Aguilita, PR Map & Demographics
Aguilita Map
Aguilita Overview
$9,826
PER CAPITA INCOME
$25,431
AVG FAMILY INCOME
$21,625
AVG HOUSEHOLD INCOME
3.4%
WAGE / INCOME GAP [ % ]
96.6¢/ $1
WAGE / INCOME GAP [ $ ]
0.44
INEQUALITY / GINI INDEX
4,197
TOTAL POPULATION
1,840
MALE POPULATION
2,357
FEMALE POPULATION
78.07
MALES / 100 FEMALES
128.10
FEMALES / 100 MALES
38.1
MEDIAN AGE
3.5
AVG FAMILY SIZE
3.0
AVG HOUSEHOLD SIZE
1,724
LABOR FORCE [ PEOPLE ]
48.8%
PERCENT IN LABOR FORCE
7.2%
UNEMPLOYMENT RATE
Income in Aguilita
Income Overview in Aguilita
Per Capita Income in Aguilita is $9,826, while median incomes of families and households are $25,431 and $21,625 respectively.
| Characteristic | Number | Measure |
| Per Capita Income | 4,197 | $9,826 |
| Median Family Income | 1,060 | $25,431 |
| Mean Family Income | 1,060 | $29,463 |
| Median Household Income | 1,395 | $21,625 |
| Mean Household Income | 1,395 | $27,151 |
| Income Deficit | 1,060 | $0 |
| Wage / Income Gap (%) | 4,197 | 3.41% |
| Wage / Income Gap ($) | 4,197 | 96.59¢ per $1 |
| Gini / Inequality Index | 4,197 | 0.44 |
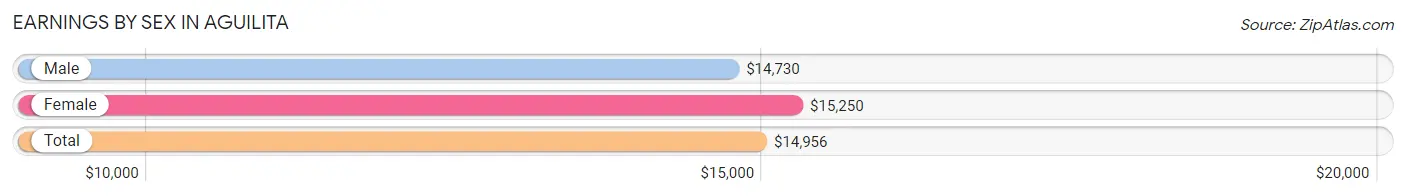
Earnings by Sex in Aguilita
Average Earnings in Aguilita are $14,956, $14,730 for men and $15,250 for women, a difference of 3.4%.
| Sex | Number | Average Earnings |
| Male | 951 (56.8%) | $14,730 |
| Female | 722 (43.2%) | $15,250 |
| Total | 1,673 (100.0%) | $14,956 |
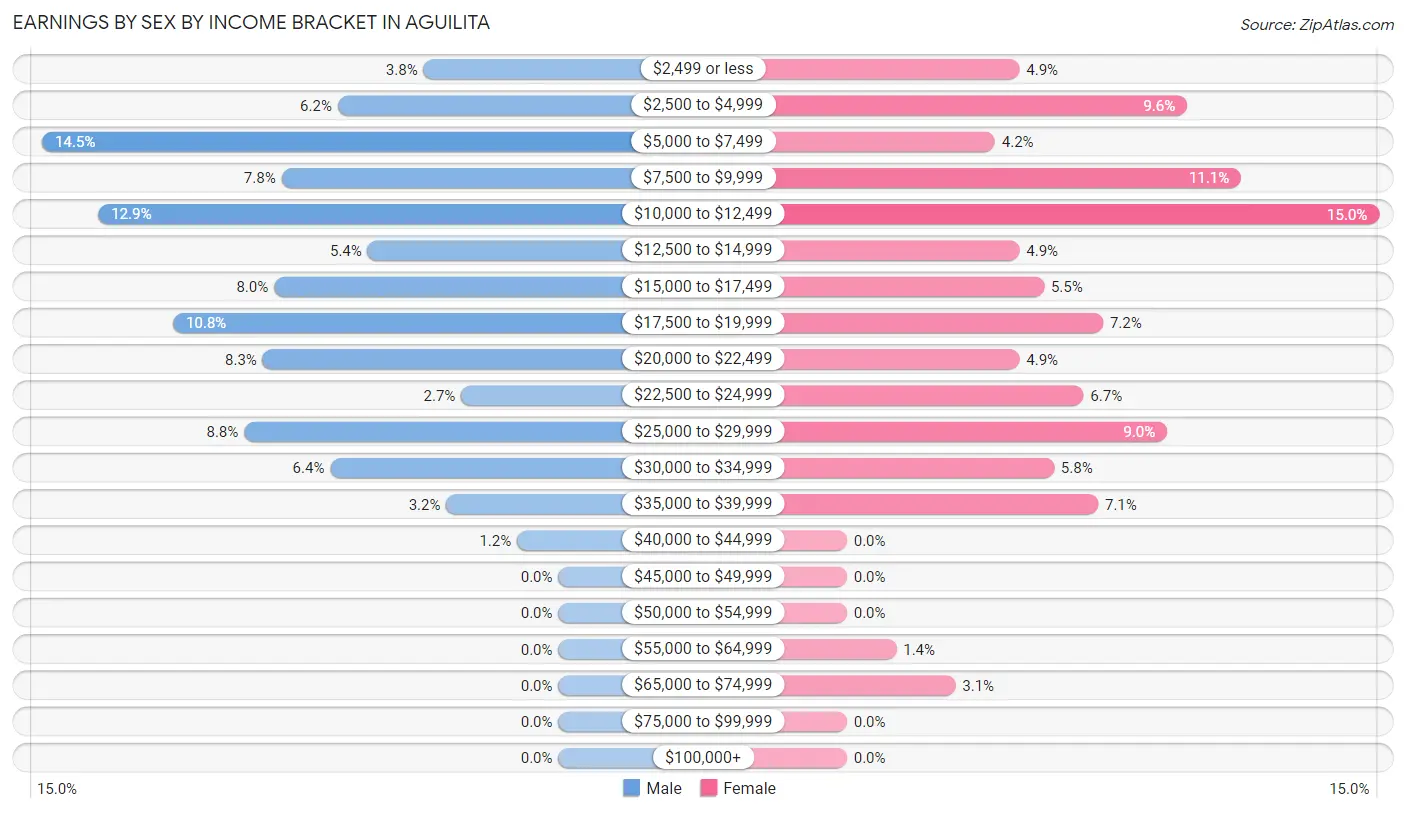
Earnings by Sex by Income Bracket in Aguilita
The most common earnings brackets in Aguilita are $5,000 to $7,499 for men (138 | 14.5%) and $10,000 to $12,499 for women (108 | 15.0%).
| Income | Male | Female |
| $2,499 or less | 36 (3.8%) | 35 (4.9%) |
| $2,500 to $4,999 | 59 (6.2%) | 69 (9.6%) |
| $5,000 to $7,499 | 138 (14.5%) | 30 (4.2%) |
| $7,500 to $9,999 | 74 (7.8%) | 80 (11.1%) |
| $10,000 to $12,499 | 123 (12.9%) | 108 (15.0%) |
| $12,500 to $14,999 | 51 (5.4%) | 35 (4.9%) |
| $15,000 to $17,499 | 76 (8.0%) | 40 (5.5%) |
| $17,500 to $19,999 | 103 (10.8%) | 52 (7.2%) |
| $20,000 to $22,499 | 79 (8.3%) | 35 (4.9%) |
| $22,500 to $24,999 | 26 (2.7%) | 48 (6.7%) |
| $25,000 to $29,999 | 84 (8.8%) | 65 (9.0%) |
| $30,000 to $34,999 | 61 (6.4%) | 42 (5.8%) |
| $35,000 to $39,999 | 30 (3.2%) | 51 (7.1%) |
| $40,000 to $44,999 | 11 (1.2%) | 0 (0.0%) |
| $45,000 to $49,999 | 0 (0.0%) | 0 (0.0%) |
| $50,000 to $54,999 | 0 (0.0%) | 0 (0.0%) |
| $55,000 to $64,999 | 0 (0.0%) | 10 (1.4%) |
| $65,000 to $74,999 | 0 (0.0%) | 22 (3.0%) |
| $75,000 to $99,999 | 0 (0.0%) | 0 (0.0%) |
| $100,000+ | 0 (0.0%) | 0 (0.0%) |
| Total | 951 (100.0%) | 722 (100.0%) |
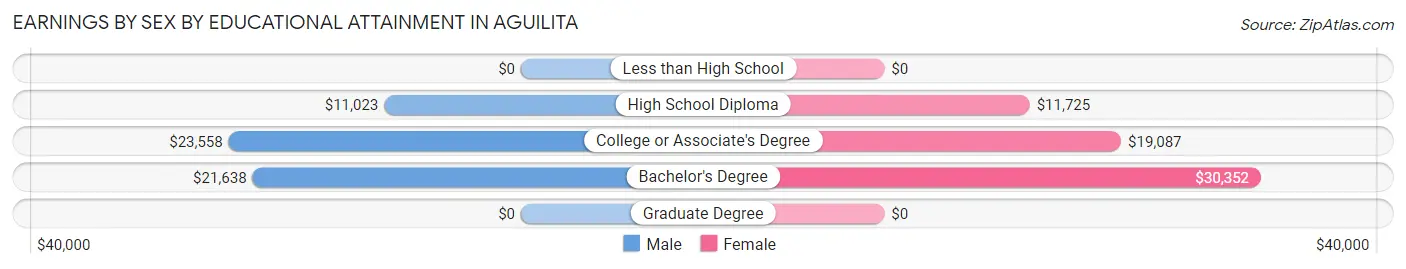
Earnings by Sex by Educational Attainment in Aguilita
Average earnings in Aguilita are $16,398 for men and $17,406 for women, a difference of 5.8%. Men with an educational attainment of college or associate's degree enjoy the highest average annual earnings of $23,558, while those with high school diploma education earn the least with $11,023. Women with an educational attainment of bachelor's degree earn the most with the average annual earnings of $30,352, while those with high school diploma education have the smallest earnings of $11,725.
| Educational Attainment | Male Income | Female Income |
| Less than High School | - | - |
| High School Diploma | $11,023 | $11,725 |
| College or Associate's Degree | $23,558 | $19,087 |
| Bachelor's Degree | $21,638 | $30,352 |
| Graduate Degree | - | - |
| Total | $16,398 | $17,406 |
Family Income in Aguilita
Family Income Brackets in Aguilita
According to the Aguilita family income data, there are 189 families falling into the less than $10,000 income range, which is the most common income bracket and makes up 17.8% of all families.
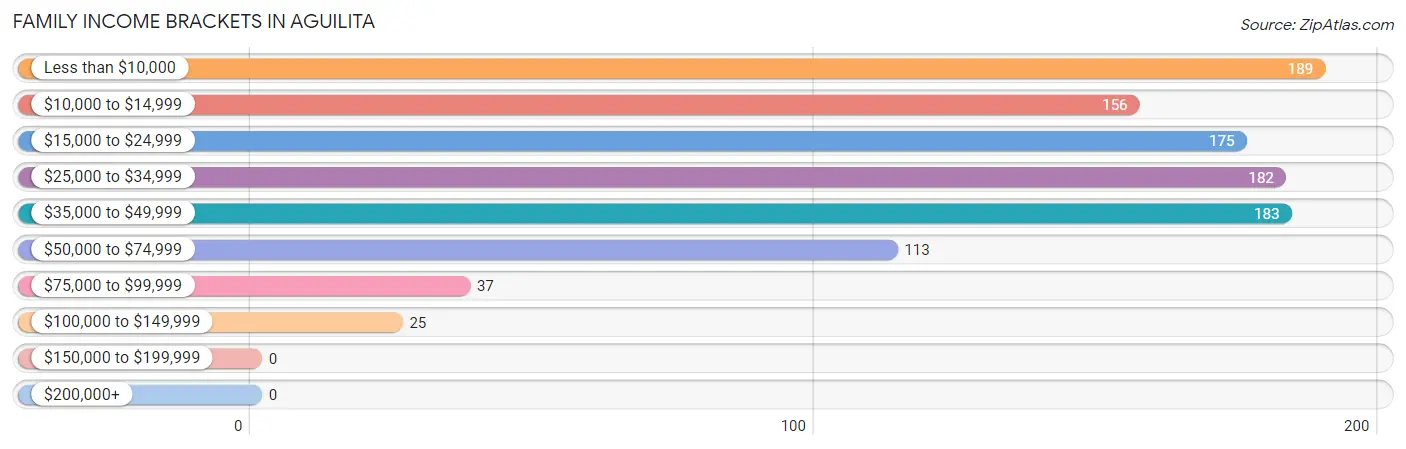
| Income Bracket | # Families | % Families |
| Less than $10,000 | 189 | 17.8% |
| $10,000 to $14,999 | 156 | 14.7% |
| $15,000 to $24,999 | 175 | 16.5% |
| $25,000 to $34,999 | 182 | 17.2% |
| $35,000 to $49,999 | 183 | 17.3% |
| $50,000 to $74,999 | 113 | 10.7% |
| $75,000 to $99,999 | 37 | 3.5% |
| $100,000 to $149,999 | 25 | 2.4% |
| $150,000 to $199,999 | 0 | 0.0% |
| $200,000+ | 0 | 0.0% |
Family Income by Famaliy Size in Aguilita
3-person families (286 | 27.0%) account for the highest median family income in Aguilita with $28,125 per family, while 2-person families (477 | 45.0%) have the highest median income of $9,945 per family member.
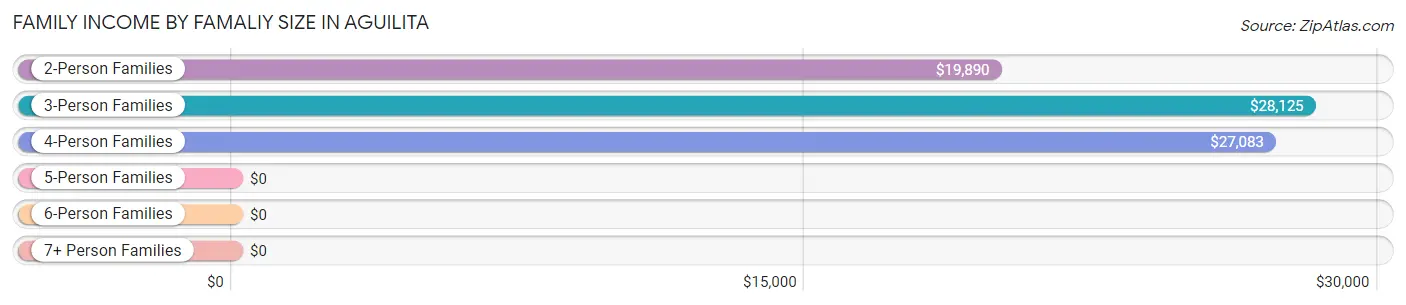
| Income Bracket | # Families | Median Income |
| 2-Person Families | 477 (45.0%) | $19,890 |
| 3-Person Families | 286 (27.0%) | $28,125 |
| 4-Person Families | 180 (17.0%) | $27,083 |
| 5-Person Families | 80 (7.5%) | $0 |
| 6-Person Families | 37 (3.5%) | $0 |
| 7+ Person Families | 0 (0.0%) | $0 |
| Total | 1,060 (100.0%) | $25,431 |
Family Income by Number of Earners in Aguilita
The median family income in Aguilita is $25,431, with families comprising 3+ earners (103) having the highest median family income of $54,602, while families with no earners (287) have the lowest median family income of $15,368, accounting for 9.7% and 27.1% of families, respectively.
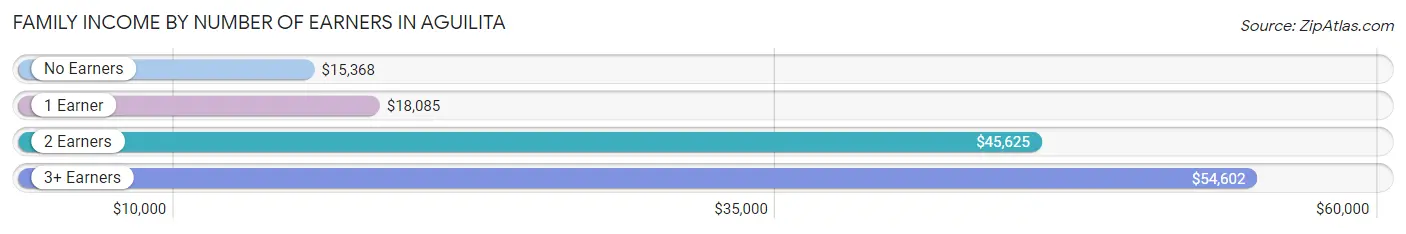
| Number of Earners | # Families | Median Income |
| No Earners | 287 (27.1%) | $15,368 |
| 1 Earner | 454 (42.8%) | $18,085 |
| 2 Earners | 216 (20.4%) | $45,625 |
| 3+ Earners | 103 (9.7%) | $54,602 |
| Total | 1,060 (100.0%) | $25,431 |
Household Income in Aguilita
Household Income Brackets in Aguilita
With 303 households falling in the category, the less than $10,000 income range is the most frequent in Aguilita, accounting for 21.7% of all households.
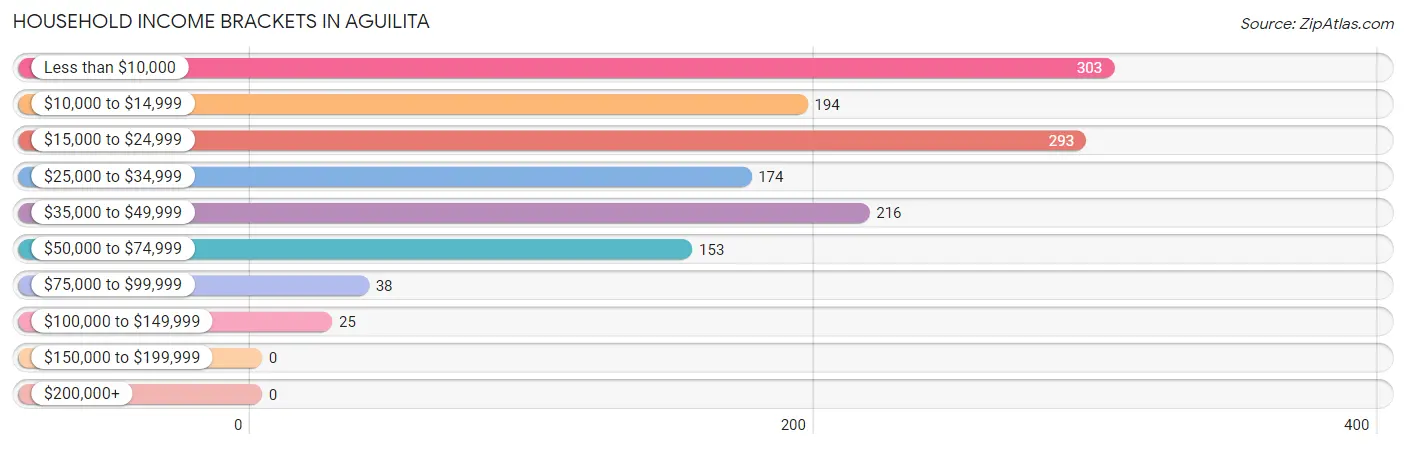
| Income Bracket | # Households | % Households |
| Less than $10,000 | 303 | 21.7% |
| $10,000 to $14,999 | 194 | 13.9% |
| $15,000 to $24,999 | 293 | 21.0% |
| $25,000 to $34,999 | 174 | 12.5% |
| $35,000 to $49,999 | 216 | 15.5% |
| $50,000 to $74,999 | 153 | 11.0% |
| $75,000 to $99,999 | 38 | 2.7% |
| $100,000 to $149,999 | 25 | 1.8% |
| $150,000 to $199,999 | 0 | 0.0% |
| $200,000+ | 0 | 0.0% |
Household Income by Householder Age in Aguilita
The median household income in Aguilita is $21,625, with the highest median household income of $24,085 found in the 25 to 44 years age bracket for the primary householder. A total of 389 households (27.9%) fall into this category. Meanwhile, the 15 to 24 years age bracket for the primary householder has the lowest median household income of $0, with 19 households (1.4%) in this group.
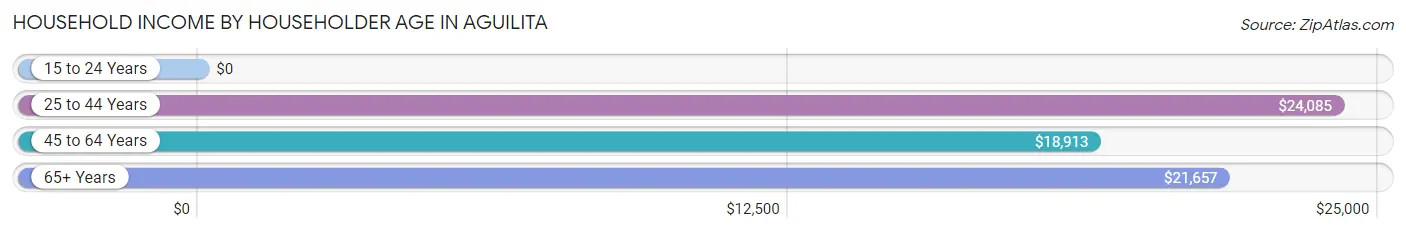
| Income Bracket | # Households | Median Income |
| 15 to 24 Years | 19 (1.4%) | $0 |
| 25 to 44 Years | 389 (27.9%) | $24,085 |
| 45 to 64 Years | 646 (46.3%) | $18,913 |
| 65+ Years | 341 (24.4%) | $21,657 |
| Total | 1,395 (100.0%) | $21,625 |
Poverty in Aguilita
Income Below Poverty by Sex and Age in Aguilita
With 41.6% poverty level for males and 55.5% for females among the residents of Aguilita, under 5 year old males and under 5 year old females are the most vulnerable to poverty, with 63 males (100.0%) and 106 females (100.0%) in their respective age groups living below the poverty level.
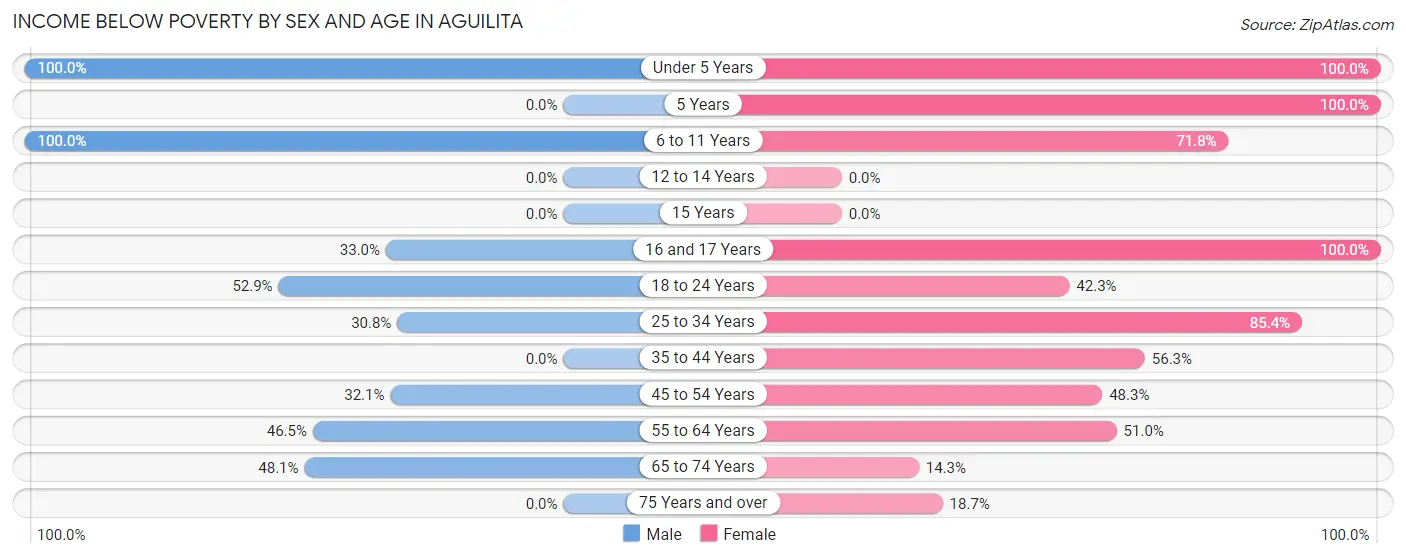
| Age Bracket | Male | Female |
| Under 5 Years | 63 (100.0%) | 106 (100.0%) |
| 5 Years | 0 (0.0%) | 26 (100.0%) |
| 6 to 11 Years | 129 (100.0%) | 183 (71.8%) |
| 12 to 14 Years | 0 (0.0%) | 0 (0.0%) |
| 15 Years | 0 (0.0%) | 0 (0.0%) |
| 16 and 17 Years | 29 (33.0%) | 117 (100.0%) |
| 18 to 24 Years | 165 (52.9%) | 60 (42.2%) |
| 25 to 34 Years | 103 (30.8%) | 269 (85.4%) |
| 35 to 44 Years | 0 (0.0%) | 126 (56.2%) |
| 45 to 54 Years | 97 (32.1%) | 175 (48.3%) |
| 55 to 64 Years | 93 (46.5%) | 175 (51.0%) |
| 65 to 74 Years | 87 (48.1%) | 33 (14.3%) |
| 75 Years and over | 0 (0.0%) | 38 (18.7%) |
| Total | 766 (41.6%) | 1,308 (55.5%) |
Income Above Poverty by Sex and Age in Aguilita
According to the poverty statistics in Aguilita, males aged 12 to 14 years and females aged 12 to 14 years are the age groups that are most secure financially, with 100.0% of males and 100.0% of females in these age groups living above the poverty line.
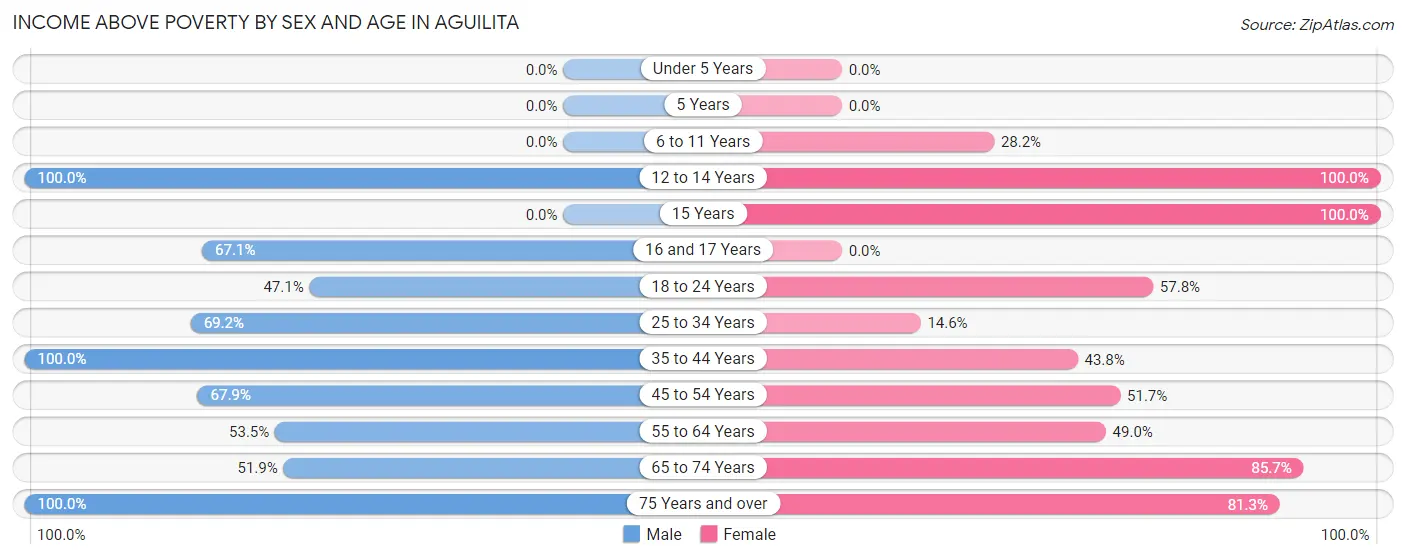
| Age Bracket | Male | Female |
| Under 5 Years | 0 (0.0%) | 0 (0.0%) |
| 5 Years | 0 (0.0%) | 0 (0.0%) |
| 6 to 11 Years | 0 (0.0%) | 72 (28.2%) |
| 12 to 14 Years | 52 (100.0%) | 21 (100.0%) |
| 15 Years | 0 (0.0%) | 12 (100.0%) |
| 16 and 17 Years | 59 (67.0%) | 0 (0.0%) |
| 18 to 24 Years | 147 (47.1%) | 82 (57.8%) |
| 25 to 34 Years | 231 (69.2%) | 46 (14.6%) |
| 35 to 44 Years | 129 (100.0%) | 98 (43.8%) |
| 45 to 54 Years | 205 (67.9%) | 187 (51.7%) |
| 55 to 64 Years | 107 (53.5%) | 168 (49.0%) |
| 65 to 74 Years | 94 (51.9%) | 198 (85.7%) |
| 75 Years and over | 50 (100.0%) | 165 (81.3%) |
| Total | 1,074 (58.4%) | 1,049 (44.5%) |
Income Below Poverty Among Married-Couple Families in Aguilita
The poverty statistics for married-couple families in Aguilita show that 28.6% or 158 of the total 553 families live below the poverty line. Families with 3 or 4 children have the highest poverty rate of 100.0%, comprising of 26 families. On the other hand, families with no children have the lowest poverty rate of 20.4%, which includes 77 families.
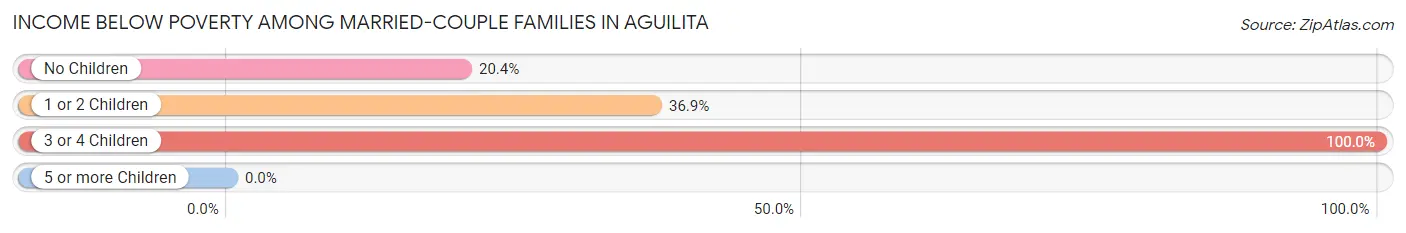
| Children | Above Poverty | Below Poverty |
| No Children | 301 (79.6%) | 77 (20.4%) |
| 1 or 2 Children | 94 (63.1%) | 55 (36.9%) |
| 3 or 4 Children | 0 (0.0%) | 26 (100.0%) |
| 5 or more Children | 0 (0.0%) | 0 (0.0%) |
| Total | 395 (71.4%) | 158 (28.6%) |
Income Below Poverty Among Single-Parent Households in Aguilita
According to the poverty data in Aguilita, 67.2% or 45 single-father households and 70.0% or 308 single-mother households are living below the poverty line. Among single-father households, those with 3 or 4 children have the highest poverty rate, with 20 households (100.0%) experiencing poverty. Likewise, among single-mother households, those with 3 or 4 children have the highest poverty rate, with 44 households (100.0%) falling below the poverty line.
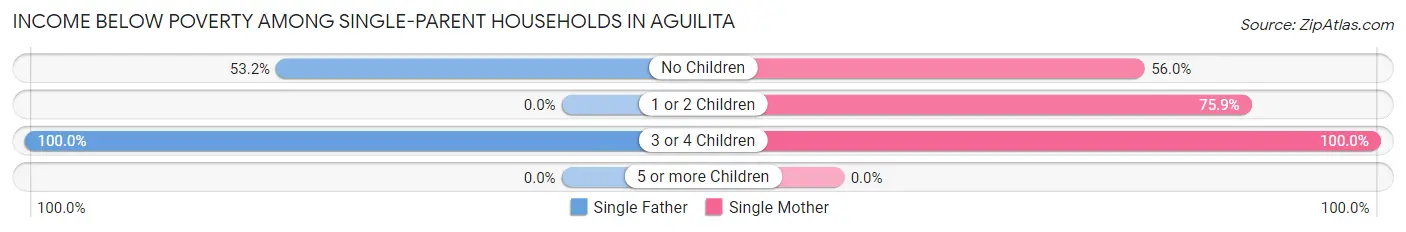
| Children | Single Father | Single Mother |
| No Children | 25 (53.2%) | 103 (56.0%) |
| 1 or 2 Children | 0 (0.0%) | 161 (75.9%) |
| 3 or 4 Children | 20 (100.0%) | 44 (100.0%) |
| 5 or more Children | 0 (0.0%) | 0 (0.0%) |
| Total | 45 (67.2%) | 308 (70.0%) |
Income Below Poverty Among Married-Couple vs Single-Parent Households in Aguilita
The poverty data for Aguilita shows that 158 of the married-couple family households (28.6%) and 353 of the single-parent households (69.6%) are living below the poverty level. Within the married-couple family households, those with 3 or 4 children have the highest poverty rate, with 26 households (100.0%) falling below the poverty line. Among the single-parent households, those with 3 or 4 children have the highest poverty rate, with 64 household (100.0%) living below poverty.
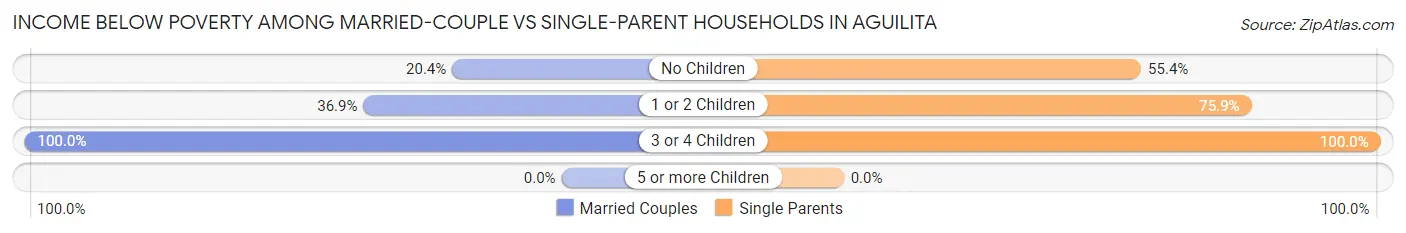
| Children | Married-Couple Families | Single-Parent Households |
| No Children | 77 (20.4%) | 128 (55.4%) |
| 1 or 2 Children | 55 (36.9%) | 161 (75.9%) |
| 3 or 4 Children | 26 (100.0%) | 64 (100.0%) |
| 5 or more Children | 0 (0.0%) | 0 (0.0%) |
| Total | 158 (28.6%) | 353 (69.6%) |
Race in Aguilita
The most populous races in Aguilita are Hispanic or Latino (4,197 | 100.0%), Two or more Races (1,691 | 40.3%), and White / Caucasian (1,282 | 30.5%).
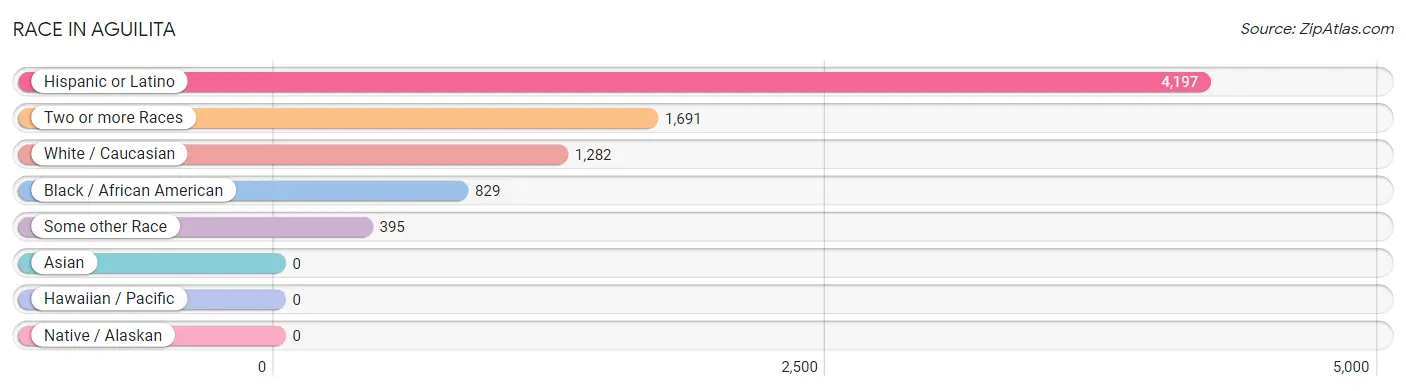
| Race | # Population | % Population |
| Asian | 0 | 0.0% |
| Black / African American | 829 | 19.8% |
| Hawaiian / Pacific | 0 | 0.0% |
| Hispanic or Latino | 4,197 | 100.0% |
| Native / Alaskan | 0 | 0.0% |
| White / Caucasian | 1,282 | 30.5% |
| Two or more Races | 1,691 | 40.3% |
| Some other Race | 395 | 9.4% |
| Total | 4,197 | 100.0% |
Ancestry in Aguilita
The most populous ancestries reported in Aguilita are Puerto Rican (4,197 | 100.0%), American (117 | 2.8%), and West Indian (19 | 0.4%), together accounting for 103.2% of all Aguilita residents.
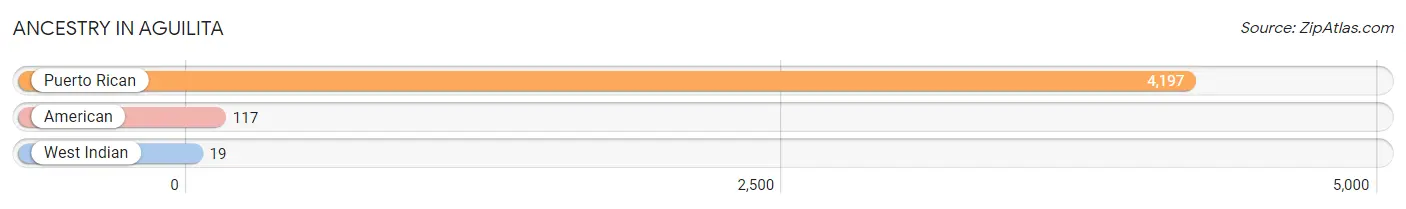
| Ancestry | # Population | % Population |
| American | 117 | 2.8% |
| Puerto Rican | 4,197 | 100.0% |
| West Indian | 19 | 0.4% | View All 3 Rows |
Immigrants in Aguilita

| Immigration Origin | # Population | % Population | View All 0 Rows |
Sex and Age in Aguilita
Sex and Age in Aguilita
The most populous age groups in Aguilita are 20 to 24 Years (243 | 13.2%) for men and 50 to 54 Years (235 | 10.0%) for women.
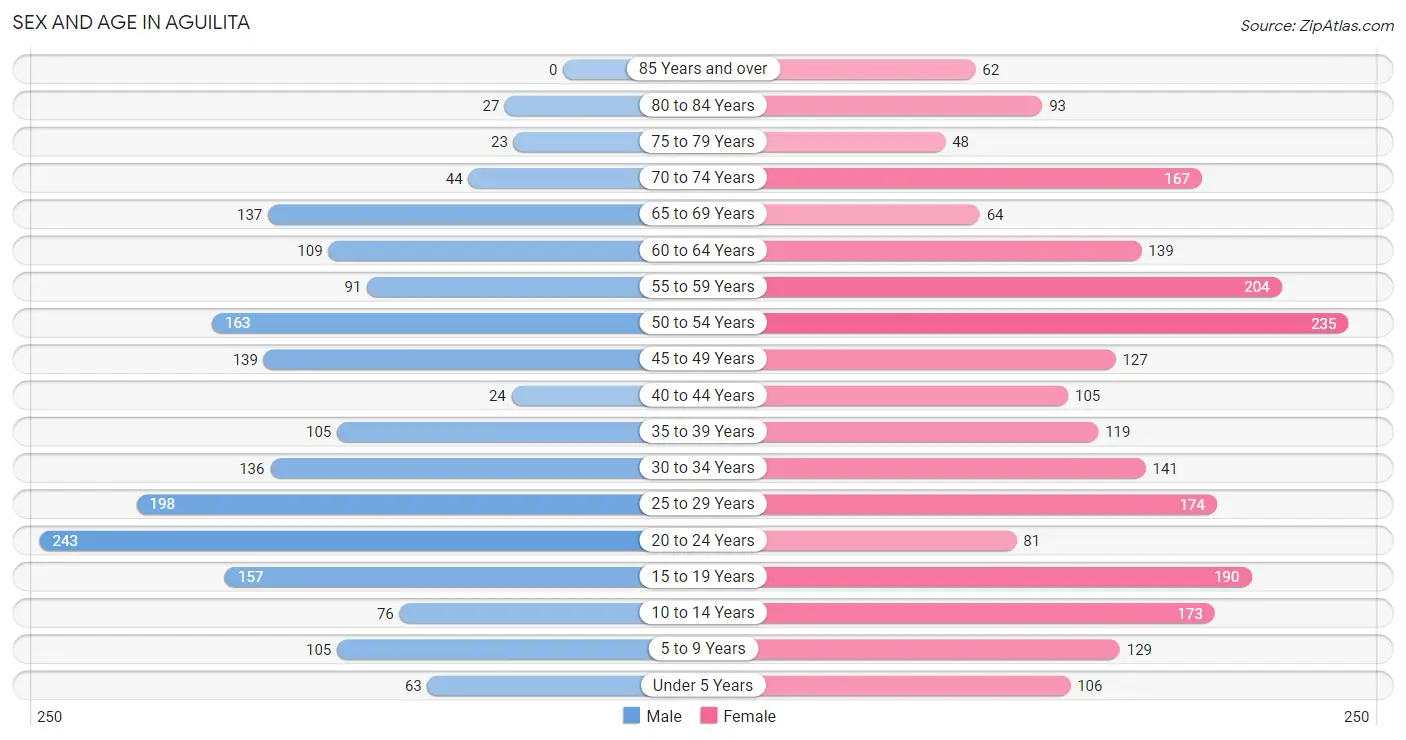
| Age Bracket | Male | Female |
| Under 5 Years | 63 (3.4%) | 106 (4.5%) |
| 5 to 9 Years | 105 (5.7%) | 129 (5.5%) |
| 10 to 14 Years | 76 (4.1%) | 173 (7.3%) |
| 15 to 19 Years | 157 (8.5%) | 190 (8.1%) |
| 20 to 24 Years | 243 (13.2%) | 81 (3.4%) |
| 25 to 29 Years | 198 (10.8%) | 174 (7.4%) |
| 30 to 34 Years | 136 (7.4%) | 141 (6.0%) |
| 35 to 39 Years | 105 (5.7%) | 119 (5.1%) |
| 40 to 44 Years | 24 (1.3%) | 105 (4.4%) |
| 45 to 49 Years | 139 (7.5%) | 127 (5.4%) |
| 50 to 54 Years | 163 (8.9%) | 235 (10.0%) |
| 55 to 59 Years | 91 (5.0%) | 204 (8.7%) |
| 60 to 64 Years | 109 (5.9%) | 139 (5.9%) |
| 65 to 69 Years | 137 (7.4%) | 64 (2.7%) |
| 70 to 74 Years | 44 (2.4%) | 167 (7.1%) |
| 75 to 79 Years | 23 (1.3%) | 48 (2.0%) |
| 80 to 84 Years | 27 (1.5%) | 93 (4.0%) |
| 85 Years and over | 0 (0.0%) | 62 (2.6%) |
| Total | 1,840 (100.0%) | 2,357 (100.0%) |
Families and Households in Aguilita
Median Family Size in Aguilita
The median family size in Aguilita is 3.49 persons per family, with single male/father families (67 | 6.3%) accounting for the largest median family size of 4.01 persons per family. On the other hand, single female/mother families (440 | 41.5%) represent the smallest median family size with 3.14 persons per family.
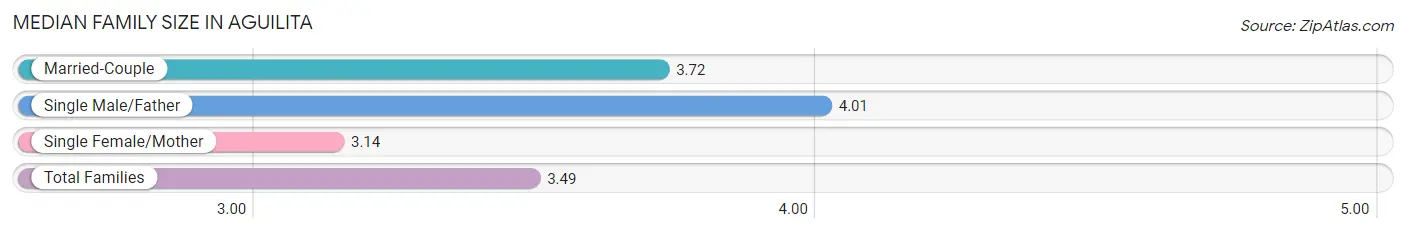
| Family Type | # Families | Family Size |
| Married-Couple | 553 (52.2%) | 3.72 |
| Single Male/Father | 67 (6.3%) | 4.01 |
| Single Female/Mother | 440 (41.5%) | 3.14 |
| Total Families | 1,060 (100.0%) | 3.49 |
Median Household Size in Aguilita
The median household size in Aguilita is 3.01 persons per household, with single male/father households (67 | 4.8%) accounting for the largest median household size of 4.64 persons per household. non-family households (335 | 24.0%) represent the smallest median household size with 1.13 persons per household.
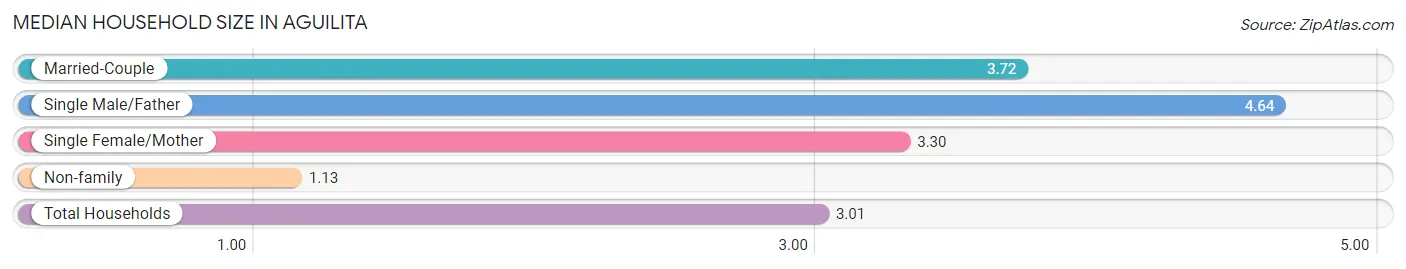
| Household Type | # Households | Household Size |
| Married-Couple | 553 (39.6%) | 3.72 |
| Single Male/Father | 67 (4.8%) | 4.64 |
| Single Female/Mother | 440 (31.5%) | 3.30 |
| Non-family | 335 (24.0%) | 1.13 |
| Total Households | 1,395 (100.0%) | 3.01 |
Household Size by Marriage Status in Aguilita
Out of a total of 1,395 households in Aguilita, 1,060 (76.0%) are family households, while 335 (24.0%) are nonfamily households. The most numerous type of family households are 2-person households, comprising 436, and the most common type of nonfamily households are 1-person households, comprising 294.
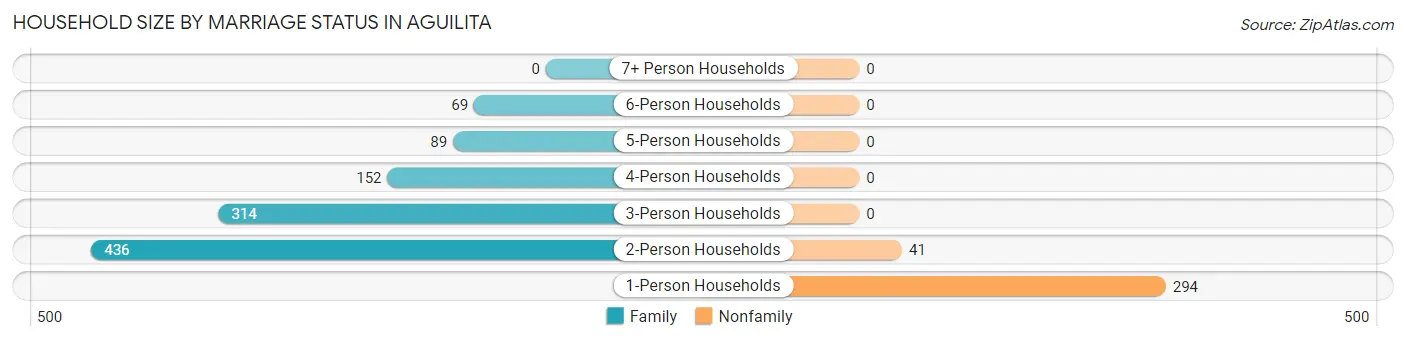
| Household Size | Family Households | Nonfamily Households |
| 1-Person Households | - | 294 (21.1%) |
| 2-Person Households | 436 (31.2%) | 41 (2.9%) |
| 3-Person Households | 314 (22.5%) | 0 (0.0%) |
| 4-Person Households | 152 (10.9%) | 0 (0.0%) |
| 5-Person Households | 89 (6.4%) | 0 (0.0%) |
| 6-Person Households | 69 (5.0%) | 0 (0.0%) |
| 7+ Person Households | 0 (0.0%) | 0 (0.0%) |
| Total | 1,060 (76.0%) | 335 (24.0%) |
Female Fertility in Aguilita
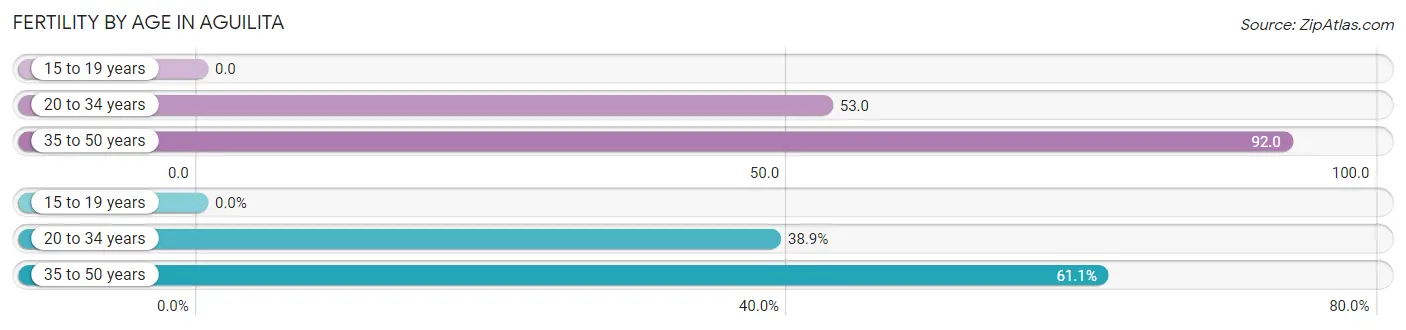
Fertility by Age in Aguilita
Average fertility rate in Aguilita is 57.0 births per 1,000 women. Women in the age bracket of 35 to 50 years have the highest fertility rate with 92.0 births per 1,000 women. Women in the age bracket of 35 to 50 years acount for 61.1% of all women with births.
| Age Bracket | Women with Births | Births / 1,000 Women |
| 15 to 19 years | 0 (0.0%) | 0.0 |
| 20 to 34 years | 21 (38.9%) | 53.0 |
| 35 to 50 years | 33 (61.1%) | 92.0 |
| Total | 54 (100.0%) | 57.0 |
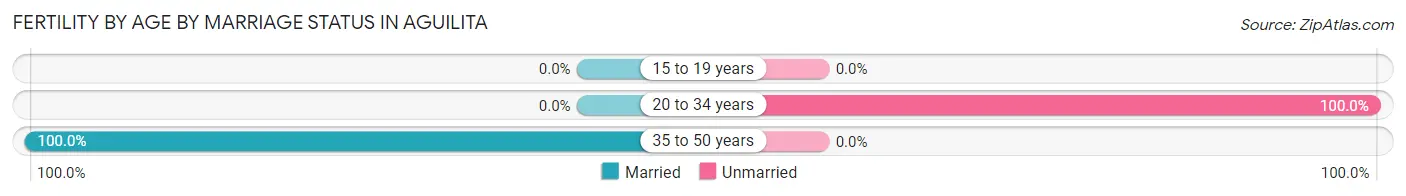
Fertility by Age by Marriage Status in Aguilita
61.1% of women with births (54) in Aguilita are married. The highest percentage of unmarried women with births falls into 20 to 34 years age bracket with 100.0% of them unmarried at the time of birth, while the lowest percentage of unmarried women with births belong to 35 to 50 years age bracket with 0.0% of them unmarried.
| Age Bracket | Married | Unmarried |
| 15 to 19 years | 0 (0.0%) | 0 (0.0%) |
| 20 to 34 years | 0 (0.0%) | 21 (100.0%) |
| 35 to 50 years | 33 (100.0%) | 0 (0.0%) |
| Total | 33 (61.1%) | 21 (38.9%) |
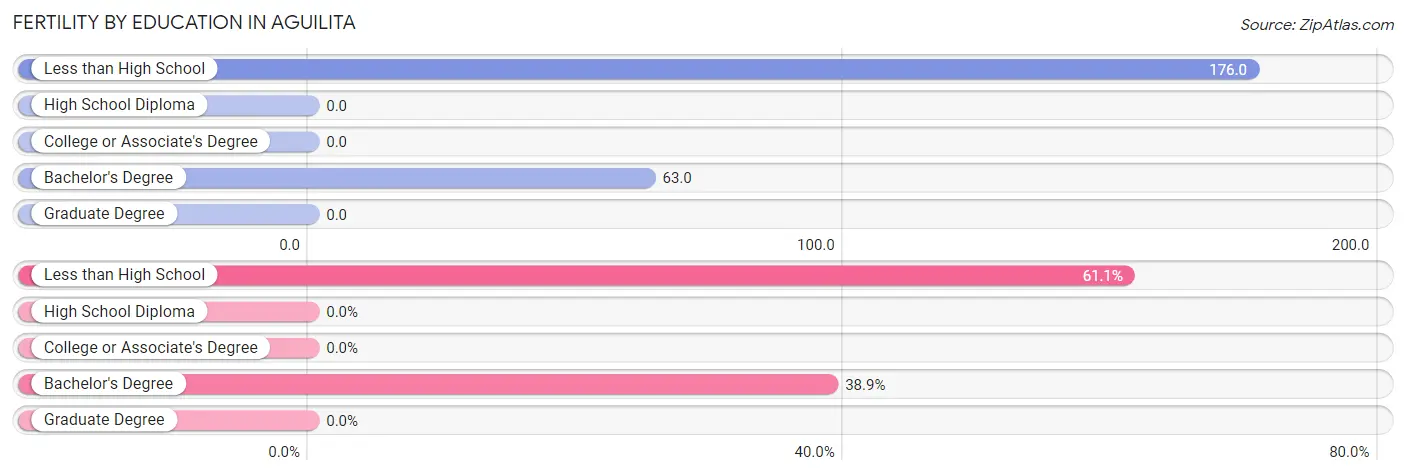
Fertility by Education in Aguilita
| Educational Attainment | Women with Births | Births / 1,000 Women |
| Less than High School | 33 (61.1%) | 176.0 |
| High School Diploma | 0 (0.0%) | 0.0 |
| College or Associate's Degree | 0 (0.0%) | 0.0 |
| Bachelor's Degree | 21 (38.9%) | 63.0 |
| Graduate Degree | 0 (0.0%) | 0.0 |
| Total | 54 (100.0%) | 57.0 |
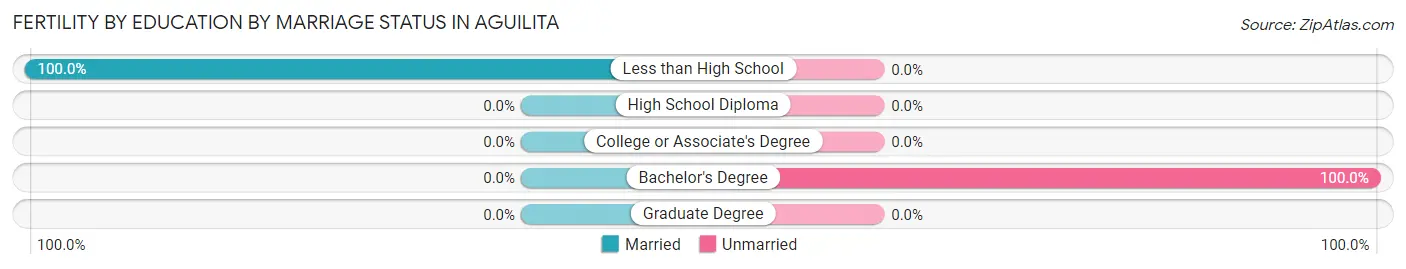
Fertility by Education by Marriage Status in Aguilita
38.9% of women with births in Aguilita are unmarried. Women with the educational attainment of less than high school are most likely to be married with 100.0% of them married at childbirth, while women with the educational attainment of bachelor's degree are least likely to be married with 100.0% of them unmarried at childbirth.
| Educational Attainment | Married | Unmarried |
| Less than High School | 33 (100.0%) | 0 (0.0%) |
| High School Diploma | 0 (0.0%) | 0 (0.0%) |
| College or Associate's Degree | 0 (0.0%) | 0 (0.0%) |
| Bachelor's Degree | 0 (0.0%) | 21 (100.0%) |
| Graduate Degree | 0 (0.0%) | 0 (0.0%) |
| Total | 33 (61.1%) | 21 (38.9%) |
Employment Characteristics in Aguilita
Employment by Class of Employer in Aguilita
Among the 1,562 employed individuals in Aguilita, private company employees (1,104 | 70.7%), state government employees (129 | 8.3%), and local government employees (99 | 6.3%) make up the most common classes of employment.
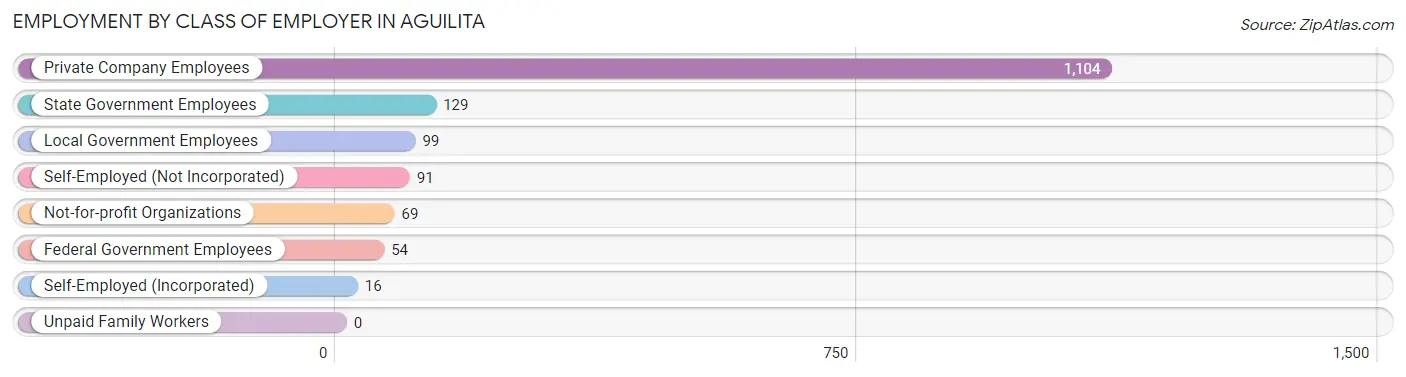
| Employer Class | # Employees | % Employees |
| Private Company Employees | 1,104 | 70.7% |
| Self-Employed (Incorporated) | 16 | 1.0% |
| Self-Employed (Not Incorporated) | 91 | 5.8% |
| Not-for-profit Organizations | 69 | 4.4% |
| Local Government Employees | 99 | 6.3% |
| State Government Employees | 129 | 8.3% |
| Federal Government Employees | 54 | 3.5% |
| Unpaid Family Workers | 0 | 0.0% |
| Total | 1,562 | 100.0% |
Employment Status by Age in Aguilita
According to the labor force statistics for Aguilita, out of the total population over 16 years of age (3,533), 48.8% or 1,724 individuals are in the labor force, with 7.2% or 124 of them unemployed. The age group with the highest labor force participation rate is 30 to 34 years, with 84.8% or 235 individuals in the labor force. Within the labor force, the 16 to 19 years age range has the highest percentage of unemployed individuals, with 54.2% or 32 of them being unemployed.
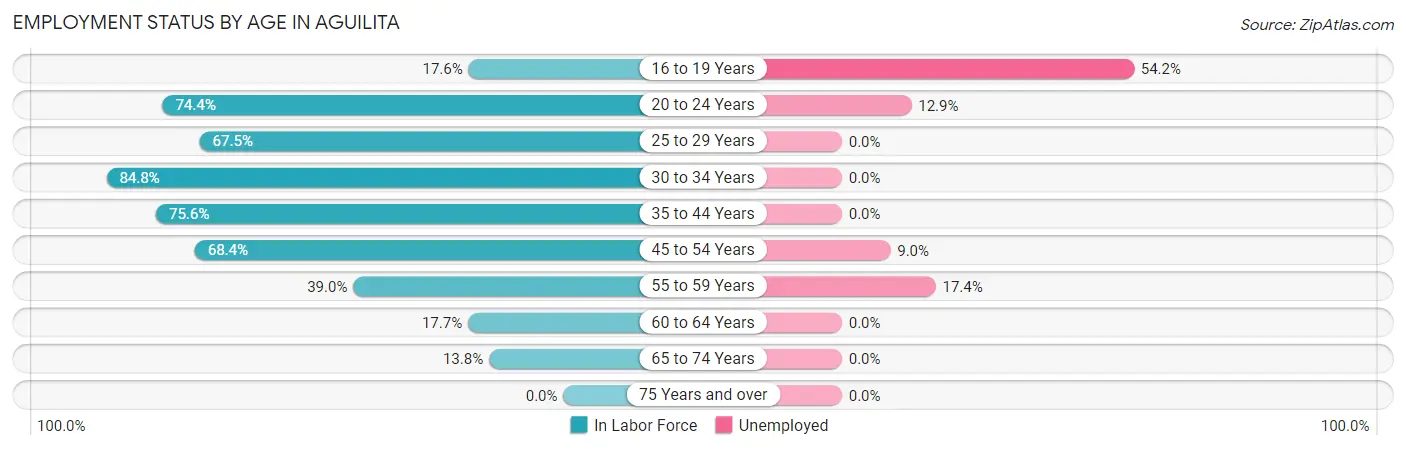
| Age Bracket | In Labor Force | Unemployed |
| 16 to 19 Years | 59 (17.6%) | 32 (54.2%) |
| 20 to 24 Years | 241 (74.4%) | 31 (12.9%) |
| 25 to 29 Years | 251 (67.5%) | 0 (0.0%) |
| 30 to 34 Years | 235 (84.8%) | 0 (0.0%) |
| 35 to 44 Years | 267 (75.6%) | 0 (0.0%) |
| 45 to 54 Years | 454 (68.4%) | 41 (9.0%) |
| 55 to 59 Years | 115 (39.0%) | 20 (17.4%) |
| 60 to 64 Years | 44 (17.7%) | 0 (0.0%) |
| 65 to 74 Years | 57 (13.8%) | 0 (0.0%) |
| 75 Years and over | 0 (0.0%) | 0 (0.0%) |
| Total | 1,724 (48.8%) | 124 (7.2%) |
Employment Status by Educational Attainment in Aguilita
According to labor force statistics for Aguilita, 61.8% of individuals (1,365) out of the total population between 25 and 64 years of age (2,209) are in the labor force, with 4.5% or 61 of them being unemployed. The group with the highest labor force participation rate are those with the educational attainment of high school diploma, with 70.4% or 544 individuals in the labor force. Within the labor force, individuals with less than high school education have the highest percentage of unemployment, with 14.5% or 16 of them being unemployed.
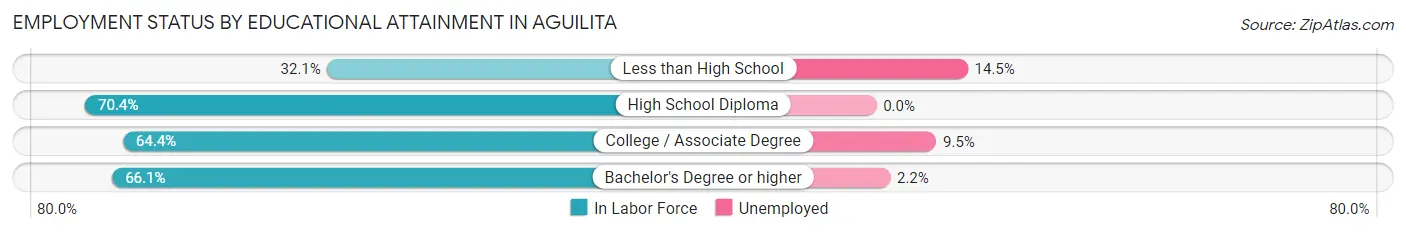
| Educational Attainment | In Labor Force | Unemployed |
| Less than High School | 110 (32.1%) | 50 (14.5%) |
| High School Diploma | 544 (70.4%) | 0 (0.0%) |
| College / Associate Degree | 400 (64.4%) | 59 (9.5%) |
| Bachelor's Degree or higher | 312 (66.1%) | 10 (2.2%) |
| Total | 1,365 (61.8%) | 99 (4.5%) |
Employment Occupations by Sex in Aguilita
Management, Business, Science and Arts Occupations
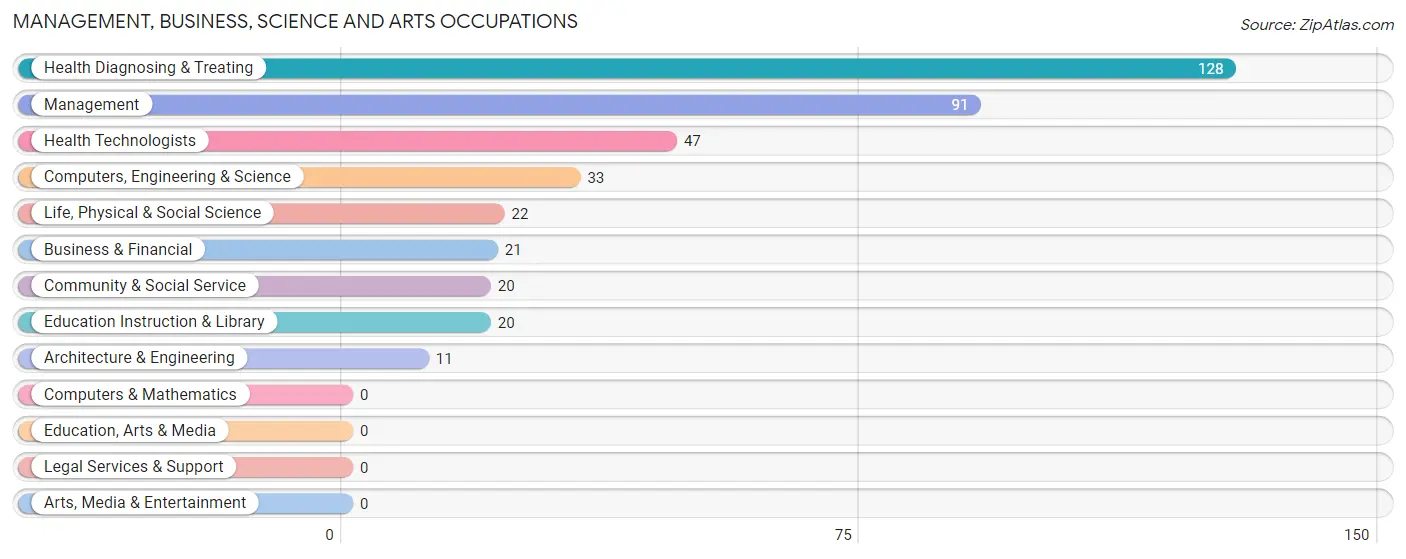
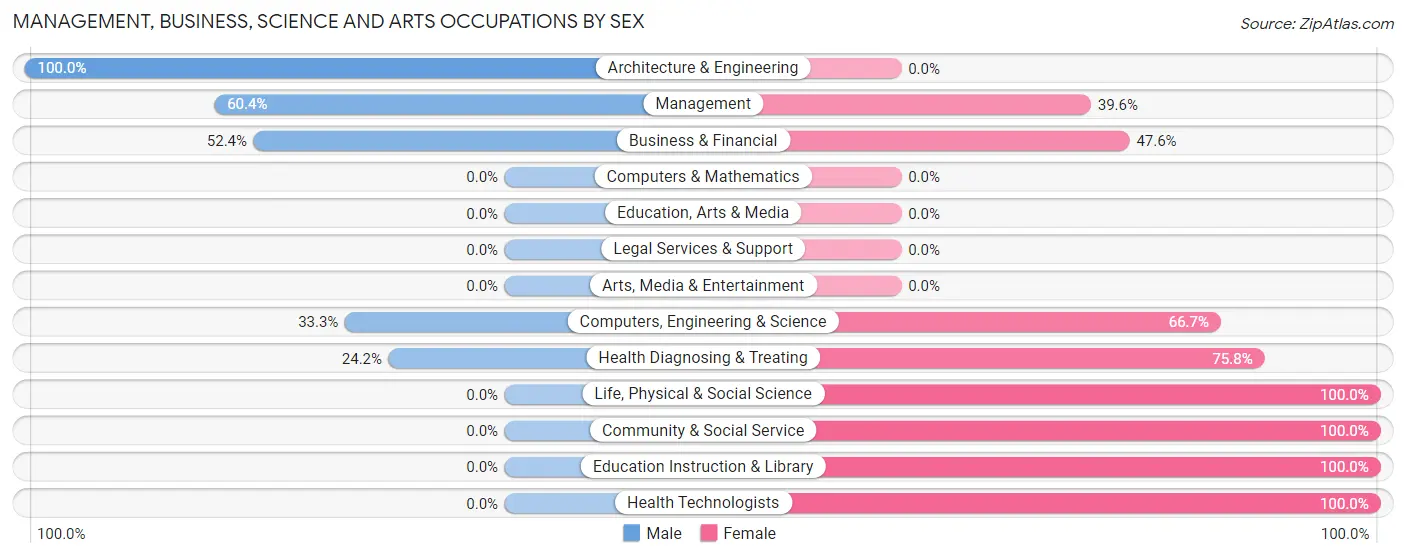
The most common Management, Business, Science and Arts occupations in Aguilita are Health Diagnosing & Treating (128 | 8.0%), Management (91 | 5.7%), Health Technologists (47 | 2.9%), Computers, Engineering & Science (33 | 2.1%), and Life, Physical & Social Science (22 | 1.4%).
Management, Business, Science and Arts Occupations by Sex
Within the Management, Business, Science and Arts occupations in Aguilita, the most male-oriented occupations are Architecture & Engineering (100.0%), Management (60.4%), and Business & Financial (52.4%), while the most female-oriented occupations are Life, Physical & Social Science (100.0%), Community & Social Service (100.0%), and Education Instruction & Library (100.0%).
| Occupation | Male | Female |
| Management | 55 (60.4%) | 36 (39.6%) |
| Business & Financial | 11 (52.4%) | 10 (47.6%) |
| Computers, Engineering & Science | 11 (33.3%) | 22 (66.7%) |
| Computers & Mathematics | 0 (0.0%) | 0 (0.0%) |
| Architecture & Engineering | 11 (100.0%) | 0 (0.0%) |
| Life, Physical & Social Science | 0 (0.0%) | 22 (100.0%) |
| Community & Social Service | 0 (0.0%) | 20 (100.0%) |
| Education, Arts & Media | 0 (0.0%) | 0 (0.0%) |
| Legal Services & Support | 0 (0.0%) | 0 (0.0%) |
| Education Instruction & Library | 0 (0.0%) | 20 (100.0%) |
| Arts, Media & Entertainment | 0 (0.0%) | 0 (0.0%) |
| Health Diagnosing & Treating | 31 (24.2%) | 97 (75.8%) |
| Health Technologists | 0 (0.0%) | 47 (100.0%) |
| Total (Category) | 108 (36.9%) | 185 (63.1%) |
| Total (Overall) | 921 (57.6%) | 678 (42.4%) |
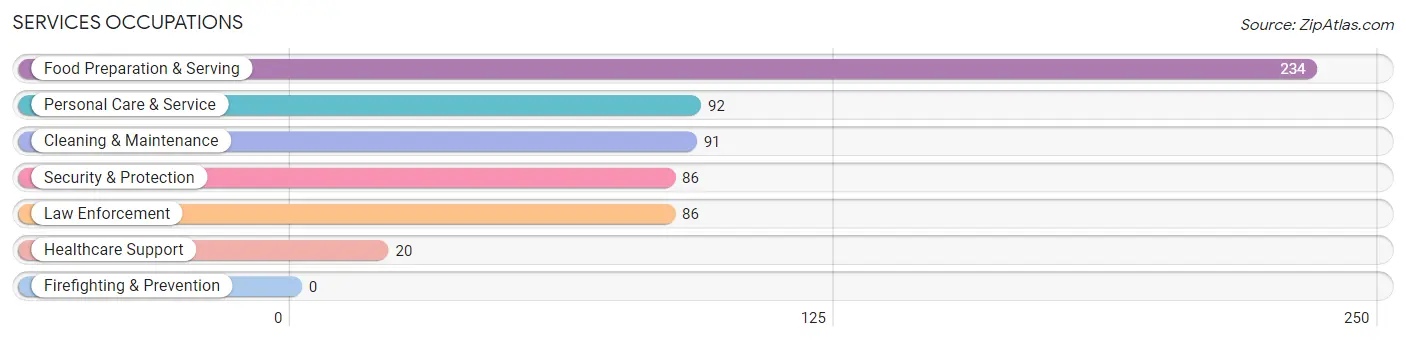
Services Occupations
The most common Services occupations in Aguilita are Food Preparation & Serving (234 | 14.6%), Personal Care & Service (92 | 5.8%), Cleaning & Maintenance (91 | 5.7%), Security & Protection (86 | 5.4%), and Law Enforcement (86 | 5.4%).
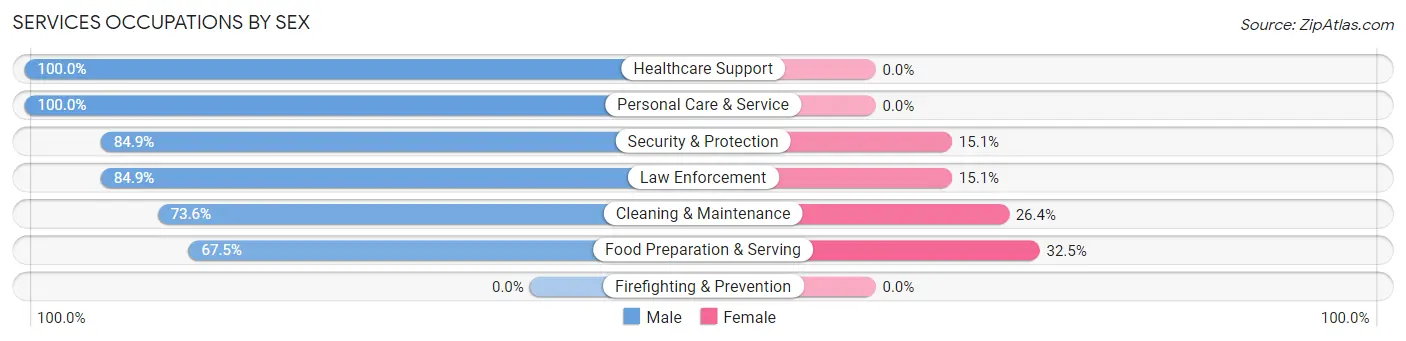
Services Occupations by Sex
Within the Services occupations in Aguilita, the most male-oriented occupations are Healthcare Support (100.0%), Personal Care & Service (100.0%), and Security & Protection (84.9%), while the most female-oriented occupations are Food Preparation & Serving (32.5%), Cleaning & Maintenance (26.4%), and Security & Protection (15.1%).
| Occupation | Male | Female |
| Healthcare Support | 20 (100.0%) | 0 (0.0%) |
| Security & Protection | 73 (84.9%) | 13 (15.1%) |
| Firefighting & Prevention | 0 (0.0%) | 0 (0.0%) |
| Law Enforcement | 73 (84.9%) | 13 (15.1%) |
| Food Preparation & Serving | 158 (67.5%) | 76 (32.5%) |
| Cleaning & Maintenance | 67 (73.6%) | 24 (26.4%) |
| Personal Care & Service | 92 (100.0%) | 0 (0.0%) |
| Total (Category) | 410 (78.4%) | 113 (21.6%) |
| Total (Overall) | 921 (57.6%) | 678 (42.4%) |
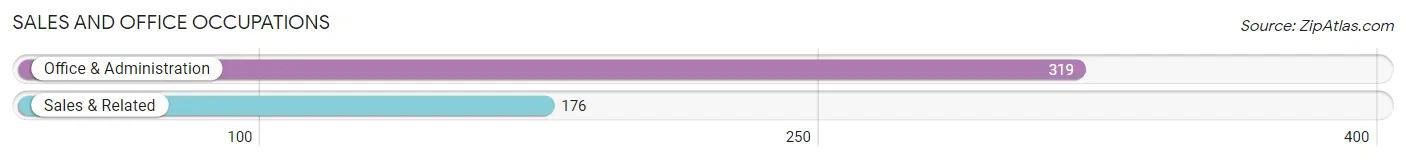
Sales and Office Occupations
The most common Sales and Office occupations in Aguilita are Office & Administration (319 | 20.0%), and Sales & Related (176 | 11.0%).
Sales and Office Occupations by Sex
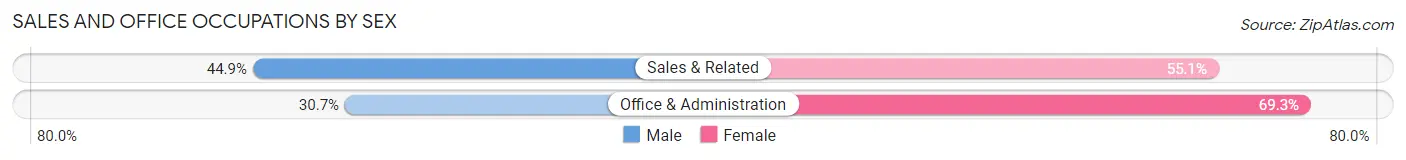
| Occupation | Male | Female |
| Sales & Related | 79 (44.9%) | 97 (55.1%) |
| Office & Administration | 98 (30.7%) | 221 (69.3%) |
| Total (Category) | 177 (35.8%) | 318 (64.2%) |
| Total (Overall) | 921 (57.6%) | 678 (42.4%) |
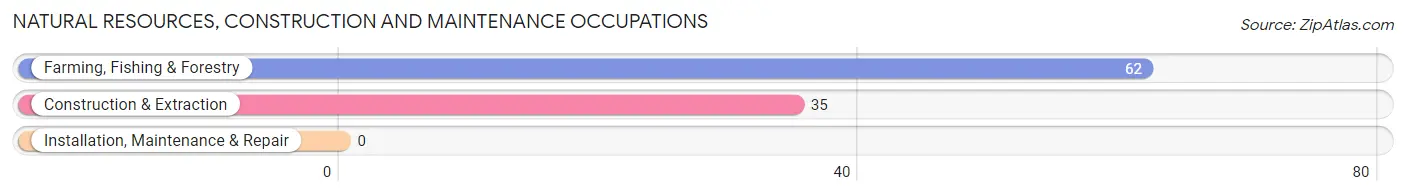
Natural Resources, Construction and Maintenance Occupations
The most common Natural Resources, Construction and Maintenance occupations in Aguilita are Farming, Fishing & Forestry (62 | 3.9%), and Construction & Extraction (35 | 2.2%).
Natural Resources, Construction and Maintenance Occupations by Sex
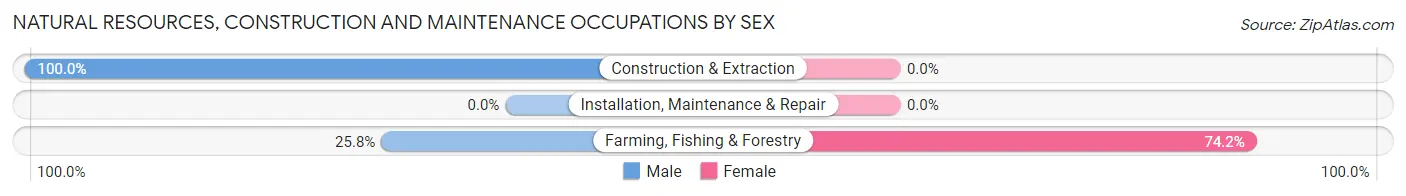
| Occupation | Male | Female |
| Farming, Fishing & Forestry | 16 (25.8%) | 46 (74.2%) |
| Construction & Extraction | 35 (100.0%) | 0 (0.0%) |
| Installation, Maintenance & Repair | 0 (0.0%) | 0 (0.0%) |
| Total (Category) | 51 (52.6%) | 46 (47.4%) |
| Total (Overall) | 921 (57.6%) | 678 (42.4%) |
Production, Transportation and Moving Occupations
The most common Production, Transportation and Moving occupations in Aguilita are Production (96 | 6.0%), Material Moving (53 | 3.3%), and Transportation (42 | 2.6%).
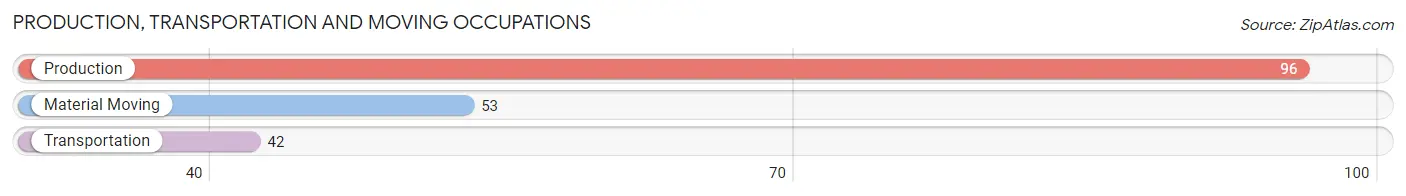
Production, Transportation and Moving Occupations by Sex
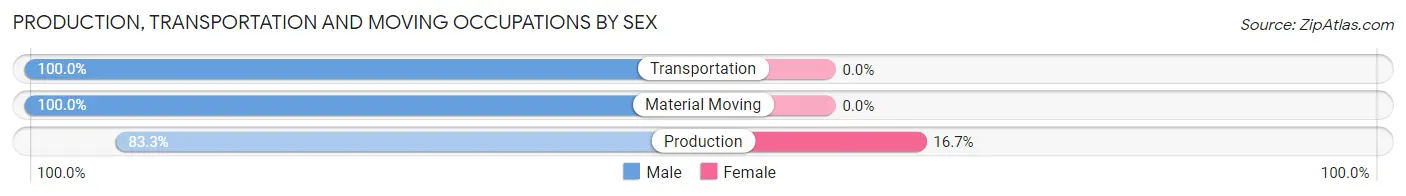
| Occupation | Male | Female |
| Production | 80 (83.3%) | 16 (16.7%) |
| Transportation | 42 (100.0%) | 0 (0.0%) |
| Material Moving | 53 (100.0%) | 0 (0.0%) |
| Total (Category) | 175 (91.6%) | 16 (8.4%) |
| Total (Overall) | 921 (57.6%) | 678 (42.4%) |
Employment Industries by Sex in Aguilita
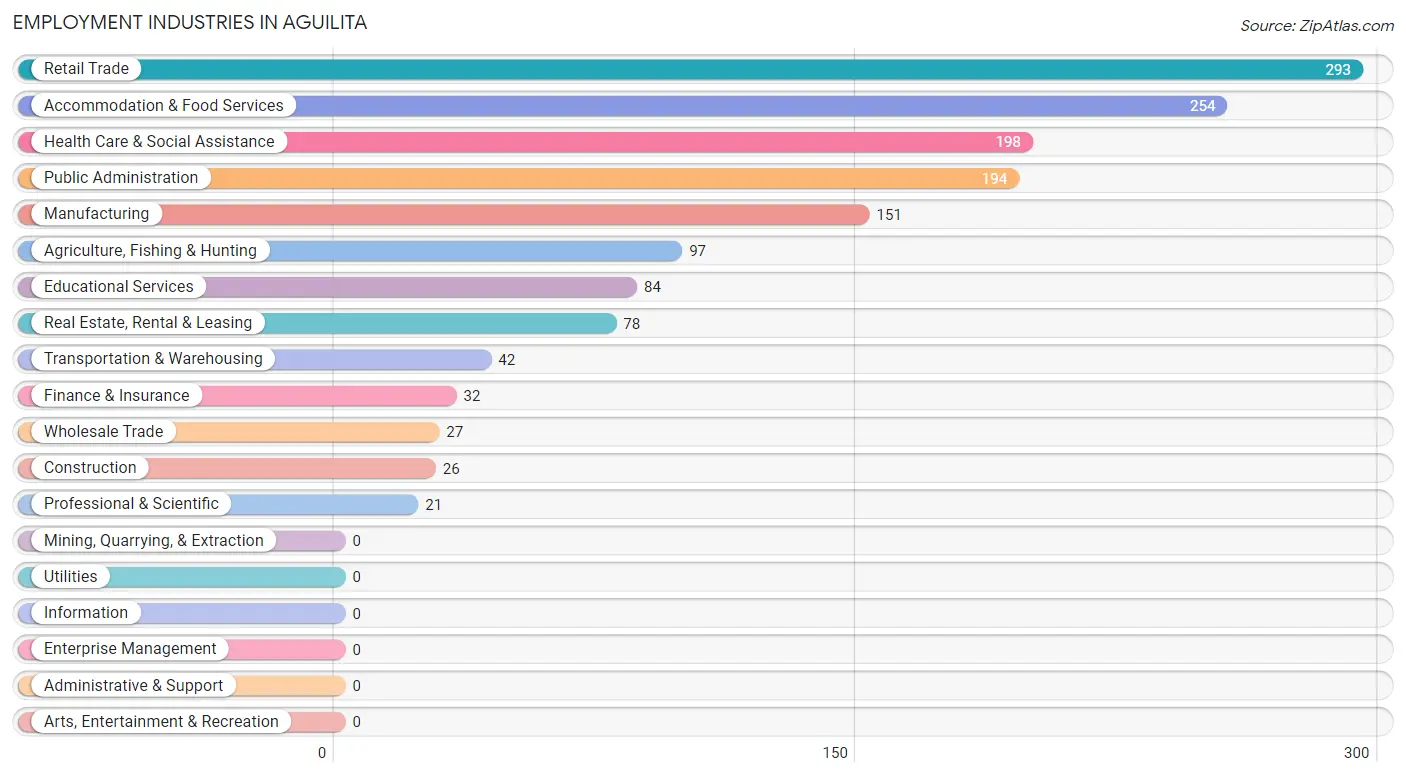
Employment Industries in Aguilita
The major employment industries in Aguilita include Retail Trade (293 | 18.3%), Accommodation & Food Services (254 | 15.9%), Health Care & Social Assistance (198 | 12.4%), Public Administration (194 | 12.1%), and Manufacturing (151 | 9.4%).
Employment Industries by Sex in Aguilita
The Aguilita industries that see more men than women are Transportation & Warehousing (100.0%), Accommodation & Food Services (84.7%), and Public Administration (74.7%), whereas the industries that tend to have a higher number of women are Construction (100.0%), Finance & Insurance (100.0%), and Educational Services (100.0%).
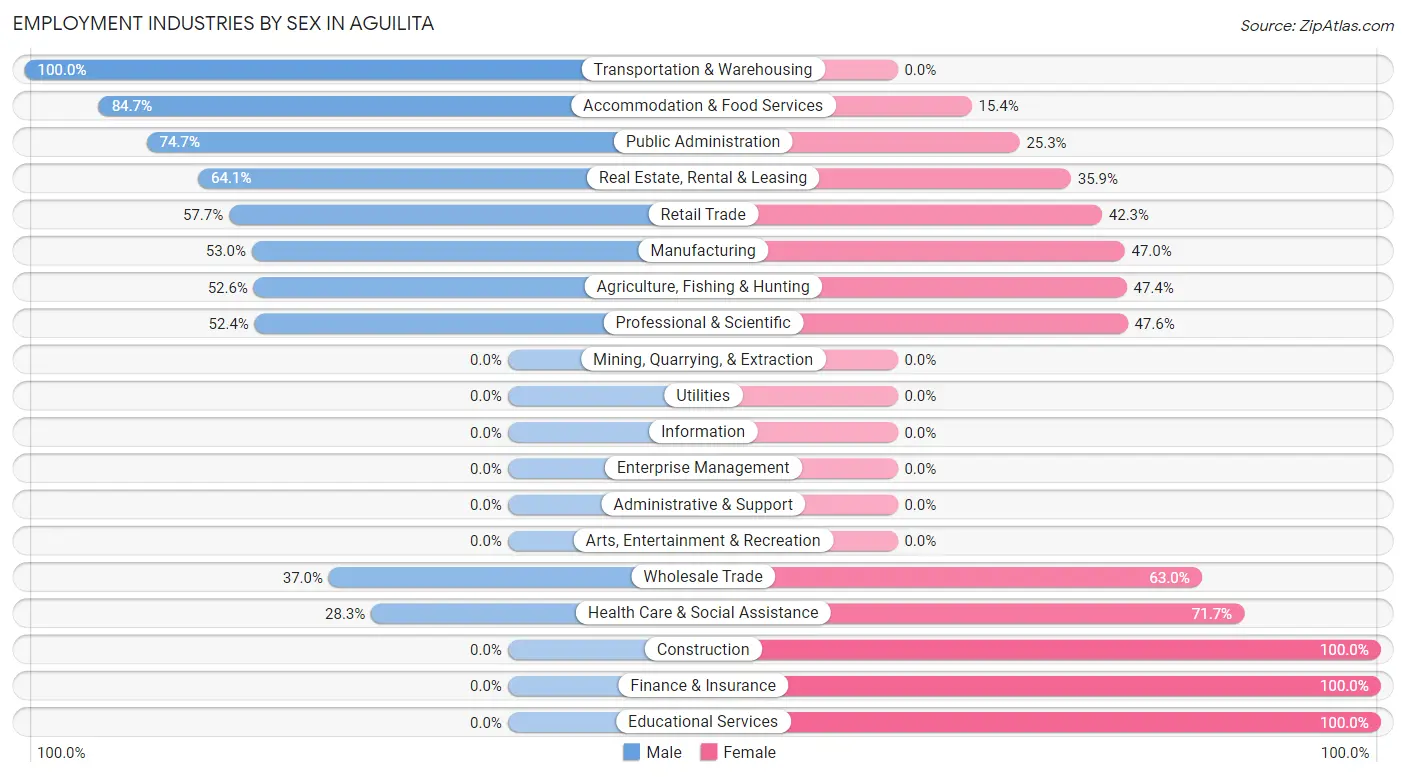
| Industry | Male | Female |
| Agriculture, Fishing & Hunting | 51 (52.6%) | 46 (47.4%) |
| Mining, Quarrying, & Extraction | 0 (0.0%) | 0 (0.0%) |
| Construction | 0 (0.0%) | 26 (100.0%) |
| Manufacturing | 80 (53.0%) | 71 (47.0%) |
| Wholesale Trade | 10 (37.0%) | 17 (63.0%) |
| Retail Trade | 169 (57.7%) | 124 (42.3%) |
| Transportation & Warehousing | 42 (100.0%) | 0 (0.0%) |
| Utilities | 0 (0.0%) | 0 (0.0%) |
| Information | 0 (0.0%) | 0 (0.0%) |
| Finance & Insurance | 0 (0.0%) | 32 (100.0%) |
| Real Estate, Rental & Leasing | 50 (64.1%) | 28 (35.9%) |
| Professional & Scientific | 11 (52.4%) | 10 (47.6%) |
| Enterprise Management | 0 (0.0%) | 0 (0.0%) |
| Administrative & Support | 0 (0.0%) | 0 (0.0%) |
| Educational Services | 0 (0.0%) | 84 (100.0%) |
| Health Care & Social Assistance | 56 (28.3%) | 142 (71.7%) |
| Arts, Entertainment & Recreation | 0 (0.0%) | 0 (0.0%) |
| Accommodation & Food Services | 215 (84.7%) | 39 (15.3%) |
| Public Administration | 145 (74.7%) | 49 (25.3%) |
| Total | 921 (57.6%) | 678 (42.4%) |
Education in Aguilita
School Enrollment in Aguilita
The most common levels of schooling among the 1,128 students in Aguilita are college / undergraduate (257 | 22.8%), high school (253 | 22.4%), and elementary school (220 | 19.5%).
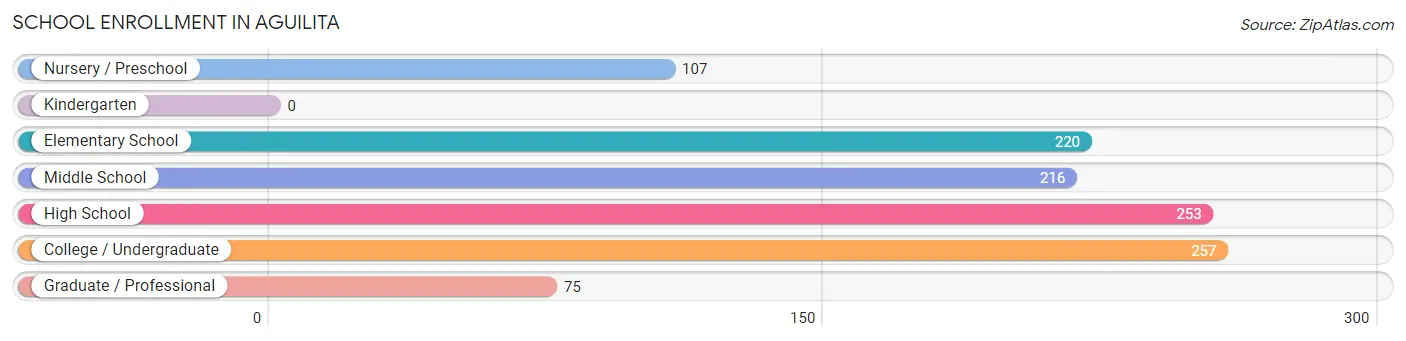
| School Level | # Students | % Students |
| Nursery / Preschool | 107 | 9.5% |
| Kindergarten | 0 | 0.0% |
| Elementary School | 220 | 19.5% |
| Middle School | 216 | 19.2% |
| High School | 253 | 22.4% |
| College / Undergraduate | 257 | 22.8% |
| Graduate / Professional | 75 | 6.7% |
| Total | 1,128 | 100.0% |
School Enrollment by Age by Funding Source in Aguilita
Out of a total of 1,128 students who are enrolled in schools in Aguilita, 483 (42.8%) attend a private institution, while the remaining 645 (57.2%) are enrolled in public schools. The age group of 25 to 34 year olds has the highest likelihood of being enrolled in private schools, with 151 (100.0% in the age bracket) enrolled. Conversely, the age group of 3 to 4 year olds has the lowest likelihood of being enrolled in a private school, with 81 (100.0% in the age bracket) attending a public institution.
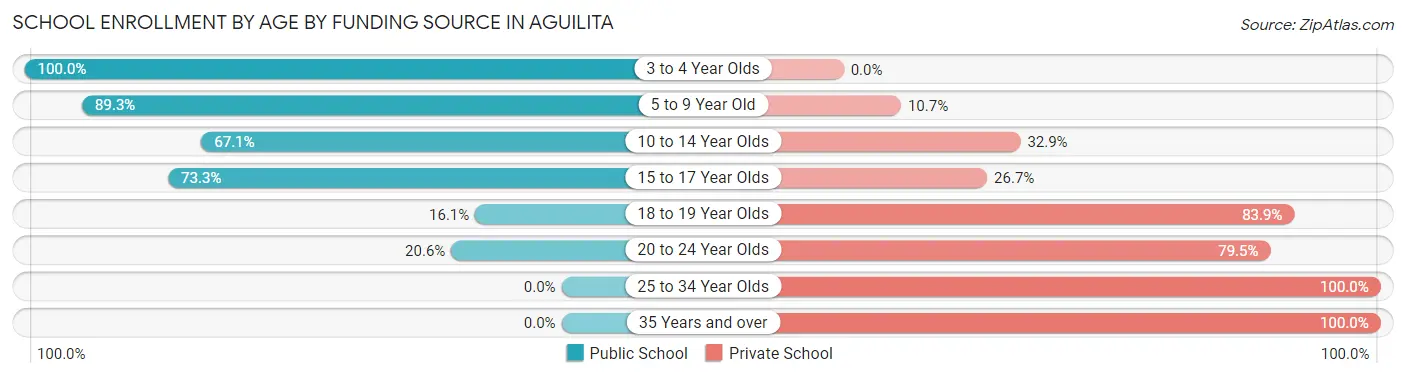
| Age Bracket | Public School | Private School |
| 3 to 4 Year Olds | 81 (100.0%) | 0 (0.0%) |
| 5 to 9 Year Old | 209 (89.3%) | 25 (10.7%) |
| 10 to 14 Year Olds | 167 (67.1%) | 82 (32.9%) |
| 15 to 17 Year Olds | 159 (73.3%) | 58 (26.7%) |
| 18 to 19 Year Olds | 14 (16.1%) | 73 (83.9%) |
| 20 to 24 Year Olds | 15 (20.5%) | 58 (79.4%) |
| 25 to 34 Year Olds | 0 (0.0%) | 151 (100.0%) |
| 35 Years and over | 0 (0.0%) | 36 (100.0%) |
| Total | 645 (57.2%) | 483 (42.8%) |
Educational Attainment by Field of Study in Aguilita
Business (204 | 38.3%), bio, nature & agricultural (137 | 25.7%), arts & humanities (76 | 14.3%), science & technology (48 | 9.0%), and education (34 | 6.4%) are the most common fields of study among 533 individuals in Aguilita who have obtained a bachelor's degree or higher.
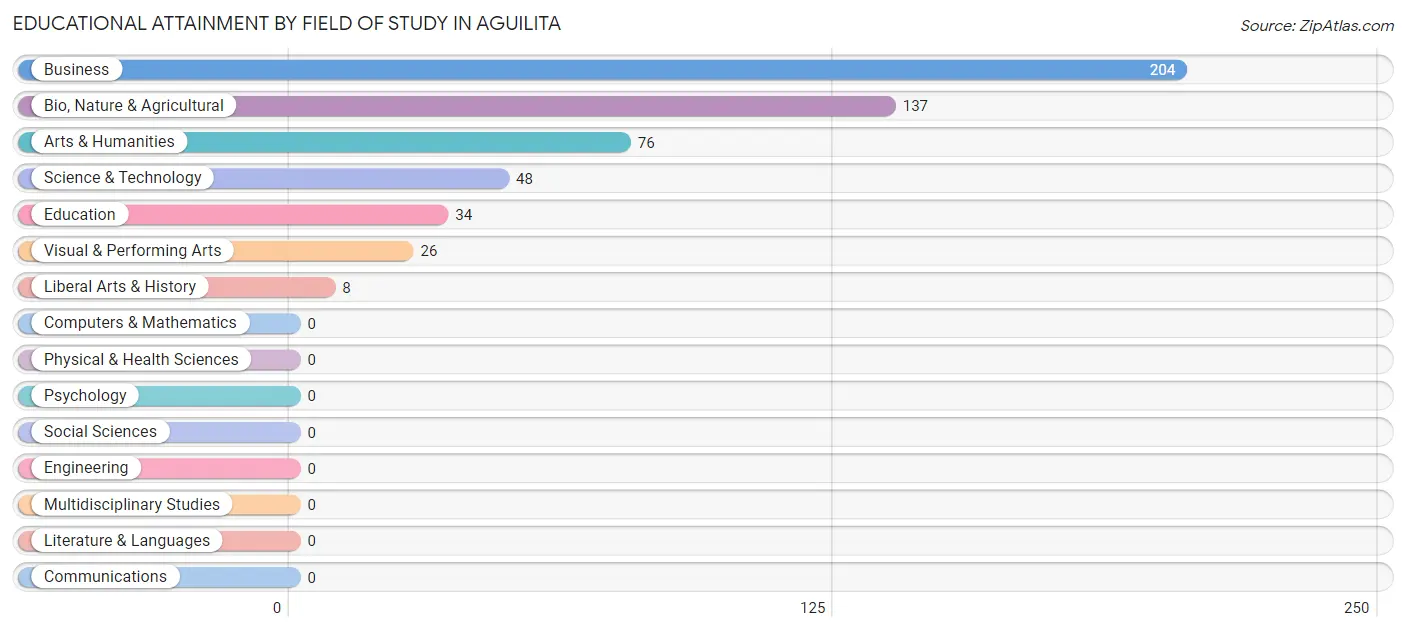
| Field of Study | # Graduates | % Graduates |
| Computers & Mathematics | 0 | 0.0% |
| Bio, Nature & Agricultural | 137 | 25.7% |
| Physical & Health Sciences | 0 | 0.0% |
| Psychology | 0 | 0.0% |
| Social Sciences | 0 | 0.0% |
| Engineering | 0 | 0.0% |
| Multidisciplinary Studies | 0 | 0.0% |
| Science & Technology | 48 | 9.0% |
| Business | 204 | 38.3% |
| Education | 34 | 6.4% |
| Literature & Languages | 0 | 0.0% |
| Liberal Arts & History | 8 | 1.5% |
| Visual & Performing Arts | 26 | 4.9% |
| Communications | 0 | 0.0% |
| Arts & Humanities | 76 | 14.3% |
| Total | 533 | 100.0% |
Transportation & Commute in Aguilita
Vehicle Availability by Sex in Aguilita
The most prevalent vehicle ownership categories in Aguilita are males with 2 vehicles (437, accounting for 48.0%) and females with 2 vehicles (227, making up 67.0%).
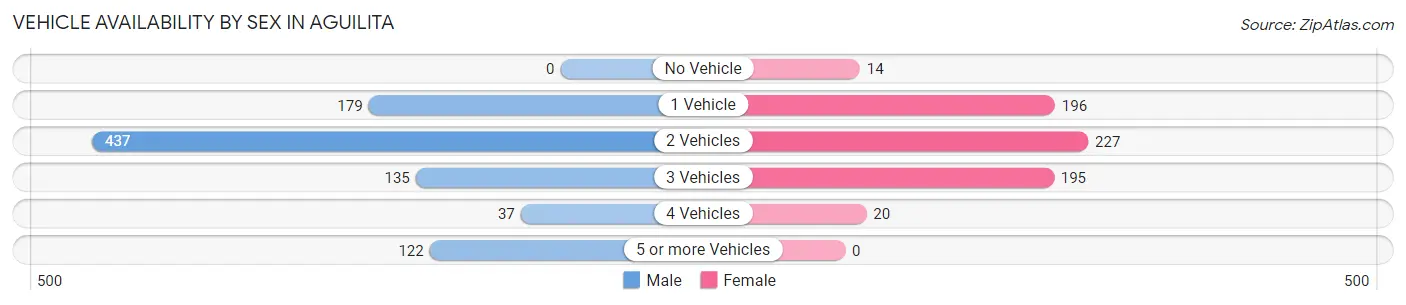
| Vehicles Available | Male | Female |
| No Vehicle | 0 (0.0%) | 14 (2.1%) |
| 1 Vehicle | 179 (19.7%) | 196 (30.1%) |
| 2 Vehicles | 437 (48.0%) | 227 (34.8%) |
| 3 Vehicles | 135 (14.8%) | 195 (29.9%) |
| 4 Vehicles | 37 (4.1%) | 20 (3.1%) |
| 5 or more Vehicles | 122 (13.4%) | 0 (0.0%) |
| Total | 910 (100.0%) | 652 (100.0%) |
Commute Time in Aguilita
The most frequently occuring commute durations in Aguilita are 30 to 34 minutes (541 commuters, 34.6%), 15 to 19 minutes (333 commuters, 21.3%), and 20 to 24 minutes (235 commuters, 15.0%).
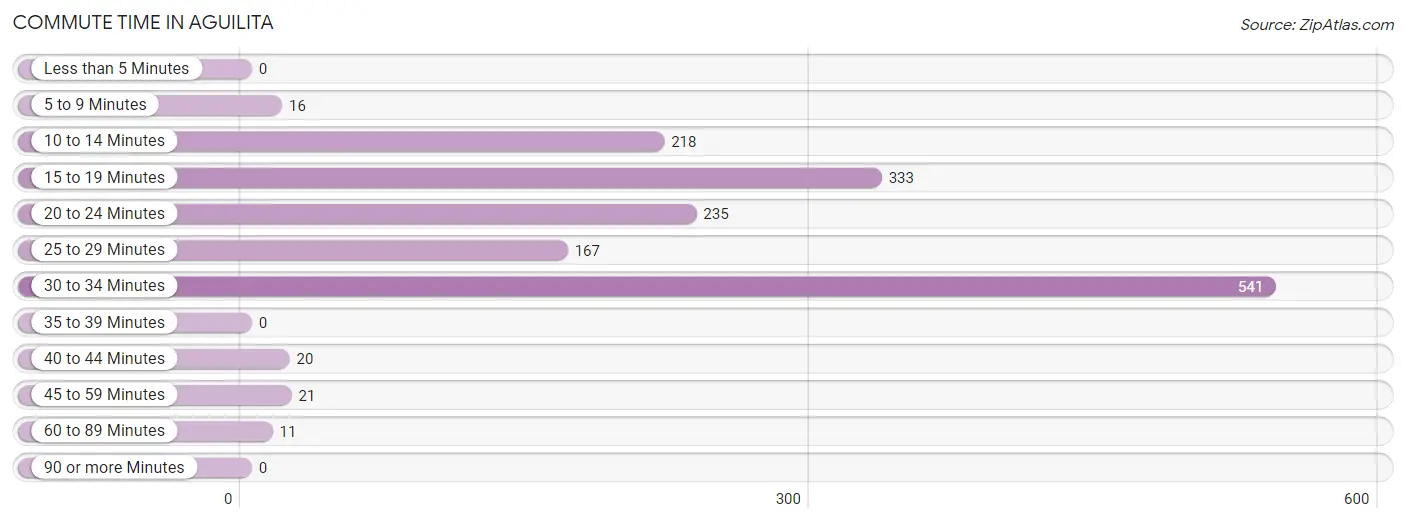
| Commute Time | # Commuters | % Commuters |
| Less than 5 Minutes | 0 | 0.0% |
| 5 to 9 Minutes | 16 | 1.0% |
| 10 to 14 Minutes | 218 | 14.0% |
| 15 to 19 Minutes | 333 | 21.3% |
| 20 to 24 Minutes | 235 | 15.0% |
| 25 to 29 Minutes | 167 | 10.7% |
| 30 to 34 Minutes | 541 | 34.6% |
| 35 to 39 Minutes | 0 | 0.0% |
| 40 to 44 Minutes | 20 | 1.3% |
| 45 to 59 Minutes | 21 | 1.3% |
| 60 to 89 Minutes | 11 | 0.7% |
| 90 or more Minutes | 0 | 0.0% |
Commute Time by Sex in Aguilita
The most common commute times in Aguilita are 30 to 34 minutes (357 commuters, 39.2%) for males and 15 to 19 minutes (195 commuters, 29.9%) for females.
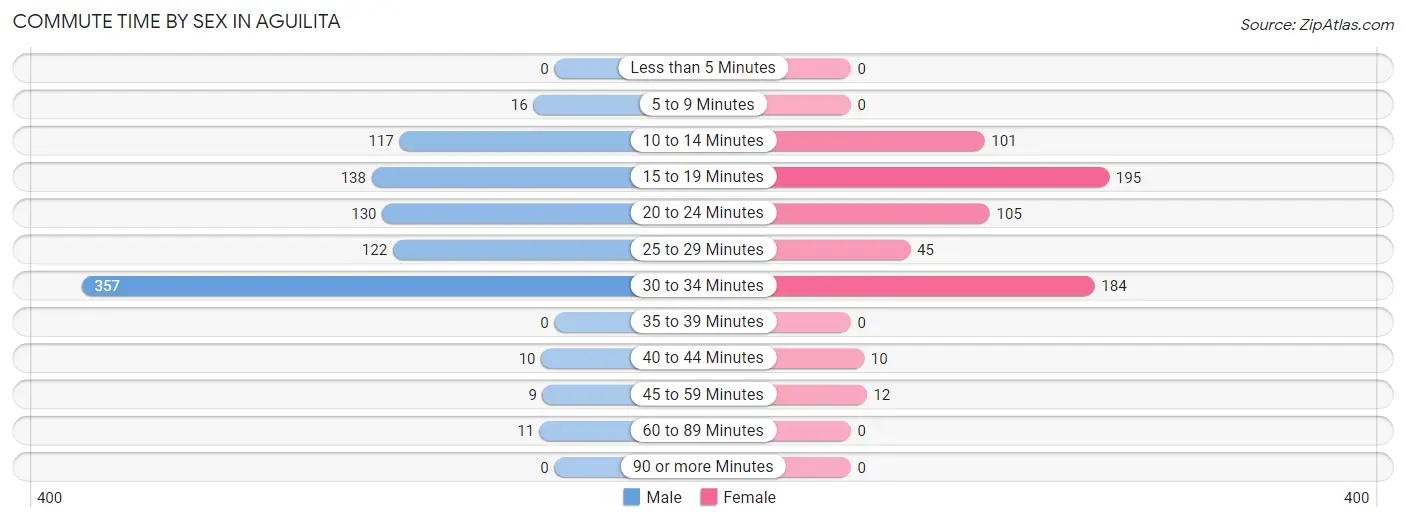
| Commute Time | Male | Female |
| Less than 5 Minutes | 0 (0.0%) | 0 (0.0%) |
| 5 to 9 Minutes | 16 (1.8%) | 0 (0.0%) |
| 10 to 14 Minutes | 117 (12.9%) | 101 (15.5%) |
| 15 to 19 Minutes | 138 (15.2%) | 195 (29.9%) |
| 20 to 24 Minutes | 130 (14.3%) | 105 (16.1%) |
| 25 to 29 Minutes | 122 (13.4%) | 45 (6.9%) |
| 30 to 34 Minutes | 357 (39.2%) | 184 (28.2%) |
| 35 to 39 Minutes | 0 (0.0%) | 0 (0.0%) |
| 40 to 44 Minutes | 10 (1.1%) | 10 (1.5%) |
| 45 to 59 Minutes | 9 (1.0%) | 12 (1.8%) |
| 60 to 89 Minutes | 11 (1.2%) | 0 (0.0%) |
| 90 or more Minutes | 0 (0.0%) | 0 (0.0%) |
Time of Departure to Work by Sex in Aguilita
The most frequent times of departure to work in Aguilita are 5:00 AM to 5:29 AM (143, 15.7%) for males and 7:00 AM to 7:29 AM (240, 36.8%) for females.
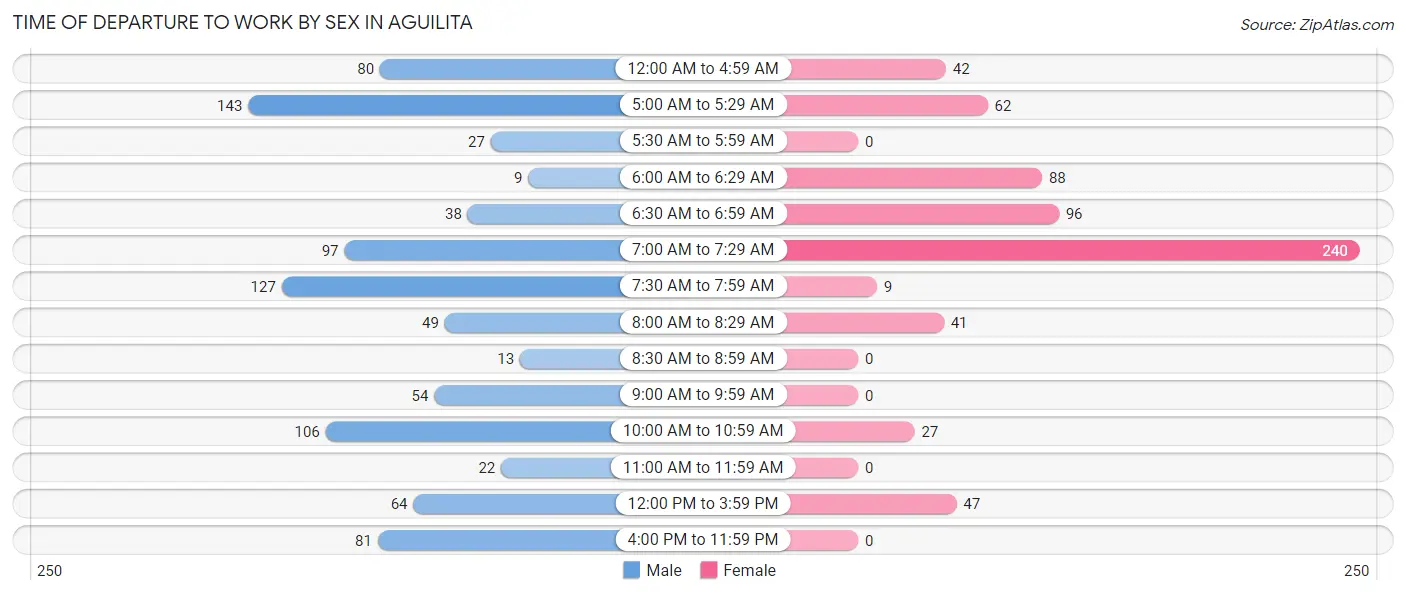
| Time of Departure | Male | Female |
| 12:00 AM to 4:59 AM | 80 (8.8%) | 42 (6.4%) |
| 5:00 AM to 5:29 AM | 143 (15.7%) | 62 (9.5%) |
| 5:30 AM to 5:59 AM | 27 (3.0%) | 0 (0.0%) |
| 6:00 AM to 6:29 AM | 9 (1.0%) | 88 (13.5%) |
| 6:30 AM to 6:59 AM | 38 (4.2%) | 96 (14.7%) |
| 7:00 AM to 7:29 AM | 97 (10.7%) | 240 (36.8%) |
| 7:30 AM to 7:59 AM | 127 (14.0%) | 9 (1.4%) |
| 8:00 AM to 8:29 AM | 49 (5.4%) | 41 (6.3%) |
| 8:30 AM to 8:59 AM | 13 (1.4%) | 0 (0.0%) |
| 9:00 AM to 9:59 AM | 54 (5.9%) | 0 (0.0%) |
| 10:00 AM to 10:59 AM | 106 (11.7%) | 27 (4.1%) |
| 11:00 AM to 11:59 AM | 22 (2.4%) | 0 (0.0%) |
| 12:00 PM to 3:59 PM | 64 (7.0%) | 47 (7.2%) |
| 4:00 PM to 11:59 PM | 81 (8.9%) | 0 (0.0%) |
| Total | 910 (100.0%) | 652 (100.0%) |
Housing Occupancy in Aguilita
Occupancy by Ownership in Aguilita
Of the total 1,395 dwellings in Aguilita, owner-occupied units account for 1,148 (82.3%), while renter-occupied units make up 247 (17.7%).
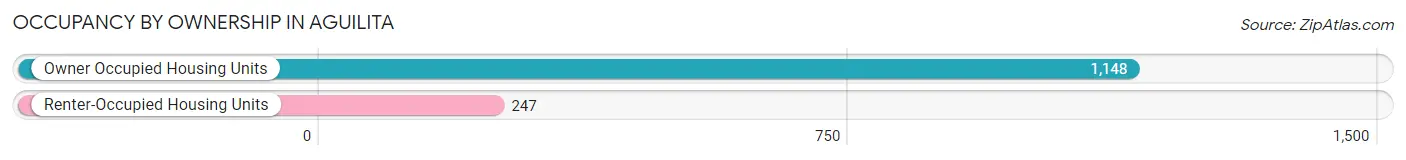
| Occupancy | # Housing Units | % Housing Units |
| Owner Occupied Housing Units | 1,148 | 82.3% |
| Renter-Occupied Housing Units | 247 | 17.7% |
| Total Occupied Housing Units | 1,395 | 100.0% |
Occupancy by Household Size in Aguilita
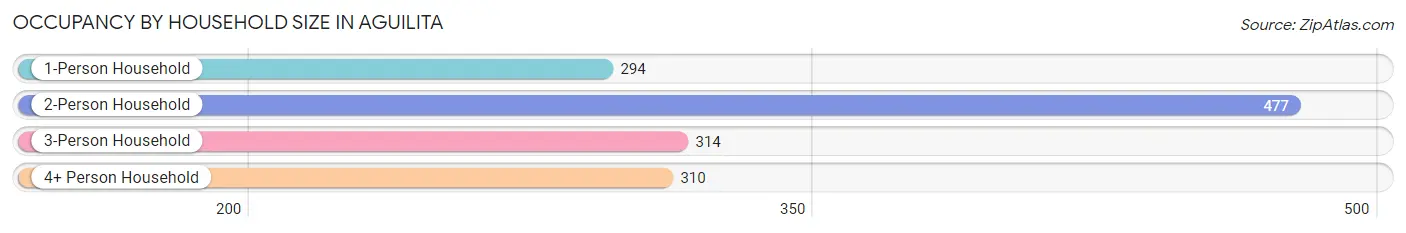
| Household Size | # Housing Units | % Housing Units |
| 1-Person Household | 294 | 21.1% |
| 2-Person Household | 477 | 34.2% |
| 3-Person Household | 314 | 22.5% |
| 4+ Person Household | 310 | 22.2% |
| Total Housing Units | 1,395 | 100.0% |
Occupancy by Ownership by Household Size in Aguilita
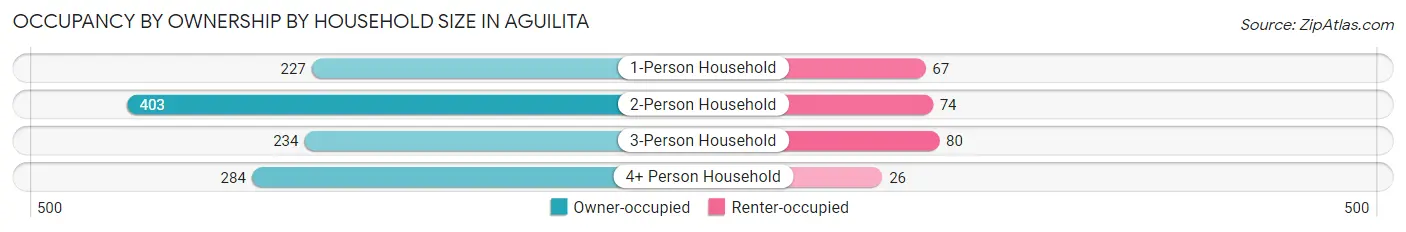
| Household Size | Owner-occupied | Renter-occupied |
| 1-Person Household | 227 (77.2%) | 67 (22.8%) |
| 2-Person Household | 403 (84.5%) | 74 (15.5%) |
| 3-Person Household | 234 (74.5%) | 80 (25.5%) |
| 4+ Person Household | 284 (91.6%) | 26 (8.4%) |
| Total Housing Units | 1,148 (82.3%) | 247 (17.7%) |
Occupancy by Educational Attainment in Aguilita
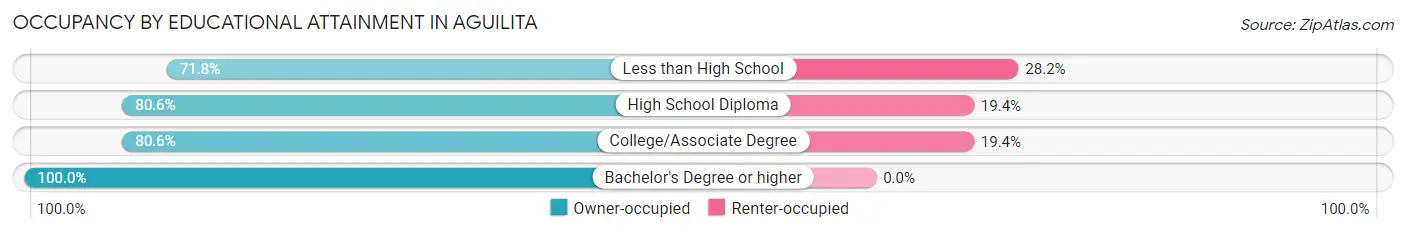
| Household Size | Owner-occupied | Renter-occupied |
| Less than High School | 219 (71.8%) | 86 (28.2%) |
| High School Diploma | 287 (80.6%) | 69 (19.4%) |
| College/Associate Degree | 383 (80.6%) | 92 (19.4%) |
| Bachelor's Degree or higher | 259 (100.0%) | 0 (0.0%) |
Occupancy by Age of Householder in Aguilita
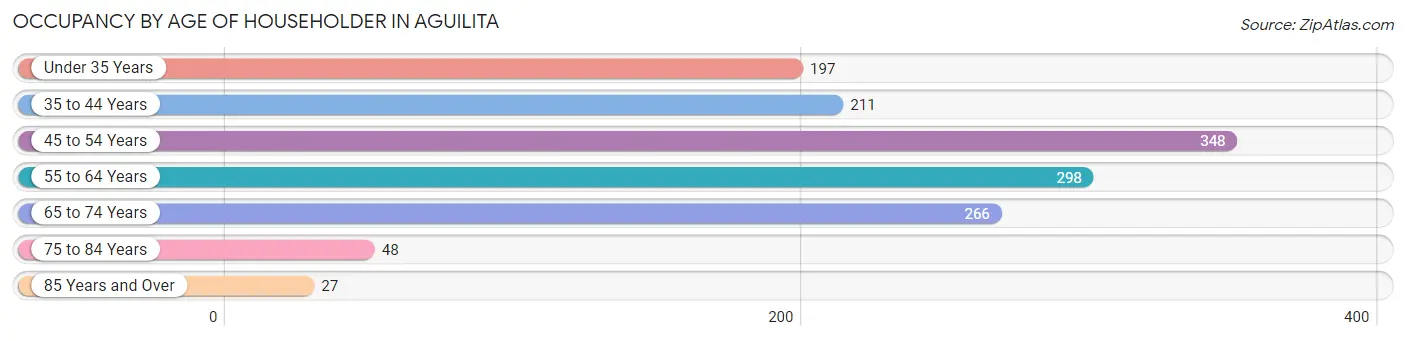
| Age Bracket | # Households | % Households |
| Under 35 Years | 197 | 14.1% |
| 35 to 44 Years | 211 | 15.1% |
| 45 to 54 Years | 348 | 24.9% |
| 55 to 64 Years | 298 | 21.4% |
| 65 to 74 Years | 266 | 19.1% |
| 75 to 84 Years | 48 | 3.4% |
| 85 Years and Over | 27 | 1.9% |
| Total | 1,395 | 100.0% |
Housing Finances in Aguilita
Median Income by Occupancy in Aguilita
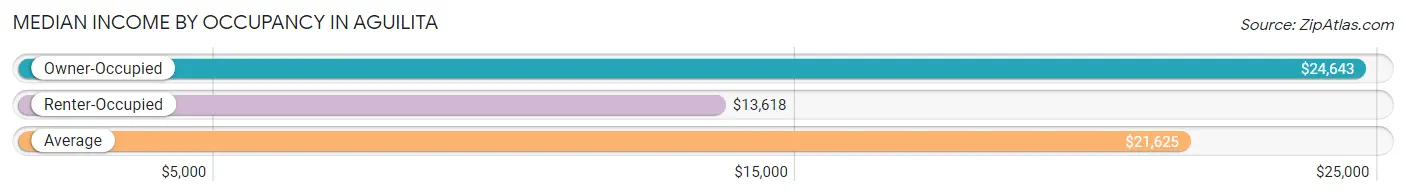
| Occupancy Type | # Households | Median Income |
| Owner-Occupied | 1,148 (82.3%) | $24,643 |
| Renter-Occupied | 247 (17.7%) | $13,618 |
| Average | 1,395 (100.0%) | $21,625 |
Occupancy by Householder Income Bracket in Aguilita
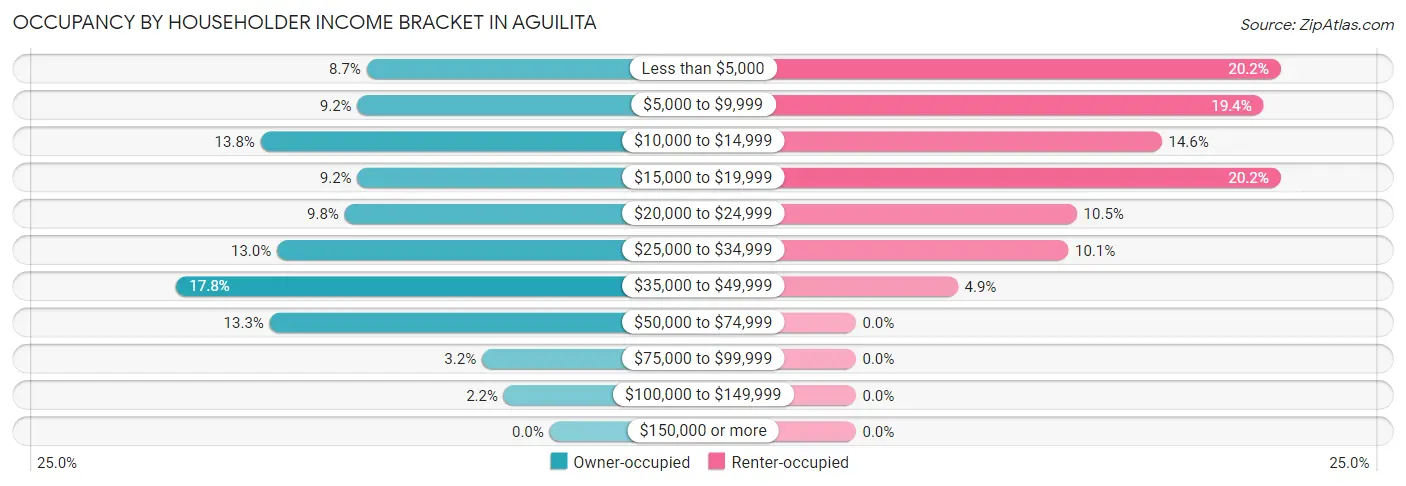
| Income Bracket | Owner-occupied | Renter-occupied |
| Less than $5,000 | 100 (8.7%) | 50 (20.2%) |
| $5,000 to $9,999 | 105 (9.1%) | 48 (19.4%) |
| $10,000 to $14,999 | 158 (13.8%) | 36 (14.6%) |
| $15,000 to $19,999 | 105 (9.1%) | 50 (20.2%) |
| $20,000 to $24,999 | 112 (9.8%) | 26 (10.5%) |
| $25,000 to $34,999 | 149 (13.0%) | 25 (10.1%) |
| $35,000 to $49,999 | 204 (17.8%) | 12 (4.9%) |
| $50,000 to $74,999 | 153 (13.3%) | 0 (0.0%) |
| $75,000 to $99,999 | 37 (3.2%) | 0 (0.0%) |
| $100,000 to $149,999 | 25 (2.2%) | 0 (0.0%) |
| $150,000 or more | 0 (0.0%) | 0 (0.0%) |
| Total | 1,148 (100.0%) | 247 (100.0%) |
Monthly Housing Cost Tiers in Aguilita
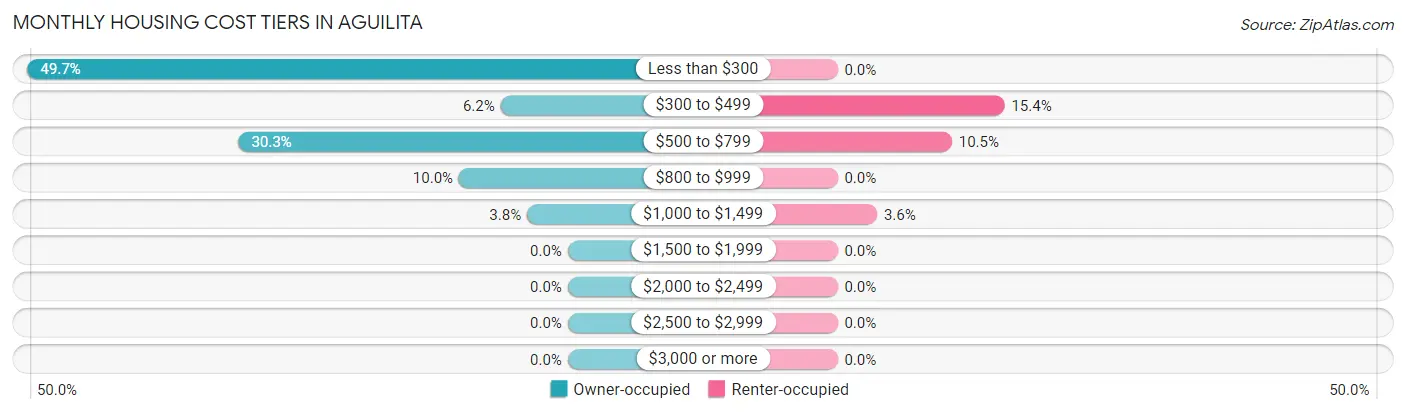
| Monthly Cost | Owner-occupied | Renter-occupied |
| Less than $300 | 571 (49.7%) | 0 (0.0%) |
| $300 to $499 | 71 (6.2%) | 38 (15.4%) |
| $500 to $799 | 348 (30.3%) | 26 (10.5%) |
| $800 to $999 | 115 (10.0%) | 0 (0.0%) |
| $1,000 to $1,499 | 43 (3.7%) | 9 (3.6%) |
| $1,500 to $1,999 | 0 (0.0%) | 0 (0.0%) |
| $2,000 to $2,499 | 0 (0.0%) | 0 (0.0%) |
| $2,500 to $2,999 | 0 (0.0%) | 0 (0.0%) |
| $3,000 or more | 0 (0.0%) | 0 (0.0%) |
| Total | 1,148 (100.0%) | 247 (100.0%) |
Physical Housing Characteristics in Aguilita
Housing Structures in Aguilita
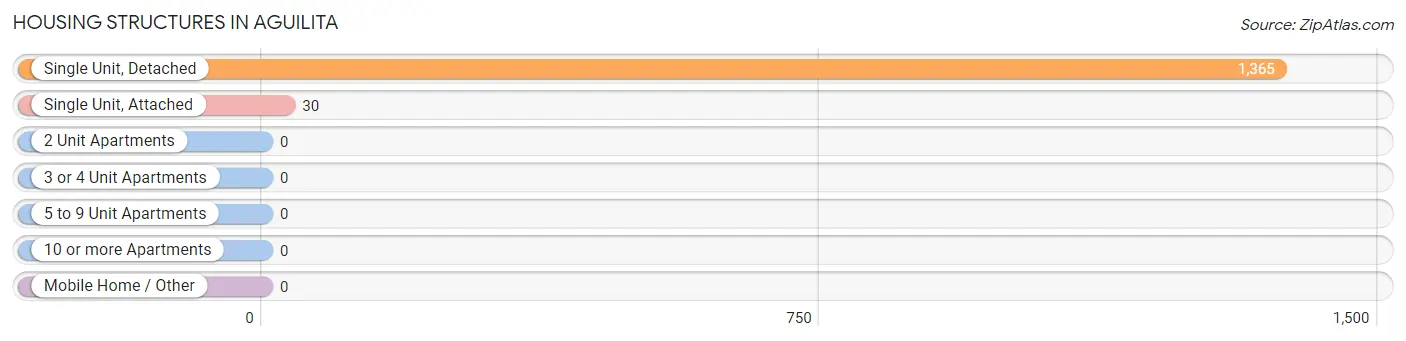
| Structure Type | # Housing Units | % Housing Units |
| Single Unit, Detached | 1,365 | 97.9% |
| Single Unit, Attached | 30 | 2.1% |
| 2 Unit Apartments | 0 | 0.0% |
| 3 or 4 Unit Apartments | 0 | 0.0% |
| 5 to 9 Unit Apartments | 0 | 0.0% |
| 10 or more Apartments | 0 | 0.0% |
| Mobile Home / Other | 0 | 0.0% |
| Total | 1,395 | 100.0% |
Housing Structures by Occupancy in Aguilita
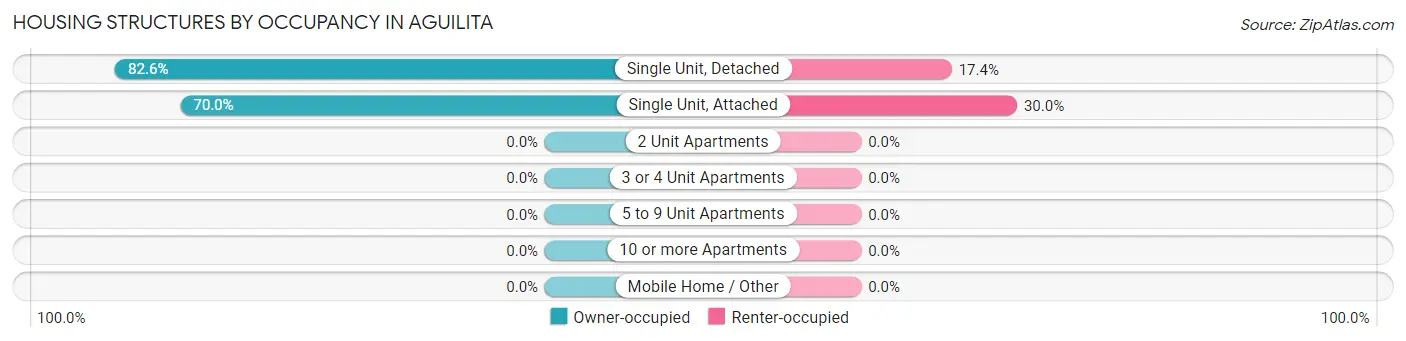
| Structure Type | Owner-occupied | Renter-occupied |
| Single Unit, Detached | 1,127 (82.6%) | 238 (17.4%) |
| Single Unit, Attached | 21 (70.0%) | 9 (30.0%) |
| 2 Unit Apartments | 0 (0.0%) | 0 (0.0%) |
| 3 or 4 Unit Apartments | 0 (0.0%) | 0 (0.0%) |
| 5 to 9 Unit Apartments | 0 (0.0%) | 0 (0.0%) |
| 10 or more Apartments | 0 (0.0%) | 0 (0.0%) |
| Mobile Home / Other | 0 (0.0%) | 0 (0.0%) |
| Total | 1,148 (82.3%) | 247 (17.7%) |
Housing Structures by Number of Rooms in Aguilita
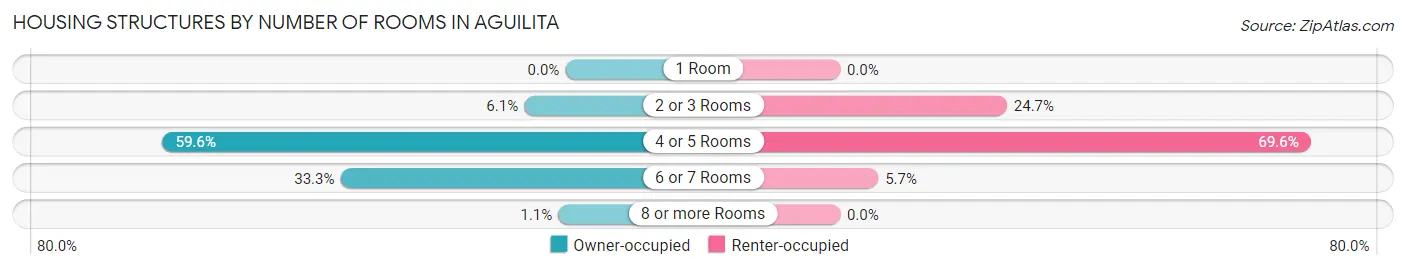
| Number of Rooms | Owner-occupied | Renter-occupied |
| 1 Room | 0 (0.0%) | 0 (0.0%) |
| 2 or 3 Rooms | 70 (6.1%) | 61 (24.7%) |
| 4 or 5 Rooms | 684 (59.6%) | 172 (69.6%) |
| 6 or 7 Rooms | 382 (33.3%) | 14 (5.7%) |
| 8 or more Rooms | 12 (1.1%) | 0 (0.0%) |
| Total | 1,148 (100.0%) | 247 (100.0%) |
Housing Structure by Heating Type in Aguilita
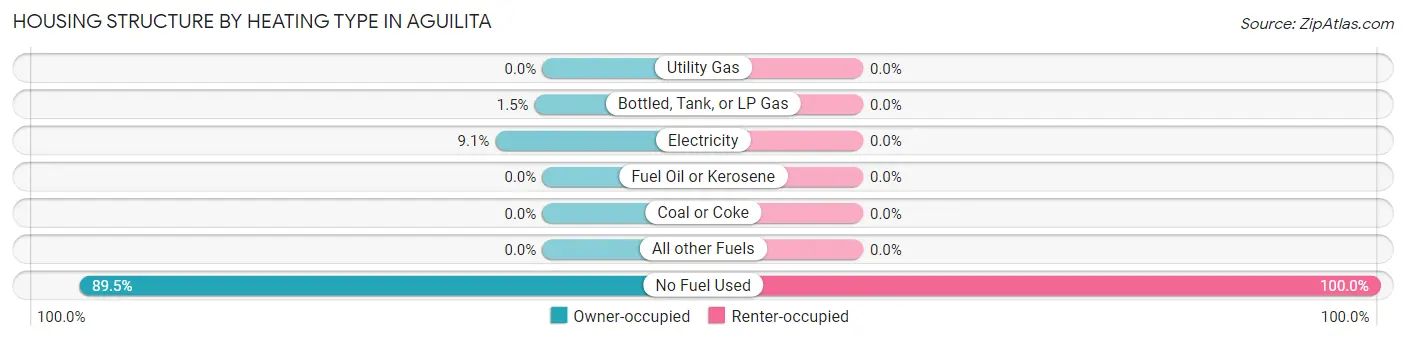
| Heating Type | Owner-occupied | Renter-occupied |
| Utility Gas | 0 (0.0%) | 0 (0.0%) |
| Bottled, Tank, or LP Gas | 17 (1.5%) | 0 (0.0%) |
| Electricity | 104 (9.1%) | 0 (0.0%) |
| Fuel Oil or Kerosene | 0 (0.0%) | 0 (0.0%) |
| Coal or Coke | 0 (0.0%) | 0 (0.0%) |
| All other Fuels | 0 (0.0%) | 0 (0.0%) |
| No Fuel Used | 1,027 (89.5%) | 247 (100.0%) |
| Total | 1,148 (100.0%) | 247 (100.0%) |
Household Vehicle Usage in Aguilita
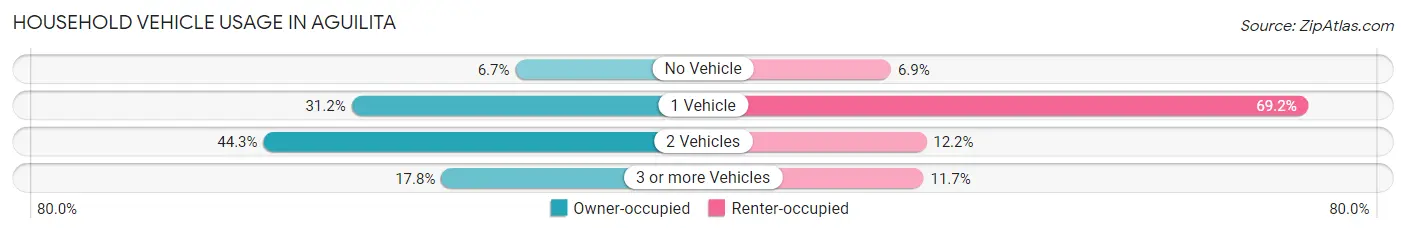
| Vehicles per Household | Owner-occupied | Renter-occupied |
| No Vehicle | 77 (6.7%) | 17 (6.9%) |
| 1 Vehicle | 358 (31.2%) | 171 (69.2%) |
| 2 Vehicles | 509 (44.3%) | 30 (12.1%) |
| 3 or more Vehicles | 204 (17.8%) | 29 (11.7%) |
| Total | 1,148 (100.0%) | 247 (100.0%) |
Real Estate & Mortgages in Aguilita
Real Estate and Mortgage Overview in Aguilita
| Characteristic | Without Mortgage | With Mortgage |
| Housing Units | 606 | 542 |
| Median Property Value | $64,500 | $111,400 |
| Median Household Income | $19,342 | $0 |
| Monthly Housing Costs | $131 | $0 |
| Real Estate Taxes | - | - |
Property Value by Mortgage Status in Aguilita
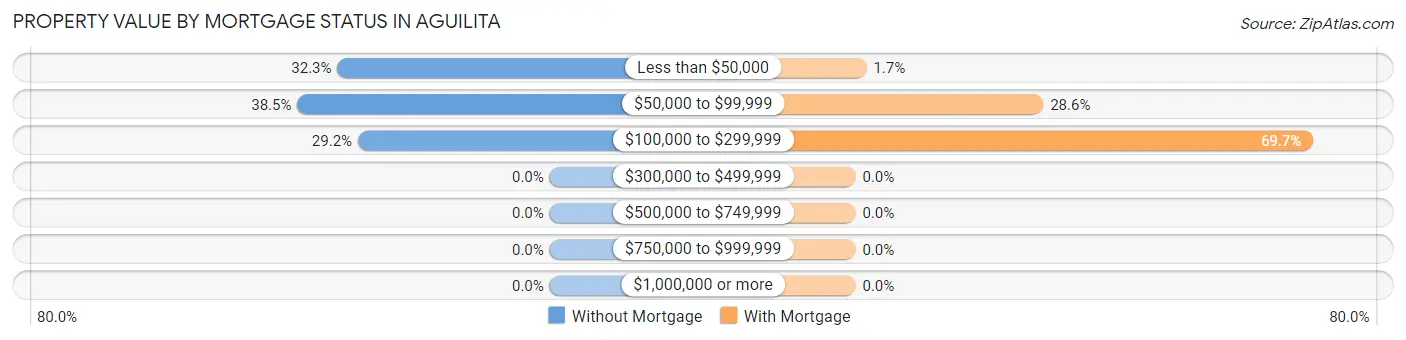
| Property Value | Without Mortgage | With Mortgage |
| Less than $50,000 | 196 (32.3%) | 9 (1.7%) |
| $50,000 to $99,999 | 233 (38.5%) | 155 (28.6%) |
| $100,000 to $299,999 | 177 (29.2%) | 378 (69.7%) |
| $300,000 to $499,999 | 0 (0.0%) | 0 (0.0%) |
| $500,000 to $749,999 | 0 (0.0%) | 0 (0.0%) |
| $750,000 to $999,999 | 0 (0.0%) | 0 (0.0%) |
| $1,000,000 or more | 0 (0.0%) | 0 (0.0%) |
| Total | 606 (100.0%) | 542 (100.0%) |
Household Income by Mortgage Status in Aguilita
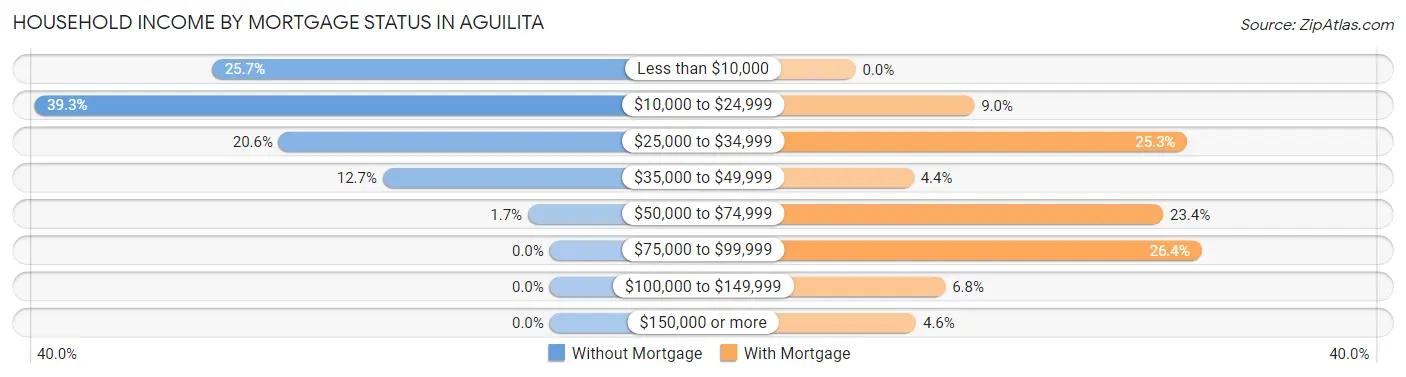
| Household Income | Without Mortgage | With Mortgage |
| Less than $10,000 | 156 (25.7%) | 0 (0.0%) |
| $10,000 to $24,999 | 238 (39.3%) | 49 (9.0%) |
| $25,000 to $34,999 | 125 (20.6%) | 137 (25.3%) |
| $35,000 to $49,999 | 77 (12.7%) | 24 (4.4%) |
| $50,000 to $74,999 | 10 (1.7%) | 127 (23.4%) |
| $75,000 to $99,999 | 0 (0.0%) | 143 (26.4%) |
| $100,000 to $149,999 | 0 (0.0%) | 37 (6.8%) |
| $150,000 or more | 0 (0.0%) | 25 (4.6%) |
| Total | 606 (100.0%) | 542 (100.0%) |
Property Value to Household Income Ratio in Aguilita
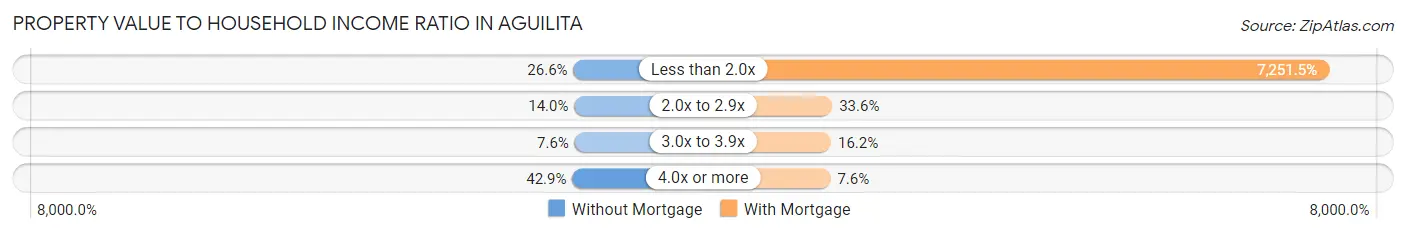
| Value-to-Income Ratio | Without Mortgage | With Mortgage |
| Less than 2.0x | 161 (26.6%) | 39,303 (7,251.5%) |
| 2.0x to 2.9x | 85 (14.0%) | 182 (33.6%) |
| 3.0x to 3.9x | 46 (7.6%) | 88 (16.2%) |
| 4.0x or more | 260 (42.9%) | 41 (7.6%) |
| Total | 606 (100.0%) | 542 (100.0%) |
Real Estate Taxes by Mortgage Status in Aguilita
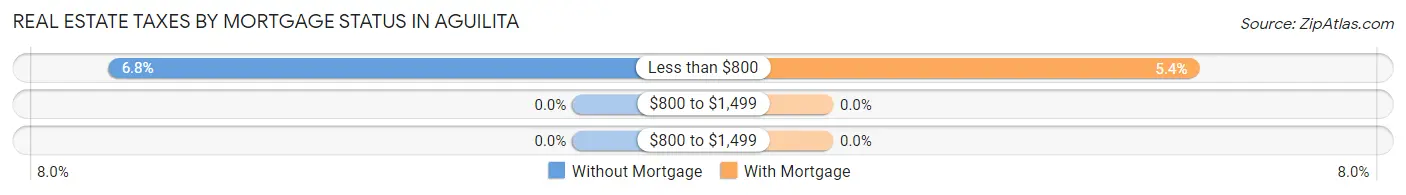
| Property Taxes | Without Mortgage | With Mortgage |
| Less than $800 | 41 (6.8%) | 29 (5.3%) |
| $800 to $1,499 | 0 (0.0%) | 0 (0.0%) |
| $800 to $1,499 | 0 (0.0%) | 0 (0.0%) |
| Total | 606 (100.0%) | 542 (100.0%) |
Health & Disability in Aguilita
Health Insurance Coverage by Age in Aguilita
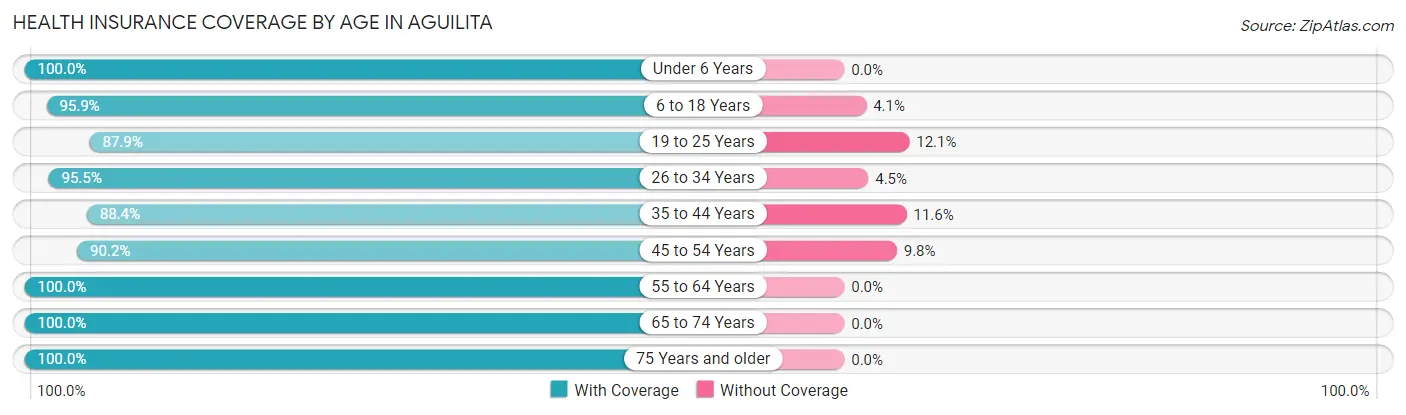
| Age Bracket | With Coverage | Without Coverage |
| Under 6 Years | 195 (100.0%) | 0 (0.0%) |
| 6 to 18 Years | 706 (95.9%) | 30 (4.1%) |
| 19 to 25 Years | 522 (87.9%) | 72 (12.1%) |
| 26 to 34 Years | 427 (95.5%) | 20 (4.5%) |
| 35 to 44 Years | 312 (88.4%) | 41 (11.6%) |
| 45 to 54 Years | 599 (90.2%) | 65 (9.8%) |
| 55 to 64 Years | 543 (100.0%) | 0 (0.0%) |
| 65 to 74 Years | 412 (100.0%) | 0 (0.0%) |
| 75 Years and older | 253 (100.0%) | 0 (0.0%) |
| Total | 3,969 (94.6%) | 228 (5.4%) |
Health Insurance Coverage by Citizenship Status in Aguilita
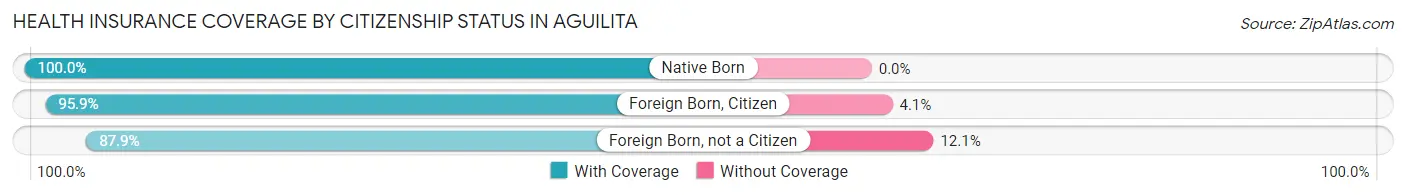
| Citizenship Status | With Coverage | Without Coverage |
| Native Born | 195 (100.0%) | 0 (0.0%) |
| Foreign Born, Citizen | 706 (95.9%) | 30 (4.1%) |
| Foreign Born, not a Citizen | 522 (87.9%) | 72 (12.1%) |
Health Insurance Coverage by Household Income in Aguilita
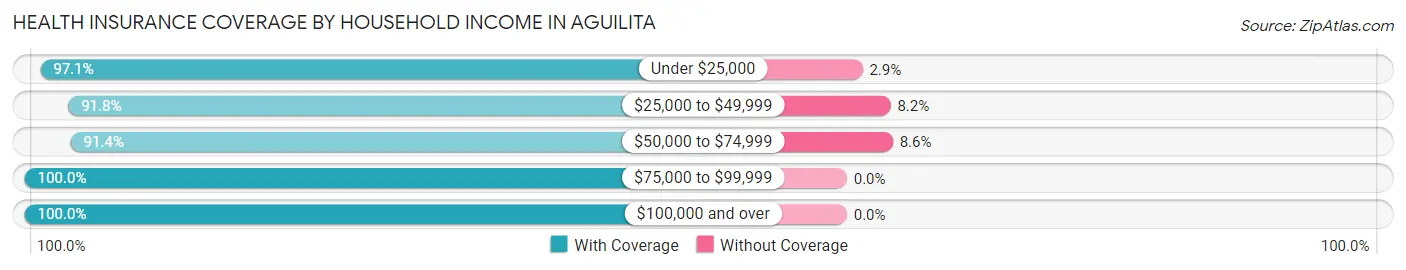
| Household Income | With Coverage | Without Coverage |
| Under $25,000 | 1,880 (97.1%) | 57 (2.9%) |
| $25,000 to $49,999 | 1,179 (91.8%) | 105 (8.2%) |
| $50,000 to $74,999 | 701 (91.4%) | 66 (8.6%) |
| $75,000 to $99,999 | 70 (100.0%) | 0 (0.0%) |
| $100,000 and over | 139 (100.0%) | 0 (0.0%) |
Public vs Private Health Insurance Coverage by Age in Aguilita
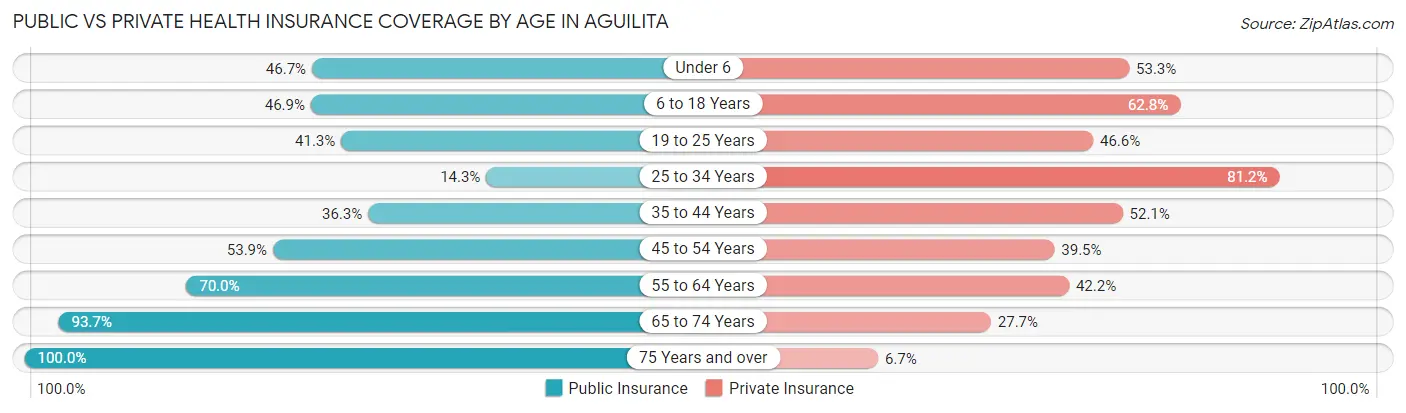
| Age Bracket | Public Insurance | Private Insurance |
| Under 6 | 91 (46.7%) | 104 (53.3%) |
| 6 to 18 Years | 345 (46.9%) | 462 (62.8%) |
| 19 to 25 Years | 245 (41.2%) | 277 (46.6%) |
| 25 to 34 Years | 64 (14.3%) | 363 (81.2%) |
| 35 to 44 Years | 128 (36.3%) | 184 (52.1%) |
| 45 to 54 Years | 358 (53.9%) | 262 (39.5%) |
| 55 to 64 Years | 380 (70.0%) | 229 (42.2%) |
| 65 to 74 Years | 386 (93.7%) | 114 (27.7%) |
| 75 Years and over | 253 (100.0%) | 17 (6.7%) |
| Total | 2,250 (53.6%) | 2,012 (47.9%) |
Disability Status by Sex by Age in Aguilita
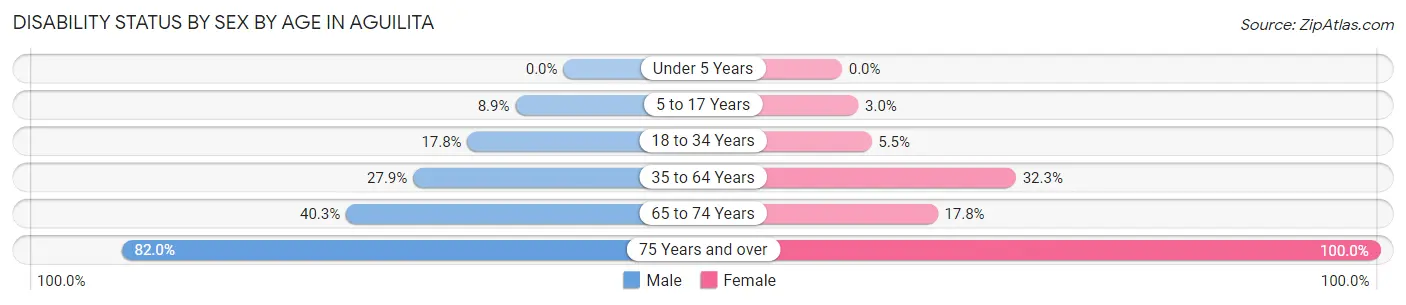
| Age Bracket | Male | Female |
| Under 5 Years | 0 (0.0%) | 0 (0.0%) |
| 5 to 17 Years | 24 (8.9%) | 13 (3.0%) |
| 18 to 34 Years | 115 (17.8%) | 25 (5.5%) |
| 35 to 64 Years | 176 (27.9%) | 300 (32.3%) |
| 65 to 74 Years | 73 (40.3%) | 41 (17.7%) |
| 75 Years and over | 41 (82.0%) | 203 (100.0%) |
Disability Class by Sex by Age in Aguilita
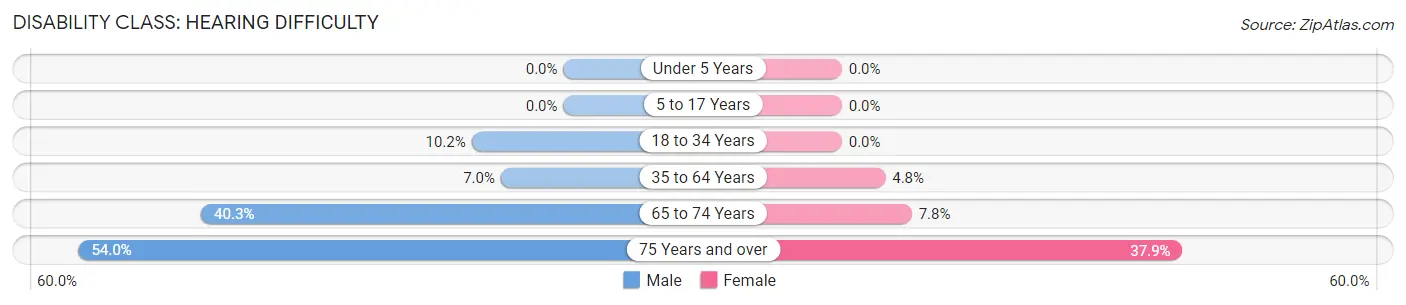
Disability Class: Hearing Difficulty
| Age Bracket | Male | Female |
| Under 5 Years | 0 (0.0%) | 0 (0.0%) |
| 5 to 17 Years | 0 (0.0%) | 0 (0.0%) |
| 18 to 34 Years | 66 (10.2%) | 0 (0.0%) |
| 35 to 64 Years | 44 (7.0%) | 45 (4.8%) |
| 65 to 74 Years | 73 (40.3%) | 18 (7.8%) |
| 75 Years and over | 27 (54.0%) | 77 (37.9%) |
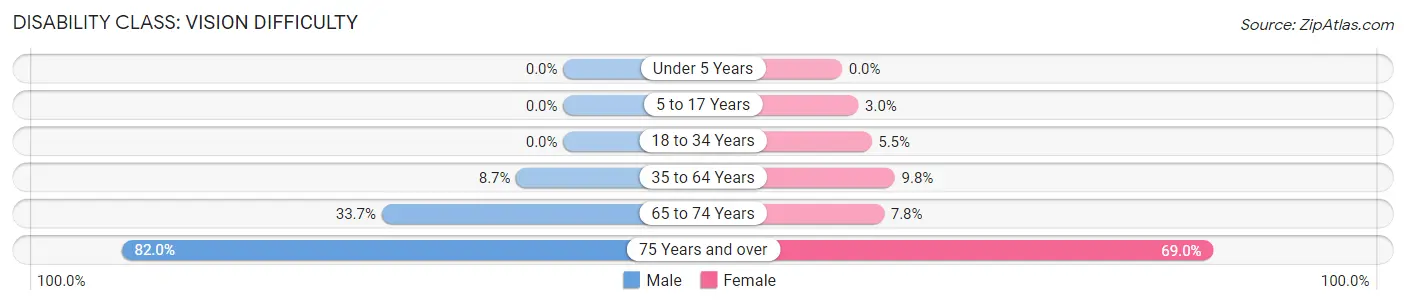
Disability Class: Vision Difficulty
| Age Bracket | Male | Female |
| Under 5 Years | 0 (0.0%) | 0 (0.0%) |
| 5 to 17 Years | 0 (0.0%) | 13 (3.0%) |
| 18 to 34 Years | 0 (0.0%) | 25 (5.5%) |
| 35 to 64 Years | 55 (8.7%) | 91 (9.8%) |
| 65 to 74 Years | 61 (33.7%) | 18 (7.8%) |
| 75 Years and over | 41 (82.0%) | 140 (69.0%) |
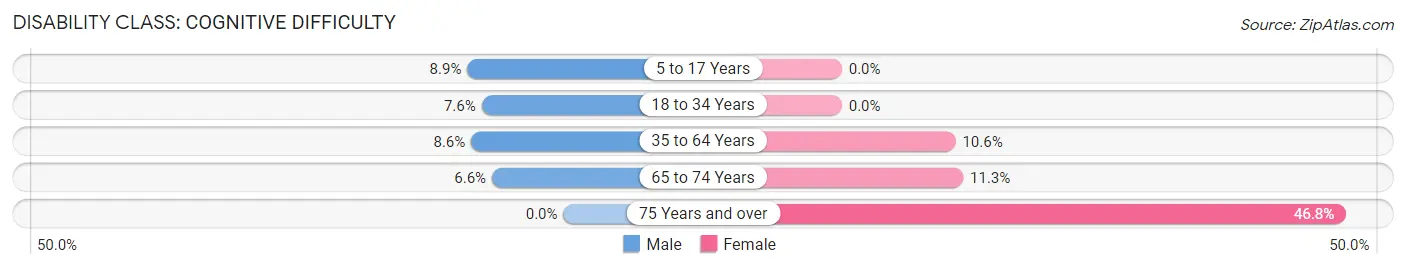
Disability Class: Cognitive Difficulty
| Age Bracket | Male | Female |
| 5 to 17 Years | 24 (8.9%) | 0 (0.0%) |
| 18 to 34 Years | 49 (7.6%) | 0 (0.0%) |
| 35 to 64 Years | 54 (8.6%) | 98 (10.5%) |
| 65 to 74 Years | 12 (6.6%) | 26 (11.3%) |
| 75 Years and over | 0 (0.0%) | 95 (46.8%) |
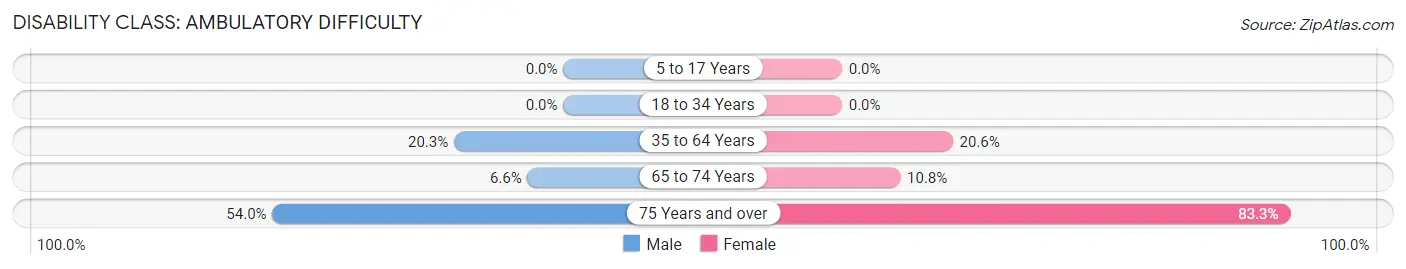
Disability Class: Ambulatory Difficulty
| Age Bracket | Male | Female |
| 5 to 17 Years | 0 (0.0%) | 0 (0.0%) |
| 18 to 34 Years | 0 (0.0%) | 0 (0.0%) |
| 35 to 64 Years | 128 (20.3%) | 191 (20.6%) |
| 65 to 74 Years | 12 (6.6%) | 25 (10.8%) |
| 75 Years and over | 27 (54.0%) | 169 (83.3%) |
Disability Class: Self-Care Difficulty
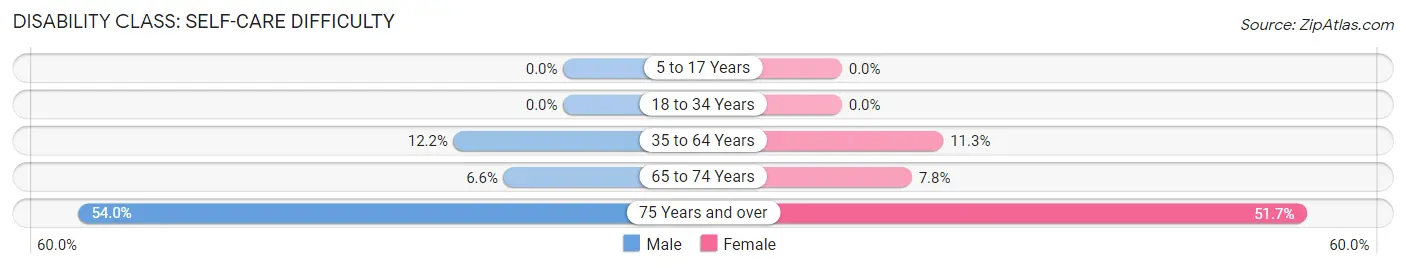
| Age Bracket | Male | Female |
| 5 to 17 Years | 0 (0.0%) | 0 (0.0%) |
| 18 to 34 Years | 0 (0.0%) | 0 (0.0%) |
| 35 to 64 Years | 77 (12.2%) | 105 (11.3%) |
| 65 to 74 Years | 12 (6.6%) | 18 (7.8%) |
| 75 Years and over | 27 (54.0%) | 105 (51.7%) |
Technology Access in Aguilita
Computing Device Access in Aguilita
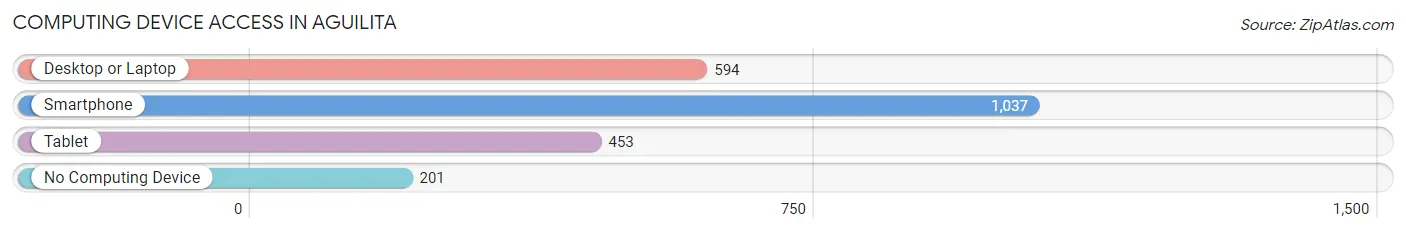
| Device Type | # Households | % Households |
| Desktop or Laptop | 594 | 42.6% |
| Smartphone | 1,037 | 74.3% |
| Tablet | 453 | 32.5% |
| No Computing Device | 201 | 14.4% |
| Total | 1,395 | 100.0% |
Internet Access in Aguilita
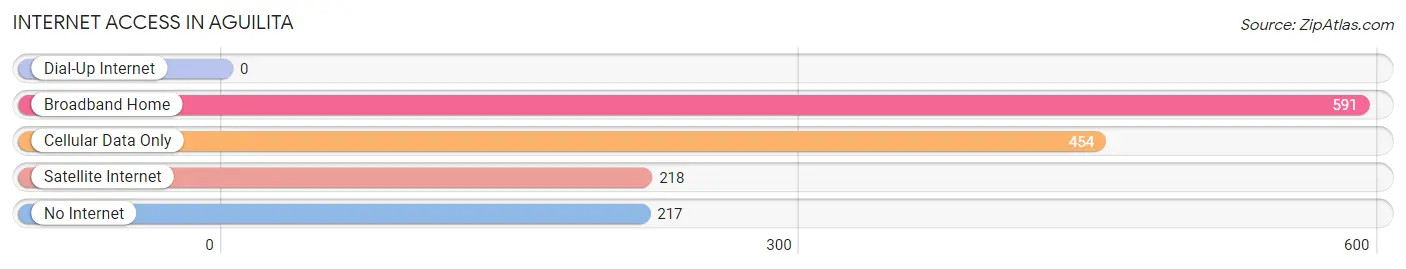
| Internet Type | # Households | % Households |
| Dial-Up Internet | 0 | 0.0% |
| Broadband Home | 591 | 42.4% |
| Cellular Data Only | 454 | 32.5% |
| Satellite Internet | 218 | 15.6% |
| No Internet | 217 | 15.6% |
| Total | 1,395 | 100.0% |
Aguilita Summary
Aguilita is a small town located in the municipality of San Germán, Puerto Rico. It is situated in the southwestern part of the island, about 20 miles from the capital city of San Juan. The town has a population of approximately 1,000 people and is known for its rural charm and traditional way of life.
Geography
Aguilita is located in the southwestern part of Puerto Rico, in the municipality of San Germán. It is situated in the foothills of the Cordillera Central mountain range, at an elevation of about 1,000 feet above sea level. The town is surrounded by lush vegetation and is home to a variety of wildlife, including iguanas, parrots, and other tropical birds. The climate is tropical, with temperatures ranging from the mid-70s to the mid-80s Fahrenheit throughout the year.
Economy
Aguilita’s economy is largely based on agriculture. The town is known for its production of coffee, bananas, and other tropical fruits. In addition, the town is home to several small businesses, including restaurants, grocery stores, and other retail establishments. Tourism is also an important part of the local economy, as the town is a popular destination for visitors from around the world.
Demographics
As of the 2000 census, the population of Aguilita was 1,000 people. The majority of the population is of Hispanic descent, with a small percentage of African-American and other ethnicities. The median age of the population is 33 years old, and the median household income is $14,000.
History
Aguilita was founded in the late 19th century by a group of settlers from the nearby town of San Germán. The town was originally known as “Aguilita de San Germán”, but the name was eventually shortened to just “Aguilita”. The town grew steadily over the years, and by the mid-20th century it had become a thriving agricultural community.
Today, Aguilita is a quiet, rural town that retains much of its traditional charm. The town is home to a variety of cultural and historical sites, including the San Germán Cathedral, the San Germán Museum, and the Aguilita Plaza. The town is also home to a number of festivals and events throughout the year, including the Aguilita Festival, which celebrates the town’s history and culture.
Common Questions
What is Per Capita Income in Aguilita?
Per Capita income in Aguilita is $9,826.
What is the Median Family Income in Aguilita?
Median Family Income in Aguilita is $25,431.
What is the Median Household income in Aguilita?
Median Household Income in Aguilita is $21,625.
What is Income or Wage Gap in Aguilita?
Income or Wage Gap in Aguilita is 3.4%.
Women in Aguilita earn 96.6 cents for every dollar earned by a man.
What is Inequality or Gini Index in Aguilita?
Inequality or Gini Index in Aguilita is 0.44.
What is the Total Population of Aguilita?
Total Population of Aguilita is 4,197.
What is the Total Male Population of Aguilita?
Total Male Population of Aguilita is 1,840.
What is the Total Female Population of Aguilita?
Total Female Population of Aguilita is 2,357.
What is the Ratio of Males per 100 Females in Aguilita?
There are 78.07 Males per 100 Females in Aguilita.
What is the Ratio of Females per 100 Males in Aguilita?
There are 128.10 Females per 100 Males in Aguilita.
What is the Median Population Age in Aguilita?
Median Population Age in Aguilita is 38.1 Years.
What is the Average Family Size in Aguilita
Average Family Size in Aguilita is 3.5 People.
What is the Average Household Size in Aguilita
Average Household Size in Aguilita is 3.0 People.
How Large is the Labor Force in Aguilita?
There are 1,724 People in the Labor Forcein in Aguilita.
What is the Percentage of People in the Labor Force in Aguilita?
48.8% of People are in the Labor Force in Aguilita.
What is the Unemployment Rate in Aguilita?
Unemployment Rate in Aguilita is 7.2%.