Rawls Springs, MS Map & Demographics
Rawls Springs Map
Rawls Springs Overview
$26,456
PER CAPITA INCOME
$70,858
AVG FAMILY INCOME
$58,750
AVG HOUSEHOLD INCOME
43.9%
WAGE / INCOME GAP [ % ]
56.1¢/ $1
WAGE / INCOME GAP [ $ ]
0.35
INEQUALITY / GINI INDEX
2,069
TOTAL POPULATION
1,048
MALE POPULATION
1,021
FEMALE POPULATION
102.64
MALES / 100 FEMALES
97.42
FEMALES / 100 MALES
38.8
MEDIAN AGE
3.3
AVG FAMILY SIZE
2.9
AVG HOUSEHOLD SIZE
1,231
LABOR FORCE [ PEOPLE ]
70.0%
PERCENT IN LABOR FORCE
5.4%
UNEMPLOYMENT RATE
Income in Rawls Springs
Income Overview in Rawls Springs
Per Capita Income in Rawls Springs is $26,456, while median incomes of families and households are $70,858 and $58,750 respectively.
| Characteristic | Number | Measure |
| Per Capita Income | 2,069 | $26,456 |
| Median Family Income | 561 | $70,858 |
| Mean Family Income | 561 | $73,236 |
| Median Household Income | 723 | $58,750 |
| Mean Household Income | 723 | $67,833 |
| Income Deficit | 561 | $0 |
| Wage / Income Gap (%) | 2,069 | 43.91% |
| Wage / Income Gap ($) | 2,069 | 56.09¢ per $1 |
| Gini / Inequality Index | 2,069 | 0.35 |
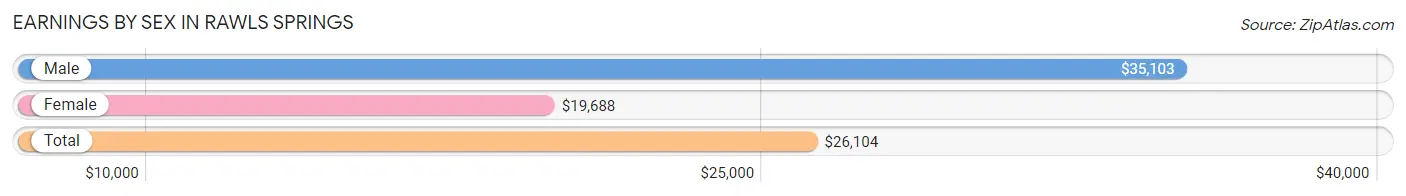
Earnings by Sex in Rawls Springs
Average Earnings in Rawls Springs are $26,104, $35,103 for men and $19,688 for women, a difference of 43.9%.
| Sex | Number | Average Earnings |
| Male | 718 (56.3%) | $35,103 |
| Female | 557 (43.7%) | $19,688 |
| Total | 1,275 (100.0%) | $26,104 |
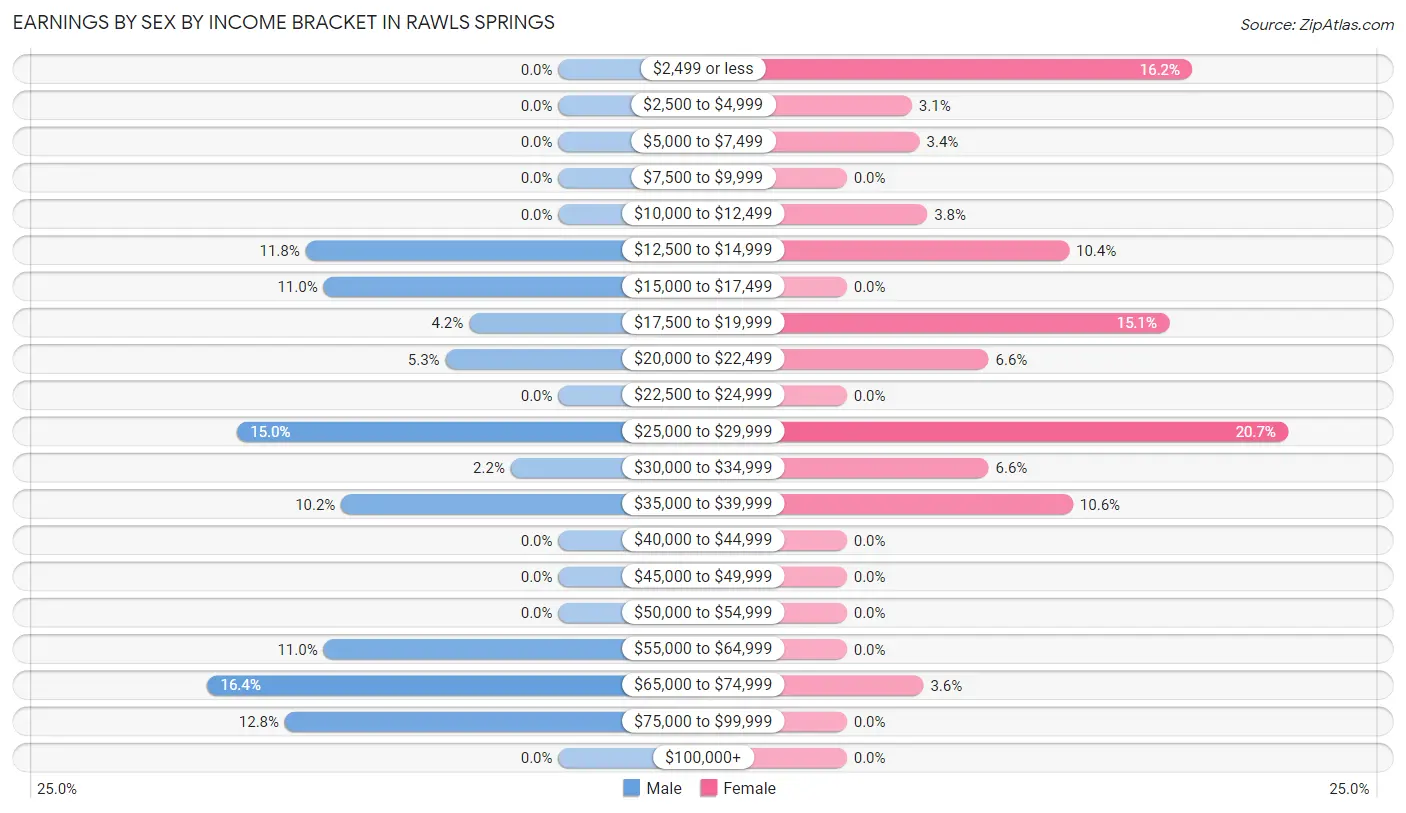
Earnings by Sex by Income Bracket in Rawls Springs
The most common earnings brackets in Rawls Springs are $65,000 to $74,999 for men (118 | 16.4%) and $25,000 to $29,999 for women (115 | 20.6%).
| Income | Male | Female |
| $2,499 or less | 0 (0.0%) | 90 (16.2%) |
| $2,500 to $4,999 | 0 (0.0%) | 17 (3.0%) |
| $5,000 to $7,499 | 0 (0.0%) | 19 (3.4%) |
| $7,500 to $9,999 | 0 (0.0%) | 0 (0.0%) |
| $10,000 to $12,499 | 0 (0.0%) | 21 (3.8%) |
| $12,500 to $14,999 | 85 (11.8%) | 58 (10.4%) |
| $15,000 to $17,499 | 79 (11.0%) | 0 (0.0%) |
| $17,500 to $19,999 | 30 (4.2%) | 84 (15.1%) |
| $20,000 to $22,499 | 38 (5.3%) | 37 (6.6%) |
| $22,500 to $24,999 | 0 (0.0%) | 0 (0.0%) |
| $25,000 to $29,999 | 108 (15.0%) | 115 (20.6%) |
| $30,000 to $34,999 | 16 (2.2%) | 37 (6.6%) |
| $35,000 to $39,999 | 73 (10.2%) | 59 (10.6%) |
| $40,000 to $44,999 | 0 (0.0%) | 0 (0.0%) |
| $45,000 to $49,999 | 0 (0.0%) | 0 (0.0%) |
| $50,000 to $54,999 | 0 (0.0%) | 0 (0.0%) |
| $55,000 to $64,999 | 79 (11.0%) | 0 (0.0%) |
| $65,000 to $74,999 | 118 (16.4%) | 20 (3.6%) |
| $75,000 to $99,999 | 92 (12.8%) | 0 (0.0%) |
| $100,000+ | 0 (0.0%) | 0 (0.0%) |
| Total | 718 (100.0%) | 557 (100.0%) |
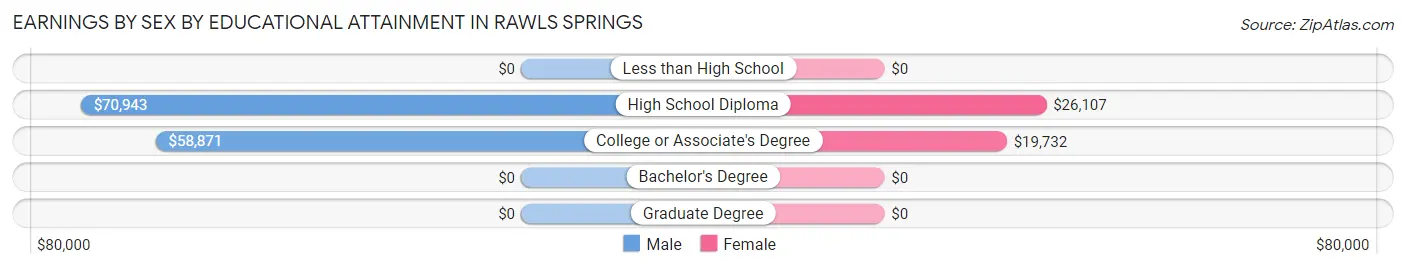
Earnings by Sex by Educational Attainment in Rawls Springs
Average earnings in Rawls Springs are $57,702 for men and $21,655 for women, a difference of 62.5%. Men with an educational attainment of high school diploma enjoy the highest average annual earnings of $70,943, while those with college or associate's degree education earn the least with $58,871. Women with an educational attainment of high school diploma earn the most with the average annual earnings of $26,107, while those with college or associate's degree education have the smallest earnings of $19,732.
| Educational Attainment | Male Income | Female Income |
| Less than High School | - | - |
| High School Diploma | $70,943 | $26,107 |
| College or Associate's Degree | $58,871 | $19,732 |
| Bachelor's Degree | - | - |
| Graduate Degree | - | - |
| Total | $57,702 | $21,655 |
Family Income in Rawls Springs
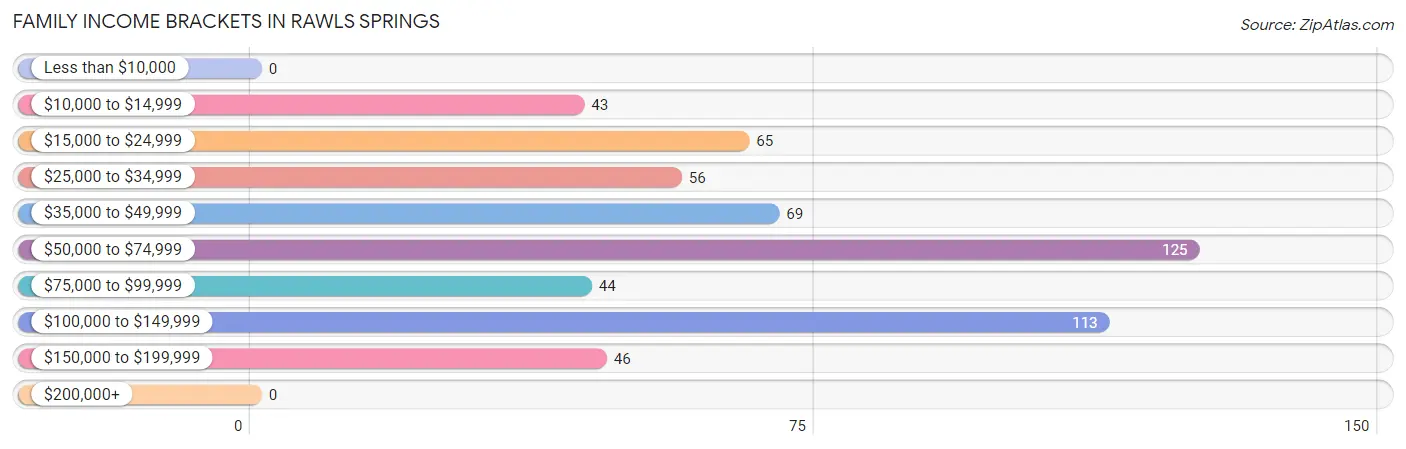
Family Income Brackets in Rawls Springs
According to the Rawls Springs family income data, there are 125 families falling into the $50,000 to $74,999 income range, which is the most common income bracket and makes up 22.3% of all families.
| Income Bracket | # Families | % Families |
| Less than $10,000 | 0 | 0.0% |
| $10,000 to $14,999 | 43 | 7.7% |
| $15,000 to $24,999 | 65 | 11.6% |
| $25,000 to $34,999 | 56 | 10.0% |
| $35,000 to $49,999 | 69 | 12.3% |
| $50,000 to $74,999 | 125 | 22.3% |
| $75,000 to $99,999 | 44 | 7.8% |
| $100,000 to $149,999 | 113 | 20.1% |
| $150,000 to $199,999 | 46 | 8.2% |
| $200,000+ | 0 | 0.0% |
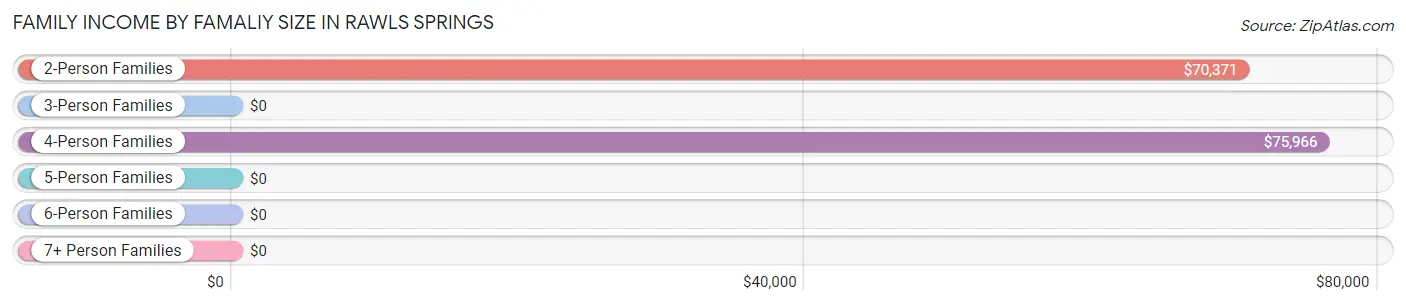
Family Income by Famaliy Size in Rawls Springs
4-person families (164 | 29.2%) account for the highest median family income in Rawls Springs with $75,966 per family, while 2-person families (235 | 41.9%) have the highest median income of $35,186 per family member.
| Income Bracket | # Families | Median Income |
| 2-Person Families | 235 (41.9%) | $70,371 |
| 3-Person Families | 133 (23.7%) | $0 |
| 4-Person Families | 164 (29.2%) | $75,966 |
| 5-Person Families | 0 (0.0%) | $0 |
| 6-Person Families | 29 (5.2%) | $0 |
| 7+ Person Families | 0 (0.0%) | $0 |
| Total | 561 (100.0%) | $70,858 |
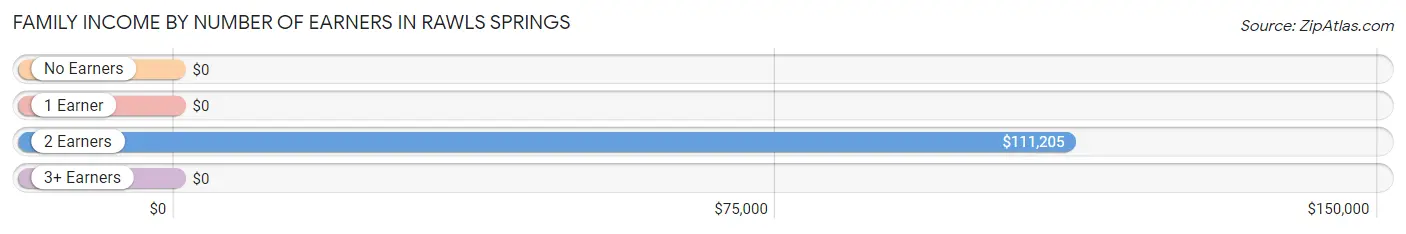
Family Income by Number of Earners in Rawls Springs
| Number of Earners | # Families | Median Income |
| No Earners | 35 (6.2%) | $0 |
| 1 Earner | 260 (46.4%) | $0 |
| 2 Earners | 91 (16.2%) | $111,205 |
| 3+ Earners | 175 (31.2%) | $0 |
| Total | 561 (100.0%) | $70,858 |
Household Income in Rawls Springs
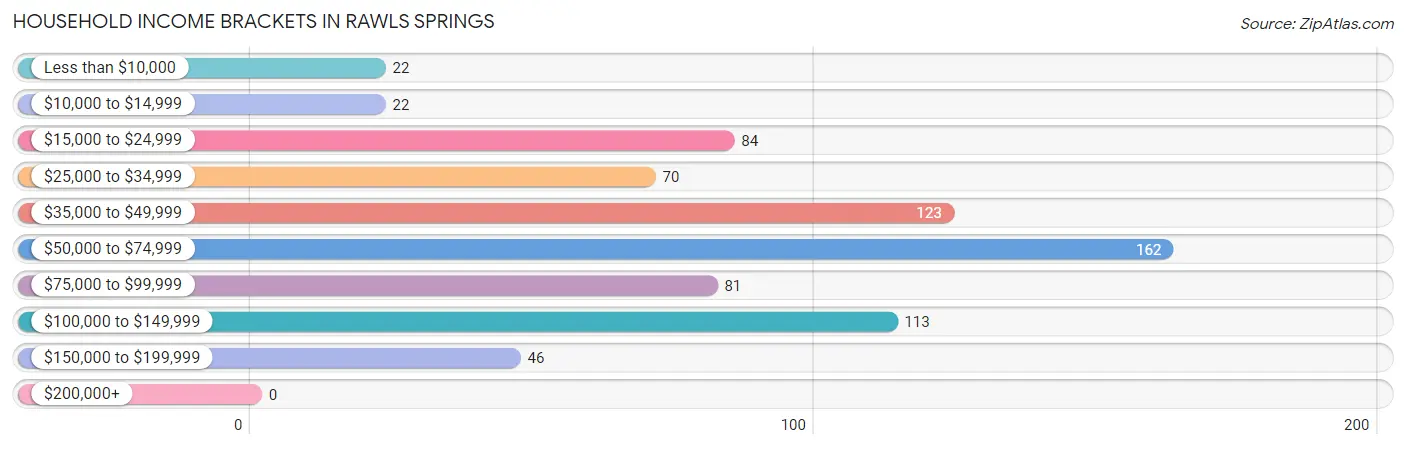
Household Income Brackets in Rawls Springs
With 162 households falling in the category, the $50,000 to $74,999 income range is the most frequent in Rawls Springs, accounting for 22.4% of all households.
| Income Bracket | # Households | % Households |
| Less than $10,000 | 22 | 3.0% |
| $10,000 to $14,999 | 22 | 3.0% |
| $15,000 to $24,999 | 84 | 11.6% |
| $25,000 to $34,999 | 70 | 9.7% |
| $35,000 to $49,999 | 123 | 17.0% |
| $50,000 to $74,999 | 162 | 22.4% |
| $75,000 to $99,999 | 81 | 11.2% |
| $100,000 to $149,999 | 113 | 15.6% |
| $150,000 to $199,999 | 46 | 6.4% |
| $200,000+ | 0 | 0.0% |
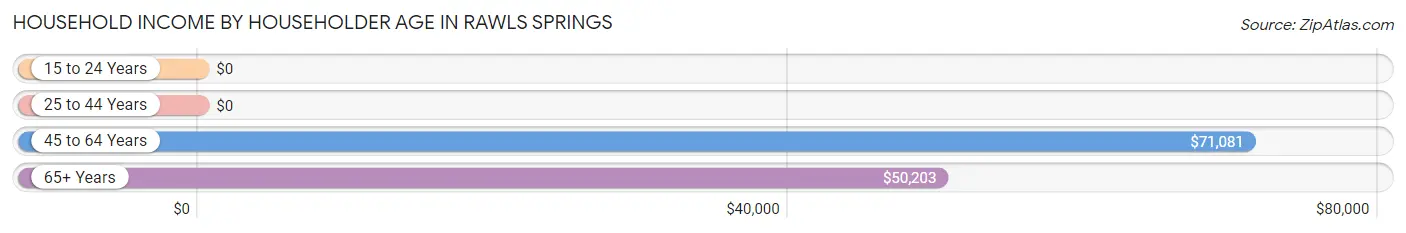
Household Income by Householder Age in Rawls Springs
The median household income in Rawls Springs is $58,750, with the highest median household income of $71,081 found in the 45 to 64 years age bracket for the primary householder. A total of 430 households (59.5%) fall into this category. Meanwhile, the 15 to 24 years age bracket for the primary householder has the lowest median household income of $0, with 38 households (5.3%) in this group.
| Income Bracket | # Households | Median Income |
| 15 to 24 Years | 38 (5.3%) | $0 |
| 25 to 44 Years | 173 (23.9%) | $0 |
| 45 to 64 Years | 430 (59.5%) | $71,081 |
| 65+ Years | 82 (11.3%) | $50,203 |
| Total | 723 (100.0%) | $58,750 |
Poverty in Rawls Springs
Income Below Poverty by Sex and Age in Rawls Springs
With 3.5% poverty level for males and 10.3% for females among the residents of Rawls Springs, under 5 year old males and under 5 year old females are the most vulnerable to poverty, with 15 males (100.0%) and 48 females (100.0%) in their respective age groups living below the poverty level.
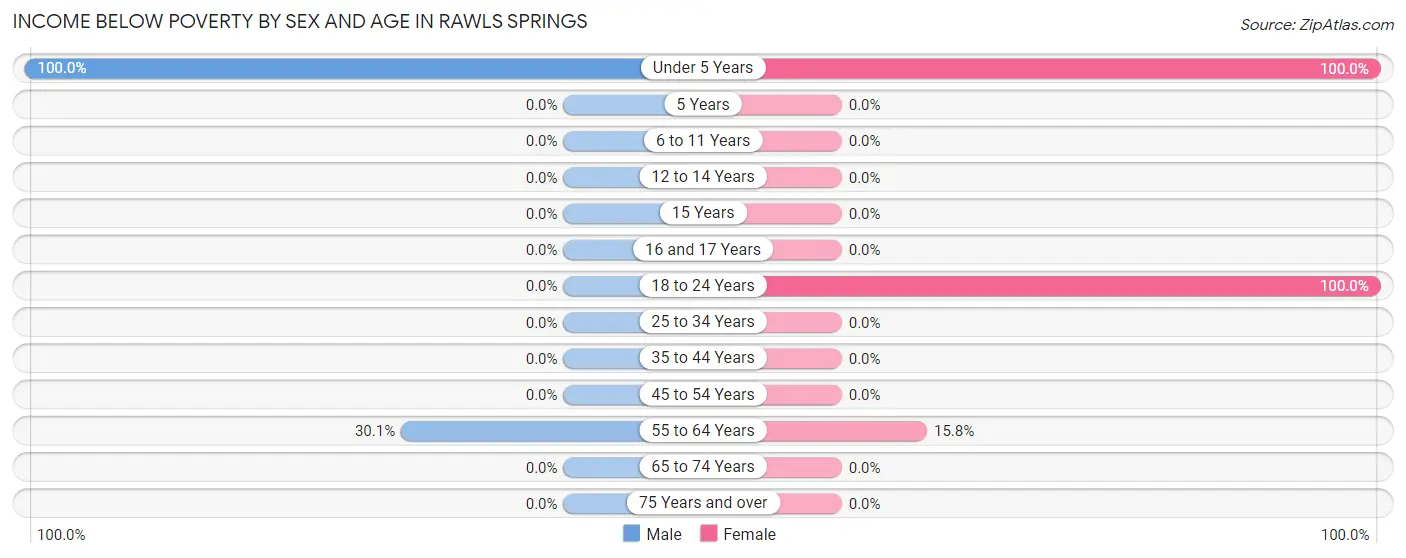
| Age Bracket | Male | Female |
| Under 5 Years | 15 (100.0%) | 48 (100.0%) |
| 5 Years | 0 (0.0%) | 0 (0.0%) |
| 6 to 11 Years | 0 (0.0%) | 0 (0.0%) |
| 12 to 14 Years | 0 (0.0%) | 0 (0.0%) |
| 15 Years | 0 (0.0%) | 0 (0.0%) |
| 16 and 17 Years | 0 (0.0%) | 0 (0.0%) |
| 18 to 24 Years | 0 (0.0%) | 38 (100.0%) |
| 25 to 34 Years | 0 (0.0%) | 0 (0.0%) |
| 35 to 44 Years | 0 (0.0%) | 0 (0.0%) |
| 45 to 54 Years | 0 (0.0%) | 0 (0.0%) |
| 55 to 64 Years | 22 (30.1%) | 19 (15.8%) |
| 65 to 74 Years | 0 (0.0%) | 0 (0.0%) |
| 75 Years and over | 0 (0.0%) | 0 (0.0%) |
| Total | 37 (3.5%) | 105 (10.3%) |
Income Above Poverty by Sex and Age in Rawls Springs
According to the poverty statistics in Rawls Springs, males aged 6 to 11 years and females aged 6 to 11 years are the age groups that are most secure financially, with 100.0% of males and 100.0% of females in these age groups living above the poverty line.
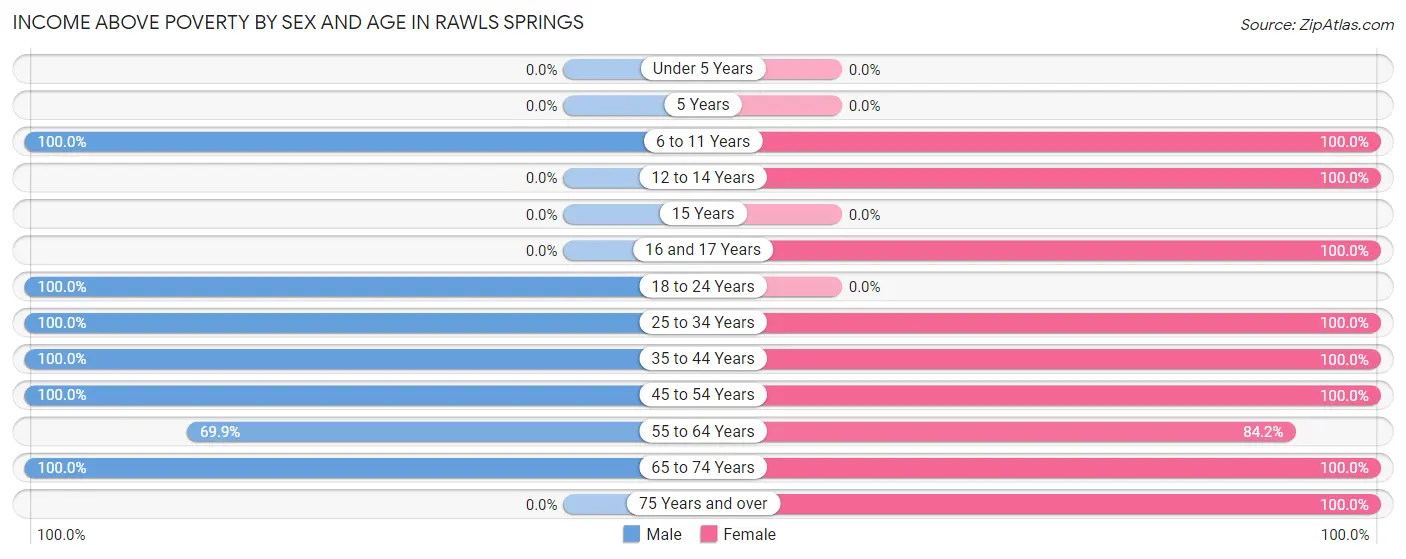
| Age Bracket | Male | Female |
| Under 5 Years | 0 (0.0%) | 0 (0.0%) |
| 5 Years | 0 (0.0%) | 0 (0.0%) |
| 6 to 11 Years | 143 (100.0%) | 45 (100.0%) |
| 12 to 14 Years | 0 (0.0%) | 60 (100.0%) |
| 15 Years | 0 (0.0%) | 0 (0.0%) |
| 16 and 17 Years | 0 (0.0%) | 32 (100.0%) |
| 18 to 24 Years | 212 (100.0%) | 0 (0.0%) |
| 25 to 34 Years | 178 (100.0%) | 156 (100.0%) |
| 35 to 44 Years | 114 (100.0%) | 80 (100.0%) |
| 45 to 54 Years | 236 (100.0%) | 295 (100.0%) |
| 55 to 64 Years | 51 (69.9%) | 101 (84.2%) |
| 65 to 74 Years | 77 (100.0%) | 78 (100.0%) |
| 75 Years and over | 0 (0.0%) | 69 (100.0%) |
| Total | 1,011 (96.5%) | 916 (89.7%) |
Income Below Poverty Among Married-Couple Families in Rawls Springs
The poverty statistics for married-couple families in Rawls Springs show that 5.2% or 22 of the total 419 families live below the poverty line. Families with no children have the highest poverty rate of 7.6%, comprising of 22 families. On the other hand, families with 1 or 2 children have the lowest poverty rate of 0.0%, which includes 0 families.
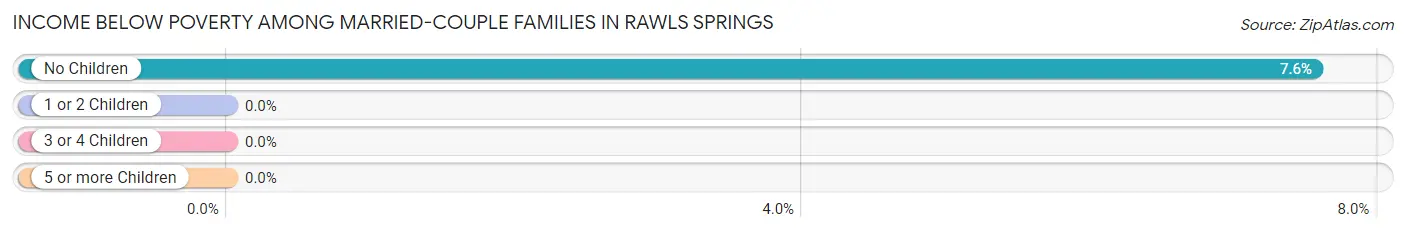
| Children | Above Poverty | Below Poverty |
| No Children | 269 (92.4%) | 22 (7.6%) |
| 1 or 2 Children | 128 (100.0%) | 0 (0.0%) |
| 3 or 4 Children | 0 (0.0%) | 0 (0.0%) |
| 5 or more Children | 0 (0.0%) | 0 (0.0%) |
| Total | 397 (94.8%) | 22 (5.2%) |
Income Below Poverty Among Single-Parent Households in Rawls Springs
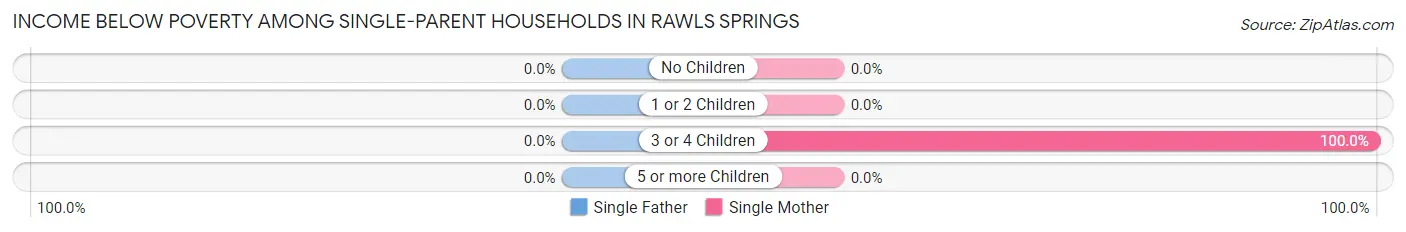
| Children | Single Father | Single Mother |
| No Children | 0 (0.0%) | 0 (0.0%) |
| 1 or 2 Children | 0 (0.0%) | 0 (0.0%) |
| 3 or 4 Children | 0 (0.0%) | 21 (100.0%) |
| 5 or more Children | 0 (0.0%) | 0 (0.0%) |
| Total | 0 (0.0%) | 21 (14.8%) |
Income Below Poverty Among Married-Couple vs Single-Parent Households in Rawls Springs
The poverty data for Rawls Springs shows that 22 of the married-couple family households (5.2%) and 21 of the single-parent households (14.8%) are living below the poverty level. Within the married-couple family households, those with no children have the highest poverty rate, with 22 households (7.6%) falling below the poverty line. Among the single-parent households, those with 3 or 4 children have the highest poverty rate, with 21 household (100.0%) living below poverty.
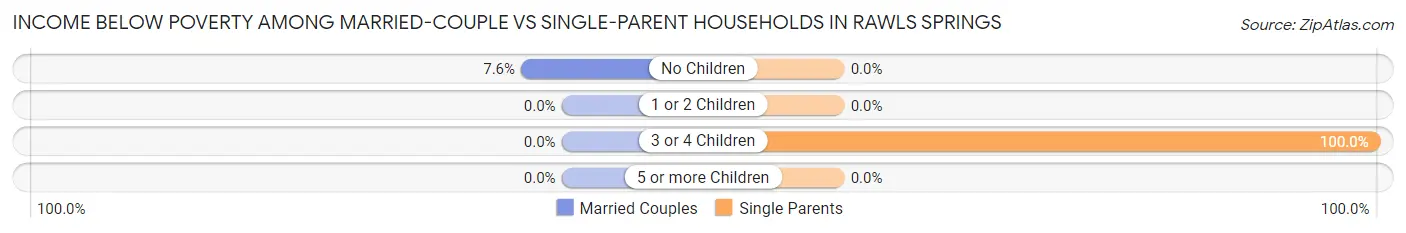
| Children | Married-Couple Families | Single-Parent Households |
| No Children | 22 (7.6%) | 0 (0.0%) |
| 1 or 2 Children | 0 (0.0%) | 0 (0.0%) |
| 3 or 4 Children | 0 (0.0%) | 21 (100.0%) |
| 5 or more Children | 0 (0.0%) | 0 (0.0%) |
| Total | 22 (5.2%) | 21 (14.8%) |
Race in Rawls Springs
The most populous races in Rawls Springs are Black / African American (970 | 46.9%), White / Caucasian (949 | 45.9%), and Hispanic or Latino (150 | 7.2%).
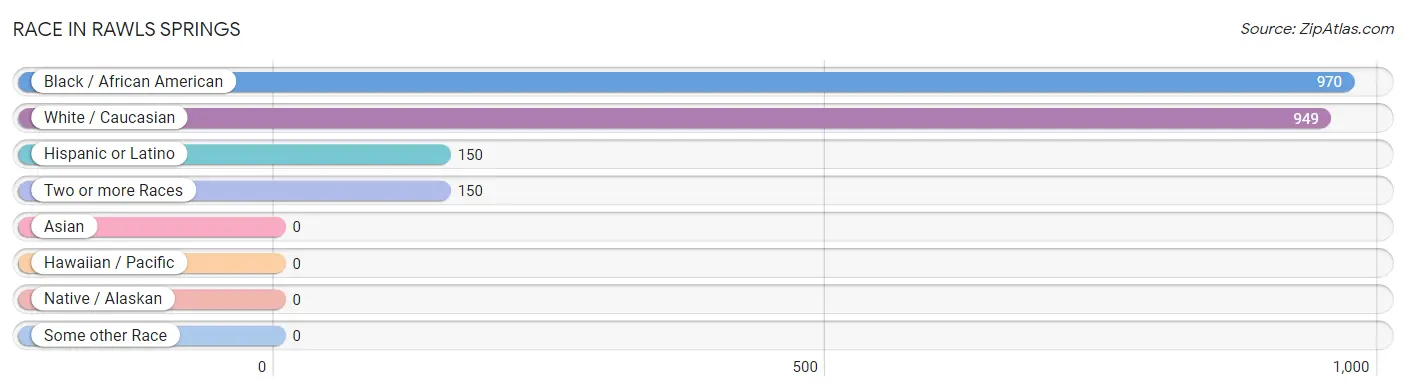
| Race | # Population | % Population |
| Asian | 0 | 0.0% |
| Black / African American | 970 | 46.9% |
| Hawaiian / Pacific | 0 | 0.0% |
| Hispanic or Latino | 150 | 7.2% |
| Native / Alaskan | 0 | 0.0% |
| White / Caucasian | 949 | 45.9% |
| Two or more Races | 150 | 7.2% |
| Some other Race | 0 | 0.0% |
| Total | 2,069 | 100.0% |
Ancestry in Rawls Springs
The most populous ancestries reported in Rawls Springs are Scottish (229 | 11.1%), American (227 | 11.0%), Northern European (188 | 9.1%), English (181 | 8.7%), and Irish (177 | 8.6%), together accounting for 48.4% of all Rawls Springs residents.
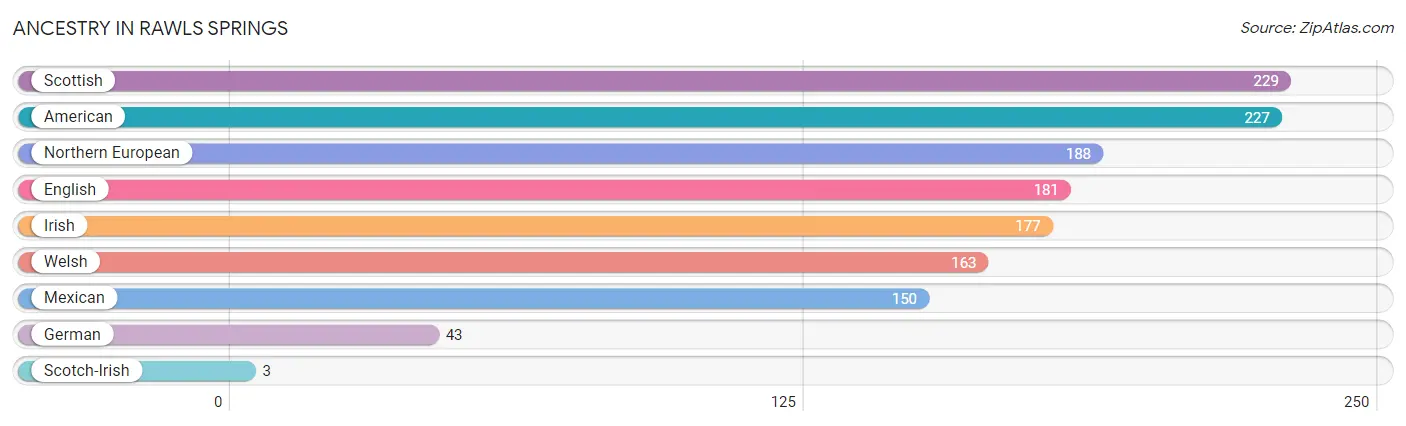
| Ancestry | # Population | % Population |
| American | 227 | 11.0% |
| English | 181 | 8.7% |
| German | 43 | 2.1% |
| Irish | 177 | 8.6% |
| Mexican | 150 | 7.2% |
| Northern European | 188 | 9.1% |
| Scotch-Irish | 3 | 0.1% |
| Scottish | 229 | 11.1% |
| Welsh | 163 | 7.9% | View All 9 Rows |
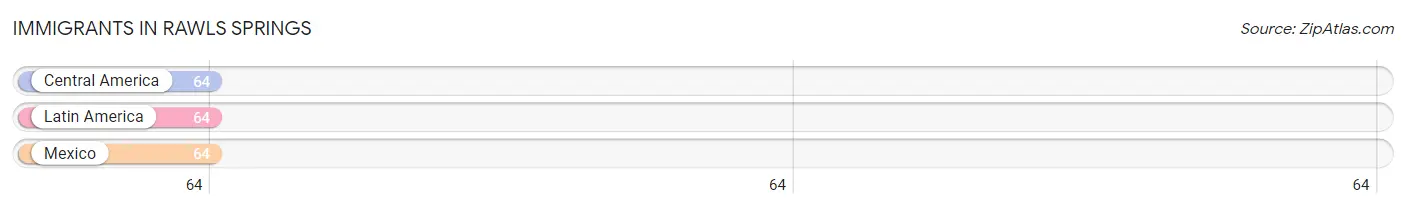
Immigrants in Rawls Springs
The most numerous immigrant groups reported in Rawls Springs came from Central America (64 | 3.1%), Latin America (64 | 3.1%), and Mexico (64 | 3.1%), together accounting for 9.3% of all Rawls Springs residents.
| Immigration Origin | # Population | % Population |
| Central America | 64 | 3.1% |
| Latin America | 64 | 3.1% |
| Mexico | 64 | 3.1% | View All 3 Rows |
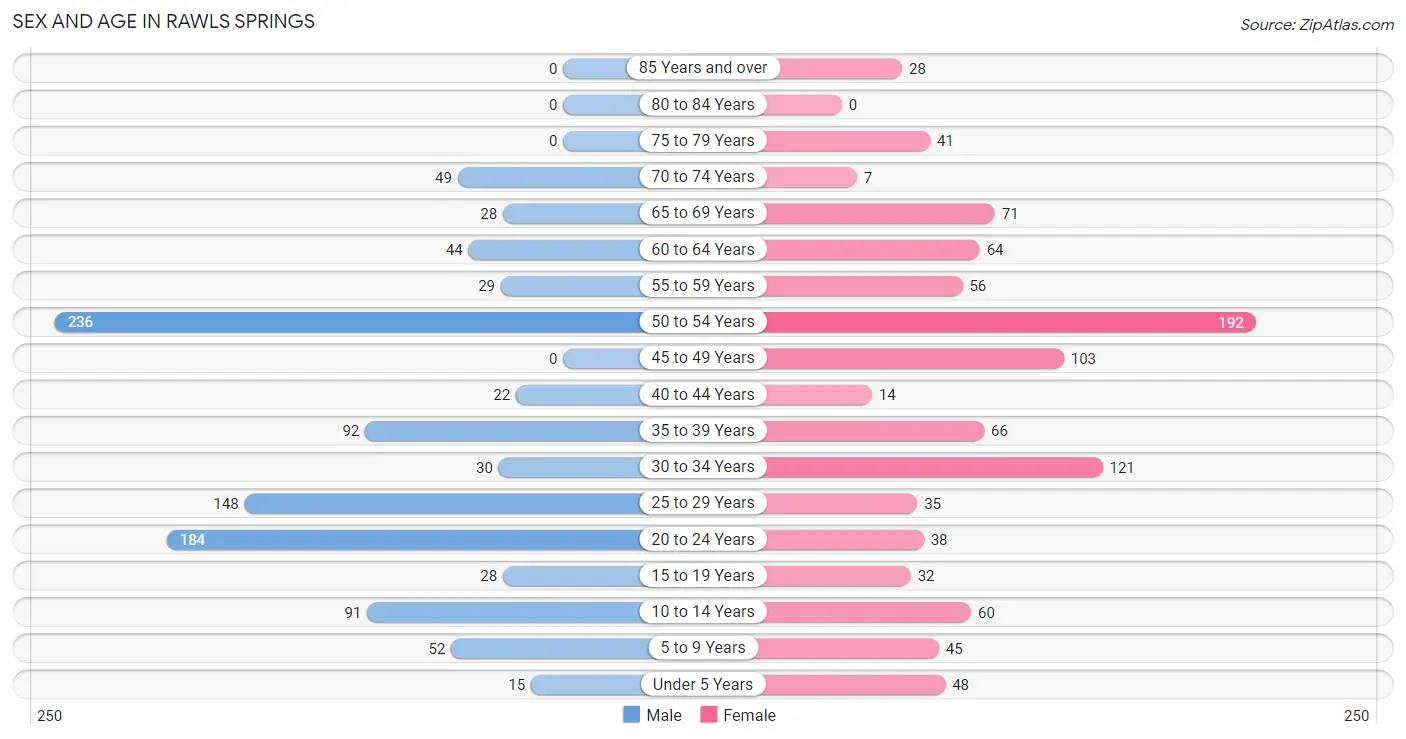
Sex and Age in Rawls Springs
Sex and Age in Rawls Springs
The most populous age groups in Rawls Springs are 50 to 54 Years (236 | 22.5%) for men and 50 to 54 Years (192 | 18.8%) for women.
| Age Bracket | Male | Female |
| Under 5 Years | 15 (1.4%) | 48 (4.7%) |
| 5 to 9 Years | 52 (5.0%) | 45 (4.4%) |
| 10 to 14 Years | 91 (8.7%) | 60 (5.9%) |
| 15 to 19 Years | 28 (2.7%) | 32 (3.1%) |
| 20 to 24 Years | 184 (17.6%) | 38 (3.7%) |
| 25 to 29 Years | 148 (14.1%) | 35 (3.4%) |
| 30 to 34 Years | 30 (2.9%) | 121 (11.8%) |
| 35 to 39 Years | 92 (8.8%) | 66 (6.5%) |
| 40 to 44 Years | 22 (2.1%) | 14 (1.4%) |
| 45 to 49 Years | 0 (0.0%) | 103 (10.1%) |
| 50 to 54 Years | 236 (22.5%) | 192 (18.8%) |
| 55 to 59 Years | 29 (2.8%) | 56 (5.5%) |
| 60 to 64 Years | 44 (4.2%) | 64 (6.3%) |
| 65 to 69 Years | 28 (2.7%) | 71 (7.0%) |
| 70 to 74 Years | 49 (4.7%) | 7 (0.7%) |
| 75 to 79 Years | 0 (0.0%) | 41 (4.0%) |
| 80 to 84 Years | 0 (0.0%) | 0 (0.0%) |
| 85 Years and over | 0 (0.0%) | 28 (2.7%) |
| Total | 1,048 (100.0%) | 1,021 (100.0%) |
Families and Households in Rawls Springs
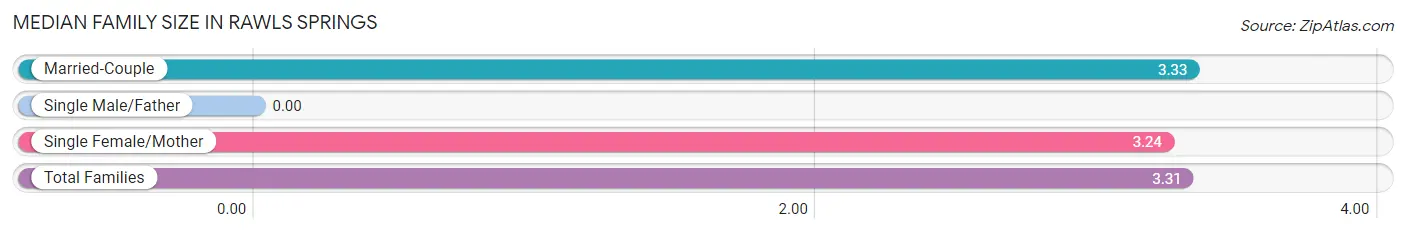
Median Family Size in Rawls Springs
| Family Type | # Families | Family Size |
| Married-Couple | 419 (74.7%) | 3.33 |
| Single Male/Father | 0 (0.0%) | - |
| Single Female/Mother | 142 (25.3%) | 3.24 |
| Total Families | 561 (100.0%) | 3.31 |
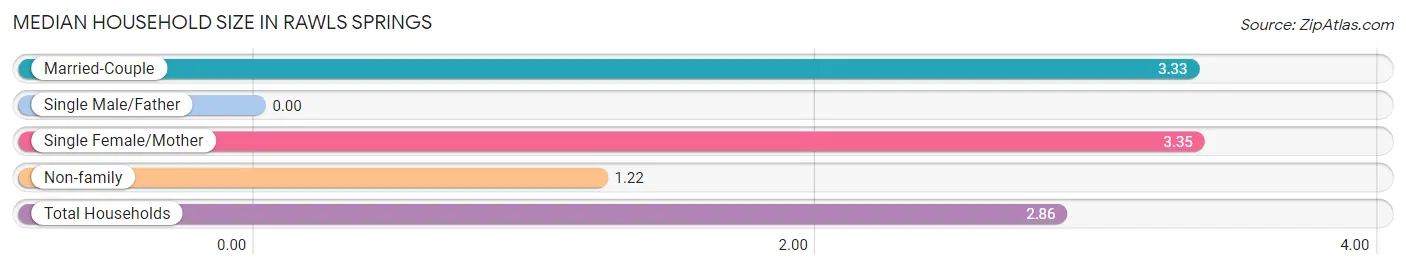
Median Household Size in Rawls Springs
| Household Type | # Households | Household Size |
| Married-Couple | 419 (58.0%) | 3.33 |
| Single Male/Father | 0 (0.0%) | - |
| Single Female/Mother | 142 (19.6%) | 3.35 |
| Non-family | 162 (22.4%) | 1.22 |
| Total Households | 723 (100.0%) | 2.86 |
Household Size by Marriage Status in Rawls Springs
Out of a total of 723 households in Rawls Springs, 561 (77.6%) are family households, while 162 (22.4%) are nonfamily households. The most numerous type of family households are 2-person households, comprising 235, and the most common type of nonfamily households are 1-person households, comprising 132.
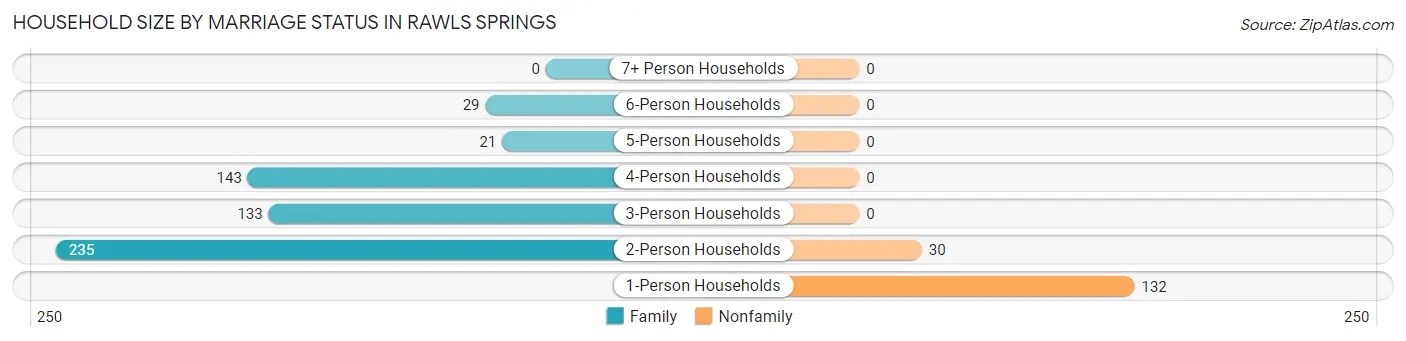
| Household Size | Family Households | Nonfamily Households |
| 1-Person Households | - | 132 (18.3%) |
| 2-Person Households | 235 (32.5%) | 30 (4.2%) |
| 3-Person Households | 133 (18.4%) | 0 (0.0%) |
| 4-Person Households | 143 (19.8%) | 0 (0.0%) |
| 5-Person Households | 21 (2.9%) | 0 (0.0%) |
| 6-Person Households | 29 (4.0%) | 0 (0.0%) |
| 7+ Person Households | 0 (0.0%) | 0 (0.0%) |
| Total | 561 (77.6%) | 162 (22.4%) |
Female Fertility in Rawls Springs
Fertility by Age in Rawls Springs
Average fertility rate in Rawls Springs is 42.0 births per 1,000 women. Women in the age bracket of 20 to 34 years have the highest fertility rate with 108.0 births per 1,000 women. Women in the age bracket of 20 to 34 years acount for 100.0% of all women with births.
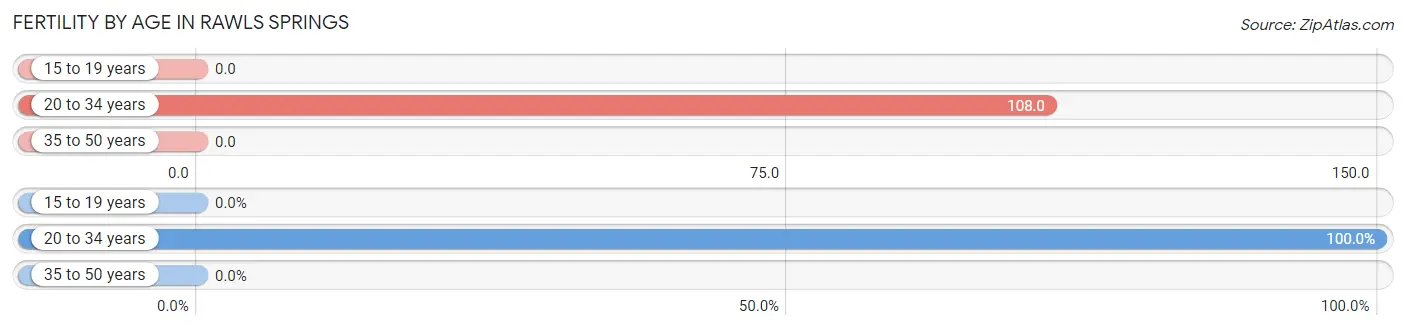
| Age Bracket | Women with Births | Births / 1,000 Women |
| 15 to 19 years | 0 (0.0%) | 0.0 |
| 20 to 34 years | 21 (100.0%) | 108.0 |
| 35 to 50 years | 0 (0.0%) | 0.0 |
| Total | 21 (100.0%) | 42.0 |
Fertility by Age by Marriage Status in Rawls Springs
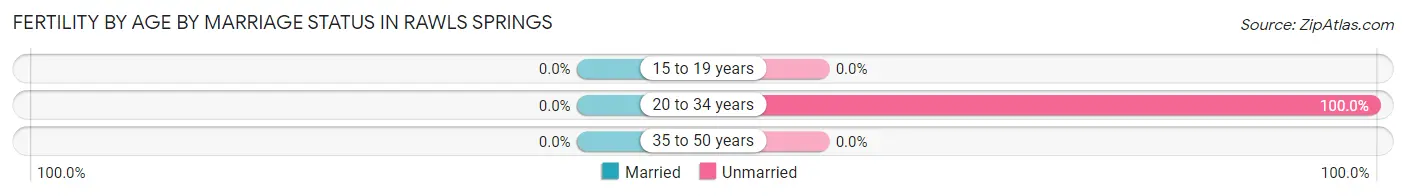
| Age Bracket | Married | Unmarried |
| 15 to 19 years | 0 (0.0%) | 0 (0.0%) |
| 20 to 34 years | 0 (0.0%) | 21 (100.0%) |
| 35 to 50 years | 0 (0.0%) | 0 (0.0%) |
| Total | 0 (0.0%) | 21 (100.0%) |
Fertility by Education in Rawls Springs
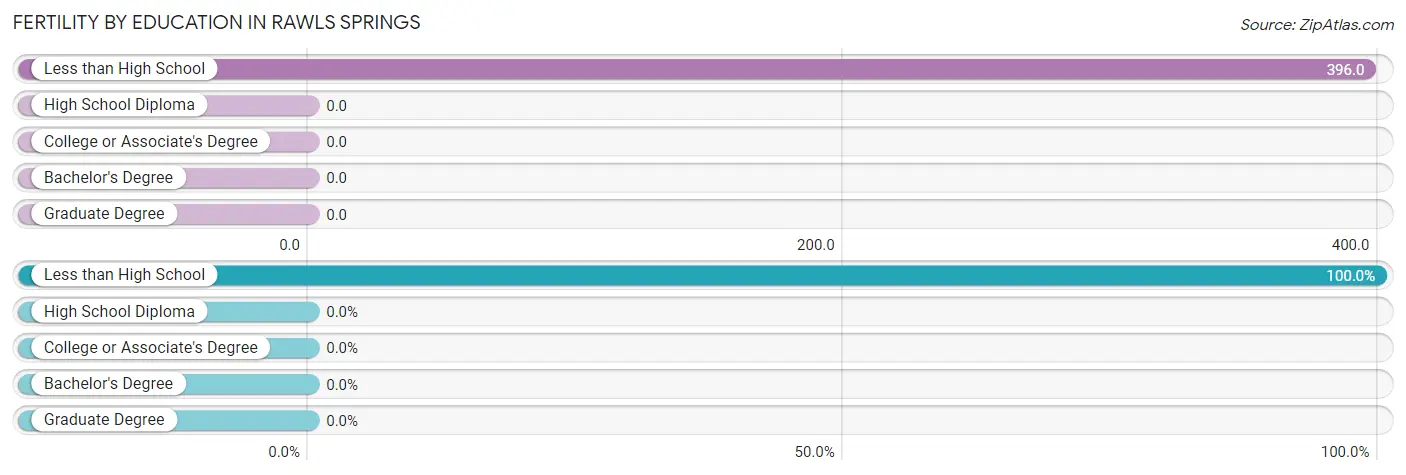
| Educational Attainment | Women with Births | Births / 1,000 Women |
| Less than High School | 21 (100.0%) | 396.0 |
| High School Diploma | 0 (0.0%) | 0.0 |
| College or Associate's Degree | 0 (0.0%) | 0.0 |
| Bachelor's Degree | 0 (0.0%) | 0.0 |
| Graduate Degree | 0 (0.0%) | 0.0 |
| Total | 21 (100.0%) | 42.0 |
Fertility by Education by Marriage Status in Rawls Springs
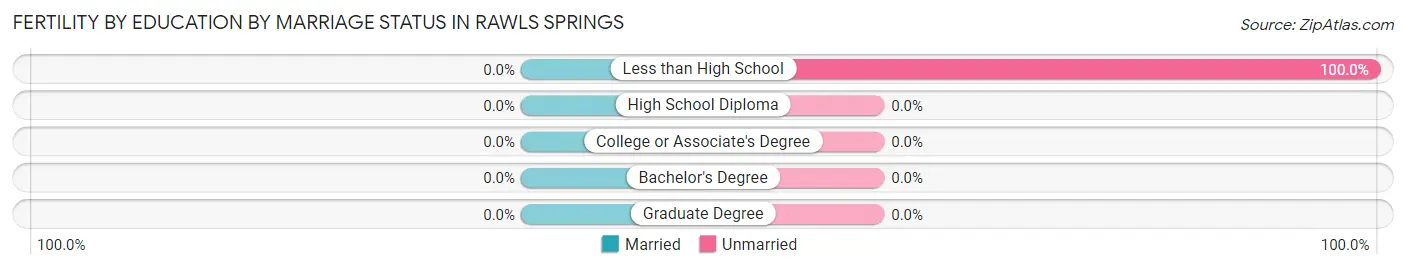
| Educational Attainment | Married | Unmarried |
| Less than High School | 0 (0.0%) | 21 (100.0%) |
| High School Diploma | 0 (0.0%) | 0 (0.0%) |
| College or Associate's Degree | 0 (0.0%) | 0 (0.0%) |
| Bachelor's Degree | 0 (0.0%) | 0 (0.0%) |
| Graduate Degree | 0 (0.0%) | 0 (0.0%) |
| Total | 0 (0.0%) | 21 (100.0%) |
Employment Characteristics in Rawls Springs
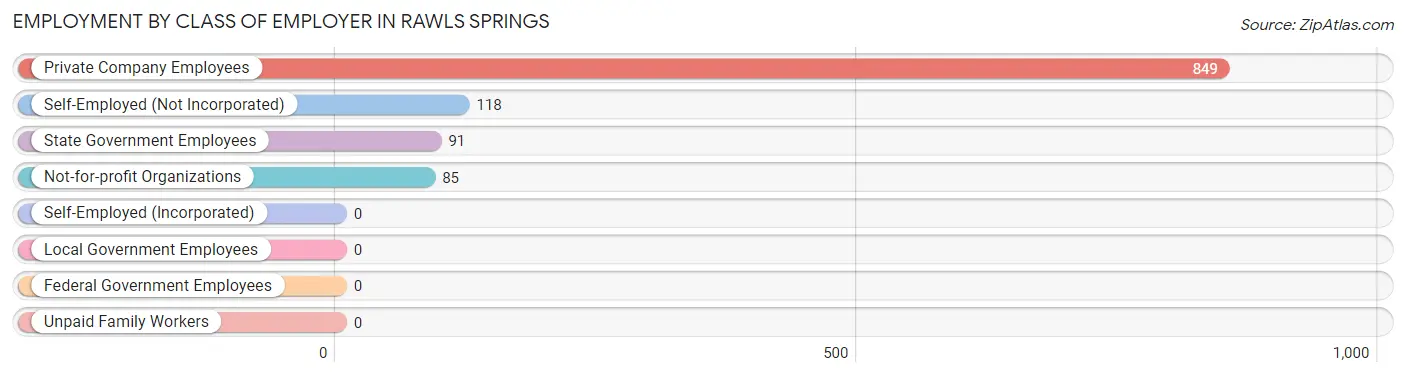
Employment by Class of Employer in Rawls Springs
Among the 1,143 employed individuals in Rawls Springs, private company employees (849 | 74.3%), self-employed (not incorporated) (118 | 10.3%), and state government employees (91 | 8.0%) make up the most common classes of employment.
| Employer Class | # Employees | % Employees |
| Private Company Employees | 849 | 74.3% |
| Self-Employed (Incorporated) | 0 | 0.0% |
| Self-Employed (Not Incorporated) | 118 | 10.3% |
| Not-for-profit Organizations | 85 | 7.4% |
| Local Government Employees | 0 | 0.0% |
| State Government Employees | 91 | 8.0% |
| Federal Government Employees | 0 | 0.0% |
| Unpaid Family Workers | 0 | 0.0% |
| Total | 1,143 | 100.0% |
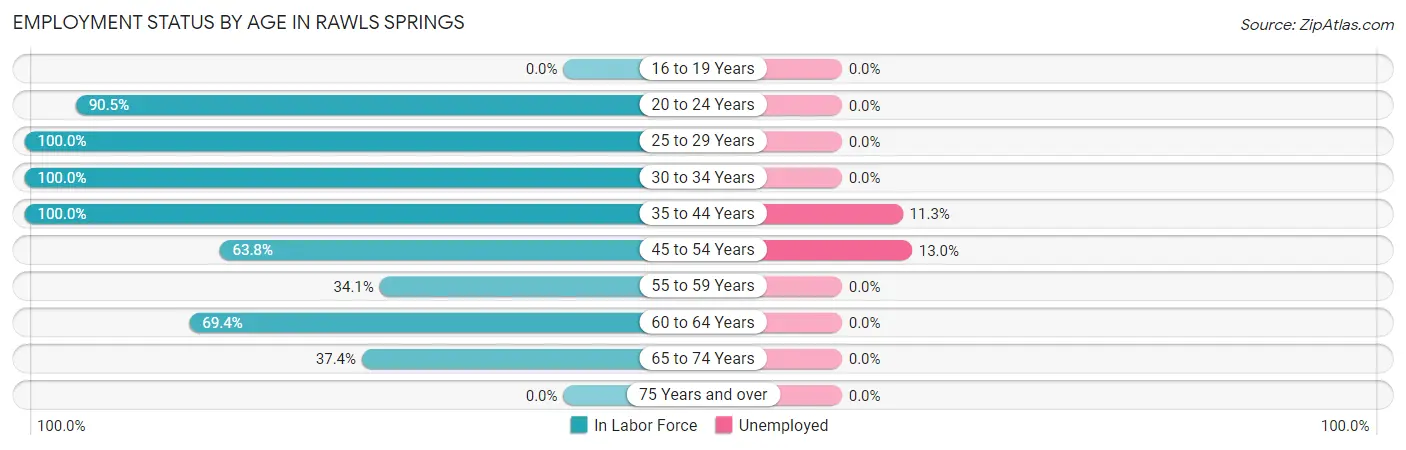
Employment Status by Age in Rawls Springs
According to the labor force statistics for Rawls Springs, out of the total population over 16 years of age (1,758), 70.0% or 1,231 individuals are in the labor force, with 5.4% or 66 of them unemployed. The age group with the highest labor force participation rate is 25 to 29 years, with 100.0% or 183 individuals in the labor force. Within the labor force, the 45 to 54 years age range has the highest percentage of unemployed individuals, with 13.0% or 44 of them being unemployed.
| Age Bracket | In Labor Force | Unemployed |
| 16 to 19 Years | 0 (0.0%) | 0 (0.0%) |
| 20 to 24 Years | 201 (90.5%) | 0 (0.0%) |
| 25 to 29 Years | 183 (100.0%) | 0 (0.0%) |
| 30 to 34 Years | 151 (100.0%) | 0 (0.0%) |
| 35 to 44 Years | 194 (100.0%) | 22 (11.3%) |
| 45 to 54 Years | 339 (63.8%) | 44 (13.0%) |
| 55 to 59 Years | 29 (34.1%) | 0 (0.0%) |
| 60 to 64 Years | 75 (69.4%) | 0 (0.0%) |
| 65 to 74 Years | 58 (37.4%) | 0 (0.0%) |
| 75 Years and over | 0 (0.0%) | 0 (0.0%) |
| Total | 1,231 (70.0%) | 66 (5.4%) |
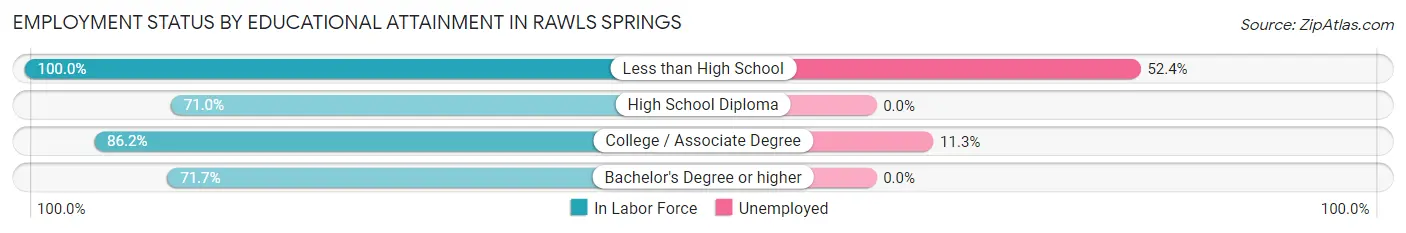
Employment Status by Educational Attainment in Rawls Springs
According to labor force statistics for Rawls Springs, 77.6% of individuals (972) out of the total population between 25 and 64 years of age (1,252) are in the labor force, with 6.8% or 66 of them being unemployed. The group with the highest labor force participation rate are those with the educational attainment of less than high school, with 100.0% or 42 individuals in the labor force. Within the labor force, individuals with less than high school education have the highest percentage of unemployment, with 52.4% or 22 of them being unemployed.
| Educational Attainment | In Labor Force | Unemployed |
| Less than High School | 42 (100.0%) | 22 (52.4%) |
| High School Diploma | 394 (71.0%) | 0 (0.0%) |
| College / Associate Degree | 388 (86.2%) | 51 (11.3%) |
| Bachelor's Degree or higher | 147 (71.7%) | 0 (0.0%) |
| Total | 972 (77.6%) | 85 (6.8%) |
Employment Occupations by Sex in Rawls Springs
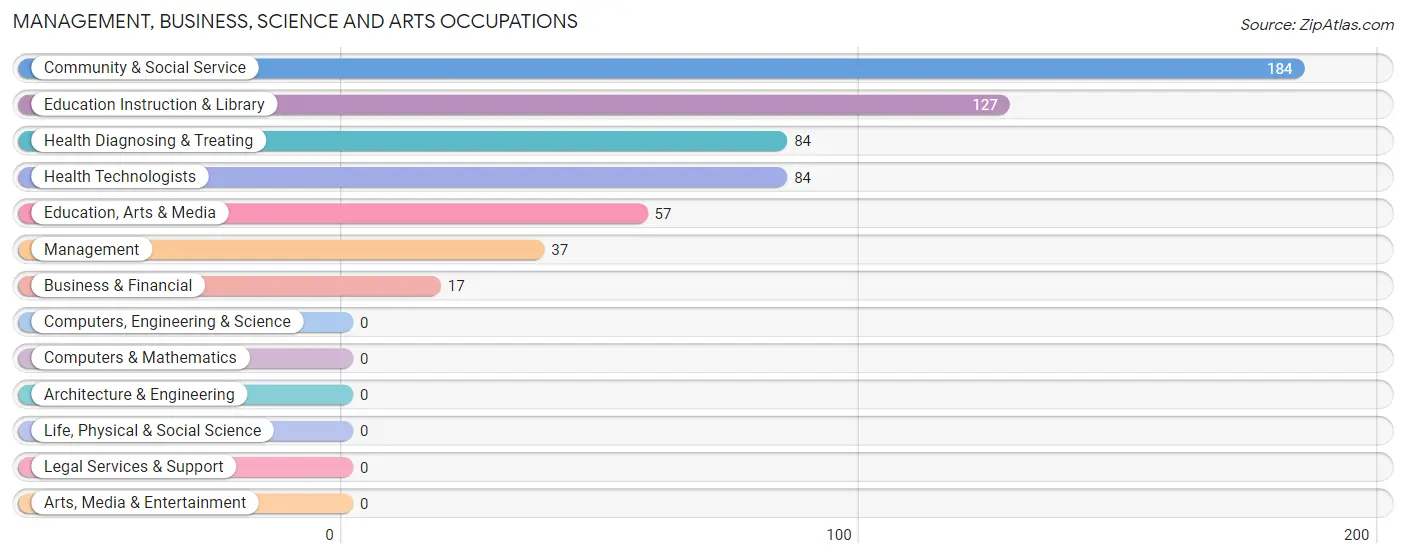
Management, Business, Science and Arts Occupations
The most common Management, Business, Science and Arts occupations in Rawls Springs are Community & Social Service (184 | 15.8%), Education Instruction & Library (127 | 10.9%), Health Diagnosing & Treating (84 | 7.2%), Health Technologists (84 | 7.2%), and Education, Arts & Media (57 | 4.9%).
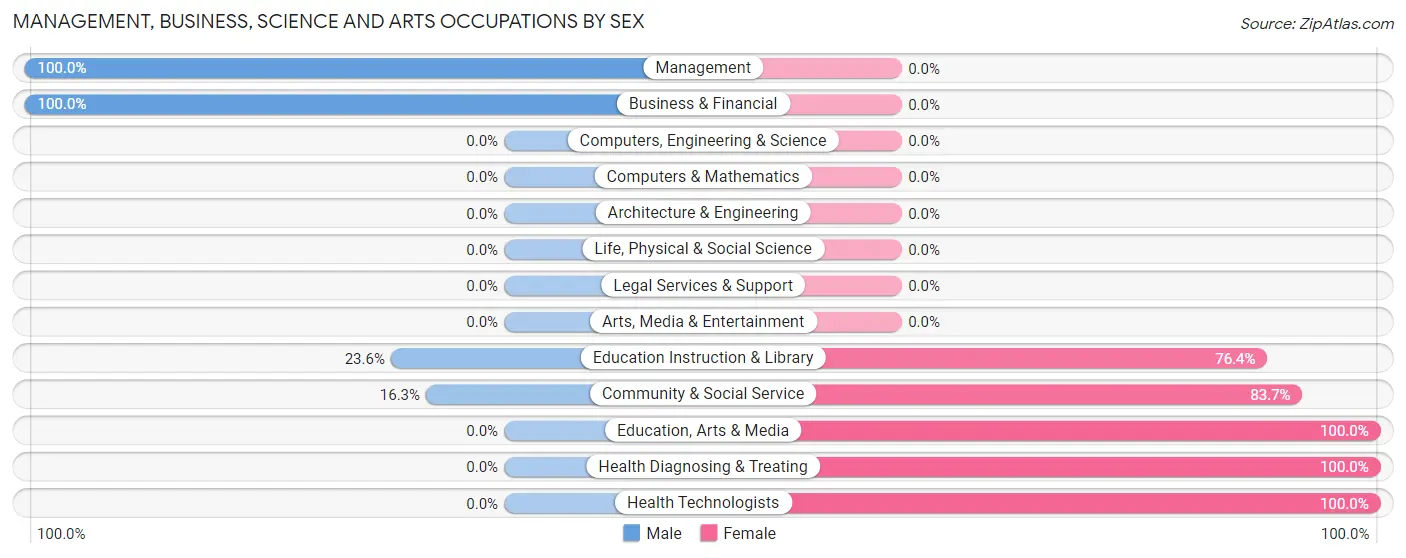
Management, Business, Science and Arts Occupations by Sex
Within the Management, Business, Science and Arts occupations in Rawls Springs, the most male-oriented occupations are Management (100.0%), Business & Financial (100.0%), and Education Instruction & Library (23.6%), while the most female-oriented occupations are Education, Arts & Media (100.0%), Health Diagnosing & Treating (100.0%), and Health Technologists (100.0%).
| Occupation | Male | Female |
| Management | 37 (100.0%) | 0 (0.0%) |
| Business & Financial | 17 (100.0%) | 0 (0.0%) |
| Computers, Engineering & Science | 0 (0.0%) | 0 (0.0%) |
| Computers & Mathematics | 0 (0.0%) | 0 (0.0%) |
| Architecture & Engineering | 0 (0.0%) | 0 (0.0%) |
| Life, Physical & Social Science | 0 (0.0%) | 0 (0.0%) |
| Community & Social Service | 30 (16.3%) | 154 (83.7%) |
| Education, Arts & Media | 0 (0.0%) | 57 (100.0%) |
| Legal Services & Support | 0 (0.0%) | 0 (0.0%) |
| Education Instruction & Library | 30 (23.6%) | 97 (76.4%) |
| Arts, Media & Entertainment | 0 (0.0%) | 0 (0.0%) |
| Health Diagnosing & Treating | 0 (0.0%) | 84 (100.0%) |
| Health Technologists | 0 (0.0%) | 84 (100.0%) |
| Total (Category) | 84 (26.1%) | 238 (73.9%) |
| Total (Overall) | 718 (61.7%) | 446 (38.3%) |
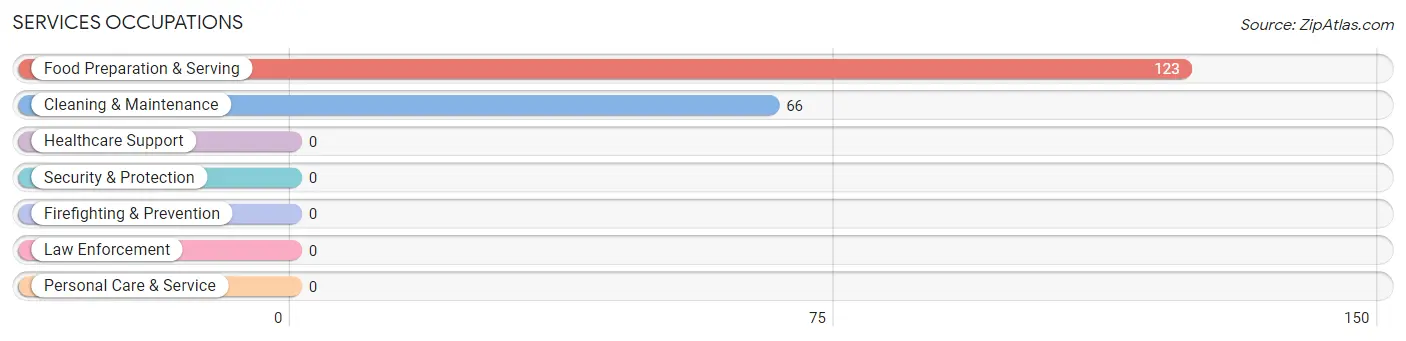
Services Occupations
The most common Services occupations in Rawls Springs are Food Preparation & Serving (123 | 10.6%), and Cleaning & Maintenance (66 | 5.7%).
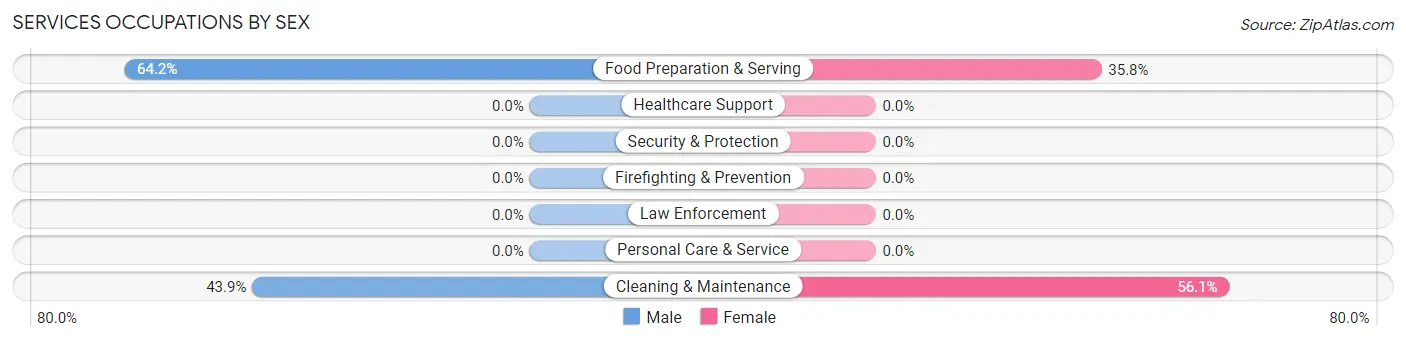
Services Occupations by Sex
Within the Services occupations in Rawls Springs, the most male-oriented occupations are Food Preparation & Serving (64.2%), and Cleaning & Maintenance (43.9%), while the most female-oriented occupations are Cleaning & Maintenance (56.1%), and Food Preparation & Serving (35.8%).
| Occupation | Male | Female |
| Healthcare Support | 0 (0.0%) | 0 (0.0%) |
| Security & Protection | 0 (0.0%) | 0 (0.0%) |
| Firefighting & Prevention | 0 (0.0%) | 0 (0.0%) |
| Law Enforcement | 0 (0.0%) | 0 (0.0%) |
| Food Preparation & Serving | 79 (64.2%) | 44 (35.8%) |
| Cleaning & Maintenance | 29 (43.9%) | 37 (56.1%) |
| Personal Care & Service | 0 (0.0%) | 0 (0.0%) |
| Total (Category) | 108 (57.1%) | 81 (42.9%) |
| Total (Overall) | 718 (61.7%) | 446 (38.3%) |
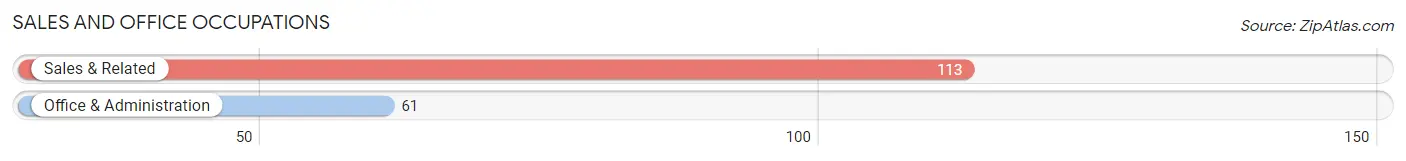
Sales and Office Occupations
The most common Sales and Office occupations in Rawls Springs are Sales & Related (113 | 9.7%), and Office & Administration (61 | 5.2%).
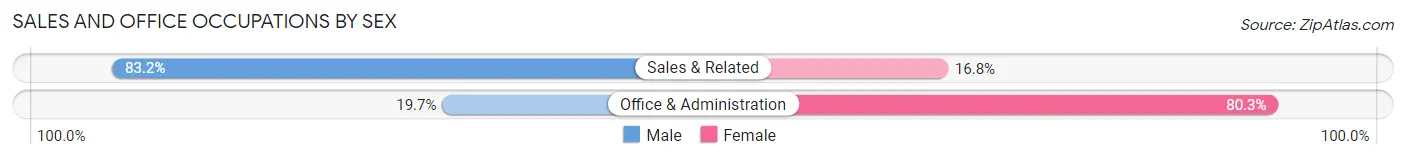
Sales and Office Occupations by Sex
| Occupation | Male | Female |
| Sales & Related | 94 (83.2%) | 19 (16.8%) |
| Office & Administration | 12 (19.7%) | 49 (80.3%) |
| Total (Category) | 106 (60.9%) | 68 (39.1%) |
| Total (Overall) | 718 (61.7%) | 446 (38.3%) |
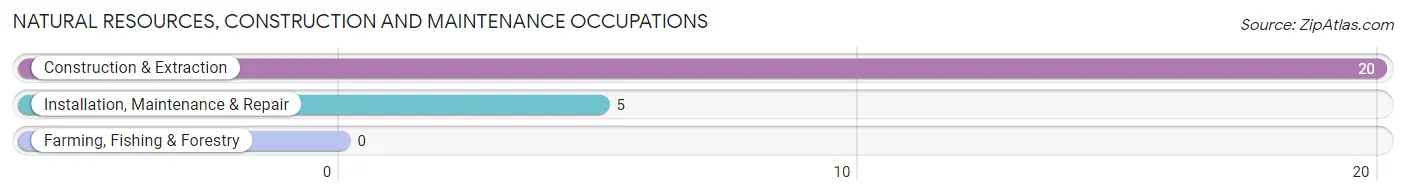
Natural Resources, Construction and Maintenance Occupations
The most common Natural Resources, Construction and Maintenance occupations in Rawls Springs are Construction & Extraction (20 | 1.7%), and Installation, Maintenance & Repair (5 | 0.4%).
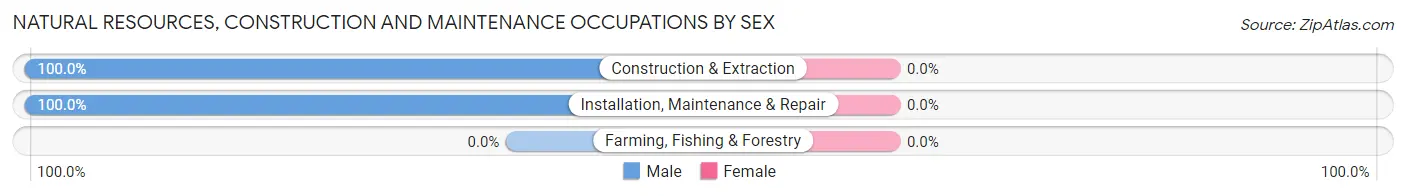
Natural Resources, Construction and Maintenance Occupations by Sex
| Occupation | Male | Female |
| Farming, Fishing & Forestry | 0 (0.0%) | 0 (0.0%) |
| Construction & Extraction | 20 (100.0%) | 0 (0.0%) |
| Installation, Maintenance & Repair | 5 (100.0%) | 0 (0.0%) |
| Total (Category) | 25 (100.0%) | 0 (0.0%) |
| Total (Overall) | 718 (61.7%) | 446 (38.3%) |
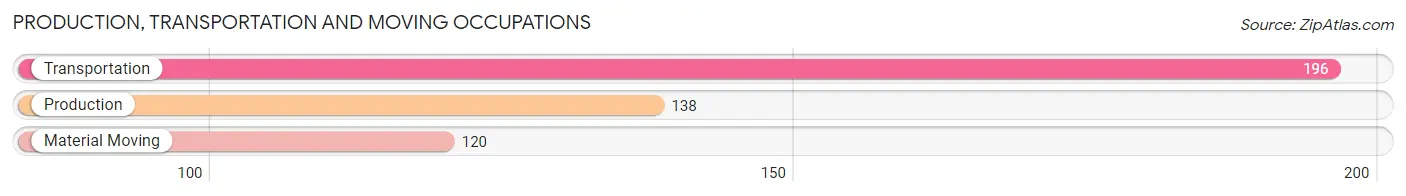
Production, Transportation and Moving Occupations
The most common Production, Transportation and Moving occupations in Rawls Springs are Transportation (196 | 16.8%), Production (138 | 11.9%), and Material Moving (120 | 10.3%).
Production, Transportation and Moving Occupations by Sex
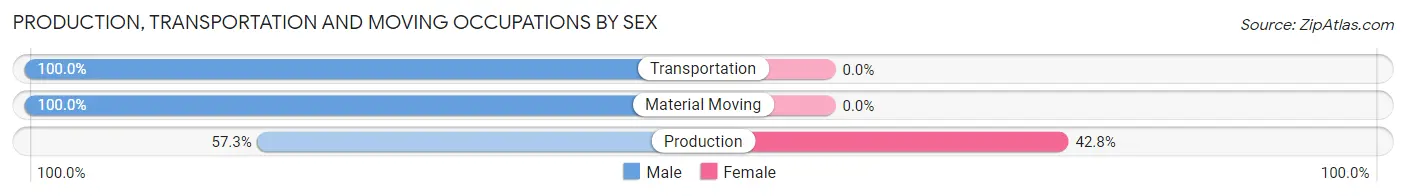
| Occupation | Male | Female |
| Production | 79 (57.3%) | 59 (42.7%) |
| Transportation | 196 (100.0%) | 0 (0.0%) |
| Material Moving | 120 (100.0%) | 0 (0.0%) |
| Total (Category) | 395 (87.0%) | 59 (13.0%) |
| Total (Overall) | 718 (61.7%) | 446 (38.3%) |
Employment Industries by Sex in Rawls Springs
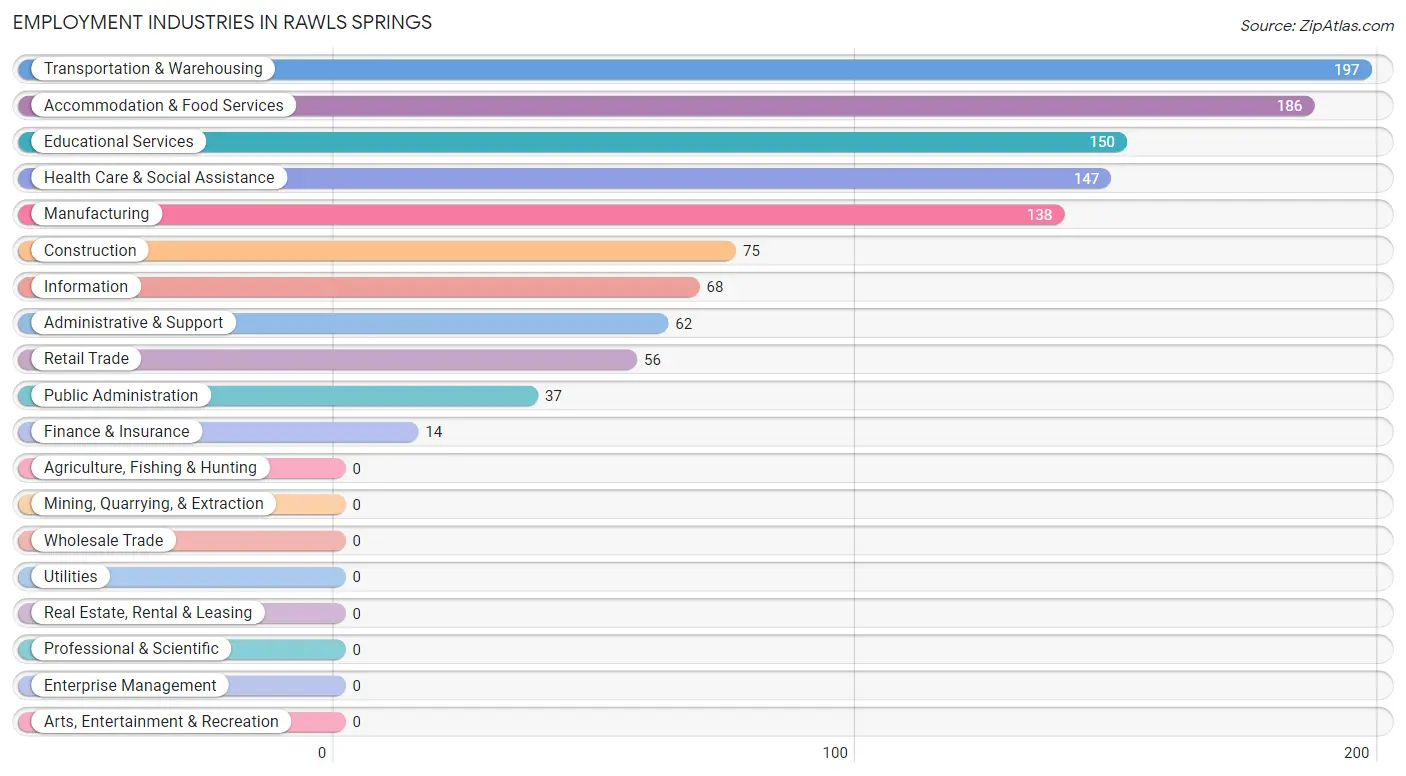
Employment Industries in Rawls Springs
The major employment industries in Rawls Springs include Transportation & Warehousing (197 | 16.9%), Accommodation & Food Services (186 | 16.0%), Educational Services (150 | 12.9%), Health Care & Social Assistance (147 | 12.6%), and Manufacturing (138 | 11.9%).
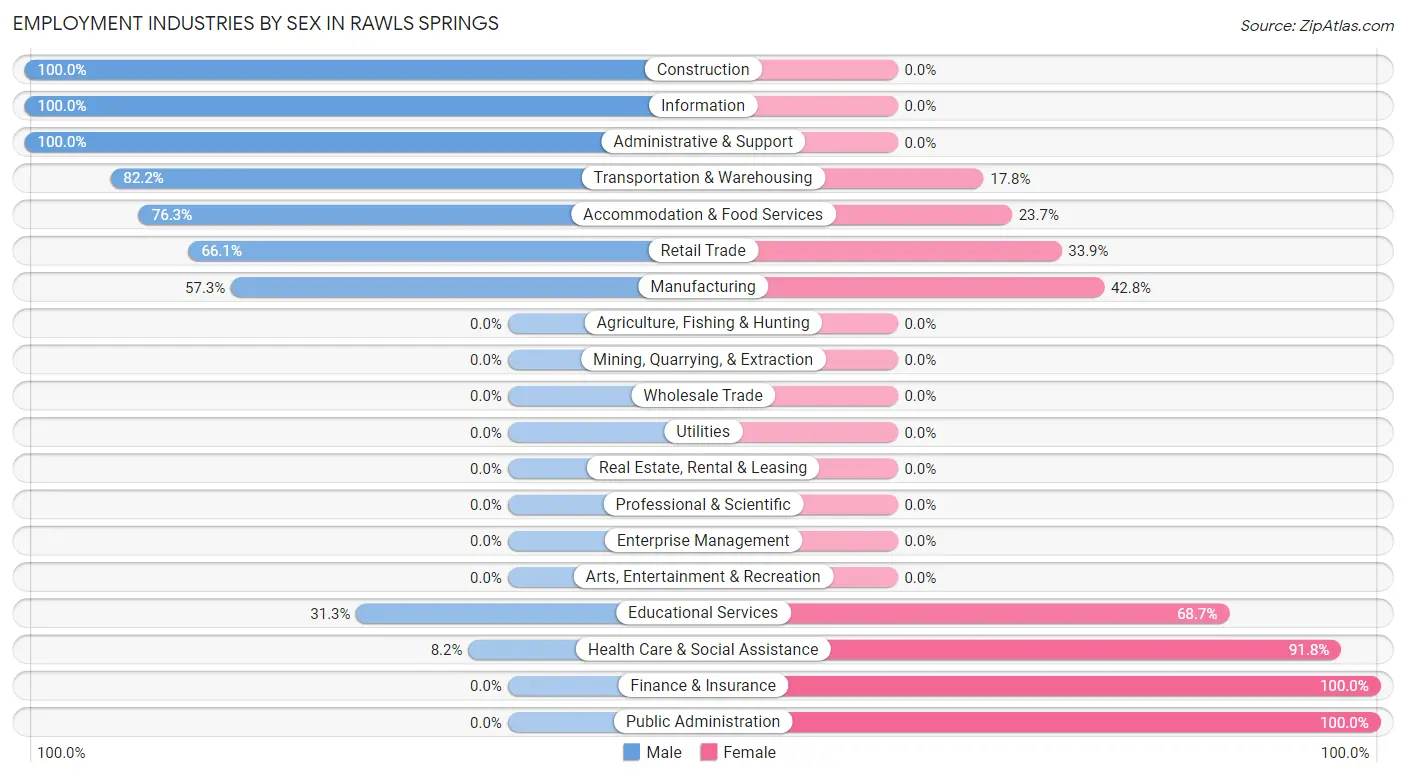
Employment Industries by Sex in Rawls Springs
The Rawls Springs industries that see more men than women are Construction (100.0%), Information (100.0%), and Administrative & Support (100.0%), whereas the industries that tend to have a higher number of women are Finance & Insurance (100.0%), Public Administration (100.0%), and Health Care & Social Assistance (91.8%).
| Industry | Male | Female |
| Agriculture, Fishing & Hunting | 0 (0.0%) | 0 (0.0%) |
| Mining, Quarrying, & Extraction | 0 (0.0%) | 0 (0.0%) |
| Construction | 75 (100.0%) | 0 (0.0%) |
| Manufacturing | 79 (57.3%) | 59 (42.7%) |
| Wholesale Trade | 0 (0.0%) | 0 (0.0%) |
| Retail Trade | 37 (66.1%) | 19 (33.9%) |
| Transportation & Warehousing | 162 (82.2%) | 35 (17.8%) |
| Utilities | 0 (0.0%) | 0 (0.0%) |
| Information | 68 (100.0%) | 0 (0.0%) |
| Finance & Insurance | 0 (0.0%) | 14 (100.0%) |
| Real Estate, Rental & Leasing | 0 (0.0%) | 0 (0.0%) |
| Professional & Scientific | 0 (0.0%) | 0 (0.0%) |
| Enterprise Management | 0 (0.0%) | 0 (0.0%) |
| Administrative & Support | 62 (100.0%) | 0 (0.0%) |
| Educational Services | 47 (31.3%) | 103 (68.7%) |
| Health Care & Social Assistance | 12 (8.2%) | 135 (91.8%) |
| Arts, Entertainment & Recreation | 0 (0.0%) | 0 (0.0%) |
| Accommodation & Food Services | 142 (76.3%) | 44 (23.7%) |
| Public Administration | 0 (0.0%) | 37 (100.0%) |
| Total | 718 (61.7%) | 446 (38.3%) |
Education in Rawls Springs
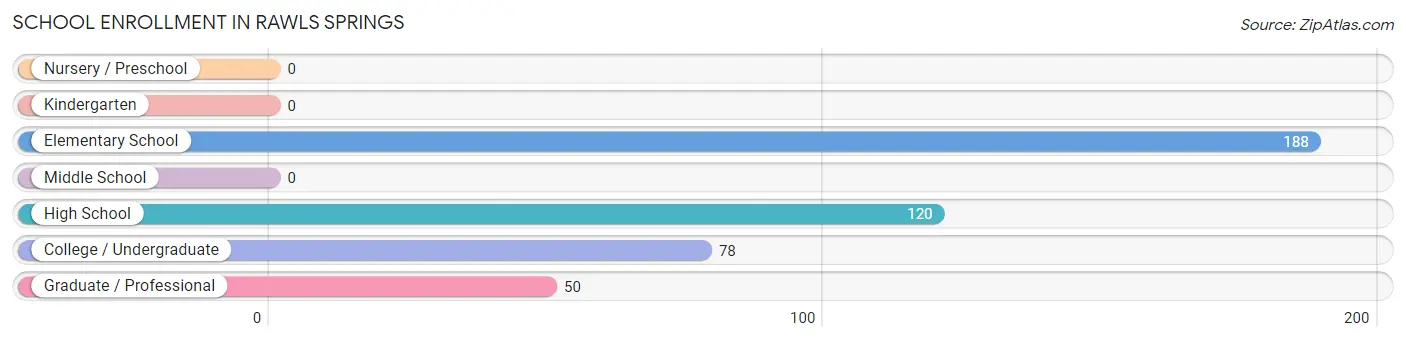
School Enrollment in Rawls Springs
The most common levels of schooling among the 436 students in Rawls Springs are elementary school (188 | 43.1%), high school (120 | 27.5%), and college / undergraduate (78 | 17.9%).
| School Level | # Students | % Students |
| Nursery / Preschool | 0 | 0.0% |
| Kindergarten | 0 | 0.0% |
| Elementary School | 188 | 43.1% |
| Middle School | 0 | 0.0% |
| High School | 120 | 27.5% |
| College / Undergraduate | 78 | 17.9% |
| Graduate / Professional | 50 | 11.5% |
| Total | 436 | 100.0% |
School Enrollment by Age by Funding Source in Rawls Springs
Out of a total of 436 students who are enrolled in schools in Rawls Springs, 55 (12.6%) attend a private institution, while the remaining 381 (87.4%) are enrolled in public schools. The age group of 35 years and over has the highest likelihood of being enrolled in private schools, with 20 (100.0% in the age bracket) enrolled. Conversely, the age group of 5 to 9 year old has the lowest likelihood of being enrolled in a private school, with 97 (100.0% in the age bracket) attending a public institution.
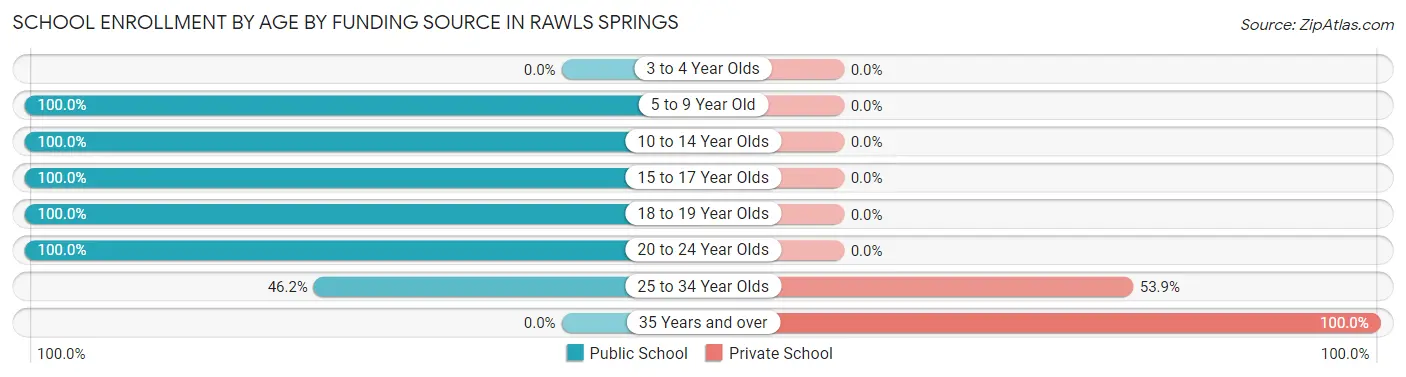
| Age Bracket | Public School | Private School |
| 3 to 4 Year Olds | 0 (0.0%) | 0 (0.0%) |
| 5 to 9 Year Old | 97 (100.0%) | 0 (0.0%) |
| 10 to 14 Year Olds | 151 (100.0%) | 0 (0.0%) |
| 15 to 17 Year Olds | 32 (100.0%) | 0 (0.0%) |
| 18 to 19 Year Olds | 28 (100.0%) | 0 (0.0%) |
| 20 to 24 Year Olds | 43 (100.0%) | 0 (0.0%) |
| 25 to 34 Year Olds | 30 (46.2%) | 35 (53.8%) |
| 35 Years and over | 0 (0.0%) | 20 (100.0%) |
| Total | 381 (87.4%) | 55 (12.6%) |
Educational Attainment by Field of Study in Rawls Springs
Social sciences (80 | 38.5%), science & technology (61 | 29.3%), education (37 | 17.8%), and psychology (30 | 14.4%) are the most common fields of study among 208 individuals in Rawls Springs who have obtained a bachelor's degree or higher.
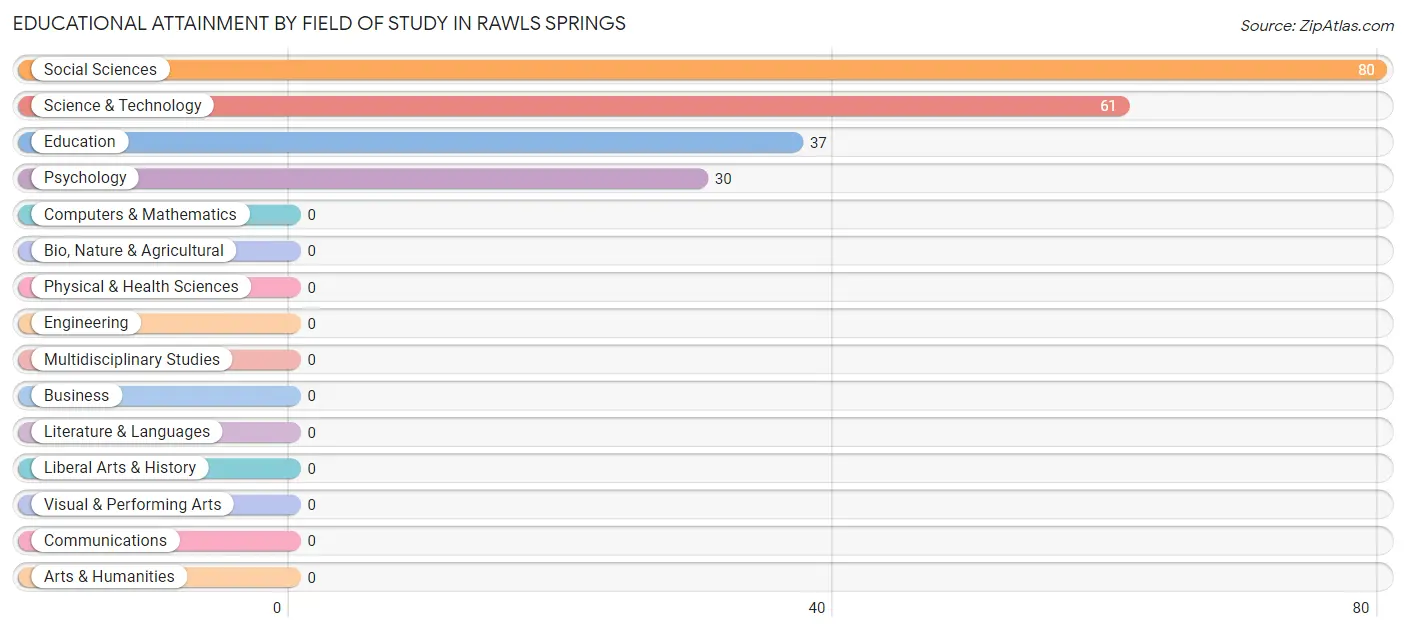
| Field of Study | # Graduates | % Graduates |
| Computers & Mathematics | 0 | 0.0% |
| Bio, Nature & Agricultural | 0 | 0.0% |
| Physical & Health Sciences | 0 | 0.0% |
| Psychology | 30 | 14.4% |
| Social Sciences | 80 | 38.5% |
| Engineering | 0 | 0.0% |
| Multidisciplinary Studies | 0 | 0.0% |
| Science & Technology | 61 | 29.3% |
| Business | 0 | 0.0% |
| Education | 37 | 17.8% |
| Literature & Languages | 0 | 0.0% |
| Liberal Arts & History | 0 | 0.0% |
| Visual & Performing Arts | 0 | 0.0% |
| Communications | 0 | 0.0% |
| Arts & Humanities | 0 | 0.0% |
| Total | 208 | 100.0% |
Transportation & Commute in Rawls Springs
Vehicle Availability by Sex in Rawls Springs
The most prevalent vehicle ownership categories in Rawls Springs are males with 2 vehicles (399, accounting for 57.3%) and females with 2 vehicles (300, making up 89.5%).
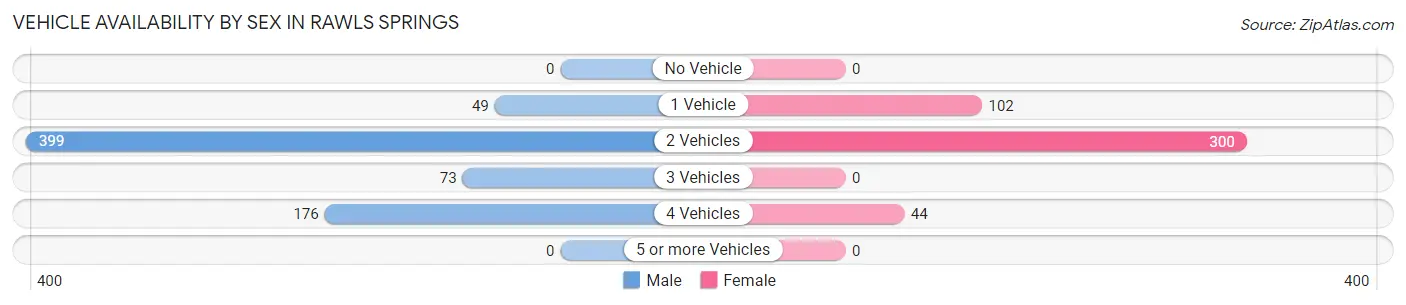
| Vehicles Available | Male | Female |
| No Vehicle | 0 (0.0%) | 0 (0.0%) |
| 1 Vehicle | 49 (7.0%) | 102 (22.9%) |
| 2 Vehicles | 399 (57.3%) | 300 (67.3%) |
| 3 Vehicles | 73 (10.5%) | 0 (0.0%) |
| 4 Vehicles | 176 (25.3%) | 44 (9.9%) |
| 5 or more Vehicles | 0 (0.0%) | 0 (0.0%) |
| Total | 697 (100.0%) | 446 (100.0%) |
Commute Time in Rawls Springs
The most frequently occuring commute durations in Rawls Springs are 15 to 19 minutes (345 commuters, 30.5%), 20 to 24 minutes (211 commuters, 18.7%), and 10 to 14 minutes (186 commuters, 16.5%).
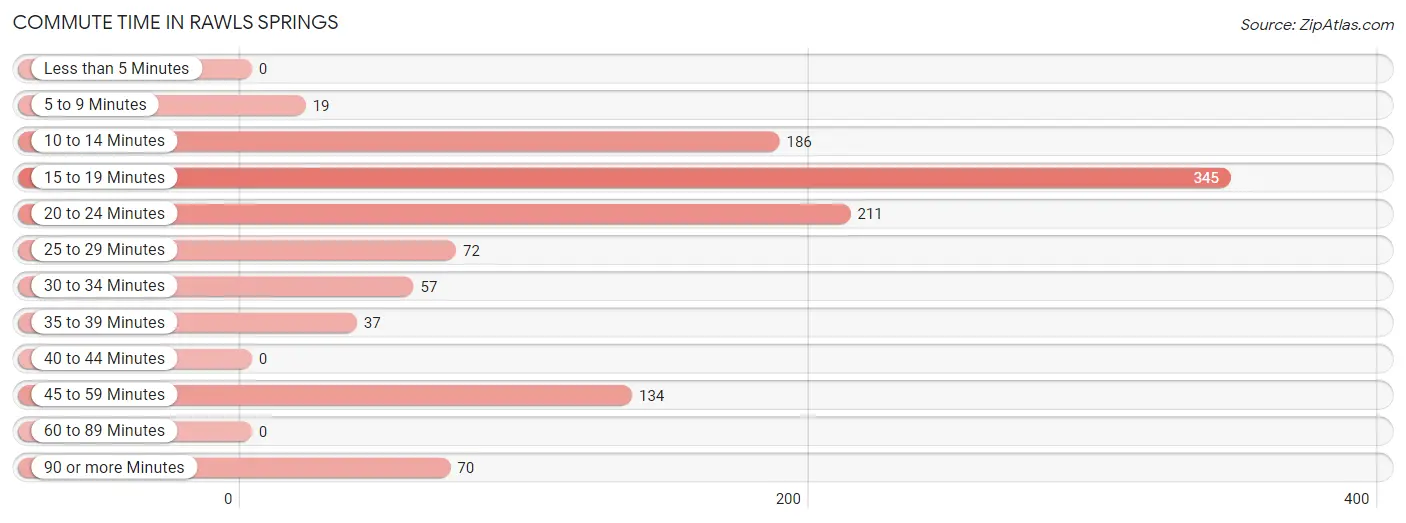
| Commute Time | # Commuters | % Commuters |
| Less than 5 Minutes | 0 | 0.0% |
| 5 to 9 Minutes | 19 | 1.7% |
| 10 to 14 Minutes | 186 | 16.5% |
| 15 to 19 Minutes | 345 | 30.5% |
| 20 to 24 Minutes | 211 | 18.7% |
| 25 to 29 Minutes | 72 | 6.4% |
| 30 to 34 Minutes | 57 | 5.0% |
| 35 to 39 Minutes | 37 | 3.3% |
| 40 to 44 Minutes | 0 | 0.0% |
| 45 to 59 Minutes | 134 | 11.8% |
| 60 to 89 Minutes | 0 | 0.0% |
| 90 or more Minutes | 70 | 6.2% |
Commute Time by Sex in Rawls Springs
The most common commute times in Rawls Springs are 15 to 19 minutes (185 commuters, 27.0%) for males and 15 to 19 minutes (160 commuters, 35.9%) for females.
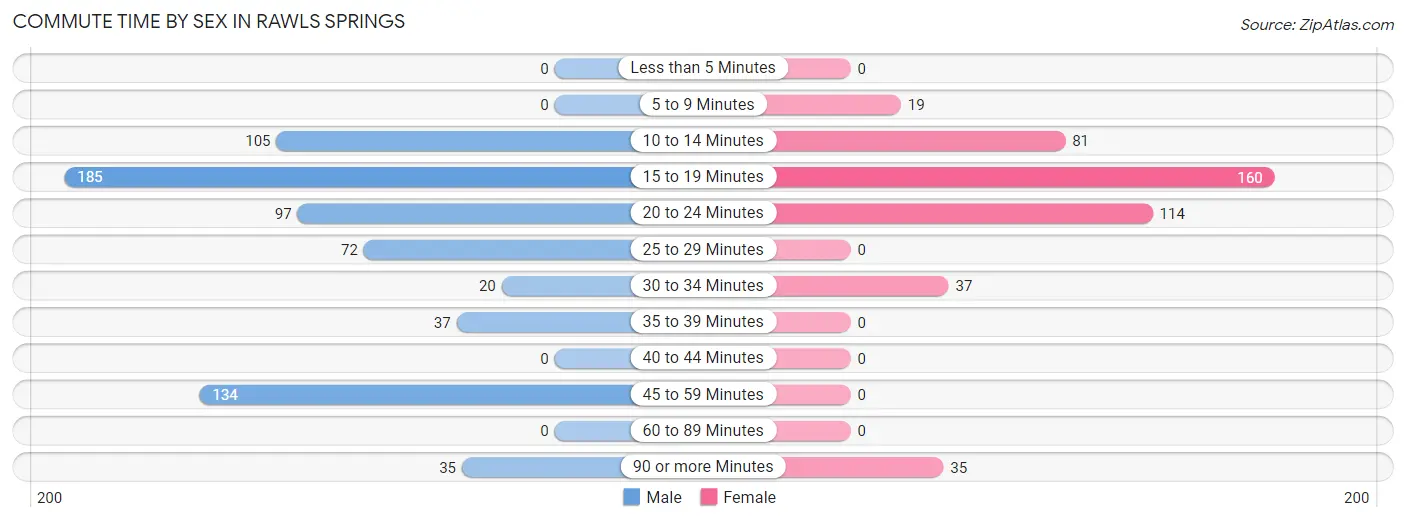
| Commute Time | Male | Female |
| Less than 5 Minutes | 0 (0.0%) | 0 (0.0%) |
| 5 to 9 Minutes | 0 (0.0%) | 19 (4.3%) |
| 10 to 14 Minutes | 105 (15.3%) | 81 (18.2%) |
| 15 to 19 Minutes | 185 (27.0%) | 160 (35.9%) |
| 20 to 24 Minutes | 97 (14.2%) | 114 (25.6%) |
| 25 to 29 Minutes | 72 (10.5%) | 0 (0.0%) |
| 30 to 34 Minutes | 20 (2.9%) | 37 (8.3%) |
| 35 to 39 Minutes | 37 (5.4%) | 0 (0.0%) |
| 40 to 44 Minutes | 0 (0.0%) | 0 (0.0%) |
| 45 to 59 Minutes | 134 (19.6%) | 0 (0.0%) |
| 60 to 89 Minutes | 0 (0.0%) | 0 (0.0%) |
| 90 or more Minutes | 35 (5.1%) | 35 (7.9%) |
Time of Departure to Work by Sex in Rawls Springs
The most frequent times of departure to work in Rawls Springs are 5:30 AM to 5:59 AM (202, 29.5%) for males and 7:00 AM to 7:29 AM (135, 30.3%) for females.
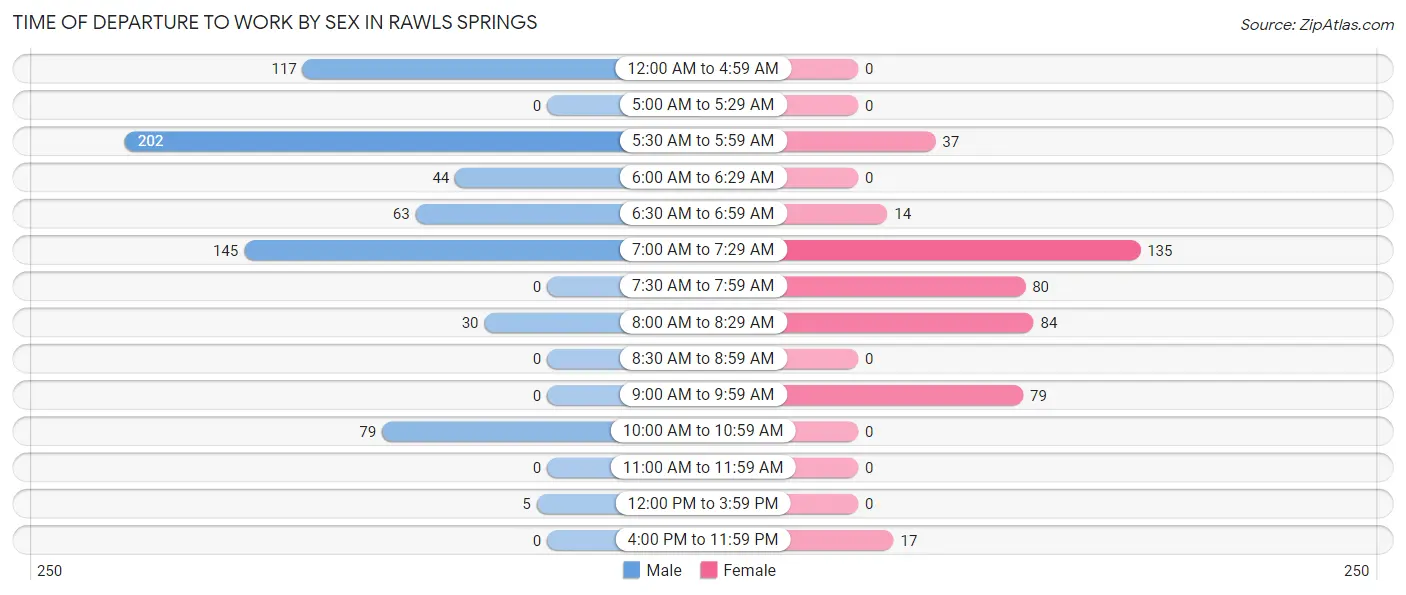
| Time of Departure | Male | Female |
| 12:00 AM to 4:59 AM | 117 (17.1%) | 0 (0.0%) |
| 5:00 AM to 5:29 AM | 0 (0.0%) | 0 (0.0%) |
| 5:30 AM to 5:59 AM | 202 (29.5%) | 37 (8.3%) |
| 6:00 AM to 6:29 AM | 44 (6.4%) | 0 (0.0%) |
| 6:30 AM to 6:59 AM | 63 (9.2%) | 14 (3.1%) |
| 7:00 AM to 7:29 AM | 145 (21.2%) | 135 (30.3%) |
| 7:30 AM to 7:59 AM | 0 (0.0%) | 80 (17.9%) |
| 8:00 AM to 8:29 AM | 30 (4.4%) | 84 (18.8%) |
| 8:30 AM to 8:59 AM | 0 (0.0%) | 0 (0.0%) |
| 9:00 AM to 9:59 AM | 0 (0.0%) | 79 (17.7%) |
| 10:00 AM to 10:59 AM | 79 (11.5%) | 0 (0.0%) |
| 11:00 AM to 11:59 AM | 0 (0.0%) | 0 (0.0%) |
| 12:00 PM to 3:59 PM | 5 (0.7%) | 0 (0.0%) |
| 4:00 PM to 11:59 PM | 0 (0.0%) | 17 (3.8%) |
| Total | 685 (100.0%) | 446 (100.0%) |
Housing Occupancy in Rawls Springs
Occupancy by Ownership in Rawls Springs
Of the total 723 dwellings in Rawls Springs, owner-occupied units account for 547 (75.7%), while renter-occupied units make up 176 (24.3%).
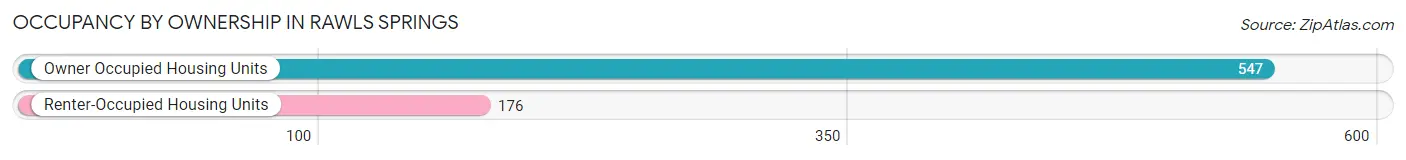
| Occupancy | # Housing Units | % Housing Units |
| Owner Occupied Housing Units | 547 | 75.7% |
| Renter-Occupied Housing Units | 176 | 24.3% |
| Total Occupied Housing Units | 723 | 100.0% |
Occupancy by Household Size in Rawls Springs
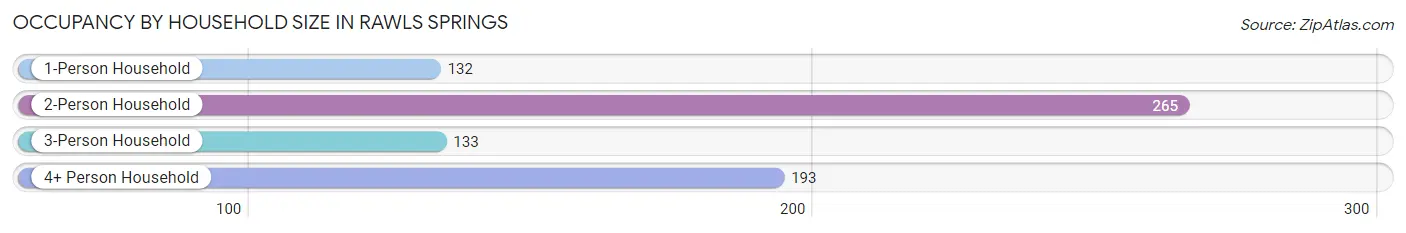
| Household Size | # Housing Units | % Housing Units |
| 1-Person Household | 132 | 18.3% |
| 2-Person Household | 265 | 36.6% |
| 3-Person Household | 133 | 18.4% |
| 4+ Person Household | 193 | 26.7% |
| Total Housing Units | 723 | 100.0% |
Occupancy by Ownership by Household Size in Rawls Springs
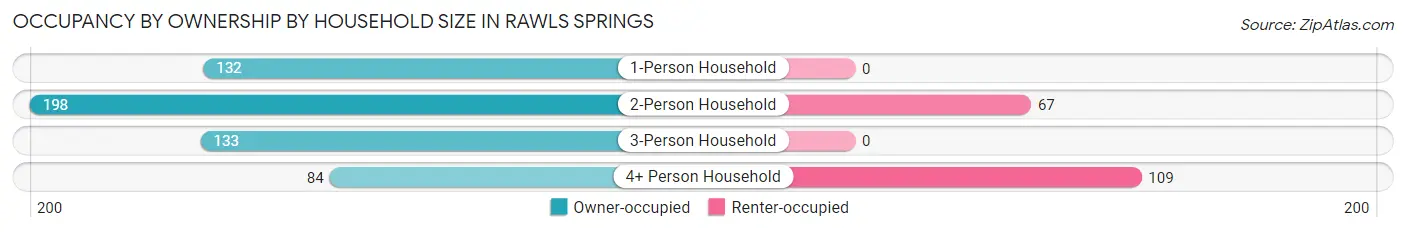
| Household Size | Owner-occupied | Renter-occupied |
| 1-Person Household | 132 (100.0%) | 0 (0.0%) |
| 2-Person Household | 198 (74.7%) | 67 (25.3%) |
| 3-Person Household | 133 (100.0%) | 0 (0.0%) |
| 4+ Person Household | 84 (43.5%) | 109 (56.5%) |
| Total Housing Units | 547 (75.7%) | 176 (24.3%) |
Occupancy by Educational Attainment in Rawls Springs
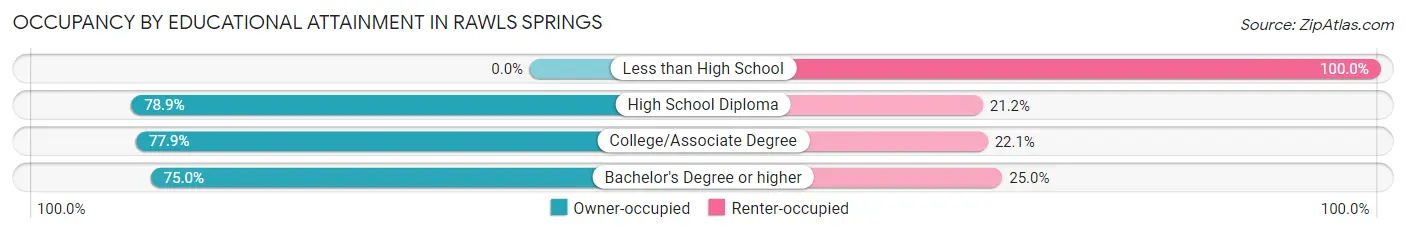
| Household Size | Owner-occupied | Renter-occupied |
| Less than High School | 0 (0.0%) | 21 (100.0%) |
| High School Diploma | 302 (78.8%) | 81 (21.1%) |
| College/Associate Degree | 155 (77.9%) | 44 (22.1%) |
| Bachelor's Degree or higher | 90 (75.0%) | 30 (25.0%) |
Occupancy by Age of Householder in Rawls Springs
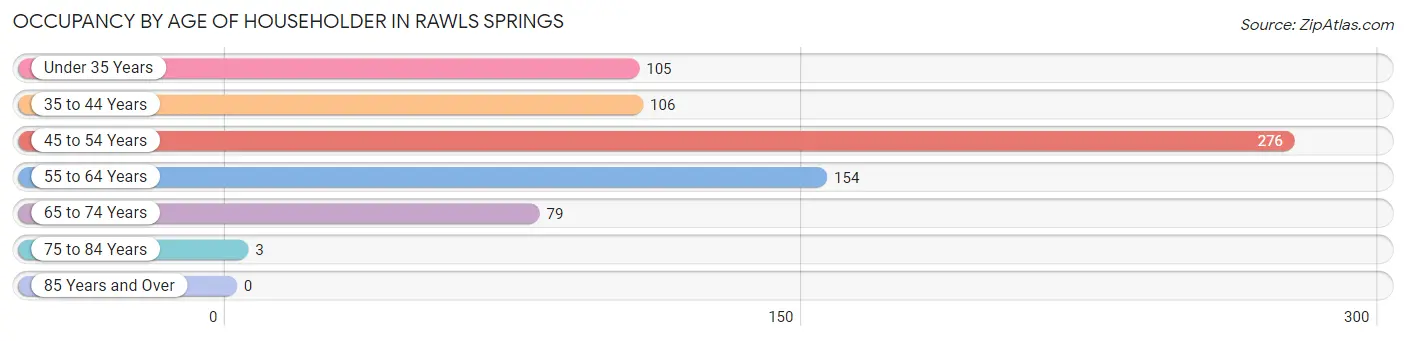
| Age Bracket | # Households | % Households |
| Under 35 Years | 105 | 14.5% |
| 35 to 44 Years | 106 | 14.7% |
| 45 to 54 Years | 276 | 38.2% |
| 55 to 64 Years | 154 | 21.3% |
| 65 to 74 Years | 79 | 10.9% |
| 75 to 84 Years | 3 | 0.4% |
| 85 Years and Over | 0 | 0.0% |
| Total | 723 | 100.0% |
Housing Finances in Rawls Springs
Median Income by Occupancy in Rawls Springs
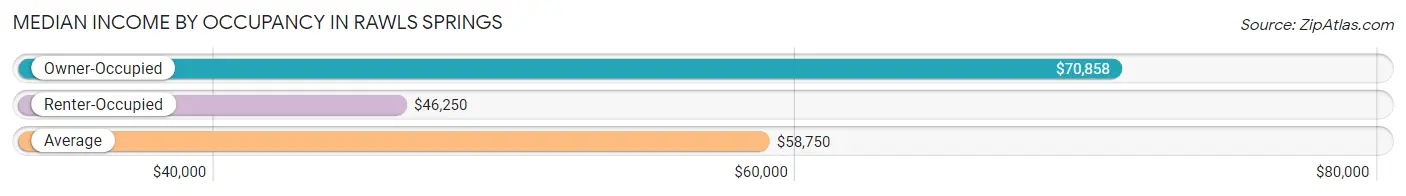
| Occupancy Type | # Households | Median Income |
| Owner-Occupied | 547 (75.7%) | $70,858 |
| Renter-Occupied | 176 (24.3%) | $46,250 |
| Average | 723 (100.0%) | $58,750 |
Occupancy by Householder Income Bracket in Rawls Springs
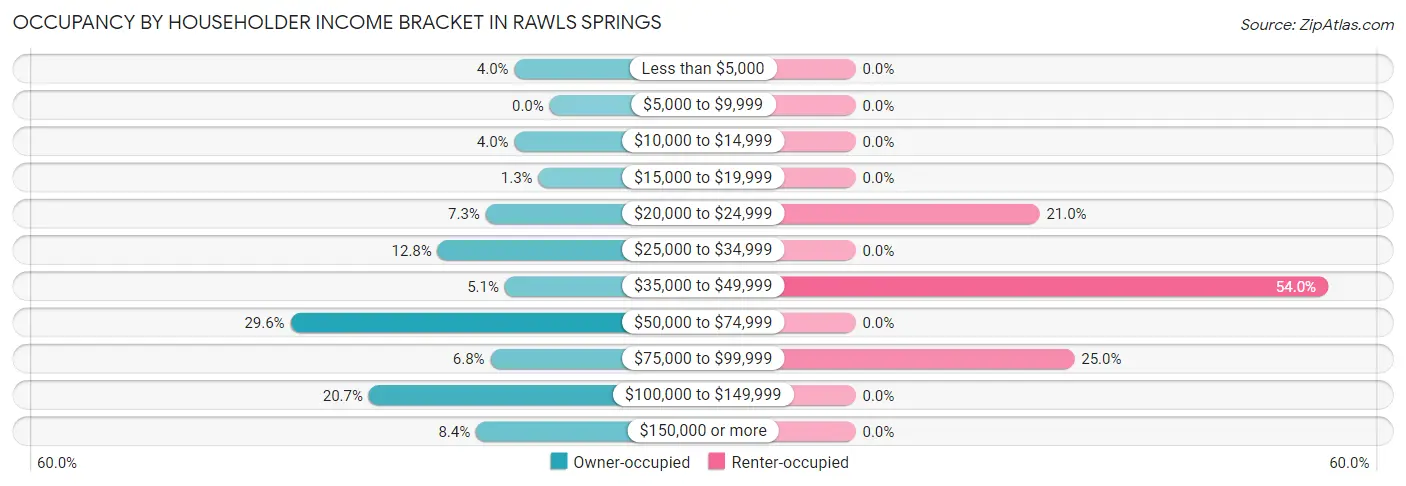
| Income Bracket | Owner-occupied | Renter-occupied |
| Less than $5,000 | 22 (4.0%) | 0 (0.0%) |
| $5,000 to $9,999 | 0 (0.0%) | 0 (0.0%) |
| $10,000 to $14,999 | 22 (4.0%) | 0 (0.0%) |
| $15,000 to $19,999 | 7 (1.3%) | 0 (0.0%) |
| $20,000 to $24,999 | 40 (7.3%) | 37 (21.0%) |
| $25,000 to $34,999 | 70 (12.8%) | 0 (0.0%) |
| $35,000 to $49,999 | 28 (5.1%) | 95 (54.0%) |
| $50,000 to $74,999 | 162 (29.6%) | 0 (0.0%) |
| $75,000 to $99,999 | 37 (6.8%) | 44 (25.0%) |
| $100,000 to $149,999 | 113 (20.7%) | 0 (0.0%) |
| $150,000 or more | 46 (8.4%) | 0 (0.0%) |
| Total | 547 (100.0%) | 176 (100.0%) |
Monthly Housing Cost Tiers in Rawls Springs
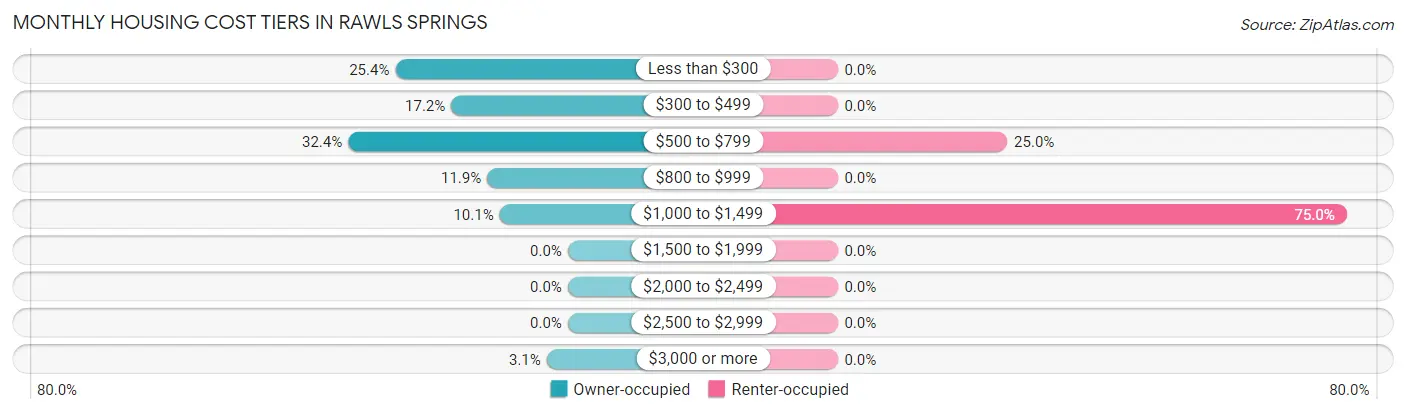
| Monthly Cost | Owner-occupied | Renter-occupied |
| Less than $300 | 139 (25.4%) | 0 (0.0%) |
| $300 to $499 | 94 (17.2%) | 0 (0.0%) |
| $500 to $799 | 177 (32.4%) | 44 (25.0%) |
| $800 to $999 | 65 (11.9%) | 0 (0.0%) |
| $1,000 to $1,499 | 55 (10.1%) | 132 (75.0%) |
| $1,500 to $1,999 | 0 (0.0%) | 0 (0.0%) |
| $2,000 to $2,499 | 0 (0.0%) | 0 (0.0%) |
| $2,500 to $2,999 | 0 (0.0%) | 0 (0.0%) |
| $3,000 or more | 17 (3.1%) | 0 (0.0%) |
| Total | 547 (100.0%) | 176 (100.0%) |
Physical Housing Characteristics in Rawls Springs
Housing Structures in Rawls Springs
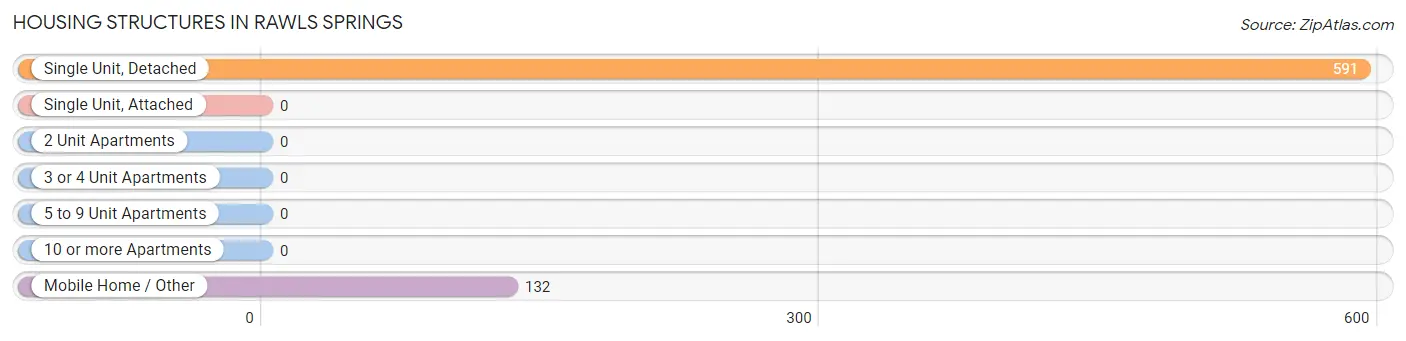
| Structure Type | # Housing Units | % Housing Units |
| Single Unit, Detached | 591 | 81.7% |
| Single Unit, Attached | 0 | 0.0% |
| 2 Unit Apartments | 0 | 0.0% |
| 3 or 4 Unit Apartments | 0 | 0.0% |
| 5 to 9 Unit Apartments | 0 | 0.0% |
| 10 or more Apartments | 0 | 0.0% |
| Mobile Home / Other | 132 | 18.3% |
| Total | 723 | 100.0% |
Housing Structures by Occupancy in Rawls Springs
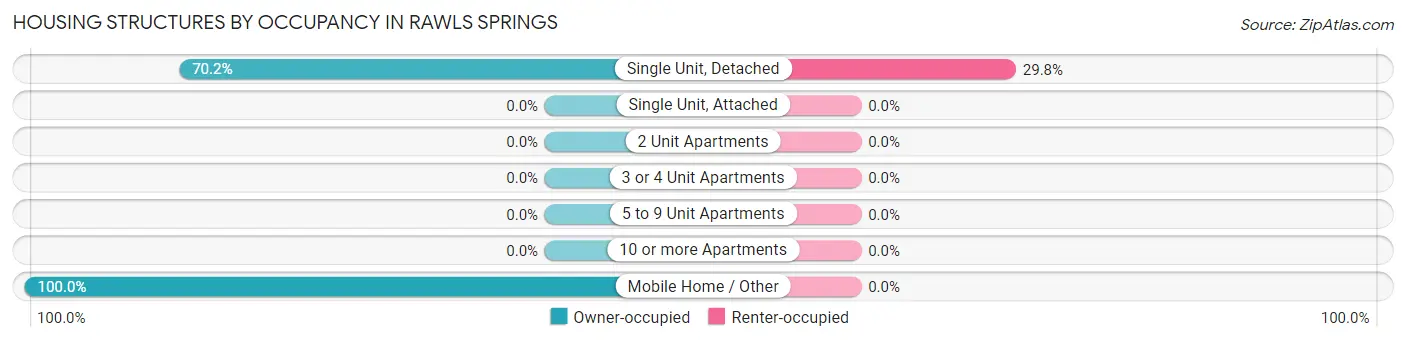
| Structure Type | Owner-occupied | Renter-occupied |
| Single Unit, Detached | 415 (70.2%) | 176 (29.8%) |
| Single Unit, Attached | 0 (0.0%) | 0 (0.0%) |
| 2 Unit Apartments | 0 (0.0%) | 0 (0.0%) |
| 3 or 4 Unit Apartments | 0 (0.0%) | 0 (0.0%) |
| 5 to 9 Unit Apartments | 0 (0.0%) | 0 (0.0%) |
| 10 or more Apartments | 0 (0.0%) | 0 (0.0%) |
| Mobile Home / Other | 132 (100.0%) | 0 (0.0%) |
| Total | 547 (75.7%) | 176 (24.3%) |
Housing Structures by Number of Rooms in Rawls Springs
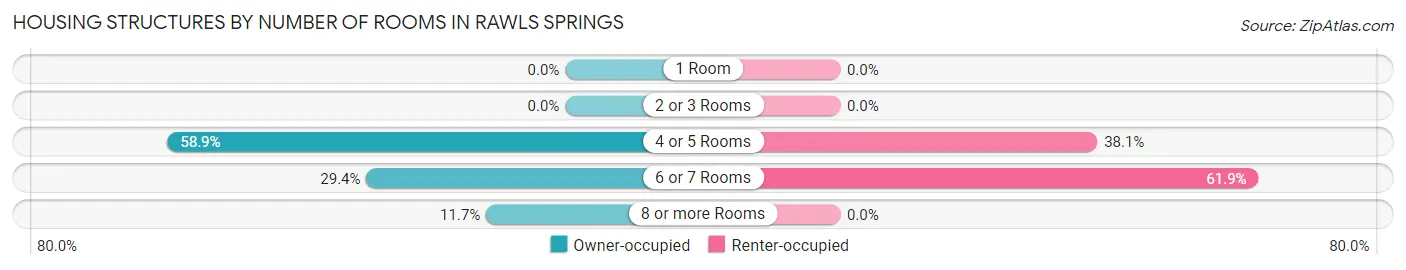
| Number of Rooms | Owner-occupied | Renter-occupied |
| 1 Room | 0 (0.0%) | 0 (0.0%) |
| 2 or 3 Rooms | 0 (0.0%) | 0 (0.0%) |
| 4 or 5 Rooms | 322 (58.9%) | 67 (38.1%) |
| 6 or 7 Rooms | 161 (29.4%) | 109 (61.9%) |
| 8 or more Rooms | 64 (11.7%) | 0 (0.0%) |
| Total | 547 (100.0%) | 176 (100.0%) |
Housing Structure by Heating Type in Rawls Springs
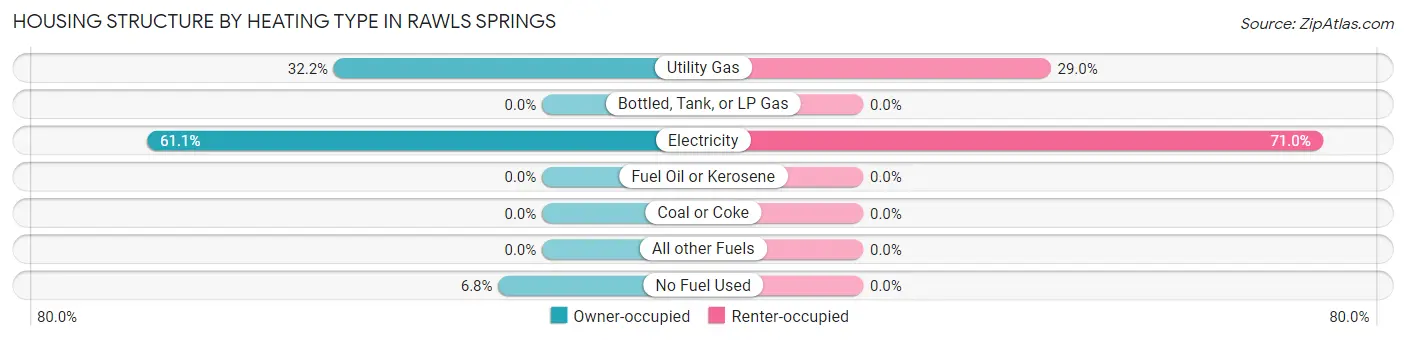
| Heating Type | Owner-occupied | Renter-occupied |
| Utility Gas | 176 (32.2%) | 51 (29.0%) |
| Bottled, Tank, or LP Gas | 0 (0.0%) | 0 (0.0%) |
| Electricity | 334 (61.1%) | 125 (71.0%) |
| Fuel Oil or Kerosene | 0 (0.0%) | 0 (0.0%) |
| Coal or Coke | 0 (0.0%) | 0 (0.0%) |
| All other Fuels | 0 (0.0%) | 0 (0.0%) |
| No Fuel Used | 37 (6.8%) | 0 (0.0%) |
| Total | 547 (100.0%) | 176 (100.0%) |
Household Vehicle Usage in Rawls Springs
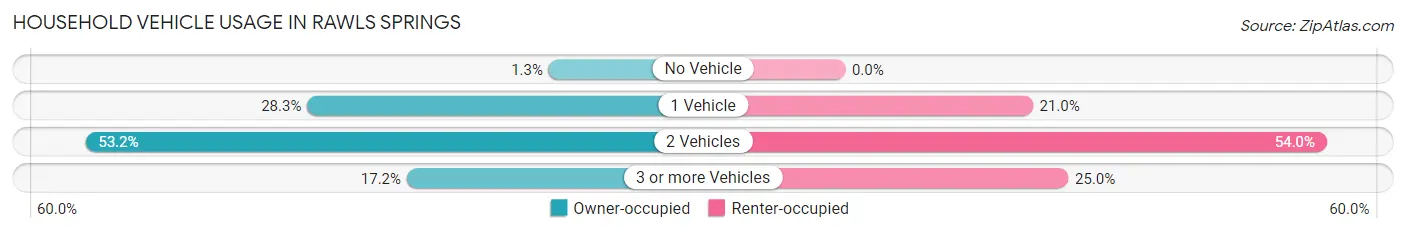
| Vehicles per Household | Owner-occupied | Renter-occupied |
| No Vehicle | 7 (1.3%) | 0 (0.0%) |
| 1 Vehicle | 155 (28.3%) | 37 (21.0%) |
| 2 Vehicles | 291 (53.2%) | 95 (54.0%) |
| 3 or more Vehicles | 94 (17.2%) | 44 (25.0%) |
| Total | 547 (100.0%) | 176 (100.0%) |
Real Estate & Mortgages in Rawls Springs
Real Estate and Mortgage Overview in Rawls Springs
| Characteristic | Without Mortgage | With Mortgage |
| Housing Units | 296 | 251 |
| Median Property Value | $82,900 | $100,700 |
| Median Household Income | $70,593 | $46 |
| Monthly Housing Costs | $370 | $17 |
| Real Estate Taxes | $314 | $82 |
Property Value by Mortgage Status in Rawls Springs
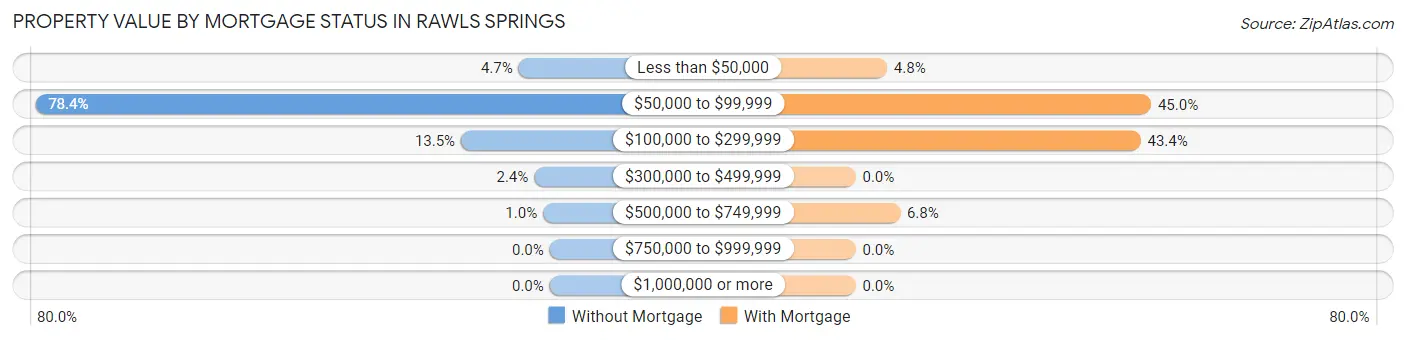
| Property Value | Without Mortgage | With Mortgage |
| Less than $50,000 | 14 (4.7%) | 12 (4.8%) |
| $50,000 to $99,999 | 232 (78.4%) | 113 (45.0%) |
| $100,000 to $299,999 | 40 (13.5%) | 109 (43.4%) |
| $300,000 to $499,999 | 7 (2.4%) | 0 (0.0%) |
| $500,000 to $749,999 | 3 (1.0%) | 17 (6.8%) |
| $750,000 to $999,999 | 0 (0.0%) | 0 (0.0%) |
| $1,000,000 or more | 0 (0.0%) | 0 (0.0%) |
| Total | 296 (100.0%) | 251 (100.0%) |
Household Income by Mortgage Status in Rawls Springs
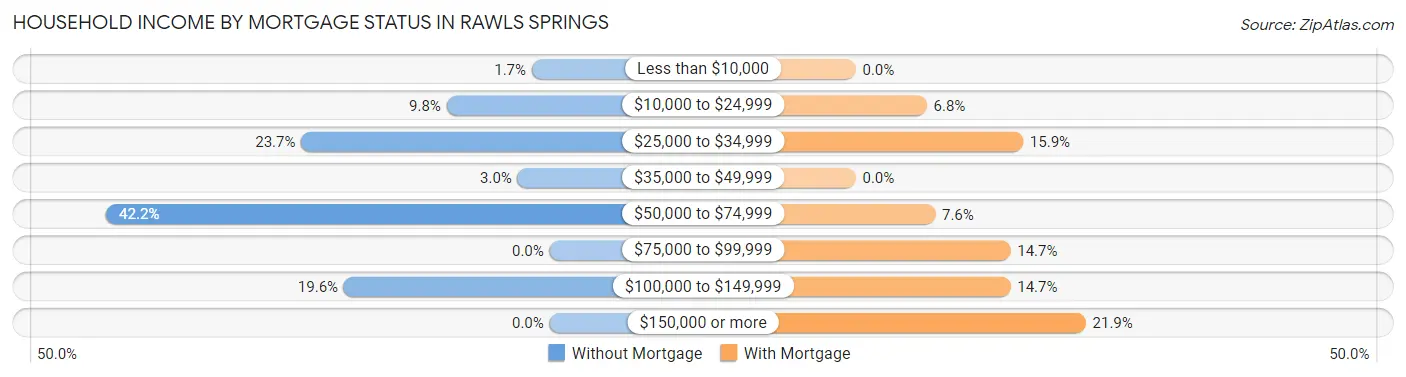
| Household Income | Without Mortgage | With Mortgage |
| Less than $10,000 | 5 (1.7%) | 0 (0.0%) |
| $10,000 to $24,999 | 29 (9.8%) | 17 (6.8%) |
| $25,000 to $34,999 | 70 (23.6%) | 40 (15.9%) |
| $35,000 to $49,999 | 9 (3.0%) | 0 (0.0%) |
| $50,000 to $74,999 | 125 (42.2%) | 19 (7.6%) |
| $75,000 to $99,999 | 0 (0.0%) | 37 (14.7%) |
| $100,000 to $149,999 | 58 (19.6%) | 37 (14.7%) |
| $150,000 or more | 0 (0.0%) | 55 (21.9%) |
| Total | 296 (100.0%) | 251 (100.0%) |
Property Value to Household Income Ratio in Rawls Springs
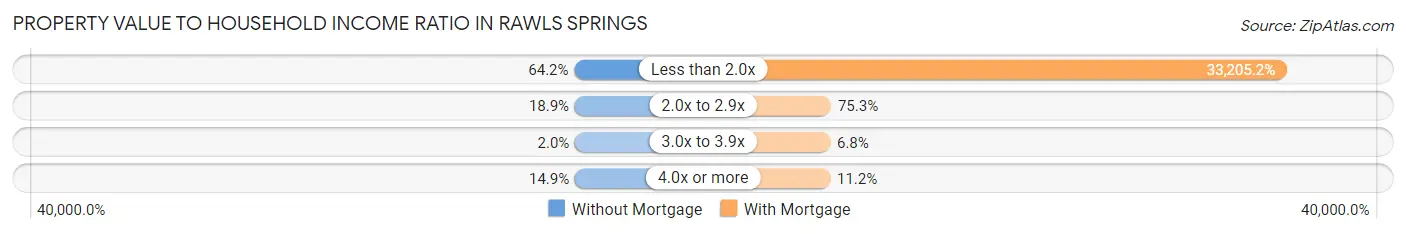
| Value-to-Income Ratio | Without Mortgage | With Mortgage |
| Less than 2.0x | 190 (64.2%) | 83,345 (33,205.2%) |
| 2.0x to 2.9x | 56 (18.9%) | 189 (75.3%) |
| 3.0x to 3.9x | 6 (2.0%) | 17 (6.8%) |
| 4.0x or more | 44 (14.9%) | 28 (11.2%) |
| Total | 296 (100.0%) | 251 (100.0%) |
Real Estate Taxes by Mortgage Status in Rawls Springs
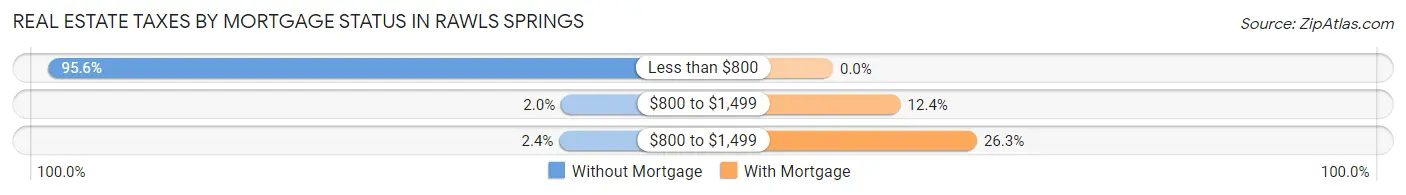
| Property Taxes | Without Mortgage | With Mortgage |
| Less than $800 | 283 (95.6%) | 0 (0.0%) |
| $800 to $1,499 | 6 (2.0%) | 31 (12.3%) |
| $800 to $1,499 | 7 (2.4%) | 66 (26.3%) |
| Total | 296 (100.0%) | 251 (100.0%) |
Health & Disability in Rawls Springs
Health Insurance Coverage by Age in Rawls Springs
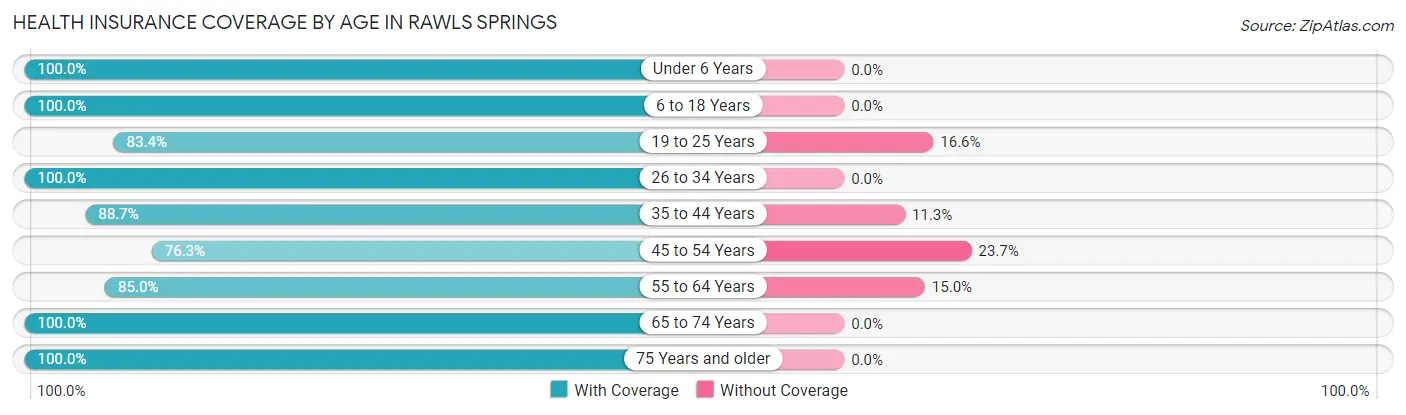
| Age Bracket | With Coverage | Without Coverage |
| Under 6 Years | 63 (100.0%) | 0 (0.0%) |
| 6 to 18 Years | 308 (100.0%) | 0 (0.0%) |
| 19 to 25 Years | 231 (83.4%) | 46 (16.6%) |
| 26 to 34 Years | 279 (100.0%) | 0 (0.0%) |
| 35 to 44 Years | 172 (88.7%) | 22 (11.3%) |
| 45 to 54 Years | 405 (76.3%) | 126 (23.7%) |
| 55 to 64 Years | 164 (85.0%) | 29 (15.0%) |
| 65 to 74 Years | 155 (100.0%) | 0 (0.0%) |
| 75 Years and older | 69 (100.0%) | 0 (0.0%) |
| Total | 1,846 (89.2%) | 223 (10.8%) |
Health Insurance Coverage by Citizenship Status in Rawls Springs
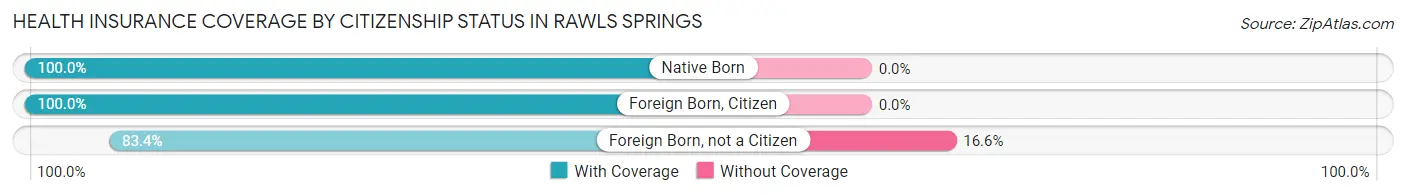
| Citizenship Status | With Coverage | Without Coverage |
| Native Born | 63 (100.0%) | 0 (0.0%) |
| Foreign Born, Citizen | 308 (100.0%) | 0 (0.0%) |
| Foreign Born, not a Citizen | 231 (83.4%) | 46 (16.6%) |
Health Insurance Coverage by Household Income in Rawls Springs
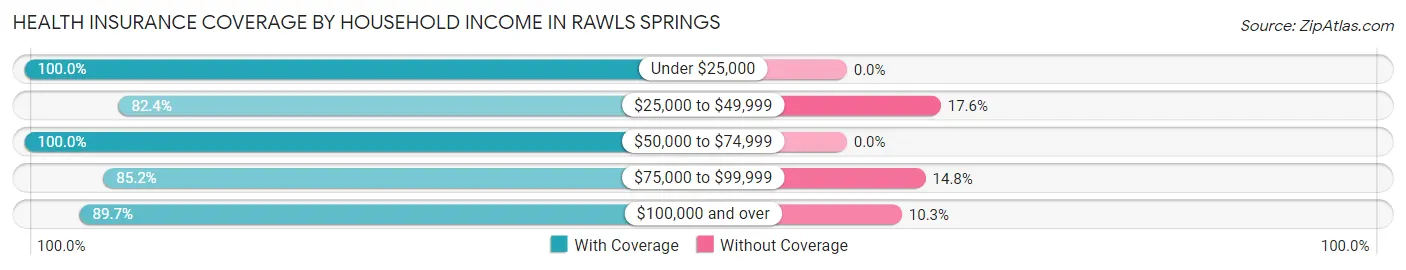
| Household Income | With Coverage | Without Coverage |
| Under $25,000 | 222 (100.0%) | 0 (0.0%) |
| $25,000 to $49,999 | 524 (82.4%) | 112 (17.6%) |
| $50,000 to $74,999 | 264 (100.0%) | 0 (0.0%) |
| $75,000 to $99,999 | 254 (85.2%) | 44 (14.8%) |
| $100,000 and over | 582 (89.7%) | 67 (10.3%) |
Public vs Private Health Insurance Coverage by Age in Rawls Springs
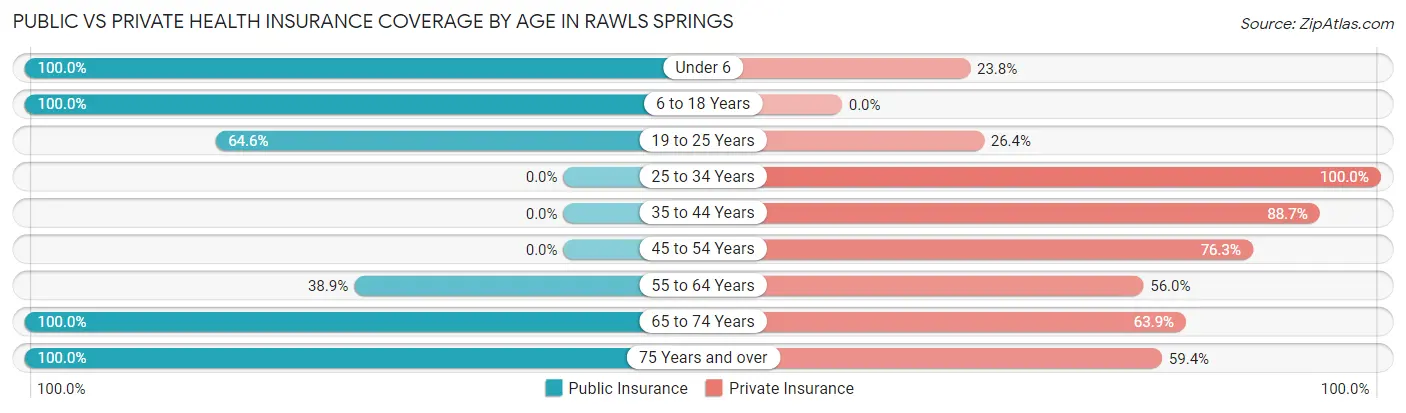
| Age Bracket | Public Insurance | Private Insurance |
| Under 6 | 63 (100.0%) | 15 (23.8%) |
| 6 to 18 Years | 308 (100.0%) | 0 (0.0%) |
| 19 to 25 Years | 179 (64.6%) | 73 (26.4%) |
| 25 to 34 Years | 0 (0.0%) | 279 (100.0%) |
| 35 to 44 Years | 0 (0.0%) | 172 (88.7%) |
| 45 to 54 Years | 0 (0.0%) | 405 (76.3%) |
| 55 to 64 Years | 75 (38.9%) | 108 (56.0%) |
| 65 to 74 Years | 155 (100.0%) | 99 (63.9%) |
| 75 Years and over | 69 (100.0%) | 41 (59.4%) |
| Total | 849 (41.0%) | 1,192 (57.6%) |
Disability Status by Sex by Age in Rawls Springs
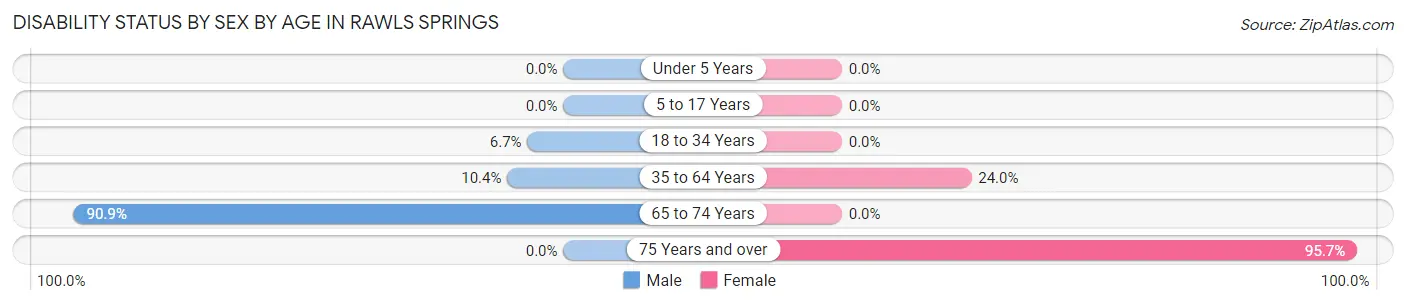
| Age Bracket | Male | Female |
| Under 5 Years | 0 (0.0%) | 0 (0.0%) |
| 5 to 17 Years | 0 (0.0%) | 0 (0.0%) |
| 18 to 34 Years | 26 (6.7%) | 0 (0.0%) |
| 35 to 64 Years | 44 (10.4%) | 119 (24.0%) |
| 65 to 74 Years | 70 (90.9%) | 0 (0.0%) |
| 75 Years and over | 0 (0.0%) | 66 (95.7%) |
Disability Class by Sex by Age in Rawls Springs
Disability Class: Hearing Difficulty
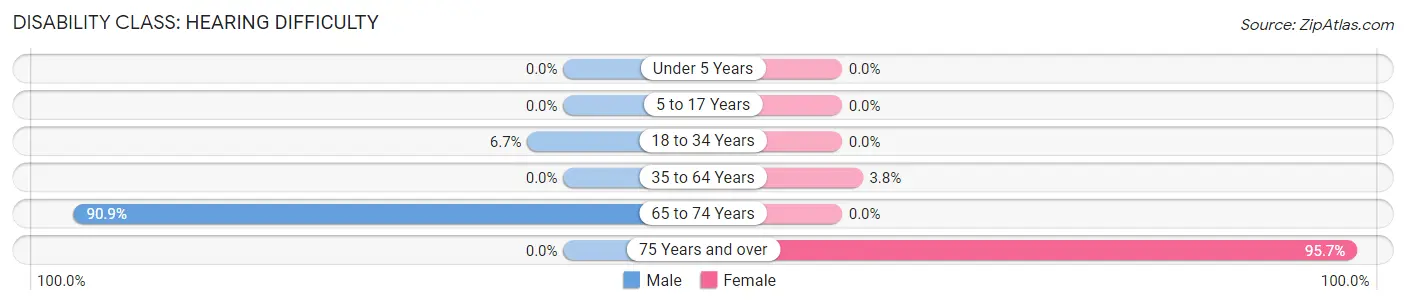
| Age Bracket | Male | Female |
| Under 5 Years | 0 (0.0%) | 0 (0.0%) |
| 5 to 17 Years | 0 (0.0%) | 0 (0.0%) |
| 18 to 34 Years | 26 (6.7%) | 0 (0.0%) |
| 35 to 64 Years | 0 (0.0%) | 19 (3.8%) |
| 65 to 74 Years | 70 (90.9%) | 0 (0.0%) |
| 75 Years and over | 0 (0.0%) | 66 (95.7%) |
Disability Class: Vision Difficulty
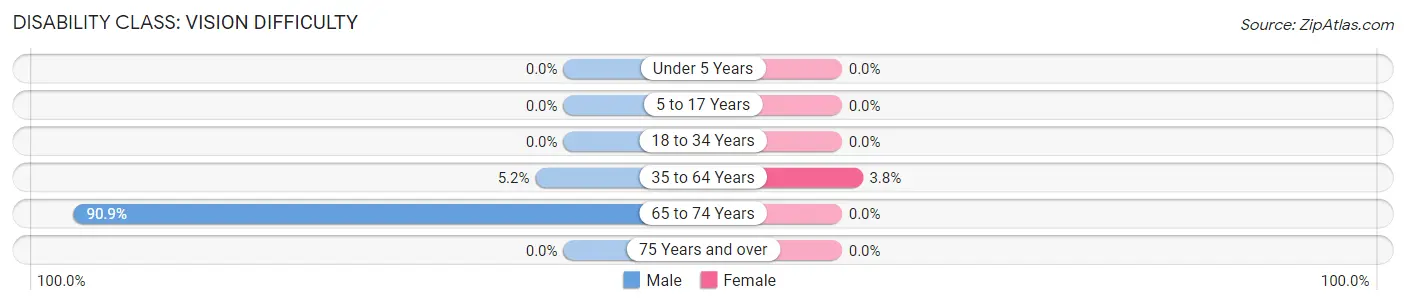
| Age Bracket | Male | Female |
| Under 5 Years | 0 (0.0%) | 0 (0.0%) |
| 5 to 17 Years | 0 (0.0%) | 0 (0.0%) |
| 18 to 34 Years | 0 (0.0%) | 0 (0.0%) |
| 35 to 64 Years | 22 (5.2%) | 19 (3.8%) |
| 65 to 74 Years | 70 (90.9%) | 0 (0.0%) |
| 75 Years and over | 0 (0.0%) | 0 (0.0%) |
Disability Class: Cognitive Difficulty
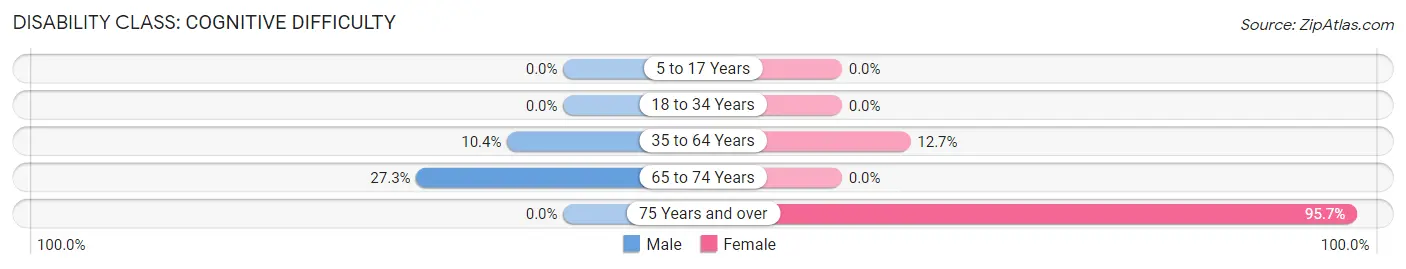
| Age Bracket | Male | Female |
| 5 to 17 Years | 0 (0.0%) | 0 (0.0%) |
| 18 to 34 Years | 0 (0.0%) | 0 (0.0%) |
| 35 to 64 Years | 44 (10.4%) | 63 (12.7%) |
| 65 to 74 Years | 21 (27.3%) | 0 (0.0%) |
| 75 Years and over | 0 (0.0%) | 66 (95.7%) |
Disability Class: Ambulatory Difficulty
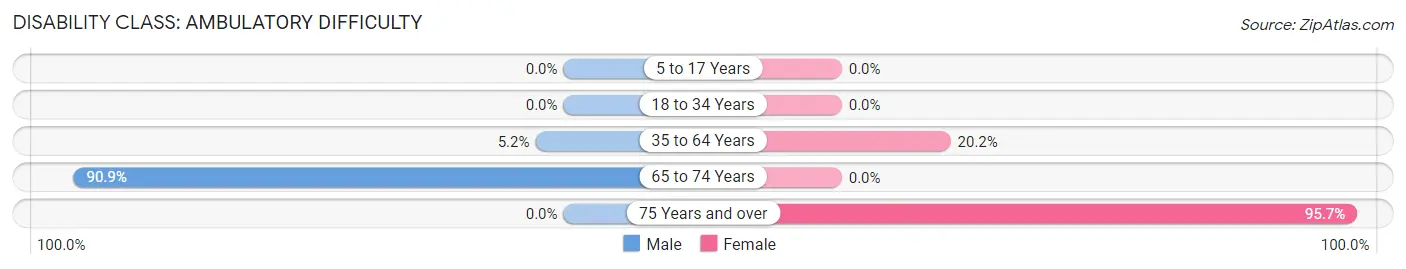
| Age Bracket | Male | Female |
| 5 to 17 Years | 0 (0.0%) | 0 (0.0%) |
| 18 to 34 Years | 0 (0.0%) | 0 (0.0%) |
| 35 to 64 Years | 22 (5.2%) | 100 (20.2%) |
| 65 to 74 Years | 70 (90.9%) | 0 (0.0%) |
| 75 Years and over | 0 (0.0%) | 66 (95.7%) |
Disability Class: Self-Care Difficulty
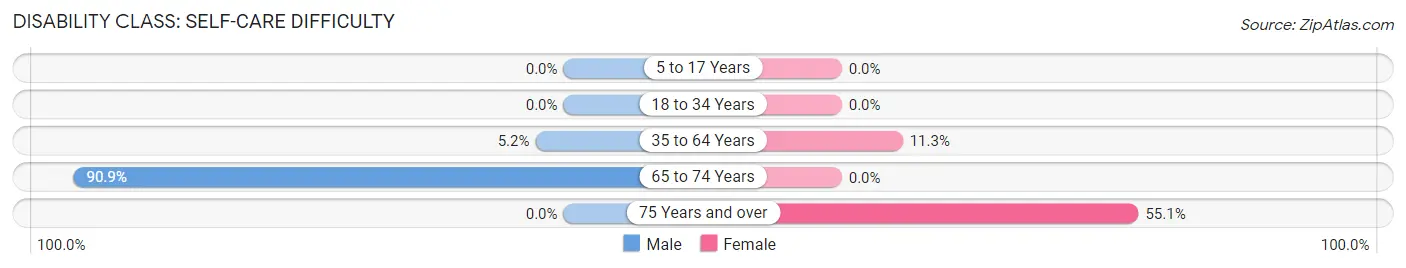
| Age Bracket | Male | Female |
| 5 to 17 Years | 0 (0.0%) | 0 (0.0%) |
| 18 to 34 Years | 0 (0.0%) | 0 (0.0%) |
| 35 to 64 Years | 22 (5.2%) | 56 (11.3%) |
| 65 to 74 Years | 70 (90.9%) | 0 (0.0%) |
| 75 Years and over | 0 (0.0%) | 38 (55.1%) |
Technology Access in Rawls Springs
Computing Device Access in Rawls Springs
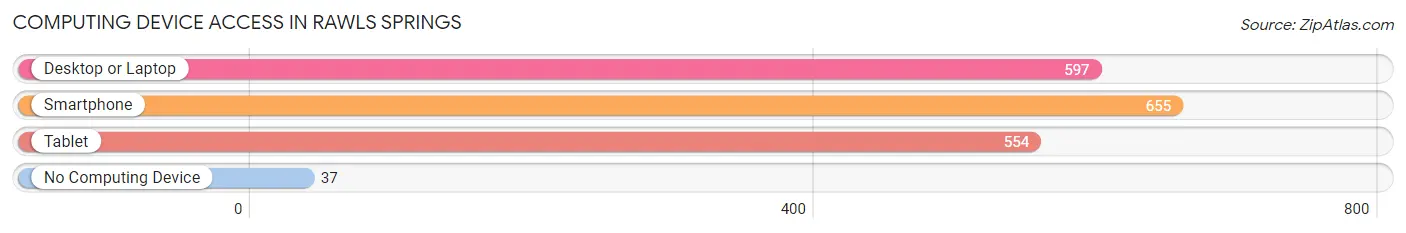
| Device Type | # Households | % Households |
| Desktop or Laptop | 597 | 82.6% |
| Smartphone | 655 | 90.6% |
| Tablet | 554 | 76.6% |
| No Computing Device | 37 | 5.1% |
| Total | 723 | 100.0% |
Internet Access in Rawls Springs
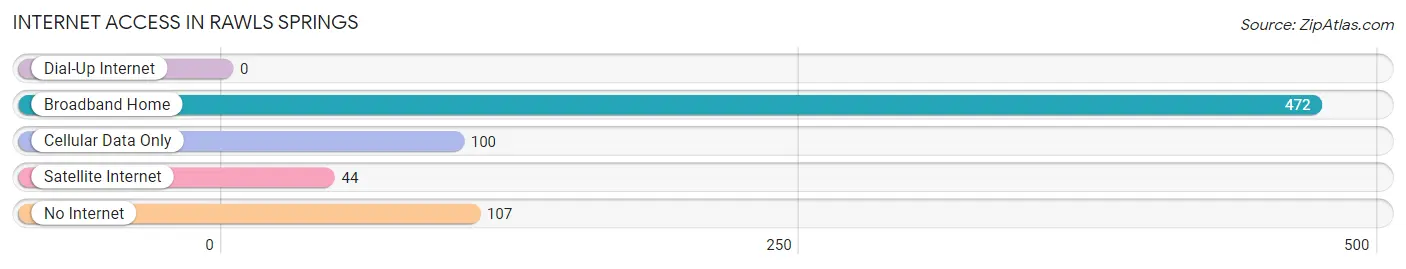
| Internet Type | # Households | % Households |
| Dial-Up Internet | 0 | 0.0% |
| Broadband Home | 472 | 65.3% |
| Cellular Data Only | 100 | 13.8% |
| Satellite Internet | 44 | 6.1% |
| No Internet | 107 | 14.8% |
| Total | 723 | 100.0% |
Rawls Springs Summary
History
Rawls Springs, Mississippi is a small unincorporated community located in Lamar County, Mississippi. It is located approximately 10 miles south of the city of Hattiesburg and is part of the Hattiesburg Metropolitan Statistical Area. The community was founded in the late 1800s by the Rawls family, who were among the first settlers in the area. The community was named after the Rawls family, who were prominent landowners in the area.
The community of Rawls Springs has a long and rich history. It was originally inhabited by the Choctaw Indians, who were the first inhabitants of the area. The Choctaw Indians were eventually forced to move out of the area due to the Indian Removal Act of 1830. After the Choctaw Indians were removed, the area was settled by European settlers, primarily from the United Kingdom. The first settlers in the area were the Rawls family, who established a homestead in the area in the late 1800s.
The Rawls family was instrumental in the development of the community. They established a general store, a post office, and a school in the area. The Rawls family also established a church in the area, which is still in operation today. The Rawls family also established a cemetery in the area, which is still in use today.
The community of Rawls Springs has remained relatively small and isolated throughout its history. It has never had a population of more than a few hundred people. The population of the community has remained relatively stable over the years, with the majority of the population being of European descent.
Geography
Rawls Springs is located in Lamar County, Mississippi. It is located approximately 10 miles south of the city of Hattiesburg and is part of the Hattiesburg Metropolitan Statistical Area. The community is situated in a rural area, surrounded by farmland and forests. The terrain of the area is mostly flat, with some rolling hills. The climate of the area is humid subtropical, with hot summers and mild winters.
The community of Rawls Springs is located near several major highways, including Interstate 59, US Highway 11, and US Highway 49. The nearest major airport is the Hattiesburg-Laurel Regional Airport, which is located approximately 20 miles away.
Economy
The economy of Rawls Springs is largely based on agriculture. The area is home to several farms, which produce a variety of crops, including corn, soybeans, cotton, and wheat. The area is also home to several timber companies, which harvest timber from the surrounding forests.
The community of Rawls Springs also has a small retail sector, with several small stores and restaurants located in the area. The nearest major shopping center is located in Hattiesburg, approximately 10 miles away.
Demographics
The population of Rawls Springs, Mississippi was estimated to be approximately 200 people in 2020. The population is primarily of European descent, with a small minority population. The median household income in the area is approximately $35,000, and the median home value is approximately $90,000. The unemployment rate in the area is approximately 5%, which is slightly lower than the national average.
Common Questions
What is Per Capita Income in Rawls Springs?
Per Capita income in Rawls Springs is $26,456.
What is the Median Family Income in Rawls Springs?
Median Family Income in Rawls Springs is $70,858.
What is the Median Household income in Rawls Springs?
Median Household Income in Rawls Springs is $58,750.
What is Income or Wage Gap in Rawls Springs?
Income or Wage Gap in Rawls Springs is 43.9%.
Women in Rawls Springs earn 56.1 cents for every dollar earned by a man.
What is Inequality or Gini Index in Rawls Springs?
Inequality or Gini Index in Rawls Springs is 0.35.
What is the Total Population of Rawls Springs?
Total Population of Rawls Springs is 2,069.
What is the Total Male Population of Rawls Springs?
Total Male Population of Rawls Springs is 1,048.
What is the Total Female Population of Rawls Springs?
Total Female Population of Rawls Springs is 1,021.
What is the Ratio of Males per 100 Females in Rawls Springs?
There are 102.64 Males per 100 Females in Rawls Springs.
What is the Ratio of Females per 100 Males in Rawls Springs?
There are 97.42 Females per 100 Males in Rawls Springs.
What is the Median Population Age in Rawls Springs?
Median Population Age in Rawls Springs is 38.8 Years.
What is the Average Family Size in Rawls Springs
Average Family Size in Rawls Springs is 3.3 People.
What is the Average Household Size in Rawls Springs
Average Household Size in Rawls Springs is 2.9 People.
How Large is the Labor Force in Rawls Springs?
There are 1,231 People in the Labor Forcein in Rawls Springs.
What is the Percentage of People in the Labor Force in Rawls Springs?
70.0% of People are in the Labor Force in Rawls Springs.
What is the Unemployment Rate in Rawls Springs?
Unemployment Rate in Rawls Springs is 5.4%.