La Parguera, PR Map & Demographics
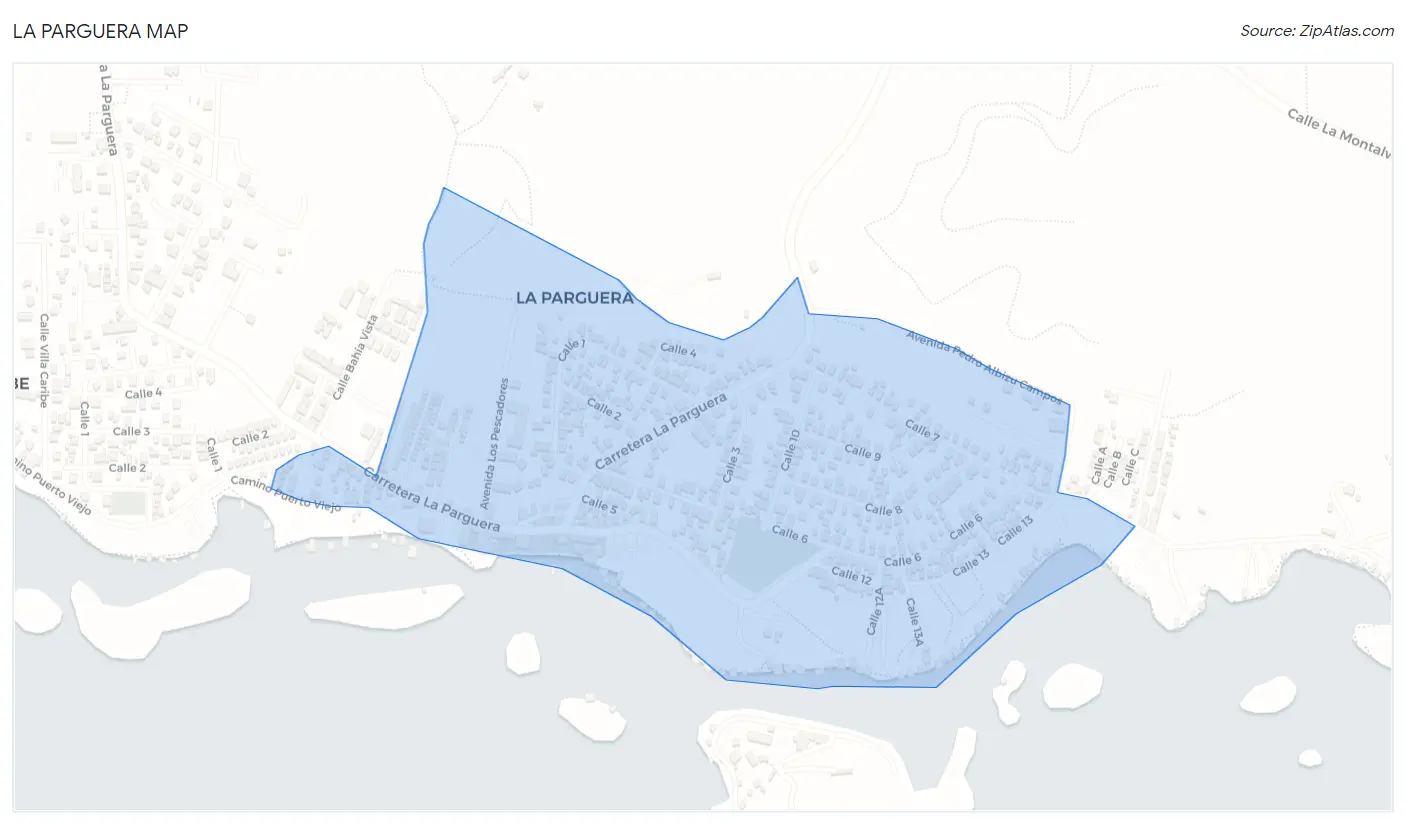
La Parguera Map
La Parguera Overview
$6,339
PER CAPITA INCOME
0.57
INEQUALITY / GINI INDEX
1,577
TOTAL POPULATION
861
MALE POPULATION
716
FEMALE POPULATION
120.25
MALES / 100 FEMALES
83.16
FEMALES / 100 MALES
42.5
MEDIAN AGE
4.8
AVG FAMILY SIZE
3.7
AVG HOUSEHOLD SIZE
262
LABOR FORCE [ PEOPLE ]
21.8%
PERCENT IN LABOR FORCE
32.4%
UNEMPLOYMENT RATE
Income in La Parguera
Income Overview in La Parguera
| Characteristic | Number | Measure |
| Per Capita Income | 1,577 | $6,339 |
| Median Family Income | 303 | $0 |
| Mean Family Income | 303 | $21,354 |
| Median Household Income | 426 | $0 |
| Mean Household Income | 426 | $18,575 |
| Income Deficit | 303 | $0 |
| Wage / Income Gap (%) | 1,577 | 0.00% |
| Wage / Income Gap ($) | 1,577 | 100.00¢ per $1 |
| Gini / Inequality Index | 1,577 | 0.57 |
Earnings by Sex in La Parguera
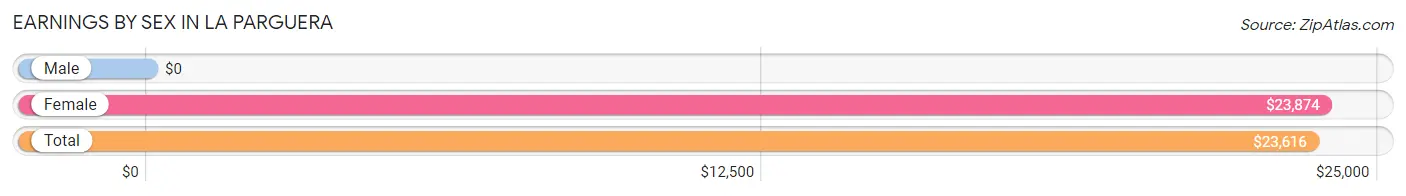
| Sex | Number | Average Earnings |
| Male | 73 (29.7%) | $0 |
| Female | 173 (70.3%) | $23,874 |
| Total | 246 (100.0%) | $23,616 |
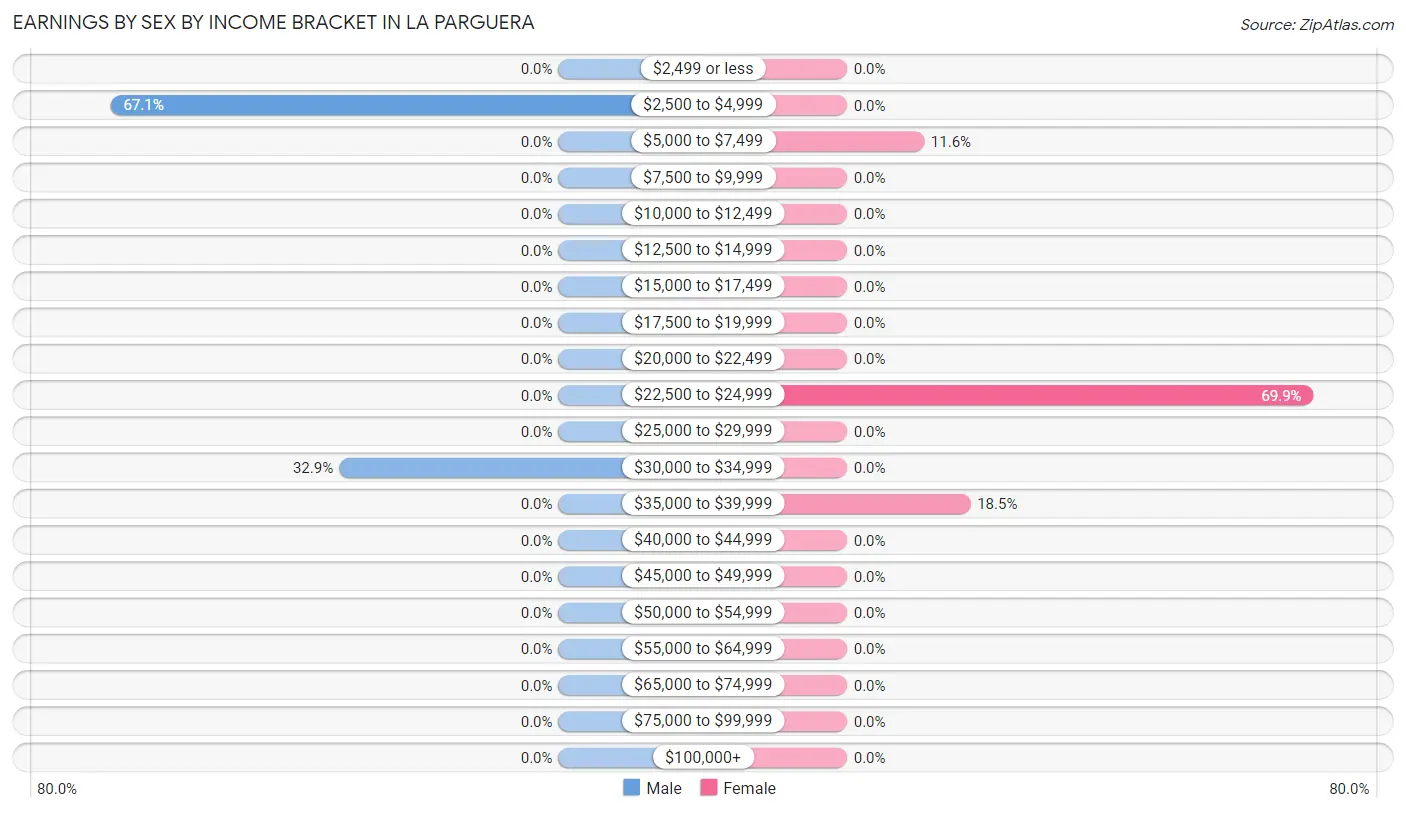
Earnings by Sex by Income Bracket in La Parguera
The most common earnings brackets in La Parguera are $2,500 to $4,999 for men (49 | 67.1%) and $22,500 to $24,999 for women (121 | 69.9%).
| Income | Male | Female |
| $2,499 or less | 0 (0.0%) | 0 (0.0%) |
| $2,500 to $4,999 | 49 (67.1%) | 0 (0.0%) |
| $5,000 to $7,499 | 0 (0.0%) | 20 (11.6%) |
| $7,500 to $9,999 | 0 (0.0%) | 0 (0.0%) |
| $10,000 to $12,499 | 0 (0.0%) | 0 (0.0%) |
| $12,500 to $14,999 | 0 (0.0%) | 0 (0.0%) |
| $15,000 to $17,499 | 0 (0.0%) | 0 (0.0%) |
| $17,500 to $19,999 | 0 (0.0%) | 0 (0.0%) |
| $20,000 to $22,499 | 0 (0.0%) | 0 (0.0%) |
| $22,500 to $24,999 | 0 (0.0%) | 121 (69.9%) |
| $25,000 to $29,999 | 0 (0.0%) | 0 (0.0%) |
| $30,000 to $34,999 | 24 (32.9%) | 0 (0.0%) |
| $35,000 to $39,999 | 0 (0.0%) | 32 (18.5%) |
| $40,000 to $44,999 | 0 (0.0%) | 0 (0.0%) |
| $45,000 to $49,999 | 0 (0.0%) | 0 (0.0%) |
| $50,000 to $54,999 | 0 (0.0%) | 0 (0.0%) |
| $55,000 to $64,999 | 0 (0.0%) | 0 (0.0%) |
| $65,000 to $74,999 | 0 (0.0%) | 0 (0.0%) |
| $75,000 to $99,999 | 0 (0.0%) | 0 (0.0%) |
| $100,000+ | 0 (0.0%) | 0 (0.0%) |
| Total | 73 (100.0%) | 173 (100.0%) |
Earnings by Sex by Educational Attainment in La Parguera
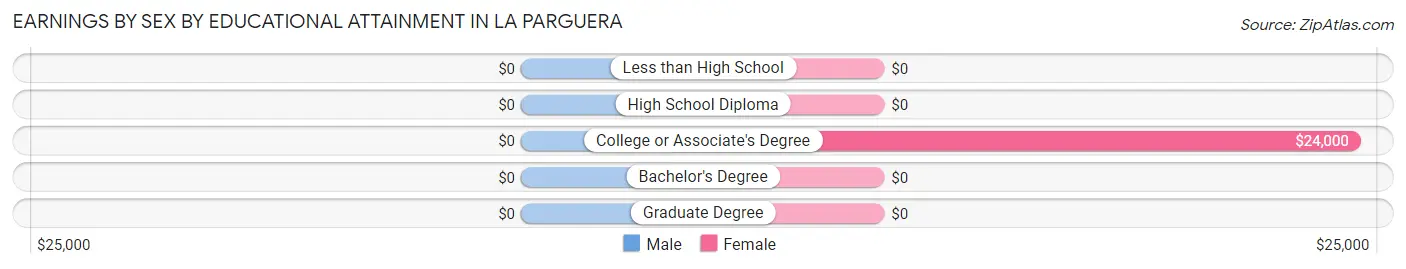
| Educational Attainment | Male Income | Female Income |
| Less than High School | - | - |
| High School Diploma | - | - |
| College or Associate's Degree | - | - |
| Bachelor's Degree | - | - |
| Graduate Degree | - | - |
| Total | - | - |
Family Income in La Parguera
Family Income Brackets in La Parguera
According to the La Parguera family income data, there are 123 families falling into the less than $10,000 income range, which is the most common income bracket and makes up 40.6% of all families.
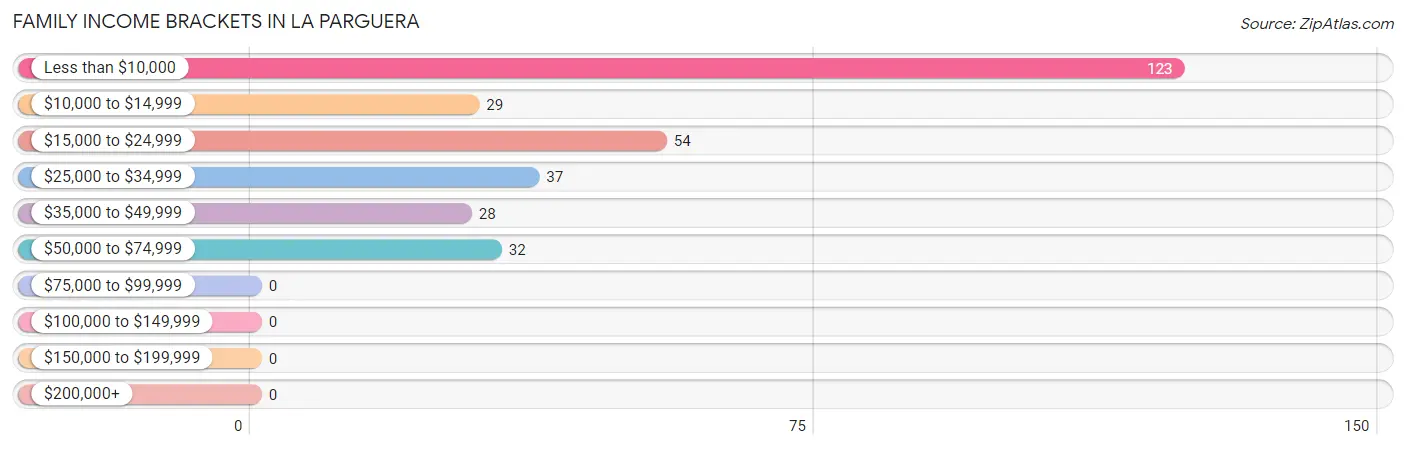
| Income Bracket | # Families | % Families |
| Less than $10,000 | 123 | 40.6% |
| $10,000 to $14,999 | 29 | 9.6% |
| $15,000 to $24,999 | 54 | 17.8% |
| $25,000 to $34,999 | 37 | 12.2% |
| $35,000 to $49,999 | 28 | 9.2% |
| $50,000 to $74,999 | 32 | 10.6% |
| $75,000 to $99,999 | 0 | 0.0% |
| $100,000 to $149,999 | 0 | 0.0% |
| $150,000 to $199,999 | 0 | 0.0% |
| $200,000+ | 0 | 0.0% |
Family Income by Famaliy Size in La Parguera
2-person families (81 | 26.7%) account for the highest median family income in La Parguera with $25,662 per family, while 2-person families (81 | 26.7%) have the highest median income of $12,831 per family member.
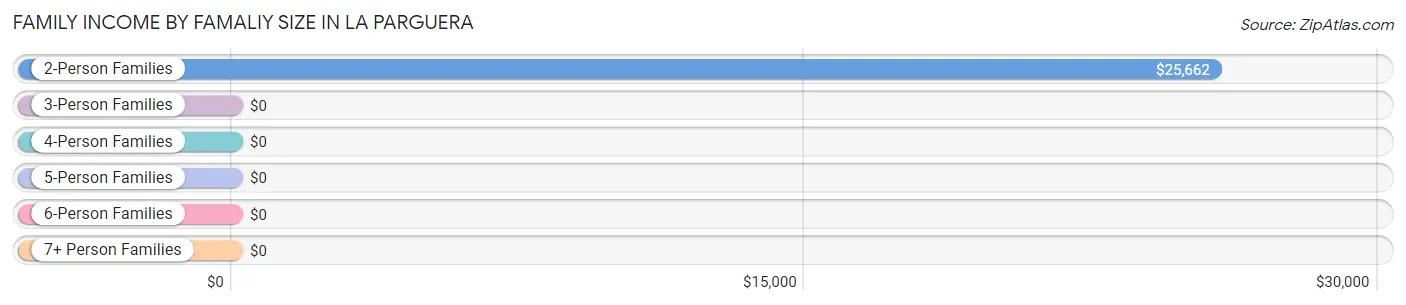
| Income Bracket | # Families | Median Income |
| 2-Person Families | 81 (26.7%) | $25,662 |
| 3-Person Families | 118 (38.9%) | $0 |
| 4-Person Families | 49 (16.2%) | $0 |
| 5-Person Families | 55 (18.1%) | $0 |
| 6-Person Families | 0 (0.0%) | $0 |
| 7+ Person Families | 0 (0.0%) | $0 |
| Total | 303 (100.0%) | $0 |
Family Income by Number of Earners in La Parguera
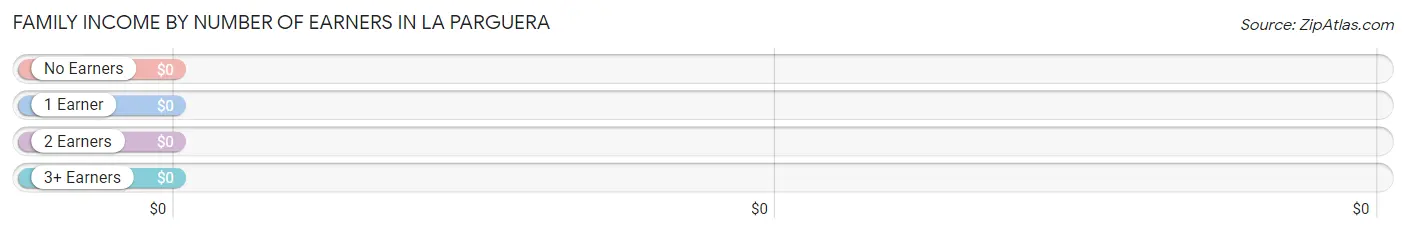
| Number of Earners | # Families | Median Income |
| No Earners | 233 (76.9%) | $0 |
| 1 Earner | 18 (5.9%) | $0 |
| 2 Earners | 52 (17.2%) | $0 |
| 3+ Earners | 0 (0.0%) | $0 |
| Total | 303 (100.0%) | $0 |
Household Income in La Parguera
Household Income Brackets in La Parguera
With 217 households falling in the category, the less than $10,000 income range is the most frequent in La Parguera, accounting for 50.9% of all households.
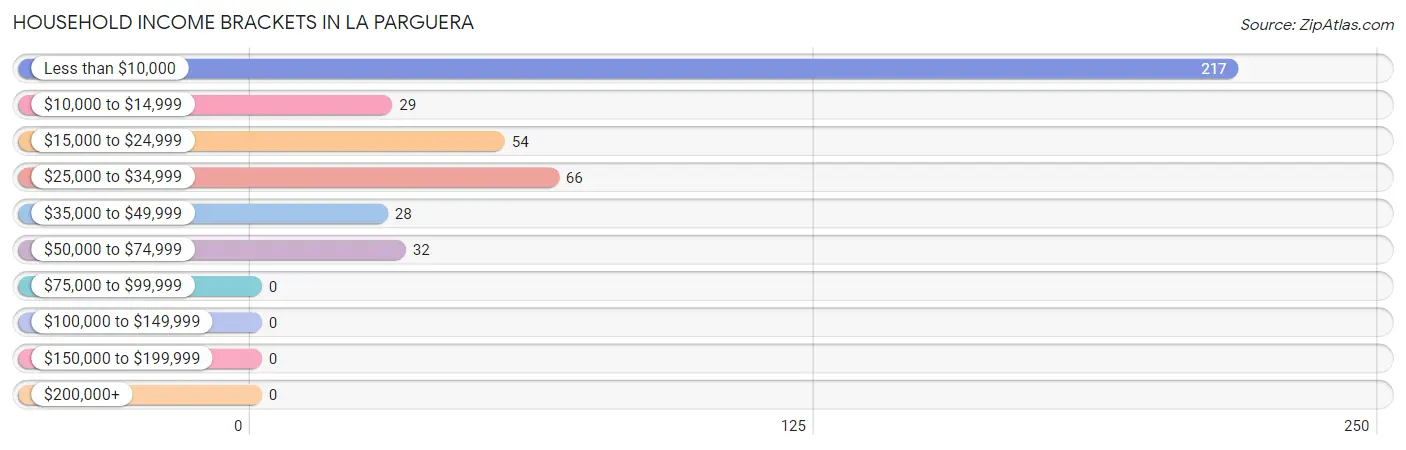
| Income Bracket | # Households | % Households |
| Less than $10,000 | 217 | 50.9% |
| $10,000 to $14,999 | 29 | 6.8% |
| $15,000 to $24,999 | 54 | 12.7% |
| $25,000 to $34,999 | 66 | 15.5% |
| $35,000 to $49,999 | 28 | 6.6% |
| $50,000 to $74,999 | 32 | 7.5% |
| $75,000 to $99,999 | 0 | 0.0% |
| $100,000 to $149,999 | 0 | 0.0% |
| $150,000 to $199,999 | 0 | 0.0% |
| $200,000+ | 0 | 0.0% |
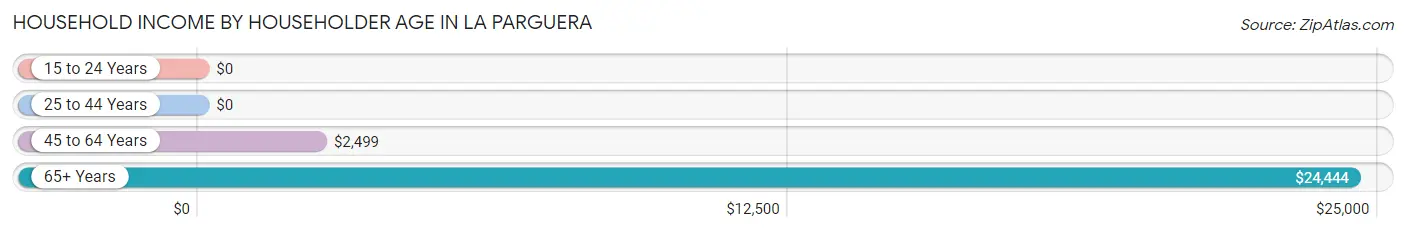
Household Income by Householder Age in La Parguera
The median household income in La Parguera is $0, with the highest median household income of $24,444 found in the 65+ years age bracket for the primary householder. A total of 204 households (47.9%) fall into this category.
| Income Bracket | # Households | Median Income |
| 15 to 24 Years | 0 (0.0%) | $0 |
| 25 to 44 Years | 130 (30.5%) | $0 |
| 45 to 64 Years | 92 (21.6%) | $2,499 |
| 65+ Years | 204 (47.9%) | $24,444 |
| Total | 426 (100.0%) | $0 |
Poverty in La Parguera
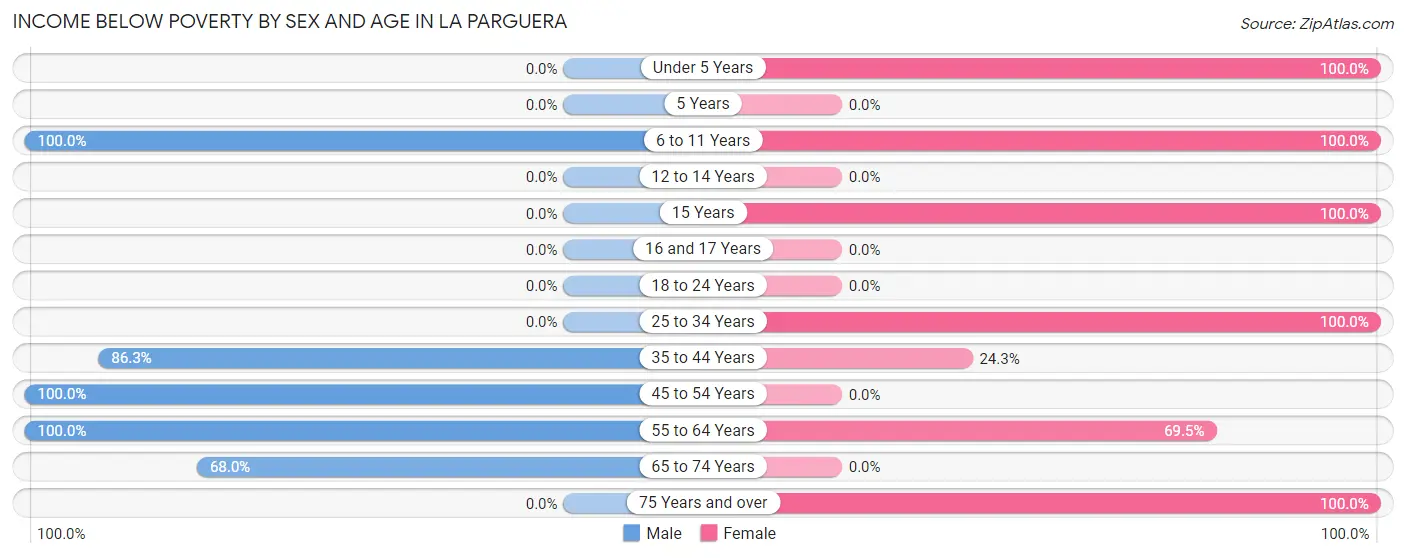
Income Below Poverty by Sex and Age in La Parguera
With 77.5% poverty level for males and 50.6% for females among the residents of La Parguera, 6 to 11 year old males and under 5 year old females are the most vulnerable to poverty, with 155 males (100.0%) and 25 females (100.0%) in their respective age groups living below the poverty level.
| Age Bracket | Male | Female |
| Under 5 Years | 0 (0.0%) | 25 (100.0%) |
| 5 Years | 0 (0.0%) | 0 (0.0%) |
| 6 to 11 Years | 155 (100.0%) | 37 (100.0%) |
| 12 to 14 Years | 0 (0.0%) | 0 (0.0%) |
| 15 Years | 0 (0.0%) | 60 (100.0%) |
| 16 and 17 Years | 0 (0.0%) | 0 (0.0%) |
| 18 to 24 Years | 0 (0.0%) | 0 (0.0%) |
| 25 to 34 Years | 0 (0.0%) | 105 (100.0%) |
| 35 to 44 Years | 151 (86.3%) | 49 (24.3%) |
| 45 to 54 Years | 182 (100.0%) | 0 (0.0%) |
| 55 to 64 Years | 94 (100.0%) | 41 (69.5%) |
| 65 to 74 Years | 85 (68.0%) | 0 (0.0%) |
| 75 Years and over | 0 (0.0%) | 45 (100.0%) |
| Total | 667 (77.5%) | 362 (50.6%) |
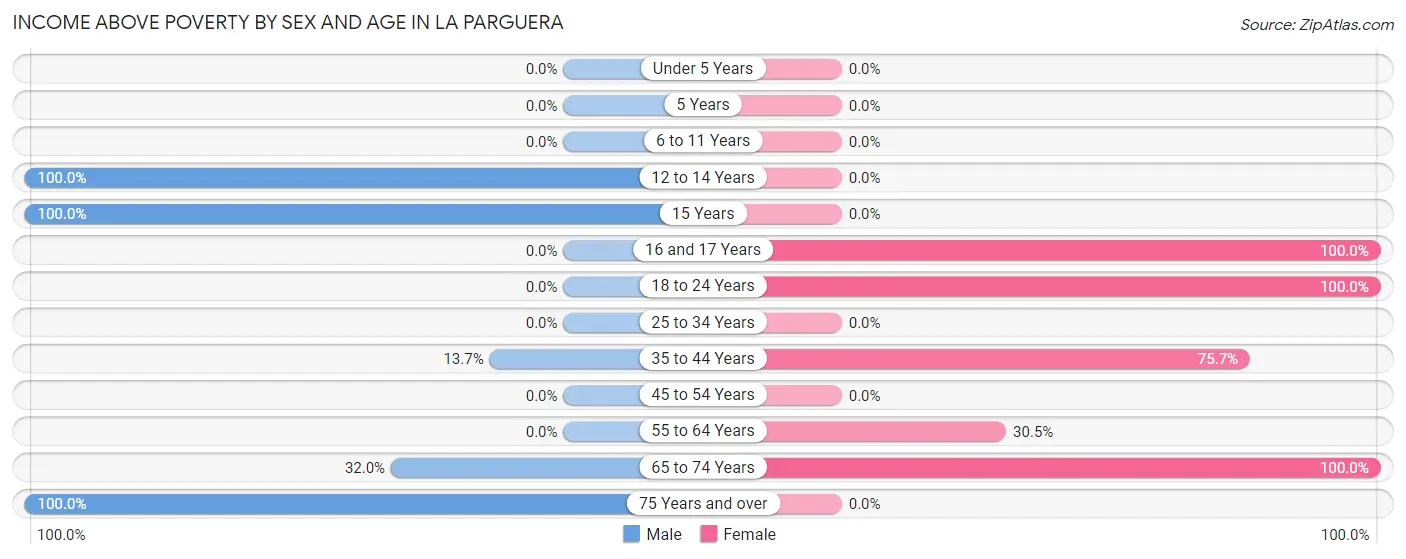
Income Above Poverty by Sex and Age in La Parguera
According to the poverty statistics in La Parguera, males aged 12 to 14 years and females aged 16 and 17 years are the age groups that are most secure financially, with 100.0% of males and 100.0% of females in these age groups living above the poverty line.
| Age Bracket | Male | Female |
| Under 5 Years | 0 (0.0%) | 0 (0.0%) |
| 5 Years | 0 (0.0%) | 0 (0.0%) |
| 6 to 11 Years | 0 (0.0%) | 0 (0.0%) |
| 12 to 14 Years | 35 (100.0%) | 0 (0.0%) |
| 15 Years | 61 (100.0%) | 0 (0.0%) |
| 16 and 17 Years | 0 (0.0%) | 32 (100.0%) |
| 18 to 24 Years | 0 (0.0%) | 18 (100.0%) |
| 25 to 34 Years | 0 (0.0%) | 0 (0.0%) |
| 35 to 44 Years | 24 (13.7%) | 153 (75.7%) |
| 45 to 54 Years | 0 (0.0%) | 0 (0.0%) |
| 55 to 64 Years | 0 (0.0%) | 18 (30.5%) |
| 65 to 74 Years | 40 (32.0%) | 133 (100.0%) |
| 75 Years and over | 34 (100.0%) | 0 (0.0%) |
| Total | 194 (22.5%) | 354 (49.4%) |
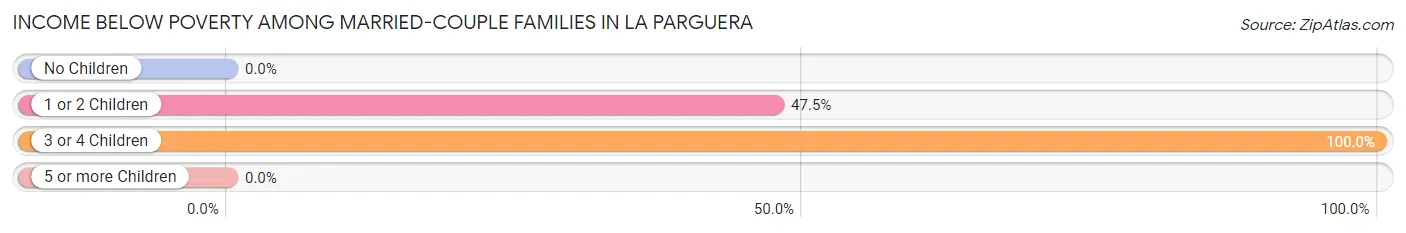
Income Below Poverty Among Married-Couple Families in La Parguera
The poverty statistics for married-couple families in La Parguera show that 47.8% or 55 of the total 115 families live below the poverty line. Families with 3 or 4 children have the highest poverty rate of 100.0%, comprising of 26 families. On the other hand, families with no children have the lowest poverty rate of 0.0%, which includes 0 families.
| Children | Above Poverty | Below Poverty |
| No Children | 28 (100.0%) | 0 (0.0%) |
| 1 or 2 Children | 32 (52.5%) | 29 (47.5%) |
| 3 or 4 Children | 0 (0.0%) | 26 (100.0%) |
| 5 or more Children | 0 (0.0%) | 0 (0.0%) |
| Total | 60 (52.2%) | 55 (47.8%) |
Income Below Poverty Among Single-Parent Households in La Parguera
According to the poverty data in La Parguera, 73.9% or 48 single-father households and 39.8% or 49 single-mother households are living below the poverty line. Among single-father households, those with no children have the highest poverty rate, with 48 households (73.9%) experiencing poverty. Likewise, among single-mother households, those with 1 or 2 children have the highest poverty rate, with 49 households (47.6%) falling below the poverty line.
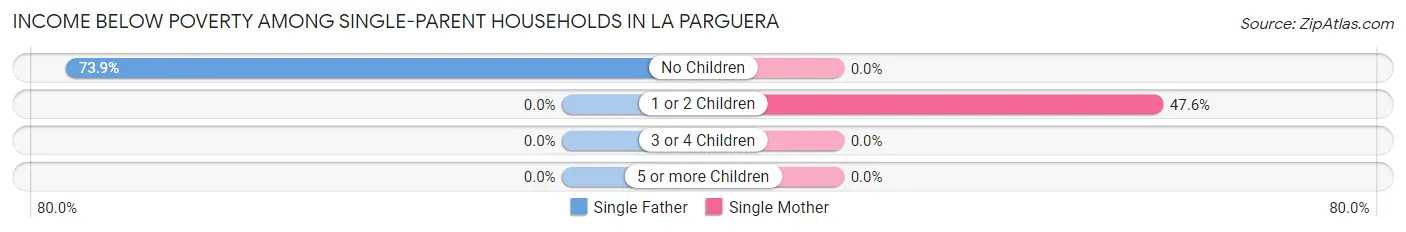
| Children | Single Father | Single Mother |
| No Children | 48 (73.9%) | 0 (0.0%) |
| 1 or 2 Children | 0 (0.0%) | 49 (47.6%) |
| 3 or 4 Children | 0 (0.0%) | 0 (0.0%) |
| 5 or more Children | 0 (0.0%) | 0 (0.0%) |
| Total | 48 (73.9%) | 49 (39.8%) |
Income Below Poverty Among Married-Couple vs Single-Parent Households in La Parguera
The poverty data for La Parguera shows that 55 of the married-couple family households (47.8%) and 97 of the single-parent households (51.6%) are living below the poverty level. Within the married-couple family households, those with 3 or 4 children have the highest poverty rate, with 26 households (100.0%) falling below the poverty line. Among the single-parent households, those with no children have the highest poverty rate, with 48 household (56.5%) living below poverty.
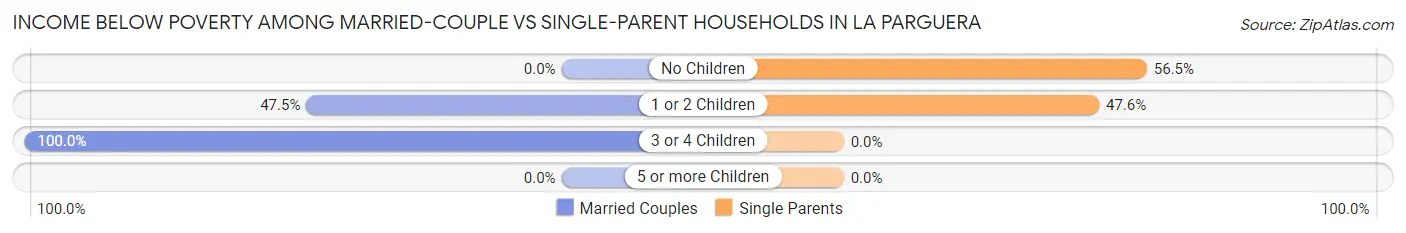
| Children | Married-Couple Families | Single-Parent Households |
| No Children | 0 (0.0%) | 48 (56.5%) |
| 1 or 2 Children | 29 (47.5%) | 49 (47.6%) |
| 3 or 4 Children | 26 (100.0%) | 0 (0.0%) |
| 5 or more Children | 0 (0.0%) | 0 (0.0%) |
| Total | 55 (47.8%) | 97 (51.6%) |
Race in La Parguera
The most populous races in La Parguera are Hispanic or Latino (1,577 | 100.0%), Some other Race (782 | 49.6%), and White / Caucasian (405 | 25.7%).
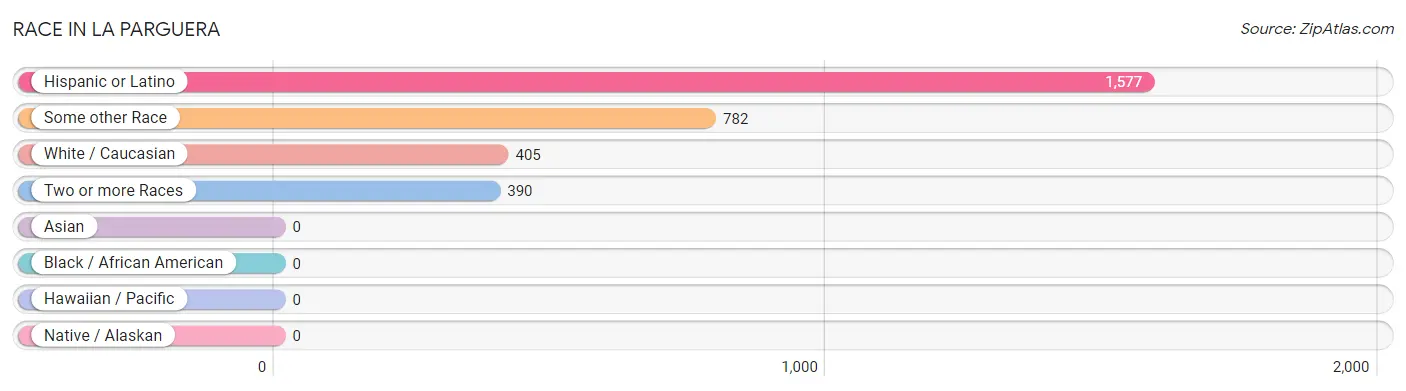
| Race | # Population | % Population |
| Asian | 0 | 0.0% |
| Black / African American | 0 | 0.0% |
| Hawaiian / Pacific | 0 | 0.0% |
| Hispanic or Latino | 1,577 | 100.0% |
| Native / Alaskan | 0 | 0.0% |
| White / Caucasian | 405 | 25.7% |
| Two or more Races | 390 | 24.7% |
| Some other Race | 782 | 49.6% |
| Total | 1,577 | 100.0% |
Ancestry in La Parguera
The most populous ancestries reported in La Parguera are Puerto Rican (1,577 | 100.0%), and West Indian (12 | 0.8%), together accounting for 100.8% of all La Parguera residents.
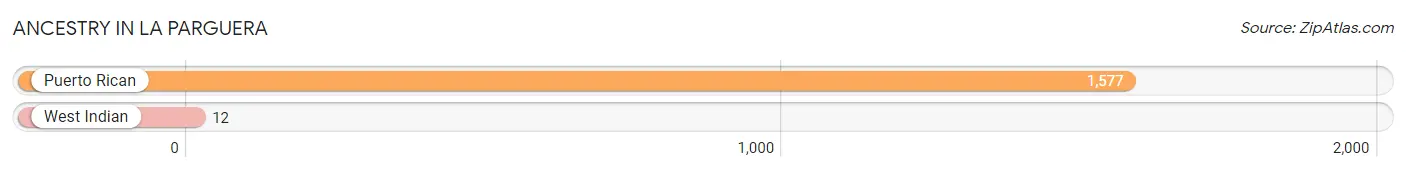
| Ancestry | # Population | % Population |
| Puerto Rican | 1,577 | 100.0% |
| West Indian | 12 | 0.8% | View All 2 Rows |
Immigrants in La Parguera

| Immigration Origin | # Population | % Population | View All 0 Rows |
Sex and Age in La Parguera
Sex and Age in La Parguera
The most populous age groups in La Parguera are 45 to 49 Years (182 | 21.1%) for men and 40 to 44 Years (142 | 19.8%) for women.
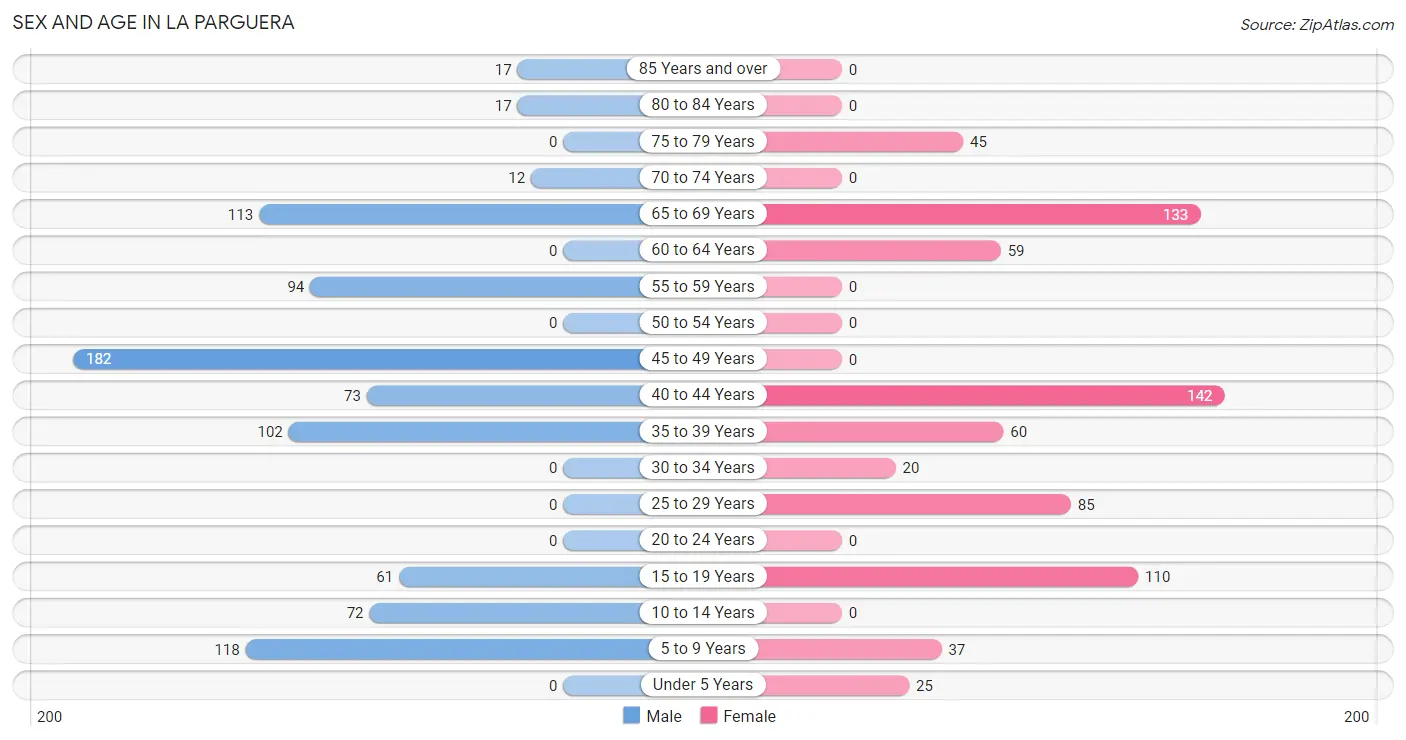
| Age Bracket | Male | Female |
| Under 5 Years | 0 (0.0%) | 25 (3.5%) |
| 5 to 9 Years | 118 (13.7%) | 37 (5.2%) |
| 10 to 14 Years | 72 (8.4%) | 0 (0.0%) |
| 15 to 19 Years | 61 (7.1%) | 110 (15.4%) |
| 20 to 24 Years | 0 (0.0%) | 0 (0.0%) |
| 25 to 29 Years | 0 (0.0%) | 85 (11.9%) |
| 30 to 34 Years | 0 (0.0%) | 20 (2.8%) |
| 35 to 39 Years | 102 (11.8%) | 60 (8.4%) |
| 40 to 44 Years | 73 (8.5%) | 142 (19.8%) |
| 45 to 49 Years | 182 (21.1%) | 0 (0.0%) |
| 50 to 54 Years | 0 (0.0%) | 0 (0.0%) |
| 55 to 59 Years | 94 (10.9%) | 0 (0.0%) |
| 60 to 64 Years | 0 (0.0%) | 59 (8.2%) |
| 65 to 69 Years | 113 (13.1%) | 133 (18.6%) |
| 70 to 74 Years | 12 (1.4%) | 0 (0.0%) |
| 75 to 79 Years | 0 (0.0%) | 45 (6.3%) |
| 80 to 84 Years | 17 (2.0%) | 0 (0.0%) |
| 85 Years and over | 17 (2.0%) | 0 (0.0%) |
| Total | 861 (100.0%) | 716 (100.0%) |
Families and Households in La Parguera
Median Family Size in La Parguera
The median family size in La Parguera is 4.80 persons per family, with married-couple families (115 | 38.0%) accounting for the largest median family size of 5.46 persons per family. On the other hand, single female/mother families (123 | 40.6%) represent the smallest median family size with 4.26 persons per family.
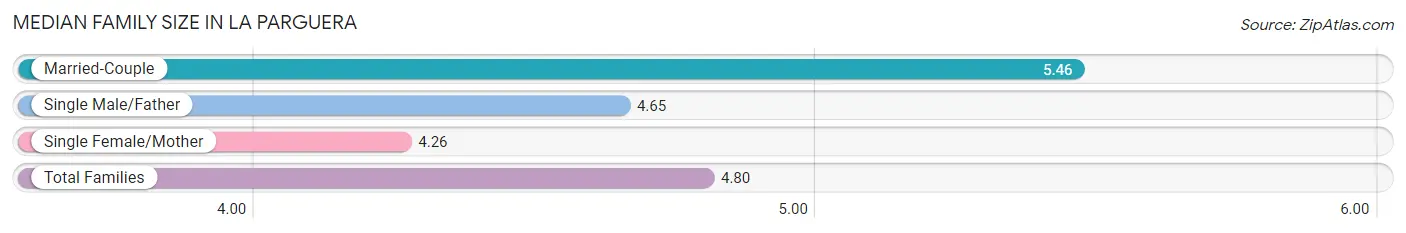
| Family Type | # Families | Family Size |
| Married-Couple | 115 (38.0%) | 5.46 |
| Single Male/Father | 65 (21.4%) | 4.65 |
| Single Female/Mother | 123 (40.6%) | 4.26 |
| Total Families | 303 (100.0%) | 4.80 |
Median Household Size in La Parguera
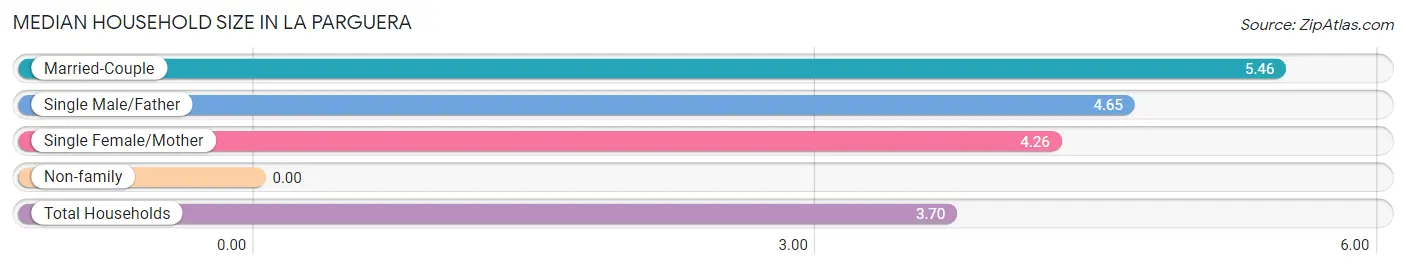
| Household Type | # Households | Household Size |
| Married-Couple | 115 (27.0%) | 5.46 |
| Single Male/Father | 65 (15.3%) | 4.65 |
| Single Female/Mother | 123 (28.9%) | 4.26 |
| Non-family | 123 (28.9%) | - |
| Total Households | 426 (100.0%) | 3.70 |
Household Size by Marriage Status in La Parguera
Out of a total of 426 households in La Parguera, 303 (71.1%) are family households, while 123 (28.9%) are nonfamily households. The most numerous type of family households are 3-person households, comprising 118, and the most common type of nonfamily households are 1-person households, comprising 123.
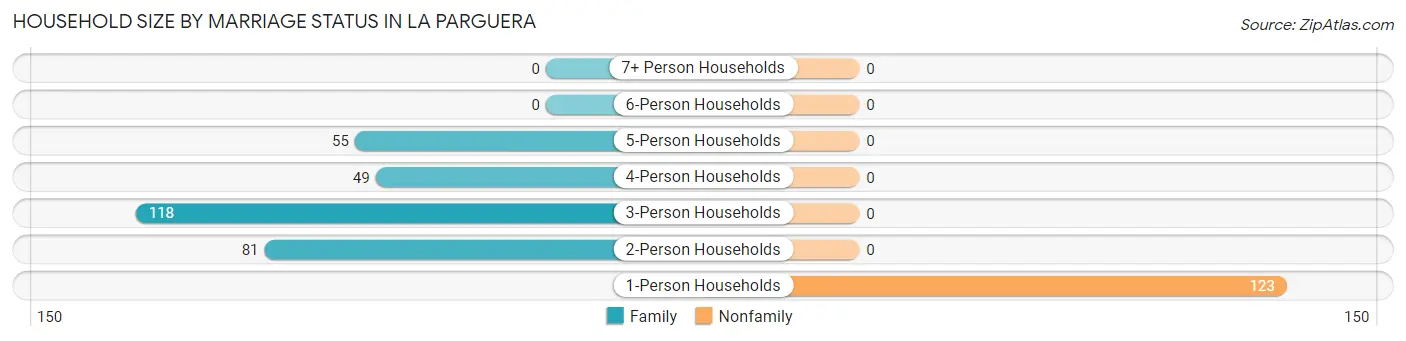
| Household Size | Family Households | Nonfamily Households |
| 1-Person Households | - | 123 (28.9%) |
| 2-Person Households | 81 (19.0%) | 0 (0.0%) |
| 3-Person Households | 118 (27.7%) | 0 (0.0%) |
| 4-Person Households | 49 (11.5%) | 0 (0.0%) |
| 5-Person Households | 55 (12.9%) | 0 (0.0%) |
| 6-Person Households | 0 (0.0%) | 0 (0.0%) |
| 7+ Person Households | 0 (0.0%) | 0 (0.0%) |
| Total | 303 (71.1%) | 123 (28.9%) |
Female Fertility in La Parguera
Fertility by Age in La Parguera
| Age Bracket | Women with Births | Births / 1,000 Women |
| 15 to 19 years | 0 (0.0%) | 0.0 |
| 20 to 34 years | 0 (0.0%) | 0.0 |
| 35 to 50 years | 0 (0.0%) | 0.0 |
| Total | 0 (0.0%) | 0.0 |
Fertility by Age by Marriage Status in La Parguera
| Age Bracket | Married | Unmarried |
| 15 to 19 years | 0 (0.0%) | 0 (0.0%) |
| 20 to 34 years | 0 (0.0%) | 0 (0.0%) |
| 35 to 50 years | 0 (0.0%) | 0 (0.0%) |
| Total | 0 (0.0%) | 0 (0.0%) |
Fertility by Education in La Parguera
| Educational Attainment | Women with Births | Births / 1,000 Women |
| Less than High School | 0 (0.0%) | 0.0 |
| High School Diploma | 0 (0.0%) | 0.0 |
| College or Associate's Degree | 0 (0.0%) | 0.0 |
| Bachelor's Degree | 0 (0.0%) | 0.0 |
| Graduate Degree | 0 (0.0%) | 0.0 |
| Total | 0 (0.0%) | 0.0 |
Fertility by Education by Marriage Status in La Parguera
| Educational Attainment | Married | Unmarried |
| Less than High School | 0 (0.0%) | 0 (0.0%) |
| High School Diploma | 0 (0.0%) | 0 (0.0%) |
| College or Associate's Degree | 0 (0.0%) | 0 (0.0%) |
| Bachelor's Degree | 0 (0.0%) | 0 (0.0%) |
| Graduate Degree | 0 (0.0%) | 0 (0.0%) |
| Total | 0 (0.0%) | 0 (0.0%) |
Employment Characteristics in La Parguera
Employment by Class of Employer in La Parguera
Among the 177 employed individuals in La Parguera, , and private company employees (177 | 100.0%) make up the most common classes of employment.
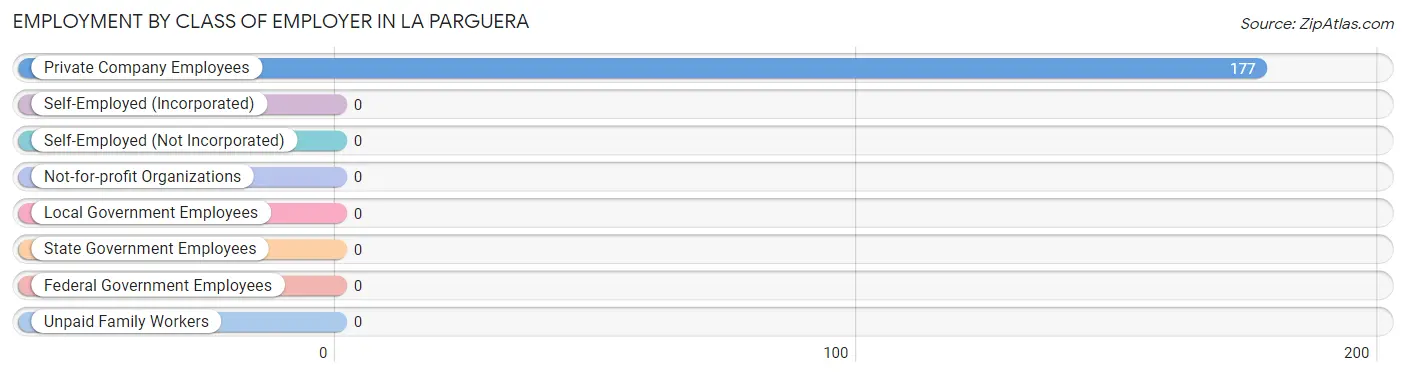
| Employer Class | # Employees | % Employees |
| Private Company Employees | 177 | 100.0% |
| Self-Employed (Incorporated) | 0 | 0.0% |
| Self-Employed (Not Incorporated) | 0 | 0.0% |
| Not-for-profit Organizations | 0 | 0.0% |
| Local Government Employees | 0 | 0.0% |
| State Government Employees | 0 | 0.0% |
| Federal Government Employees | 0 | 0.0% |
| Unpaid Family Workers | 0 | 0.0% |
| Total | 177 | 100.0% |
Employment Status by Age in La Parguera
According to the labor force statistics for La Parguera, out of the total population over 16 years of age (1,204), 21.8% or 262 individuals are in the labor force, with 32.4% or 85 of them unemployed. The age group with the highest labor force participation rate is 25 to 29 years, with 100.0% or 85 individuals in the labor force. Within the labor force, the 25 to 29 years age range has the highest percentage of unemployed individuals, with 100.0% or 85 of them being unemployed.
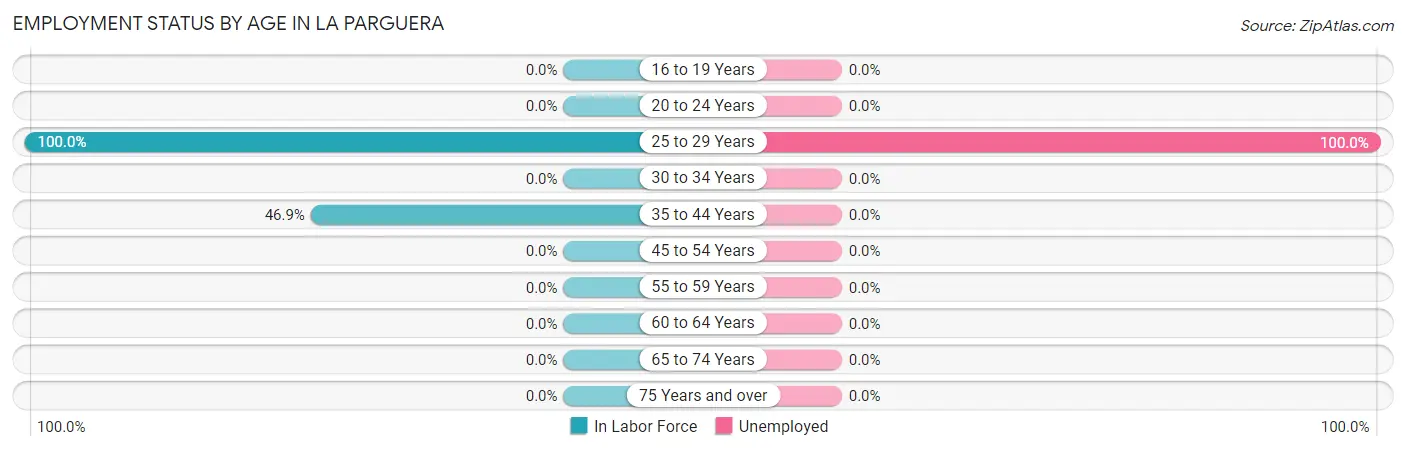
| Age Bracket | In Labor Force | Unemployed |
| 16 to 19 Years | 0 (0.0%) | 0 (0.0%) |
| 20 to 24 Years | 0 (0.0%) | 0 (0.0%) |
| 25 to 29 Years | 85 (100.0%) | 85 (100.0%) |
| 30 to 34 Years | 0 (0.0%) | 0 (0.0%) |
| 35 to 44 Years | 177 (46.9%) | 0 (0.0%) |
| 45 to 54 Years | 0 (0.0%) | 0 (0.0%) |
| 55 to 59 Years | 0 (0.0%) | 0 (0.0%) |
| 60 to 64 Years | 0 (0.0%) | 0 (0.0%) |
| 65 to 74 Years | 0 (0.0%) | 0 (0.0%) |
| 75 Years and over | 0 (0.0%) | 0 (0.0%) |
| Total | 262 (21.8%) | 85 (32.4%) |
Employment Status by Educational Attainment in La Parguera
According to labor force statistics for La Parguera, 32.1% of individuals (262) out of the total population between 25 and 64 years of age (817) are in the labor force, with 32.4% or 85 of them being unemployed. The group with the highest labor force participation rate are those with the educational attainment of bachelor's degree or higher, with 100.0% or 61 individuals in the labor force. Within the labor force, individuals with high school diploma education have the highest percentage of unemployment, with 100.0% or 85 of them being unemployed.
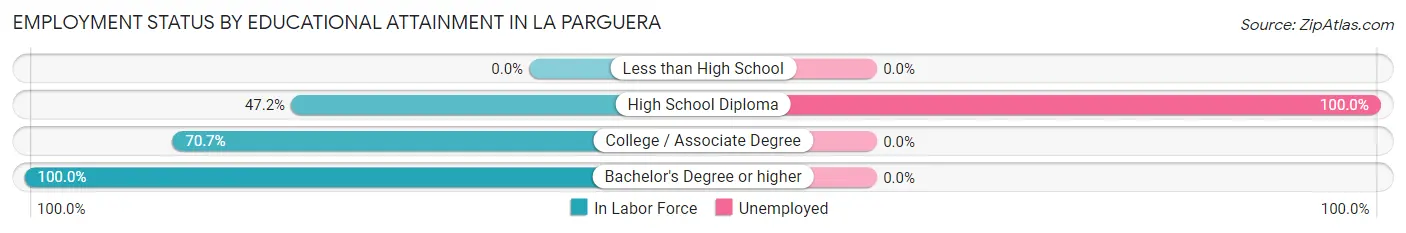
| Educational Attainment | In Labor Force | Unemployed |
| Less than High School | 0 (0.0%) | 0 (0.0%) |
| High School Diploma | 85 (47.2%) | 180 (100.0%) |
| College / Associate Degree | 116 (70.7%) | 0 (0.0%) |
| Bachelor's Degree or higher | 61 (100.0%) | 0 (0.0%) |
| Total | 262 (32.1%) | 265 (32.4%) |
Employment Occupations by Sex in La Parguera
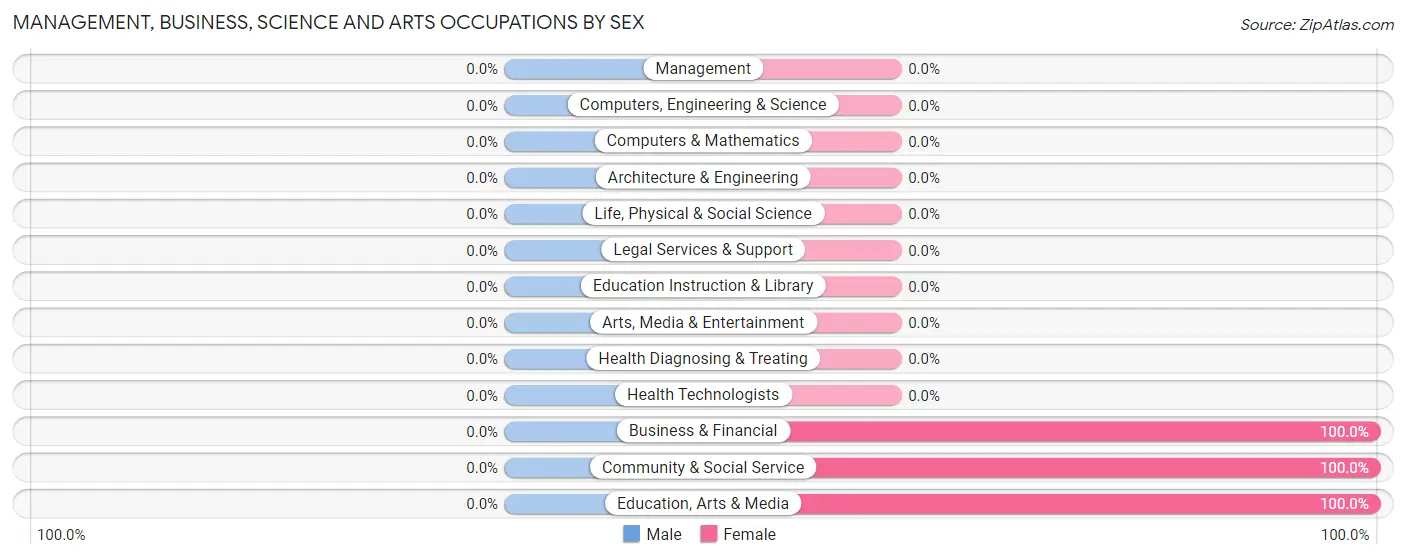
Management, Business, Science and Arts Occupations
The most common Management, Business, Science and Arts occupations in La Parguera are Business & Financial (61 | 34.5%), Community & Social Service (32 | 18.1%), and Education, Arts & Media (32 | 18.1%).
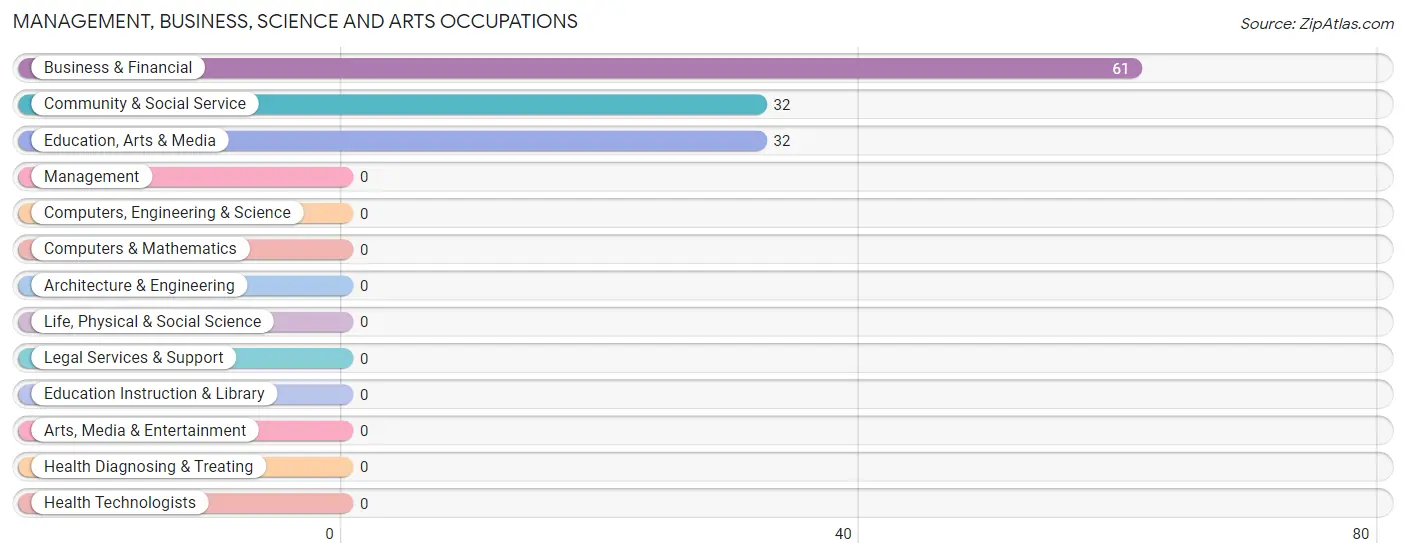
Management, Business, Science and Arts Occupations by Sex
| Occupation | Male | Female |
| Management | 0 (0.0%) | 0 (0.0%) |
| Business & Financial | 0 (0.0%) | 61 (100.0%) |
| Computers, Engineering & Science | 0 (0.0%) | 0 (0.0%) |
| Computers & Mathematics | 0 (0.0%) | 0 (0.0%) |
| Architecture & Engineering | 0 (0.0%) | 0 (0.0%) |
| Life, Physical & Social Science | 0 (0.0%) | 0 (0.0%) |
| Community & Social Service | 0 (0.0%) | 32 (100.0%) |
| Education, Arts & Media | 0 (0.0%) | 32 (100.0%) |
| Legal Services & Support | 0 (0.0%) | 0 (0.0%) |
| Education Instruction & Library | 0 (0.0%) | 0 (0.0%) |
| Arts, Media & Entertainment | 0 (0.0%) | 0 (0.0%) |
| Health Diagnosing & Treating | 0 (0.0%) | 0 (0.0%) |
| Health Technologists | 0 (0.0%) | 0 (0.0%) |
| Total (Category) | 0 (0.0%) | 93 (100.0%) |
| Total (Overall) | 24 (13.6%) | 153 (86.4%) |
Services Occupations
Services Occupations by Sex
| Occupation | Male | Female |
| Healthcare Support | 0 (0.0%) | 0 (0.0%) |
| Security & Protection | 0 (0.0%) | 0 (0.0%) |
| Firefighting & Prevention | 0 (0.0%) | 0 (0.0%) |
| Law Enforcement | 0 (0.0%) | 0 (0.0%) |
| Food Preparation & Serving | 0 (0.0%) | 0 (0.0%) |
| Cleaning & Maintenance | 0 (0.0%) | 0 (0.0%) |
| Personal Care & Service | 0 (0.0%) | 0 (0.0%) |
| Total (Category) | 0 (0.0%) | 0 (0.0%) |
| Total (Overall) | 24 (13.6%) | 153 (86.4%) |
Sales and Office Occupations

Sales and Office Occupations by Sex

| Occupation | Male | Female |
| Sales & Related | 0 (0.0%) | 0 (0.0%) |
| Office & Administration | 0 (0.0%) | 0 (0.0%) |
| Total (Category) | 0 (0.0%) | 0 (0.0%) |
| Total (Overall) | 24 (13.6%) | 153 (86.4%) |
Natural Resources, Construction and Maintenance Occupations
The most common Natural Resources, Construction and Maintenance occupations in La Parguera are , and Installation, Maintenance & Repair (24 | 13.6%).
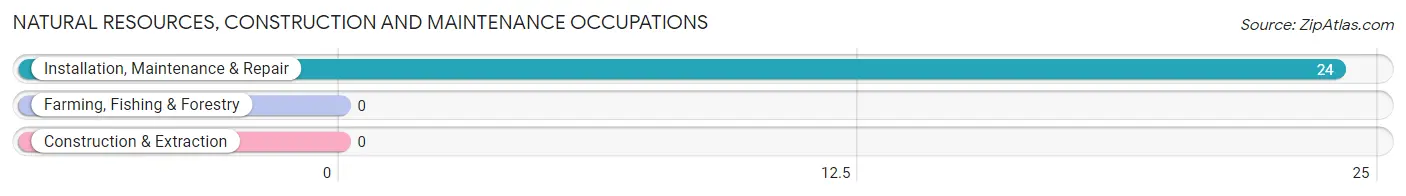
Natural Resources, Construction and Maintenance Occupations by Sex
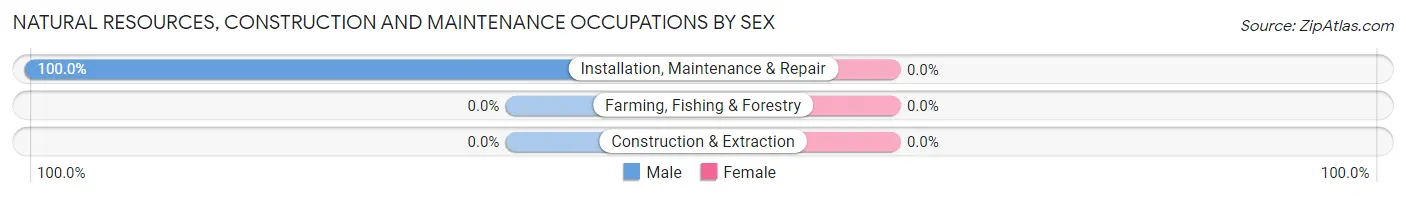
| Occupation | Male | Female |
| Farming, Fishing & Forestry | 0 (0.0%) | 0 (0.0%) |
| Construction & Extraction | 0 (0.0%) | 0 (0.0%) |
| Installation, Maintenance & Repair | 24 (100.0%) | 0 (0.0%) |
| Total (Category) | 24 (100.0%) | 0 (0.0%) |
| Total (Overall) | 24 (13.6%) | 153 (86.4%) |
Production, Transportation and Moving Occupations
The most common Production, Transportation and Moving occupations in La Parguera are , and Production (60 | 33.9%).
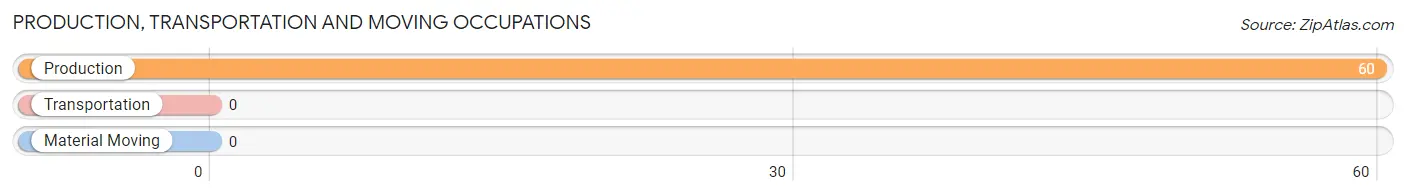
Production, Transportation and Moving Occupations by Sex
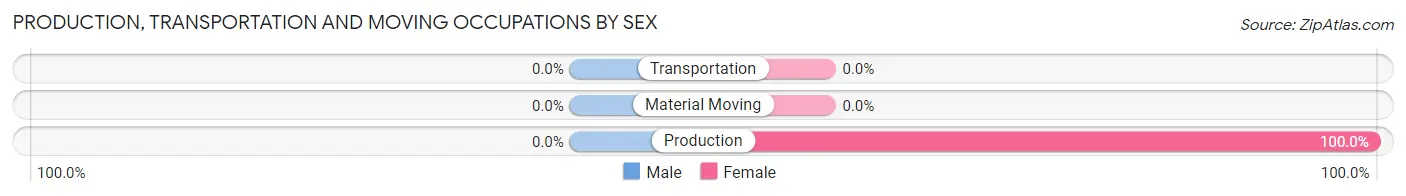
| Occupation | Male | Female |
| Production | 0 (0.0%) | 60 (100.0%) |
| Transportation | 0 (0.0%) | 0 (0.0%) |
| Material Moving | 0 (0.0%) | 0 (0.0%) |
| Total (Category) | 0 (0.0%) | 60 (100.0%) |
| Total (Overall) | 24 (13.6%) | 153 (86.4%) |
Employment Industries by Sex in La Parguera
Employment Industries in La Parguera
The major employment industries in La Parguera include , and Manufacturing (177 | 100.0%).
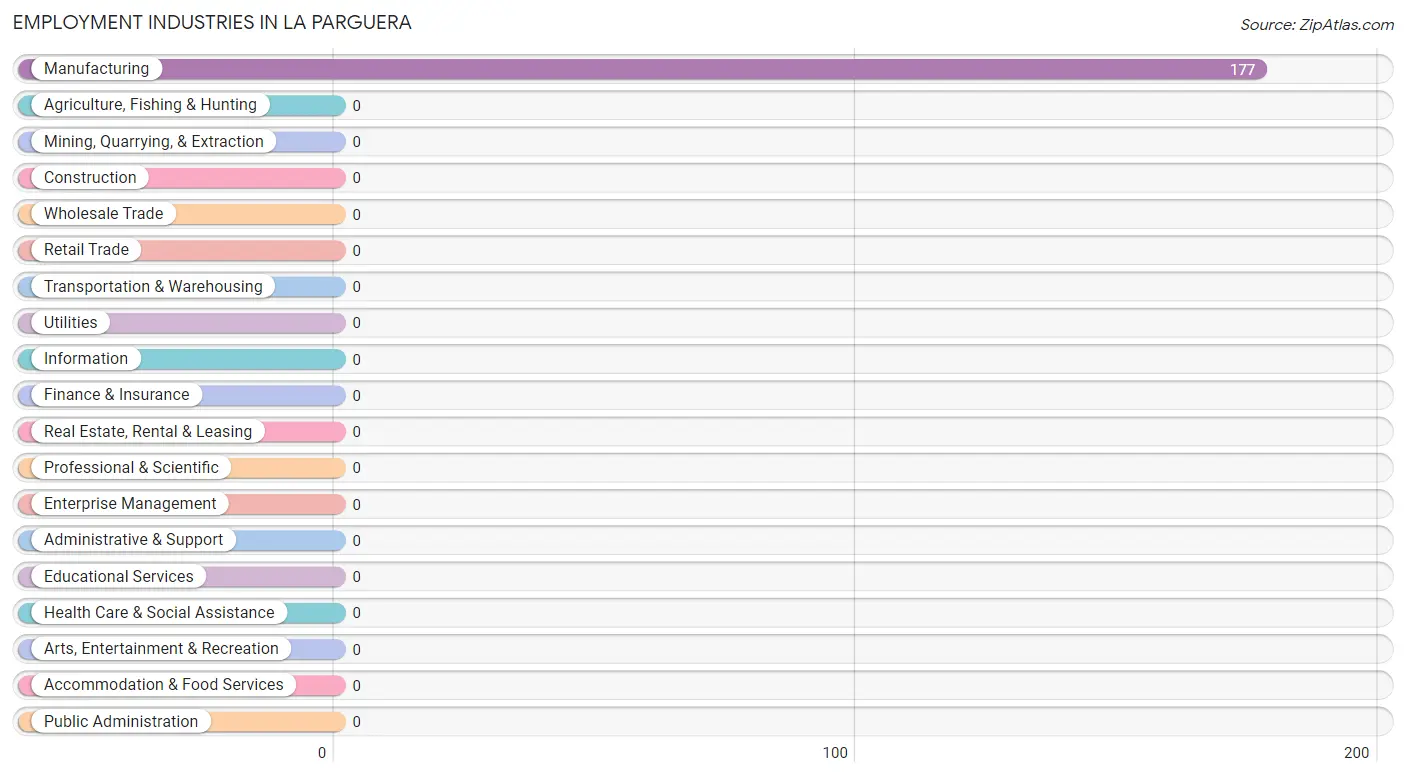
Employment Industries by Sex in La Parguera
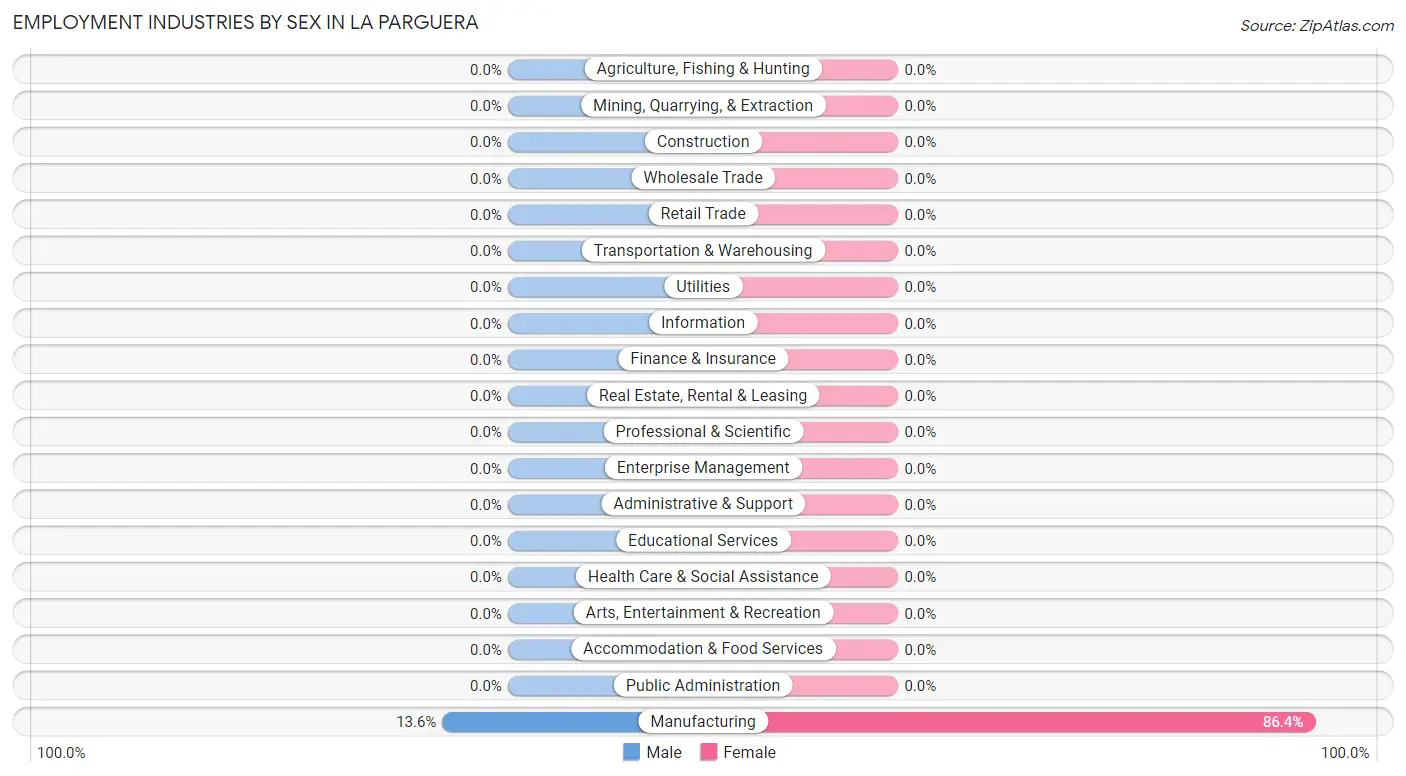
| Industry | Male | Female |
| Agriculture, Fishing & Hunting | 0 (0.0%) | 0 (0.0%) |
| Mining, Quarrying, & Extraction | 0 (0.0%) | 0 (0.0%) |
| Construction | 0 (0.0%) | 0 (0.0%) |
| Manufacturing | 24 (13.6%) | 153 (86.4%) |
| Wholesale Trade | 0 (0.0%) | 0 (0.0%) |
| Retail Trade | 0 (0.0%) | 0 (0.0%) |
| Transportation & Warehousing | 0 (0.0%) | 0 (0.0%) |
| Utilities | 0 (0.0%) | 0 (0.0%) |
| Information | 0 (0.0%) | 0 (0.0%) |
| Finance & Insurance | 0 (0.0%) | 0 (0.0%) |
| Real Estate, Rental & Leasing | 0 (0.0%) | 0 (0.0%) |
| Professional & Scientific | 0 (0.0%) | 0 (0.0%) |
| Enterprise Management | 0 (0.0%) | 0 (0.0%) |
| Administrative & Support | 0 (0.0%) | 0 (0.0%) |
| Educational Services | 0 (0.0%) | 0 (0.0%) |
| Health Care & Social Assistance | 0 (0.0%) | 0 (0.0%) |
| Arts, Entertainment & Recreation | 0 (0.0%) | 0 (0.0%) |
| Accommodation & Food Services | 0 (0.0%) | 0 (0.0%) |
| Public Administration | 0 (0.0%) | 0 (0.0%) |
| Total | 24 (13.6%) | 153 (86.4%) |
Education in La Parguera
School Enrollment in La Parguera
The most common levels of schooling among the 426 students in La Parguera are high school (188 | 44.1%), elementary school (102 | 23.9%), and middle school (90 | 21.1%).
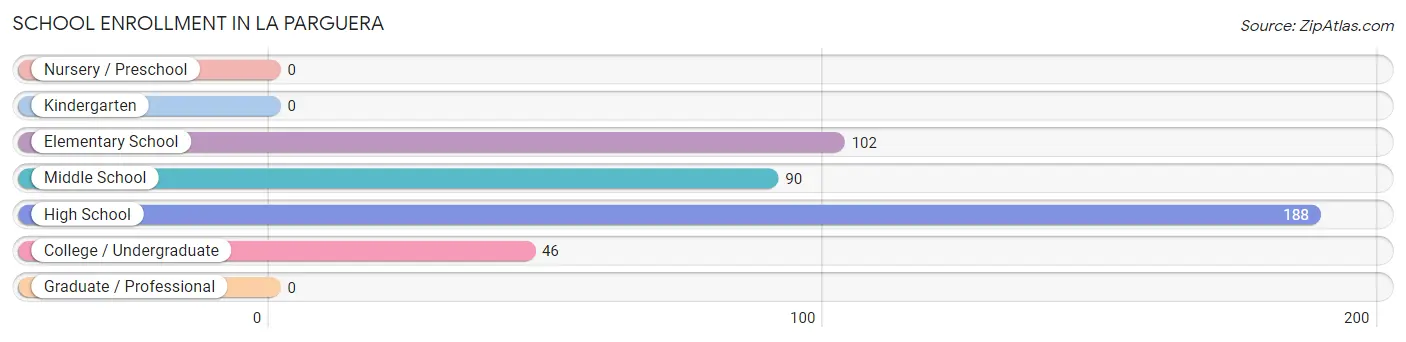
| School Level | # Students | % Students |
| Nursery / Preschool | 0 | 0.0% |
| Kindergarten | 0 | 0.0% |
| Elementary School | 102 | 23.9% |
| Middle School | 90 | 21.1% |
| High School | 188 | 44.1% |
| College / Undergraduate | 46 | 10.8% |
| Graduate / Professional | 0 | 0.0% |
| Total | 426 | 100.0% |
School Enrollment by Age by Funding Source in La Parguera
Out of a total of 426 students who are enrolled in schools in La Parguera, 113 (26.5%) attend a private institution, while the remaining 313 (73.5%) are enrolled in public schools. The age group of 18 to 19 year olds has the highest likelihood of being enrolled in private schools, with 18 (100.0% in the age bracket) enrolled. Conversely, the age group of 5 to 9 year old has the lowest likelihood of being enrolled in a private school, with 155 (100.0% in the age bracket) attending a public institution.
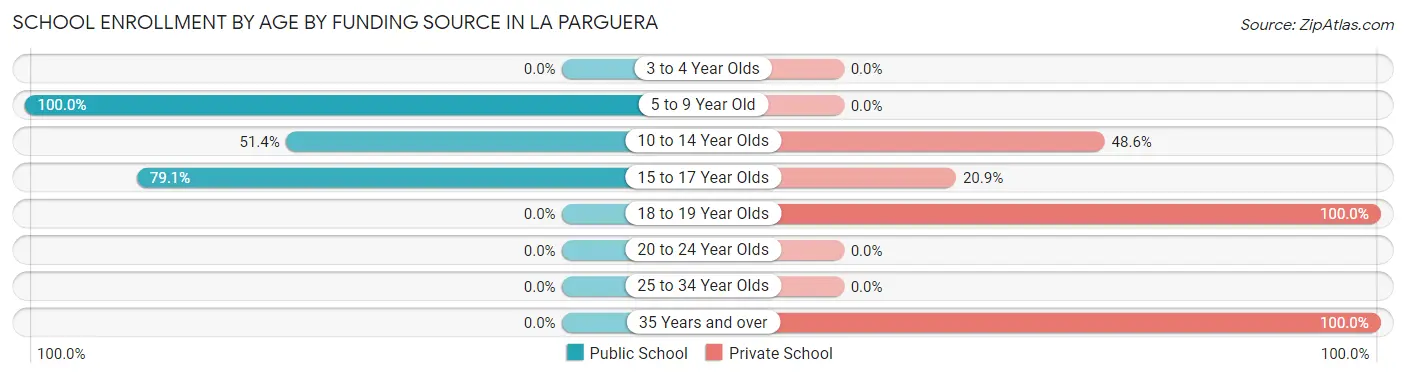
| Age Bracket | Public School | Private School |
| 3 to 4 Year Olds | 0 (0.0%) | 0 (0.0%) |
| 5 to 9 Year Old | 155 (100.0%) | 0 (0.0%) |
| 10 to 14 Year Olds | 37 (51.4%) | 35 (48.6%) |
| 15 to 17 Year Olds | 121 (79.1%) | 32 (20.9%) |
| 18 to 19 Year Olds | 0 (0.0%) | 18 (100.0%) |
| 20 to 24 Year Olds | 0 (0.0%) | 0 (0.0%) |
| 25 to 34 Year Olds | 0 (0.0%) | 0 (0.0%) |
| 35 Years and over | 0 (0.0%) | 28 (100.0%) |
| Total | 313 (73.5%) | 113 (26.5%) |
Educational Attainment by Field of Study in La Parguera
Science & technology (61 | 68.5%), and business (28 | 31.5%) are the most common fields of study among 89 individuals in La Parguera who have obtained a bachelor's degree or higher.
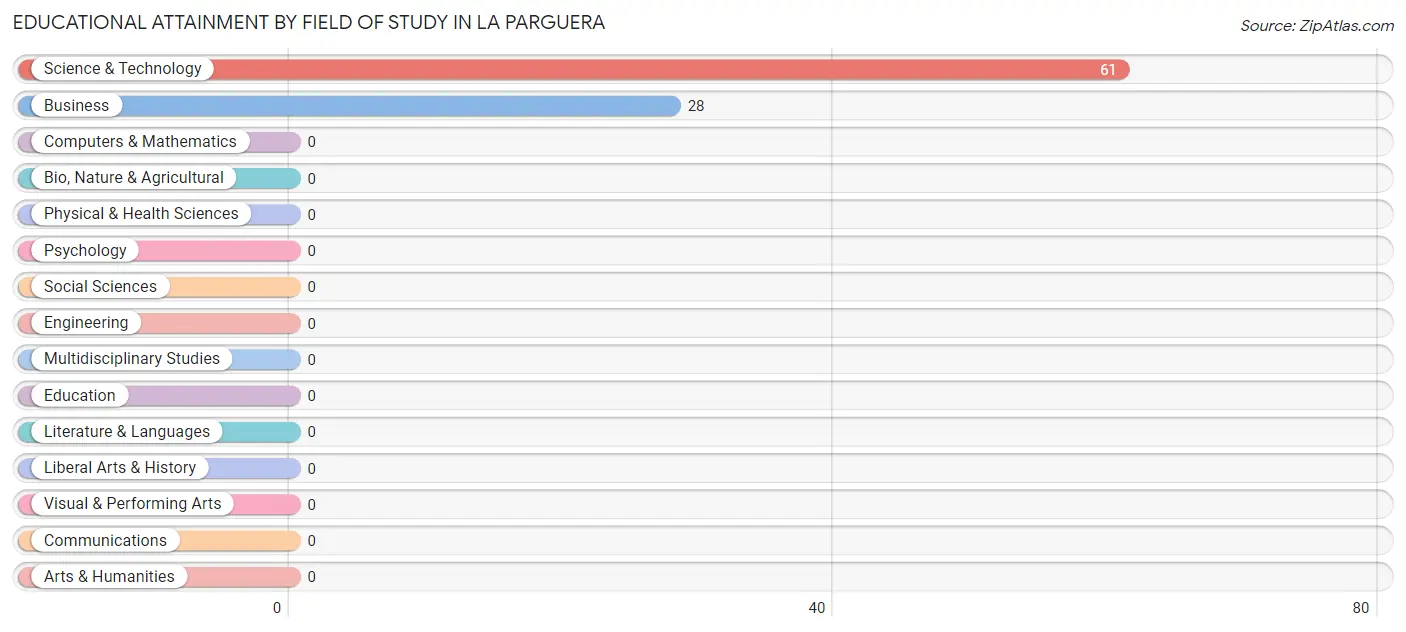
| Field of Study | # Graduates | % Graduates |
| Computers & Mathematics | 0 | 0.0% |
| Bio, Nature & Agricultural | 0 | 0.0% |
| Physical & Health Sciences | 0 | 0.0% |
| Psychology | 0 | 0.0% |
| Social Sciences | 0 | 0.0% |
| Engineering | 0 | 0.0% |
| Multidisciplinary Studies | 0 | 0.0% |
| Science & Technology | 61 | 68.5% |
| Business | 28 | 31.5% |
| Education | 0 | 0.0% |
| Literature & Languages | 0 | 0.0% |
| Liberal Arts & History | 0 | 0.0% |
| Visual & Performing Arts | 0 | 0.0% |
| Communications | 0 | 0.0% |
| Arts & Humanities | 0 | 0.0% |
| Total | 89 | 100.0% |
Transportation & Commute in La Parguera
Vehicle Availability by Sex in La Parguera
The most prevalent vehicle ownership categories in La Parguera are males with 2 vehicles (24, accounting for 100.0%) and females with 2 vehicles (93, making up 15.7%).
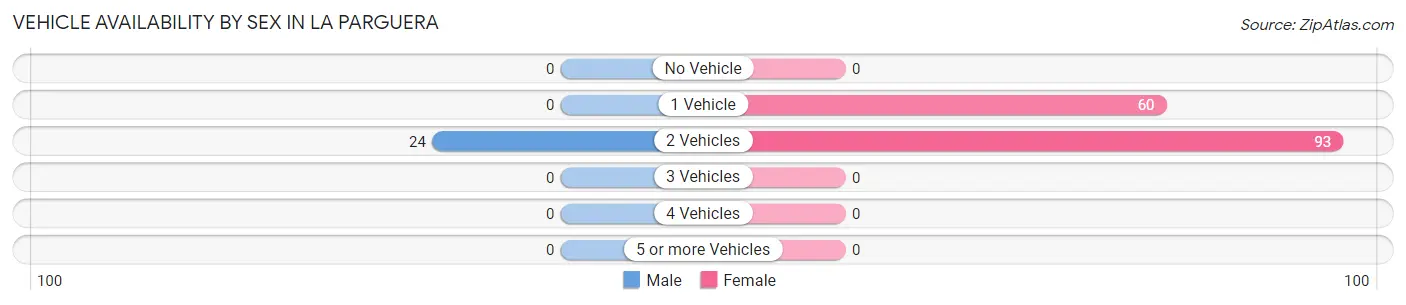
| Vehicles Available | Male | Female |
| No Vehicle | 0 (0.0%) | 0 (0.0%) |
| 1 Vehicle | 0 (0.0%) | 60 (39.2%) |
| 2 Vehicles | 24 (100.0%) | 93 (60.8%) |
| 3 Vehicles | 0 (0.0%) | 0 (0.0%) |
| 4 Vehicles | 0 (0.0%) | 0 (0.0%) |
| 5 or more Vehicles | 0 (0.0%) | 0 (0.0%) |
| Total | 24 (100.0%) | 153 (100.0%) |
Commute Time in La Parguera
The most frequently occuring commute durations in La Parguera are 15 to 19 minutes (116 commuters, 65.5%), 60 to 89 minutes (61 commuters, 34.5%), and less than 5 minutes (0 commuters, 0.0%).
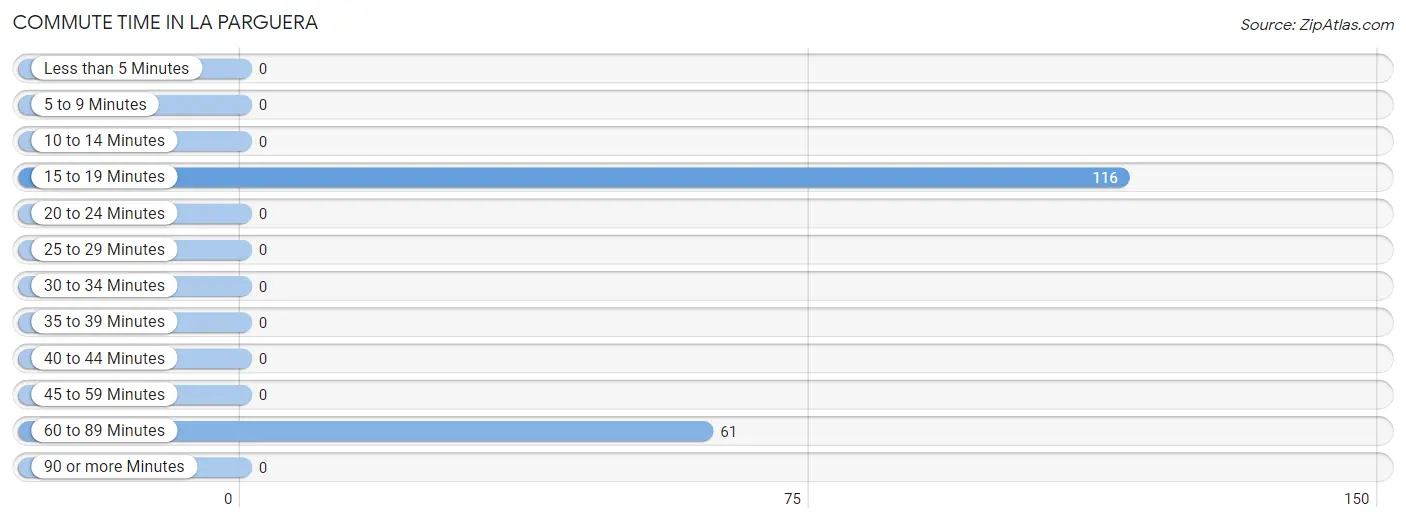
| Commute Time | # Commuters | % Commuters |
| Less than 5 Minutes | 0 | 0.0% |
| 5 to 9 Minutes | 0 | 0.0% |
| 10 to 14 Minutes | 0 | 0.0% |
| 15 to 19 Minutes | 116 | 65.5% |
| 20 to 24 Minutes | 0 | 0.0% |
| 25 to 29 Minutes | 0 | 0.0% |
| 30 to 34 Minutes | 0 | 0.0% |
| 35 to 39 Minutes | 0 | 0.0% |
| 40 to 44 Minutes | 0 | 0.0% |
| 45 to 59 Minutes | 0 | 0.0% |
| 60 to 89 Minutes | 61 | 34.5% |
| 90 or more Minutes | 0 | 0.0% |
Commute Time by Sex in La Parguera
The most common commute times in La Parguera are 15 to 19 minutes (24 commuters, 100.0%) for males and 15 to 19 minutes (92 commuters, 60.1%) for females.
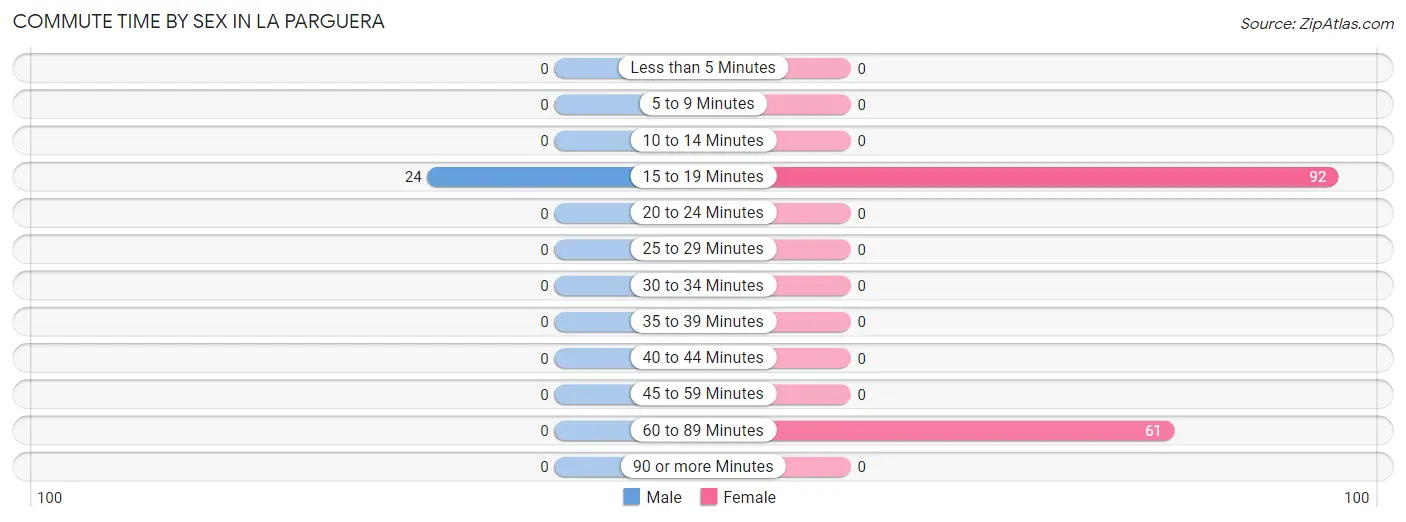
| Commute Time | Male | Female |
| Less than 5 Minutes | 0 (0.0%) | 0 (0.0%) |
| 5 to 9 Minutes | 0 (0.0%) | 0 (0.0%) |
| 10 to 14 Minutes | 0 (0.0%) | 0 (0.0%) |
| 15 to 19 Minutes | 24 (100.0%) | 92 (60.1%) |
| 20 to 24 Minutes | 0 (0.0%) | 0 (0.0%) |
| 25 to 29 Minutes | 0 (0.0%) | 0 (0.0%) |
| 30 to 34 Minutes | 0 (0.0%) | 0 (0.0%) |
| 35 to 39 Minutes | 0 (0.0%) | 0 (0.0%) |
| 40 to 44 Minutes | 0 (0.0%) | 0 (0.0%) |
| 45 to 59 Minutes | 0 (0.0%) | 0 (0.0%) |
| 60 to 89 Minutes | 0 (0.0%) | 61 (39.9%) |
| 90 or more Minutes | 0 (0.0%) | 0 (0.0%) |
Time of Departure to Work by Sex in La Parguera
The most frequent times of departure to work in La Parguera are 6:00 AM to 6:29 AM (24, 100.0%) for males and 6:00 AM to 6:29 AM (92, 60.1%) for females.
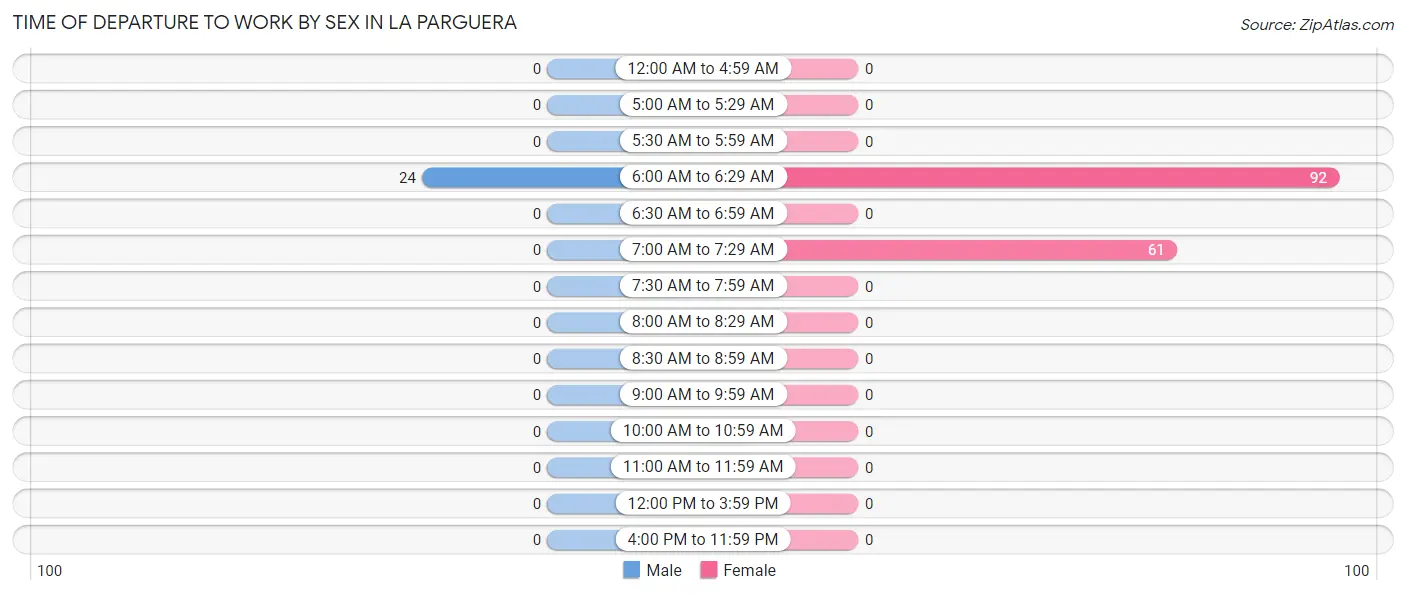
| Time of Departure | Male | Female |
| 12:00 AM to 4:59 AM | 0 (0.0%) | 0 (0.0%) |
| 5:00 AM to 5:29 AM | 0 (0.0%) | 0 (0.0%) |
| 5:30 AM to 5:59 AM | 0 (0.0%) | 0 (0.0%) |
| 6:00 AM to 6:29 AM | 24 (100.0%) | 92 (60.1%) |
| 6:30 AM to 6:59 AM | 0 (0.0%) | 0 (0.0%) |
| 7:00 AM to 7:29 AM | 0 (0.0%) | 61 (39.9%) |
| 7:30 AM to 7:59 AM | 0 (0.0%) | 0 (0.0%) |
| 8:00 AM to 8:29 AM | 0 (0.0%) | 0 (0.0%) |
| 8:30 AM to 8:59 AM | 0 (0.0%) | 0 (0.0%) |
| 9:00 AM to 9:59 AM | 0 (0.0%) | 0 (0.0%) |
| 10:00 AM to 10:59 AM | 0 (0.0%) | 0 (0.0%) |
| 11:00 AM to 11:59 AM | 0 (0.0%) | 0 (0.0%) |
| 12:00 PM to 3:59 PM | 0 (0.0%) | 0 (0.0%) |
| 4:00 PM to 11:59 PM | 0 (0.0%) | 0 (0.0%) |
| Total | 24 (100.0%) | 153 (100.0%) |
Housing Occupancy in La Parguera
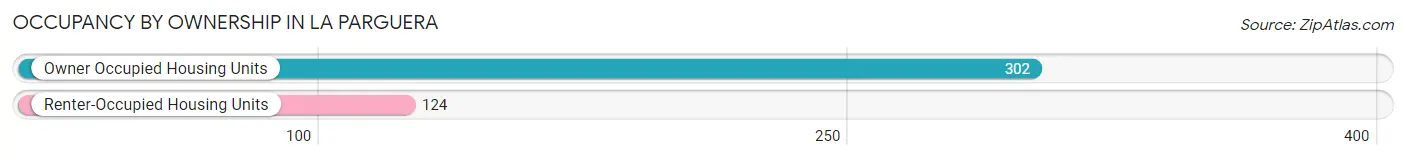
Occupancy by Ownership in La Parguera
Of the total 426 dwellings in La Parguera, owner-occupied units account for 302 (70.9%), while renter-occupied units make up 124 (29.1%).
| Occupancy | # Housing Units | % Housing Units |
| Owner Occupied Housing Units | 302 | 70.9% |
| Renter-Occupied Housing Units | 124 | 29.1% |
| Total Occupied Housing Units | 426 | 100.0% |
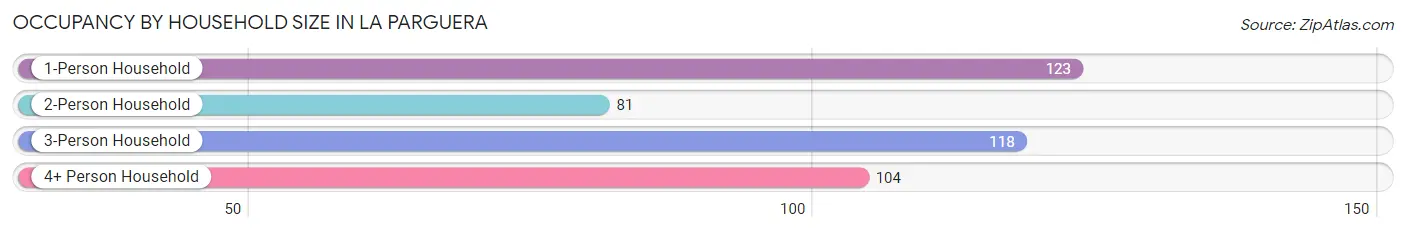
Occupancy by Household Size in La Parguera
| Household Size | # Housing Units | % Housing Units |
| 1-Person Household | 123 | 28.9% |
| 2-Person Household | 81 | 19.0% |
| 3-Person Household | 118 | 27.7% |
| 4+ Person Household | 104 | 24.4% |
| Total Housing Units | 426 | 100.0% |
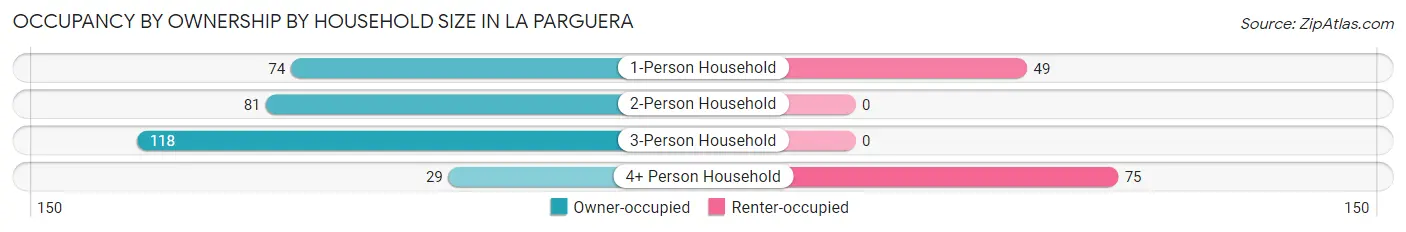
Occupancy by Ownership by Household Size in La Parguera
| Household Size | Owner-occupied | Renter-occupied |
| 1-Person Household | 74 (60.2%) | 49 (39.8%) |
| 2-Person Household | 81 (100.0%) | 0 (0.0%) |
| 3-Person Household | 118 (100.0%) | 0 (0.0%) |
| 4+ Person Household | 29 (27.9%) | 75 (72.1%) |
| Total Housing Units | 302 (70.9%) | 124 (29.1%) |
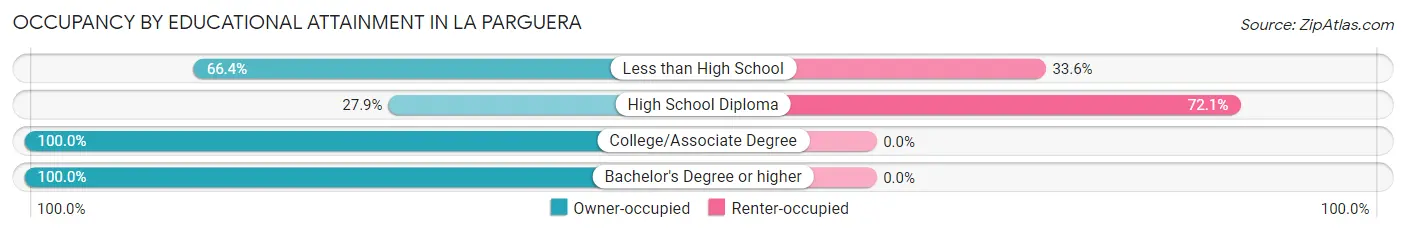
Occupancy by Educational Attainment in La Parguera
| Household Size | Owner-occupied | Renter-occupied |
| Less than High School | 97 (66.4%) | 49 (33.6%) |
| High School Diploma | 29 (27.9%) | 75 (72.1%) |
| College/Associate Degree | 148 (100.0%) | 0 (0.0%) |
| Bachelor's Degree or higher | 28 (100.0%) | 0 (0.0%) |
Occupancy by Age of Householder in La Parguera
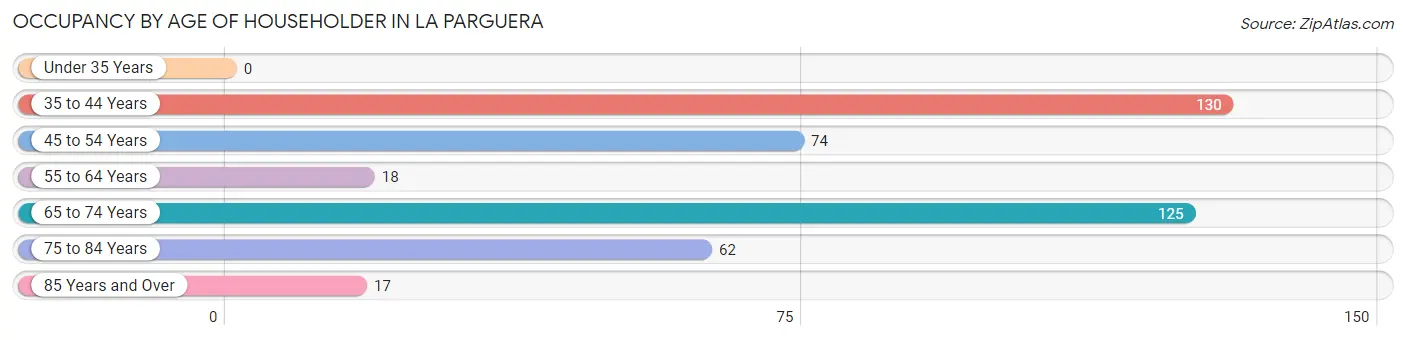
| Age Bracket | # Households | % Households |
| Under 35 Years | 0 | 0.0% |
| 35 to 44 Years | 130 | 30.5% |
| 45 to 54 Years | 74 | 17.4% |
| 55 to 64 Years | 18 | 4.2% |
| 65 to 74 Years | 125 | 29.3% |
| 75 to 84 Years | 62 | 14.5% |
| 85 Years and Over | 17 | 4.0% |
| Total | 426 | 100.0% |
Housing Finances in La Parguera
Median Income by Occupancy in La Parguera
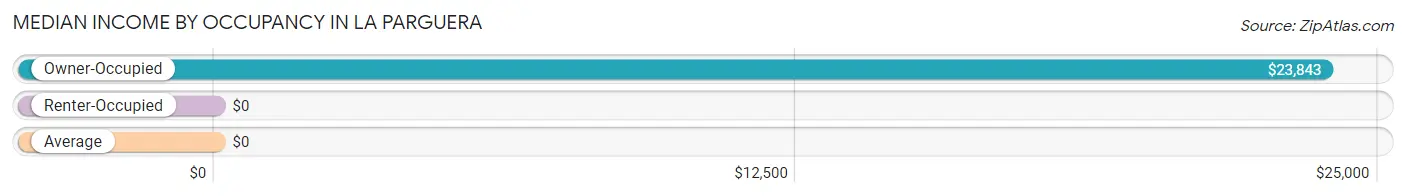
| Occupancy Type | # Households | Median Income |
| Owner-Occupied | 302 (70.9%) | $23,843 |
| Renter-Occupied | 124 (29.1%) | $0 |
| Average | 426 (100.0%) | $0 |
Occupancy by Householder Income Bracket in La Parguera
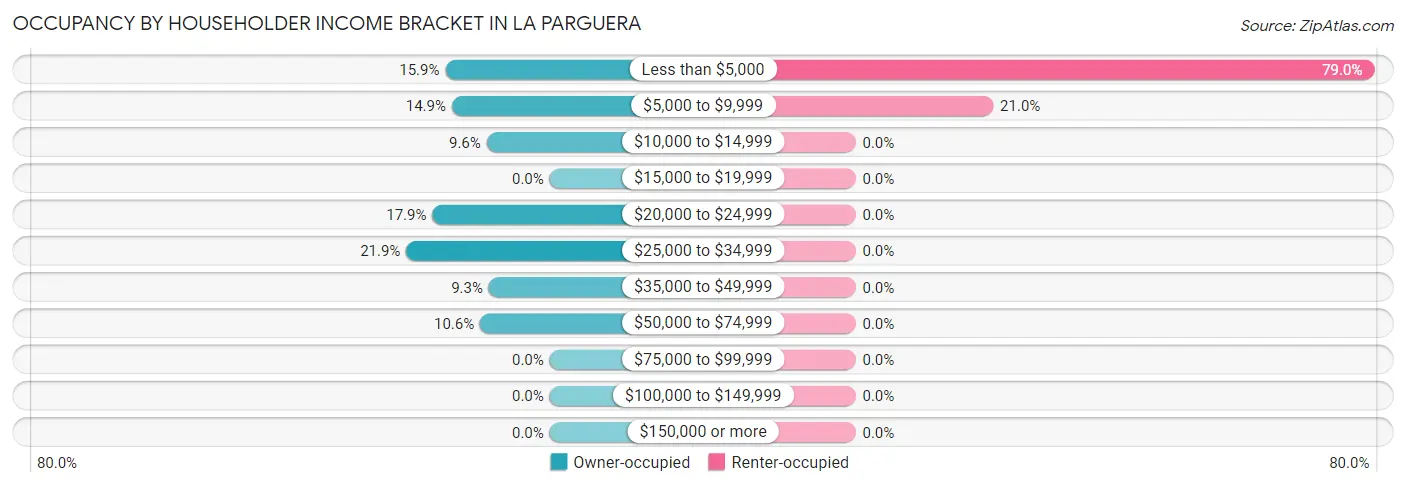
| Income Bracket | Owner-occupied | Renter-occupied |
| Less than $5,000 | 48 (15.9%) | 98 (79.0%) |
| $5,000 to $9,999 | 45 (14.9%) | 26 (21.0%) |
| $10,000 to $14,999 | 29 (9.6%) | 0 (0.0%) |
| $15,000 to $19,999 | 0 (0.0%) | 0 (0.0%) |
| $20,000 to $24,999 | 54 (17.9%) | 0 (0.0%) |
| $25,000 to $34,999 | 66 (21.8%) | 0 (0.0%) |
| $35,000 to $49,999 | 28 (9.3%) | 0 (0.0%) |
| $50,000 to $74,999 | 32 (10.6%) | 0 (0.0%) |
| $75,000 to $99,999 | 0 (0.0%) | 0 (0.0%) |
| $100,000 to $149,999 | 0 (0.0%) | 0 (0.0%) |
| $150,000 or more | 0 (0.0%) | 0 (0.0%) |
| Total | 302 (100.0%) | 124 (100.0%) |
Monthly Housing Cost Tiers in La Parguera
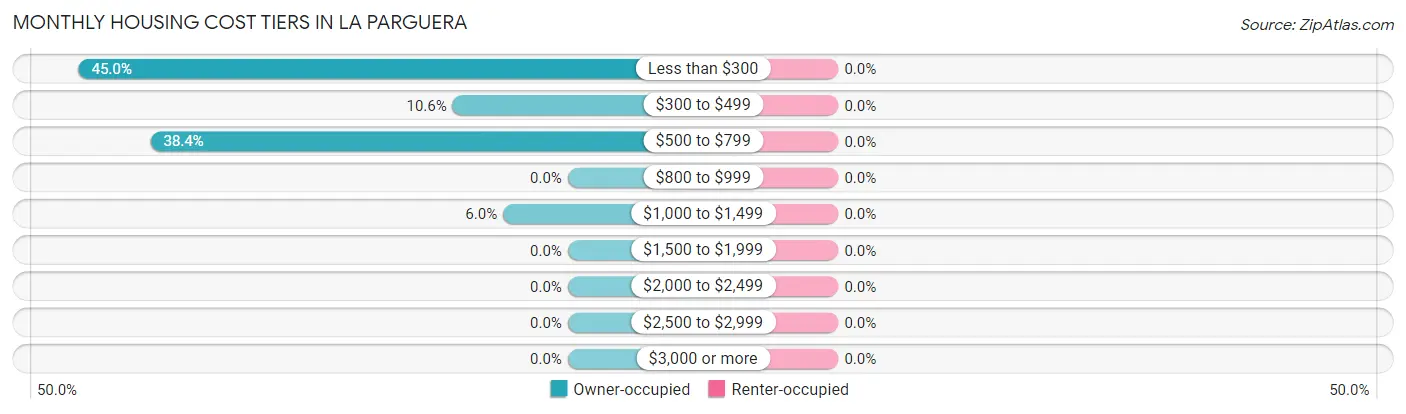
| Monthly Cost | Owner-occupied | Renter-occupied |
| Less than $300 | 136 (45.0%) | 0 (0.0%) |
| $300 to $499 | 32 (10.6%) | 0 (0.0%) |
| $500 to $799 | 116 (38.4%) | 0 (0.0%) |
| $800 to $999 | 0 (0.0%) | 0 (0.0%) |
| $1,000 to $1,499 | 18 (6.0%) | 0 (0.0%) |
| $1,500 to $1,999 | 0 (0.0%) | 0 (0.0%) |
| $2,000 to $2,499 | 0 (0.0%) | 0 (0.0%) |
| $2,500 to $2,999 | 0 (0.0%) | 0 (0.0%) |
| $3,000 or more | 0 (0.0%) | 0 (0.0%) |
| Total | 302 (100.0%) | 124 (100.0%) |
Physical Housing Characteristics in La Parguera
Housing Structures in La Parguera
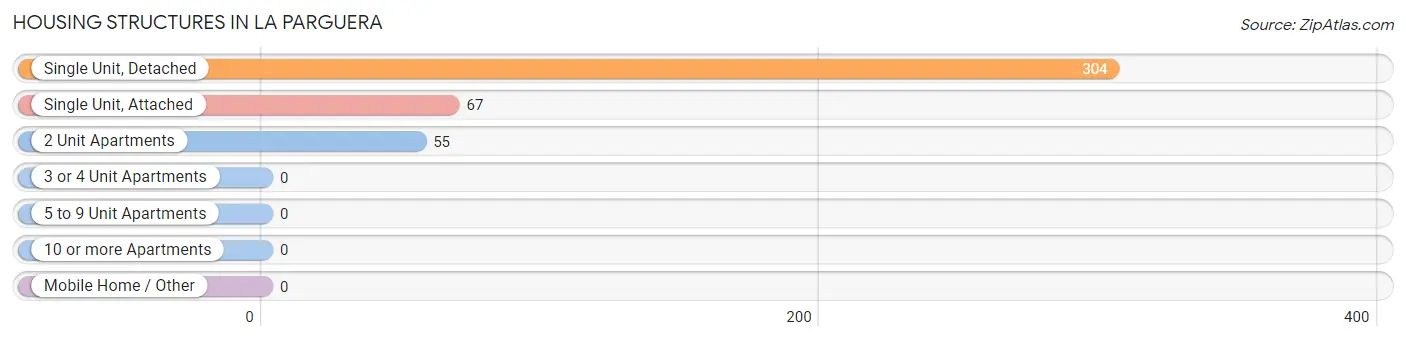
| Structure Type | # Housing Units | % Housing Units |
| Single Unit, Detached | 304 | 71.4% |
| Single Unit, Attached | 67 | 15.7% |
| 2 Unit Apartments | 55 | 12.9% |
| 3 or 4 Unit Apartments | 0 | 0.0% |
| 5 to 9 Unit Apartments | 0 | 0.0% |
| 10 or more Apartments | 0 | 0.0% |
| Mobile Home / Other | 0 | 0.0% |
| Total | 426 | 100.0% |
Housing Structures by Occupancy in La Parguera
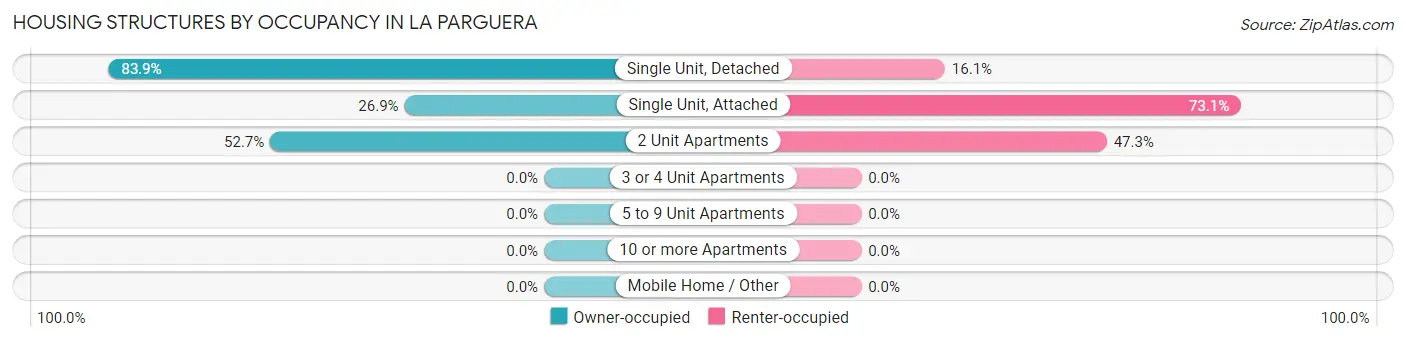
| Structure Type | Owner-occupied | Renter-occupied |
| Single Unit, Detached | 255 (83.9%) | 49 (16.1%) |
| Single Unit, Attached | 18 (26.9%) | 49 (73.1%) |
| 2 Unit Apartments | 29 (52.7%) | 26 (47.3%) |
| 3 or 4 Unit Apartments | 0 (0.0%) | 0 (0.0%) |
| 5 to 9 Unit Apartments | 0 (0.0%) | 0 (0.0%) |
| 10 or more Apartments | 0 (0.0%) | 0 (0.0%) |
| Mobile Home / Other | 0 (0.0%) | 0 (0.0%) |
| Total | 302 (70.9%) | 124 (29.1%) |
Housing Structures by Number of Rooms in La Parguera
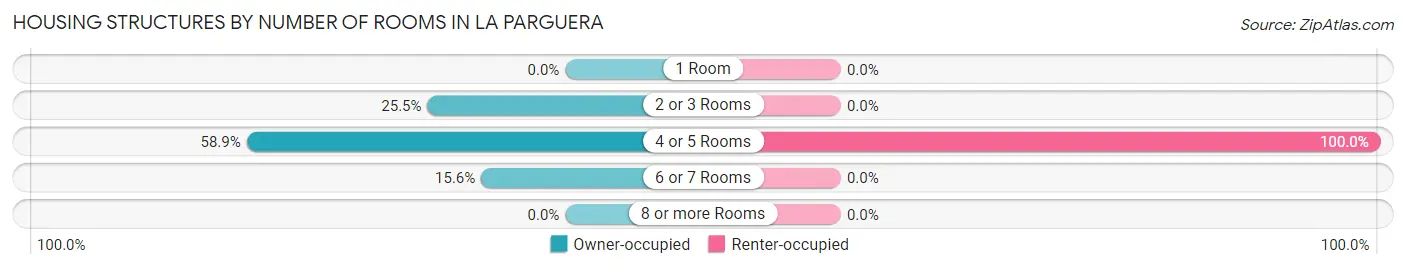
| Number of Rooms | Owner-occupied | Renter-occupied |
| 1 Room | 0 (0.0%) | 0 (0.0%) |
| 2 or 3 Rooms | 77 (25.5%) | 0 (0.0%) |
| 4 or 5 Rooms | 178 (58.9%) | 124 (100.0%) |
| 6 or 7 Rooms | 47 (15.6%) | 0 (0.0%) |
| 8 or more Rooms | 0 (0.0%) | 0 (0.0%) |
| Total | 302 (100.0%) | 124 (100.0%) |
Housing Structure by Heating Type in La Parguera
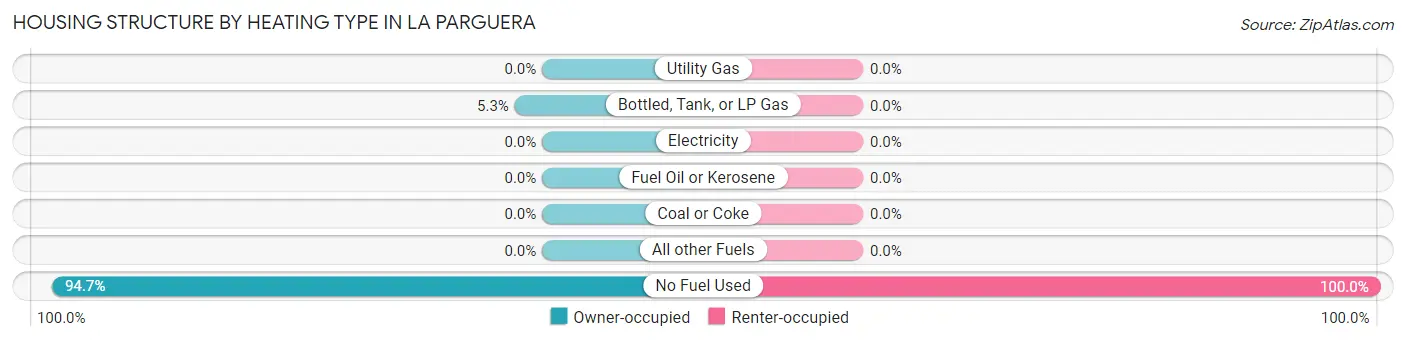
| Heating Type | Owner-occupied | Renter-occupied |
| Utility Gas | 0 (0.0%) | 0 (0.0%) |
| Bottled, Tank, or LP Gas | 16 (5.3%) | 0 (0.0%) |
| Electricity | 0 (0.0%) | 0 (0.0%) |
| Fuel Oil or Kerosene | 0 (0.0%) | 0 (0.0%) |
| Coal or Coke | 0 (0.0%) | 0 (0.0%) |
| All other Fuels | 0 (0.0%) | 0 (0.0%) |
| No Fuel Used | 286 (94.7%) | 124 (100.0%) |
| Total | 302 (100.0%) | 124 (100.0%) |
Household Vehicle Usage in La Parguera
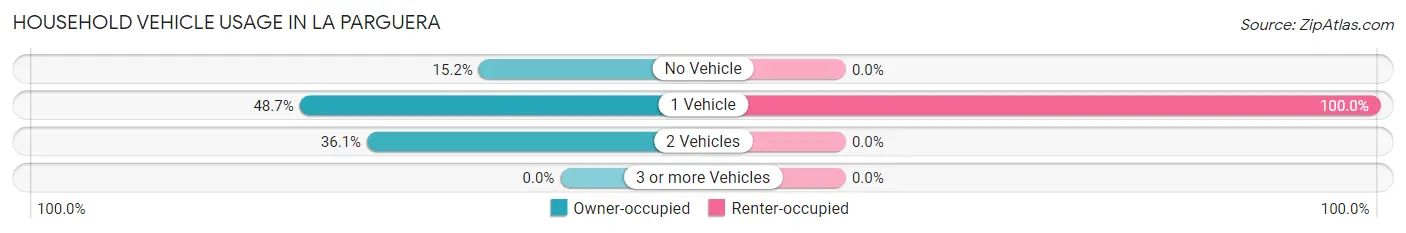
| Vehicles per Household | Owner-occupied | Renter-occupied |
| No Vehicle | 46 (15.2%) | 0 (0.0%) |
| 1 Vehicle | 147 (48.7%) | 124 (100.0%) |
| 2 Vehicles | 109 (36.1%) | 0 (0.0%) |
| 3 or more Vehicles | 0 (0.0%) | 0 (0.0%) |
| Total | 302 (100.0%) | 124 (100.0%) |
Real Estate & Mortgages in La Parguera
Real Estate and Mortgage Overview in La Parguera
| Characteristic | Without Mortgage | With Mortgage |
| Housing Units | 200 | 102 |
| Median Property Value | $84,800 | $107,800 |
| Median Household Income | $32,959 | $0 |
| Monthly Housing Costs | $175 | $0 |
| Real Estate Taxes | - | - |
Property Value by Mortgage Status in La Parguera
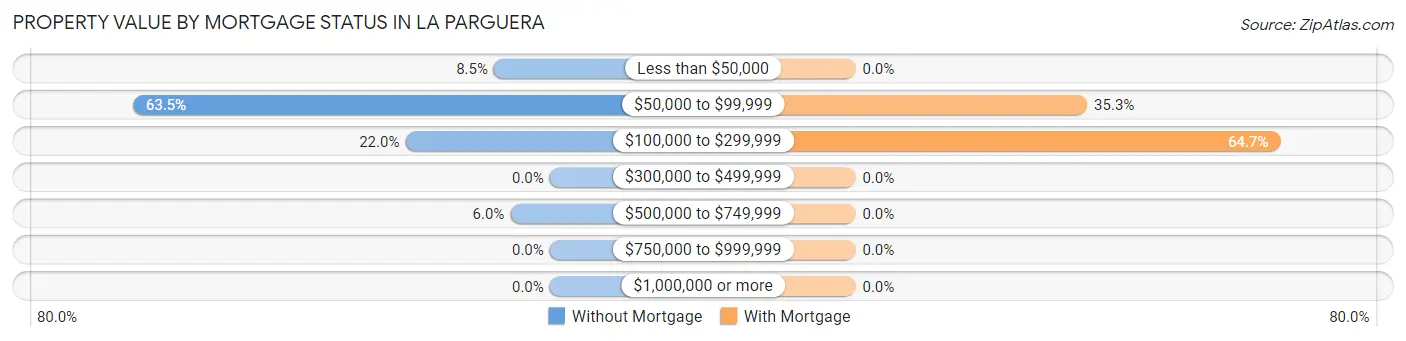
| Property Value | Without Mortgage | With Mortgage |
| Less than $50,000 | 17 (8.5%) | 0 (0.0%) |
| $50,000 to $99,999 | 127 (63.5%) | 36 (35.3%) |
| $100,000 to $299,999 | 44 (22.0%) | 66 (64.7%) |
| $300,000 to $499,999 | 0 (0.0%) | 0 (0.0%) |
| $500,000 to $749,999 | 12 (6.0%) | 0 (0.0%) |
| $750,000 to $999,999 | 0 (0.0%) | 0 (0.0%) |
| $1,000,000 or more | 0 (0.0%) | 0 (0.0%) |
| Total | 200 (100.0%) | 102 (100.0%) |
Household Income by Mortgage Status in La Parguera
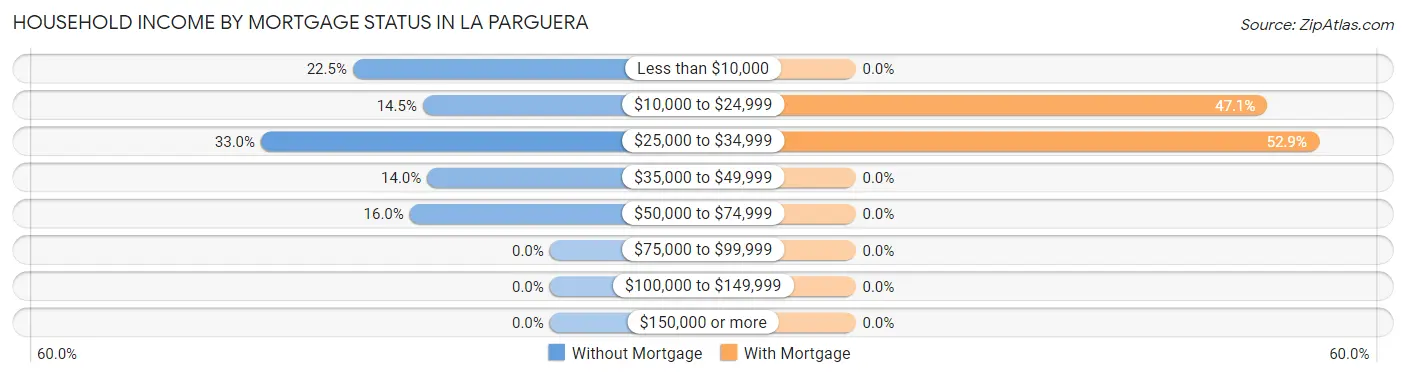
| Household Income | Without Mortgage | With Mortgage |
| Less than $10,000 | 45 (22.5%) | 0 (0.0%) |
| $10,000 to $24,999 | 29 (14.5%) | 48 (47.1%) |
| $25,000 to $34,999 | 66 (33.0%) | 54 (52.9%) |
| $35,000 to $49,999 | 28 (14.0%) | 0 (0.0%) |
| $50,000 to $74,999 | 32 (16.0%) | 0 (0.0%) |
| $75,000 to $99,999 | 0 (0.0%) | 0 (0.0%) |
| $100,000 to $149,999 | 0 (0.0%) | 0 (0.0%) |
| $150,000 or more | 0 (0.0%) | 0 (0.0%) |
| Total | 200 (100.0%) | 102 (100.0%) |
Property Value to Household Income Ratio in La Parguera
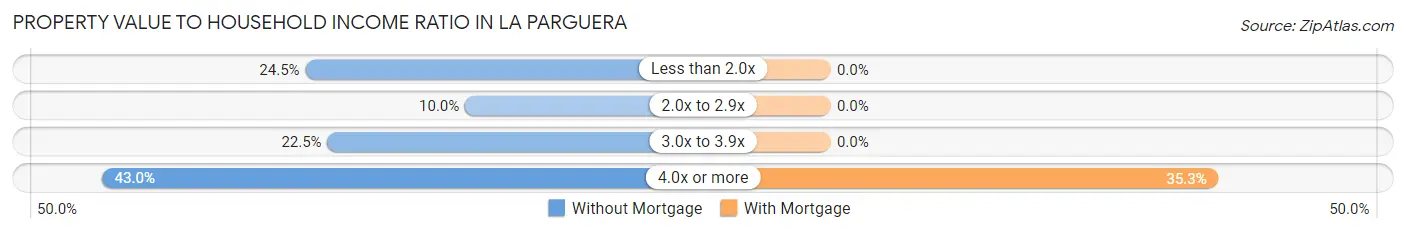
| Value-to-Income Ratio | Without Mortgage | With Mortgage |
| Less than 2.0x | 49 (24.5%) | 0 (0.0%) |
| 2.0x to 2.9x | 20 (10.0%) | 0 (0.0%) |
| 3.0x to 3.9x | 45 (22.5%) | 0 (0.0%) |
| 4.0x or more | 86 (43.0%) | 36 (35.3%) |
| Total | 200 (100.0%) | 102 (100.0%) |
Real Estate Taxes by Mortgage Status in La Parguera
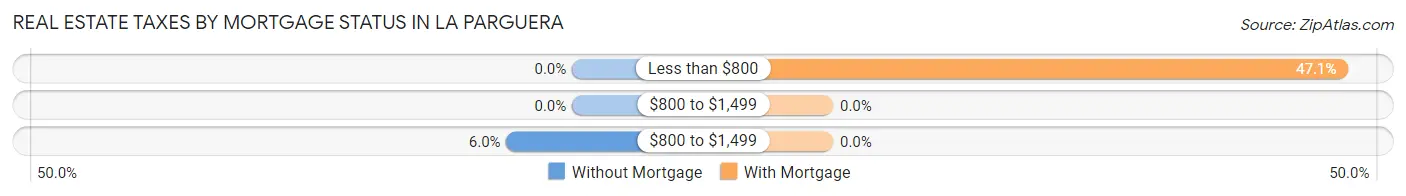
| Property Taxes | Without Mortgage | With Mortgage |
| Less than $800 | 0 (0.0%) | 48 (47.1%) |
| $800 to $1,499 | 0 (0.0%) | 0 (0.0%) |
| $800 to $1,499 | 12 (6.0%) | 0 (0.0%) |
| Total | 200 (100.0%) | 102 (100.0%) |
Health & Disability in La Parguera
Health Insurance Coverage by Age in La Parguera
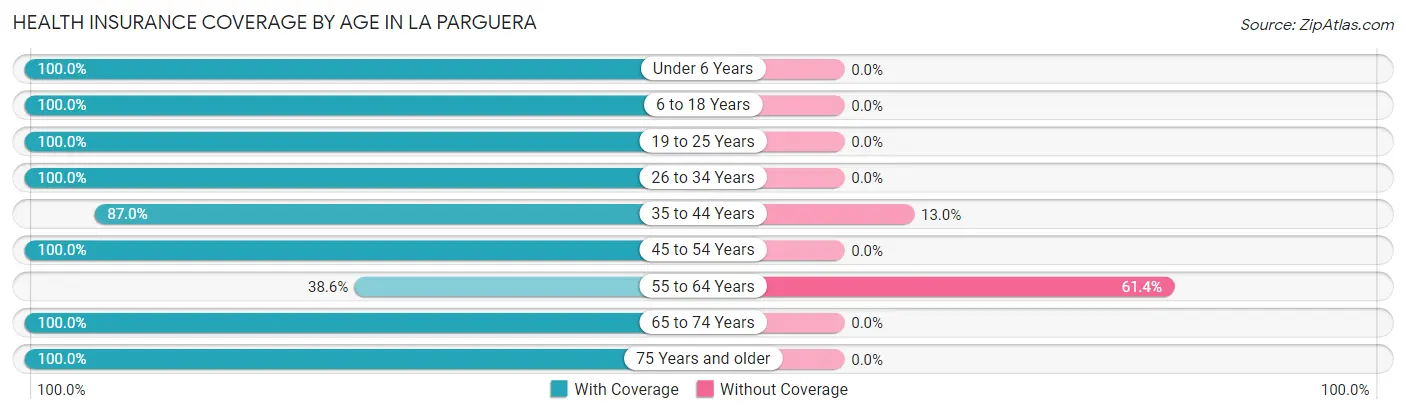
| Age Bracket | With Coverage | Without Coverage |
| Under 6 Years | 25 (100.0%) | 0 (0.0%) |
| 6 to 18 Years | 380 (100.0%) | 0 (0.0%) |
| 19 to 25 Years | 18 (100.0%) | 0 (0.0%) |
| 26 to 34 Years | 105 (100.0%) | 0 (0.0%) |
| 35 to 44 Years | 328 (87.0%) | 49 (13.0%) |
| 45 to 54 Years | 182 (100.0%) | 0 (0.0%) |
| 55 to 64 Years | 59 (38.6%) | 94 (61.4%) |
| 65 to 74 Years | 258 (100.0%) | 0 (0.0%) |
| 75 Years and older | 79 (100.0%) | 0 (0.0%) |
| Total | 1,434 (90.9%) | 143 (9.1%) |
Health Insurance Coverage by Citizenship Status in La Parguera
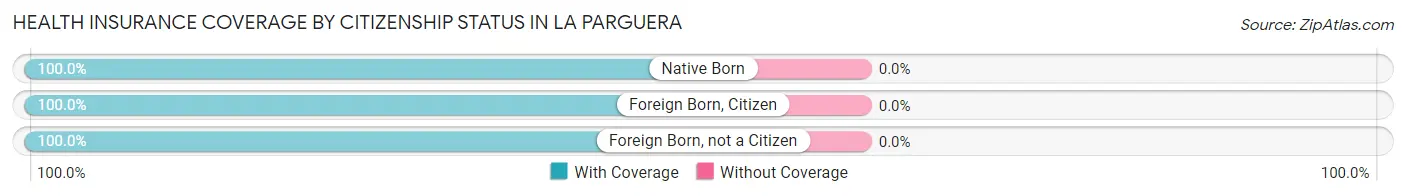
| Citizenship Status | With Coverage | Without Coverage |
| Native Born | 25 (100.0%) | 0 (0.0%) |
| Foreign Born, Citizen | 380 (100.0%) | 0 (0.0%) |
| Foreign Born, not a Citizen | 18 (100.0%) | 0 (0.0%) |
Health Insurance Coverage by Household Income in La Parguera
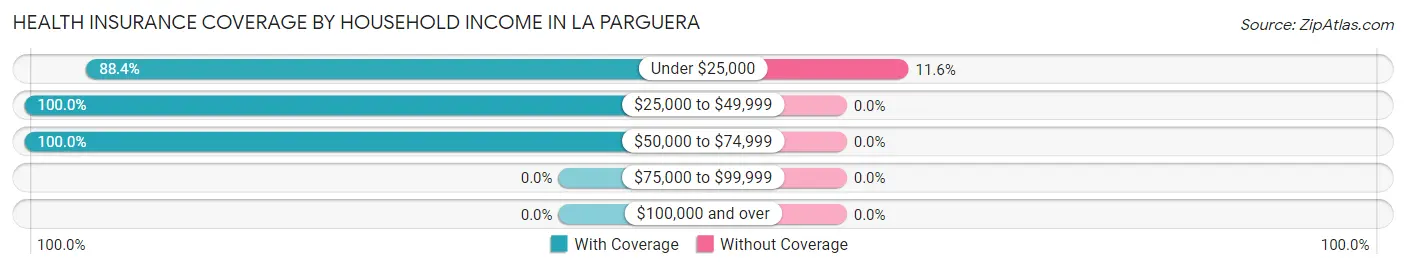
| Household Income | With Coverage | Without Coverage |
| Under $25,000 | 1,093 (88.4%) | 143 (11.6%) |
| $25,000 to $49,999 | 250 (100.0%) | 0 (0.0%) |
| $50,000 to $74,999 | 91 (100.0%) | 0 (0.0%) |
| $75,000 to $99,999 | 0 (0.0%) | 0 (0.0%) |
| $100,000 and over | 0 (0.0%) | 0 (0.0%) |
Public vs Private Health Insurance Coverage by Age in La Parguera
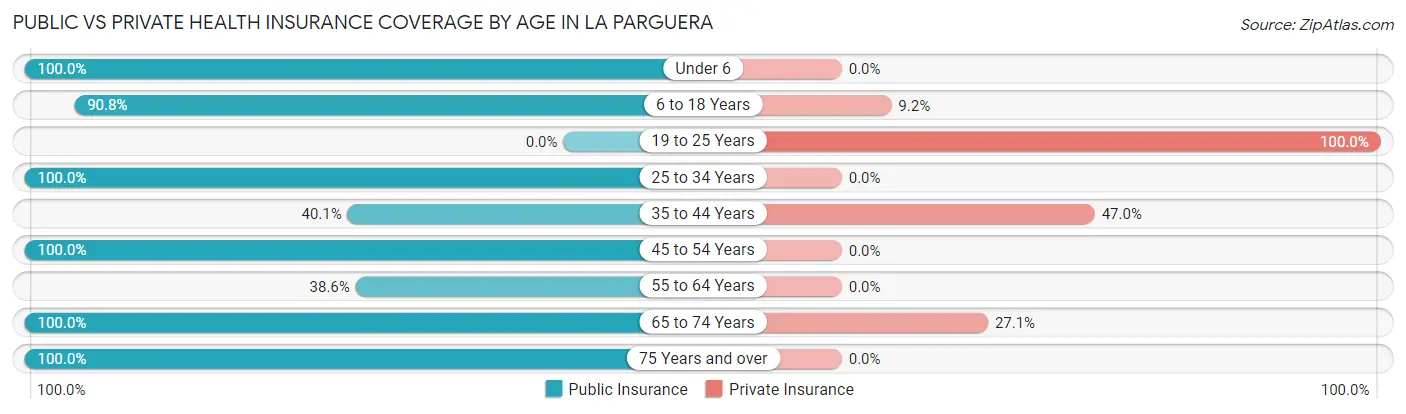
| Age Bracket | Public Insurance | Private Insurance |
| Under 6 | 25 (100.0%) | 0 (0.0%) |
| 6 to 18 Years | 345 (90.8%) | 35 (9.2%) |
| 19 to 25 Years | 0 (0.0%) | 18 (100.0%) |
| 25 to 34 Years | 105 (100.0%) | 0 (0.0%) |
| 35 to 44 Years | 151 (40.1%) | 177 (46.9%) |
| 45 to 54 Years | 182 (100.0%) | 0 (0.0%) |
| 55 to 64 Years | 59 (38.6%) | 0 (0.0%) |
| 65 to 74 Years | 258 (100.0%) | 70 (27.1%) |
| 75 Years and over | 79 (100.0%) | 0 (0.0%) |
| Total | 1,204 (76.3%) | 300 (19.0%) |
Disability Status by Sex by Age in La Parguera
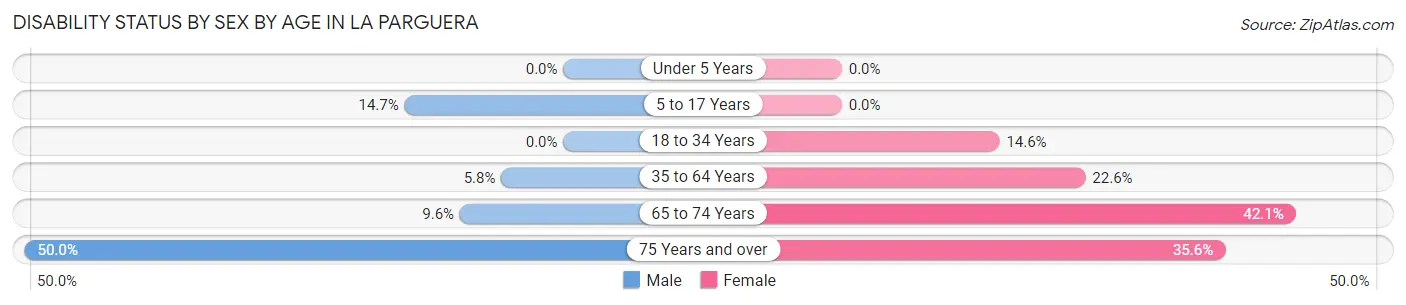
| Age Bracket | Male | Female |
| Under 5 Years | 0 (0.0%) | 0 (0.0%) |
| 5 to 17 Years | 37 (14.7%) | 0 (0.0%) |
| 18 to 34 Years | 0 (0.0%) | 18 (14.6%) |
| 35 to 64 Years | 26 (5.8%) | 59 (22.6%) |
| 65 to 74 Years | 12 (9.6%) | 56 (42.1%) |
| 75 Years and over | 17 (50.0%) | 16 (35.6%) |
Disability Class by Sex by Age in La Parguera
Disability Class: Hearing Difficulty
| Age Bracket | Male | Female |
| Under 5 Years | 0 (0.0%) | 0 (0.0%) |
| 5 to 17 Years | 0 (0.0%) | 0 (0.0%) |
| 18 to 34 Years | 0 (0.0%) | 0 (0.0%) |
| 35 to 64 Years | 0 (0.0%) | 0 (0.0%) |
| 65 to 74 Years | 0 (0.0%) | 0 (0.0%) |
| 75 Years and over | 0 (0.0%) | 0 (0.0%) |
Disability Class: Vision Difficulty
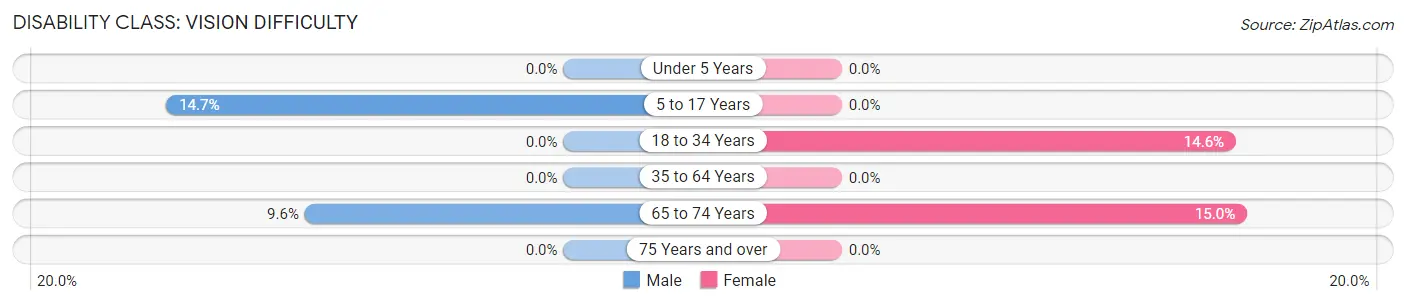
| Age Bracket | Male | Female |
| Under 5 Years | 0 (0.0%) | 0 (0.0%) |
| 5 to 17 Years | 37 (14.7%) | 0 (0.0%) |
| 18 to 34 Years | 0 (0.0%) | 18 (14.6%) |
| 35 to 64 Years | 0 (0.0%) | 0 (0.0%) |
| 65 to 74 Years | 12 (9.6%) | 20 (15.0%) |
| 75 Years and over | 0 (0.0%) | 0 (0.0%) |
Disability Class: Cognitive Difficulty
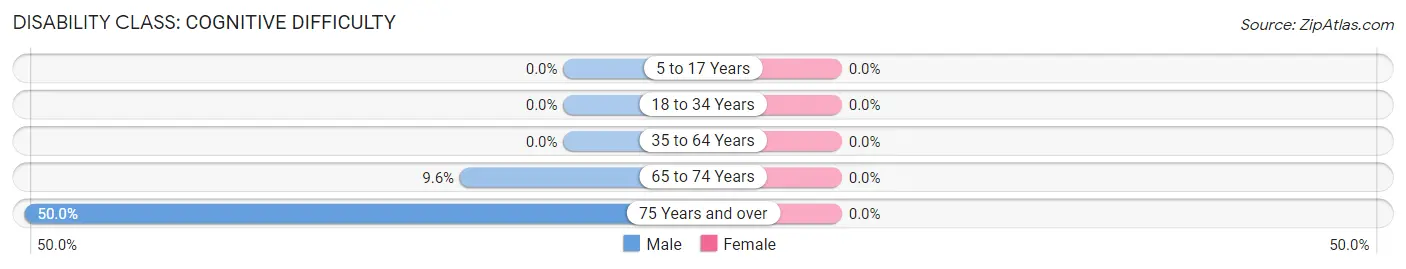
| Age Bracket | Male | Female |
| 5 to 17 Years | 0 (0.0%) | 0 (0.0%) |
| 18 to 34 Years | 0 (0.0%) | 0 (0.0%) |
| 35 to 64 Years | 0 (0.0%) | 0 (0.0%) |
| 65 to 74 Years | 12 (9.6%) | 0 (0.0%) |
| 75 Years and over | 17 (50.0%) | 0 (0.0%) |
Disability Class: Ambulatory Difficulty
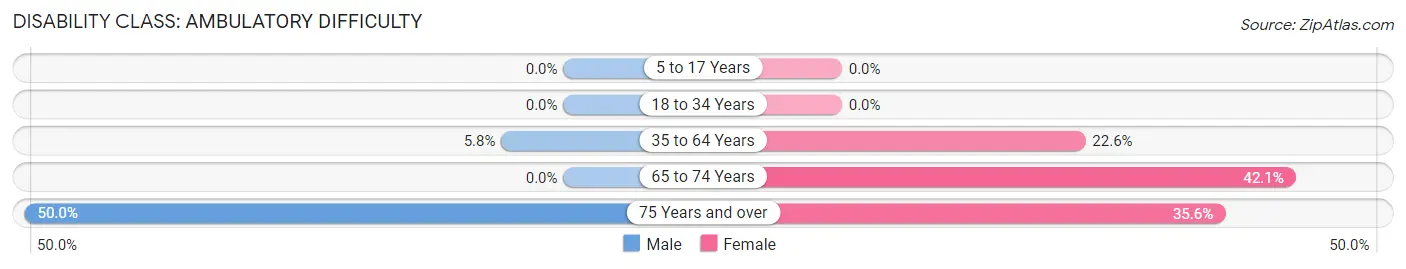
| Age Bracket | Male | Female |
| 5 to 17 Years | 0 (0.0%) | 0 (0.0%) |
| 18 to 34 Years | 0 (0.0%) | 0 (0.0%) |
| 35 to 64 Years | 26 (5.8%) | 59 (22.6%) |
| 65 to 74 Years | 0 (0.0%) | 56 (42.1%) |
| 75 Years and over | 17 (50.0%) | 16 (35.6%) |
Disability Class: Self-Care Difficulty
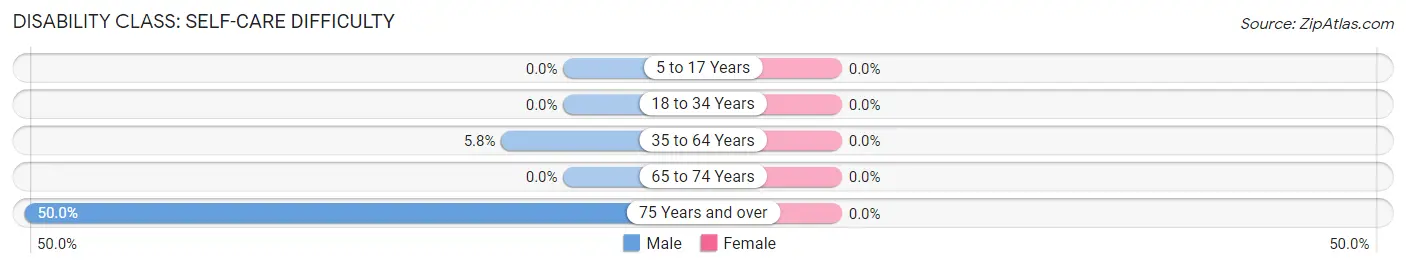
| Age Bracket | Male | Female |
| 5 to 17 Years | 0 (0.0%) | 0 (0.0%) |
| 18 to 34 Years | 0 (0.0%) | 0 (0.0%) |
| 35 to 64 Years | 26 (5.8%) | 0 (0.0%) |
| 65 to 74 Years | 0 (0.0%) | 0 (0.0%) |
| 75 Years and over | 17 (50.0%) | 0 (0.0%) |
Technology Access in La Parguera
Computing Device Access in La Parguera
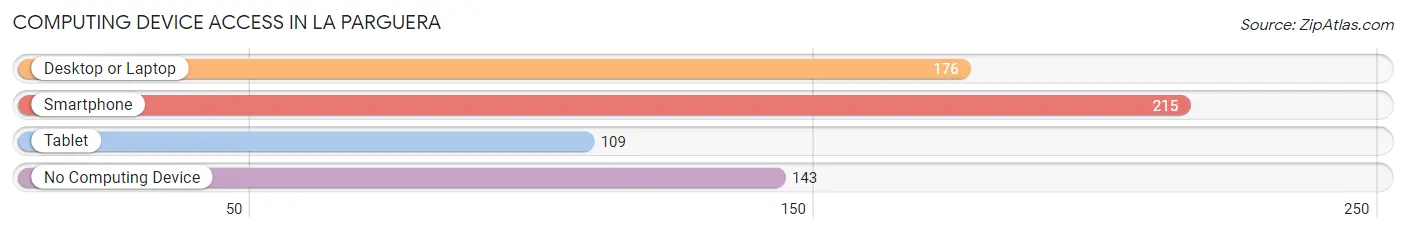
| Device Type | # Households | % Households |
| Desktop or Laptop | 176 | 41.3% |
| Smartphone | 215 | 50.5% |
| Tablet | 109 | 25.6% |
| No Computing Device | 143 | 33.6% |
| Total | 426 | 100.0% |
Internet Access in La Parguera
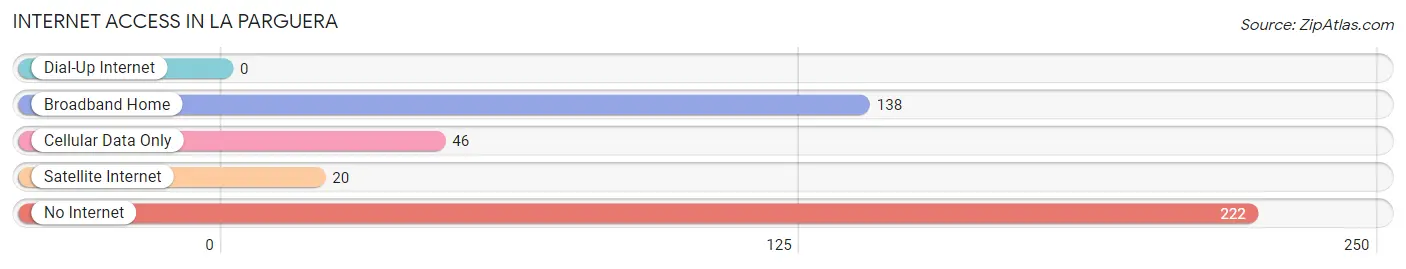
| Internet Type | # Households | % Households |
| Dial-Up Internet | 0 | 0.0% |
| Broadband Home | 138 | 32.4% |
| Cellular Data Only | 46 | 10.8% |
| Satellite Internet | 20 | 4.7% |
| No Internet | 222 | 52.1% |
| Total | 426 | 100.0% |
La Parguera Summary
La Parguera is a small fishing village located on the southwestern coast of Puerto Rico. It is situated in the municipality of Lajas, and is part of the Porta del Sol region. La Parguera is known for its beautiful beaches, mangroves, and coral reefs, and is a popular tourist destination.
History
The area of La Parguera was first settled by the Taíno Indians, who were the indigenous people of Puerto Rico. The Taíno named the area “Paragüera”, which means “place of the parrots”. The Taíno were eventually displaced by the Spanish, who colonized the island in the 16th century. The Spanish established a small fishing village in La Parguera, and the area became known for its abundance of fish and seafood.
In the 19th century, La Parguera became a popular destination for wealthy families from San Juan and other parts of Puerto Rico. They built luxurious homes in the area, and the village became known as a place of leisure and relaxation.
In the 20th century, La Parguera became a popular tourist destination. The village was connected to the rest of Puerto Rico by a bridge in the 1950s, and the area began to develop rapidly. In the 1970s, the village was declared a protected area, and the government began to invest in the development of the area.
Geography
La Parguera is located on the southwestern coast of Puerto Rico, in the municipality of Lajas. The village is situated on a small peninsula, and is surrounded by the Caribbean Sea on three sides. The area is known for its beautiful beaches, mangroves, and coral reefs.
The village is divided into two sections: La Parguera Pueblo and La Parguera Playa. La Parguera Pueblo is the main village, and is home to most of the businesses and services in the area. La Parguera Playa is the beach area, and is popular with tourists.
Economy
The economy of La Parguera is largely based on tourism. The village is a popular destination for both local and international tourists, and the area is known for its beautiful beaches, mangroves, and coral reefs. The village also has a number of restaurants, bars, and hotels, which cater to tourists.
In addition to tourism, La Parguera is also known for its fishing industry. The village is home to a number of fishing boats, and the area is known for its abundance of fish and seafood.
Demographics
As of the 2010 census, the population of La Parguera was 2,845. The majority of the population is of Puerto Rican descent, and the village is predominantly Roman Catholic. The village is also home to a small number of immigrants from other Caribbean countries, such as the Dominican Republic and Haiti.
La Parguera is a small but vibrant village, and is a popular tourist destination. The village is known for its beautiful beaches, mangroves, and coral reefs, and is a great place to relax and enjoy the Caribbean lifestyle.
Common Questions
What is Per Capita Income in La Parguera?
Per Capita income in La Parguera is $6,339.
What is Inequality or Gini Index in La Parguera?
Inequality or Gini Index in La Parguera is 0.57.
What is the Total Population of La Parguera?
Total Population of La Parguera is 1,577.
What is the Total Male Population of La Parguera?
Total Male Population of La Parguera is 861.
What is the Total Female Population of La Parguera?
Total Female Population of La Parguera is 716.
What is the Ratio of Males per 100 Females in La Parguera?
There are 120.25 Males per 100 Females in La Parguera.
What is the Ratio of Females per 100 Males in La Parguera?
There are 83.16 Females per 100 Males in La Parguera.
What is the Median Population Age in La Parguera?
Median Population Age in La Parguera is 42.5 Years.
What is the Average Family Size in La Parguera
Average Family Size in La Parguera is 4.8 People.
What is the Average Household Size in La Parguera
Average Household Size in La Parguera is 3.7 People.
How Large is the Labor Force in La Parguera?
There are 262 People in the Labor Forcein in La Parguera.
What is the Percentage of People in the Labor Force in La Parguera?
21.8% of People are in the Labor Force in La Parguera.
What is the Unemployment Rate in La Parguera?
Unemployment Rate in La Parguera is 32.4%.