McAlmont, AR Map & Demographics
McAlmont Map
McAlmont Overview
$9,864
PER CAPITA INCOME
$23,919
AVG FAMILY INCOME
$30,517
AVG HOUSEHOLD INCOME
27.0%
WAGE / INCOME GAP [ % ]
73.0¢/ $1
WAGE / INCOME GAP [ $ ]
0.28
INEQUALITY / GINI INDEX
1,584
TOTAL POPULATION
803
MALE POPULATION
781
FEMALE POPULATION
102.82
MALES / 100 FEMALES
97.26
FEMALES / 100 MALES
10.1
MEDIAN AGE
4.2
AVG FAMILY SIZE
2.9
AVG HOUSEHOLD SIZE
488
LABOR FORCE [ PEOPLE ]
69.8%
PERCENT IN LABOR FORCE
46.9%
UNEMPLOYMENT RATE
Income in McAlmont
Income Overview in McAlmont
Per Capita Income in McAlmont is $9,864, while median incomes of families and households are $23,919 and $30,517 respectively.
| Characteristic | Number | Measure |
| Per Capita Income | 1,584 | $9,864 |
| Median Family Income | 302 | $23,919 |
| Mean Family Income | 302 | $24,966 |
| Median Household Income | 538 | $30,517 |
| Mean Household Income | 538 | $28,913 |
| Income Deficit | 302 | $0 |
| Wage / Income Gap (%) | 1,584 | 26.98% |
| Wage / Income Gap ($) | 1,584 | 73.02¢ per $1 |
| Gini / Inequality Index | 1,584 | 0.28 |
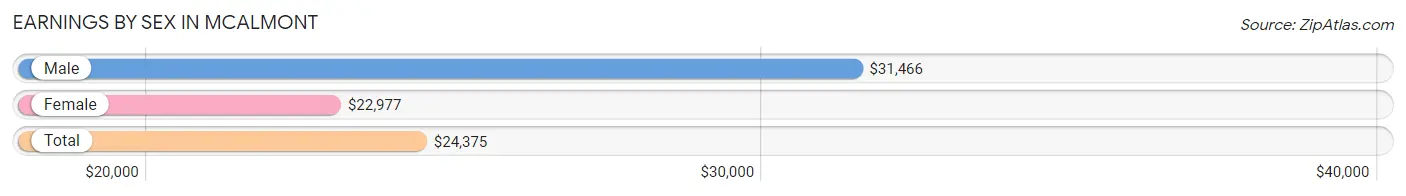
Earnings by Sex in McAlmont
Average Earnings in McAlmont are $24,375, $31,466 for men and $22,977 for women, a difference of 27.0%.
| Sex | Number | Average Earnings |
| Male | 242 (48.6%) | $31,466 |
| Female | 256 (51.4%) | $22,977 |
| Total | 498 (100.0%) | $24,375 |
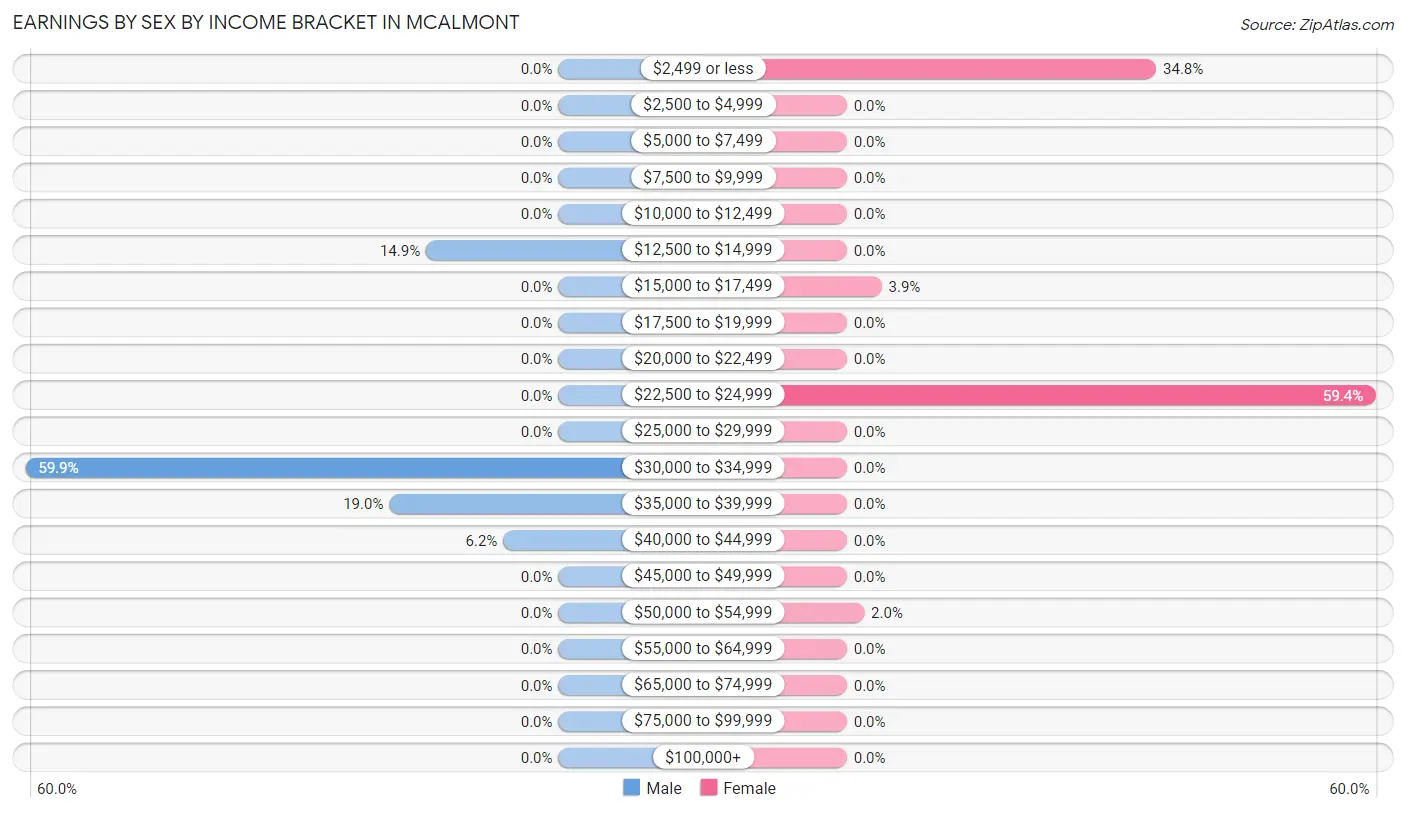
Earnings by Sex by Income Bracket in McAlmont
The most common earnings brackets in McAlmont are $30,000 to $34,999 for men (145 | 59.9%) and $22,500 to $24,999 for women (152 | 59.4%).
| Income | Male | Female |
| $2,499 or less | 0 (0.0%) | 89 (34.8%) |
| $2,500 to $4,999 | 0 (0.0%) | 0 (0.0%) |
| $5,000 to $7,499 | 0 (0.0%) | 0 (0.0%) |
| $7,500 to $9,999 | 0 (0.0%) | 0 (0.0%) |
| $10,000 to $12,499 | 0 (0.0%) | 0 (0.0%) |
| $12,500 to $14,999 | 36 (14.9%) | 0 (0.0%) |
| $15,000 to $17,499 | 0 (0.0%) | 10 (3.9%) |
| $17,500 to $19,999 | 0 (0.0%) | 0 (0.0%) |
| $20,000 to $22,499 | 0 (0.0%) | 0 (0.0%) |
| $22,500 to $24,999 | 0 (0.0%) | 152 (59.4%) |
| $25,000 to $29,999 | 0 (0.0%) | 0 (0.0%) |
| $30,000 to $34,999 | 145 (59.9%) | 0 (0.0%) |
| $35,000 to $39,999 | 46 (19.0%) | 0 (0.0%) |
| $40,000 to $44,999 | 15 (6.2%) | 0 (0.0%) |
| $45,000 to $49,999 | 0 (0.0%) | 0 (0.0%) |
| $50,000 to $54,999 | 0 (0.0%) | 5 (1.9%) |
| $55,000 to $64,999 | 0 (0.0%) | 0 (0.0%) |
| $65,000 to $74,999 | 0 (0.0%) | 0 (0.0%) |
| $75,000 to $99,999 | 0 (0.0%) | 0 (0.0%) |
| $100,000+ | 0 (0.0%) | 0 (0.0%) |
| Total | 242 (100.0%) | 256 (100.0%) |
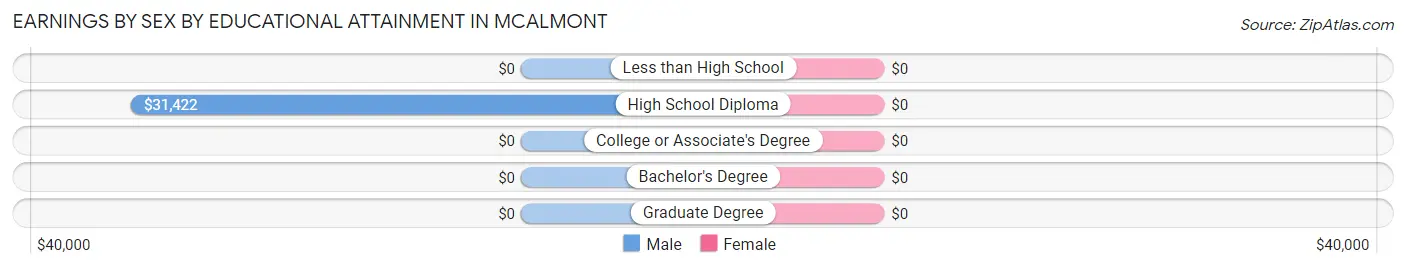
Earnings by Sex by Educational Attainment in McAlmont
| Educational Attainment | Male Income | Female Income |
| Less than High School | - | - |
| High School Diploma | $31,422 | $0 |
| College or Associate's Degree | - | - |
| Bachelor's Degree | - | - |
| Graduate Degree | - | - |
| Total | $31,466 | $23,668 |
Family Income in McAlmont
Family Income Brackets in McAlmont
According to the McAlmont family income data, there are 118 families falling into the $15,000 to $24,999 income range, which is the most common income bracket and makes up 39.1% of all families.
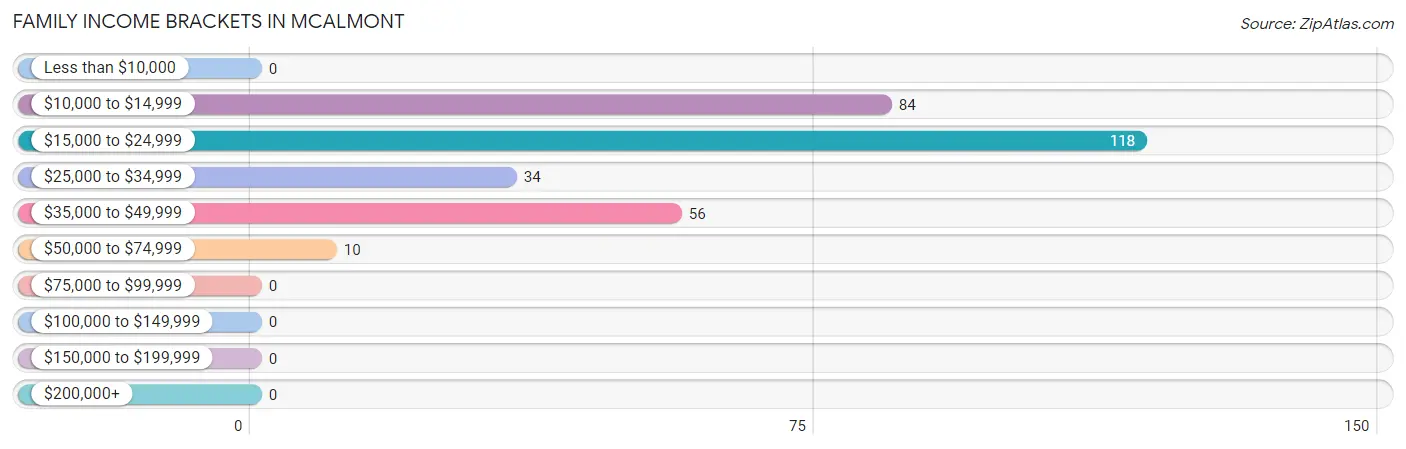
| Income Bracket | # Families | % Families |
| Less than $10,000 | 0 | 0.0% |
| $10,000 to $14,999 | 84 | 27.8% |
| $15,000 to $24,999 | 118 | 39.1% |
| $25,000 to $34,999 | 34 | 11.3% |
| $35,000 to $49,999 | 56 | 18.5% |
| $50,000 to $74,999 | 10 | 3.3% |
| $75,000 to $99,999 | 0 | 0.0% |
| $100,000 to $149,999 | 0 | 0.0% |
| $150,000 to $199,999 | 0 | 0.0% |
| $200,000+ | 0 | 0.0% |
Family Income by Famaliy Size in McAlmont
2-person families (20 | 6.6%) account for the highest median family income in McAlmont with $57,500 per family, while 2-person families (20 | 6.6%) have the highest median income of $28,750 per family member.
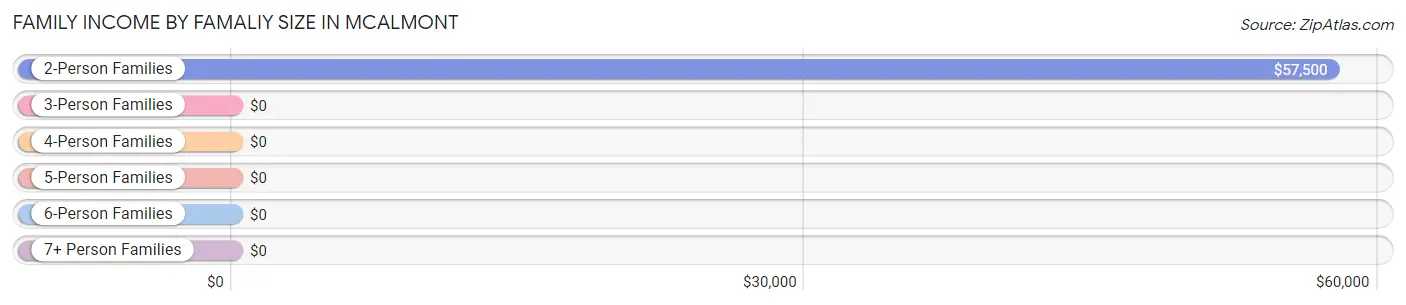
| Income Bracket | # Families | Median Income |
| 2-Person Families | 20 (6.6%) | $57,500 |
| 3-Person Families | 80 (26.5%) | $0 |
| 4-Person Families | 118 (39.1%) | $0 |
| 5-Person Families | 84 (27.8%) | $0 |
| 6-Person Families | 0 (0.0%) | $0 |
| 7+ Person Families | 0 (0.0%) | $0 |
| Total | 302 (100.0%) | $23,919 |
Family Income by Number of Earners in McAlmont
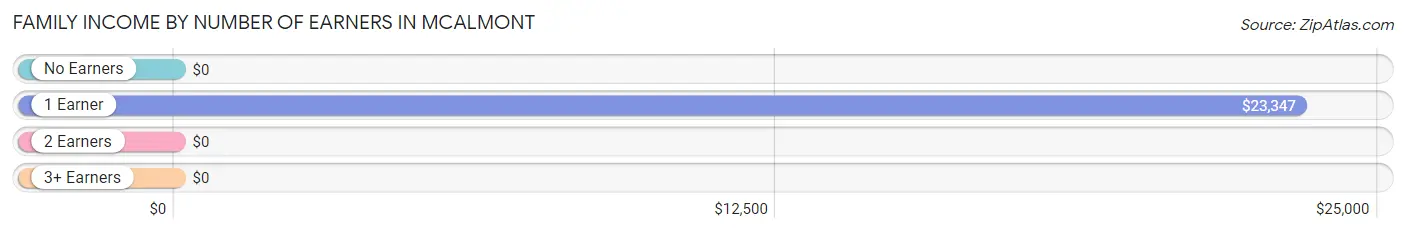
| Number of Earners | # Families | Median Income |
| No Earners | 39 (12.9%) | $0 |
| 1 Earner | 248 (82.1%) | $23,347 |
| 2 Earners | 15 (5.0%) | $0 |
| 3+ Earners | 0 (0.0%) | $0 |
| Total | 302 (100.0%) | $23,919 |
Household Income in McAlmont
Household Income Brackets in McAlmont
With 145 households falling in the category, the $25,000 to $34,999 income range is the most frequent in McAlmont, accounting for 27.0% of all households.
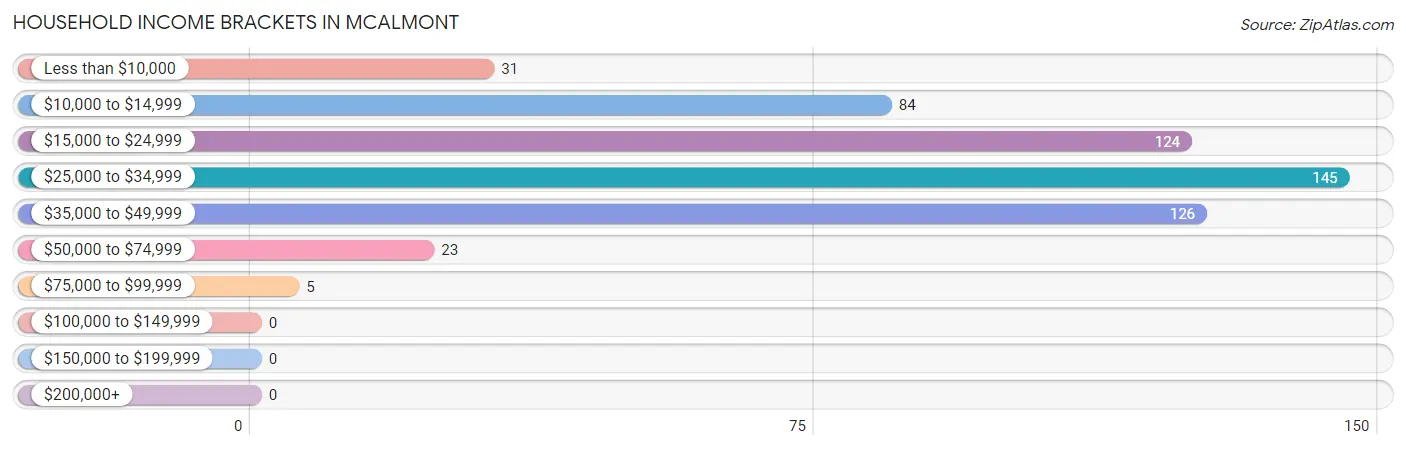
| Income Bracket | # Households | % Households |
| Less than $10,000 | 31 | 5.8% |
| $10,000 to $14,999 | 84 | 15.6% |
| $15,000 to $24,999 | 124 | 23.0% |
| $25,000 to $34,999 | 145 | 27.0% |
| $35,000 to $49,999 | 126 | 23.4% |
| $50,000 to $74,999 | 23 | 4.3% |
| $75,000 to $99,999 | 5 | 0.9% |
| $100,000 to $149,999 | 0 | 0.0% |
| $150,000 to $199,999 | 0 | 0.0% |
| $200,000+ | 0 | 0.0% |
Household Income by Householder Age in McAlmont
The median household income in McAlmont is $30,517, with the highest median household income of $43,235 found in the 65+ years age bracket for the primary householder. A total of 104 households (19.3%) fall into this category. Meanwhile, the 15 to 24 years age bracket for the primary householder has the lowest median household income of $0, with 84 households (15.6%) in this group.
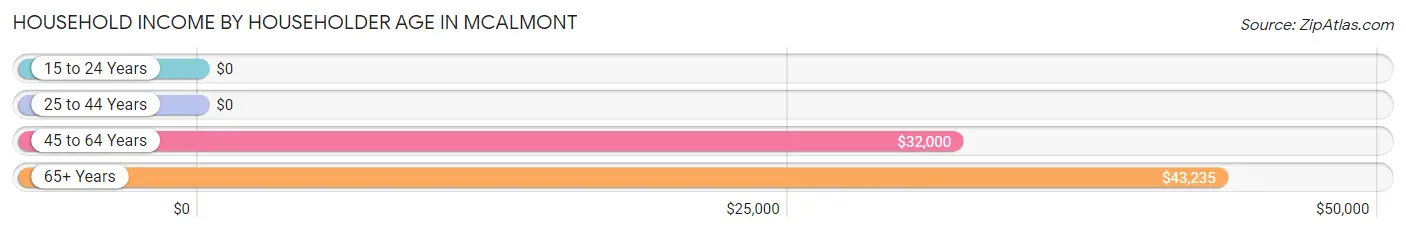
| Income Bracket | # Households | Median Income |
| 15 to 24 Years | 84 (15.6%) | $0 |
| 25 to 44 Years | 118 (21.9%) | $0 |
| 45 to 64 Years | 232 (43.1%) | $32,000 |
| 65+ Years | 104 (19.3%) | $43,235 |
| Total | 538 (100.0%) | $30,517 |
Poverty in McAlmont
Income Below Poverty by Sex and Age in McAlmont
With 60.2% poverty level for males and 70.6% for females among the residents of McAlmont, under 5 year old males and under 5 year old females are the most vulnerable to poverty, with 241 males (100.0%) and 123 females (100.0%) in their respective age groups living below the poverty level.
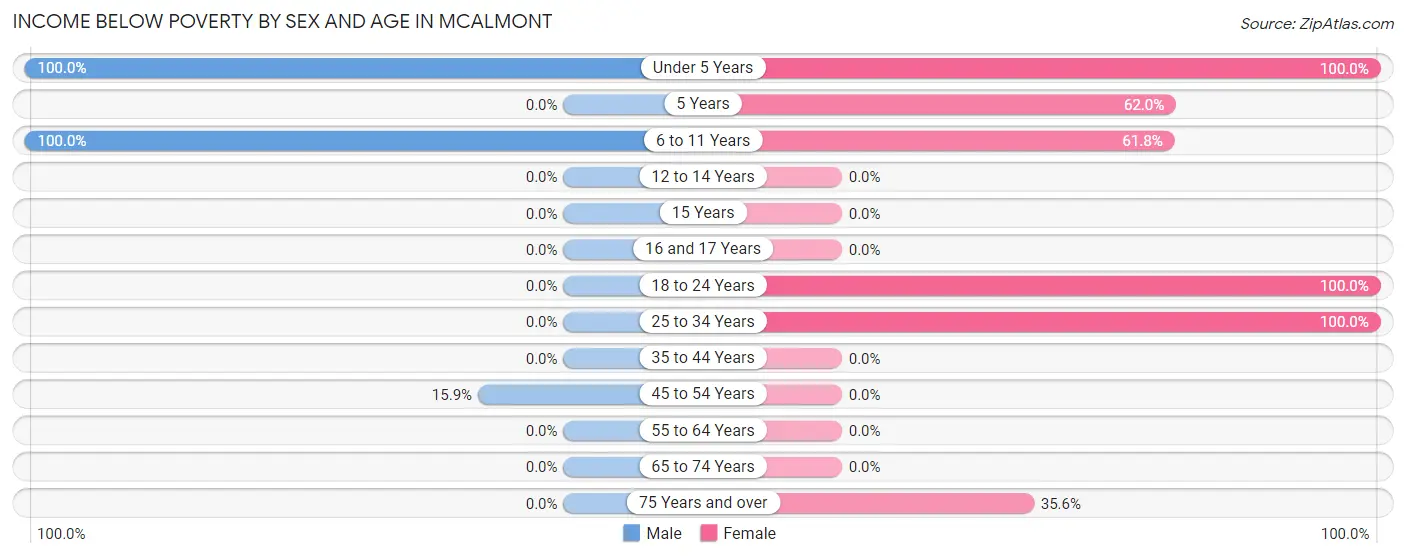
| Age Bracket | Male | Female |
| Under 5 Years | 241 (100.0%) | 123 (100.0%) |
| 5 Years | 0 (0.0%) | 98 (62.0%) |
| 6 to 11 Years | 206 (100.0%) | 97 (61.8%) |
| 12 to 14 Years | 0 (0.0%) | 0 (0.0%) |
| 15 Years | 0 (0.0%) | 0 (0.0%) |
| 16 and 17 Years | 0 (0.0%) | 0 (0.0%) |
| 18 to 24 Years | 0 (0.0%) | 84 (100.0%) |
| 25 to 34 Years | 0 (0.0%) | 118 (100.0%) |
| 35 to 44 Years | 0 (0.0%) | 0 (0.0%) |
| 45 to 54 Years | 36 (15.9%) | 0 (0.0%) |
| 55 to 64 Years | 0 (0.0%) | 0 (0.0%) |
| 65 to 74 Years | 0 (0.0%) | 0 (0.0%) |
| 75 Years and over | 0 (0.0%) | 31 (35.6%) |
| Total | 483 (60.2%) | 551 (70.6%) |
Income Above Poverty by Sex and Age in McAlmont
According to the poverty statistics in McAlmont, males aged 55 to 64 years and females aged 45 to 54 years are the age groups that are most secure financially, with 100.0% of males and 100.0% of females in these age groups living above the poverty line.
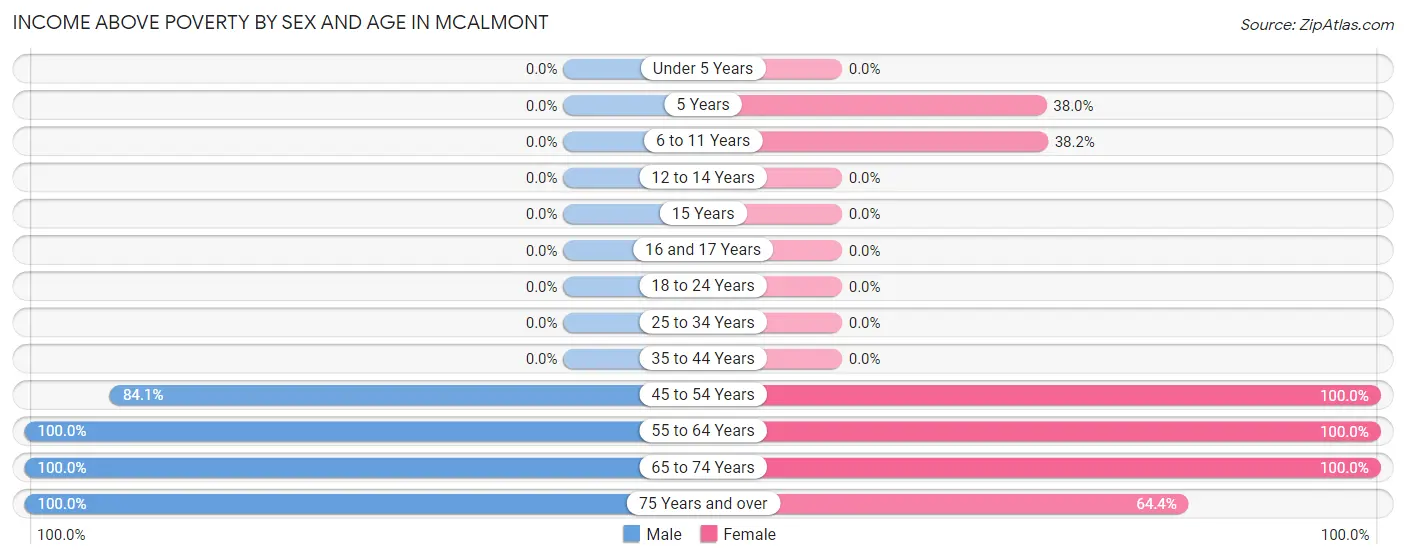
| Age Bracket | Male | Female |
| Under 5 Years | 0 (0.0%) | 0 (0.0%) |
| 5 Years | 0 (0.0%) | 60 (38.0%) |
| 6 to 11 Years | 0 (0.0%) | 60 (38.2%) |
| 12 to 14 Years | 0 (0.0%) | 0 (0.0%) |
| 15 Years | 0 (0.0%) | 0 (0.0%) |
| 16 and 17 Years | 0 (0.0%) | 0 (0.0%) |
| 18 to 24 Years | 0 (0.0%) | 0 (0.0%) |
| 25 to 34 Years | 0 (0.0%) | 0 (0.0%) |
| 35 to 44 Years | 0 (0.0%) | 0 (0.0%) |
| 45 to 54 Years | 191 (84.1%) | 34 (100.0%) |
| 55 to 64 Years | 68 (100.0%) | 15 (100.0%) |
| 65 to 74 Years | 50 (100.0%) | 5 (100.0%) |
| 75 Years and over | 11 (100.0%) | 56 (64.4%) |
| Total | 320 (39.9%) | 230 (29.4%) |
Income Below Poverty Among Married-Couple Families in McAlmont
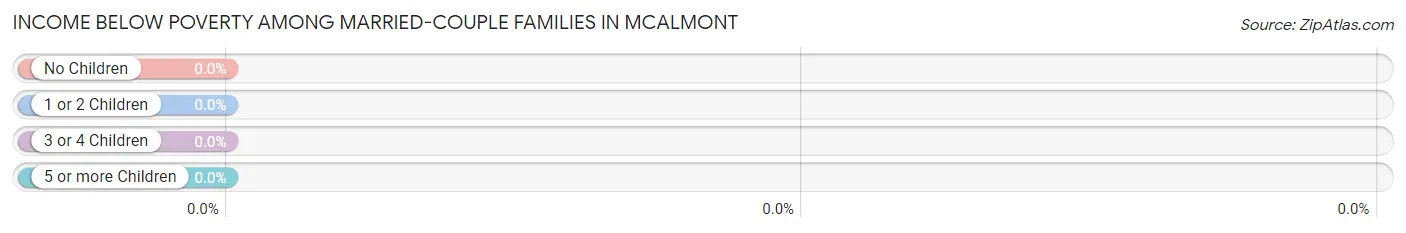
| Children | Above Poverty | Below Poverty |
| No Children | 20 (100.0%) | 0 (0.0%) |
| 1 or 2 Children | 0 (0.0%) | 0 (0.0%) |
| 3 or 4 Children | 0 (0.0%) | 0 (0.0%) |
| 5 or more Children | 0 (0.0%) | 0 (0.0%) |
| Total | 20 (100.0%) | 0 (0.0%) |
Income Below Poverty Among Single-Parent Households in McAlmont
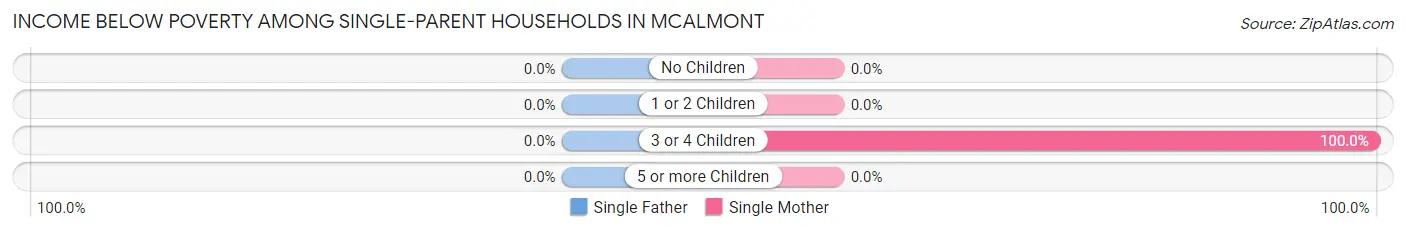
| Children | Single Father | Single Mother |
| No Children | 0 (0.0%) | 0 (0.0%) |
| 1 or 2 Children | 0 (0.0%) | 0 (0.0%) |
| 3 or 4 Children | 0 (0.0%) | 202 (100.0%) |
| 5 or more Children | 0 (0.0%) | 0 (0.0%) |
| Total | 0 (0.0%) | 202 (85.6%) |
Income Below Poverty Among Married-Couple vs Single-Parent Households in McAlmont
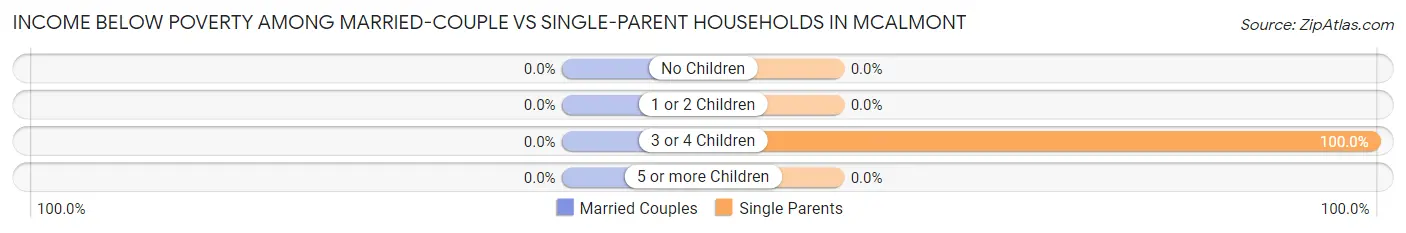
| Children | Married-Couple Families | Single-Parent Households |
| No Children | 0 (0.0%) | 0 (0.0%) |
| 1 or 2 Children | 0 (0.0%) | 0 (0.0%) |
| 3 or 4 Children | 0 (0.0%) | 202 (100.0%) |
| 5 or more Children | 0 (0.0%) | 0 (0.0%) |
| Total | 0 (0.0%) | 202 (71.6%) |
Race in McAlmont
The most populous races in McAlmont are Black / African American (1,461 | 92.2%), Two or more Races (68 | 4.3%), and White / Caucasian (55 | 3.5%).
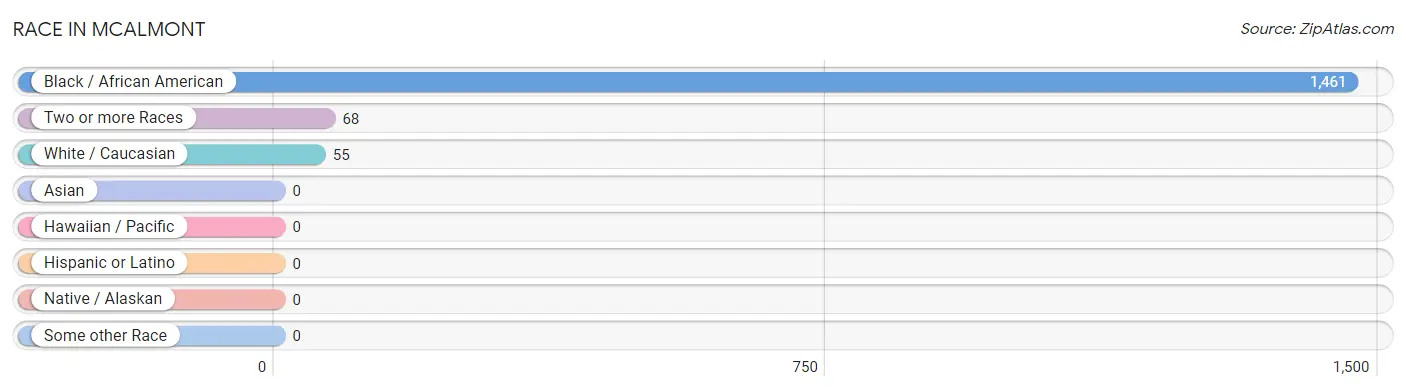
| Race | # Population | % Population |
| Asian | 0 | 0.0% |
| Black / African American | 1,461 | 92.2% |
| Hawaiian / Pacific | 0 | 0.0% |
| Hispanic or Latino | 0 | 0.0% |
| Native / Alaskan | 0 | 0.0% |
| White / Caucasian | 55 | 3.5% |
| Two or more Races | 68 | 4.3% |
| Some other Race | 0 | 0.0% |
| Total | 1,584 | 100.0% |
Ancestry in McAlmont
The most populous ancestries reported in McAlmont are French (5 | 0.3%), and German (5 | 0.3%), together accounting for 0.6% of all McAlmont residents.
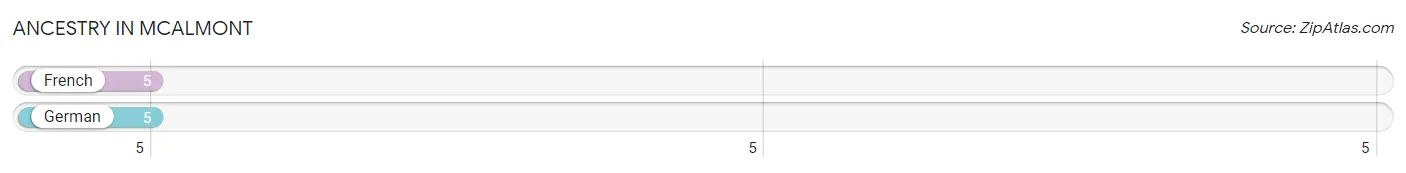
| Ancestry | # Population | % Population |
| French | 5 | 0.3% |
| German | 5 | 0.3% | View All 2 Rows |
Immigrants in McAlmont

| Immigration Origin | # Population | % Population | View All 0 Rows |
Sex and Age in McAlmont
Sex and Age in McAlmont
The most populous age groups in McAlmont are Under 5 Years (241 | 30.0%) for men and 5 to 9 Years (315 | 40.3%) for women.
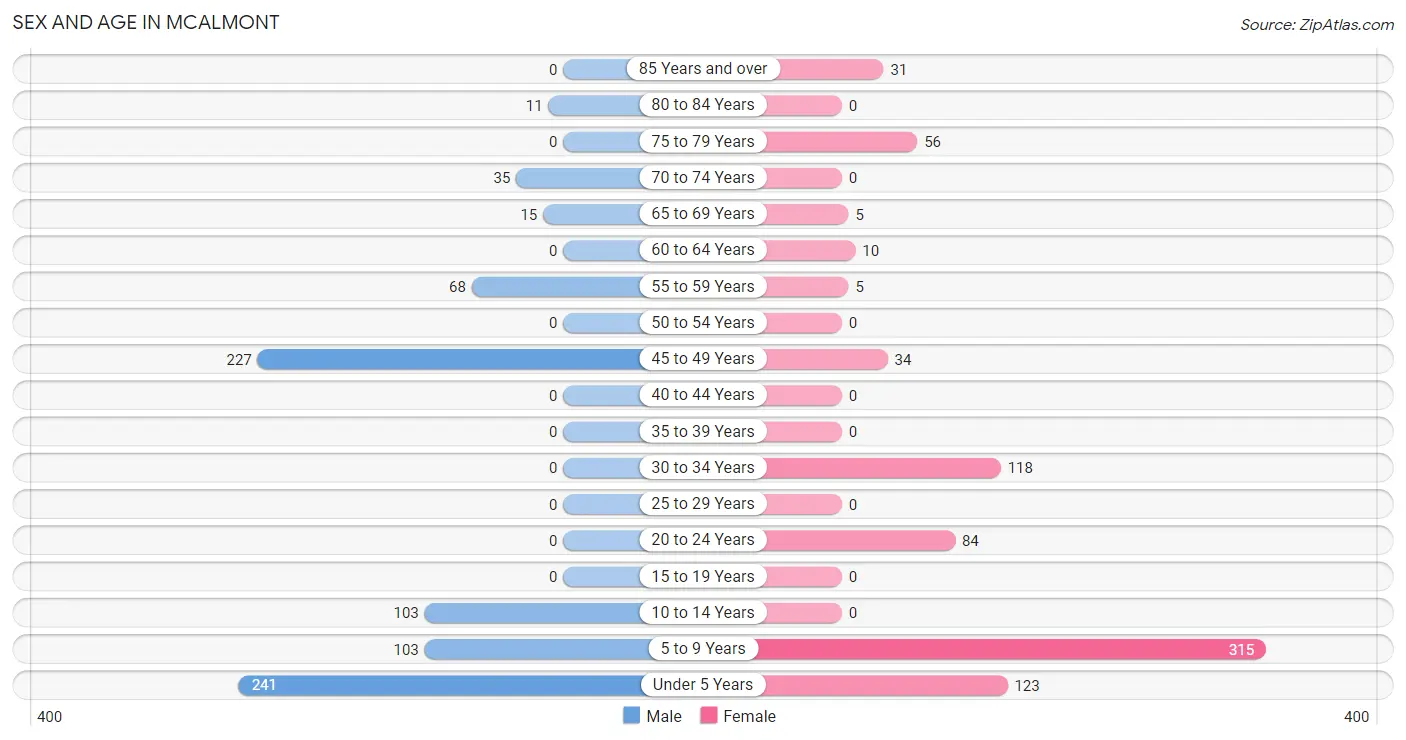
| Age Bracket | Male | Female |
| Under 5 Years | 241 (30.0%) | 123 (15.8%) |
| 5 to 9 Years | 103 (12.8%) | 315 (40.3%) |
| 10 to 14 Years | 103 (12.8%) | 0 (0.0%) |
| 15 to 19 Years | 0 (0.0%) | 0 (0.0%) |
| 20 to 24 Years | 0 (0.0%) | 84 (10.8%) |
| 25 to 29 Years | 0 (0.0%) | 0 (0.0%) |
| 30 to 34 Years | 0 (0.0%) | 118 (15.1%) |
| 35 to 39 Years | 0 (0.0%) | 0 (0.0%) |
| 40 to 44 Years | 0 (0.0%) | 0 (0.0%) |
| 45 to 49 Years | 227 (28.3%) | 34 (4.3%) |
| 50 to 54 Years | 0 (0.0%) | 0 (0.0%) |
| 55 to 59 Years | 68 (8.5%) | 5 (0.6%) |
| 60 to 64 Years | 0 (0.0%) | 10 (1.3%) |
| 65 to 69 Years | 15 (1.9%) | 5 (0.6%) |
| 70 to 74 Years | 35 (4.4%) | 0 (0.0%) |
| 75 to 79 Years | 0 (0.0%) | 56 (7.2%) |
| 80 to 84 Years | 11 (1.4%) | 0 (0.0%) |
| 85 Years and over | 0 (0.0%) | 31 (4.0%) |
| Total | 803 (100.0%) | 781 (100.0%) |
Families and Households in McAlmont
Median Family Size in McAlmont
The median family size in McAlmont is 4.24 persons per family, with single female/mother families (236 | 78.1%) accounting for the largest median family size of 4.53 persons per family. On the other hand, married-couple families (20 | 6.6%) represent the smallest median family size with 2.20 persons per family.
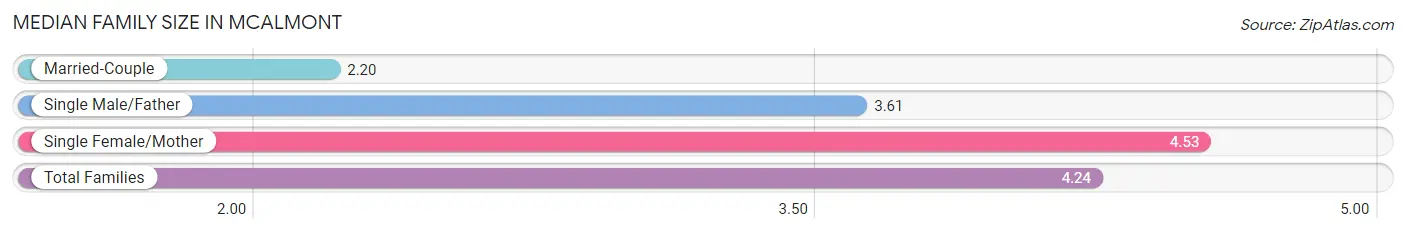
| Family Type | # Families | Family Size |
| Married-Couple | 20 (6.6%) | 2.20 |
| Single Male/Father | 46 (15.2%) | 3.61 |
| Single Female/Mother | 236 (78.1%) | 4.53 |
| Total Families | 302 (100.0%) | 4.24 |
Median Household Size in McAlmont
The median household size in McAlmont is 2.94 persons per household, with single female/mother households (236 | 43.9%) accounting for the largest median household size of 4.68 persons per household. non-family households (236 | 43.9%) represent the smallest median household size with 1.14 persons per household.
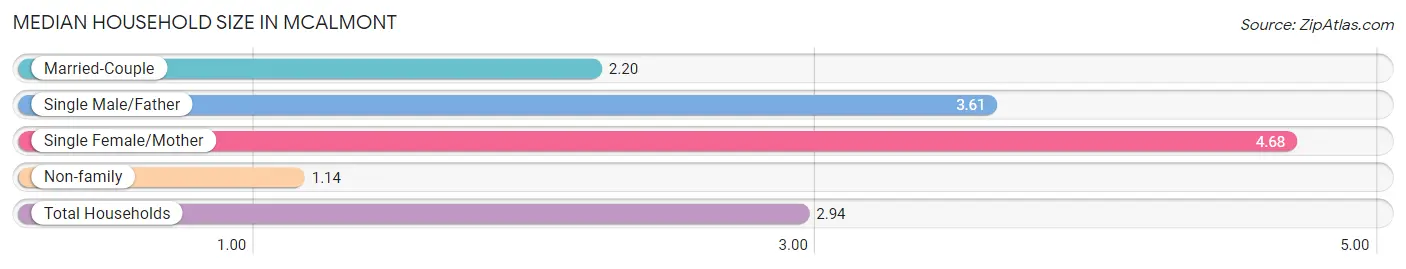
| Household Type | # Households | Household Size |
| Married-Couple | 20 (3.7%) | 2.20 |
| Single Male/Father | 46 (8.6%) | 3.61 |
| Single Female/Mother | 236 (43.9%) | 4.68 |
| Non-family | 236 (43.9%) | 1.14 |
| Total Households | 538 (100.0%) | 2.94 |
Household Size by Marriage Status in McAlmont
Out of a total of 538 households in McAlmont, 302 (56.1%) are family households, while 236 (43.9%) are nonfamily households. The most numerous type of family households are 4-person households, comprising 152, and the most common type of nonfamily households are 1-person households, comprising 200.
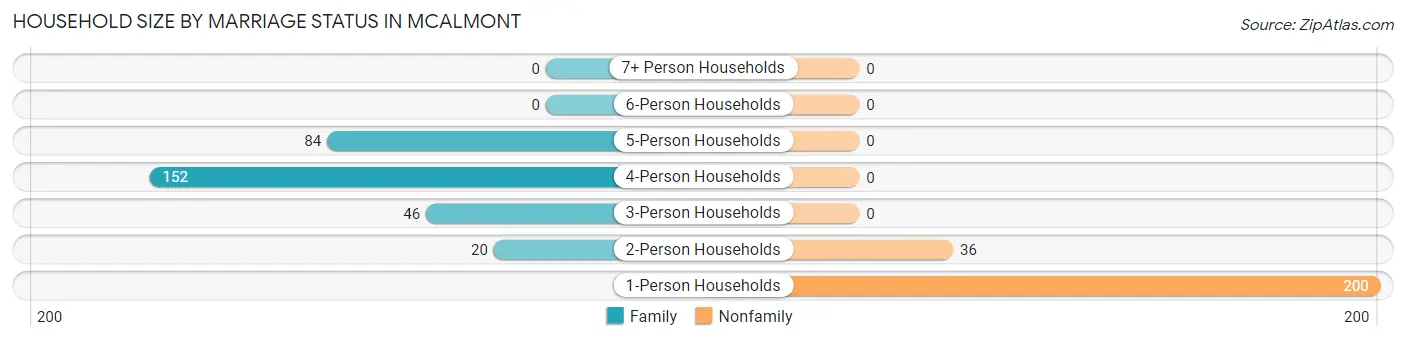
| Household Size | Family Households | Nonfamily Households |
| 1-Person Households | - | 200 (37.2%) |
| 2-Person Households | 20 (3.7%) | 36 (6.7%) |
| 3-Person Households | 46 (8.6%) | 0 (0.0%) |
| 4-Person Households | 152 (28.2%) | 0 (0.0%) |
| 5-Person Households | 84 (15.6%) | 0 (0.0%) |
| 6-Person Households | 0 (0.0%) | 0 (0.0%) |
| 7+ Person Households | 0 (0.0%) | 0 (0.0%) |
| Total | 302 (56.1%) | 236 (43.9%) |
Female Fertility in McAlmont
Fertility by Age in McAlmont
| Age Bracket | Women with Births | Births / 1,000 Women |
| 15 to 19 years | 0 (0.0%) | 0.0 |
| 20 to 34 years | 0 (0.0%) | 0.0 |
| 35 to 50 years | 0 (0.0%) | 0.0 |
| Total | 0 (0.0%) | 0.0 |
Fertility by Age by Marriage Status in McAlmont
| Age Bracket | Married | Unmarried |
| 15 to 19 years | 0 (0.0%) | 0 (0.0%) |
| 20 to 34 years | 0 (0.0%) | 0 (0.0%) |
| 35 to 50 years | 0 (0.0%) | 0 (0.0%) |
| Total | 0 (0.0%) | 0 (0.0%) |
Fertility by Education in McAlmont
| Educational Attainment | Women with Births | Births / 1,000 Women |
| Less than High School | 0 (0.0%) | 0.0 |
| High School Diploma | 0 (0.0%) | 0.0 |
| College or Associate's Degree | 0 (0.0%) | 0.0 |
| Bachelor's Degree | 0 (0.0%) | 0.0 |
| Graduate Degree | 0 (0.0%) | 0.0 |
| Total | 0 (0.0%) | 0.0 |
Fertility by Education by Marriage Status in McAlmont
| Educational Attainment | Married | Unmarried |
| Less than High School | 0 (0.0%) | 0 (0.0%) |
| High School Diploma | 0 (0.0%) | 0 (0.0%) |
| College or Associate's Degree | 0 (0.0%) | 0 (0.0%) |
| Bachelor's Degree | 0 (0.0%) | 0 (0.0%) |
| Graduate Degree | 0 (0.0%) | 0 (0.0%) |
| Total | 0 (0.0%) | 0 (0.0%) |
Employment Characteristics in McAlmont
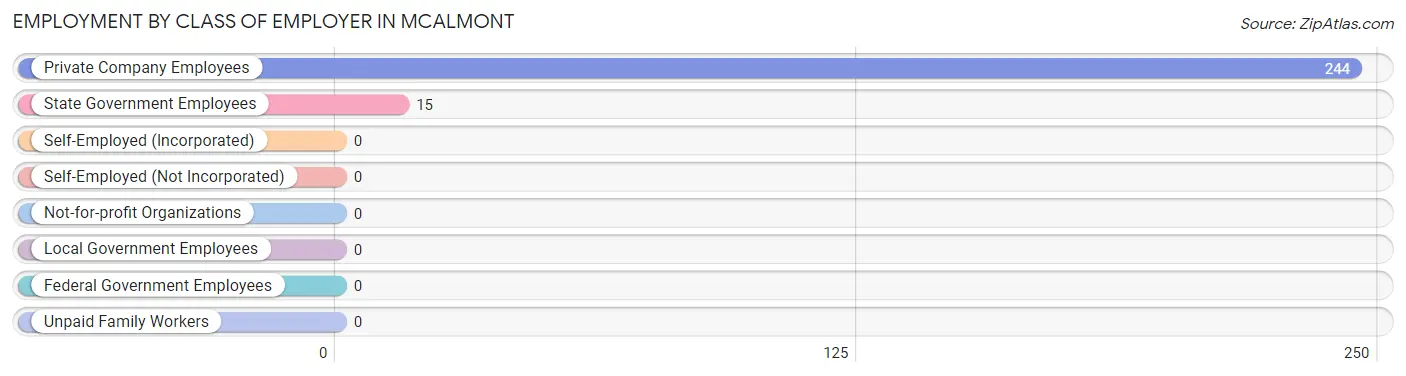
Employment by Class of Employer in McAlmont
Among the 259 employed individuals in McAlmont, private company employees (244 | 94.2%), and state government employees (15 | 5.8%) make up the most common classes of employment.
| Employer Class | # Employees | % Employees |
| Private Company Employees | 244 | 94.2% |
| Self-Employed (Incorporated) | 0 | 0.0% |
| Self-Employed (Not Incorporated) | 0 | 0.0% |
| Not-for-profit Organizations | 0 | 0.0% |
| Local Government Employees | 0 | 0.0% |
| State Government Employees | 15 | 5.8% |
| Federal Government Employees | 0 | 0.0% |
| Unpaid Family Workers | 0 | 0.0% |
| Total | 259 | 100.0% |
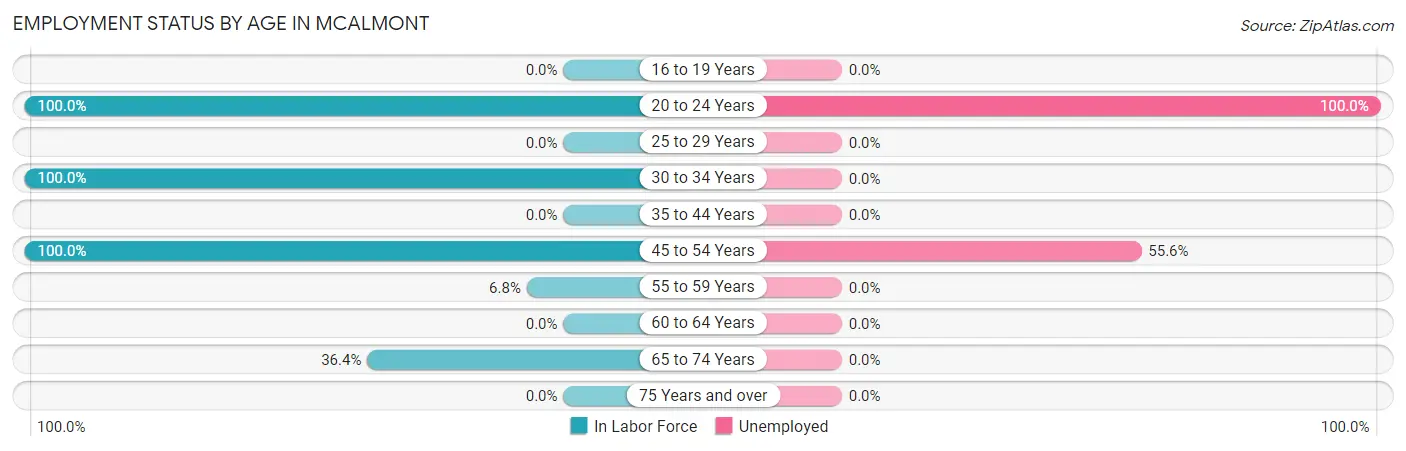
Employment Status by Age in McAlmont
According to the labor force statistics for McAlmont, out of the total population over 16 years of age (699), 69.8% or 488 individuals are in the labor force, with 46.9% or 229 of them unemployed. The age group with the highest labor force participation rate is 20 to 24 years, with 100.0% or 84 individuals in the labor force. Within the labor force, the 20 to 24 years age range has the highest percentage of unemployed individuals, with 100.0% or 84 of them being unemployed.
| Age Bracket | In Labor Force | Unemployed |
| 16 to 19 Years | 0 (0.0%) | 0 (0.0%) |
| 20 to 24 Years | 84 (100.0%) | 84 (100.0%) |
| 25 to 29 Years | 0 (0.0%) | 0 (0.0%) |
| 30 to 34 Years | 118 (100.0%) | 0 (0.0%) |
| 35 to 44 Years | 0 (0.0%) | 0 (0.0%) |
| 45 to 54 Years | 261 (100.0%) | 145 (55.6%) |
| 55 to 59 Years | 5 (6.8%) | 0 (0.0%) |
| 60 to 64 Years | 0 (0.0%) | 0 (0.0%) |
| 65 to 74 Years | 20 (36.4%) | 0 (0.0%) |
| 75 Years and over | 0 (0.0%) | 0 (0.0%) |
| Total | 488 (69.8%) | 229 (46.9%) |
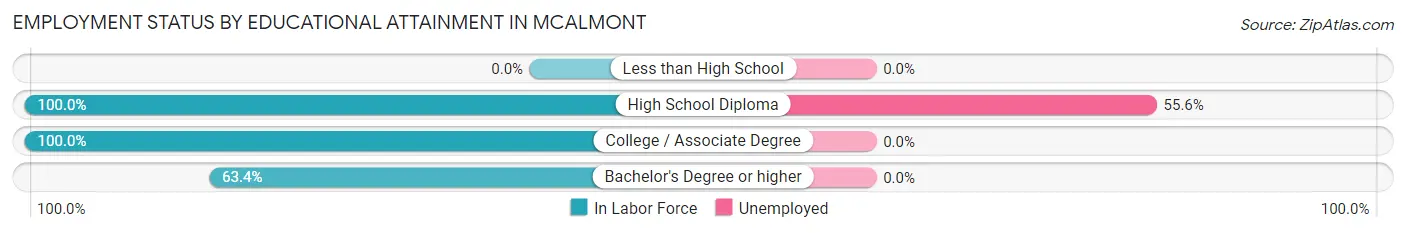
Employment Status by Educational Attainment in McAlmont
According to labor force statistics for McAlmont, 83.1% of individuals (384) out of the total population between 25 and 64 years of age (462) are in the labor force, with 37.8% or 145 of them being unemployed. The group with the highest labor force participation rate are those with the educational attainment of high school diploma, with 100.0% or 261 individuals in the labor force. Within the labor force, individuals with high school diploma education have the highest percentage of unemployment, with 55.6% or 145 of them being unemployed.
| Educational Attainment | In Labor Force | Unemployed |
| Less than High School | 0 (0.0%) | 0 (0.0%) |
| High School Diploma | 261 (100.0%) | 145 (55.6%) |
| College / Associate Degree | 5 (100.0%) | 0 (0.0%) |
| Bachelor's Degree or higher | 118 (63.4%) | 0 (0.0%) |
| Total | 384 (83.1%) | 175 (37.8%) |
Employment Occupations by Sex in McAlmont
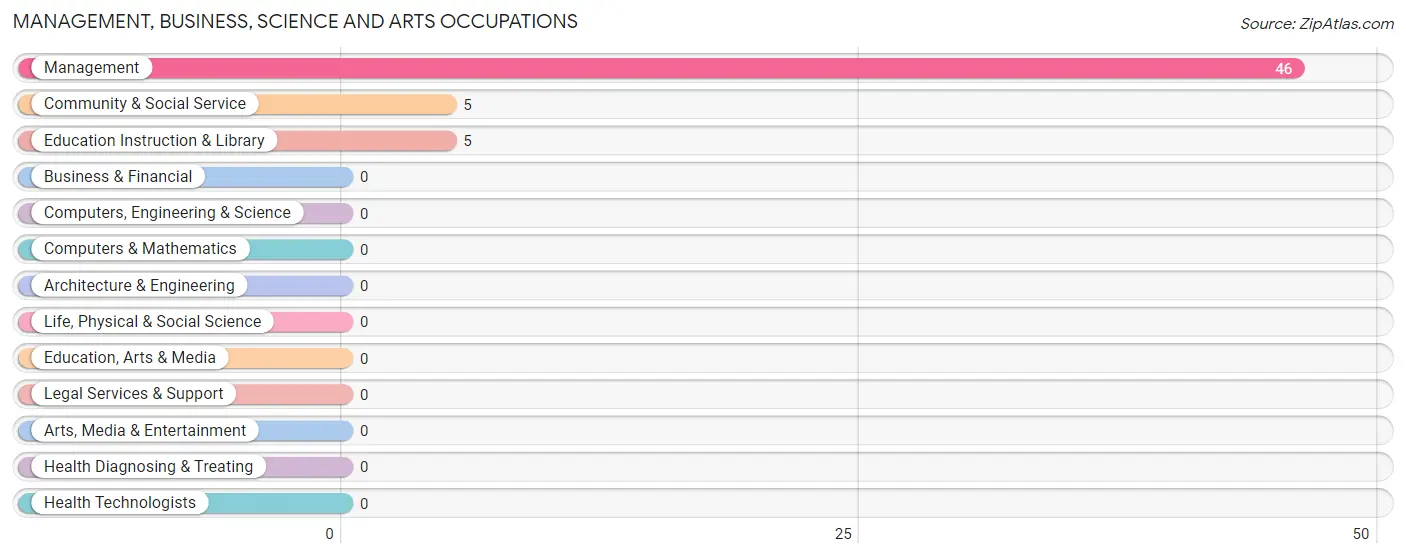
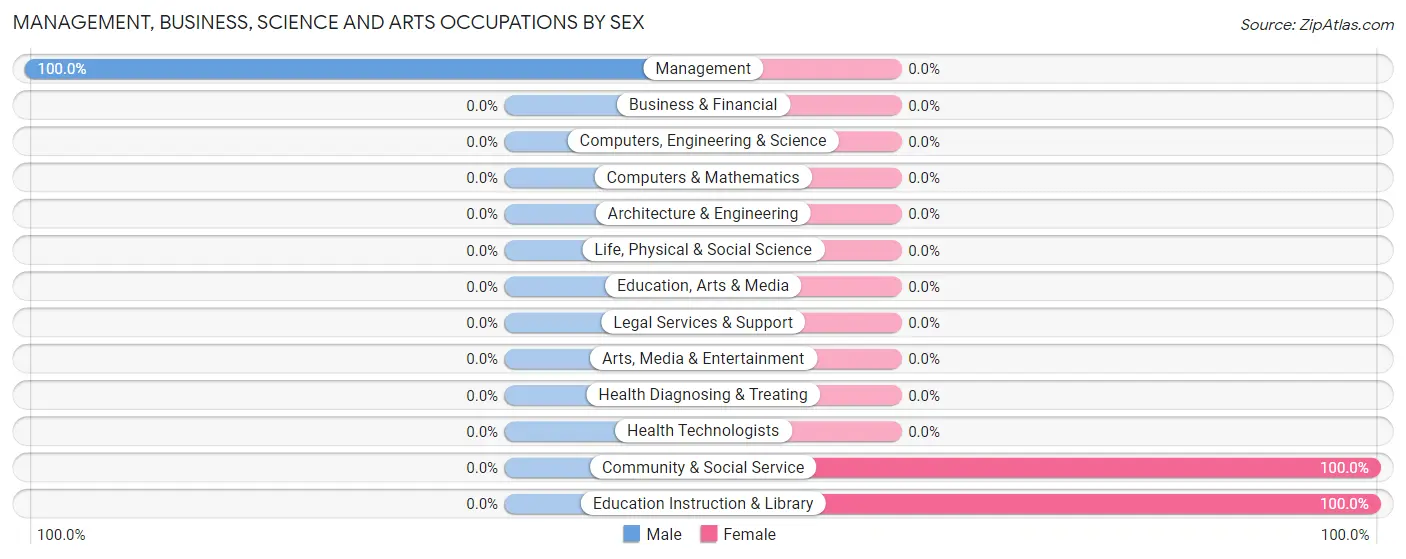
Management, Business, Science and Arts Occupations
The most common Management, Business, Science and Arts occupations in McAlmont are Management (46 | 17.8%), Community & Social Service (5 | 1.9%), and Education Instruction & Library (5 | 1.9%).
Management, Business, Science and Arts Occupations by Sex
| Occupation | Male | Female |
| Management | 46 (100.0%) | 0 (0.0%) |
| Business & Financial | 0 (0.0%) | 0 (0.0%) |
| Computers, Engineering & Science | 0 (0.0%) | 0 (0.0%) |
| Computers & Mathematics | 0 (0.0%) | 0 (0.0%) |
| Architecture & Engineering | 0 (0.0%) | 0 (0.0%) |
| Life, Physical & Social Science | 0 (0.0%) | 0 (0.0%) |
| Community & Social Service | 0 (0.0%) | 5 (100.0%) |
| Education, Arts & Media | 0 (0.0%) | 0 (0.0%) |
| Legal Services & Support | 0 (0.0%) | 0 (0.0%) |
| Education Instruction & Library | 0 (0.0%) | 5 (100.0%) |
| Arts, Media & Entertainment | 0 (0.0%) | 0 (0.0%) |
| Health Diagnosing & Treating | 0 (0.0%) | 0 (0.0%) |
| Health Technologists | 0 (0.0%) | 0 (0.0%) |
| Total (Category) | 46 (90.2%) | 5 (9.8%) |
| Total (Overall) | 97 (37.4%) | 162 (62.5%) |
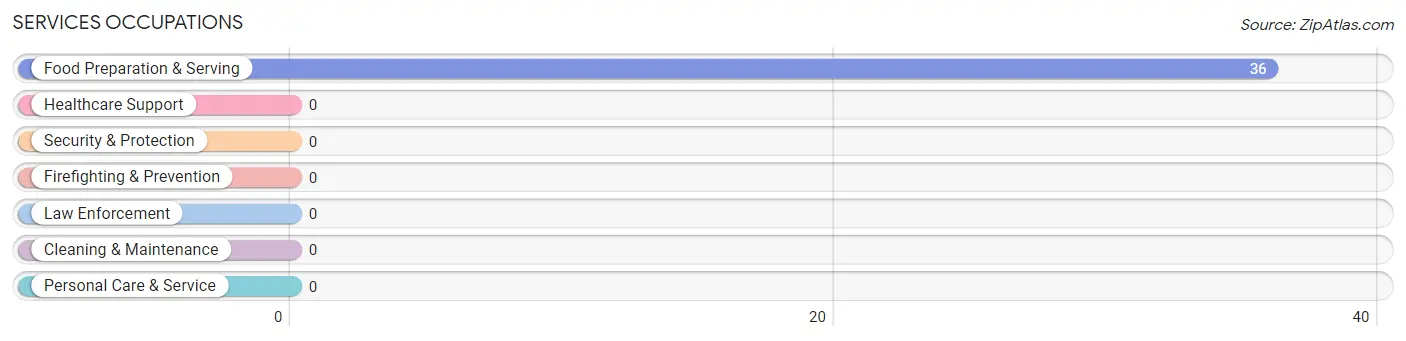
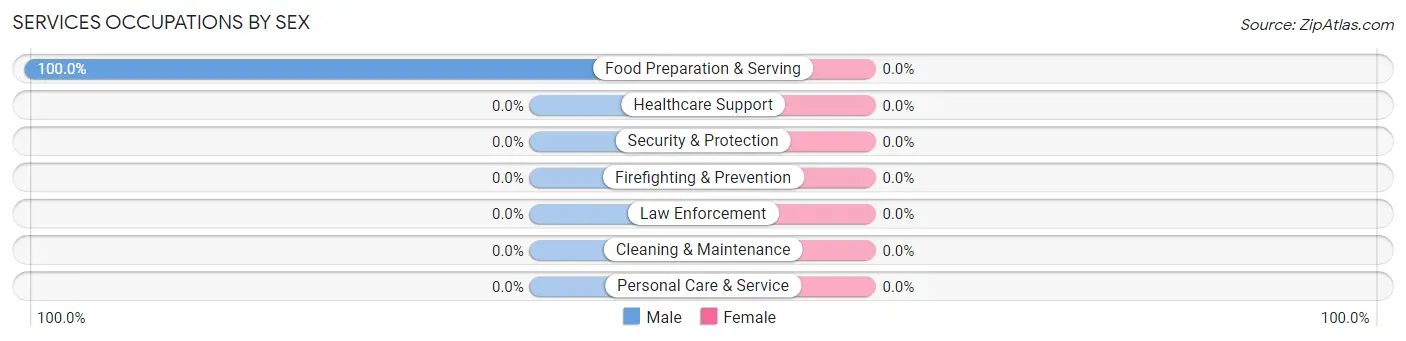
Services Occupations
The most common Services occupations in McAlmont are , and Food Preparation & Serving (36 | 13.9%).
Services Occupations by Sex
| Occupation | Male | Female |
| Healthcare Support | 0 (0.0%) | 0 (0.0%) |
| Security & Protection | 0 (0.0%) | 0 (0.0%) |
| Firefighting & Prevention | 0 (0.0%) | 0 (0.0%) |
| Law Enforcement | 0 (0.0%) | 0 (0.0%) |
| Food Preparation & Serving | 36 (100.0%) | 0 (0.0%) |
| Cleaning & Maintenance | 0 (0.0%) | 0 (0.0%) |
| Personal Care & Service | 0 (0.0%) | 0 (0.0%) |
| Total (Category) | 36 (100.0%) | 0 (0.0%) |
| Total (Overall) | 97 (37.4%) | 162 (62.5%) |
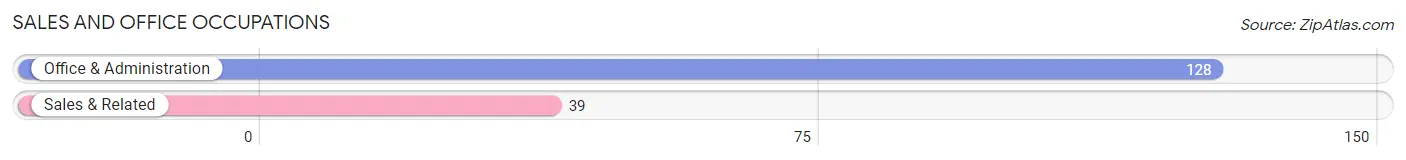
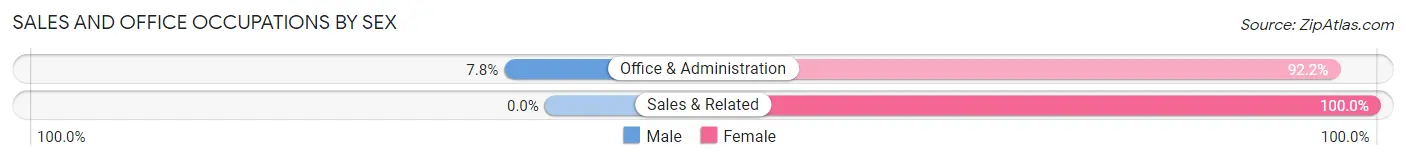
Sales and Office Occupations
The most common Sales and Office occupations in McAlmont are Office & Administration (128 | 49.4%), and Sales & Related (39 | 15.1%).
Sales and Office Occupations by Sex
| Occupation | Male | Female |
| Sales & Related | 0 (0.0%) | 39 (100.0%) |
| Office & Administration | 10 (7.8%) | 118 (92.2%) |
| Total (Category) | 10 (6.0%) | 157 (94.0%) |
| Total (Overall) | 97 (37.4%) | 162 (62.5%) |
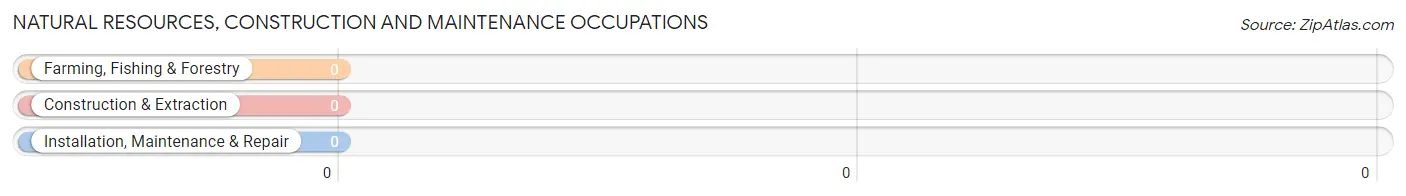
Natural Resources, Construction and Maintenance Occupations
Natural Resources, Construction and Maintenance Occupations by Sex
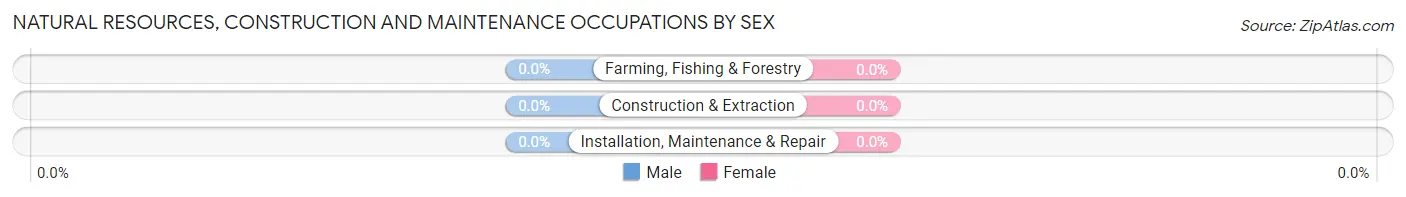
| Occupation | Male | Female |
| Farming, Fishing & Forestry | 0 (0.0%) | 0 (0.0%) |
| Construction & Extraction | 0 (0.0%) | 0 (0.0%) |
| Installation, Maintenance & Repair | 0 (0.0%) | 0 (0.0%) |
| Total (Category) | 0 (0.0%) | 0 (0.0%) |
| Total (Overall) | 97 (37.4%) | 162 (62.5%) |
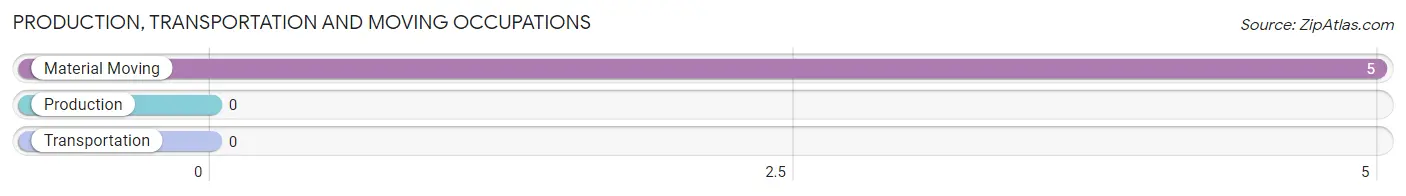
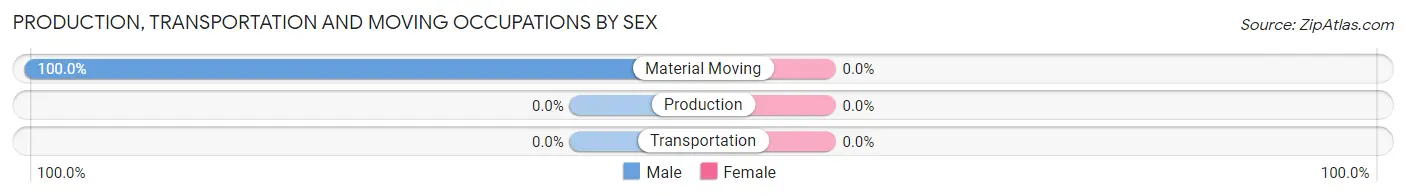
Production, Transportation and Moving Occupations
The most common Production, Transportation and Moving occupations in McAlmont are , and Material Moving (5 | 1.9%).
Production, Transportation and Moving Occupations by Sex
| Occupation | Male | Female |
| Production | 0 (0.0%) | 0 (0.0%) |
| Transportation | 0 (0.0%) | 0 (0.0%) |
| Material Moving | 5 (100.0%) | 0 (0.0%) |
| Total (Category) | 5 (100.0%) | 0 (0.0%) |
| Total (Overall) | 97 (37.4%) | 162 (62.5%) |
Employment Industries by Sex in McAlmont
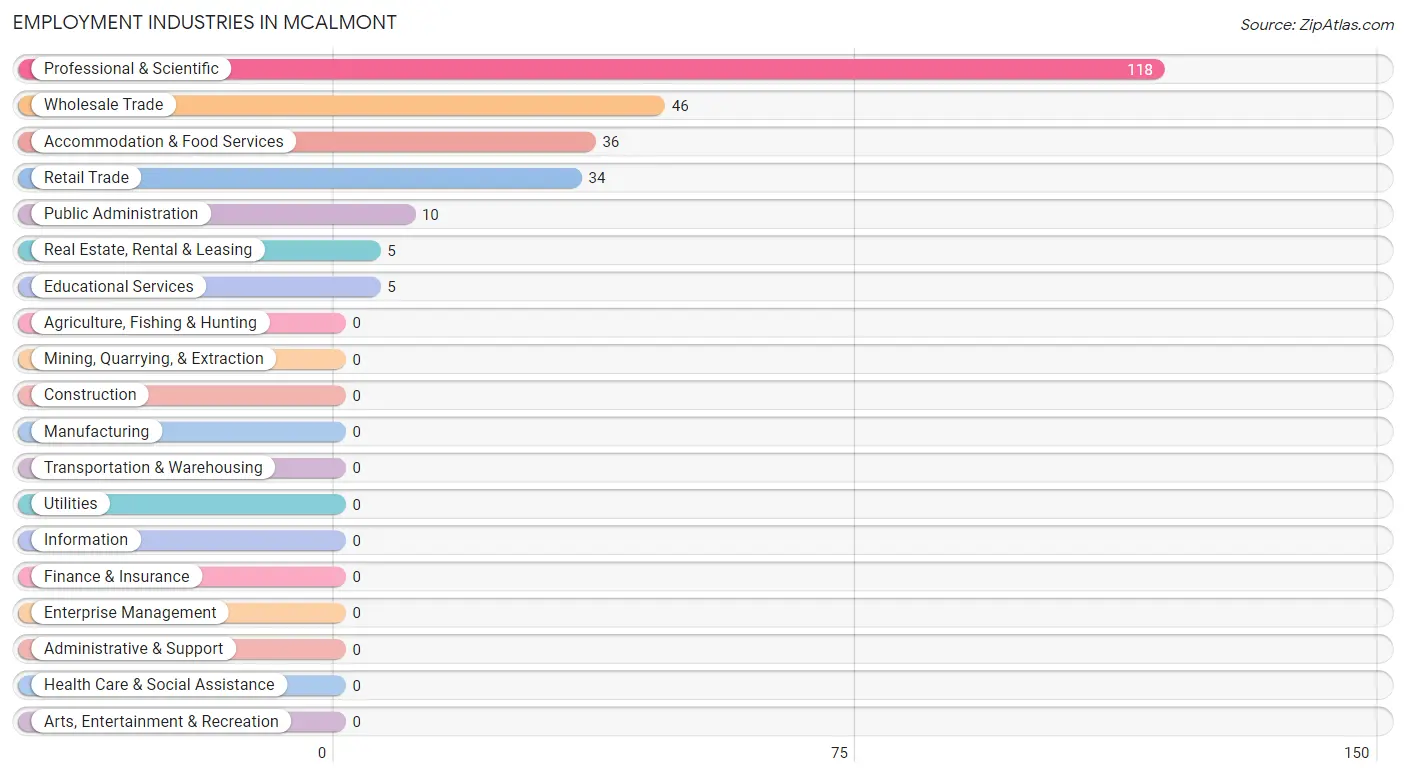
Employment Industries in McAlmont
The major employment industries in McAlmont include Professional & Scientific (118 | 45.6%), Wholesale Trade (46 | 17.8%), Accommodation & Food Services (36 | 13.9%), Retail Trade (34 | 13.1%), and Public Administration (10 | 3.9%).
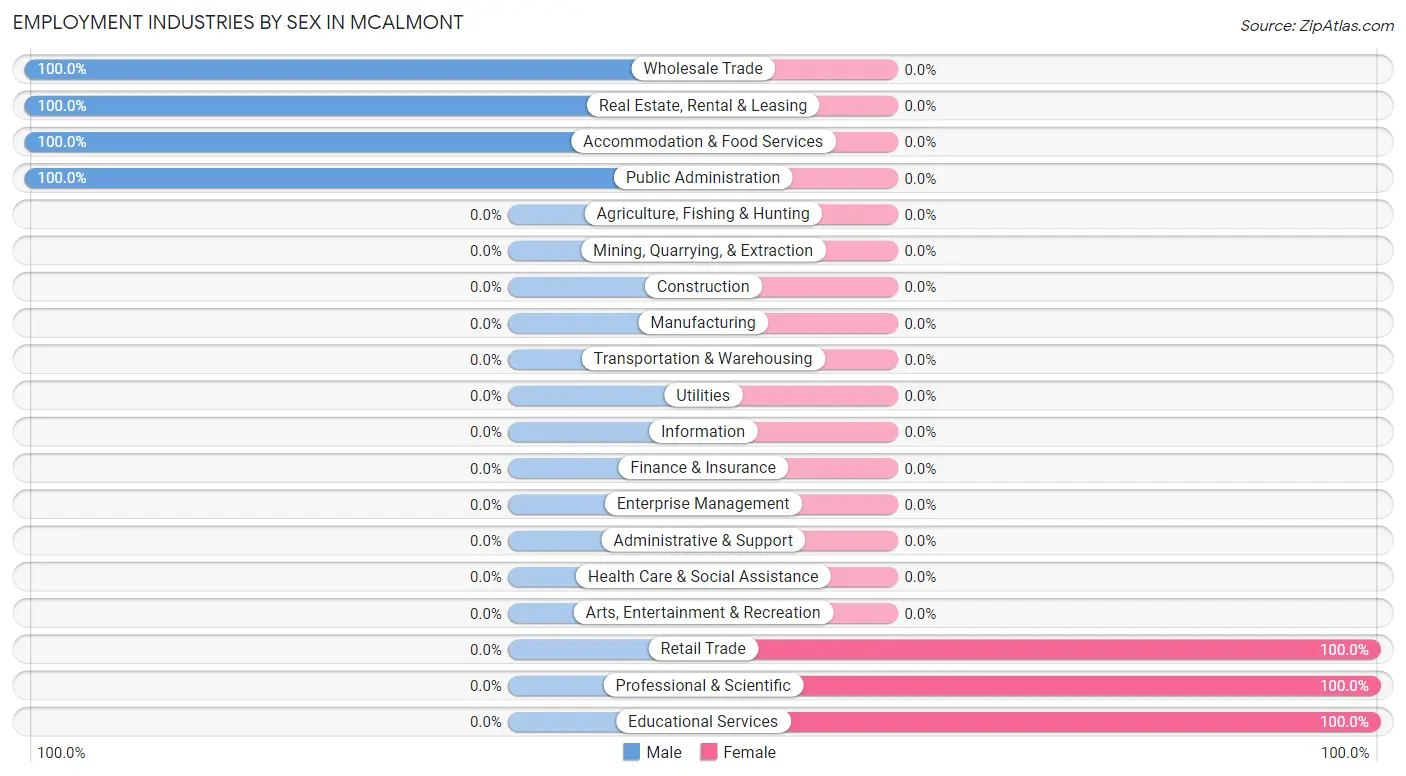
Employment Industries by Sex in McAlmont
The McAlmont industries that see more men than women are Wholesale Trade (100.0%), Real Estate, Rental & Leasing (100.0%), and Accommodation & Food Services (100.0%), whereas the industries that tend to have a higher number of women are Retail Trade (100.0%), Professional & Scientific (100.0%), and Educational Services (100.0%).
| Industry | Male | Female |
| Agriculture, Fishing & Hunting | 0 (0.0%) | 0 (0.0%) |
| Mining, Quarrying, & Extraction | 0 (0.0%) | 0 (0.0%) |
| Construction | 0 (0.0%) | 0 (0.0%) |
| Manufacturing | 0 (0.0%) | 0 (0.0%) |
| Wholesale Trade | 46 (100.0%) | 0 (0.0%) |
| Retail Trade | 0 (0.0%) | 34 (100.0%) |
| Transportation & Warehousing | 0 (0.0%) | 0 (0.0%) |
| Utilities | 0 (0.0%) | 0 (0.0%) |
| Information | 0 (0.0%) | 0 (0.0%) |
| Finance & Insurance | 0 (0.0%) | 0 (0.0%) |
| Real Estate, Rental & Leasing | 5 (100.0%) | 0 (0.0%) |
| Professional & Scientific | 0 (0.0%) | 118 (100.0%) |
| Enterprise Management | 0 (0.0%) | 0 (0.0%) |
| Administrative & Support | 0 (0.0%) | 0 (0.0%) |
| Educational Services | 0 (0.0%) | 5 (100.0%) |
| Health Care & Social Assistance | 0 (0.0%) | 0 (0.0%) |
| Arts, Entertainment & Recreation | 0 (0.0%) | 0 (0.0%) |
| Accommodation & Food Services | 36 (100.0%) | 0 (0.0%) |
| Public Administration | 10 (100.0%) | 0 (0.0%) |
| Total | 97 (37.4%) | 162 (62.5%) |
Education in McAlmont
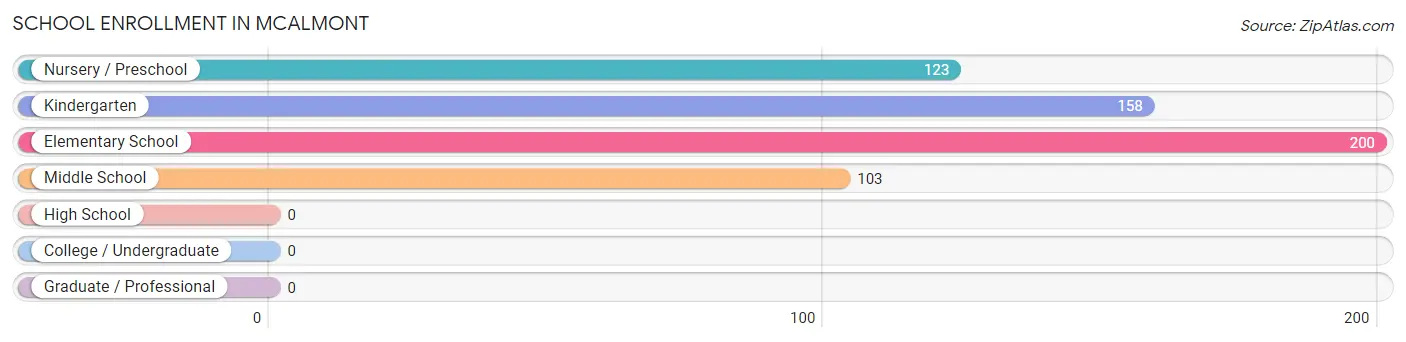
School Enrollment in McAlmont
The most common levels of schooling among the 584 students in McAlmont are elementary school (200 | 34.3%), kindergarten (158 | 27.1%), and nursery / preschool (123 | 21.1%).
| School Level | # Students | % Students |
| Nursery / Preschool | 123 | 21.1% |
| Kindergarten | 158 | 27.1% |
| Elementary School | 200 | 34.3% |
| Middle School | 103 | 17.6% |
| High School | 0 | 0.0% |
| College / Undergraduate | 0 | 0.0% |
| Graduate / Professional | 0 | 0.0% |
| Total | 584 | 100.0% |
School Enrollment by Age by Funding Source in McAlmont
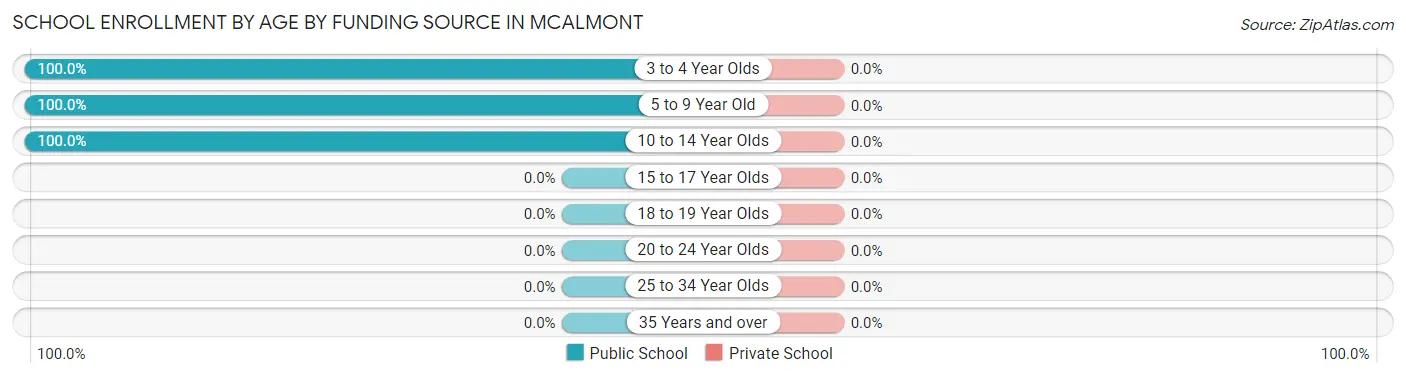
| Age Bracket | Public School | Private School |
| 3 to 4 Year Olds | 123 (100.0%) | 0 (0.0%) |
| 5 to 9 Year Old | 358 (100.0%) | 0 (0.0%) |
| 10 to 14 Year Olds | 103 (100.0%) | 0 (0.0%) |
| 15 to 17 Year Olds | 0 (0.0%) | 0 (0.0%) |
| 18 to 19 Year Olds | 0 (0.0%) | 0 (0.0%) |
| 20 to 24 Year Olds | 0 (0.0%) | 0 (0.0%) |
| 25 to 34 Year Olds | 0 (0.0%) | 0 (0.0%) |
| 35 Years and over | 0 (0.0%) | 0 (0.0%) |
| Total | 584 (100.0%) | 0 (0.0%) |
Educational Attainment by Field of Study in McAlmont
Business (118 | 57.8%), bio, nature & agricultural (34 | 16.7%), visual & performing arts (34 | 16.7%), and education (18 | 8.8%) are the most common fields of study among 204 individuals in McAlmont who have obtained a bachelor's degree or higher.
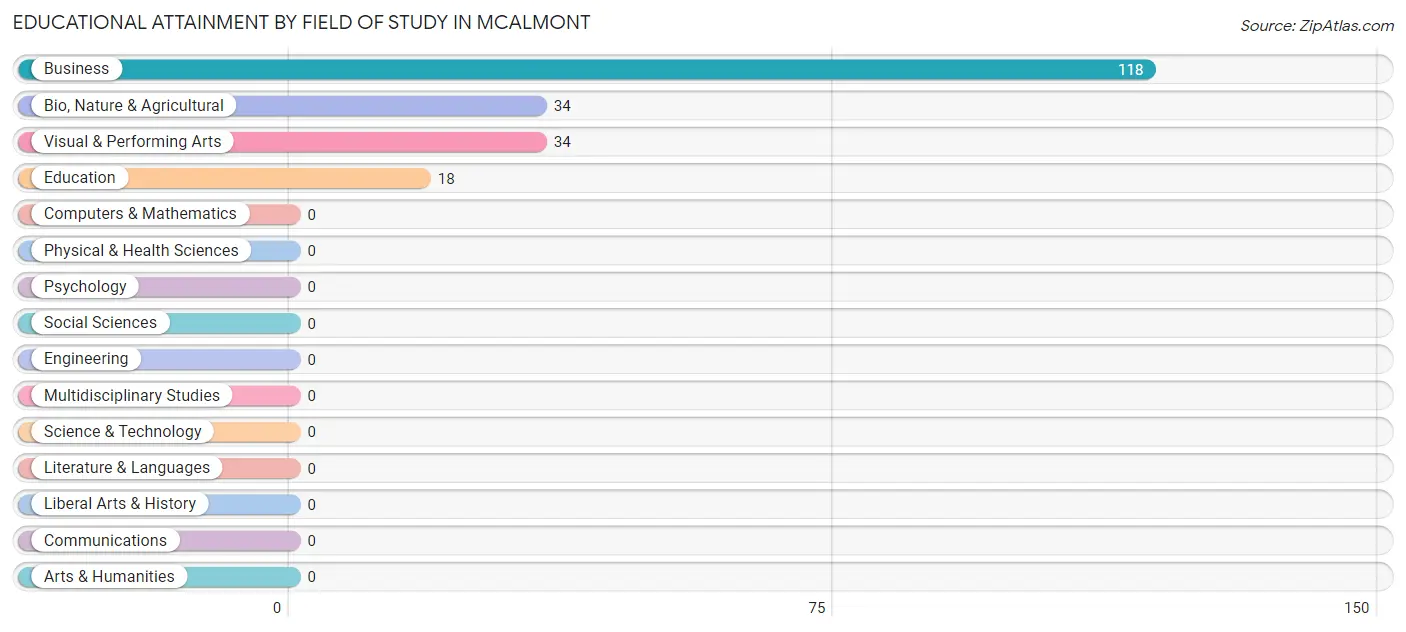
| Field of Study | # Graduates | % Graduates |
| Computers & Mathematics | 0 | 0.0% |
| Bio, Nature & Agricultural | 34 | 16.7% |
| Physical & Health Sciences | 0 | 0.0% |
| Psychology | 0 | 0.0% |
| Social Sciences | 0 | 0.0% |
| Engineering | 0 | 0.0% |
| Multidisciplinary Studies | 0 | 0.0% |
| Science & Technology | 0 | 0.0% |
| Business | 118 | 57.8% |
| Education | 18 | 8.8% |
| Literature & Languages | 0 | 0.0% |
| Liberal Arts & History | 0 | 0.0% |
| Visual & Performing Arts | 34 | 16.7% |
| Communications | 0 | 0.0% |
| Arts & Humanities | 0 | 0.0% |
| Total | 204 | 100.0% |
Transportation & Commute in McAlmont
Vehicle Availability by Sex in McAlmont
The most prevalent vehicle ownership categories in McAlmont are males with 2 vehicles (61, accounting for 62.9%) and females with 2 vehicles (5, making up 37.7%).
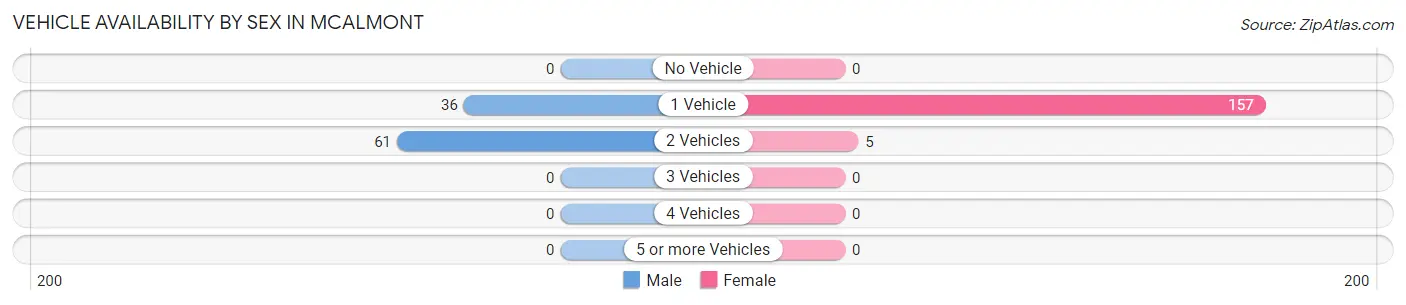
| Vehicles Available | Male | Female |
| No Vehicle | 0 (0.0%) | 0 (0.0%) |
| 1 Vehicle | 36 (37.1%) | 157 (96.9%) |
| 2 Vehicles | 61 (62.9%) | 5 (3.1%) |
| 3 Vehicles | 0 (0.0%) | 0 (0.0%) |
| 4 Vehicles | 0 (0.0%) | 0 (0.0%) |
| 5 or more Vehicles | 0 (0.0%) | 0 (0.0%) |
| Total | 97 (100.0%) | 162 (100.0%) |
Commute Time in McAlmont
The most frequently occuring commute durations in McAlmont are 5 to 9 minutes (75 commuters, 53.2%), 30 to 34 minutes (46 commuters, 32.6%), and 15 to 19 minutes (20 commuters, 14.2%).
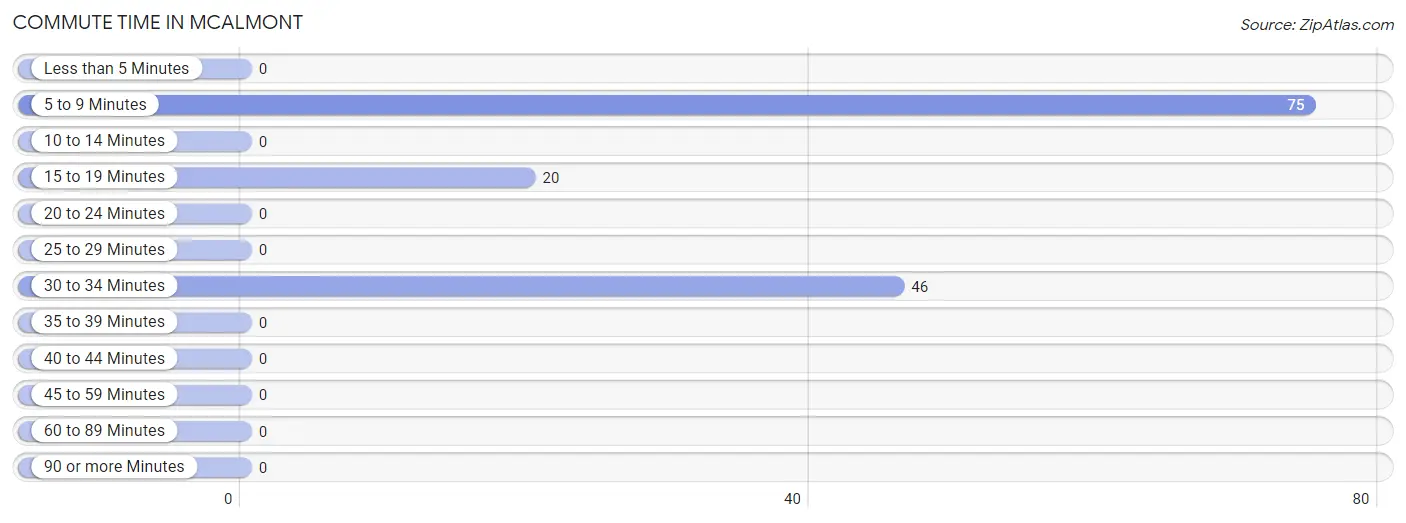
| Commute Time | # Commuters | % Commuters |
| Less than 5 Minutes | 0 | 0.0% |
| 5 to 9 Minutes | 75 | 53.2% |
| 10 to 14 Minutes | 0 | 0.0% |
| 15 to 19 Minutes | 20 | 14.2% |
| 20 to 24 Minutes | 0 | 0.0% |
| 25 to 29 Minutes | 0 | 0.0% |
| 30 to 34 Minutes | 46 | 32.6% |
| 35 to 39 Minutes | 0 | 0.0% |
| 40 to 44 Minutes | 0 | 0.0% |
| 45 to 59 Minutes | 0 | 0.0% |
| 60 to 89 Minutes | 0 | 0.0% |
| 90 or more Minutes | 0 | 0.0% |
Commute Time by Sex in McAlmont
The most common commute times in McAlmont are 30 to 34 minutes (46 commuters, 47.4%) for males and 5 to 9 minutes (39 commuters, 88.6%) for females.
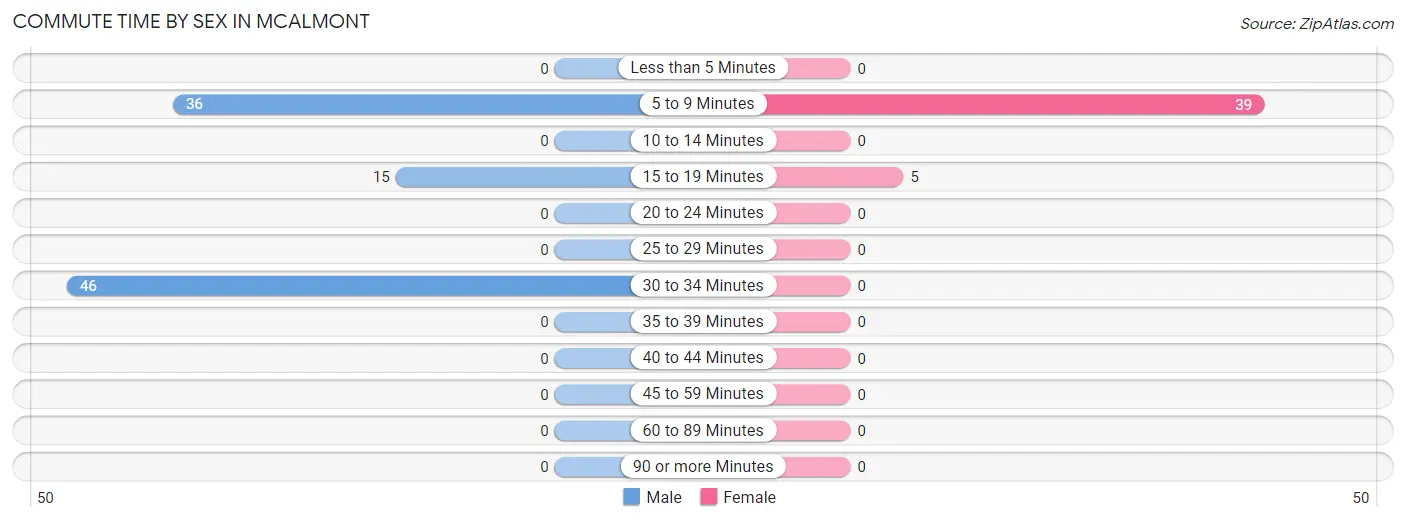
| Commute Time | Male | Female |
| Less than 5 Minutes | 0 (0.0%) | 0 (0.0%) |
| 5 to 9 Minutes | 36 (37.1%) | 39 (88.6%) |
| 10 to 14 Minutes | 0 (0.0%) | 0 (0.0%) |
| 15 to 19 Minutes | 15 (15.5%) | 5 (11.4%) |
| 20 to 24 Minutes | 0 (0.0%) | 0 (0.0%) |
| 25 to 29 Minutes | 0 (0.0%) | 0 (0.0%) |
| 30 to 34 Minutes | 46 (47.4%) | 0 (0.0%) |
| 35 to 39 Minutes | 0 (0.0%) | 0 (0.0%) |
| 40 to 44 Minutes | 0 (0.0%) | 0 (0.0%) |
| 45 to 59 Minutes | 0 (0.0%) | 0 (0.0%) |
| 60 to 89 Minutes | 0 (0.0%) | 0 (0.0%) |
| 90 or more Minutes | 0 (0.0%) | 0 (0.0%) |
Time of Departure to Work by Sex in McAlmont
The most frequent times of departure to work in McAlmont are 7:30 AM to 7:59 AM (46, 47.4%) for males and 6:00 AM to 6:29 AM (39, 88.6%) for females.
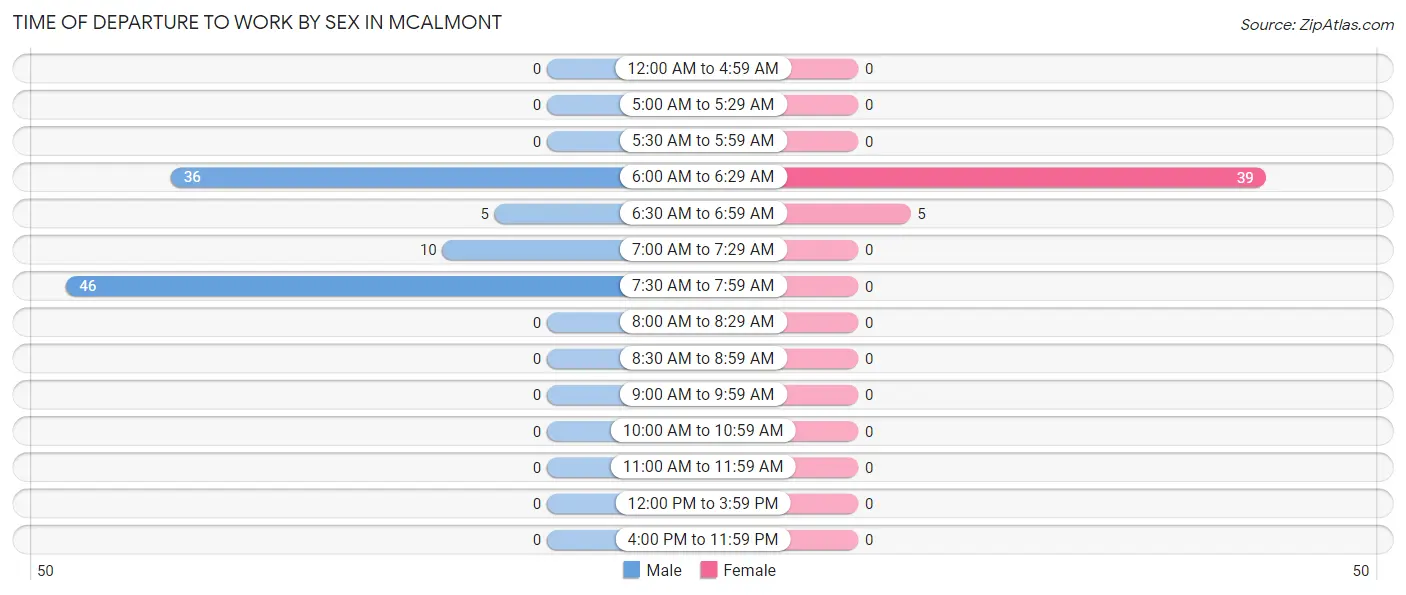
| Time of Departure | Male | Female |
| 12:00 AM to 4:59 AM | 0 (0.0%) | 0 (0.0%) |
| 5:00 AM to 5:29 AM | 0 (0.0%) | 0 (0.0%) |
| 5:30 AM to 5:59 AM | 0 (0.0%) | 0 (0.0%) |
| 6:00 AM to 6:29 AM | 36 (37.1%) | 39 (88.6%) |
| 6:30 AM to 6:59 AM | 5 (5.1%) | 5 (11.4%) |
| 7:00 AM to 7:29 AM | 10 (10.3%) | 0 (0.0%) |
| 7:30 AM to 7:59 AM | 46 (47.4%) | 0 (0.0%) |
| 8:00 AM to 8:29 AM | 0 (0.0%) | 0 (0.0%) |
| 8:30 AM to 8:59 AM | 0 (0.0%) | 0 (0.0%) |
| 9:00 AM to 9:59 AM | 0 (0.0%) | 0 (0.0%) |
| 10:00 AM to 10:59 AM | 0 (0.0%) | 0 (0.0%) |
| 11:00 AM to 11:59 AM | 0 (0.0%) | 0 (0.0%) |
| 12:00 PM to 3:59 PM | 0 (0.0%) | 0 (0.0%) |
| 4:00 PM to 11:59 PM | 0 (0.0%) | 0 (0.0%) |
| Total | 97 (100.0%) | 44 (100.0%) |
Housing Occupancy in McAlmont
Occupancy by Ownership in McAlmont
Of the total 538 dwellings in McAlmont, owner-occupied units account for 254 (47.2%), while renter-occupied units make up 284 (52.8%).
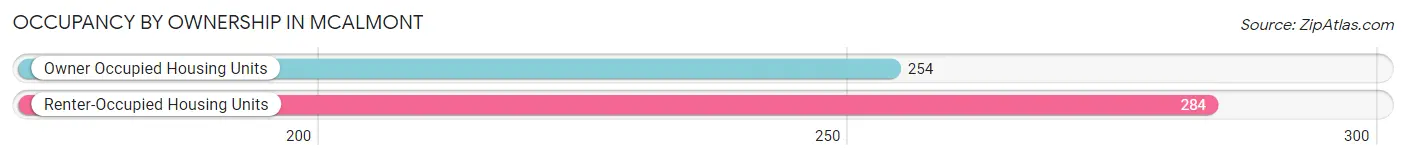
| Occupancy | # Housing Units | % Housing Units |
| Owner Occupied Housing Units | 254 | 47.2% |
| Renter-Occupied Housing Units | 284 | 52.8% |
| Total Occupied Housing Units | 538 | 100.0% |
Occupancy by Household Size in McAlmont
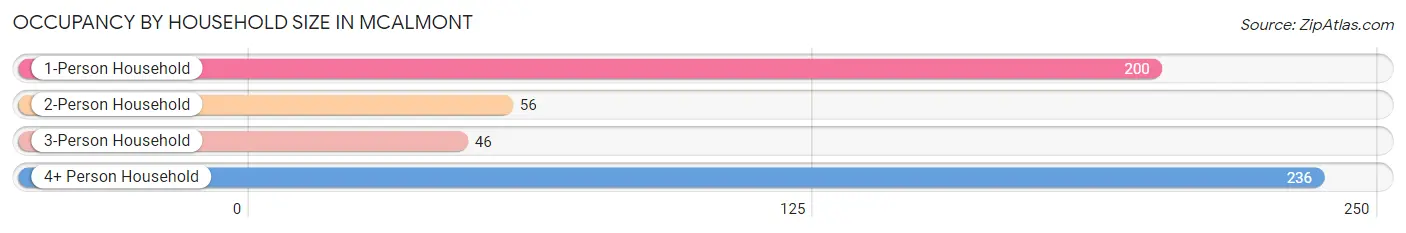
| Household Size | # Housing Units | % Housing Units |
| 1-Person Household | 200 | 37.2% |
| 2-Person Household | 56 | 10.4% |
| 3-Person Household | 46 | 8.6% |
| 4+ Person Household | 236 | 43.9% |
| Total Housing Units | 538 | 100.0% |
Occupancy by Ownership by Household Size in McAlmont
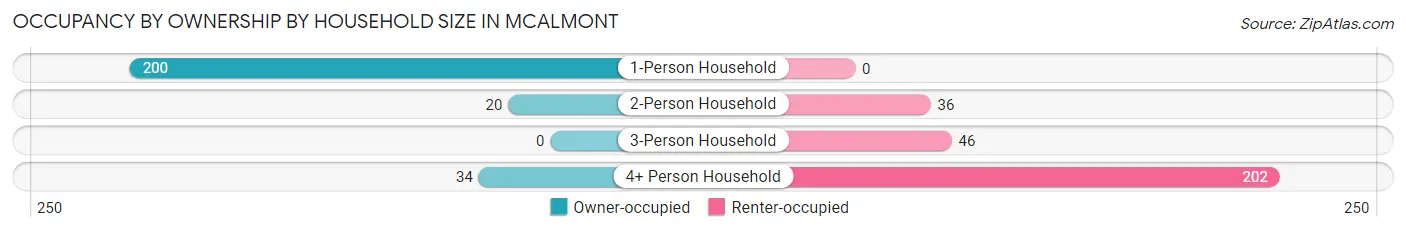
| Household Size | Owner-occupied | Renter-occupied |
| 1-Person Household | 200 (100.0%) | 0 (0.0%) |
| 2-Person Household | 20 (35.7%) | 36 (64.3%) |
| 3-Person Household | 0 (0.0%) | 46 (100.0%) |
| 4+ Person Household | 34 (14.4%) | 202 (85.6%) |
| Total Housing Units | 254 (47.2%) | 284 (52.8%) |
Occupancy by Educational Attainment in McAlmont
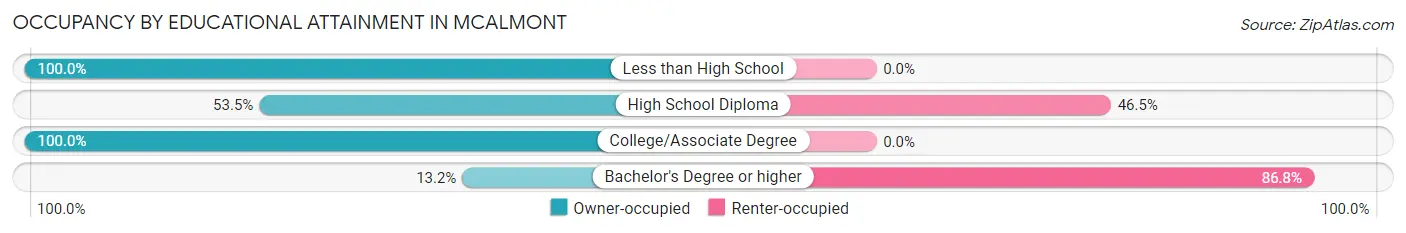
| Household Size | Owner-occupied | Renter-occupied |
| Less than High School | 40 (100.0%) | 0 (0.0%) |
| High School Diploma | 191 (53.5%) | 166 (46.5%) |
| College/Associate Degree | 5 (100.0%) | 0 (0.0%) |
| Bachelor's Degree or higher | 18 (13.2%) | 118 (86.8%) |
Occupancy by Age of Householder in McAlmont
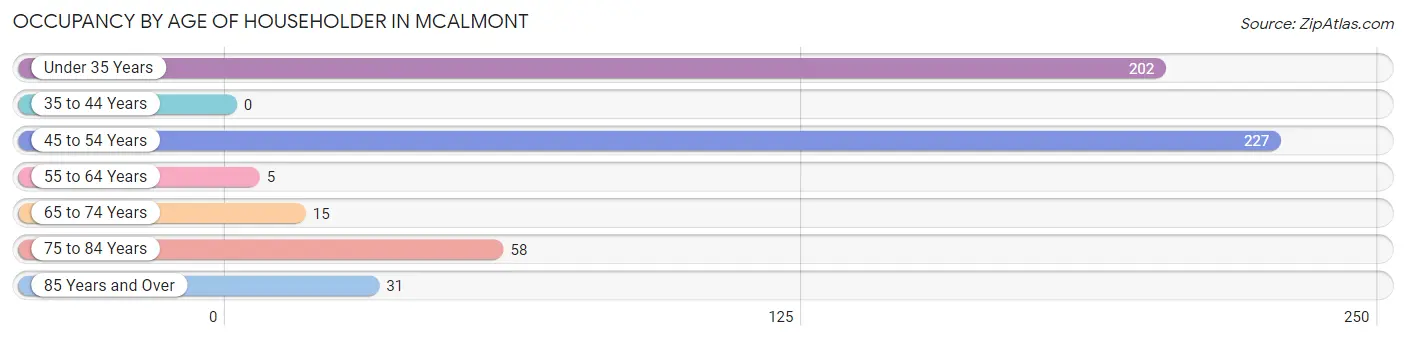
| Age Bracket | # Households | % Households |
| Under 35 Years | 202 | 37.6% |
| 35 to 44 Years | 0 | 0.0% |
| 45 to 54 Years | 227 | 42.2% |
| 55 to 64 Years | 5 | 0.9% |
| 65 to 74 Years | 15 | 2.8% |
| 75 to 84 Years | 58 | 10.8% |
| 85 Years and Over | 31 | 5.8% |
| Total | 538 | 100.0% |
Housing Finances in McAlmont
Median Income by Occupancy in McAlmont
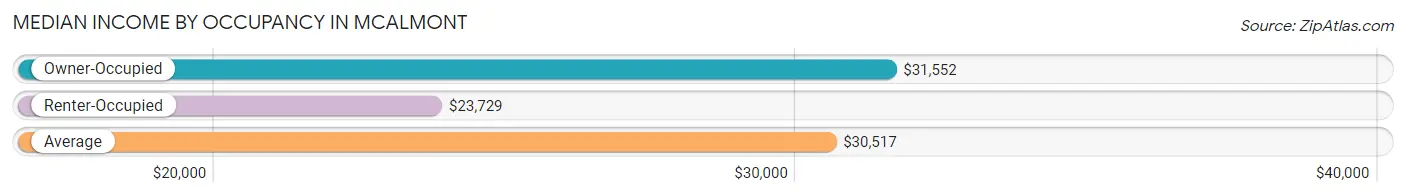
| Occupancy Type | # Households | Median Income |
| Owner-Occupied | 254 (47.2%) | $31,552 |
| Renter-Occupied | 284 (52.8%) | $23,729 |
| Average | 538 (100.0%) | $30,517 |
Occupancy by Householder Income Bracket in McAlmont
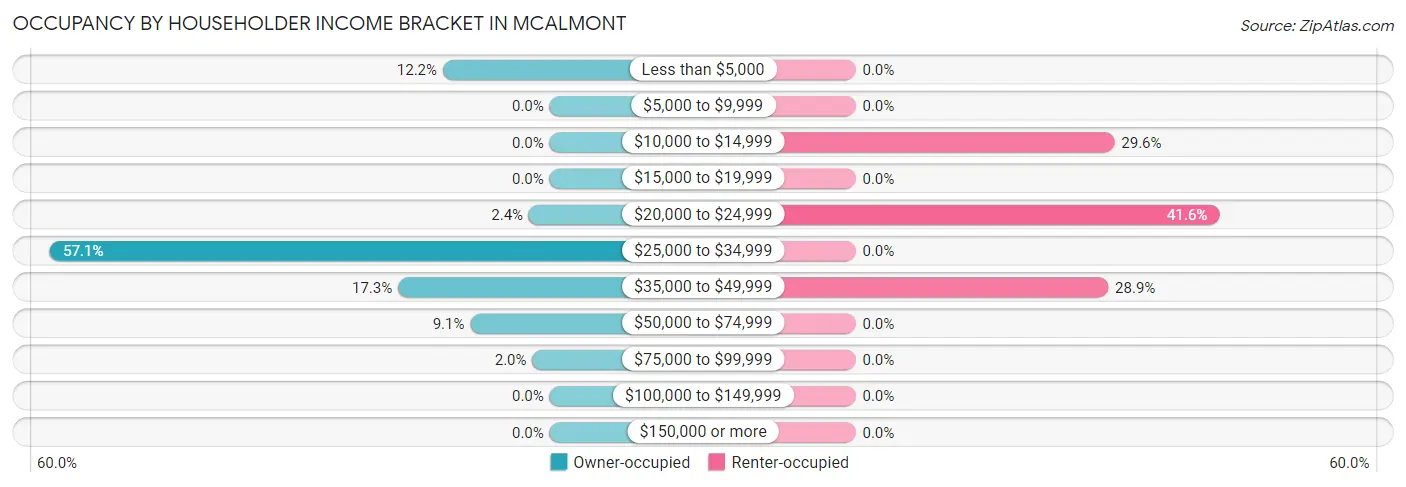
| Income Bracket | Owner-occupied | Renter-occupied |
| Less than $5,000 | 31 (12.2%) | 0 (0.0%) |
| $5,000 to $9,999 | 0 (0.0%) | 0 (0.0%) |
| $10,000 to $14,999 | 0 (0.0%) | 84 (29.6%) |
| $15,000 to $19,999 | 0 (0.0%) | 0 (0.0%) |
| $20,000 to $24,999 | 6 (2.4%) | 118 (41.5%) |
| $25,000 to $34,999 | 145 (57.1%) | 0 (0.0%) |
| $35,000 to $49,999 | 44 (17.3%) | 82 (28.9%) |
| $50,000 to $74,999 | 23 (9.1%) | 0 (0.0%) |
| $75,000 to $99,999 | 5 (2.0%) | 0 (0.0%) |
| $100,000 to $149,999 | 0 (0.0%) | 0 (0.0%) |
| $150,000 or more | 0 (0.0%) | 0 (0.0%) |
| Total | 254 (100.0%) | 284 (100.0%) |
Monthly Housing Cost Tiers in McAlmont
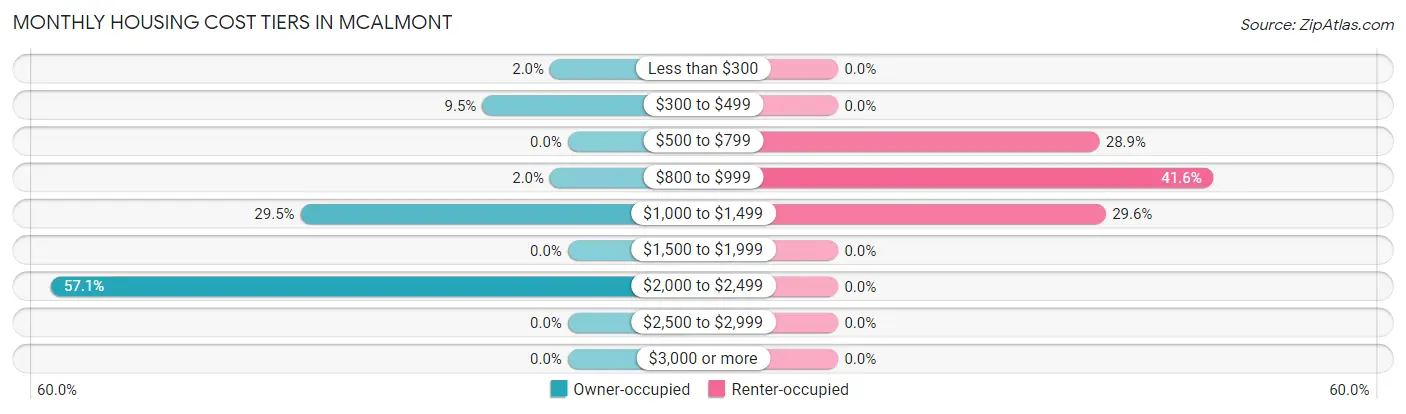
| Monthly Cost | Owner-occupied | Renter-occupied |
| Less than $300 | 5 (2.0%) | 0 (0.0%) |
| $300 to $499 | 24 (9.5%) | 0 (0.0%) |
| $500 to $799 | 0 (0.0%) | 82 (28.9%) |
| $800 to $999 | 5 (2.0%) | 118 (41.5%) |
| $1,000 to $1,499 | 75 (29.5%) | 84 (29.6%) |
| $1,500 to $1,999 | 0 (0.0%) | 0 (0.0%) |
| $2,000 to $2,499 | 145 (57.1%) | 0 (0.0%) |
| $2,500 to $2,999 | 0 (0.0%) | 0 (0.0%) |
| $3,000 or more | 0 (0.0%) | 0 (0.0%) |
| Total | 254 (100.0%) | 284 (100.0%) |
Physical Housing Characteristics in McAlmont
Housing Structures in McAlmont
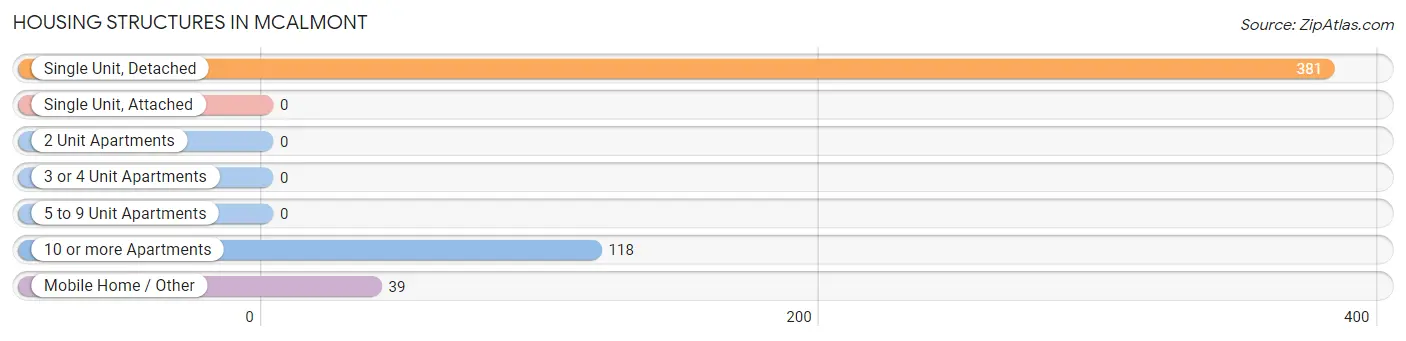
| Structure Type | # Housing Units | % Housing Units |
| Single Unit, Detached | 381 | 70.8% |
| Single Unit, Attached | 0 | 0.0% |
| 2 Unit Apartments | 0 | 0.0% |
| 3 or 4 Unit Apartments | 0 | 0.0% |
| 5 to 9 Unit Apartments | 0 | 0.0% |
| 10 or more Apartments | 118 | 21.9% |
| Mobile Home / Other | 39 | 7.2% |
| Total | 538 | 100.0% |
Housing Structures by Occupancy in McAlmont
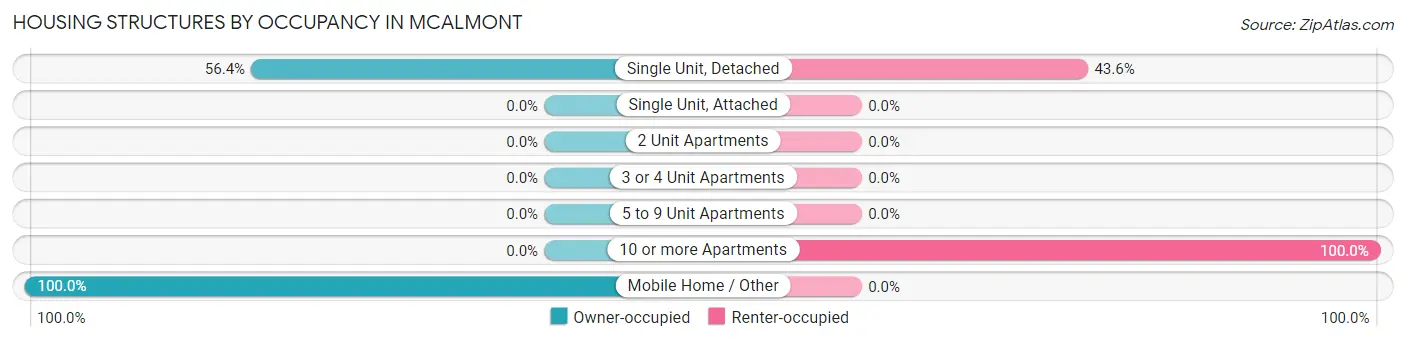
| Structure Type | Owner-occupied | Renter-occupied |
| Single Unit, Detached | 215 (56.4%) | 166 (43.6%) |
| Single Unit, Attached | 0 (0.0%) | 0 (0.0%) |
| 2 Unit Apartments | 0 (0.0%) | 0 (0.0%) |
| 3 or 4 Unit Apartments | 0 (0.0%) | 0 (0.0%) |
| 5 to 9 Unit Apartments | 0 (0.0%) | 0 (0.0%) |
| 10 or more Apartments | 0 (0.0%) | 118 (100.0%) |
| Mobile Home / Other | 39 (100.0%) | 0 (0.0%) |
| Total | 254 (47.2%) | 284 (52.8%) |
Housing Structures by Number of Rooms in McAlmont
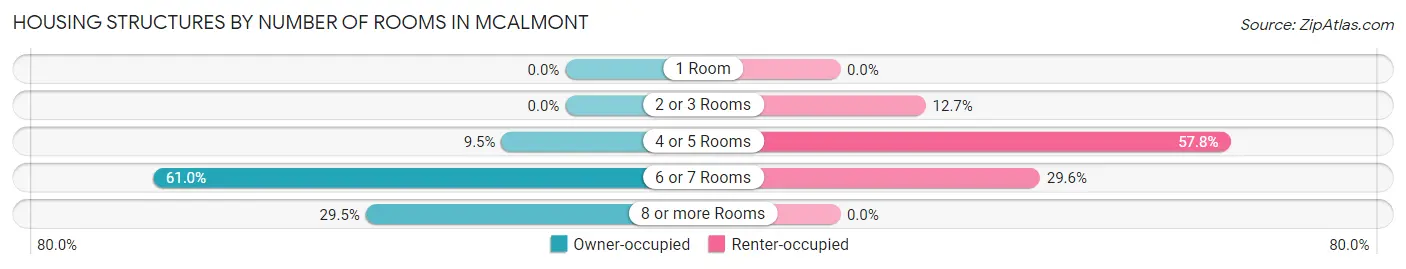
| Number of Rooms | Owner-occupied | Renter-occupied |
| 1 Room | 0 (0.0%) | 0 (0.0%) |
| 2 or 3 Rooms | 0 (0.0%) | 36 (12.7%) |
| 4 or 5 Rooms | 24 (9.5%) | 164 (57.8%) |
| 6 or 7 Rooms | 155 (61.0%) | 84 (29.6%) |
| 8 or more Rooms | 75 (29.5%) | 0 (0.0%) |
| Total | 254 (100.0%) | 284 (100.0%) |
Housing Structure by Heating Type in McAlmont
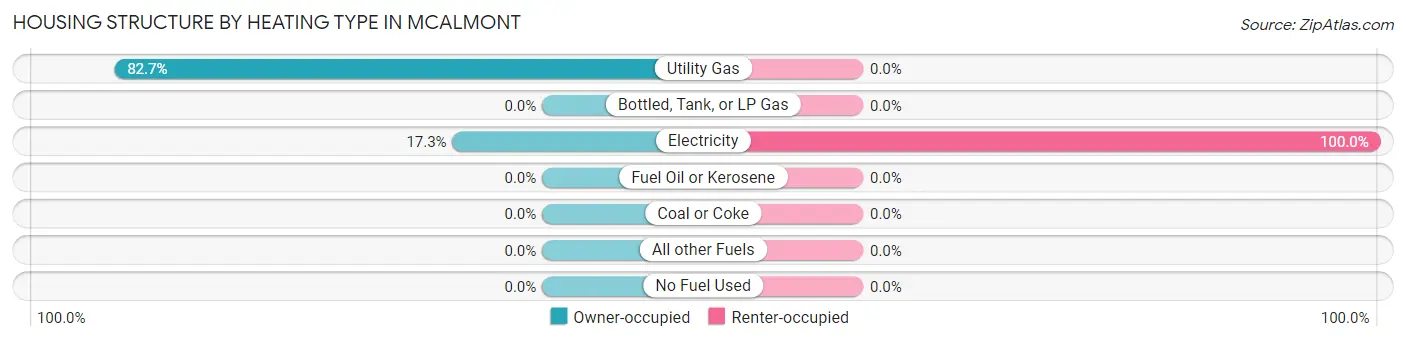
| Heating Type | Owner-occupied | Renter-occupied |
| Utility Gas | 210 (82.7%) | 0 (0.0%) |
| Bottled, Tank, or LP Gas | 0 (0.0%) | 0 (0.0%) |
| Electricity | 44 (17.3%) | 284 (100.0%) |
| Fuel Oil or Kerosene | 0 (0.0%) | 0 (0.0%) |
| Coal or Coke | 0 (0.0%) | 0 (0.0%) |
| All other Fuels | 0 (0.0%) | 0 (0.0%) |
| No Fuel Used | 0 (0.0%) | 0 (0.0%) |
| Total | 254 (100.0%) | 284 (100.0%) |
Household Vehicle Usage in McAlmont
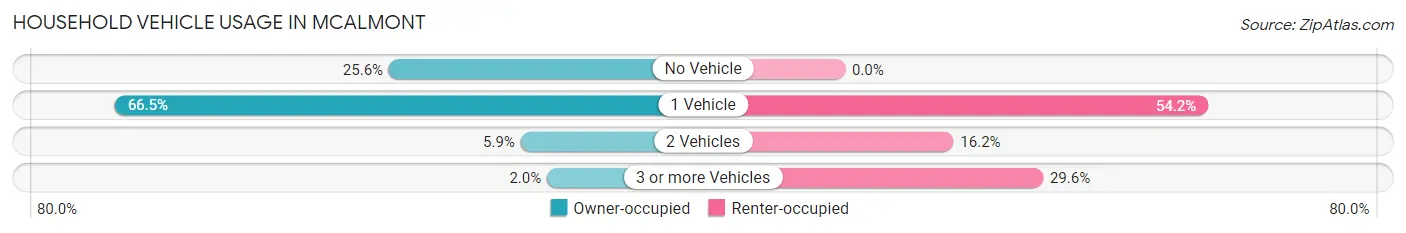
| Vehicles per Household | Owner-occupied | Renter-occupied |
| No Vehicle | 65 (25.6%) | 0 (0.0%) |
| 1 Vehicle | 169 (66.5%) | 154 (54.2%) |
| 2 Vehicles | 15 (5.9%) | 46 (16.2%) |
| 3 or more Vehicles | 5 (2.0%) | 84 (29.6%) |
| Total | 254 (100.0%) | 284 (100.0%) |
Real Estate & Mortgages in McAlmont
Real Estate and Mortgage Overview in McAlmont
| Characteristic | Without Mortgage | With Mortgage |
| Housing Units | 60 | 194 |
| Median Property Value | - | - |
| Median Household Income | $2,499 | $0 |
| Monthly Housing Costs | - | - |
| Real Estate Taxes | - | - |
Property Value by Mortgage Status in McAlmont
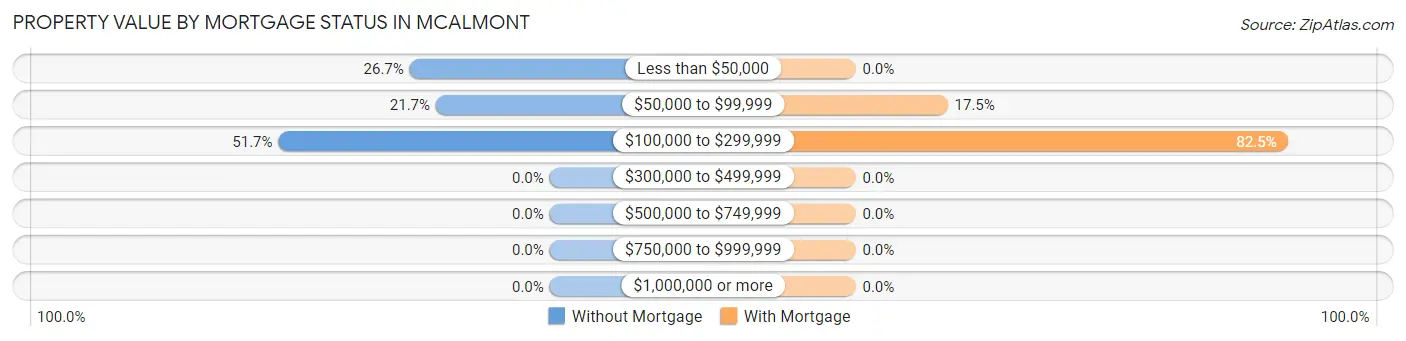
| Property Value | Without Mortgage | With Mortgage |
| Less than $50,000 | 16 (26.7%) | 0 (0.0%) |
| $50,000 to $99,999 | 13 (21.7%) | 34 (17.5%) |
| $100,000 to $299,999 | 31 (51.7%) | 160 (82.5%) |
| $300,000 to $499,999 | 0 (0.0%) | 0 (0.0%) |
| $500,000 to $749,999 | 0 (0.0%) | 0 (0.0%) |
| $750,000 to $999,999 | 0 (0.0%) | 0 (0.0%) |
| $1,000,000 or more | 0 (0.0%) | 0 (0.0%) |
| Total | 60 (100.0%) | 194 (100.0%) |
Household Income by Mortgage Status in McAlmont
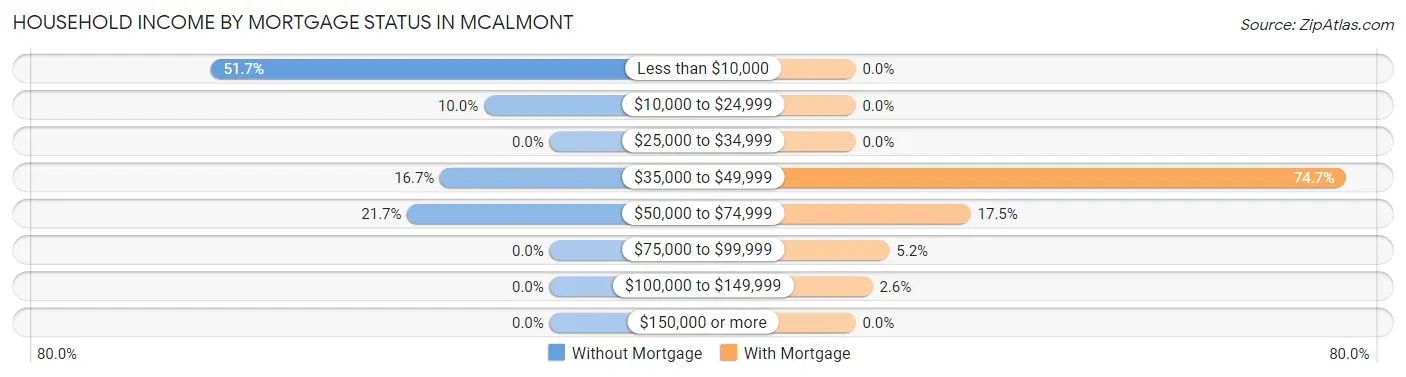
| Household Income | Without Mortgage | With Mortgage |
| Less than $10,000 | 31 (51.7%) | 0 (0.0%) |
| $10,000 to $24,999 | 6 (10.0%) | 0 (0.0%) |
| $25,000 to $34,999 | 0 (0.0%) | 0 (0.0%) |
| $35,000 to $49,999 | 10 (16.7%) | 145 (74.7%) |
| $50,000 to $74,999 | 13 (21.7%) | 34 (17.5%) |
| $75,000 to $99,999 | 0 (0.0%) | 10 (5.1%) |
| $100,000 to $149,999 | 0 (0.0%) | 5 (2.6%) |
| $150,000 or more | 0 (0.0%) | 0 (0.0%) |
| Total | 60 (100.0%) | 194 (100.0%) |
Property Value to Household Income Ratio in McAlmont
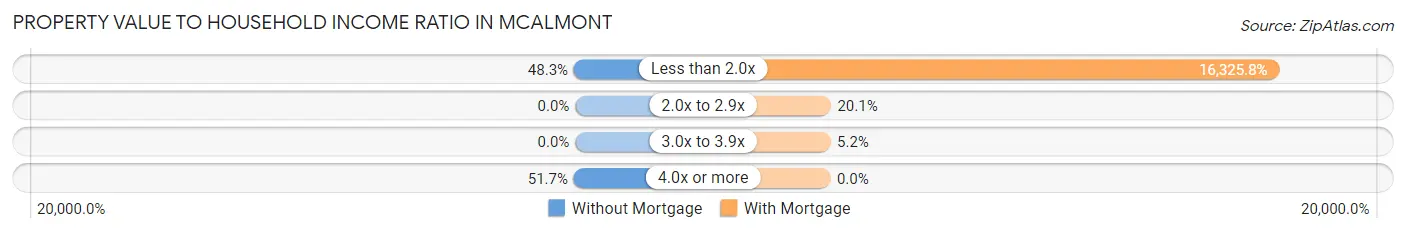
| Value-to-Income Ratio | Without Mortgage | With Mortgage |
| Less than 2.0x | 29 (48.3%) | 31,672 (16,325.8%) |
| 2.0x to 2.9x | 0 (0.0%) | 39 (20.1%) |
| 3.0x to 3.9x | 0 (0.0%) | 10 (5.1%) |
| 4.0x or more | 31 (51.7%) | 0 (0.0%) |
| Total | 60 (100.0%) | 194 (100.0%) |
Real Estate Taxes by Mortgage Status in McAlmont
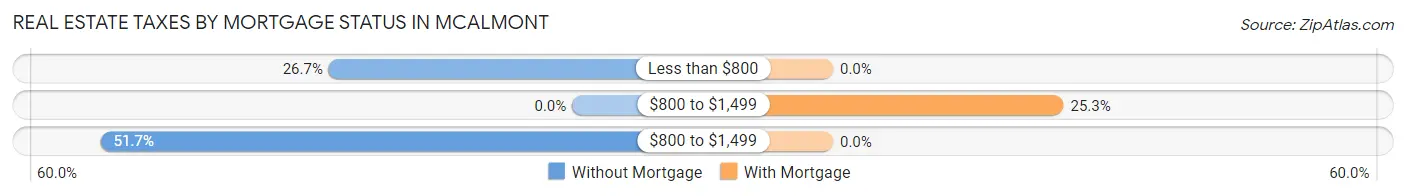
| Property Taxes | Without Mortgage | With Mortgage |
| Less than $800 | 16 (26.7%) | 0 (0.0%) |
| $800 to $1,499 | 0 (0.0%) | 49 (25.3%) |
| $800 to $1,499 | 31 (51.7%) | 0 (0.0%) |
| Total | 60 (100.0%) | 194 (100.0%) |
Health & Disability in McAlmont
Health Insurance Coverage by Age in McAlmont
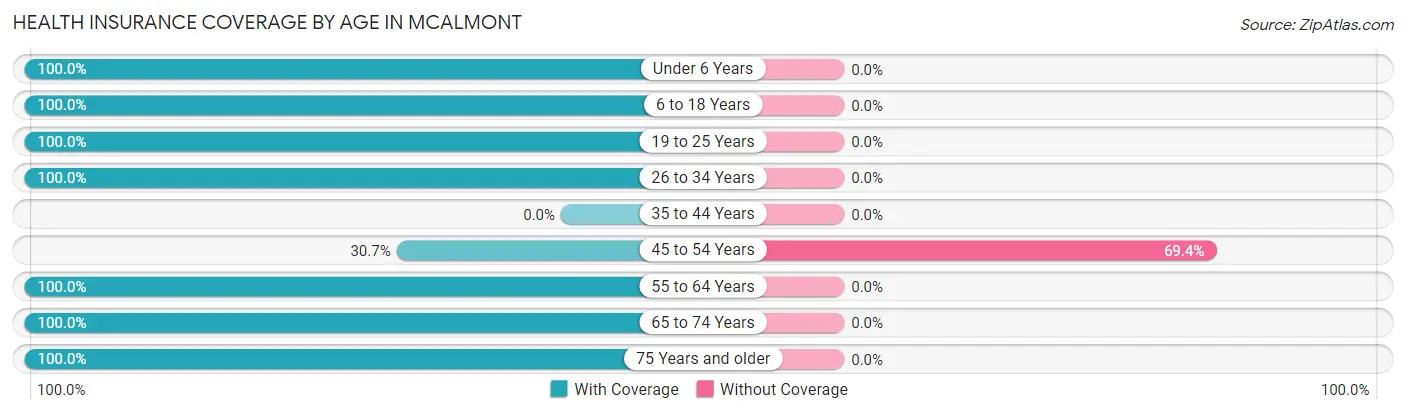
| Age Bracket | With Coverage | Without Coverage |
| Under 6 Years | 522 (100.0%) | 0 (0.0%) |
| 6 to 18 Years | 363 (100.0%) | 0 (0.0%) |
| 19 to 25 Years | 84 (100.0%) | 0 (0.0%) |
| 26 to 34 Years | 118 (100.0%) | 0 (0.0%) |
| 35 to 44 Years | 0 (0.0%) | 0 (0.0%) |
| 45 to 54 Years | 80 (30.6%) | 181 (69.4%) |
| 55 to 64 Years | 83 (100.0%) | 0 (0.0%) |
| 65 to 74 Years | 55 (100.0%) | 0 (0.0%) |
| 75 Years and older | 98 (100.0%) | 0 (0.0%) |
| Total | 1,403 (88.6%) | 181 (11.4%) |
Health Insurance Coverage by Citizenship Status in McAlmont
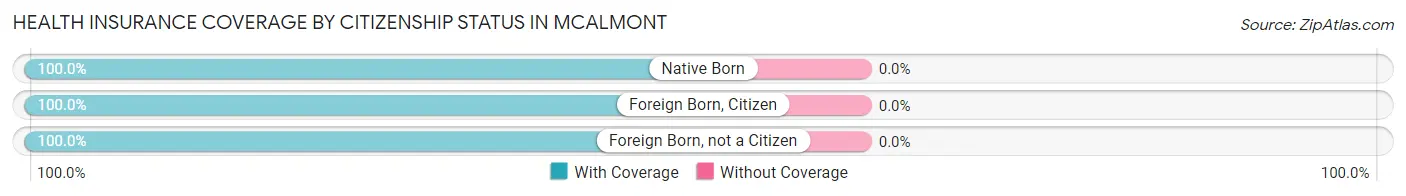
| Citizenship Status | With Coverage | Without Coverage |
| Native Born | 522 (100.0%) | 0 (0.0%) |
| Foreign Born, Citizen | 363 (100.0%) | 0 (0.0%) |
| Foreign Born, not a Citizen | 84 (100.0%) | 0 (0.0%) |
Health Insurance Coverage by Household Income in McAlmont
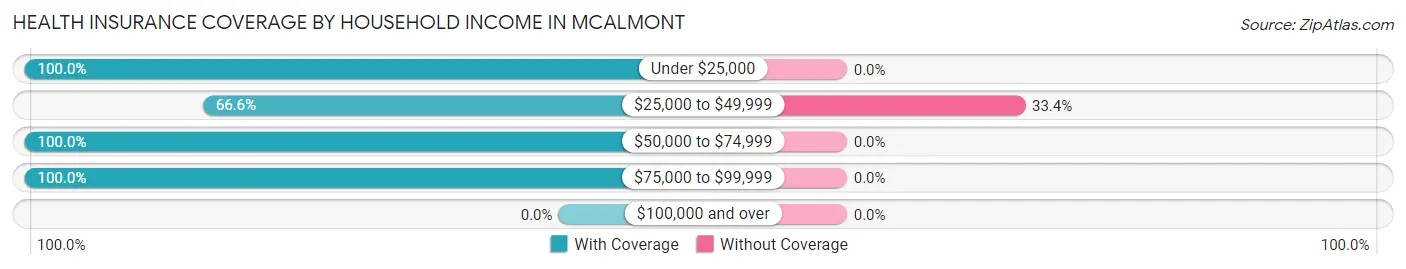
| Household Income | With Coverage | Without Coverage |
| Under $25,000 | 1,004 (100.0%) | 0 (0.0%) |
| $25,000 to $49,999 | 361 (66.6%) | 181 (33.4%) |
| $50,000 to $74,999 | 33 (100.0%) | 0 (0.0%) |
| $75,000 to $99,999 | 5 (100.0%) | 0 (0.0%) |
| $100,000 and over | 0 (0.0%) | 0 (0.0%) |
Public vs Private Health Insurance Coverage by Age in McAlmont
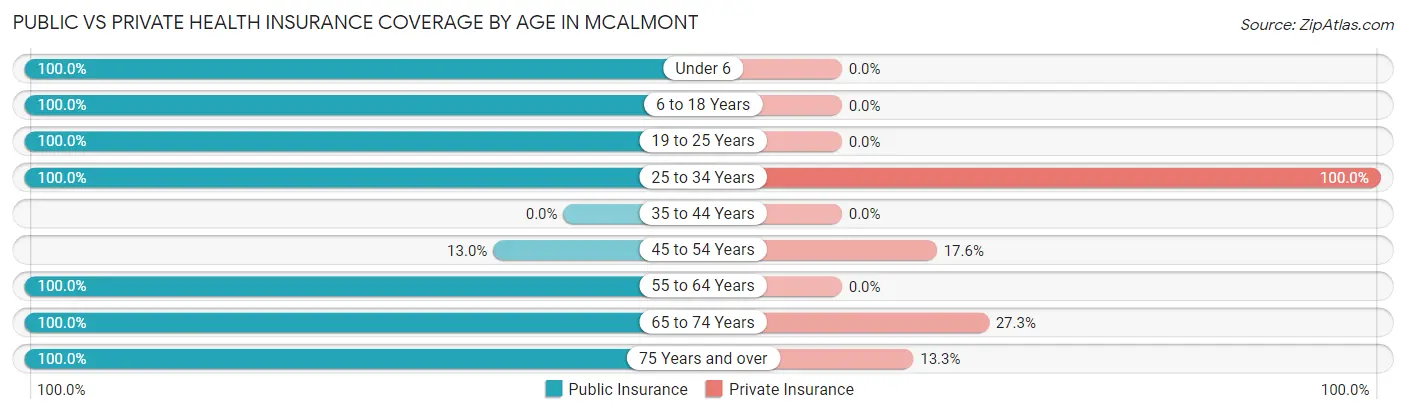
| Age Bracket | Public Insurance | Private Insurance |
| Under 6 | 522 (100.0%) | 0 (0.0%) |
| 6 to 18 Years | 363 (100.0%) | 0 (0.0%) |
| 19 to 25 Years | 84 (100.0%) | 0 (0.0%) |
| 25 to 34 Years | 118 (100.0%) | 118 (100.0%) |
| 35 to 44 Years | 0 (0.0%) | 0 (0.0%) |
| 45 to 54 Years | 34 (13.0%) | 46 (17.6%) |
| 55 to 64 Years | 83 (100.0%) | 0 (0.0%) |
| 65 to 74 Years | 55 (100.0%) | 15 (27.3%) |
| 75 Years and over | 98 (100.0%) | 13 (13.3%) |
| Total | 1,357 (85.7%) | 192 (12.1%) |
Disability Status by Sex by Age in McAlmont
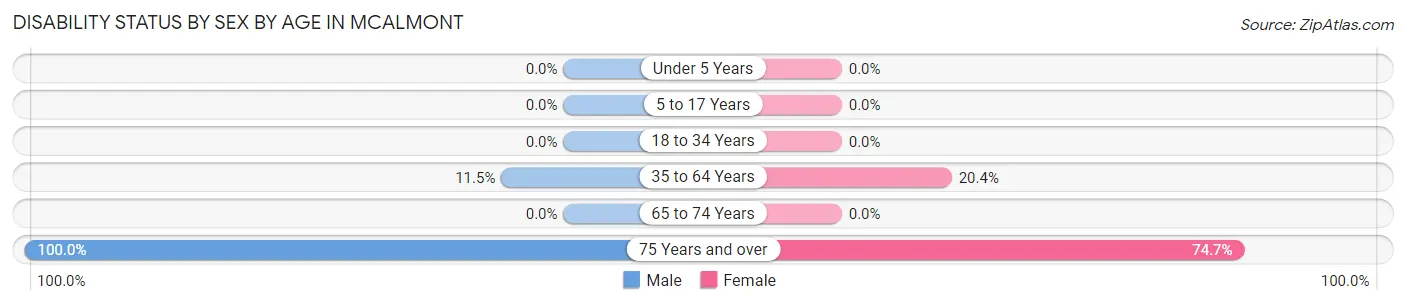
| Age Bracket | Male | Female |
| Under 5 Years | 0 (0.0%) | 0 (0.0%) |
| 5 to 17 Years | 0 (0.0%) | 0 (0.0%) |
| 18 to 34 Years | 0 (0.0%) | 0 (0.0%) |
| 35 to 64 Years | 34 (11.5%) | 10 (20.4%) |
| 65 to 74 Years | 0 (0.0%) | 0 (0.0%) |
| 75 Years and over | 11 (100.0%) | 65 (74.7%) |
Disability Class by Sex by Age in McAlmont
Disability Class: Hearing Difficulty
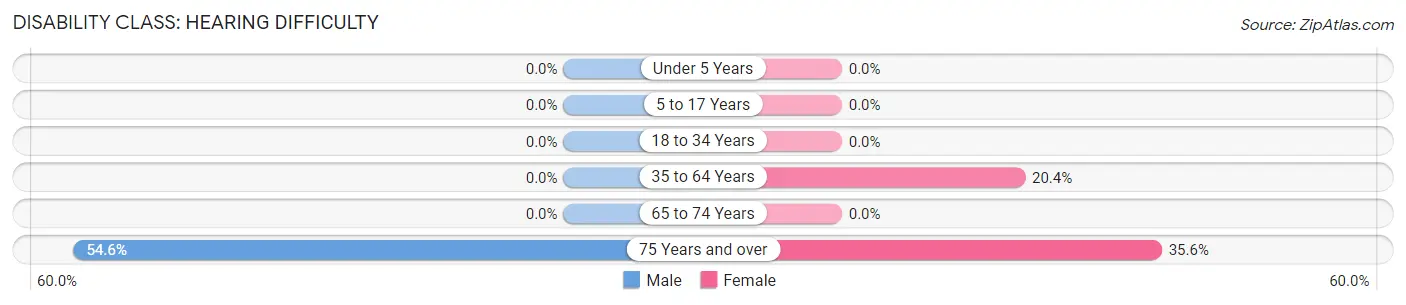
| Age Bracket | Male | Female |
| Under 5 Years | 0 (0.0%) | 0 (0.0%) |
| 5 to 17 Years | 0 (0.0%) | 0 (0.0%) |
| 18 to 34 Years | 0 (0.0%) | 0 (0.0%) |
| 35 to 64 Years | 0 (0.0%) | 10 (20.4%) |
| 65 to 74 Years | 0 (0.0%) | 0 (0.0%) |
| 75 Years and over | 6 (54.5%) | 31 (35.6%) |
Disability Class: Vision Difficulty
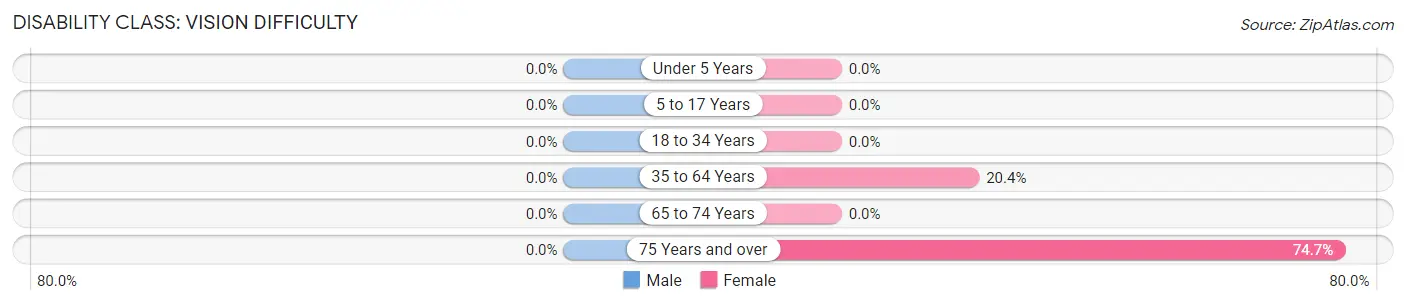
| Age Bracket | Male | Female |
| Under 5 Years | 0 (0.0%) | 0 (0.0%) |
| 5 to 17 Years | 0 (0.0%) | 0 (0.0%) |
| 18 to 34 Years | 0 (0.0%) | 0 (0.0%) |
| 35 to 64 Years | 0 (0.0%) | 10 (20.4%) |
| 65 to 74 Years | 0 (0.0%) | 0 (0.0%) |
| 75 Years and over | 0 (0.0%) | 65 (74.7%) |
Disability Class: Cognitive Difficulty
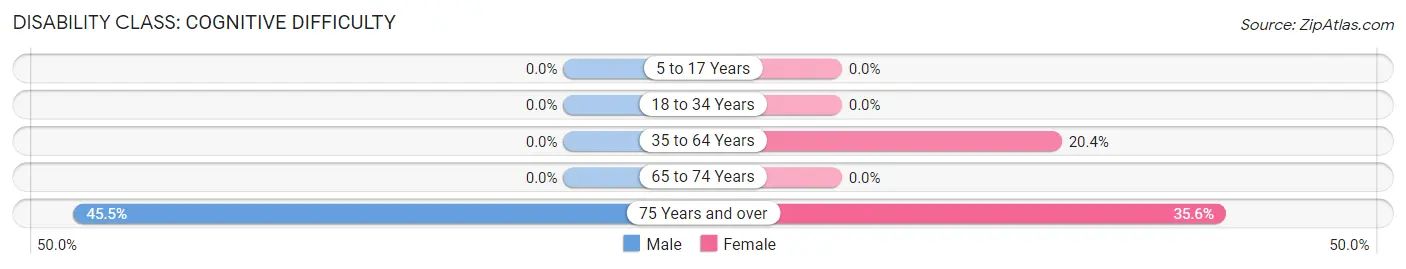
| Age Bracket | Male | Female |
| 5 to 17 Years | 0 (0.0%) | 0 (0.0%) |
| 18 to 34 Years | 0 (0.0%) | 0 (0.0%) |
| 35 to 64 Years | 0 (0.0%) | 10 (20.4%) |
| 65 to 74 Years | 0 (0.0%) | 0 (0.0%) |
| 75 Years and over | 5 (45.5%) | 31 (35.6%) |
Disability Class: Ambulatory Difficulty
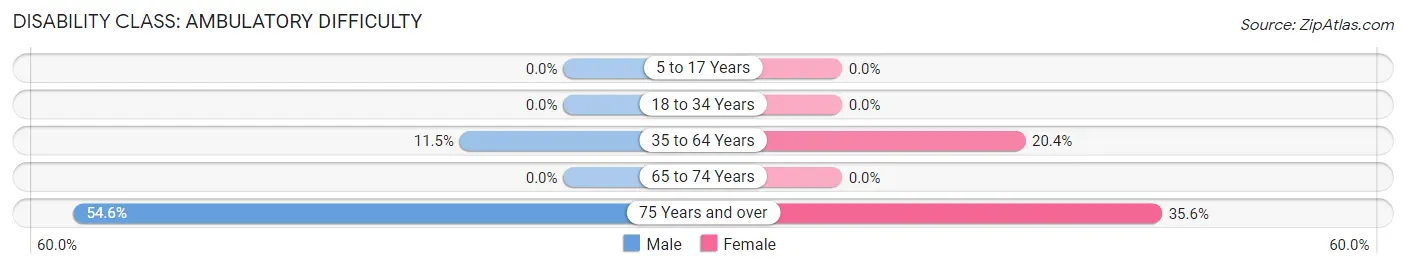
| Age Bracket | Male | Female |
| 5 to 17 Years | 0 (0.0%) | 0 (0.0%) |
| 18 to 34 Years | 0 (0.0%) | 0 (0.0%) |
| 35 to 64 Years | 34 (11.5%) | 10 (20.4%) |
| 65 to 74 Years | 0 (0.0%) | 0 (0.0%) |
| 75 Years and over | 6 (54.5%) | 31 (35.6%) |
Disability Class: Self-Care Difficulty
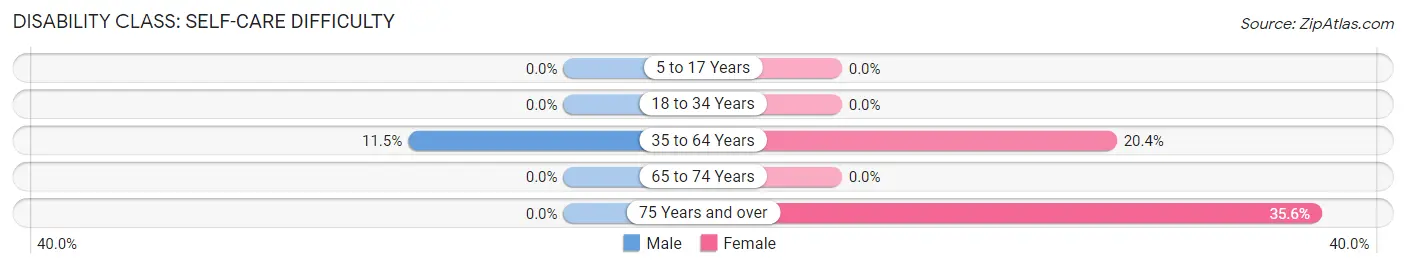
| Age Bracket | Male | Female |
| 5 to 17 Years | 0 (0.0%) | 0 (0.0%) |
| 18 to 34 Years | 0 (0.0%) | 0 (0.0%) |
| 35 to 64 Years | 34 (11.5%) | 10 (20.4%) |
| 65 to 74 Years | 0 (0.0%) | 0 (0.0%) |
| 75 Years and over | 0 (0.0%) | 31 (35.6%) |
Technology Access in McAlmont
Computing Device Access in McAlmont
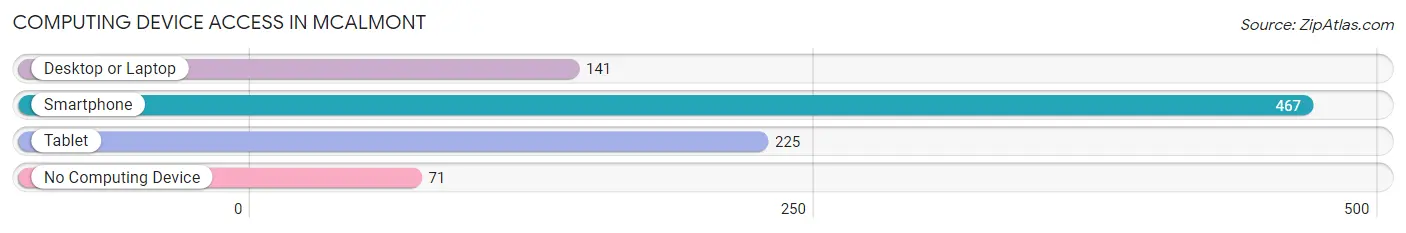
| Device Type | # Households | % Households |
| Desktop or Laptop | 141 | 26.2% |
| Smartphone | 467 | 86.8% |
| Tablet | 225 | 41.8% |
| No Computing Device | 71 | 13.2% |
| Total | 538 | 100.0% |
Internet Access in McAlmont
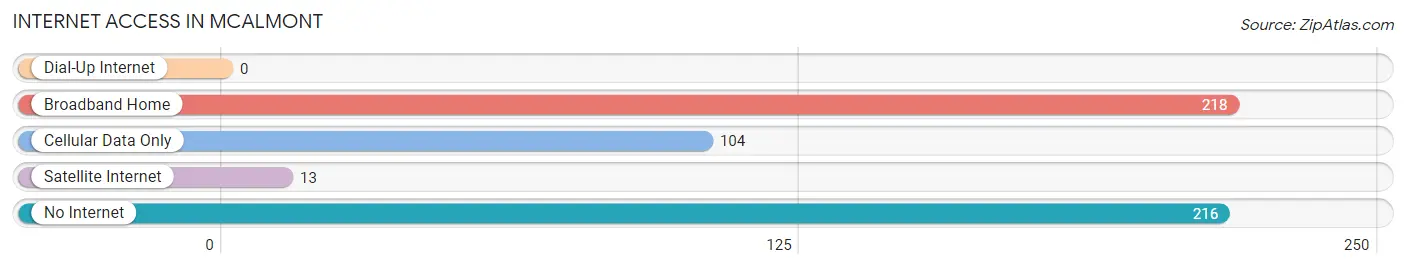
| Internet Type | # Households | % Households |
| Dial-Up Internet | 0 | 0.0% |
| Broadband Home | 218 | 40.5% |
| Cellular Data Only | 104 | 19.3% |
| Satellite Internet | 13 | 2.4% |
| No Internet | 216 | 40.2% |
| Total | 538 | 100.0% |
McAlmont Summary
Mcalmont is a small unincorporated community located in the northern part of Arkansas, in the United States. It is situated in the foothills of the Ozark Mountains, in the county of Jefferson. The population of Mcalmont was estimated to be around 200 people in the year 2000.
History
Mcalmont was founded in 1883 by a group of settlers from the nearby town of Pine Bluff. The town was named after a local landowner, William McAlmont. The town was originally a small farming community, but it soon grew to become a thriving business center. The town was home to several stores, a post office, a bank, a hotel, and a school.
In the early 1900s, the town was a popular destination for tourists, who came to enjoy the scenic beauty of the Ozark Mountains. The town was also known for its mineral springs, which were believed to have healing properties.
In the late 1940s, the town began to decline as the local economy shifted away from agriculture and towards industry. The town's population began to decline, and by the year 2000, it had dropped to around 200 people.
Geography
Mcalmont is located in the northern part of Arkansas, in the county of Jefferson. It is situated in the foothills of the Ozark Mountains, and is surrounded by rolling hills and forests. The town is located near the White River, which provides a source of recreation for the local residents.
The climate in Mcalmont is humid subtropical, with hot summers and mild winters. The average annual temperature is around 64°F (18°C), and the average annual precipitation is around 48 inches (122 cm).
Economy
The economy of Mcalmont is largely based on agriculture and tourism. The town is home to several farms, which produce a variety of crops, including corn, soybeans, and cotton. The town is also home to several tourist attractions, including the Ozark National Forest and the White River.
The town is also home to several small businesses, including restaurants, stores, and a post office. The town is served by a local newspaper, the Mcalmont Times.
Demographics
As of the year 2000, the population of Mcalmont was estimated to be around 200 people. The racial makeup of the town was 97.5% White, 0.5% African American, 0.5% Native American, and 1.5% from other races. The median household income was $25,000, and the median house value was $50,000.
The town is served by the Jefferson County School District, which includes a high school, a middle school, and an elementary school. The town is also home to a public library, which provides access to books, magazines, and other resources.
Mcalmont is a small, rural community with a rich history and a strong sense of community. The town is home to a variety of businesses and attractions, and is a popular destination for tourists. The town is also home to a variety of outdoor activities, including fishing, hunting, and camping. The town is a great place to live, work, and raise a family.
Common Questions
What is Per Capita Income in McAlmont?
Per Capita income in McAlmont is $9,864.
What is the Median Family Income in McAlmont?
Median Family Income in McAlmont is $23,919.
What is the Median Household income in McAlmont?
Median Household Income in McAlmont is $30,517.
What is Income or Wage Gap in McAlmont?
Income or Wage Gap in McAlmont is 27.0%.
Women in McAlmont earn 73.0 cents for every dollar earned by a man.
What is Inequality or Gini Index in McAlmont?
Inequality or Gini Index in McAlmont is 0.28.
What is the Total Population of McAlmont?
Total Population of McAlmont is 1,584.
What is the Total Male Population of McAlmont?
Total Male Population of McAlmont is 803.
What is the Total Female Population of McAlmont?
Total Female Population of McAlmont is 781.
What is the Ratio of Males per 100 Females in McAlmont?
There are 102.82 Males per 100 Females in McAlmont.
What is the Ratio of Females per 100 Males in McAlmont?
There are 97.26 Females per 100 Males in McAlmont.
What is the Median Population Age in McAlmont?
Median Population Age in McAlmont is 10.1 Years.
What is the Average Family Size in McAlmont
Average Family Size in McAlmont is 4.2 People.
What is the Average Household Size in McAlmont
Average Household Size in McAlmont is 2.9 People.
How Large is the Labor Force in McAlmont?
There are 488 People in the Labor Forcein in McAlmont.
What is the Percentage of People in the Labor Force in McAlmont?
69.8% of People are in the Labor Force in McAlmont.
What is the Unemployment Rate in McAlmont?
Unemployment Rate in McAlmont is 46.9%.