Mariano Colon, PR Map & Demographics
Mariano Colon Overview
$8,026
PER CAPITA INCOME
$19,688
AVG FAMILY INCOME
$16,029
AVG HOUSEHOLD INCOME
0.56
INEQUALITY / GINI INDEX
1,920
TOTAL POPULATION
886
MALE POPULATION
1,034
FEMALE POPULATION
85.69
MALES / 100 FEMALES
116.70
FEMALES / 100 MALES
41.5
MEDIAN AGE
4.2
AVG FAMILY SIZE
3.2
AVG HOUSEHOLD SIZE
713
LABOR FORCE [ PEOPLE ]
44.4%
PERCENT IN LABOR FORCE
12.6%
UNEMPLOYMENT RATE
Income in Mariano Colon
Income Overview in Mariano Colon
Per Capita Income in Mariano Colon is $8,026, while median incomes of families and households are $19,688 and $16,029 respectively.
| Characteristic | Number | Measure |
| Per Capita Income | 1,920 | $8,026 |
| Median Family Income | 402 | $19,688 |
| Mean Family Income | 402 | $28,378 |
| Median Household Income | 590 | $16,029 |
| Mean Household Income | 590 | $22,041 |
| Income Deficit | 402 | $0 |
| Wage / Income Gap (%) | 1,920 | 0.00% |
| Wage / Income Gap ($) | 1,920 | 100.00¢ per $1 |
| Gini / Inequality Index | 1,920 | 0.56 |
Earnings by Sex in Mariano Colon
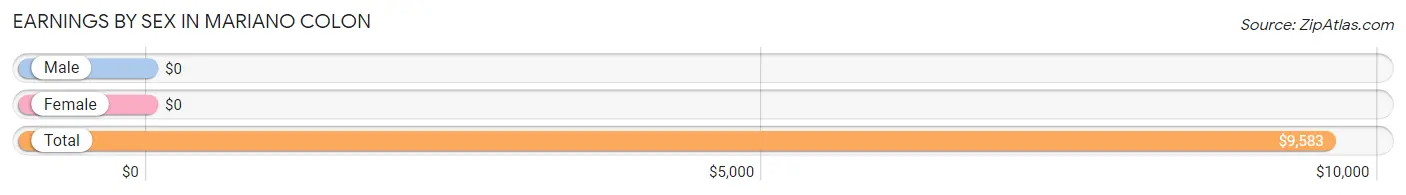
| Sex | Number | Average Earnings |
| Male | 440 (61.2%) | $0 |
| Female | 279 (38.8%) | $0 |
| Total | 719 (100.0%) | $9,583 |
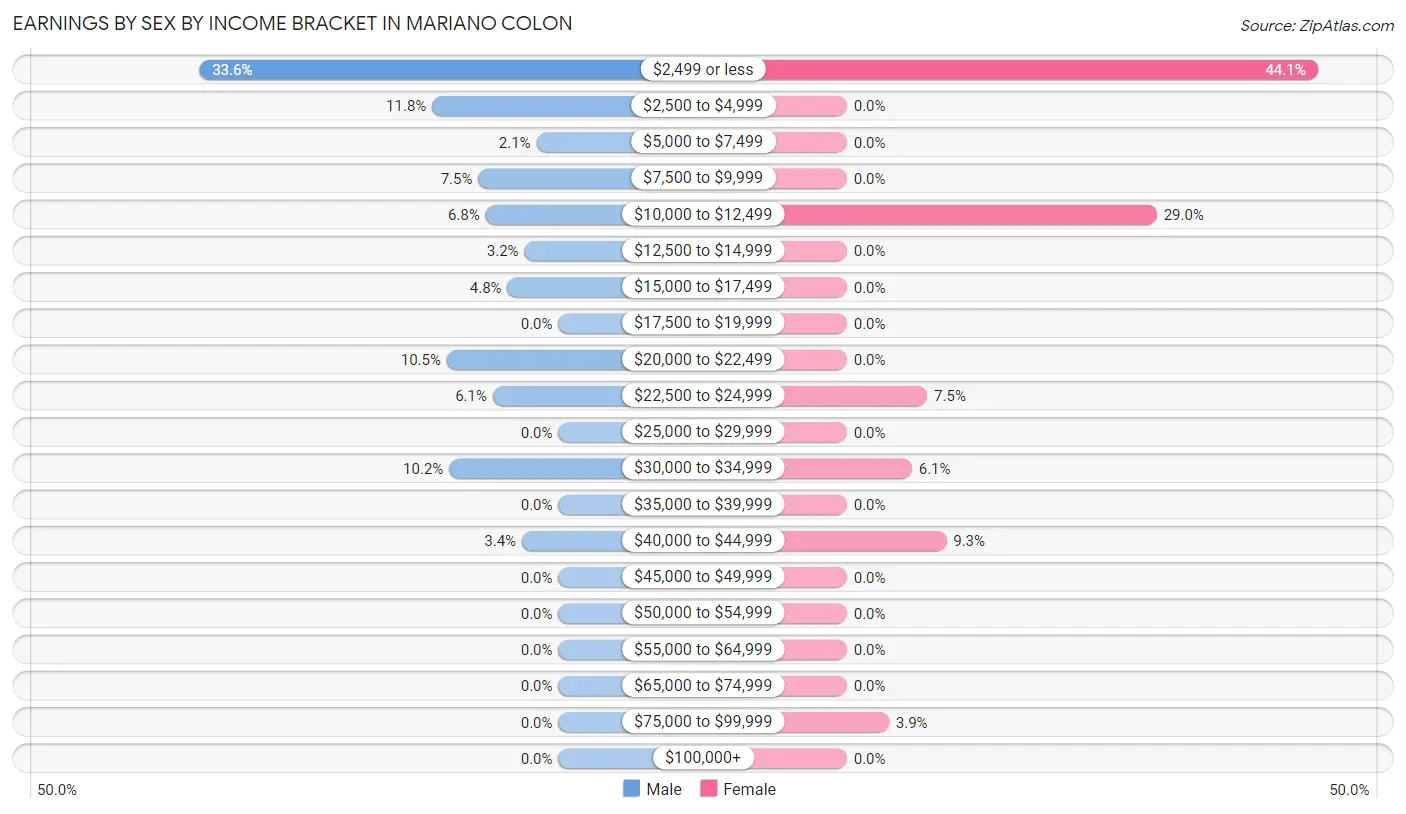
Earnings by Sex by Income Bracket in Mariano Colon
The most common earnings brackets in Mariano Colon are $2,499 or less for men (148 | 33.6%) and $2,499 or less for women (123 | 44.1%).
| Income | Male | Female |
| $2,499 or less | 148 (33.6%) | 123 (44.1%) |
| $2,500 to $4,999 | 52 (11.8%) | 0 (0.0%) |
| $5,000 to $7,499 | 9 (2.1%) | 0 (0.0%) |
| $7,500 to $9,999 | 33 (7.5%) | 0 (0.0%) |
| $10,000 to $12,499 | 30 (6.8%) | 81 (29.0%) |
| $12,500 to $14,999 | 14 (3.2%) | 0 (0.0%) |
| $15,000 to $17,499 | 21 (4.8%) | 0 (0.0%) |
| $17,500 to $19,999 | 0 (0.0%) | 0 (0.0%) |
| $20,000 to $22,499 | 46 (10.4%) | 0 (0.0%) |
| $22,500 to $24,999 | 27 (6.1%) | 21 (7.5%) |
| $25,000 to $29,999 | 0 (0.0%) | 0 (0.0%) |
| $30,000 to $34,999 | 45 (10.2%) | 17 (6.1%) |
| $35,000 to $39,999 | 0 (0.0%) | 0 (0.0%) |
| $40,000 to $44,999 | 15 (3.4%) | 26 (9.3%) |
| $45,000 to $49,999 | 0 (0.0%) | 0 (0.0%) |
| $50,000 to $54,999 | 0 (0.0%) | 0 (0.0%) |
| $55,000 to $64,999 | 0 (0.0%) | 0 (0.0%) |
| $65,000 to $74,999 | 0 (0.0%) | 0 (0.0%) |
| $75,000 to $99,999 | 0 (0.0%) | 11 (3.9%) |
| $100,000+ | 0 (0.0%) | 0 (0.0%) |
| Total | 440 (100.0%) | 279 (100.0%) |
Earnings by Sex by Educational Attainment in Mariano Colon
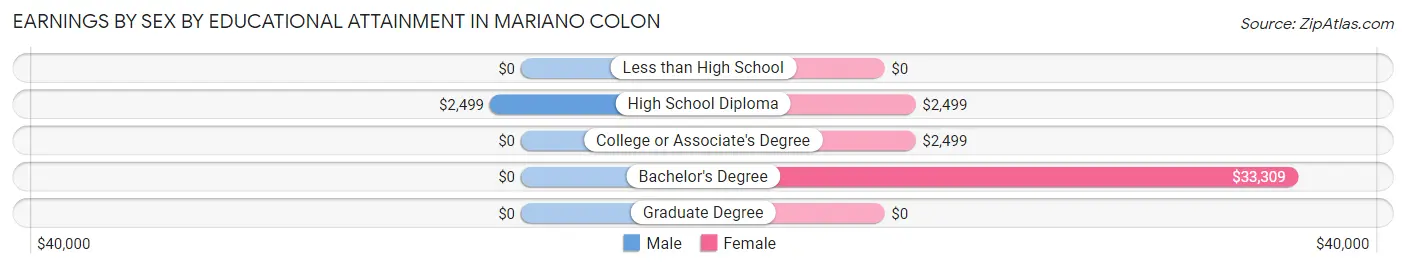
| Educational Attainment | Male Income | Female Income |
| Less than High School | - | - |
| High School Diploma | $2,499 | $2,499 |
| College or Associate's Degree | - | - |
| Bachelor's Degree | - | - |
| Graduate Degree | - | - |
| Total | - | - |
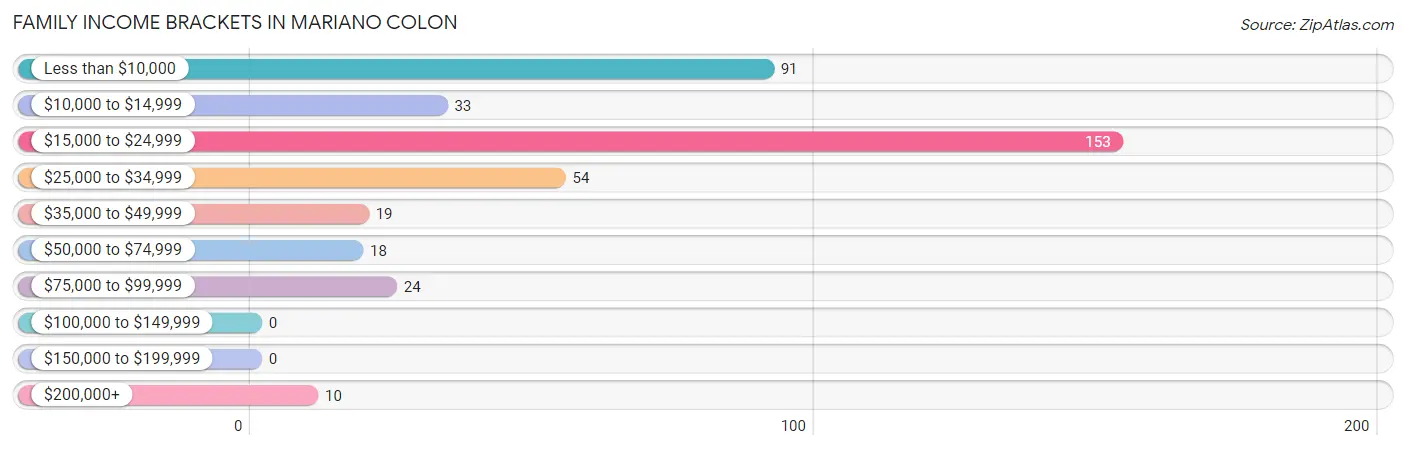
Family Income in Mariano Colon
Family Income Brackets in Mariano Colon
According to the Mariano Colon family income data, there are 153 families falling into the $15,000 to $24,999 income range, which is the most common income bracket and makes up 38.1% of all families.
| Income Bracket | # Families | % Families |
| Less than $10,000 | 91 | 22.6% |
| $10,000 to $14,999 | 33 | 8.2% |
| $15,000 to $24,999 | 153 | 38.1% |
| $25,000 to $34,999 | 54 | 13.4% |
| $35,000 to $49,999 | 19 | 4.7% |
| $50,000 to $74,999 | 18 | 4.5% |
| $75,000 to $99,999 | 24 | 6.0% |
| $100,000 to $149,999 | 0 | 0.0% |
| $150,000 to $199,999 | 0 | 0.0% |
| $200,000+ | 10 | 2.5% |
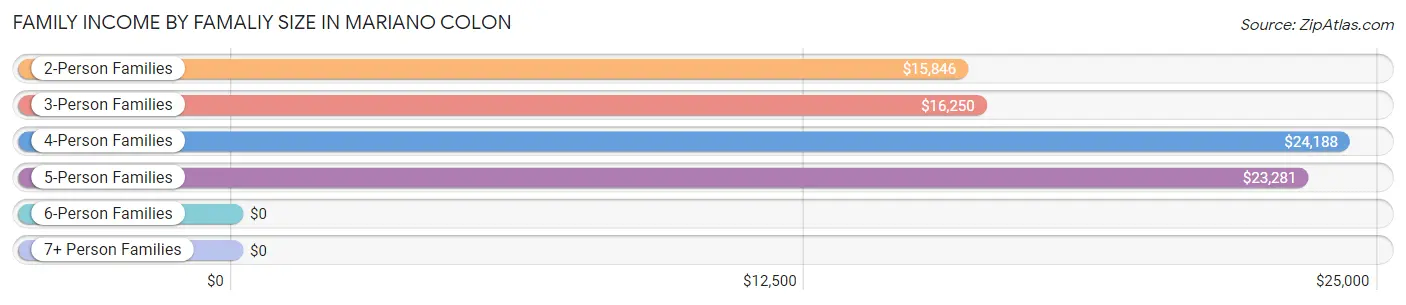
Family Income by Famaliy Size in Mariano Colon
4-person families (111 | 27.6%) account for the highest median family income in Mariano Colon with $24,188 per family, while 2-person families (119 | 29.6%) have the highest median income of $7,923 per family member.
| Income Bracket | # Families | Median Income |
| 2-Person Families | 119 (29.6%) | $15,846 |
| 3-Person Families | 110 (27.4%) | $16,250 |
| 4-Person Families | 111 (27.6%) | $24,188 |
| 5-Person Families | 53 (13.2%) | $23,281 |
| 6-Person Families | 9 (2.2%) | $0 |
| 7+ Person Families | 0 (0.0%) | $0 |
| Total | 402 (100.0%) | $19,688 |
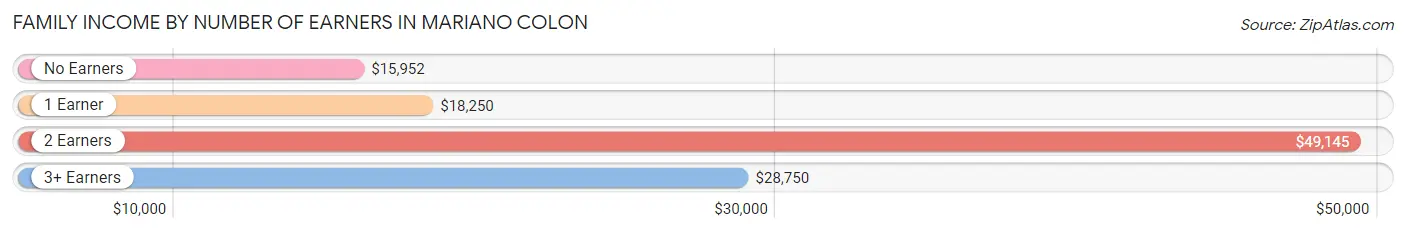
Family Income by Number of Earners in Mariano Colon
The median family income in Mariano Colon is $19,688, with families comprising 2 earners (63) having the highest median family income of $49,145, while families with no earners (100) have the lowest median family income of $15,952, accounting for 15.7% and 24.9% of families, respectively.
| Number of Earners | # Families | Median Income |
| No Earners | 100 (24.9%) | $15,952 |
| 1 Earner | 199 (49.5%) | $18,250 |
| 2 Earners | 63 (15.7%) | $49,145 |
| 3+ Earners | 40 (10.0%) | $28,750 |
| Total | 402 (100.0%) | $19,688 |
Household Income in Mariano Colon
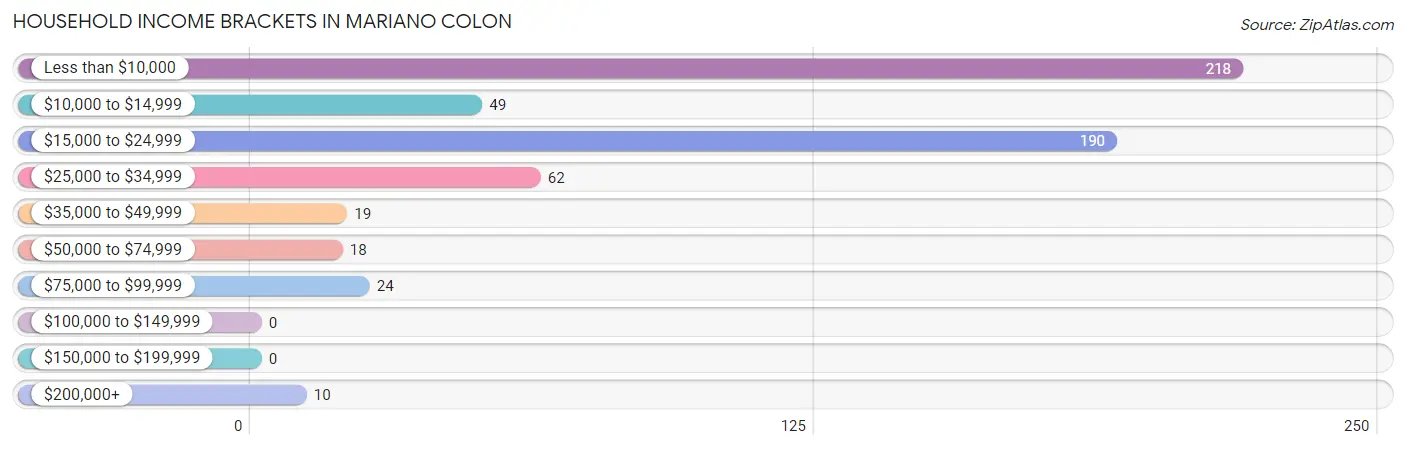
Household Income Brackets in Mariano Colon
With 218 households falling in the category, the less than $10,000 income range is the most frequent in Mariano Colon, accounting for 36.9% of all households.
| Income Bracket | # Households | % Households |
| Less than $10,000 | 218 | 36.9% |
| $10,000 to $14,999 | 49 | 8.3% |
| $15,000 to $24,999 | 190 | 32.2% |
| $25,000 to $34,999 | 62 | 10.5% |
| $35,000 to $49,999 | 19 | 3.2% |
| $50,000 to $74,999 | 18 | 3.1% |
| $75,000 to $99,999 | 24 | 4.1% |
| $100,000 to $149,999 | 0 | 0.0% |
| $150,000 to $199,999 | 0 | 0.0% |
| $200,000+ | 10 | 1.7% |
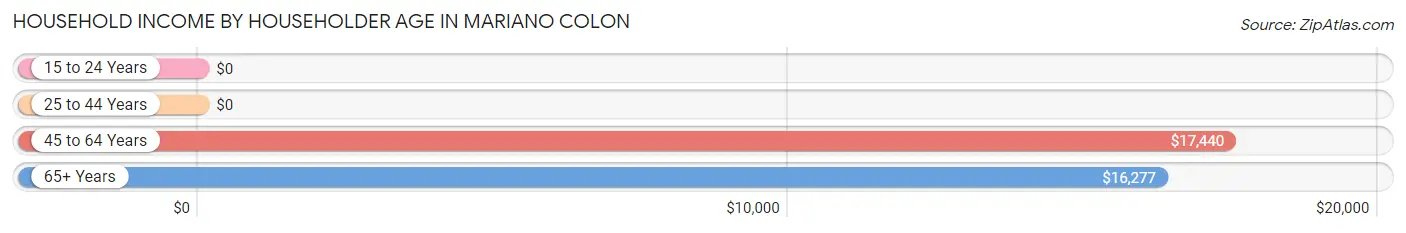
Household Income by Householder Age in Mariano Colon
The median household income in Mariano Colon is $16,029, with the highest median household income of $17,440 found in the 45 to 64 years age bracket for the primary householder. A total of 155 households (26.3%) fall into this category. Meanwhile, the 15 to 24 years age bracket for the primary householder has the lowest median household income of $0, with 11 households (1.9%) in this group.
| Income Bracket | # Households | Median Income |
| 15 to 24 Years | 11 (1.9%) | $0 |
| 25 to 44 Years | 206 (34.9%) | $0 |
| 45 to 64 Years | 155 (26.3%) | $17,440 |
| 65+ Years | 218 (36.9%) | $16,277 |
| Total | 590 (100.0%) | $16,029 |
Poverty in Mariano Colon
Income Below Poverty by Sex and Age in Mariano Colon
With 73.4% poverty level for males and 70.4% for females among the residents of Mariano Colon, under 5 year old males and under 5 year old females are the most vulnerable to poverty, with 36 males (100.0%) and 72 females (100.0%) in their respective age groups living below the poverty level.
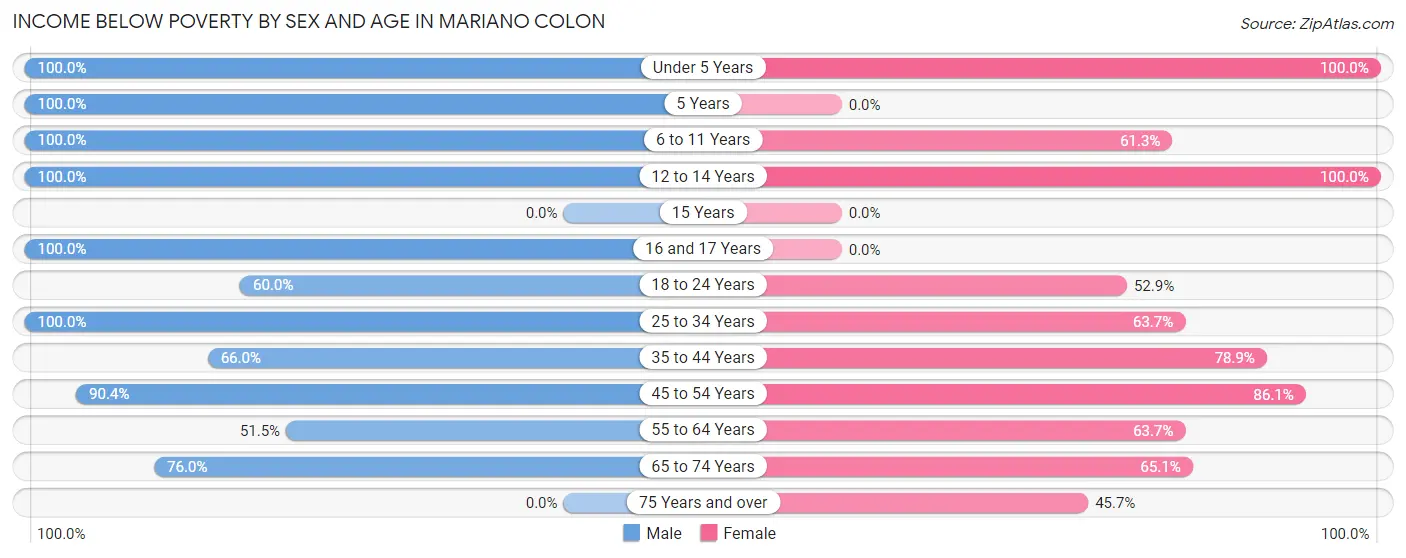
| Age Bracket | Male | Female |
| Under 5 Years | 36 (100.0%) | 72 (100.0%) |
| 5 Years | 19 (100.0%) | 0 (0.0%) |
| 6 to 11 Years | 40 (100.0%) | 46 (61.3%) |
| 12 to 14 Years | 22 (100.0%) | 51 (100.0%) |
| 15 Years | 0 (0.0%) | 0 (0.0%) |
| 16 and 17 Years | 29 (100.0%) | 0 (0.0%) |
| 18 to 24 Years | 27 (60.0%) | 54 (52.9%) |
| 25 to 34 Years | 162 (100.0%) | 93 (63.7%) |
| 35 to 44 Years | 101 (66.0%) | 97 (78.9%) |
| 45 to 54 Years | 85 (90.4%) | 130 (86.1%) |
| 55 to 64 Years | 69 (51.5%) | 58 (63.7%) |
| 65 to 74 Years | 60 (75.9%) | 84 (65.1%) |
| 75 Years and over | 0 (0.0%) | 43 (45.7%) |
| Total | 650 (73.4%) | 728 (70.4%) |
Income Above Poverty by Sex and Age in Mariano Colon
According to the poverty statistics in Mariano Colon, males aged 75 years and over and females aged 75 years and over are the age groups that are most secure financially, with 100.0% of males and 54.3% of females in these age groups living above the poverty line.
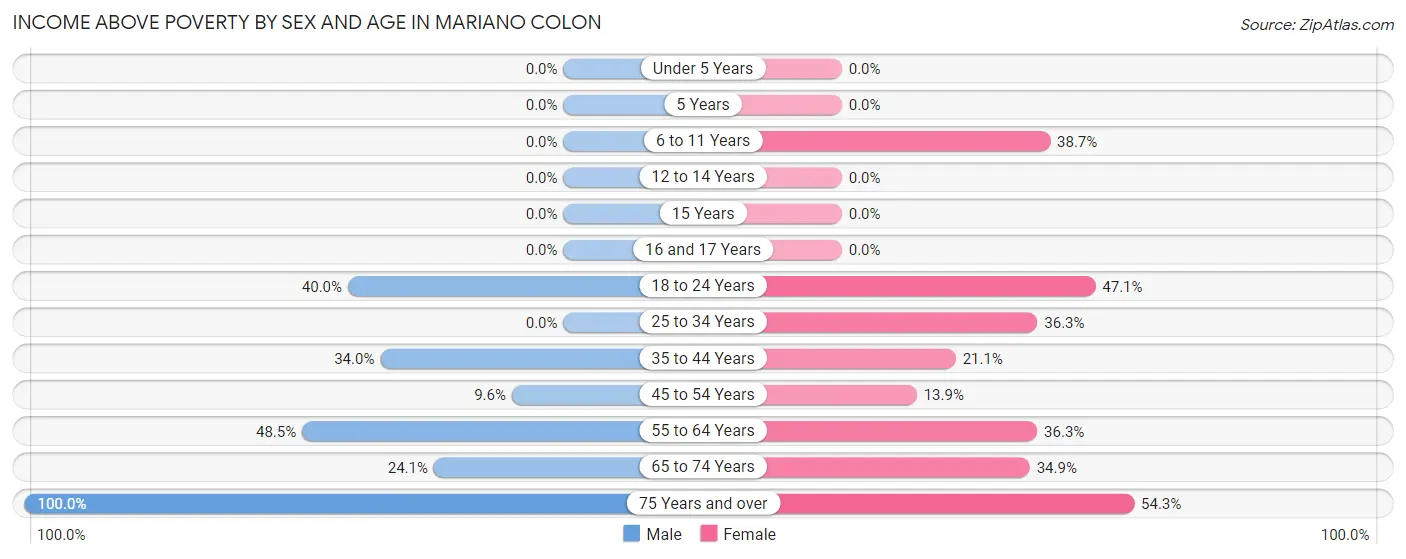
| Age Bracket | Male | Female |
| Under 5 Years | 0 (0.0%) | 0 (0.0%) |
| 5 Years | 0 (0.0%) | 0 (0.0%) |
| 6 to 11 Years | 0 (0.0%) | 29 (38.7%) |
| 12 to 14 Years | 0 (0.0%) | 0 (0.0%) |
| 15 Years | 0 (0.0%) | 0 (0.0%) |
| 16 and 17 Years | 0 (0.0%) | 0 (0.0%) |
| 18 to 24 Years | 18 (40.0%) | 48 (47.1%) |
| 25 to 34 Years | 0 (0.0%) | 53 (36.3%) |
| 35 to 44 Years | 52 (34.0%) | 26 (21.1%) |
| 45 to 54 Years | 9 (9.6%) | 21 (13.9%) |
| 55 to 64 Years | 65 (48.5%) | 33 (36.3%) |
| 65 to 74 Years | 19 (24.0%) | 45 (34.9%) |
| 75 Years and over | 73 (100.0%) | 51 (54.3%) |
| Total | 236 (26.6%) | 306 (29.6%) |
Income Below Poverty Among Married-Couple Families in Mariano Colon
The poverty statistics for married-couple families in Mariano Colon show that 65.0% or 199 of the total 306 families live below the poverty line. Families with 3 or 4 children have the highest poverty rate of 100.0%, comprising of 21 families. On the other hand, families with no children have the lowest poverty rate of 48.0%, which includes 85 families.
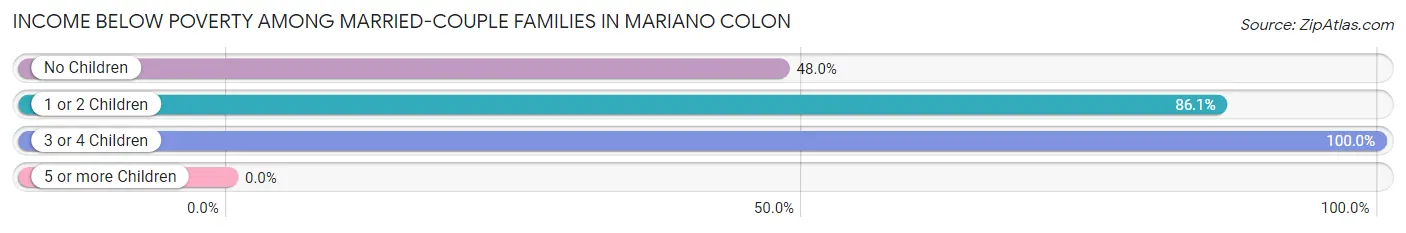
| Children | Above Poverty | Below Poverty |
| No Children | 92 (52.0%) | 85 (48.0%) |
| 1 or 2 Children | 15 (13.9%) | 93 (86.1%) |
| 3 or 4 Children | 0 (0.0%) | 21 (100.0%) |
| 5 or more Children | 0 (0.0%) | 0 (0.0%) |
| Total | 107 (35.0%) | 199 (65.0%) |
Income Below Poverty Among Single-Parent Households in Mariano Colon
According to the poverty data in Mariano Colon, 66.7% or 14 single-father households and 100.0% or 75 single-mother households are living below the poverty line. Among single-father households, those with 3 or 4 children have the highest poverty rate, with 14 households (100.0%) experiencing poverty. Likewise, among single-mother households, those with no children have the highest poverty rate, with 55 households (100.0%) falling below the poverty line.
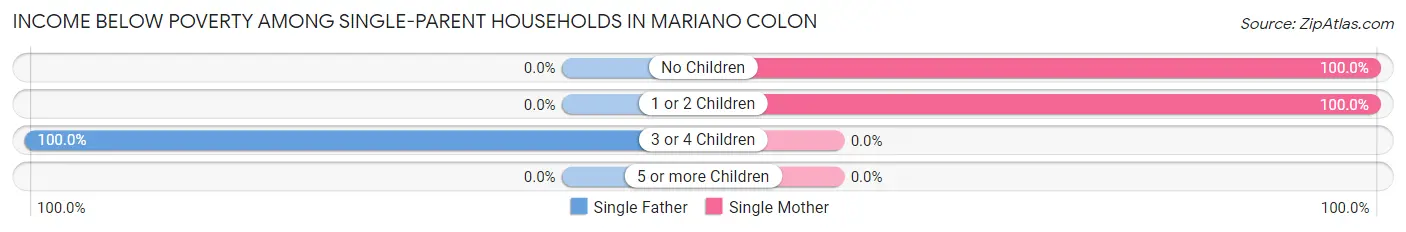
| Children | Single Father | Single Mother |
| No Children | 0 (0.0%) | 55 (100.0%) |
| 1 or 2 Children | 0 (0.0%) | 20 (100.0%) |
| 3 or 4 Children | 14 (100.0%) | 0 (0.0%) |
| 5 or more Children | 0 (0.0%) | 0 (0.0%) |
| Total | 14 (66.7%) | 75 (100.0%) |
Income Below Poverty Among Married-Couple vs Single-Parent Households in Mariano Colon
The poverty data for Mariano Colon shows that 199 of the married-couple family households (65.0%) and 89 of the single-parent households (92.7%) are living below the poverty level. Within the married-couple family households, those with 3 or 4 children have the highest poverty rate, with 21 households (100.0%) falling below the poverty line. Among the single-parent households, those with 1 or 2 children have the highest poverty rate, with 20 household (100.0%) living below poverty.
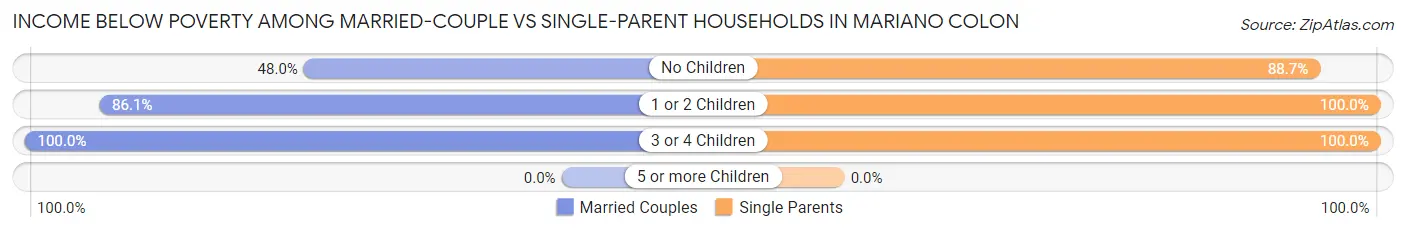
| Children | Married-Couple Families | Single-Parent Households |
| No Children | 85 (48.0%) | 55 (88.7%) |
| 1 or 2 Children | 93 (86.1%) | 20 (100.0%) |
| 3 or 4 Children | 21 (100.0%) | 14 (100.0%) |
| 5 or more Children | 0 (0.0%) | 0 (0.0%) |
| Total | 199 (65.0%) | 89 (92.7%) |
Race in Mariano Colon
The most populous races in Mariano Colon are Hispanic or Latino (1,920 | 100.0%), Two or more Races (729 | 38.0%), and White / Caucasian (564 | 29.4%).
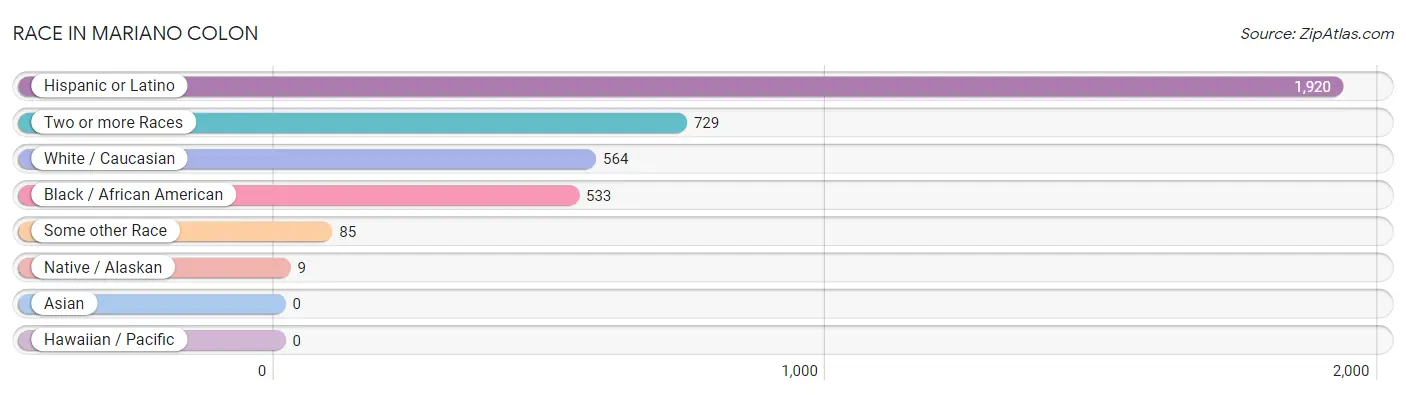
| Race | # Population | % Population |
| Asian | 0 | 0.0% |
| Black / African American | 533 | 27.8% |
| Hawaiian / Pacific | 0 | 0.0% |
| Hispanic or Latino | 1,920 | 100.0% |
| Native / Alaskan | 9 | 0.5% |
| White / Caucasian | 564 | 29.4% |
| Two or more Races | 729 | 38.0% |
| Some other Race | 85 | 4.4% |
| Total | 1,920 | 100.0% |
Ancestry in Mariano Colon
The most populous ancestries reported in Mariano Colon are Puerto Rican (1,913 | 99.6%), Central American Indian (9 | 0.5%), and Cuban (7 | 0.4%), together accounting for 100.5% of all Mariano Colon residents.
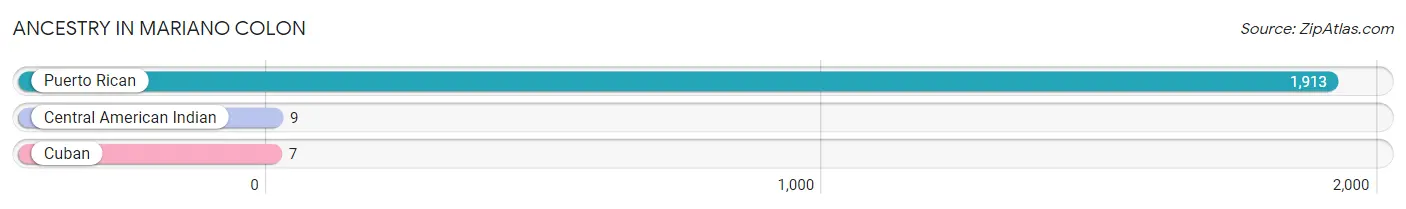
| Ancestry | # Population | % Population |
| Central American Indian | 9 | 0.5% |
| Cuban | 7 | 0.4% |
| Puerto Rican | 1,913 | 99.6% | View All 3 Rows |
Immigrants in Mariano Colon

| Immigration Origin | # Population | % Population | View All 0 Rows |
Sex and Age in Mariano Colon
Sex and Age in Mariano Colon
The most populous age groups in Mariano Colon are 25 to 29 Years (125 | 14.1%) for men and 45 to 49 Years (107 | 10.3%) for women.
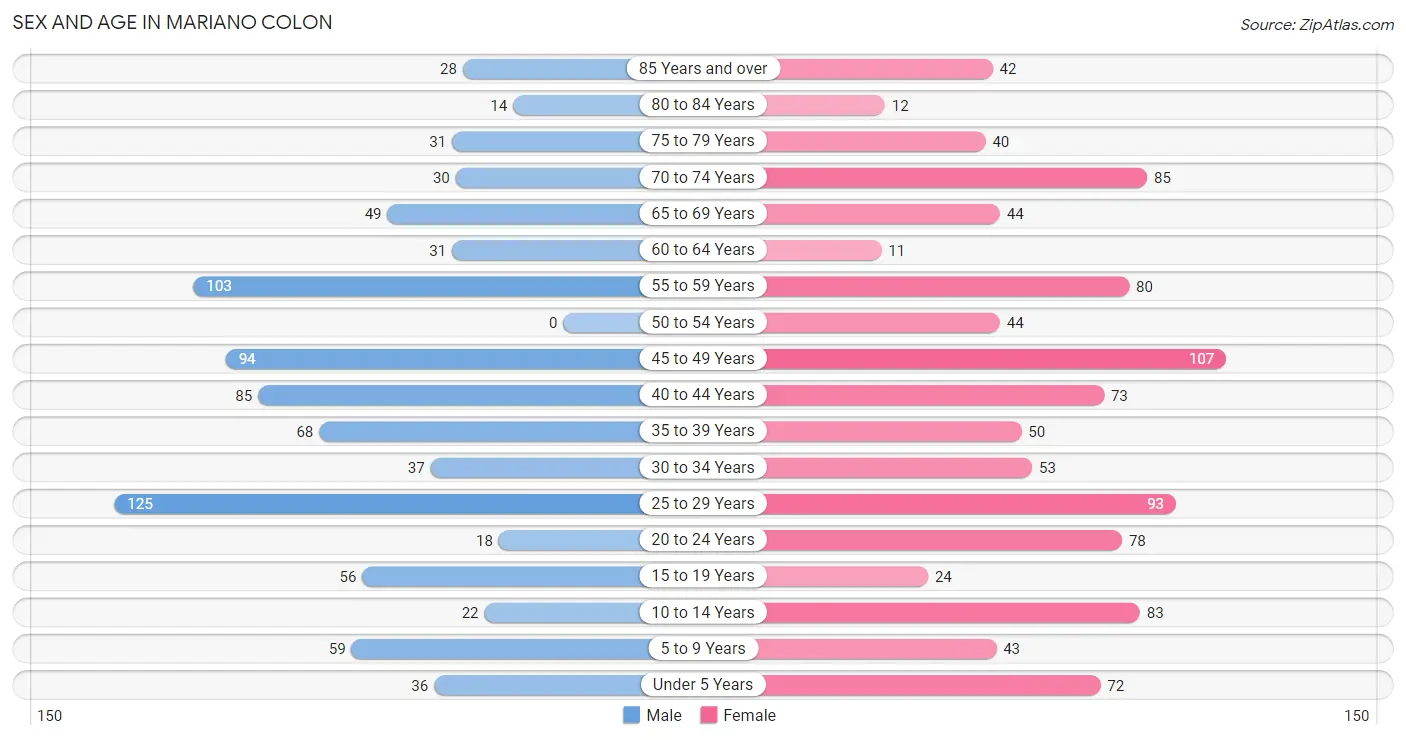
| Age Bracket | Male | Female |
| Under 5 Years | 36 (4.1%) | 72 (7.0%) |
| 5 to 9 Years | 59 (6.7%) | 43 (4.2%) |
| 10 to 14 Years | 22 (2.5%) | 83 (8.0%) |
| 15 to 19 Years | 56 (6.3%) | 24 (2.3%) |
| 20 to 24 Years | 18 (2.0%) | 78 (7.5%) |
| 25 to 29 Years | 125 (14.1%) | 93 (9.0%) |
| 30 to 34 Years | 37 (4.2%) | 53 (5.1%) |
| 35 to 39 Years | 68 (7.7%) | 50 (4.8%) |
| 40 to 44 Years | 85 (9.6%) | 73 (7.1%) |
| 45 to 49 Years | 94 (10.6%) | 107 (10.3%) |
| 50 to 54 Years | 0 (0.0%) | 44 (4.3%) |
| 55 to 59 Years | 103 (11.6%) | 80 (7.7%) |
| 60 to 64 Years | 31 (3.5%) | 11 (1.1%) |
| 65 to 69 Years | 49 (5.5%) | 44 (4.3%) |
| 70 to 74 Years | 30 (3.4%) | 85 (8.2%) |
| 75 to 79 Years | 31 (3.5%) | 40 (3.9%) |
| 80 to 84 Years | 14 (1.6%) | 12 (1.2%) |
| 85 Years and over | 28 (3.2%) | 42 (4.1%) |
| Total | 886 (100.0%) | 1,034 (100.0%) |
Families and Households in Mariano Colon
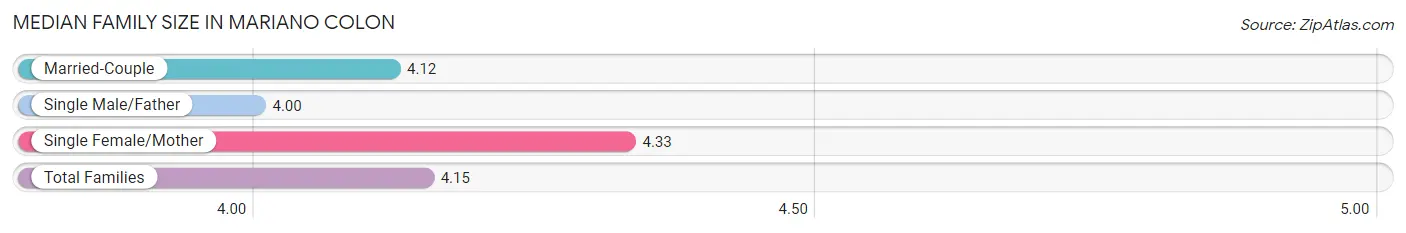
Median Family Size in Mariano Colon
The median family size in Mariano Colon is 4.15 persons per family, with single female/mother families (75 | 18.7%) accounting for the largest median family size of 4.33 persons per family. On the other hand, single male/father families (21 | 5.2%) represent the smallest median family size with 4.00 persons per family.
| Family Type | # Families | Family Size |
| Married-Couple | 306 (76.1%) | 4.12 |
| Single Male/Father | 21 (5.2%) | 4.00 |
| Single Female/Mother | 75 (18.7%) | 4.33 |
| Total Families | 402 (100.0%) | 4.15 |
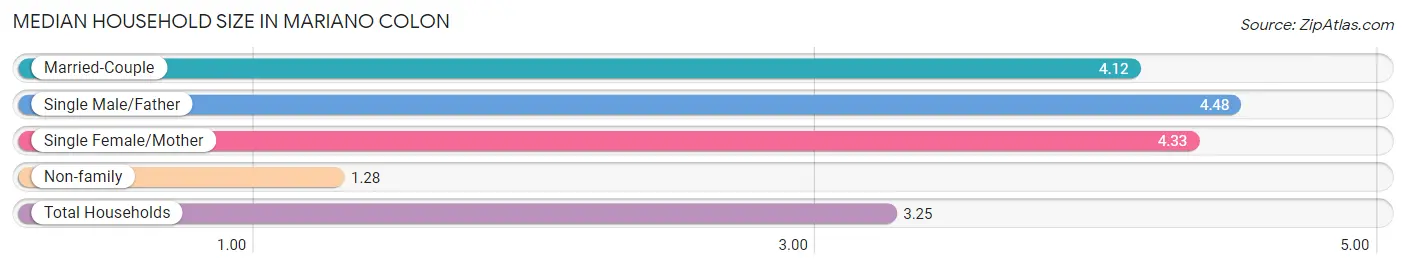
Median Household Size in Mariano Colon
The median household size in Mariano Colon is 3.25 persons per household, with single male/father households (21 | 3.6%) accounting for the largest median household size of 4.48 persons per household. non-family households (188 | 31.9%) represent the smallest median household size with 1.28 persons per household.
| Household Type | # Households | Household Size |
| Married-Couple | 306 (51.9%) | 4.12 |
| Single Male/Father | 21 (3.6%) | 4.48 |
| Single Female/Mother | 75 (12.7%) | 4.33 |
| Non-family | 188 (31.9%) | 1.28 |
| Total Households | 590 (100.0%) | 3.25 |
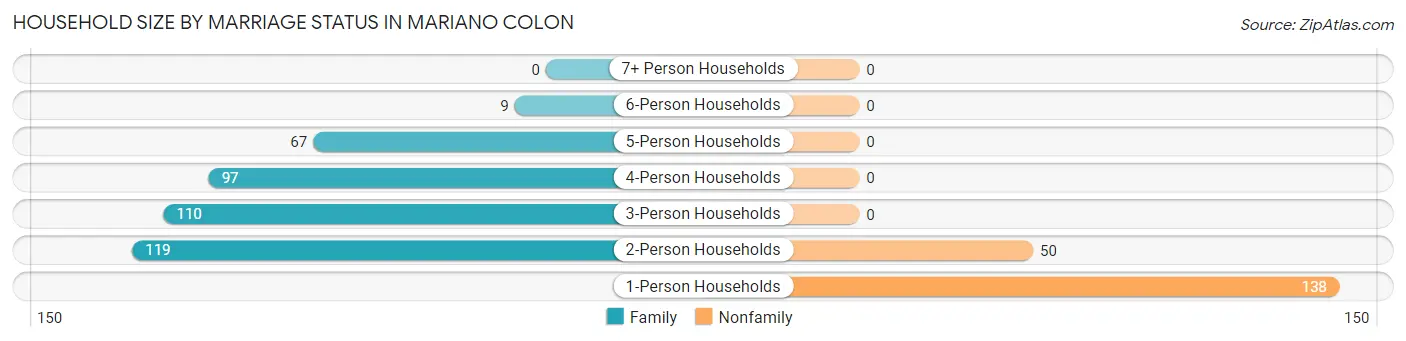
Household Size by Marriage Status in Mariano Colon
Out of a total of 590 households in Mariano Colon, 402 (68.1%) are family households, while 188 (31.9%) are nonfamily households. The most numerous type of family households are 2-person households, comprising 119, and the most common type of nonfamily households are 1-person households, comprising 138.
| Household Size | Family Households | Nonfamily Households |
| 1-Person Households | - | 138 (23.4%) |
| 2-Person Households | 119 (20.2%) | 50 (8.5%) |
| 3-Person Households | 110 (18.6%) | 0 (0.0%) |
| 4-Person Households | 97 (16.4%) | 0 (0.0%) |
| 5-Person Households | 67 (11.4%) | 0 (0.0%) |
| 6-Person Households | 9 (1.5%) | 0 (0.0%) |
| 7+ Person Households | 0 (0.0%) | 0 (0.0%) |
| Total | 402 (68.1%) | 188 (31.9%) |
Female Fertility in Mariano Colon
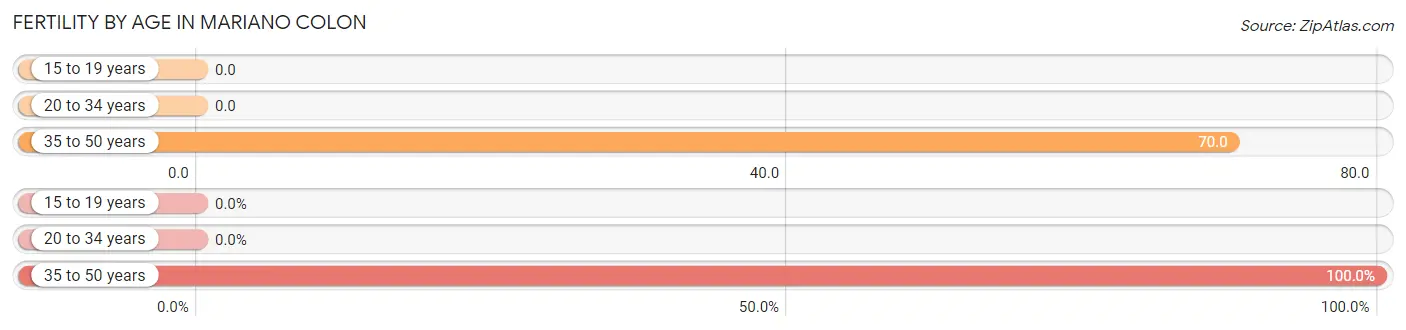
Fertility by Age in Mariano Colon
Average fertility rate in Mariano Colon is 33.0 births per 1,000 women. Women in the age bracket of 35 to 50 years have the highest fertility rate with 70.0 births per 1,000 women. Women in the age bracket of 35 to 50 years acount for 100.0% of all women with births.
| Age Bracket | Women with Births | Births / 1,000 Women |
| 15 to 19 years | 0 (0.0%) | 0.0 |
| 20 to 34 years | 0 (0.0%) | 0.0 |
| 35 to 50 years | 16 (100.0%) | 70.0 |
| Total | 16 (100.0%) | 33.0 |
Fertility by Age by Marriage Status in Mariano Colon
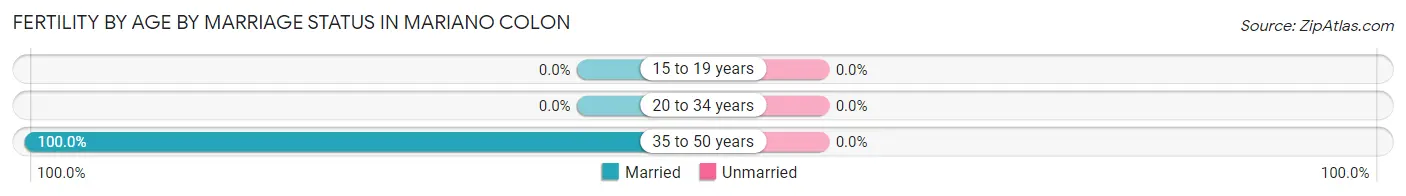
| Age Bracket | Married | Unmarried |
| 15 to 19 years | 0 (0.0%) | 0 (0.0%) |
| 20 to 34 years | 0 (0.0%) | 0 (0.0%) |
| 35 to 50 years | 16 (100.0%) | 0 (0.0%) |
| Total | 16 (100.0%) | 0 (0.0%) |
Fertility by Education in Mariano Colon
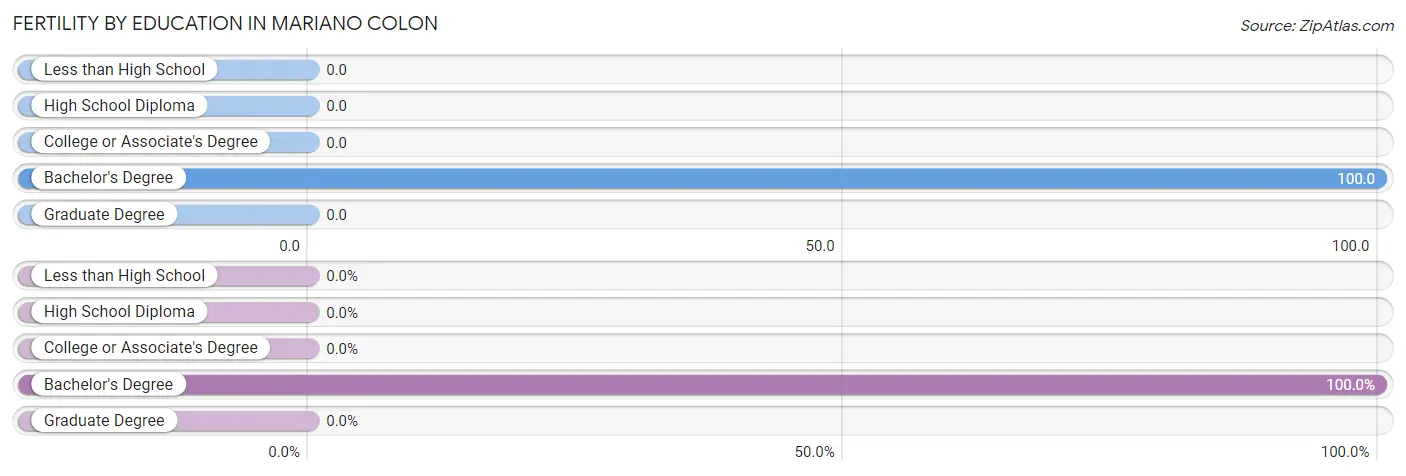
| Educational Attainment | Women with Births | Births / 1,000 Women |
| Less than High School | 0 (0.0%) | 0.0 |
| High School Diploma | 0 (0.0%) | 0.0 |
| College or Associate's Degree | 0 (0.0%) | 0.0 |
| Bachelor's Degree | 16 (100.0%) | 100.0 |
| Graduate Degree | 0 (0.0%) | 0.0 |
| Total | 16 (100.0%) | 33.0 |
Fertility by Education by Marriage Status in Mariano Colon
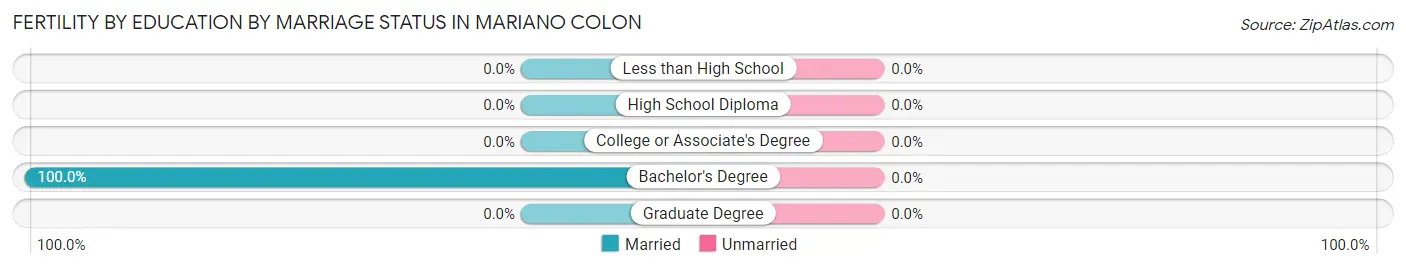
| Educational Attainment | Married | Unmarried |
| Less than High School | 0 (0.0%) | 0 (0.0%) |
| High School Diploma | 0 (0.0%) | 0 (0.0%) |
| College or Associate's Degree | 0 (0.0%) | 0 (0.0%) |
| Bachelor's Degree | 16 (100.0%) | 0 (0.0%) |
| Graduate Degree | 0 (0.0%) | 0 (0.0%) |
| Total | 16 (100.0%) | 0 (0.0%) |
Employment Characteristics in Mariano Colon
Employment by Class of Employer in Mariano Colon
Among the 587 employed individuals in Mariano Colon, private company employees (367 | 62.5%), self-employed (not incorporated) (113 | 19.3%), and state government employees (46 | 7.8%) make up the most common classes of employment.
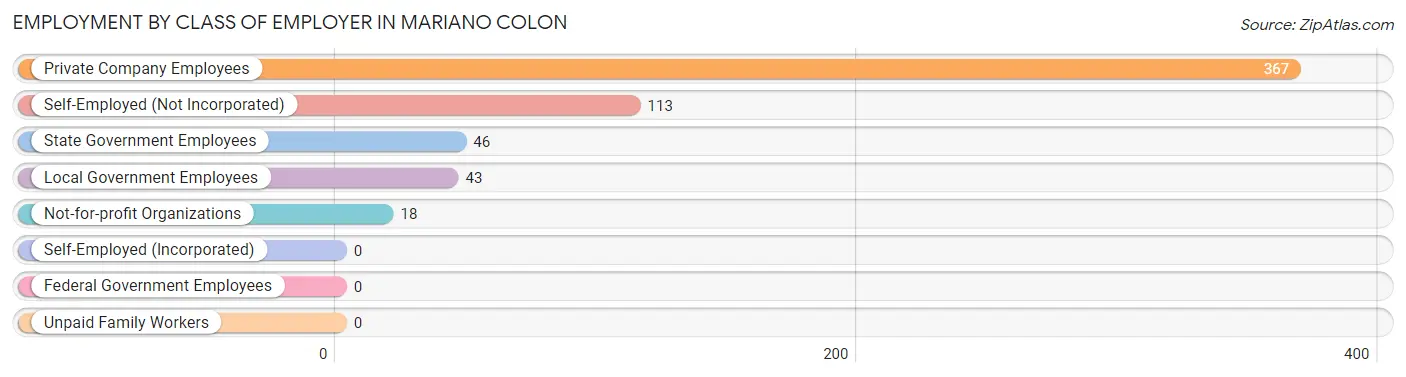
| Employer Class | # Employees | % Employees |
| Private Company Employees | 367 | 62.5% |
| Self-Employed (Incorporated) | 0 | 0.0% |
| Self-Employed (Not Incorporated) | 113 | 19.3% |
| Not-for-profit Organizations | 18 | 3.1% |
| Local Government Employees | 43 | 7.3% |
| State Government Employees | 46 | 7.8% |
| Federal Government Employees | 0 | 0.0% |
| Unpaid Family Workers | 0 | 0.0% |
| Total | 587 | 100.0% |
Employment Status by Age in Mariano Colon
According to the labor force statistics for Mariano Colon, out of the total population over 16 years of age (1,605), 44.4% or 713 individuals are in the labor force, with 12.6% or 90 of them unemployed. The age group with the highest labor force participation rate is 25 to 29 years, with 83.5% or 182 individuals in the labor force. Within the labor force, the 35 to 44 years age range has the highest percentage of unemployed individuals, with 34.7% or 61 of them being unemployed.
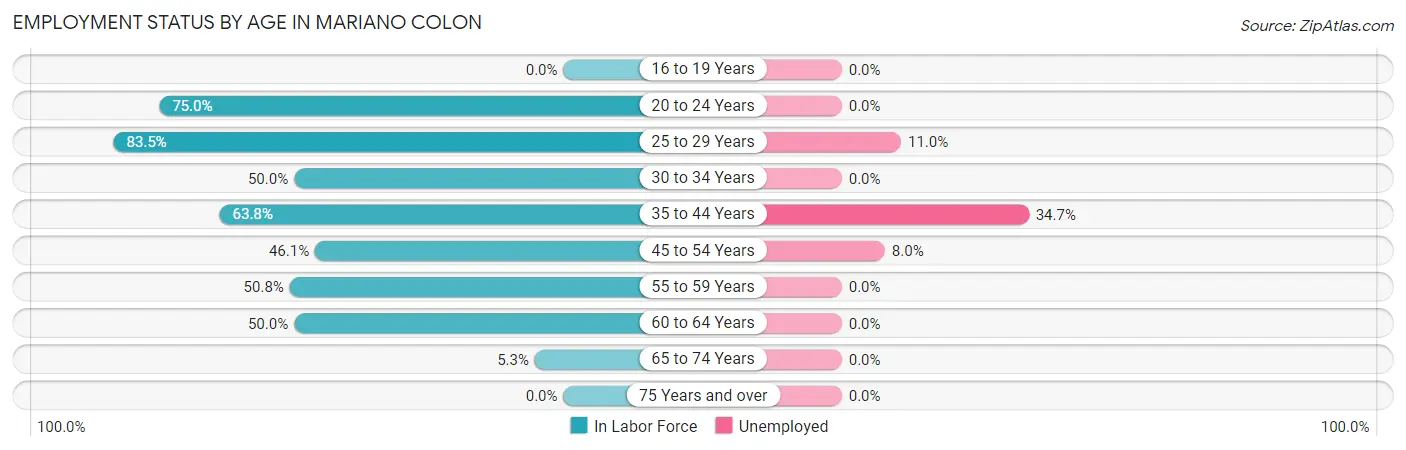
| Age Bracket | In Labor Force | Unemployed |
| 16 to 19 Years | 0 (0.0%) | 0 (0.0%) |
| 20 to 24 Years | 72 (75.0%) | 0 (0.0%) |
| 25 to 29 Years | 182 (83.5%) | 20 (11.0%) |
| 30 to 34 Years | 45 (50.0%) | 0 (0.0%) |
| 35 to 44 Years | 176 (63.8%) | 61 (34.7%) |
| 45 to 54 Years | 113 (46.1%) | 9 (8.0%) |
| 55 to 59 Years | 93 (50.8%) | 0 (0.0%) |
| 60 to 64 Years | 21 (50.0%) | 0 (0.0%) |
| 65 to 74 Years | 11 (5.3%) | 0 (0.0%) |
| 75 Years and over | 0 (0.0%) | 0 (0.0%) |
| Total | 713 (44.4%) | 90 (12.6%) |
Employment Status by Educational Attainment in Mariano Colon
According to labor force statistics for Mariano Colon, 59.8% of individuals (630) out of the total population between 25 and 64 years of age (1,054) are in the labor force, with 14.3% or 90 of them being unemployed. The group with the highest labor force participation rate are those with the educational attainment of high school diploma, with 78.5% or 284 individuals in the labor force. Within the labor force, individuals with college / associate degree education have the highest percentage of unemployment, with 43.1% or 53 of them being unemployed.
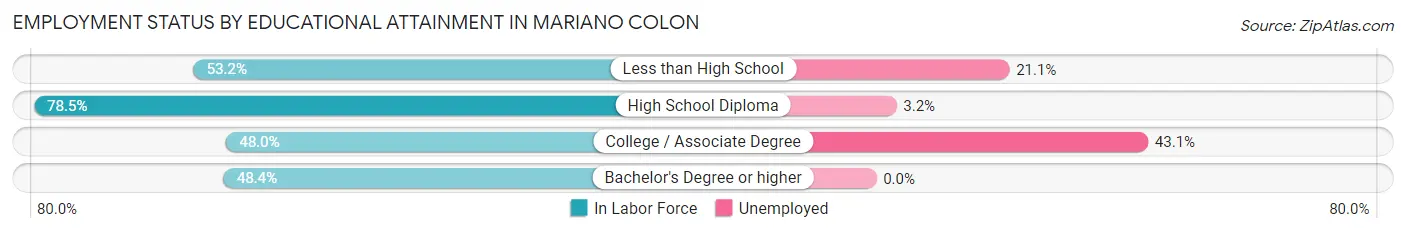
| Educational Attainment | In Labor Force | Unemployed |
| Less than High School | 133 (53.2%) | 53 (21.1%) |
| High School Diploma | 284 (78.5%) | 12 (3.2%) |
| College / Associate Degree | 123 (48.0%) | 110 (43.1%) |
| Bachelor's Degree or higher | 90 (48.4%) | 0 (0.0%) |
| Total | 630 (59.8%) | 151 (14.3%) |
Employment Occupations by Sex in Mariano Colon
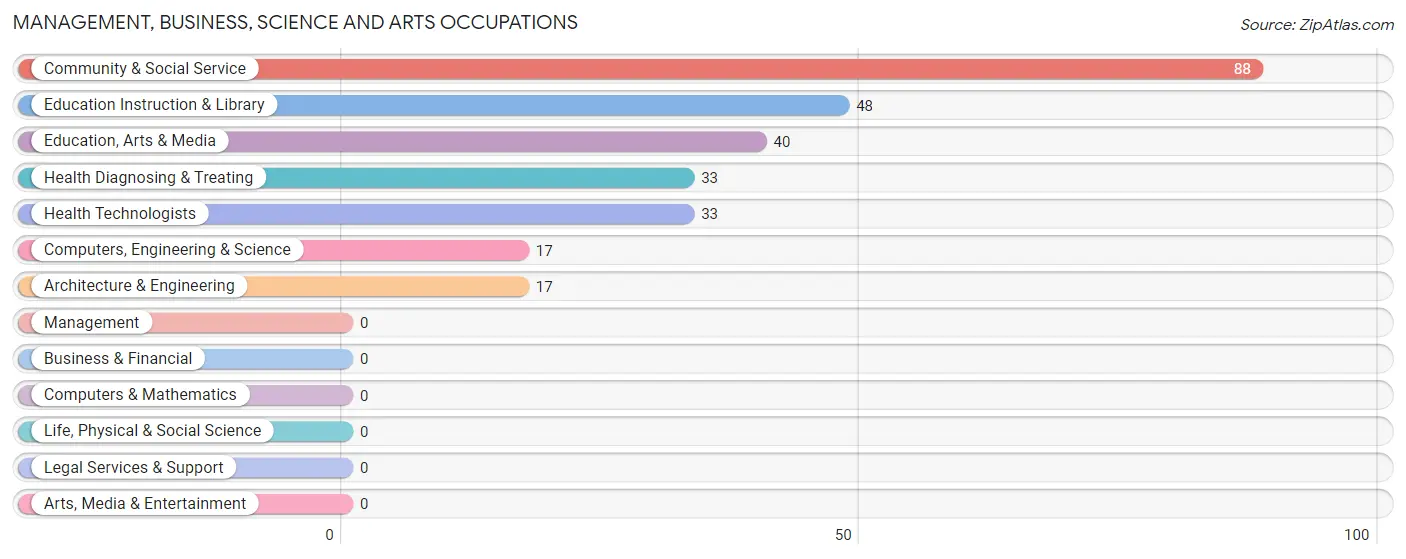
Management, Business, Science and Arts Occupations
The most common Management, Business, Science and Arts occupations in Mariano Colon are Community & Social Service (88 | 14.1%), Education Instruction & Library (48 | 7.7%), Education, Arts & Media (40 | 6.4%), Health Diagnosing & Treating (33 | 5.3%), and Health Technologists (33 | 5.3%).
Management, Business, Science and Arts Occupations by Sex
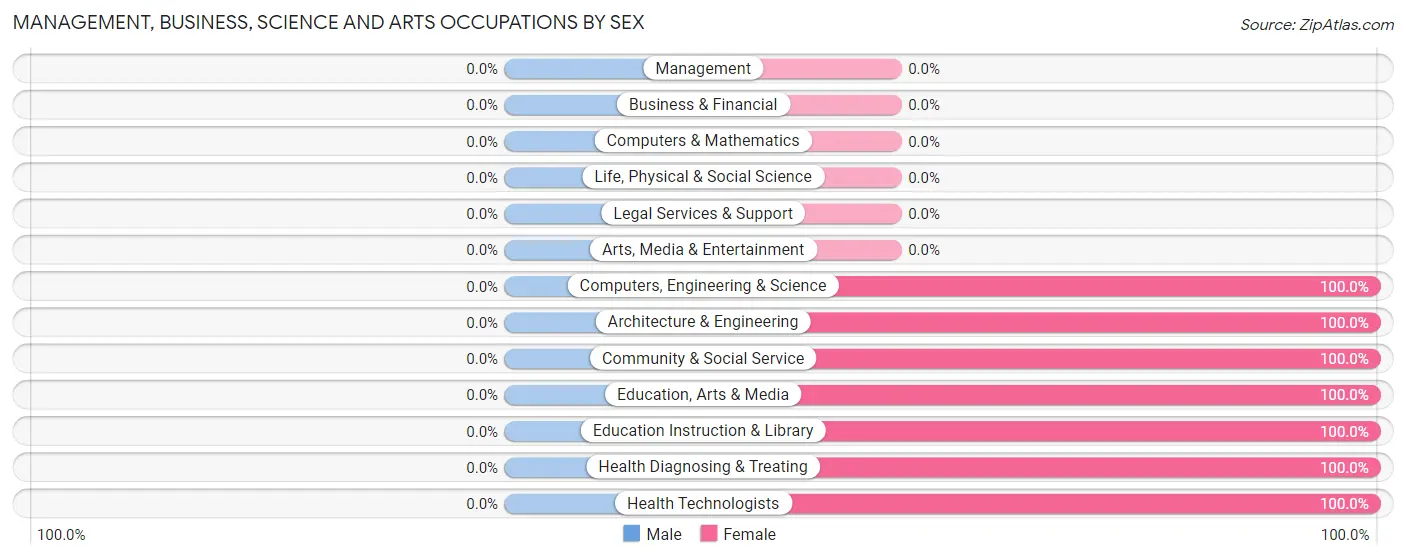
| Occupation | Male | Female |
| Management | 0 (0.0%) | 0 (0.0%) |
| Business & Financial | 0 (0.0%) | 0 (0.0%) |
| Computers, Engineering & Science | 0 (0.0%) | 17 (100.0%) |
| Computers & Mathematics | 0 (0.0%) | 0 (0.0%) |
| Architecture & Engineering | 0 (0.0%) | 17 (100.0%) |
| Life, Physical & Social Science | 0 (0.0%) | 0 (0.0%) |
| Community & Social Service | 0 (0.0%) | 88 (100.0%) |
| Education, Arts & Media | 0 (0.0%) | 40 (100.0%) |
| Legal Services & Support | 0 (0.0%) | 0 (0.0%) |
| Education Instruction & Library | 0 (0.0%) | 48 (100.0%) |
| Arts, Media & Entertainment | 0 (0.0%) | 0 (0.0%) |
| Health Diagnosing & Treating | 0 (0.0%) | 33 (100.0%) |
| Health Technologists | 0 (0.0%) | 33 (100.0%) |
| Total (Category) | 0 (0.0%) | 138 (100.0%) |
| Total (Overall) | 384 (61.6%) | 239 (38.4%) |
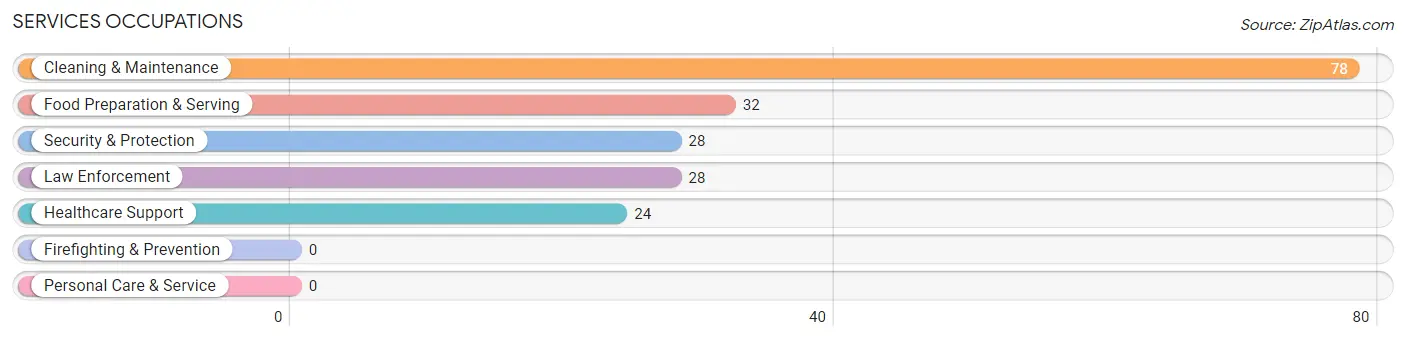
Services Occupations
The most common Services occupations in Mariano Colon are Cleaning & Maintenance (78 | 12.5%), Food Preparation & Serving (32 | 5.1%), Security & Protection (28 | 4.5%), Law Enforcement (28 | 4.5%), and Healthcare Support (24 | 3.8%).
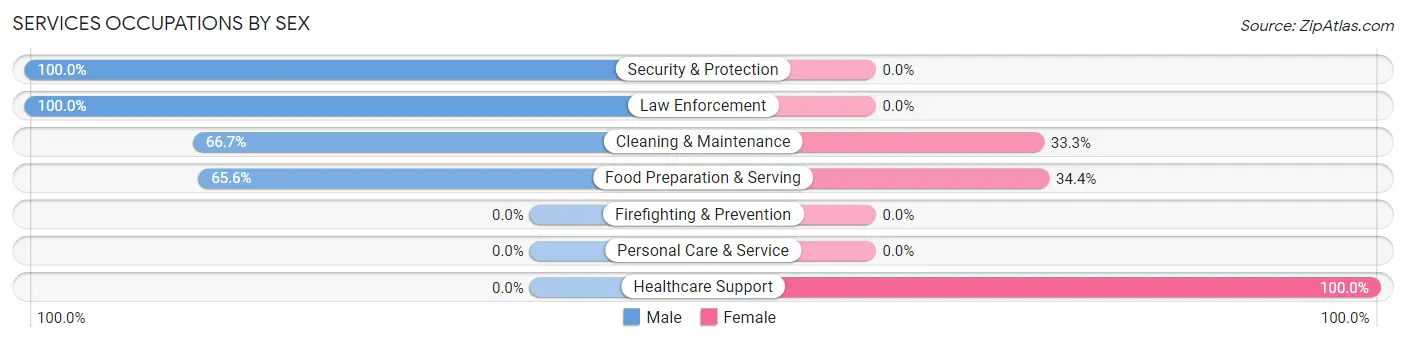
Services Occupations by Sex
Within the Services occupations in Mariano Colon, the most male-oriented occupations are Security & Protection (100.0%), Law Enforcement (100.0%), and Cleaning & Maintenance (66.7%), while the most female-oriented occupations are Healthcare Support (100.0%), Food Preparation & Serving (34.4%), and Cleaning & Maintenance (33.3%).
| Occupation | Male | Female |
| Healthcare Support | 0 (0.0%) | 24 (100.0%) |
| Security & Protection | 28 (100.0%) | 0 (0.0%) |
| Firefighting & Prevention | 0 (0.0%) | 0 (0.0%) |
| Law Enforcement | 28 (100.0%) | 0 (0.0%) |
| Food Preparation & Serving | 21 (65.6%) | 11 (34.4%) |
| Cleaning & Maintenance | 52 (66.7%) | 26 (33.3%) |
| Personal Care & Service | 0 (0.0%) | 0 (0.0%) |
| Total (Category) | 101 (62.4%) | 61 (37.7%) |
| Total (Overall) | 384 (61.6%) | 239 (38.4%) |
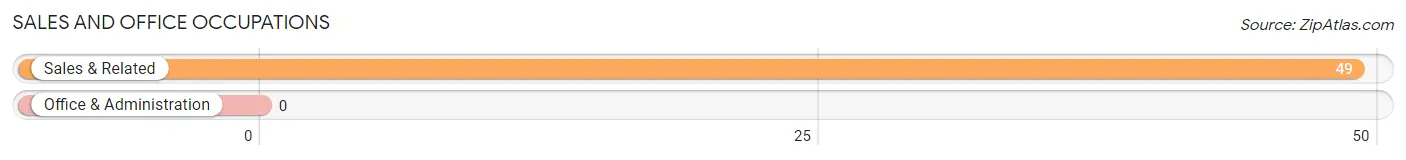
Sales and Office Occupations
The most common Sales and Office occupations in Mariano Colon are , and Sales & Related (49 | 7.9%).
Sales and Office Occupations by Sex

| Occupation | Male | Female |
| Sales & Related | 29 (59.2%) | 20 (40.8%) |
| Office & Administration | 0 (0.0%) | 0 (0.0%) |
| Total (Category) | 29 (59.2%) | 20 (40.8%) |
| Total (Overall) | 384 (61.6%) | 239 (38.4%) |
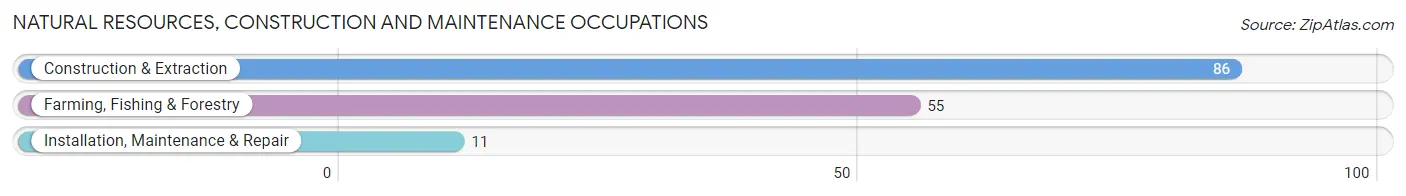
Natural Resources, Construction and Maintenance Occupations
The most common Natural Resources, Construction and Maintenance occupations in Mariano Colon are Construction & Extraction (86 | 13.8%), Farming, Fishing & Forestry (55 | 8.8%), and Installation, Maintenance & Repair (11 | 1.8%).
Natural Resources, Construction and Maintenance Occupations by Sex
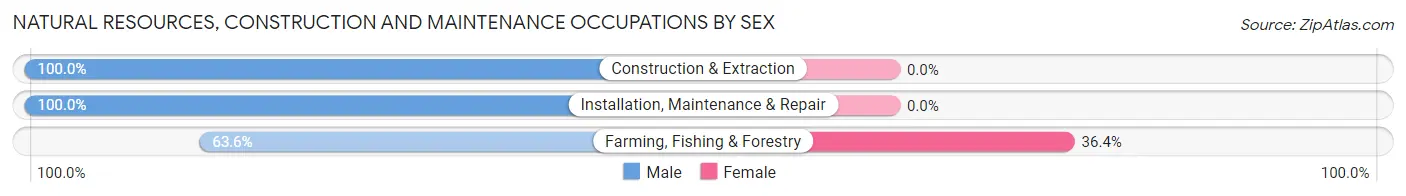
| Occupation | Male | Female |
| Farming, Fishing & Forestry | 35 (63.6%) | 20 (36.4%) |
| Construction & Extraction | 86 (100.0%) | 0 (0.0%) |
| Installation, Maintenance & Repair | 11 (100.0%) | 0 (0.0%) |
| Total (Category) | 132 (86.8%) | 20 (13.2%) |
| Total (Overall) | 384 (61.6%) | 239 (38.4%) |
Production, Transportation and Moving Occupations
The most common Production, Transportation and Moving occupations in Mariano Colon are Production (93 | 14.9%), and Material Moving (29 | 4.6%).
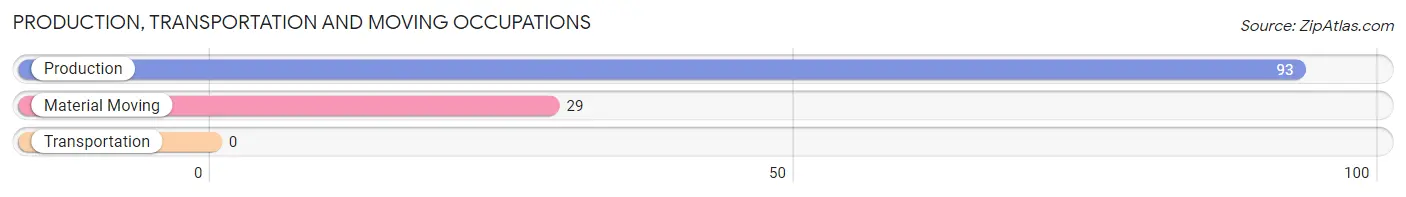
Production, Transportation and Moving Occupations by Sex
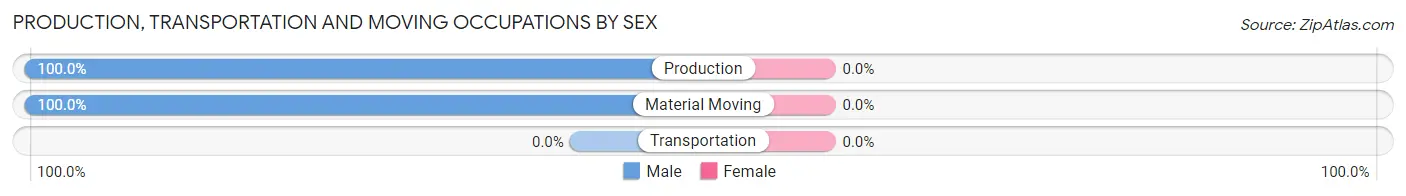
| Occupation | Male | Female |
| Production | 93 (100.0%) | 0 (0.0%) |
| Transportation | 0 (0.0%) | 0 (0.0%) |
| Material Moving | 29 (100.0%) | 0 (0.0%) |
| Total (Category) | 122 (100.0%) | 0 (0.0%) |
| Total (Overall) | 384 (61.6%) | 239 (38.4%) |
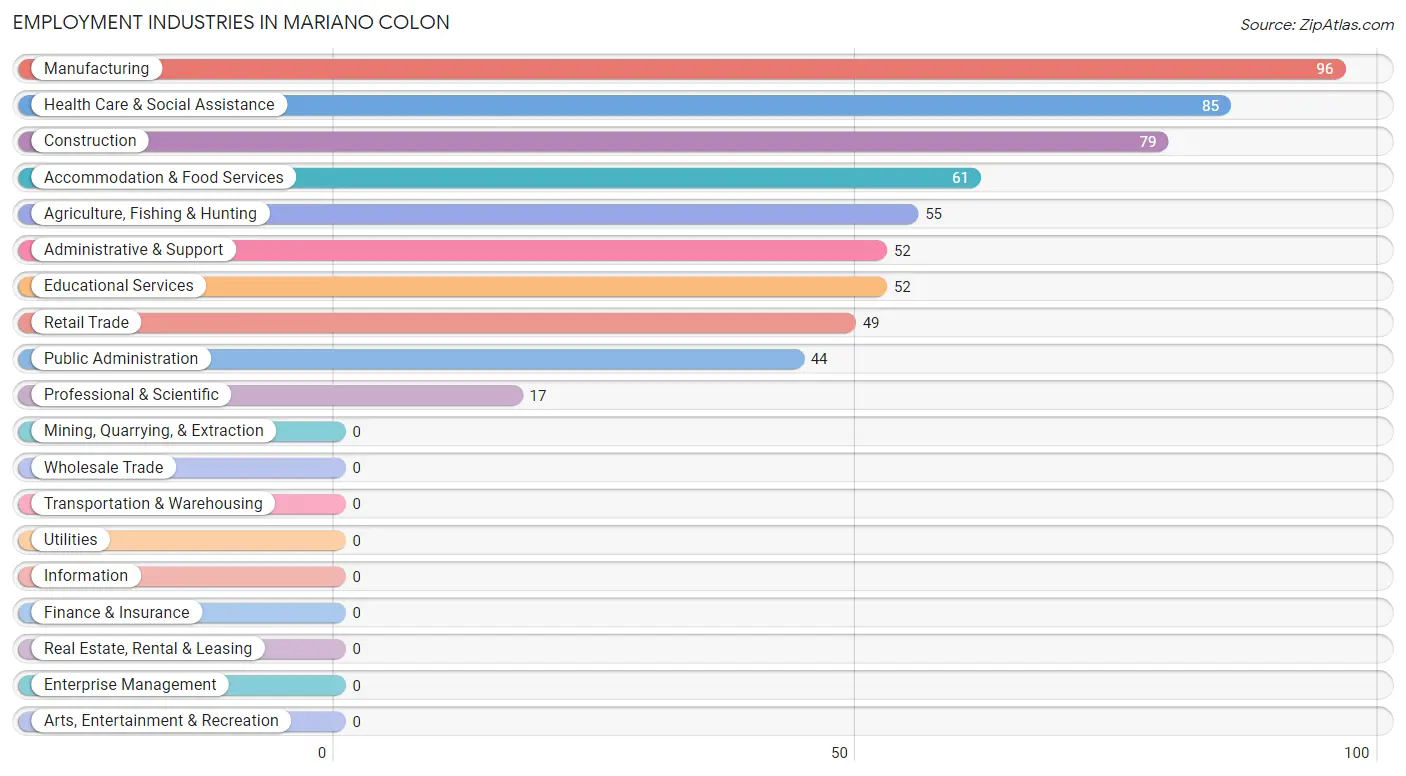
Employment Industries by Sex in Mariano Colon
Employment Industries in Mariano Colon
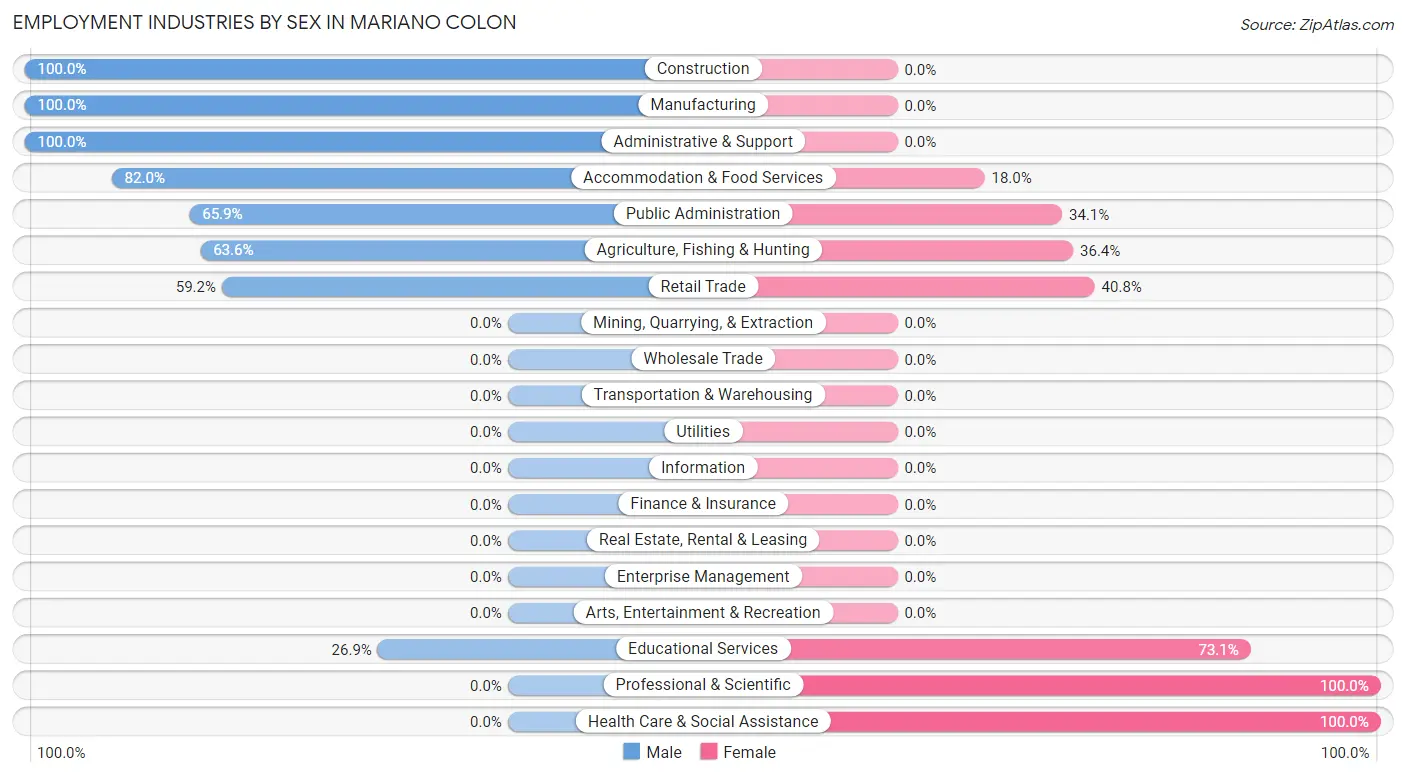
The major employment industries in Mariano Colon include Manufacturing (96 | 15.4%), Health Care & Social Assistance (85 | 13.6%), Construction (79 | 12.7%), Accommodation & Food Services (61 | 9.8%), and Agriculture, Fishing & Hunting (55 | 8.8%).
Employment Industries by Sex in Mariano Colon
The Mariano Colon industries that see more men than women are Construction (100.0%), Manufacturing (100.0%), and Administrative & Support (100.0%), whereas the industries that tend to have a higher number of women are Professional & Scientific (100.0%), Health Care & Social Assistance (100.0%), and Educational Services (73.1%).
| Industry | Male | Female |
| Agriculture, Fishing & Hunting | 35 (63.6%) | 20 (36.4%) |
| Mining, Quarrying, & Extraction | 0 (0.0%) | 0 (0.0%) |
| Construction | 79 (100.0%) | 0 (0.0%) |
| Manufacturing | 96 (100.0%) | 0 (0.0%) |
| Wholesale Trade | 0 (0.0%) | 0 (0.0%) |
| Retail Trade | 29 (59.2%) | 20 (40.8%) |
| Transportation & Warehousing | 0 (0.0%) | 0 (0.0%) |
| Utilities | 0 (0.0%) | 0 (0.0%) |
| Information | 0 (0.0%) | 0 (0.0%) |
| Finance & Insurance | 0 (0.0%) | 0 (0.0%) |
| Real Estate, Rental & Leasing | 0 (0.0%) | 0 (0.0%) |
| Professional & Scientific | 0 (0.0%) | 17 (100.0%) |
| Enterprise Management | 0 (0.0%) | 0 (0.0%) |
| Administrative & Support | 52 (100.0%) | 0 (0.0%) |
| Educational Services | 14 (26.9%) | 38 (73.1%) |
| Health Care & Social Assistance | 0 (0.0%) | 85 (100.0%) |
| Arts, Entertainment & Recreation | 0 (0.0%) | 0 (0.0%) |
| Accommodation & Food Services | 50 (82.0%) | 11 (18.0%) |
| Public Administration | 29 (65.9%) | 15 (34.1%) |
| Total | 384 (61.6%) | 239 (38.4%) |
Education in Mariano Colon
School Enrollment in Mariano Colon
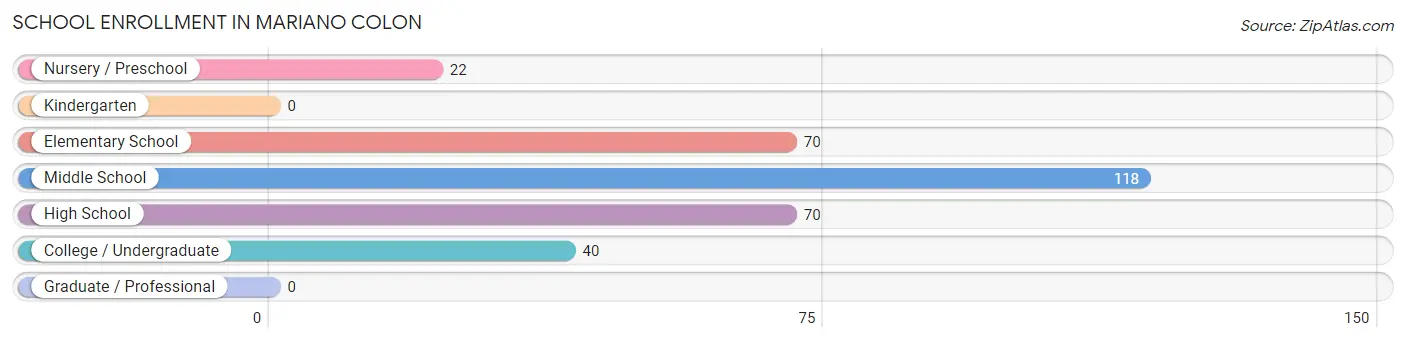
The most common levels of schooling among the 320 students in Mariano Colon are middle school (118 | 36.9%), elementary school (70 | 21.9%), and high school (70 | 21.9%).
| School Level | # Students | % Students |
| Nursery / Preschool | 22 | 6.9% |
| Kindergarten | 0 | 0.0% |
| Elementary School | 70 | 21.9% |
| Middle School | 118 | 36.9% |
| High School | 70 | 21.9% |
| College / Undergraduate | 40 | 12.5% |
| Graduate / Professional | 0 | 0.0% |
| Total | 320 | 100.0% |
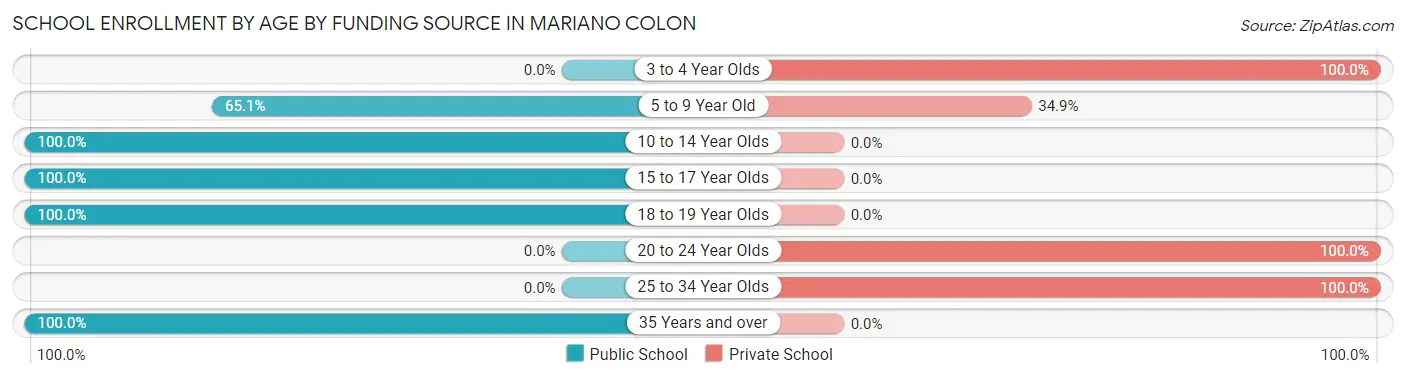
School Enrollment by Age by Funding Source in Mariano Colon
Out of a total of 320 students who are enrolled in schools in Mariano Colon, 91 (28.4%) attend a private institution, while the remaining 229 (71.6%) are enrolled in public schools. The age group of 3 to 4 year olds has the highest likelihood of being enrolled in private schools, with 22 (100.0% in the age bracket) enrolled. Conversely, the age group of 10 to 14 year olds has the lowest likelihood of being enrolled in a private school, with 105 (100.0% in the age bracket) attending a public institution.
| Age Bracket | Public School | Private School |
| 3 to 4 Year Olds | 0 (0.0%) | 22 (100.0%) |
| 5 to 9 Year Old | 54 (65.1%) | 29 (34.9%) |
| 10 to 14 Year Olds | 105 (100.0%) | 0 (0.0%) |
| 15 to 17 Year Olds | 29 (100.0%) | 0 (0.0%) |
| 18 to 19 Year Olds | 24 (100.0%) | 0 (0.0%) |
| 20 to 24 Year Olds | 0 (0.0%) | 28 (100.0%) |
| 25 to 34 Year Olds | 0 (0.0%) | 12 (100.0%) |
| 35 Years and over | 17 (100.0%) | 0 (0.0%) |
| Total | 229 (71.6%) | 91 (28.4%) |
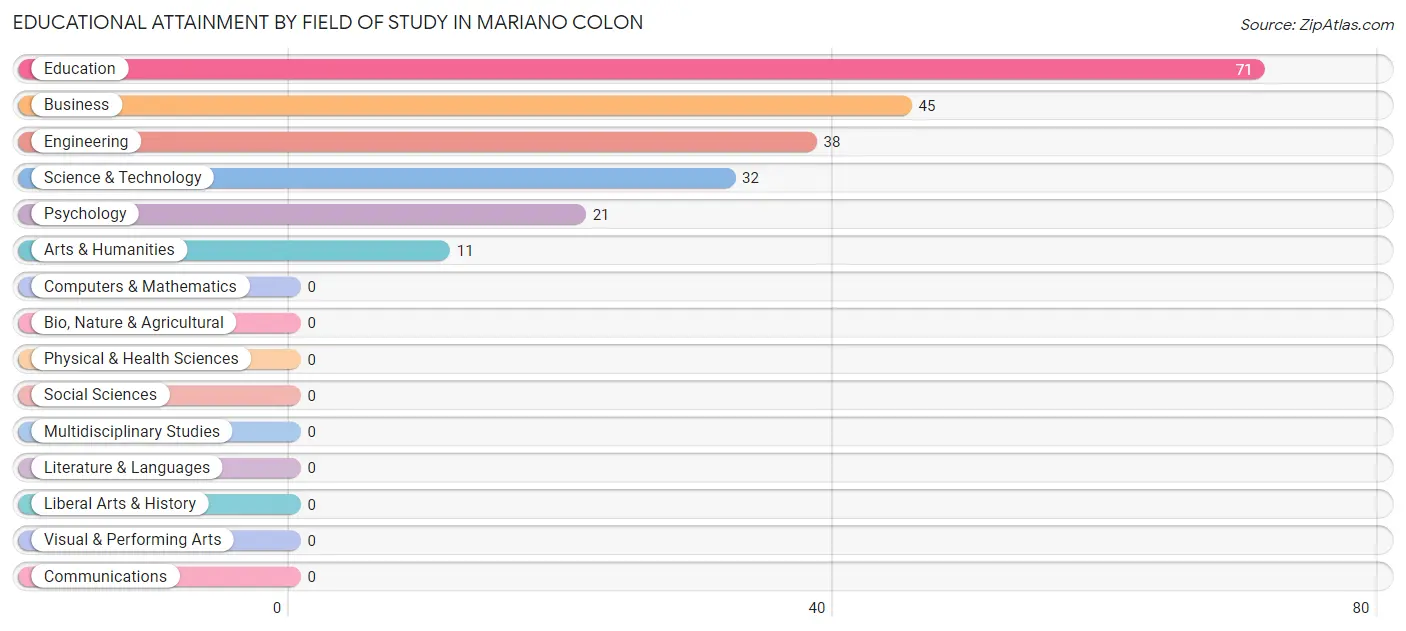
Educational Attainment by Field of Study in Mariano Colon
Education (71 | 32.6%), business (45 | 20.6%), engineering (38 | 17.4%), science & technology (32 | 14.7%), and psychology (21 | 9.6%) are the most common fields of study among 218 individuals in Mariano Colon who have obtained a bachelor's degree or higher.
| Field of Study | # Graduates | % Graduates |
| Computers & Mathematics | 0 | 0.0% |
| Bio, Nature & Agricultural | 0 | 0.0% |
| Physical & Health Sciences | 0 | 0.0% |
| Psychology | 21 | 9.6% |
| Social Sciences | 0 | 0.0% |
| Engineering | 38 | 17.4% |
| Multidisciplinary Studies | 0 | 0.0% |
| Science & Technology | 32 | 14.7% |
| Business | 45 | 20.6% |
| Education | 71 | 32.6% |
| Literature & Languages | 0 | 0.0% |
| Liberal Arts & History | 0 | 0.0% |
| Visual & Performing Arts | 0 | 0.0% |
| Communications | 0 | 0.0% |
| Arts & Humanities | 11 | 5.1% |
| Total | 218 | 100.0% |
Transportation & Commute in Mariano Colon
Vehicle Availability by Sex in Mariano Colon
The most prevalent vehicle ownership categories in Mariano Colon are males with 2 vehicles (191, accounting for 53.2%) and females with 2 vehicles (121, making up 83.8%).
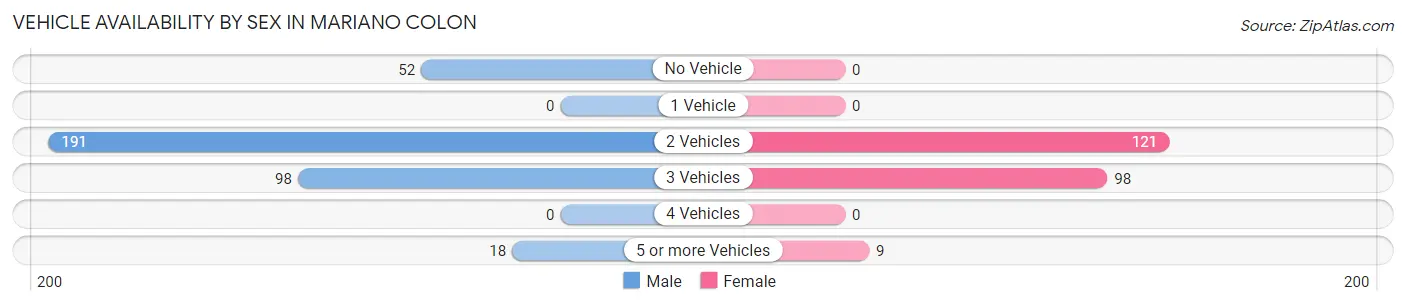
| Vehicles Available | Male | Female |
| No Vehicle | 52 (14.5%) | 0 (0.0%) |
| 1 Vehicle | 0 (0.0%) | 0 (0.0%) |
| 2 Vehicles | 191 (53.2%) | 121 (53.1%) |
| 3 Vehicles | 98 (27.3%) | 98 (43.0%) |
| 4 Vehicles | 0 (0.0%) | 0 (0.0%) |
| 5 or more Vehicles | 18 (5.0%) | 9 (4.0%) |
| Total | 359 (100.0%) | 228 (100.0%) |
Commute Time in Mariano Colon
The most frequently occuring commute durations in Mariano Colon are 20 to 24 minutes (141 commuters, 24.0%), 10 to 14 minutes (111 commuters, 18.9%), and 15 to 19 minutes (89 commuters, 15.2%).
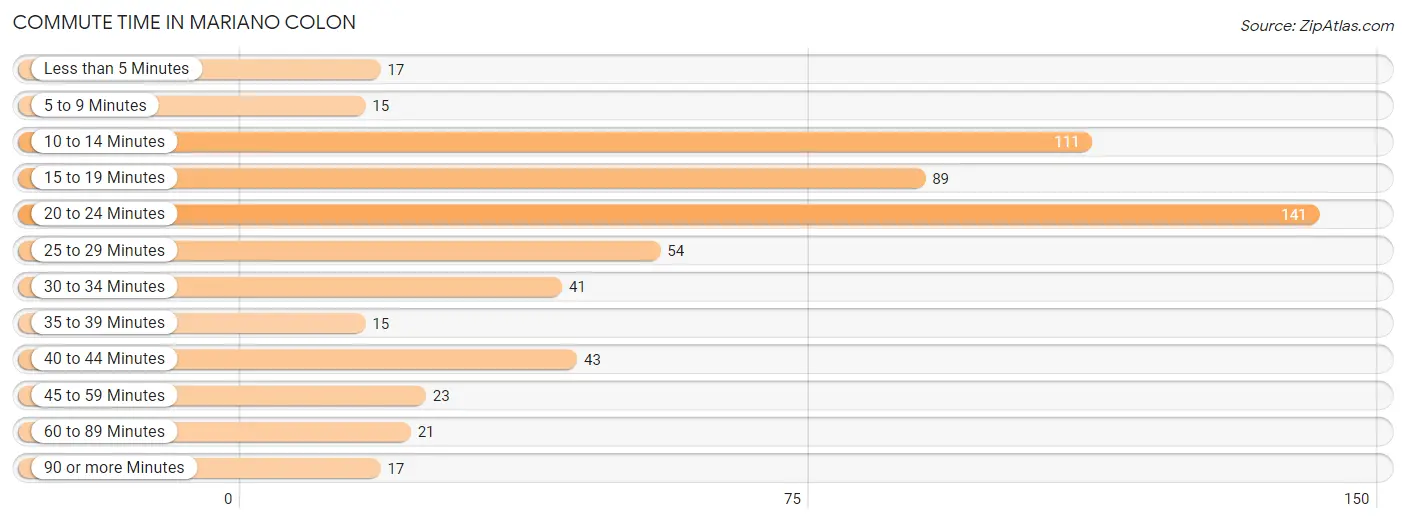
| Commute Time | # Commuters | % Commuters |
| Less than 5 Minutes | 17 | 2.9% |
| 5 to 9 Minutes | 15 | 2.6% |
| 10 to 14 Minutes | 111 | 18.9% |
| 15 to 19 Minutes | 89 | 15.2% |
| 20 to 24 Minutes | 141 | 24.0% |
| 25 to 29 Minutes | 54 | 9.2% |
| 30 to 34 Minutes | 41 | 7.0% |
| 35 to 39 Minutes | 15 | 2.6% |
| 40 to 44 Minutes | 43 | 7.3% |
| 45 to 59 Minutes | 23 | 3.9% |
| 60 to 89 Minutes | 21 | 3.6% |
| 90 or more Minutes | 17 | 2.9% |
Commute Time by Sex in Mariano Colon
The most common commute times in Mariano Colon are 10 to 14 minutes (91 commuters, 25.4%) for males and 20 to 24 minutes (107 commuters, 46.9%) for females.
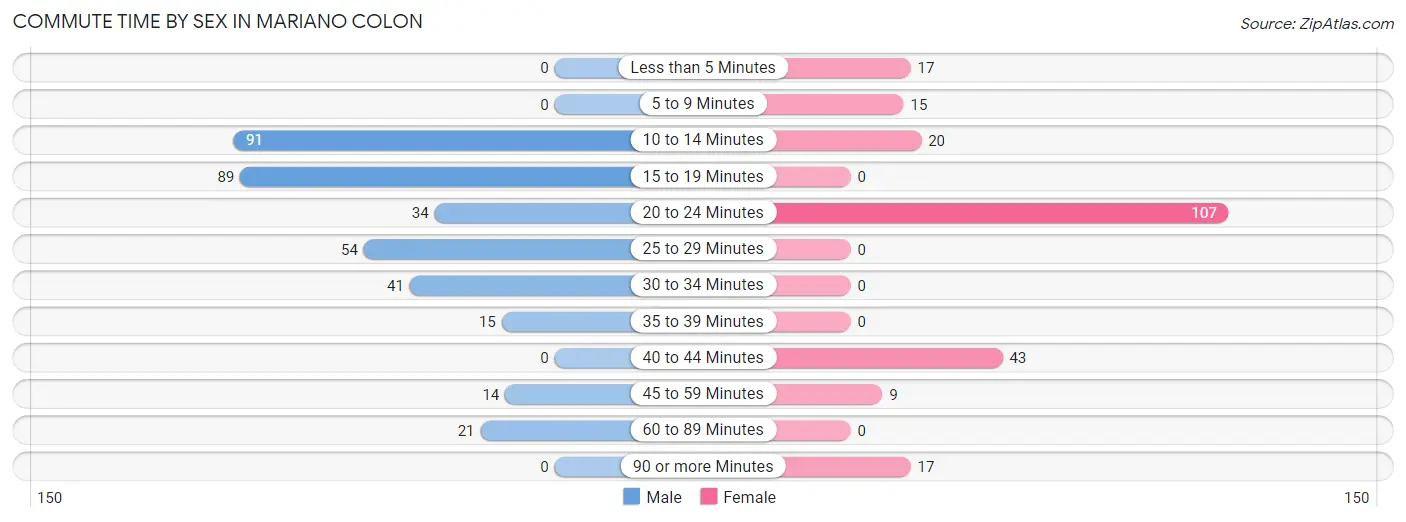
| Commute Time | Male | Female |
| Less than 5 Minutes | 0 (0.0%) | 17 (7.5%) |
| 5 to 9 Minutes | 0 (0.0%) | 15 (6.6%) |
| 10 to 14 Minutes | 91 (25.4%) | 20 (8.8%) |
| 15 to 19 Minutes | 89 (24.8%) | 0 (0.0%) |
| 20 to 24 Minutes | 34 (9.5%) | 107 (46.9%) |
| 25 to 29 Minutes | 54 (15.0%) | 0 (0.0%) |
| 30 to 34 Minutes | 41 (11.4%) | 0 (0.0%) |
| 35 to 39 Minutes | 15 (4.2%) | 0 (0.0%) |
| 40 to 44 Minutes | 0 (0.0%) | 43 (18.9%) |
| 45 to 59 Minutes | 14 (3.9%) | 9 (4.0%) |
| 60 to 89 Minutes | 21 (5.9%) | 0 (0.0%) |
| 90 or more Minutes | 0 (0.0%) | 17 (7.5%) |
Time of Departure to Work by Sex in Mariano Colon
The most frequent times of departure to work in Mariano Colon are 5:00 AM to 5:29 AM (126, 35.1%) for males and 7:00 AM to 7:29 AM (93, 40.8%) for females.
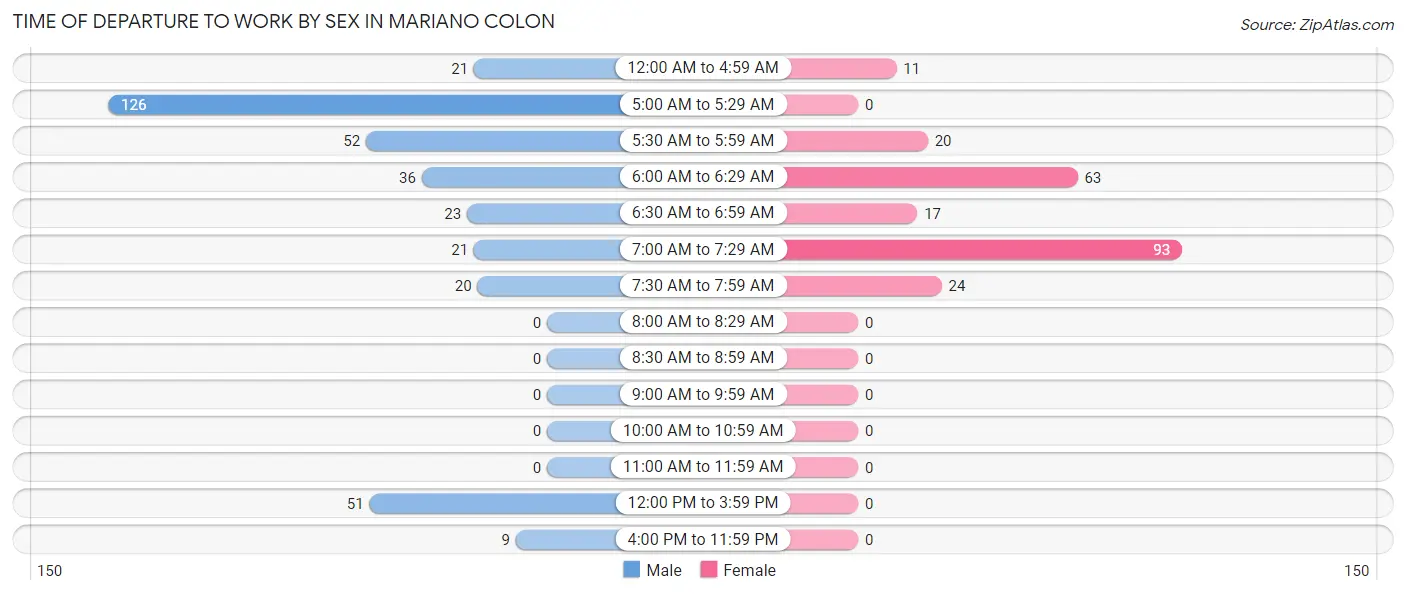
| Time of Departure | Male | Female |
| 12:00 AM to 4:59 AM | 21 (5.9%) | 11 (4.8%) |
| 5:00 AM to 5:29 AM | 126 (35.1%) | 0 (0.0%) |
| 5:30 AM to 5:59 AM | 52 (14.5%) | 20 (8.8%) |
| 6:00 AM to 6:29 AM | 36 (10.0%) | 63 (27.6%) |
| 6:30 AM to 6:59 AM | 23 (6.4%) | 17 (7.5%) |
| 7:00 AM to 7:29 AM | 21 (5.9%) | 93 (40.8%) |
| 7:30 AM to 7:59 AM | 20 (5.6%) | 24 (10.5%) |
| 8:00 AM to 8:29 AM | 0 (0.0%) | 0 (0.0%) |
| 8:30 AM to 8:59 AM | 0 (0.0%) | 0 (0.0%) |
| 9:00 AM to 9:59 AM | 0 (0.0%) | 0 (0.0%) |
| 10:00 AM to 10:59 AM | 0 (0.0%) | 0 (0.0%) |
| 11:00 AM to 11:59 AM | 0 (0.0%) | 0 (0.0%) |
| 12:00 PM to 3:59 PM | 51 (14.2%) | 0 (0.0%) |
| 4:00 PM to 11:59 PM | 9 (2.5%) | 0 (0.0%) |
| Total | 359 (100.0%) | 228 (100.0%) |
Housing Occupancy in Mariano Colon
Occupancy by Ownership in Mariano Colon
Of the total 590 dwellings in Mariano Colon, owner-occupied units account for 537 (91.0%), while renter-occupied units make up 53 (9.0%).
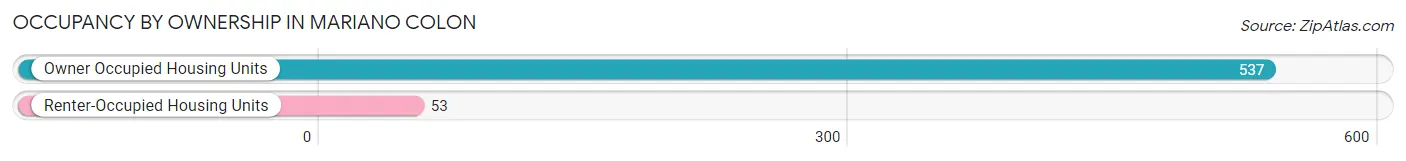
| Occupancy | # Housing Units | % Housing Units |
| Owner Occupied Housing Units | 537 | 91.0% |
| Renter-Occupied Housing Units | 53 | 9.0% |
| Total Occupied Housing Units | 590 | 100.0% |
Occupancy by Household Size in Mariano Colon
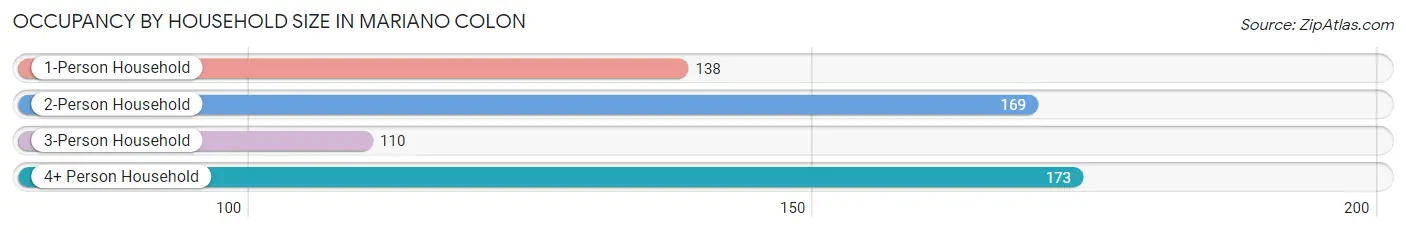
| Household Size | # Housing Units | % Housing Units |
| 1-Person Household | 138 | 23.4% |
| 2-Person Household | 169 | 28.6% |
| 3-Person Household | 110 | 18.6% |
| 4+ Person Household | 173 | 29.3% |
| Total Housing Units | 590 | 100.0% |
Occupancy by Ownership by Household Size in Mariano Colon
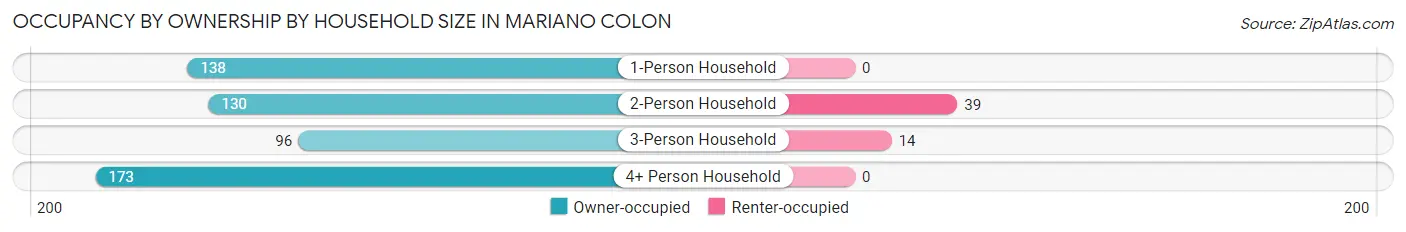
| Household Size | Owner-occupied | Renter-occupied |
| 1-Person Household | 138 (100.0%) | 0 (0.0%) |
| 2-Person Household | 130 (76.9%) | 39 (23.1%) |
| 3-Person Household | 96 (87.3%) | 14 (12.7%) |
| 4+ Person Household | 173 (100.0%) | 0 (0.0%) |
| Total Housing Units | 537 (91.0%) | 53 (9.0%) |
Occupancy by Educational Attainment in Mariano Colon
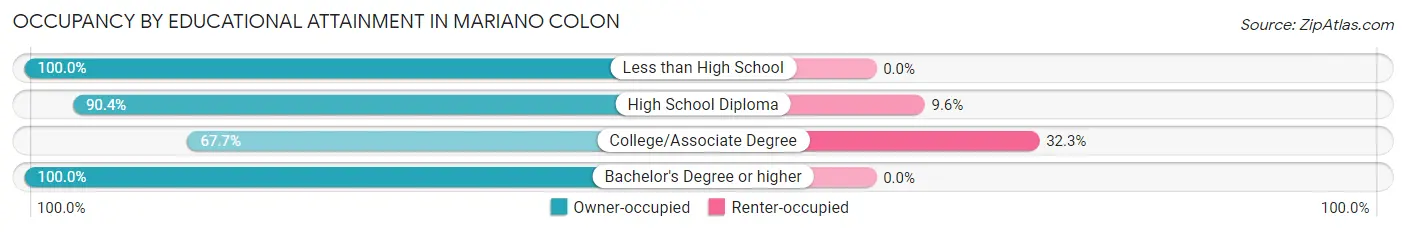
| Household Size | Owner-occupied | Renter-occupied |
| Less than High School | 188 (100.0%) | 0 (0.0%) |
| High School Diploma | 198 (90.4%) | 21 (9.6%) |
| College/Associate Degree | 67 (67.7%) | 32 (32.3%) |
| Bachelor's Degree or higher | 84 (100.0%) | 0 (0.0%) |
Occupancy by Age of Householder in Mariano Colon
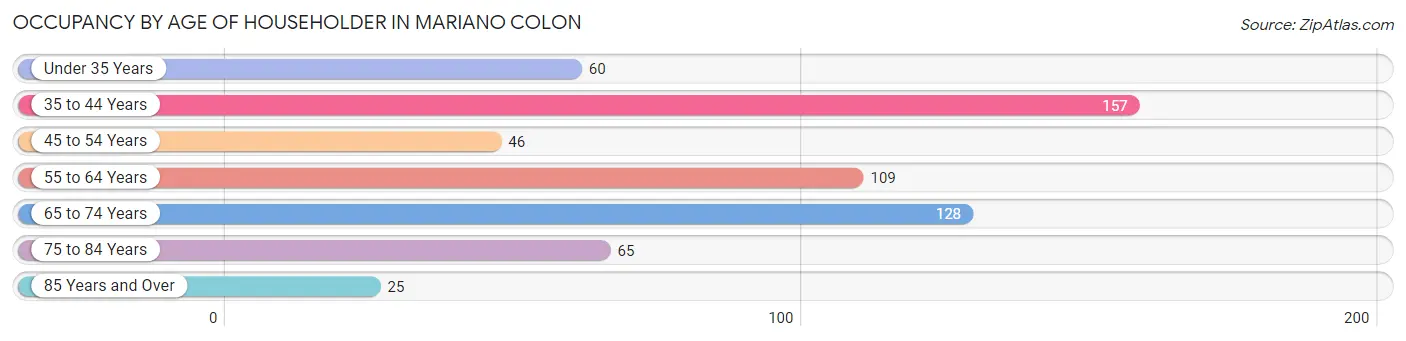
| Age Bracket | # Households | % Households |
| Under 35 Years | 60 | 10.2% |
| 35 to 44 Years | 157 | 26.6% |
| 45 to 54 Years | 46 | 7.8% |
| 55 to 64 Years | 109 | 18.5% |
| 65 to 74 Years | 128 | 21.7% |
| 75 to 84 Years | 65 | 11.0% |
| 85 Years and Over | 25 | 4.2% |
| Total | 590 | 100.0% |
Housing Finances in Mariano Colon
Median Income by Occupancy in Mariano Colon
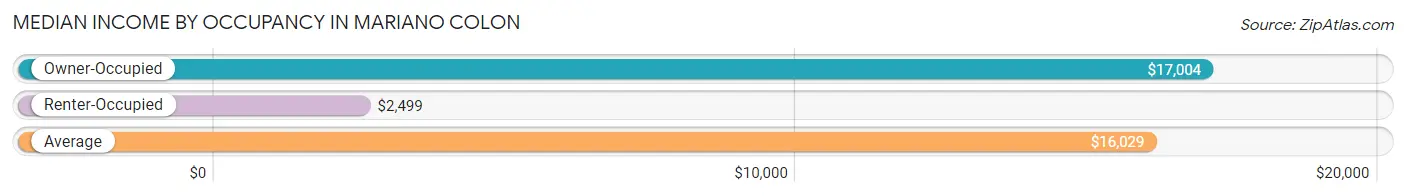
| Occupancy Type | # Households | Median Income |
| Owner-Occupied | 537 (91.0%) | $17,004 |
| Renter-Occupied | 53 (9.0%) | $2,499 |
| Average | 590 (100.0%) | $16,029 |
Occupancy by Householder Income Bracket in Mariano Colon
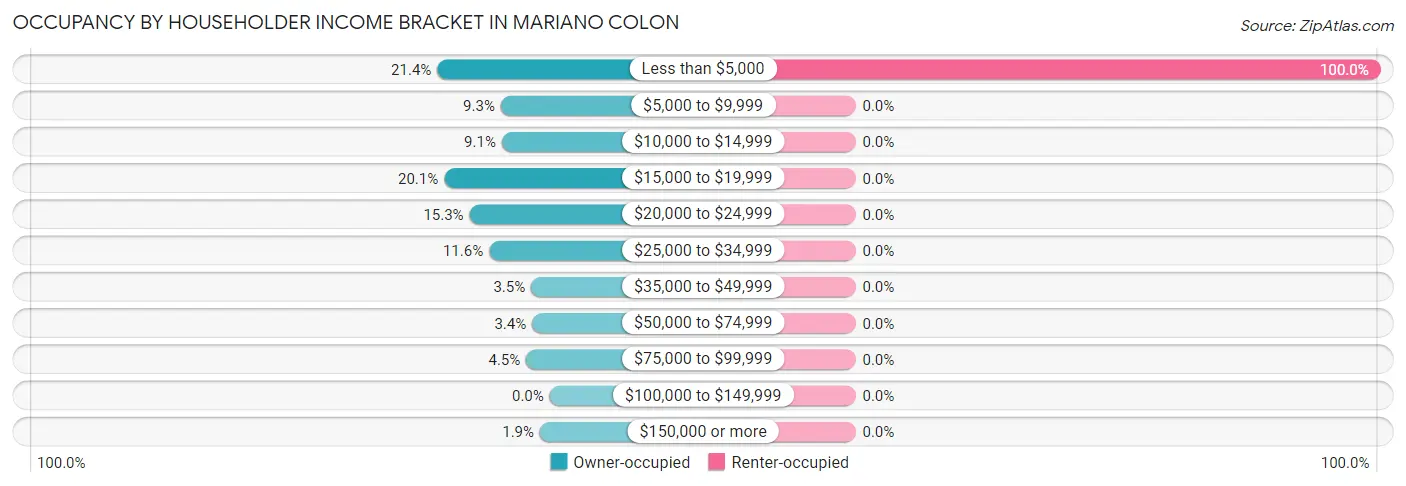
| Income Bracket | Owner-occupied | Renter-occupied |
| Less than $5,000 | 115 (21.4%) | 53 (100.0%) |
| $5,000 to $9,999 | 50 (9.3%) | 0 (0.0%) |
| $10,000 to $14,999 | 49 (9.1%) | 0 (0.0%) |
| $15,000 to $19,999 | 108 (20.1%) | 0 (0.0%) |
| $20,000 to $24,999 | 82 (15.3%) | 0 (0.0%) |
| $25,000 to $34,999 | 62 (11.6%) | 0 (0.0%) |
| $35,000 to $49,999 | 19 (3.5%) | 0 (0.0%) |
| $50,000 to $74,999 | 18 (3.4%) | 0 (0.0%) |
| $75,000 to $99,999 | 24 (4.5%) | 0 (0.0%) |
| $100,000 to $149,999 | 0 (0.0%) | 0 (0.0%) |
| $150,000 or more | 10 (1.9%) | 0 (0.0%) |
| Total | 537 (100.0%) | 53 (100.0%) |
Monthly Housing Cost Tiers in Mariano Colon
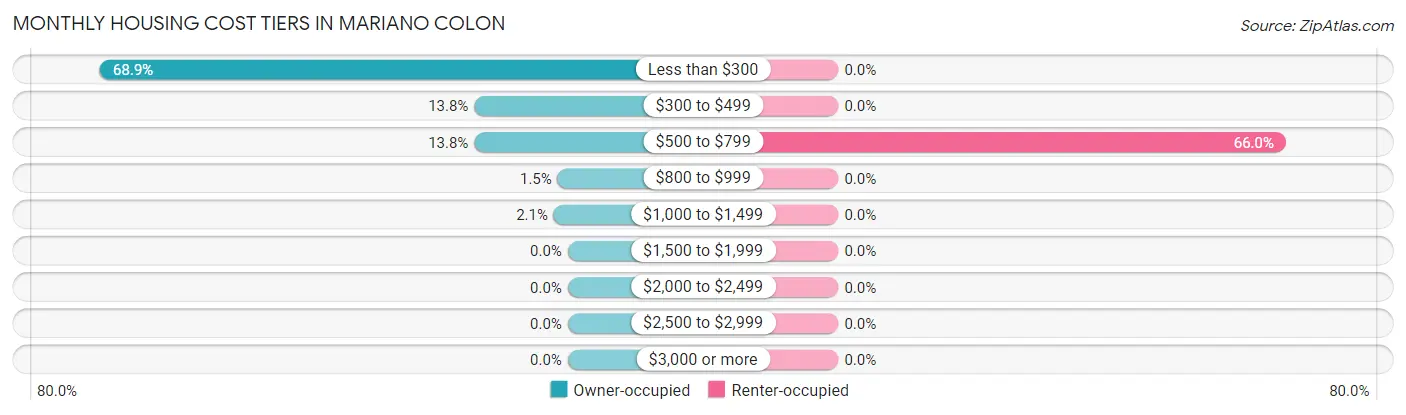
| Monthly Cost | Owner-occupied | Renter-occupied |
| Less than $300 | 370 (68.9%) | 0 (0.0%) |
| $300 to $499 | 74 (13.8%) | 0 (0.0%) |
| $500 to $799 | 74 (13.8%) | 35 (66.0%) |
| $800 to $999 | 8 (1.5%) | 0 (0.0%) |
| $1,000 to $1,499 | 11 (2.1%) | 0 (0.0%) |
| $1,500 to $1,999 | 0 (0.0%) | 0 (0.0%) |
| $2,000 to $2,499 | 0 (0.0%) | 0 (0.0%) |
| $2,500 to $2,999 | 0 (0.0%) | 0 (0.0%) |
| $3,000 or more | 0 (0.0%) | 0 (0.0%) |
| Total | 537 (100.0%) | 53 (100.0%) |
Physical Housing Characteristics in Mariano Colon
Housing Structures in Mariano Colon
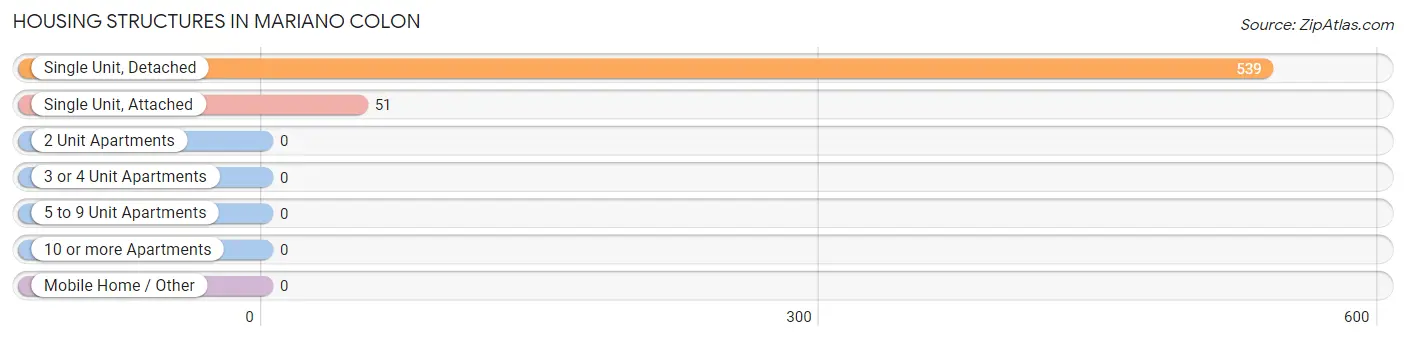
| Structure Type | # Housing Units | % Housing Units |
| Single Unit, Detached | 539 | 91.4% |
| Single Unit, Attached | 51 | 8.6% |
| 2 Unit Apartments | 0 | 0.0% |
| 3 or 4 Unit Apartments | 0 | 0.0% |
| 5 to 9 Unit Apartments | 0 | 0.0% |
| 10 or more Apartments | 0 | 0.0% |
| Mobile Home / Other | 0 | 0.0% |
| Total | 590 | 100.0% |
Housing Structures by Occupancy in Mariano Colon
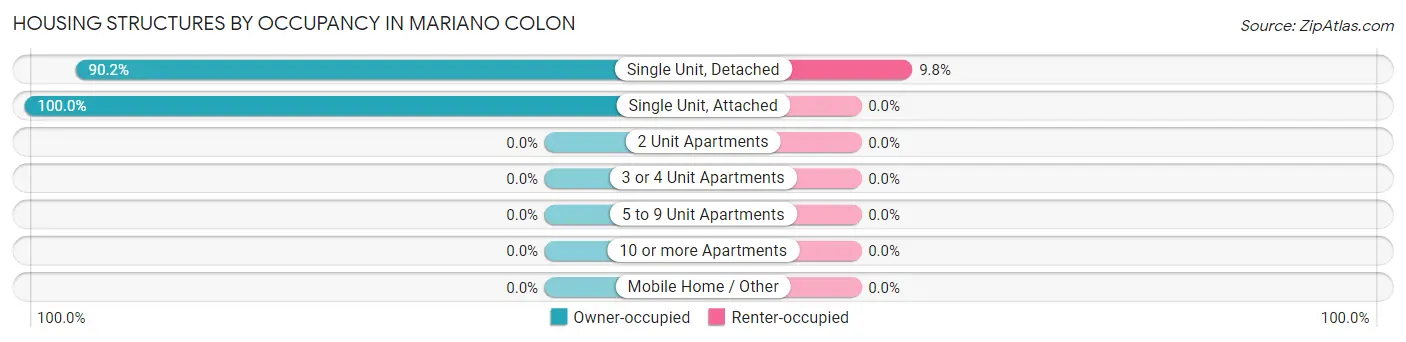
| Structure Type | Owner-occupied | Renter-occupied |
| Single Unit, Detached | 486 (90.2%) | 53 (9.8%) |
| Single Unit, Attached | 51 (100.0%) | 0 (0.0%) |
| 2 Unit Apartments | 0 (0.0%) | 0 (0.0%) |
| 3 or 4 Unit Apartments | 0 (0.0%) | 0 (0.0%) |
| 5 to 9 Unit Apartments | 0 (0.0%) | 0 (0.0%) |
| 10 or more Apartments | 0 (0.0%) | 0 (0.0%) |
| Mobile Home / Other | 0 (0.0%) | 0 (0.0%) |
| Total | 537 (91.0%) | 53 (9.0%) |
Housing Structures by Number of Rooms in Mariano Colon
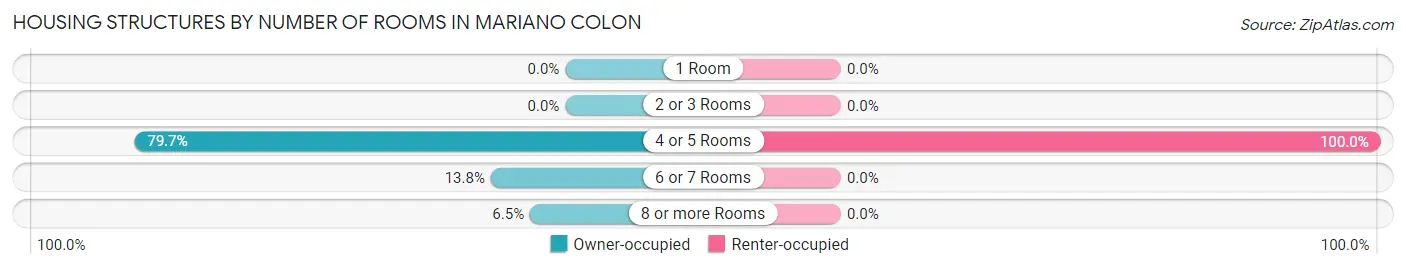
| Number of Rooms | Owner-occupied | Renter-occupied |
| 1 Room | 0 (0.0%) | 0 (0.0%) |
| 2 or 3 Rooms | 0 (0.0%) | 0 (0.0%) |
| 4 or 5 Rooms | 428 (79.7%) | 53 (100.0%) |
| 6 or 7 Rooms | 74 (13.8%) | 0 (0.0%) |
| 8 or more Rooms | 35 (6.5%) | 0 (0.0%) |
| Total | 537 (100.0%) | 53 (100.0%) |
Housing Structure by Heating Type in Mariano Colon
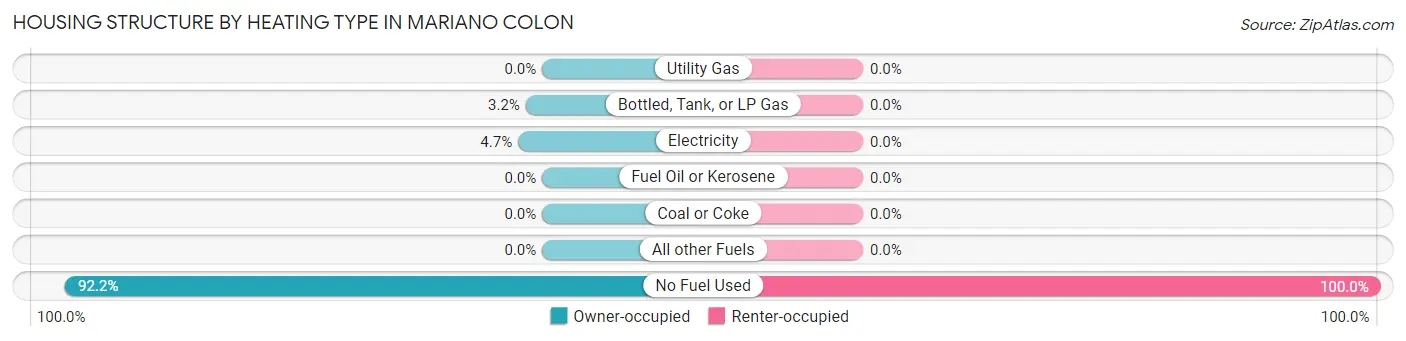
| Heating Type | Owner-occupied | Renter-occupied |
| Utility Gas | 0 (0.0%) | 0 (0.0%) |
| Bottled, Tank, or LP Gas | 17 (3.2%) | 0 (0.0%) |
| Electricity | 25 (4.7%) | 0 (0.0%) |
| Fuel Oil or Kerosene | 0 (0.0%) | 0 (0.0%) |
| Coal or Coke | 0 (0.0%) | 0 (0.0%) |
| All other Fuels | 0 (0.0%) | 0 (0.0%) |
| No Fuel Used | 495 (92.2%) | 53 (100.0%) |
| Total | 537 (100.0%) | 53 (100.0%) |
Household Vehicle Usage in Mariano Colon
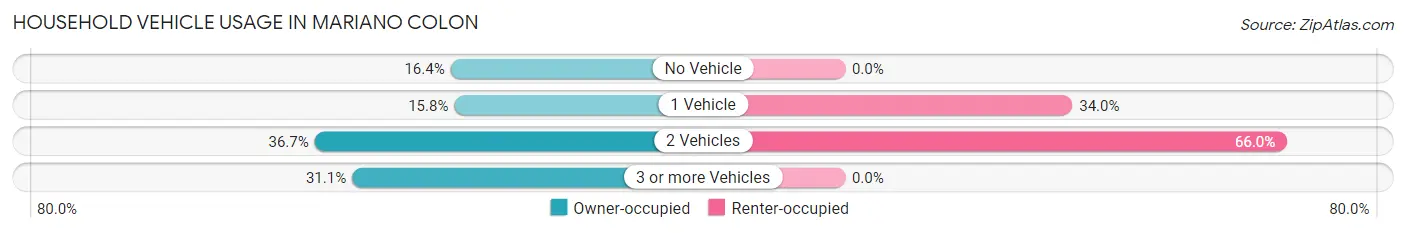
| Vehicles per Household | Owner-occupied | Renter-occupied |
| No Vehicle | 88 (16.4%) | 0 (0.0%) |
| 1 Vehicle | 85 (15.8%) | 18 (34.0%) |
| 2 Vehicles | 197 (36.7%) | 35 (66.0%) |
| 3 or more Vehicles | 167 (31.1%) | 0 (0.0%) |
| Total | 537 (100.0%) | 53 (100.0%) |
Real Estate & Mortgages in Mariano Colon
Real Estate and Mortgage Overview in Mariano Colon
| Characteristic | Without Mortgage | With Mortgage |
| Housing Units | 413 | 124 |
| Median Property Value | $79,700 | $95,400 |
| Median Household Income | $16,232 | $0 |
| Monthly Housing Costs | $173 | $0 |
| Real Estate Taxes | - | - |
Property Value by Mortgage Status in Mariano Colon
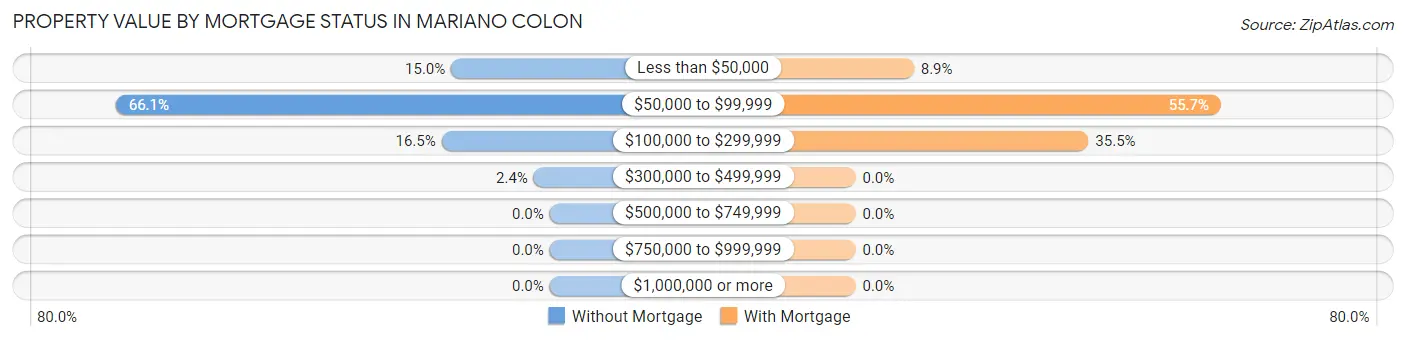
| Property Value | Without Mortgage | With Mortgage |
| Less than $50,000 | 62 (15.0%) | 11 (8.9%) |
| $50,000 to $99,999 | 273 (66.1%) | 69 (55.6%) |
| $100,000 to $299,999 | 68 (16.5%) | 44 (35.5%) |
| $300,000 to $499,999 | 10 (2.4%) | 0 (0.0%) |
| $500,000 to $749,999 | 0 (0.0%) | 0 (0.0%) |
| $750,000 to $999,999 | 0 (0.0%) | 0 (0.0%) |
| $1,000,000 or more | 0 (0.0%) | 0 (0.0%) |
| Total | 413 (100.0%) | 124 (100.0%) |
Household Income by Mortgage Status in Mariano Colon
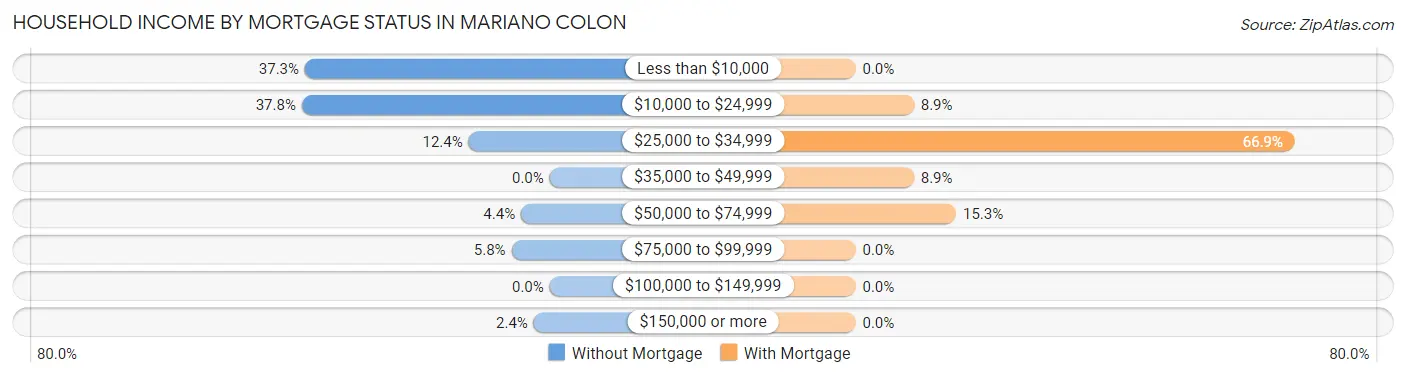
| Household Income | Without Mortgage | With Mortgage |
| Less than $10,000 | 154 (37.3%) | 0 (0.0%) |
| $10,000 to $24,999 | 156 (37.8%) | 11 (8.9%) |
| $25,000 to $34,999 | 51 (12.3%) | 83 (66.9%) |
| $35,000 to $49,999 | 0 (0.0%) | 11 (8.9%) |
| $50,000 to $74,999 | 18 (4.4%) | 19 (15.3%) |
| $75,000 to $99,999 | 24 (5.8%) | 0 (0.0%) |
| $100,000 to $149,999 | 0 (0.0%) | 0 (0.0%) |
| $150,000 or more | 10 (2.4%) | 0 (0.0%) |
| Total | 413 (100.0%) | 124 (100.0%) |
Property Value to Household Income Ratio in Mariano Colon
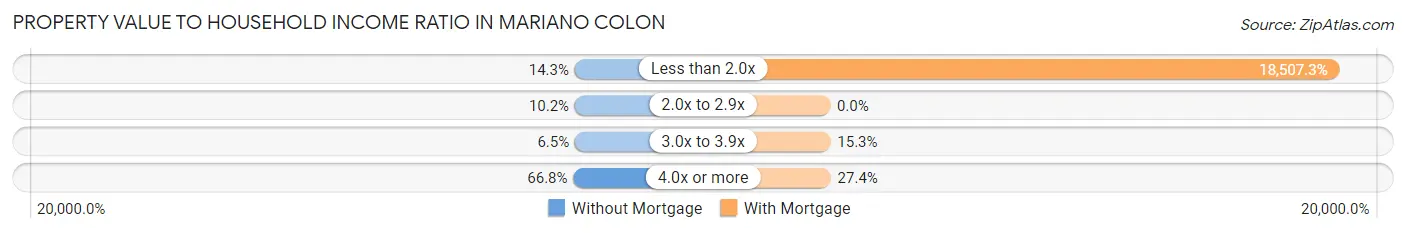
| Value-to-Income Ratio | Without Mortgage | With Mortgage |
| Less than 2.0x | 59 (14.3%) | 22,949 (18,507.3%) |
| 2.0x to 2.9x | 42 (10.2%) | 0 (0.0%) |
| 3.0x to 3.9x | 27 (6.5%) | 19 (15.3%) |
| 4.0x or more | 276 (66.8%) | 34 (27.4%) |
| Total | 413 (100.0%) | 124 (100.0%) |
Real Estate Taxes by Mortgage Status in Mariano Colon
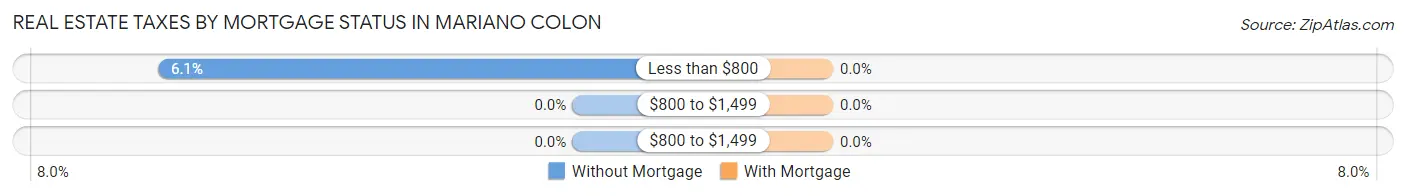
| Property Taxes | Without Mortgage | With Mortgage |
| Less than $800 | 25 (6.0%) | 0 (0.0%) |
| $800 to $1,499 | 0 (0.0%) | 0 (0.0%) |
| $800 to $1,499 | 0 (0.0%) | 0 (0.0%) |
| Total | 413 (100.0%) | 124 (100.0%) |
Health & Disability in Mariano Colon
Health Insurance Coverage by Age in Mariano Colon
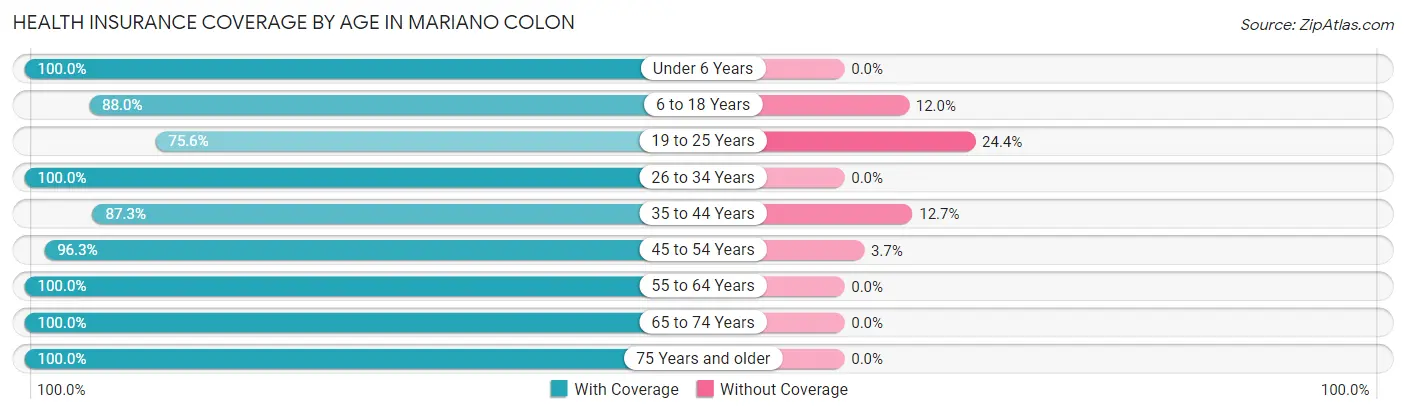
| Age Bracket | With Coverage | Without Coverage |
| Under 6 Years | 127 (100.0%) | 0 (0.0%) |
| 6 to 18 Years | 212 (88.0%) | 29 (12.0%) |
| 19 to 25 Years | 155 (75.6%) | 50 (24.4%) |
| 26 to 34 Years | 226 (100.0%) | 0 (0.0%) |
| 35 to 44 Years | 241 (87.3%) | 35 (12.7%) |
| 45 to 54 Years | 236 (96.3%) | 9 (3.7%) |
| 55 to 64 Years | 225 (100.0%) | 0 (0.0%) |
| 65 to 74 Years | 208 (100.0%) | 0 (0.0%) |
| 75 Years and older | 167 (100.0%) | 0 (0.0%) |
| Total | 1,797 (93.6%) | 123 (6.4%) |
Health Insurance Coverage by Citizenship Status in Mariano Colon
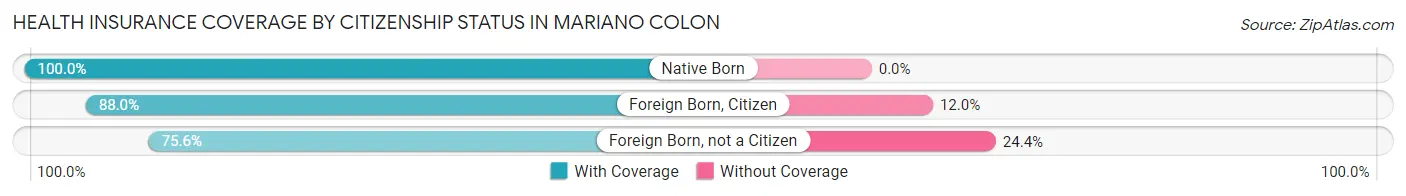
| Citizenship Status | With Coverage | Without Coverage |
| Native Born | 127 (100.0%) | 0 (0.0%) |
| Foreign Born, Citizen | 212 (88.0%) | 29 (12.0%) |
| Foreign Born, not a Citizen | 155 (75.6%) | 50 (24.4%) |
Health Insurance Coverage by Household Income in Mariano Colon
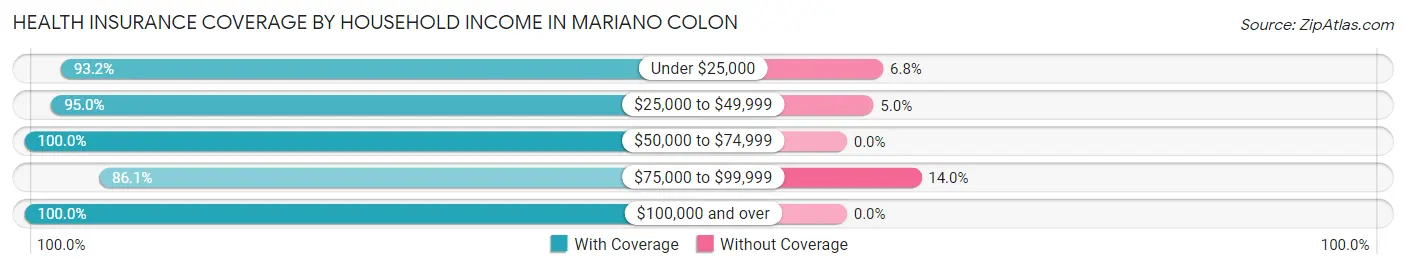
| Household Income | With Coverage | Without Coverage |
| Under $25,000 | 1,193 (93.2%) | 87 (6.8%) |
| $25,000 to $49,999 | 343 (95.0%) | 18 (5.0%) |
| $50,000 to $74,999 | 79 (100.0%) | 0 (0.0%) |
| $75,000 to $99,999 | 111 (86.1%) | 18 (14.0%) |
| $100,000 and over | 71 (100.0%) | 0 (0.0%) |
Public vs Private Health Insurance Coverage by Age in Mariano Colon
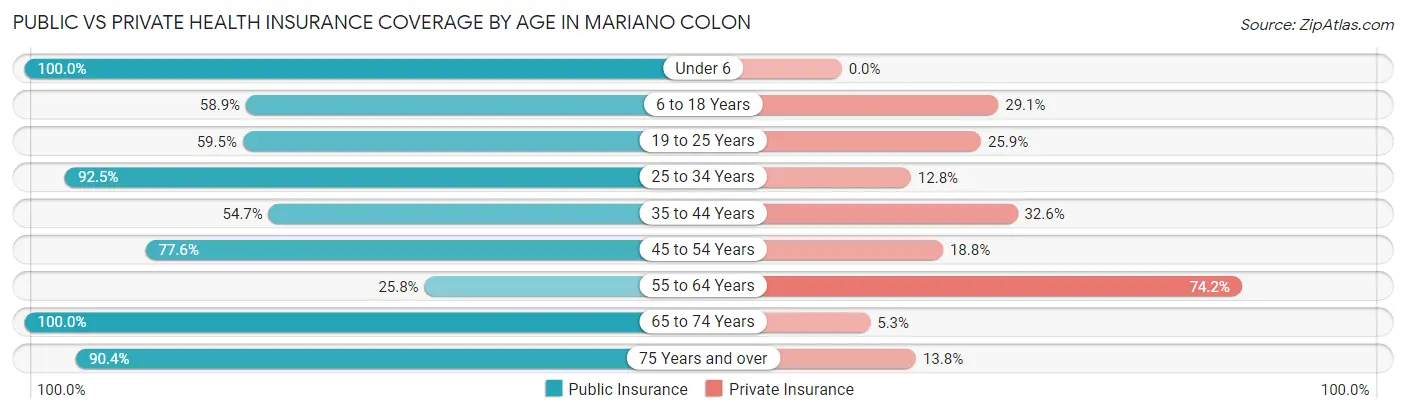
| Age Bracket | Public Insurance | Private Insurance |
| Under 6 | 127 (100.0%) | 0 (0.0%) |
| 6 to 18 Years | 142 (58.9%) | 70 (29.0%) |
| 19 to 25 Years | 122 (59.5%) | 53 (25.9%) |
| 25 to 34 Years | 209 (92.5%) | 29 (12.8%) |
| 35 to 44 Years | 151 (54.7%) | 90 (32.6%) |
| 45 to 54 Years | 190 (77.5%) | 46 (18.8%) |
| 55 to 64 Years | 58 (25.8%) | 167 (74.2%) |
| 65 to 74 Years | 208 (100.0%) | 11 (5.3%) |
| 75 Years and over | 151 (90.4%) | 23 (13.8%) |
| Total | 1,358 (70.7%) | 489 (25.5%) |
Disability Status by Sex by Age in Mariano Colon
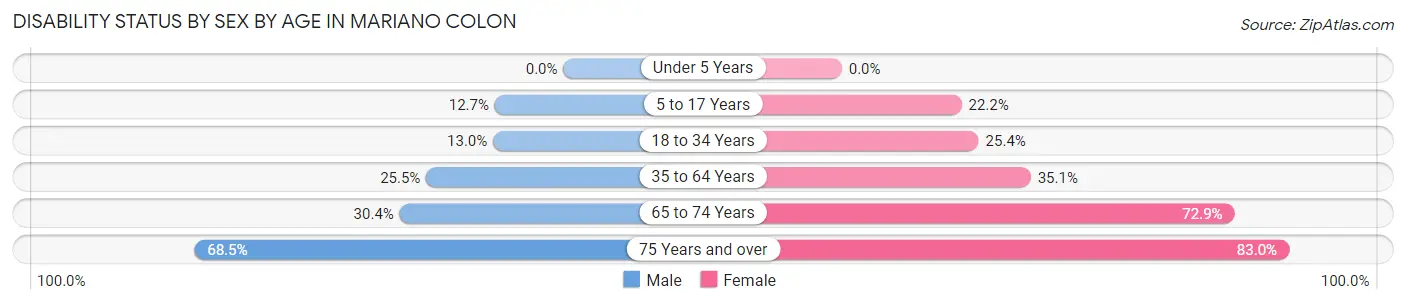
| Age Bracket | Male | Female |
| Under 5 Years | 0 (0.0%) | 0 (0.0%) |
| 5 to 17 Years | 14 (12.7%) | 28 (22.2%) |
| 18 to 34 Years | 27 (13.0%) | 63 (25.4%) |
| 35 to 64 Years | 97 (25.5%) | 128 (35.1%) |
| 65 to 74 Years | 24 (30.4%) | 94 (72.9%) |
| 75 Years and over | 50 (68.5%) | 78 (83.0%) |
Disability Class by Sex by Age in Mariano Colon
Disability Class: Hearing Difficulty
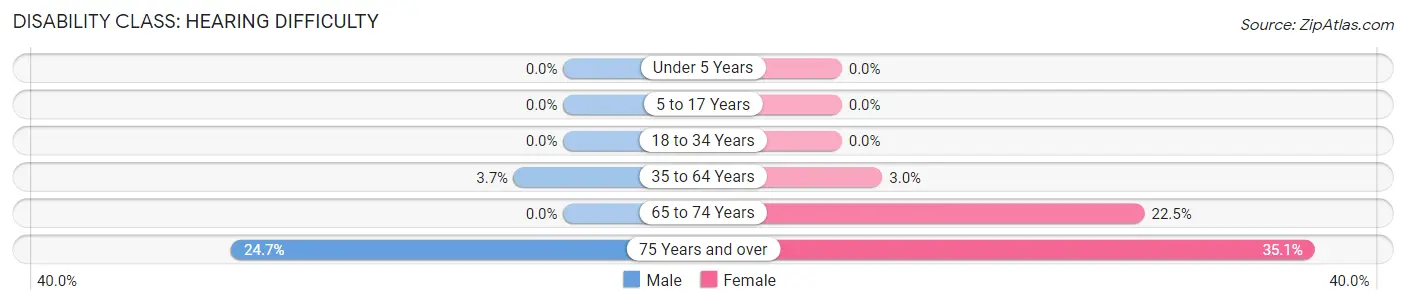
| Age Bracket | Male | Female |
| Under 5 Years | 0 (0.0%) | 0 (0.0%) |
| 5 to 17 Years | 0 (0.0%) | 0 (0.0%) |
| 18 to 34 Years | 0 (0.0%) | 0 (0.0%) |
| 35 to 64 Years | 14 (3.7%) | 11 (3.0%) |
| 65 to 74 Years | 0 (0.0%) | 29 (22.5%) |
| 75 Years and over | 18 (24.7%) | 33 (35.1%) |
Disability Class: Vision Difficulty
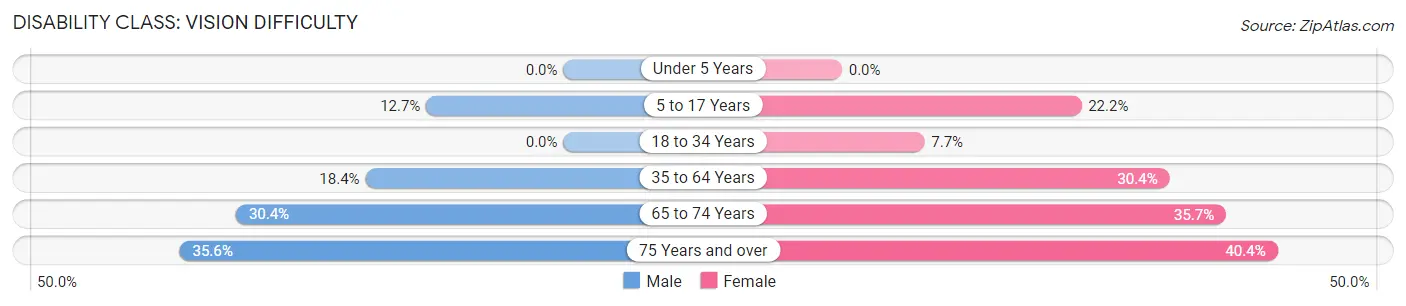
| Age Bracket | Male | Female |
| Under 5 Years | 0 (0.0%) | 0 (0.0%) |
| 5 to 17 Years | 14 (12.7%) | 28 (22.2%) |
| 18 to 34 Years | 0 (0.0%) | 19 (7.7%) |
| 35 to 64 Years | 70 (18.4%) | 111 (30.4%) |
| 65 to 74 Years | 24 (30.4%) | 46 (35.7%) |
| 75 Years and over | 26 (35.6%) | 38 (40.4%) |
Disability Class: Cognitive Difficulty
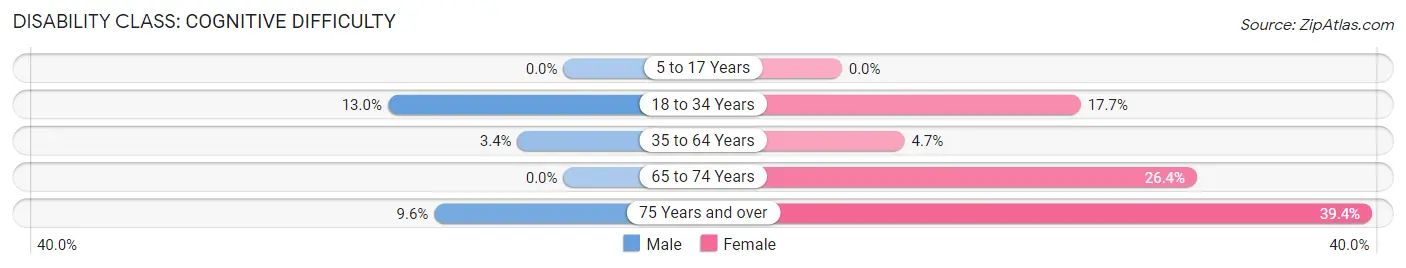
| Age Bracket | Male | Female |
| 5 to 17 Years | 0 (0.0%) | 0 (0.0%) |
| 18 to 34 Years | 27 (13.0%) | 44 (17.7%) |
| 35 to 64 Years | 13 (3.4%) | 17 (4.7%) |
| 65 to 74 Years | 0 (0.0%) | 34 (26.4%) |
| 75 Years and over | 7 (9.6%) | 37 (39.4%) |
Disability Class: Ambulatory Difficulty
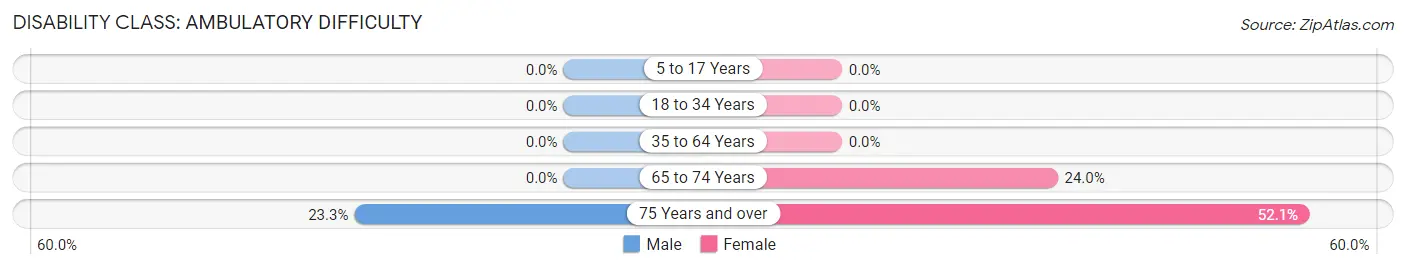
| Age Bracket | Male | Female |
| 5 to 17 Years | 0 (0.0%) | 0 (0.0%) |
| 18 to 34 Years | 0 (0.0%) | 0 (0.0%) |
| 35 to 64 Years | 0 (0.0%) | 0 (0.0%) |
| 65 to 74 Years | 0 (0.0%) | 31 (24.0%) |
| 75 Years and over | 17 (23.3%) | 49 (52.1%) |
Disability Class: Self-Care Difficulty
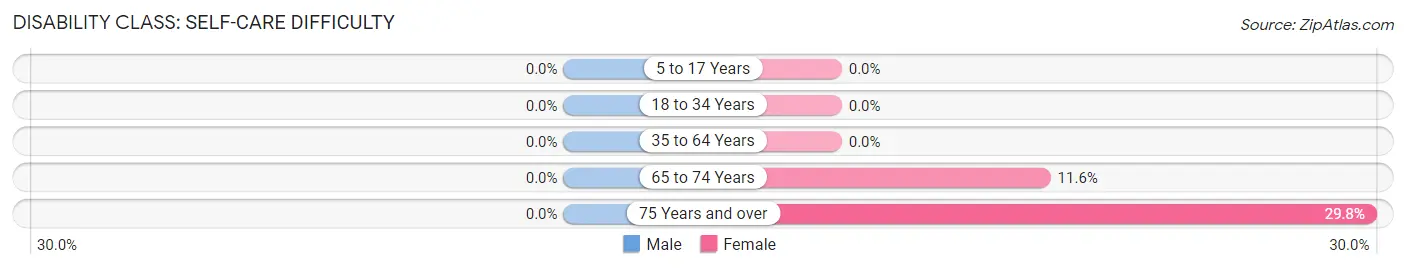
| Age Bracket | Male | Female |
| 5 to 17 Years | 0 (0.0%) | 0 (0.0%) |
| 18 to 34 Years | 0 (0.0%) | 0 (0.0%) |
| 35 to 64 Years | 0 (0.0%) | 0 (0.0%) |
| 65 to 74 Years | 0 (0.0%) | 15 (11.6%) |
| 75 Years and over | 0 (0.0%) | 28 (29.8%) |
Technology Access in Mariano Colon
Computing Device Access in Mariano Colon
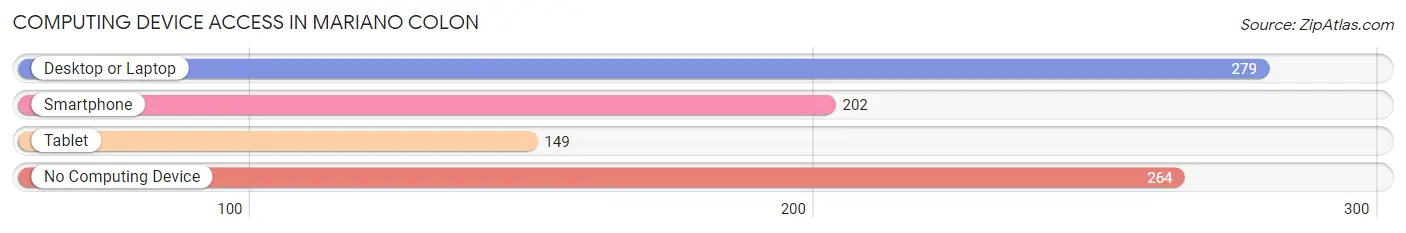
| Device Type | # Households | % Households |
| Desktop or Laptop | 279 | 47.3% |
| Smartphone | 202 | 34.2% |
| Tablet | 149 | 25.3% |
| No Computing Device | 264 | 44.8% |
| Total | 590 | 100.0% |
Internet Access in Mariano Colon
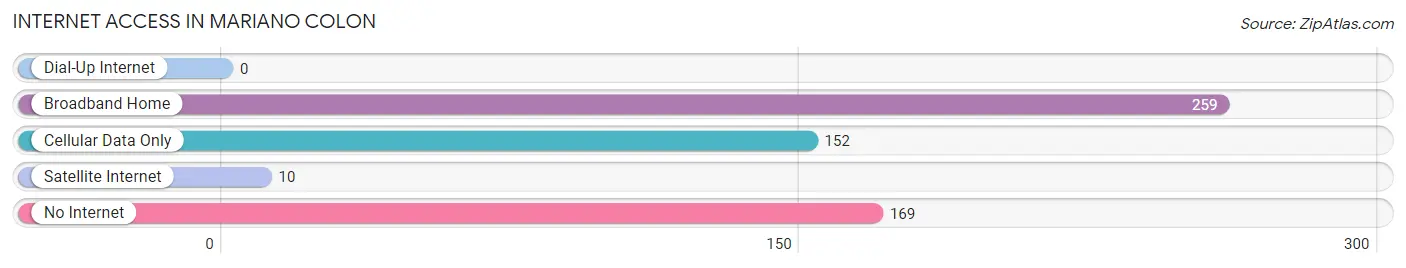
| Internet Type | # Households | % Households |
| Dial-Up Internet | 0 | 0.0% |
| Broadband Home | 259 | 43.9% |
| Cellular Data Only | 152 | 25.8% |
| Satellite Internet | 10 | 1.7% |
| No Internet | 169 | 28.6% |
| Total | 590 | 100.0% |
Mariano Colon Summary
Puerto Rico is an unincorporated territory of the United States located in the Caribbean Sea. It is an archipelago consisting of the main island of Puerto Rico and several smaller islands. The main island is the smallest and most populated of the Greater Antilles. Puerto Rico has a rich history, diverse geography, vibrant economy, and unique demographics.
History
Puerto Rico has a long and varied history. The island was first inhabited by the Taíno people, who were later displaced by the Spanish in the 16th century. The Spanish established a colony on the island and began to import African slaves to work on the plantations. Puerto Rico remained a Spanish colony until 1898, when it was ceded to the United States after the Spanish-American War.
In 1917, the Jones-Shafroth Act granted Puerto Ricans US citizenship. In 1952, Puerto Rico became a self-governing commonwealth of the United States. Since then, Puerto Rico has had a complex relationship with the US, with the island’s residents having limited representation in the US government.
Geography
Puerto Rico is located in the Caribbean Sea, east of the Dominican Republic and west of the Virgin Islands. The main island is approximately 100 miles long and 35 miles wide. It is surrounded by smaller islands, including Vieques, Culebra, and Mona.
The island is divided into 78 municipalities, each with its own government. The capital and largest city is San Juan, located on the northern coast. Other major cities include Ponce, Mayagüez, and Arecibo.
The terrain of Puerto Rico is mostly mountainous, with the highest peak being Cerro de Punta at 4,390 feet. The climate is tropical, with temperatures ranging from the mid-70s to the mid-80s.
Economy
Puerto Rico has a vibrant economy that is largely driven by tourism and manufacturing. The island is home to several large pharmaceutical companies, including Pfizer and Merck. Tourism is also a major industry, with millions of visitors coming to the island each year.
The government of Puerto Rico has implemented several economic reforms in recent years, including tax incentives for businesses and a reduction in the corporate tax rate. These reforms have helped to attract new businesses and investments to the island.
Demographics
Puerto Rico has a population of approximately 3.2 million people. The majority of the population is of Hispanic or Latino descent, with the largest ethnic group being Puerto Ricans. Other ethnic groups include African, European, and Asian.
The official language of Puerto Rico is Spanish, although English is also widely spoken. The majority of the population is Roman Catholic, although there are also significant numbers of Protestants and other religious groups.
Puerto Rico has a high rate of poverty, with approximately 45% of the population living below the poverty line. The unemployment rate is also high, at around 10%.
Conclusion
Puerto Rico is a unique and vibrant island with a rich history, diverse geography, vibrant economy, and unique demographics. The island has a complex relationship with the United States, with its residents having limited representation in the US government. Despite its challenges, Puerto Rico remains an important part of the Caribbean and a vibrant destination for tourists and businesses alike.
Common Questions
What is Per Capita Income in Mariano Colon?
Per Capita income in Mariano Colon is $8,026.
What is the Median Family Income in Mariano Colon?
Median Family Income in Mariano Colon is $19,688.
What is the Median Household income in Mariano Colon?
Median Household Income in Mariano Colon is $16,029.
What is Inequality or Gini Index in Mariano Colon?
Inequality or Gini Index in Mariano Colon is 0.56.
What is the Total Population of Mariano Colon?
Total Population of Mariano Colon is 1,920.
What is the Total Male Population of Mariano Colon?
Total Male Population of Mariano Colon is 886.
What is the Total Female Population of Mariano Colon?
Total Female Population of Mariano Colon is 1,034.
What is the Ratio of Males per 100 Females in Mariano Colon?
There are 85.69 Males per 100 Females in Mariano Colon.
What is the Ratio of Females per 100 Males in Mariano Colon?
There are 116.70 Females per 100 Males in Mariano Colon.
What is the Median Population Age in Mariano Colon?
Median Population Age in Mariano Colon is 41.5 Years.
What is the Average Family Size in Mariano Colon
Average Family Size in Mariano Colon is 4.2 People.
What is the Average Household Size in Mariano Colon
Average Household Size in Mariano Colon is 3.2 People.
How Large is the Labor Force in Mariano Colon?
There are 713 People in the Labor Forcein in Mariano Colon.
What is the Percentage of People in the Labor Force in Mariano Colon?
44.4% of People are in the Labor Force in Mariano Colon.
What is the Unemployment Rate in Mariano Colon?
Unemployment Rate in Mariano Colon is 12.6%.