Pole Ojea, PR Map & Demographics
Pole Ojea Map
Pole Ojea Overview
$6,993
PER CAPITA INCOME
$14,740
AVG FAMILY INCOME
$13,841
AVG HOUSEHOLD INCOME
50.3%
WAGE / INCOME GAP [ % ]
49.7¢/ $1
WAGE / INCOME GAP [ $ ]
$10,091
FAMILY INCOME DEFICIT
0.41
INEQUALITY / GINI INDEX
1,658
TOTAL POPULATION
751
MALE POPULATION
907
FEMALE POPULATION
82.80
MALES / 100 FEMALES
120.77
FEMALES / 100 MALES
48.6
MEDIAN AGE
3.7
AVG FAMILY SIZE
2.8
AVG HOUSEHOLD SIZE
483
LABOR FORCE [ PEOPLE ]
34.6%
PERCENT IN LABOR FORCE
10.8%
UNEMPLOYMENT RATE
Income in Pole Ojea
Income Overview in Pole Ojea
Per Capita Income in Pole Ojea is $6,993, while median incomes of families and households are $14,740 and $13,841 respectively.
| Characteristic | Number | Measure |
| Per Capita Income | 1,658 | $6,993 |
| Median Family Income | 365 | $14,740 |
| Mean Family Income | 365 | $17,841 |
| Median Household Income | 587 | $13,841 |
| Mean Household Income | 587 | $17,814 |
| Income Deficit | 365 | $10,091 |
| Wage / Income Gap (%) | 1,658 | 50.32% |
| Wage / Income Gap ($) | 1,658 | 49.68¢ per $1 |
| Gini / Inequality Index | 1,658 | 0.41 |
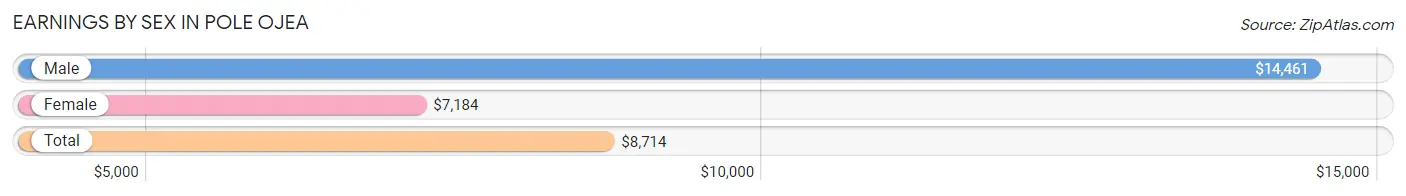
Earnings by Sex in Pole Ojea
Average Earnings in Pole Ojea are $8,714, $14,461 for men and $7,184 for women, a difference of 50.3%.
| Sex | Number | Average Earnings |
| Male | 137 (31.1%) | $14,461 |
| Female | 303 (68.9%) | $7,184 |
| Total | 440 (100.0%) | $8,714 |
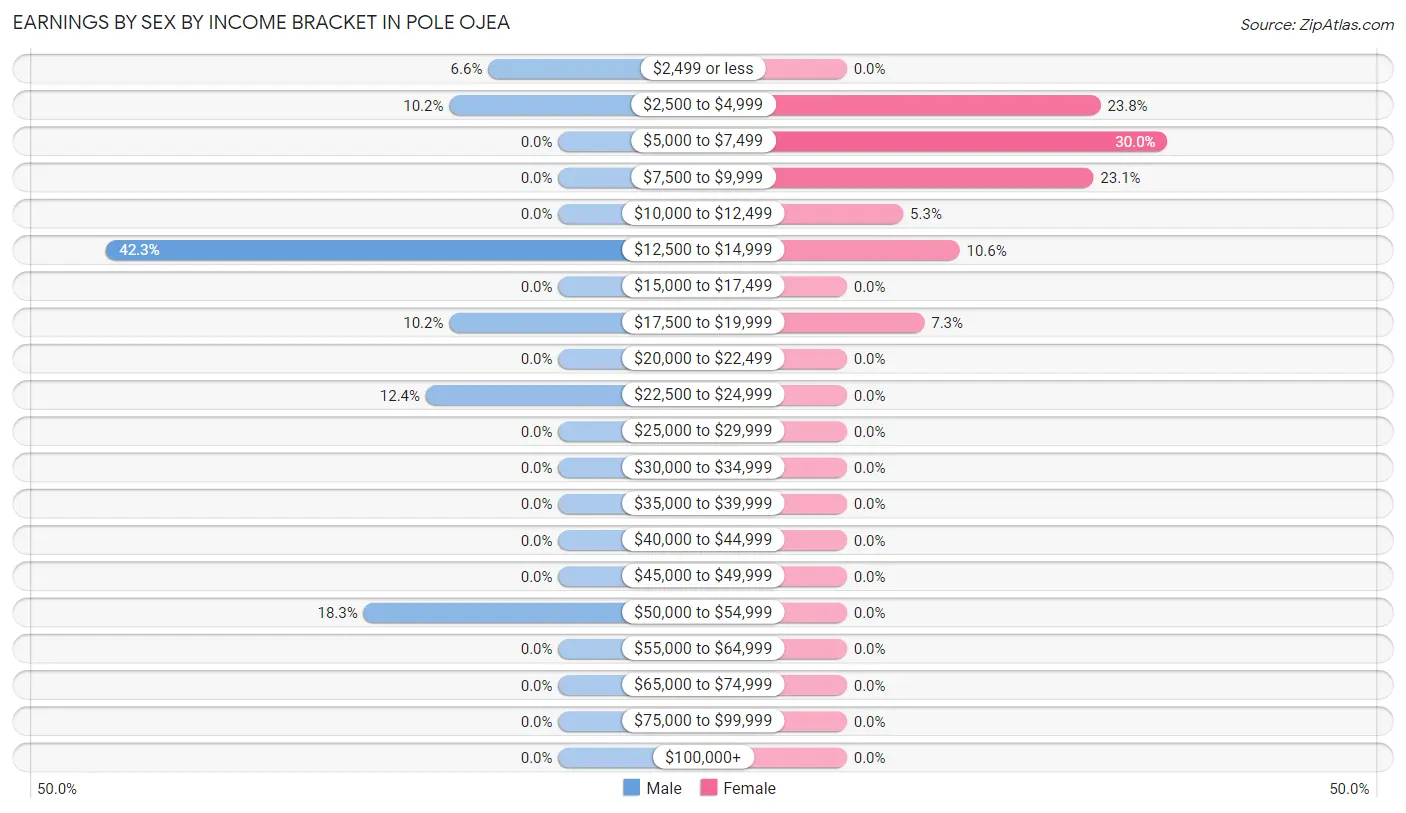
Earnings by Sex by Income Bracket in Pole Ojea
The most common earnings brackets in Pole Ojea are $12,500 to $14,999 for men (58 | 42.3%) and $5,000 to $7,499 for women (91 | 30.0%).
| Income | Male | Female |
| $2,499 or less | 9 (6.6%) | 0 (0.0%) |
| $2,500 to $4,999 | 14 (10.2%) | 72 (23.8%) |
| $5,000 to $7,499 | 0 (0.0%) | 91 (30.0%) |
| $7,500 to $9,999 | 0 (0.0%) | 70 (23.1%) |
| $10,000 to $12,499 | 0 (0.0%) | 16 (5.3%) |
| $12,500 to $14,999 | 58 (42.3%) | 32 (10.6%) |
| $15,000 to $17,499 | 0 (0.0%) | 0 (0.0%) |
| $17,500 to $19,999 | 14 (10.2%) | 22 (7.3%) |
| $20,000 to $22,499 | 0 (0.0%) | 0 (0.0%) |
| $22,500 to $24,999 | 17 (12.4%) | 0 (0.0%) |
| $25,000 to $29,999 | 0 (0.0%) | 0 (0.0%) |
| $30,000 to $34,999 | 0 (0.0%) | 0 (0.0%) |
| $35,000 to $39,999 | 0 (0.0%) | 0 (0.0%) |
| $40,000 to $44,999 | 0 (0.0%) | 0 (0.0%) |
| $45,000 to $49,999 | 0 (0.0%) | 0 (0.0%) |
| $50,000 to $54,999 | 25 (18.2%) | 0 (0.0%) |
| $55,000 to $64,999 | 0 (0.0%) | 0 (0.0%) |
| $65,000 to $74,999 | 0 (0.0%) | 0 (0.0%) |
| $75,000 to $99,999 | 0 (0.0%) | 0 (0.0%) |
| $100,000+ | 0 (0.0%) | 0 (0.0%) |
| Total | 137 (100.0%) | 303 (100.0%) |
Earnings by Sex by Educational Attainment in Pole Ojea
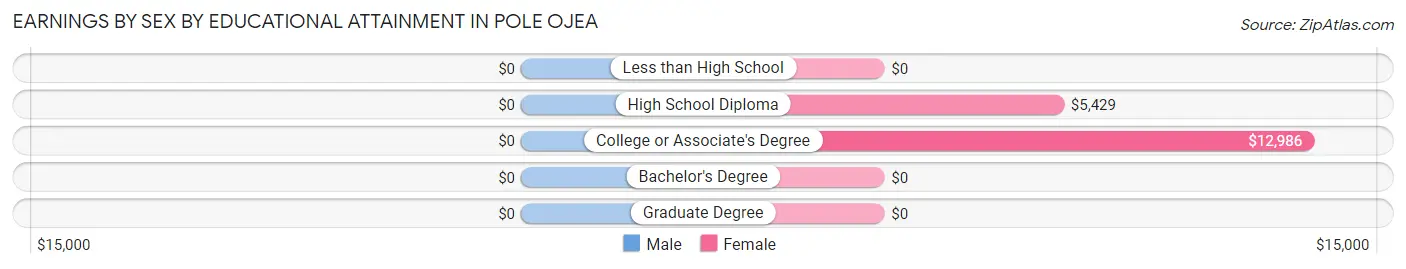
| Educational Attainment | Male Income | Female Income |
| Less than High School | - | - |
| High School Diploma | - | - |
| College or Associate's Degree | - | - |
| Bachelor's Degree | - | - |
| Graduate Degree | - | - |
| Total | $14,957 | $6,621 |
Family Income in Pole Ojea
Family Income Brackets in Pole Ojea
According to the Pole Ojea family income data, there are 125 families falling into the less than $10,000 income range, which is the most common income bracket and makes up 34.3% of all families.
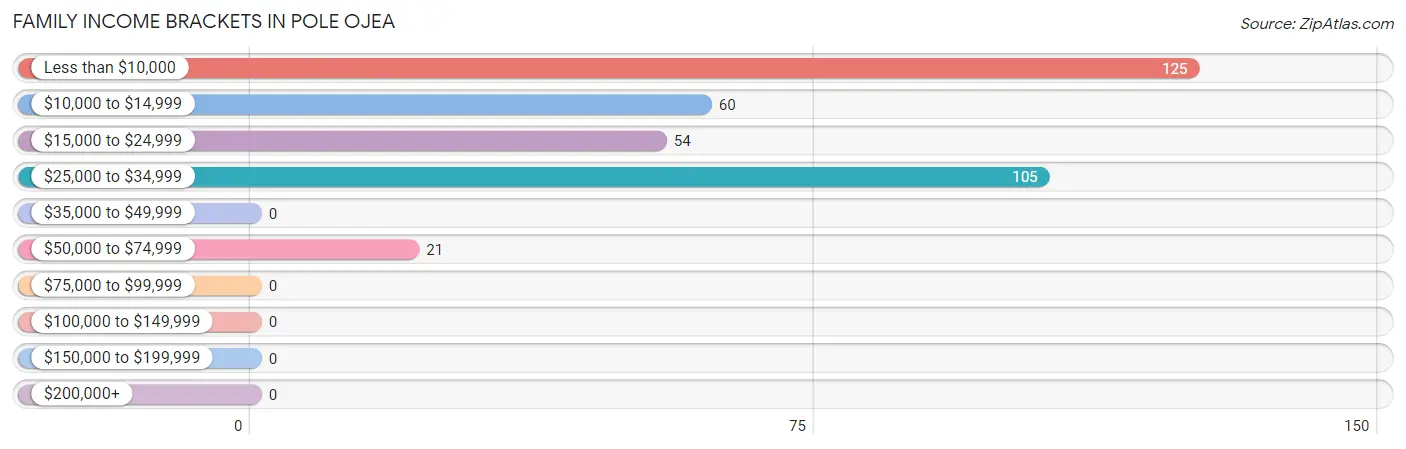
| Income Bracket | # Families | % Families |
| Less than $10,000 | 125 | 34.2% |
| $10,000 to $14,999 | 60 | 16.4% |
| $15,000 to $24,999 | 54 | 14.8% |
| $25,000 to $34,999 | 105 | 28.8% |
| $35,000 to $49,999 | 0 | 0.0% |
| $50,000 to $74,999 | 21 | 5.8% |
| $75,000 to $99,999 | 0 | 0.0% |
| $100,000 to $149,999 | 0 | 0.0% |
| $150,000 to $199,999 | 0 | 0.0% |
| $200,000+ | 0 | 0.0% |
Family Income by Famaliy Size in Pole Ojea
2-person families (186 | 51.0%) account for the highest median family income in Pole Ojea with $9,219 per family, while 2-person families (186 | 51.0%) have the highest median income of $4,610 per family member.
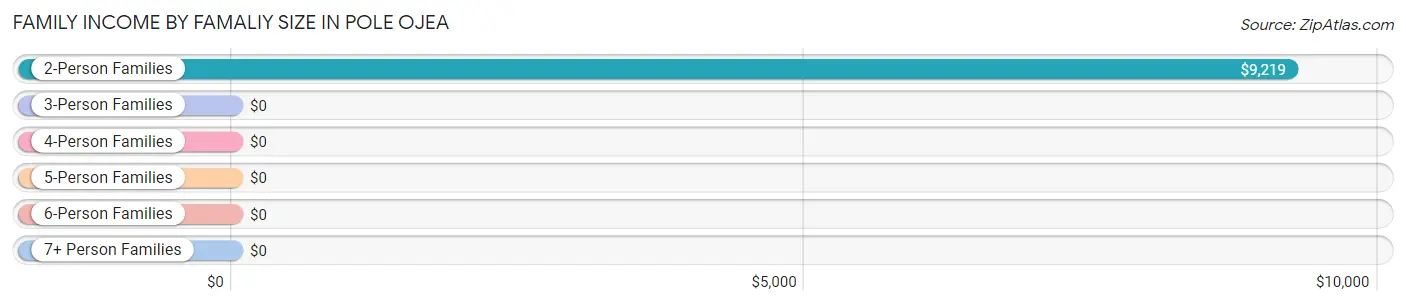
| Income Bracket | # Families | Median Income |
| 2-Person Families | 186 (51.0%) | $9,219 |
| 3-Person Families | 90 (24.7%) | $0 |
| 4-Person Families | 39 (10.7%) | $0 |
| 5-Person Families | 34 (9.3%) | $0 |
| 6-Person Families | 16 (4.4%) | $0 |
| 7+ Person Families | 0 (0.0%) | $0 |
| Total | 365 (100.0%) | $14,740 |
Family Income by Number of Earners in Pole Ojea
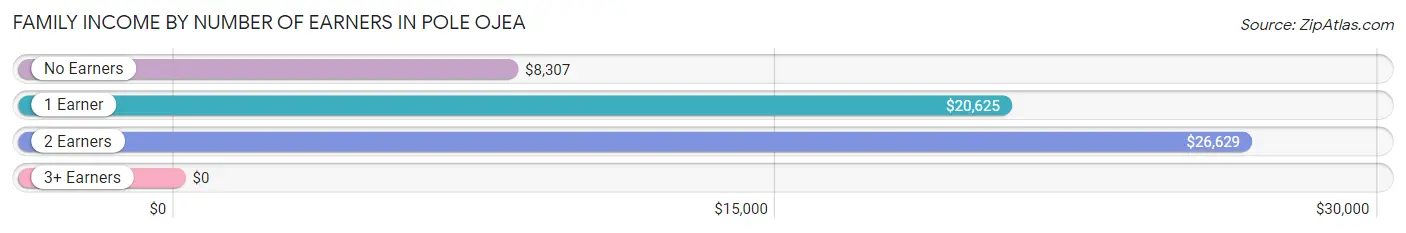
| Number of Earners | # Families | Median Income |
| No Earners | 185 (50.7%) | $8,307 |
| 1 Earner | 125 (34.3%) | $20,625 |
| 2 Earners | 55 (15.1%) | $26,629 |
| 3+ Earners | 0 (0.0%) | $0 |
| Total | 365 (100.0%) | $14,740 |
Household Income in Pole Ojea
Household Income Brackets in Pole Ojea
With 173 households falling in the category, the less than $10,000 income range is the most frequent in Pole Ojea, accounting for 29.5% of all households.
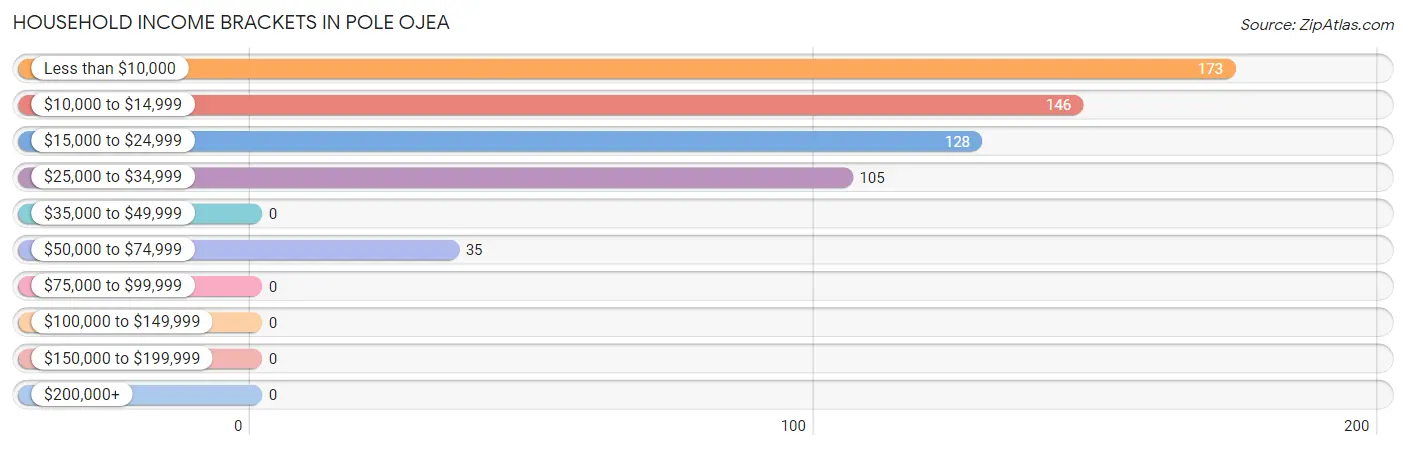
| Income Bracket | # Households | % Households |
| Less than $10,000 | 173 | 29.5% |
| $10,000 to $14,999 | 146 | 24.9% |
| $15,000 to $24,999 | 128 | 21.8% |
| $25,000 to $34,999 | 105 | 17.9% |
| $35,000 to $49,999 | 0 | 0.0% |
| $50,000 to $74,999 | 35 | 6.0% |
| $75,000 to $99,999 | 0 | 0.0% |
| $100,000 to $149,999 | 0 | 0.0% |
| $150,000 to $199,999 | 0 | 0.0% |
| $200,000+ | 0 | 0.0% |
Household Income by Householder Age in Pole Ojea
The median household income in Pole Ojea is $13,841, with the highest median household income of $25,455 found in the 45 to 64 years age bracket for the primary householder. A total of 168 households (28.6%) fall into this category.
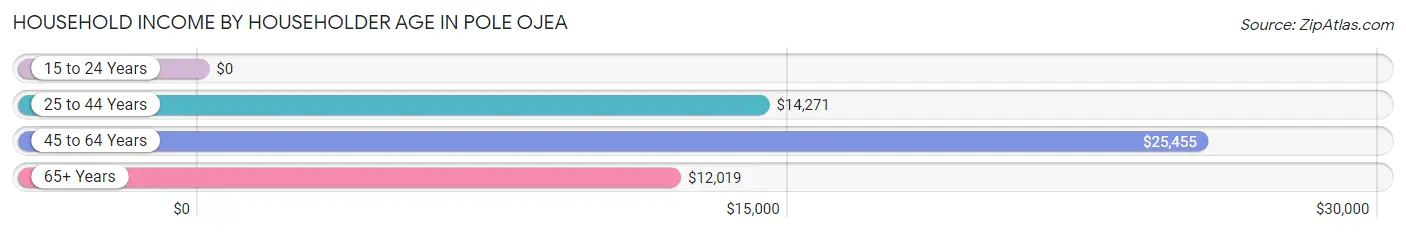
| Income Bracket | # Households | Median Income |
| 15 to 24 Years | 0 (0.0%) | $0 |
| 25 to 44 Years | 121 (20.6%) | $14,271 |
| 45 to 64 Years | 168 (28.6%) | $25,455 |
| 65+ Years | 298 (50.8%) | $12,019 |
| Total | 587 (100.0%) | $13,841 |
Poverty in Pole Ojea
Income Below Poverty by Sex and Age in Pole Ojea
With 83.2% poverty level for males and 79.6% for females among the residents of Pole Ojea, 12 to 14 year old males and under 5 year old females are the most vulnerable to poverty, with 34 males (100.0%) and 68 females (100.0%) in their respective age groups living below the poverty level.
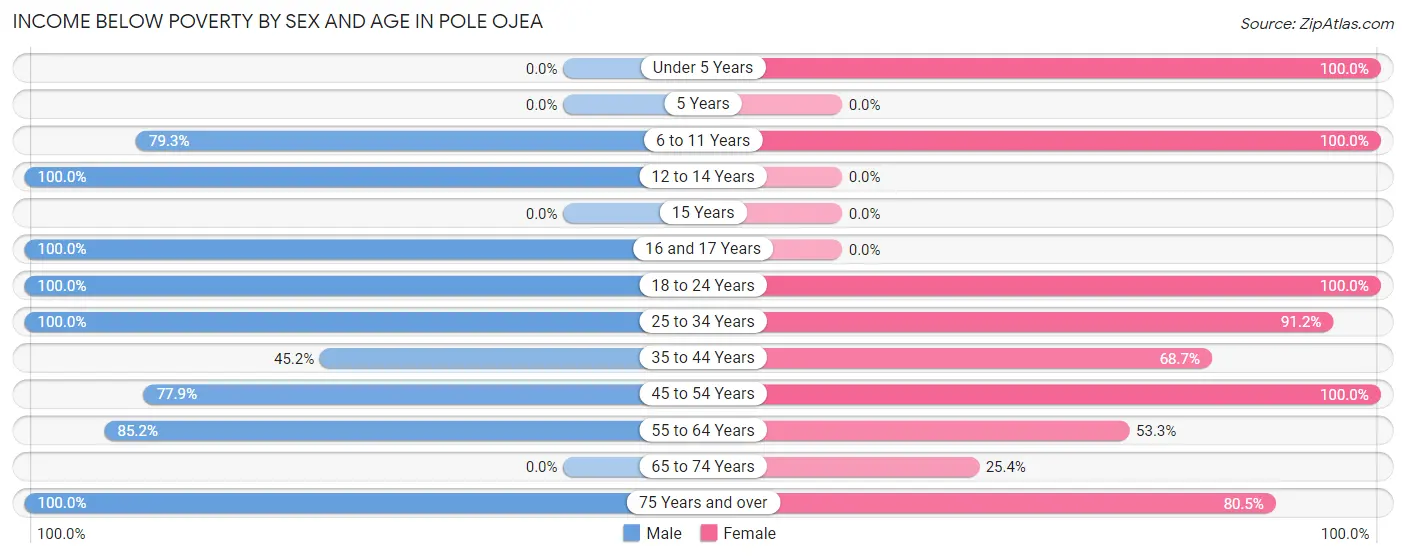
| Age Bracket | Male | Female |
| Under 5 Years | 0 (0.0%) | 68 (100.0%) |
| 5 Years | 0 (0.0%) | 0 (0.0%) |
| 6 to 11 Years | 92 (79.3%) | 44 (100.0%) |
| 12 to 14 Years | 34 (100.0%) | 0 (0.0%) |
| 15 Years | 0 (0.0%) | 0 (0.0%) |
| 16 and 17 Years | 22 (100.0%) | 0 (0.0%) |
| 18 to 24 Years | 42 (100.0%) | 81 (100.0%) |
| 25 to 34 Years | 58 (100.0%) | 228 (91.2%) |
| 35 to 44 Years | 14 (45.2%) | 46 (68.7%) |
| 45 to 54 Years | 88 (77.9%) | 55 (100.0%) |
| 55 to 64 Years | 155 (85.2%) | 16 (53.3%) |
| 65 to 74 Years | 0 (0.0%) | 31 (25.4%) |
| 75 Years and over | 120 (100.0%) | 153 (80.5%) |
| Total | 625 (83.2%) | 722 (79.6%) |
Income Above Poverty by Sex and Age in Pole Ojea
According to the poverty statistics in Pole Ojea, males aged 65 to 74 years and females aged 65 to 74 years are the age groups that are most secure financially, with 100.0% of males and 74.6% of females in these age groups living above the poverty line.
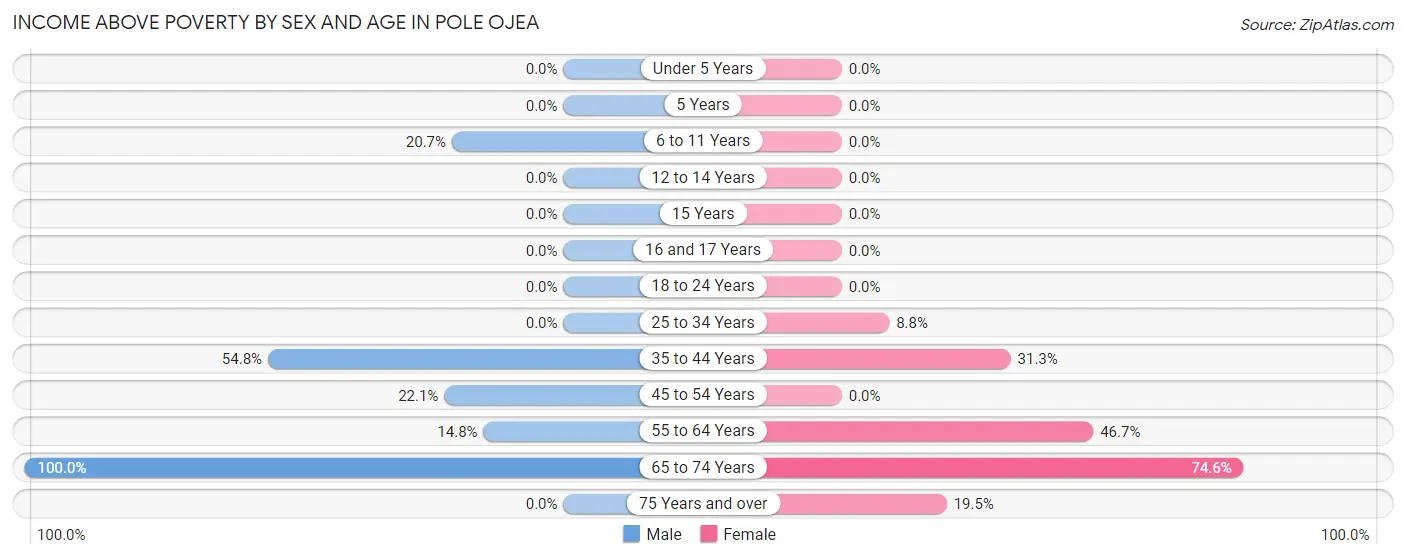
| Age Bracket | Male | Female |
| Under 5 Years | 0 (0.0%) | 0 (0.0%) |
| 5 Years | 0 (0.0%) | 0 (0.0%) |
| 6 to 11 Years | 24 (20.7%) | 0 (0.0%) |
| 12 to 14 Years | 0 (0.0%) | 0 (0.0%) |
| 15 Years | 0 (0.0%) | 0 (0.0%) |
| 16 and 17 Years | 0 (0.0%) | 0 (0.0%) |
| 18 to 24 Years | 0 (0.0%) | 0 (0.0%) |
| 25 to 34 Years | 0 (0.0%) | 22 (8.8%) |
| 35 to 44 Years | 17 (54.8%) | 21 (31.3%) |
| 45 to 54 Years | 25 (22.1%) | 0 (0.0%) |
| 55 to 64 Years | 27 (14.8%) | 14 (46.7%) |
| 65 to 74 Years | 33 (100.0%) | 91 (74.6%) |
| 75 Years and over | 0 (0.0%) | 37 (19.5%) |
| Total | 126 (16.8%) | 185 (20.4%) |
Income Below Poverty Among Married-Couple Families in Pole Ojea
The poverty statistics for married-couple families in Pole Ojea show that 59.3% or 112 of the total 189 families live below the poverty line. Families with 1 or 2 children have the highest poverty rate of 70.4%, comprising of 50 families. On the other hand, families with no children have the lowest poverty rate of 52.5%, which includes 62 families.
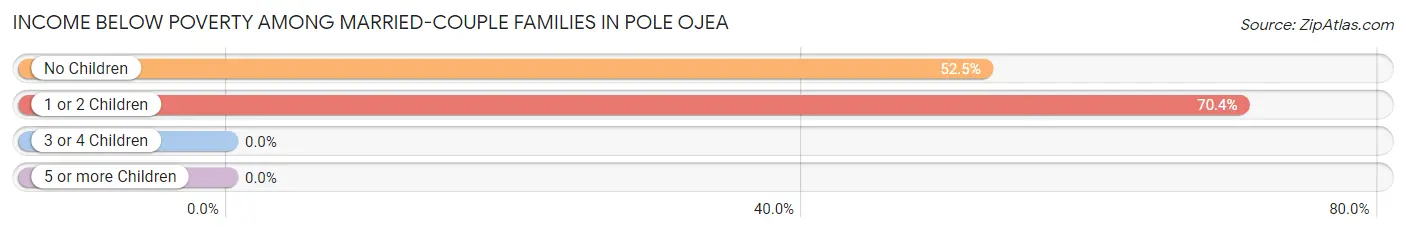
| Children | Above Poverty | Below Poverty |
| No Children | 56 (47.5%) | 62 (52.5%) |
| 1 or 2 Children | 21 (29.6%) | 50 (70.4%) |
| 3 or 4 Children | 0 (0.0%) | 0 (0.0%) |
| 5 or more Children | 0 (0.0%) | 0 (0.0%) |
| Total | 77 (40.7%) | 112 (59.3%) |
Income Below Poverty Among Single-Parent Households in Pole Ojea
According to the poverty data in Pole Ojea, 100.0% or 67 single-father households and 100.0% or 109 single-mother households are living below the poverty line. Among single-father households, those with no children have the highest poverty rate, with 15 households (100.0%) experiencing poverty. Likewise, among single-mother households, those with no children have the highest poverty rate, with 63 households (100.0%) falling below the poverty line.
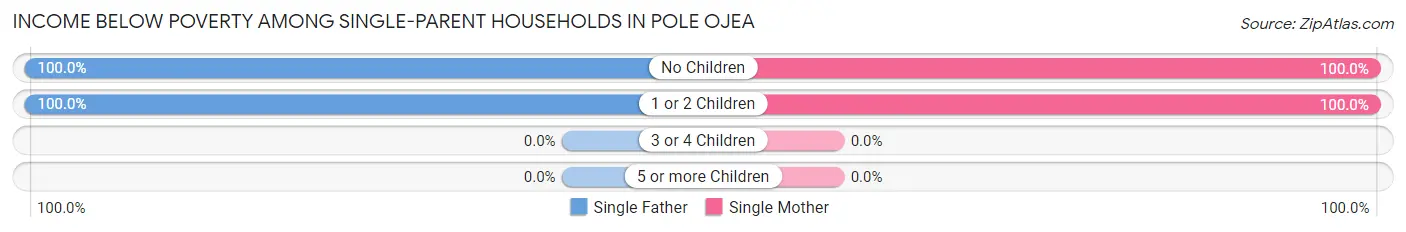
| Children | Single Father | Single Mother |
| No Children | 15 (100.0%) | 63 (100.0%) |
| 1 or 2 Children | 52 (100.0%) | 46 (100.0%) |
| 3 or 4 Children | 0 (0.0%) | 0 (0.0%) |
| 5 or more Children | 0 (0.0%) | 0 (0.0%) |
| Total | 67 (100.0%) | 109 (100.0%) |
Income Below Poverty Among Married-Couple vs Single-Parent Households in Pole Ojea
The poverty data for Pole Ojea shows that 112 of the married-couple family households (59.3%) and 176 of the single-parent households (100.0%) are living below the poverty level. Within the married-couple family households, those with 1 or 2 children have the highest poverty rate, with 50 households (70.4%) falling below the poverty line. Among the single-parent households, those with no children have the highest poverty rate, with 78 household (100.0%) living below poverty.
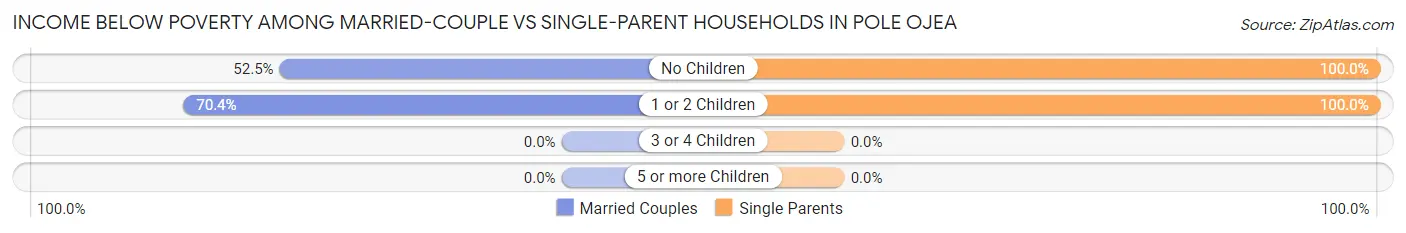
| Children | Married-Couple Families | Single-Parent Households |
| No Children | 62 (52.5%) | 78 (100.0%) |
| 1 or 2 Children | 50 (70.4%) | 98 (100.0%) |
| 3 or 4 Children | 0 (0.0%) | 0 (0.0%) |
| 5 or more Children | 0 (0.0%) | 0 (0.0%) |
| Total | 112 (59.3%) | 176 (100.0%) |
Race in Pole Ojea
The most populous races in Pole Ojea are Hispanic or Latino (1,637 | 98.7%), Some other Race (759 | 45.8%), and White / Caucasian (731 | 44.1%).
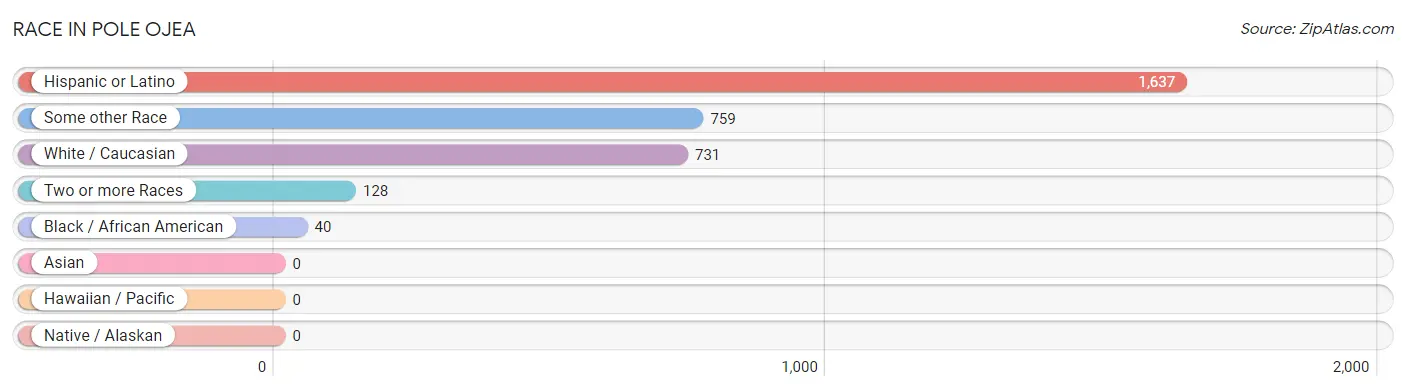
| Race | # Population | % Population |
| Asian | 0 | 0.0% |
| Black / African American | 40 | 2.4% |
| Hawaiian / Pacific | 0 | 0.0% |
| Hispanic or Latino | 1,637 | 98.7% |
| Native / Alaskan | 0 | 0.0% |
| White / Caucasian | 731 | 44.1% |
| Two or more Races | 128 | 7.7% |
| Some other Race | 759 | 45.8% |
| Total | 1,658 | 100.0% |
Ancestry in Pole Ojea
The most populous ancestries reported in Pole Ojea are Puerto Rican (1,637 | 98.7%), and American (65 | 3.9%), together accounting for 102.6% of all Pole Ojea residents.
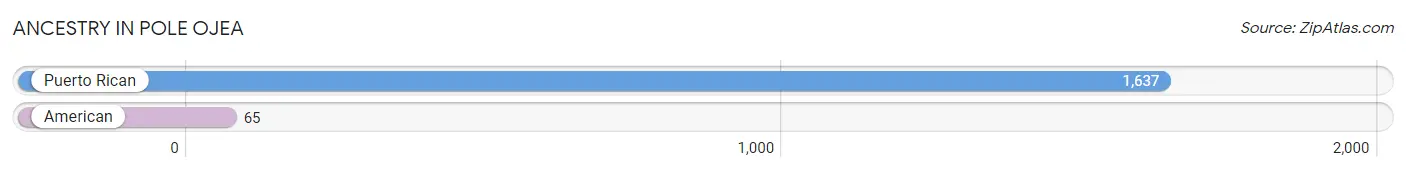
| Ancestry | # Population | % Population |
| American | 65 | 3.9% |
| Puerto Rican | 1,637 | 98.7% | View All 2 Rows |
Immigrants in Pole Ojea

| Immigration Origin | # Population | % Population | View All 0 Rows |
Sex and Age in Pole Ojea
Sex and Age in Pole Ojea
The most populous age groups in Pole Ojea are 55 to 59 Years (135 | 18.0%) for men and 25 to 29 Years (157 | 17.3%) for women.
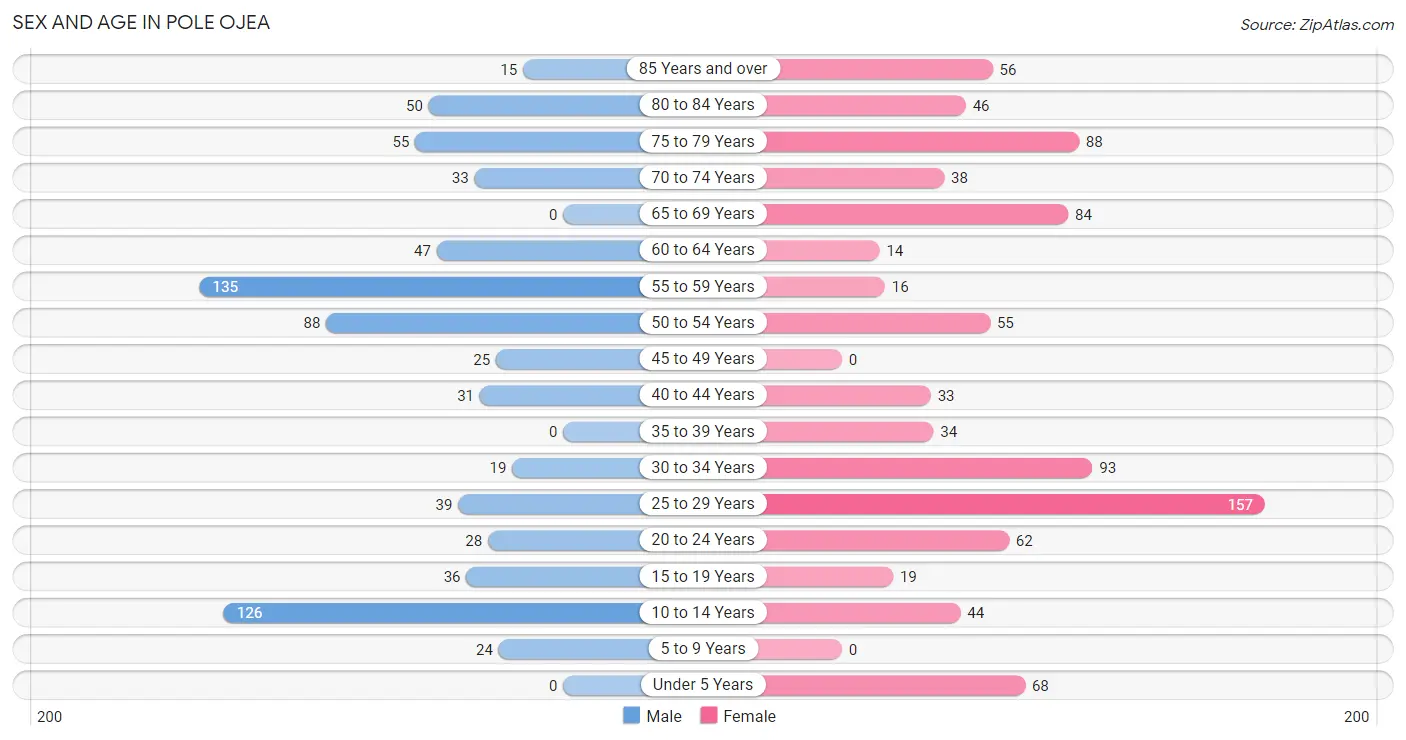
| Age Bracket | Male | Female |
| Under 5 Years | 0 (0.0%) | 68 (7.5%) |
| 5 to 9 Years | 24 (3.2%) | 0 (0.0%) |
| 10 to 14 Years | 126 (16.8%) | 44 (4.9%) |
| 15 to 19 Years | 36 (4.8%) | 19 (2.1%) |
| 20 to 24 Years | 28 (3.7%) | 62 (6.8%) |
| 25 to 29 Years | 39 (5.2%) | 157 (17.3%) |
| 30 to 34 Years | 19 (2.5%) | 93 (10.2%) |
| 35 to 39 Years | 0 (0.0%) | 34 (3.7%) |
| 40 to 44 Years | 31 (4.1%) | 33 (3.6%) |
| 45 to 49 Years | 25 (3.3%) | 0 (0.0%) |
| 50 to 54 Years | 88 (11.7%) | 55 (6.1%) |
| 55 to 59 Years | 135 (18.0%) | 16 (1.8%) |
| 60 to 64 Years | 47 (6.3%) | 14 (1.5%) |
| 65 to 69 Years | 0 (0.0%) | 84 (9.3%) |
| 70 to 74 Years | 33 (4.4%) | 38 (4.2%) |
| 75 to 79 Years | 55 (7.3%) | 88 (9.7%) |
| 80 to 84 Years | 50 (6.7%) | 46 (5.1%) |
| 85 Years and over | 15 (2.0%) | 56 (6.2%) |
| Total | 751 (100.0%) | 907 (100.0%) |
Families and Households in Pole Ojea
Median Family Size in Pole Ojea
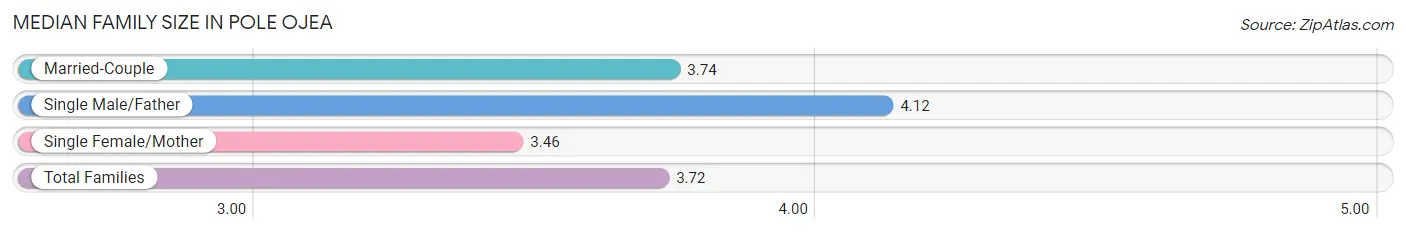
The median family size in Pole Ojea is 3.72 persons per family, with single male/father families (67 | 18.4%) accounting for the largest median family size of 4.12 persons per family. On the other hand, single female/mother families (109 | 29.9%) represent the smallest median family size with 3.46 persons per family.
| Family Type | # Families | Family Size |
| Married-Couple | 189 (51.8%) | 3.74 |
| Single Male/Father | 67 (18.4%) | 4.12 |
| Single Female/Mother | 109 (29.9%) | 3.46 |
| Total Families | 365 (100.0%) | 3.72 |
Median Household Size in Pole Ojea
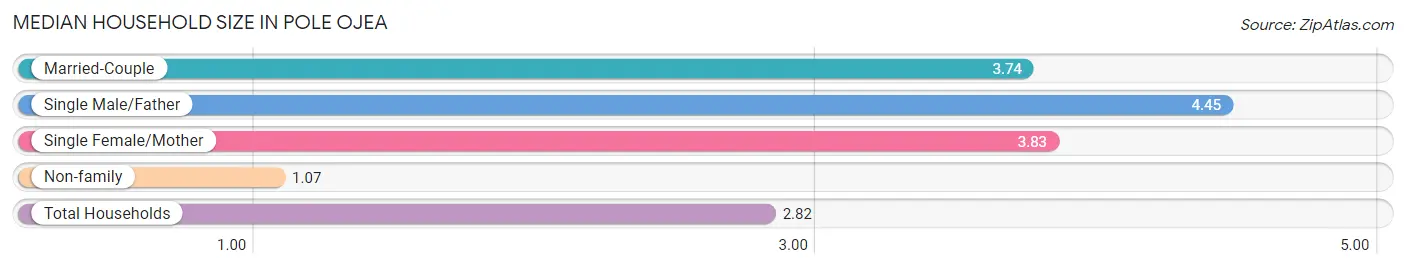
The median household size in Pole Ojea is 2.82 persons per household, with single male/father households (67 | 11.4%) accounting for the largest median household size of 4.45 persons per household. non-family households (222 | 37.8%) represent the smallest median household size with 1.07 persons per household.
| Household Type | # Households | Household Size |
| Married-Couple | 189 (32.2%) | 3.74 |
| Single Male/Father | 67 (11.4%) | 4.45 |
| Single Female/Mother | 109 (18.6%) | 3.83 |
| Non-family | 222 (37.8%) | 1.07 |
| Total Households | 587 (100.0%) | 2.82 |
Household Size by Marriage Status in Pole Ojea
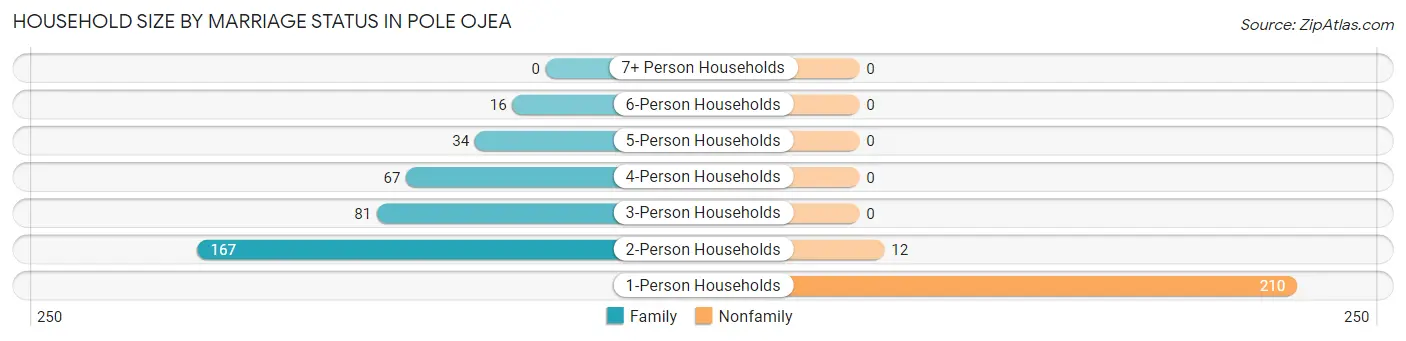
Out of a total of 587 households in Pole Ojea, 365 (62.2%) are family households, while 222 (37.8%) are nonfamily households. The most numerous type of family households are 2-person households, comprising 167, and the most common type of nonfamily households are 1-person households, comprising 210.
| Household Size | Family Households | Nonfamily Households |
| 1-Person Households | - | 210 (35.8%) |
| 2-Person Households | 167 (28.4%) | 12 (2.0%) |
| 3-Person Households | 81 (13.8%) | 0 (0.0%) |
| 4-Person Households | 67 (11.4%) | 0 (0.0%) |
| 5-Person Households | 34 (5.8%) | 0 (0.0%) |
| 6-Person Households | 16 (2.7%) | 0 (0.0%) |
| 7+ Person Households | 0 (0.0%) | 0 (0.0%) |
| Total | 365 (62.2%) | 222 (37.8%) |
Female Fertility in Pole Ojea
Fertility by Age in Pole Ojea
| Age Bracket | Women with Births | Births / 1,000 Women |
| 15 to 19 years | 0 (0.0%) | 0.0 |
| 20 to 34 years | 0 (0.0%) | 0.0 |
| 35 to 50 years | 0 (0.0%) | 0.0 |
| Total | 0 (0.0%) | 0.0 |
Fertility by Age by Marriage Status in Pole Ojea
| Age Bracket | Married | Unmarried |
| 15 to 19 years | 0 (0.0%) | 0 (0.0%) |
| 20 to 34 years | 0 (0.0%) | 0 (0.0%) |
| 35 to 50 years | 0 (0.0%) | 0 (0.0%) |
| Total | 0 (0.0%) | 0 (0.0%) |
Fertility by Education in Pole Ojea
| Educational Attainment | Women with Births | Births / 1,000 Women |
| Less than High School | 0 (0.0%) | 0.0 |
| High School Diploma | 0 (0.0%) | 0.0 |
| College or Associate's Degree | 0 (0.0%) | 0.0 |
| Bachelor's Degree | 0 (0.0%) | 0.0 |
| Graduate Degree | 0 (0.0%) | 0.0 |
| Total | 0 (0.0%) | 0.0 |
Fertility by Education by Marriage Status in Pole Ojea
| Educational Attainment | Married | Unmarried |
| Less than High School | 0 (0.0%) | 0 (0.0%) |
| High School Diploma | 0 (0.0%) | 0 (0.0%) |
| College or Associate's Degree | 0 (0.0%) | 0 (0.0%) |
| Bachelor's Degree | 0 (0.0%) | 0 (0.0%) |
| Graduate Degree | 0 (0.0%) | 0 (0.0%) |
| Total | 0 (0.0%) | 0 (0.0%) |
Employment Characteristics in Pole Ojea
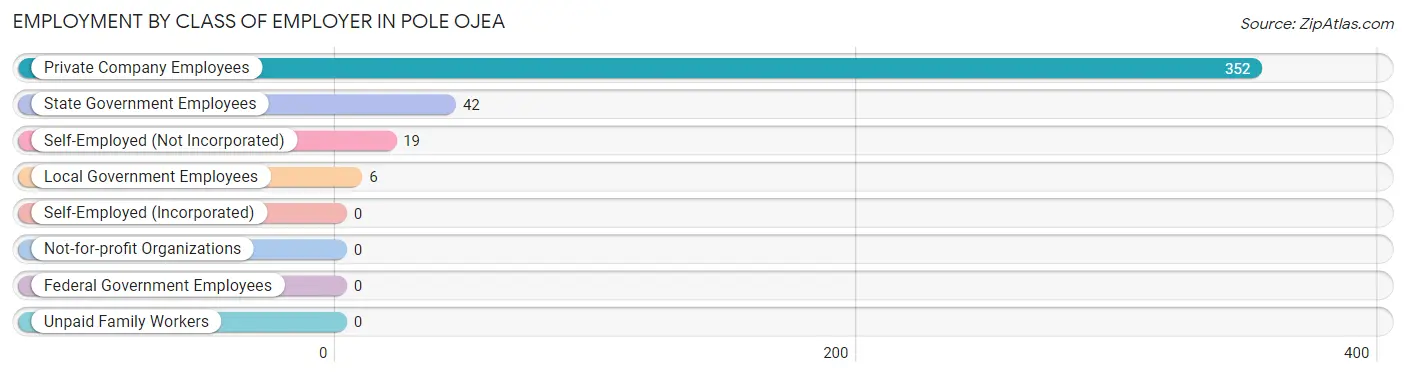
Employment by Class of Employer in Pole Ojea
Among the 419 employed individuals in Pole Ojea, private company employees (352 | 84.0%), state government employees (42 | 10.0%), and self-employed (not incorporated) (19 | 4.5%) make up the most common classes of employment.
| Employer Class | # Employees | % Employees |
| Private Company Employees | 352 | 84.0% |
| Self-Employed (Incorporated) | 0 | 0.0% |
| Self-Employed (Not Incorporated) | 19 | 4.5% |
| Not-for-profit Organizations | 0 | 0.0% |
| Local Government Employees | 6 | 1.4% |
| State Government Employees | 42 | 10.0% |
| Federal Government Employees | 0 | 0.0% |
| Unpaid Family Workers | 0 | 0.0% |
| Total | 419 | 100.0% |
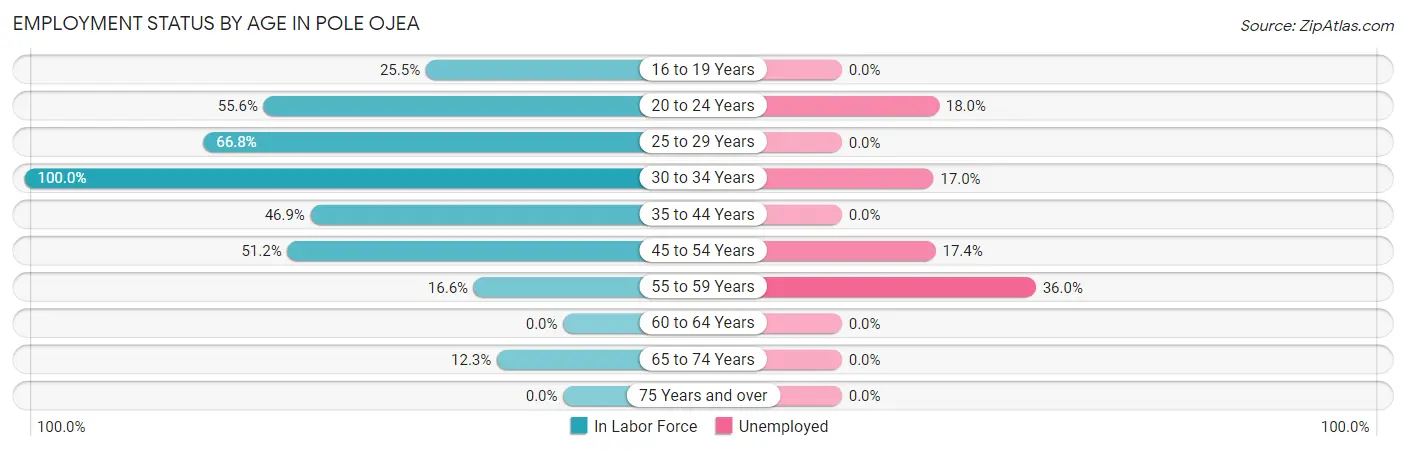
Employment Status by Age in Pole Ojea
According to the labor force statistics for Pole Ojea, out of the total population over 16 years of age (1,396), 34.6% or 483 individuals are in the labor force, with 10.8% or 52 of them unemployed. The age group with the highest labor force participation rate is 30 to 34 years, with 100.0% or 112 individuals in the labor force. Within the labor force, the 55 to 59 years age range has the highest percentage of unemployed individuals, with 36.0% or 9 of them being unemployed.
| Age Bracket | In Labor Force | Unemployed |
| 16 to 19 Years | 14 (25.5%) | 0 (0.0%) |
| 20 to 24 Years | 50 (55.6%) | 9 (18.0%) |
| 25 to 29 Years | 131 (66.8%) | 0 (0.0%) |
| 30 to 34 Years | 112 (100.0%) | 19 (17.0%) |
| 35 to 44 Years | 46 (46.9%) | 0 (0.0%) |
| 45 to 54 Years | 86 (51.2%) | 15 (17.4%) |
| 55 to 59 Years | 25 (16.6%) | 9 (36.0%) |
| 60 to 64 Years | 0 (0.0%) | 0 (0.0%) |
| 65 to 74 Years | 19 (12.3%) | 0 (0.0%) |
| 75 Years and over | 0 (0.0%) | 0 (0.0%) |
| Total | 483 (34.6%) | 52 (10.8%) |
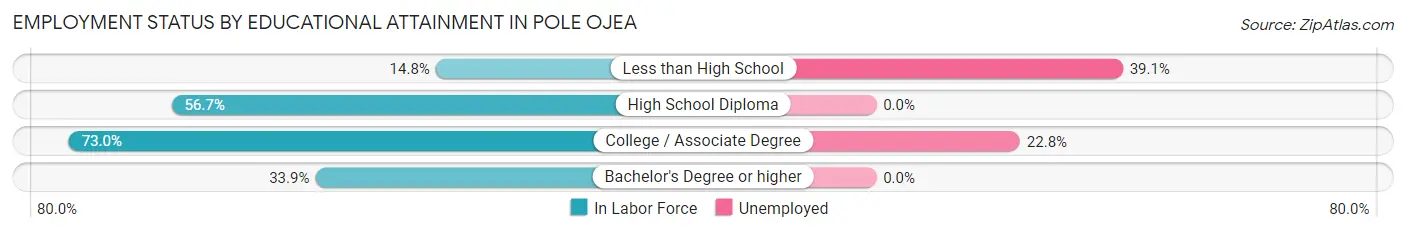
Employment Status by Educational Attainment in Pole Ojea
According to labor force statistics for Pole Ojea, 50.9% of individuals (400) out of the total population between 25 and 64 years of age (786) are in the labor force, with 10.8% or 43 of them being unemployed. The group with the highest labor force participation rate are those with the educational attainment of college / associate degree, with 73.0% or 149 individuals in the labor force. Within the labor force, individuals with less than high school education have the highest percentage of unemployment, with 39.1% or 9 of them being unemployed.
| Educational Attainment | In Labor Force | Unemployed |
| Less than High School | 23 (14.8%) | 61 (39.1%) |
| High School Diploma | 207 (56.7%) | 0 (0.0%) |
| College / Associate Degree | 149 (73.0%) | 47 (22.8%) |
| Bachelor's Degree or higher | 21 (33.9%) | 0 (0.0%) |
| Total | 400 (50.9%) | 85 (10.8%) |
Employment Occupations by Sex in Pole Ojea
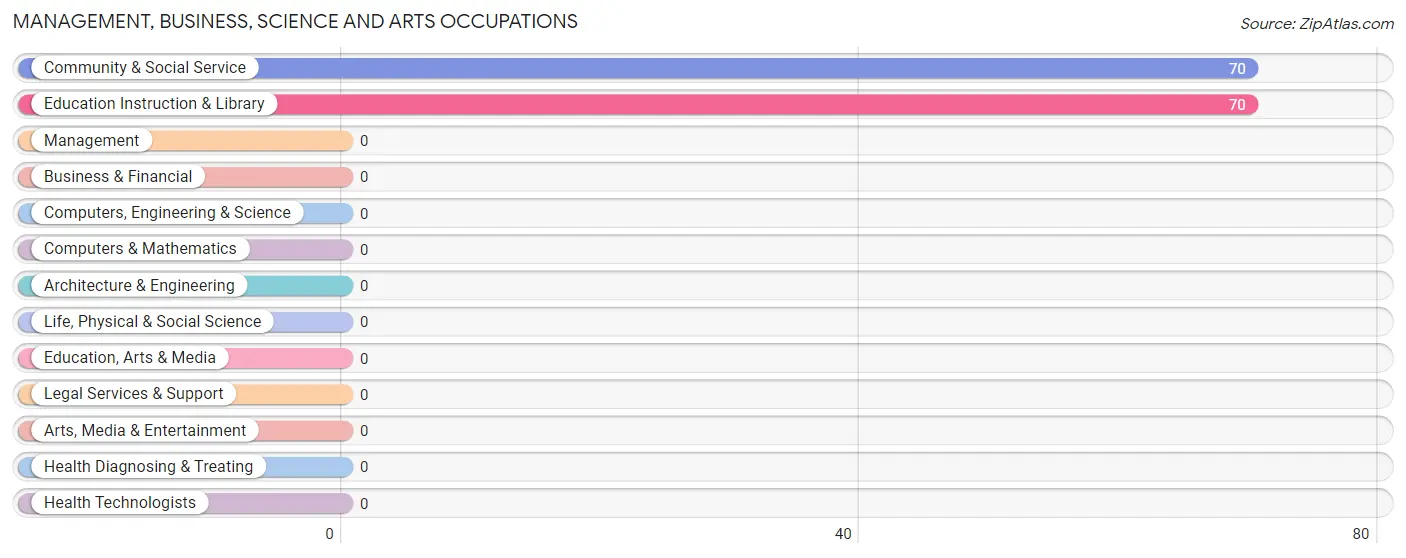
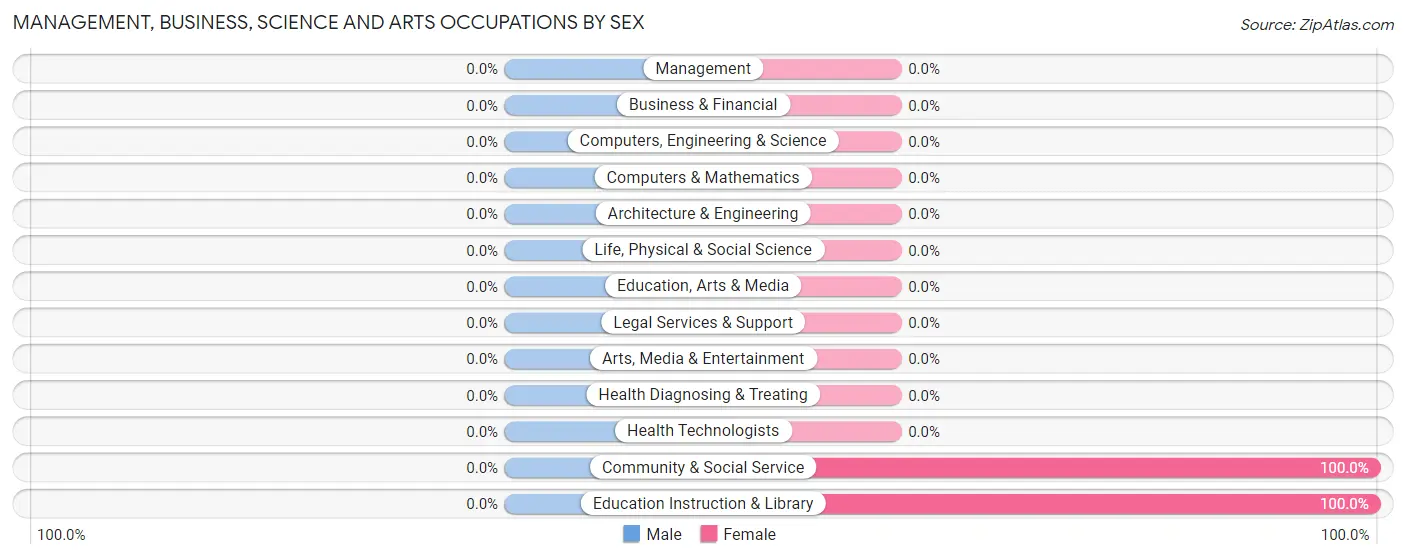
Management, Business, Science and Arts Occupations
The most common Management, Business, Science and Arts occupations in Pole Ojea are Community & Social Service (70 | 16.2%), and Education Instruction & Library (70 | 16.2%).
Management, Business, Science and Arts Occupations by Sex
| Occupation | Male | Female |
| Management | 0 (0.0%) | 0 (0.0%) |
| Business & Financial | 0 (0.0%) | 0 (0.0%) |
| Computers, Engineering & Science | 0 (0.0%) | 0 (0.0%) |
| Computers & Mathematics | 0 (0.0%) | 0 (0.0%) |
| Architecture & Engineering | 0 (0.0%) | 0 (0.0%) |
| Life, Physical & Social Science | 0 (0.0%) | 0 (0.0%) |
| Community & Social Service | 0 (0.0%) | 70 (100.0%) |
| Education, Arts & Media | 0 (0.0%) | 0 (0.0%) |
| Legal Services & Support | 0 (0.0%) | 0 (0.0%) |
| Education Instruction & Library | 0 (0.0%) | 70 (100.0%) |
| Arts, Media & Entertainment | 0 (0.0%) | 0 (0.0%) |
| Health Diagnosing & Treating | 0 (0.0%) | 0 (0.0%) |
| Health Technologists | 0 (0.0%) | 0 (0.0%) |
| Total (Category) | 0 (0.0%) | 70 (100.0%) |
| Total (Overall) | 128 (29.7%) | 303 (70.3%) |
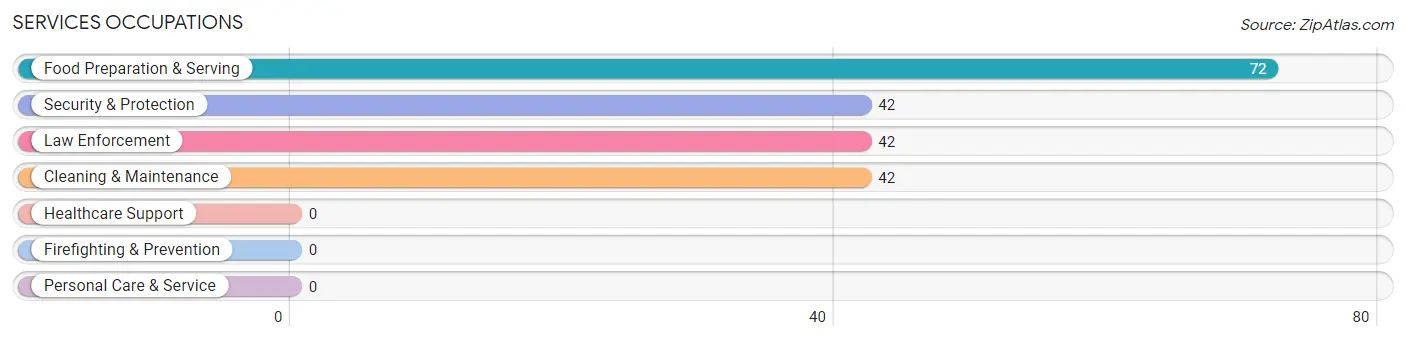
Services Occupations
The most common Services occupations in Pole Ojea are Food Preparation & Serving (72 | 16.7%), Security & Protection (42 | 9.7%), Law Enforcement (42 | 9.7%), and Cleaning & Maintenance (42 | 9.7%).
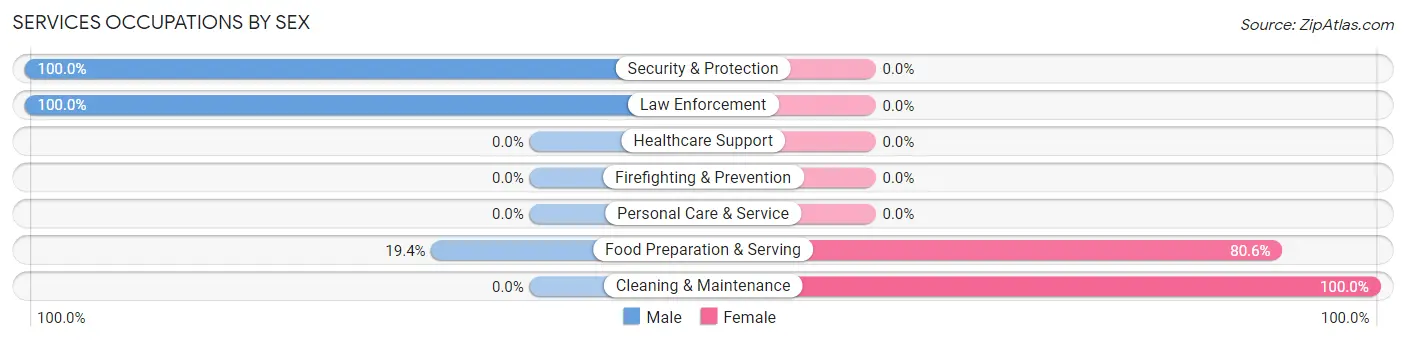
Services Occupations by Sex
Within the Services occupations in Pole Ojea, the most male-oriented occupations are Security & Protection (100.0%), Law Enforcement (100.0%), and Food Preparation & Serving (19.4%), while the most female-oriented occupations are Cleaning & Maintenance (100.0%), and Food Preparation & Serving (80.6%).
| Occupation | Male | Female |
| Healthcare Support | 0 (0.0%) | 0 (0.0%) |
| Security & Protection | 42 (100.0%) | 0 (0.0%) |
| Firefighting & Prevention | 0 (0.0%) | 0 (0.0%) |
| Law Enforcement | 42 (100.0%) | 0 (0.0%) |
| Food Preparation & Serving | 14 (19.4%) | 58 (80.6%) |
| Cleaning & Maintenance | 0 (0.0%) | 42 (100.0%) |
| Personal Care & Service | 0 (0.0%) | 0 (0.0%) |
| Total (Category) | 56 (35.9%) | 100 (64.1%) |
| Total (Overall) | 128 (29.7%) | 303 (70.3%) |
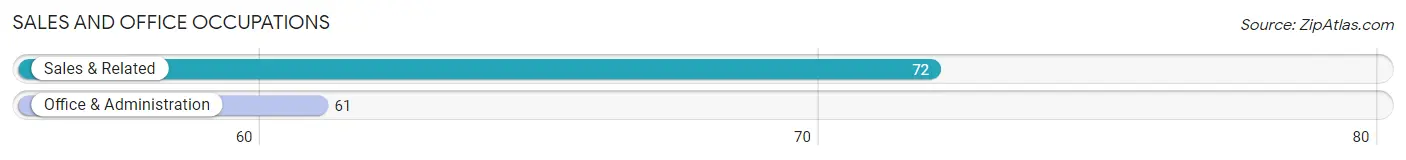
Sales and Office Occupations
The most common Sales and Office occupations in Pole Ojea are Sales & Related (72 | 16.7%), and Office & Administration (61 | 14.1%).
Sales and Office Occupations by Sex
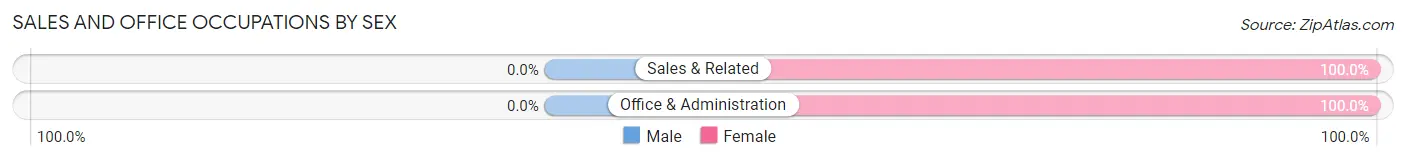
| Occupation | Male | Female |
| Sales & Related | 0 (0.0%) | 72 (100.0%) |
| Office & Administration | 0 (0.0%) | 61 (100.0%) |
| Total (Category) | 0 (0.0%) | 133 (100.0%) |
| Total (Overall) | 128 (29.7%) | 303 (70.3%) |
Natural Resources, Construction and Maintenance Occupations
The most common Natural Resources, Construction and Maintenance occupations in Pole Ojea are Construction & Extraction (19 | 4.4%), and Farming, Fishing & Forestry (14 | 3.3%).
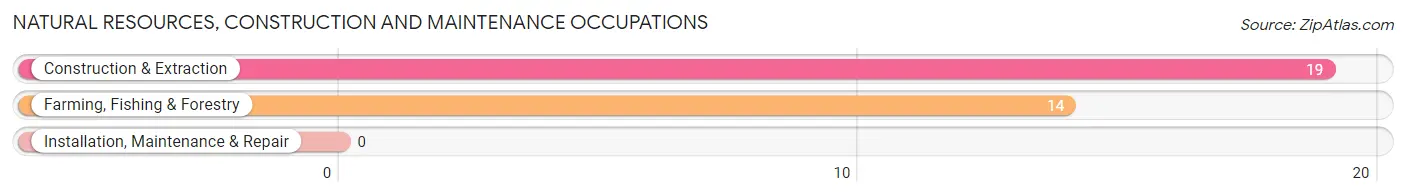
Natural Resources, Construction and Maintenance Occupations by Sex
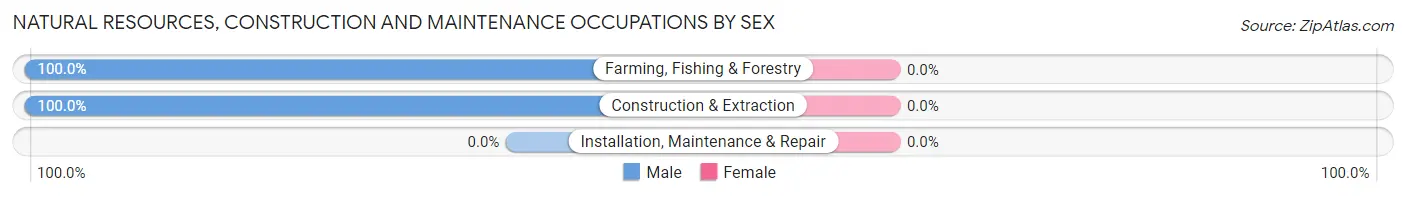
| Occupation | Male | Female |
| Farming, Fishing & Forestry | 14 (100.0%) | 0 (0.0%) |
| Construction & Extraction | 19 (100.0%) | 0 (0.0%) |
| Installation, Maintenance & Repair | 0 (0.0%) | 0 (0.0%) |
| Total (Category) | 33 (100.0%) | 0 (0.0%) |
| Total (Overall) | 128 (29.7%) | 303 (70.3%) |
Production, Transportation and Moving Occupations
The most common Production, Transportation and Moving occupations in Pole Ojea are , and Material Moving (39 | 9.0%).
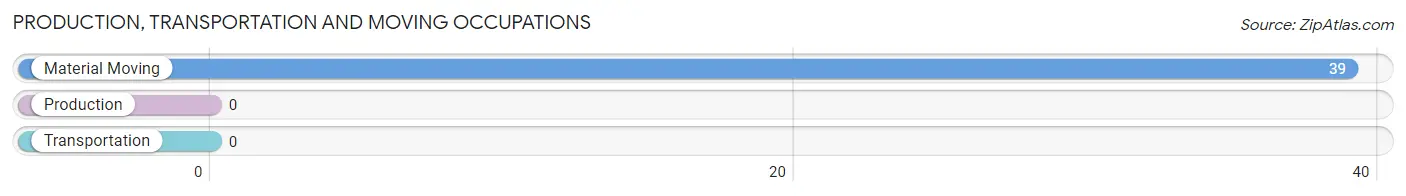
Production, Transportation and Moving Occupations by Sex
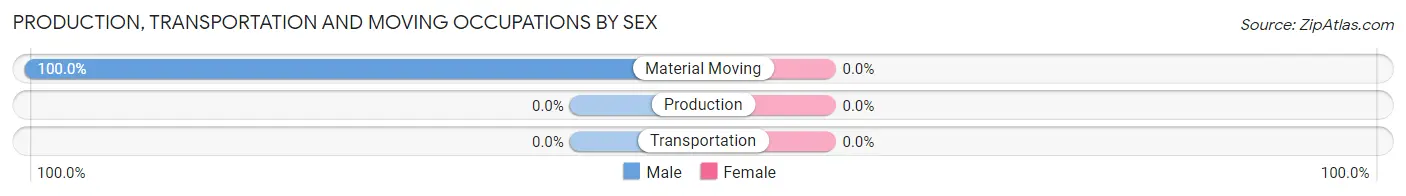
| Occupation | Male | Female |
| Production | 0 (0.0%) | 0 (0.0%) |
| Transportation | 0 (0.0%) | 0 (0.0%) |
| Material Moving | 39 (100.0%) | 0 (0.0%) |
| Total (Category) | 39 (100.0%) | 0 (0.0%) |
| Total (Overall) | 128 (29.7%) | 303 (70.3%) |
Employment Industries by Sex in Pole Ojea
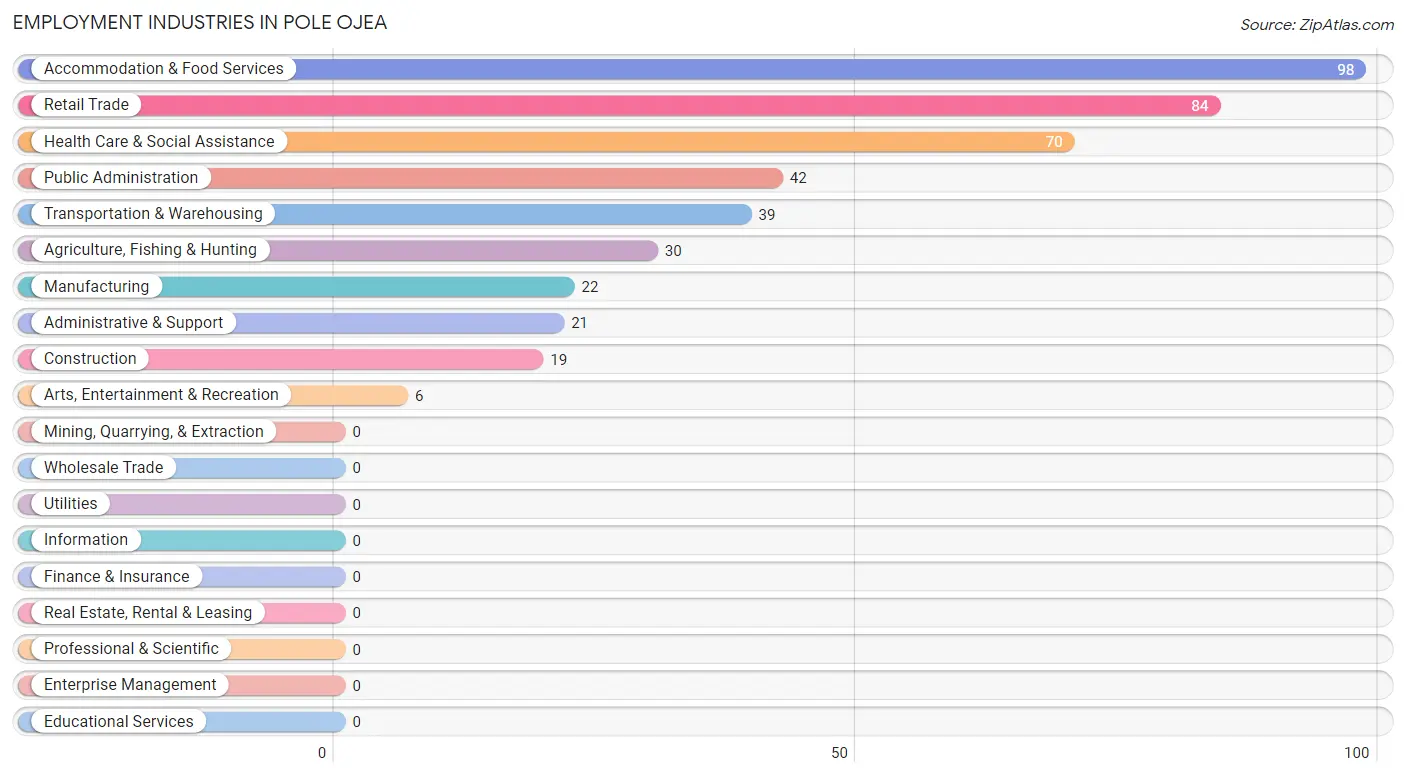
Employment Industries in Pole Ojea
The major employment industries in Pole Ojea include Accommodation & Food Services (98 | 22.7%), Retail Trade (84 | 19.5%), Health Care & Social Assistance (70 | 16.2%), Public Administration (42 | 9.7%), and Transportation & Warehousing (39 | 9.0%).
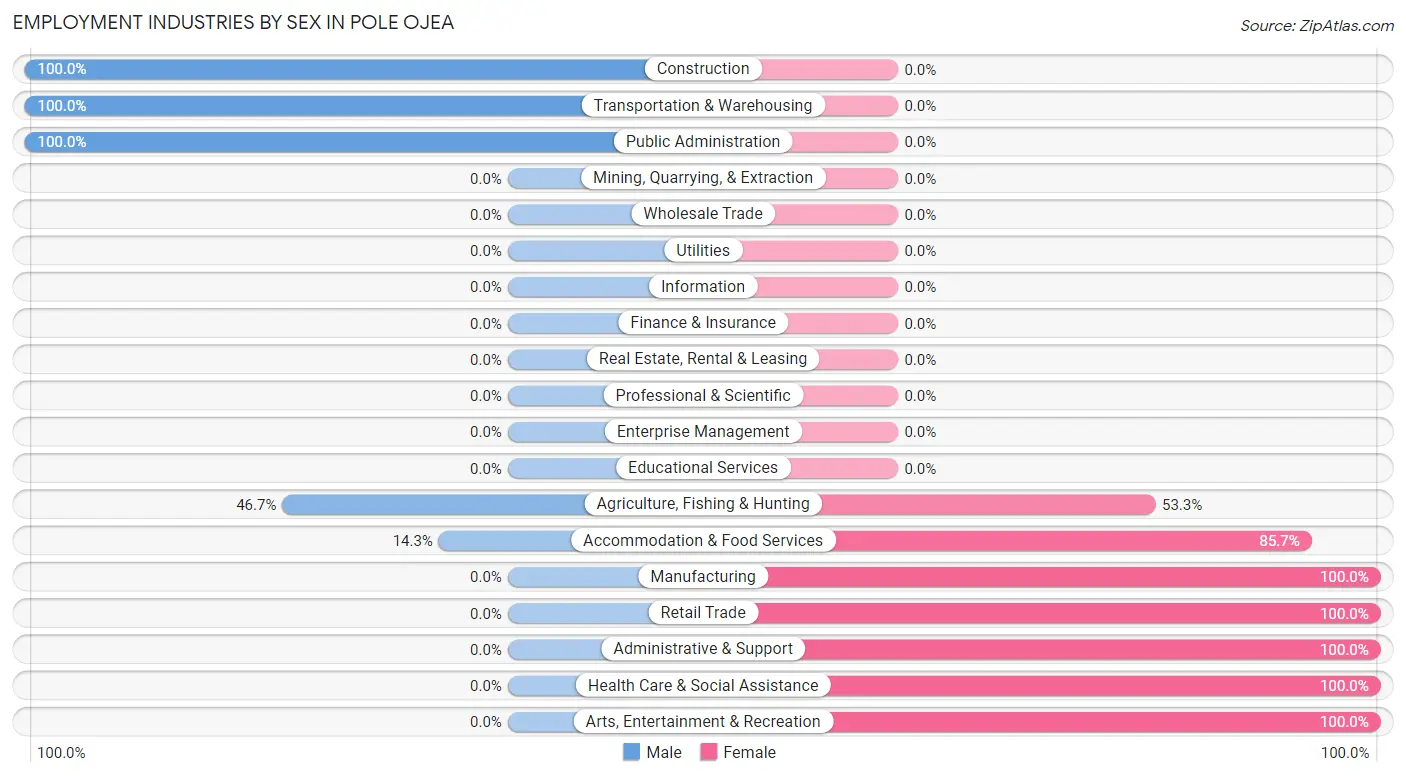
Employment Industries by Sex in Pole Ojea
The Pole Ojea industries that see more men than women are Construction (100.0%), Transportation & Warehousing (100.0%), and Public Administration (100.0%), whereas the industries that tend to have a higher number of women are Manufacturing (100.0%), Retail Trade (100.0%), and Administrative & Support (100.0%).
| Industry | Male | Female |
| Agriculture, Fishing & Hunting | 14 (46.7%) | 16 (53.3%) |
| Mining, Quarrying, & Extraction | 0 (0.0%) | 0 (0.0%) |
| Construction | 19 (100.0%) | 0 (0.0%) |
| Manufacturing | 0 (0.0%) | 22 (100.0%) |
| Wholesale Trade | 0 (0.0%) | 0 (0.0%) |
| Retail Trade | 0 (0.0%) | 84 (100.0%) |
| Transportation & Warehousing | 39 (100.0%) | 0 (0.0%) |
| Utilities | 0 (0.0%) | 0 (0.0%) |
| Information | 0 (0.0%) | 0 (0.0%) |
| Finance & Insurance | 0 (0.0%) | 0 (0.0%) |
| Real Estate, Rental & Leasing | 0 (0.0%) | 0 (0.0%) |
| Professional & Scientific | 0 (0.0%) | 0 (0.0%) |
| Enterprise Management | 0 (0.0%) | 0 (0.0%) |
| Administrative & Support | 0 (0.0%) | 21 (100.0%) |
| Educational Services | 0 (0.0%) | 0 (0.0%) |
| Health Care & Social Assistance | 0 (0.0%) | 70 (100.0%) |
| Arts, Entertainment & Recreation | 0 (0.0%) | 6 (100.0%) |
| Accommodation & Food Services | 14 (14.3%) | 84 (85.7%) |
| Public Administration | 42 (100.0%) | 0 (0.0%) |
| Total | 128 (29.7%) | 303 (70.3%) |
Education in Pole Ojea
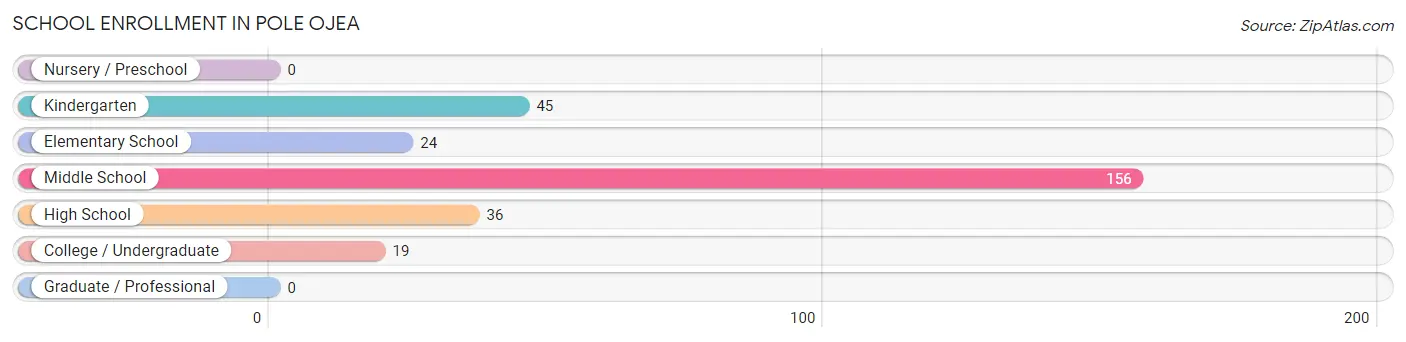
School Enrollment in Pole Ojea
The most common levels of schooling among the 280 students in Pole Ojea are middle school (156 | 55.7%), kindergarten (45 | 16.1%), and high school (36 | 12.9%).
| School Level | # Students | % Students |
| Nursery / Preschool | 0 | 0.0% |
| Kindergarten | 45 | 16.1% |
| Elementary School | 24 | 8.6% |
| Middle School | 156 | 55.7% |
| High School | 36 | 12.9% |
| College / Undergraduate | 19 | 6.8% |
| Graduate / Professional | 0 | 0.0% |
| Total | 280 | 100.0% |
School Enrollment by Age by Funding Source in Pole Ojea
Out of a total of 280 students who are enrolled in schools in Pole Ojea, 19 (6.8%) attend a private institution, while the remaining 261 (93.2%) are enrolled in public schools. The age group of 18 to 19 year olds has the highest likelihood of being enrolled in private schools, with 19 (100.0% in the age bracket) enrolled. Conversely, the age group of 3 to 4 year olds has the lowest likelihood of being enrolled in a private school, with 45 (100.0% in the age bracket) attending a public institution.
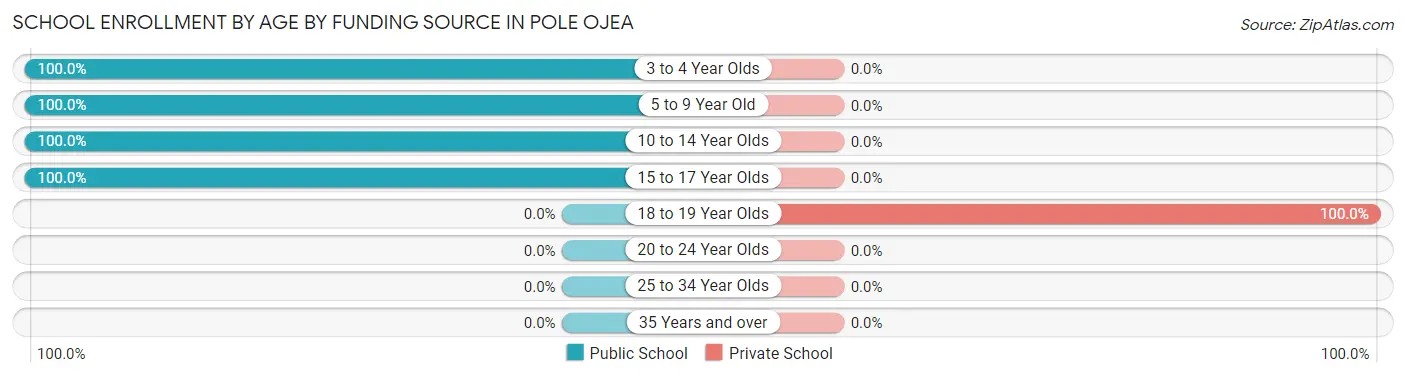
| Age Bracket | Public School | Private School |
| 3 to 4 Year Olds | 45 (100.0%) | 0 (0.0%) |
| 5 to 9 Year Old | 24 (100.0%) | 0 (0.0%) |
| 10 to 14 Year Olds | 170 (100.0%) | 0 (0.0%) |
| 15 to 17 Year Olds | 22 (100.0%) | 0 (0.0%) |
| 18 to 19 Year Olds | 0 (0.0%) | 19 (100.0%) |
| 20 to 24 Year Olds | 0 (0.0%) | 0 (0.0%) |
| 25 to 34 Year Olds | 0 (0.0%) | 0 (0.0%) |
| 35 Years and over | 0 (0.0%) | 0 (0.0%) |
| Total | 261 (93.2%) | 19 (6.8%) |
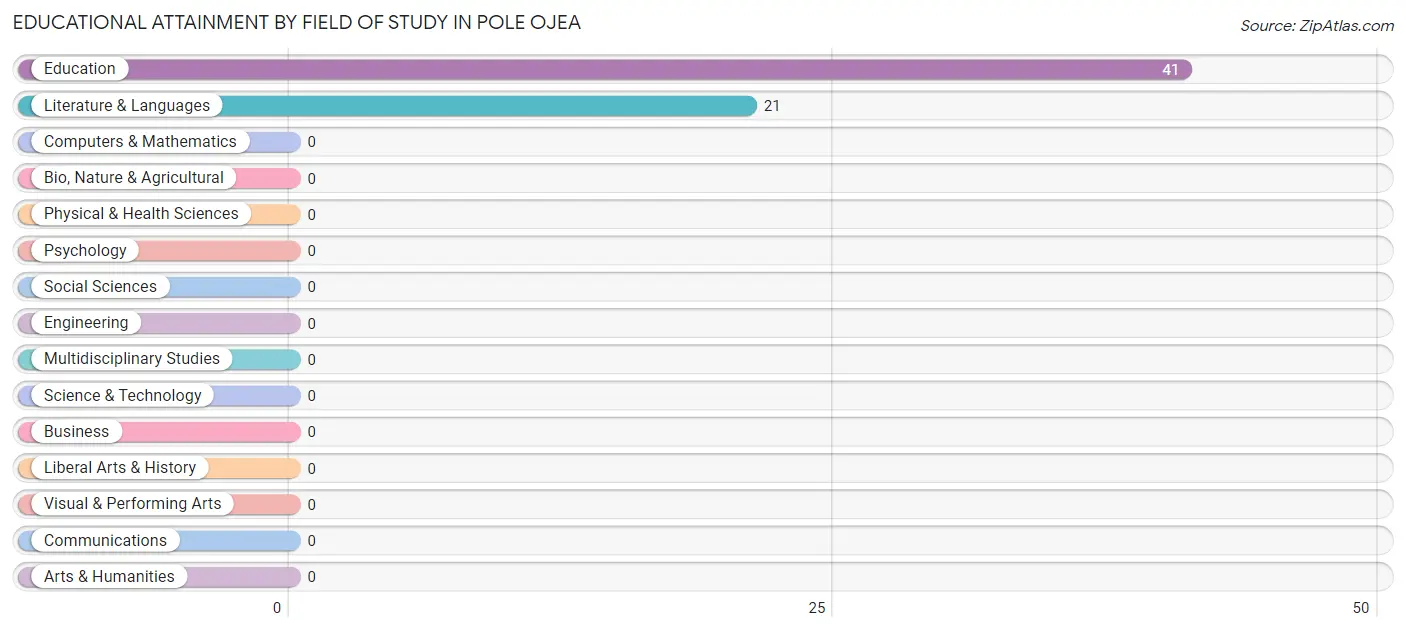
Educational Attainment by Field of Study in Pole Ojea
Education (41 | 66.1%), and literature & languages (21 | 33.9%) are the most common fields of study among 62 individuals in Pole Ojea who have obtained a bachelor's degree or higher.
| Field of Study | # Graduates | % Graduates |
| Computers & Mathematics | 0 | 0.0% |
| Bio, Nature & Agricultural | 0 | 0.0% |
| Physical & Health Sciences | 0 | 0.0% |
| Psychology | 0 | 0.0% |
| Social Sciences | 0 | 0.0% |
| Engineering | 0 | 0.0% |
| Multidisciplinary Studies | 0 | 0.0% |
| Science & Technology | 0 | 0.0% |
| Business | 0 | 0.0% |
| Education | 41 | 66.1% |
| Literature & Languages | 21 | 33.9% |
| Liberal Arts & History | 0 | 0.0% |
| Visual & Performing Arts | 0 | 0.0% |
| Communications | 0 | 0.0% |
| Arts & Humanities | 0 | 0.0% |
| Total | 62 | 100.0% |
Transportation & Commute in Pole Ojea
Vehicle Availability by Sex in Pole Ojea
The most prevalent vehicle ownership categories in Pole Ojea are males with 2 vehicles (89, accounting for 69.5%) and females with 2 vehicles (150, making up 30.6%).
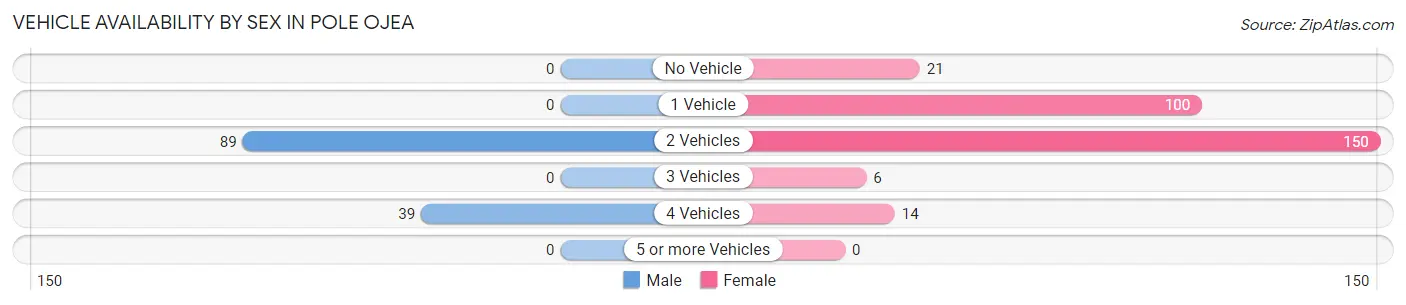
| Vehicles Available | Male | Female |
| No Vehicle | 0 (0.0%) | 21 (7.2%) |
| 1 Vehicle | 0 (0.0%) | 100 (34.4%) |
| 2 Vehicles | 89 (69.5%) | 150 (51.5%) |
| 3 Vehicles | 0 (0.0%) | 6 (2.1%) |
| 4 Vehicles | 39 (30.5%) | 14 (4.8%) |
| 5 or more Vehicles | 0 (0.0%) | 0 (0.0%) |
| Total | 128 (100.0%) | 291 (100.0%) |
Commute Time in Pole Ojea
The most frequently occuring commute durations in Pole Ojea are 20 to 24 minutes (110 commuters, 26.3%), 30 to 34 minutes (93 commuters, 22.2%), and 60 to 89 minutes (88 commuters, 21.0%).
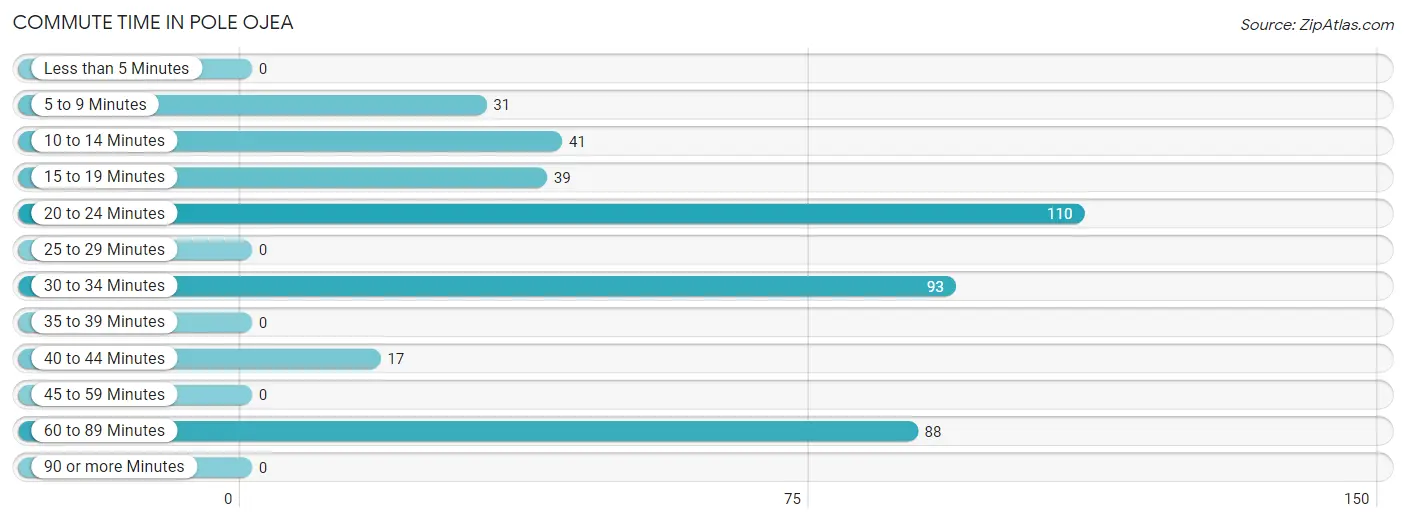
| Commute Time | # Commuters | % Commuters |
| Less than 5 Minutes | 0 | 0.0% |
| 5 to 9 Minutes | 31 | 7.4% |
| 10 to 14 Minutes | 41 | 9.8% |
| 15 to 19 Minutes | 39 | 9.3% |
| 20 to 24 Minutes | 110 | 26.3% |
| 25 to 29 Minutes | 0 | 0.0% |
| 30 to 34 Minutes | 93 | 22.2% |
| 35 to 39 Minutes | 0 | 0.0% |
| 40 to 44 Minutes | 17 | 4.1% |
| 45 to 59 Minutes | 0 | 0.0% |
| 60 to 89 Minutes | 88 | 21.0% |
| 90 or more Minutes | 0 | 0.0% |
Commute Time by Sex in Pole Ojea
The most common commute times in Pole Ojea are 15 to 19 minutes (39 commuters, 30.5%) for males and 20 to 24 minutes (91 commuters, 31.3%) for females.
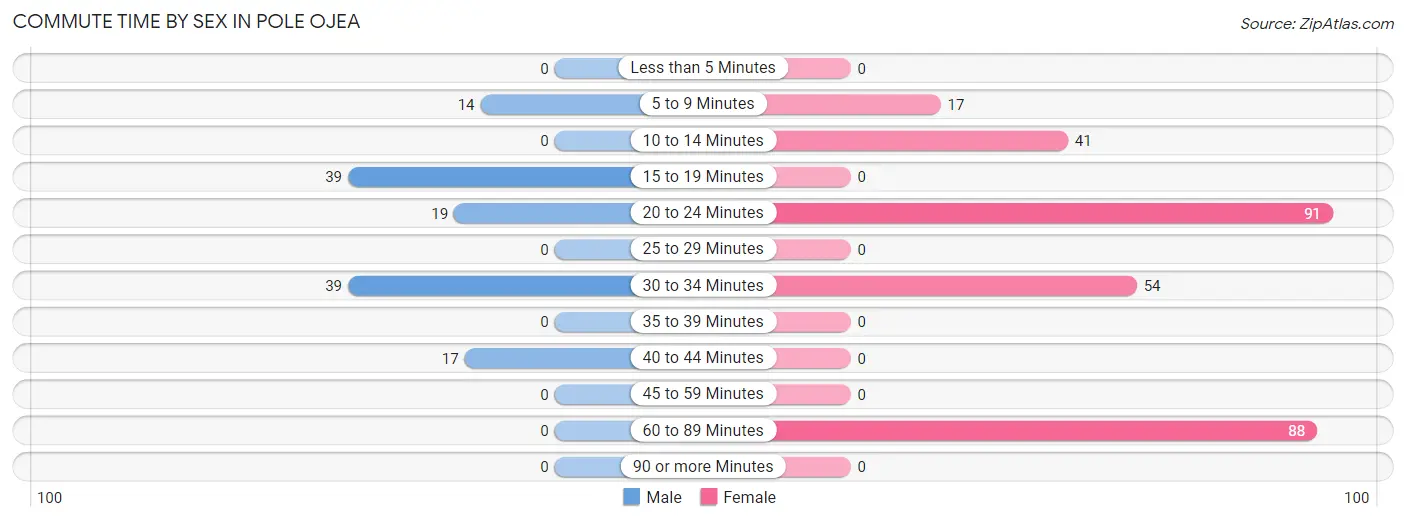
| Commute Time | Male | Female |
| Less than 5 Minutes | 0 (0.0%) | 0 (0.0%) |
| 5 to 9 Minutes | 14 (10.9%) | 17 (5.8%) |
| 10 to 14 Minutes | 0 (0.0%) | 41 (14.1%) |
| 15 to 19 Minutes | 39 (30.5%) | 0 (0.0%) |
| 20 to 24 Minutes | 19 (14.8%) | 91 (31.3%) |
| 25 to 29 Minutes | 0 (0.0%) | 0 (0.0%) |
| 30 to 34 Minutes | 39 (30.5%) | 54 (18.6%) |
| 35 to 39 Minutes | 0 (0.0%) | 0 (0.0%) |
| 40 to 44 Minutes | 17 (13.3%) | 0 (0.0%) |
| 45 to 59 Minutes | 0 (0.0%) | 0 (0.0%) |
| 60 to 89 Minutes | 0 (0.0%) | 88 (30.2%) |
| 90 or more Minutes | 0 (0.0%) | 0 (0.0%) |
Time of Departure to Work by Sex in Pole Ojea
The most frequent times of departure to work in Pole Ojea are 6:30 AM to 6:59 AM (64, 50.0%) for males and 7:00 AM to 7:29 AM (160, 55.0%) for females.
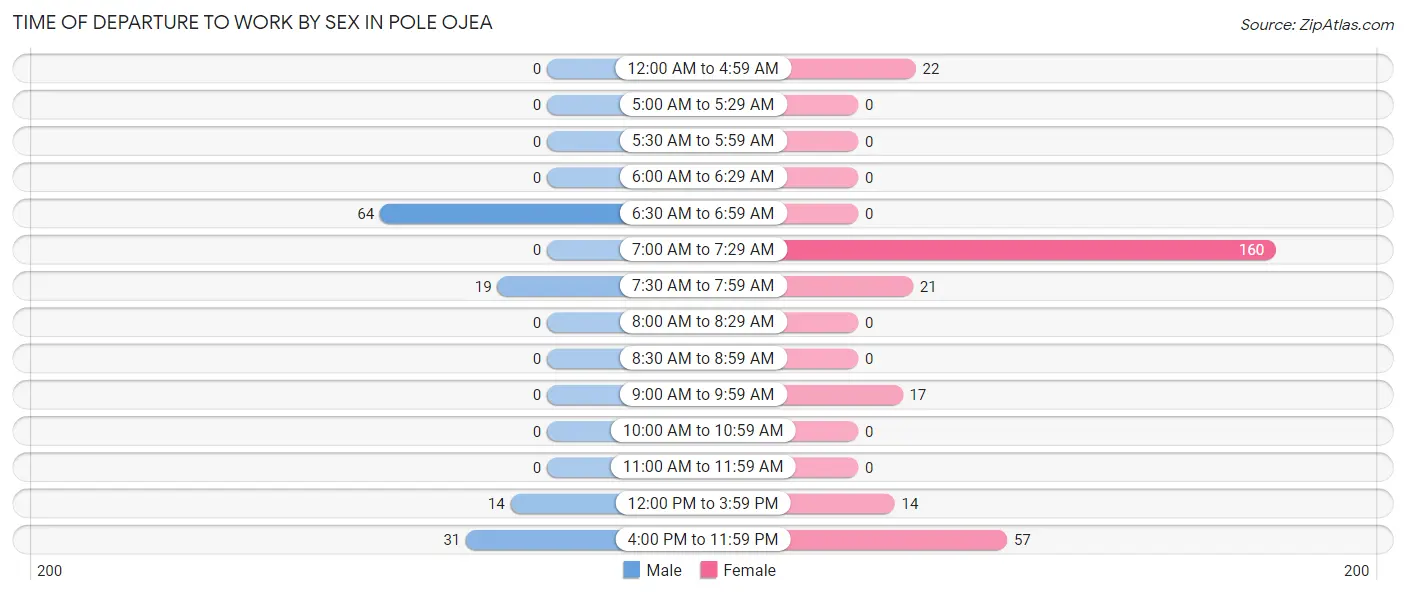
| Time of Departure | Male | Female |
| 12:00 AM to 4:59 AM | 0 (0.0%) | 22 (7.6%) |
| 5:00 AM to 5:29 AM | 0 (0.0%) | 0 (0.0%) |
| 5:30 AM to 5:59 AM | 0 (0.0%) | 0 (0.0%) |
| 6:00 AM to 6:29 AM | 0 (0.0%) | 0 (0.0%) |
| 6:30 AM to 6:59 AM | 64 (50.0%) | 0 (0.0%) |
| 7:00 AM to 7:29 AM | 0 (0.0%) | 160 (55.0%) |
| 7:30 AM to 7:59 AM | 19 (14.8%) | 21 (7.2%) |
| 8:00 AM to 8:29 AM | 0 (0.0%) | 0 (0.0%) |
| 8:30 AM to 8:59 AM | 0 (0.0%) | 0 (0.0%) |
| 9:00 AM to 9:59 AM | 0 (0.0%) | 17 (5.8%) |
| 10:00 AM to 10:59 AM | 0 (0.0%) | 0 (0.0%) |
| 11:00 AM to 11:59 AM | 0 (0.0%) | 0 (0.0%) |
| 12:00 PM to 3:59 PM | 14 (10.9%) | 14 (4.8%) |
| 4:00 PM to 11:59 PM | 31 (24.2%) | 57 (19.6%) |
| Total | 128 (100.0%) | 291 (100.0%) |
Housing Occupancy in Pole Ojea
Occupancy by Ownership in Pole Ojea
Of the total 587 dwellings in Pole Ojea, owner-occupied units account for 446 (76.0%), while renter-occupied units make up 141 (24.0%).
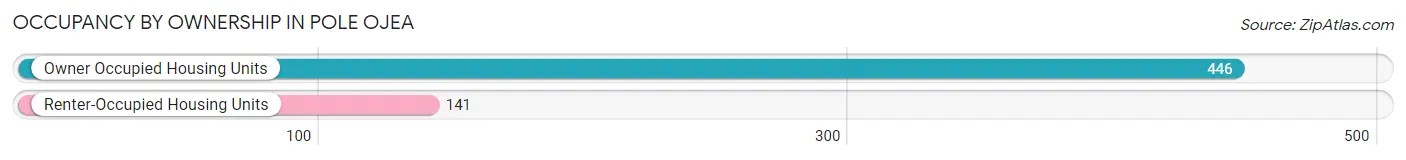
| Occupancy | # Housing Units | % Housing Units |
| Owner Occupied Housing Units | 446 | 76.0% |
| Renter-Occupied Housing Units | 141 | 24.0% |
| Total Occupied Housing Units | 587 | 100.0% |
Occupancy by Household Size in Pole Ojea
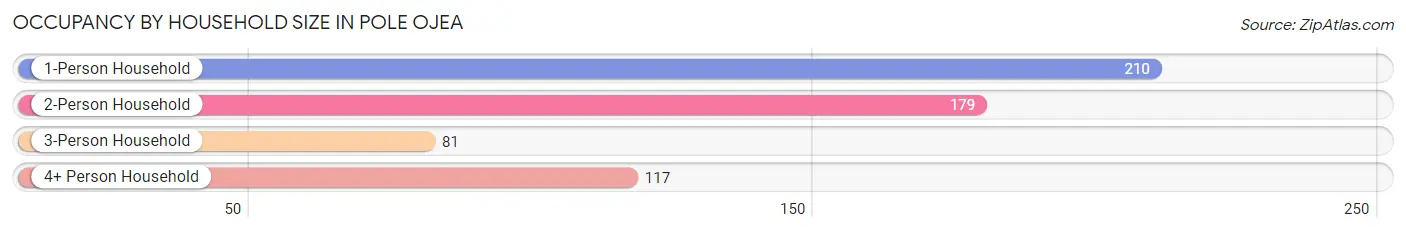
| Household Size | # Housing Units | % Housing Units |
| 1-Person Household | 210 | 35.8% |
| 2-Person Household | 179 | 30.5% |
| 3-Person Household | 81 | 13.8% |
| 4+ Person Household | 117 | 19.9% |
| Total Housing Units | 587 | 100.0% |
Occupancy by Ownership by Household Size in Pole Ojea
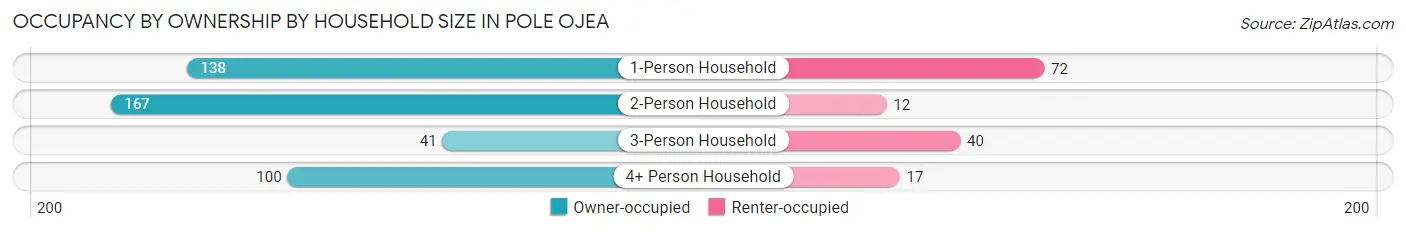
| Household Size | Owner-occupied | Renter-occupied |
| 1-Person Household | 138 (65.7%) | 72 (34.3%) |
| 2-Person Household | 167 (93.3%) | 12 (6.7%) |
| 3-Person Household | 41 (50.6%) | 40 (49.4%) |
| 4+ Person Household | 100 (85.5%) | 17 (14.5%) |
| Total Housing Units | 446 (76.0%) | 141 (24.0%) |
Occupancy by Educational Attainment in Pole Ojea
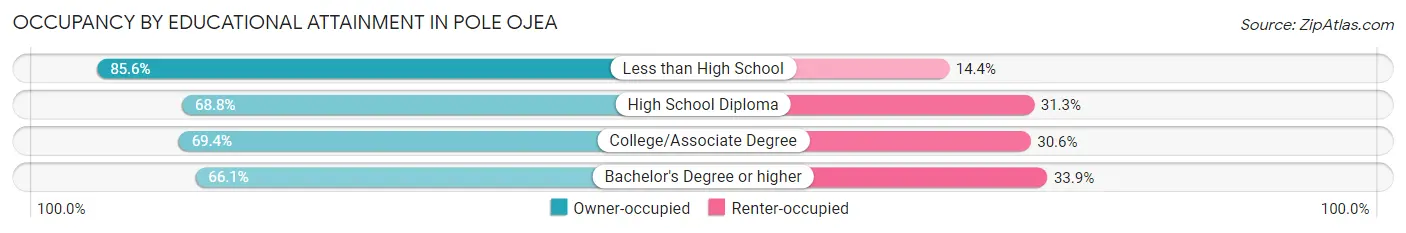
| Household Size | Owner-occupied | Renter-occupied |
| Less than High School | 220 (85.6%) | 37 (14.4%) |
| High School Diploma | 110 (68.8%) | 50 (31.2%) |
| College/Associate Degree | 75 (69.4%) | 33 (30.6%) |
| Bachelor's Degree or higher | 41 (66.1%) | 21 (33.9%) |
Occupancy by Age of Householder in Pole Ojea
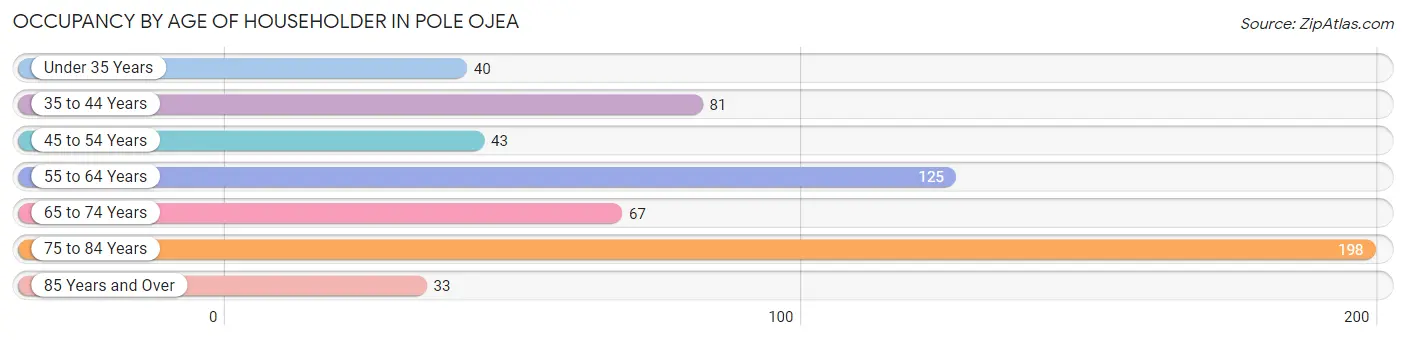
| Age Bracket | # Households | % Households |
| Under 35 Years | 40 | 6.8% |
| 35 to 44 Years | 81 | 13.8% |
| 45 to 54 Years | 43 | 7.3% |
| 55 to 64 Years | 125 | 21.3% |
| 65 to 74 Years | 67 | 11.4% |
| 75 to 84 Years | 198 | 33.7% |
| 85 Years and Over | 33 | 5.6% |
| Total | 587 | 100.0% |
Housing Finances in Pole Ojea
Median Income by Occupancy in Pole Ojea
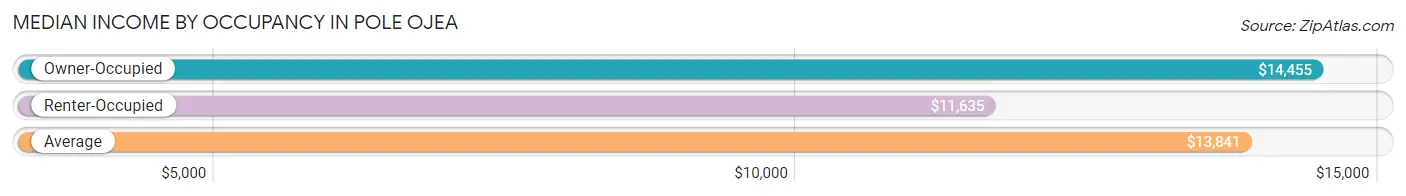
| Occupancy Type | # Households | Median Income |
| Owner-Occupied | 446 (76.0%) | $14,455 |
| Renter-Occupied | 141 (24.0%) | $11,635 |
| Average | 587 (100.0%) | $13,841 |
Occupancy by Householder Income Bracket in Pole Ojea
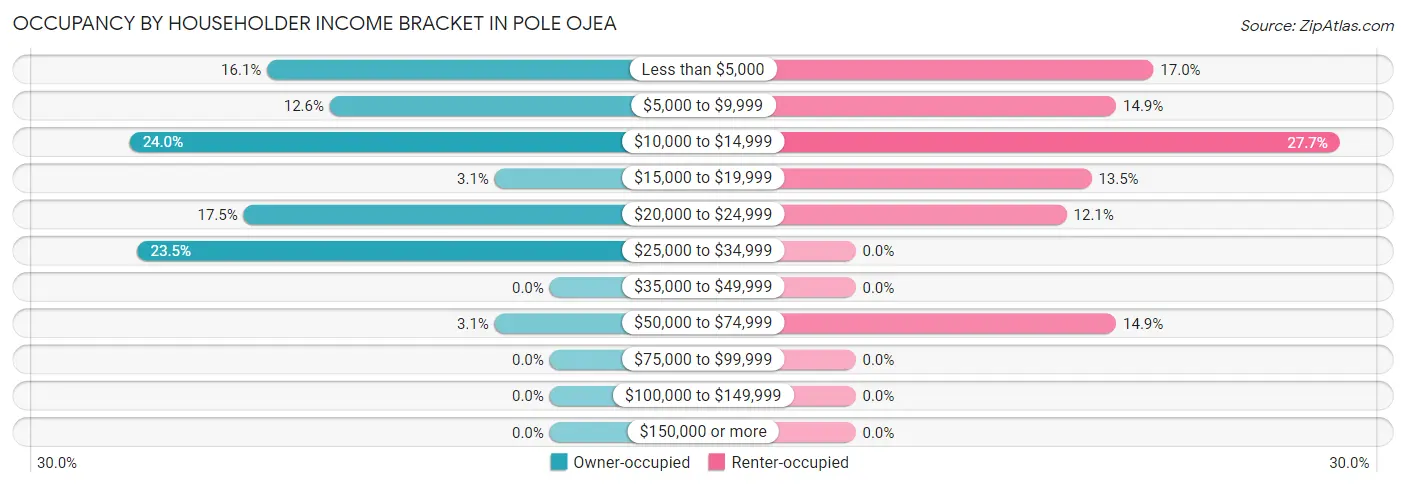
| Income Bracket | Owner-occupied | Renter-occupied |
| Less than $5,000 | 72 (16.1%) | 24 (17.0%) |
| $5,000 to $9,999 | 56 (12.6%) | 21 (14.9%) |
| $10,000 to $14,999 | 107 (24.0%) | 39 (27.7%) |
| $15,000 to $19,999 | 14 (3.1%) | 19 (13.5%) |
| $20,000 to $24,999 | 78 (17.5%) | 17 (12.1%) |
| $25,000 to $34,999 | 105 (23.5%) | 0 (0.0%) |
| $35,000 to $49,999 | 0 (0.0%) | 0 (0.0%) |
| $50,000 to $74,999 | 14 (3.1%) | 21 (14.9%) |
| $75,000 to $99,999 | 0 (0.0%) | 0 (0.0%) |
| $100,000 to $149,999 | 0 (0.0%) | 0 (0.0%) |
| $150,000 or more | 0 (0.0%) | 0 (0.0%) |
| Total | 446 (100.0%) | 141 (100.0%) |
Monthly Housing Cost Tiers in Pole Ojea
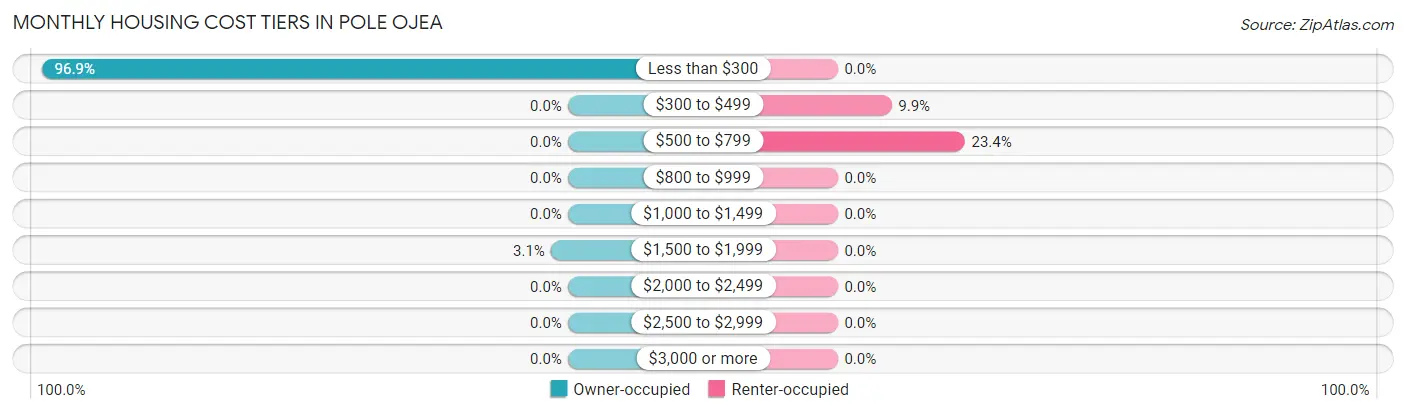
| Monthly Cost | Owner-occupied | Renter-occupied |
| Less than $300 | 432 (96.9%) | 0 (0.0%) |
| $300 to $499 | 0 (0.0%) | 14 (9.9%) |
| $500 to $799 | 0 (0.0%) | 33 (23.4%) |
| $800 to $999 | 0 (0.0%) | 0 (0.0%) |
| $1,000 to $1,499 | 0 (0.0%) | 0 (0.0%) |
| $1,500 to $1,999 | 14 (3.1%) | 0 (0.0%) |
| $2,000 to $2,499 | 0 (0.0%) | 0 (0.0%) |
| $2,500 to $2,999 | 0 (0.0%) | 0 (0.0%) |
| $3,000 or more | 0 (0.0%) | 0 (0.0%) |
| Total | 446 (100.0%) | 141 (100.0%) |
Physical Housing Characteristics in Pole Ojea
Housing Structures in Pole Ojea
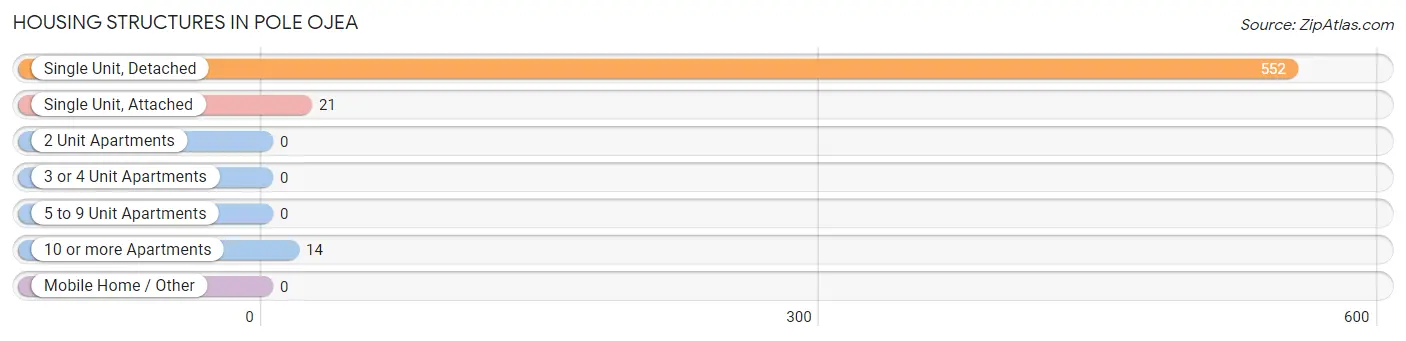
| Structure Type | # Housing Units | % Housing Units |
| Single Unit, Detached | 552 | 94.0% |
| Single Unit, Attached | 21 | 3.6% |
| 2 Unit Apartments | 0 | 0.0% |
| 3 or 4 Unit Apartments | 0 | 0.0% |
| 5 to 9 Unit Apartments | 0 | 0.0% |
| 10 or more Apartments | 14 | 2.4% |
| Mobile Home / Other | 0 | 0.0% |
| Total | 587 | 100.0% |
Housing Structures by Occupancy in Pole Ojea
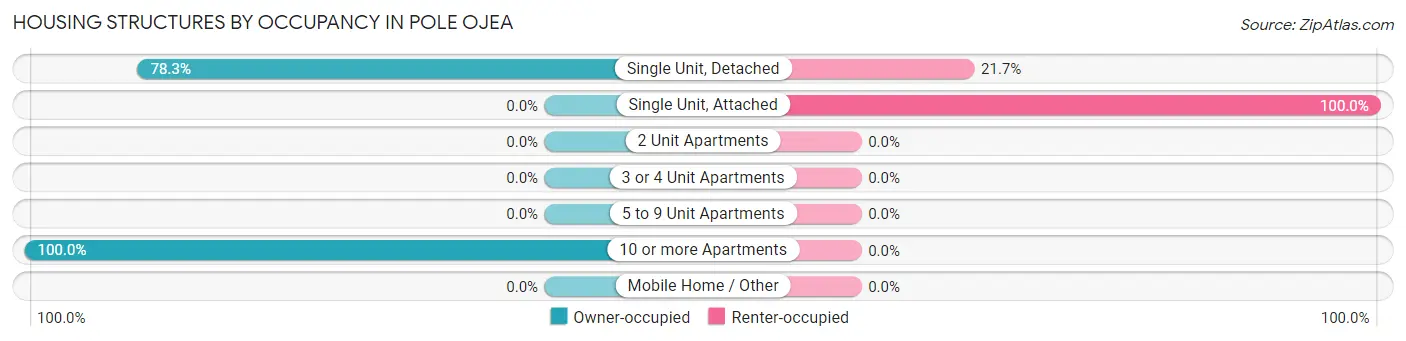
| Structure Type | Owner-occupied | Renter-occupied |
| Single Unit, Detached | 432 (78.3%) | 120 (21.7%) |
| Single Unit, Attached | 0 (0.0%) | 21 (100.0%) |
| 2 Unit Apartments | 0 (0.0%) | 0 (0.0%) |
| 3 or 4 Unit Apartments | 0 (0.0%) | 0 (0.0%) |
| 5 to 9 Unit Apartments | 0 (0.0%) | 0 (0.0%) |
| 10 or more Apartments | 14 (100.0%) | 0 (0.0%) |
| Mobile Home / Other | 0 (0.0%) | 0 (0.0%) |
| Total | 446 (76.0%) | 141 (24.0%) |
Housing Structures by Number of Rooms in Pole Ojea
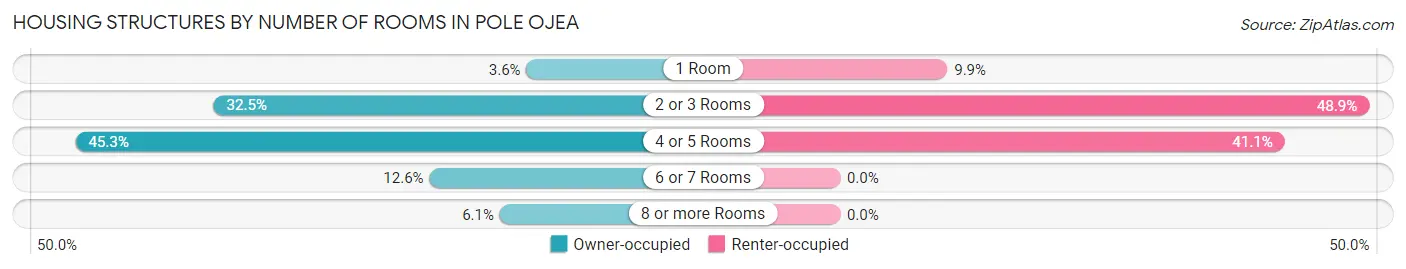
| Number of Rooms | Owner-occupied | Renter-occupied |
| 1 Room | 16 (3.6%) | 14 (9.9%) |
| 2 or 3 Rooms | 145 (32.5%) | 69 (48.9%) |
| 4 or 5 Rooms | 202 (45.3%) | 58 (41.1%) |
| 6 or 7 Rooms | 56 (12.6%) | 0 (0.0%) |
| 8 or more Rooms | 27 (6.0%) | 0 (0.0%) |
| Total | 446 (100.0%) | 141 (100.0%) |
Housing Structure by Heating Type in Pole Ojea
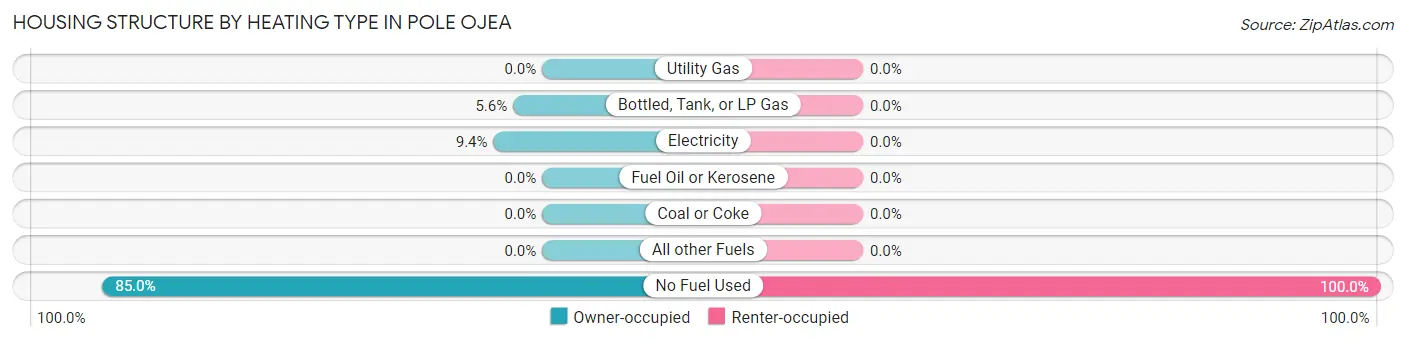
| Heating Type | Owner-occupied | Renter-occupied |
| Utility Gas | 0 (0.0%) | 0 (0.0%) |
| Bottled, Tank, or LP Gas | 25 (5.6%) | 0 (0.0%) |
| Electricity | 42 (9.4%) | 0 (0.0%) |
| Fuel Oil or Kerosene | 0 (0.0%) | 0 (0.0%) |
| Coal or Coke | 0 (0.0%) | 0 (0.0%) |
| All other Fuels | 0 (0.0%) | 0 (0.0%) |
| No Fuel Used | 379 (85.0%) | 141 (100.0%) |
| Total | 446 (100.0%) | 141 (100.0%) |
Household Vehicle Usage in Pole Ojea
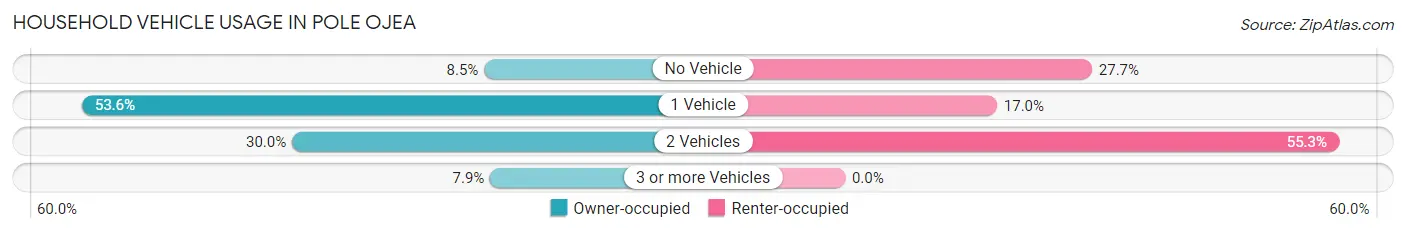
| Vehicles per Household | Owner-occupied | Renter-occupied |
| No Vehicle | 38 (8.5%) | 39 (27.7%) |
| 1 Vehicle | 239 (53.6%) | 24 (17.0%) |
| 2 Vehicles | 134 (30.0%) | 78 (55.3%) |
| 3 or more Vehicles | 35 (7.9%) | 0 (0.0%) |
| Total | 446 (100.0%) | 141 (100.0%) |
Real Estate & Mortgages in Pole Ojea
Real Estate and Mortgage Overview in Pole Ojea
| Characteristic | Without Mortgage | With Mortgage |
| Housing Units | 432 | 14 |
| Median Property Value | $70,600 | $0 |
| Median Household Income | $14,136 | $0 |
| Monthly Housing Costs | $129 | $0 |
| Real Estate Taxes | - | - |
Property Value by Mortgage Status in Pole Ojea
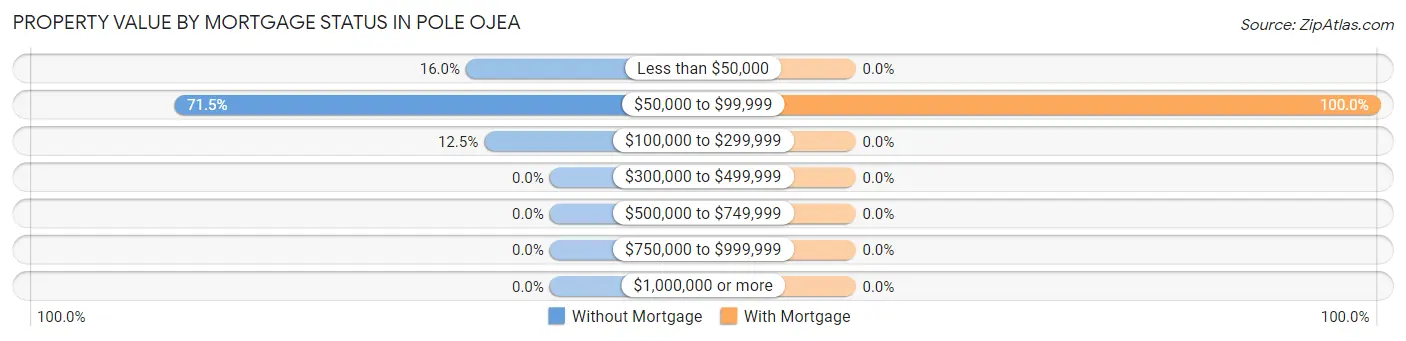
| Property Value | Without Mortgage | With Mortgage |
| Less than $50,000 | 69 (16.0%) | 0 (0.0%) |
| $50,000 to $99,999 | 309 (71.5%) | 14 (100.0%) |
| $100,000 to $299,999 | 54 (12.5%) | 0 (0.0%) |
| $300,000 to $499,999 | 0 (0.0%) | 0 (0.0%) |
| $500,000 to $749,999 | 0 (0.0%) | 0 (0.0%) |
| $750,000 to $999,999 | 0 (0.0%) | 0 (0.0%) |
| $1,000,000 or more | 0 (0.0%) | 0 (0.0%) |
| Total | 432 (100.0%) | 14 (100.0%) |
Household Income by Mortgage Status in Pole Ojea
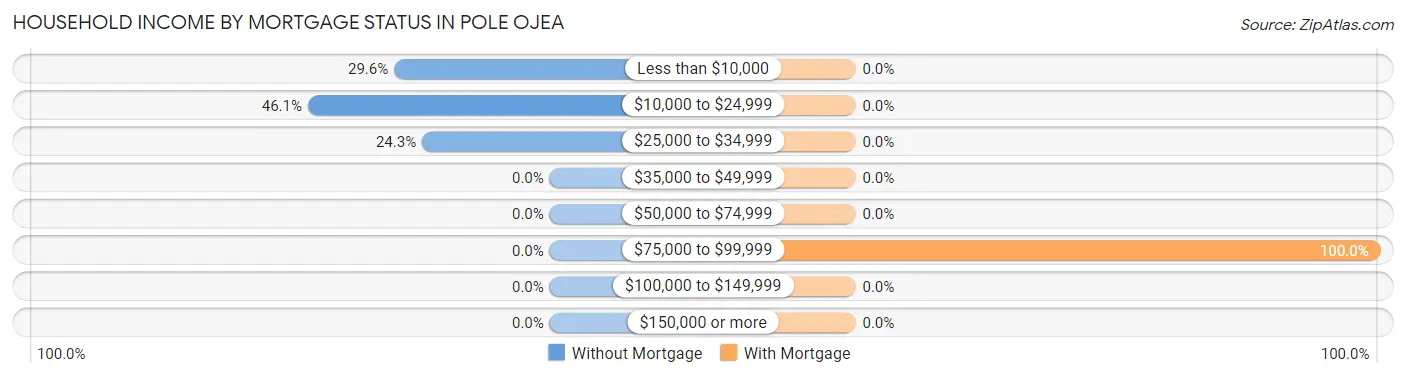
| Household Income | Without Mortgage | With Mortgage |
| Less than $10,000 | 128 (29.6%) | 0 (0.0%) |
| $10,000 to $24,999 | 199 (46.1%) | 0 (0.0%) |
| $25,000 to $34,999 | 105 (24.3%) | 0 (0.0%) |
| $35,000 to $49,999 | 0 (0.0%) | 0 (0.0%) |
| $50,000 to $74,999 | 0 (0.0%) | 0 (0.0%) |
| $75,000 to $99,999 | 0 (0.0%) | 14 (100.0%) |
| $100,000 to $149,999 | 0 (0.0%) | 0 (0.0%) |
| $150,000 or more | 0 (0.0%) | 0 (0.0%) |
| Total | 432 (100.0%) | 14 (100.0%) |
Property Value to Household Income Ratio in Pole Ojea
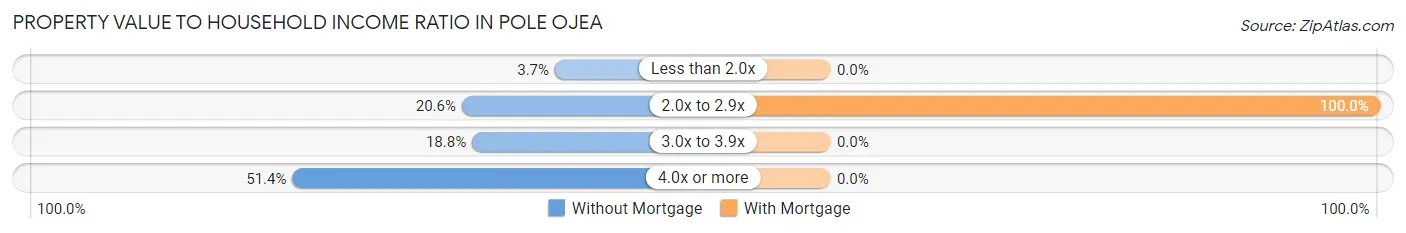
| Value-to-Income Ratio | Without Mortgage | With Mortgage |
| Less than 2.0x | 16 (3.7%) | 0 (0.0%) |
| 2.0x to 2.9x | 89 (20.6%) | 14 (100.0%) |
| 3.0x to 3.9x | 81 (18.8%) | 0 (0.0%) |
| 4.0x or more | 222 (51.4%) | 0 (0.0%) |
| Total | 432 (100.0%) | 14 (100.0%) |
Real Estate Taxes by Mortgage Status in Pole Ojea
| Property Taxes | Without Mortgage | With Mortgage |
| Less than $800 | 0 (0.0%) | 0 (0.0%) |
| $800 to $1,499 | 0 (0.0%) | 0 (0.0%) |
| $800 to $1,499 | 0 (0.0%) | 0 (0.0%) |
| Total | 432 (100.0%) | 14 (100.0%) |
Health & Disability in Pole Ojea
Health Insurance Coverage by Age in Pole Ojea
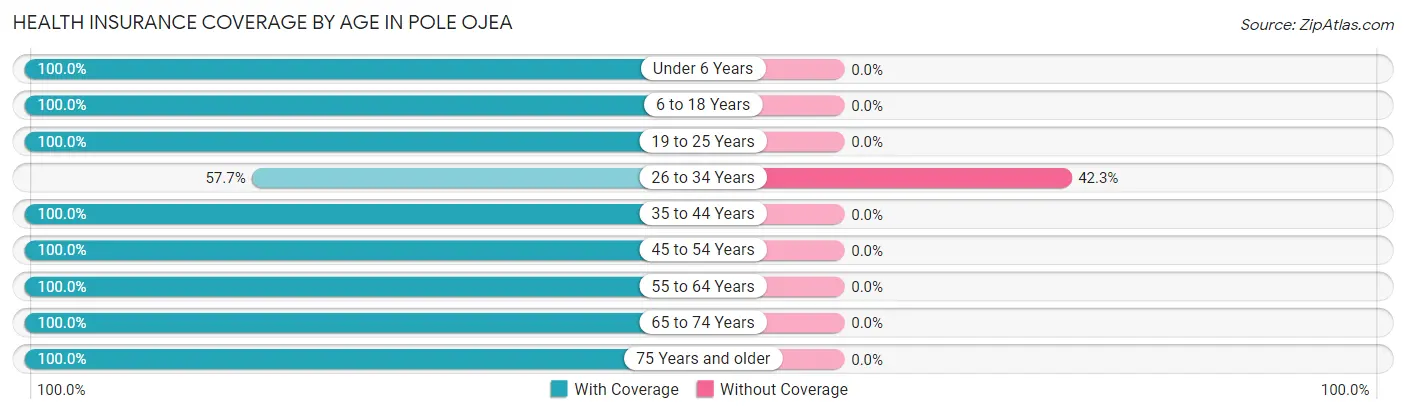
| Age Bracket | With Coverage | Without Coverage |
| Under 6 Years | 68 (100.0%) | 0 (0.0%) |
| 6 to 18 Years | 230 (100.0%) | 0 (0.0%) |
| 19 to 25 Years | 131 (100.0%) | 0 (0.0%) |
| 26 to 34 Years | 165 (57.7%) | 121 (42.3%) |
| 35 to 44 Years | 98 (100.0%) | 0 (0.0%) |
| 45 to 54 Years | 168 (100.0%) | 0 (0.0%) |
| 55 to 64 Years | 212 (100.0%) | 0 (0.0%) |
| 65 to 74 Years | 155 (100.0%) | 0 (0.0%) |
| 75 Years and older | 310 (100.0%) | 0 (0.0%) |
| Total | 1,537 (92.7%) | 121 (7.3%) |
Health Insurance Coverage by Citizenship Status in Pole Ojea
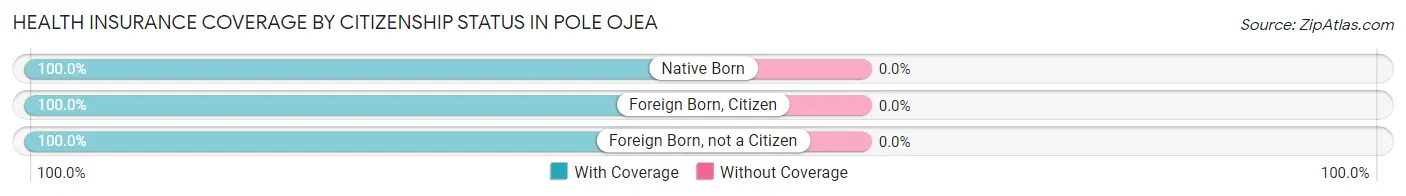
| Citizenship Status | With Coverage | Without Coverage |
| Native Born | 68 (100.0%) | 0 (0.0%) |
| Foreign Born, Citizen | 230 (100.0%) | 0 (0.0%) |
| Foreign Born, not a Citizen | 131 (100.0%) | 0 (0.0%) |
Health Insurance Coverage by Household Income in Pole Ojea
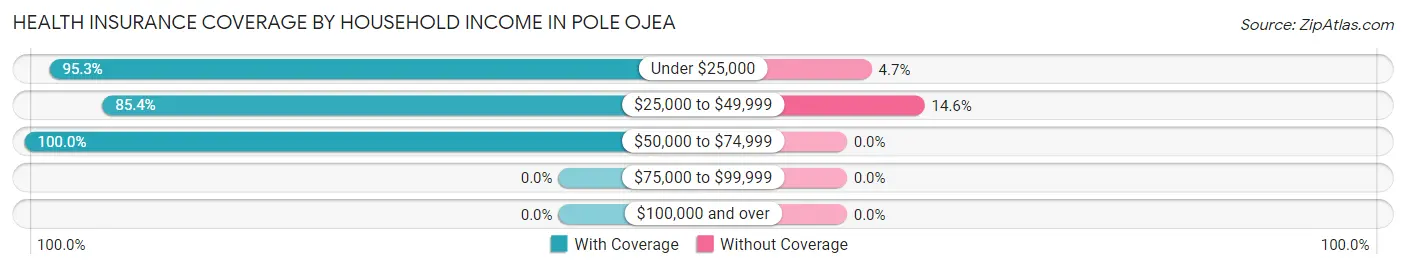
| Household Income | With Coverage | Without Coverage |
| Under $25,000 | 1,043 (95.3%) | 51 (4.7%) |
| $25,000 to $49,999 | 410 (85.4%) | 70 (14.6%) |
| $50,000 to $74,999 | 84 (100.0%) | 0 (0.0%) |
| $75,000 to $99,999 | 0 (0.0%) | 0 (0.0%) |
| $100,000 and over | 0 (0.0%) | 0 (0.0%) |
Public vs Private Health Insurance Coverage by Age in Pole Ojea
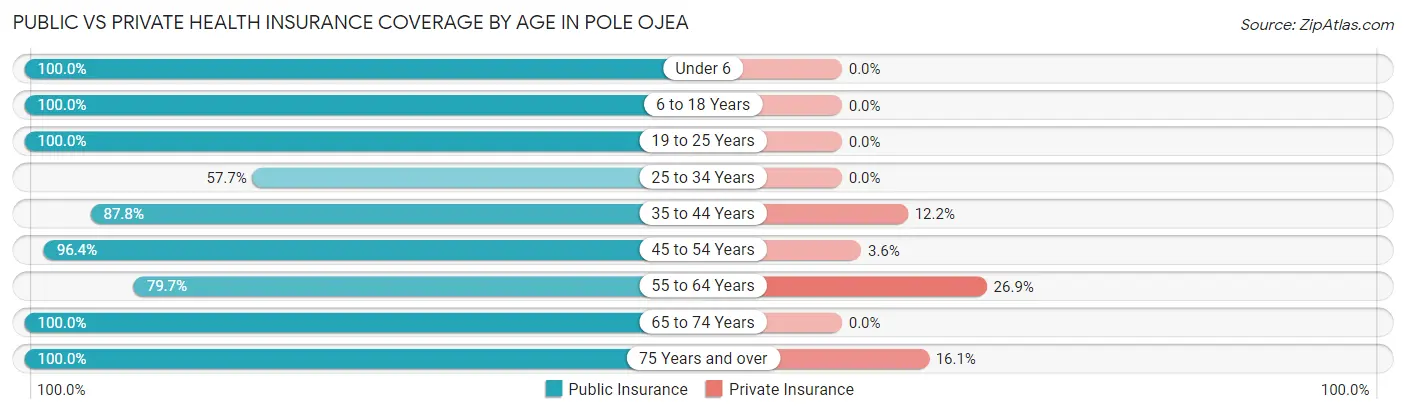
| Age Bracket | Public Insurance | Private Insurance |
| Under 6 | 68 (100.0%) | 0 (0.0%) |
| 6 to 18 Years | 230 (100.0%) | 0 (0.0%) |
| 19 to 25 Years | 131 (100.0%) | 0 (0.0%) |
| 25 to 34 Years | 165 (57.7%) | 0 (0.0%) |
| 35 to 44 Years | 86 (87.8%) | 12 (12.2%) |
| 45 to 54 Years | 162 (96.4%) | 6 (3.6%) |
| 55 to 64 Years | 169 (79.7%) | 57 (26.9%) |
| 65 to 74 Years | 155 (100.0%) | 0 (0.0%) |
| 75 Years and over | 310 (100.0%) | 50 (16.1%) |
| Total | 1,476 (89.0%) | 125 (7.5%) |
Disability Status by Sex by Age in Pole Ojea
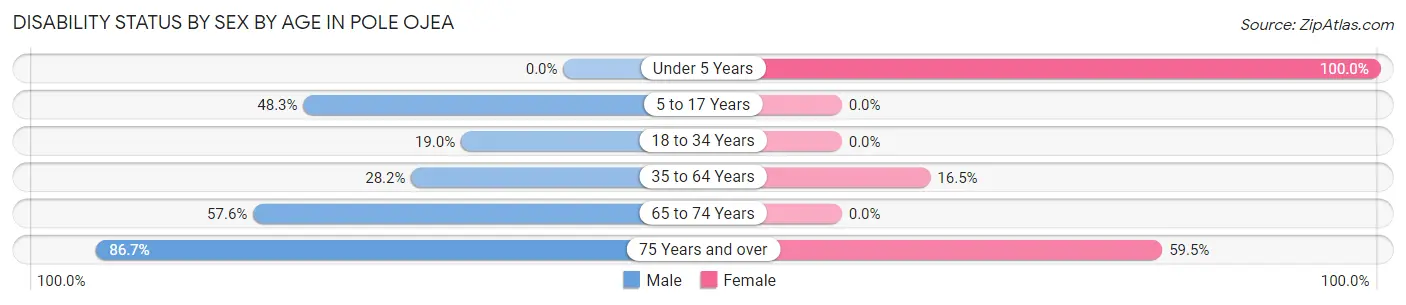
| Age Bracket | Male | Female |
| Under 5 Years | 0 (0.0%) | 68 (100.0%) |
| 5 to 17 Years | 83 (48.3%) | 0 (0.0%) |
| 18 to 34 Years | 19 (19.0%) | 0 (0.0%) |
| 35 to 64 Years | 92 (28.2%) | 25 (16.5%) |
| 65 to 74 Years | 19 (57.6%) | 0 (0.0%) |
| 75 Years and over | 104 (86.7%) | 113 (59.5%) |
Disability Class by Sex by Age in Pole Ojea
Disability Class: Hearing Difficulty
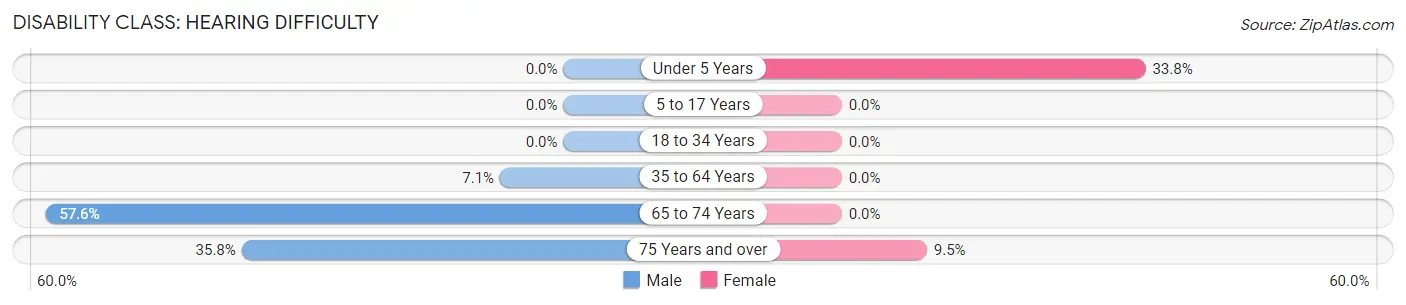
| Age Bracket | Male | Female |
| Under 5 Years | 0 (0.0%) | 23 (33.8%) |
| 5 to 17 Years | 0 (0.0%) | 0 (0.0%) |
| 18 to 34 Years | 0 (0.0%) | 0 (0.0%) |
| 35 to 64 Years | 23 (7.1%) | 0 (0.0%) |
| 65 to 74 Years | 19 (57.6%) | 0 (0.0%) |
| 75 Years and over | 43 (35.8%) | 18 (9.5%) |
Disability Class: Vision Difficulty
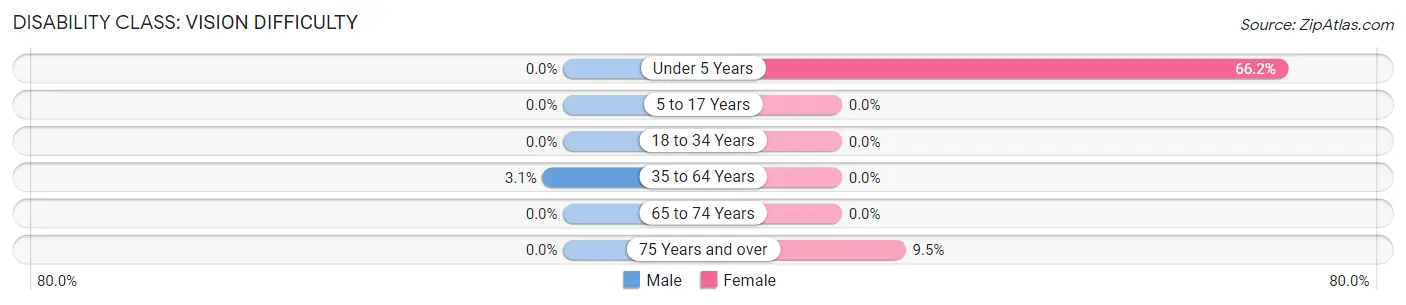
| Age Bracket | Male | Female |
| Under 5 Years | 0 (0.0%) | 45 (66.2%) |
| 5 to 17 Years | 0 (0.0%) | 0 (0.0%) |
| 18 to 34 Years | 0 (0.0%) | 0 (0.0%) |
| 35 to 64 Years | 10 (3.1%) | 0 (0.0%) |
| 65 to 74 Years | 0 (0.0%) | 0 (0.0%) |
| 75 Years and over | 0 (0.0%) | 18 (9.5%) |
Disability Class: Cognitive Difficulty
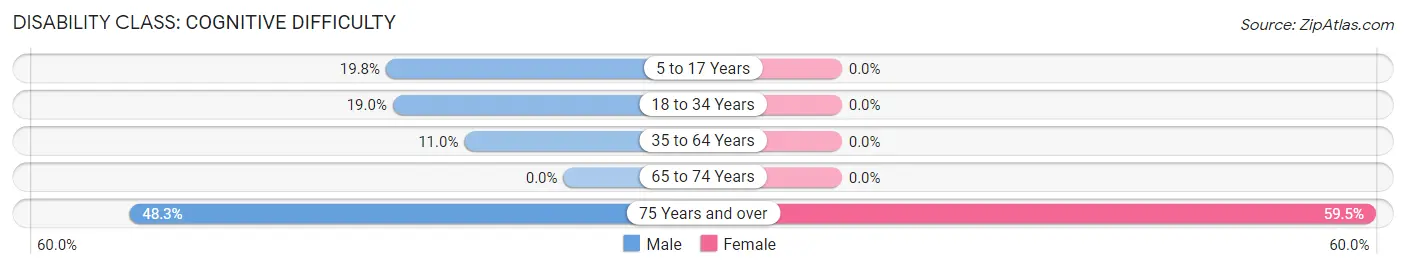
| Age Bracket | Male | Female |
| 5 to 17 Years | 34 (19.8%) | 0 (0.0%) |
| 18 to 34 Years | 19 (19.0%) | 0 (0.0%) |
| 35 to 64 Years | 36 (11.0%) | 0 (0.0%) |
| 65 to 74 Years | 0 (0.0%) | 0 (0.0%) |
| 75 Years and over | 58 (48.3%) | 113 (59.5%) |
Disability Class: Ambulatory Difficulty
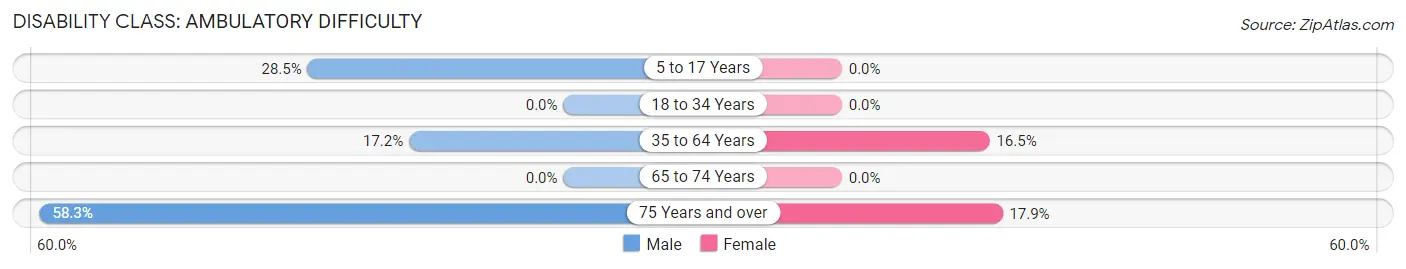
| Age Bracket | Male | Female |
| 5 to 17 Years | 49 (28.5%) | 0 (0.0%) |
| 18 to 34 Years | 0 (0.0%) | 0 (0.0%) |
| 35 to 64 Years | 56 (17.2%) | 25 (16.5%) |
| 65 to 74 Years | 0 (0.0%) | 0 (0.0%) |
| 75 Years and over | 70 (58.3%) | 34 (17.9%) |
Disability Class: Self-Care Difficulty
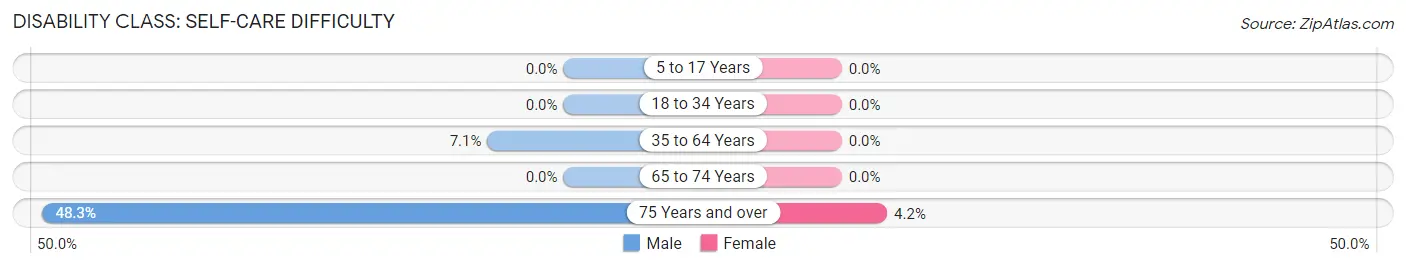
| Age Bracket | Male | Female |
| 5 to 17 Years | 0 (0.0%) | 0 (0.0%) |
| 18 to 34 Years | 0 (0.0%) | 0 (0.0%) |
| 35 to 64 Years | 23 (7.1%) | 0 (0.0%) |
| 65 to 74 Years | 0 (0.0%) | 0 (0.0%) |
| 75 Years and over | 58 (48.3%) | 8 (4.2%) |
Technology Access in Pole Ojea
Computing Device Access in Pole Ojea
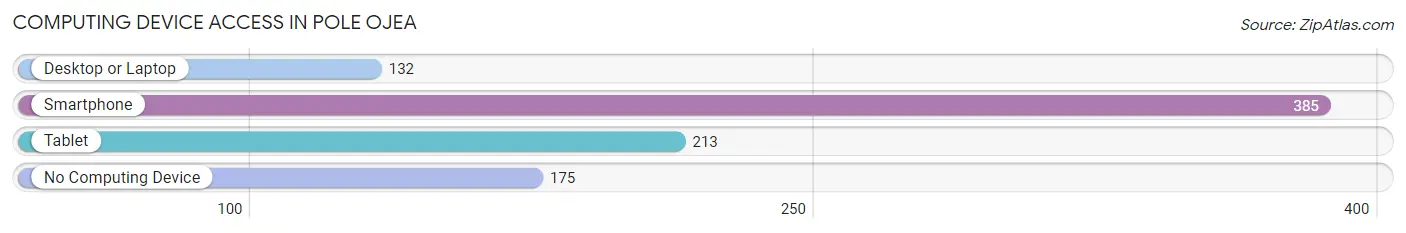
| Device Type | # Households | % Households |
| Desktop or Laptop | 132 | 22.5% |
| Smartphone | 385 | 65.6% |
| Tablet | 213 | 36.3% |
| No Computing Device | 175 | 29.8% |
| Total | 587 | 100.0% |
Internet Access in Pole Ojea
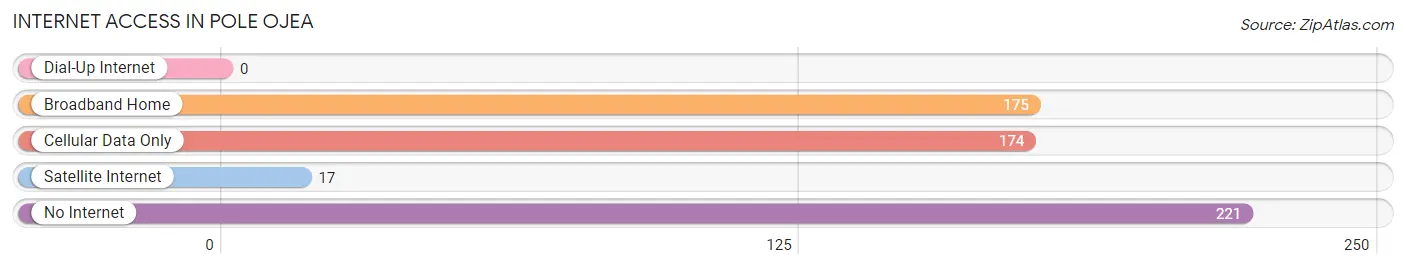
| Internet Type | # Households | % Households |
| Dial-Up Internet | 0 | 0.0% |
| Broadband Home | 175 | 29.8% |
| Cellular Data Only | 174 | 29.6% |
| Satellite Internet | 17 | 2.9% |
| No Internet | 221 | 37.7% |
| Total | 587 | 100.0% |
Pole Ojea Summary
Puerto Rico is an unincorporated territory of the United States located in the northeastern Caribbean Sea. It is an archipelago that includes the main island of Puerto Rico and several smaller islands, such as Vieques, Culebra, and Mona. The total land area of Puerto Rico is 3,515 square miles (9,104 km2). The capital and largest city is San Juan.
History
Puerto Rico has a long and complex history. The island was inhabited by the indigenous Taíno people for centuries before the arrival of Spanish explorers in the late 15th century. The Spanish colonized the island and established a settlement in 1508. The island was ceded to the United States in 1898 following the Spanish-American War. In 1917, Puerto Ricans were granted U.S. citizenship.
In 1952, Puerto Rico became a self-governing commonwealth of the United States. This status allows Puerto Ricans to elect their own governor and representatives to the U.S. Congress. In 2017, Puerto Rico was devastated by Hurricane Maria, which caused widespread destruction and loss of life.
Geography
Puerto Rico is located in the Caribbean Sea, east of the Dominican Republic and west of the Virgin Islands. The main island is approximately 100 miles (160 km) long and 35 miles (56 km) wide. It is divided into 78 municipalities. The terrain is mostly mountainous, with the highest point being Cerro de Punta at 4,390 feet (1,338 m). The climate is tropical, with temperatures ranging from the mid-70s to the mid-80s Fahrenheit (24-30°C).
Economy
Puerto Rico has a mixed economy, with a large public sector and a smaller private sector. The main industries are tourism, pharmaceuticals, and manufacturing. The government is the largest employer, followed by the service sector. The unemployment rate is high, at 11.2% in 2019.
The currency is the U.S. dollar. The per capita GDP was $19,890 in 2018. The poverty rate is high, at 44.3% in 2018. The government has implemented several measures to stimulate economic growth, including tax incentives and infrastructure investments.
Demographics
Puerto Rico has a population of 3.2 million people, making it the second-most populous territory in the United States. The population is largely of Spanish and African descent, with smaller numbers of other ethnicities. Spanish is the official language, although English is widely spoken. The majority of the population is Roman Catholic.
Conclusion
Puerto Rico is an unincorporated territory of the United States located in the northeastern Caribbean Sea. It has a long and complex history, with a diverse geography, economy, and population. The island has a mixed economy, with a large public sector and a smaller private sector. The population is largely of Spanish and African descent, with smaller numbers of other ethnicities. Puerto Rico is a self-governing commonwealth of the United States, with its own governor and representatives to the U.S. Congress.
Common Questions
What is Per Capita Income in Pole Ojea?
Per Capita income in Pole Ojea is $6,993.
What is the Median Family Income in Pole Ojea?
Median Family Income in Pole Ojea is $14,740.
What is the Median Household income in Pole Ojea?
Median Household Income in Pole Ojea is $13,841.
What is Income or Wage Gap in Pole Ojea?
Income or Wage Gap in Pole Ojea is 50.3%.
Women in Pole Ojea earn 49.7 cents for every dollar earned by a man.
What is Family Income Deficit in Pole Ojea?
Family Income Deficit in Pole Ojea is $10,091.
Families that are below poverty line in Pole Ojea earn $10,091 less on average than the poverty threshold level.
What is Inequality or Gini Index in Pole Ojea?
Inequality or Gini Index in Pole Ojea is 0.41.
What is the Total Population of Pole Ojea?
Total Population of Pole Ojea is 1,658.
What is the Total Male Population of Pole Ojea?
Total Male Population of Pole Ojea is 751.
What is the Total Female Population of Pole Ojea?
Total Female Population of Pole Ojea is 907.
What is the Ratio of Males per 100 Females in Pole Ojea?
There are 82.80 Males per 100 Females in Pole Ojea.
What is the Ratio of Females per 100 Males in Pole Ojea?
There are 120.77 Females per 100 Males in Pole Ojea.
What is the Median Population Age in Pole Ojea?
Median Population Age in Pole Ojea is 48.6 Years.
What is the Average Family Size in Pole Ojea
Average Family Size in Pole Ojea is 3.7 People.
What is the Average Household Size in Pole Ojea
Average Household Size in Pole Ojea is 2.8 People.
How Large is the Labor Force in Pole Ojea?
There are 483 People in the Labor Forcein in Pole Ojea.
What is the Percentage of People in the Labor Force in Pole Ojea?
34.6% of People are in the Labor Force in Pole Ojea.
What is the Unemployment Rate in Pole Ojea?
Unemployment Rate in Pole Ojea is 10.8%.