Jobos, PR Map & Demographics
Jobos Map
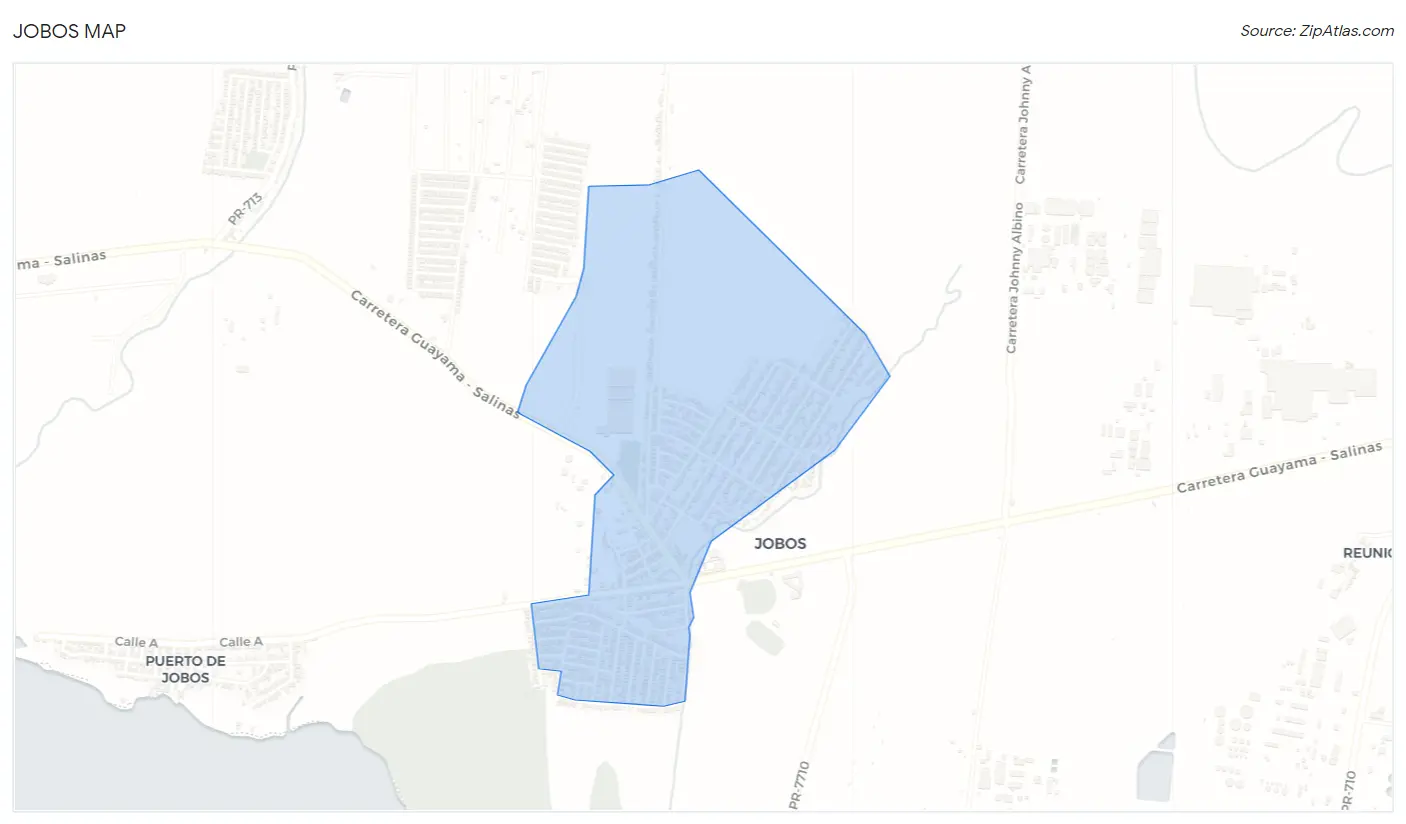
Jobos Overview
$12,655
PER CAPITA INCOME
$19,705
AVG FAMILY INCOME
$17,791
AVG HOUSEHOLD INCOME
4.9%
WAGE / INCOME GAP [ % ]
95.1¢/ $1
WAGE / INCOME GAP [ $ ]
0.44
INEQUALITY / GINI INDEX
1,632
TOTAL POPULATION
731
MALE POPULATION
901
FEMALE POPULATION
81.13
MALES / 100 FEMALES
123.26
FEMALES / 100 MALES
55.5
MEDIAN AGE
2.5
AVG FAMILY SIZE
2.0
AVG HOUSEHOLD SIZE
540
LABOR FORCE [ PEOPLE ]
37.4%
PERCENT IN LABOR FORCE
4.5%
UNEMPLOYMENT RATE
Income in Jobos
Income Overview in Jobos
Per Capita Income in Jobos is $12,655, while median incomes of families and households are $19,705 and $17,791 respectively.
| Characteristic | Number | Measure |
| Per Capita Income | 1,632 | $12,655 |
| Median Family Income | 511 | $19,705 |
| Mean Family Income | 511 | $29,120 |
| Median Household Income | 800 | $17,791 |
| Mean Household Income | 800 | $25,421 |
| Income Deficit | 511 | $0 |
| Wage / Income Gap (%) | 1,632 | 4.87% |
| Wage / Income Gap ($) | 1,632 | 95.13¢ per $1 |
| Gini / Inequality Index | 1,632 | 0.44 |
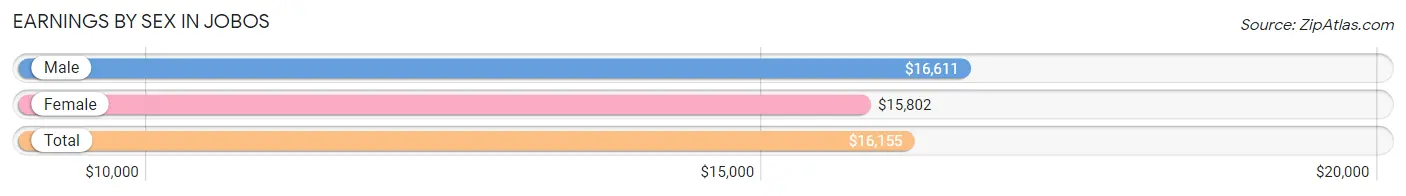
Earnings by Sex in Jobos
Average Earnings in Jobos are $16,155, $16,611 for men and $15,802 for women, a difference of 4.9%.
| Sex | Number | Average Earnings |
| Male | 201 (35.4%) | $16,611 |
| Female | 367 (64.6%) | $15,802 |
| Total | 568 (100.0%) | $16,155 |
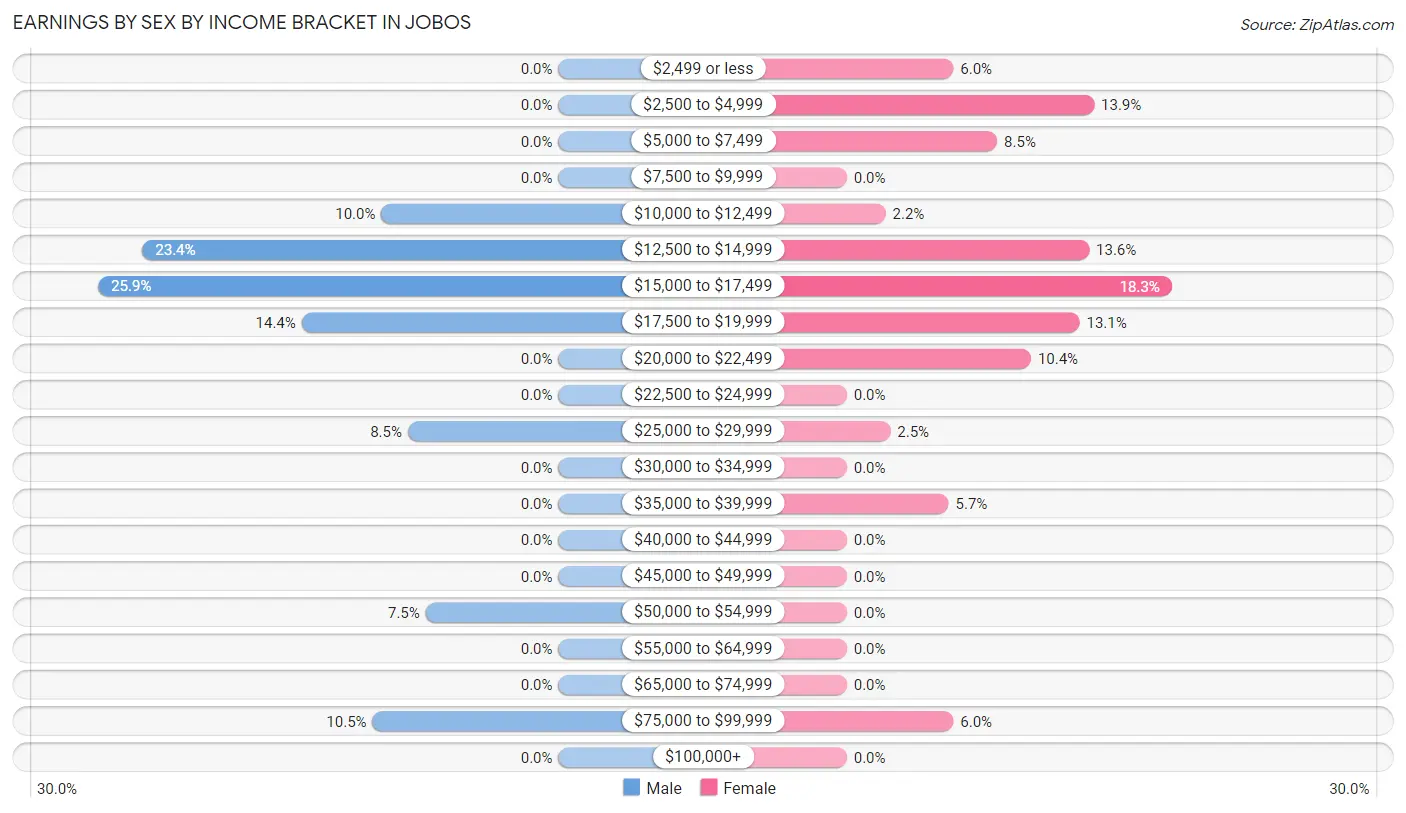
Earnings by Sex by Income Bracket in Jobos
The most common earnings brackets in Jobos are $15,000 to $17,499 for men (52 | 25.9%) and $15,000 to $17,499 for women (67 | 18.3%).
| Income | Male | Female |
| $2,499 or less | 0 (0.0%) | 22 (6.0%) |
| $2,500 to $4,999 | 0 (0.0%) | 51 (13.9%) |
| $5,000 to $7,499 | 0 (0.0%) | 31 (8.5%) |
| $7,500 to $9,999 | 0 (0.0%) | 0 (0.0%) |
| $10,000 to $12,499 | 20 (10.0%) | 8 (2.2%) |
| $12,500 to $14,999 | 47 (23.4%) | 50 (13.6%) |
| $15,000 to $17,499 | 52 (25.9%) | 67 (18.3%) |
| $17,500 to $19,999 | 29 (14.4%) | 48 (13.1%) |
| $20,000 to $22,499 | 0 (0.0%) | 38 (10.3%) |
| $22,500 to $24,999 | 0 (0.0%) | 0 (0.0%) |
| $25,000 to $29,999 | 17 (8.5%) | 9 (2.5%) |
| $30,000 to $34,999 | 0 (0.0%) | 0 (0.0%) |
| $35,000 to $39,999 | 0 (0.0%) | 21 (5.7%) |
| $40,000 to $44,999 | 0 (0.0%) | 0 (0.0%) |
| $45,000 to $49,999 | 0 (0.0%) | 0 (0.0%) |
| $50,000 to $54,999 | 15 (7.5%) | 0 (0.0%) |
| $55,000 to $64,999 | 0 (0.0%) | 0 (0.0%) |
| $65,000 to $74,999 | 0 (0.0%) | 0 (0.0%) |
| $75,000 to $99,999 | 21 (10.4%) | 22 (6.0%) |
| $100,000+ | 0 (0.0%) | 0 (0.0%) |
| Total | 201 (100.0%) | 367 (100.0%) |
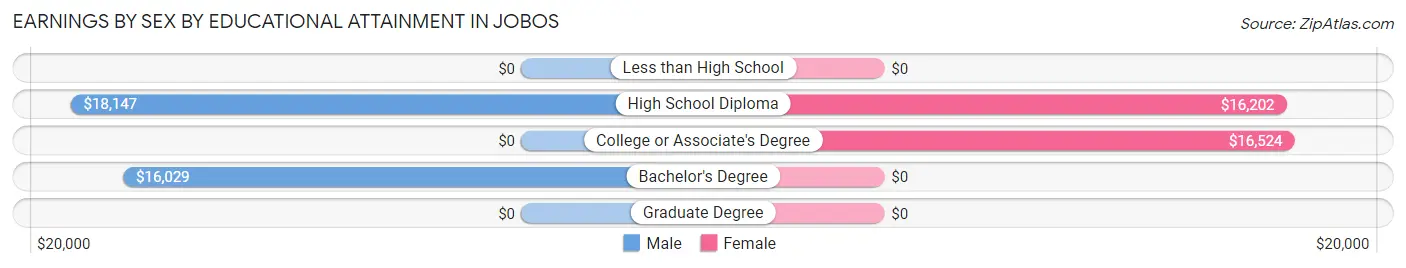
Earnings by Sex by Educational Attainment in Jobos
Average earnings in Jobos are $17,931 for men and $16,474 for women, a difference of 8.1%. Men with an educational attainment of high school diploma enjoy the highest average annual earnings of $18,147, while those with bachelor's degree education earn the least with $16,029. Women with an educational attainment of college or associate's degree earn the most with the average annual earnings of $16,524, while those with high school diploma education have the smallest earnings of $16,202.
| Educational Attainment | Male Income | Female Income |
| Less than High School | - | - |
| High School Diploma | $18,147 | $16,202 |
| College or Associate's Degree | - | - |
| Bachelor's Degree | $16,029 | $0 |
| Graduate Degree | - | - |
| Total | $17,931 | $16,474 |
Family Income in Jobos
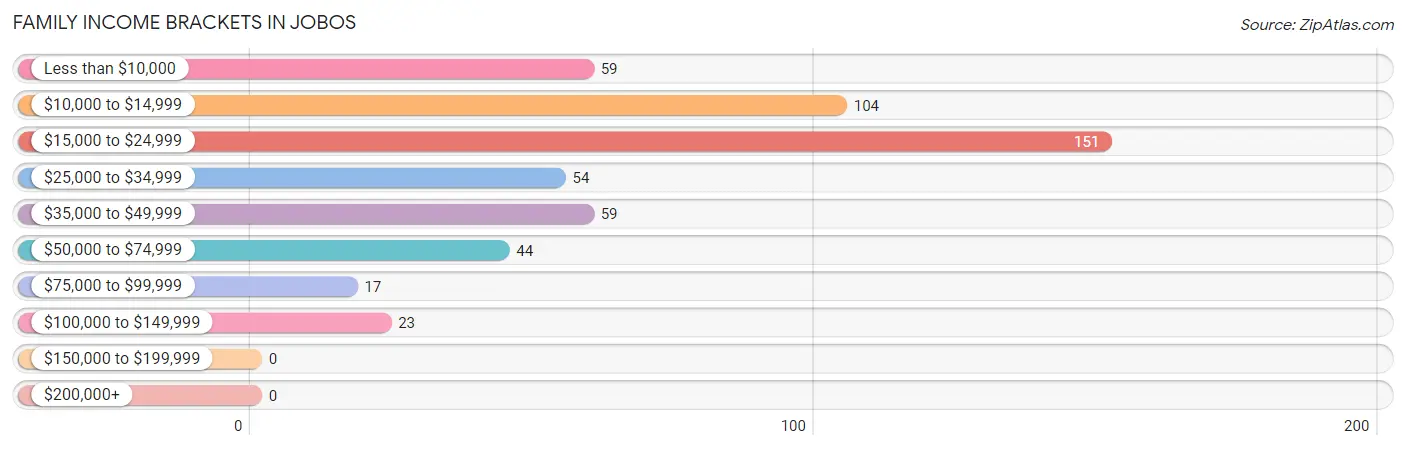
Family Income Brackets in Jobos
According to the Jobos family income data, there are 151 families falling into the $15,000 to $24,999 income range, which is the most common income bracket and makes up 29.5% of all families.
| Income Bracket | # Families | % Families |
| Less than $10,000 | 59 | 11.5% |
| $10,000 to $14,999 | 104 | 20.4% |
| $15,000 to $24,999 | 151 | 29.5% |
| $25,000 to $34,999 | 54 | 10.6% |
| $35,000 to $49,999 | 59 | 11.5% |
| $50,000 to $74,999 | 44 | 8.6% |
| $75,000 to $99,999 | 17 | 3.3% |
| $100,000 to $149,999 | 23 | 4.5% |
| $150,000 to $199,999 | 0 | 0.0% |
| $200,000+ | 0 | 0.0% |
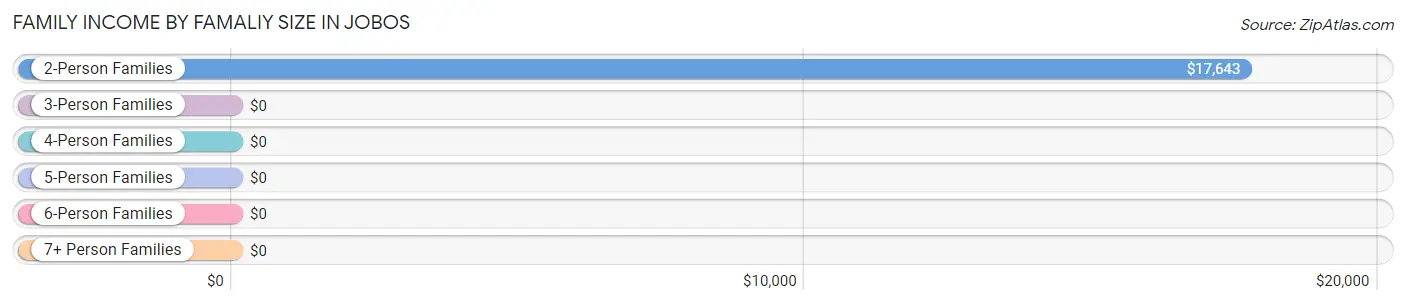
Family Income by Famaliy Size in Jobos
2-person families (392 | 76.7%) account for the highest median family income in Jobos with $17,643 per family, while 2-person families (392 | 76.7%) have the highest median income of $8,822 per family member.
| Income Bracket | # Families | Median Income |
| 2-Person Families | 392 (76.7%) | $17,643 |
| 3-Person Families | 44 (8.6%) | $0 |
| 4-Person Families | 55 (10.8%) | $0 |
| 5-Person Families | 20 (3.9%) | $0 |
| 6-Person Families | 0 (0.0%) | $0 |
| 7+ Person Families | 0 (0.0%) | $0 |
| Total | 511 (100.0%) | $19,705 |
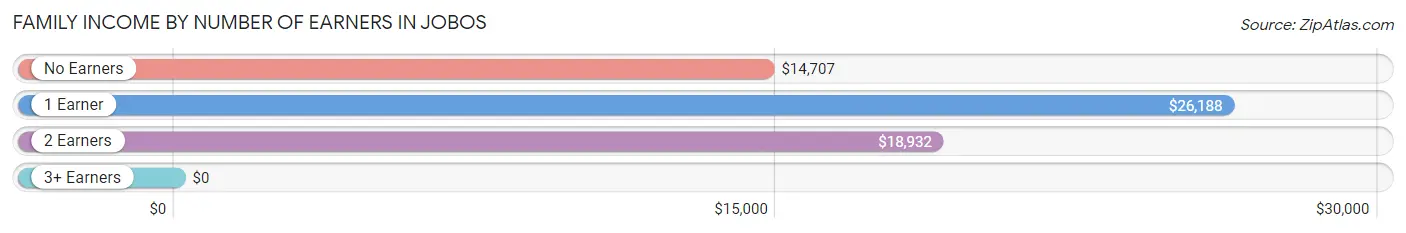
Family Income by Number of Earners in Jobos
| Number of Earners | # Families | Median Income |
| No Earners | 247 (48.3%) | $14,707 |
| 1 Earner | 181 (35.4%) | $26,188 |
| 2 Earners | 63 (12.3%) | $18,932 |
| 3+ Earners | 20 (3.9%) | $0 |
| Total | 511 (100.0%) | $19,705 |
Household Income in Jobos
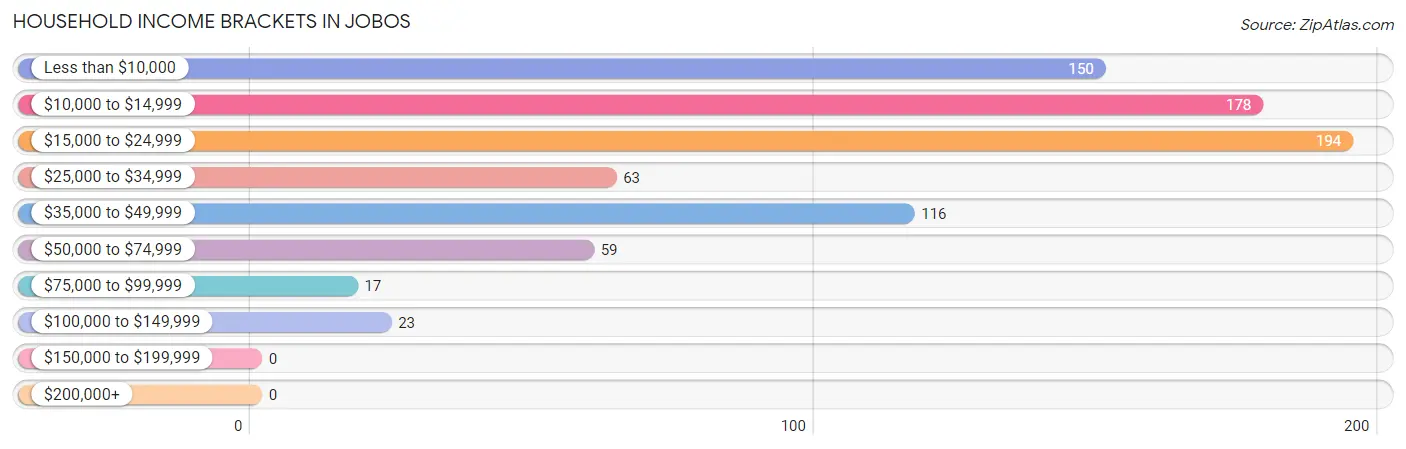
Household Income Brackets in Jobos
With 194 households falling in the category, the $15,000 to $24,999 income range is the most frequent in Jobos, accounting for 24.2% of all households.
| Income Bracket | # Households | % Households |
| Less than $10,000 | 150 | 18.8% |
| $10,000 to $14,999 | 178 | 22.3% |
| $15,000 to $24,999 | 194 | 24.3% |
| $25,000 to $34,999 | 63 | 7.9% |
| $35,000 to $49,999 | 116 | 14.5% |
| $50,000 to $74,999 | 59 | 7.4% |
| $75,000 to $99,999 | 17 | 2.1% |
| $100,000 to $149,999 | 23 | 2.9% |
| $150,000 to $199,999 | 0 | 0.0% |
| $200,000+ | 0 | 0.0% |
Household Income by Householder Age in Jobos
The median household income in Jobos is $17,791, with the highest median household income of $22,917 found in the 65+ years age bracket for the primary householder. A total of 303 households (37.9%) fall into this category. Meanwhile, the 15 to 24 years age bracket for the primary householder has the lowest median household income of $0, with 56 households (7.0%) in this group.
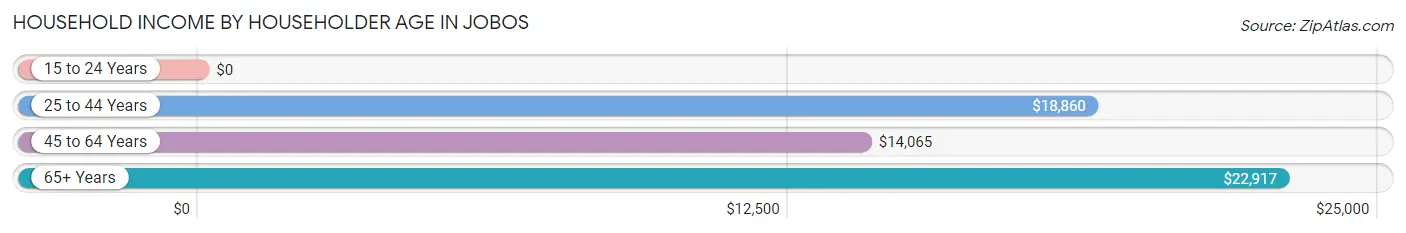
| Income Bracket | # Households | Median Income |
| 15 to 24 Years | 56 (7.0%) | $0 |
| 25 to 44 Years | 118 (14.7%) | $18,860 |
| 45 to 64 Years | 323 (40.4%) | $14,065 |
| 65+ Years | 303 (37.9%) | $22,917 |
| Total | 800 (100.0%) | $17,791 |
Poverty in Jobos
Income Below Poverty by Sex and Age in Jobos
With 60.5% poverty level for males and 62.0% for females among the residents of Jobos, 18 to 24 year old males and under 5 year old females are the most vulnerable to poverty, with 64 males (82.1%) and 29 females (100.0%) in their respective age groups living below the poverty level.
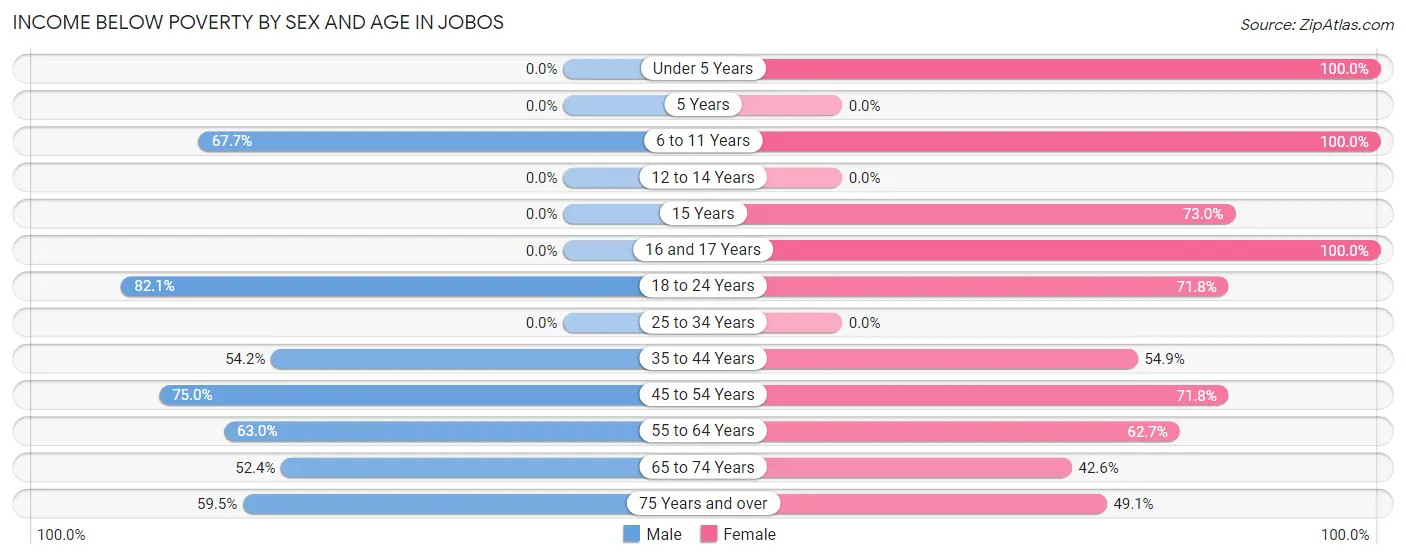
| Age Bracket | Male | Female |
| Under 5 Years | 0 (0.0%) | 29 (100.0%) |
| 5 Years | 0 (0.0%) | 0 (0.0%) |
| 6 to 11 Years | 46 (67.6%) | 55 (100.0%) |
| 12 to 14 Years | 0 (0.0%) | 0 (0.0%) |
| 15 Years | 0 (0.0%) | 27 (73.0%) |
| 16 and 17 Years | 0 (0.0%) | 40 (100.0%) |
| 18 to 24 Years | 64 (82.1%) | 56 (71.8%) |
| 25 to 34 Years | 0 (0.0%) | 0 (0.0%) |
| 35 to 44 Years | 45 (54.2%) | 45 (54.9%) |
| 45 to 54 Years | 75 (75.0%) | 56 (71.8%) |
| 55 to 64 Years | 68 (63.0%) | 168 (62.7%) |
| 65 to 74 Years | 100 (52.4%) | 55 (42.6%) |
| 75 Years and over | 44 (59.5%) | 28 (49.1%) |
| Total | 442 (60.5%) | 559 (62.0%) |
Income Above Poverty by Sex and Age in Jobos
According to the poverty statistics in Jobos, males aged 25 to 34 years and females aged 25 to 34 years are the age groups that are most secure financially, with 100.0% of males and 100.0% of females in these age groups living above the poverty line.
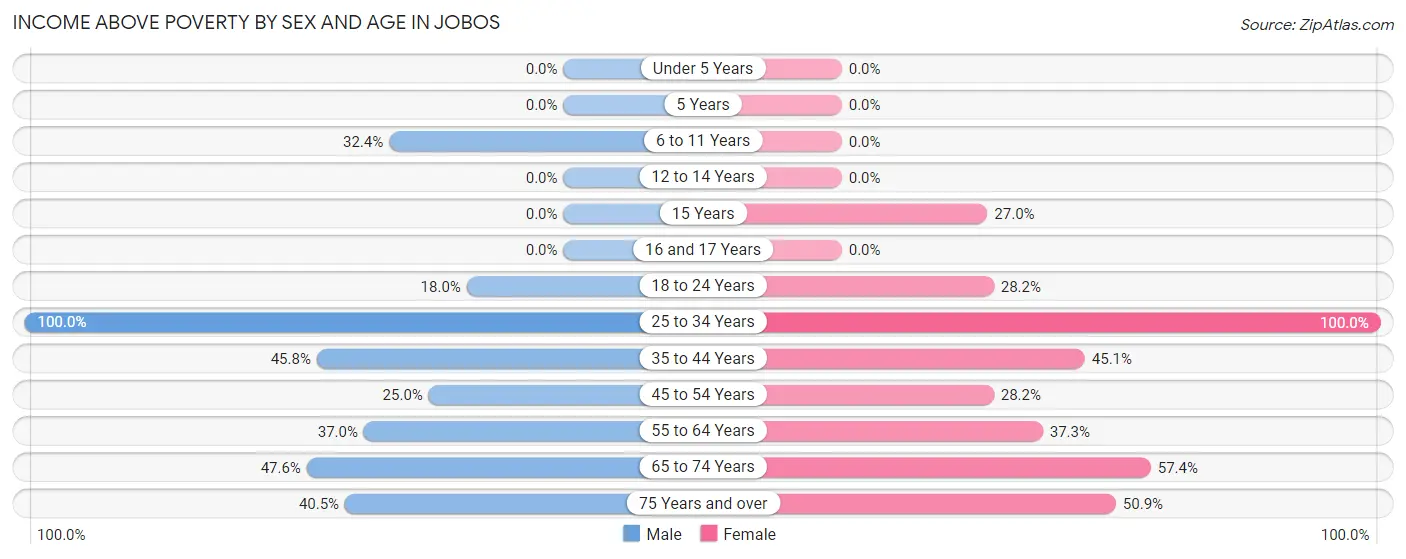
| Age Bracket | Male | Female |
| Under 5 Years | 0 (0.0%) | 0 (0.0%) |
| 5 Years | 0 (0.0%) | 0 (0.0%) |
| 6 to 11 Years | 22 (32.4%) | 0 (0.0%) |
| 12 to 14 Years | 0 (0.0%) | 0 (0.0%) |
| 15 Years | 0 (0.0%) | 10 (27.0%) |
| 16 and 17 Years | 0 (0.0%) | 0 (0.0%) |
| 18 to 24 Years | 14 (17.9%) | 22 (28.2%) |
| 25 to 34 Years | 29 (100.0%) | 48 (100.0%) |
| 35 to 44 Years | 38 (45.8%) | 37 (45.1%) |
| 45 to 54 Years | 25 (25.0%) | 22 (28.2%) |
| 55 to 64 Years | 40 (37.0%) | 100 (37.3%) |
| 65 to 74 Years | 91 (47.6%) | 74 (57.4%) |
| 75 Years and over | 30 (40.5%) | 29 (50.9%) |
| Total | 289 (39.5%) | 342 (38.0%) |
Income Below Poverty Among Married-Couple Families in Jobos
The poverty statistics for married-couple families in Jobos show that 63.8% or 222 of the total 348 families live below the poverty line. Families with 3 or 4 children have the highest poverty rate of 100.0%, comprising of 20 families. On the other hand, families with 1 or 2 children have the lowest poverty rate of 31.7%, which includes 13 families.
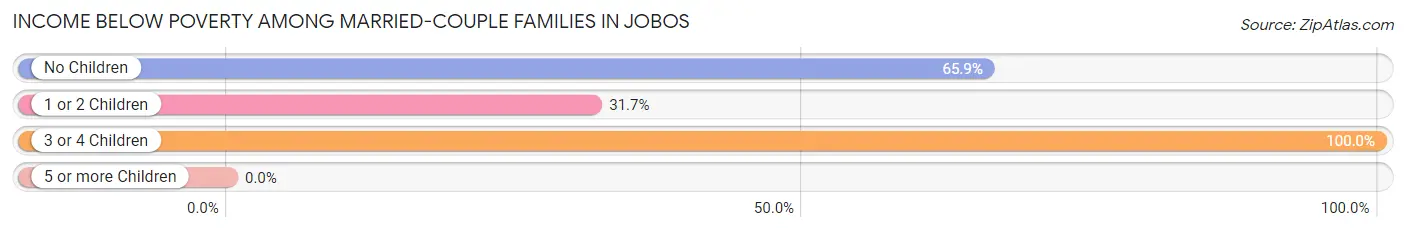
| Children | Above Poverty | Below Poverty |
| No Children | 98 (34.2%) | 189 (65.8%) |
| 1 or 2 Children | 28 (68.3%) | 13 (31.7%) |
| 3 or 4 Children | 0 (0.0%) | 20 (100.0%) |
| 5 or more Children | 0 (0.0%) | 0 (0.0%) |
| Total | 126 (36.2%) | 222 (63.8%) |
Income Below Poverty Among Single-Parent Households in Jobos
According to the poverty data in Jobos, 32.0% or 8 single-father households and 54.3% or 75 single-mother households are living below the poverty line. Among single-father households, those with no children have the highest poverty rate, with 8 households (32.0%) experiencing poverty. Likewise, among single-mother households, those with 1 or 2 children have the highest poverty rate, with 65 households (100.0%) falling below the poverty line.
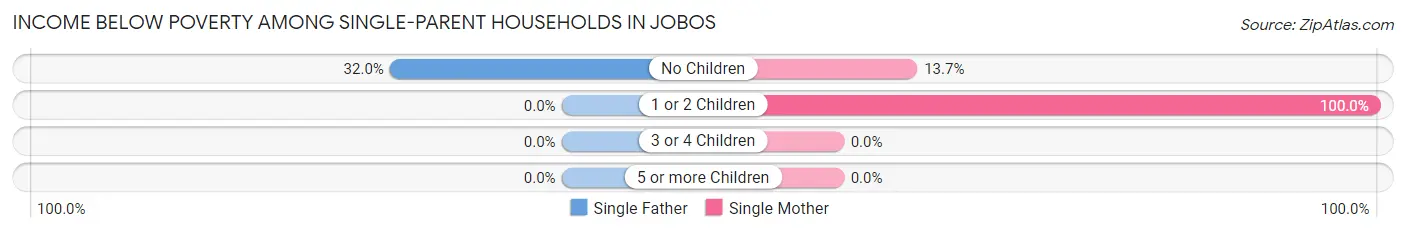
| Children | Single Father | Single Mother |
| No Children | 8 (32.0%) | 10 (13.7%) |
| 1 or 2 Children | 0 (0.0%) | 65 (100.0%) |
| 3 or 4 Children | 0 (0.0%) | 0 (0.0%) |
| 5 or more Children | 0 (0.0%) | 0 (0.0%) |
| Total | 8 (32.0%) | 75 (54.3%) |
Income Below Poverty Among Married-Couple vs Single-Parent Households in Jobos
The poverty data for Jobos shows that 222 of the married-couple family households (63.8%) and 83 of the single-parent households (50.9%) are living below the poverty level. Within the married-couple family households, those with 3 or 4 children have the highest poverty rate, with 20 households (100.0%) falling below the poverty line. Among the single-parent households, those with 1 or 2 children have the highest poverty rate, with 65 household (100.0%) living below poverty.
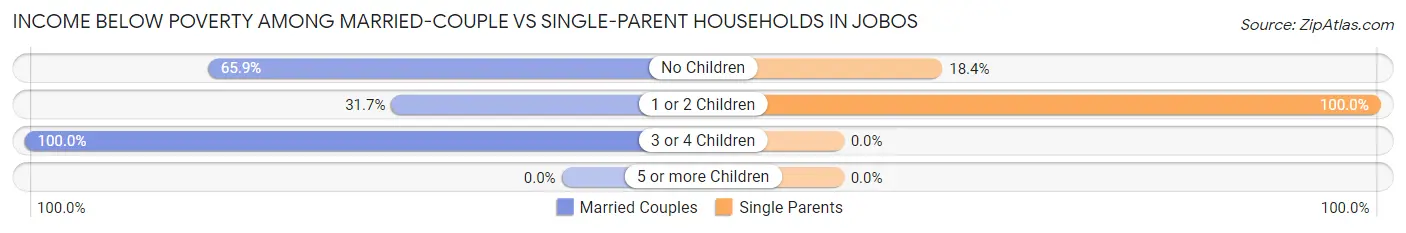
| Children | Married-Couple Families | Single-Parent Households |
| No Children | 189 (65.8%) | 18 (18.4%) |
| 1 or 2 Children | 13 (31.7%) | 65 (100.0%) |
| 3 or 4 Children | 20 (100.0%) | 0 (0.0%) |
| 5 or more Children | 0 (0.0%) | 0 (0.0%) |
| Total | 222 (63.8%) | 83 (50.9%) |
Race in Jobos
The most populous races in Jobos are Hispanic or Latino (1,632 | 100.0%), White / Caucasian (955 | 58.5%), and Black / African American (278 | 17.0%).
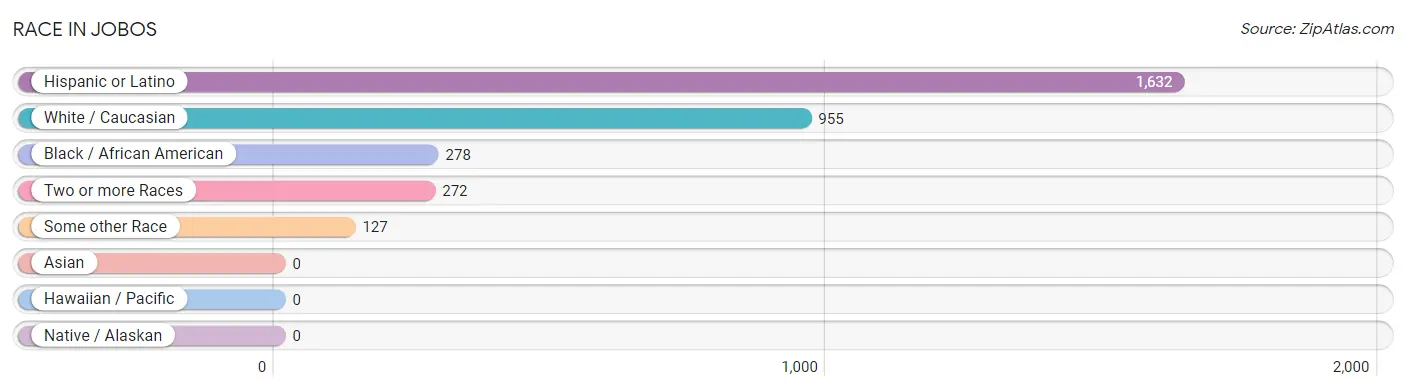
| Race | # Population | % Population |
| Asian | 0 | 0.0% |
| Black / African American | 278 | 17.0% |
| Hawaiian / Pacific | 0 | 0.0% |
| Hispanic or Latino | 1,632 | 100.0% |
| Native / Alaskan | 0 | 0.0% |
| White / Caucasian | 955 | 58.5% |
| Two or more Races | 272 | 16.7% |
| Some other Race | 127 | 7.8% |
| Total | 1,632 | 100.0% |
Ancestry in Jobos
The most populous ancestries reported in Jobos are Puerto Rican (1,597 | 97.9%), Spaniard (27 | 1.7%), American (10 | 0.6%), Burmese (8 | 0.5%), and Cuban (8 | 0.5%), together accounting for 101.1% of all Jobos residents.
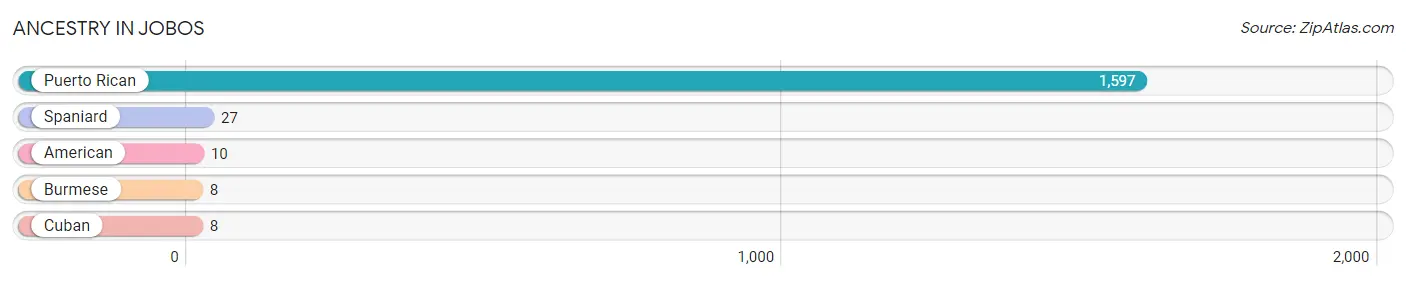
| Ancestry | # Population | % Population |
| American | 10 | 0.6% |
| Burmese | 8 | 0.5% |
| Cuban | 8 | 0.5% |
| Puerto Rican | 1,597 | 97.9% |
| Spaniard | 27 | 1.7% | View All 5 Rows |
Immigrants in Jobos

| Immigration Origin | # Population | % Population | View All 0 Rows |
Sex and Age in Jobos
Sex and Age in Jobos
The most populous age groups in Jobos are 65 to 69 Years (113 | 15.5%) for men and 60 to 64 Years (202 | 22.4%) for women.
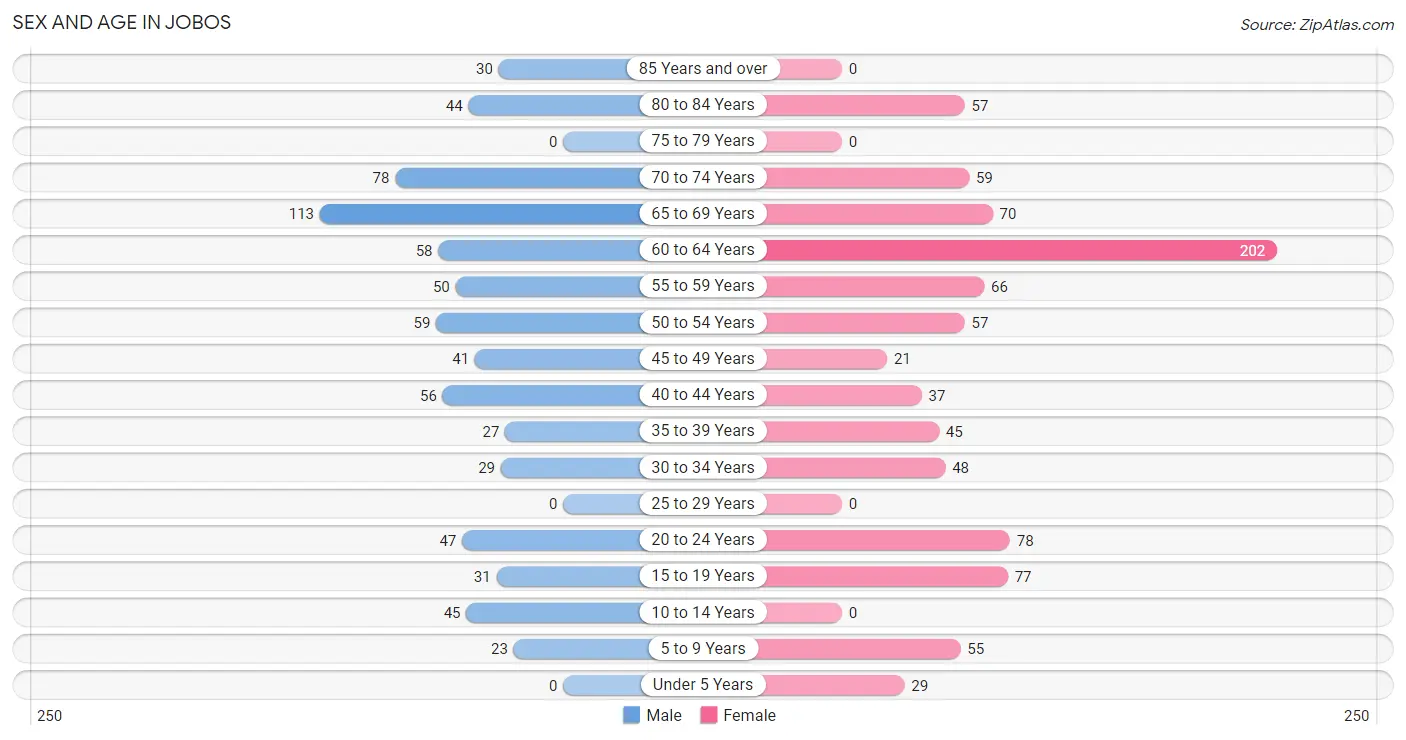
| Age Bracket | Male | Female |
| Under 5 Years | 0 (0.0%) | 29 (3.2%) |
| 5 to 9 Years | 23 (3.2%) | 55 (6.1%) |
| 10 to 14 Years | 45 (6.2%) | 0 (0.0%) |
| 15 to 19 Years | 31 (4.2%) | 77 (8.6%) |
| 20 to 24 Years | 47 (6.4%) | 78 (8.7%) |
| 25 to 29 Years | 0 (0.0%) | 0 (0.0%) |
| 30 to 34 Years | 29 (4.0%) | 48 (5.3%) |
| 35 to 39 Years | 27 (3.7%) | 45 (5.0%) |
| 40 to 44 Years | 56 (7.7%) | 37 (4.1%) |
| 45 to 49 Years | 41 (5.6%) | 21 (2.3%) |
| 50 to 54 Years | 59 (8.1%) | 57 (6.3%) |
| 55 to 59 Years | 50 (6.8%) | 66 (7.3%) |
| 60 to 64 Years | 58 (7.9%) | 202 (22.4%) |
| 65 to 69 Years | 113 (15.5%) | 70 (7.8%) |
| 70 to 74 Years | 78 (10.7%) | 59 (6.6%) |
| 75 to 79 Years | 0 (0.0%) | 0 (0.0%) |
| 80 to 84 Years | 44 (6.0%) | 57 (6.3%) |
| 85 Years and over | 30 (4.1%) | 0 (0.0%) |
| Total | 731 (100.0%) | 901 (100.0%) |
Families and Households in Jobos
Median Family Size in Jobos
The median family size in Jobos is 2.52 persons per family, with married-couple families (348 | 68.1%) accounting for the largest median family size of 2.59 persons per family. On the other hand, single male/father families (25 | 4.9%) represent the smallest median family size with 1.84 persons per family.
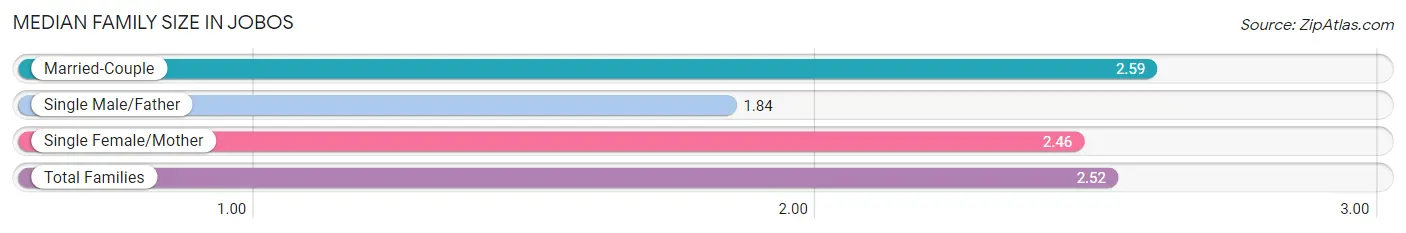
| Family Type | # Families | Family Size |
| Married-Couple | 348 (68.1%) | 2.59 |
| Single Male/Father | 25 (4.9%) | 1.84 |
| Single Female/Mother | 138 (27.0%) | 2.46 |
| Total Families | 511 (100.0%) | 2.52 |
Median Household Size in Jobos
The median household size in Jobos is 2.04 persons per household, with single female/mother households (138 | 17.2%) accounting for the largest median household size of 2.74 persons per household. non-family households (289 | 36.1%) represent the smallest median household size with 1.06 persons per household.
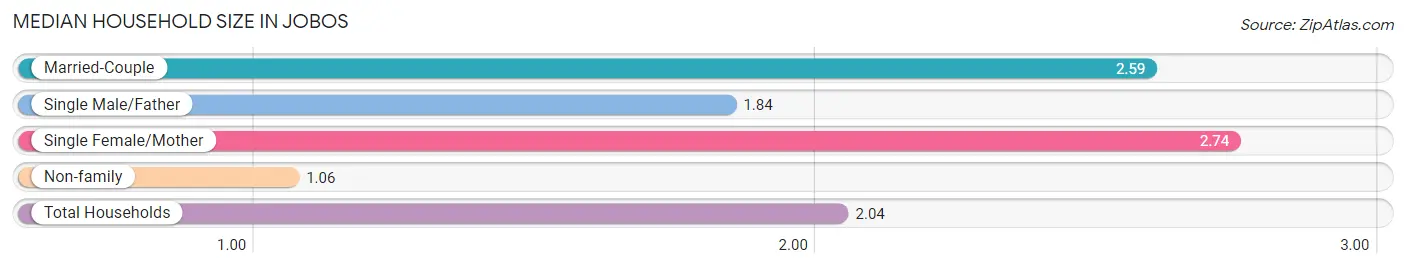
| Household Type | # Households | Household Size |
| Married-Couple | 348 (43.5%) | 2.59 |
| Single Male/Father | 25 (3.1%) | 1.84 |
| Single Female/Mother | 138 (17.2%) | 2.74 |
| Non-family | 289 (36.1%) | 1.06 |
| Total Households | 800 (100.0%) | 2.04 |
Household Size by Marriage Status in Jobos
Out of a total of 800 households in Jobos, 511 (63.9%) are family households, while 289 (36.1%) are nonfamily households. The most numerous type of family households are 2-person households, comprising 379, and the most common type of nonfamily households are 1-person households, comprising 270.
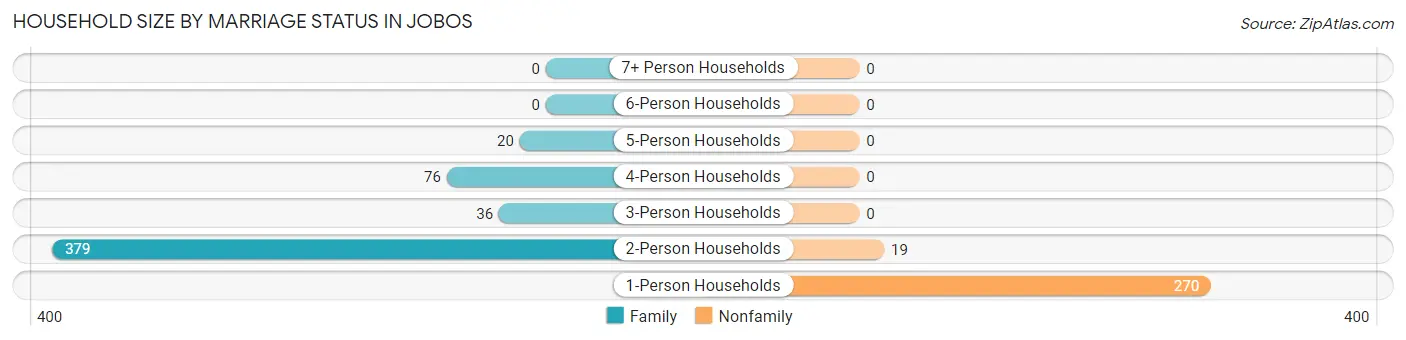
| Household Size | Family Households | Nonfamily Households |
| 1-Person Households | - | 270 (33.8%) |
| 2-Person Households | 379 (47.4%) | 19 (2.4%) |
| 3-Person Households | 36 (4.5%) | 0 (0.0%) |
| 4-Person Households | 76 (9.5%) | 0 (0.0%) |
| 5-Person Households | 20 (2.5%) | 0 (0.0%) |
| 6-Person Households | 0 (0.0%) | 0 (0.0%) |
| 7+ Person Households | 0 (0.0%) | 0 (0.0%) |
| Total | 511 (63.9%) | 289 (36.1%) |
Female Fertility in Jobos
Fertility by Age in Jobos
| Age Bracket | Women with Births | Births / 1,000 Women |
| 15 to 19 years | 0 (0.0%) | 0.0 |
| 20 to 34 years | 0 (0.0%) | 0.0 |
| 35 to 50 years | 0 (0.0%) | 0.0 |
| Total | 0 (0.0%) | 0.0 |
Fertility by Age by Marriage Status in Jobos
| Age Bracket | Married | Unmarried |
| 15 to 19 years | 0 (0.0%) | 0 (0.0%) |
| 20 to 34 years | 0 (0.0%) | 0 (0.0%) |
| 35 to 50 years | 0 (0.0%) | 0 (0.0%) |
| Total | 0 (0.0%) | 0 (0.0%) |
Fertility by Education in Jobos
| Educational Attainment | Women with Births | Births / 1,000 Women |
| Less than High School | 0 (0.0%) | 0.0 |
| High School Diploma | 0 (0.0%) | 0.0 |
| College or Associate's Degree | 0 (0.0%) | 0.0 |
| Bachelor's Degree | 0 (0.0%) | 0.0 |
| Graduate Degree | 0 (0.0%) | 0.0 |
| Total | 0 (0.0%) | 0.0 |
Fertility by Education by Marriage Status in Jobos
| Educational Attainment | Married | Unmarried |
| Less than High School | 0 (0.0%) | 0 (0.0%) |
| High School Diploma | 0 (0.0%) | 0 (0.0%) |
| College or Associate's Degree | 0 (0.0%) | 0 (0.0%) |
| Bachelor's Degree | 0 (0.0%) | 0 (0.0%) |
| Graduate Degree | 0 (0.0%) | 0 (0.0%) |
| Total | 0 (0.0%) | 0 (0.0%) |
Employment Characteristics in Jobos
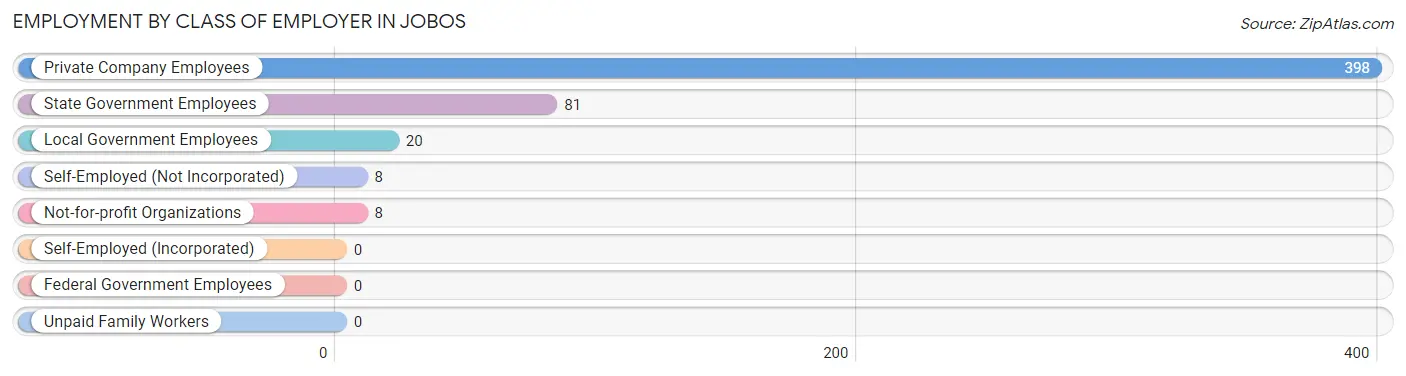
Employment by Class of Employer in Jobos
Among the 515 employed individuals in Jobos, private company employees (398 | 77.3%), state government employees (81 | 15.7%), and local government employees (20 | 3.9%) make up the most common classes of employment.
| Employer Class | # Employees | % Employees |
| Private Company Employees | 398 | 77.3% |
| Self-Employed (Incorporated) | 0 | 0.0% |
| Self-Employed (Not Incorporated) | 8 | 1.5% |
| Not-for-profit Organizations | 8 | 1.5% |
| Local Government Employees | 20 | 3.9% |
| State Government Employees | 81 | 15.7% |
| Federal Government Employees | 0 | 0.0% |
| Unpaid Family Workers | 0 | 0.0% |
| Total | 515 | 100.0% |
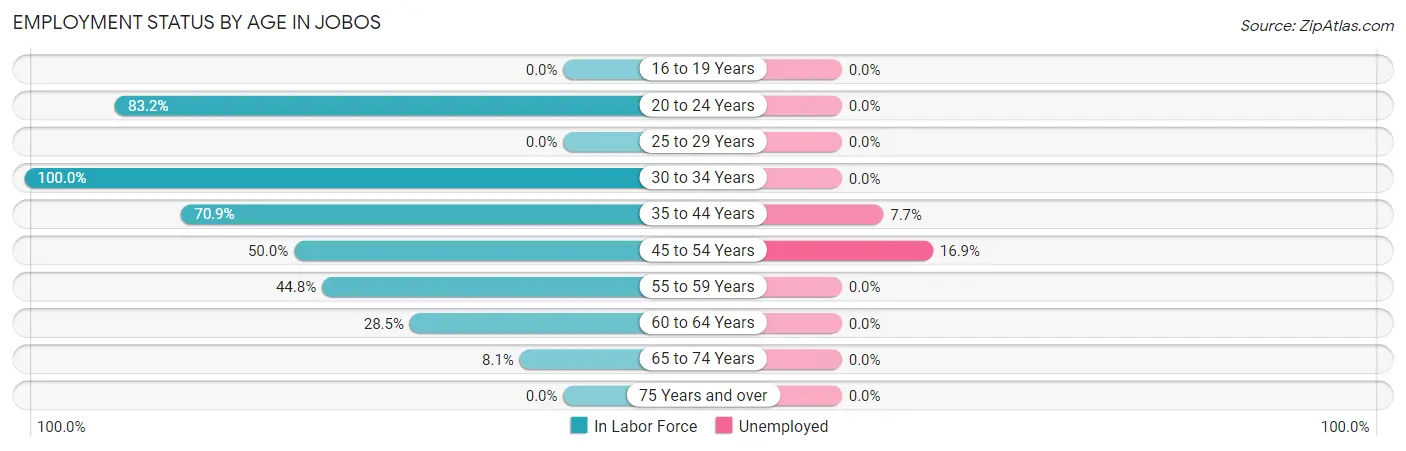
Employment Status by Age in Jobos
According to the labor force statistics for Jobos, out of the total population over 16 years of age (1,443), 37.4% or 540 individuals are in the labor force, with 4.5% or 24 of them unemployed. The age group with the highest labor force participation rate is 30 to 34 years, with 100.0% or 77 individuals in the labor force. Within the labor force, the 45 to 54 years age range has the highest percentage of unemployed individuals, with 16.9% or 15 of them being unemployed.
| Age Bracket | In Labor Force | Unemployed |
| 16 to 19 Years | 0 (0.0%) | 0 (0.0%) |
| 20 to 24 Years | 104 (83.2%) | 0 (0.0%) |
| 25 to 29 Years | 0 (0.0%) | 0 (0.0%) |
| 30 to 34 Years | 77 (100.0%) | 0 (0.0%) |
| 35 to 44 Years | 117 (70.9%) | 9 (7.7%) |
| 45 to 54 Years | 89 (50.0%) | 15 (16.9%) |
| 55 to 59 Years | 52 (44.8%) | 0 (0.0%) |
| 60 to 64 Years | 74 (28.5%) | 0 (0.0%) |
| 65 to 74 Years | 26 (8.1%) | 0 (0.0%) |
| 75 Years and over | 0 (0.0%) | 0 (0.0%) |
| Total | 540 (37.4%) | 24 (4.5%) |
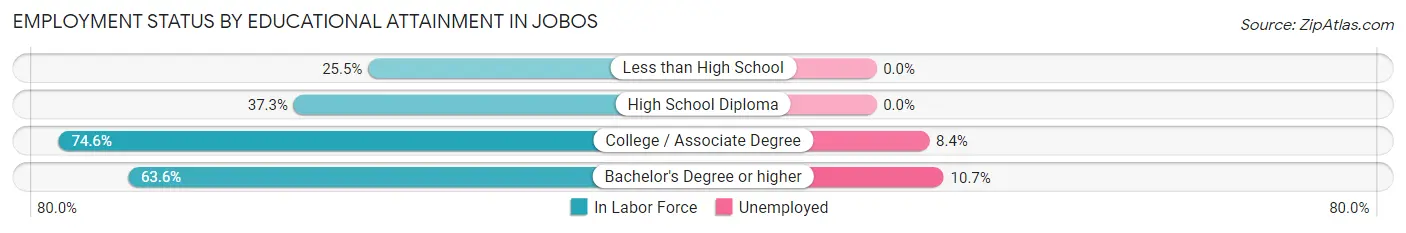
Employment Status by Educational Attainment in Jobos
According to labor force statistics for Jobos, 51.4% of individuals (409) out of the total population between 25 and 64 years of age (796) are in the labor force, with 5.9% or 24 of them being unemployed. The group with the highest labor force participation rate are those with the educational attainment of college / associate degree, with 74.6% or 179 individuals in the labor force. Within the labor force, individuals with bachelor's degree or higher education have the highest percentage of unemployment, with 10.7% or 9 of them being unemployed.
| Educational Attainment | In Labor Force | Unemployed |
| Less than High School | 26 (25.5%) | 0 (0.0%) |
| High School Diploma | 120 (37.3%) | 0 (0.0%) |
| College / Associate Degree | 179 (74.6%) | 20 (8.4%) |
| Bachelor's Degree or higher | 84 (63.6%) | 14 (10.7%) |
| Total | 409 (51.4%) | 47 (5.9%) |
Employment Occupations by Sex in Jobos
Management, Business, Science and Arts Occupations
The most common Management, Business, Science and Arts occupations in Jobos are Health Diagnosing & Treating (68 | 13.2%), Health Technologists (29 | 5.6%), and Management (8 | 1.5%).
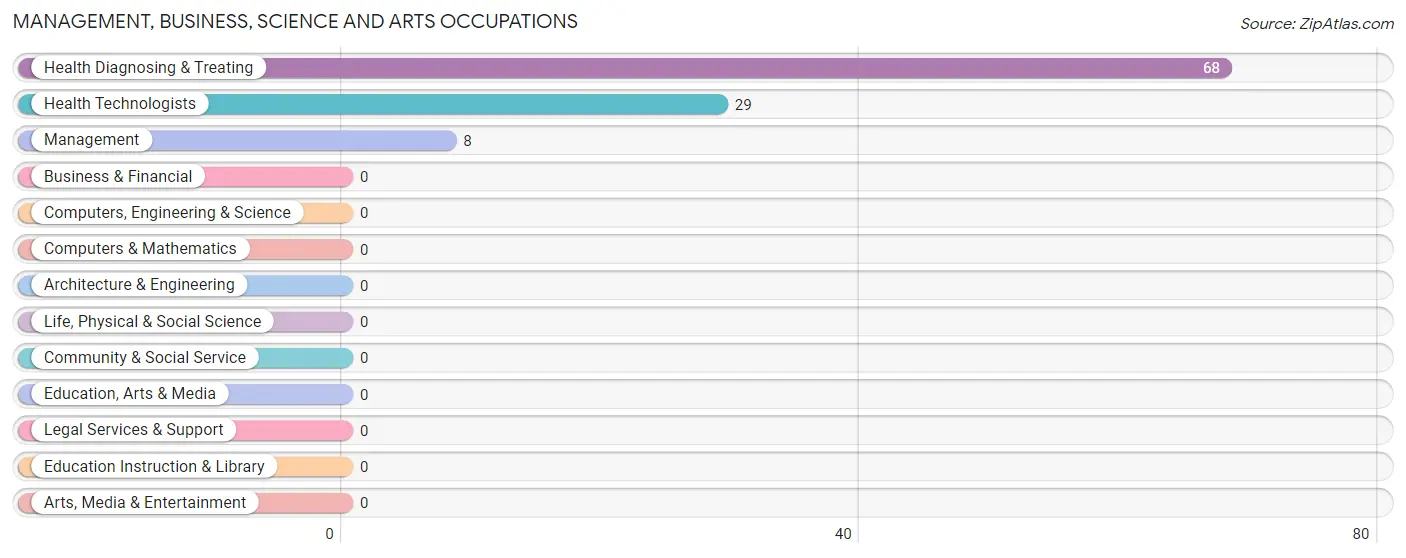
Management, Business, Science and Arts Occupations by Sex
Within the Management, Business, Science and Arts occupations in Jobos, the most male-oriented occupations are Management (100.0%), and Health Diagnosing & Treating (27.9%), while the most female-oriented occupations are Health Technologists (100.0%), and Health Diagnosing & Treating (72.1%).
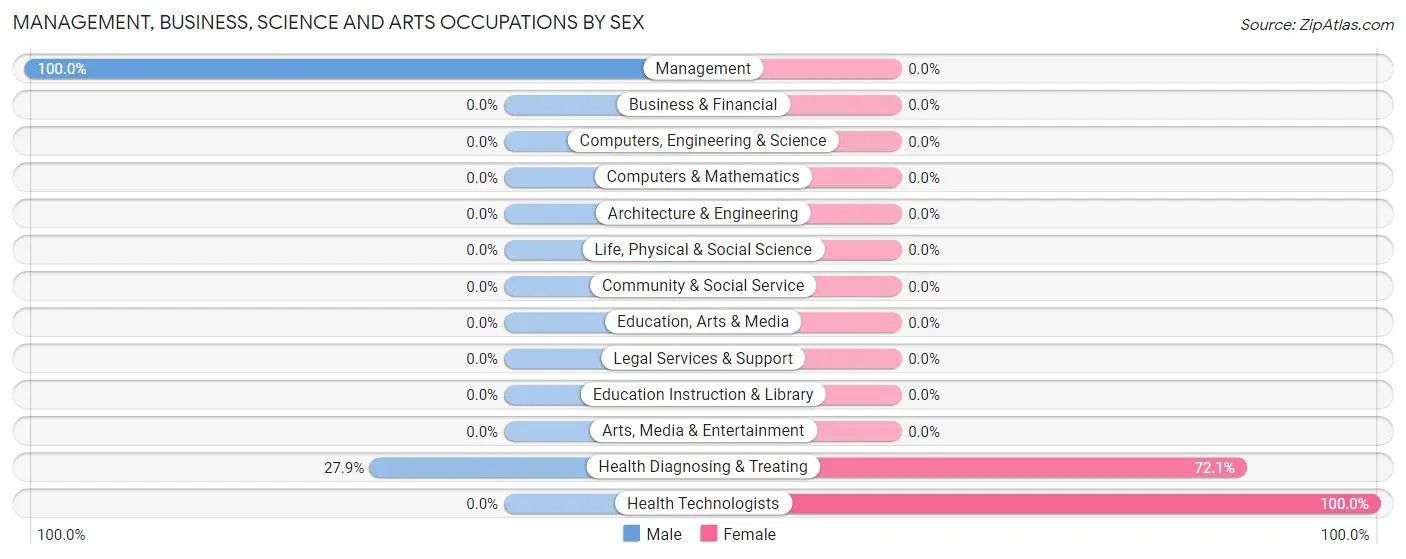
| Occupation | Male | Female |
| Management | 8 (100.0%) | 0 (0.0%) |
| Business & Financial | 0 (0.0%) | 0 (0.0%) |
| Computers, Engineering & Science | 0 (0.0%) | 0 (0.0%) |
| Computers & Mathematics | 0 (0.0%) | 0 (0.0%) |
| Architecture & Engineering | 0 (0.0%) | 0 (0.0%) |
| Life, Physical & Social Science | 0 (0.0%) | 0 (0.0%) |
| Community & Social Service | 0 (0.0%) | 0 (0.0%) |
| Education, Arts & Media | 0 (0.0%) | 0 (0.0%) |
| Legal Services & Support | 0 (0.0%) | 0 (0.0%) |
| Education Instruction & Library | 0 (0.0%) | 0 (0.0%) |
| Arts, Media & Entertainment | 0 (0.0%) | 0 (0.0%) |
| Health Diagnosing & Treating | 19 (27.9%) | 49 (72.1%) |
| Health Technologists | 0 (0.0%) | 29 (100.0%) |
| Total (Category) | 27 (35.5%) | 49 (64.5%) |
| Total (Overall) | 201 (39.0%) | 314 (61.0%) |
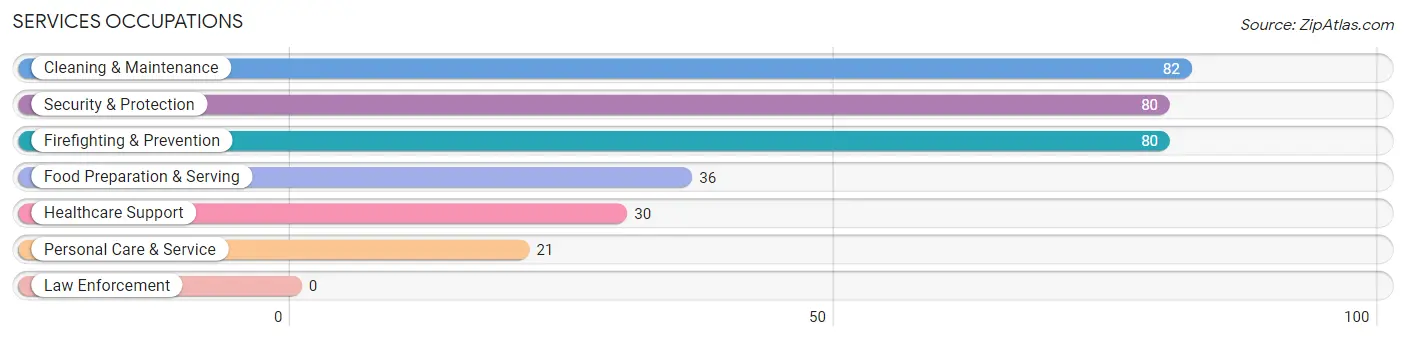
Services Occupations
The most common Services occupations in Jobos are Cleaning & Maintenance (82 | 15.9%), Security & Protection (80 | 15.5%), Firefighting & Prevention (80 | 15.5%), Food Preparation & Serving (36 | 7.0%), and Healthcare Support (30 | 5.8%).
Services Occupations by Sex
Within the Services occupations in Jobos, the most male-oriented occupations are Cleaning & Maintenance (57.3%), Security & Protection (40.0%), and Firefighting & Prevention (40.0%), while the most female-oriented occupations are Healthcare Support (100.0%), Food Preparation & Serving (100.0%), and Personal Care & Service (100.0%).
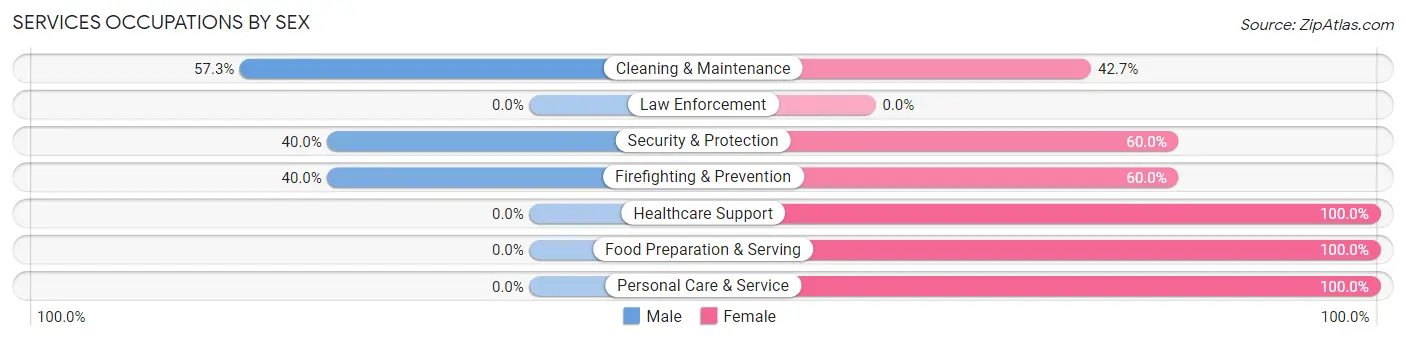
| Occupation | Male | Female |
| Healthcare Support | 0 (0.0%) | 30 (100.0%) |
| Security & Protection | 32 (40.0%) | 48 (60.0%) |
| Firefighting & Prevention | 32 (40.0%) | 48 (60.0%) |
| Law Enforcement | 0 (0.0%) | 0 (0.0%) |
| Food Preparation & Serving | 0 (0.0%) | 36 (100.0%) |
| Cleaning & Maintenance | 47 (57.3%) | 35 (42.7%) |
| Personal Care & Service | 0 (0.0%) | 21 (100.0%) |
| Total (Category) | 79 (31.7%) | 170 (68.3%) |
| Total (Overall) | 201 (39.0%) | 314 (61.0%) |
Sales and Office Occupations
The most common Sales and Office occupations in Jobos are Sales & Related (8 | 1.5%), and Office & Administration (8 | 1.5%).
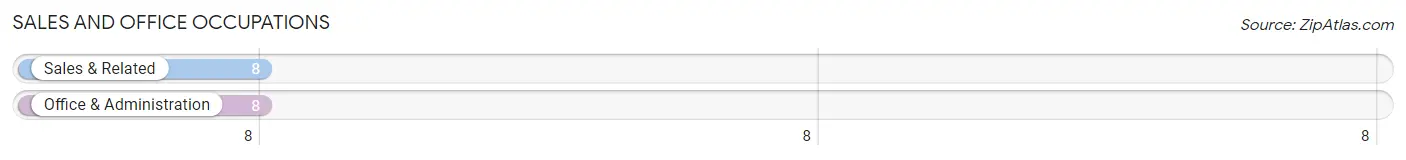
Sales and Office Occupations by Sex
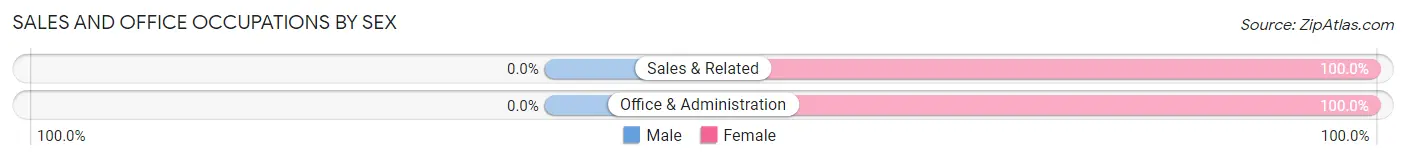
| Occupation | Male | Female |
| Sales & Related | 0 (0.0%) | 8 (100.0%) |
| Office & Administration | 0 (0.0%) | 8 (100.0%) |
| Total (Category) | 0 (0.0%) | 16 (100.0%) |
| Total (Overall) | 201 (39.0%) | 314 (61.0%) |
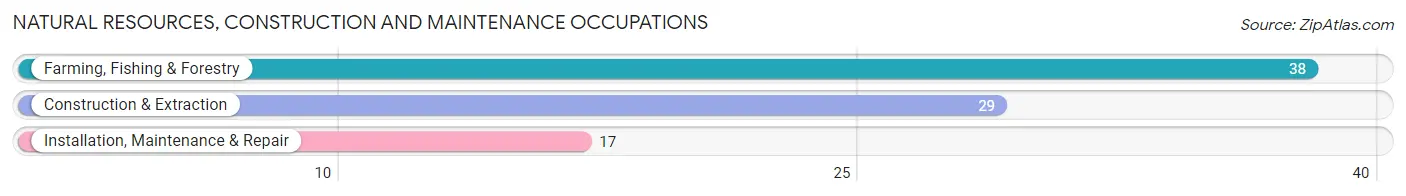
Natural Resources, Construction and Maintenance Occupations
The most common Natural Resources, Construction and Maintenance occupations in Jobos are Farming, Fishing & Forestry (38 | 7.4%), Construction & Extraction (29 | 5.6%), and Installation, Maintenance & Repair (17 | 3.3%).
Natural Resources, Construction and Maintenance Occupations by Sex
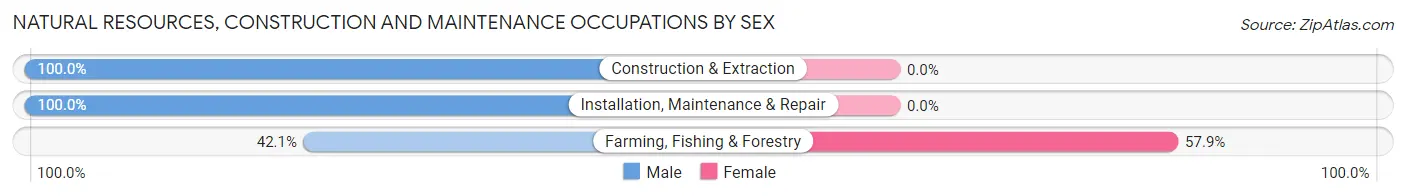
| Occupation | Male | Female |
| Farming, Fishing & Forestry | 16 (42.1%) | 22 (57.9%) |
| Construction & Extraction | 29 (100.0%) | 0 (0.0%) |
| Installation, Maintenance & Repair | 17 (100.0%) | 0 (0.0%) |
| Total (Category) | 62 (73.8%) | 22 (26.2%) |
| Total (Overall) | 201 (39.0%) | 314 (61.0%) |
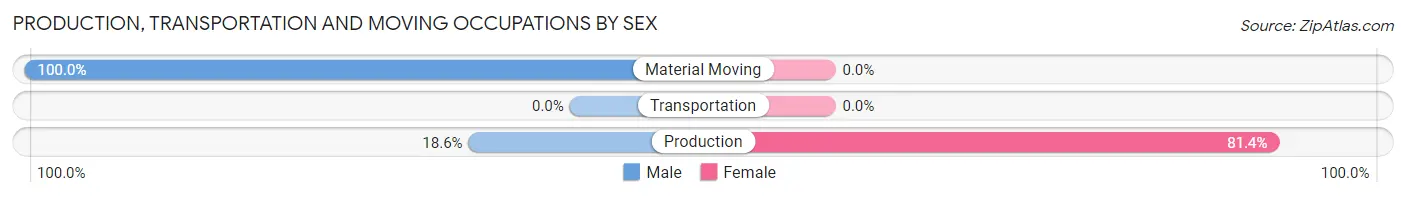
Production, Transportation and Moving Occupations
The most common Production, Transportation and Moving occupations in Jobos are Production (70 | 13.6%), and Material Moving (20 | 3.9%).
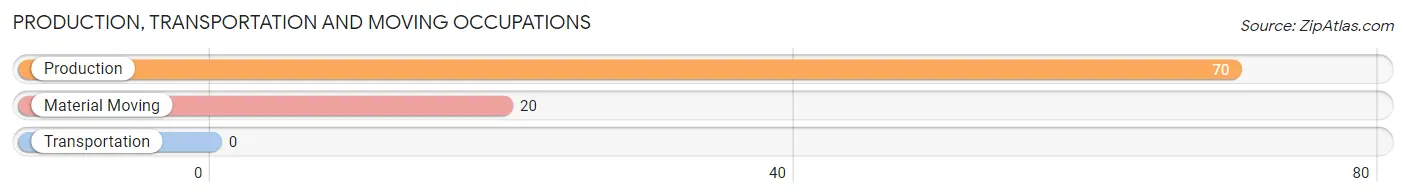
Production, Transportation and Moving Occupations by Sex
| Occupation | Male | Female |
| Production | 13 (18.6%) | 57 (81.4%) |
| Transportation | 0 (0.0%) | 0 (0.0%) |
| Material Moving | 20 (100.0%) | 0 (0.0%) |
| Total (Category) | 33 (36.7%) | 57 (63.3%) |
| Total (Overall) | 201 (39.0%) | 314 (61.0%) |
Employment Industries by Sex in Jobos
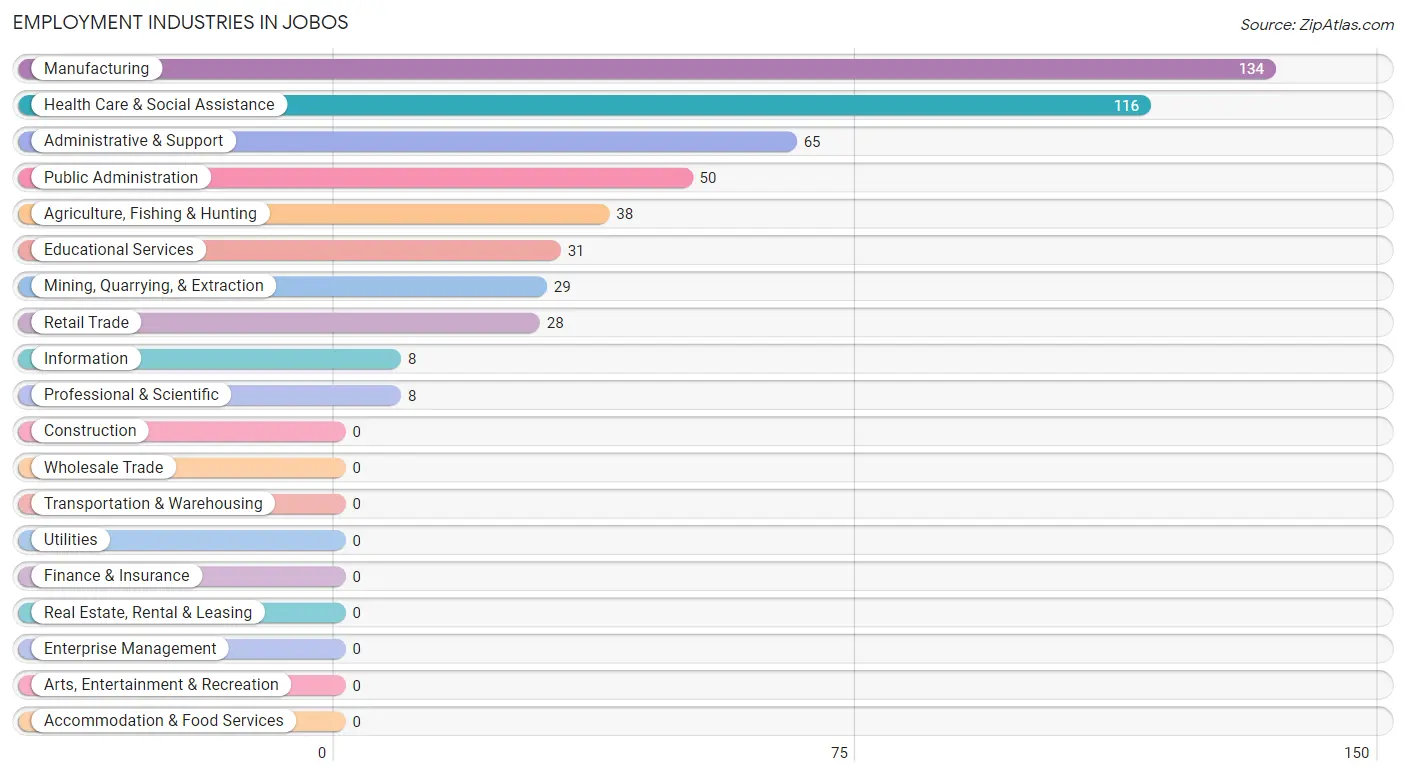
Employment Industries in Jobos
The major employment industries in Jobos include Manufacturing (134 | 26.0%), Health Care & Social Assistance (116 | 22.5%), Administrative & Support (65 | 12.6%), Public Administration (50 | 9.7%), and Agriculture, Fishing & Hunting (38 | 7.4%).
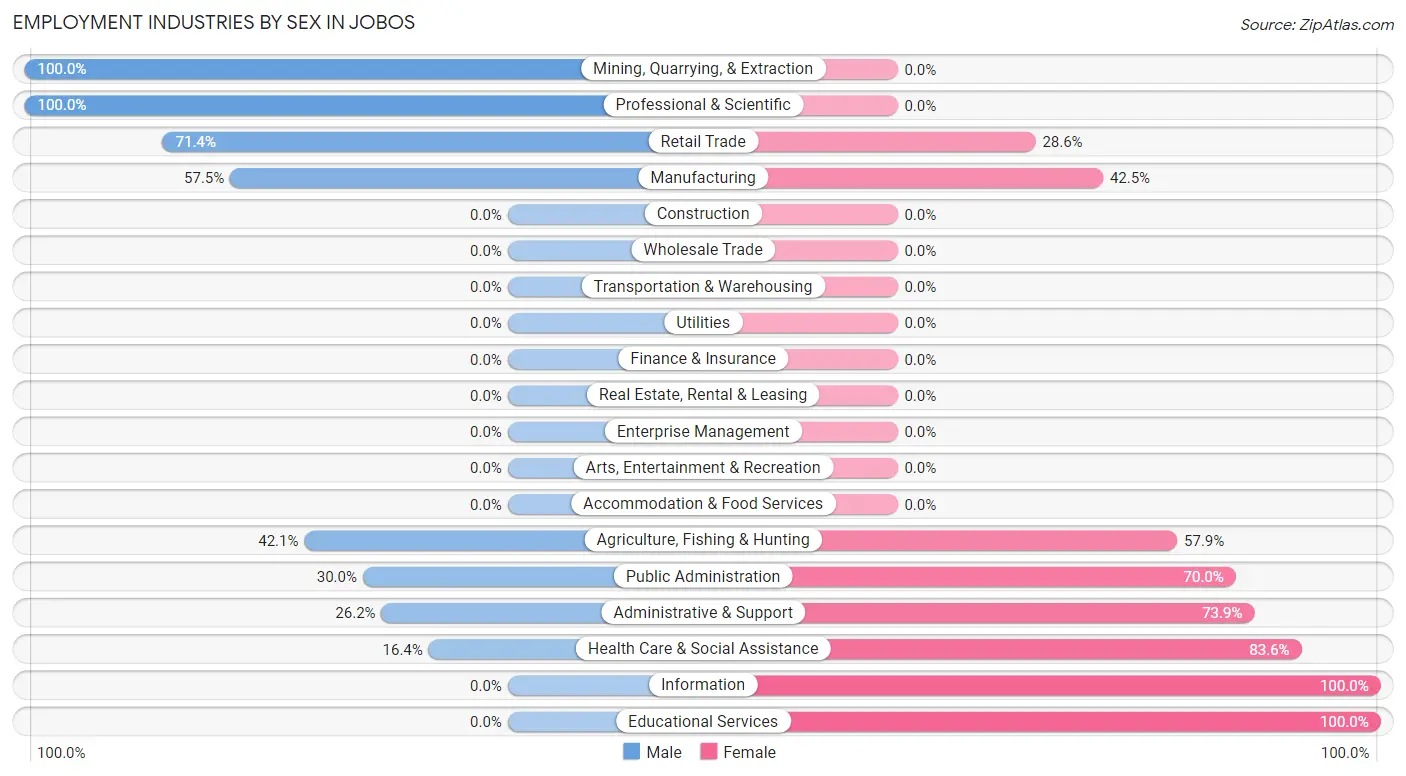
Employment Industries by Sex in Jobos
The Jobos industries that see more men than women are Mining, Quarrying, & Extraction (100.0%), Professional & Scientific (100.0%), and Retail Trade (71.4%), whereas the industries that tend to have a higher number of women are Information (100.0%), Educational Services (100.0%), and Health Care & Social Assistance (83.6%).
| Industry | Male | Female |
| Agriculture, Fishing & Hunting | 16 (42.1%) | 22 (57.9%) |
| Mining, Quarrying, & Extraction | 29 (100.0%) | 0 (0.0%) |
| Construction | 0 (0.0%) | 0 (0.0%) |
| Manufacturing | 77 (57.5%) | 57 (42.5%) |
| Wholesale Trade | 0 (0.0%) | 0 (0.0%) |
| Retail Trade | 20 (71.4%) | 8 (28.6%) |
| Transportation & Warehousing | 0 (0.0%) | 0 (0.0%) |
| Utilities | 0 (0.0%) | 0 (0.0%) |
| Information | 0 (0.0%) | 8 (100.0%) |
| Finance & Insurance | 0 (0.0%) | 0 (0.0%) |
| Real Estate, Rental & Leasing | 0 (0.0%) | 0 (0.0%) |
| Professional & Scientific | 8 (100.0%) | 0 (0.0%) |
| Enterprise Management | 0 (0.0%) | 0 (0.0%) |
| Administrative & Support | 17 (26.2%) | 48 (73.9%) |
| Educational Services | 0 (0.0%) | 31 (100.0%) |
| Health Care & Social Assistance | 19 (16.4%) | 97 (83.6%) |
| Arts, Entertainment & Recreation | 0 (0.0%) | 0 (0.0%) |
| Accommodation & Food Services | 0 (0.0%) | 0 (0.0%) |
| Public Administration | 15 (30.0%) | 35 (70.0%) |
| Total | 201 (39.0%) | 314 (61.0%) |
Education in Jobos
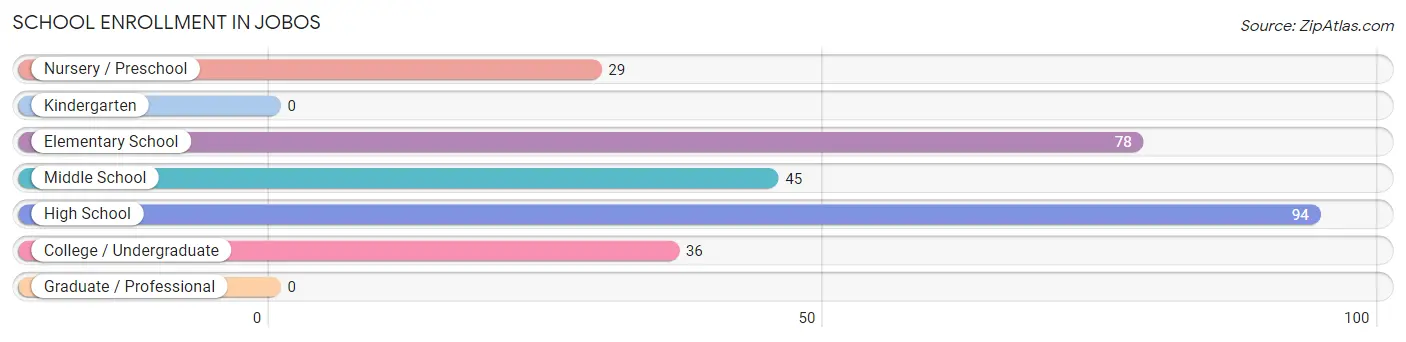
School Enrollment in Jobos
The most common levels of schooling among the 282 students in Jobos are high school (94 | 33.3%), elementary school (78 | 27.7%), and middle school (45 | 16.0%).
| School Level | # Students | % Students |
| Nursery / Preschool | 29 | 10.3% |
| Kindergarten | 0 | 0.0% |
| Elementary School | 78 | 27.7% |
| Middle School | 45 | 16.0% |
| High School | 94 | 33.3% |
| College / Undergraduate | 36 | 12.8% |
| Graduate / Professional | 0 | 0.0% |
| Total | 282 | 100.0% |
School Enrollment by Age by Funding Source in Jobos
Out of a total of 282 students who are enrolled in schools in Jobos, 32 (11.3%) attend a private institution, while the remaining 250 (88.7%) are enrolled in public schools. The age group of 35 years and over has the highest likelihood of being enrolled in private schools, with 22 (100.0% in the age bracket) enrolled. Conversely, the age group of 3 to 4 year olds has the lowest likelihood of being enrolled in a private school, with 29 (100.0% in the age bracket) attending a public institution.
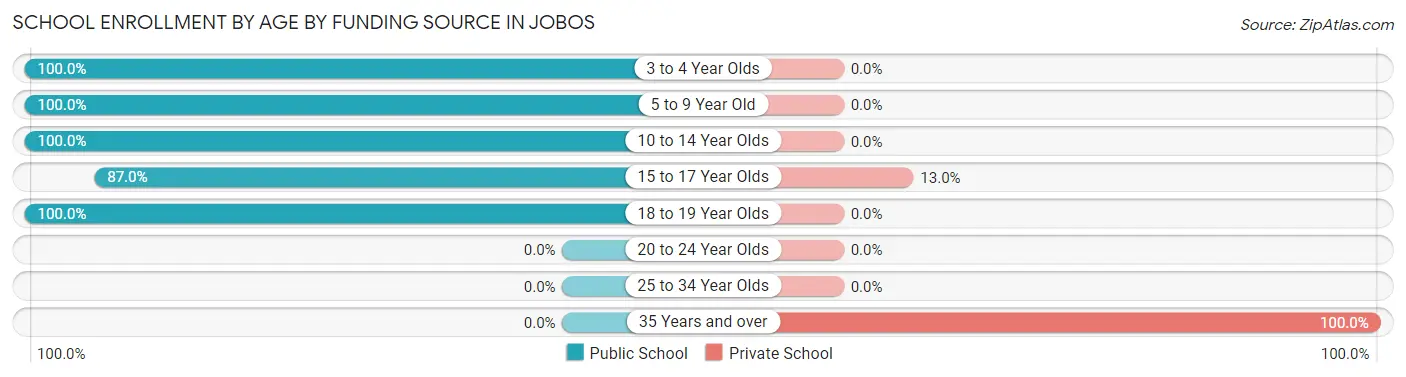
| Age Bracket | Public School | Private School |
| 3 to 4 Year Olds | 29 (100.0%) | 0 (0.0%) |
| 5 to 9 Year Old | 78 (100.0%) | 0 (0.0%) |
| 10 to 14 Year Olds | 45 (100.0%) | 0 (0.0%) |
| 15 to 17 Year Olds | 67 (87.0%) | 10 (13.0%) |
| 18 to 19 Year Olds | 31 (100.0%) | 0 (0.0%) |
| 20 to 24 Year Olds | 0 (0.0%) | 0 (0.0%) |
| 25 to 34 Year Olds | 0 (0.0%) | 0 (0.0%) |
| 35 Years and over | 0 (0.0%) | 22 (100.0%) |
| Total | 250 (88.7%) | 32 (11.3%) |
Educational Attainment by Field of Study in Jobos
Science & technology (73 | 55.3%), business (42 | 31.8%), bio, nature & agricultural (9 | 6.8%), and engineering (8 | 6.1%) are the most common fields of study among 132 individuals in Jobos who have obtained a bachelor's degree or higher.
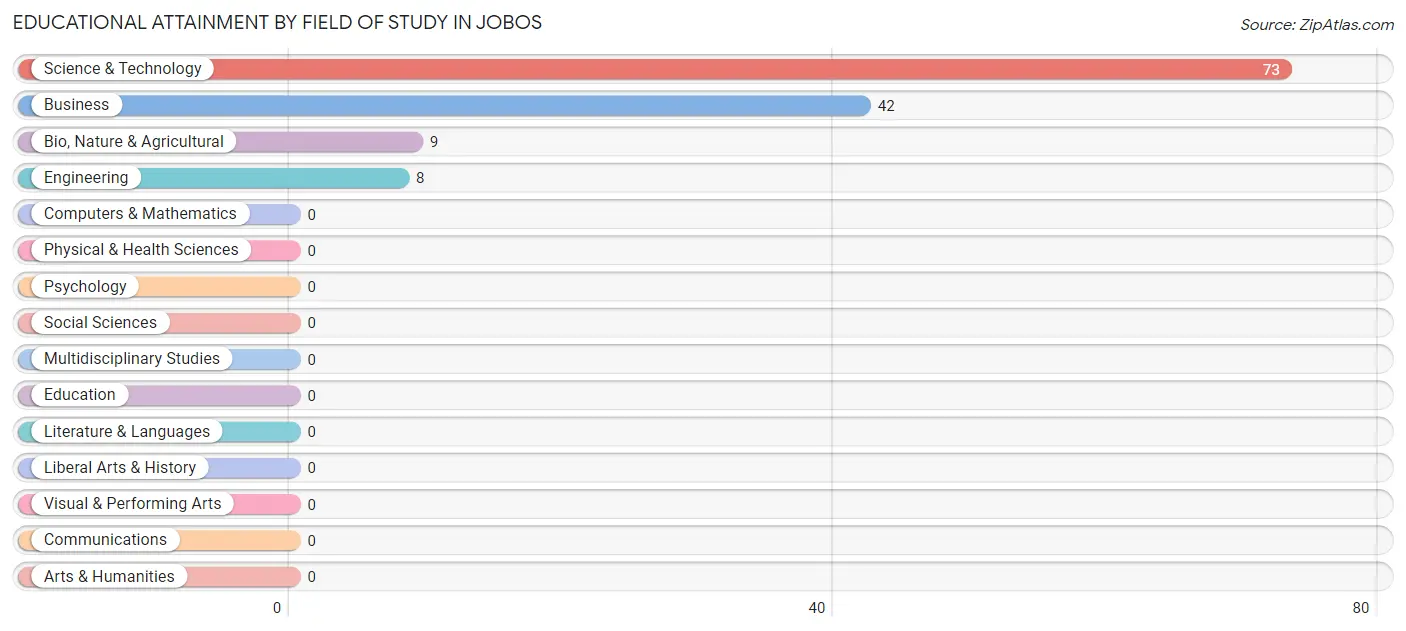
| Field of Study | # Graduates | % Graduates |
| Computers & Mathematics | 0 | 0.0% |
| Bio, Nature & Agricultural | 9 | 6.8% |
| Physical & Health Sciences | 0 | 0.0% |
| Psychology | 0 | 0.0% |
| Social Sciences | 0 | 0.0% |
| Engineering | 8 | 6.1% |
| Multidisciplinary Studies | 0 | 0.0% |
| Science & Technology | 73 | 55.3% |
| Business | 42 | 31.8% |
| Education | 0 | 0.0% |
| Literature & Languages | 0 | 0.0% |
| Liberal Arts & History | 0 | 0.0% |
| Visual & Performing Arts | 0 | 0.0% |
| Communications | 0 | 0.0% |
| Arts & Humanities | 0 | 0.0% |
| Total | 132 | 100.0% |
Transportation & Commute in Jobos
Vehicle Availability by Sex in Jobos
The most prevalent vehicle ownership categories in Jobos are males with 2 vehicles (134, accounting for 66.7%) and females with 2 vehicles (177, making up 42.7%).
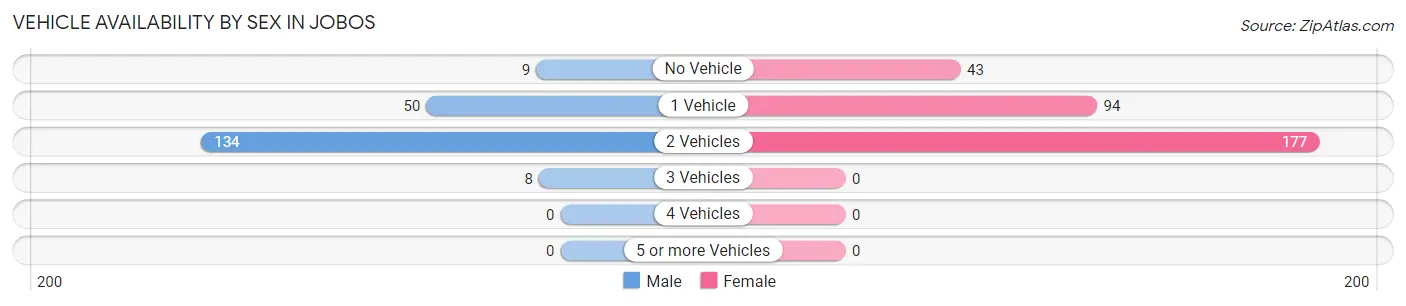
| Vehicles Available | Male | Female |
| No Vehicle | 9 (4.5%) | 43 (13.7%) |
| 1 Vehicle | 50 (24.9%) | 94 (29.9%) |
| 2 Vehicles | 134 (66.7%) | 177 (56.4%) |
| 3 Vehicles | 8 (4.0%) | 0 (0.0%) |
| 4 Vehicles | 0 (0.0%) | 0 (0.0%) |
| 5 or more Vehicles | 0 (0.0%) | 0 (0.0%) |
| Total | 201 (100.0%) | 314 (100.0%) |
Commute Time in Jobos
The most frequently occuring commute durations in Jobos are 5 to 9 minutes (112 commuters, 24.0%), 15 to 19 minutes (109 commuters, 23.3%), and 20 to 24 minutes (95 commuters, 20.3%).
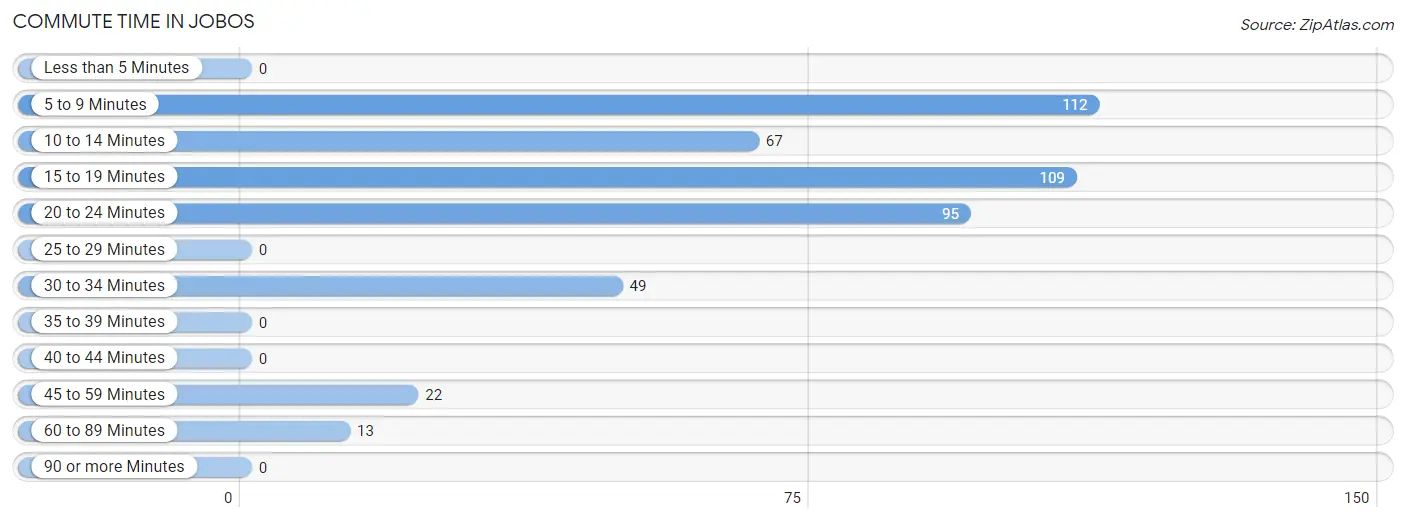
| Commute Time | # Commuters | % Commuters |
| Less than 5 Minutes | 0 | 0.0% |
| 5 to 9 Minutes | 112 | 24.0% |
| 10 to 14 Minutes | 67 | 14.3% |
| 15 to 19 Minutes | 109 | 23.3% |
| 20 to 24 Minutes | 95 | 20.3% |
| 25 to 29 Minutes | 0 | 0.0% |
| 30 to 34 Minutes | 49 | 10.5% |
| 35 to 39 Minutes | 0 | 0.0% |
| 40 to 44 Minutes | 0 | 0.0% |
| 45 to 59 Minutes | 22 | 4.7% |
| 60 to 89 Minutes | 13 | 2.8% |
| 90 or more Minutes | 0 | 0.0% |
Commute Time by Sex in Jobos
The most common commute times in Jobos are 15 to 19 minutes (75 commuters, 37.3%) for males and 20 to 24 minutes (75 commuters, 28.2%) for females.
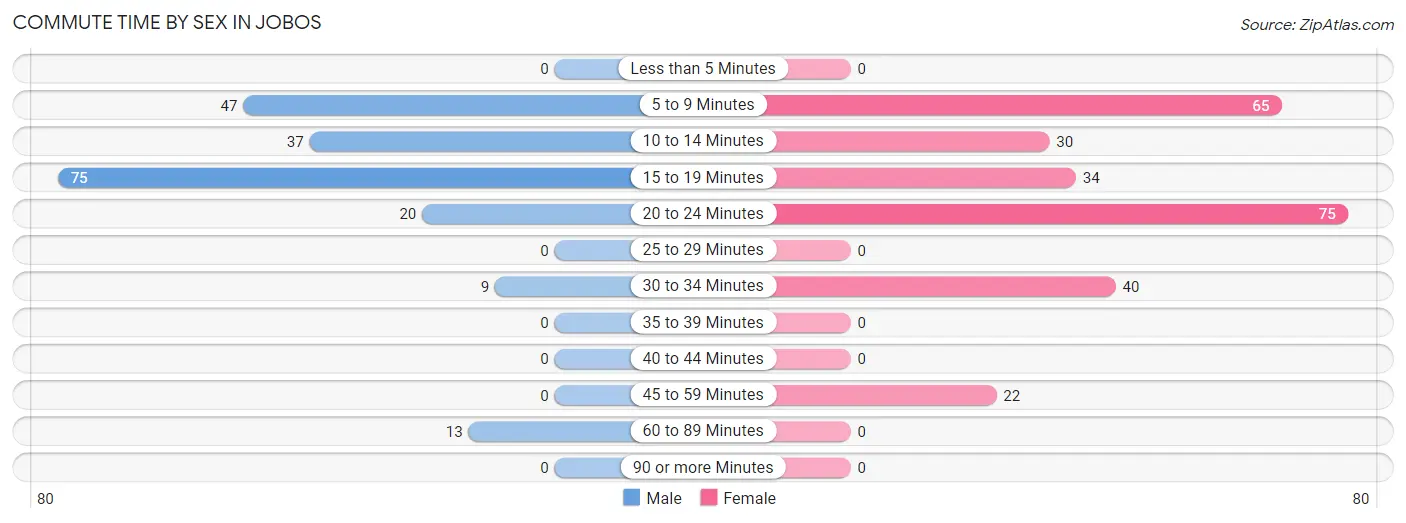
| Commute Time | Male | Female |
| Less than 5 Minutes | 0 (0.0%) | 0 (0.0%) |
| 5 to 9 Minutes | 47 (23.4%) | 65 (24.4%) |
| 10 to 14 Minutes | 37 (18.4%) | 30 (11.3%) |
| 15 to 19 Minutes | 75 (37.3%) | 34 (12.8%) |
| 20 to 24 Minutes | 20 (10.0%) | 75 (28.2%) |
| 25 to 29 Minutes | 0 (0.0%) | 0 (0.0%) |
| 30 to 34 Minutes | 9 (4.5%) | 40 (15.0%) |
| 35 to 39 Minutes | 0 (0.0%) | 0 (0.0%) |
| 40 to 44 Minutes | 0 (0.0%) | 0 (0.0%) |
| 45 to 59 Minutes | 0 (0.0%) | 22 (8.3%) |
| 60 to 89 Minutes | 13 (6.5%) | 0 (0.0%) |
| 90 or more Minutes | 0 (0.0%) | 0 (0.0%) |
Time of Departure to Work by Sex in Jobos
The most frequent times of departure to work in Jobos are 6:30 AM to 6:59 AM (84, 41.8%) for males and 6:30 AM to 6:59 AM (86, 32.3%) for females.
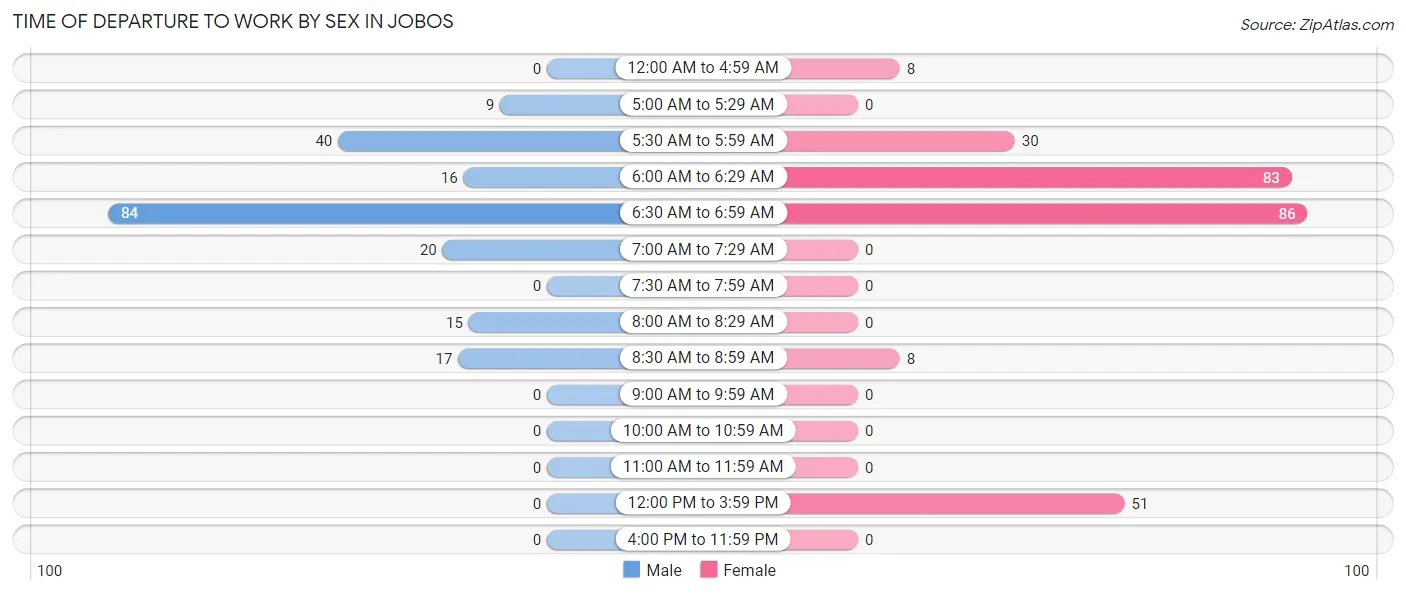
| Time of Departure | Male | Female |
| 12:00 AM to 4:59 AM | 0 (0.0%) | 8 (3.0%) |
| 5:00 AM to 5:29 AM | 9 (4.5%) | 0 (0.0%) |
| 5:30 AM to 5:59 AM | 40 (19.9%) | 30 (11.3%) |
| 6:00 AM to 6:29 AM | 16 (8.0%) | 83 (31.2%) |
| 6:30 AM to 6:59 AM | 84 (41.8%) | 86 (32.3%) |
| 7:00 AM to 7:29 AM | 20 (10.0%) | 0 (0.0%) |
| 7:30 AM to 7:59 AM | 0 (0.0%) | 0 (0.0%) |
| 8:00 AM to 8:29 AM | 15 (7.5%) | 0 (0.0%) |
| 8:30 AM to 8:59 AM | 17 (8.5%) | 8 (3.0%) |
| 9:00 AM to 9:59 AM | 0 (0.0%) | 0 (0.0%) |
| 10:00 AM to 10:59 AM | 0 (0.0%) | 0 (0.0%) |
| 11:00 AM to 11:59 AM | 0 (0.0%) | 0 (0.0%) |
| 12:00 PM to 3:59 PM | 0 (0.0%) | 51 (19.2%) |
| 4:00 PM to 11:59 PM | 0 (0.0%) | 0 (0.0%) |
| Total | 201 (100.0%) | 266 (100.0%) |
Housing Occupancy in Jobos
Occupancy by Ownership in Jobos
Of the total 800 dwellings in Jobos, owner-occupied units account for 632 (79.0%), while renter-occupied units make up 168 (21.0%).
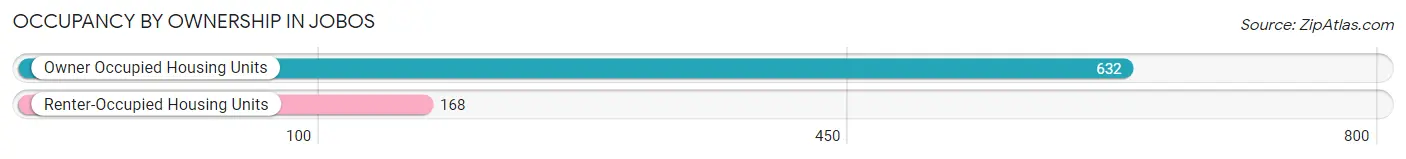
| Occupancy | # Housing Units | % Housing Units |
| Owner Occupied Housing Units | 632 | 79.0% |
| Renter-Occupied Housing Units | 168 | 21.0% |
| Total Occupied Housing Units | 800 | 100.0% |
Occupancy by Household Size in Jobos
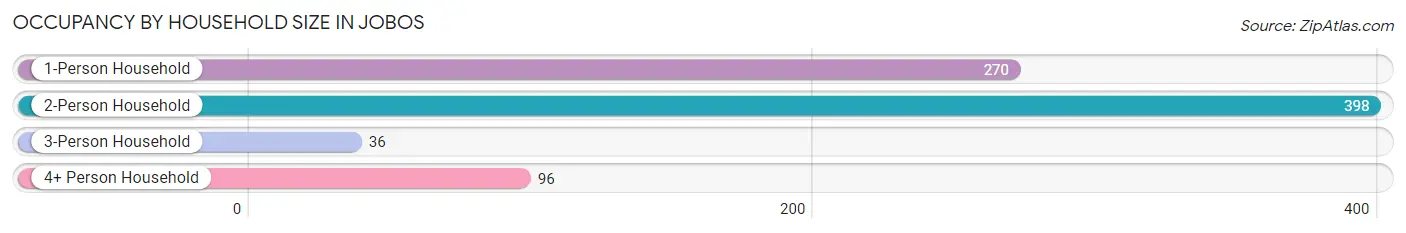
| Household Size | # Housing Units | % Housing Units |
| 1-Person Household | 270 | 33.8% |
| 2-Person Household | 398 | 49.7% |
| 3-Person Household | 36 | 4.5% |
| 4+ Person Household | 96 | 12.0% |
| Total Housing Units | 800 | 100.0% |
Occupancy by Ownership by Household Size in Jobos
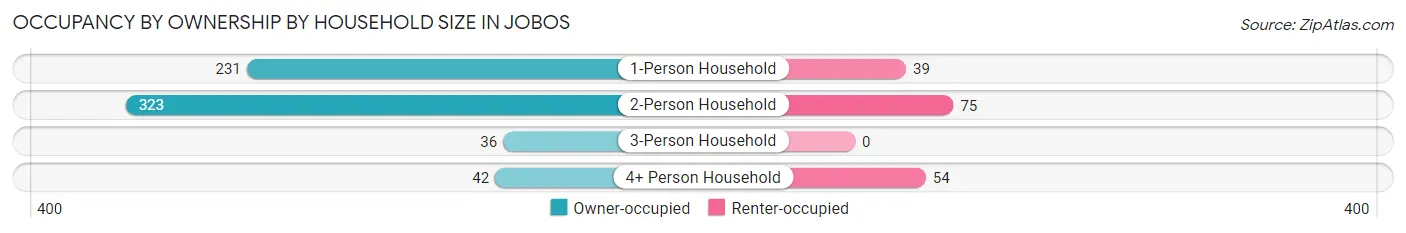
| Household Size | Owner-occupied | Renter-occupied |
| 1-Person Household | 231 (85.6%) | 39 (14.4%) |
| 2-Person Household | 323 (81.2%) | 75 (18.8%) |
| 3-Person Household | 36 (100.0%) | 0 (0.0%) |
| 4+ Person Household | 42 (43.8%) | 54 (56.2%) |
| Total Housing Units | 632 (79.0%) | 168 (21.0%) |
Occupancy by Educational Attainment in Jobos
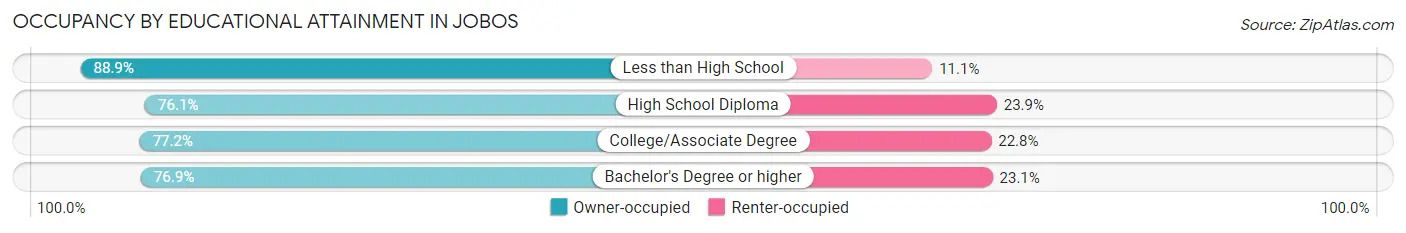
| Household Size | Owner-occupied | Renter-occupied |
| Less than High School | 144 (88.9%) | 18 (11.1%) |
| High School Diploma | 296 (76.1%) | 93 (23.9%) |
| College/Associate Degree | 142 (77.2%) | 42 (22.8%) |
| Bachelor's Degree or higher | 50 (76.9%) | 15 (23.1%) |
Occupancy by Age of Householder in Jobos
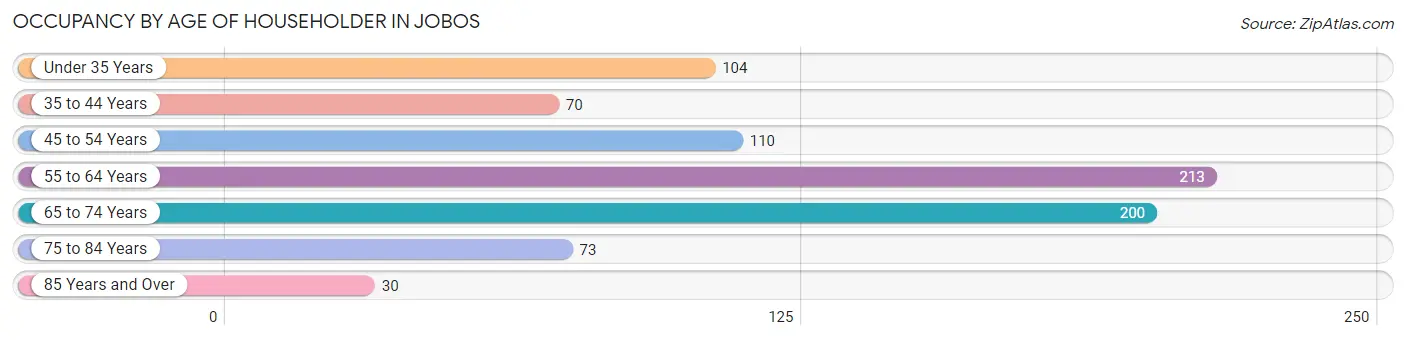
| Age Bracket | # Households | % Households |
| Under 35 Years | 104 | 13.0% |
| 35 to 44 Years | 70 | 8.7% |
| 45 to 54 Years | 110 | 13.8% |
| 55 to 64 Years | 213 | 26.6% |
| 65 to 74 Years | 200 | 25.0% |
| 75 to 84 Years | 73 | 9.1% |
| 85 Years and Over | 30 | 3.7% |
| Total | 800 | 100.0% |
Housing Finances in Jobos
Median Income by Occupancy in Jobos
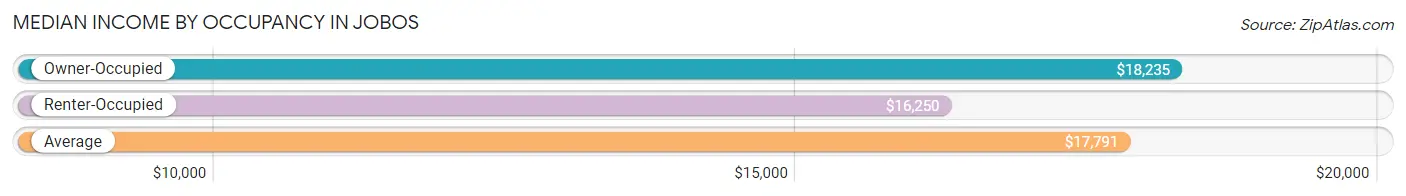
| Occupancy Type | # Households | Median Income |
| Owner-Occupied | 632 (79.0%) | $18,235 |
| Renter-Occupied | 168 (21.0%) | $16,250 |
| Average | 800 (100.0%) | $17,791 |
Occupancy by Householder Income Bracket in Jobos
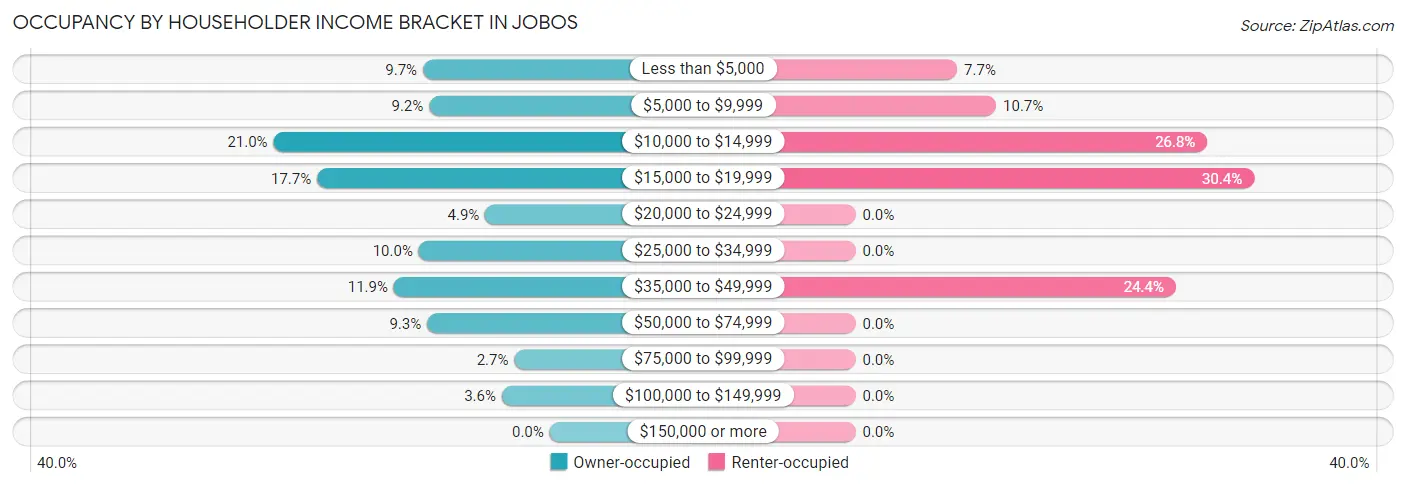
| Income Bracket | Owner-occupied | Renter-occupied |
| Less than $5,000 | 61 (9.7%) | 13 (7.7%) |
| $5,000 to $9,999 | 58 (9.2%) | 18 (10.7%) |
| $10,000 to $14,999 | 133 (21.0%) | 45 (26.8%) |
| $15,000 to $19,999 | 112 (17.7%) | 51 (30.4%) |
| $20,000 to $24,999 | 31 (4.9%) | 0 (0.0%) |
| $25,000 to $34,999 | 63 (10.0%) | 0 (0.0%) |
| $35,000 to $49,999 | 75 (11.9%) | 41 (24.4%) |
| $50,000 to $74,999 | 59 (9.3%) | 0 (0.0%) |
| $75,000 to $99,999 | 17 (2.7%) | 0 (0.0%) |
| $100,000 to $149,999 | 23 (3.6%) | 0 (0.0%) |
| $150,000 or more | 0 (0.0%) | 0 (0.0%) |
| Total | 632 (100.0%) | 168 (100.0%) |
Monthly Housing Cost Tiers in Jobos
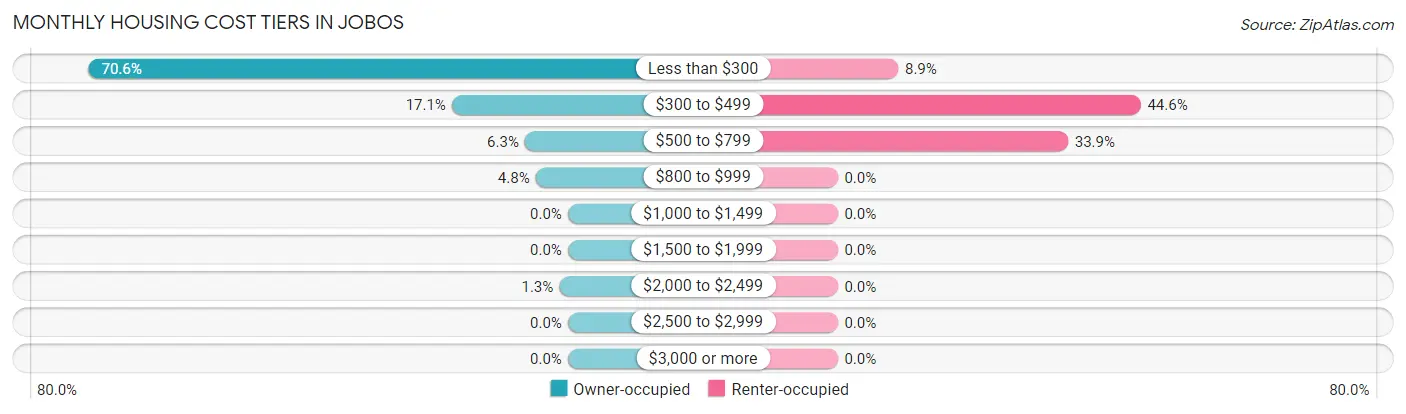
| Monthly Cost | Owner-occupied | Renter-occupied |
| Less than $300 | 446 (70.6%) | 15 (8.9%) |
| $300 to $499 | 108 (17.1%) | 75 (44.6%) |
| $500 to $799 | 40 (6.3%) | 57 (33.9%) |
| $800 to $999 | 30 (4.8%) | 0 (0.0%) |
| $1,000 to $1,499 | 0 (0.0%) | 0 (0.0%) |
| $1,500 to $1,999 | 0 (0.0%) | 0 (0.0%) |
| $2,000 to $2,499 | 8 (1.3%) | 0 (0.0%) |
| $2,500 to $2,999 | 0 (0.0%) | 0 (0.0%) |
| $3,000 or more | 0 (0.0%) | 0 (0.0%) |
| Total | 632 (100.0%) | 168 (100.0%) |
Physical Housing Characteristics in Jobos
Housing Structures in Jobos
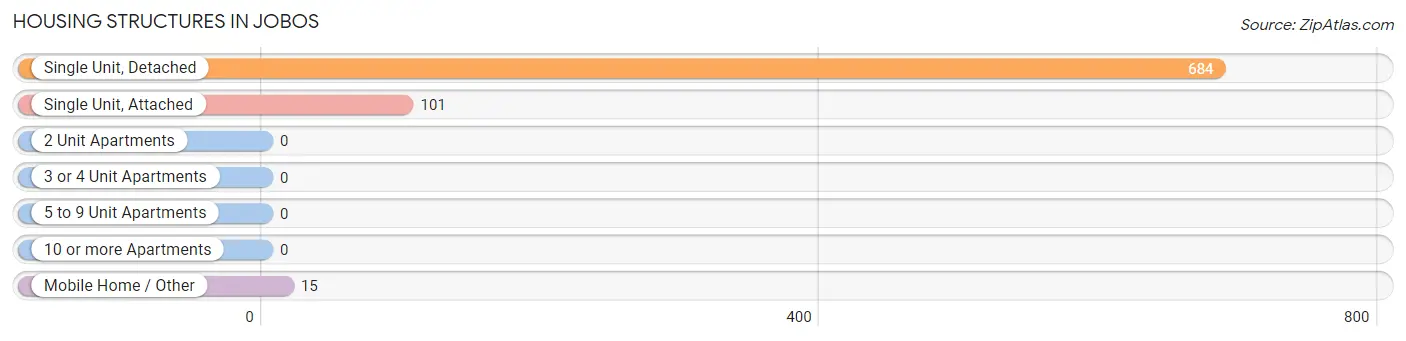
| Structure Type | # Housing Units | % Housing Units |
| Single Unit, Detached | 684 | 85.5% |
| Single Unit, Attached | 101 | 12.6% |
| 2 Unit Apartments | 0 | 0.0% |
| 3 or 4 Unit Apartments | 0 | 0.0% |
| 5 to 9 Unit Apartments | 0 | 0.0% |
| 10 or more Apartments | 0 | 0.0% |
| Mobile Home / Other | 15 | 1.9% |
| Total | 800 | 100.0% |
Housing Structures by Occupancy in Jobos
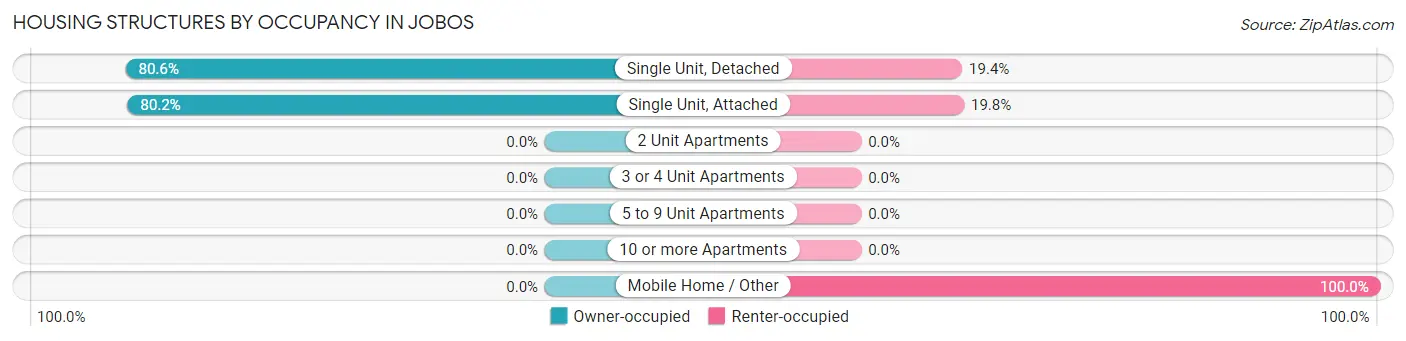
| Structure Type | Owner-occupied | Renter-occupied |
| Single Unit, Detached | 551 (80.6%) | 133 (19.4%) |
| Single Unit, Attached | 81 (80.2%) | 20 (19.8%) |
| 2 Unit Apartments | 0 (0.0%) | 0 (0.0%) |
| 3 or 4 Unit Apartments | 0 (0.0%) | 0 (0.0%) |
| 5 to 9 Unit Apartments | 0 (0.0%) | 0 (0.0%) |
| 10 or more Apartments | 0 (0.0%) | 0 (0.0%) |
| Mobile Home / Other | 0 (0.0%) | 15 (100.0%) |
| Total | 632 (79.0%) | 168 (21.0%) |
Housing Structures by Number of Rooms in Jobos
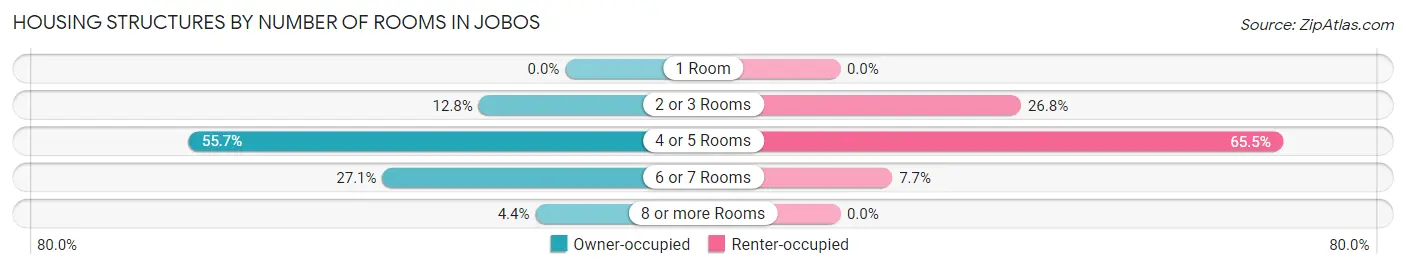
| Number of Rooms | Owner-occupied | Renter-occupied |
| 1 Room | 0 (0.0%) | 0 (0.0%) |
| 2 or 3 Rooms | 81 (12.8%) | 45 (26.8%) |
| 4 or 5 Rooms | 352 (55.7%) | 110 (65.5%) |
| 6 or 7 Rooms | 171 (27.1%) | 13 (7.7%) |
| 8 or more Rooms | 28 (4.4%) | 0 (0.0%) |
| Total | 632 (100.0%) | 168 (100.0%) |
Housing Structure by Heating Type in Jobos
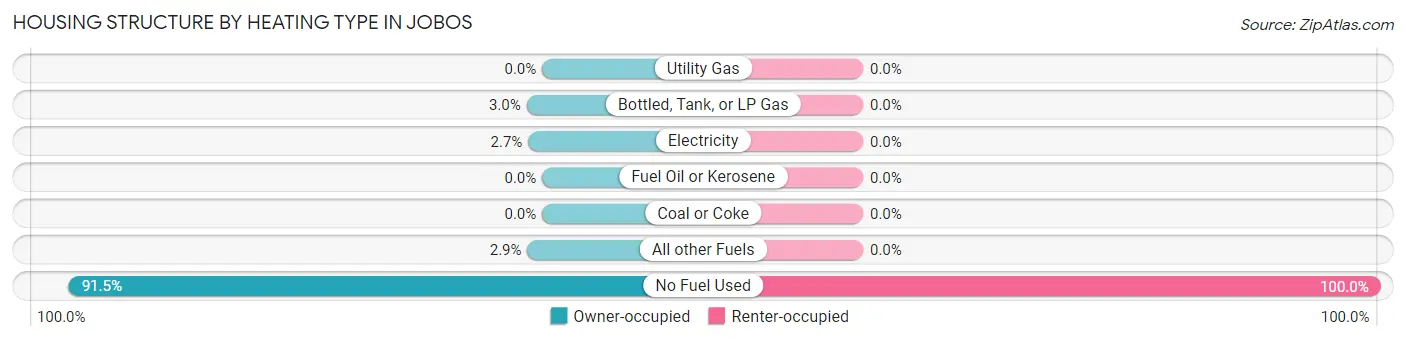
| Heating Type | Owner-occupied | Renter-occupied |
| Utility Gas | 0 (0.0%) | 0 (0.0%) |
| Bottled, Tank, or LP Gas | 19 (3.0%) | 0 (0.0%) |
| Electricity | 17 (2.7%) | 0 (0.0%) |
| Fuel Oil or Kerosene | 0 (0.0%) | 0 (0.0%) |
| Coal or Coke | 0 (0.0%) | 0 (0.0%) |
| All other Fuels | 18 (2.9%) | 0 (0.0%) |
| No Fuel Used | 578 (91.5%) | 168 (100.0%) |
| Total | 632 (100.0%) | 168 (100.0%) |
Household Vehicle Usage in Jobos
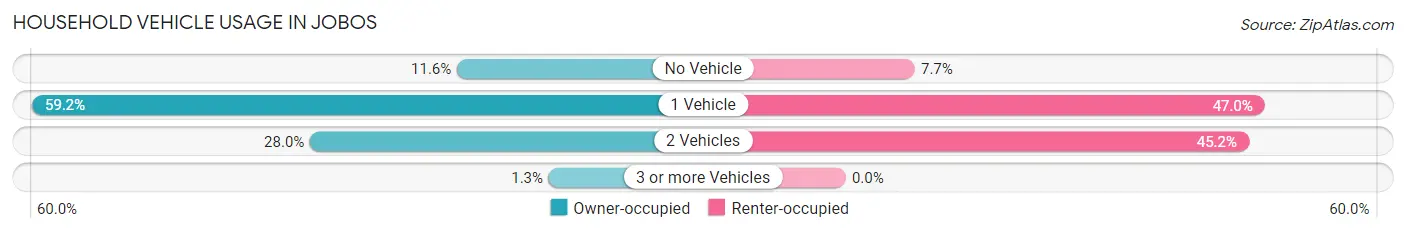
| Vehicles per Household | Owner-occupied | Renter-occupied |
| No Vehicle | 73 (11.6%) | 13 (7.7%) |
| 1 Vehicle | 374 (59.2%) | 79 (47.0%) |
| 2 Vehicles | 177 (28.0%) | 76 (45.2%) |
| 3 or more Vehicles | 8 (1.3%) | 0 (0.0%) |
| Total | 632 (100.0%) | 168 (100.0%) |
Real Estate & Mortgages in Jobos
Real Estate and Mortgage Overview in Jobos
| Characteristic | Without Mortgage | With Mortgage |
| Housing Units | 524 | 108 |
| Median Property Value | $58,600 | $111,500 |
| Median Household Income | $16,875 | $0 |
| Monthly Housing Costs | $195 | $0 |
| Real Estate Taxes | - | - |
Property Value by Mortgage Status in Jobos
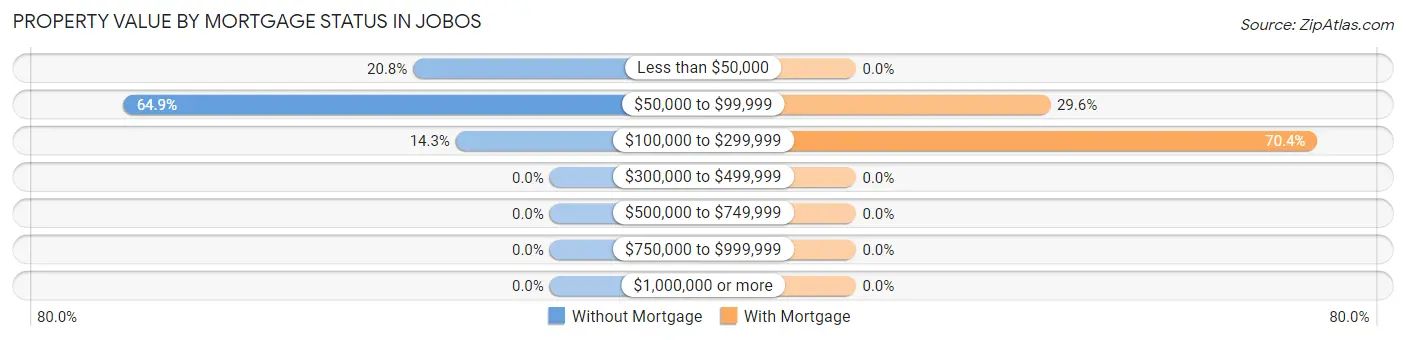
| Property Value | Without Mortgage | With Mortgage |
| Less than $50,000 | 109 (20.8%) | 0 (0.0%) |
| $50,000 to $99,999 | 340 (64.9%) | 32 (29.6%) |
| $100,000 to $299,999 | 75 (14.3%) | 76 (70.4%) |
| $300,000 to $499,999 | 0 (0.0%) | 0 (0.0%) |
| $500,000 to $749,999 | 0 (0.0%) | 0 (0.0%) |
| $750,000 to $999,999 | 0 (0.0%) | 0 (0.0%) |
| $1,000,000 or more | 0 (0.0%) | 0 (0.0%) |
| Total | 524 (100.0%) | 108 (100.0%) |
Household Income by Mortgage Status in Jobos
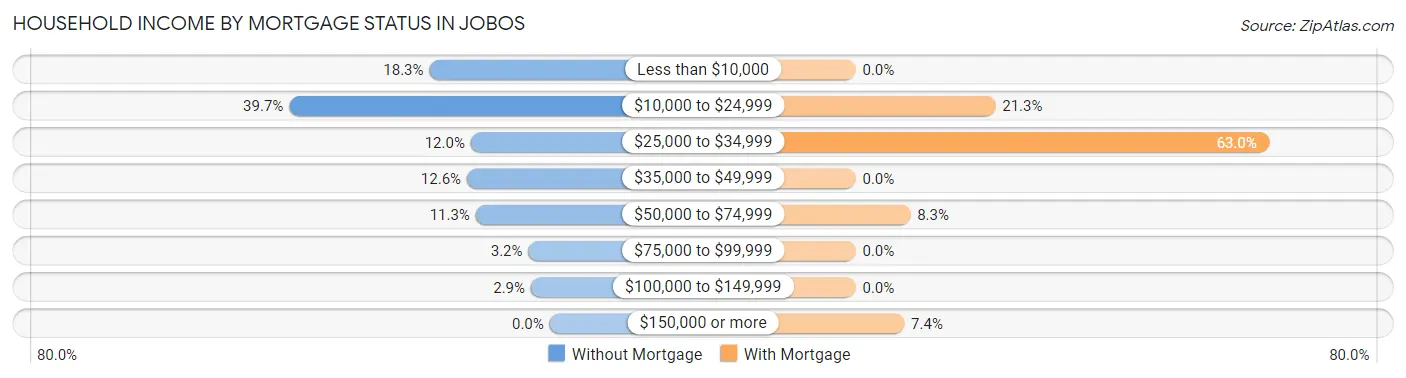
| Household Income | Without Mortgage | With Mortgage |
| Less than $10,000 | 96 (18.3%) | 0 (0.0%) |
| $10,000 to $24,999 | 208 (39.7%) | 23 (21.3%) |
| $25,000 to $34,999 | 63 (12.0%) | 68 (63.0%) |
| $35,000 to $49,999 | 66 (12.6%) | 0 (0.0%) |
| $50,000 to $74,999 | 59 (11.3%) | 9 (8.3%) |
| $75,000 to $99,999 | 17 (3.2%) | 0 (0.0%) |
| $100,000 to $149,999 | 15 (2.9%) | 0 (0.0%) |
| $150,000 or more | 0 (0.0%) | 8 (7.4%) |
| Total | 524 (100.0%) | 108 (100.0%) |
Property Value to Household Income Ratio in Jobos
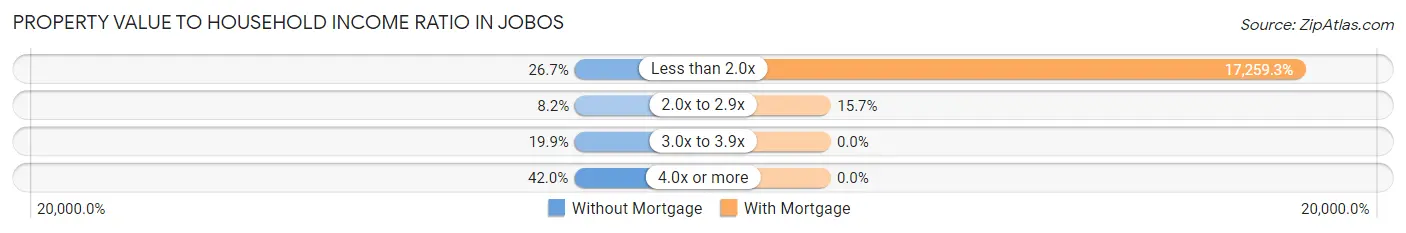
| Value-to-Income Ratio | Without Mortgage | With Mortgage |
| Less than 2.0x | 140 (26.7%) | 18,640 (17,259.3%) |
| 2.0x to 2.9x | 43 (8.2%) | 17 (15.7%) |
| 3.0x to 3.9x | 104 (19.9%) | 0 (0.0%) |
| 4.0x or more | 220 (42.0%) | 0 (0.0%) |
| Total | 524 (100.0%) | 108 (100.0%) |
Real Estate Taxes by Mortgage Status in Jobos
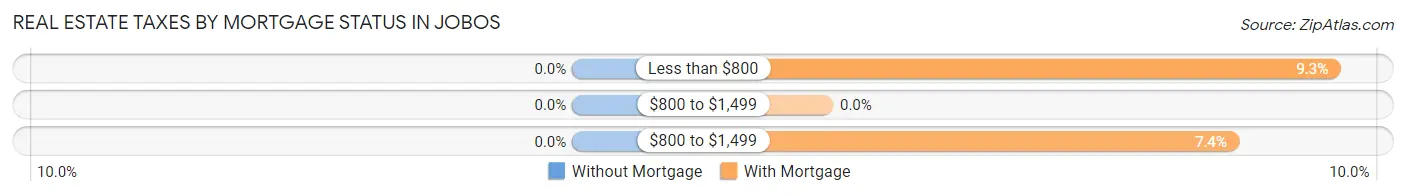
| Property Taxes | Without Mortgage | With Mortgage |
| Less than $800 | 0 (0.0%) | 10 (9.3%) |
| $800 to $1,499 | 0 (0.0%) | 0 (0.0%) |
| $800 to $1,499 | 0 (0.0%) | 8 (7.4%) |
| Total | 524 (100.0%) | 108 (100.0%) |
Health & Disability in Jobos
Health Insurance Coverage by Age in Jobos
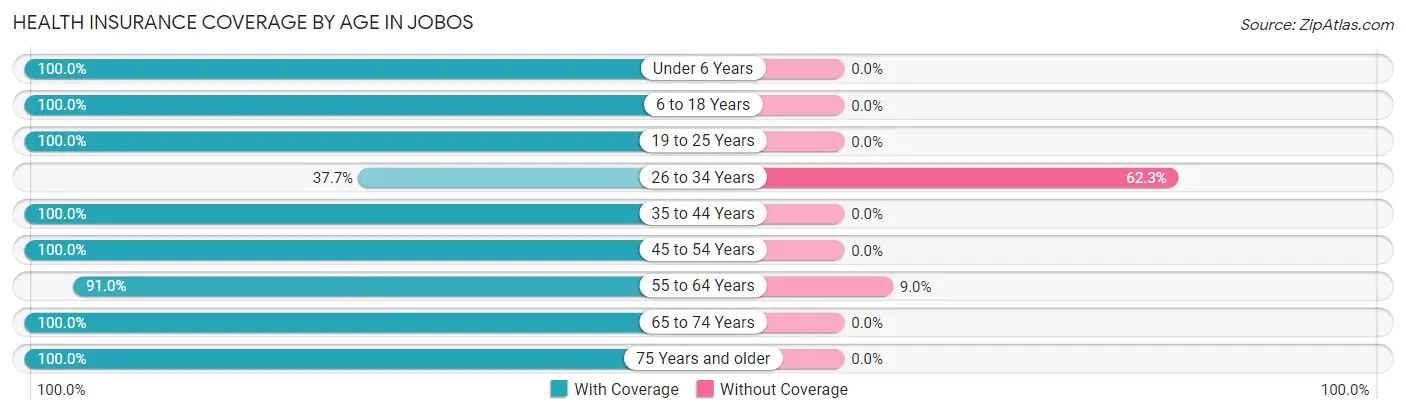
| Age Bracket | With Coverage | Without Coverage |
| Under 6 Years | 29 (100.0%) | 0 (0.0%) |
| 6 to 18 Years | 217 (100.0%) | 0 (0.0%) |
| 19 to 25 Years | 139 (100.0%) | 0 (0.0%) |
| 26 to 34 Years | 29 (37.7%) | 48 (62.3%) |
| 35 to 44 Years | 165 (100.0%) | 0 (0.0%) |
| 45 to 54 Years | 178 (100.0%) | 0 (0.0%) |
| 55 to 64 Years | 342 (91.0%) | 34 (9.0%) |
| 65 to 74 Years | 320 (100.0%) | 0 (0.0%) |
| 75 Years and older | 131 (100.0%) | 0 (0.0%) |
| Total | 1,550 (95.0%) | 82 (5.0%) |
Health Insurance Coverage by Citizenship Status in Jobos
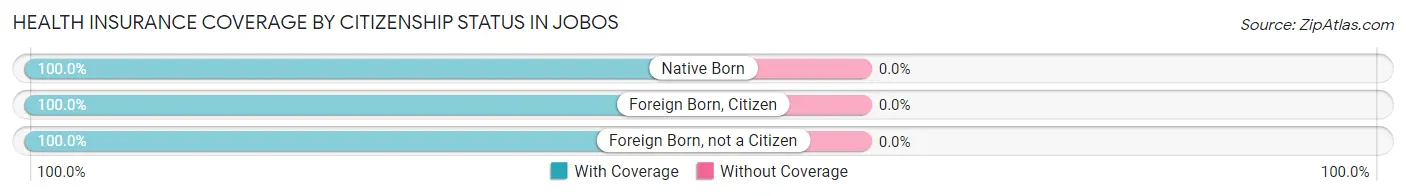
| Citizenship Status | With Coverage | Without Coverage |
| Native Born | 29 (100.0%) | 0 (0.0%) |
| Foreign Born, Citizen | 217 (100.0%) | 0 (0.0%) |
| Foreign Born, not a Citizen | 139 (100.0%) | 0 (0.0%) |
Health Insurance Coverage by Household Income in Jobos
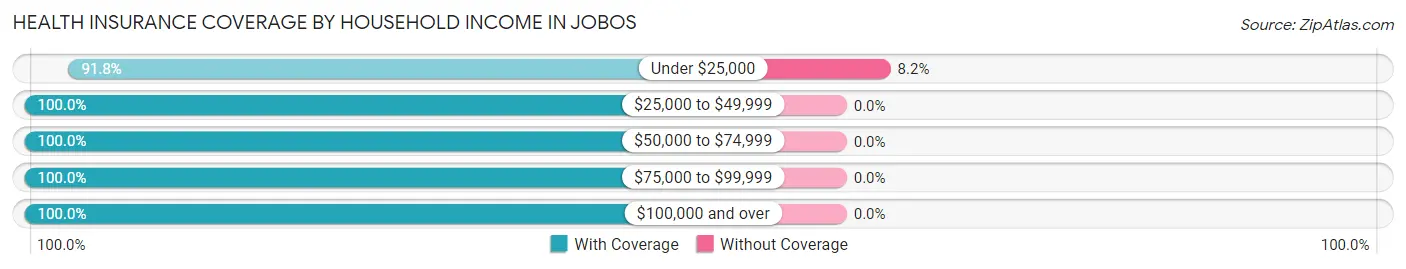
| Household Income | With Coverage | Without Coverage |
| Under $25,000 | 915 (91.8%) | 82 (8.2%) |
| $25,000 to $49,999 | 419 (100.0%) | 0 (0.0%) |
| $50,000 to $74,999 | 106 (100.0%) | 0 (0.0%) |
| $75,000 to $99,999 | 39 (100.0%) | 0 (0.0%) |
| $100,000 and over | 71 (100.0%) | 0 (0.0%) |
Public vs Private Health Insurance Coverage by Age in Jobos
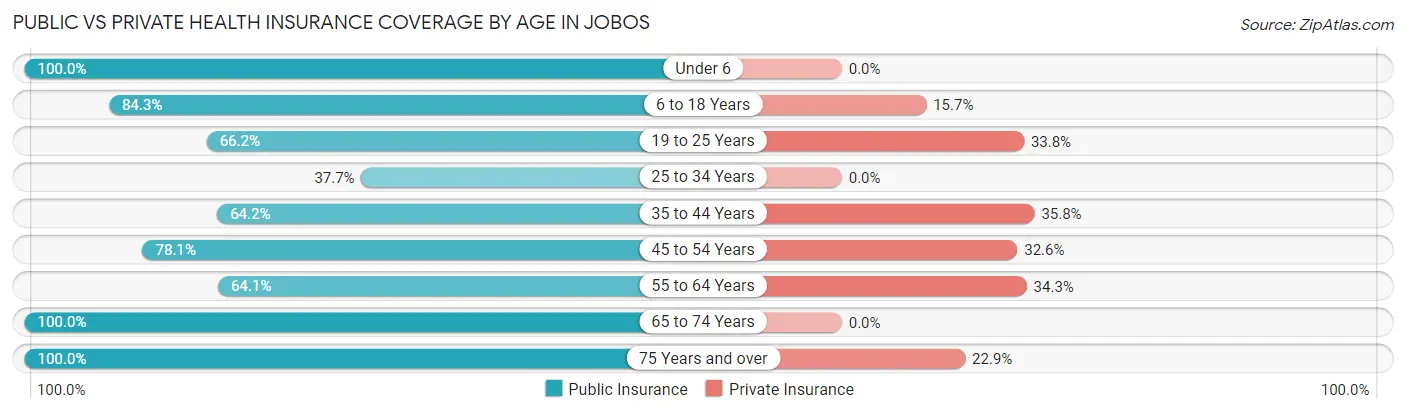
| Age Bracket | Public Insurance | Private Insurance |
| Under 6 | 29 (100.0%) | 0 (0.0%) |
| 6 to 18 Years | 183 (84.3%) | 34 (15.7%) |
| 19 to 25 Years | 92 (66.2%) | 47 (33.8%) |
| 25 to 34 Years | 29 (37.7%) | 0 (0.0%) |
| 35 to 44 Years | 106 (64.2%) | 59 (35.8%) |
| 45 to 54 Years | 139 (78.1%) | 58 (32.6%) |
| 55 to 64 Years | 241 (64.1%) | 129 (34.3%) |
| 65 to 74 Years | 320 (100.0%) | 0 (0.0%) |
| 75 Years and over | 131 (100.0%) | 30 (22.9%) |
| Total | 1,270 (77.8%) | 357 (21.9%) |
Disability Status by Sex by Age in Jobos
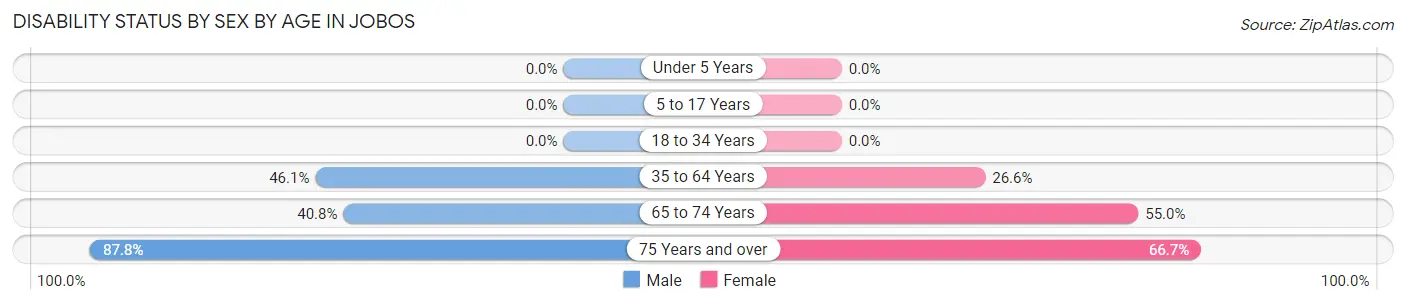
| Age Bracket | Male | Female |
| Under 5 Years | 0 (0.0%) | 0 (0.0%) |
| 5 to 17 Years | 0 (0.0%) | 0 (0.0%) |
| 18 to 34 Years | 0 (0.0%) | 0 (0.0%) |
| 35 to 64 Years | 134 (46.1%) | 114 (26.6%) |
| 65 to 74 Years | 78 (40.8%) | 71 (55.0%) |
| 75 Years and over | 65 (87.8%) | 38 (66.7%) |
Disability Class by Sex by Age in Jobos
Disability Class: Hearing Difficulty
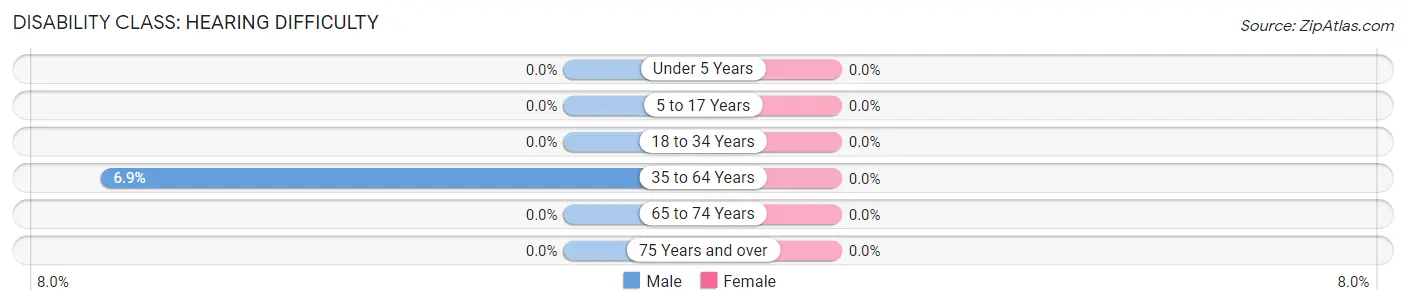
| Age Bracket | Male | Female |
| Under 5 Years | 0 (0.0%) | 0 (0.0%) |
| 5 to 17 Years | 0 (0.0%) | 0 (0.0%) |
| 18 to 34 Years | 0 (0.0%) | 0 (0.0%) |
| 35 to 64 Years | 20 (6.9%) | 0 (0.0%) |
| 65 to 74 Years | 0 (0.0%) | 0 (0.0%) |
| 75 Years and over | 0 (0.0%) | 0 (0.0%) |
Disability Class: Vision Difficulty
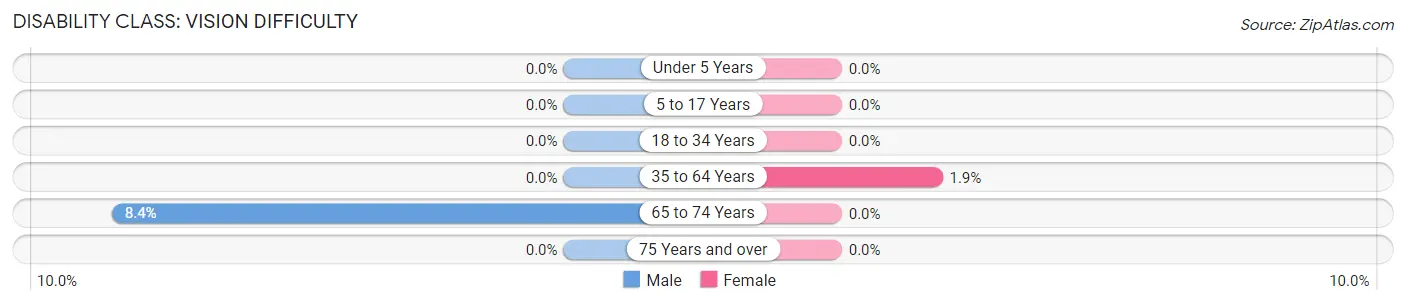
| Age Bracket | Male | Female |
| Under 5 Years | 0 (0.0%) | 0 (0.0%) |
| 5 to 17 Years | 0 (0.0%) | 0 (0.0%) |
| 18 to 34 Years | 0 (0.0%) | 0 (0.0%) |
| 35 to 64 Years | 0 (0.0%) | 8 (1.9%) |
| 65 to 74 Years | 16 (8.4%) | 0 (0.0%) |
| 75 Years and over | 0 (0.0%) | 0 (0.0%) |
Disability Class: Cognitive Difficulty
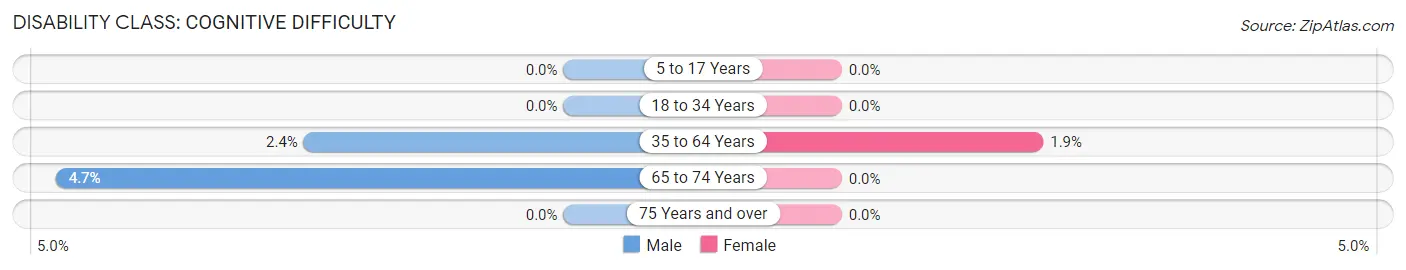
| Age Bracket | Male | Female |
| 5 to 17 Years | 0 (0.0%) | 0 (0.0%) |
| 18 to 34 Years | 0 (0.0%) | 0 (0.0%) |
| 35 to 64 Years | 7 (2.4%) | 8 (1.9%) |
| 65 to 74 Years | 9 (4.7%) | 0 (0.0%) |
| 75 Years and over | 0 (0.0%) | 0 (0.0%) |
Disability Class: Ambulatory Difficulty
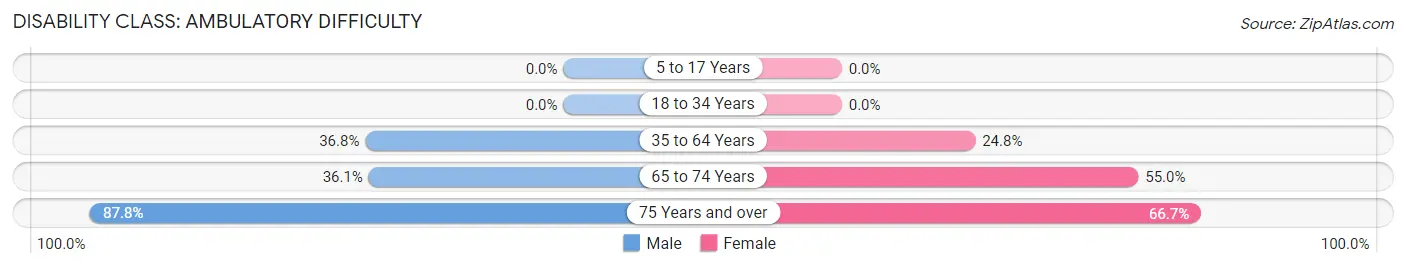
| Age Bracket | Male | Female |
| 5 to 17 Years | 0 (0.0%) | 0 (0.0%) |
| 18 to 34 Years | 0 (0.0%) | 0 (0.0%) |
| 35 to 64 Years | 107 (36.8%) | 106 (24.8%) |
| 65 to 74 Years | 69 (36.1%) | 71 (55.0%) |
| 75 Years and over | 65 (87.8%) | 38 (66.7%) |
Disability Class: Self-Care Difficulty
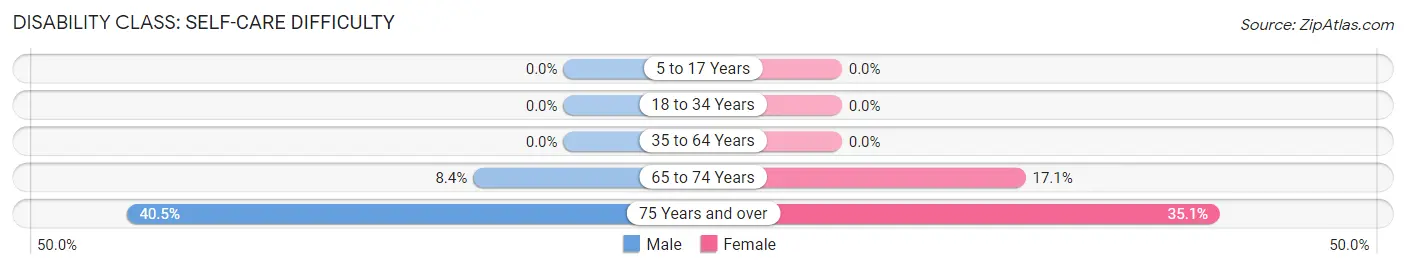
| Age Bracket | Male | Female |
| 5 to 17 Years | 0 (0.0%) | 0 (0.0%) |
| 18 to 34 Years | 0 (0.0%) | 0 (0.0%) |
| 35 to 64 Years | 0 (0.0%) | 0 (0.0%) |
| 65 to 74 Years | 16 (8.4%) | 22 (17.1%) |
| 75 Years and over | 30 (40.5%) | 20 (35.1%) |
Technology Access in Jobos
Computing Device Access in Jobos
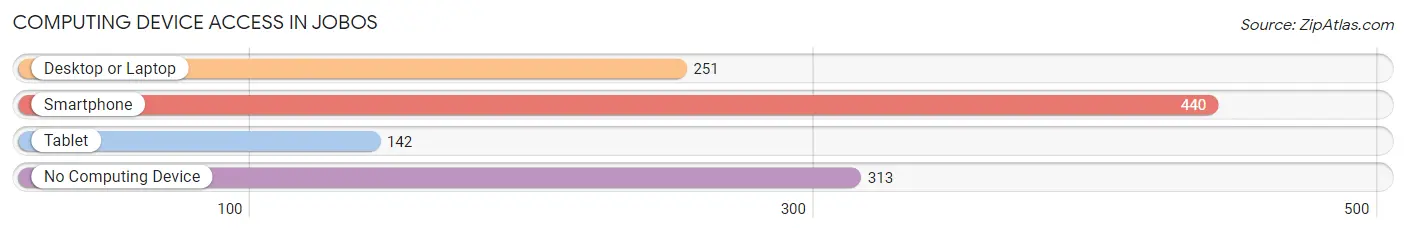
| Device Type | # Households | % Households |
| Desktop or Laptop | 251 | 31.4% |
| Smartphone | 440 | 55.0% |
| Tablet | 142 | 17.7% |
| No Computing Device | 313 | 39.1% |
| Total | 800 | 100.0% |
Internet Access in Jobos
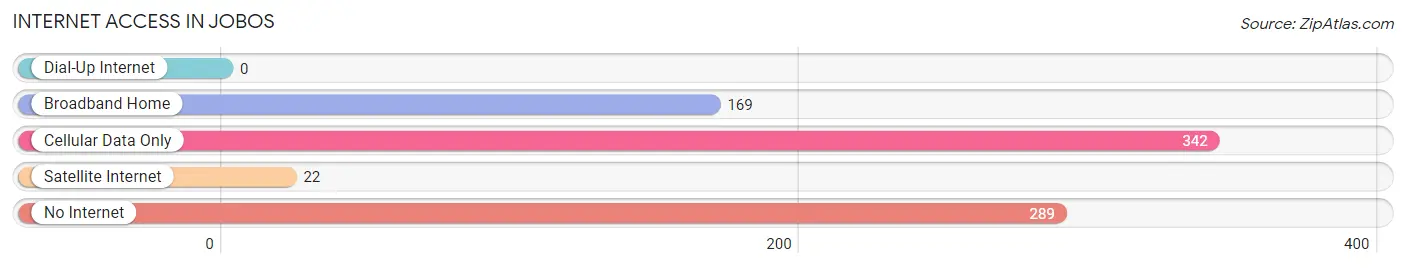
| Internet Type | # Households | % Households |
| Dial-Up Internet | 0 | 0.0% |
| Broadband Home | 169 | 21.1% |
| Cellular Data Only | 342 | 42.7% |
| Satellite Internet | 22 | 2.8% |
| No Internet | 289 | 36.1% |
| Total | 800 | 100.0% |
Jobos Summary
PR History
Puerto Rico is a Caribbean island located in the northeastern Caribbean Sea, east of the Dominican Republic and west of the Virgin Islands. It is the smallest of the Greater Antilles and is the easternmost island of the West Indies. Puerto Rico has a long and rich history, beginning with its first inhabitants, the Taíno Indians, who arrived in the region around 1000 A.D. The Taíno were a peaceful people who lived in small villages and were skilled farmers and fishermen.
In 1493, Christopher Columbus arrived in Puerto Rico and claimed it for Spain. The Spanish began to colonize the island, bringing with them African slaves to work the land. The Spanish also introduced Catholicism to the island, which remains the predominant religion today.
In 1898, the Spanish-American War ended with the signing of the Treaty of Paris, which ceded Puerto Rico to the United States. The island became a U.S. territory and was granted limited autonomy. In 1917, the Jones-Shafroth Act granted Puerto Ricans U.S. citizenship.
In 1952, Puerto Rico became a Commonwealth of the United States, granting it greater autonomy and self-governance. In the following decades, Puerto Rico experienced a period of rapid economic growth and industrialization. In the late 20th century, the island’s economy began to decline due to a number of factors, including the closure of U.S. military bases and the rise of competition from other Caribbean countries.
Geography
Puerto Rico is an archipelago located in the northeastern Caribbean Sea, east of the Dominican Republic and west of the Virgin Islands. It is the smallest of the Greater Antilles and is the easternmost island of the West Indies. The main island of Puerto Rico is approximately 100 miles long and 35 miles wide, with a total area of 3,515 square miles.
The island is divided into 78 municipalities, each with its own government. The capital and largest city is San Juan, located on the northern coast. Other major cities include Ponce, Mayagüez, and Arecibo.
The terrain of Puerto Rico is mostly mountainous, with the highest peak, Cerro de Punta, reaching 4,390 feet. The island is surrounded by coral reefs and has many bays and beaches. The climate is tropical, with temperatures ranging from the mid-70s to the mid-80s.
Economy
Puerto Rico has a mixed economy, with a combination of private and public sectors. The island’s main industries are tourism, manufacturing, and agriculture.
Tourism is a major source of income for Puerto Rico, with over 4 million visitors each year. The island is home to many resorts, beaches, and historical sites.
Manufacturing is another important sector of the economy. Puerto Rico is home to many pharmaceutical and electronics companies, as well as food processing and textiles.
Agriculture is also an important part of the economy, with the main crops being sugarcane, coffee, and bananas.
Demographics
Puerto Rico has a population of 3.2 million people, with the majority of the population living on the main island. The population is largely of Spanish and African descent, with smaller numbers of Taino Indians, Europeans, and Asians.
The official language of Puerto Rico is Spanish, although English is also widely spoken. The majority of the population is Roman Catholic, with smaller numbers of Protestants and other religions.
The median household income in Puerto Rico is $20,000, with the poverty rate at 45%. The unemployment rate is 11.5%.
Common Questions
What is Per Capita Income in Jobos?
Per Capita income in Jobos is $12,655.
What is the Median Family Income in Jobos?
Median Family Income in Jobos is $19,705.
What is the Median Household income in Jobos?
Median Household Income in Jobos is $17,791.
What is Income or Wage Gap in Jobos?
Income or Wage Gap in Jobos is 4.9%.
Women in Jobos earn 95.1 cents for every dollar earned by a man.
What is Inequality or Gini Index in Jobos?
Inequality or Gini Index in Jobos is 0.44.
What is the Total Population of Jobos?
Total Population of Jobos is 1,632.
What is the Total Male Population of Jobos?
Total Male Population of Jobos is 731.
What is the Total Female Population of Jobos?
Total Female Population of Jobos is 901.
What is the Ratio of Males per 100 Females in Jobos?
There are 81.13 Males per 100 Females in Jobos.
What is the Ratio of Females per 100 Males in Jobos?
There are 123.26 Females per 100 Males in Jobos.
What is the Median Population Age in Jobos?
Median Population Age in Jobos is 55.5 Years.
What is the Average Family Size in Jobos
Average Family Size in Jobos is 2.5 People.
What is the Average Household Size in Jobos
Average Household Size in Jobos is 2.0 People.
How Large is the Labor Force in Jobos?
There are 540 People in the Labor Forcein in Jobos.
What is the Percentage of People in the Labor Force in Jobos?
37.4% of People are in the Labor Force in Jobos.
What is the Unemployment Rate in Jobos?
Unemployment Rate in Jobos is 4.5%.