Martorell, PR Map & Demographics
Martorell Map
Martorell Overview
$13,994
PER CAPITA INCOME
$27,303
AVG FAMILY INCOME
$20,521
AVG HOUSEHOLD INCOME
16.2%
WAGE / INCOME GAP [ % ]
83.8¢/ $1
WAGE / INCOME GAP [ $ ]
0.49
INEQUALITY / GINI INDEX
2,102
TOTAL POPULATION
1,044
MALE POPULATION
1,058
FEMALE POPULATION
98.68
MALES / 100 FEMALES
101.34
FEMALES / 100 MALES
56.0
MEDIAN AGE
3.2
AVG FAMILY SIZE
2.3
AVG HOUSEHOLD SIZE
677
LABOR FORCE [ PEOPLE ]
35.8%
PERCENT IN LABOR FORCE
15.2%
UNEMPLOYMENT RATE
Income in Martorell
Income Overview in Martorell
Per Capita Income in Martorell is $13,994, while median incomes of families and households are $27,303 and $20,521 respectively.
| Characteristic | Number | Measure |
| Per Capita Income | 2,102 | $13,994 |
| Median Family Income | 459 | $27,303 |
| Mean Family Income | 459 | $34,746 |
| Median Household Income | 904 | $20,521 |
| Mean Household Income | 904 | $26,357 |
| Income Deficit | 459 | $0 |
| Wage / Income Gap (%) | 2,102 | 16.20% |
| Wage / Income Gap ($) | 2,102 | 83.80¢ per $1 |
| Gini / Inequality Index | 2,102 | 0.49 |
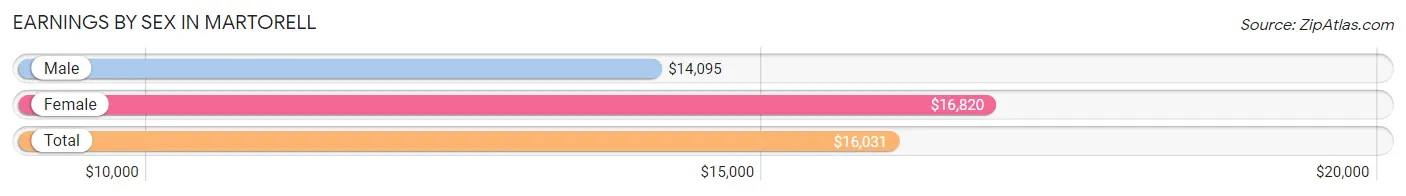
Earnings by Sex in Martorell
Average Earnings in Martorell are $16,031, $14,095 for men and $16,820 for women, a difference of 16.2%.
| Sex | Number | Average Earnings |
| Male | 331 (50.5%) | $14,095 |
| Female | 325 (49.5%) | $16,820 |
| Total | 656 (100.0%) | $16,031 |
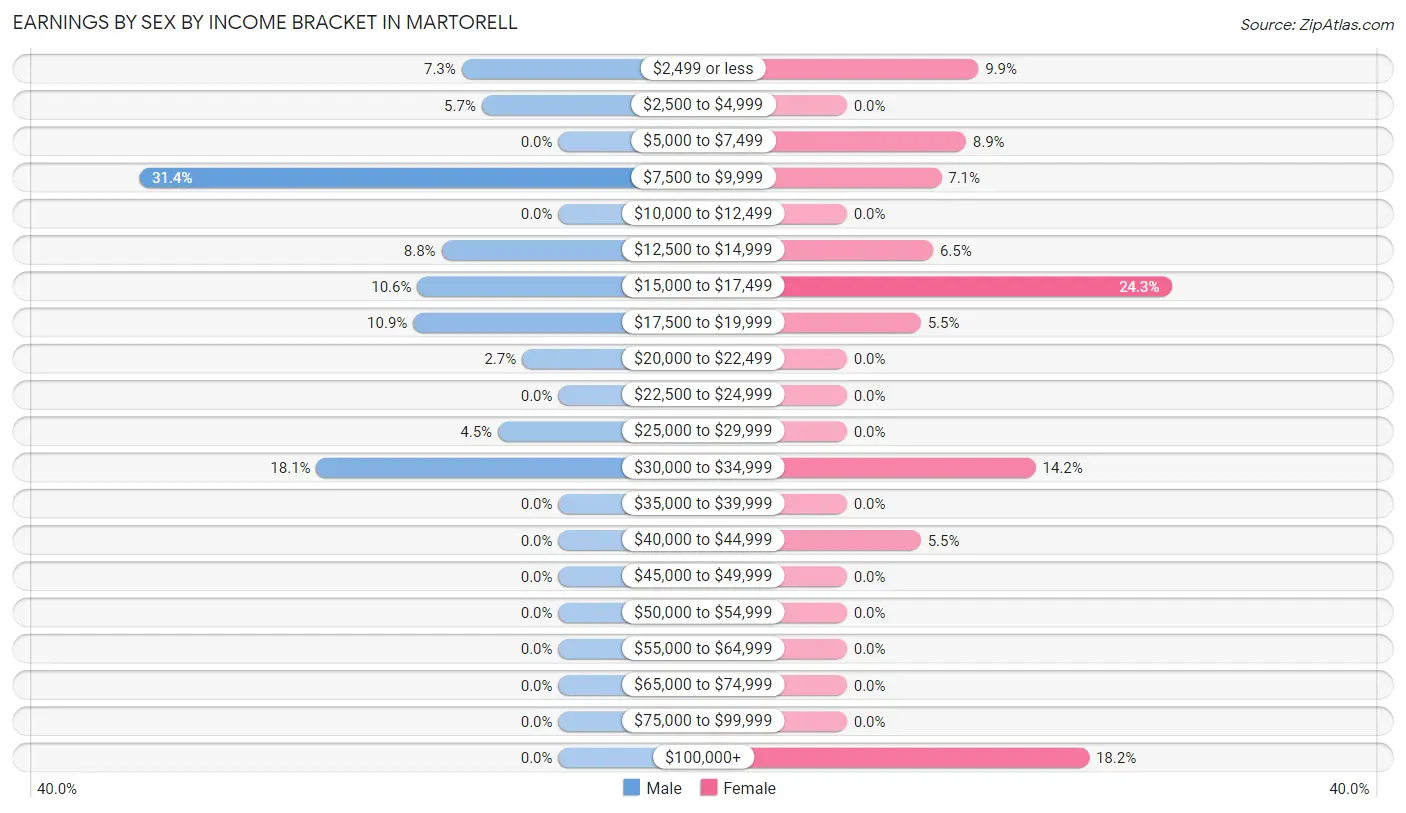
Earnings by Sex by Income Bracket in Martorell
The most common earnings brackets in Martorell are $7,500 to $9,999 for men (104 | 31.4%) and $15,000 to $17,499 for women (79 | 24.3%).
| Income | Male | Female |
| $2,499 or less | 24 (7.2%) | 32 (9.9%) |
| $2,500 to $4,999 | 19 (5.7%) | 0 (0.0%) |
| $5,000 to $7,499 | 0 (0.0%) | 29 (8.9%) |
| $7,500 to $9,999 | 104 (31.4%) | 23 (7.1%) |
| $10,000 to $12,499 | 0 (0.0%) | 0 (0.0%) |
| $12,500 to $14,999 | 29 (8.8%) | 21 (6.5%) |
| $15,000 to $17,499 | 35 (10.6%) | 79 (24.3%) |
| $17,500 to $19,999 | 36 (10.9%) | 18 (5.5%) |
| $20,000 to $22,499 | 9 (2.7%) | 0 (0.0%) |
| $22,500 to $24,999 | 0 (0.0%) | 0 (0.0%) |
| $25,000 to $29,999 | 15 (4.5%) | 0 (0.0%) |
| $30,000 to $34,999 | 60 (18.1%) | 46 (14.1%) |
| $35,000 to $39,999 | 0 (0.0%) | 0 (0.0%) |
| $40,000 to $44,999 | 0 (0.0%) | 18 (5.5%) |
| $45,000 to $49,999 | 0 (0.0%) | 0 (0.0%) |
| $50,000 to $54,999 | 0 (0.0%) | 0 (0.0%) |
| $55,000 to $64,999 | 0 (0.0%) | 0 (0.0%) |
| $65,000 to $74,999 | 0 (0.0%) | 0 (0.0%) |
| $75,000 to $99,999 | 0 (0.0%) | 0 (0.0%) |
| $100,000+ | 0 (0.0%) | 59 (18.1%) |
| Total | 331 (100.0%) | 325 (100.0%) |
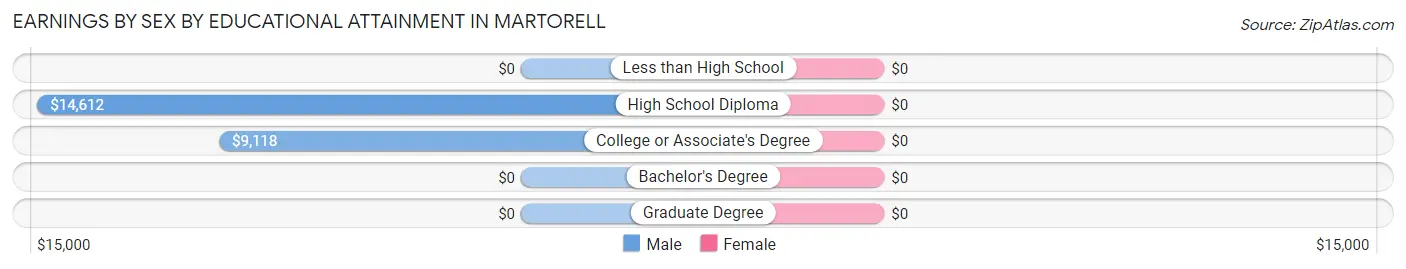
Earnings by Sex by Educational Attainment in Martorell
| Educational Attainment | Male Income | Female Income |
| Less than High School | - | - |
| High School Diploma | $14,612 | $0 |
| College or Associate's Degree | $9,118 | $0 |
| Bachelor's Degree | - | - |
| Graduate Degree | - | - |
| Total | $15,750 | $0 |
Family Income in Martorell
Family Income Brackets in Martorell
According to the Martorell family income data, there are 87 families falling into the less than $10,000 income range, which is the most common income bracket and makes up 19.0% of all families.
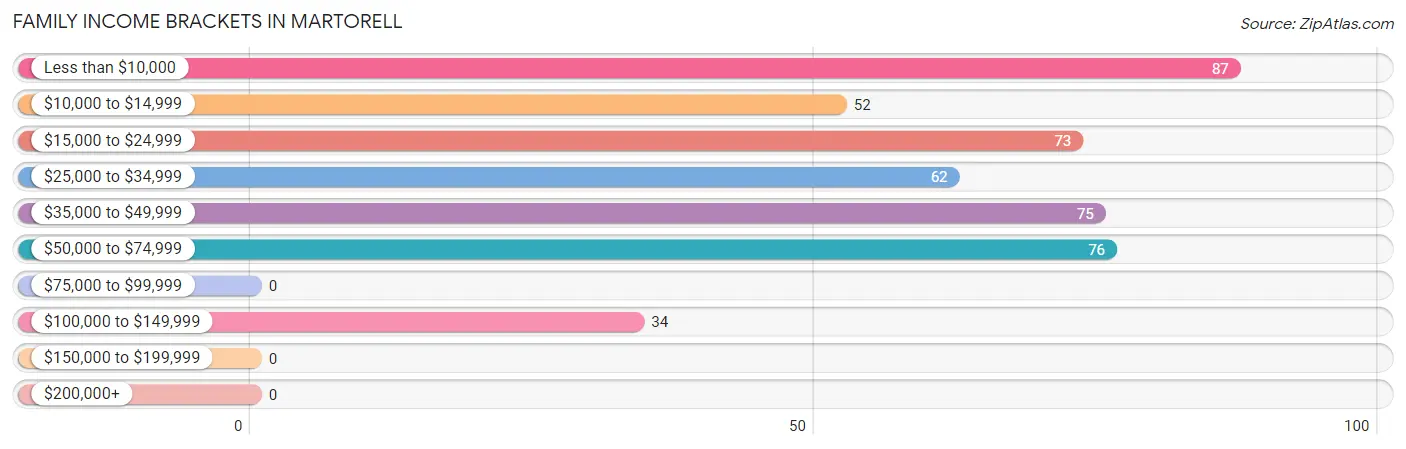
| Income Bracket | # Families | % Families |
| Less than $10,000 | 87 | 19.0% |
| $10,000 to $14,999 | 52 | 11.3% |
| $15,000 to $24,999 | 73 | 15.9% |
| $25,000 to $34,999 | 62 | 13.5% |
| $35,000 to $49,999 | 75 | 16.3% |
| $50,000 to $74,999 | 76 | 16.6% |
| $75,000 to $99,999 | 0 | 0.0% |
| $100,000 to $149,999 | 34 | 7.4% |
| $150,000 to $199,999 | 0 | 0.0% |
| $200,000+ | 0 | 0.0% |
Family Income by Famaliy Size in Martorell
3-person families (137 | 29.8%) account for the highest median family income in Martorell with $24,931 per family, while 2-person families (242 | 52.7%) have the highest median income of $12,054 per family member.
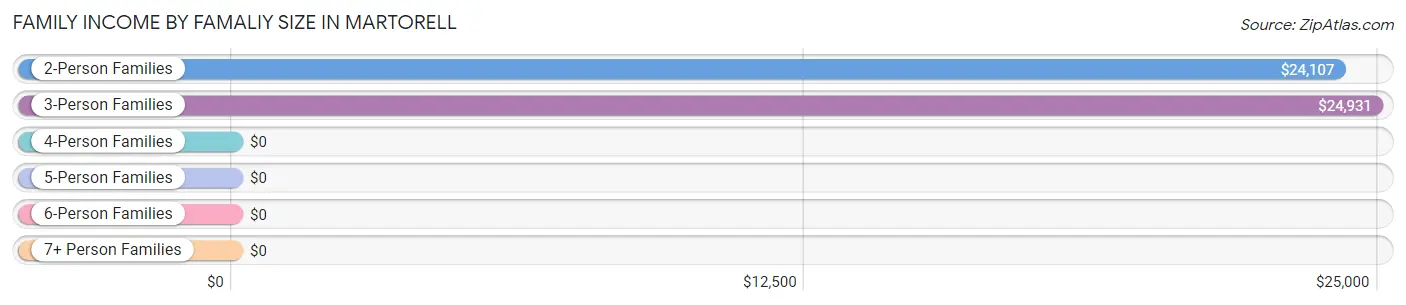
| Income Bracket | # Families | Median Income |
| 2-Person Families | 242 (52.7%) | $24,107 |
| 3-Person Families | 137 (29.8%) | $24,931 |
| 4-Person Families | 61 (13.3%) | $0 |
| 5-Person Families | 19 (4.1%) | $0 |
| 6-Person Families | 0 (0.0%) | $0 |
| 7+ Person Families | 0 (0.0%) | $0 |
| Total | 459 (100.0%) | $27,303 |
Family Income by Number of Earners in Martorell
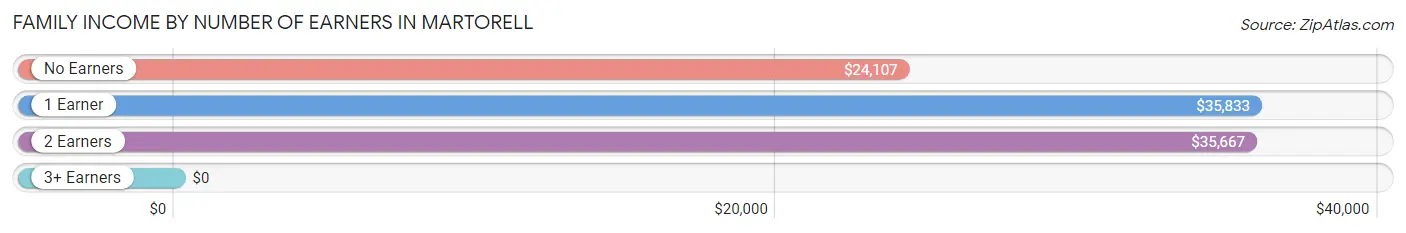
| Number of Earners | # Families | Median Income |
| No Earners | 206 (44.9%) | $24,107 |
| 1 Earner | 186 (40.5%) | $35,833 |
| 2 Earners | 42 (9.1%) | $35,667 |
| 3+ Earners | 25 (5.4%) | $0 |
| Total | 459 (100.0%) | $27,303 |
Household Income in Martorell
Household Income Brackets in Martorell
With 273 households falling in the category, the less than $10,000 income range is the most frequent in Martorell, accounting for 30.2% of all households.
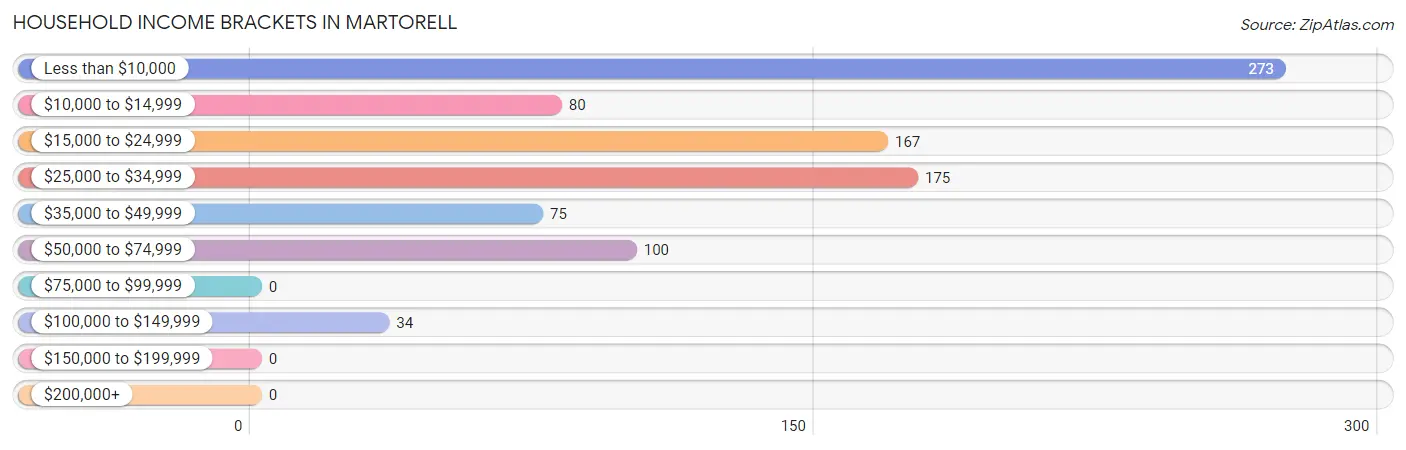
| Income Bracket | # Households | % Households |
| Less than $10,000 | 273 | 30.2% |
| $10,000 to $14,999 | 80 | 8.8% |
| $15,000 to $24,999 | 167 | 18.5% |
| $25,000 to $34,999 | 175 | 19.4% |
| $35,000 to $49,999 | 75 | 8.3% |
| $50,000 to $74,999 | 100 | 11.1% |
| $75,000 to $99,999 | 0 | 0.0% |
| $100,000 to $149,999 | 34 | 3.8% |
| $150,000 to $199,999 | 0 | 0.0% |
| $200,000+ | 0 | 0.0% |
Household Income by Householder Age in Martorell
The median household income in Martorell is $20,521, with the highest median household income of $24,336 found in the 65+ years age bracket for the primary householder. A total of 441 households (48.8%) fall into this category.
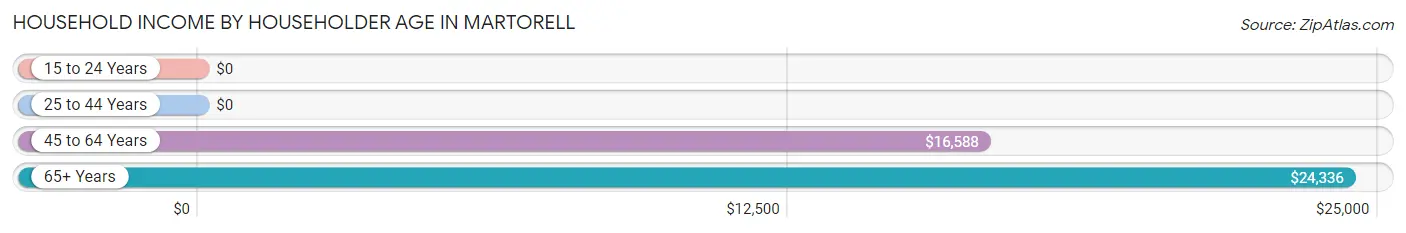
| Income Bracket | # Households | Median Income |
| 15 to 24 Years | 0 (0.0%) | $0 |
| 25 to 44 Years | 90 (10.0%) | $0 |
| 45 to 64 Years | 373 (41.3%) | $16,588 |
| 65+ Years | 441 (48.8%) | $24,336 |
| Total | 904 (100.0%) | $20,521 |
Poverty in Martorell
Income Below Poverty by Sex and Age in Martorell
With 56.8% poverty level for males and 42.4% for females among the residents of Martorell, under 5 year old males and 16 and 17 year old females are the most vulnerable to poverty, with 43 males (100.0%) and 26 females (100.0%) in their respective age groups living below the poverty level.
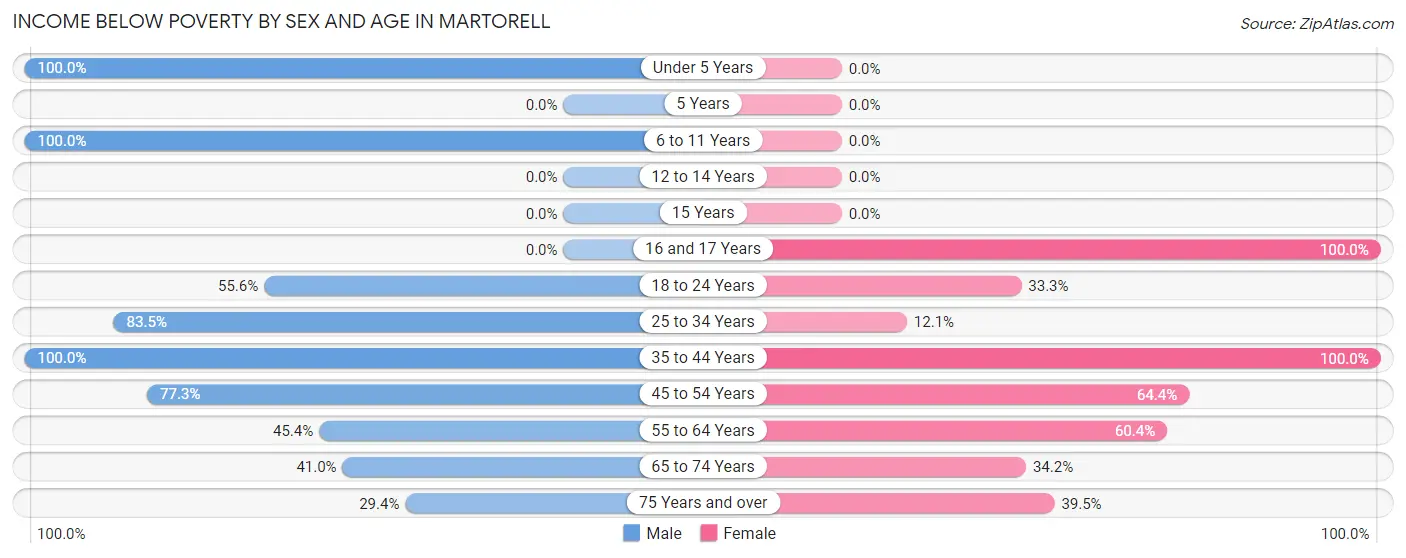
| Age Bracket | Male | Female |
| Under 5 Years | 43 (100.0%) | 0 (0.0%) |
| 5 Years | 0 (0.0%) | 0 (0.0%) |
| 6 to 11 Years | 54 (100.0%) | 0 (0.0%) |
| 12 to 14 Years | 0 (0.0%) | 0 (0.0%) |
| 15 Years | 0 (0.0%) | 0 (0.0%) |
| 16 and 17 Years | 0 (0.0%) | 26 (100.0%) |
| 18 to 24 Years | 50 (55.6%) | 17 (33.3%) |
| 25 to 34 Years | 106 (83.5%) | 22 (12.1%) |
| 35 to 44 Years | 63 (100.0%) | 15 (100.0%) |
| 45 to 54 Years | 51 (77.3%) | 87 (64.4%) |
| 55 to 64 Years | 117 (45.4%) | 169 (60.4%) |
| 65 to 74 Years | 82 (41.0%) | 53 (34.2%) |
| 75 Years and over | 27 (29.3%) | 60 (39.5%) |
| Total | 593 (56.8%) | 449 (42.4%) |
Income Above Poverty by Sex and Age in Martorell
According to the poverty statistics in Martorell, males aged 12 to 14 years and females aged 12 to 14 years are the age groups that are most secure financially, with 100.0% of males and 100.0% of females in these age groups living above the poverty line.
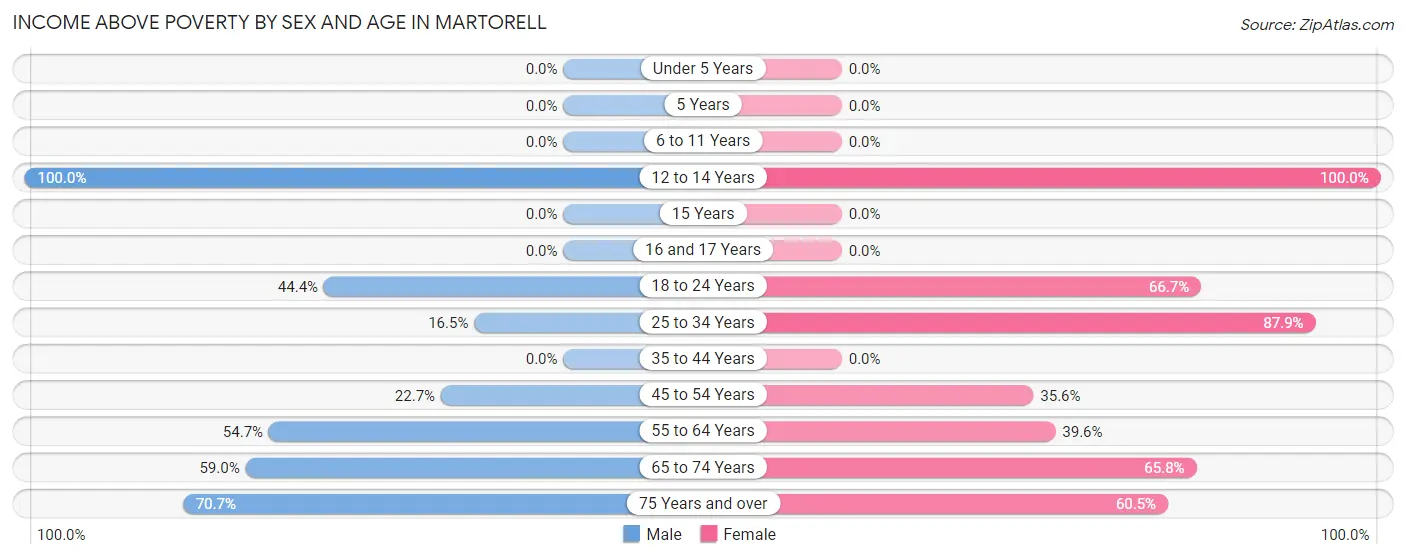
| Age Bracket | Male | Female |
| Under 5 Years | 0 (0.0%) | 0 (0.0%) |
| 5 Years | 0 (0.0%) | 0 (0.0%) |
| 6 to 11 Years | 0 (0.0%) | 0 (0.0%) |
| 12 to 14 Years | 51 (100.0%) | 62 (100.0%) |
| 15 Years | 0 (0.0%) | 0 (0.0%) |
| 16 and 17 Years | 0 (0.0%) | 0 (0.0%) |
| 18 to 24 Years | 40 (44.4%) | 34 (66.7%) |
| 25 to 34 Years | 21 (16.5%) | 160 (87.9%) |
| 35 to 44 Years | 0 (0.0%) | 0 (0.0%) |
| 45 to 54 Years | 15 (22.7%) | 48 (35.6%) |
| 55 to 64 Years | 141 (54.6%) | 111 (39.6%) |
| 65 to 74 Years | 118 (59.0%) | 102 (65.8%) |
| 75 Years and over | 65 (70.7%) | 92 (60.5%) |
| Total | 451 (43.2%) | 609 (57.6%) |
Income Below Poverty Among Married-Couple Families in Martorell
The poverty statistics for married-couple families in Martorell show that 31.9% or 75 of the total 235 families live below the poverty line. Families with no children have the highest poverty rate of 31.9%, comprising of 75 families. On the other hand, families with no children have the lowest poverty rate of 31.9%, which includes 75 families.
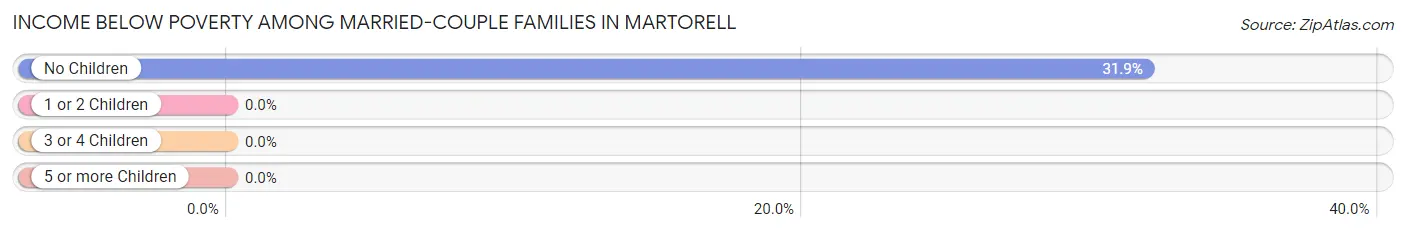
| Children | Above Poverty | Below Poverty |
| No Children | 160 (68.1%) | 75 (31.9%) |
| 1 or 2 Children | 0 (0.0%) | 0 (0.0%) |
| 3 or 4 Children | 0 (0.0%) | 0 (0.0%) |
| 5 or more Children | 0 (0.0%) | 0 (0.0%) |
| Total | 160 (68.1%) | 75 (31.9%) |
Income Below Poverty Among Single-Parent Households in Martorell
According to the poverty data in Martorell, 53.0% or 53 single-father households and 57.3% or 71 single-mother households are living below the poverty line. Among single-father households, those with 1 or 2 children have the highest poverty rate, with 53 households (77.9%) experiencing poverty. Likewise, among single-mother households, those with no children have the highest poverty rate, with 49 households (72.1%) falling below the poverty line.
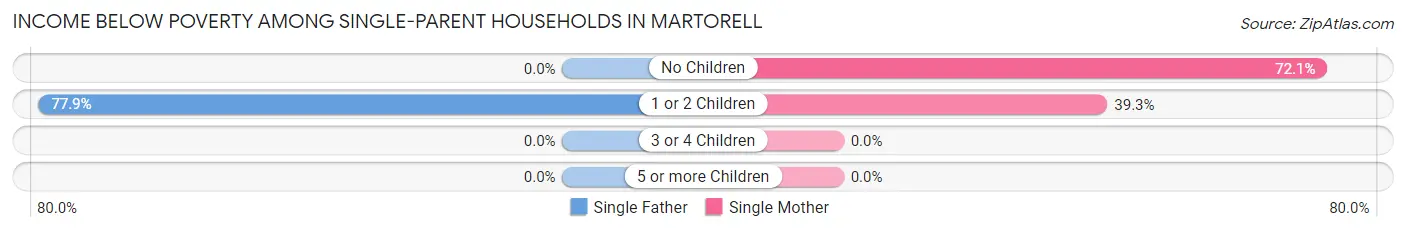
| Children | Single Father | Single Mother |
| No Children | 0 (0.0%) | 49 (72.1%) |
| 1 or 2 Children | 53 (77.9%) | 22 (39.3%) |
| 3 or 4 Children | 0 (0.0%) | 0 (0.0%) |
| 5 or more Children | 0 (0.0%) | 0 (0.0%) |
| Total | 53 (53.0%) | 71 (57.3%) |
Income Below Poverty Among Married-Couple vs Single-Parent Households in Martorell
The poverty data for Martorell shows that 75 of the married-couple family households (31.9%) and 124 of the single-parent households (55.4%) are living below the poverty level. Within the married-couple family households, those with no children have the highest poverty rate, with 75 households (31.9%) falling below the poverty line. Among the single-parent households, those with 1 or 2 children have the highest poverty rate, with 75 household (60.5%) living below poverty.
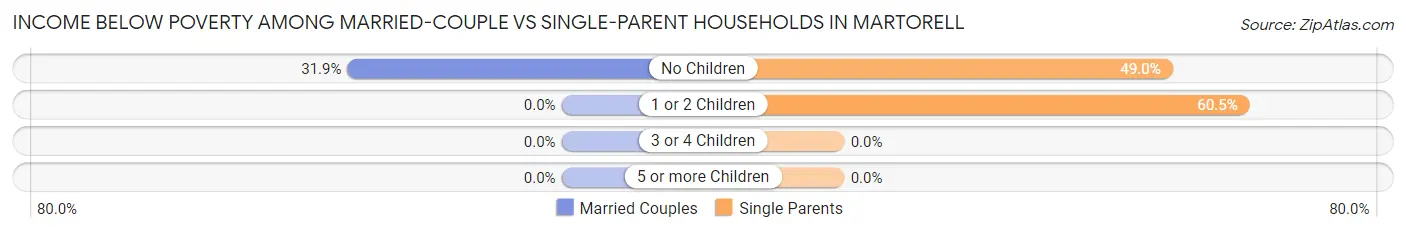
| Children | Married-Couple Families | Single-Parent Households |
| No Children | 75 (31.9%) | 49 (49.0%) |
| 1 or 2 Children | 0 (0.0%) | 75 (60.5%) |
| 3 or 4 Children | 0 (0.0%) | 0 (0.0%) |
| 5 or more Children | 0 (0.0%) | 0 (0.0%) |
| Total | 75 (31.9%) | 124 (55.4%) |
Race in Martorell
The most populous races in Martorell are Hispanic or Latino (2,102 | 100.0%), Some other Race (1,270 | 60.4%), and Black / African American (617 | 29.3%).
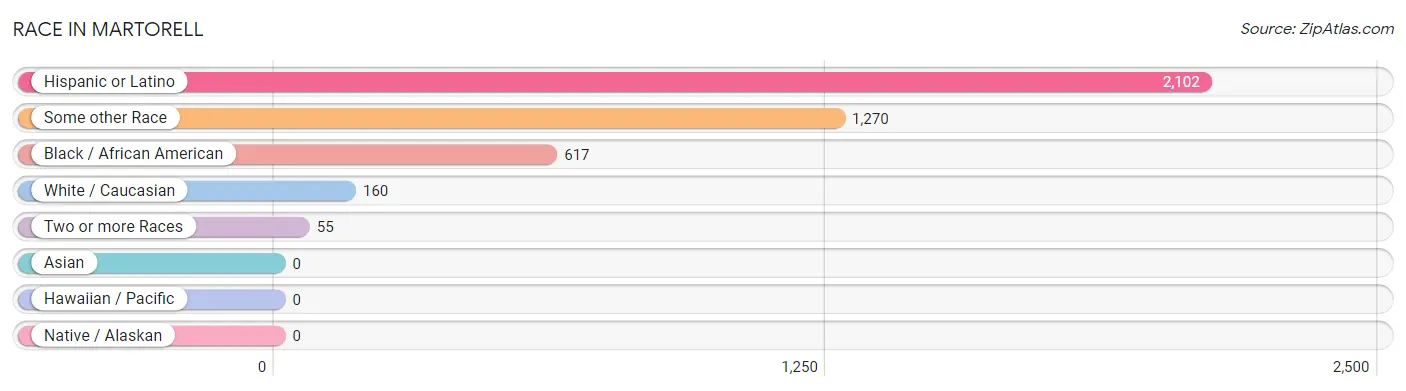
| Race | # Population | % Population |
| Asian | 0 | 0.0% |
| Black / African American | 617 | 29.3% |
| Hawaiian / Pacific | 0 | 0.0% |
| Hispanic or Latino | 2,102 | 100.0% |
| Native / Alaskan | 0 | 0.0% |
| White / Caucasian | 160 | 7.6% |
| Two or more Races | 55 | 2.6% |
| Some other Race | 1,270 | 60.4% |
| Total | 2,102 | 100.0% |
Ancestry in Martorell
The most populous ancestries reported in Martorell are Puerto Rican (2,102 | 100.0%), and American (9 | 0.4%), together accounting for 100.4% of all Martorell residents.
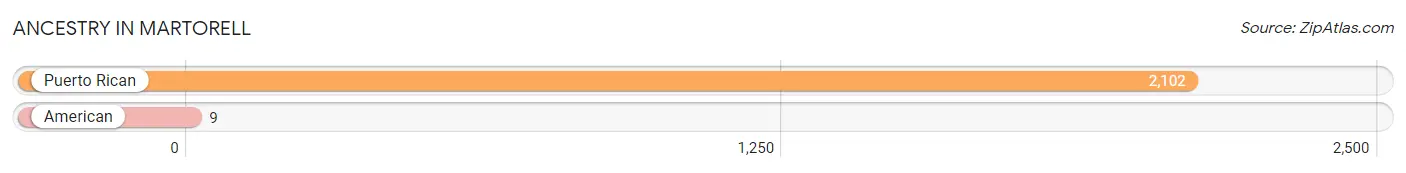
| Ancestry | # Population | % Population |
| American | 9 | 0.4% |
| Puerto Rican | 2,102 | 100.0% | View All 2 Rows |
Immigrants in Martorell

| Immigration Origin | # Population | % Population | View All 0 Rows |
Sex and Age in Martorell
Sex and Age in Martorell
The most populous age groups in Martorell are 65 to 69 Years (145 | 13.9%) for men and 60 to 64 Years (163 | 15.4%) for women.
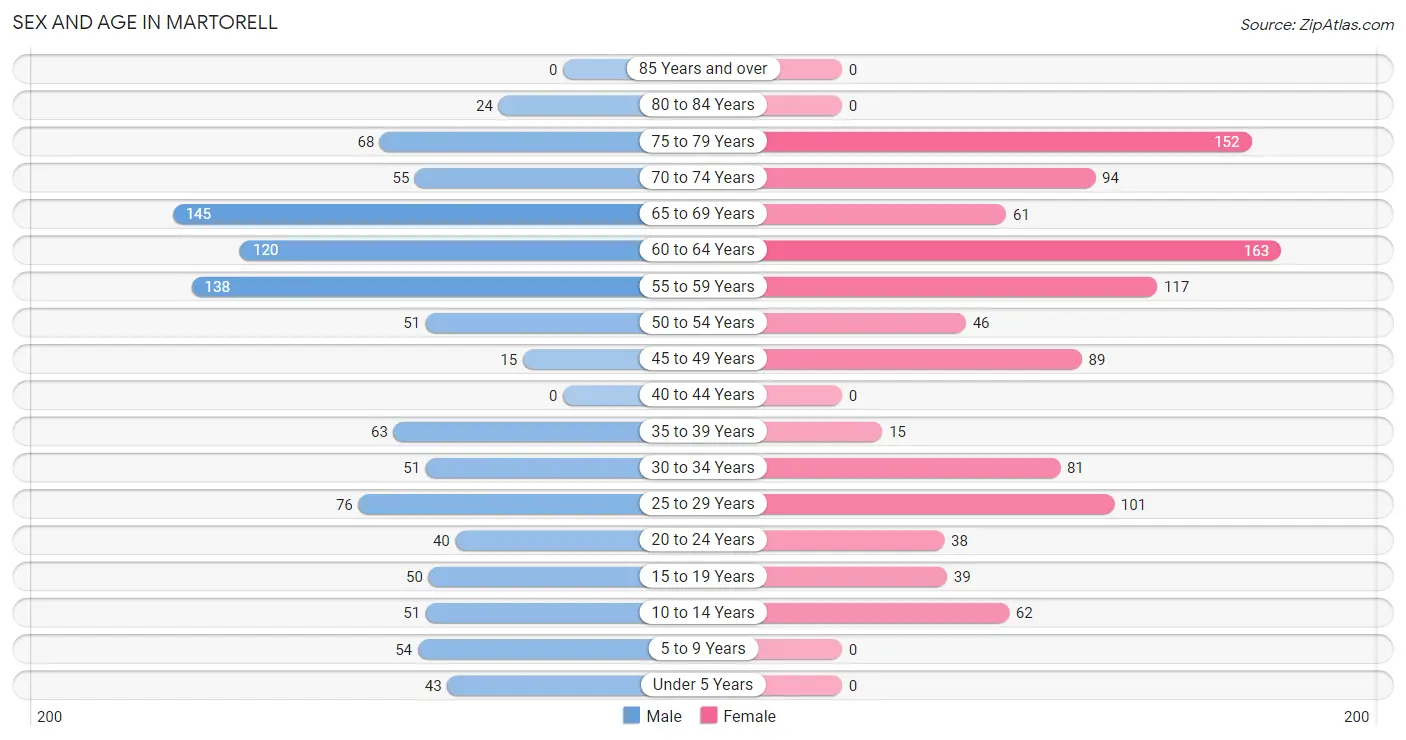
| Age Bracket | Male | Female |
| Under 5 Years | 43 (4.1%) | 0 (0.0%) |
| 5 to 9 Years | 54 (5.2%) | 0 (0.0%) |
| 10 to 14 Years | 51 (4.9%) | 62 (5.9%) |
| 15 to 19 Years | 50 (4.8%) | 39 (3.7%) |
| 20 to 24 Years | 40 (3.8%) | 38 (3.6%) |
| 25 to 29 Years | 76 (7.3%) | 101 (9.6%) |
| 30 to 34 Years | 51 (4.9%) | 81 (7.7%) |
| 35 to 39 Years | 63 (6.0%) | 15 (1.4%) |
| 40 to 44 Years | 0 (0.0%) | 0 (0.0%) |
| 45 to 49 Years | 15 (1.4%) | 89 (8.4%) |
| 50 to 54 Years | 51 (4.9%) | 46 (4.3%) |
| 55 to 59 Years | 138 (13.2%) | 117 (11.1%) |
| 60 to 64 Years | 120 (11.5%) | 163 (15.4%) |
| 65 to 69 Years | 145 (13.9%) | 61 (5.8%) |
| 70 to 74 Years | 55 (5.3%) | 94 (8.9%) |
| 75 to 79 Years | 68 (6.5%) | 152 (14.4%) |
| 80 to 84 Years | 24 (2.3%) | 0 (0.0%) |
| 85 Years and over | 0 (0.0%) | 0 (0.0%) |
| Total | 1,044 (100.0%) | 1,058 (100.0%) |
Families and Households in Martorell
Median Family Size in Martorell
The median family size in Martorell is 3.17 persons per family, with single female/mother families (124 | 27.0%) accounting for the largest median family size of 3.81 persons per family. On the other hand, single male/father families (100 | 21.8%) represent the smallest median family size with 2.57 persons per family.
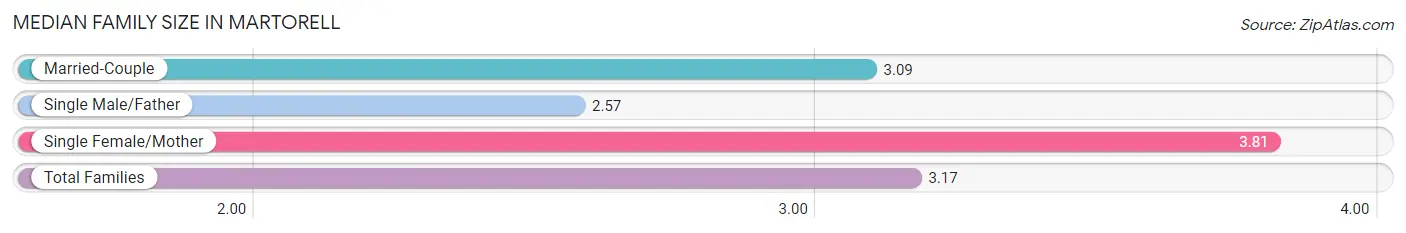
| Family Type | # Families | Family Size |
| Married-Couple | 235 (51.2%) | 3.09 |
| Single Male/Father | 100 (21.8%) | 2.57 |
| Single Female/Mother | 124 (27.0%) | 3.81 |
| Total Families | 459 (100.0%) | 3.17 |
Median Household Size in Martorell
The median household size in Martorell is 2.33 persons per household, with single female/mother households (124 | 13.7%) accounting for the largest median household size of 4.19 persons per household. non-family households (445 | 49.2%) represent the smallest median household size with 1.18 persons per household.
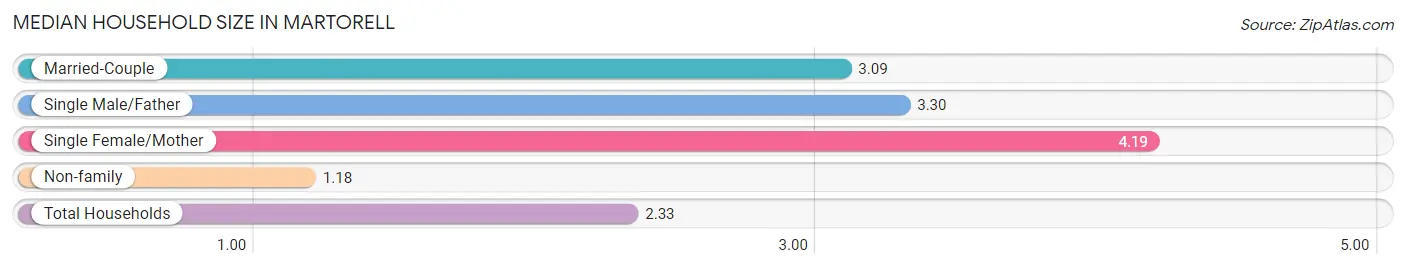
| Household Type | # Households | Household Size |
| Married-Couple | 235 (26.0%) | 3.09 |
| Single Male/Father | 100 (11.1%) | 3.30 |
| Single Female/Mother | 124 (13.7%) | 4.19 |
| Non-family | 445 (49.2%) | 1.18 |
| Total Households | 904 (100.0%) | 2.33 |
Household Size by Marriage Status in Martorell
Out of a total of 904 households in Martorell, 459 (50.8%) are family households, while 445 (49.2%) are nonfamily households. The most numerous type of family households are 2-person households, comprising 218, and the most common type of nonfamily households are 1-person households, comprising 373.
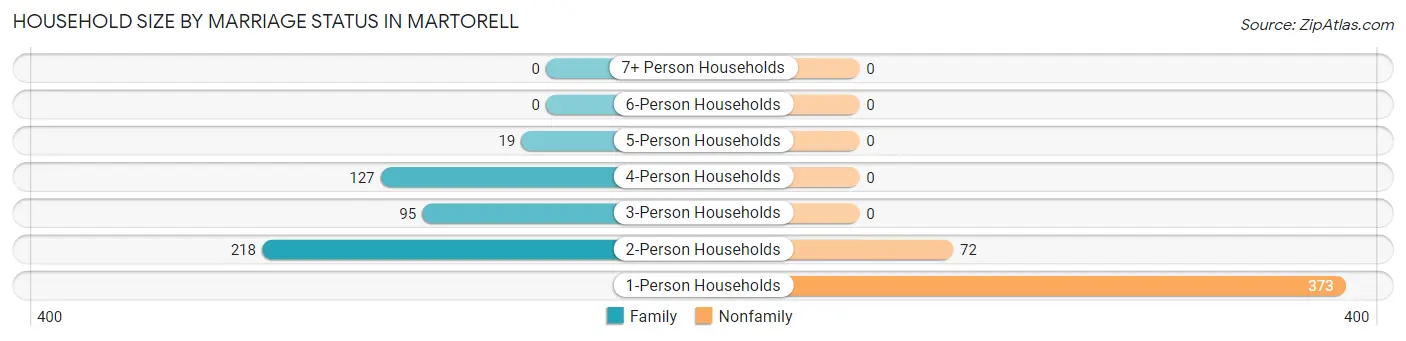
| Household Size | Family Households | Nonfamily Households |
| 1-Person Households | - | 373 (41.3%) |
| 2-Person Households | 218 (24.1%) | 72 (8.0%) |
| 3-Person Households | 95 (10.5%) | 0 (0.0%) |
| 4-Person Households | 127 (14.1%) | 0 (0.0%) |
| 5-Person Households | 19 (2.1%) | 0 (0.0%) |
| 6-Person Households | 0 (0.0%) | 0 (0.0%) |
| 7+ Person Households | 0 (0.0%) | 0 (0.0%) |
| Total | 459 (50.8%) | 445 (49.2%) |
Female Fertility in Martorell
Fertility by Age in Martorell
| Age Bracket | Women with Births | Births / 1,000 Women |
| 15 to 19 years | 0 (0.0%) | 0.0 |
| 20 to 34 years | 0 (0.0%) | 0.0 |
| 35 to 50 years | 0 (0.0%) | 0.0 |
| Total | 0 (0.0%) | 0.0 |
Fertility by Age by Marriage Status in Martorell
| Age Bracket | Married | Unmarried |
| 15 to 19 years | 0 (0.0%) | 0 (0.0%) |
| 20 to 34 years | 0 (0.0%) | 0 (0.0%) |
| 35 to 50 years | 0 (0.0%) | 0 (0.0%) |
| Total | 0 (0.0%) | 0 (0.0%) |
Fertility by Education in Martorell
| Educational Attainment | Women with Births | Births / 1,000 Women |
| Less than High School | 0 (0.0%) | 0.0 |
| High School Diploma | 0 (0.0%) | 0.0 |
| College or Associate's Degree | 0 (0.0%) | 0.0 |
| Bachelor's Degree | 0 (0.0%) | 0.0 |
| Graduate Degree | 0 (0.0%) | 0.0 |
| Total | 0 (0.0%) | 0.0 |
Fertility by Education by Marriage Status in Martorell
| Educational Attainment | Married | Unmarried |
| Less than High School | 0 (0.0%) | 0 (0.0%) |
| High School Diploma | 0 (0.0%) | 0 (0.0%) |
| College or Associate's Degree | 0 (0.0%) | 0 (0.0%) |
| Bachelor's Degree | 0 (0.0%) | 0 (0.0%) |
| Graduate Degree | 0 (0.0%) | 0 (0.0%) |
| Total | 0 (0.0%) | 0 (0.0%) |
Employment Characteristics in Martorell
Employment by Class of Employer in Martorell
Among the 556 employed individuals in Martorell, private company employees (317 | 57.0%), local government employees (64 | 11.5%), and state government employees (59 | 10.6%) make up the most common classes of employment.
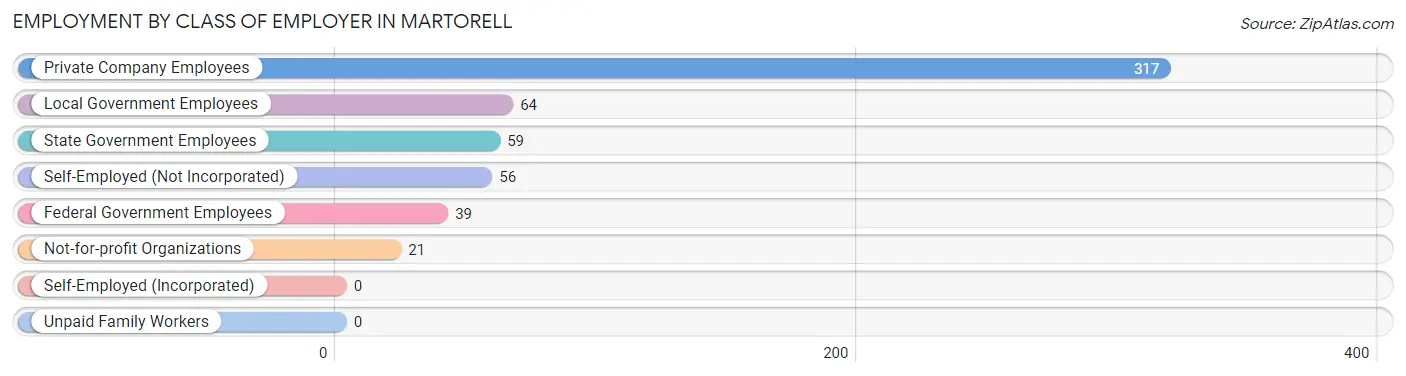
| Employer Class | # Employees | % Employees |
| Private Company Employees | 317 | 57.0% |
| Self-Employed (Incorporated) | 0 | 0.0% |
| Self-Employed (Not Incorporated) | 56 | 10.1% |
| Not-for-profit Organizations | 21 | 3.8% |
| Local Government Employees | 64 | 11.5% |
| State Government Employees | 59 | 10.6% |
| Federal Government Employees | 39 | 7.0% |
| Unpaid Family Workers | 0 | 0.0% |
| Total | 556 | 100.0% |
Employment Status by Age in Martorell
According to the labor force statistics for Martorell, out of the total population over 16 years of age (1,892), 35.8% or 677 individuals are in the labor force, with 15.2% or 103 of them unemployed. The age group with the highest labor force participation rate is 20 to 24 years, with 100.0% or 78 individuals in the labor force. Within the labor force, the 20 to 24 years age range has the highest percentage of unemployed individuals, with 51.3% or 40 of them being unemployed.
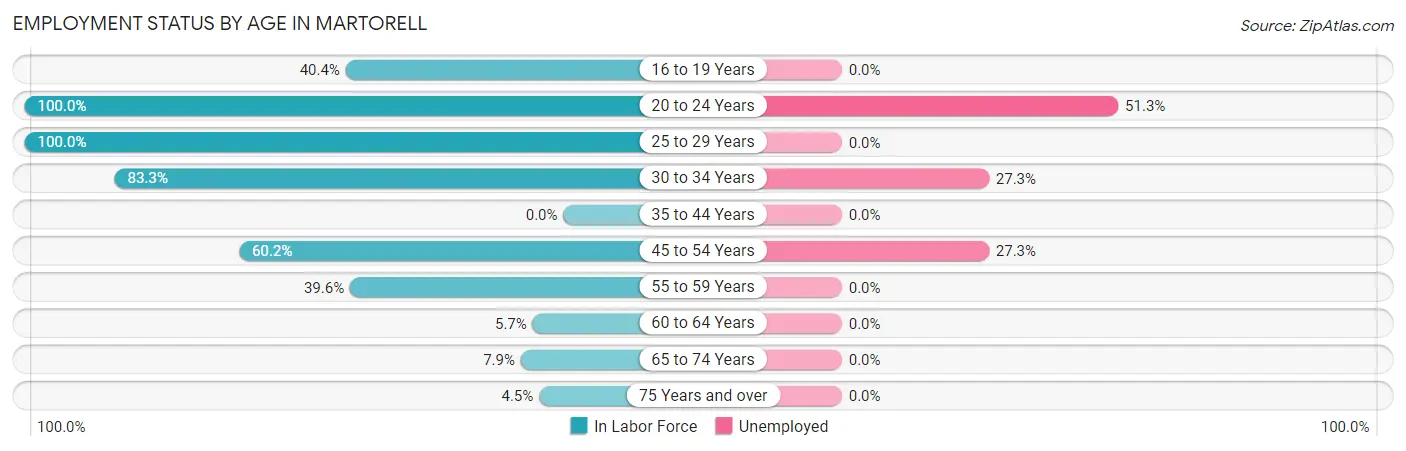
| Age Bracket | In Labor Force | Unemployed |
| 16 to 19 Years | 36 (40.4%) | 0 (0.0%) |
| 20 to 24 Years | 78 (100.0%) | 40 (51.3%) |
| 25 to 29 Years | 177 (100.0%) | 0 (0.0%) |
| 30 to 34 Years | 110 (83.3%) | 30 (27.3%) |
| 35 to 44 Years | 0 (0.0%) | 0 (0.0%) |
| 45 to 54 Years | 121 (60.2%) | 33 (27.3%) |
| 55 to 59 Years | 101 (39.6%) | 0 (0.0%) |
| 60 to 64 Years | 16 (5.7%) | 0 (0.0%) |
| 65 to 74 Years | 28 (7.9%) | 0 (0.0%) |
| 75 Years and over | 11 (4.5%) | 0 (0.0%) |
| Total | 677 (35.8%) | 103 (15.2%) |
Employment Status by Educational Attainment in Martorell
According to labor force statistics for Martorell, 46.6% of individuals (525) out of the total population between 25 and 64 years of age (1,126) are in the labor force, with 12.0% or 63 of them being unemployed. The group with the highest labor force participation rate are those with the educational attainment of bachelor's degree or higher, with 78.2% or 136 individuals in the labor force. Within the labor force, individuals with bachelor's degree or higher education have the highest percentage of unemployment, with 24.3% or 33 of them being unemployed.
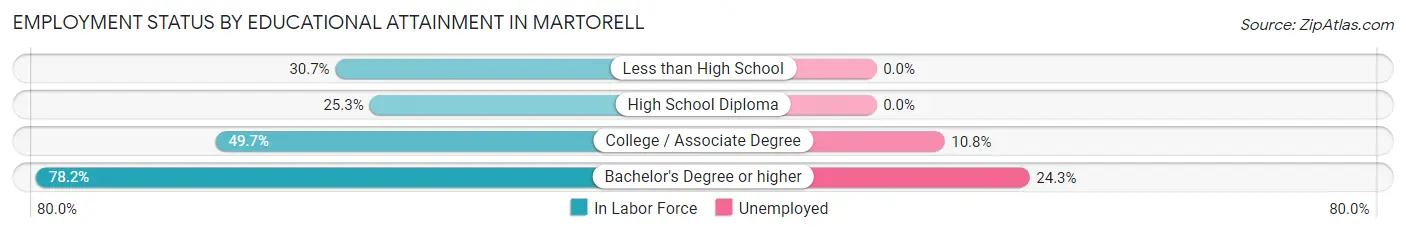
| Educational Attainment | In Labor Force | Unemployed |
| Less than High School | 63 (30.7%) | 0 (0.0%) |
| High School Diploma | 47 (25.3%) | 0 (0.0%) |
| College / Associate Degree | 279 (49.7%) | 61 (10.8%) |
| Bachelor's Degree or higher | 136 (78.2%) | 42 (24.3%) |
| Total | 525 (46.6%) | 135 (12.0%) |
Employment Occupations by Sex in Martorell
Management, Business, Science and Arts Occupations
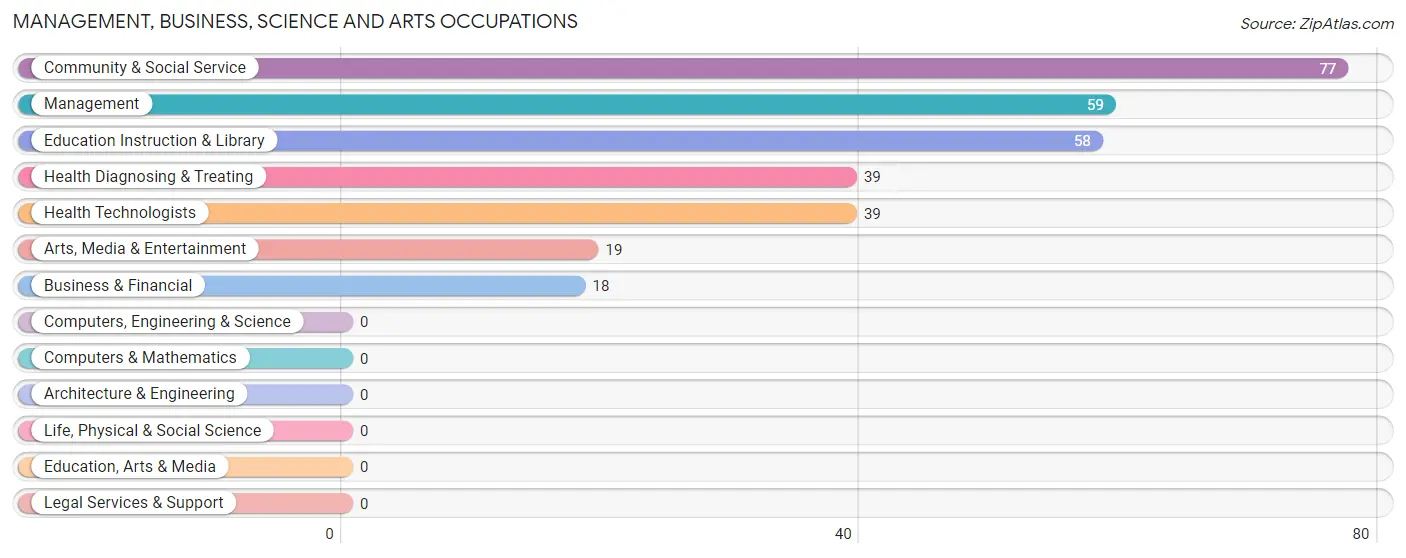
The most common Management, Business, Science and Arts occupations in Martorell are Community & Social Service (77 | 13.4%), Management (59 | 10.3%), Education Instruction & Library (58 | 10.1%), Health Diagnosing & Treating (39 | 6.8%), and Health Technologists (39 | 6.8%).
Management, Business, Science and Arts Occupations by Sex
Within the Management, Business, Science and Arts occupations in Martorell, the most male-oriented occupations are Arts, Media & Entertainment (100.0%), Health Diagnosing & Treating (100.0%), and Health Technologists (100.0%), while the most female-oriented occupations are Management (100.0%), Business & Financial (100.0%), and Education Instruction & Library (100.0%).
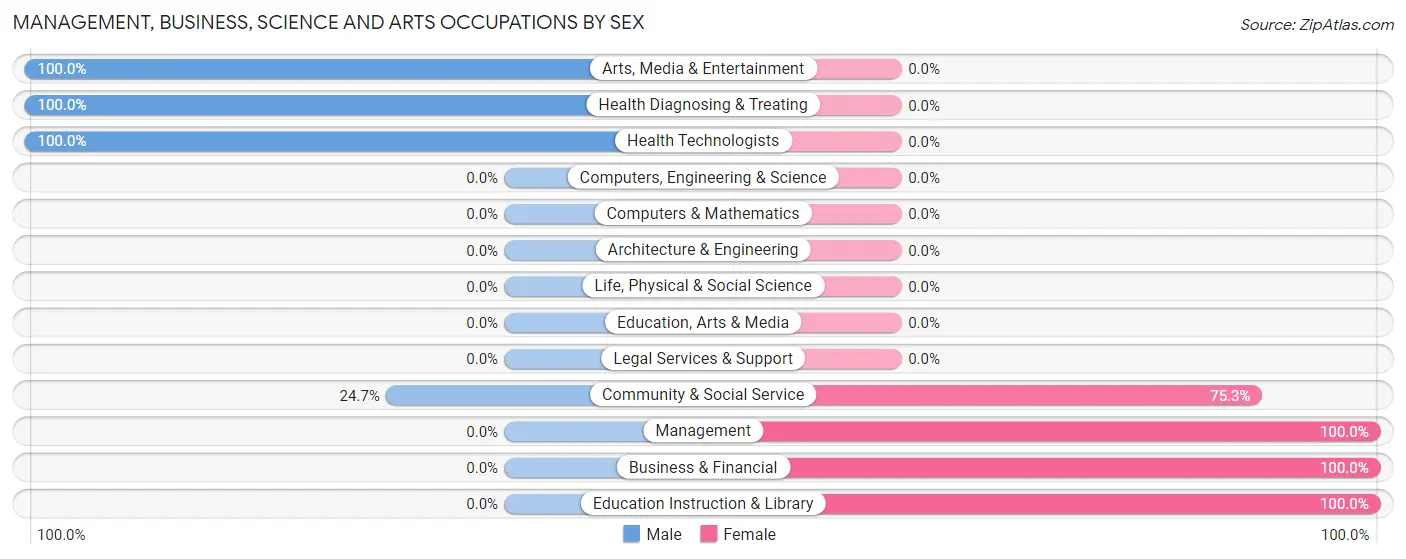
| Occupation | Male | Female |
| Management | 0 (0.0%) | 59 (100.0%) |
| Business & Financial | 0 (0.0%) | 18 (100.0%) |
| Computers, Engineering & Science | 0 (0.0%) | 0 (0.0%) |
| Computers & Mathematics | 0 (0.0%) | 0 (0.0%) |
| Architecture & Engineering | 0 (0.0%) | 0 (0.0%) |
| Life, Physical & Social Science | 0 (0.0%) | 0 (0.0%) |
| Community & Social Service | 19 (24.7%) | 58 (75.3%) |
| Education, Arts & Media | 0 (0.0%) | 0 (0.0%) |
| Legal Services & Support | 0 (0.0%) | 0 (0.0%) |
| Education Instruction & Library | 0 (0.0%) | 58 (100.0%) |
| Arts, Media & Entertainment | 19 (100.0%) | 0 (0.0%) |
| Health Diagnosing & Treating | 39 (100.0%) | 0 (0.0%) |
| Health Technologists | 39 (100.0%) | 0 (0.0%) |
| Total (Category) | 58 (30.0%) | 135 (70.0%) |
| Total (Overall) | 288 (50.1%) | 287 (49.9%) |
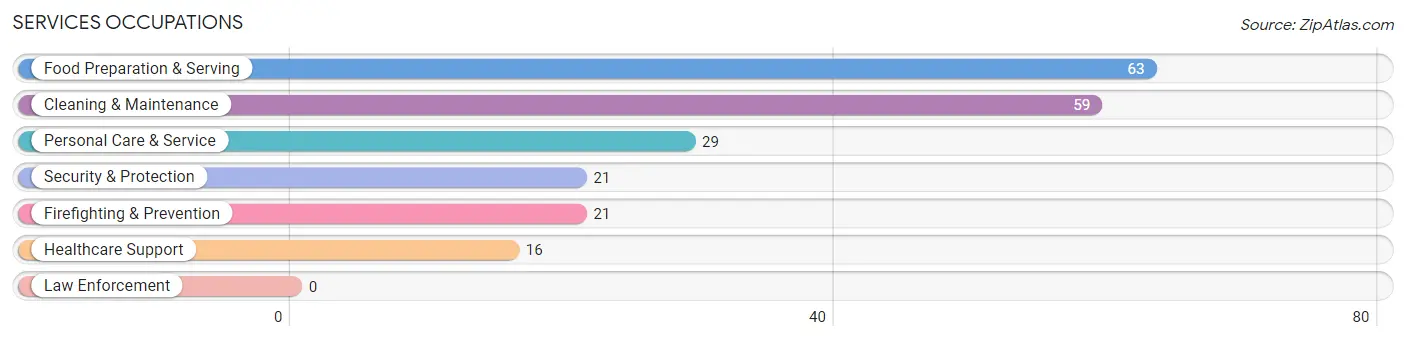
Services Occupations
The most common Services occupations in Martorell are Food Preparation & Serving (63 | 11.0%), Cleaning & Maintenance (59 | 10.3%), Personal Care & Service (29 | 5.0%), Security & Protection (21 | 3.6%), and Firefighting & Prevention (21 | 3.6%).
Services Occupations by Sex
Within the Services occupations in Martorell, the most male-oriented occupations are Cleaning & Maintenance (100.0%), and Personal Care & Service (100.0%), while the most female-oriented occupations are Healthcare Support (100.0%), Security & Protection (100.0%), and Firefighting & Prevention (100.0%).
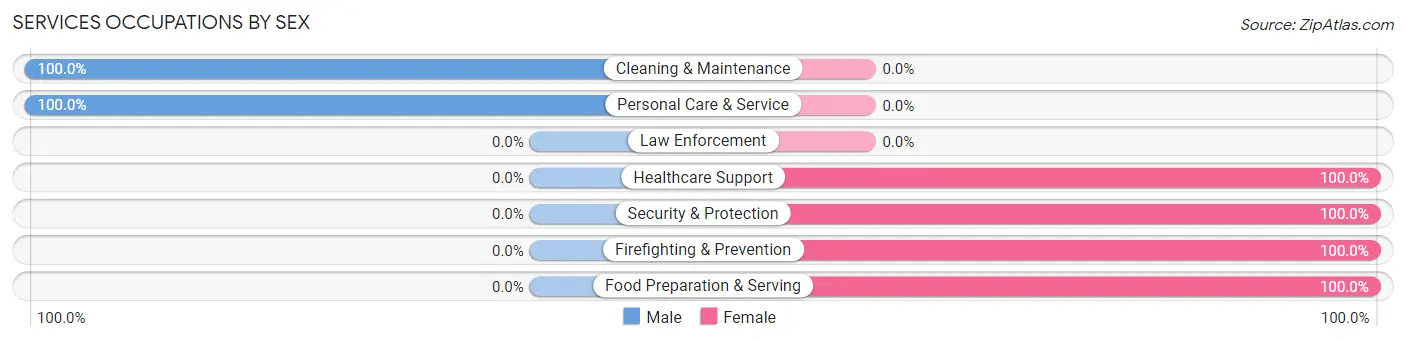
| Occupation | Male | Female |
| Healthcare Support | 0 (0.0%) | 16 (100.0%) |
| Security & Protection | 0 (0.0%) | 21 (100.0%) |
| Firefighting & Prevention | 0 (0.0%) | 21 (100.0%) |
| Law Enforcement | 0 (0.0%) | 0 (0.0%) |
| Food Preparation & Serving | 0 (0.0%) | 63 (100.0%) |
| Cleaning & Maintenance | 59 (100.0%) | 0 (0.0%) |
| Personal Care & Service | 29 (100.0%) | 0 (0.0%) |
| Total (Category) | 88 (46.8%) | 100 (53.2%) |
| Total (Overall) | 288 (50.1%) | 287 (49.9%) |
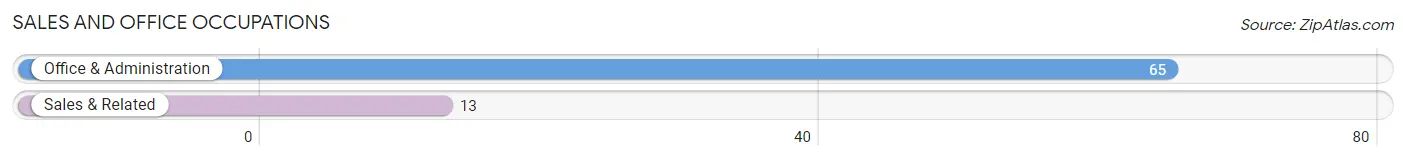
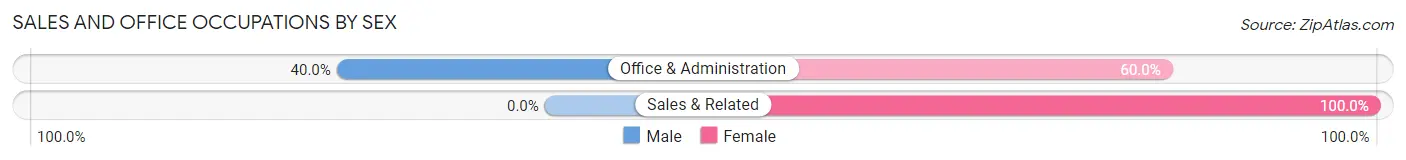
Sales and Office Occupations
The most common Sales and Office occupations in Martorell are Office & Administration (65 | 11.3%), and Sales & Related (13 | 2.3%).
Sales and Office Occupations by Sex
| Occupation | Male | Female |
| Sales & Related | 0 (0.0%) | 13 (100.0%) |
| Office & Administration | 26 (40.0%) | 39 (60.0%) |
| Total (Category) | 26 (33.3%) | 52 (66.7%) |
| Total (Overall) | 288 (50.1%) | 287 (49.9%) |
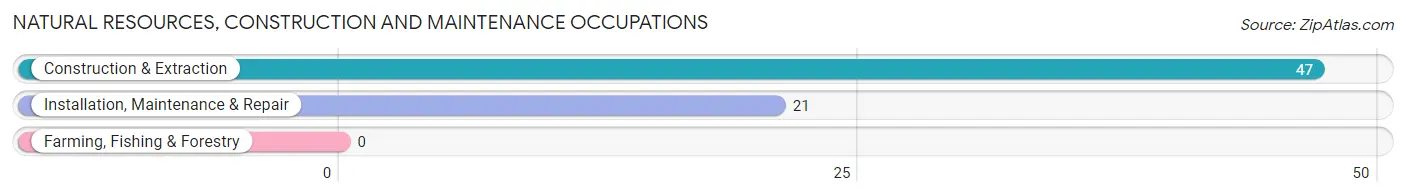
Natural Resources, Construction and Maintenance Occupations
The most common Natural Resources, Construction and Maintenance occupations in Martorell are Construction & Extraction (47 | 8.2%), and Installation, Maintenance & Repair (21 | 3.6%).
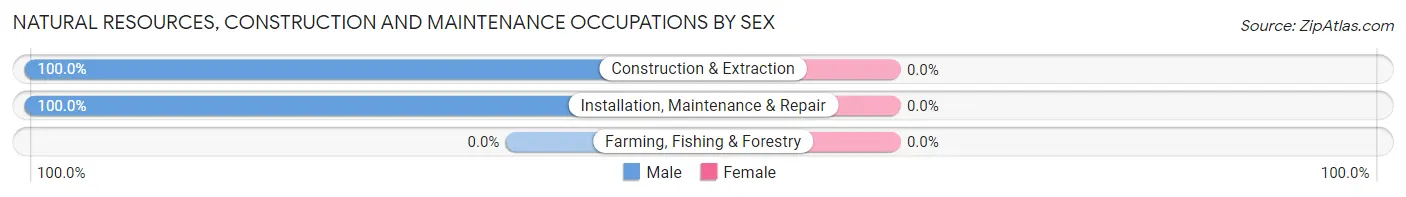
Natural Resources, Construction and Maintenance Occupations by Sex
| Occupation | Male | Female |
| Farming, Fishing & Forestry | 0 (0.0%) | 0 (0.0%) |
| Construction & Extraction | 47 (100.0%) | 0 (0.0%) |
| Installation, Maintenance & Repair | 21 (100.0%) | 0 (0.0%) |
| Total (Category) | 68 (100.0%) | 0 (0.0%) |
| Total (Overall) | 288 (50.1%) | 287 (49.9%) |
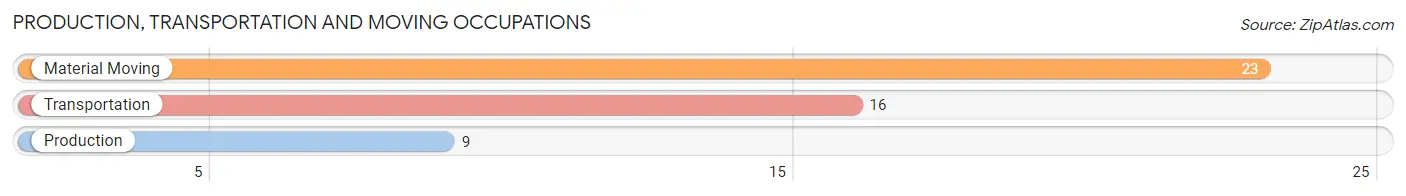
Production, Transportation and Moving Occupations
The most common Production, Transportation and Moving occupations in Martorell are Material Moving (23 | 4.0%), Transportation (16 | 2.8%), and Production (9 | 1.6%).
Production, Transportation and Moving Occupations by Sex
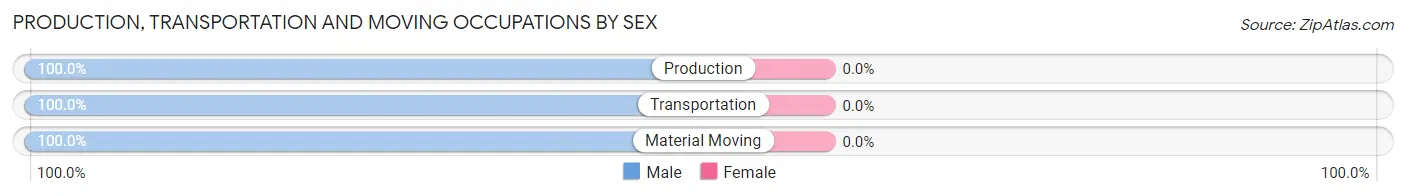
| Occupation | Male | Female |
| Production | 9 (100.0%) | 0 (0.0%) |
| Transportation | 16 (100.0%) | 0 (0.0%) |
| Material Moving | 23 (100.0%) | 0 (0.0%) |
| Total (Category) | 48 (100.0%) | 0 (0.0%) |
| Total (Overall) | 288 (50.1%) | 287 (49.9%) |
Employment Industries by Sex in Martorell
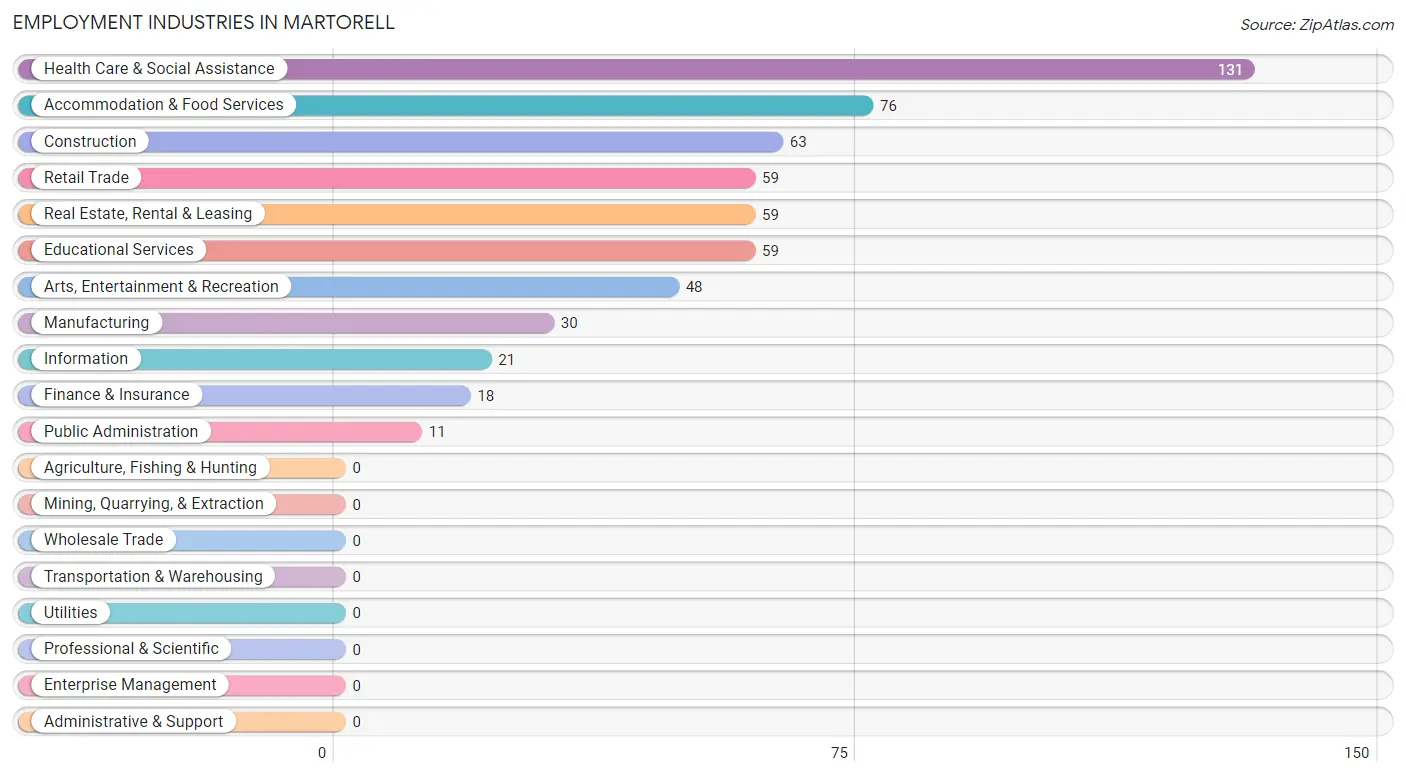
Employment Industries in Martorell
The major employment industries in Martorell include Health Care & Social Assistance (131 | 22.8%), Accommodation & Food Services (76 | 13.2%), Construction (63 | 11.0%), Retail Trade (59 | 10.3%), and Real Estate, Rental & Leasing (59 | 10.3%).
Employment Industries by Sex in Martorell
The Martorell industries that see more men than women are Construction (100.0%), Information (100.0%), and Educational Services (100.0%), whereas the industries that tend to have a higher number of women are Finance & Insurance (100.0%), Real Estate, Rental & Leasing (100.0%), and Accommodation & Food Services (100.0%).
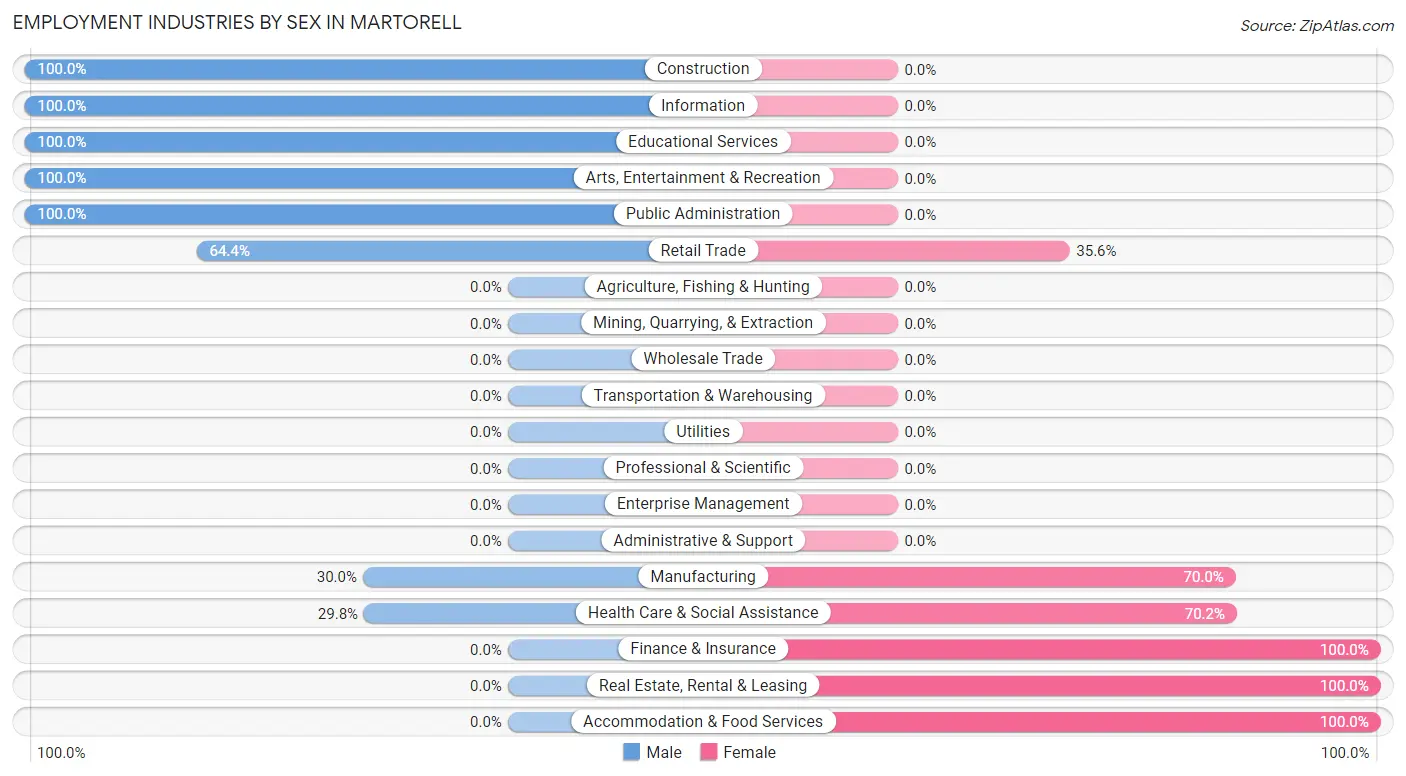
| Industry | Male | Female |
| Agriculture, Fishing & Hunting | 0 (0.0%) | 0 (0.0%) |
| Mining, Quarrying, & Extraction | 0 (0.0%) | 0 (0.0%) |
| Construction | 63 (100.0%) | 0 (0.0%) |
| Manufacturing | 9 (30.0%) | 21 (70.0%) |
| Wholesale Trade | 0 (0.0%) | 0 (0.0%) |
| Retail Trade | 38 (64.4%) | 21 (35.6%) |
| Transportation & Warehousing | 0 (0.0%) | 0 (0.0%) |
| Utilities | 0 (0.0%) | 0 (0.0%) |
| Information | 21 (100.0%) | 0 (0.0%) |
| Finance & Insurance | 0 (0.0%) | 18 (100.0%) |
| Real Estate, Rental & Leasing | 0 (0.0%) | 59 (100.0%) |
| Professional & Scientific | 0 (0.0%) | 0 (0.0%) |
| Enterprise Management | 0 (0.0%) | 0 (0.0%) |
| Administrative & Support | 0 (0.0%) | 0 (0.0%) |
| Educational Services | 59 (100.0%) | 0 (0.0%) |
| Health Care & Social Assistance | 39 (29.8%) | 92 (70.2%) |
| Arts, Entertainment & Recreation | 48 (100.0%) | 0 (0.0%) |
| Accommodation & Food Services | 0 (0.0%) | 76 (100.0%) |
| Public Administration | 11 (100.0%) | 0 (0.0%) |
| Total | 288 (50.1%) | 287 (49.9%) |
Education in Martorell
School Enrollment in Martorell
The most common levels of schooling among the 347 students in Martorell are college / undergraduate (80 | 23.1%), high school (71 | 20.5%), and middle school (68 | 19.6%).
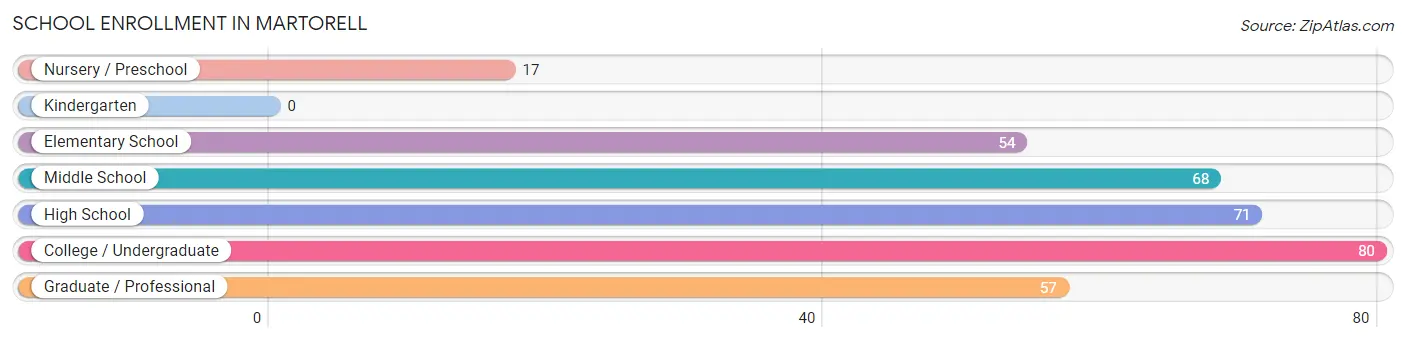
| School Level | # Students | % Students |
| Nursery / Preschool | 17 | 4.9% |
| Kindergarten | 0 | 0.0% |
| Elementary School | 54 | 15.6% |
| Middle School | 68 | 19.6% |
| High School | 71 | 20.5% |
| College / Undergraduate | 80 | 23.1% |
| Graduate / Professional | 57 | 16.4% |
| Total | 347 | 100.0% |
School Enrollment by Age by Funding Source in Martorell
Out of a total of 347 students who are enrolled in schools in Martorell, 118 (34.0%) attend a private institution, while the remaining 229 (66.0%) are enrolled in public schools. The age group of 15 to 17 year olds has the highest likelihood of being enrolled in private schools, with 26 (100.0% in the age bracket) enrolled. Conversely, the age group of 3 to 4 year olds has the lowest likelihood of being enrolled in a private school, with 17 (100.0% in the age bracket) attending a public institution.
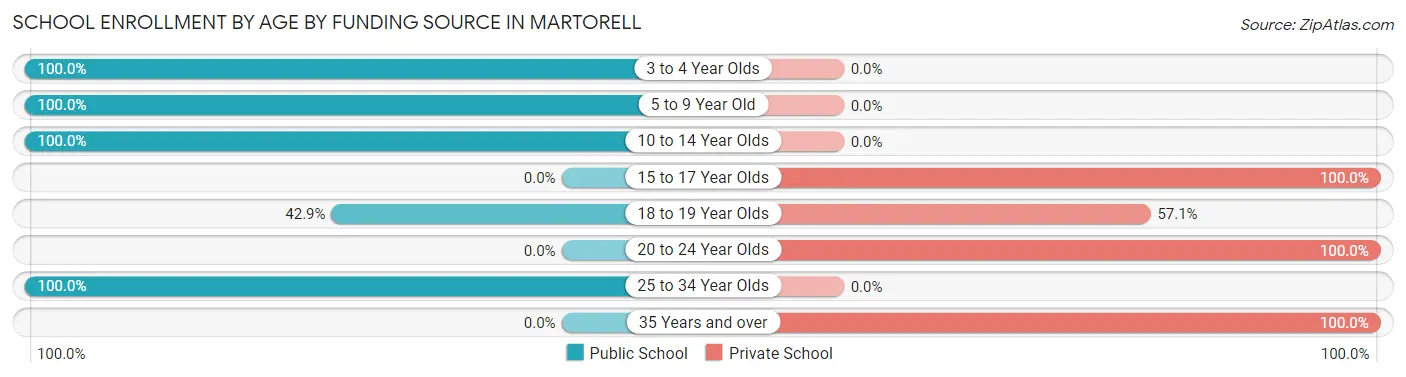
| Age Bracket | Public School | Private School |
| 3 to 4 Year Olds | 17 (100.0%) | 0 (0.0%) |
| 5 to 9 Year Old | 54 (100.0%) | 0 (0.0%) |
| 10 to 14 Year Olds | 113 (100.0%) | 0 (0.0%) |
| 15 to 17 Year Olds | 0 (0.0%) | 26 (100.0%) |
| 18 to 19 Year Olds | 27 (42.9%) | 36 (57.1%) |
| 20 to 24 Year Olds | 0 (0.0%) | 17 (100.0%) |
| 25 to 34 Year Olds | 18 (100.0%) | 0 (0.0%) |
| 35 Years and over | 0 (0.0%) | 39 (100.0%) |
| Total | 229 (66.0%) | 118 (34.0%) |
Educational Attainment by Field of Study in Martorell
Education (84 | 35.4%), social sciences (52 | 21.9%), bio, nature & agricultural (39 | 16.5%), business (23 | 9.7%), and communications (21 | 8.9%) are the most common fields of study among 237 individuals in Martorell who have obtained a bachelor's degree or higher.
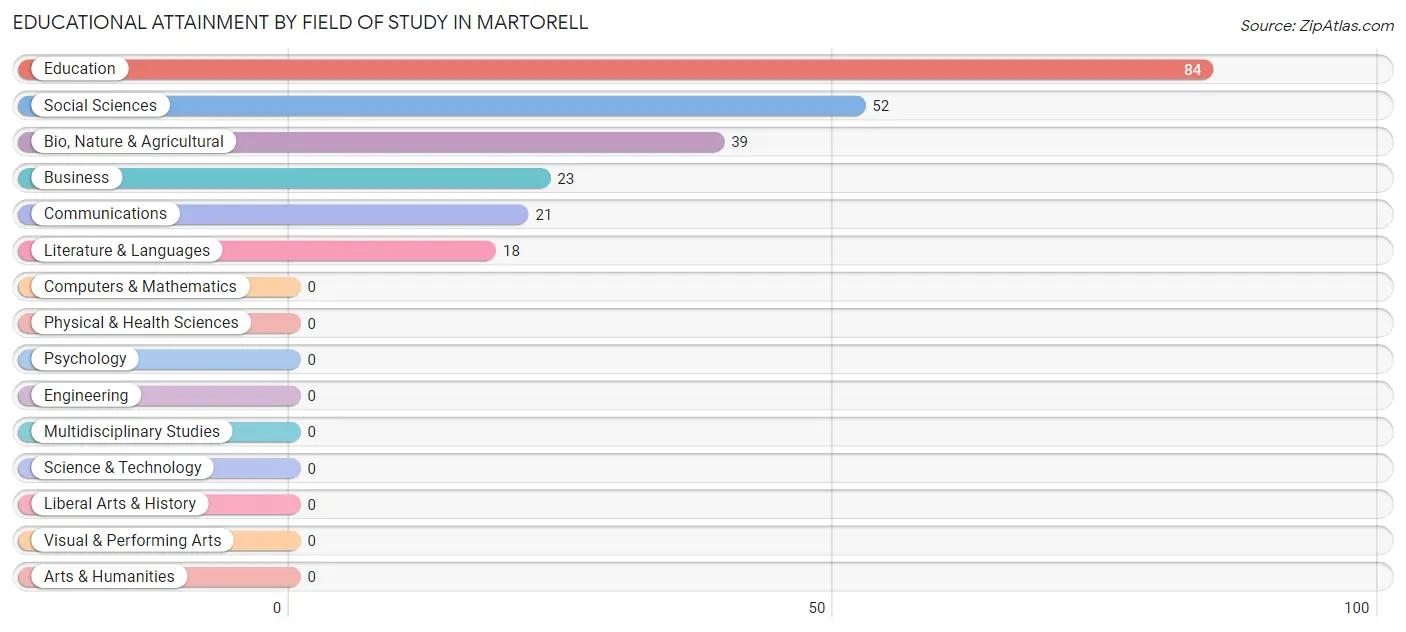
| Field of Study | # Graduates | % Graduates |
| Computers & Mathematics | 0 | 0.0% |
| Bio, Nature & Agricultural | 39 | 16.5% |
| Physical & Health Sciences | 0 | 0.0% |
| Psychology | 0 | 0.0% |
| Social Sciences | 52 | 21.9% |
| Engineering | 0 | 0.0% |
| Multidisciplinary Studies | 0 | 0.0% |
| Science & Technology | 0 | 0.0% |
| Business | 23 | 9.7% |
| Education | 84 | 35.4% |
| Literature & Languages | 18 | 7.6% |
| Liberal Arts & History | 0 | 0.0% |
| Visual & Performing Arts | 0 | 0.0% |
| Communications | 21 | 8.9% |
| Arts & Humanities | 0 | 0.0% |
| Total | 237 | 100.0% |
Transportation & Commute in Martorell
Vehicle Availability by Sex in Martorell
The most prevalent vehicle ownership categories in Martorell are males with 3 vehicles (123, accounting for 42.7%) and females with 3 vehicles (51, making up 45.9%).
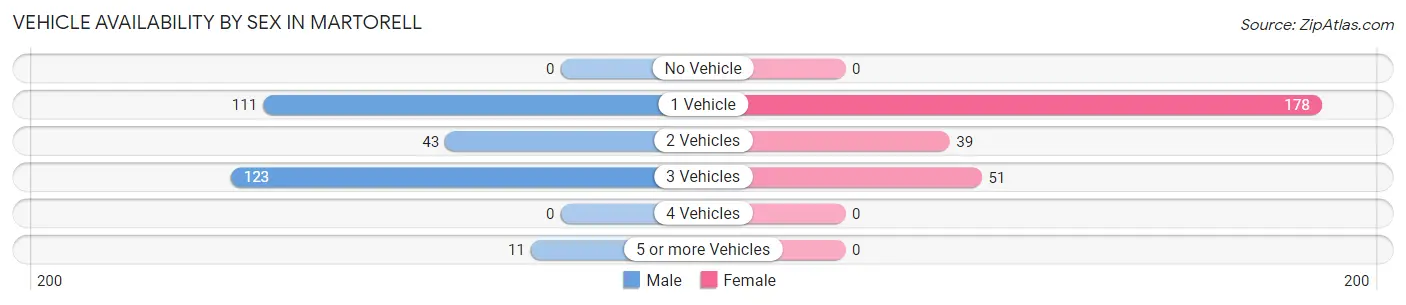
| Vehicles Available | Male | Female |
| No Vehicle | 0 (0.0%) | 0 (0.0%) |
| 1 Vehicle | 111 (38.5%) | 178 (66.4%) |
| 2 Vehicles | 43 (14.9%) | 39 (14.5%) |
| 3 Vehicles | 123 (42.7%) | 51 (19.0%) |
| 4 Vehicles | 0 (0.0%) | 0 (0.0%) |
| 5 or more Vehicles | 11 (3.8%) | 0 (0.0%) |
| Total | 288 (100.0%) | 268 (100.0%) |
Commute Time in Martorell
The most frequently occuring commute durations in Martorell are 30 to 34 minutes (191 commuters, 34.4%), 5 to 9 minutes (104 commuters, 18.7%), and 20 to 24 minutes (102 commuters, 18.3%).
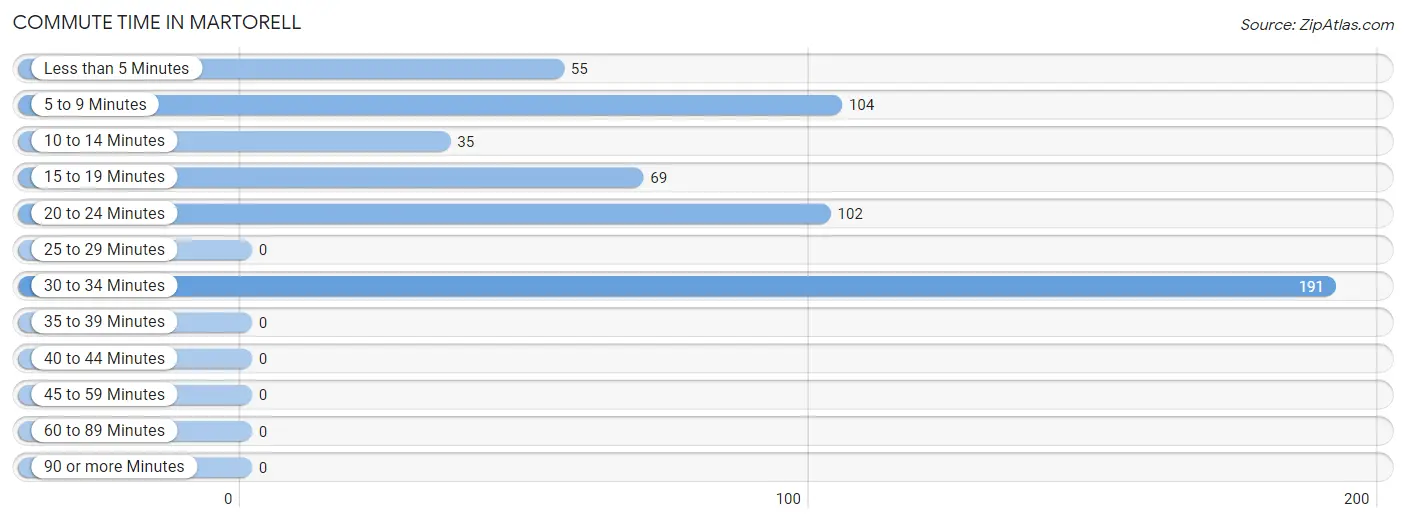
| Commute Time | # Commuters | % Commuters |
| Less than 5 Minutes | 55 | 9.9% |
| 5 to 9 Minutes | 104 | 18.7% |
| 10 to 14 Minutes | 35 | 6.3% |
| 15 to 19 Minutes | 69 | 12.4% |
| 20 to 24 Minutes | 102 | 18.3% |
| 25 to 29 Minutes | 0 | 0.0% |
| 30 to 34 Minutes | 191 | 34.4% |
| 35 to 39 Minutes | 0 | 0.0% |
| 40 to 44 Minutes | 0 | 0.0% |
| 45 to 59 Minutes | 0 | 0.0% |
| 60 to 89 Minutes | 0 | 0.0% |
| 90 or more Minutes | 0 | 0.0% |
Commute Time by Sex in Martorell
The most common commute times in Martorell are 30 to 34 minutes (100 commuters, 34.7%) for males and 30 to 34 minutes (91 commuters, 34.0%) for females.
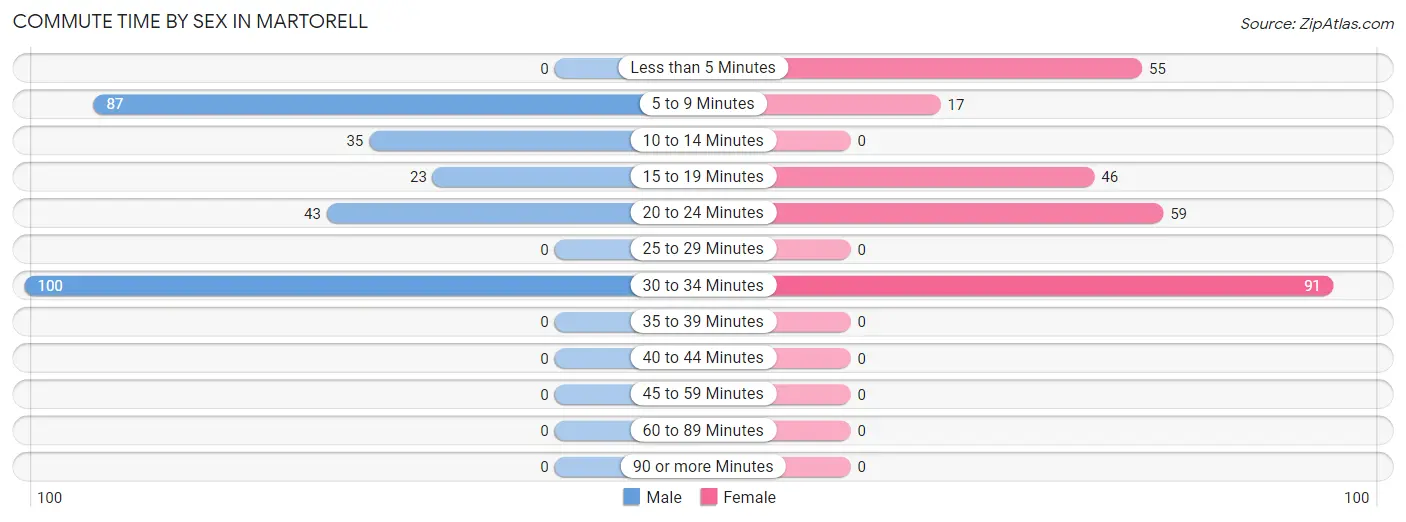
| Commute Time | Male | Female |
| Less than 5 Minutes | 0 (0.0%) | 55 (20.5%) |
| 5 to 9 Minutes | 87 (30.2%) | 17 (6.3%) |
| 10 to 14 Minutes | 35 (12.1%) | 0 (0.0%) |
| 15 to 19 Minutes | 23 (8.0%) | 46 (17.2%) |
| 20 to 24 Minutes | 43 (14.9%) | 59 (22.0%) |
| 25 to 29 Minutes | 0 (0.0%) | 0 (0.0%) |
| 30 to 34 Minutes | 100 (34.7%) | 91 (34.0%) |
| 35 to 39 Minutes | 0 (0.0%) | 0 (0.0%) |
| 40 to 44 Minutes | 0 (0.0%) | 0 (0.0%) |
| 45 to 59 Minutes | 0 (0.0%) | 0 (0.0%) |
| 60 to 89 Minutes | 0 (0.0%) | 0 (0.0%) |
| 90 or more Minutes | 0 (0.0%) | 0 (0.0%) |
Time of Departure to Work by Sex in Martorell
The most frequent times of departure to work in Martorell are 6:00 AM to 6:29 AM (81, 28.1%) for males and 8:00 AM to 8:29 AM (59, 22.0%) for females.
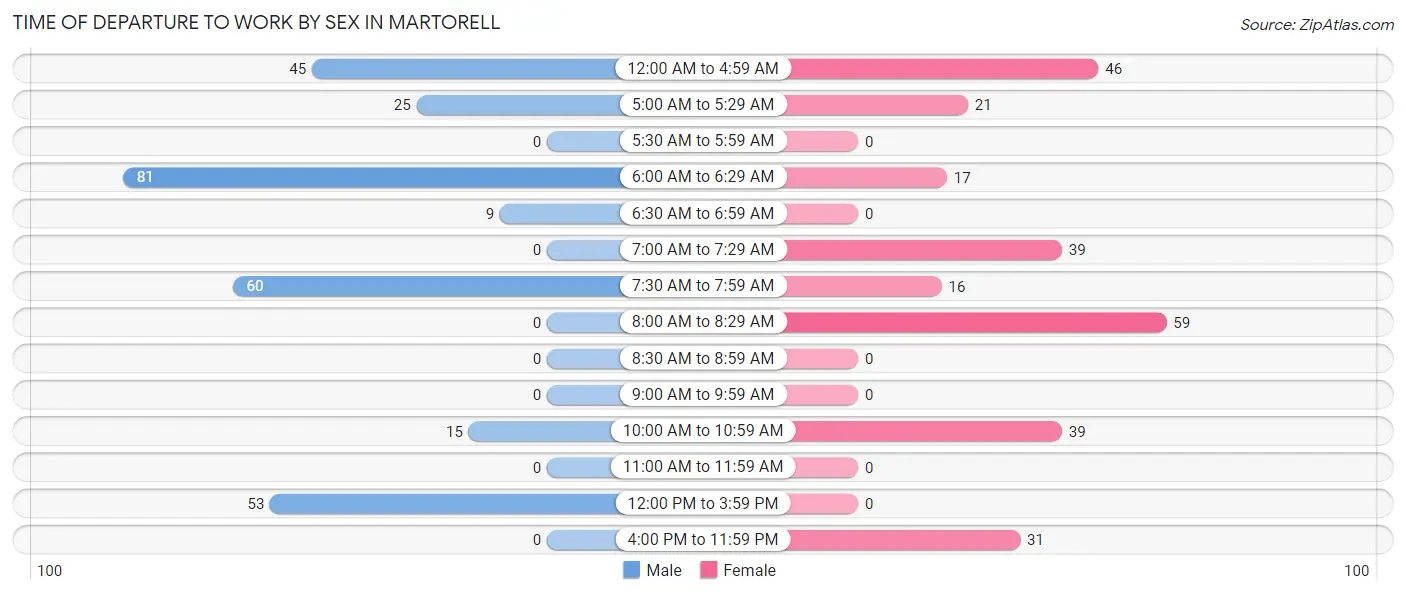
| Time of Departure | Male | Female |
| 12:00 AM to 4:59 AM | 45 (15.6%) | 46 (17.2%) |
| 5:00 AM to 5:29 AM | 25 (8.7%) | 21 (7.8%) |
| 5:30 AM to 5:59 AM | 0 (0.0%) | 0 (0.0%) |
| 6:00 AM to 6:29 AM | 81 (28.1%) | 17 (6.3%) |
| 6:30 AM to 6:59 AM | 9 (3.1%) | 0 (0.0%) |
| 7:00 AM to 7:29 AM | 0 (0.0%) | 39 (14.5%) |
| 7:30 AM to 7:59 AM | 60 (20.8%) | 16 (6.0%) |
| 8:00 AM to 8:29 AM | 0 (0.0%) | 59 (22.0%) |
| 8:30 AM to 8:59 AM | 0 (0.0%) | 0 (0.0%) |
| 9:00 AM to 9:59 AM | 0 (0.0%) | 0 (0.0%) |
| 10:00 AM to 10:59 AM | 15 (5.2%) | 39 (14.5%) |
| 11:00 AM to 11:59 AM | 0 (0.0%) | 0 (0.0%) |
| 12:00 PM to 3:59 PM | 53 (18.4%) | 0 (0.0%) |
| 4:00 PM to 11:59 PM | 0 (0.0%) | 31 (11.6%) |
| Total | 288 (100.0%) | 268 (100.0%) |
Housing Occupancy in Martorell
Occupancy by Ownership in Martorell
Of the total 904 dwellings in Martorell, owner-occupied units account for 596 (65.9%), while renter-occupied units make up 308 (34.1%).
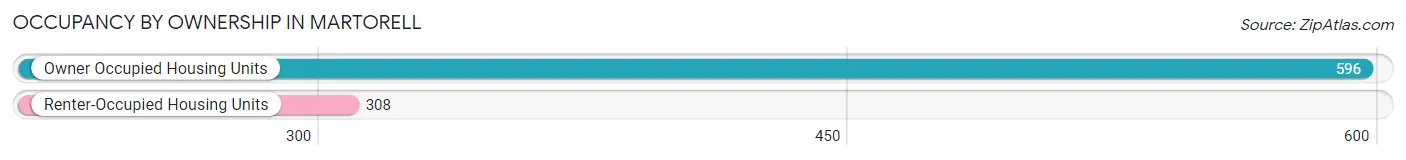
| Occupancy | # Housing Units | % Housing Units |
| Owner Occupied Housing Units | 596 | 65.9% |
| Renter-Occupied Housing Units | 308 | 34.1% |
| Total Occupied Housing Units | 904 | 100.0% |
Occupancy by Household Size in Martorell
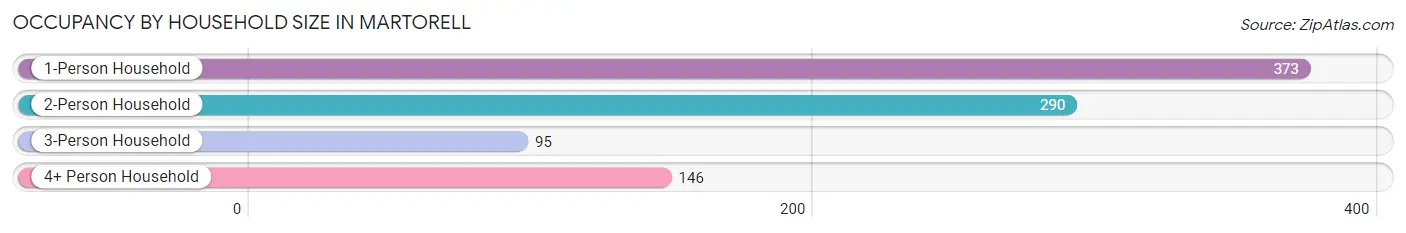
| Household Size | # Housing Units | % Housing Units |
| 1-Person Household | 373 | 41.3% |
| 2-Person Household | 290 | 32.1% |
| 3-Person Household | 95 | 10.5% |
| 4+ Person Household | 146 | 16.2% |
| Total Housing Units | 904 | 100.0% |
Occupancy by Ownership by Household Size in Martorell
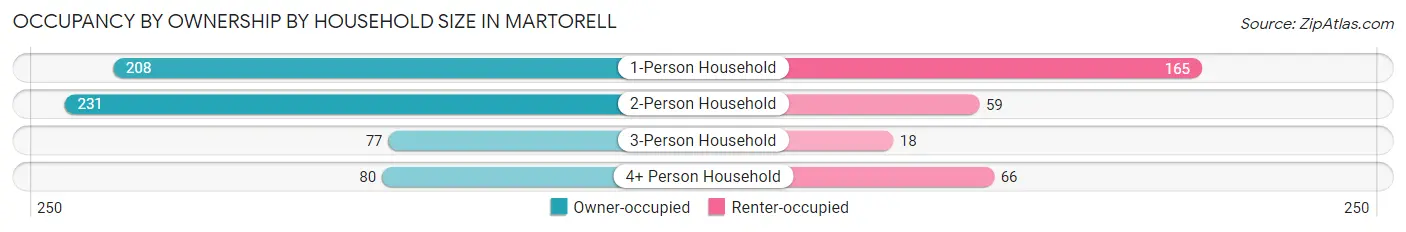
| Household Size | Owner-occupied | Renter-occupied |
| 1-Person Household | 208 (55.8%) | 165 (44.2%) |
| 2-Person Household | 231 (79.7%) | 59 (20.3%) |
| 3-Person Household | 77 (81.0%) | 18 (19.0%) |
| 4+ Person Household | 80 (54.8%) | 66 (45.2%) |
| Total Housing Units | 596 (65.9%) | 308 (34.1%) |
Occupancy by Educational Attainment in Martorell
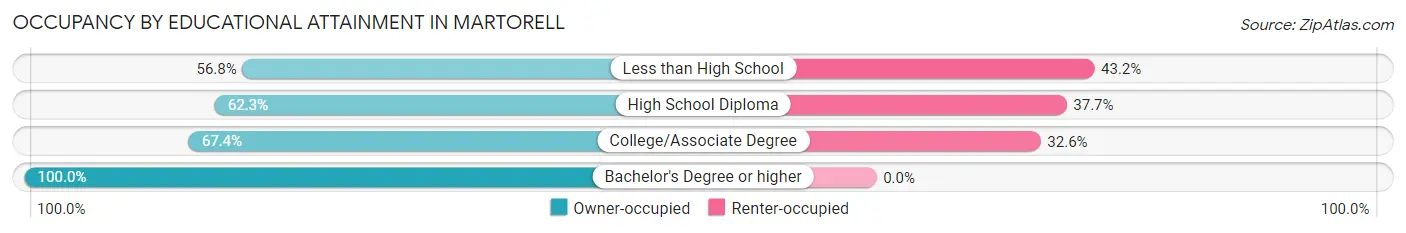
| Household Size | Owner-occupied | Renter-occupied |
| Less than High School | 159 (56.8%) | 121 (43.2%) |
| High School Diploma | 147 (62.3%) | 89 (37.7%) |
| College/Associate Degree | 203 (67.4%) | 98 (32.6%) |
| Bachelor's Degree or higher | 87 (100.0%) | 0 (0.0%) |
Occupancy by Age of Householder in Martorell
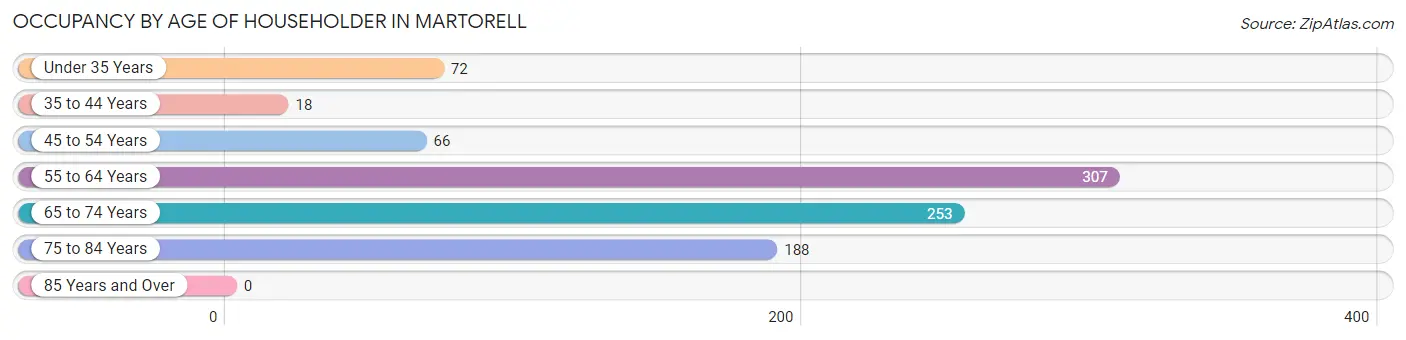
| Age Bracket | # Households | % Households |
| Under 35 Years | 72 | 8.0% |
| 35 to 44 Years | 18 | 2.0% |
| 45 to 54 Years | 66 | 7.3% |
| 55 to 64 Years | 307 | 34.0% |
| 65 to 74 Years | 253 | 28.0% |
| 75 to 84 Years | 188 | 20.8% |
| 85 Years and Over | 0 | 0.0% |
| Total | 904 | 100.0% |
Housing Finances in Martorell
Median Income by Occupancy in Martorell
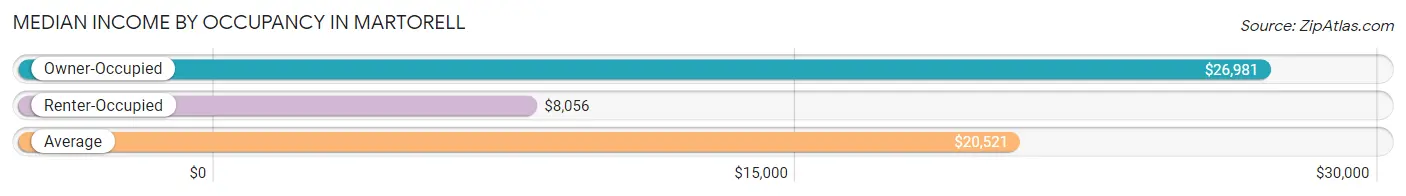
| Occupancy Type | # Households | Median Income |
| Owner-Occupied | 596 (65.9%) | $26,981 |
| Renter-Occupied | 308 (34.1%) | $8,056 |
| Average | 904 (100.0%) | $20,521 |
Occupancy by Householder Income Bracket in Martorell
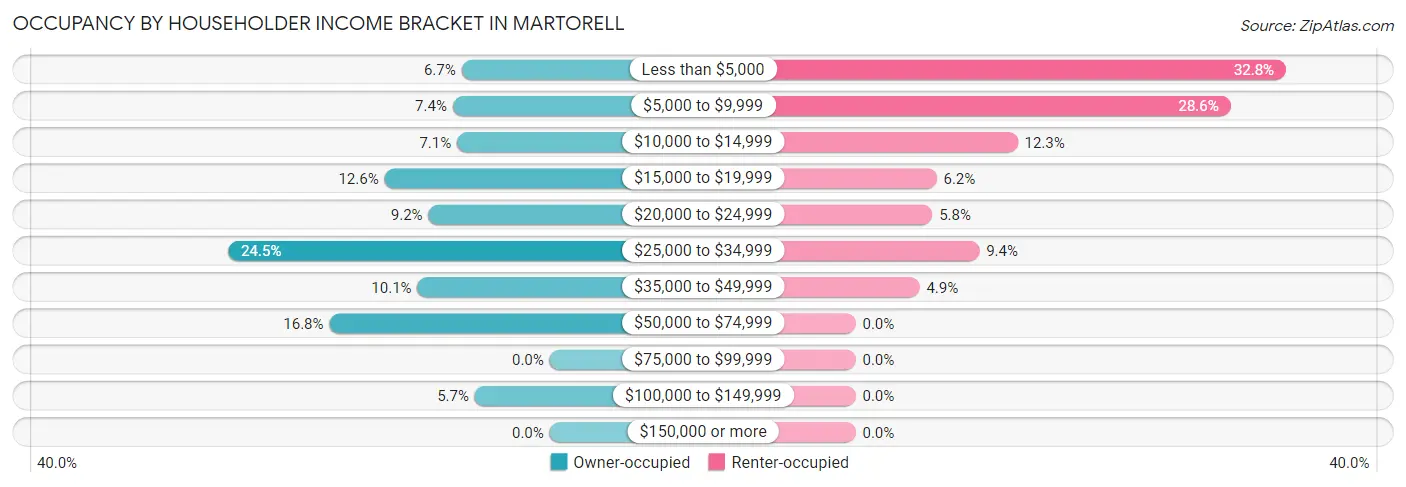
| Income Bracket | Owner-occupied | Renter-occupied |
| Less than $5,000 | 40 (6.7%) | 101 (32.8%) |
| $5,000 to $9,999 | 44 (7.4%) | 88 (28.6%) |
| $10,000 to $14,999 | 42 (7.0%) | 38 (12.3%) |
| $15,000 to $19,999 | 75 (12.6%) | 19 (6.2%) |
| $20,000 to $24,999 | 55 (9.2%) | 18 (5.8%) |
| $25,000 to $34,999 | 146 (24.5%) | 29 (9.4%) |
| $35,000 to $49,999 | 60 (10.1%) | 15 (4.9%) |
| $50,000 to $74,999 | 100 (16.8%) | 0 (0.0%) |
| $75,000 to $99,999 | 0 (0.0%) | 0 (0.0%) |
| $100,000 to $149,999 | 34 (5.7%) | 0 (0.0%) |
| $150,000 or more | 0 (0.0%) | 0 (0.0%) |
| Total | 596 (100.0%) | 308 (100.0%) |
Monthly Housing Cost Tiers in Martorell
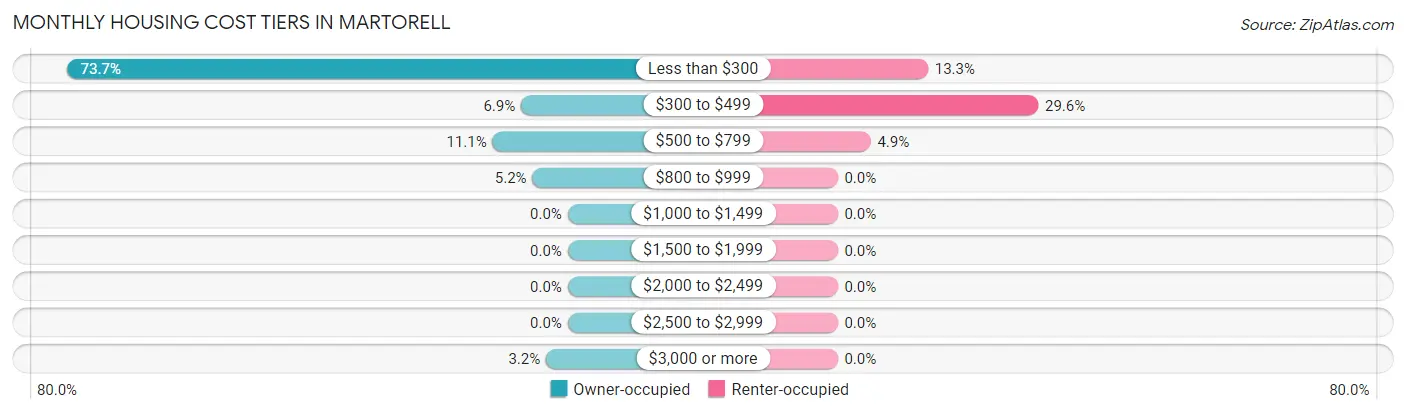
| Monthly Cost | Owner-occupied | Renter-occupied |
| Less than $300 | 439 (73.7%) | 41 (13.3%) |
| $300 to $499 | 41 (6.9%) | 91 (29.5%) |
| $500 to $799 | 66 (11.1%) | 15 (4.9%) |
| $800 to $999 | 31 (5.2%) | 0 (0.0%) |
| $1,000 to $1,499 | 0 (0.0%) | 0 (0.0%) |
| $1,500 to $1,999 | 0 (0.0%) | 0 (0.0%) |
| $2,000 to $2,499 | 0 (0.0%) | 0 (0.0%) |
| $2,500 to $2,999 | 0 (0.0%) | 0 (0.0%) |
| $3,000 or more | 19 (3.2%) | 0 (0.0%) |
| Total | 596 (100.0%) | 308 (100.0%) |
Physical Housing Characteristics in Martorell
Housing Structures in Martorell
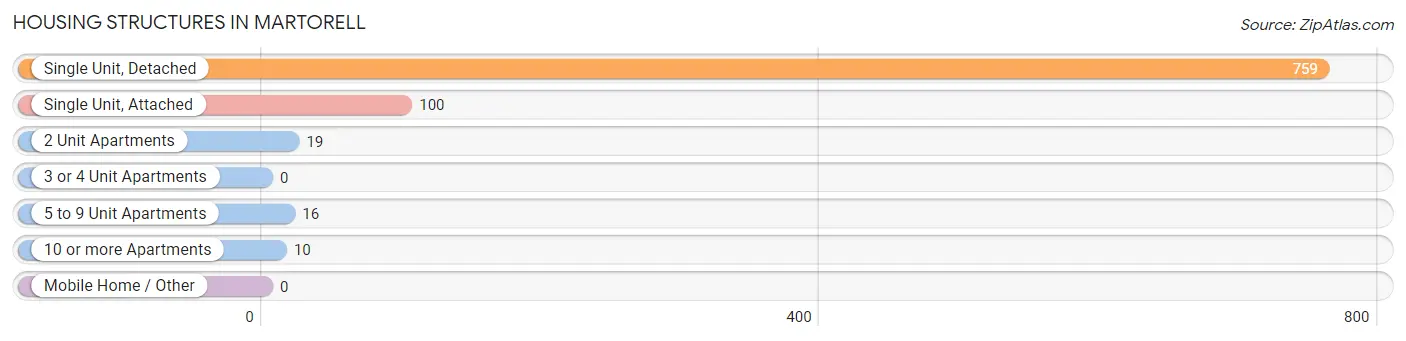
| Structure Type | # Housing Units | % Housing Units |
| Single Unit, Detached | 759 | 84.0% |
| Single Unit, Attached | 100 | 11.1% |
| 2 Unit Apartments | 19 | 2.1% |
| 3 or 4 Unit Apartments | 0 | 0.0% |
| 5 to 9 Unit Apartments | 16 | 1.8% |
| 10 or more Apartments | 10 | 1.1% |
| Mobile Home / Other | 0 | 0.0% |
| Total | 904 | 100.0% |
Housing Structures by Occupancy in Martorell
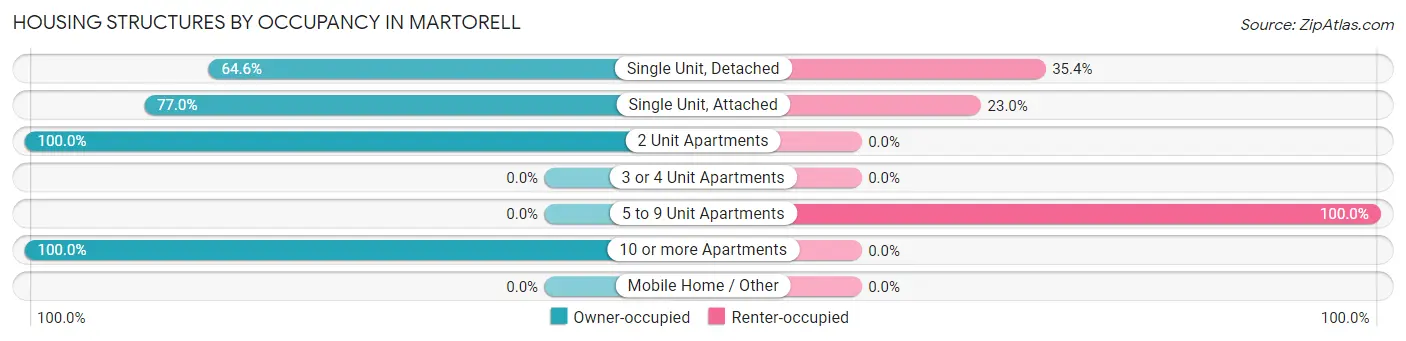
| Structure Type | Owner-occupied | Renter-occupied |
| Single Unit, Detached | 490 (64.6%) | 269 (35.4%) |
| Single Unit, Attached | 77 (77.0%) | 23 (23.0%) |
| 2 Unit Apartments | 19 (100.0%) | 0 (0.0%) |
| 3 or 4 Unit Apartments | 0 (0.0%) | 0 (0.0%) |
| 5 to 9 Unit Apartments | 0 (0.0%) | 16 (100.0%) |
| 10 or more Apartments | 10 (100.0%) | 0 (0.0%) |
| Mobile Home / Other | 0 (0.0%) | 0 (0.0%) |
| Total | 596 (65.9%) | 308 (34.1%) |
Housing Structures by Number of Rooms in Martorell
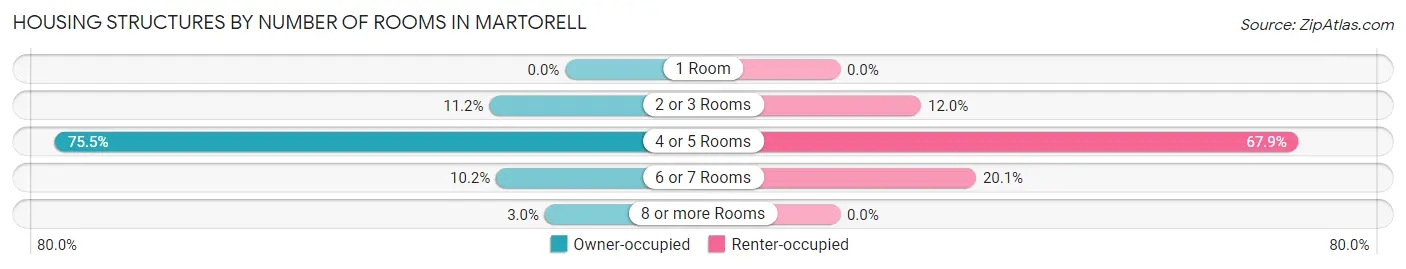
| Number of Rooms | Owner-occupied | Renter-occupied |
| 1 Room | 0 (0.0%) | 0 (0.0%) |
| 2 or 3 Rooms | 67 (11.2%) | 37 (12.0%) |
| 4 or 5 Rooms | 450 (75.5%) | 209 (67.9%) |
| 6 or 7 Rooms | 61 (10.2%) | 62 (20.1%) |
| 8 or more Rooms | 18 (3.0%) | 0 (0.0%) |
| Total | 596 (100.0%) | 308 (100.0%) |
Housing Structure by Heating Type in Martorell
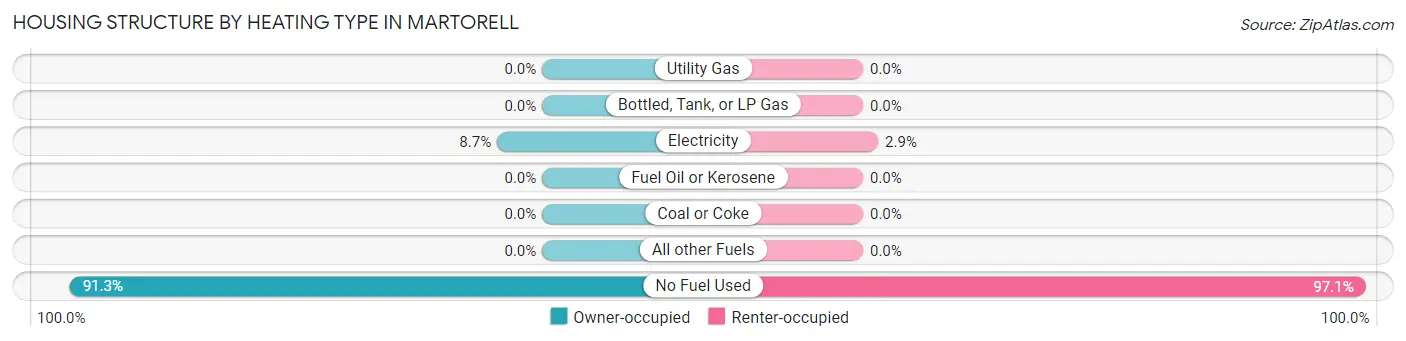
| Heating Type | Owner-occupied | Renter-occupied |
| Utility Gas | 0 (0.0%) | 0 (0.0%) |
| Bottled, Tank, or LP Gas | 0 (0.0%) | 0 (0.0%) |
| Electricity | 52 (8.7%) | 9 (2.9%) |
| Fuel Oil or Kerosene | 0 (0.0%) | 0 (0.0%) |
| Coal or Coke | 0 (0.0%) | 0 (0.0%) |
| All other Fuels | 0 (0.0%) | 0 (0.0%) |
| No Fuel Used | 544 (91.3%) | 299 (97.1%) |
| Total | 596 (100.0%) | 308 (100.0%) |
Household Vehicle Usage in Martorell
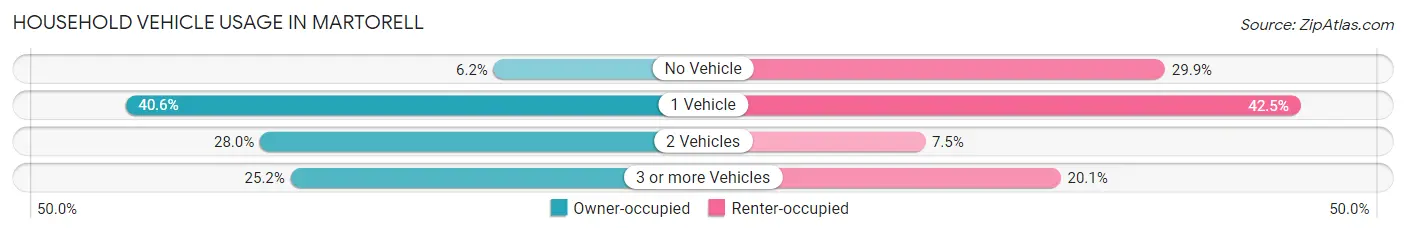
| Vehicles per Household | Owner-occupied | Renter-occupied |
| No Vehicle | 37 (6.2%) | 92 (29.9%) |
| 1 Vehicle | 242 (40.6%) | 131 (42.5%) |
| 2 Vehicles | 167 (28.0%) | 23 (7.5%) |
| 3 or more Vehicles | 150 (25.2%) | 62 (20.1%) |
| Total | 596 (100.0%) | 308 (100.0%) |
Real Estate & Mortgages in Martorell
Real Estate and Mortgage Overview in Martorell
| Characteristic | Without Mortgage | With Mortgage |
| Housing Units | 461 | 135 |
| Median Property Value | $74,200 | $82,700 |
| Median Household Income | $28,059 | $0 |
| Monthly Housing Costs | $125 | $19 |
| Real Estate Taxes | - | - |
Property Value by Mortgage Status in Martorell
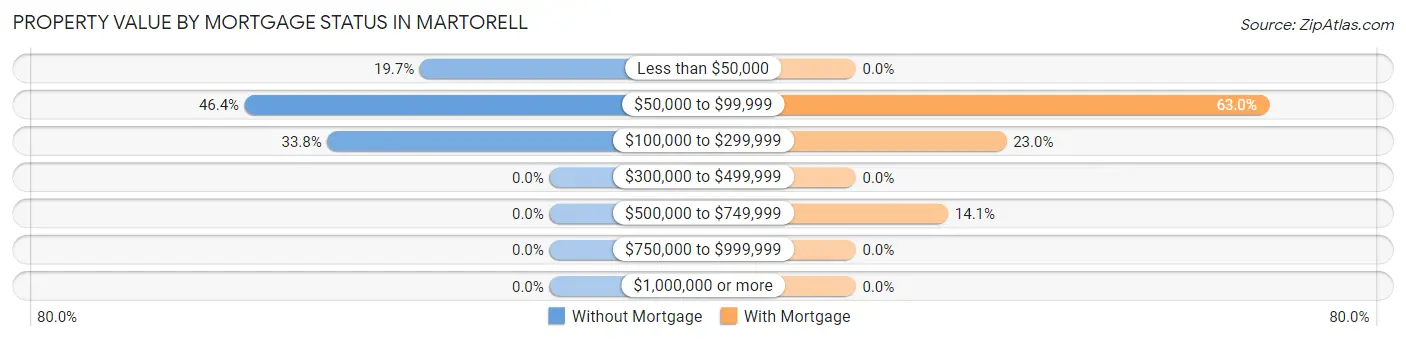
| Property Value | Without Mortgage | With Mortgage |
| Less than $50,000 | 91 (19.7%) | 0 (0.0%) |
| $50,000 to $99,999 | 214 (46.4%) | 85 (63.0%) |
| $100,000 to $299,999 | 156 (33.8%) | 31 (23.0%) |
| $300,000 to $499,999 | 0 (0.0%) | 0 (0.0%) |
| $500,000 to $749,999 | 0 (0.0%) | 19 (14.1%) |
| $750,000 to $999,999 | 0 (0.0%) | 0 (0.0%) |
| $1,000,000 or more | 0 (0.0%) | 0 (0.0%) |
| Total | 461 (100.0%) | 135 (100.0%) |
Household Income by Mortgage Status in Martorell
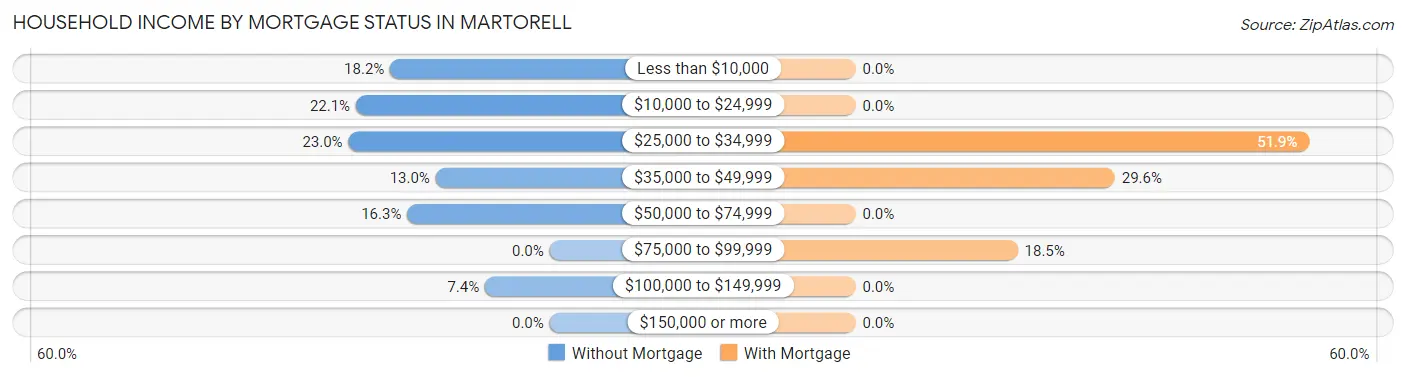
| Household Income | Without Mortgage | With Mortgage |
| Less than $10,000 | 84 (18.2%) | 0 (0.0%) |
| $10,000 to $24,999 | 102 (22.1%) | 0 (0.0%) |
| $25,000 to $34,999 | 106 (23.0%) | 70 (51.8%) |
| $35,000 to $49,999 | 60 (13.0%) | 40 (29.6%) |
| $50,000 to $74,999 | 75 (16.3%) | 0 (0.0%) |
| $75,000 to $99,999 | 0 (0.0%) | 25 (18.5%) |
| $100,000 to $149,999 | 34 (7.4%) | 0 (0.0%) |
| $150,000 or more | 0 (0.0%) | 0 (0.0%) |
| Total | 461 (100.0%) | 135 (100.0%) |
Property Value to Household Income Ratio in Martorell
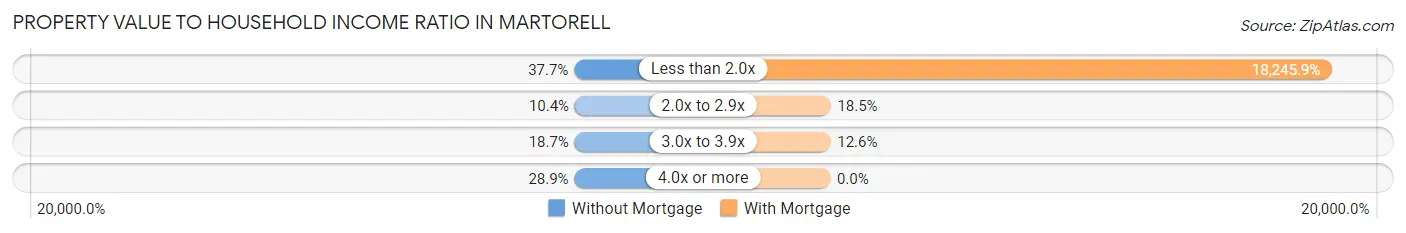
| Value-to-Income Ratio | Without Mortgage | With Mortgage |
| Less than 2.0x | 174 (37.7%) | 24,632 (18,245.9%) |
| 2.0x to 2.9x | 48 (10.4%) | 25 (18.5%) |
| 3.0x to 3.9x | 86 (18.7%) | 17 (12.6%) |
| 4.0x or more | 133 (28.8%) | 0 (0.0%) |
| Total | 461 (100.0%) | 135 (100.0%) |
Real Estate Taxes by Mortgage Status in Martorell
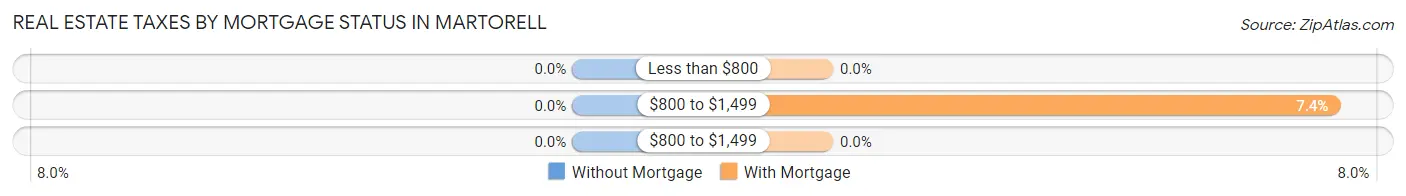
| Property Taxes | Without Mortgage | With Mortgage |
| Less than $800 | 0 (0.0%) | 0 (0.0%) |
| $800 to $1,499 | 0 (0.0%) | 10 (7.4%) |
| $800 to $1,499 | 0 (0.0%) | 0 (0.0%) |
| Total | 461 (100.0%) | 135 (100.0%) |
Health & Disability in Martorell
Health Insurance Coverage by Age in Martorell
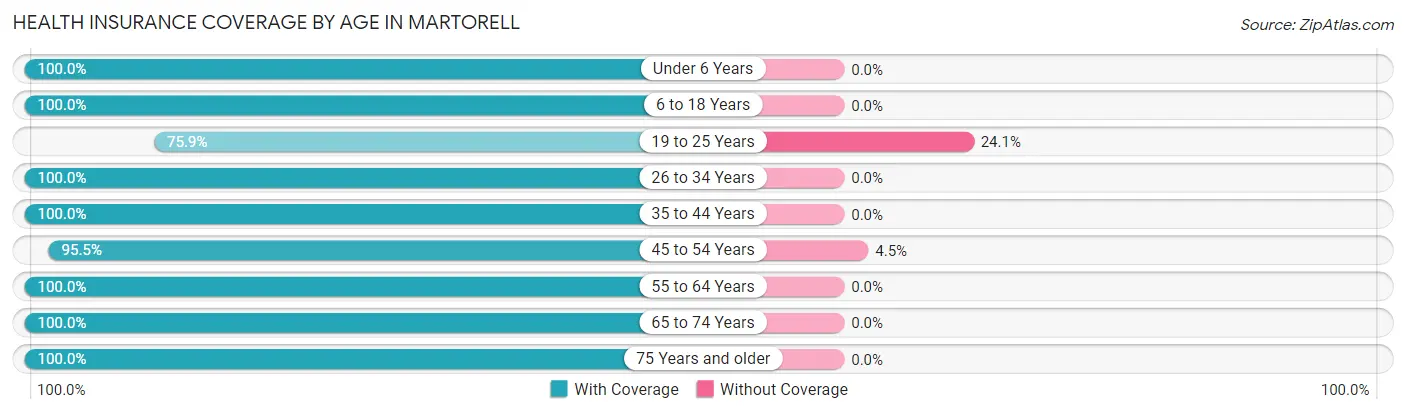
| Age Bracket | With Coverage | Without Coverage |
| Under 6 Years | 43 (100.0%) | 0 (0.0%) |
| 6 to 18 Years | 206 (100.0%) | 0 (0.0%) |
| 19 to 25 Years | 132 (75.9%) | 42 (24.1%) |
| 26 to 34 Years | 263 (100.0%) | 0 (0.0%) |
| 35 to 44 Years | 78 (100.0%) | 0 (0.0%) |
| 45 to 54 Years | 192 (95.5%) | 9 (4.5%) |
| 55 to 64 Years | 538 (100.0%) | 0 (0.0%) |
| 65 to 74 Years | 355 (100.0%) | 0 (0.0%) |
| 75 Years and older | 244 (100.0%) | 0 (0.0%) |
| Total | 2,051 (97.6%) | 51 (2.4%) |
Health Insurance Coverage by Citizenship Status in Martorell
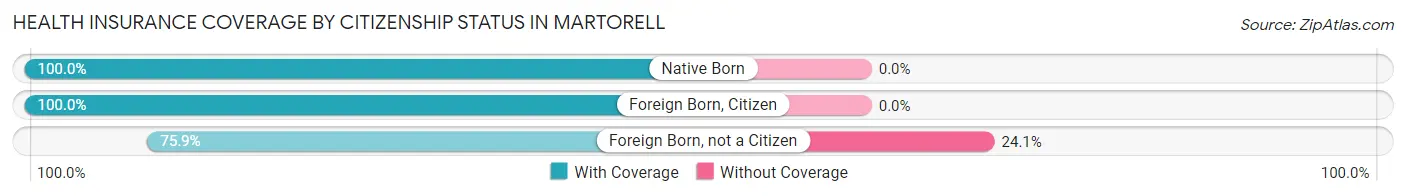
| Citizenship Status | With Coverage | Without Coverage |
| Native Born | 43 (100.0%) | 0 (0.0%) |
| Foreign Born, Citizen | 206 (100.0%) | 0 (0.0%) |
| Foreign Born, not a Citizen | 132 (75.9%) | 42 (24.1%) |
Health Insurance Coverage by Household Income in Martorell
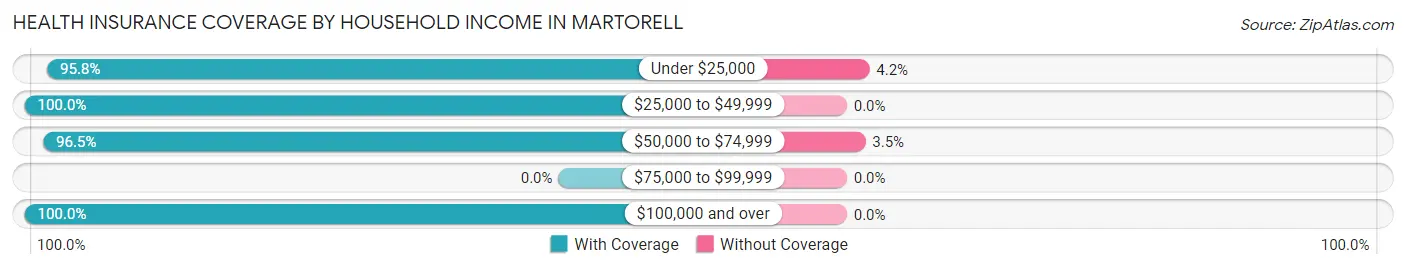
| Household Income | With Coverage | Without Coverage |
| Under $25,000 | 952 (95.8%) | 42 (4.2%) |
| $25,000 to $49,999 | 660 (100.0%) | 0 (0.0%) |
| $50,000 to $74,999 | 250 (96.5%) | 9 (3.5%) |
| $75,000 to $99,999 | 0 (0.0%) | 0 (0.0%) |
| $100,000 and over | 189 (100.0%) | 0 (0.0%) |
Public vs Private Health Insurance Coverage by Age in Martorell
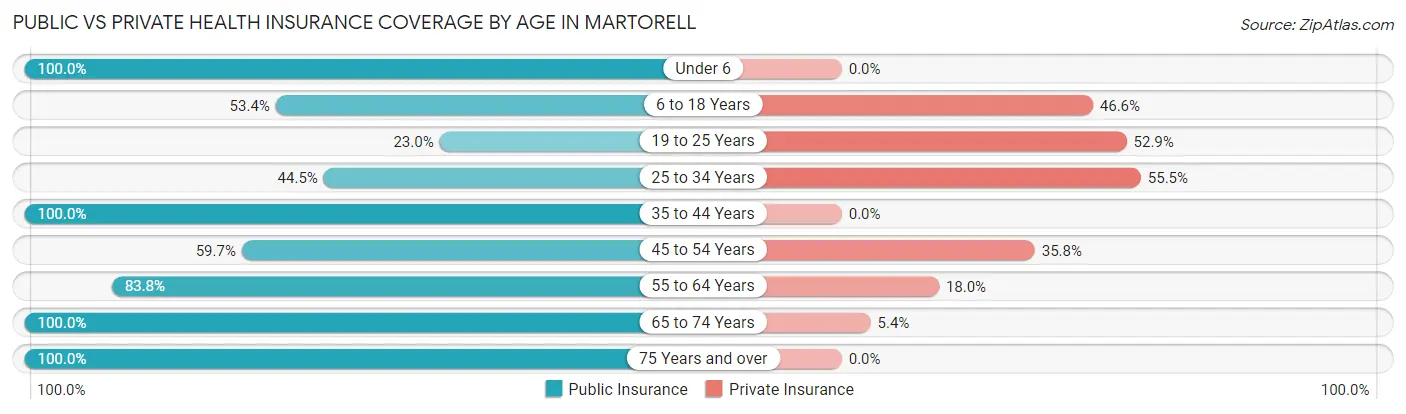
| Age Bracket | Public Insurance | Private Insurance |
| Under 6 | 43 (100.0%) | 0 (0.0%) |
| 6 to 18 Years | 110 (53.4%) | 96 (46.6%) |
| 19 to 25 Years | 40 (23.0%) | 92 (52.9%) |
| 25 to 34 Years | 117 (44.5%) | 146 (55.5%) |
| 35 to 44 Years | 78 (100.0%) | 0 (0.0%) |
| 45 to 54 Years | 120 (59.7%) | 72 (35.8%) |
| 55 to 64 Years | 451 (83.8%) | 97 (18.0%) |
| 65 to 74 Years | 355 (100.0%) | 19 (5.3%) |
| 75 Years and over | 244 (100.0%) | 0 (0.0%) |
| Total | 1,558 (74.1%) | 522 (24.8%) |
Disability Status by Sex by Age in Martorell
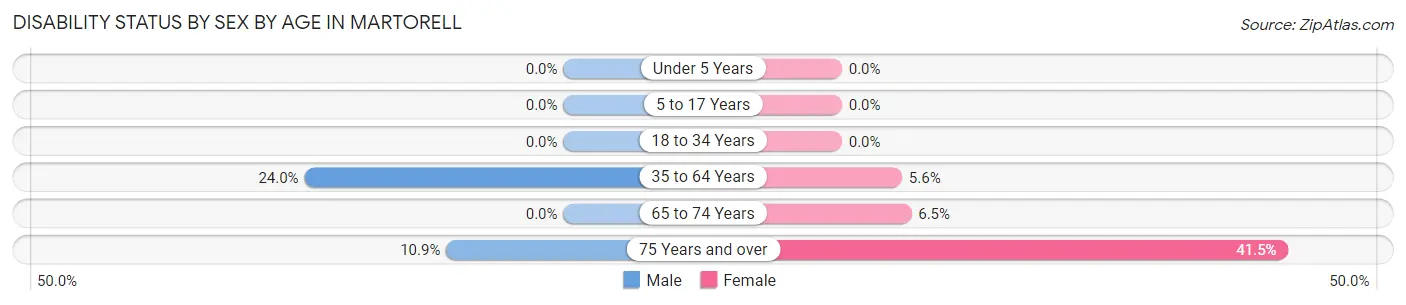
| Age Bracket | Male | Female |
| Under 5 Years | 0 (0.0%) | 0 (0.0%) |
| 5 to 17 Years | 0 (0.0%) | 0 (0.0%) |
| 18 to 34 Years | 0 (0.0%) | 0 (0.0%) |
| 35 to 64 Years | 93 (24.0%) | 24 (5.6%) |
| 65 to 74 Years | 0 (0.0%) | 10 (6.5%) |
| 75 Years and over | 10 (10.9%) | 63 (41.4%) |
Disability Class by Sex by Age in Martorell
Disability Class: Hearing Difficulty
| Age Bracket | Male | Female |
| Under 5 Years | 0 (0.0%) | 0 (0.0%) |
| 5 to 17 Years | 0 (0.0%) | 0 (0.0%) |
| 18 to 34 Years | 0 (0.0%) | 0 (0.0%) |
| 35 to 64 Years | 0 (0.0%) | 0 (0.0%) |
| 65 to 74 Years | 0 (0.0%) | 0 (0.0%) |
| 75 Years and over | 0 (0.0%) | 0 (0.0%) |
Disability Class: Vision Difficulty
| Age Bracket | Male | Female |
| Under 5 Years | 0 (0.0%) | 0 (0.0%) |
| 5 to 17 Years | 0 (0.0%) | 0 (0.0%) |
| 18 to 34 Years | 0 (0.0%) | 0 (0.0%) |
| 35 to 64 Years | 14 (3.6%) | 0 (0.0%) |
| 65 to 74 Years | 0 (0.0%) | 0 (0.0%) |
| 75 Years and over | 0 (0.0%) | 0 (0.0%) |
Disability Class: Cognitive Difficulty
| Age Bracket | Male | Female |
| 5 to 17 Years | 0 (0.0%) | 0 (0.0%) |
| 18 to 34 Years | 0 (0.0%) | 0 (0.0%) |
| 35 to 64 Years | 36 (9.3%) | 0 (0.0%) |
| 65 to 74 Years | 0 (0.0%) | 0 (0.0%) |
| 75 Years and over | 0 (0.0%) | 8 (5.3%) |
Disability Class: Ambulatory Difficulty
| Age Bracket | Male | Female |
| 5 to 17 Years | 0 (0.0%) | 0 (0.0%) |
| 18 to 34 Years | 0 (0.0%) | 0 (0.0%) |
| 35 to 64 Years | 18 (4.6%) | 0 (0.0%) |
| 65 to 74 Years | 0 (0.0%) | 10 (6.5%) |
| 75 Years and over | 10 (10.9%) | 0 (0.0%) |
Disability Class: Self-Care Difficulty
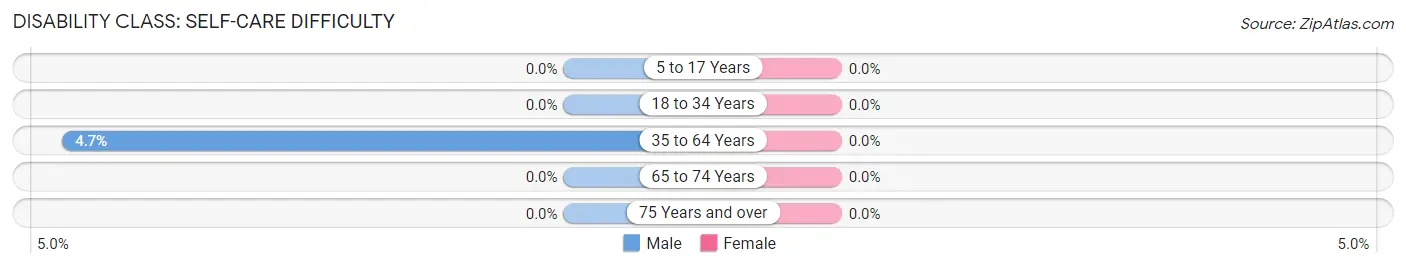
| Age Bracket | Male | Female |
| 5 to 17 Years | 0 (0.0%) | 0 (0.0%) |
| 18 to 34 Years | 0 (0.0%) | 0 (0.0%) |
| 35 to 64 Years | 18 (4.6%) | 0 (0.0%) |
| 65 to 74 Years | 0 (0.0%) | 0 (0.0%) |
| 75 Years and over | 0 (0.0%) | 0 (0.0%) |
Technology Access in Martorell
Computing Device Access in Martorell
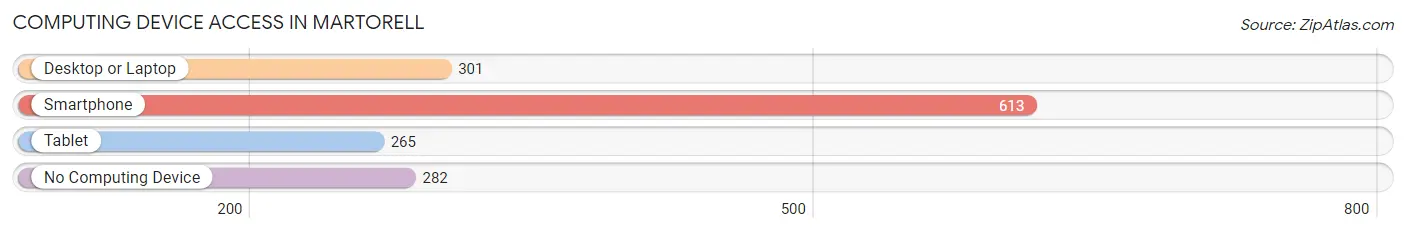
| Device Type | # Households | % Households |
| Desktop or Laptop | 301 | 33.3% |
| Smartphone | 613 | 67.8% |
| Tablet | 265 | 29.3% |
| No Computing Device | 282 | 31.2% |
| Total | 904 | 100.0% |
Internet Access in Martorell
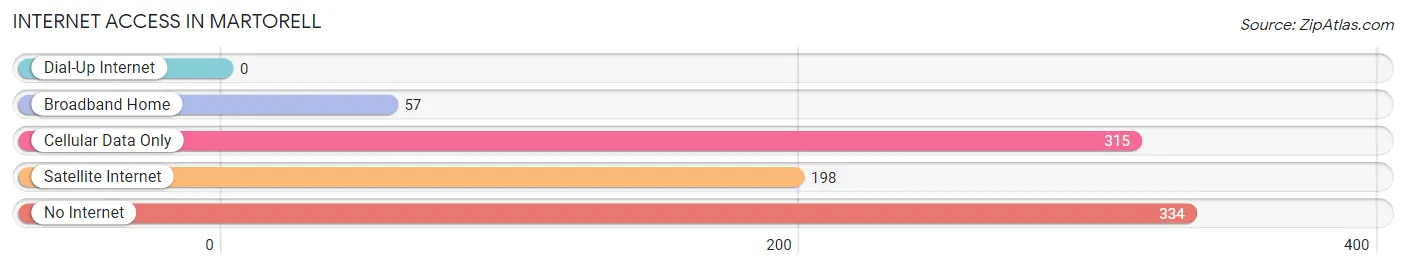
| Internet Type | # Households | % Households |
| Dial-Up Internet | 0 | 0.0% |
| Broadband Home | 57 | 6.3% |
| Cellular Data Only | 315 | 34.8% |
| Satellite Internet | 198 | 21.9% |
| No Internet | 334 | 36.9% |
| Total | 904 | 100.0% |
Martorell Summary
Martorell is a municipality located in the province of Barcelona, in the autonomous community of Catalonia, Spain. It is situated in the comarca of the Baix Llobregat, on the left bank of the Llobregat river. The municipality covers an area of 28.3 km2 and, as of 2019, had a population of 24,845 inhabitants.
History
The area of Martorell has been inhabited since prehistoric times, as evidenced by the archaeological remains found in the area. The first written reference to the town dates back to the year 945, when it was mentioned in a document of the Monastery of Sant Cugat del Vallès. During the Middle Ages, the town was part of the County of Barcelona, and in the 13th century it was granted the title of villa.
In the 15th century, the town was the site of a battle between the forces of the Crown of Aragon and the Kingdom of Castile. In the 16th century, the town was affected by the War of the Spanish Succession, and in the 19th century it was the site of a battle between the French and Spanish armies.
In the 20th century, the town experienced a period of economic growth, thanks to the development of the textile industry. In the 1950s, the town was connected to Barcelona by a railway line, which further boosted its economic development.
Geography
Martorell is located in the comarca of the Baix Llobregat, in the province of Barcelona, in the autonomous community of Catalonia, Spain. It is situated on the left bank of the Llobregat river, at an altitude of 40 meters above sea level. The municipality covers an area of 28.3 km2 and is bordered by the municipalities of Sant Andreu de la Barca, Sant Vicenç dels Horts, Sant Climent de Llobregat, Sant Joan Despí, and Sant Feliu de Llobregat.
The climate in Martorell is Mediterranean, with mild winters and hot, dry summers. The average annual temperature is 16.5 °C, and the average annual precipitation is 545 mm.
Economy
The economy of Martorell is mainly based on the service sector, which accounts for around 70% of the total GDP. The main services provided in the town are retail, hospitality, and health care. The industrial sector is also important, and it is mainly focused on the automotive industry. The main companies based in the town are SEAT, Volkswagen, and Renault.
The agricultural sector is also important, and it is mainly focused on the production of cereals, vegetables, and fruits. The main crops grown in the area are wheat, barley, oats, potatoes, tomatoes, and peppers.
Demographics
As of 2019, the population of Martorell was 24,845 inhabitants, of which 49.3% were male and 50.7% were female. The population density was 872.3 inhabitants per km2. The median age of the population was 40.3 years, and the unemployment rate was 11.2%.
The majority of the population (90.2%) was of Spanish nationality, while the remaining 9.8% was of foreign nationality. The most common foreign nationalities were Moroccan (3.2%), Romanian (2.2%), and Italian (1.7%). The majority of the population (90.2%) was Roman Catholic, while the remaining 9.8% belonged to other religions.
Common Questions
What is Per Capita Income in Martorell?
Per Capita income in Martorell is $13,994.
What is the Median Family Income in Martorell?
Median Family Income in Martorell is $27,303.
What is the Median Household income in Martorell?
Median Household Income in Martorell is $20,521.
What is Income or Wage Gap in Martorell?
Income or Wage Gap in Martorell is 16.2%.
Women in Martorell earn 83.8 cents for every dollar earned by a man.
What is Inequality or Gini Index in Martorell?
Inequality or Gini Index in Martorell is 0.49.
What is the Total Population of Martorell?
Total Population of Martorell is 2,102.
What is the Total Male Population of Martorell?
Total Male Population of Martorell is 1,044.
What is the Total Female Population of Martorell?
Total Female Population of Martorell is 1,058.
What is the Ratio of Males per 100 Females in Martorell?
There are 98.68 Males per 100 Females in Martorell.
What is the Ratio of Females per 100 Males in Martorell?
There are 101.34 Females per 100 Males in Martorell.
What is the Median Population Age in Martorell?
Median Population Age in Martorell is 56.0 Years.
What is the Average Family Size in Martorell
Average Family Size in Martorell is 3.2 People.
What is the Average Household Size in Martorell
Average Household Size in Martorell is 2.3 People.
How Large is the Labor Force in Martorell?
There are 677 People in the Labor Forcein in Martorell.
What is the Percentage of People in the Labor Force in Martorell?
35.8% of People are in the Labor Force in Martorell.
What is the Unemployment Rate in Martorell?
Unemployment Rate in Martorell is 15.2%.