John Day, OR Map & Demographics
John Day Map
John Day Overview
$31,329
PER CAPITA INCOME
$82,604
AVG FAMILY INCOME
$67,083
AVG HOUSEHOLD INCOME
0.6%
WAGE / INCOME GAP [ % ]
99.4¢/ $1
WAGE / INCOME GAP [ $ ]
0.40
INEQUALITY / GINI INDEX
1,561
TOTAL POPULATION
795
MALE POPULATION
766
FEMALE POPULATION
103.79
MALES / 100 FEMALES
96.35
FEMALES / 100 MALES
43.9
MEDIAN AGE
2.5
AVG FAMILY SIZE
2.1
AVG HOUSEHOLD SIZE
767
LABOR FORCE [ PEOPLE ]
57.9%
PERCENT IN LABOR FORCE
8.2%
UNEMPLOYMENT RATE
John Day Zip Codes
John Day Area Codes
Income in John Day
Income Overview in John Day
Per Capita Income in John Day is $31,329, while median incomes of families and households are $82,604 and $67,083 respectively.
| Characteristic | Number | Measure |
| Per Capita Income | 1,561 | $31,329 |
| Median Family Income | 402 | $82,604 |
| Mean Family Income | 402 | $89,582 |
| Median Household Income | 716 | $67,083 |
| Mean Household Income | 716 | $70,878 |
| Income Deficit | 402 | $0 |
| Wage / Income Gap (%) | 1,561 | 0.61% |
| Wage / Income Gap ($) | 1,561 | 99.39¢ per $1 |
| Gini / Inequality Index | 1,561 | 0.40 |
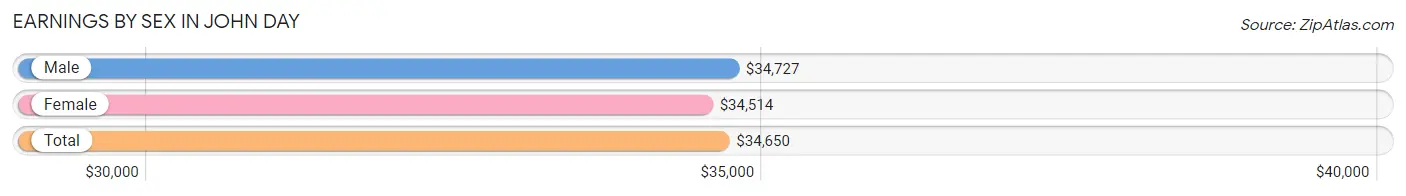
Earnings by Sex in John Day
Average Earnings in John Day are $34,650, $34,727 for men and $34,514 for women, a difference of 0.6%.
| Sex | Number | Average Earnings |
| Male | 419 (52.5%) | $34,727 |
| Female | 379 (47.5%) | $34,514 |
| Total | 798 (100.0%) | $34,650 |
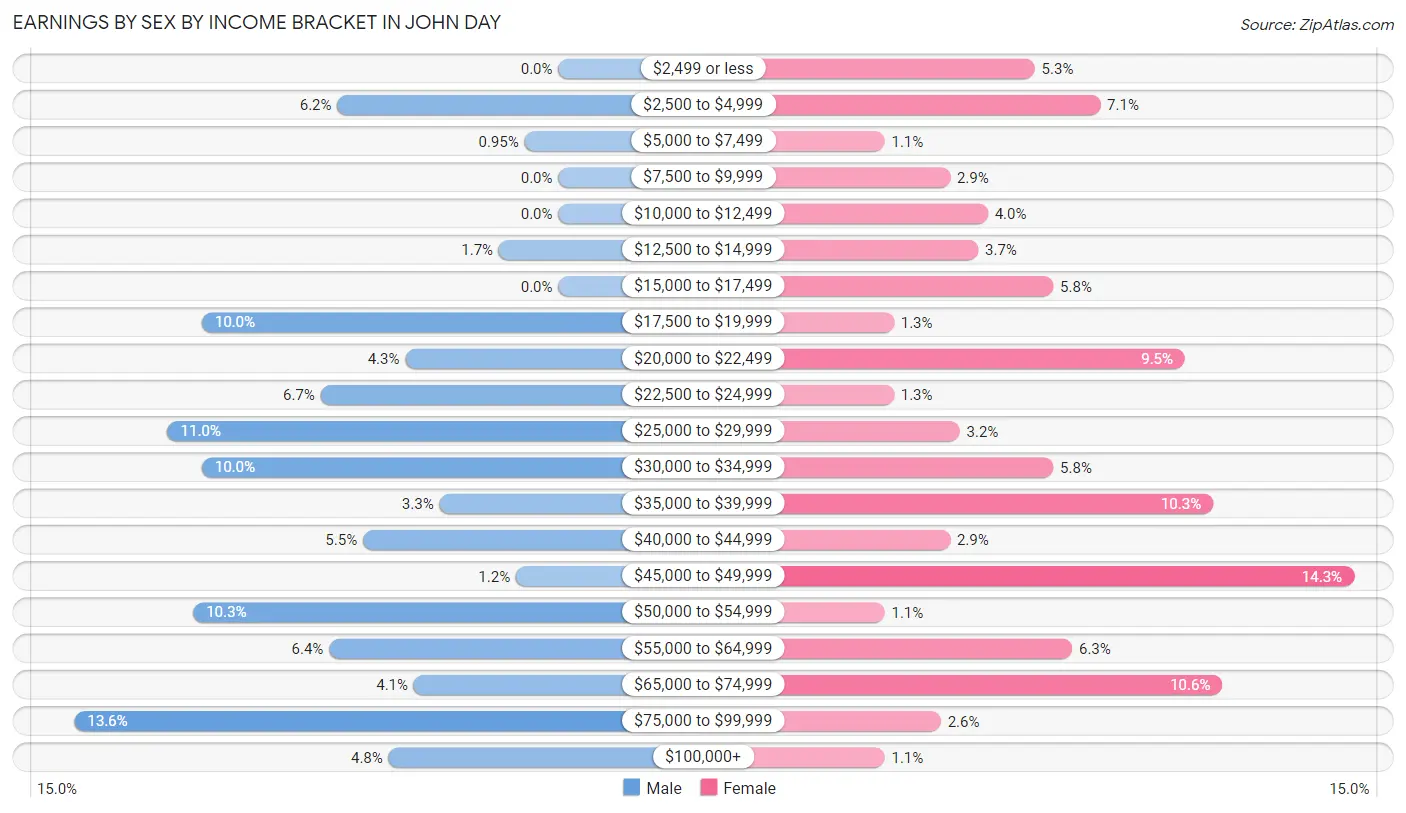
Earnings by Sex by Income Bracket in John Day
The most common earnings brackets in John Day are $75,000 to $99,999 for men (57 | 13.6%) and $45,000 to $49,999 for women (54 | 14.2%).
| Income | Male | Female |
| $2,499 or less | 0 (0.0%) | 20 (5.3%) |
| $2,500 to $4,999 | 26 (6.2%) | 27 (7.1%) |
| $5,000 to $7,499 | 4 (0.9%) | 4 (1.1%) |
| $7,500 to $9,999 | 0 (0.0%) | 11 (2.9%) |
| $10,000 to $12,499 | 0 (0.0%) | 15 (4.0%) |
| $12,500 to $14,999 | 7 (1.7%) | 14 (3.7%) |
| $15,000 to $17,499 | 0 (0.0%) | 22 (5.8%) |
| $17,500 to $19,999 | 42 (10.0%) | 5 (1.3%) |
| $20,000 to $22,499 | 18 (4.3%) | 36 (9.5%) |
| $22,500 to $24,999 | 28 (6.7%) | 5 (1.3%) |
| $25,000 to $29,999 | 46 (11.0%) | 12 (3.2%) |
| $30,000 to $34,999 | 42 (10.0%) | 22 (5.8%) |
| $35,000 to $39,999 | 14 (3.3%) | 39 (10.3%) |
| $40,000 to $44,999 | 23 (5.5%) | 11 (2.9%) |
| $45,000 to $49,999 | 5 (1.2%) | 54 (14.2%) |
| $50,000 to $54,999 | 43 (10.3%) | 4 (1.1%) |
| $55,000 to $64,999 | 27 (6.4%) | 24 (6.3%) |
| $65,000 to $74,999 | 17 (4.1%) | 40 (10.5%) |
| $75,000 to $99,999 | 57 (13.6%) | 10 (2.6%) |
| $100,000+ | 20 (4.8%) | 4 (1.1%) |
| Total | 419 (100.0%) | 379 (100.0%) |
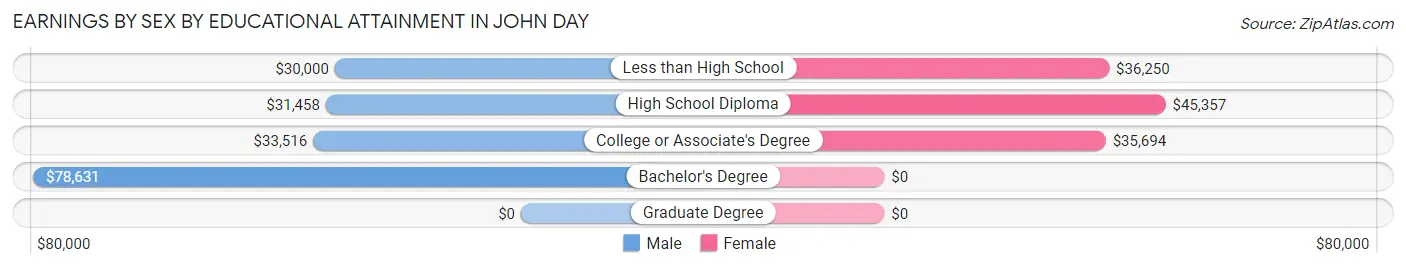
Earnings by Sex by Educational Attainment in John Day
Average earnings in John Day are $39,444 for men and $36,210 for women, a difference of 8.2%. Men with an educational attainment of bachelor's degree enjoy the highest average annual earnings of $78,631, while those with less than high school education earn the least with $30,000. Women with an educational attainment of high school diploma earn the most with the average annual earnings of $45,357, while those with college or associate's degree education have the smallest earnings of $35,694.
| Educational Attainment | Male Income | Female Income |
| Less than High School | $30,000 | $36,250 |
| High School Diploma | $31,458 | $45,357 |
| College or Associate's Degree | $33,516 | $35,694 |
| Bachelor's Degree | $78,631 | $0 |
| Graduate Degree | - | - |
| Total | $39,444 | $36,210 |
Family Income in John Day
Family Income Brackets in John Day
According to the John Day family income data, there are 97 families falling into the $75,000 to $99,999 income range, which is the most common income bracket and makes up 24.1% of all families. Conversely, the $15,000 to $24,999 income bracket is the least frequent group with only 7 families (1.7%) belonging to this category.
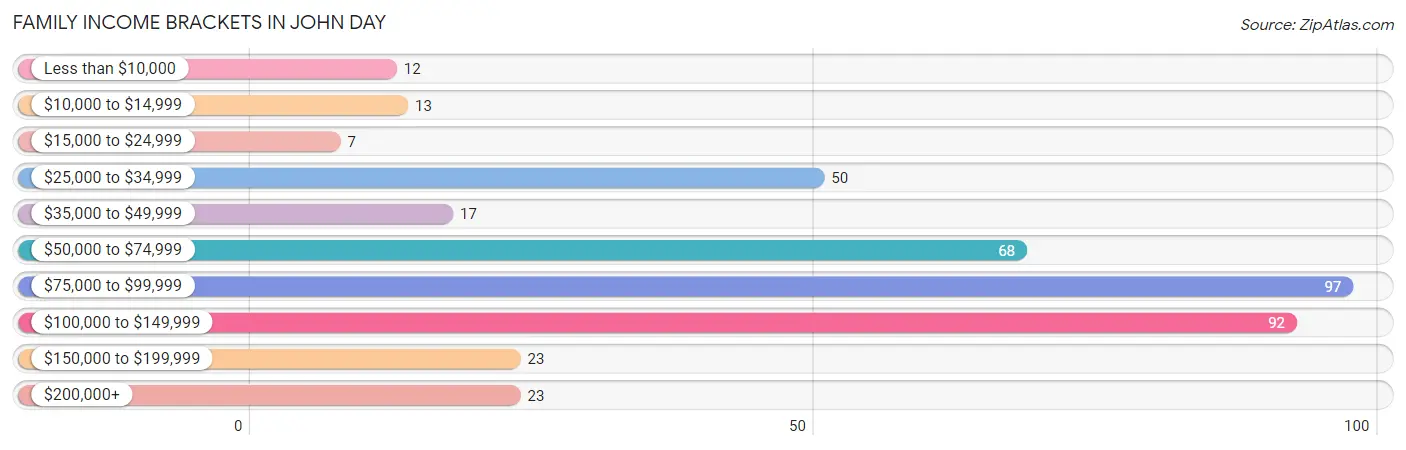
| Income Bracket | # Families | % Families |
| Less than $10,000 | 12 | 3.0% |
| $10,000 to $14,999 | 13 | 3.2% |
| $15,000 to $24,999 | 7 | 1.7% |
| $25,000 to $34,999 | 50 | 12.4% |
| $35,000 to $49,999 | 17 | 4.2% |
| $50,000 to $74,999 | 68 | 16.9% |
| $75,000 to $99,999 | 97 | 24.1% |
| $100,000 to $149,999 | 92 | 22.9% |
| $150,000 to $199,999 | 23 | 5.7% |
| $200,000+ | 23 | 5.7% |
Family Income by Famaliy Size in John Day
3-person families (102 | 25.4%) account for the highest median family income in John Day with $108,810 per family, while 3-person families (102 | 25.4%) have the highest median income of $36,270 per family member.
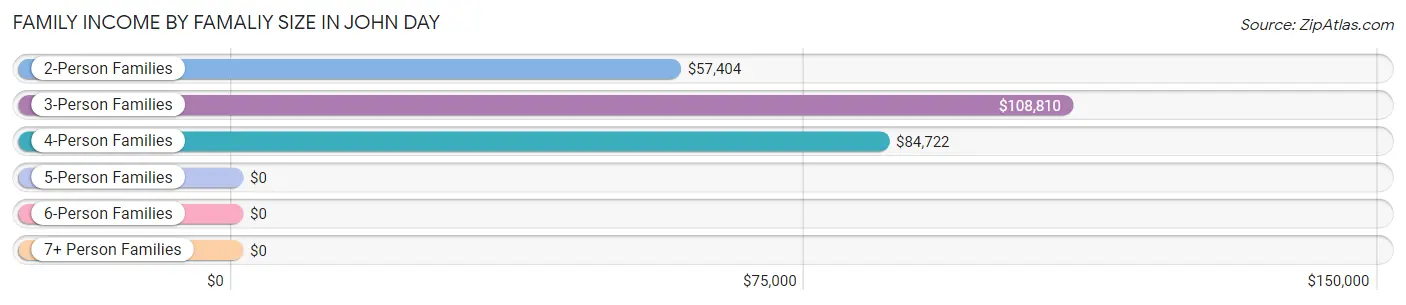
| Income Bracket | # Families | Median Income |
| 2-Person Families | 209 (52.0%) | $57,404 |
| 3-Person Families | 102 (25.4%) | $108,810 |
| 4-Person Families | 64 (15.9%) | $84,722 |
| 5-Person Families | 20 (5.0%) | $0 |
| 6-Person Families | 7 (1.7%) | $0 |
| 7+ Person Families | 0 (0.0%) | $0 |
| Total | 402 (100.0%) | $82,604 |
Family Income by Number of Earners in John Day
The median family income in John Day is $82,604, with families comprising 3+ earners (44) having the highest median family income of $115,192, while families with 1 earner (113) have the lowest median family income of $37,813, accounting for 11.0% and 28.1% of families, respectively.
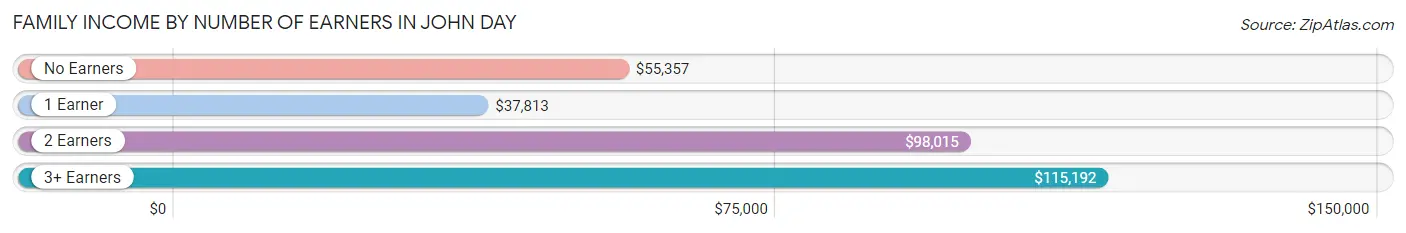
| Number of Earners | # Families | Median Income |
| No Earners | 66 (16.4%) | $55,357 |
| 1 Earner | 113 (28.1%) | $37,813 |
| 2 Earners | 179 (44.5%) | $98,015 |
| 3+ Earners | 44 (11.0%) | $115,192 |
| Total | 402 (100.0%) | $82,604 |
Household Income in John Day
Household Income Brackets in John Day
With 164 households falling in the category, the $75,000 to $99,999 income range is the most frequent in John Day, accounting for 22.9% of all households. In contrast, only 23 households (3.2%) fall into the $150,000 to $199,999 income bracket, making it the least populous group.
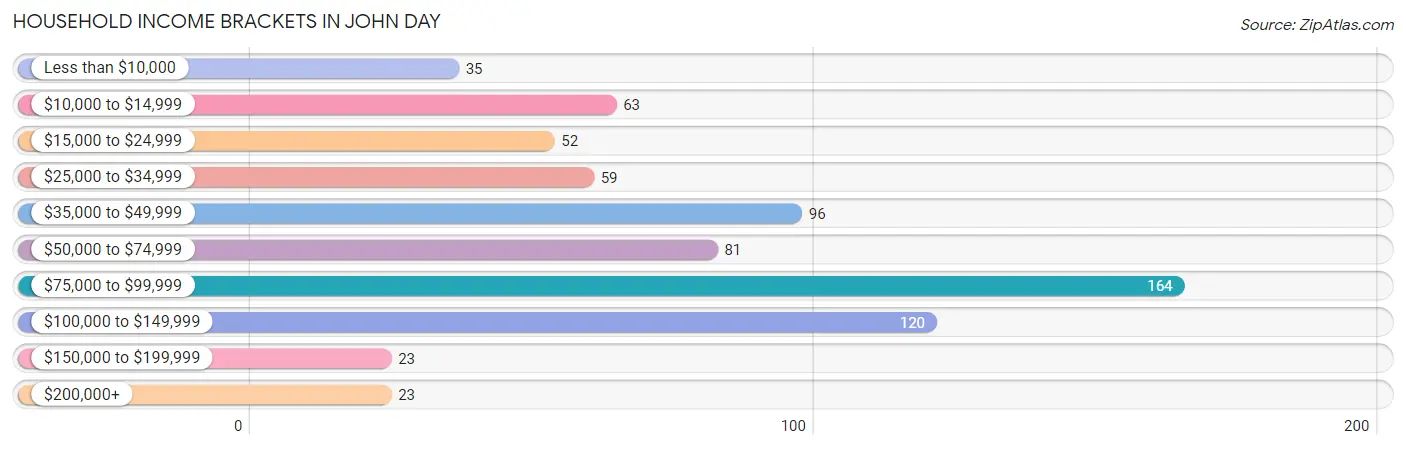
| Income Bracket | # Households | % Households |
| Less than $10,000 | 35 | 4.9% |
| $10,000 to $14,999 | 63 | 8.8% |
| $15,000 to $24,999 | 52 | 7.3% |
| $25,000 to $34,999 | 59 | 8.2% |
| $35,000 to $49,999 | 96 | 13.4% |
| $50,000 to $74,999 | 81 | 11.3% |
| $75,000 to $99,999 | 164 | 22.9% |
| $100,000 to $149,999 | 120 | 16.8% |
| $150,000 to $199,999 | 23 | 3.2% |
| $200,000+ | 23 | 3.2% |
Household Income by Householder Age in John Day
The median household income in John Day is $67,083, with the highest median household income of $97,500 found in the 25 to 44 years age bracket for the primary householder. A total of 190 households (26.5%) fall into this category. Meanwhile, the 15 to 24 years age bracket for the primary householder has the lowest median household income of $0, with 31 households (4.3%) in this group.
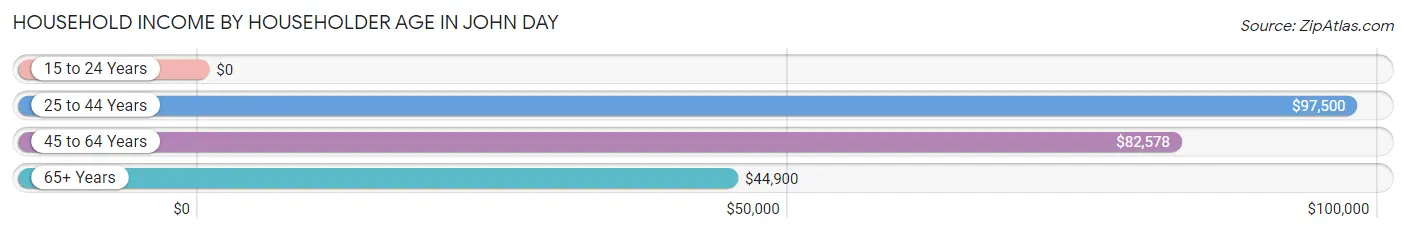
| Income Bracket | # Households | Median Income |
| 15 to 24 Years | 31 (4.3%) | $0 |
| 25 to 44 Years | 190 (26.5%) | $97,500 |
| 45 to 64 Years | 295 (41.2%) | $82,578 |
| 65+ Years | 200 (27.9%) | $44,900 |
| Total | 716 (100.0%) | $67,083 |
Poverty in John Day
Income Below Poverty by Sex and Age in John Day
With 12.0% poverty level for males and 23.6% for females among the residents of John Day, under 5 year old males and under 5 year old females are the most vulnerable to poverty, with 10 males (100.0%) and 3 females (100.0%) in their respective age groups living below the poverty level.
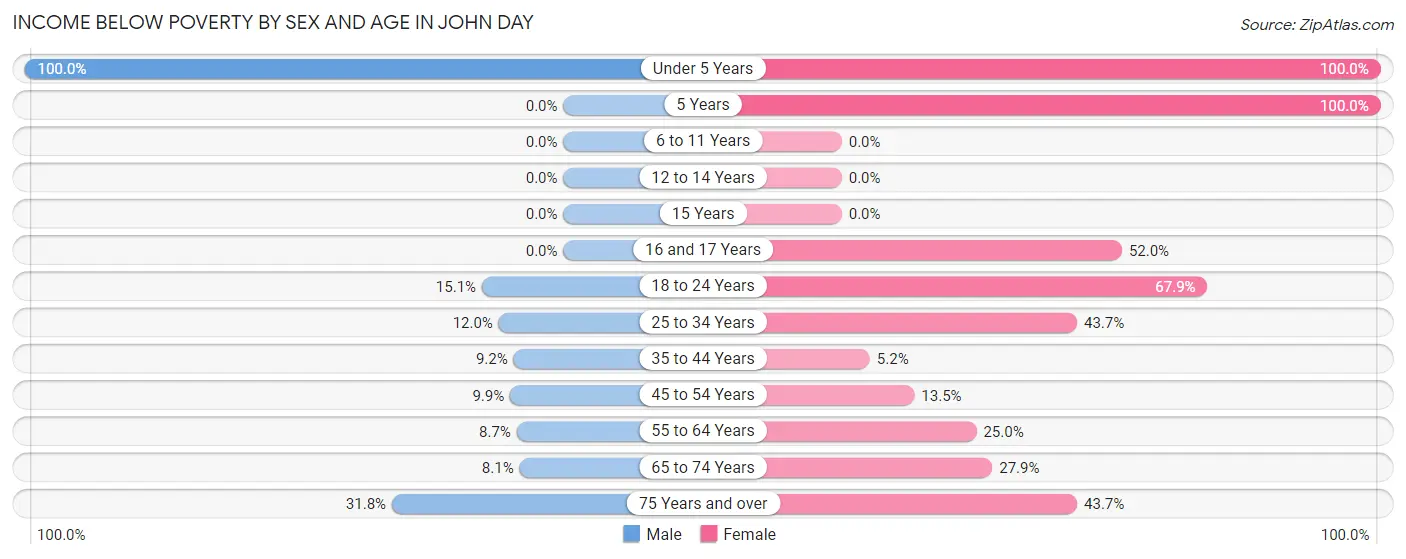
| Age Bracket | Male | Female |
| Under 5 Years | 10 (100.0%) | 3 (100.0%) |
| 5 Years | 0 (0.0%) | 3 (100.0%) |
| 6 to 11 Years | 0 (0.0%) | 0 (0.0%) |
| 12 to 14 Years | 0 (0.0%) | 0 (0.0%) |
| 15 Years | 0 (0.0%) | 0 (0.0%) |
| 16 and 17 Years | 0 (0.0%) | 13 (52.0%) |
| 18 to 24 Years | 13 (15.1%) | 19 (67.9%) |
| 25 to 34 Years | 9 (12.0%) | 31 (43.7%) |
| 35 to 44 Years | 11 (9.2%) | 7 (5.2%) |
| 45 to 54 Years | 10 (9.9%) | 12 (13.5%) |
| 55 to 64 Years | 11 (8.7%) | 28 (25.0%) |
| 65 to 74 Years | 7 (8.1%) | 19 (27.9%) |
| 75 Years and over | 21 (31.8%) | 38 (43.7%) |
| Total | 92 (12.0%) | 173 (23.6%) |
Income Above Poverty by Sex and Age in John Day
According to the poverty statistics in John Day, males aged 6 to 11 years and females aged 6 to 11 years are the age groups that are most secure financially, with 100.0% of males and 100.0% of females in these age groups living above the poverty line.
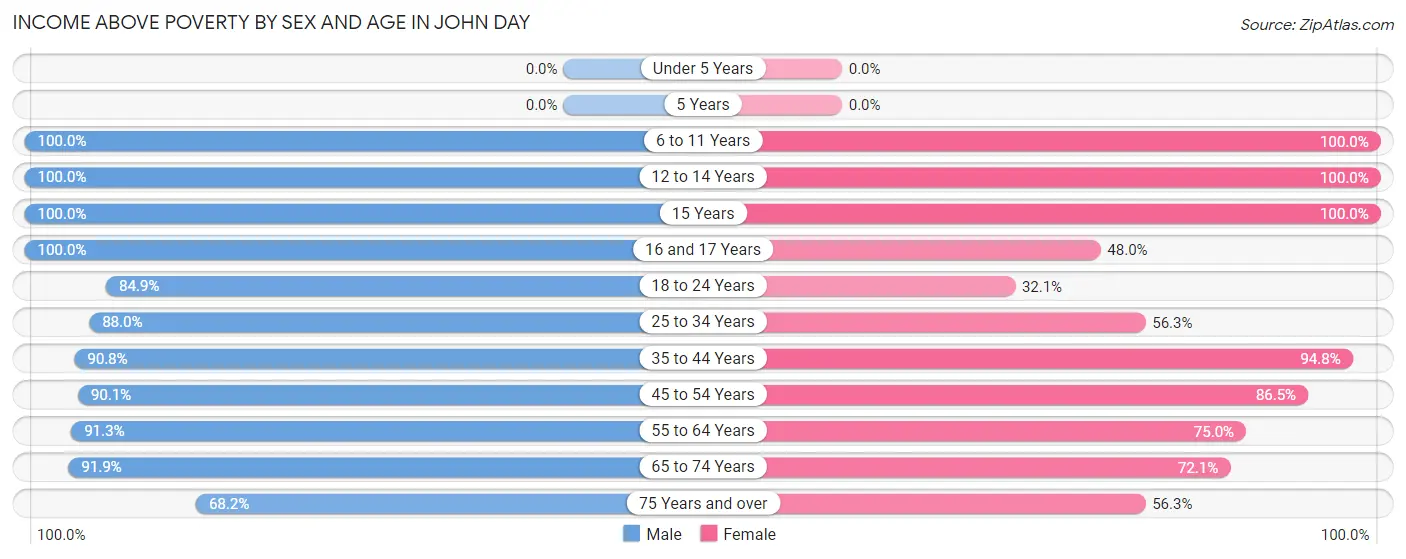
| Age Bracket | Male | Female |
| Under 5 Years | 0 (0.0%) | 0 (0.0%) |
| 5 Years | 0 (0.0%) | 0 (0.0%) |
| 6 to 11 Years | 44 (100.0%) | 53 (100.0%) |
| 12 to 14 Years | 21 (100.0%) | 41 (100.0%) |
| 15 Years | 5 (100.0%) | 20 (100.0%) |
| 16 and 17 Years | 28 (100.0%) | 12 (48.0%) |
| 18 to 24 Years | 73 (84.9%) | 9 (32.1%) |
| 25 to 34 Years | 66 (88.0%) | 40 (56.3%) |
| 35 to 44 Years | 108 (90.8%) | 127 (94.8%) |
| 45 to 54 Years | 91 (90.1%) | 77 (86.5%) |
| 55 to 64 Years | 116 (91.3%) | 84 (75.0%) |
| 65 to 74 Years | 79 (91.9%) | 49 (72.1%) |
| 75 Years and over | 45 (68.2%) | 49 (56.3%) |
| Total | 676 (88.0%) | 561 (76.4%) |
Income Below Poverty Among Married-Couple Families in John Day
The poverty statistics for married-couple families in John Day show that 4.6% or 13 of the total 285 families live below the poverty line. Families with 1 or 2 children have the highest poverty rate of 9.2%, comprising of 7 families. On the other hand, families with 3 or 4 children have the lowest poverty rate of 0.0%, which includes 0 families.
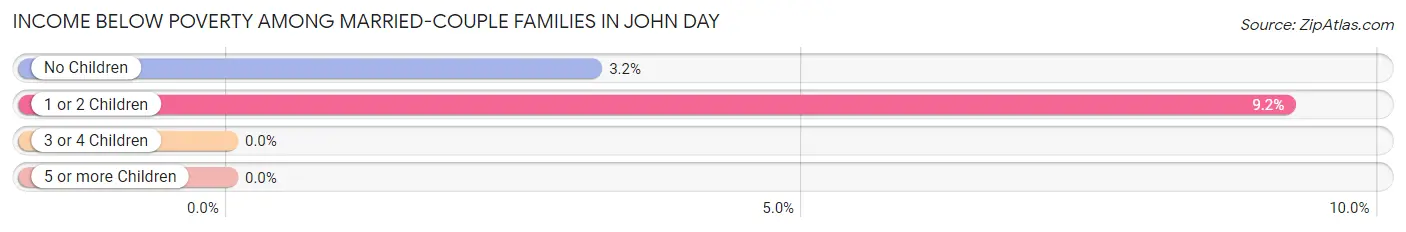
| Children | Above Poverty | Below Poverty |
| No Children | 183 (96.8%) | 6 (3.2%) |
| 1 or 2 Children | 69 (90.8%) | 7 (9.2%) |
| 3 or 4 Children | 20 (100.0%) | 0 (0.0%) |
| 5 or more Children | 0 (0.0%) | 0 (0.0%) |
| Total | 272 (95.4%) | 13 (4.6%) |
Income Below Poverty Among Single-Parent Households in John Day
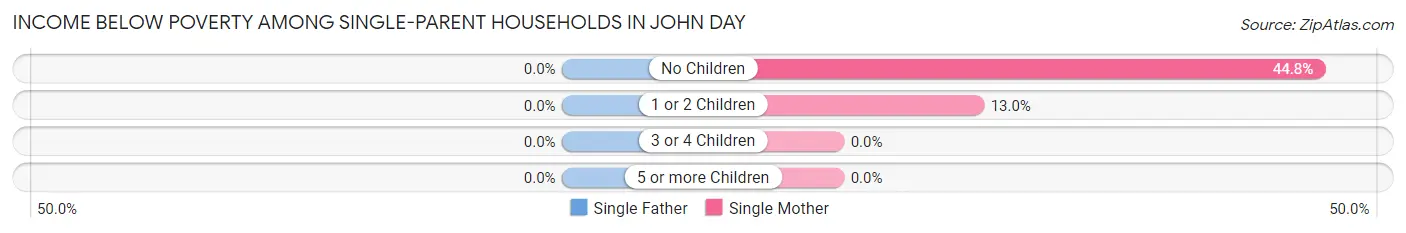
| Children | Single Father | Single Mother |
| No Children | 0 (0.0%) | 13 (44.8%) |
| 1 or 2 Children | 0 (0.0%) | 6 (13.0%) |
| 3 or 4 Children | 0 (0.0%) | 0 (0.0%) |
| 5 or more Children | 0 (0.0%) | 0 (0.0%) |
| Total | 0 (0.0%) | 19 (25.3%) |
Income Below Poverty Among Married-Couple vs Single-Parent Households in John Day
The poverty data for John Day shows that 13 of the married-couple family households (4.6%) and 19 of the single-parent households (16.2%) are living below the poverty level. Within the married-couple family households, those with 1 or 2 children have the highest poverty rate, with 7 households (9.2%) falling below the poverty line. Among the single-parent households, those with no children have the highest poverty rate, with 13 household (18.3%) living below poverty.
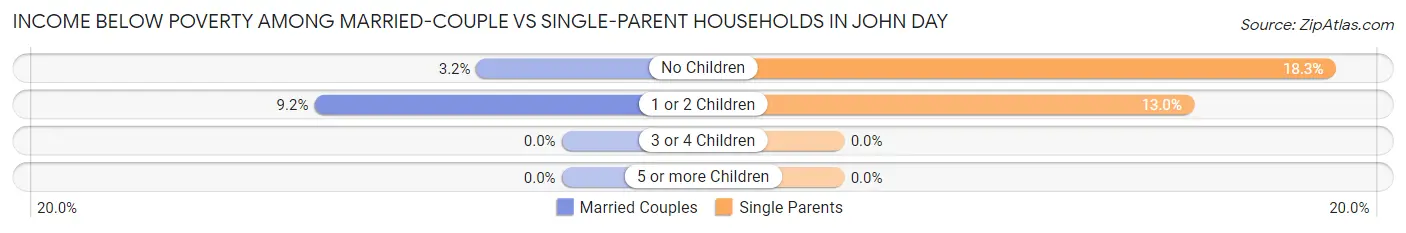
| Children | Married-Couple Families | Single-Parent Households |
| No Children | 6 (3.2%) | 13 (18.3%) |
| 1 or 2 Children | 7 (9.2%) | 6 (13.0%) |
| 3 or 4 Children | 0 (0.0%) | 0 (0.0%) |
| 5 or more Children | 0 (0.0%) | 0 (0.0%) |
| Total | 13 (4.6%) | 19 (16.2%) |
Race in John Day
The most populous races in John Day are White / Caucasian (1,357 | 86.9%), Two or more Races (130 | 8.3%), and Asian (49 | 3.1%).
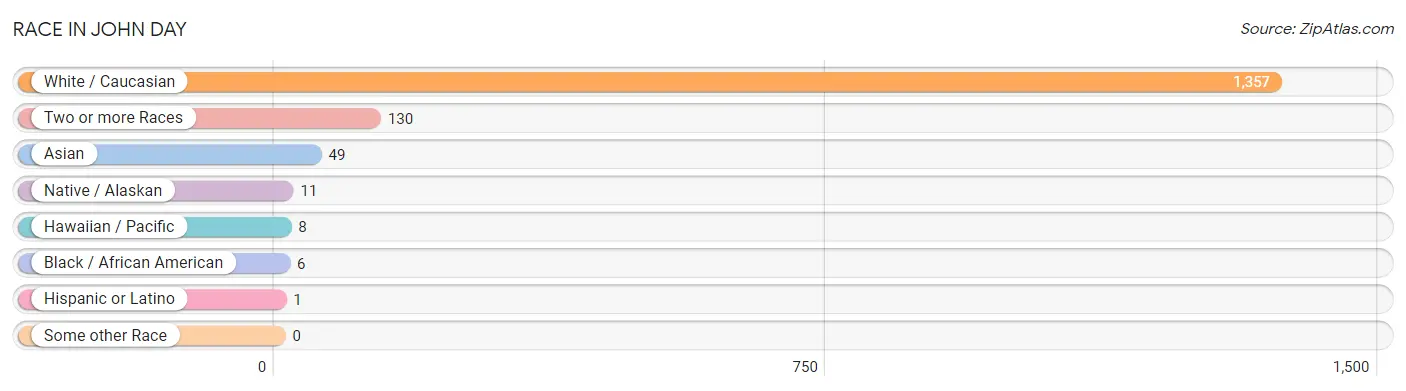
| Race | # Population | % Population |
| Asian | 49 | 3.1% |
| Black / African American | 6 | 0.4% |
| Hawaiian / Pacific | 8 | 0.5% |
| Hispanic or Latino | 1 | 0.1% |
| Native / Alaskan | 11 | 0.7% |
| White / Caucasian | 1,357 | 86.9% |
| Two or more Races | 130 | 8.3% |
| Some other Race | 0 | 0.0% |
| Total | 1,561 | 100.0% |
Ancestry in John Day
The most populous ancestries reported in John Day are American (227 | 14.5%), English (198 | 12.7%), German (198 | 12.7%), Scottish (106 | 6.8%), and French Canadian (102 | 6.5%), together accounting for 53.2% of all John Day residents.
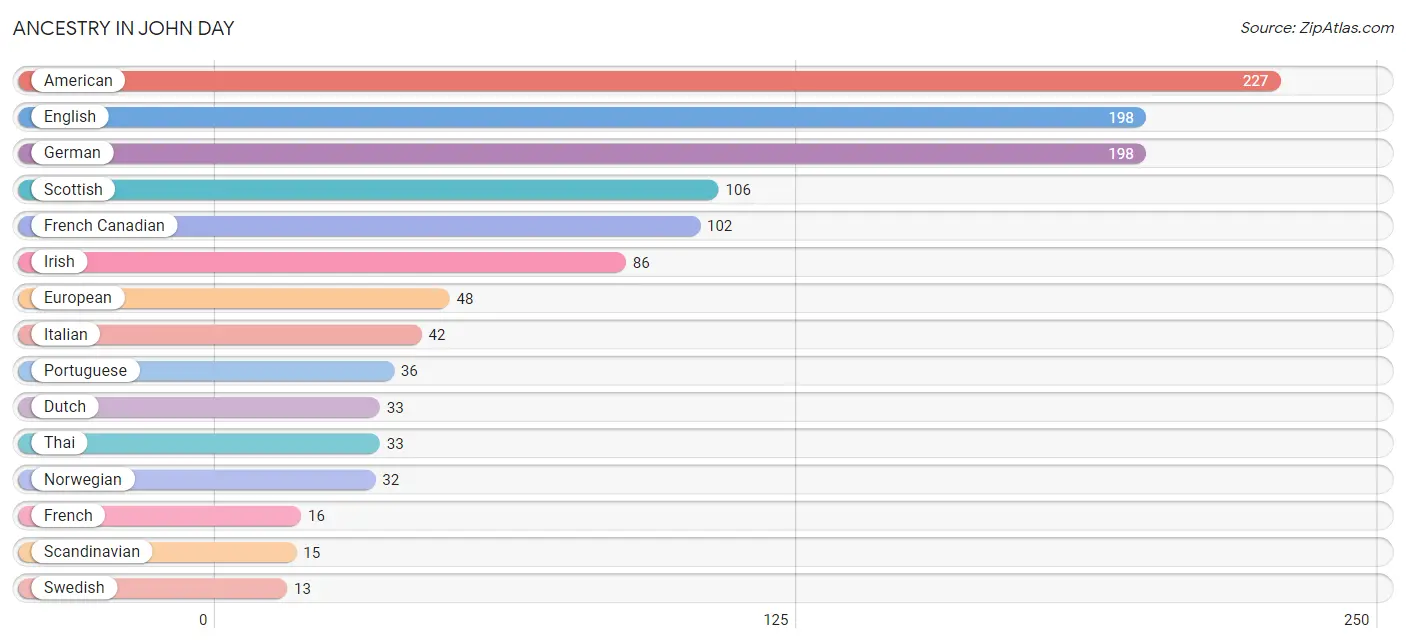
| Ancestry | # Population | % Population |
| American | 227 | 14.5% |
| Armenian | 9 | 0.6% |
| Bhutanese | 3 | 0.2% |
| British | 11 | 0.7% |
| Cherokee | 2 | 0.1% |
| Dutch | 33 | 2.1% |
| Eastern European | 3 | 0.2% |
| English | 198 | 12.7% |
| European | 48 | 3.1% |
| French | 16 | 1.0% |
| French Canadian | 102 | 6.5% |
| German | 198 | 12.7% |
| Greek | 3 | 0.2% |
| Irish | 86 | 5.5% |
| Italian | 42 | 2.7% |
| Lumbee | 3 | 0.2% |
| Mexican | 1 | 0.1% |
| Norwegian | 32 | 2.1% |
| Polish | 12 | 0.8% |
| Portuguese | 36 | 2.3% |
| Russian | 6 | 0.4% |
| Scandinavian | 15 | 1.0% |
| Scotch-Irish | 5 | 0.3% |
| Scottish | 106 | 6.8% |
| Swedish | 13 | 0.8% |
| Thai | 33 | 2.1% |
| Tohono O'Odham | 6 | 0.4% |
| Welsh | 4 | 0.3% |
| Yaqui | 4 | 0.3% | View All 29 Rows |
Immigrants in John Day
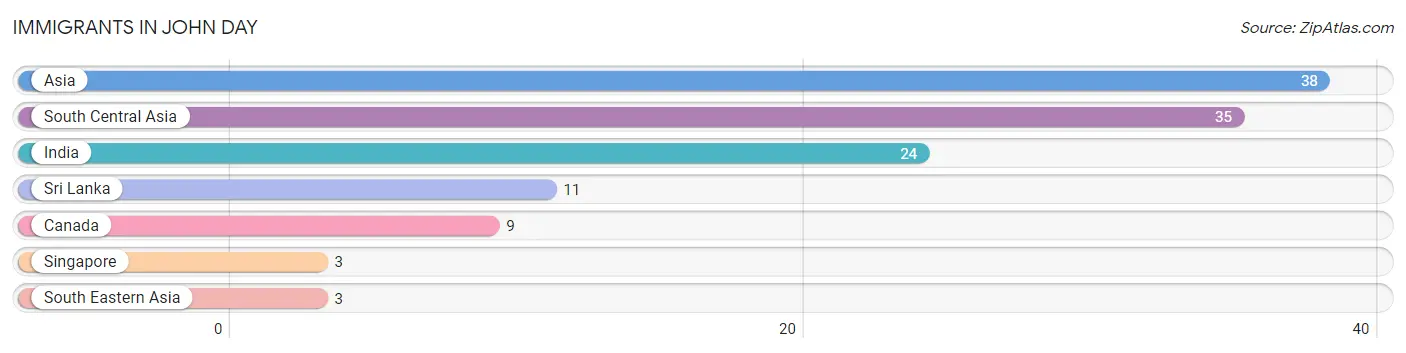
The most numerous immigrant groups reported in John Day came from Asia (38 | 2.4%), South Central Asia (35 | 2.2%), India (24 | 1.5%), Sri Lanka (11 | 0.7%), and Canada (9 | 0.6%), together accounting for 7.5% of all John Day residents.
| Immigration Origin | # Population | % Population |
| Asia | 38 | 2.4% |
| Canada | 9 | 0.6% |
| India | 24 | 1.5% |
| Singapore | 3 | 0.2% |
| South Central Asia | 35 | 2.2% |
| South Eastern Asia | 3 | 0.2% |
| Sri Lanka | 11 | 0.7% | View All 7 Rows |
Sex and Age in John Day
Sex and Age in John Day
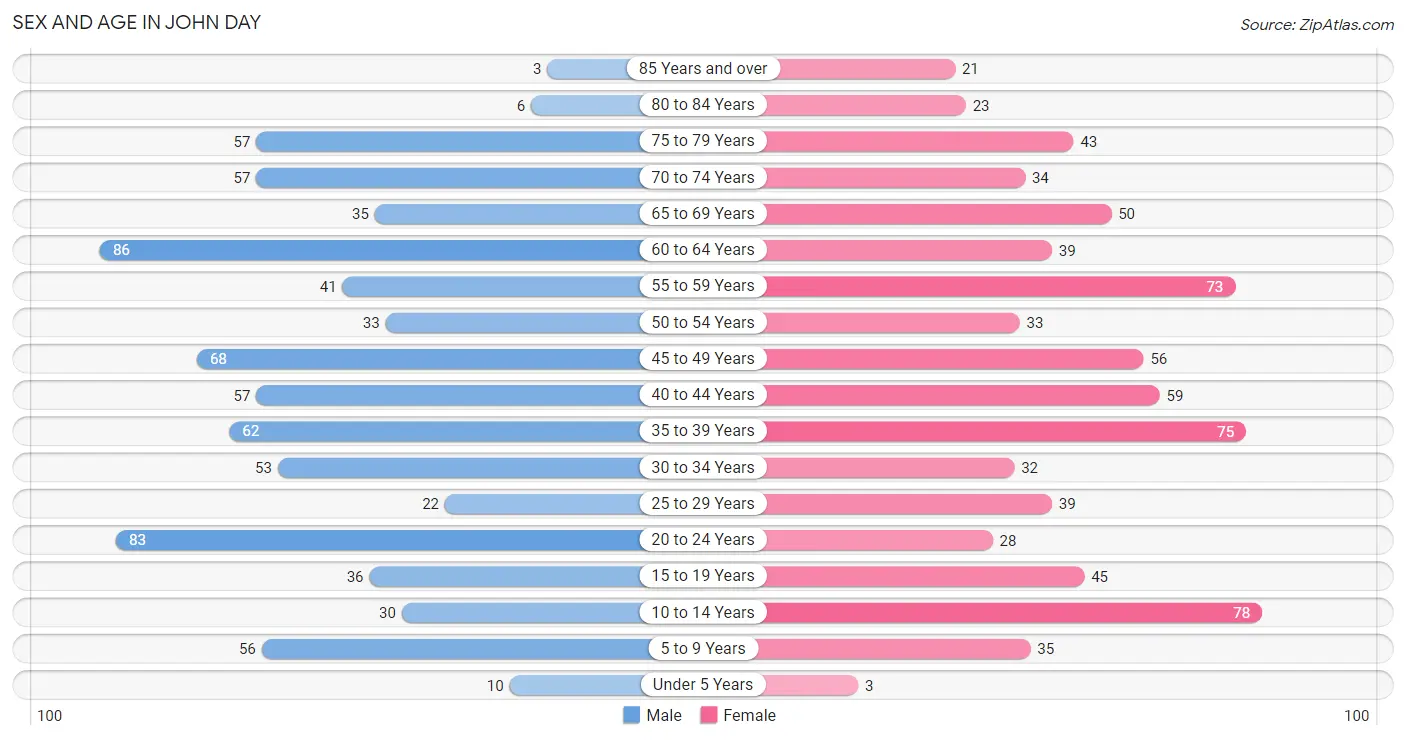
The most populous age groups in John Day are 60 to 64 Years (86 | 10.8%) for men and 10 to 14 Years (78 | 10.2%) for women.
| Age Bracket | Male | Female |
| Under 5 Years | 10 (1.3%) | 3 (0.4%) |
| 5 to 9 Years | 56 (7.0%) | 35 (4.6%) |
| 10 to 14 Years | 30 (3.8%) | 78 (10.2%) |
| 15 to 19 Years | 36 (4.5%) | 45 (5.9%) |
| 20 to 24 Years | 83 (10.4%) | 28 (3.7%) |
| 25 to 29 Years | 22 (2.8%) | 39 (5.1%) |
| 30 to 34 Years | 53 (6.7%) | 32 (4.2%) |
| 35 to 39 Years | 62 (7.8%) | 75 (9.8%) |
| 40 to 44 Years | 57 (7.2%) | 59 (7.7%) |
| 45 to 49 Years | 68 (8.6%) | 56 (7.3%) |
| 50 to 54 Years | 33 (4.2%) | 33 (4.3%) |
| 55 to 59 Years | 41 (5.2%) | 73 (9.5%) |
| 60 to 64 Years | 86 (10.8%) | 39 (5.1%) |
| 65 to 69 Years | 35 (4.4%) | 50 (6.5%) |
| 70 to 74 Years | 57 (7.2%) | 34 (4.4%) |
| 75 to 79 Years | 57 (7.2%) | 43 (5.6%) |
| 80 to 84 Years | 6 (0.7%) | 23 (3.0%) |
| 85 Years and over | 3 (0.4%) | 21 (2.7%) |
| Total | 795 (100.0%) | 766 (100.0%) |
Families and Households in John Day
Median Family Size in John Day
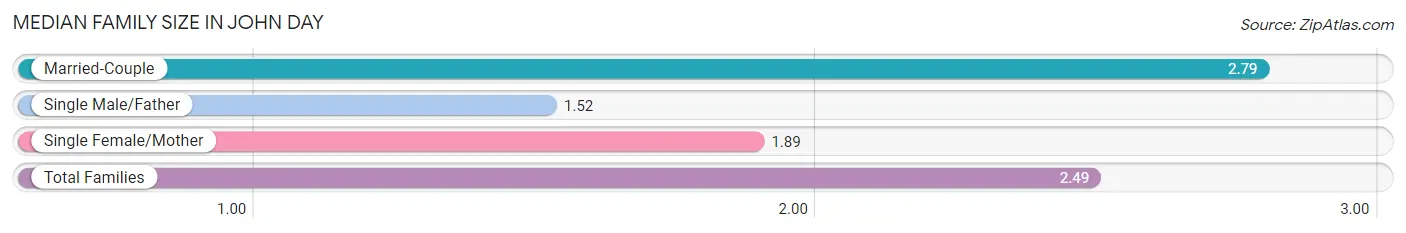
The median family size in John Day is 2.49 persons per family, with married-couple families (285 | 70.9%) accounting for the largest median family size of 2.79 persons per family. On the other hand, single male/father families (42 | 10.4%) represent the smallest median family size with 1.52 persons per family.
| Family Type | # Families | Family Size |
| Married-Couple | 285 (70.9%) | 2.79 |
| Single Male/Father | 42 (10.4%) | 1.52 |
| Single Female/Mother | 75 (18.7%) | 1.89 |
| Total Families | 402 (100.0%) | 2.49 |
Median Household Size in John Day
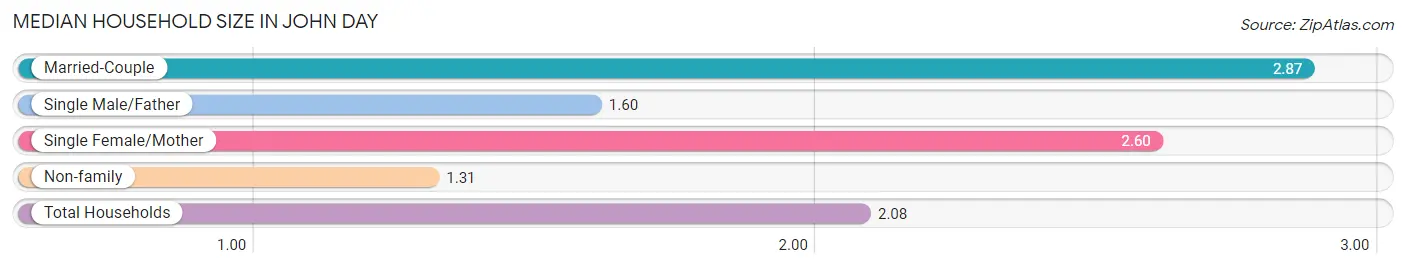
The median household size in John Day is 2.08 persons per household, with married-couple households (285 | 39.8%) accounting for the largest median household size of 2.87 persons per household. non-family households (314 | 43.9%) represent the smallest median household size with 1.31 persons per household.
| Household Type | # Households | Household Size |
| Married-Couple | 285 (39.8%) | 2.87 |
| Single Male/Father | 42 (5.9%) | 1.60 |
| Single Female/Mother | 75 (10.5%) | 2.60 |
| Non-family | 314 (43.9%) | 1.31 |
| Total Households | 716 (100.0%) | 2.08 |
Household Size by Marriage Status in John Day
Out of a total of 716 households in John Day, 402 (56.1%) are family households, while 314 (43.9%) are nonfamily households. The most numerous type of family households are 2-person households, comprising 160, and the most common type of nonfamily households are 1-person households, comprising 247.
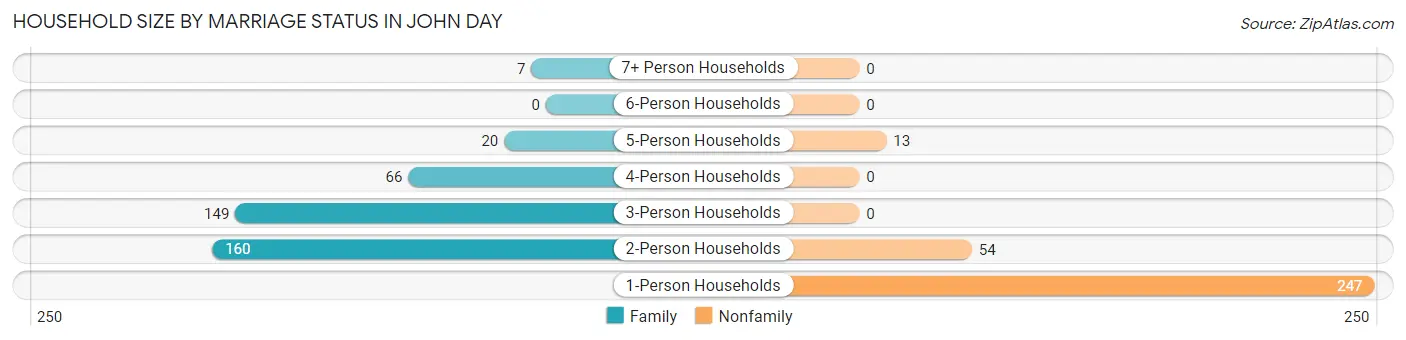
| Household Size | Family Households | Nonfamily Households |
| 1-Person Households | - | 247 (34.5%) |
| 2-Person Households | 160 (22.4%) | 54 (7.5%) |
| 3-Person Households | 149 (20.8%) | 0 (0.0%) |
| 4-Person Households | 66 (9.2%) | 0 (0.0%) |
| 5-Person Households | 20 (2.8%) | 13 (1.8%) |
| 6-Person Households | 0 (0.0%) | 0 (0.0%) |
| 7+ Person Households | 7 (1.0%) | 0 (0.0%) |
| Total | 402 (56.1%) | 314 (43.9%) |
Female Fertility in John Day
Fertility by Age in John Day
Average fertility rate in John Day is 12.0 births per 1,000 women. Women in the age bracket of 20 to 34 years have the highest fertility rate with 40.0 births per 1,000 women. Women in the age bracket of 20 to 34 years acount for 100.0% of all women with births.
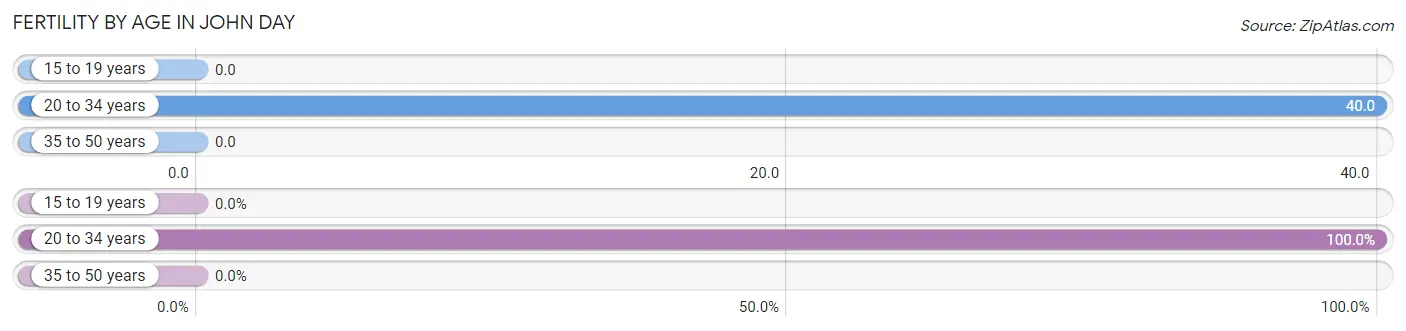
| Age Bracket | Women with Births | Births / 1,000 Women |
| 15 to 19 years | 0 (0.0%) | 0.0 |
| 20 to 34 years | 4 (100.0%) | 40.0 |
| 35 to 50 years | 0 (0.0%) | 0.0 |
| Total | 4 (100.0%) | 12.0 |
Fertility by Age by Marriage Status in John Day
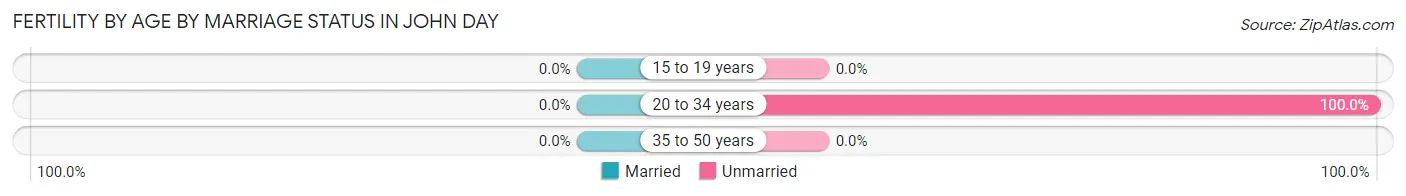
| Age Bracket | Married | Unmarried |
| 15 to 19 years | 0 (0.0%) | 0 (0.0%) |
| 20 to 34 years | 0 (0.0%) | 4 (100.0%) |
| 35 to 50 years | 0 (0.0%) | 0 (0.0%) |
| Total | 0 (0.0%) | 4 (100.0%) |
Fertility by Education in John Day
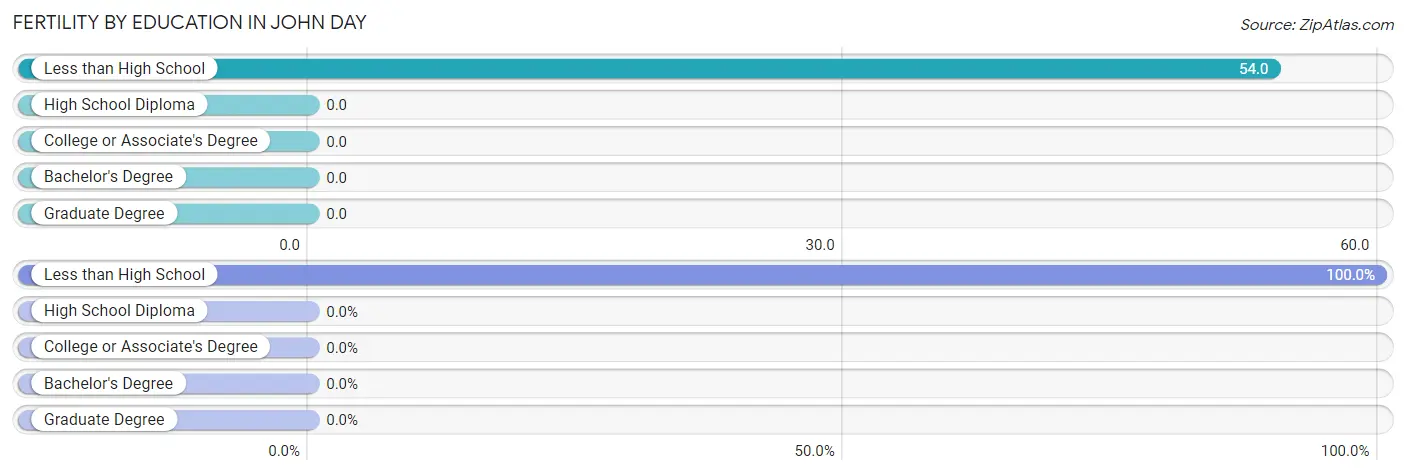
| Educational Attainment | Women with Births | Births / 1,000 Women |
| Less than High School | 4 (100.0%) | 54.0 |
| High School Diploma | 0 (0.0%) | 0.0 |
| College or Associate's Degree | 0 (0.0%) | 0.0 |
| Bachelor's Degree | 0 (0.0%) | 0.0 |
| Graduate Degree | 0 (0.0%) | 0.0 |
| Total | 4 (100.0%) | 12.0 |
Fertility by Education by Marriage Status in John Day
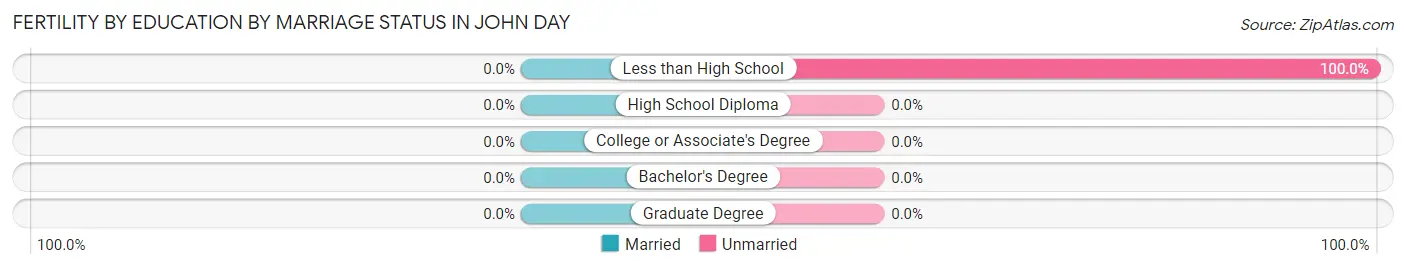
| Educational Attainment | Married | Unmarried |
| Less than High School | 0 (0.0%) | 4 (100.0%) |
| High School Diploma | 0 (0.0%) | 0 (0.0%) |
| College or Associate's Degree | 0 (0.0%) | 0 (0.0%) |
| Bachelor's Degree | 0 (0.0%) | 0 (0.0%) |
| Graduate Degree | 0 (0.0%) | 0 (0.0%) |
| Total | 0 (0.0%) | 4 (100.0%) |
Employment Characteristics in John Day
Employment by Class of Employer in John Day
Among the 690 employed individuals in John Day, private company employees (357 | 51.7%), state government employees (100 | 14.5%), and not-for-profit organizations (70 | 10.1%) make up the most common classes of employment.
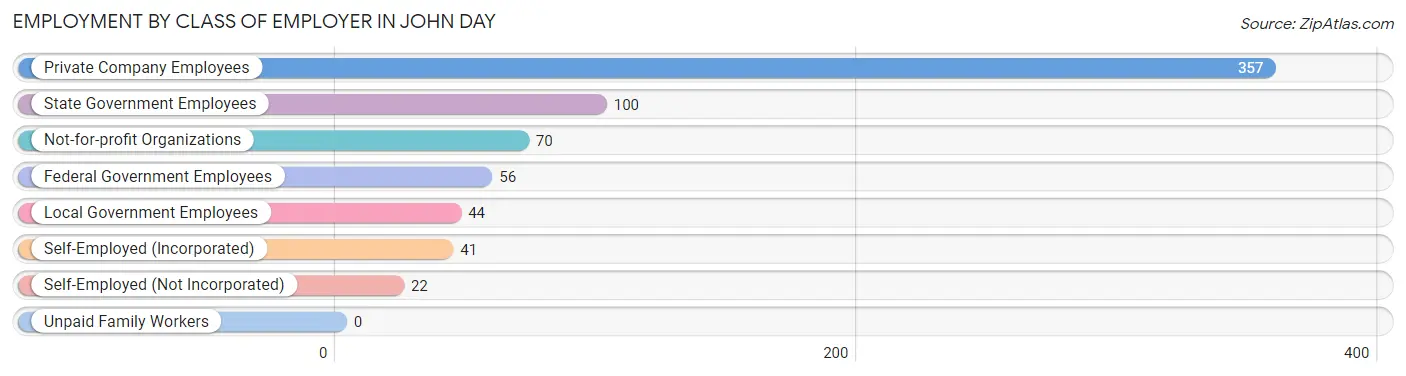
| Employer Class | # Employees | % Employees |
| Private Company Employees | 357 | 51.7% |
| Self-Employed (Incorporated) | 41 | 5.9% |
| Self-Employed (Not Incorporated) | 22 | 3.2% |
| Not-for-profit Organizations | 70 | 10.1% |
| Local Government Employees | 44 | 6.4% |
| State Government Employees | 100 | 14.5% |
| Federal Government Employees | 56 | 8.1% |
| Unpaid Family Workers | 0 | 0.0% |
| Total | 690 | 100.0% |
Employment Status by Age in John Day
According to the labor force statistics for John Day, out of the total population over 16 years of age (1,324), 57.9% or 767 individuals are in the labor force, with 8.2% or 63 of them unemployed. The age group with the highest labor force participation rate is 35 to 44 years, with 94.9% or 240 individuals in the labor force. Within the labor force, the 20 to 24 years age range has the highest percentage of unemployed individuals, with 42.9% or 30 of them being unemployed.
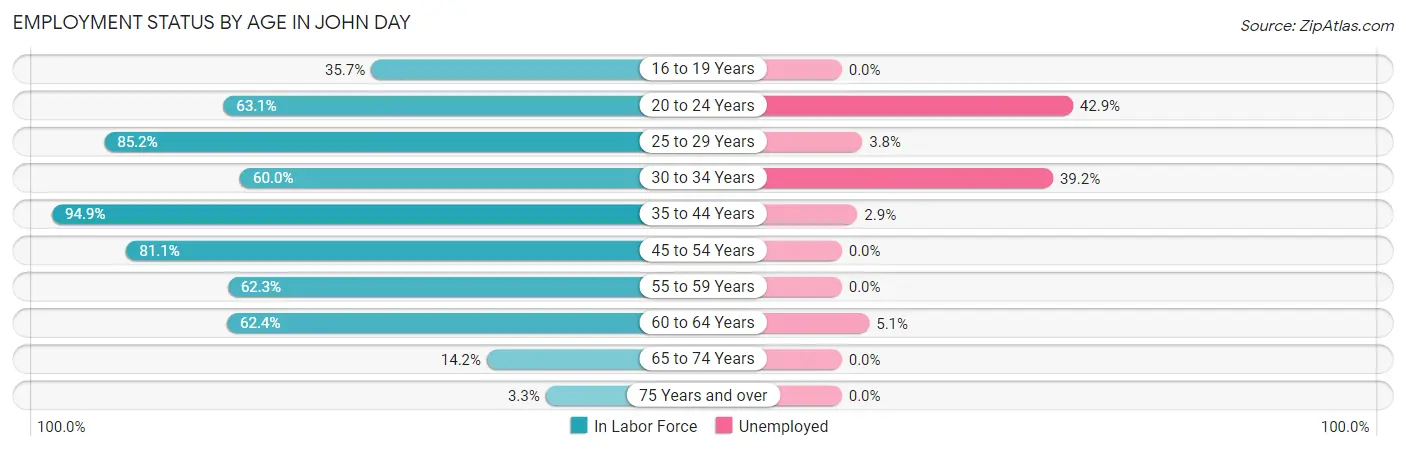
| Age Bracket | In Labor Force | Unemployed |
| 16 to 19 Years | 20 (35.7%) | 0 (0.0%) |
| 20 to 24 Years | 70 (63.1%) | 30 (42.9%) |
| 25 to 29 Years | 52 (85.2%) | 2 (3.8%) |
| 30 to 34 Years | 51 (60.0%) | 20 (39.2%) |
| 35 to 44 Years | 240 (94.9%) | 7 (2.9%) |
| 45 to 54 Years | 154 (81.1%) | 0 (0.0%) |
| 55 to 59 Years | 71 (62.3%) | 0 (0.0%) |
| 60 to 64 Years | 78 (62.4%) | 4 (5.1%) |
| 65 to 74 Years | 25 (14.2%) | 0 (0.0%) |
| 75 Years and over | 5 (3.3%) | 0 (0.0%) |
| Total | 767 (57.9%) | 63 (8.2%) |
Employment Status by Educational Attainment in John Day
According to labor force statistics for John Day, 78.0% of individuals (646) out of the total population between 25 and 64 years of age (828) are in the labor force, with 5.1% or 33 of them being unemployed. The group with the highest labor force participation rate are those with the educational attainment of bachelor's degree or higher, with 85.6% or 137 individuals in the labor force. Within the labor force, individuals with less than high school education have the highest percentage of unemployment, with 17.6% or 6 of them being unemployed.
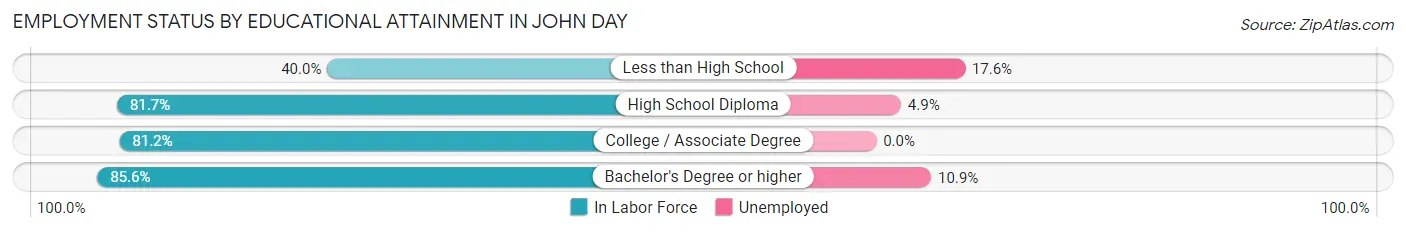
| Educational Attainment | In Labor Force | Unemployed |
| Less than High School | 34 (40.0%) | 15 (17.6%) |
| High School Diploma | 246 (81.7%) | 15 (4.9%) |
| College / Associate Degree | 229 (81.2%) | 0 (0.0%) |
| Bachelor's Degree or higher | 137 (85.6%) | 17 (10.9%) |
| Total | 646 (78.0%) | 42 (5.1%) |
Employment Occupations by Sex in John Day
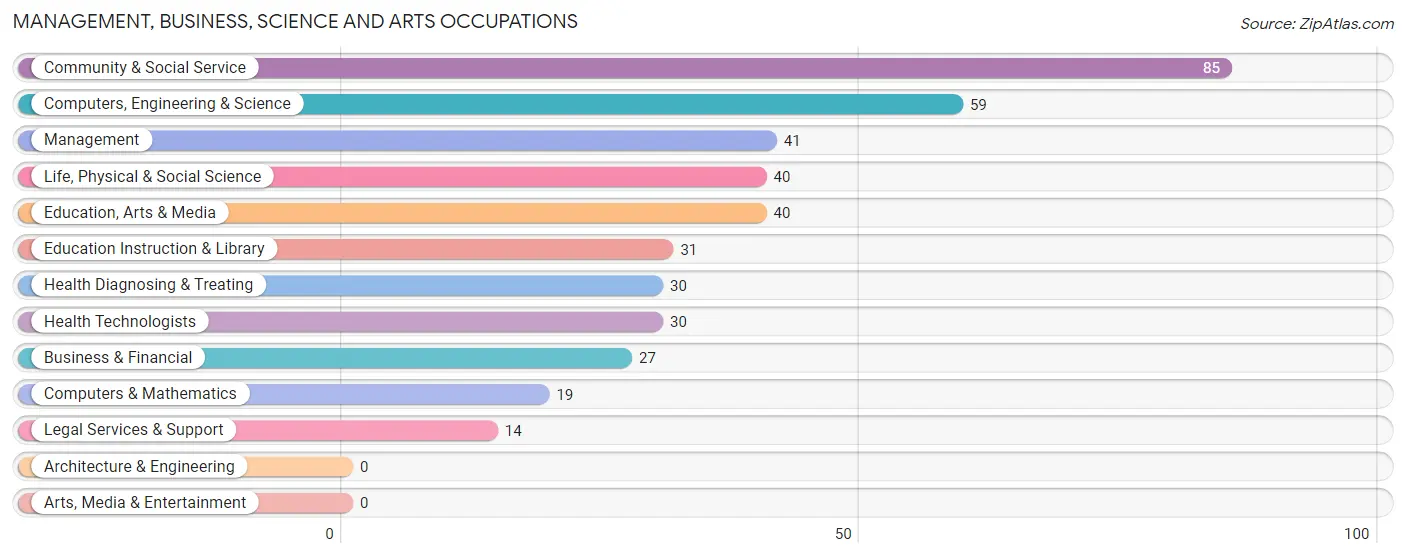
Management, Business, Science and Arts Occupations
The most common Management, Business, Science and Arts occupations in John Day are Community & Social Service (85 | 12.1%), Computers, Engineering & Science (59 | 8.4%), Management (41 | 5.8%), Life, Physical & Social Science (40 | 5.7%), and Education, Arts & Media (40 | 5.7%).
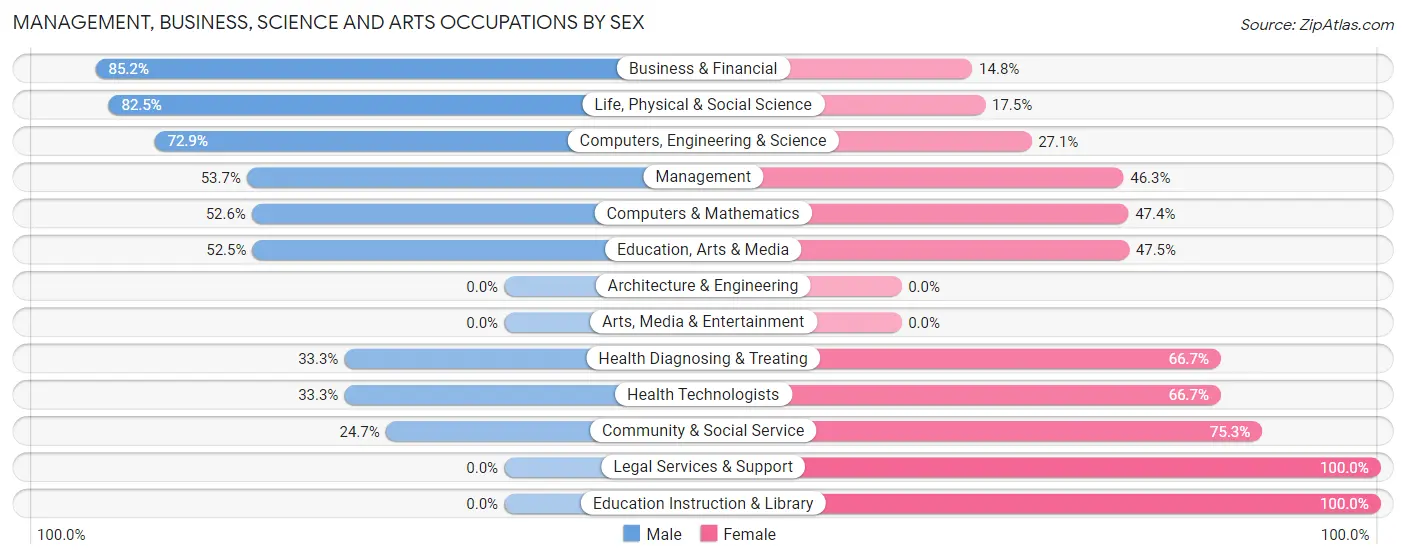
Management, Business, Science and Arts Occupations by Sex
Within the Management, Business, Science and Arts occupations in John Day, the most male-oriented occupations are Business & Financial (85.2%), Life, Physical & Social Science (82.5%), and Computers, Engineering & Science (72.9%), while the most female-oriented occupations are Legal Services & Support (100.0%), Education Instruction & Library (100.0%), and Community & Social Service (75.3%).
| Occupation | Male | Female |
| Management | 22 (53.7%) | 19 (46.3%) |
| Business & Financial | 23 (85.2%) | 4 (14.8%) |
| Computers, Engineering & Science | 43 (72.9%) | 16 (27.1%) |
| Computers & Mathematics | 10 (52.6%) | 9 (47.4%) |
| Architecture & Engineering | 0 (0.0%) | 0 (0.0%) |
| Life, Physical & Social Science | 33 (82.5%) | 7 (17.5%) |
| Community & Social Service | 21 (24.7%) | 64 (75.3%) |
| Education, Arts & Media | 21 (52.5%) | 19 (47.5%) |
| Legal Services & Support | 0 (0.0%) | 14 (100.0%) |
| Education Instruction & Library | 0 (0.0%) | 31 (100.0%) |
| Arts, Media & Entertainment | 0 (0.0%) | 0 (0.0%) |
| Health Diagnosing & Treating | 10 (33.3%) | 20 (66.7%) |
| Health Technologists | 10 (33.3%) | 20 (66.7%) |
| Total (Category) | 119 (49.2%) | 123 (50.8%) |
| Total (Overall) | 339 (48.2%) | 364 (51.8%) |
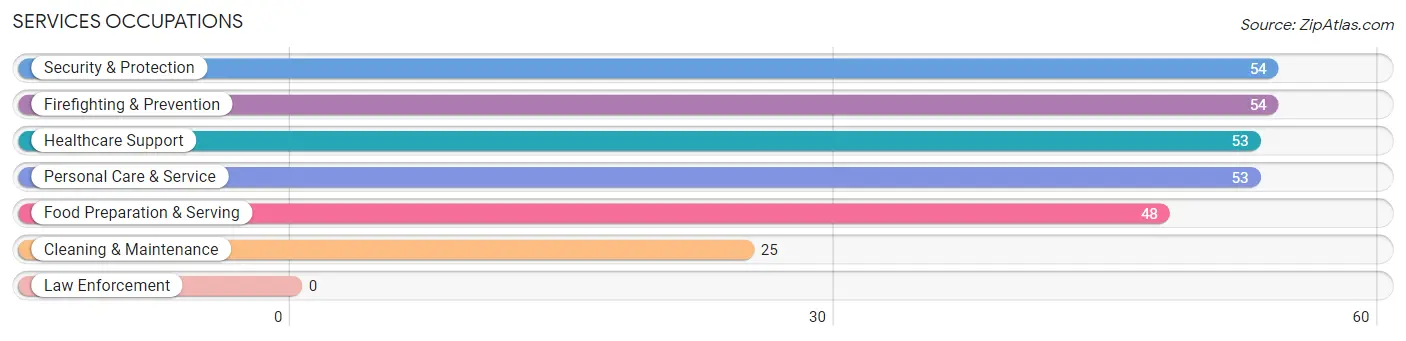
Services Occupations
The most common Services occupations in John Day are Security & Protection (54 | 7.7%), Firefighting & Prevention (54 | 7.7%), Healthcare Support (53 | 7.5%), Personal Care & Service (53 | 7.5%), and Food Preparation & Serving (48 | 6.8%).
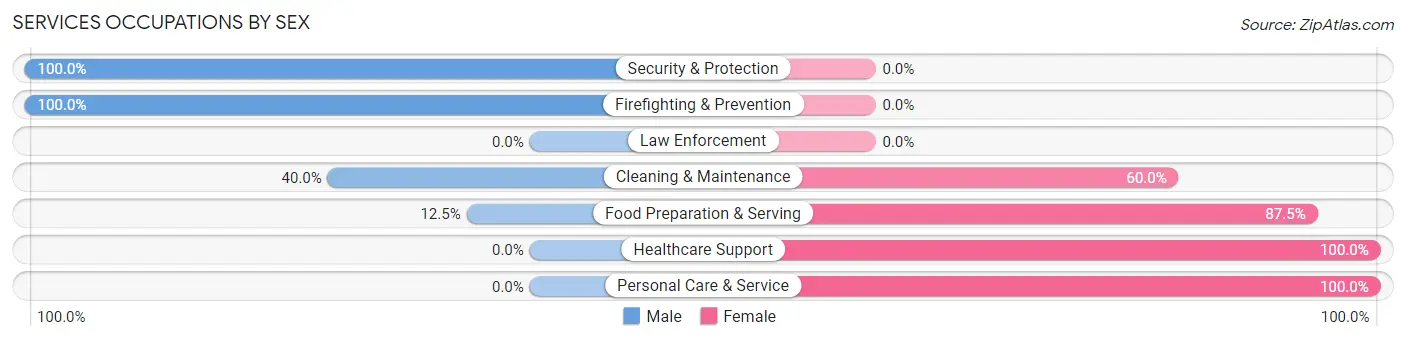
Services Occupations by Sex
Within the Services occupations in John Day, the most male-oriented occupations are Security & Protection (100.0%), Firefighting & Prevention (100.0%), and Cleaning & Maintenance (40.0%), while the most female-oriented occupations are Healthcare Support (100.0%), Personal Care & Service (100.0%), and Food Preparation & Serving (87.5%).
| Occupation | Male | Female |
| Healthcare Support | 0 (0.0%) | 53 (100.0%) |
| Security & Protection | 54 (100.0%) | 0 (0.0%) |
| Firefighting & Prevention | 54 (100.0%) | 0 (0.0%) |
| Law Enforcement | 0 (0.0%) | 0 (0.0%) |
| Food Preparation & Serving | 6 (12.5%) | 42 (87.5%) |
| Cleaning & Maintenance | 10 (40.0%) | 15 (60.0%) |
| Personal Care & Service | 0 (0.0%) | 53 (100.0%) |
| Total (Category) | 70 (30.0%) | 163 (70.0%) |
| Total (Overall) | 339 (48.2%) | 364 (51.8%) |
Sales and Office Occupations
The most common Sales and Office occupations in John Day are Office & Administration (90 | 12.8%), and Sales & Related (25 | 3.6%).
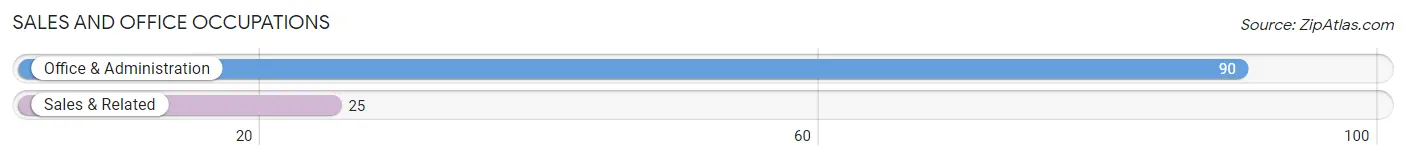
Sales and Office Occupations by Sex

| Occupation | Male | Female |
| Sales & Related | 21 (84.0%) | 4 (16.0%) |
| Office & Administration | 16 (17.8%) | 74 (82.2%) |
| Total (Category) | 37 (32.2%) | 78 (67.8%) |
| Total (Overall) | 339 (48.2%) | 364 (51.8%) |
Natural Resources, Construction and Maintenance Occupations
The most common Natural Resources, Construction and Maintenance occupations in John Day are Installation, Maintenance & Repair (28 | 4.0%), Construction & Extraction (23 | 3.3%), and Farming, Fishing & Forestry (8 | 1.1%).
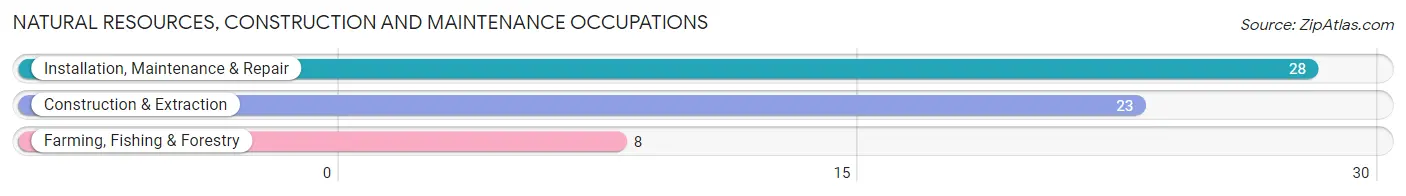
Natural Resources, Construction and Maintenance Occupations by Sex
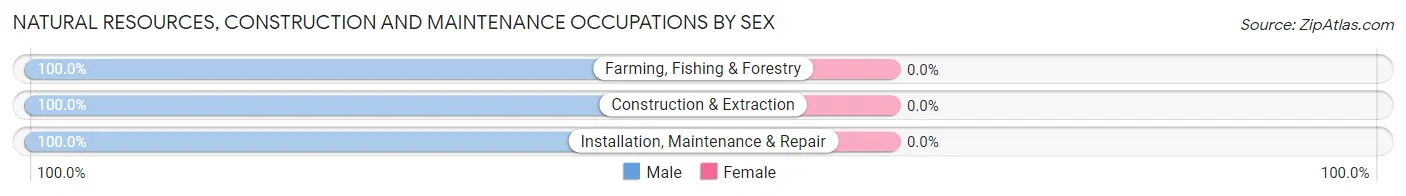
| Occupation | Male | Female |
| Farming, Fishing & Forestry | 8 (100.0%) | 0 (0.0%) |
| Construction & Extraction | 23 (100.0%) | 0 (0.0%) |
| Installation, Maintenance & Repair | 28 (100.0%) | 0 (0.0%) |
| Total (Category) | 59 (100.0%) | 0 (0.0%) |
| Total (Overall) | 339 (48.2%) | 364 (51.8%) |
Production, Transportation and Moving Occupations
The most common Production, Transportation and Moving occupations in John Day are Transportation (28 | 4.0%), Material Moving (23 | 3.3%), and Production (3 | 0.4%).
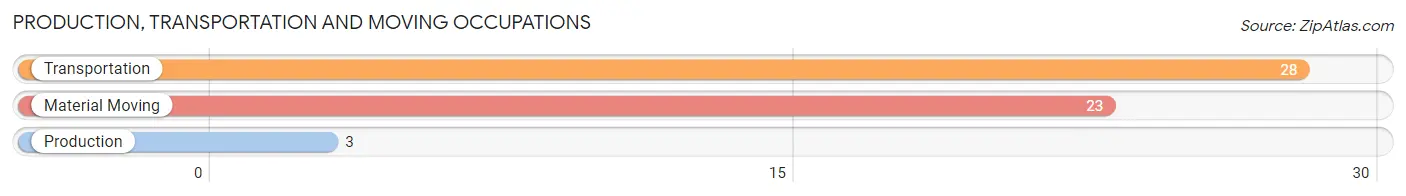
Production, Transportation and Moving Occupations by Sex
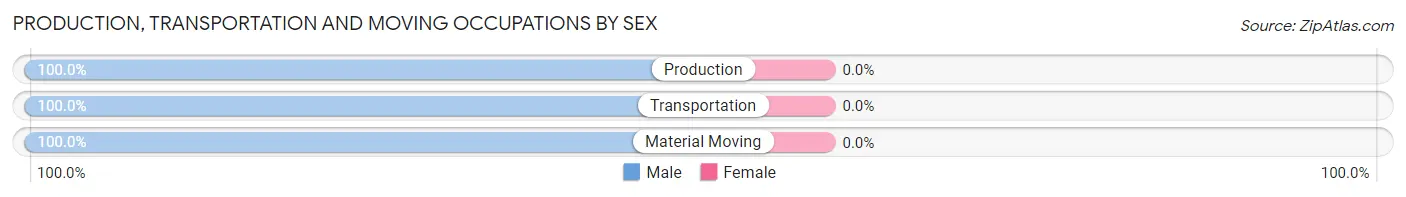
| Occupation | Male | Female |
| Production | 3 (100.0%) | 0 (0.0%) |
| Transportation | 28 (100.0%) | 0 (0.0%) |
| Material Moving | 23 (100.0%) | 0 (0.0%) |
| Total (Category) | 54 (100.0%) | 0 (0.0%) |
| Total (Overall) | 339 (48.2%) | 364 (51.8%) |
Employment Industries by Sex in John Day
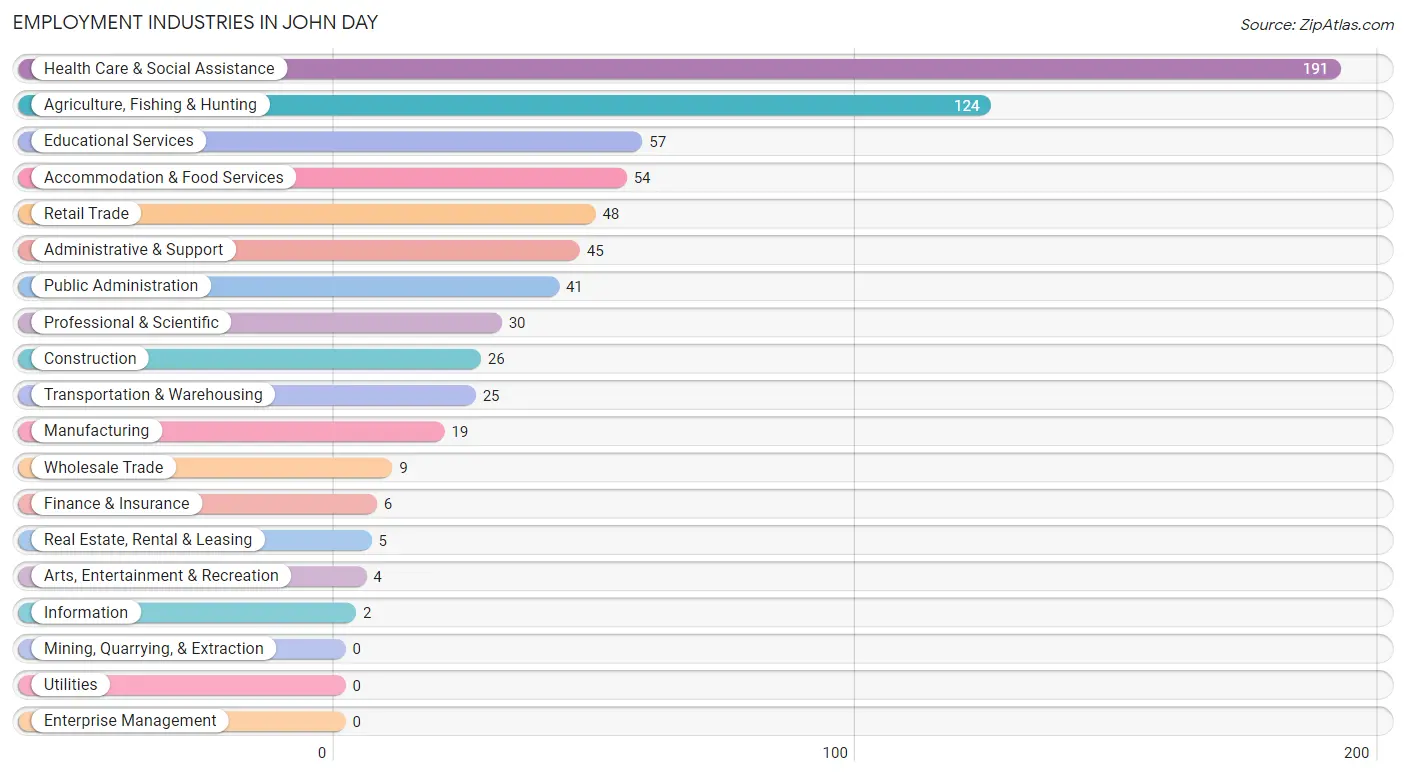
Employment Industries in John Day
The major employment industries in John Day include Health Care & Social Assistance (191 | 27.2%), Agriculture, Fishing & Hunting (124 | 17.6%), Educational Services (57 | 8.1%), Accommodation & Food Services (54 | 7.7%), and Retail Trade (48 | 6.8%).
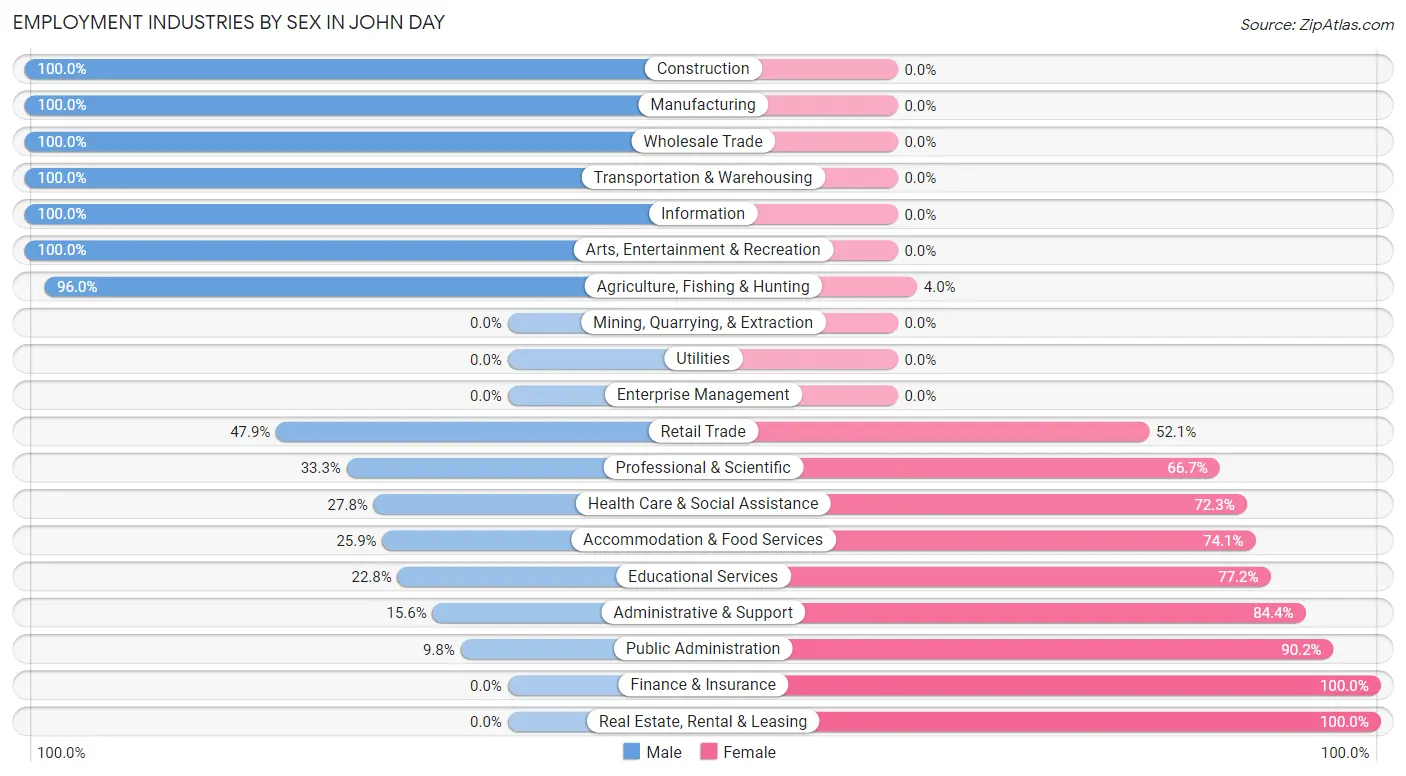
Employment Industries by Sex in John Day
The John Day industries that see more men than women are Construction (100.0%), Manufacturing (100.0%), and Wholesale Trade (100.0%), whereas the industries that tend to have a higher number of women are Finance & Insurance (100.0%), Real Estate, Rental & Leasing (100.0%), and Public Administration (90.2%).
| Industry | Male | Female |
| Agriculture, Fishing & Hunting | 119 (96.0%) | 5 (4.0%) |
| Mining, Quarrying, & Extraction | 0 (0.0%) | 0 (0.0%) |
| Construction | 26 (100.0%) | 0 (0.0%) |
| Manufacturing | 19 (100.0%) | 0 (0.0%) |
| Wholesale Trade | 9 (100.0%) | 0 (0.0%) |
| Retail Trade | 23 (47.9%) | 25 (52.1%) |
| Transportation & Warehousing | 25 (100.0%) | 0 (0.0%) |
| Utilities | 0 (0.0%) | 0 (0.0%) |
| Information | 2 (100.0%) | 0 (0.0%) |
| Finance & Insurance | 0 (0.0%) | 6 (100.0%) |
| Real Estate, Rental & Leasing | 0 (0.0%) | 5 (100.0%) |
| Professional & Scientific | 10 (33.3%) | 20 (66.7%) |
| Enterprise Management | 0 (0.0%) | 0 (0.0%) |
| Administrative & Support | 7 (15.6%) | 38 (84.4%) |
| Educational Services | 13 (22.8%) | 44 (77.2%) |
| Health Care & Social Assistance | 53 (27.8%) | 138 (72.3%) |
| Arts, Entertainment & Recreation | 4 (100.0%) | 0 (0.0%) |
| Accommodation & Food Services | 14 (25.9%) | 40 (74.1%) |
| Public Administration | 4 (9.8%) | 37 (90.2%) |
| Total | 339 (48.2%) | 364 (51.8%) |
Education in John Day
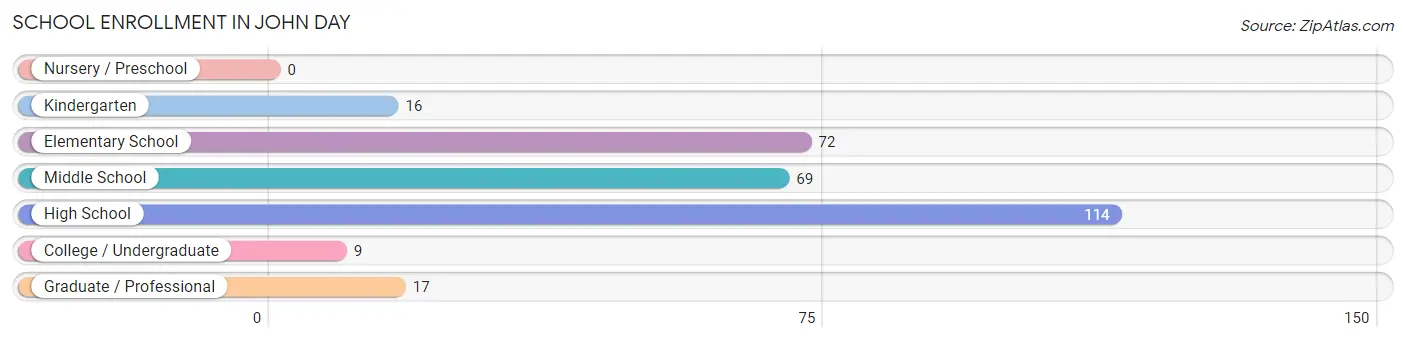
School Enrollment in John Day
The most common levels of schooling among the 297 students in John Day are high school (114 | 38.4%), elementary school (72 | 24.2%), and middle school (69 | 23.2%).
| School Level | # Students | % Students |
| Nursery / Preschool | 0 | 0.0% |
| Kindergarten | 16 | 5.4% |
| Elementary School | 72 | 24.2% |
| Middle School | 69 | 23.2% |
| High School | 114 | 38.4% |
| College / Undergraduate | 9 | 3.0% |
| Graduate / Professional | 17 | 5.7% |
| Total | 297 | 100.0% |
School Enrollment by Age by Funding Source in John Day
Out of a total of 297 students who are enrolled in schools in John Day, 22 (7.4%) attend a private institution, while the remaining 275 (92.6%) are enrolled in public schools. The age group of 20 to 24 year olds has the highest likelihood of being enrolled in private schools, with 3 (100.0% in the age bracket) enrolled. Conversely, the age group of 10 to 14 year olds has the lowest likelihood of being enrolled in a private school, with 100 (100.0% in the age bracket) attending a public institution.
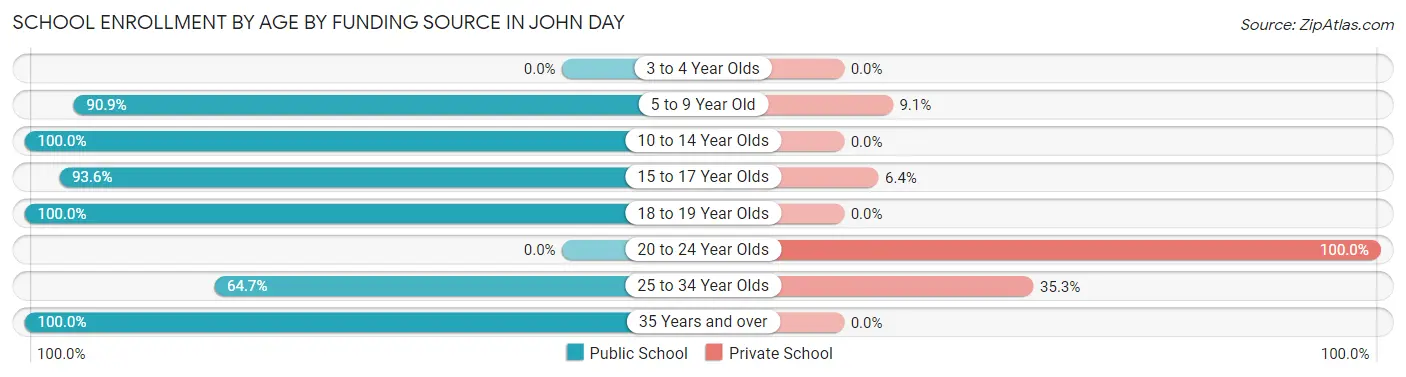
| Age Bracket | Public School | Private School |
| 3 to 4 Year Olds | 0 (0.0%) | 0 (0.0%) |
| 5 to 9 Year Old | 80 (90.9%) | 8 (9.1%) |
| 10 to 14 Year Olds | 100 (100.0%) | 0 (0.0%) |
| 15 to 17 Year Olds | 73 (93.6%) | 5 (6.4%) |
| 18 to 19 Year Olds | 3 (100.0%) | 0 (0.0%) |
| 20 to 24 Year Olds | 0 (0.0%) | 3 (100.0%) |
| 25 to 34 Year Olds | 11 (64.7%) | 6 (35.3%) |
| 35 Years and over | 8 (100.0%) | 0 (0.0%) |
| Total | 275 (92.6%) | 22 (7.4%) |
Educational Attainment by Field of Study in John Day
Bio, nature & agricultural (40 | 16.2%), business (40 | 16.2%), liberal arts & history (36 | 14.6%), education (32 | 13.0%), and social sciences (30 | 12.1%) are the most common fields of study among 247 individuals in John Day who have obtained a bachelor's degree or higher.
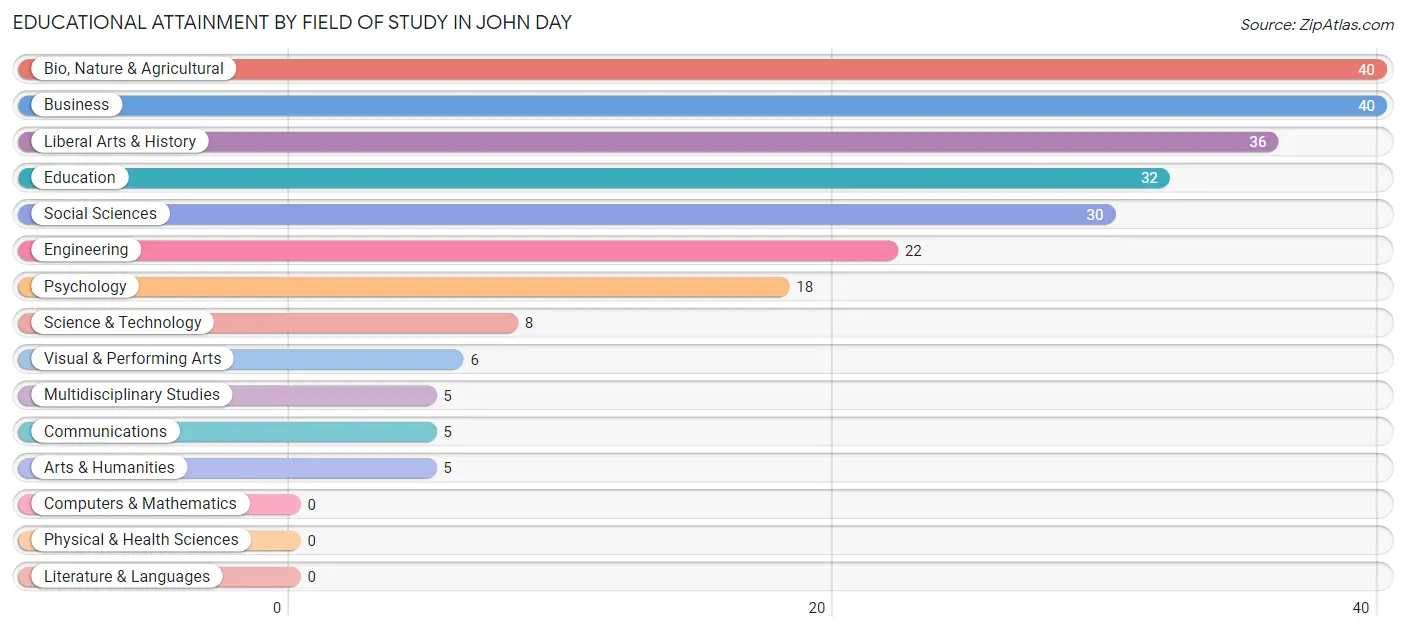
| Field of Study | # Graduates | % Graduates |
| Computers & Mathematics | 0 | 0.0% |
| Bio, Nature & Agricultural | 40 | 16.2% |
| Physical & Health Sciences | 0 | 0.0% |
| Psychology | 18 | 7.3% |
| Social Sciences | 30 | 12.1% |
| Engineering | 22 | 8.9% |
| Multidisciplinary Studies | 5 | 2.0% |
| Science & Technology | 8 | 3.2% |
| Business | 40 | 16.2% |
| Education | 32 | 13.0% |
| Literature & Languages | 0 | 0.0% |
| Liberal Arts & History | 36 | 14.6% |
| Visual & Performing Arts | 6 | 2.4% |
| Communications | 5 | 2.0% |
| Arts & Humanities | 5 | 2.0% |
| Total | 247 | 100.0% |
Transportation & Commute in John Day
Vehicle Availability by Sex in John Day
The most prevalent vehicle ownership categories in John Day are males with 2 vehicles (136, accounting for 40.1%) and females with 2 vehicles (110, making up 38.8%).
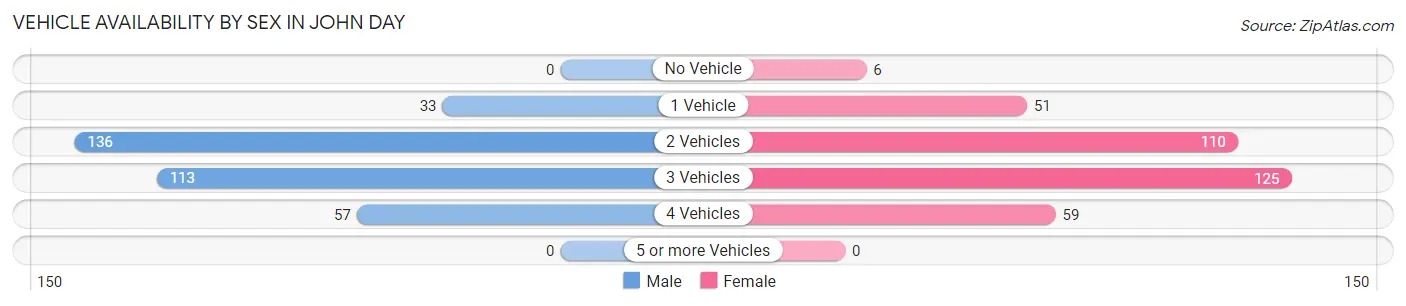
| Vehicles Available | Male | Female |
| No Vehicle | 0 (0.0%) | 6 (1.7%) |
| 1 Vehicle | 33 (9.7%) | 51 (14.5%) |
| 2 Vehicles | 136 (40.1%) | 110 (31.3%) |
| 3 Vehicles | 113 (33.3%) | 125 (35.6%) |
| 4 Vehicles | 57 (16.8%) | 59 (16.8%) |
| 5 or more Vehicles | 0 (0.0%) | 0 (0.0%) |
| Total | 339 (100.0%) | 351 (100.0%) |
Commute Time in John Day
The most frequently occuring commute durations in John Day are less than 5 minutes (213 commuters, 34.1%), 5 to 9 minutes (157 commuters, 25.2%), and 10 to 14 minutes (119 commuters, 19.1%).
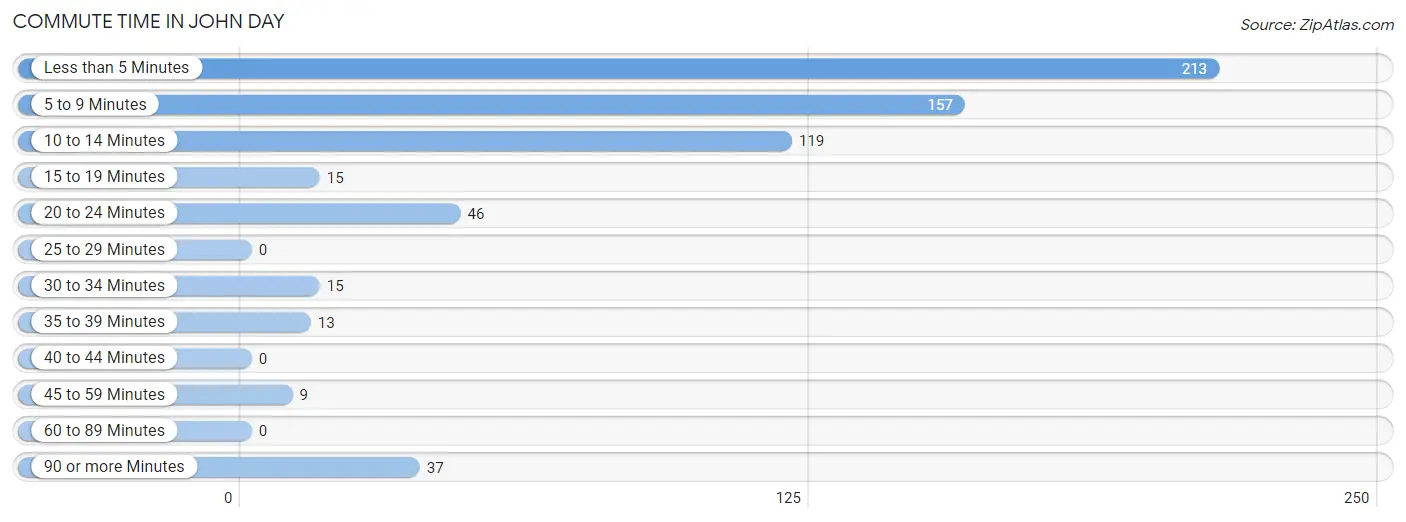
| Commute Time | # Commuters | % Commuters |
| Less than 5 Minutes | 213 | 34.1% |
| 5 to 9 Minutes | 157 | 25.2% |
| 10 to 14 Minutes | 119 | 19.1% |
| 15 to 19 Minutes | 15 | 2.4% |
| 20 to 24 Minutes | 46 | 7.4% |
| 25 to 29 Minutes | 0 | 0.0% |
| 30 to 34 Minutes | 15 | 2.4% |
| 35 to 39 Minutes | 13 | 2.1% |
| 40 to 44 Minutes | 0 | 0.0% |
| 45 to 59 Minutes | 9 | 1.4% |
| 60 to 89 Minutes | 0 | 0.0% |
| 90 or more Minutes | 37 | 5.9% |
Commute Time by Sex in John Day
The most common commute times in John Day are 5 to 9 minutes (81 commuters, 26.2%) for males and less than 5 minutes (136 commuters, 43.2%) for females.
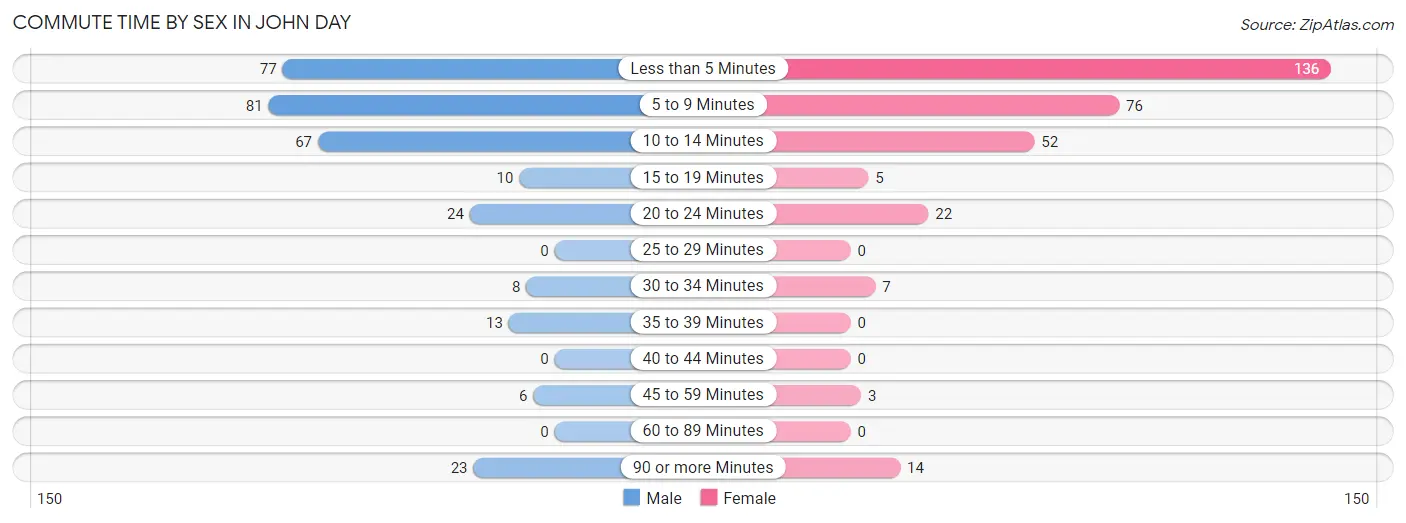
| Commute Time | Male | Female |
| Less than 5 Minutes | 77 (24.9%) | 136 (43.2%) |
| 5 to 9 Minutes | 81 (26.2%) | 76 (24.1%) |
| 10 to 14 Minutes | 67 (21.7%) | 52 (16.5%) |
| 15 to 19 Minutes | 10 (3.2%) | 5 (1.6%) |
| 20 to 24 Minutes | 24 (7.8%) | 22 (7.0%) |
| 25 to 29 Minutes | 0 (0.0%) | 0 (0.0%) |
| 30 to 34 Minutes | 8 (2.6%) | 7 (2.2%) |
| 35 to 39 Minutes | 13 (4.2%) | 0 (0.0%) |
| 40 to 44 Minutes | 0 (0.0%) | 0 (0.0%) |
| 45 to 59 Minutes | 6 (1.9%) | 3 (0.9%) |
| 60 to 89 Minutes | 0 (0.0%) | 0 (0.0%) |
| 90 or more Minutes | 23 (7.4%) | 14 (4.4%) |
Time of Departure to Work by Sex in John Day
The most frequent times of departure to work in John Day are 7:30 AM to 7:59 AM (92, 29.8%) for males and 6:00 AM to 6:29 AM (58, 18.4%) for females.
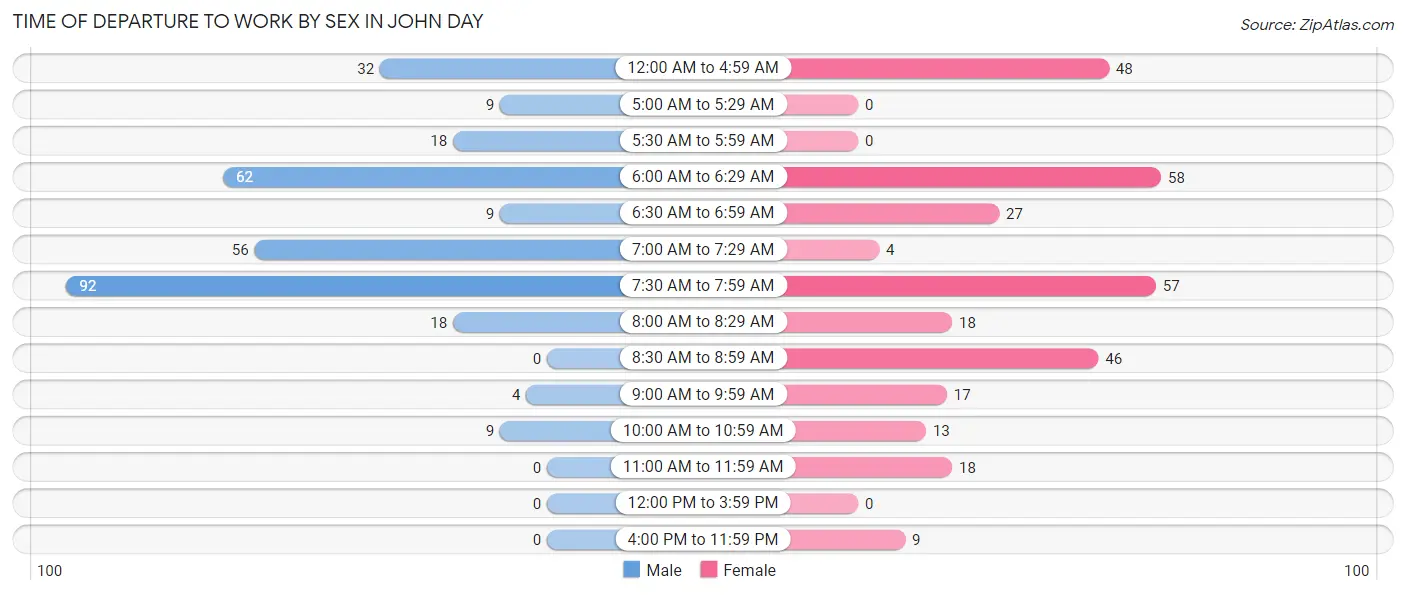
| Time of Departure | Male | Female |
| 12:00 AM to 4:59 AM | 32 (10.4%) | 48 (15.2%) |
| 5:00 AM to 5:29 AM | 9 (2.9%) | 0 (0.0%) |
| 5:30 AM to 5:59 AM | 18 (5.8%) | 0 (0.0%) |
| 6:00 AM to 6:29 AM | 62 (20.1%) | 58 (18.4%) |
| 6:30 AM to 6:59 AM | 9 (2.9%) | 27 (8.6%) |
| 7:00 AM to 7:29 AM | 56 (18.1%) | 4 (1.3%) |
| 7:30 AM to 7:59 AM | 92 (29.8%) | 57 (18.1%) |
| 8:00 AM to 8:29 AM | 18 (5.8%) | 18 (5.7%) |
| 8:30 AM to 8:59 AM | 0 (0.0%) | 46 (14.6%) |
| 9:00 AM to 9:59 AM | 4 (1.3%) | 17 (5.4%) |
| 10:00 AM to 10:59 AM | 9 (2.9%) | 13 (4.1%) |
| 11:00 AM to 11:59 AM | 0 (0.0%) | 18 (5.7%) |
| 12:00 PM to 3:59 PM | 0 (0.0%) | 0 (0.0%) |
| 4:00 PM to 11:59 PM | 0 (0.0%) | 9 (2.9%) |
| Total | 309 (100.0%) | 315 (100.0%) |
Housing Occupancy in John Day
Occupancy by Ownership in John Day
Of the total 716 dwellings in John Day, owner-occupied units account for 445 (62.2%), while renter-occupied units make up 271 (37.9%).
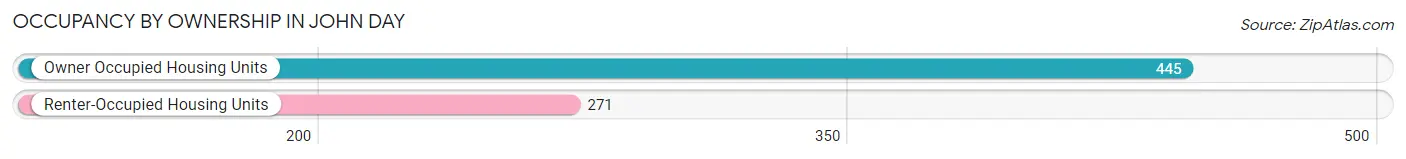
| Occupancy | # Housing Units | % Housing Units |
| Owner Occupied Housing Units | 445 | 62.2% |
| Renter-Occupied Housing Units | 271 | 37.9% |
| Total Occupied Housing Units | 716 | 100.0% |
Occupancy by Household Size in John Day
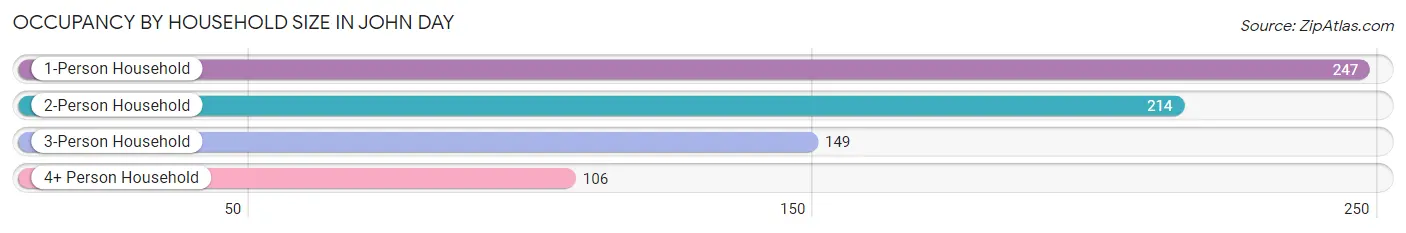
| Household Size | # Housing Units | % Housing Units |
| 1-Person Household | 247 | 34.5% |
| 2-Person Household | 214 | 29.9% |
| 3-Person Household | 149 | 20.8% |
| 4+ Person Household | 106 | 14.8% |
| Total Housing Units | 716 | 100.0% |
Occupancy by Ownership by Household Size in John Day
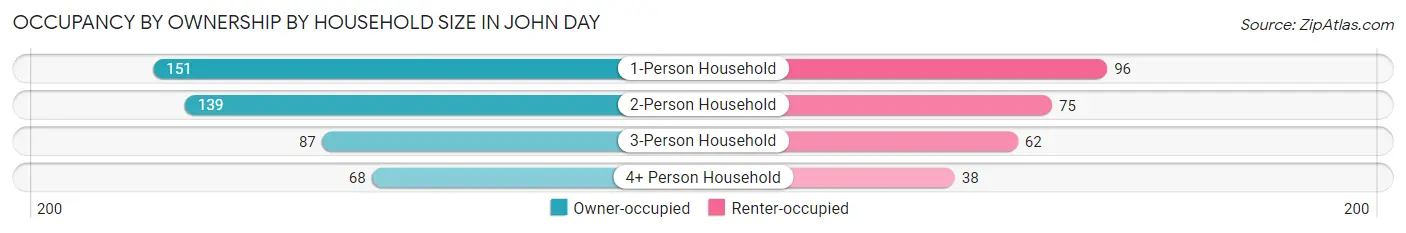
| Household Size | Owner-occupied | Renter-occupied |
| 1-Person Household | 151 (61.1%) | 96 (38.9%) |
| 2-Person Household | 139 (64.9%) | 75 (35.0%) |
| 3-Person Household | 87 (58.4%) | 62 (41.6%) |
| 4+ Person Household | 68 (64.1%) | 38 (35.8%) |
| Total Housing Units | 445 (62.2%) | 271 (37.9%) |
Occupancy by Educational Attainment in John Day
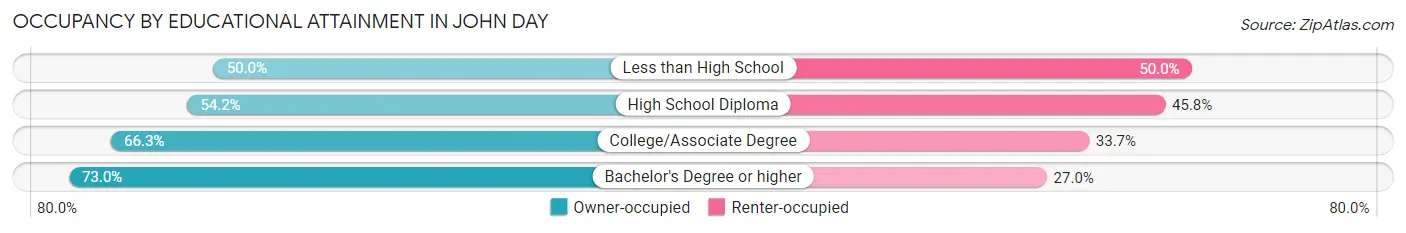
| Household Size | Owner-occupied | Renter-occupied |
| Less than High School | 34 (50.0%) | 34 (50.0%) |
| High School Diploma | 130 (54.2%) | 110 (45.8%) |
| College/Associate Degree | 165 (66.3%) | 84 (33.7%) |
| Bachelor's Degree or higher | 116 (73.0%) | 43 (27.0%) |
Occupancy by Age of Householder in John Day
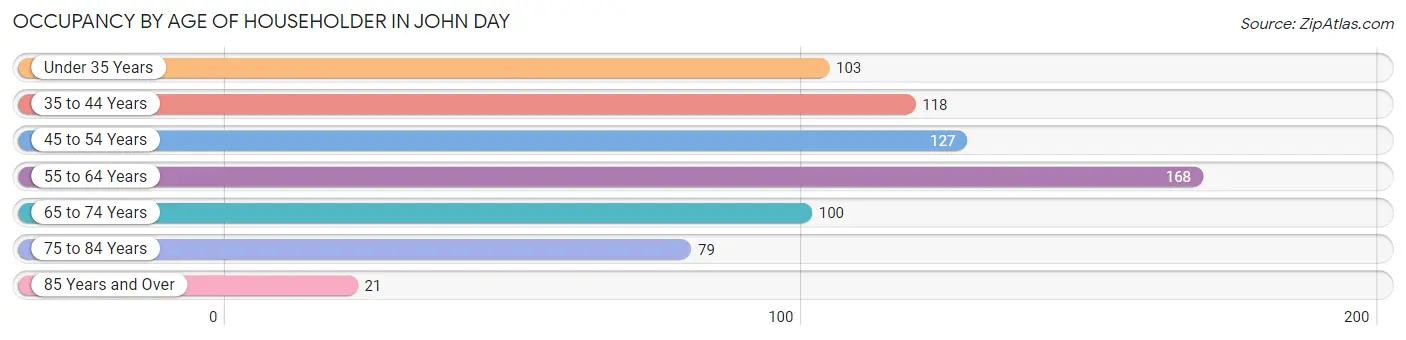
| Age Bracket | # Households | % Households |
| Under 35 Years | 103 | 14.4% |
| 35 to 44 Years | 118 | 16.5% |
| 45 to 54 Years | 127 | 17.7% |
| 55 to 64 Years | 168 | 23.5% |
| 65 to 74 Years | 100 | 14.0% |
| 75 to 84 Years | 79 | 11.0% |
| 85 Years and Over | 21 | 2.9% |
| Total | 716 | 100.0% |
Housing Finances in John Day
Median Income by Occupancy in John Day
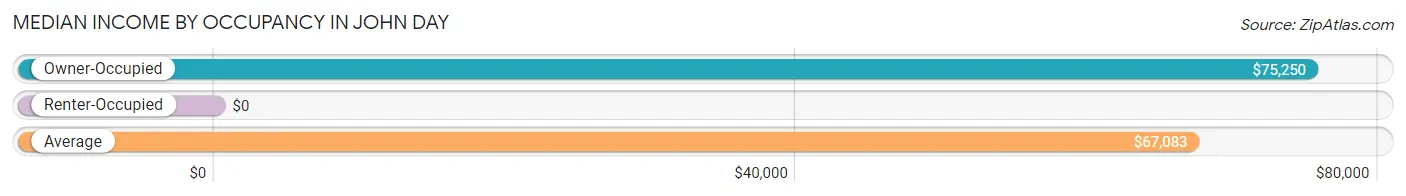
| Occupancy Type | # Households | Median Income |
| Owner-Occupied | 445 (62.2%) | $75,250 |
| Renter-Occupied | 271 (37.9%) | $0 |
| Average | 716 (100.0%) | $67,083 |
Occupancy by Householder Income Bracket in John Day
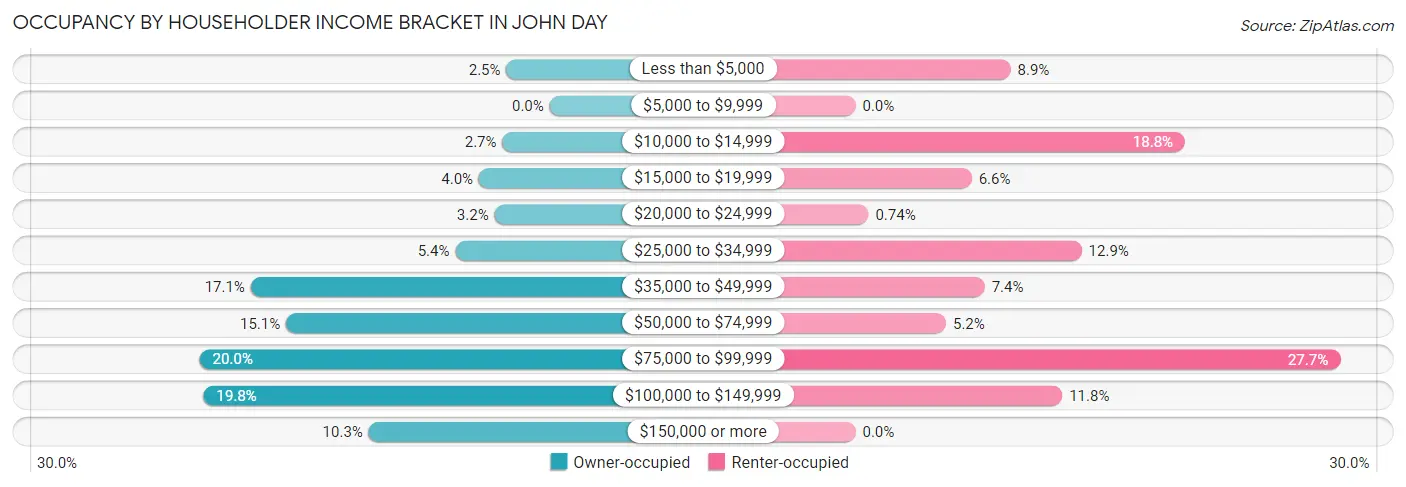
| Income Bracket | Owner-occupied | Renter-occupied |
| Less than $5,000 | 11 (2.5%) | 24 (8.9%) |
| $5,000 to $9,999 | 0 (0.0%) | 0 (0.0%) |
| $10,000 to $14,999 | 12 (2.7%) | 51 (18.8%) |
| $15,000 to $19,999 | 18 (4.0%) | 18 (6.6%) |
| $20,000 to $24,999 | 14 (3.2%) | 2 (0.7%) |
| $25,000 to $34,999 | 24 (5.4%) | 35 (12.9%) |
| $35,000 to $49,999 | 76 (17.1%) | 20 (7.4%) |
| $50,000 to $74,999 | 67 (15.1%) | 14 (5.2%) |
| $75,000 to $99,999 | 89 (20.0%) | 75 (27.7%) |
| $100,000 to $149,999 | 88 (19.8%) | 32 (11.8%) |
| $150,000 or more | 46 (10.3%) | 0 (0.0%) |
| Total | 445 (100.0%) | 271 (100.0%) |
Monthly Housing Cost Tiers in John Day
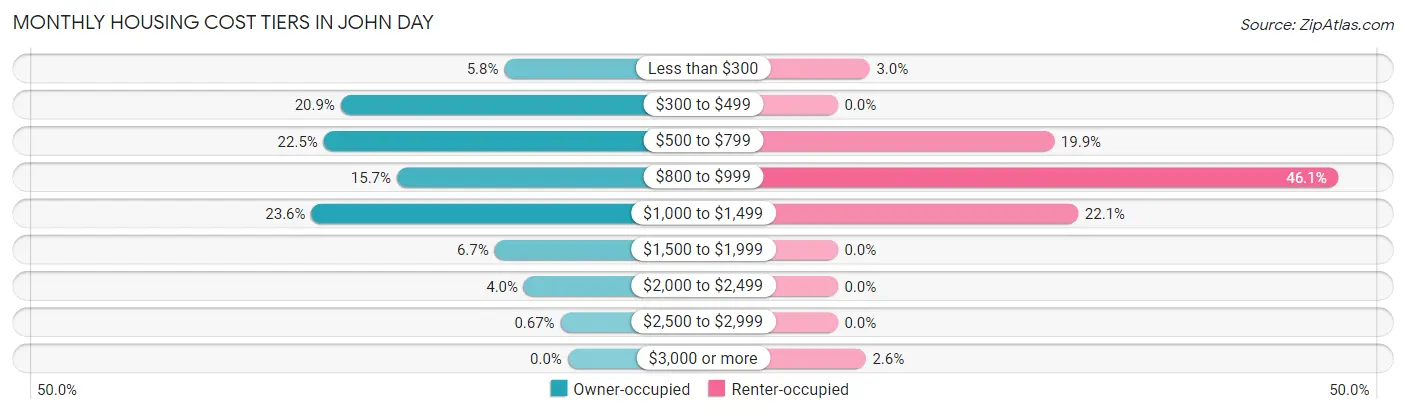
| Monthly Cost | Owner-occupied | Renter-occupied |
| Less than $300 | 26 (5.8%) | 8 (2.9%) |
| $300 to $499 | 93 (20.9%) | 0 (0.0%) |
| $500 to $799 | 100 (22.5%) | 54 (19.9%) |
| $800 to $999 | 70 (15.7%) | 125 (46.1%) |
| $1,000 to $1,499 | 105 (23.6%) | 60 (22.1%) |
| $1,500 to $1,999 | 30 (6.7%) | 0 (0.0%) |
| $2,000 to $2,499 | 18 (4.0%) | 0 (0.0%) |
| $2,500 to $2,999 | 3 (0.7%) | 0 (0.0%) |
| $3,000 or more | 0 (0.0%) | 7 (2.6%) |
| Total | 445 (100.0%) | 271 (100.0%) |
Physical Housing Characteristics in John Day
Housing Structures in John Day
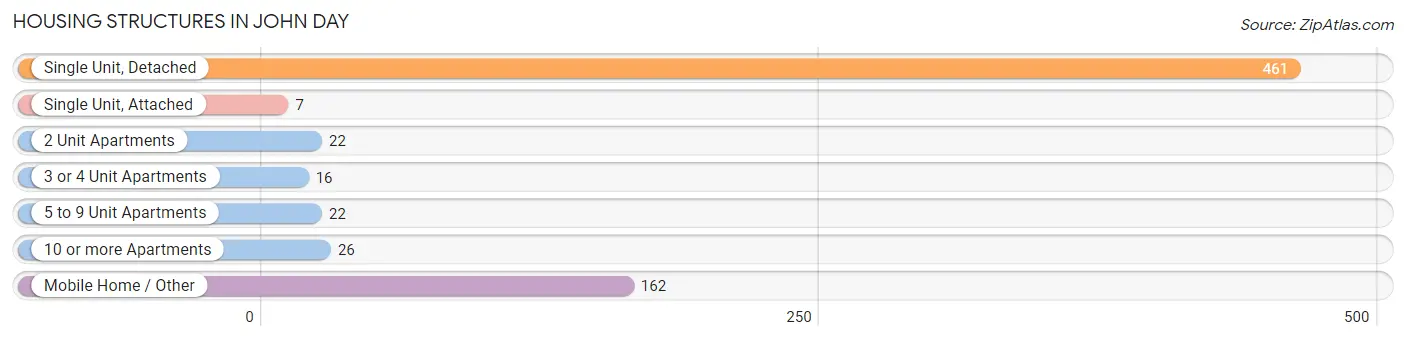
| Structure Type | # Housing Units | % Housing Units |
| Single Unit, Detached | 461 | 64.4% |
| Single Unit, Attached | 7 | 1.0% |
| 2 Unit Apartments | 22 | 3.1% |
| 3 or 4 Unit Apartments | 16 | 2.2% |
| 5 to 9 Unit Apartments | 22 | 3.1% |
| 10 or more Apartments | 26 | 3.6% |
| Mobile Home / Other | 162 | 22.6% |
| Total | 716 | 100.0% |
Housing Structures by Occupancy in John Day
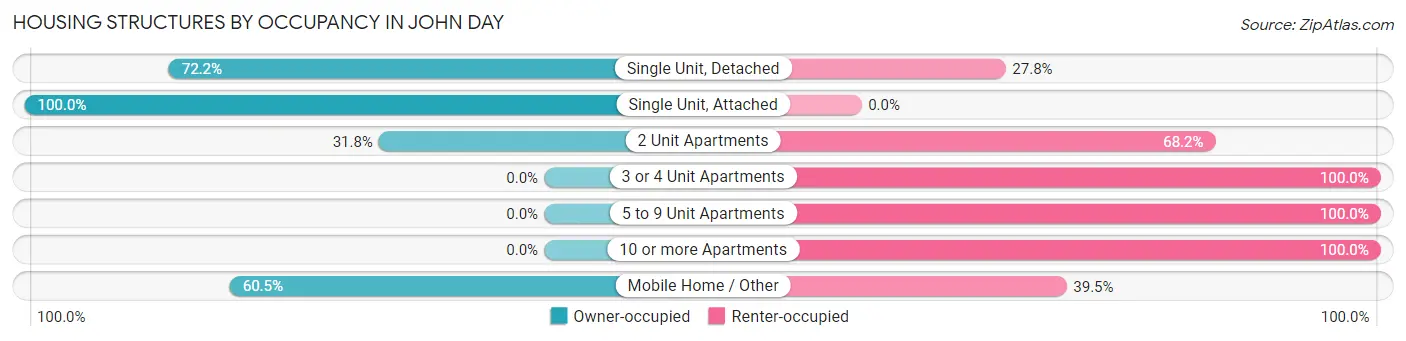
| Structure Type | Owner-occupied | Renter-occupied |
| Single Unit, Detached | 333 (72.2%) | 128 (27.8%) |
| Single Unit, Attached | 7 (100.0%) | 0 (0.0%) |
| 2 Unit Apartments | 7 (31.8%) | 15 (68.2%) |
| 3 or 4 Unit Apartments | 0 (0.0%) | 16 (100.0%) |
| 5 to 9 Unit Apartments | 0 (0.0%) | 22 (100.0%) |
| 10 or more Apartments | 0 (0.0%) | 26 (100.0%) |
| Mobile Home / Other | 98 (60.5%) | 64 (39.5%) |
| Total | 445 (62.2%) | 271 (37.9%) |
Housing Structures by Number of Rooms in John Day
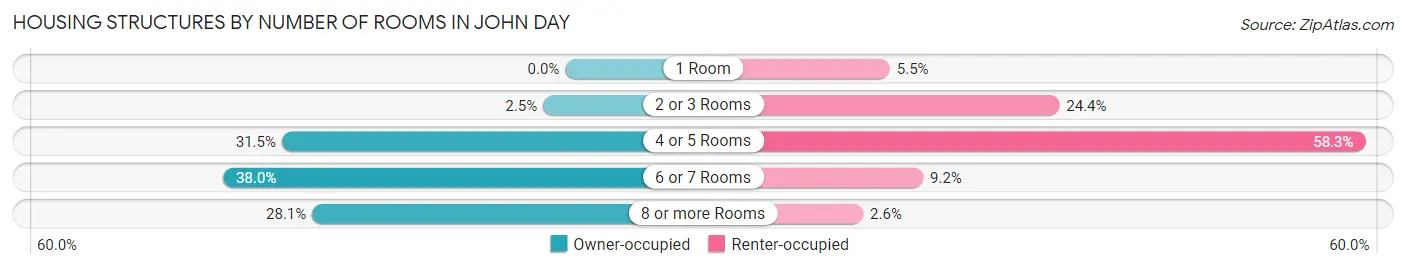
| Number of Rooms | Owner-occupied | Renter-occupied |
| 1 Room | 0 (0.0%) | 15 (5.5%) |
| 2 or 3 Rooms | 11 (2.5%) | 66 (24.3%) |
| 4 or 5 Rooms | 140 (31.5%) | 158 (58.3%) |
| 6 or 7 Rooms | 169 (38.0%) | 25 (9.2%) |
| 8 or more Rooms | 125 (28.1%) | 7 (2.6%) |
| Total | 445 (100.0%) | 271 (100.0%) |
Housing Structure by Heating Type in John Day
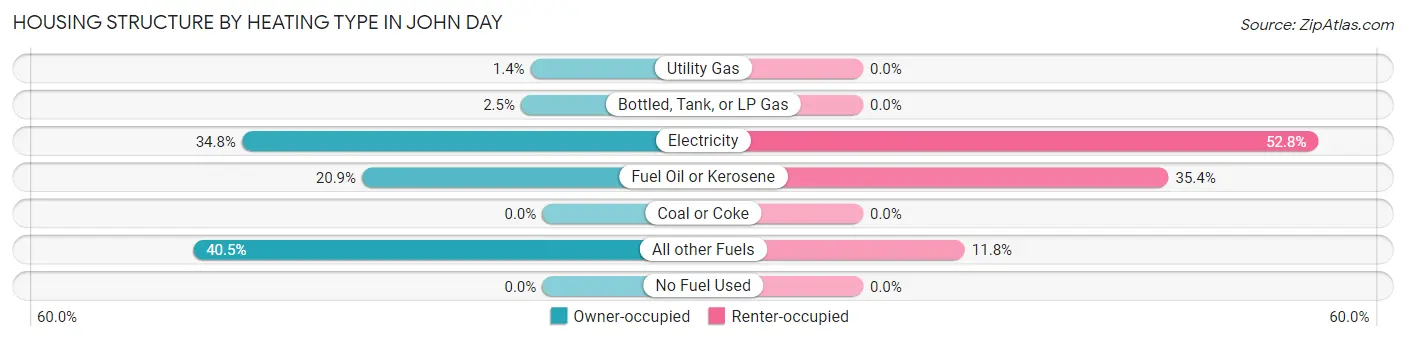
| Heating Type | Owner-occupied | Renter-occupied |
| Utility Gas | 6 (1.3%) | 0 (0.0%) |
| Bottled, Tank, or LP Gas | 11 (2.5%) | 0 (0.0%) |
| Electricity | 155 (34.8%) | 143 (52.8%) |
| Fuel Oil or Kerosene | 93 (20.9%) | 96 (35.4%) |
| Coal or Coke | 0 (0.0%) | 0 (0.0%) |
| All other Fuels | 180 (40.5%) | 32 (11.8%) |
| No Fuel Used | 0 (0.0%) | 0 (0.0%) |
| Total | 445 (100.0%) | 271 (100.0%) |
Household Vehicle Usage in John Day
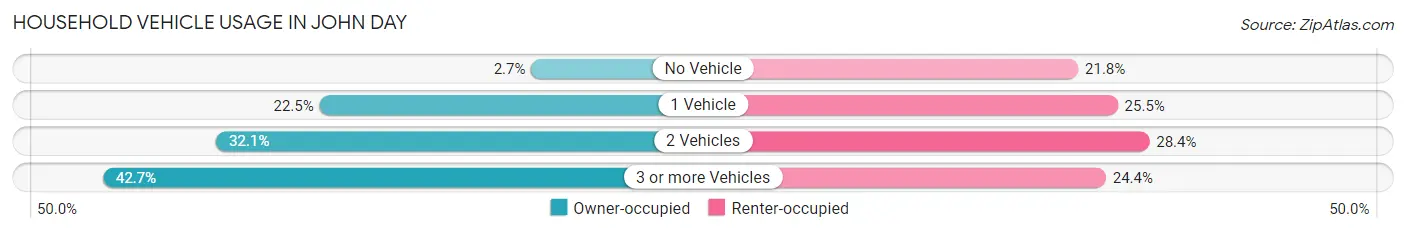
| Vehicles per Household | Owner-occupied | Renter-occupied |
| No Vehicle | 12 (2.7%) | 59 (21.8%) |
| 1 Vehicle | 100 (22.5%) | 69 (25.5%) |
| 2 Vehicles | 143 (32.1%) | 77 (28.4%) |
| 3 or more Vehicles | 190 (42.7%) | 66 (24.3%) |
| Total | 445 (100.0%) | 271 (100.0%) |
Real Estate & Mortgages in John Day
Real Estate and Mortgage Overview in John Day
| Characteristic | Without Mortgage | With Mortgage |
| Housing Units | 233 | 212 |
| Median Property Value | $148,700 | $207,800 |
| Median Household Income | $80,625 | $25 |
| Monthly Housing Costs | $494 | $0 |
| Real Estate Taxes | $1,512 | $9 |
Property Value by Mortgage Status in John Day
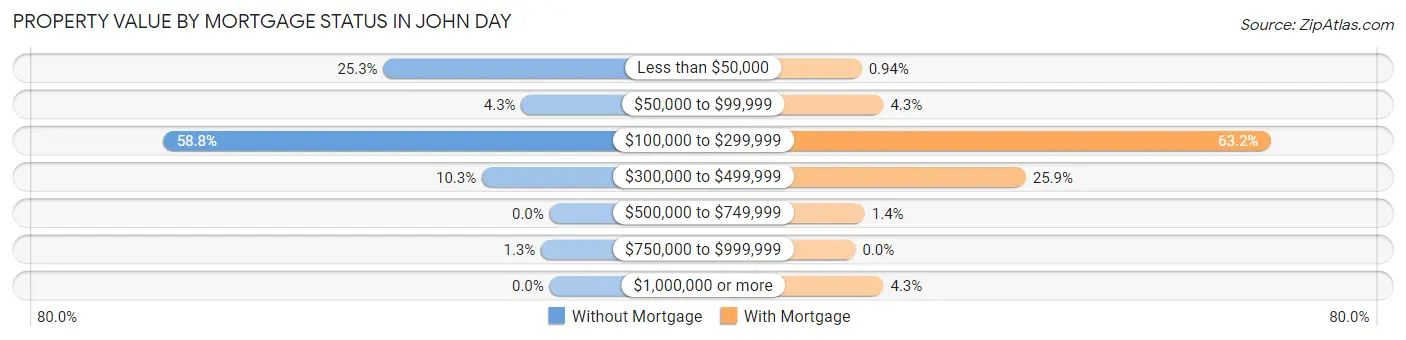
| Property Value | Without Mortgage | With Mortgage |
| Less than $50,000 | 59 (25.3%) | 2 (0.9%) |
| $50,000 to $99,999 | 10 (4.3%) | 9 (4.3%) |
| $100,000 to $299,999 | 137 (58.8%) | 134 (63.2%) |
| $300,000 to $499,999 | 24 (10.3%) | 55 (25.9%) |
| $500,000 to $749,999 | 0 (0.0%) | 3 (1.4%) |
| $750,000 to $999,999 | 3 (1.3%) | 0 (0.0%) |
| $1,000,000 or more | 0 (0.0%) | 9 (4.3%) |
| Total | 233 (100.0%) | 212 (100.0%) |
Household Income by Mortgage Status in John Day
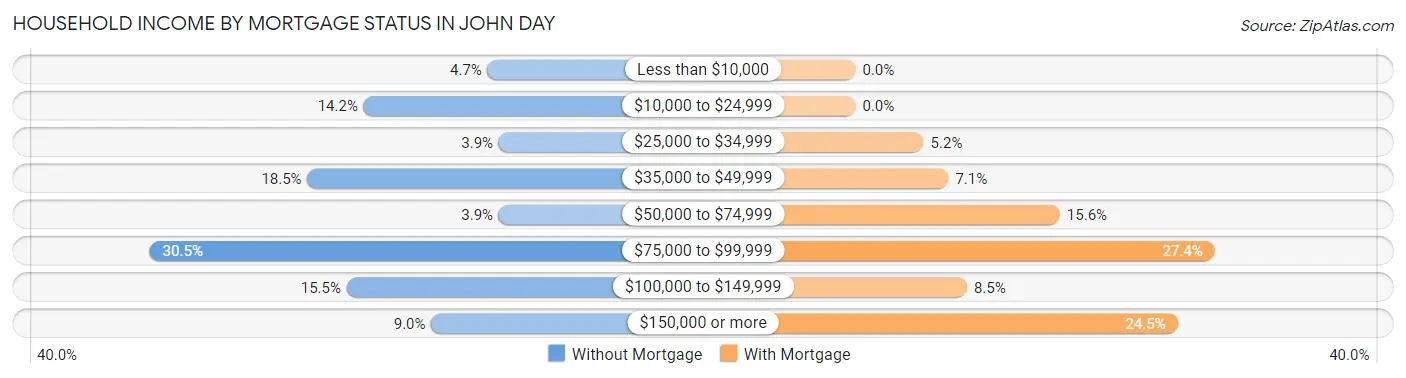
| Household Income | Without Mortgage | With Mortgage |
| Less than $10,000 | 11 (4.7%) | 0 (0.0%) |
| $10,000 to $24,999 | 33 (14.2%) | 0 (0.0%) |
| $25,000 to $34,999 | 9 (3.9%) | 11 (5.2%) |
| $35,000 to $49,999 | 43 (18.4%) | 15 (7.1%) |
| $50,000 to $74,999 | 9 (3.9%) | 33 (15.6%) |
| $75,000 to $99,999 | 71 (30.5%) | 58 (27.4%) |
| $100,000 to $149,999 | 36 (15.4%) | 18 (8.5%) |
| $150,000 or more | 21 (9.0%) | 52 (24.5%) |
| Total | 233 (100.0%) | 212 (100.0%) |
Property Value to Household Income Ratio in John Day
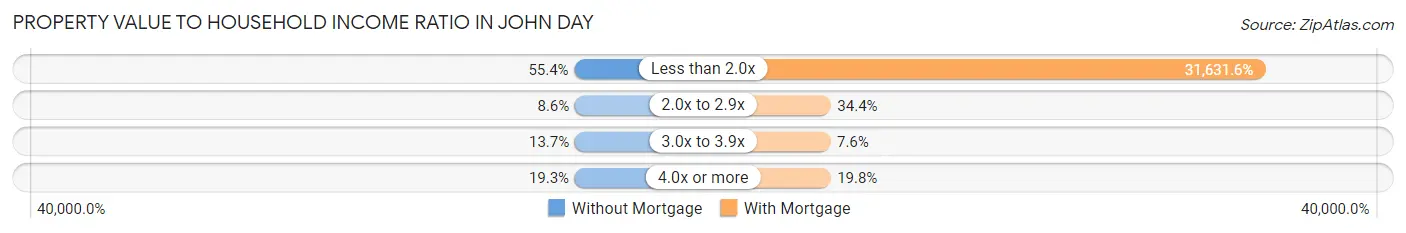
| Value-to-Income Ratio | Without Mortgage | With Mortgage |
| Less than 2.0x | 129 (55.4%) | 67,059 (31,631.6%) |
| 2.0x to 2.9x | 20 (8.6%) | 73 (34.4%) |
| 3.0x to 3.9x | 32 (13.7%) | 16 (7.5%) |
| 4.0x or more | 45 (19.3%) | 42 (19.8%) |
| Total | 233 (100.0%) | 212 (100.0%) |
Real Estate Taxes by Mortgage Status in John Day
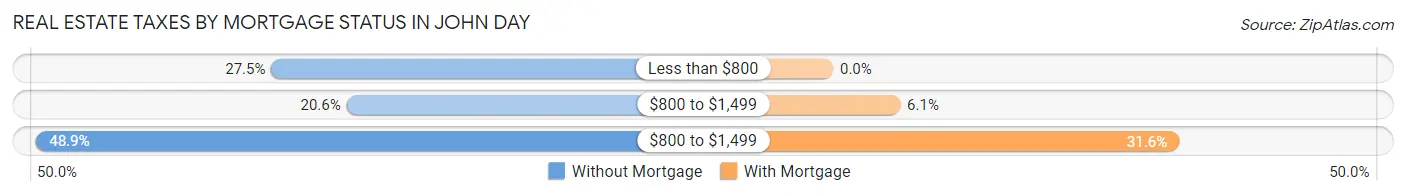
| Property Taxes | Without Mortgage | With Mortgage |
| Less than $800 | 64 (27.5%) | 0 (0.0%) |
| $800 to $1,499 | 48 (20.6%) | 13 (6.1%) |
| $800 to $1,499 | 114 (48.9%) | 67 (31.6%) |
| Total | 233 (100.0%) | 212 (100.0%) |
Health & Disability in John Day
Health Insurance Coverage by Age in John Day
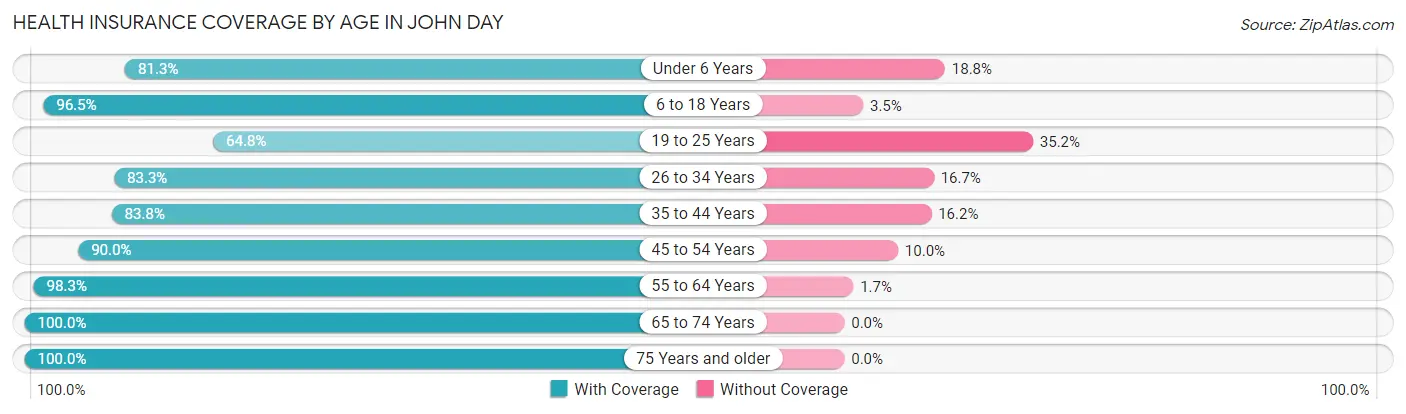
| Age Bracket | With Coverage | Without Coverage |
| Under 6 Years | 26 (81.2%) | 6 (18.8%) |
| 6 to 18 Years | 249 (96.5%) | 9 (3.5%) |
| 19 to 25 Years | 83 (64.8%) | 45 (35.2%) |
| 26 to 34 Years | 110 (83.3%) | 22 (16.7%) |
| 35 to 44 Years | 212 (83.8%) | 41 (16.2%) |
| 45 to 54 Years | 171 (90.0%) | 19 (10.0%) |
| 55 to 64 Years | 235 (98.3%) | 4 (1.7%) |
| 65 to 74 Years | 154 (100.0%) | 0 (0.0%) |
| 75 Years and older | 153 (100.0%) | 0 (0.0%) |
| Total | 1,393 (90.5%) | 146 (9.5%) |
Health Insurance Coverage by Citizenship Status in John Day
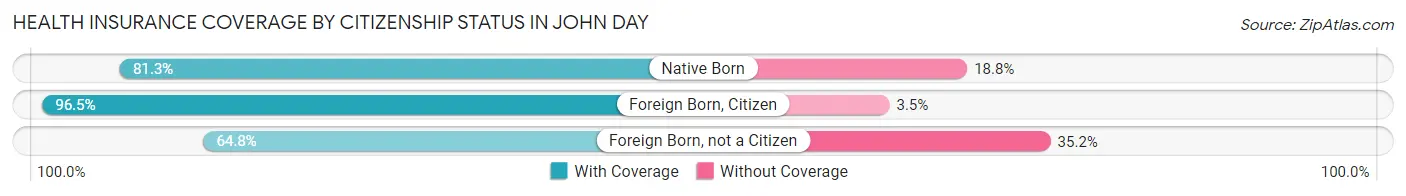
| Citizenship Status | With Coverage | Without Coverage |
| Native Born | 26 (81.2%) | 6 (18.8%) |
| Foreign Born, Citizen | 249 (96.5%) | 9 (3.5%) |
| Foreign Born, not a Citizen | 83 (64.8%) | 45 (35.2%) |
Health Insurance Coverage by Household Income in John Day
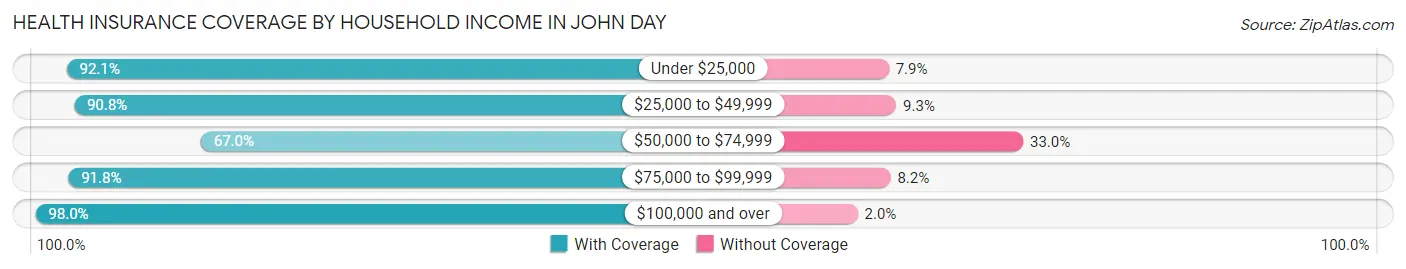
| Household Income | With Coverage | Without Coverage |
| Under $25,000 | 211 (92.1%) | 18 (7.9%) |
| $25,000 to $49,999 | 206 (90.7%) | 21 (9.2%) |
| $50,000 to $74,999 | 142 (67.0%) | 70 (33.0%) |
| $75,000 to $99,999 | 303 (91.8%) | 27 (8.2%) |
| $100,000 and over | 482 (98.0%) | 10 (2.0%) |
Public vs Private Health Insurance Coverage by Age in John Day
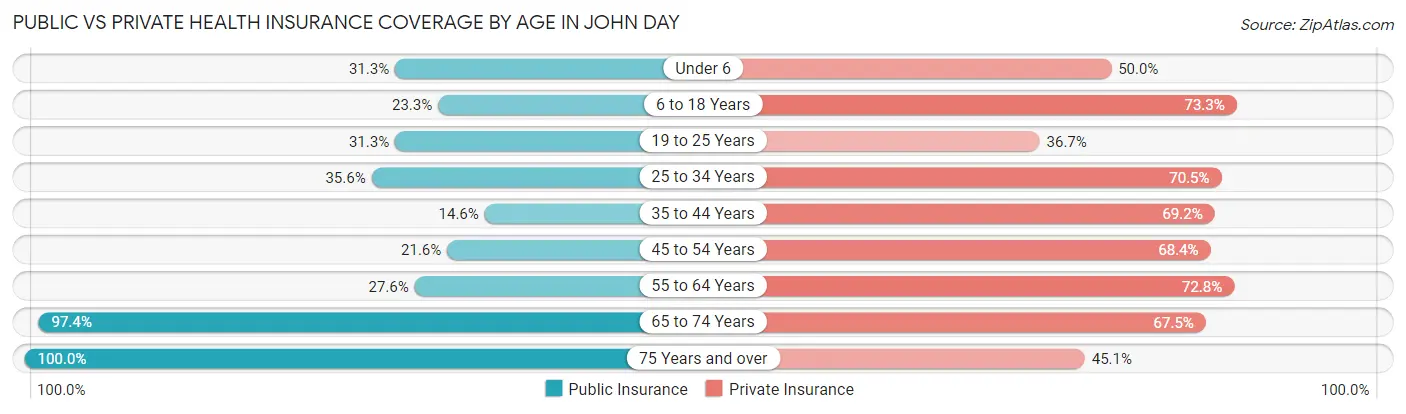
| Age Bracket | Public Insurance | Private Insurance |
| Under 6 | 10 (31.2%) | 16 (50.0%) |
| 6 to 18 Years | 60 (23.3%) | 189 (73.3%) |
| 19 to 25 Years | 40 (31.2%) | 47 (36.7%) |
| 25 to 34 Years | 47 (35.6%) | 93 (70.5%) |
| 35 to 44 Years | 37 (14.6%) | 175 (69.2%) |
| 45 to 54 Years | 41 (21.6%) | 130 (68.4%) |
| 55 to 64 Years | 66 (27.6%) | 174 (72.8%) |
| 65 to 74 Years | 150 (97.4%) | 104 (67.5%) |
| 75 Years and over | 153 (100.0%) | 69 (45.1%) |
| Total | 604 (39.3%) | 997 (64.8%) |
Disability Status by Sex by Age in John Day
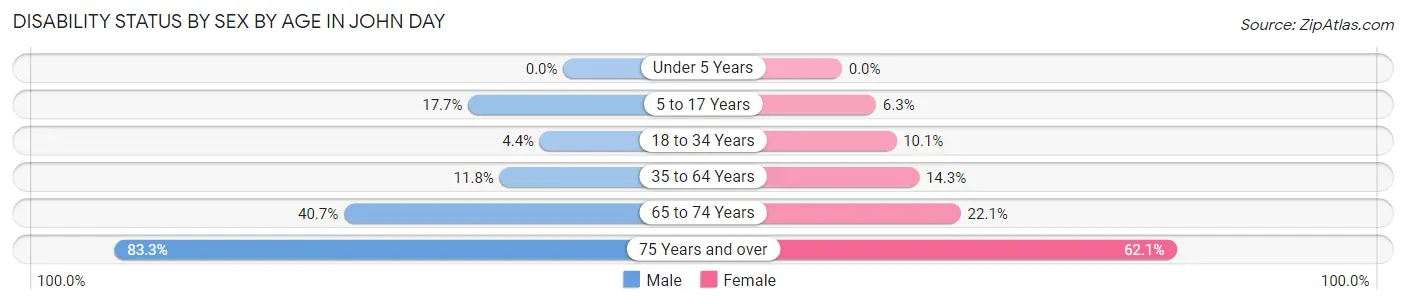
| Age Bracket | Male | Female |
| Under 5 Years | 0 (0.0%) | 0 (0.0%) |
| 5 to 17 Years | 21 (17.6%) | 10 (6.3%) |
| 18 to 34 Years | 7 (4.3%) | 10 (10.1%) |
| 35 to 64 Years | 41 (11.8%) | 48 (14.3%) |
| 65 to 74 Years | 35 (40.7%) | 15 (22.1%) |
| 75 Years and over | 55 (83.3%) | 54 (62.1%) |
Disability Class by Sex by Age in John Day
Disability Class: Hearing Difficulty
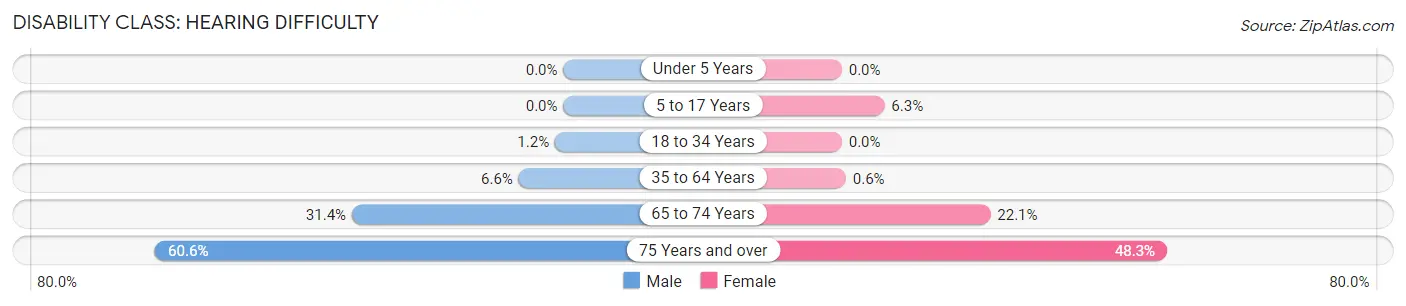
| Age Bracket | Male | Female |
| Under 5 Years | 0 (0.0%) | 0 (0.0%) |
| 5 to 17 Years | 0 (0.0%) | 10 (6.3%) |
| 18 to 34 Years | 2 (1.2%) | 0 (0.0%) |
| 35 to 64 Years | 23 (6.6%) | 2 (0.6%) |
| 65 to 74 Years | 27 (31.4%) | 15 (22.1%) |
| 75 Years and over | 40 (60.6%) | 42 (48.3%) |
Disability Class: Vision Difficulty
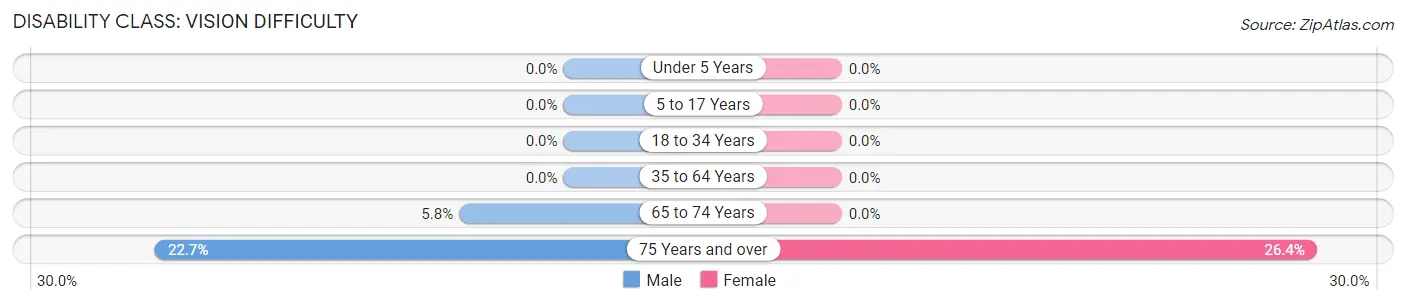
| Age Bracket | Male | Female |
| Under 5 Years | 0 (0.0%) | 0 (0.0%) |
| 5 to 17 Years | 0 (0.0%) | 0 (0.0%) |
| 18 to 34 Years | 0 (0.0%) | 0 (0.0%) |
| 35 to 64 Years | 0 (0.0%) | 0 (0.0%) |
| 65 to 74 Years | 5 (5.8%) | 0 (0.0%) |
| 75 Years and over | 15 (22.7%) | 23 (26.4%) |
Disability Class: Cognitive Difficulty
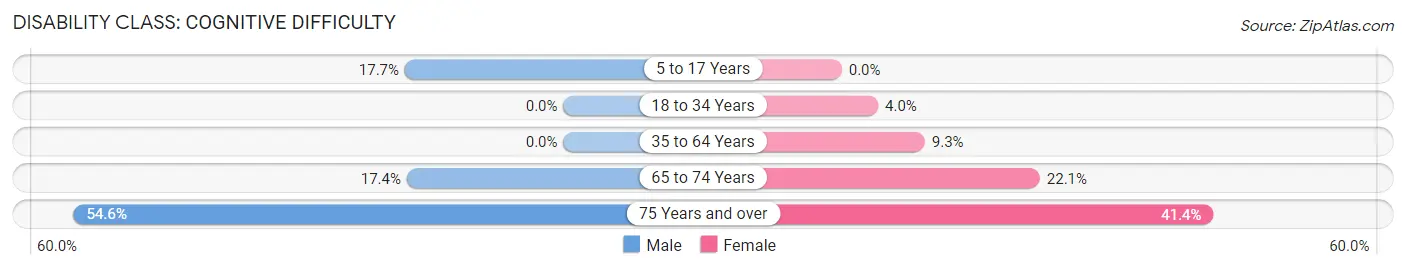
| Age Bracket | Male | Female |
| 5 to 17 Years | 21 (17.6%) | 0 (0.0%) |
| 18 to 34 Years | 0 (0.0%) | 4 (4.0%) |
| 35 to 64 Years | 0 (0.0%) | 31 (9.2%) |
| 65 to 74 Years | 15 (17.4%) | 15 (22.1%) |
| 75 Years and over | 36 (54.5%) | 36 (41.4%) |
Disability Class: Ambulatory Difficulty
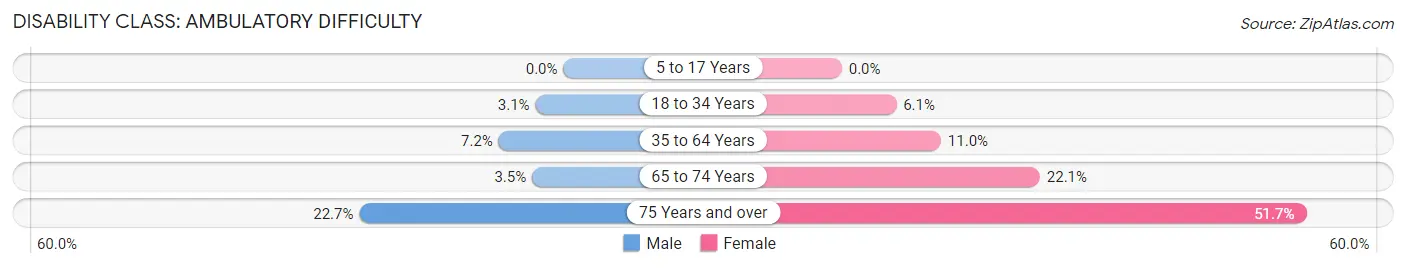
| Age Bracket | Male | Female |
| 5 to 17 Years | 0 (0.0%) | 0 (0.0%) |
| 18 to 34 Years | 5 (3.1%) | 6 (6.1%) |
| 35 to 64 Years | 25 (7.2%) | 37 (11.0%) |
| 65 to 74 Years | 3 (3.5%) | 15 (22.1%) |
| 75 Years and over | 15 (22.7%) | 45 (51.7%) |
Disability Class: Self-Care Difficulty
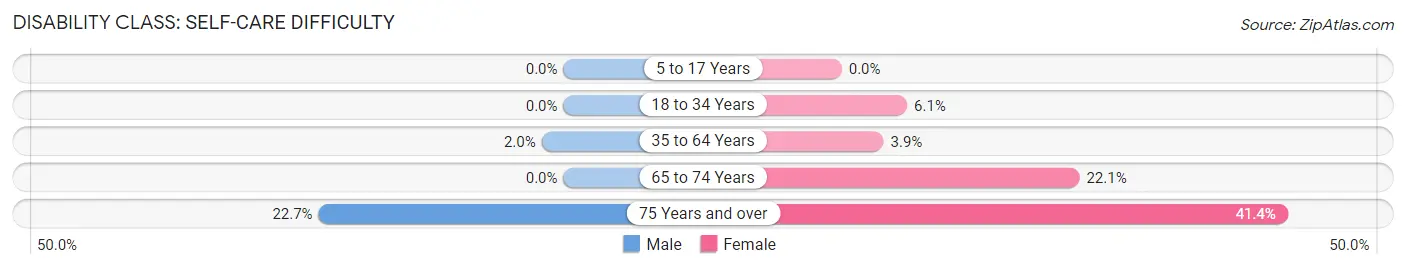
| Age Bracket | Male | Female |
| 5 to 17 Years | 0 (0.0%) | 0 (0.0%) |
| 18 to 34 Years | 0 (0.0%) | 6 (6.1%) |
| 35 to 64 Years | 7 (2.0%) | 13 (3.9%) |
| 65 to 74 Years | 0 (0.0%) | 15 (22.1%) |
| 75 Years and over | 15 (22.7%) | 36 (41.4%) |
Technology Access in John Day
Computing Device Access in John Day
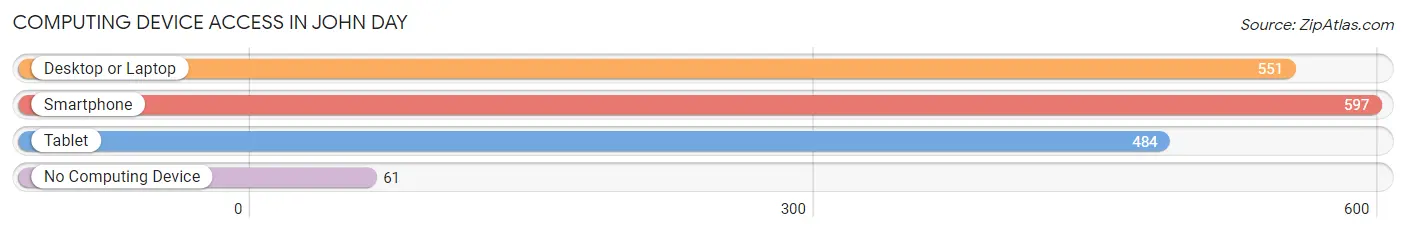
| Device Type | # Households | % Households |
| Desktop or Laptop | 551 | 77.0% |
| Smartphone | 597 | 83.4% |
| Tablet | 484 | 67.6% |
| No Computing Device | 61 | 8.5% |
| Total | 716 | 100.0% |
Internet Access in John Day
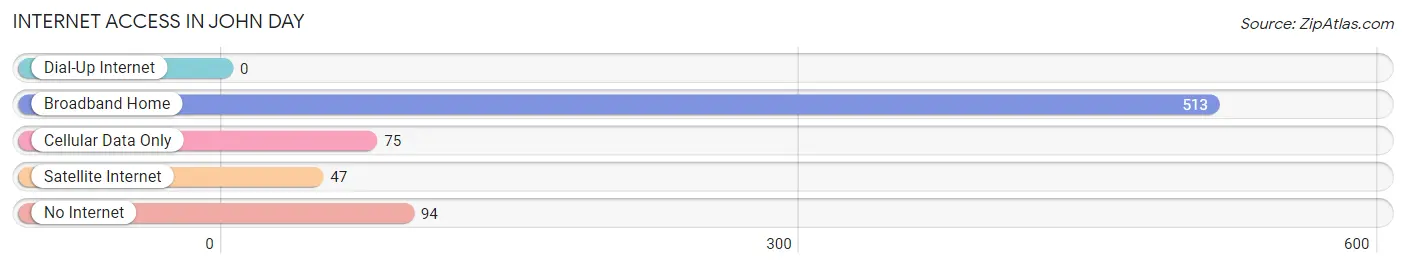
| Internet Type | # Households | % Households |
| Dial-Up Internet | 0 | 0.0% |
| Broadband Home | 513 | 71.7% |
| Cellular Data Only | 75 | 10.5% |
| Satellite Internet | 47 | 6.6% |
| No Internet | 94 | 13.1% |
| Total | 716 | 100.0% |
John Day Summary
John Day is a city located in Grant County, Oregon, United States. It is the county seat of Grant County and is located in the Blue Mountains of Eastern Oregon. The population was 1,731 at the 2010 census.
History
John Day was founded in 1864 by a group of miners who were searching for gold in the area. The town was named after John Day, a prospector who had been killed by Native Americans in the area. The town quickly grew and by 1868, it had become the county seat of Grant County.
In the late 19th century, John Day was a bustling center of commerce and industry. The town was home to several sawmills, a flour mill, a woolen mill, and a brickyard. The town also had a number of saloons, hotels, and other businesses.
In the early 20th century, John Day was a major stop on the Oregon Trail. The town was also home to a number of ranches and farms, and it was a popular destination for tourists.
Geography
John Day is located in the Blue Mountains of Eastern Oregon. The city is situated at an elevation of 3,845 feet (1,172 m). The city is located at the confluence of the John Day River and the North Fork John Day River.
The city is surrounded by the Malheur National Forest and is located near the John Day Fossil Beds National Monument. The city is also located near the Strawberry Mountain Wilderness and the Monument Rock Wilderness.
Economy
John Day’s economy is largely based on agriculture and tourism. The city is home to several ranches and farms, and it is a popular destination for tourists. The city is also home to a number of businesses, including restaurants, hotels, and retail stores.
Demographics
As of the 2010 census, there were 1,731 people, 745 households, and 463 families residing in the city. The population density was 1,092.3 people per square mile (422.2/km2). There were 845 housing units at an average density of 537.3 per square mile (207.6/km2). The racial makeup of the city was 94.2% White, 0.2% African American, 1.2% Native American, 0.2% Asian, 0.1% Pacific Islander, 0.7% from other races, and 3.0% from two or more races. Hispanic or Latino of any race were 2.7% of the population.
There were 745 households, out of which 24.3% had children under the age of 18 living with them, 48.2% were married couples living together, 9.7% had a female householder with no husband present, and 37.7% were non-families. 32.7% of all households were made up of individuals, and 16.2% had someone living alone who was 65 years of age or older. The average household size was 2.26 and the average family size was 2.86.
In the city, the population was spread out, with 22.7% under the age of 18, 6.7% from 18 to 24, 22.2% from 25 to 44, 27.2% from 45 to 64, and 21.2% who were 65 years of age or older. The median age was 44 years. For every 100 females, there were 92.2 males. For every 100 females age 18 and over, there were 88.3 males.
The median income for a household in the city was $30,938, and the median income for a family was $37,500. Males had a median income of $30,000 versus $20,000 for females. The per capita income for the city was $17,845. About 11.2% of families and 14.7% of the population were below the poverty line, including 19.2% of those under age 18 and 8.2% of those age 65 or over.
Common Questions
What is Per Capita Income in John Day?
Per Capita income in John Day is $31,329.
What is the Median Family Income in John Day?
Median Family Income in John Day is $82,604.
What is the Median Household income in John Day?
Median Household Income in John Day is $67,083.
What is Income or Wage Gap in John Day?
Income or Wage Gap in John Day is 0.6%.
Women in John Day earn 99.4 cents for every dollar earned by a man.
What is Inequality or Gini Index in John Day?
Inequality or Gini Index in John Day is 0.40.
What is the Total Population of John Day?
Total Population of John Day is 1,561.
What is the Total Male Population of John Day?
Total Male Population of John Day is 795.
What is the Total Female Population of John Day?
Total Female Population of John Day is 766.
What is the Ratio of Males per 100 Females in John Day?
There are 103.79 Males per 100 Females in John Day.
What is the Ratio of Females per 100 Males in John Day?
There are 96.35 Females per 100 Males in John Day.
What is the Median Population Age in John Day?
Median Population Age in John Day is 43.9 Years.
What is the Average Family Size in John Day
Average Family Size in John Day is 2.5 People.
What is the Average Household Size in John Day
Average Household Size in John Day is 2.1 People.
How Large is the Labor Force in John Day?
There are 767 People in the Labor Forcein in John Day.
What is the Percentage of People in the Labor Force in John Day?
57.9% of People are in the Labor Force in John Day.
What is the Unemployment Rate in John Day?
Unemployment Rate in John Day is 8.2%.