Barbourville, KY Map & Demographics
Barbourville Map
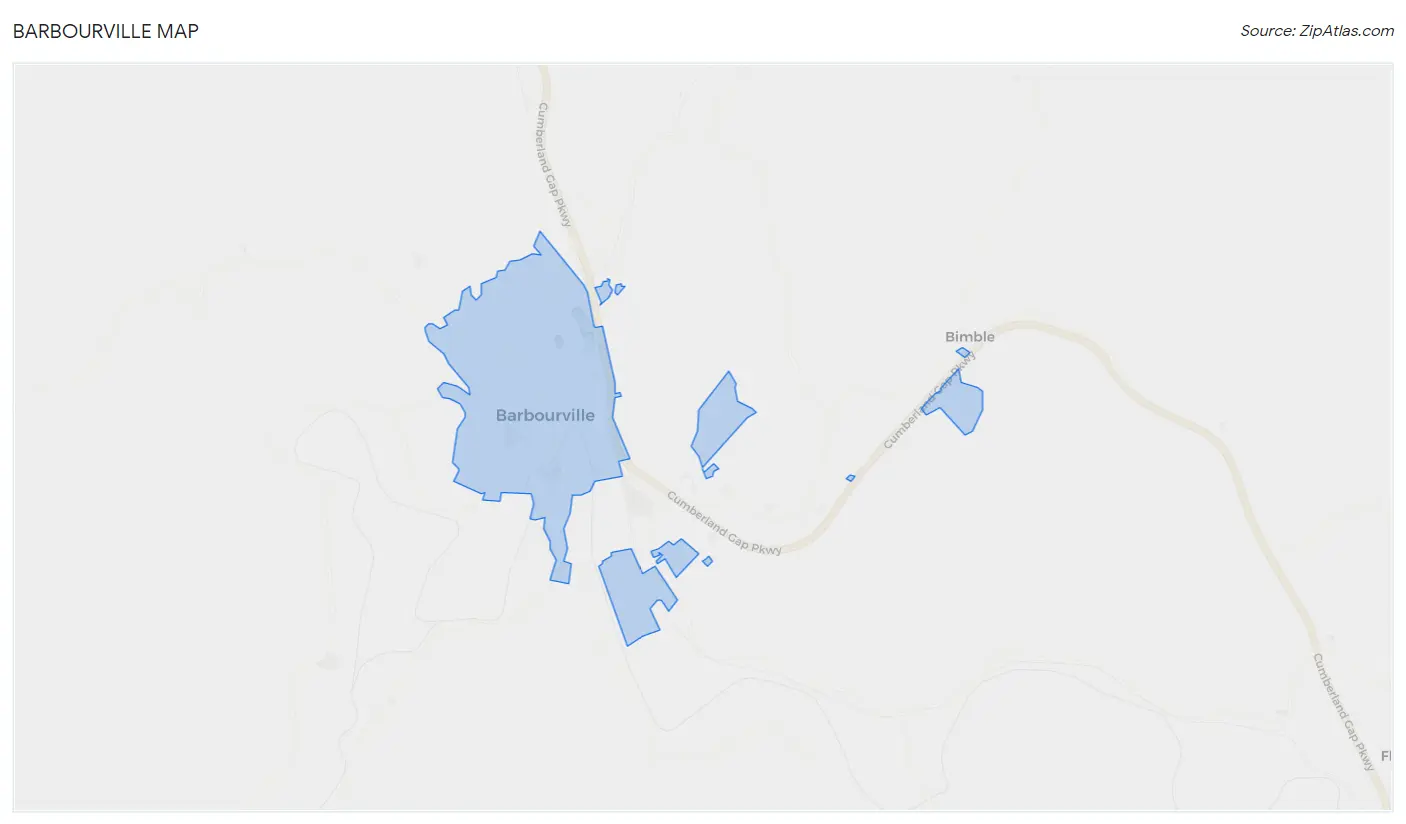
Barbourville Overview
$27,407
PER CAPITA INCOME
$21,287
AVG HOUSEHOLD INCOME
47.5%
WAGE / INCOME GAP [ % ]
52.5¢/ $1
WAGE / INCOME GAP [ $ ]
0.54
INEQUALITY / GINI INDEX
3,195
TOTAL POPULATION
1,155
MALE POPULATION
2,040
FEMALE POPULATION
56.62
MALES / 100 FEMALES
176.62
FEMALES / 100 MALES
40.8
MEDIAN AGE
3.2
AVG FAMILY SIZE
1.9
AVG HOUSEHOLD SIZE
1,395
LABOR FORCE [ PEOPLE ]
46.8%
PERCENT IN LABOR FORCE
23.7%
UNEMPLOYMENT RATE
Barbourville Zip Codes
Barbourville Area Codes
Income in Barbourville
Income Overview in Barbourville
| Characteristic | Number | Measure |
| Per Capita Income | 3,195 | $27,407 |
| Median Family Income | 472 | $0 |
| Mean Family Income | 472 | $61,087 |
| Median Household Income | 1,414 | $21,287 |
| Mean Household Income | 1,414 | $57,640 |
| Income Deficit | 472 | $0 |
| Wage / Income Gap (%) | 3,195 | 47.52% |
| Wage / Income Gap ($) | 3,195 | 52.48¢ per $1 |
| Gini / Inequality Index | 3,195 | 0.54 |
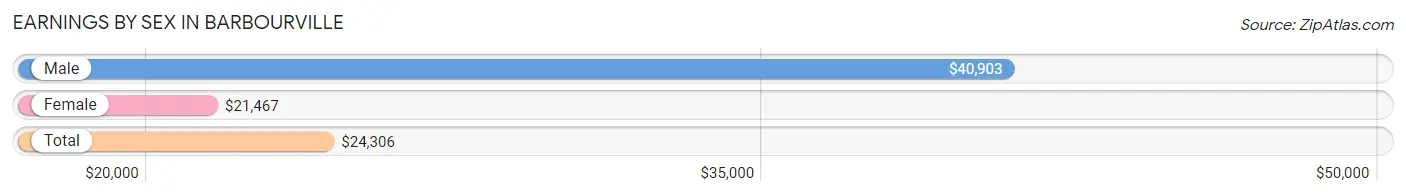
Earnings by Sex in Barbourville
Average Earnings in Barbourville are $24,306, $40,903 for men and $21,467 for women, a difference of 47.5%.
| Sex | Number | Average Earnings |
| Male | 545 (36.5%) | $40,903 |
| Female | 948 (63.5%) | $21,467 |
| Total | 1,493 (100.0%) | $24,306 |
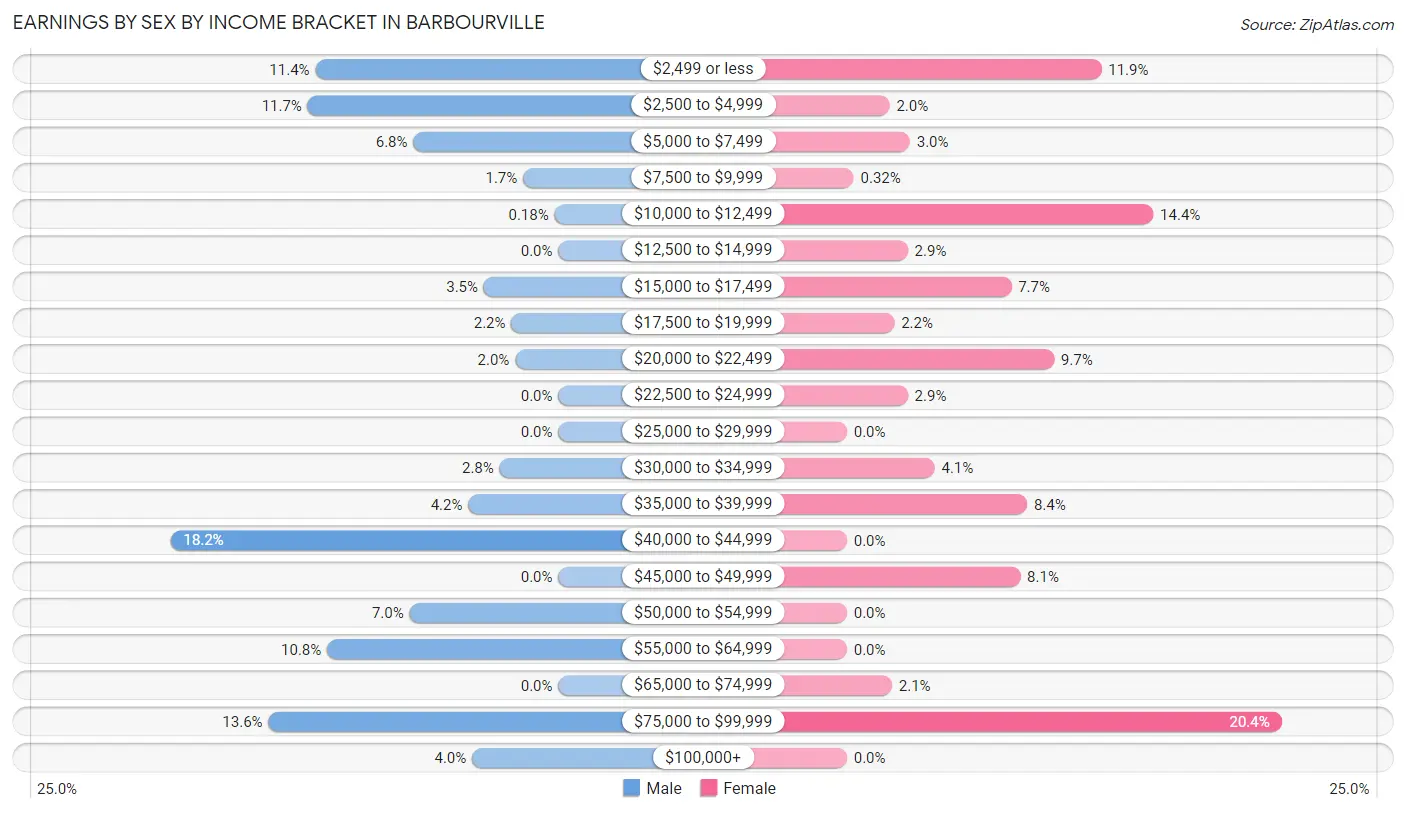
Earnings by Sex by Income Bracket in Barbourville
The most common earnings brackets in Barbourville are $40,000 to $44,999 for men (99 | 18.2%) and $75,000 to $99,999 for women (193 | 20.4%).
| Income | Male | Female |
| $2,499 or less | 62 (11.4%) | 113 (11.9%) |
| $2,500 to $4,999 | 64 (11.7%) | 19 (2.0%) |
| $5,000 to $7,499 | 37 (6.8%) | 28 (2.9%) |
| $7,500 to $9,999 | 9 (1.7%) | 3 (0.3%) |
| $10,000 to $12,499 | 1 (0.2%) | 136 (14.3%) |
| $12,500 to $14,999 | 0 (0.0%) | 27 (2.9%) |
| $15,000 to $17,499 | 19 (3.5%) | 73 (7.7%) |
| $17,500 to $19,999 | 12 (2.2%) | 21 (2.2%) |
| $20,000 to $22,499 | 11 (2.0%) | 92 (9.7%) |
| $22,500 to $24,999 | 0 (0.0%) | 27 (2.9%) |
| $25,000 to $29,999 | 0 (0.0%) | 0 (0.0%) |
| $30,000 to $34,999 | 15 (2.8%) | 39 (4.1%) |
| $35,000 to $39,999 | 23 (4.2%) | 80 (8.4%) |
| $40,000 to $44,999 | 99 (18.2%) | 0 (0.0%) |
| $45,000 to $49,999 | 0 (0.0%) | 77 (8.1%) |
| $50,000 to $54,999 | 38 (7.0%) | 0 (0.0%) |
| $55,000 to $64,999 | 59 (10.8%) | 0 (0.0%) |
| $65,000 to $74,999 | 0 (0.0%) | 20 (2.1%) |
| $75,000 to $99,999 | 74 (13.6%) | 193 (20.4%) |
| $100,000+ | 22 (4.0%) | 0 (0.0%) |
| Total | 545 (100.0%) | 948 (100.0%) |
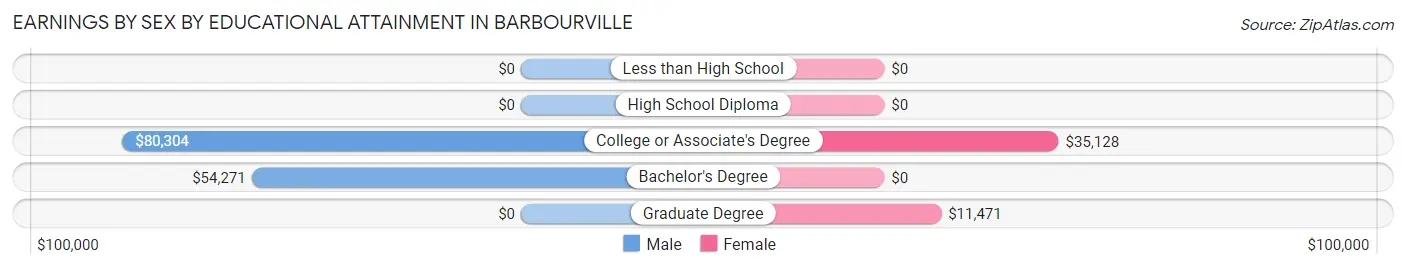
Earnings by Sex by Educational Attainment in Barbourville
Average earnings in Barbourville are $44,111 for men and $35,281 for women, a difference of 20.0%. Men with an educational attainment of college or associate's degree enjoy the highest average annual earnings of $80,304, while those with bachelor's degree education earn the least with $54,271. Women with an educational attainment of college or associate's degree earn the most with the average annual earnings of $35,128, while those with graduate degree education have the smallest earnings of $11,471.
| Educational Attainment | Male Income | Female Income |
| Less than High School | - | - |
| High School Diploma | - | - |
| College or Associate's Degree | $80,304 | $35,128 |
| Bachelor's Degree | $54,271 | $0 |
| Graduate Degree | - | - |
| Total | $44,111 | $35,281 |
Family Income in Barbourville
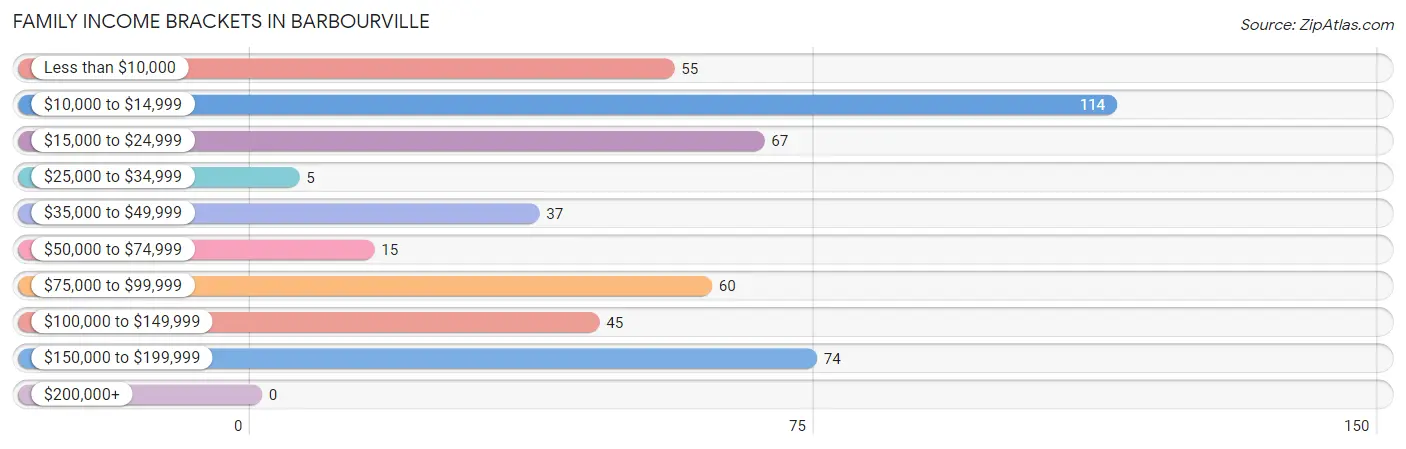
Family Income Brackets in Barbourville
According to the Barbourville family income data, there are 114 families falling into the $10,000 to $14,999 income range, which is the most common income bracket and makes up 24.1% of all families.
| Income Bracket | # Families | % Families |
| Less than $10,000 | 55 | 11.7% |
| $10,000 to $14,999 | 114 | 24.2% |
| $15,000 to $24,999 | 67 | 14.2% |
| $25,000 to $34,999 | 5 | 1.1% |
| $35,000 to $49,999 | 37 | 7.8% |
| $50,000 to $74,999 | 15 | 3.2% |
| $75,000 to $99,999 | 60 | 12.7% |
| $100,000 to $149,999 | 45 | 9.5% |
| $150,000 to $199,999 | 74 | 15.7% |
| $200,000+ | 0 | 0.0% |
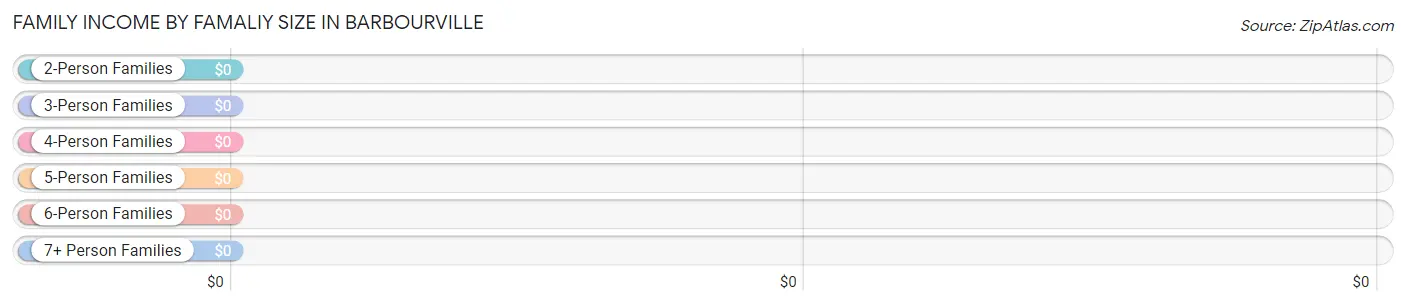
Family Income by Famaliy Size in Barbourville
| Income Bracket | # Families | Median Income |
| 2-Person Families | 281 (59.5%) | $0 |
| 3-Person Families | 119 (25.2%) | $0 |
| 4-Person Families | 9 (1.9%) | $0 |
| 5-Person Families | 63 (13.4%) | $0 |
| 6-Person Families | 0 (0.0%) | $0 |
| 7+ Person Families | 0 (0.0%) | $0 |
| Total | 472 (100.0%) | $0 |
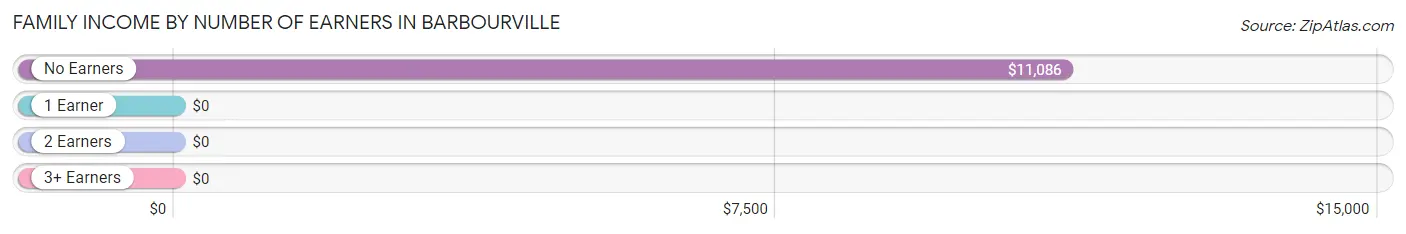
Family Income by Number of Earners in Barbourville
| Number of Earners | # Families | Median Income |
| No Earners | 209 (44.3%) | $11,086 |
| 1 Earner | 15 (3.2%) | $0 |
| 2 Earners | 129 (27.3%) | $0 |
| 3+ Earners | 119 (25.2%) | $0 |
| Total | 472 (100.0%) | $0 |
Household Income in Barbourville
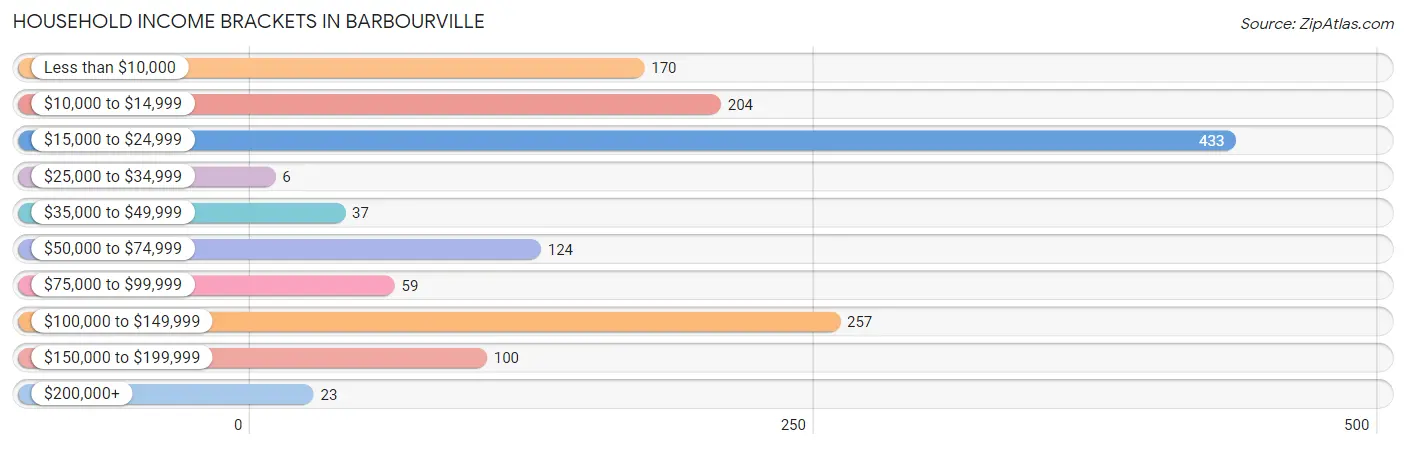
Household Income Brackets in Barbourville
With 433 households falling in the category, the $15,000 to $24,999 income range is the most frequent in Barbourville, accounting for 30.6% of all households. In contrast, only 6 households (0.4%) fall into the $25,000 to $34,999 income bracket, making it the least populous group.
| Income Bracket | # Households | % Households |
| Less than $10,000 | 170 | 12.0% |
| $10,000 to $14,999 | 204 | 14.4% |
| $15,000 to $24,999 | 433 | 30.6% |
| $25,000 to $34,999 | 6 | 0.4% |
| $35,000 to $49,999 | 37 | 2.6% |
| $50,000 to $74,999 | 124 | 8.8% |
| $75,000 to $99,999 | 59 | 4.2% |
| $100,000 to $149,999 | 257 | 18.2% |
| $150,000 to $199,999 | 100 | 7.1% |
| $200,000+ | 23 | 1.6% |
Household Income by Householder Age in Barbourville
The median household income in Barbourville is $21,287, with the highest median household income of $75,161 found in the 15 to 24 years age bracket for the primary householder. A total of 58 households (4.1%) fall into this category. Meanwhile, the 45 to 64 years age bracket for the primary householder has the lowest median household income of $0, with 457 households (32.3%) in this group.
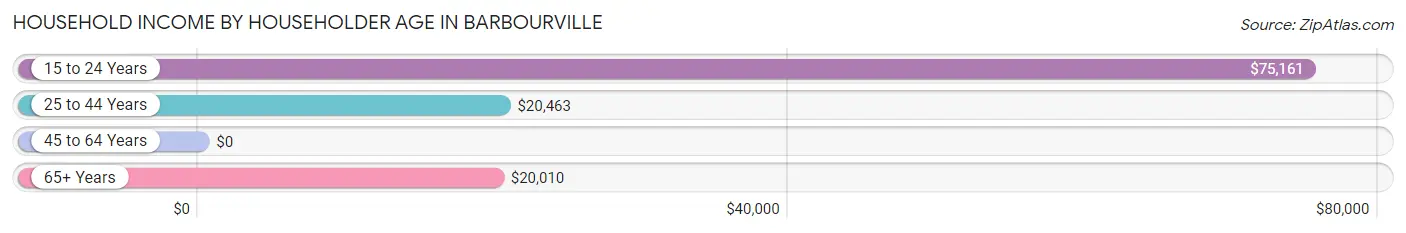
| Income Bracket | # Households | Median Income |
| 15 to 24 Years | 58 (4.1%) | $75,161 |
| 25 to 44 Years | 366 (25.9%) | $20,463 |
| 45 to 64 Years | 457 (32.3%) | $0 |
| 65+ Years | 533 (37.7%) | $20,010 |
| Total | 1,414 (100.0%) | $21,287 |
Poverty in Barbourville
Income Below Poverty by Sex and Age in Barbourville
With 47.0% poverty level for males and 38.7% for females among the residents of Barbourville, under 5 year old males and 5 year old females are the most vulnerable to poverty, with 25 males (100.0%) and 20 females (100.0%) in their respective age groups living below the poverty level.
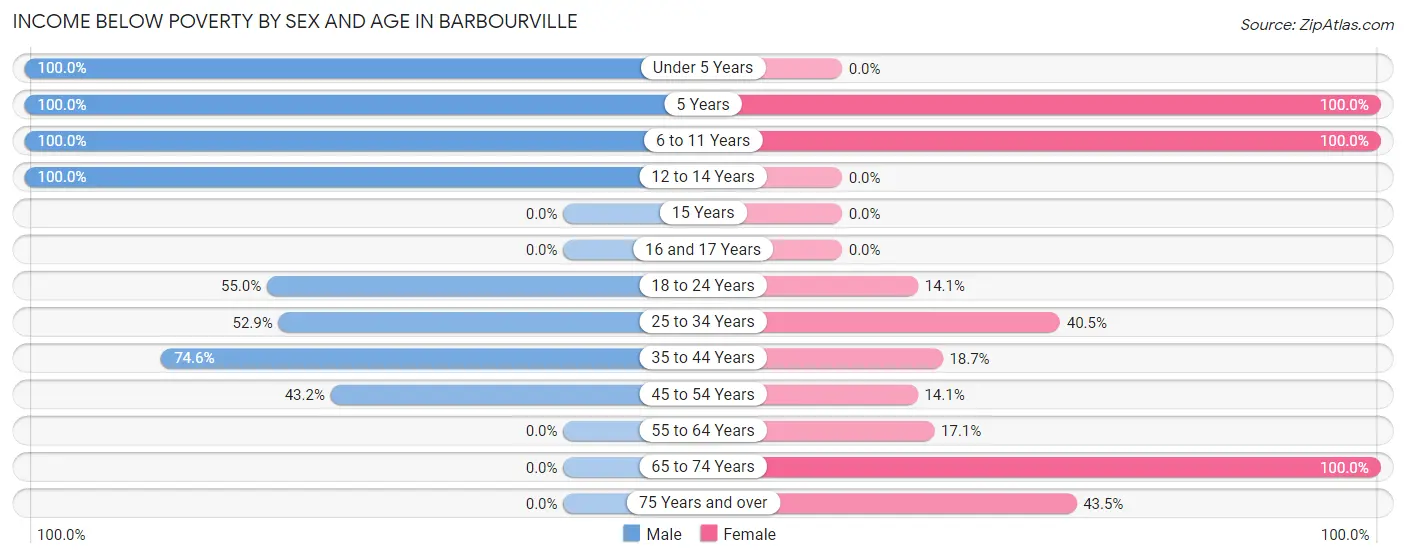
| Age Bracket | Male | Female |
| Under 5 Years | 25 (100.0%) | 0 (0.0%) |
| 5 Years | 10 (100.0%) | 20 (100.0%) |
| 6 to 11 Years | 20 (100.0%) | 130 (100.0%) |
| 12 to 14 Years | 9 (100.0%) | 0 (0.0%) |
| 15 Years | 0 (0.0%) | 0 (0.0%) |
| 16 and 17 Years | 0 (0.0%) | 0 (0.0%) |
| 18 to 24 Years | 33 (55.0%) | 35 (14.1%) |
| 25 to 34 Years | 148 (52.9%) | 155 (40.5%) |
| 35 to 44 Years | 100 (74.6%) | 17 (18.7%) |
| 45 to 54 Years | 57 (43.2%) | 34 (14.1%) |
| 55 to 64 Years | 0 (0.0%) | 37 (17.1%) |
| 65 to 74 Years | 0 (0.0%) | 112 (100.0%) |
| 75 Years and over | 0 (0.0%) | 161 (43.5%) |
| Total | 402 (47.0%) | 701 (38.7%) |
Income Above Poverty by Sex and Age in Barbourville
According to the poverty statistics in Barbourville, males aged 55 to 64 years and females aged 45 to 54 years are the age groups that are most secure financially, with 100.0% of males and 86.0% of females in these age groups living above the poverty line.
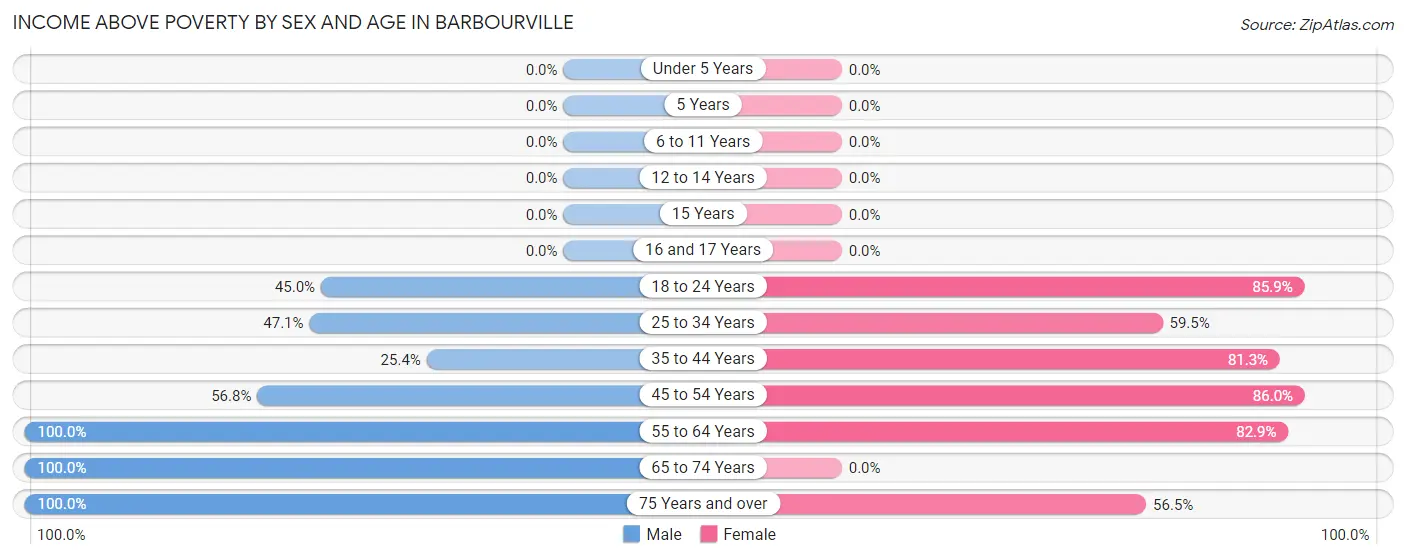
| Age Bracket | Male | Female |
| Under 5 Years | 0 (0.0%) | 0 (0.0%) |
| 5 Years | 0 (0.0%) | 0 (0.0%) |
| 6 to 11 Years | 0 (0.0%) | 0 (0.0%) |
| 12 to 14 Years | 0 (0.0%) | 0 (0.0%) |
| 15 Years | 0 (0.0%) | 0 (0.0%) |
| 16 and 17 Years | 0 (0.0%) | 0 (0.0%) |
| 18 to 24 Years | 27 (45.0%) | 213 (85.9%) |
| 25 to 34 Years | 132 (47.1%) | 228 (59.5%) |
| 35 to 44 Years | 34 (25.4%) | 74 (81.3%) |
| 45 to 54 Years | 75 (56.8%) | 208 (86.0%) |
| 55 to 64 Years | 42 (100.0%) | 179 (82.9%) |
| 65 to 74 Years | 87 (100.0%) | 0 (0.0%) |
| 75 Years and over | 57 (100.0%) | 209 (56.5%) |
| Total | 454 (53.0%) | 1,111 (61.3%) |
Income Below Poverty Among Married-Couple Families in Barbourville
The poverty statistics for married-couple families in Barbourville show that 24.6% or 77 of the total 313 families live below the poverty line. Families with 3 or 4 children have the highest poverty rate of 100.0%, comprising of 18 families. On the other hand, families with no children have the lowest poverty rate of 20.0%, which includes 59 families.
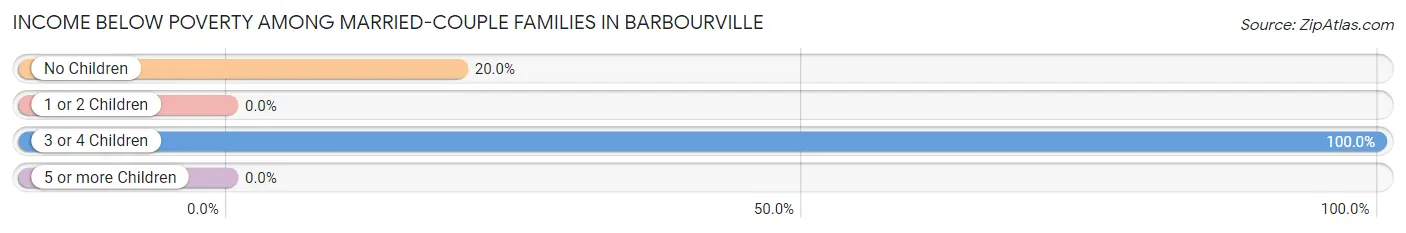
| Children | Above Poverty | Below Poverty |
| No Children | 236 (80.0%) | 59 (20.0%) |
| 1 or 2 Children | 0 (0.0%) | 0 (0.0%) |
| 3 or 4 Children | 0 (0.0%) | 18 (100.0%) |
| 5 or more Children | 0 (0.0%) | 0 (0.0%) |
| Total | 236 (75.4%) | 77 (24.6%) |
Income Below Poverty Among Single-Parent Households in Barbourville
According to the poverty data in Barbourville, 100.0% or 18 single-father households and 100.0% or 141 single-mother households are living below the poverty line. Among single-father households, those with no children have the highest poverty rate, with 18 households (100.0%) experiencing poverty. Likewise, among single-mother households, those with no children have the highest poverty rate, with 18 households (100.0%) falling below the poverty line.
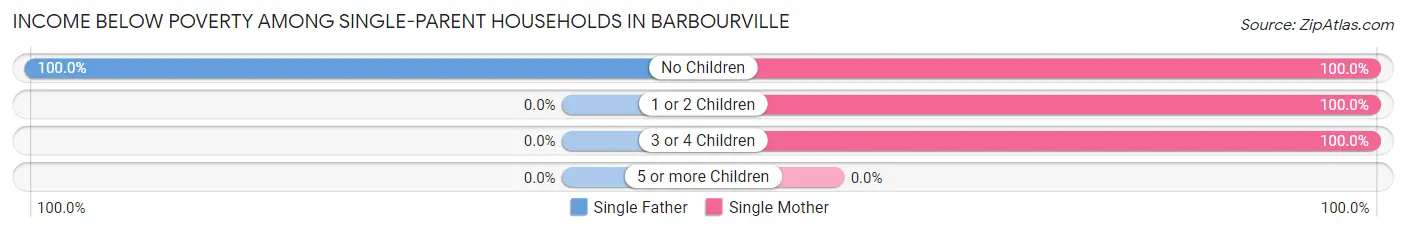
| Children | Single Father | Single Mother |
| No Children | 18 (100.0%) | 18 (100.0%) |
| 1 or 2 Children | 0 (0.0%) | 114 (100.0%) |
| 3 or 4 Children | 0 (0.0%) | 9 (100.0%) |
| 5 or more Children | 0 (0.0%) | 0 (0.0%) |
| Total | 18 (100.0%) | 141 (100.0%) |
Income Below Poverty Among Married-Couple vs Single-Parent Households in Barbourville
The poverty data for Barbourville shows that 77 of the married-couple family households (24.6%) and 159 of the single-parent households (100.0%) are living below the poverty level. Within the married-couple family households, those with 3 or 4 children have the highest poverty rate, with 18 households (100.0%) falling below the poverty line. Among the single-parent households, those with no children have the highest poverty rate, with 36 household (100.0%) living below poverty.
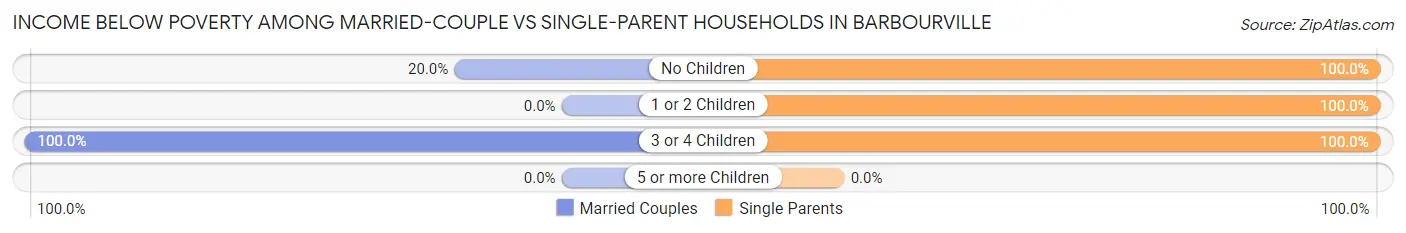
| Children | Married-Couple Families | Single-Parent Households |
| No Children | 59 (20.0%) | 36 (100.0%) |
| 1 or 2 Children | 0 (0.0%) | 114 (100.0%) |
| 3 or 4 Children | 18 (100.0%) | 9 (100.0%) |
| 5 or more Children | 0 (0.0%) | 0 (0.0%) |
| Total | 77 (24.6%) | 159 (100.0%) |
Race in Barbourville
The most populous races in Barbourville are White / Caucasian (3,055 | 95.6%), Black / African American (95 | 3.0%), and Hispanic or Latino (45 | 1.4%).
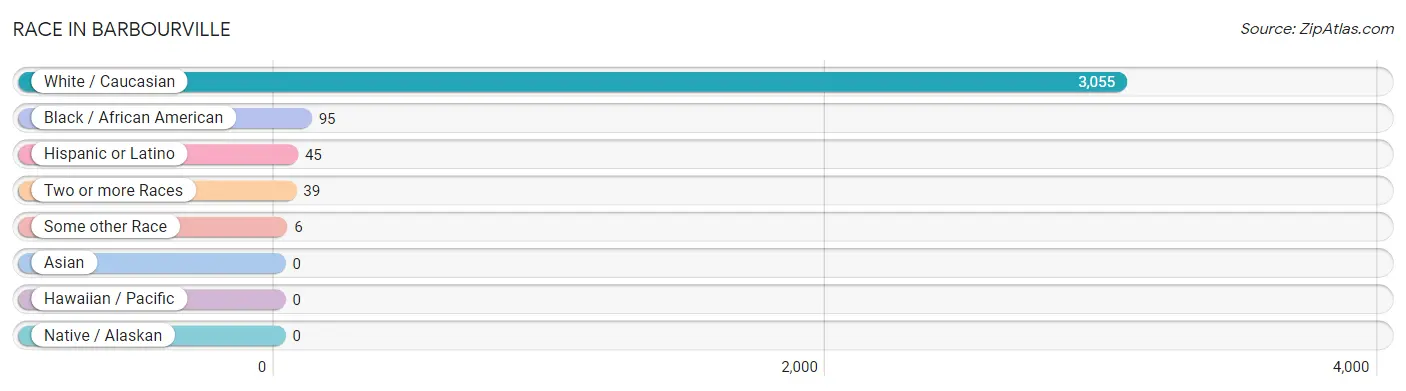
| Race | # Population | % Population |
| Asian | 0 | 0.0% |
| Black / African American | 95 | 3.0% |
| Hawaiian / Pacific | 0 | 0.0% |
| Hispanic or Latino | 45 | 1.4% |
| Native / Alaskan | 0 | 0.0% |
| White / Caucasian | 3,055 | 95.6% |
| Two or more Races | 39 | 1.2% |
| Some other Race | 6 | 0.2% |
| Total | 3,195 | 100.0% |
Ancestry in Barbourville
The most populous ancestries reported in Barbourville are Irish (696 | 21.8%), English (268 | 8.4%), German (204 | 6.4%), American (111 | 3.5%), and Eastern European (77 | 2.4%), together accounting for 42.4% of all Barbourville residents.
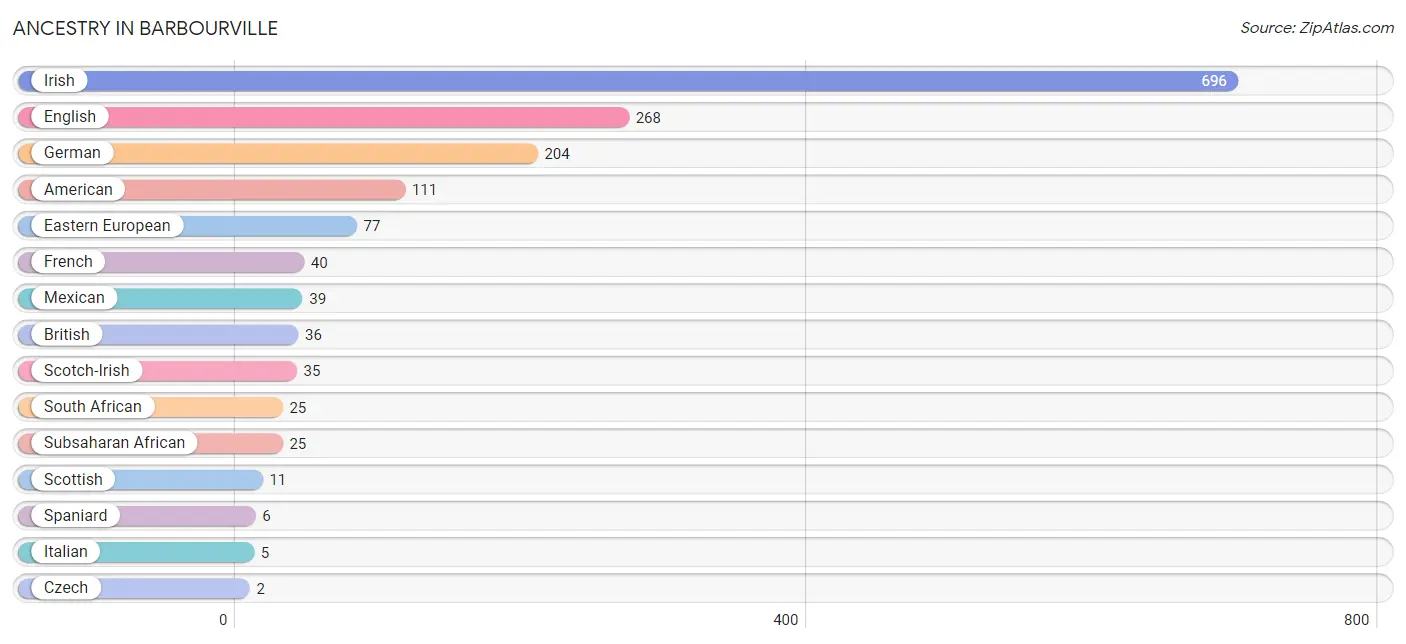
| Ancestry | # Population | % Population |
| American | 111 | 3.5% |
| British | 36 | 1.1% |
| Czech | 2 | 0.1% |
| Dutch | 1 | 0.0% |
| Eastern European | 77 | 2.4% |
| English | 268 | 8.4% |
| French | 40 | 1.3% |
| German | 204 | 6.4% |
| Irish | 696 | 21.8% |
| Italian | 5 | 0.2% |
| Mexican | 39 | 1.2% |
| Scotch-Irish | 35 | 1.1% |
| Scottish | 11 | 0.3% |
| South African | 25 | 0.8% |
| Spaniard | 6 | 0.2% |
| Subsaharan African | 25 | 0.8% | View All 16 Rows |
Immigrants in Barbourville
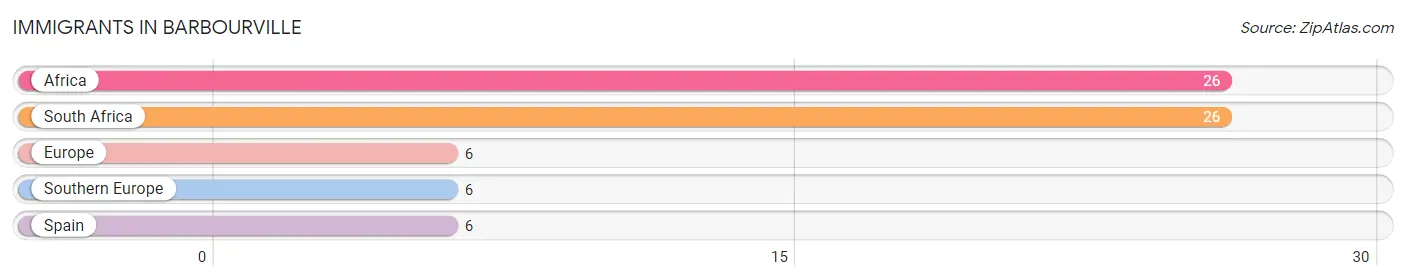
The most numerous immigrant groups reported in Barbourville came from Africa (26 | 0.8%), South Africa (26 | 0.8%), Europe (6 | 0.2%), Southern Europe (6 | 0.2%), and Spain (6 | 0.2%), together accounting for 2.2% of all Barbourville residents.
| Immigration Origin | # Population | % Population |
| Africa | 26 | 0.8% |
| Europe | 6 | 0.2% |
| South Africa | 26 | 0.8% |
| Southern Europe | 6 | 0.2% |
| Spain | 6 | 0.2% | View All 5 Rows |
Sex and Age in Barbourville
Sex and Age in Barbourville
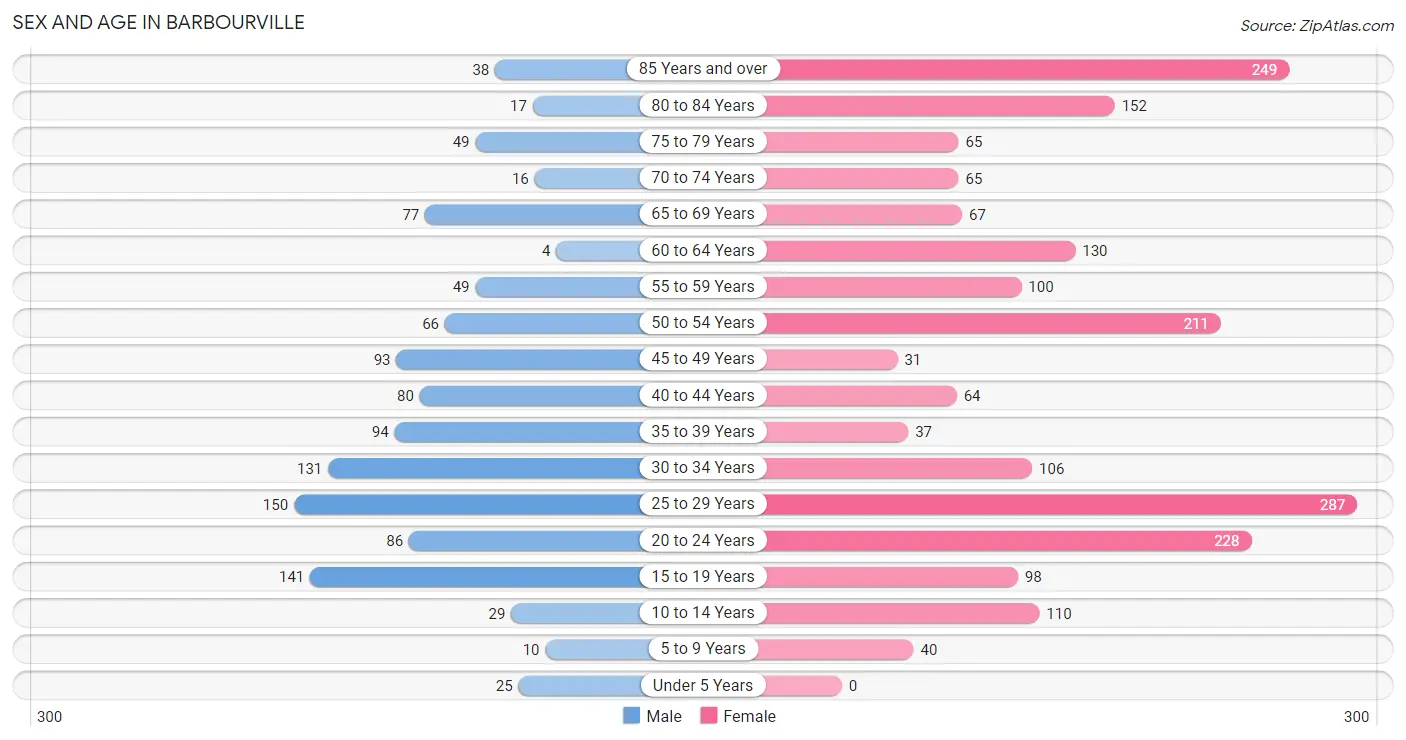
The most populous age groups in Barbourville are 25 to 29 Years (150 | 13.0%) for men and 25 to 29 Years (287 | 14.1%) for women.
| Age Bracket | Male | Female |
| Under 5 Years | 25 (2.2%) | 0 (0.0%) |
| 5 to 9 Years | 10 (0.9%) | 40 (2.0%) |
| 10 to 14 Years | 29 (2.5%) | 110 (5.4%) |
| 15 to 19 Years | 141 (12.2%) | 98 (4.8%) |
| 20 to 24 Years | 86 (7.4%) | 228 (11.2%) |
| 25 to 29 Years | 150 (13.0%) | 287 (14.1%) |
| 30 to 34 Years | 131 (11.3%) | 106 (5.2%) |
| 35 to 39 Years | 94 (8.1%) | 37 (1.8%) |
| 40 to 44 Years | 80 (6.9%) | 64 (3.1%) |
| 45 to 49 Years | 93 (8.1%) | 31 (1.5%) |
| 50 to 54 Years | 66 (5.7%) | 211 (10.3%) |
| 55 to 59 Years | 49 (4.2%) | 100 (4.9%) |
| 60 to 64 Years | 4 (0.4%) | 130 (6.4%) |
| 65 to 69 Years | 77 (6.7%) | 67 (3.3%) |
| 70 to 74 Years | 16 (1.4%) | 65 (3.2%) |
| 75 to 79 Years | 49 (4.2%) | 65 (3.2%) |
| 80 to 84 Years | 17 (1.5%) | 152 (7.4%) |
| 85 Years and over | 38 (3.3%) | 249 (12.2%) |
| Total | 1,155 (100.0%) | 2,040 (100.0%) |
Families and Households in Barbourville
Median Family Size in Barbourville
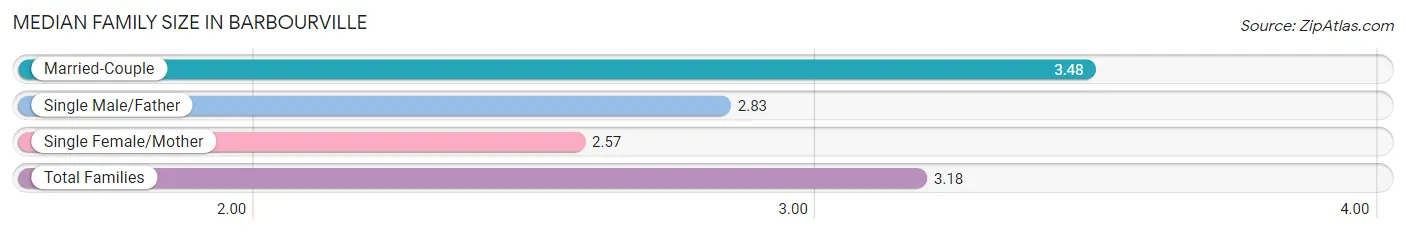
The median family size in Barbourville is 3.18 persons per family, with married-couple families (313 | 66.3%) accounting for the largest median family size of 3.48 persons per family. On the other hand, single female/mother families (141 | 29.9%) represent the smallest median family size with 2.57 persons per family.
| Family Type | # Families | Family Size |
| Married-Couple | 313 (66.3%) | 3.48 |
| Single Male/Father | 18 (3.8%) | 2.83 |
| Single Female/Mother | 141 (29.9%) | 2.57 |
| Total Families | 472 (100.0%) | 3.18 |
Median Household Size in Barbourville
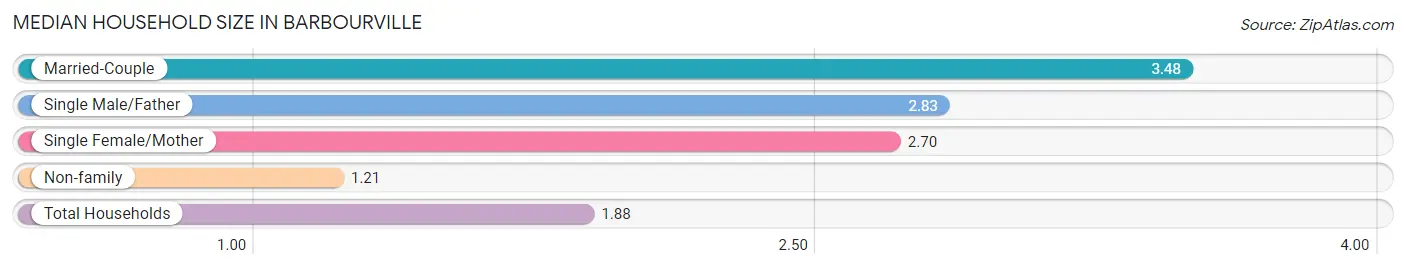
The median household size in Barbourville is 1.88 persons per household, with married-couple households (313 | 22.1%) accounting for the largest median household size of 3.48 persons per household. non-family households (942 | 66.6%) represent the smallest median household size with 1.21 persons per household.
| Household Type | # Households | Household Size |
| Married-Couple | 313 (22.1%) | 3.48 |
| Single Male/Father | 18 (1.3%) | 2.83 |
| Single Female/Mother | 141 (10.0%) | 2.70 |
| Non-family | 942 (66.6%) | 1.21 |
| Total Households | 1,414 (100.0%) | 1.88 |
Household Size by Marriage Status in Barbourville
Out of a total of 1,414 households in Barbourville, 472 (33.4%) are family households, while 942 (66.6%) are nonfamily households. The most numerous type of family households are 2-person households, comprising 281, and the most common type of nonfamily households are 1-person households, comprising 799.
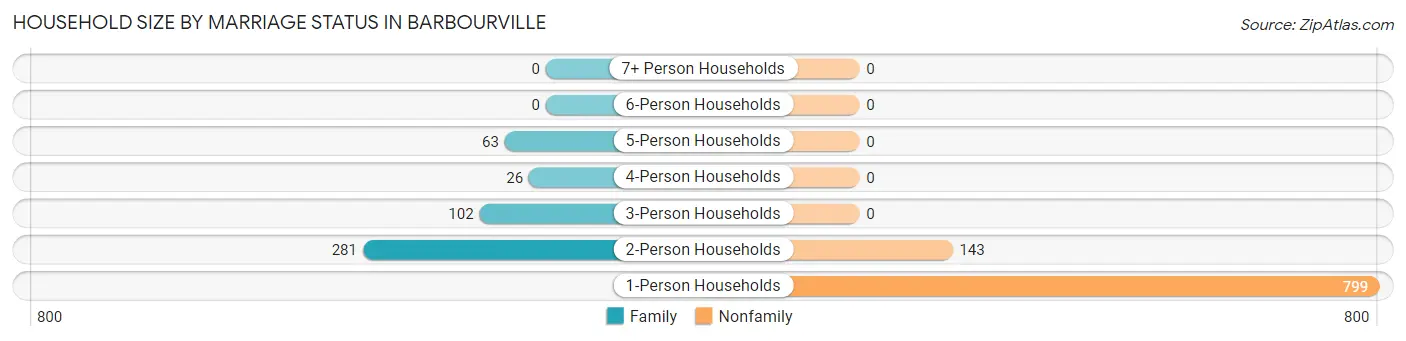
| Household Size | Family Households | Nonfamily Households |
| 1-Person Households | - | 799 (56.5%) |
| 2-Person Households | 281 (19.9%) | 143 (10.1%) |
| 3-Person Households | 102 (7.2%) | 0 (0.0%) |
| 4-Person Households | 26 (1.8%) | 0 (0.0%) |
| 5-Person Households | 63 (4.5%) | 0 (0.0%) |
| 6-Person Households | 0 (0.0%) | 0 (0.0%) |
| 7+ Person Households | 0 (0.0%) | 0 (0.0%) |
| Total | 472 (33.4%) | 942 (66.6%) |
Female Fertility in Barbourville
Fertility by Age in Barbourville
Average fertility rate in Barbourville is 24.0 births per 1,000 women. Women in the age bracket of 20 to 34 years have the highest fertility rate with 29.0 births per 1,000 women. Women in the age bracket of 20 to 34 years acount for 90.0% of all women with births.
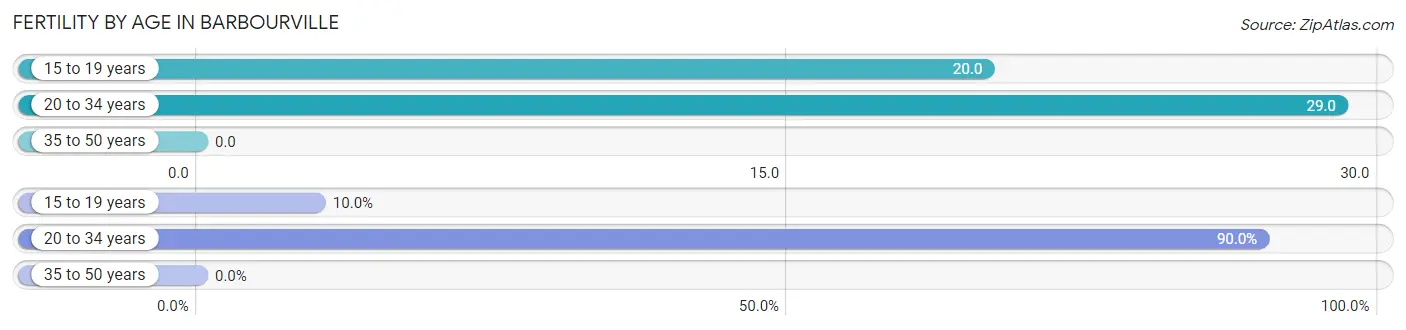
| Age Bracket | Women with Births | Births / 1,000 Women |
| 15 to 19 years | 2 (10.0%) | 20.0 |
| 20 to 34 years | 18 (90.0%) | 29.0 |
| 35 to 50 years | 0 (0.0%) | 0.0 |
| Total | 20 (100.0%) | 24.0 |
Fertility by Age by Marriage Status in Barbourville
90.0% of women with births (20) in Barbourville are married. The highest percentage of unmarried women with births falls into 15 to 19 years age bracket with 100.0% of them unmarried at the time of birth, while the lowest percentage of unmarried women with births belong to 20 to 34 years age bracket with 0.0% of them unmarried.
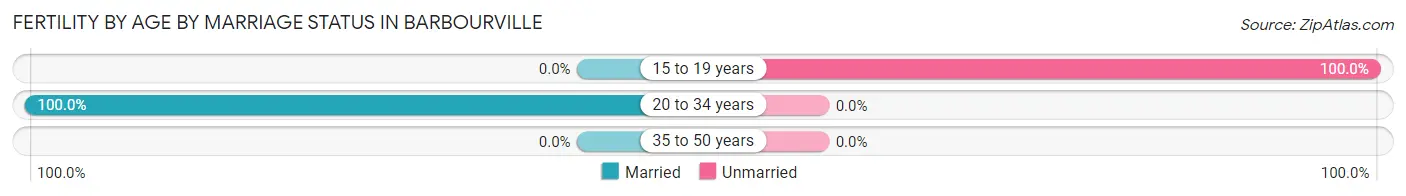
| Age Bracket | Married | Unmarried |
| 15 to 19 years | 0 (0.0%) | 2 (100.0%) |
| 20 to 34 years | 18 (100.0%) | 0 (0.0%) |
| 35 to 50 years | 0 (0.0%) | 0 (0.0%) |
| Total | 18 (90.0%) | 2 (10.0%) |
Fertility by Education in Barbourville
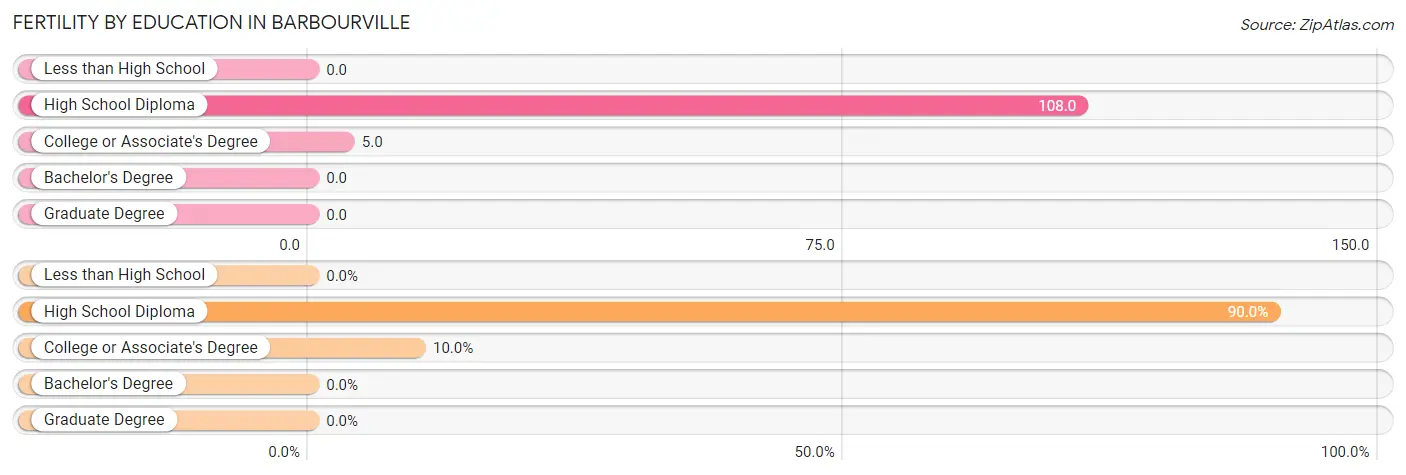
| Educational Attainment | Women with Births | Births / 1,000 Women |
| Less than High School | 0 (0.0%) | 0.0 |
| High School Diploma | 18 (90.0%) | 108.0 |
| College or Associate's Degree | 2 (10.0%) | 5.0 |
| Bachelor's Degree | 0 (0.0%) | 0.0 |
| Graduate Degree | 0 (0.0%) | 0.0 |
| Total | 20 (100.0%) | 24.0 |
Fertility by Education by Marriage Status in Barbourville
10.0% of women with births in Barbourville are unmarried. Women with the educational attainment of high school diploma are most likely to be married with 100.0% of them married at childbirth, while women with the educational attainment of college or associate's degree are least likely to be married with 100.0% of them unmarried at childbirth.
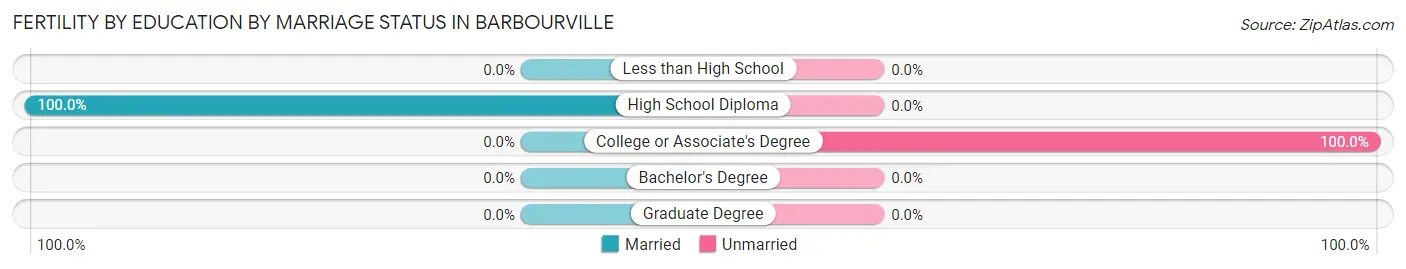
| Educational Attainment | Married | Unmarried |
| Less than High School | 0 (0.0%) | 0 (0.0%) |
| High School Diploma | 18 (100.0%) | 0 (0.0%) |
| College or Associate's Degree | 0 (0.0%) | 2 (100.0%) |
| Bachelor's Degree | 0 (0.0%) | 0 (0.0%) |
| Graduate Degree | 0 (0.0%) | 0 (0.0%) |
| Total | 18 (90.0%) | 2 (10.0%) |
Employment Characteristics in Barbourville
Employment by Class of Employer in Barbourville
Among the 1,049 employed individuals in Barbourville, private company employees (781 | 74.5%), not-for-profit organizations (115 | 11.0%), and local government employees (83 | 7.9%) make up the most common classes of employment.
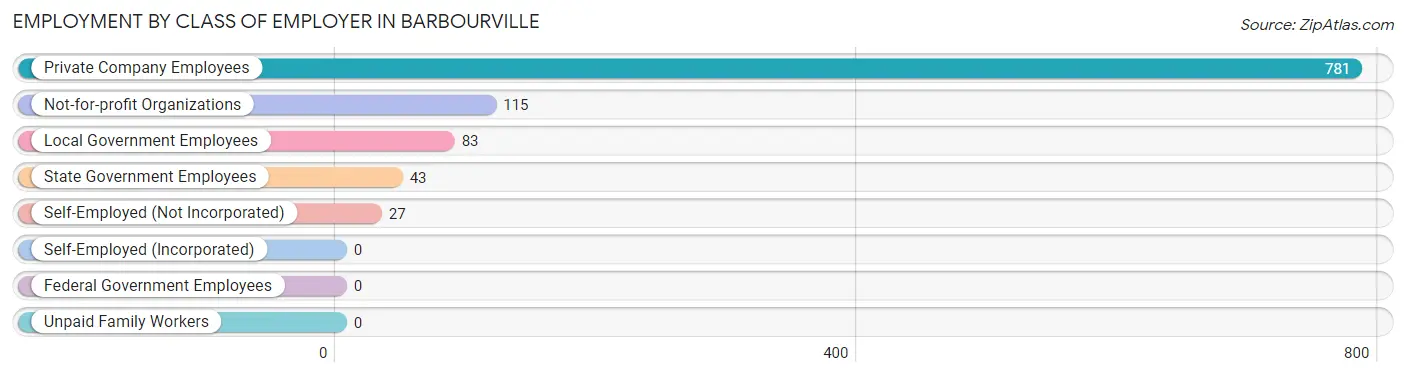
| Employer Class | # Employees | % Employees |
| Private Company Employees | 781 | 74.5% |
| Self-Employed (Incorporated) | 0 | 0.0% |
| Self-Employed (Not Incorporated) | 27 | 2.6% |
| Not-for-profit Organizations | 115 | 11.0% |
| Local Government Employees | 83 | 7.9% |
| State Government Employees | 43 | 4.1% |
| Federal Government Employees | 0 | 0.0% |
| Unpaid Family Workers | 0 | 0.0% |
| Total | 1,049 | 100.0% |
Employment Status by Age in Barbourville
According to the labor force statistics for Barbourville, out of the total population over 16 years of age (2,981), 46.8% or 1,395 individuals are in the labor force, with 23.7% or 331 of them unemployed. The age group with the highest labor force participation rate is 20 to 24 years, with 83.1% or 261 individuals in the labor force. Within the labor force, the 45 to 54 years age range has the highest percentage of unemployed individuals, with 72.0% or 195 of them being unemployed.
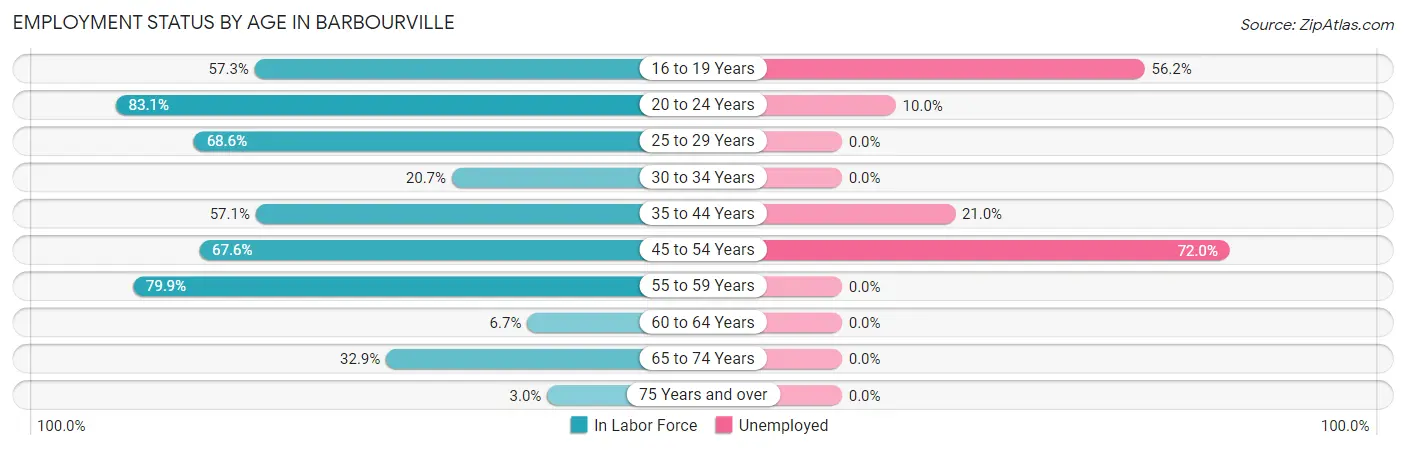
| Age Bracket | In Labor Force | Unemployed |
| 16 to 19 Years | 137 (57.3%) | 77 (56.2%) |
| 20 to 24 Years | 261 (83.1%) | 26 (10.0%) |
| 25 to 29 Years | 300 (68.6%) | 0 (0.0%) |
| 30 to 34 Years | 49 (20.7%) | 0 (0.0%) |
| 35 to 44 Years | 157 (57.1%) | 33 (21.0%) |
| 45 to 54 Years | 271 (67.6%) | 195 (72.0%) |
| 55 to 59 Years | 119 (79.9%) | 0 (0.0%) |
| 60 to 64 Years | 9 (6.7%) | 0 (0.0%) |
| 65 to 74 Years | 74 (32.9%) | 0 (0.0%) |
| 75 Years and over | 17 (3.0%) | 0 (0.0%) |
| Total | 1,395 (46.8%) | 331 (23.7%) |
Employment Status by Educational Attainment in Barbourville
According to labor force statistics for Barbourville, 55.4% of individuals (905) out of the total population between 25 and 64 years of age (1,633) are in the labor force, with 25.2% or 228 of them being unemployed. The group with the highest labor force participation rate are those with the educational attainment of bachelor's degree or higher, with 94.3% or 479 individuals in the labor force. Within the labor force, individuals with bachelor's degree or higher education have the highest percentage of unemployment, with 40.3% or 193 of them being unemployed.
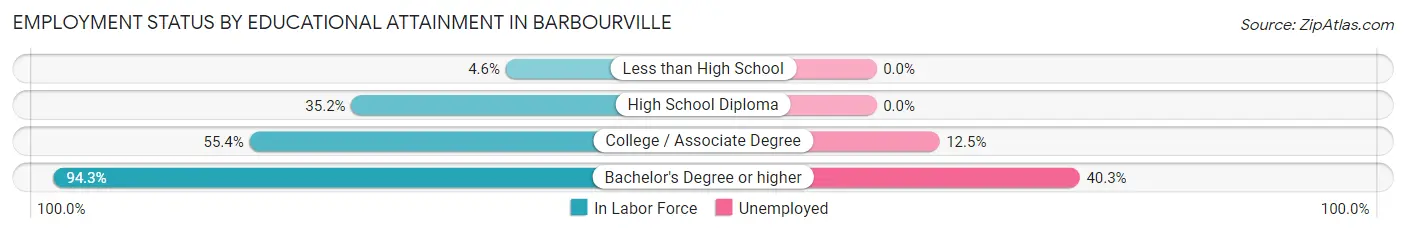
| Educational Attainment | In Labor Force | Unemployed |
| Less than High School | 11 (4.6%) | 0 (0.0%) |
| High School Diploma | 134 (35.2%) | 0 (0.0%) |
| College / Associate Degree | 281 (55.4%) | 63 (12.5%) |
| Bachelor's Degree or higher | 479 (94.3%) | 205 (40.3%) |
| Total | 905 (55.4%) | 412 (25.2%) |
Employment Occupations by Sex in Barbourville
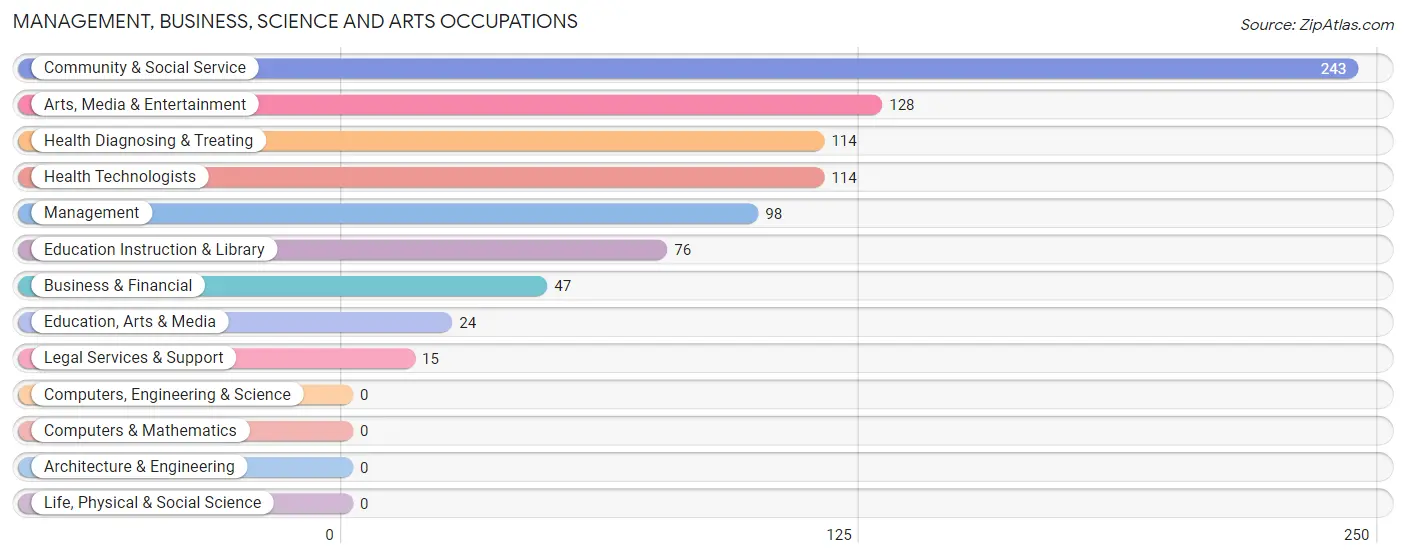
Management, Business, Science and Arts Occupations
The most common Management, Business, Science and Arts occupations in Barbourville are Community & Social Service (243 | 22.9%), Arts, Media & Entertainment (128 | 12.0%), Health Diagnosing & Treating (114 | 10.7%), Health Technologists (114 | 10.7%), and Management (98 | 9.2%).
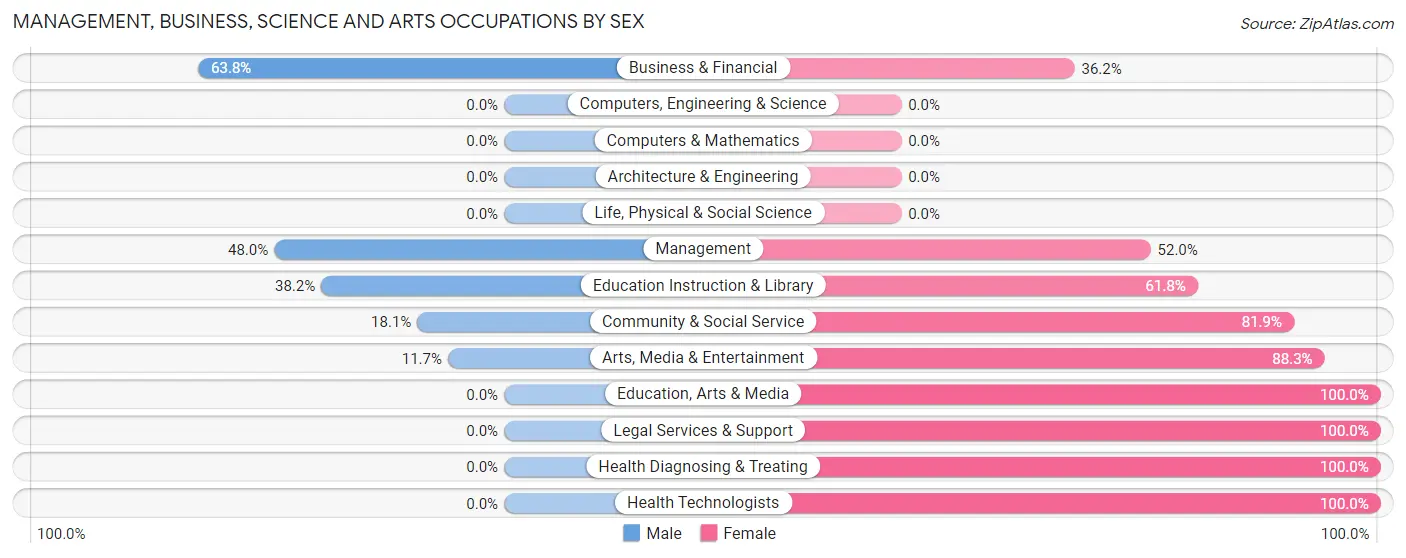
Management, Business, Science and Arts Occupations by Sex
Within the Management, Business, Science and Arts occupations in Barbourville, the most male-oriented occupations are Business & Financial (63.8%), Management (48.0%), and Education Instruction & Library (38.2%), while the most female-oriented occupations are Education, Arts & Media (100.0%), Legal Services & Support (100.0%), and Health Diagnosing & Treating (100.0%).
| Occupation | Male | Female |
| Management | 47 (48.0%) | 51 (52.0%) |
| Business & Financial | 30 (63.8%) | 17 (36.2%) |
| Computers, Engineering & Science | 0 (0.0%) | 0 (0.0%) |
| Computers & Mathematics | 0 (0.0%) | 0 (0.0%) |
| Architecture & Engineering | 0 (0.0%) | 0 (0.0%) |
| Life, Physical & Social Science | 0 (0.0%) | 0 (0.0%) |
| Community & Social Service | 44 (18.1%) | 199 (81.9%) |
| Education, Arts & Media | 0 (0.0%) | 24 (100.0%) |
| Legal Services & Support | 0 (0.0%) | 15 (100.0%) |
| Education Instruction & Library | 29 (38.2%) | 47 (61.8%) |
| Arts, Media & Entertainment | 15 (11.7%) | 113 (88.3%) |
| Health Diagnosing & Treating | 0 (0.0%) | 114 (100.0%) |
| Health Technologists | 0 (0.0%) | 114 (100.0%) |
| Total (Category) | 121 (24.1%) | 381 (75.9%) |
| Total (Overall) | 425 (40.0%) | 638 (60.0%) |
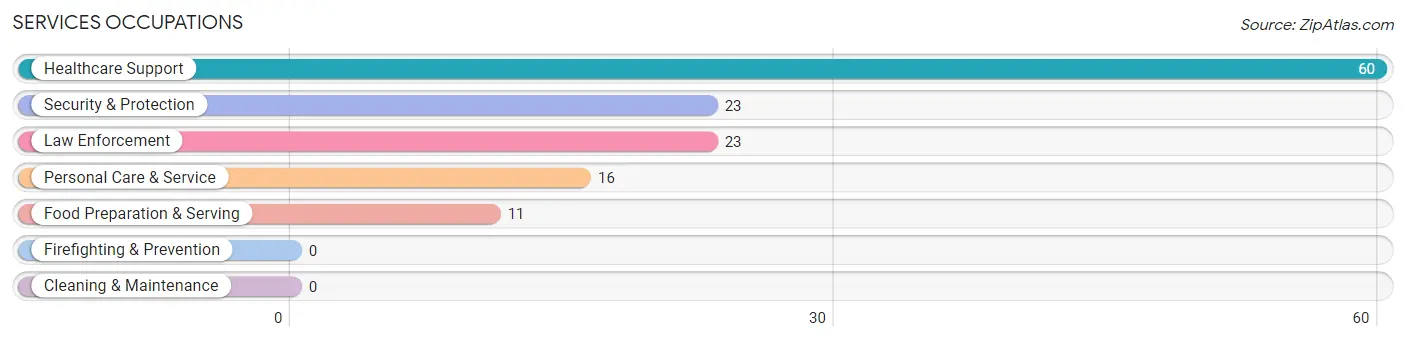
Services Occupations
The most common Services occupations in Barbourville are Healthcare Support (60 | 5.6%), Security & Protection (23 | 2.2%), Law Enforcement (23 | 2.2%), Personal Care & Service (16 | 1.5%), and Food Preparation & Serving (11 | 1.0%).
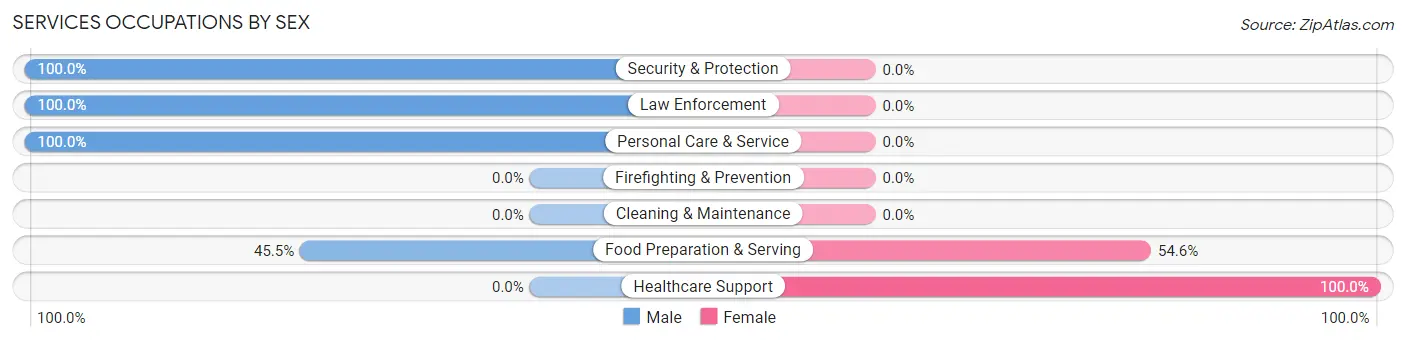
Services Occupations by Sex
Within the Services occupations in Barbourville, the most male-oriented occupations are Security & Protection (100.0%), Law Enforcement (100.0%), and Personal Care & Service (100.0%), while the most female-oriented occupations are Healthcare Support (100.0%), and Food Preparation & Serving (54.5%).
| Occupation | Male | Female |
| Healthcare Support | 0 (0.0%) | 60 (100.0%) |
| Security & Protection | 23 (100.0%) | 0 (0.0%) |
| Firefighting & Prevention | 0 (0.0%) | 0 (0.0%) |
| Law Enforcement | 23 (100.0%) | 0 (0.0%) |
| Food Preparation & Serving | 5 (45.5%) | 6 (54.5%) |
| Cleaning & Maintenance | 0 (0.0%) | 0 (0.0%) |
| Personal Care & Service | 16 (100.0%) | 0 (0.0%) |
| Total (Category) | 44 (40.0%) | 66 (60.0%) |
| Total (Overall) | 425 (40.0%) | 638 (60.0%) |
Sales and Office Occupations
The most common Sales and Office occupations in Barbourville are Office & Administration (252 | 23.7%), and Sales & Related (75 | 7.1%).

Sales and Office Occupations by Sex
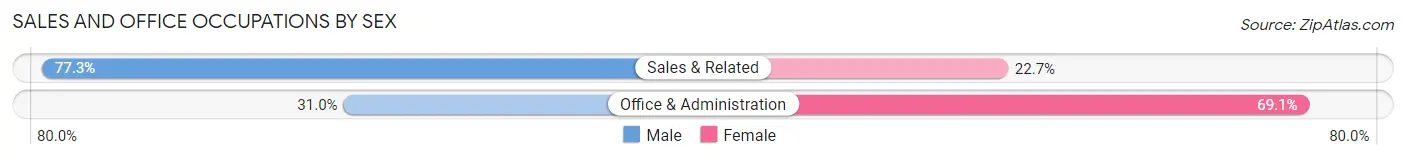
| Occupation | Male | Female |
| Sales & Related | 58 (77.3%) | 17 (22.7%) |
| Office & Administration | 78 (30.9%) | 174 (69.1%) |
| Total (Category) | 136 (41.6%) | 191 (58.4%) |
| Total (Overall) | 425 (40.0%) | 638 (60.0%) |
Natural Resources, Construction and Maintenance Occupations
The most common Natural Resources, Construction and Maintenance occupations in Barbourville are , and Construction & Extraction (86 | 8.1%).
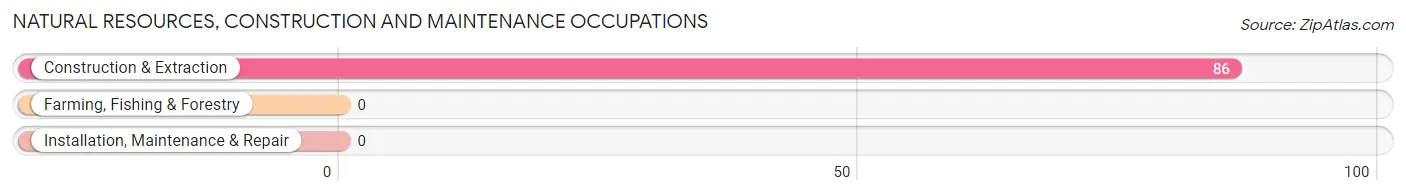
Natural Resources, Construction and Maintenance Occupations by Sex

| Occupation | Male | Female |
| Farming, Fishing & Forestry | 0 (0.0%) | 0 (0.0%) |
| Construction & Extraction | 86 (100.0%) | 0 (0.0%) |
| Installation, Maintenance & Repair | 0 (0.0%) | 0 (0.0%) |
| Total (Category) | 86 (100.0%) | 0 (0.0%) |
| Total (Overall) | 425 (40.0%) | 638 (60.0%) |
Production, Transportation and Moving Occupations
The most common Production, Transportation and Moving occupations in Barbourville are Production (26 | 2.5%), and Material Moving (12 | 1.1%).
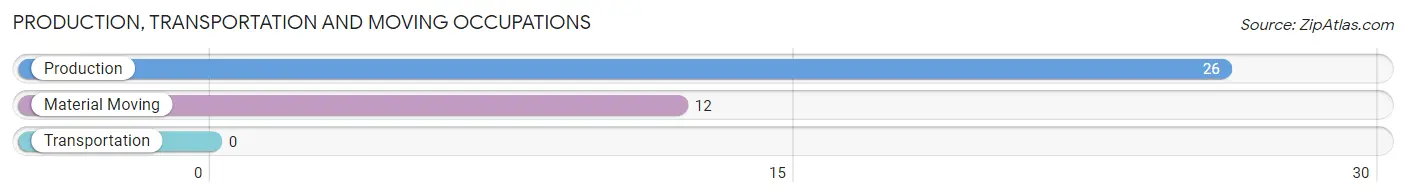
Production, Transportation and Moving Occupations by Sex
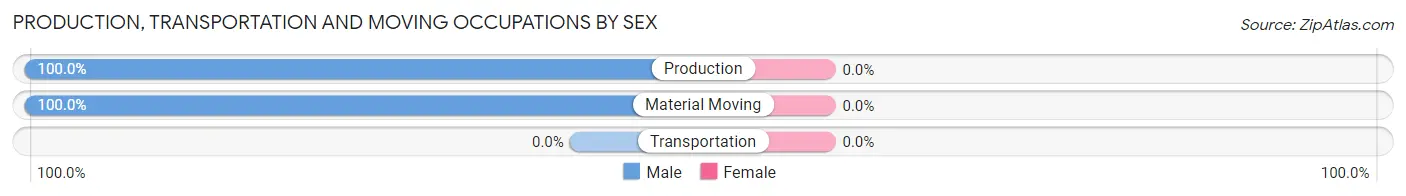
| Occupation | Male | Female |
| Production | 26 (100.0%) | 0 (0.0%) |
| Transportation | 0 (0.0%) | 0 (0.0%) |
| Material Moving | 12 (100.0%) | 0 (0.0%) |
| Total (Category) | 38 (100.0%) | 0 (0.0%) |
| Total (Overall) | 425 (40.0%) | 638 (60.0%) |
Employment Industries by Sex in Barbourville
Employment Industries in Barbourville
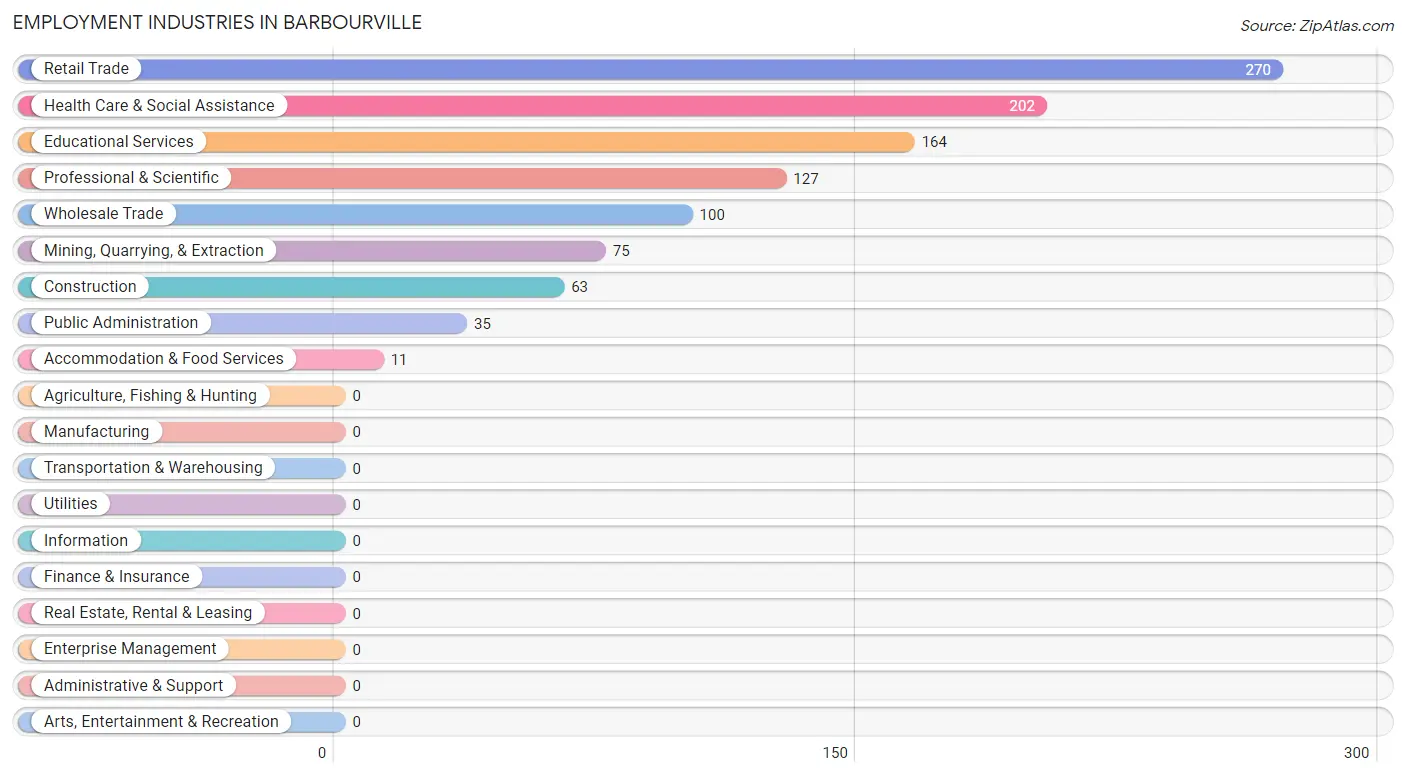
The major employment industries in Barbourville include Retail Trade (270 | 25.4%), Health Care & Social Assistance (202 | 19.0%), Educational Services (164 | 15.4%), Professional & Scientific (127 | 11.9%), and Wholesale Trade (100 | 9.4%).
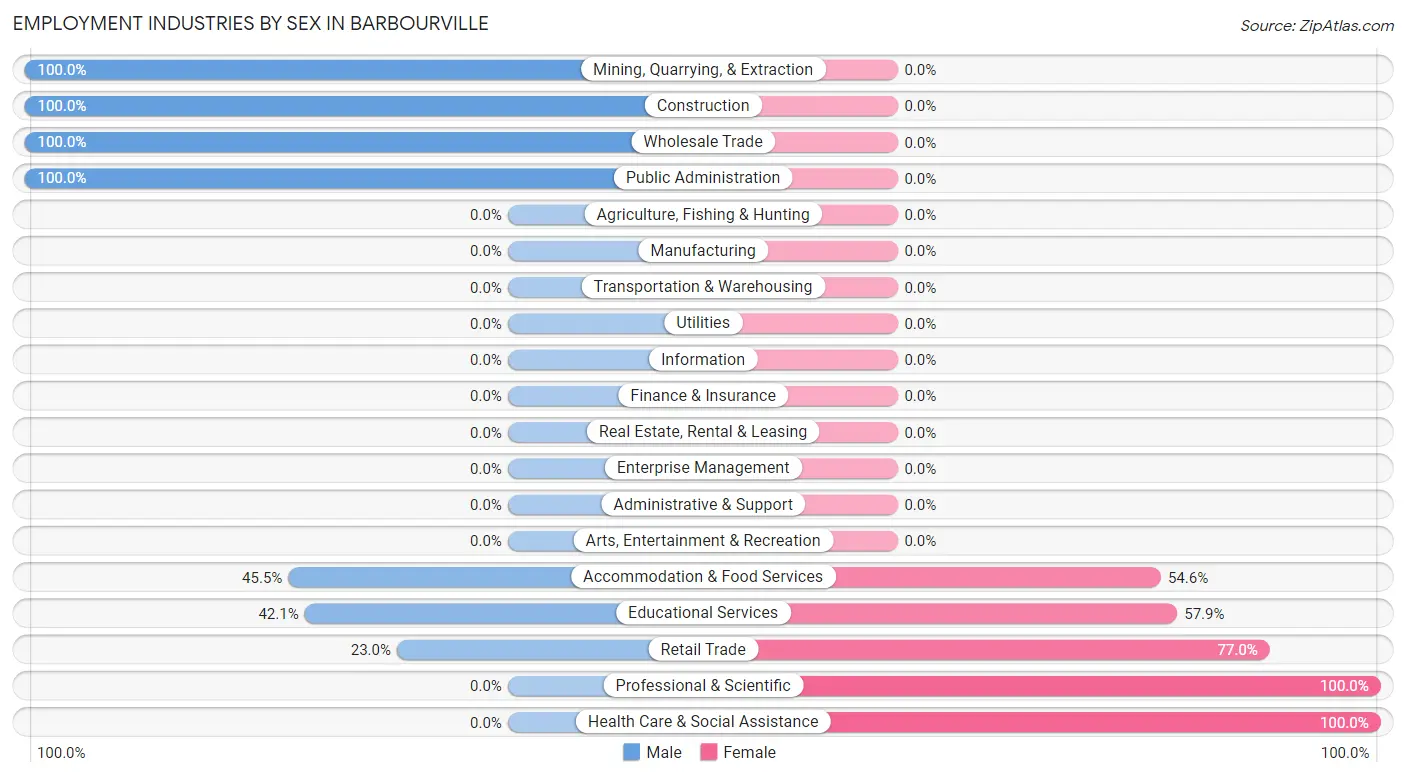
Employment Industries by Sex in Barbourville
The Barbourville industries that see more men than women are Mining, Quarrying, & Extraction (100.0%), Construction (100.0%), and Wholesale Trade (100.0%), whereas the industries that tend to have a higher number of women are Professional & Scientific (100.0%), Health Care & Social Assistance (100.0%), and Retail Trade (77.0%).
| Industry | Male | Female |
| Agriculture, Fishing & Hunting | 0 (0.0%) | 0 (0.0%) |
| Mining, Quarrying, & Extraction | 75 (100.0%) | 0 (0.0%) |
| Construction | 63 (100.0%) | 0 (0.0%) |
| Manufacturing | 0 (0.0%) | 0 (0.0%) |
| Wholesale Trade | 100 (100.0%) | 0 (0.0%) |
| Retail Trade | 62 (23.0%) | 208 (77.0%) |
| Transportation & Warehousing | 0 (0.0%) | 0 (0.0%) |
| Utilities | 0 (0.0%) | 0 (0.0%) |
| Information | 0 (0.0%) | 0 (0.0%) |
| Finance & Insurance | 0 (0.0%) | 0 (0.0%) |
| Real Estate, Rental & Leasing | 0 (0.0%) | 0 (0.0%) |
| Professional & Scientific | 0 (0.0%) | 127 (100.0%) |
| Enterprise Management | 0 (0.0%) | 0 (0.0%) |
| Administrative & Support | 0 (0.0%) | 0 (0.0%) |
| Educational Services | 69 (42.1%) | 95 (57.9%) |
| Health Care & Social Assistance | 0 (0.0%) | 202 (100.0%) |
| Arts, Entertainment & Recreation | 0 (0.0%) | 0 (0.0%) |
| Accommodation & Food Services | 5 (45.5%) | 6 (54.5%) |
| Public Administration | 35 (100.0%) | 0 (0.0%) |
| Total | 425 (40.0%) | 638 (60.0%) |
Education in Barbourville
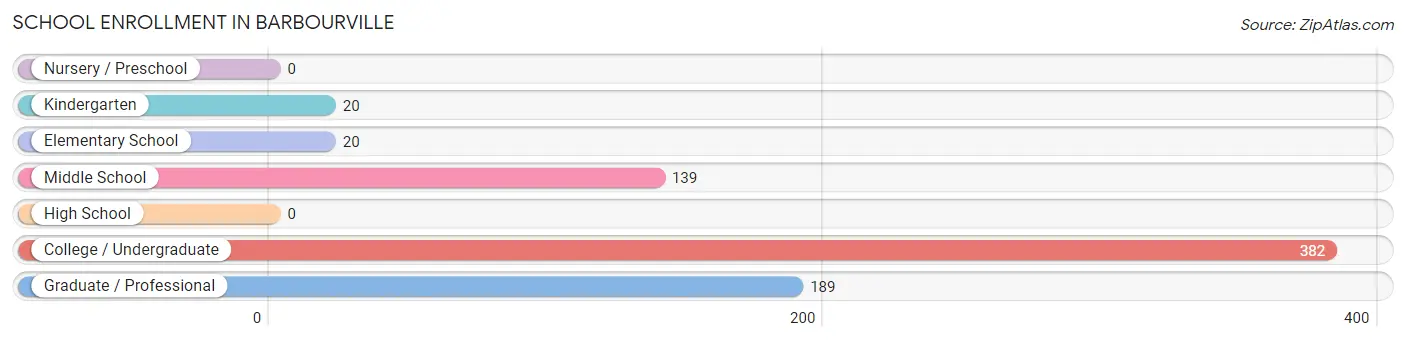
School Enrollment in Barbourville
The most common levels of schooling among the 750 students in Barbourville are college / undergraduate (382 | 50.9%), graduate / professional (189 | 25.2%), and middle school (139 | 18.5%).
| School Level | # Students | % Students |
| Nursery / Preschool | 0 | 0.0% |
| Kindergarten | 20 | 2.7% |
| Elementary School | 20 | 2.7% |
| Middle School | 139 | 18.5% |
| High School | 0 | 0.0% |
| College / Undergraduate | 382 | 50.9% |
| Graduate / Professional | 189 | 25.2% |
| Total | 750 | 100.0% |
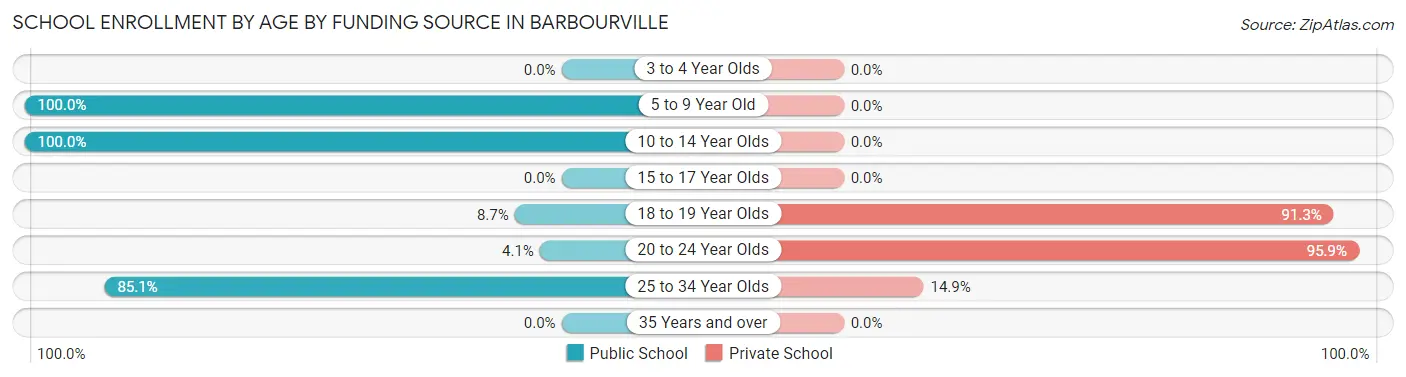
School Enrollment by Age by Funding Source in Barbourville
Out of a total of 750 students who are enrolled in schools in Barbourville, 402 (53.6%) attend a private institution, while the remaining 348 (46.4%) are enrolled in public schools. The age group of 20 to 24 year olds has the highest likelihood of being enrolled in private schools, with 189 (95.9% in the age bracket) enrolled. Conversely, the age group of 5 to 9 year old has the lowest likelihood of being enrolled in a private school, with 40 (100.0% in the age bracket) attending a public institution.
| Age Bracket | Public School | Private School |
| 3 to 4 Year Olds | 0 (0.0%) | 0 (0.0%) |
| 5 to 9 Year Old | 40 (100.0%) | 0 (0.0%) |
| 10 to 14 Year Olds | 139 (100.0%) | 0 (0.0%) |
| 15 to 17 Year Olds | 0 (0.0%) | 0 (0.0%) |
| 18 to 19 Year Olds | 18 (8.7%) | 188 (91.3%) |
| 20 to 24 Year Olds | 8 (4.1%) | 189 (95.9%) |
| 25 to 34 Year Olds | 143 (85.1%) | 25 (14.9%) |
| 35 Years and over | 0 (0.0%) | 0 (0.0%) |
| Total | 348 (46.4%) | 402 (53.6%) |
Educational Attainment by Field of Study in Barbourville
Education (324 | 37.8%), bio, nature & agricultural (152 | 17.7%), physical & health sciences (114 | 13.3%), business (61 | 7.1%), and arts & humanities (53 | 6.2%) are the most common fields of study among 858 individuals in Barbourville who have obtained a bachelor's degree or higher.
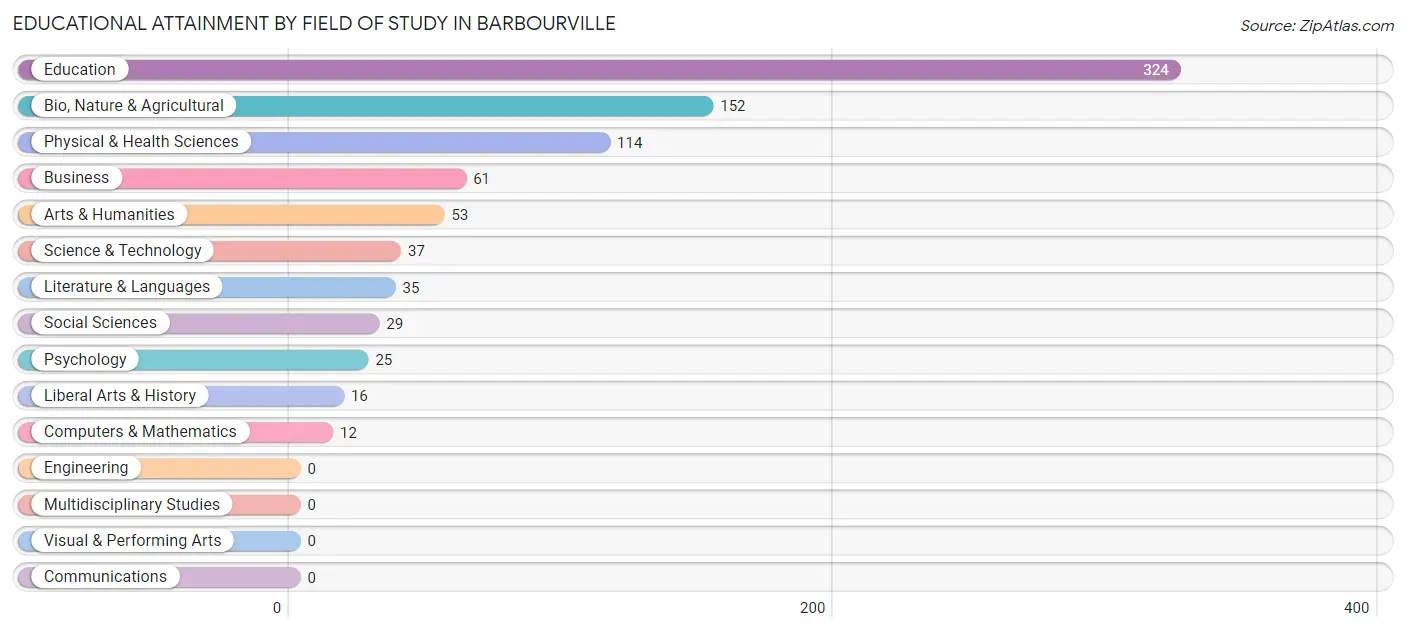
| Field of Study | # Graduates | % Graduates |
| Computers & Mathematics | 12 | 1.4% |
| Bio, Nature & Agricultural | 152 | 17.7% |
| Physical & Health Sciences | 114 | 13.3% |
| Psychology | 25 | 2.9% |
| Social Sciences | 29 | 3.4% |
| Engineering | 0 | 0.0% |
| Multidisciplinary Studies | 0 | 0.0% |
| Science & Technology | 37 | 4.3% |
| Business | 61 | 7.1% |
| Education | 324 | 37.8% |
| Literature & Languages | 35 | 4.1% |
| Liberal Arts & History | 16 | 1.9% |
| Visual & Performing Arts | 0 | 0.0% |
| Communications | 0 | 0.0% |
| Arts & Humanities | 53 | 6.2% |
| Total | 858 | 100.0% |
Transportation & Commute in Barbourville
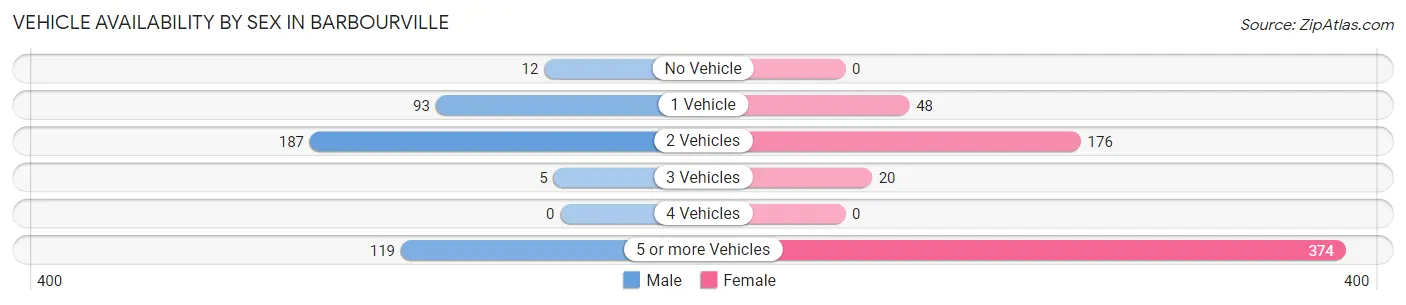
Vehicle Availability by Sex in Barbourville
The most prevalent vehicle ownership categories in Barbourville are males with 2 vehicles (187, accounting for 45.0%) and females with 2 vehicles (176, making up 30.3%).
| Vehicles Available | Male | Female |
| No Vehicle | 12 (2.9%) | 0 (0.0%) |
| 1 Vehicle | 93 (22.4%) | 48 (7.8%) |
| 2 Vehicles | 187 (45.0%) | 176 (28.5%) |
| 3 Vehicles | 5 (1.2%) | 20 (3.2%) |
| 4 Vehicles | 0 (0.0%) | 0 (0.0%) |
| 5 or more Vehicles | 119 (28.6%) | 374 (60.5%) |
| Total | 416 (100.0%) | 618 (100.0%) |
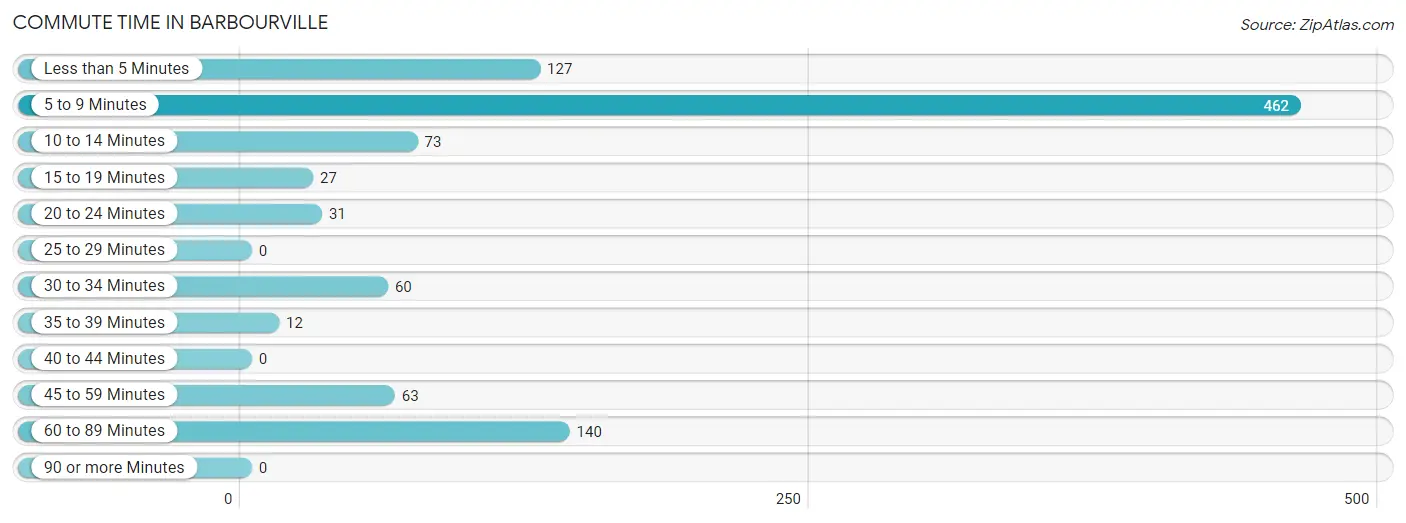
Commute Time in Barbourville
The most frequently occuring commute durations in Barbourville are 5 to 9 minutes (462 commuters, 46.4%), 60 to 89 minutes (140 commuters, 14.1%), and less than 5 minutes (127 commuters, 12.8%).
| Commute Time | # Commuters | % Commuters |
| Less than 5 Minutes | 127 | 12.8% |
| 5 to 9 Minutes | 462 | 46.4% |
| 10 to 14 Minutes | 73 | 7.3% |
| 15 to 19 Minutes | 27 | 2.7% |
| 20 to 24 Minutes | 31 | 3.1% |
| 25 to 29 Minutes | 0 | 0.0% |
| 30 to 34 Minutes | 60 | 6.0% |
| 35 to 39 Minutes | 12 | 1.2% |
| 40 to 44 Minutes | 0 | 0.0% |
| 45 to 59 Minutes | 63 | 6.3% |
| 60 to 89 Minutes | 140 | 14.1% |
| 90 or more Minutes | 0 | 0.0% |
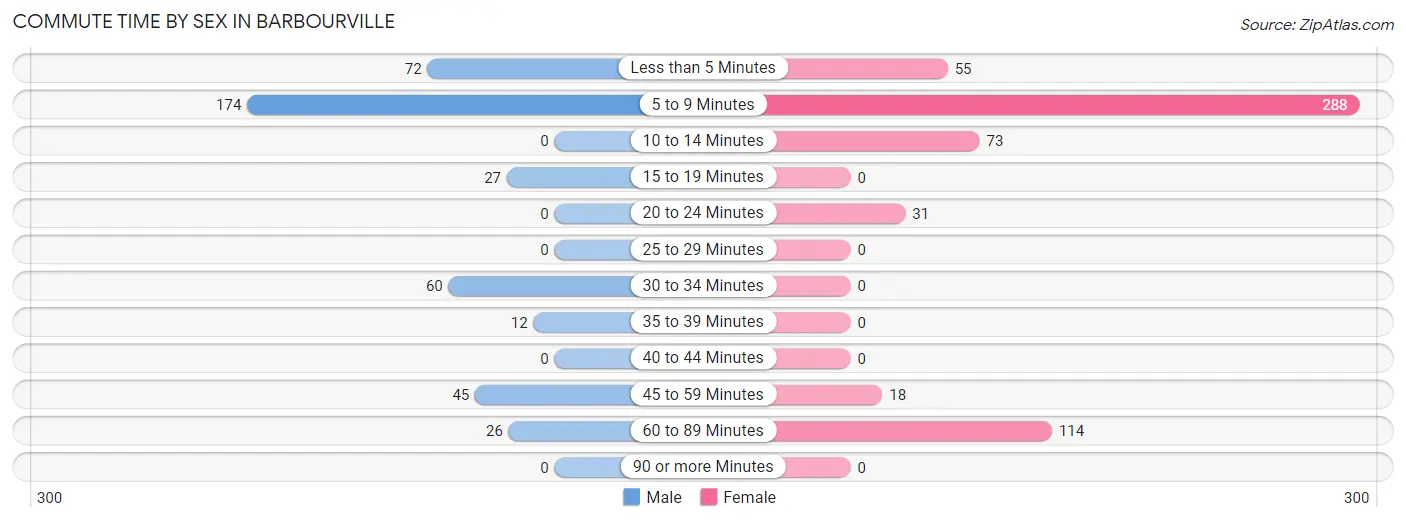
Commute Time by Sex in Barbourville
The most common commute times in Barbourville are 5 to 9 minutes (174 commuters, 41.8%) for males and 5 to 9 minutes (288 commuters, 49.7%) for females.
| Commute Time | Male | Female |
| Less than 5 Minutes | 72 (17.3%) | 55 (9.5%) |
| 5 to 9 Minutes | 174 (41.8%) | 288 (49.7%) |
| 10 to 14 Minutes | 0 (0.0%) | 73 (12.6%) |
| 15 to 19 Minutes | 27 (6.5%) | 0 (0.0%) |
| 20 to 24 Minutes | 0 (0.0%) | 31 (5.3%) |
| 25 to 29 Minutes | 0 (0.0%) | 0 (0.0%) |
| 30 to 34 Minutes | 60 (14.4%) | 0 (0.0%) |
| 35 to 39 Minutes | 12 (2.9%) | 0 (0.0%) |
| 40 to 44 Minutes | 0 (0.0%) | 0 (0.0%) |
| 45 to 59 Minutes | 45 (10.8%) | 18 (3.1%) |
| 60 to 89 Minutes | 26 (6.2%) | 114 (19.7%) |
| 90 or more Minutes | 0 (0.0%) | 0 (0.0%) |
Time of Departure to Work by Sex in Barbourville
The most frequent times of departure to work in Barbourville are 9:00 AM to 9:59 AM (90, 21.6%) for males and 7:00 AM to 7:29 AM (129, 22.3%) for females.
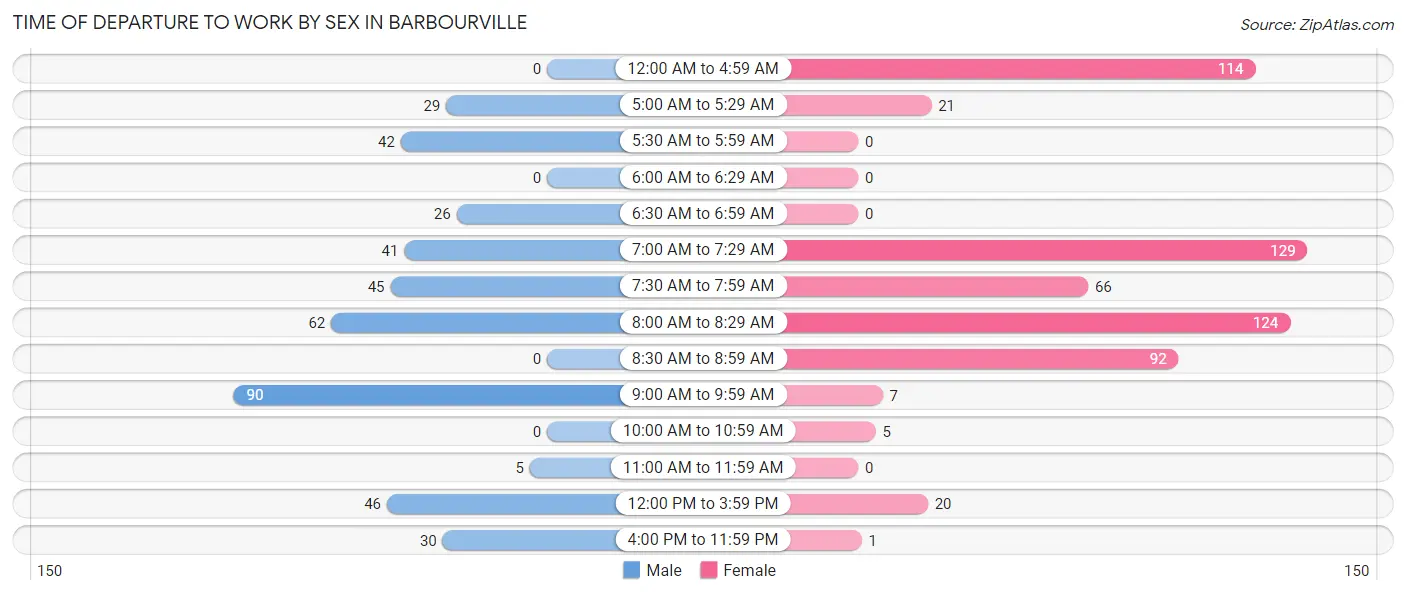
| Time of Departure | Male | Female |
| 12:00 AM to 4:59 AM | 0 (0.0%) | 114 (19.7%) |
| 5:00 AM to 5:29 AM | 29 (7.0%) | 21 (3.6%) |
| 5:30 AM to 5:59 AM | 42 (10.1%) | 0 (0.0%) |
| 6:00 AM to 6:29 AM | 0 (0.0%) | 0 (0.0%) |
| 6:30 AM to 6:59 AM | 26 (6.2%) | 0 (0.0%) |
| 7:00 AM to 7:29 AM | 41 (9.9%) | 129 (22.3%) |
| 7:30 AM to 7:59 AM | 45 (10.8%) | 66 (11.4%) |
| 8:00 AM to 8:29 AM | 62 (14.9%) | 124 (21.4%) |
| 8:30 AM to 8:59 AM | 0 (0.0%) | 92 (15.9%) |
| 9:00 AM to 9:59 AM | 90 (21.6%) | 7 (1.2%) |
| 10:00 AM to 10:59 AM | 0 (0.0%) | 5 (0.9%) |
| 11:00 AM to 11:59 AM | 5 (1.2%) | 0 (0.0%) |
| 12:00 PM to 3:59 PM | 46 (11.1%) | 20 (3.5%) |
| 4:00 PM to 11:59 PM | 30 (7.2%) | 1 (0.2%) |
| Total | 416 (100.0%) | 579 (100.0%) |
Housing Occupancy in Barbourville
Occupancy by Ownership in Barbourville
Of the total 1,414 dwellings in Barbourville, owner-occupied units account for 543 (38.4%), while renter-occupied units make up 871 (61.6%).
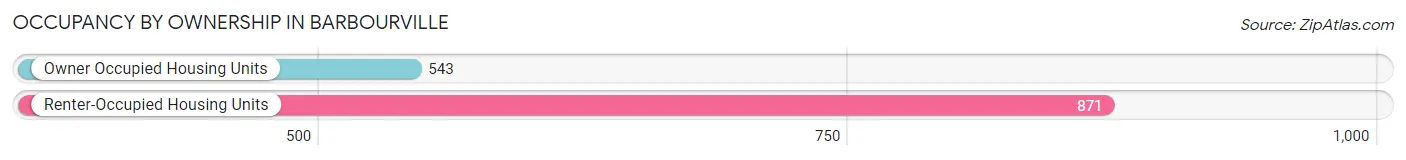
| Occupancy | # Housing Units | % Housing Units |
| Owner Occupied Housing Units | 543 | 38.4% |
| Renter-Occupied Housing Units | 871 | 61.6% |
| Total Occupied Housing Units | 1,414 | 100.0% |
Occupancy by Household Size in Barbourville
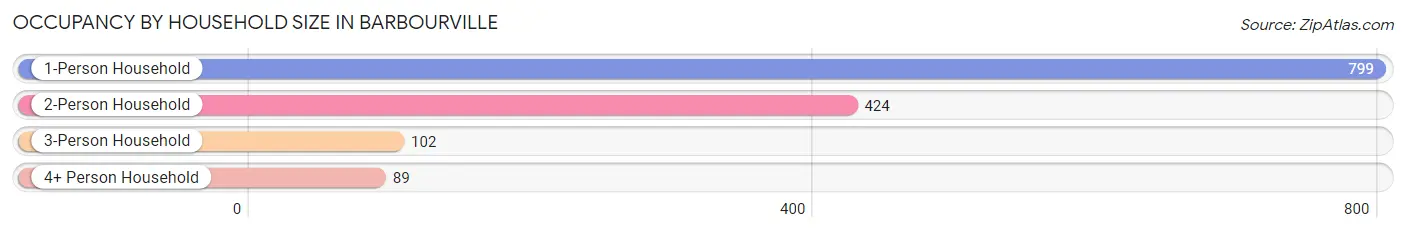
| Household Size | # Housing Units | % Housing Units |
| 1-Person Household | 799 | 56.5% |
| 2-Person Household | 424 | 30.0% |
| 3-Person Household | 102 | 7.2% |
| 4+ Person Household | 89 | 6.3% |
| Total Housing Units | 1,414 | 100.0% |
Occupancy by Ownership by Household Size in Barbourville
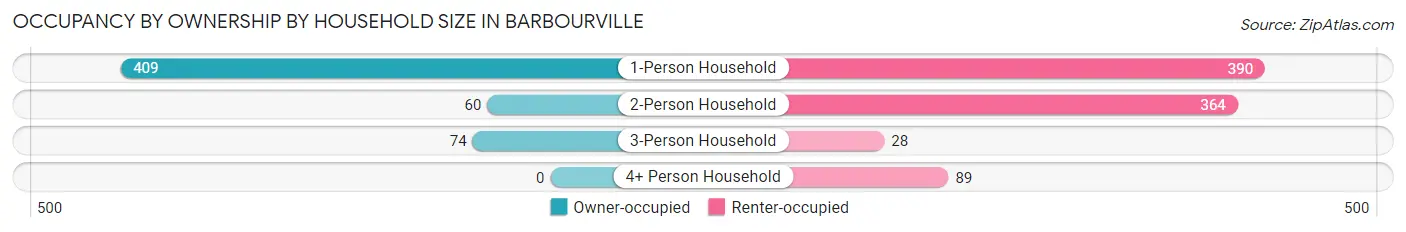
| Household Size | Owner-occupied | Renter-occupied |
| 1-Person Household | 409 (51.2%) | 390 (48.8%) |
| 2-Person Household | 60 (14.1%) | 364 (85.9%) |
| 3-Person Household | 74 (72.6%) | 28 (27.5%) |
| 4+ Person Household | 0 (0.0%) | 89 (100.0%) |
| Total Housing Units | 543 (38.4%) | 871 (61.6%) |
Occupancy by Educational Attainment in Barbourville
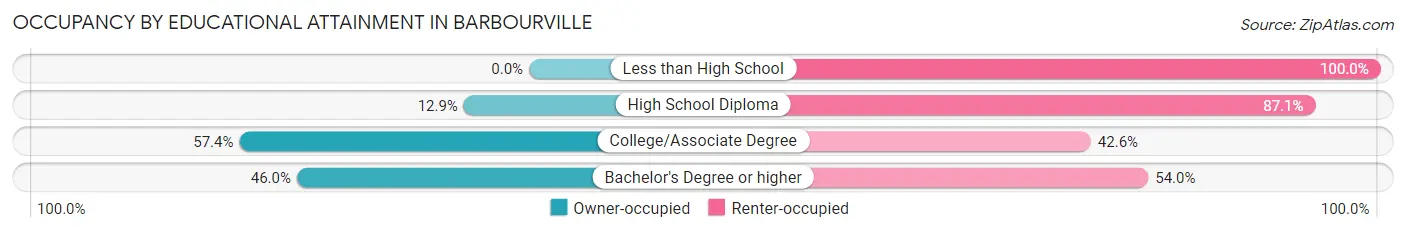
| Household Size | Owner-occupied | Renter-occupied |
| Less than High School | 0 (0.0%) | 99 (100.0%) |
| High School Diploma | 40 (12.9%) | 269 (87.1%) |
| College/Associate Degree | 201 (57.4%) | 149 (42.6%) |
| Bachelor's Degree or higher | 302 (46.0%) | 354 (54.0%) |
Occupancy by Age of Householder in Barbourville
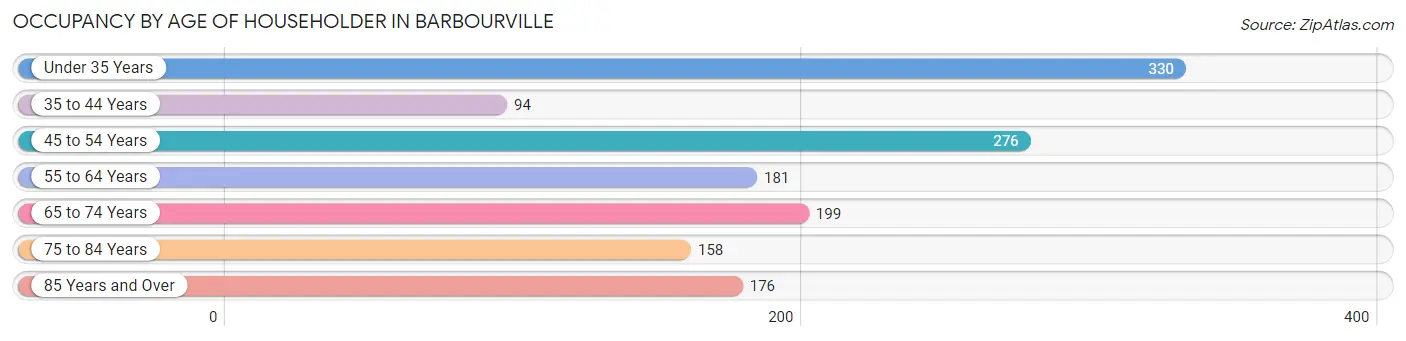
| Age Bracket | # Households | % Households |
| Under 35 Years | 330 | 23.3% |
| 35 to 44 Years | 94 | 6.7% |
| 45 to 54 Years | 276 | 19.5% |
| 55 to 64 Years | 181 | 12.8% |
| 65 to 74 Years | 199 | 14.1% |
| 75 to 84 Years | 158 | 11.2% |
| 85 Years and Over | 176 | 12.4% |
| Total | 1,414 | 100.0% |
Housing Finances in Barbourville
Median Income by Occupancy in Barbourville
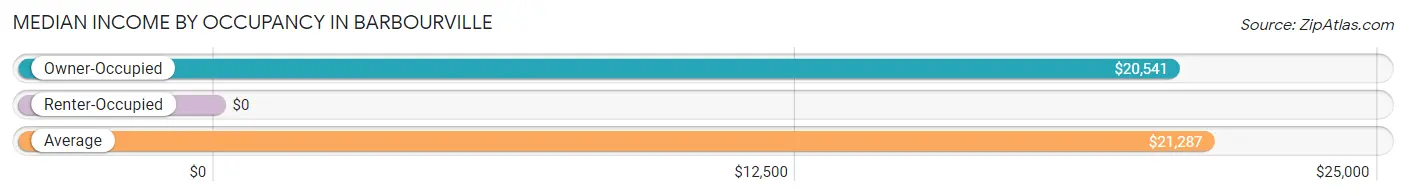
| Occupancy Type | # Households | Median Income |
| Owner-Occupied | 543 (38.4%) | $20,541 |
| Renter-Occupied | 871 (61.6%) | $0 |
| Average | 1,414 (100.0%) | $21,287 |
Occupancy by Householder Income Bracket in Barbourville
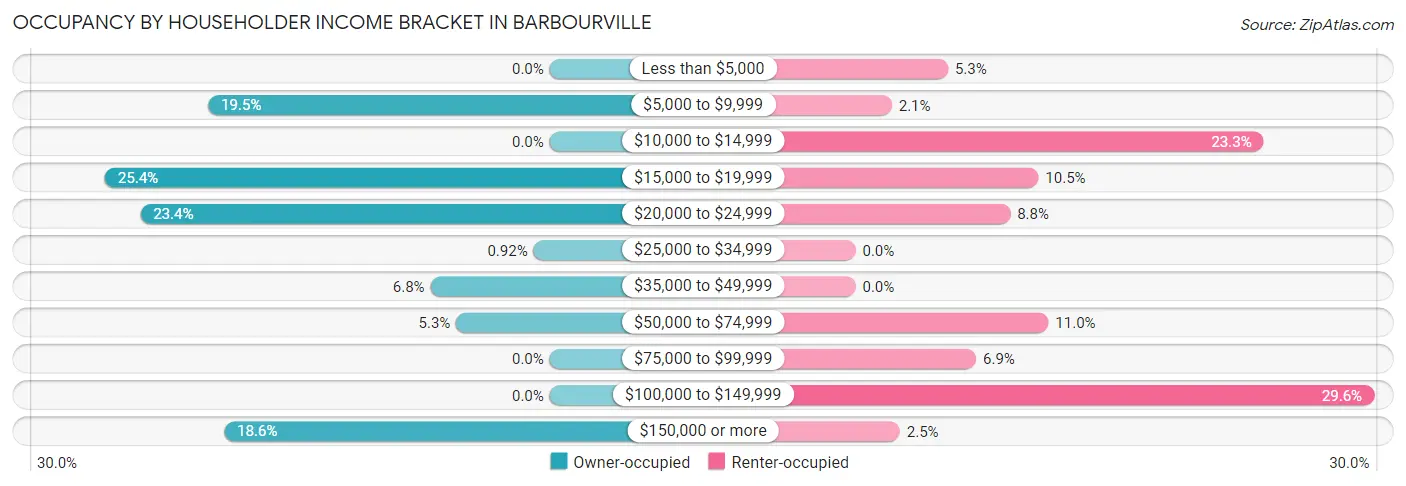
| Income Bracket | Owner-occupied | Renter-occupied |
| Less than $5,000 | 0 (0.0%) | 46 (5.3%) |
| $5,000 to $9,999 | 106 (19.5%) | 18 (2.1%) |
| $10,000 to $14,999 | 0 (0.0%) | 203 (23.3%) |
| $15,000 to $19,999 | 138 (25.4%) | 91 (10.4%) |
| $20,000 to $24,999 | 127 (23.4%) | 77 (8.8%) |
| $25,000 to $34,999 | 5 (0.9%) | 0 (0.0%) |
| $35,000 to $49,999 | 37 (6.8%) | 0 (0.0%) |
| $50,000 to $74,999 | 29 (5.3%) | 96 (11.0%) |
| $75,000 to $99,999 | 0 (0.0%) | 60 (6.9%) |
| $100,000 to $149,999 | 0 (0.0%) | 258 (29.6%) |
| $150,000 or more | 101 (18.6%) | 22 (2.5%) |
| Total | 543 (100.0%) | 871 (100.0%) |
Monthly Housing Cost Tiers in Barbourville
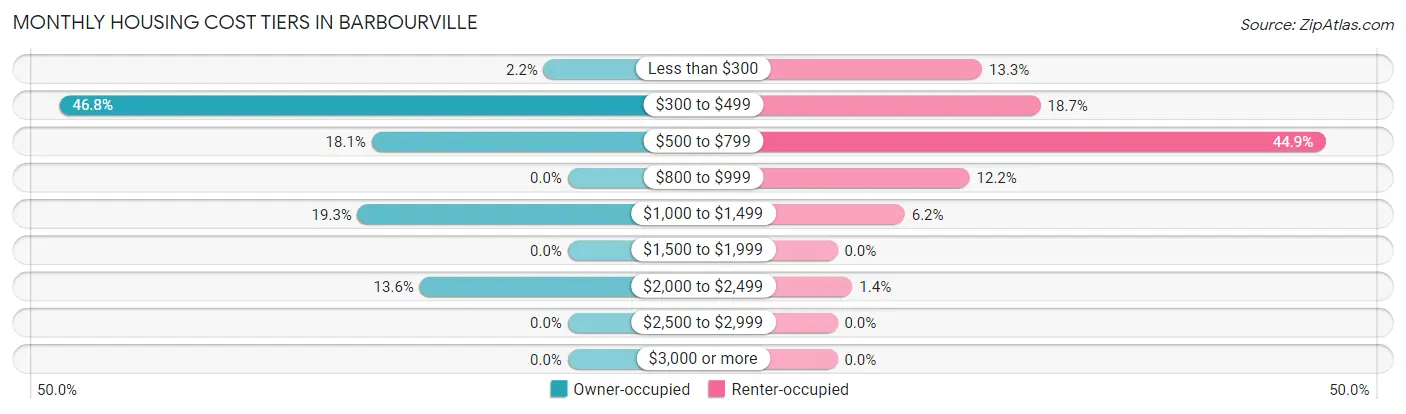
| Monthly Cost | Owner-occupied | Renter-occupied |
| Less than $300 | 12 (2.2%) | 116 (13.3%) |
| $300 to $499 | 254 (46.8%) | 163 (18.7%) |
| $500 to $799 | 98 (18.0%) | 391 (44.9%) |
| $800 to $999 | 0 (0.0%) | 106 (12.2%) |
| $1,000 to $1,499 | 105 (19.3%) | 54 (6.2%) |
| $1,500 to $1,999 | 0 (0.0%) | 0 (0.0%) |
| $2,000 to $2,499 | 74 (13.6%) | 12 (1.4%) |
| $2,500 to $2,999 | 0 (0.0%) | 0 (0.0%) |
| $3,000 or more | 0 (0.0%) | 0 (0.0%) |
| Total | 543 (100.0%) | 871 (100.0%) |
Physical Housing Characteristics in Barbourville
Housing Structures in Barbourville
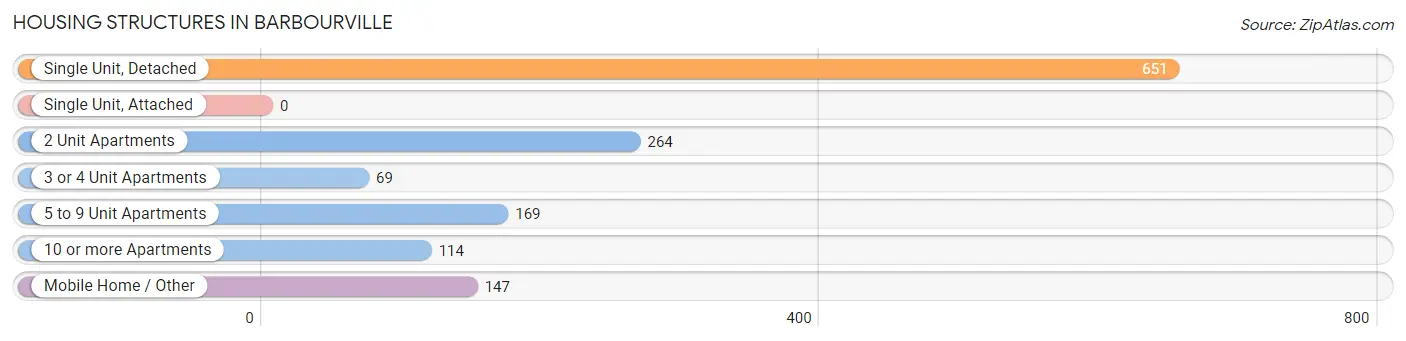
| Structure Type | # Housing Units | % Housing Units |
| Single Unit, Detached | 651 | 46.0% |
| Single Unit, Attached | 0 | 0.0% |
| 2 Unit Apartments | 264 | 18.7% |
| 3 or 4 Unit Apartments | 69 | 4.9% |
| 5 to 9 Unit Apartments | 169 | 11.9% |
| 10 or more Apartments | 114 | 8.1% |
| Mobile Home / Other | 147 | 10.4% |
| Total | 1,414 | 100.0% |
Housing Structures by Occupancy in Barbourville
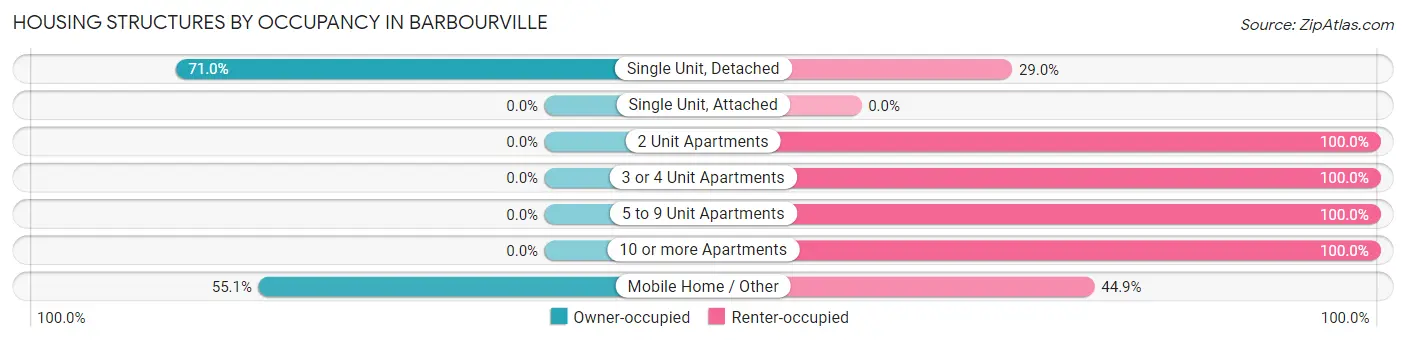
| Structure Type | Owner-occupied | Renter-occupied |
| Single Unit, Detached | 462 (71.0%) | 189 (29.0%) |
| Single Unit, Attached | 0 (0.0%) | 0 (0.0%) |
| 2 Unit Apartments | 0 (0.0%) | 264 (100.0%) |
| 3 or 4 Unit Apartments | 0 (0.0%) | 69 (100.0%) |
| 5 to 9 Unit Apartments | 0 (0.0%) | 169 (100.0%) |
| 10 or more Apartments | 0 (0.0%) | 114 (100.0%) |
| Mobile Home / Other | 81 (55.1%) | 66 (44.9%) |
| Total | 543 (38.4%) | 871 (61.6%) |
Housing Structures by Number of Rooms in Barbourville
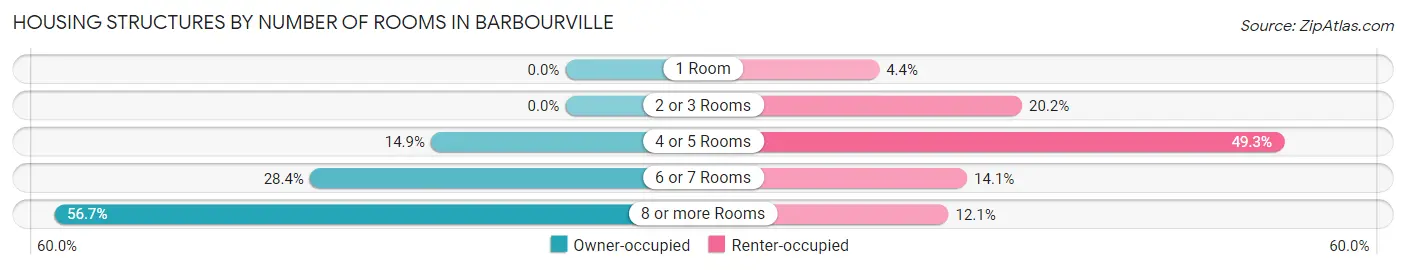
| Number of Rooms | Owner-occupied | Renter-occupied |
| 1 Room | 0 (0.0%) | 38 (4.4%) |
| 2 or 3 Rooms | 0 (0.0%) | 176 (20.2%) |
| 4 or 5 Rooms | 81 (14.9%) | 429 (49.2%) |
| 6 or 7 Rooms | 154 (28.4%) | 123 (14.1%) |
| 8 or more Rooms | 308 (56.7%) | 105 (12.1%) |
| Total | 543 (100.0%) | 871 (100.0%) |
Housing Structure by Heating Type in Barbourville
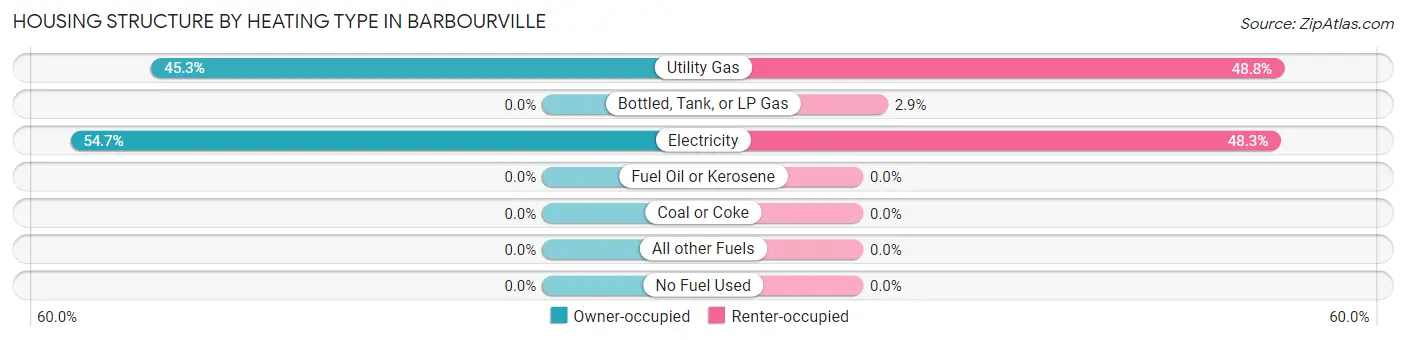
| Heating Type | Owner-occupied | Renter-occupied |
| Utility Gas | 246 (45.3%) | 425 (48.8%) |
| Bottled, Tank, or LP Gas | 0 (0.0%) | 25 (2.9%) |
| Electricity | 297 (54.7%) | 421 (48.3%) |
| Fuel Oil or Kerosene | 0 (0.0%) | 0 (0.0%) |
| Coal or Coke | 0 (0.0%) | 0 (0.0%) |
| All other Fuels | 0 (0.0%) | 0 (0.0%) |
| No Fuel Used | 0 (0.0%) | 0 (0.0%) |
| Total | 543 (100.0%) | 871 (100.0%) |
Household Vehicle Usage in Barbourville
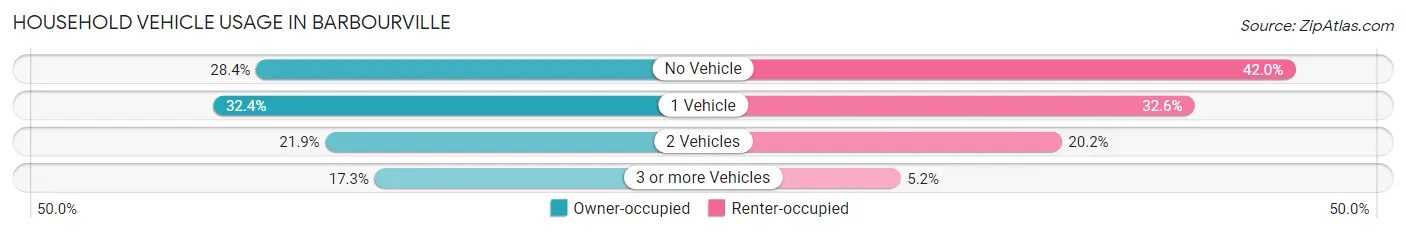
| Vehicles per Household | Owner-occupied | Renter-occupied |
| No Vehicle | 154 (28.4%) | 366 (42.0%) |
| 1 Vehicle | 176 (32.4%) | 284 (32.6%) |
| 2 Vehicles | 119 (21.9%) | 176 (20.2%) |
| 3 or more Vehicles | 94 (17.3%) | 45 (5.2%) |
| Total | 543 (100.0%) | 871 (100.0%) |
Real Estate & Mortgages in Barbourville
Real Estate and Mortgage Overview in Barbourville
| Characteristic | Without Mortgage | With Mortgage |
| Housing Units | 258 | 285 |
| Median Property Value | $163,700 | $162,800 |
| Median Household Income | $21,496 | $74 |
| Monthly Housing Costs | $442 | $0 |
| Real Estate Taxes | $1,194 | $0 |
Property Value by Mortgage Status in Barbourville
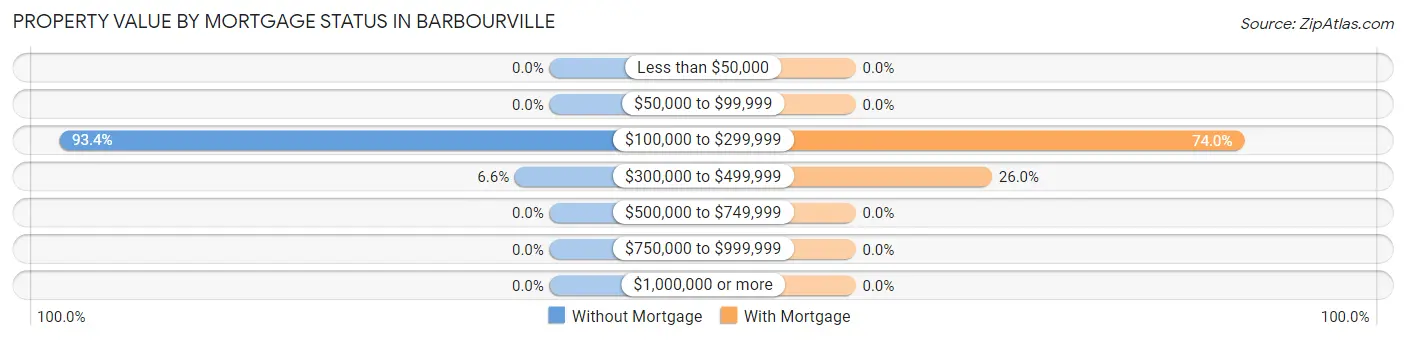
| Property Value | Without Mortgage | With Mortgage |
| Less than $50,000 | 0 (0.0%) | 0 (0.0%) |
| $50,000 to $99,999 | 0 (0.0%) | 0 (0.0%) |
| $100,000 to $299,999 | 241 (93.4%) | 211 (74.0%) |
| $300,000 to $499,999 | 17 (6.6%) | 74 (26.0%) |
| $500,000 to $749,999 | 0 (0.0%) | 0 (0.0%) |
| $750,000 to $999,999 | 0 (0.0%) | 0 (0.0%) |
| $1,000,000 or more | 0 (0.0%) | 0 (0.0%) |
| Total | 258 (100.0%) | 285 (100.0%) |
Household Income by Mortgage Status in Barbourville
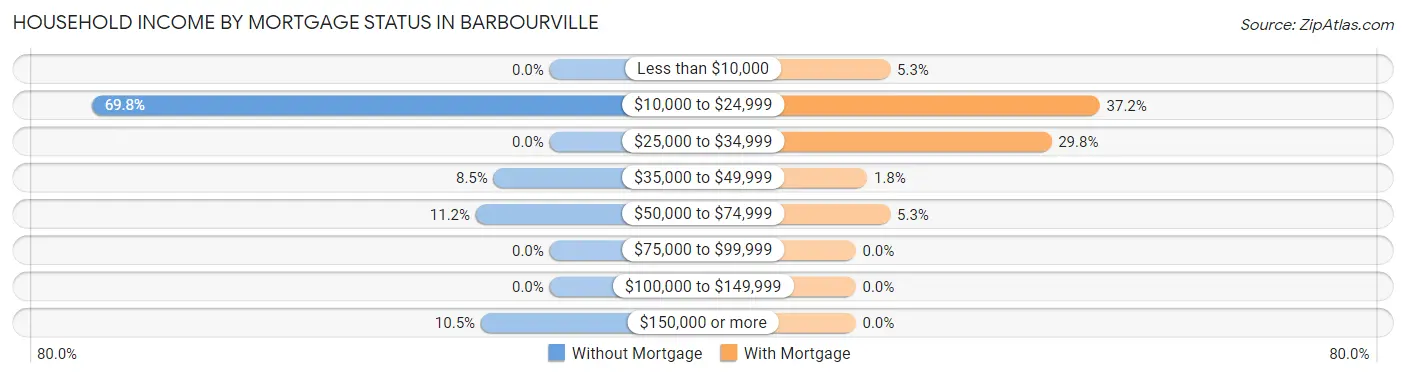
| Household Income | Without Mortgage | With Mortgage |
| Less than $10,000 | 0 (0.0%) | 15 (5.3%) |
| $10,000 to $24,999 | 180 (69.8%) | 106 (37.2%) |
| $25,000 to $34,999 | 0 (0.0%) | 85 (29.8%) |
| $35,000 to $49,999 | 22 (8.5%) | 5 (1.8%) |
| $50,000 to $74,999 | 29 (11.2%) | 15 (5.3%) |
| $75,000 to $99,999 | 0 (0.0%) | 0 (0.0%) |
| $100,000 to $149,999 | 0 (0.0%) | 0 (0.0%) |
| $150,000 or more | 27 (10.5%) | 0 (0.0%) |
| Total | 258 (100.0%) | 285 (100.0%) |
Property Value to Household Income Ratio in Barbourville
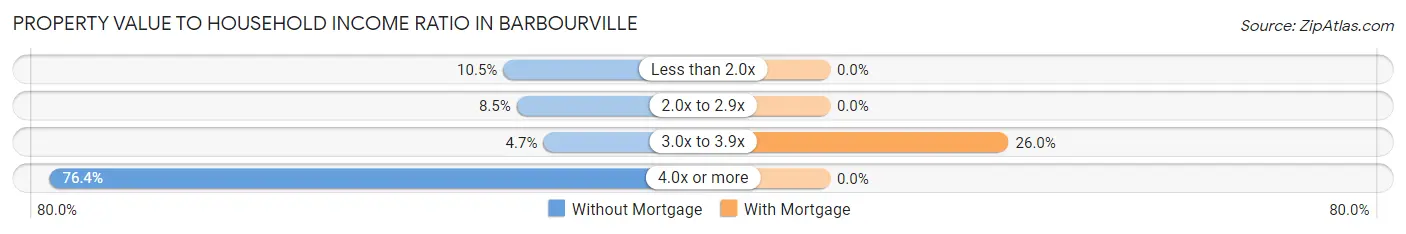
| Value-to-Income Ratio | Without Mortgage | With Mortgage |
| Less than 2.0x | 27 (10.5%) | 0 (0.0%) |
| 2.0x to 2.9x | 22 (8.5%) | 0 (0.0%) |
| 3.0x to 3.9x | 12 (4.6%) | 74 (26.0%) |
| 4.0x or more | 197 (76.4%) | 0 (0.0%) |
| Total | 258 (100.0%) | 285 (100.0%) |
Real Estate Taxes by Mortgage Status in Barbourville
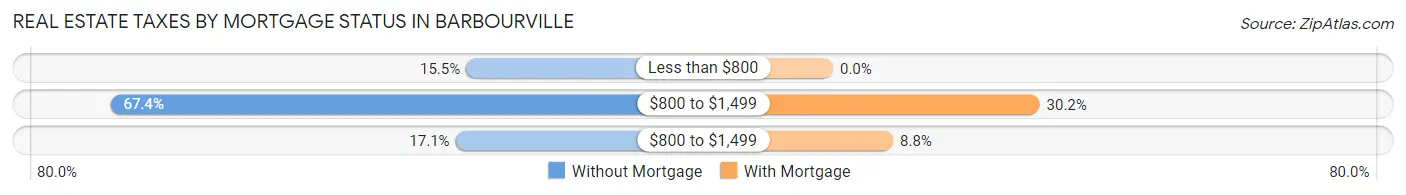
| Property Taxes | Without Mortgage | With Mortgage |
| Less than $800 | 40 (15.5%) | 0 (0.0%) |
| $800 to $1,499 | 174 (67.4%) | 86 (30.2%) |
| $800 to $1,499 | 44 (17.1%) | 25 (8.8%) |
| Total | 258 (100.0%) | 285 (100.0%) |
Health & Disability in Barbourville
Health Insurance Coverage by Age in Barbourville
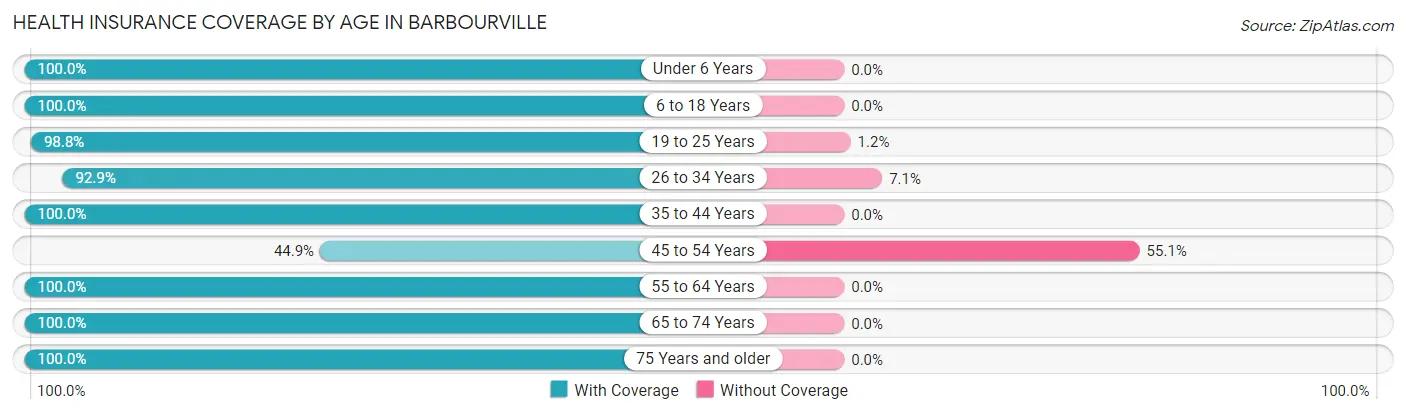
| Age Bracket | With Coverage | Without Coverage |
| Under 6 Years | 55 (100.0%) | 0 (0.0%) |
| 6 to 18 Years | 235 (100.0%) | 0 (0.0%) |
| 19 to 25 Years | 749 (98.8%) | 9 (1.2%) |
| 26 to 34 Years | 342 (92.9%) | 26 (7.1%) |
| 35 to 44 Years | 225 (100.0%) | 0 (0.0%) |
| 45 to 54 Years | 168 (44.9%) | 206 (55.1%) |
| 55 to 64 Years | 258 (100.0%) | 0 (0.0%) |
| 65 to 74 Years | 199 (100.0%) | 0 (0.0%) |
| 75 Years and older | 427 (100.0%) | 0 (0.0%) |
| Total | 2,658 (91.7%) | 241 (8.3%) |
Health Insurance Coverage by Citizenship Status in Barbourville
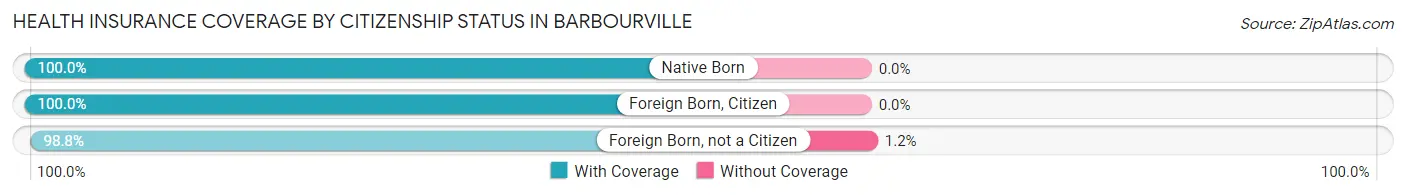
| Citizenship Status | With Coverage | Without Coverage |
| Native Born | 55 (100.0%) | 0 (0.0%) |
| Foreign Born, Citizen | 235 (100.0%) | 0 (0.0%) |
| Foreign Born, not a Citizen | 749 (98.8%) | 9 (1.2%) |
Health Insurance Coverage by Household Income in Barbourville
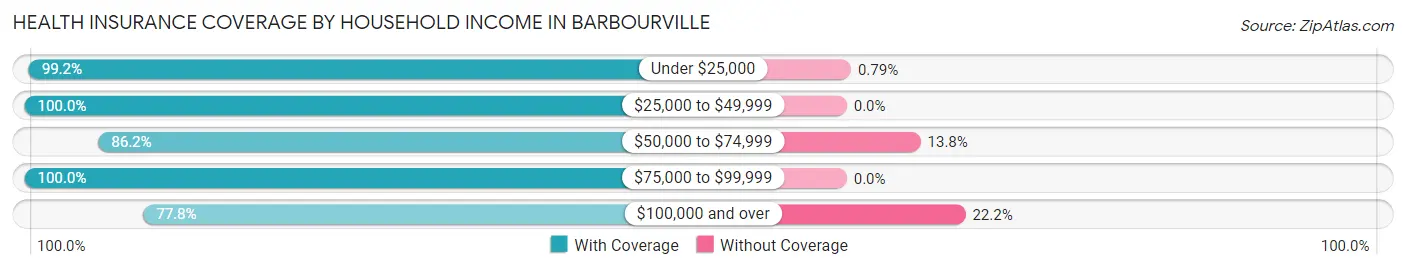
| Household Income | With Coverage | Without Coverage |
| Under $25,000 | 1,381 (99.2%) | 11 (0.8%) |
| $25,000 to $49,999 | 97 (100.0%) | 0 (0.0%) |
| $50,000 to $74,999 | 162 (86.2%) | 26 (13.8%) |
| $75,000 to $99,999 | 116 (100.0%) | 0 (0.0%) |
| $100,000 and over | 675 (77.8%) | 193 (22.2%) |
Public vs Private Health Insurance Coverage by Age in Barbourville
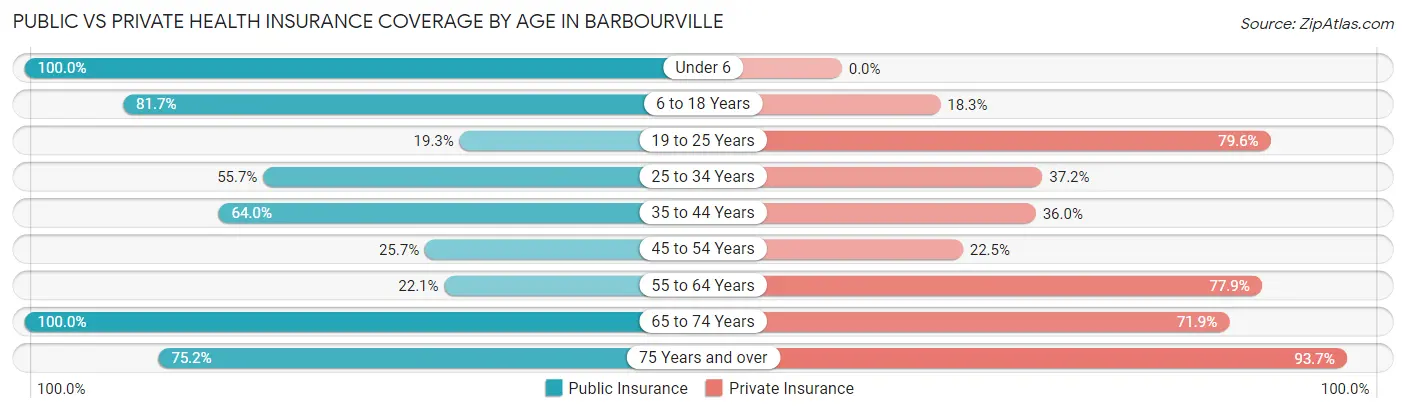
| Age Bracket | Public Insurance | Private Insurance |
| Under 6 | 55 (100.0%) | 0 (0.0%) |
| 6 to 18 Years | 192 (81.7%) | 43 (18.3%) |
| 19 to 25 Years | 146 (19.3%) | 603 (79.5%) |
| 25 to 34 Years | 205 (55.7%) | 137 (37.2%) |
| 35 to 44 Years | 144 (64.0%) | 81 (36.0%) |
| 45 to 54 Years | 96 (25.7%) | 84 (22.5%) |
| 55 to 64 Years | 57 (22.1%) | 201 (77.9%) |
| 65 to 74 Years | 199 (100.0%) | 143 (71.9%) |
| 75 Years and over | 321 (75.2%) | 400 (93.7%) |
| Total | 1,415 (48.8%) | 1,692 (58.4%) |
Disability Status by Sex by Age in Barbourville
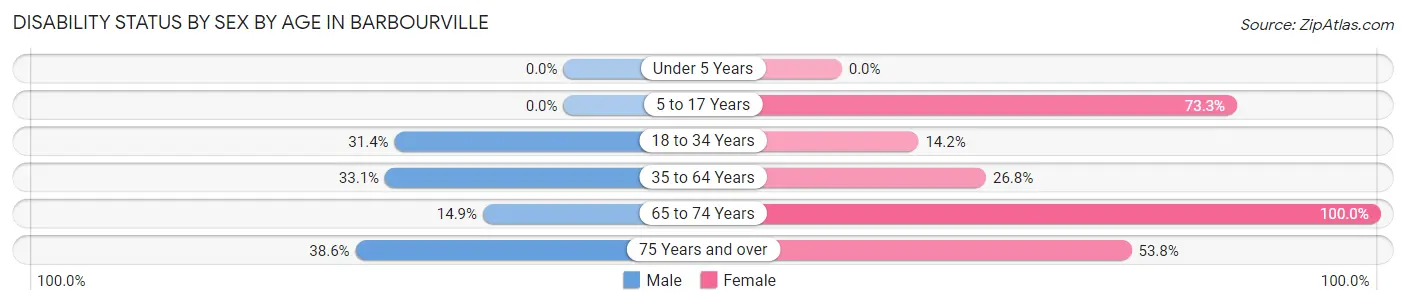
| Age Bracket | Male | Female |
| Under 5 Years | 0 (0.0%) | 0 (0.0%) |
| 5 to 17 Years | 0 (0.0%) | 110 (73.3%) |
| 18 to 34 Years | 159 (31.4%) | 99 (14.2%) |
| 35 to 64 Years | 102 (33.1%) | 147 (26.8%) |
| 65 to 74 Years | 13 (14.9%) | 112 (100.0%) |
| 75 Years and over | 22 (38.6%) | 199 (53.8%) |
Disability Class by Sex by Age in Barbourville
Disability Class: Hearing Difficulty
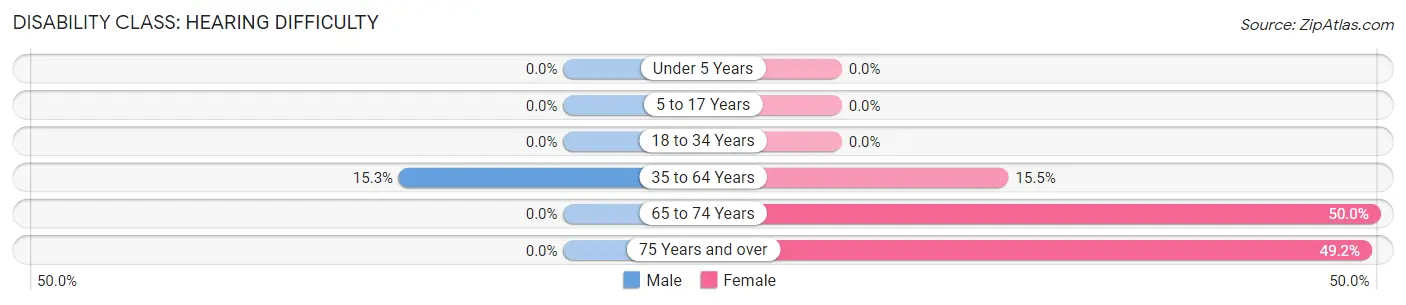
| Age Bracket | Male | Female |
| Under 5 Years | 0 (0.0%) | 0 (0.0%) |
| 5 to 17 Years | 0 (0.0%) | 0 (0.0%) |
| 18 to 34 Years | 0 (0.0%) | 0 (0.0%) |
| 35 to 64 Years | 47 (15.3%) | 85 (15.5%) |
| 65 to 74 Years | 0 (0.0%) | 56 (50.0%) |
| 75 Years and over | 0 (0.0%) | 182 (49.2%) |
Disability Class: Vision Difficulty
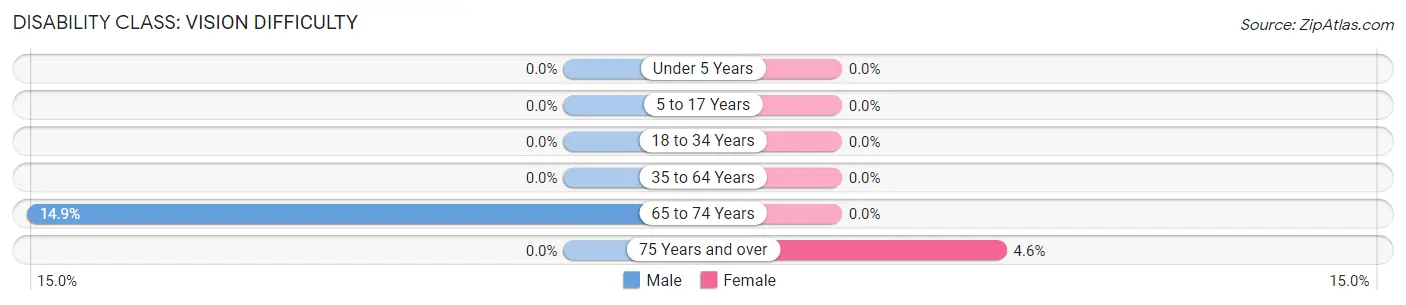
| Age Bracket | Male | Female |
| Under 5 Years | 0 (0.0%) | 0 (0.0%) |
| 5 to 17 Years | 0 (0.0%) | 0 (0.0%) |
| 18 to 34 Years | 0 (0.0%) | 0 (0.0%) |
| 35 to 64 Years | 0 (0.0%) | 0 (0.0%) |
| 65 to 74 Years | 13 (14.9%) | 0 (0.0%) |
| 75 Years and over | 0 (0.0%) | 17 (4.6%) |
Disability Class: Cognitive Difficulty
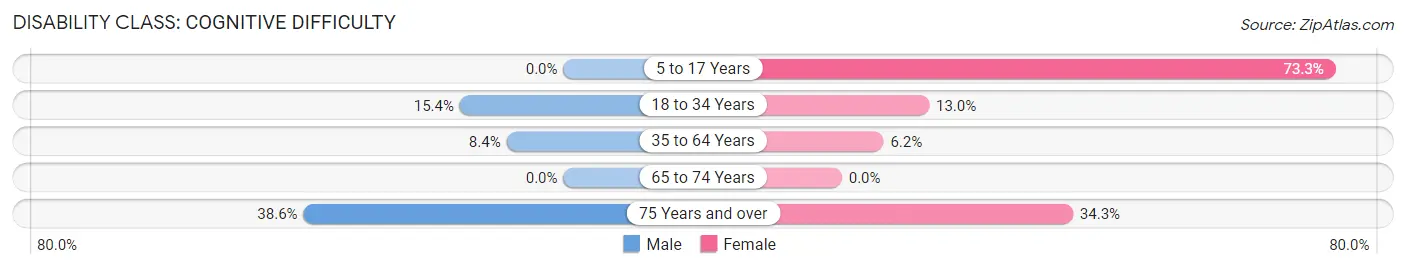
| Age Bracket | Male | Female |
| 5 to 17 Years | 0 (0.0%) | 110 (73.3%) |
| 18 to 34 Years | 78 (15.4%) | 90 (13.0%) |
| 35 to 64 Years | 26 (8.4%) | 34 (6.2%) |
| 65 to 74 Years | 0 (0.0%) | 0 (0.0%) |
| 75 Years and over | 22 (38.6%) | 127 (34.3%) |
Disability Class: Ambulatory Difficulty
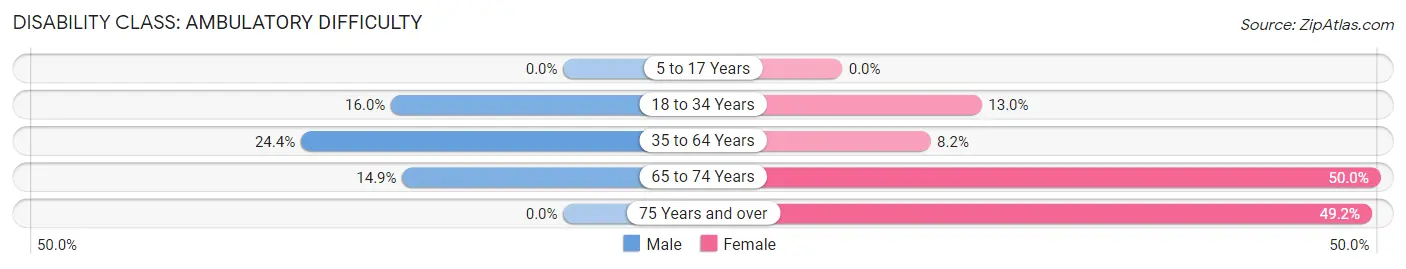
| Age Bracket | Male | Female |
| 5 to 17 Years | 0 (0.0%) | 0 (0.0%) |
| 18 to 34 Years | 81 (16.0%) | 90 (13.0%) |
| 35 to 64 Years | 75 (24.3%) | 45 (8.2%) |
| 65 to 74 Years | 13 (14.9%) | 56 (50.0%) |
| 75 Years and over | 0 (0.0%) | 182 (49.2%) |
Disability Class: Self-Care Difficulty
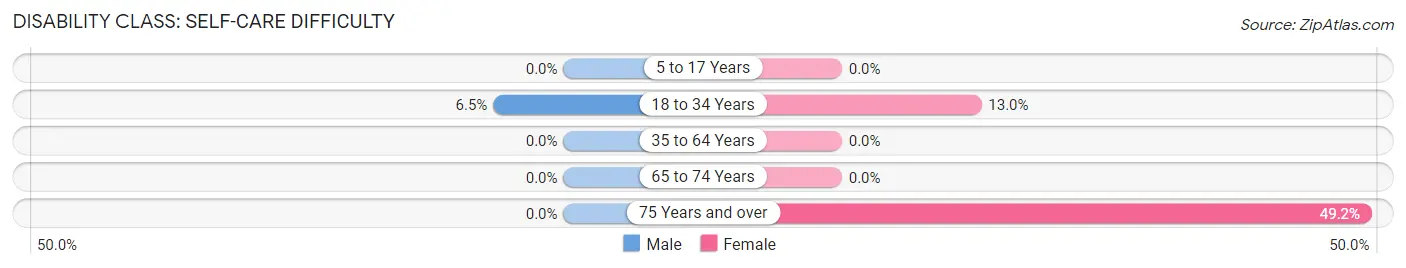
| Age Bracket | Male | Female |
| 5 to 17 Years | 0 (0.0%) | 0 (0.0%) |
| 18 to 34 Years | 33 (6.5%) | 90 (13.0%) |
| 35 to 64 Years | 0 (0.0%) | 0 (0.0%) |
| 65 to 74 Years | 0 (0.0%) | 0 (0.0%) |
| 75 Years and over | 0 (0.0%) | 182 (49.2%) |
Technology Access in Barbourville
Computing Device Access in Barbourville
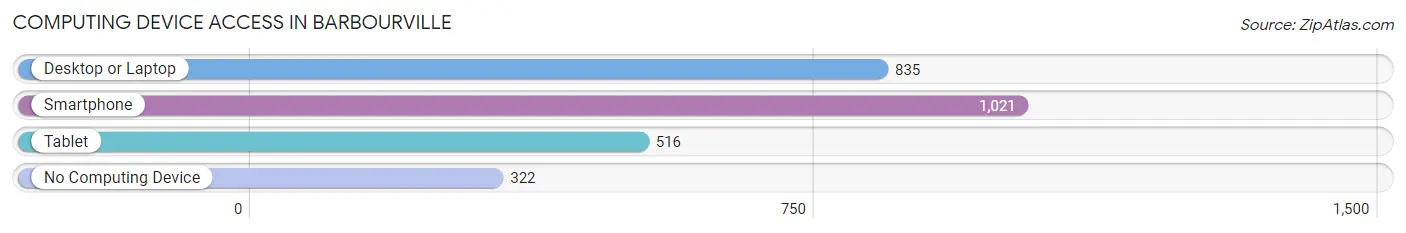
| Device Type | # Households | % Households |
| Desktop or Laptop | 835 | 59.1% |
| Smartphone | 1,021 | 72.2% |
| Tablet | 516 | 36.5% |
| No Computing Device | 322 | 22.8% |
| Total | 1,414 | 100.0% |
Internet Access in Barbourville
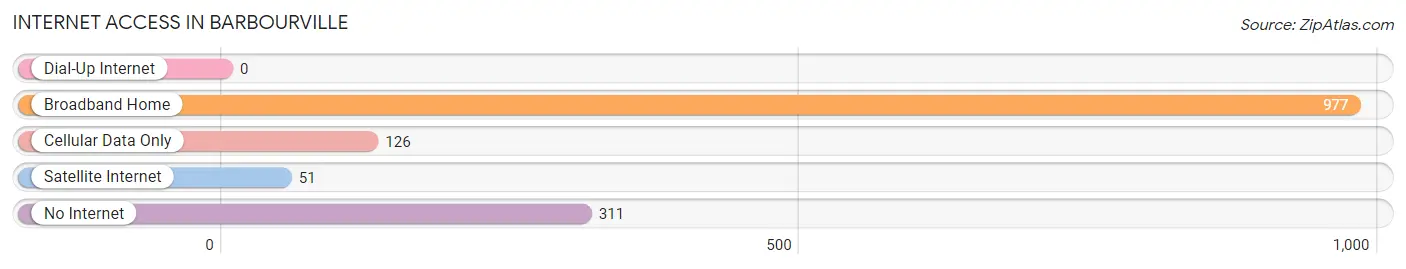
| Internet Type | # Households | % Households |
| Dial-Up Internet | 0 | 0.0% |
| Broadband Home | 977 | 69.1% |
| Cellular Data Only | 126 | 8.9% |
| Satellite Internet | 51 | 3.6% |
| No Internet | 311 | 22.0% |
| Total | 1,414 | 100.0% |
Barbourville Summary
Barbourville, Kentucky is a small city located in Knox County in the southeastern part of the state. It is the county seat and the largest city in the county. The city is situated in the foothills of the Appalachian Mountains and is surrounded by rolling hills and lush forests. The city has a population of 3,159 as of the 2010 census.
Barbourville was founded in 1799 by Revolutionary War veteran James Barbour. The city was named after him and was incorporated in 1854. The city was an important stop on the Wilderness Road, which was the main route for settlers heading west. The city was also an important stop on the Louisville and Nashville Railroad, which connected the city to the rest of the country.
The economy of Barbourville is largely based on agriculture and manufacturing. The city is home to several large manufacturing plants, including a paper mill, a furniture factory, and a plastics plant. The city also has a large agricultural sector, with many farms located in the surrounding area. The city is also home to several educational institutions, including Union College, which is the oldest college in Kentucky.
The geography of Barbourville is characterized by rolling hills and lush forests. The city is located in the foothills of the Appalachian Mountains and is surrounded by the Cumberland Gap National Historical Park. The city is also located near the Big South Fork National River and Recreation Area, which is a popular destination for outdoor recreation.
The demographics of Barbourville are largely white, with a population that is approximately 90% white. The city also has a small African American population, which makes up about 5% of the population. The city also has a small Hispanic population, which makes up about 2% of the population. The median household income in Barbourville is $30,845, which is slightly lower than the national average.
Barbourville is a small city with a rich history and a vibrant economy. The city is home to several educational institutions, manufacturing plants, and agricultural operations. The city is also surrounded by beautiful natural scenery and is a popular destination for outdoor recreation. The city has a diverse population and a median household income that is slightly lower than the national average.
Common Questions
What is Per Capita Income in Barbourville?
Per Capita income in Barbourville is $27,407.
What is the Median Household income in Barbourville?
Median Household Income in Barbourville is $21,287.
What is Income or Wage Gap in Barbourville?
Income or Wage Gap in Barbourville is 47.5%.
Women in Barbourville earn 52.5 cents for every dollar earned by a man.
What is Inequality or Gini Index in Barbourville?
Inequality or Gini Index in Barbourville is 0.54.
What is the Total Population of Barbourville?
Total Population of Barbourville is 3,195.
What is the Total Male Population of Barbourville?
Total Male Population of Barbourville is 1,155.
What is the Total Female Population of Barbourville?
Total Female Population of Barbourville is 2,040.
What is the Ratio of Males per 100 Females in Barbourville?
There are 56.62 Males per 100 Females in Barbourville.
What is the Ratio of Females per 100 Males in Barbourville?
There are 176.62 Females per 100 Males in Barbourville.
What is the Median Population Age in Barbourville?
Median Population Age in Barbourville is 40.8 Years.
What is the Average Family Size in Barbourville
Average Family Size in Barbourville is 3.2 People.
What is the Average Household Size in Barbourville
Average Household Size in Barbourville is 1.9 People.
How Large is the Labor Force in Barbourville?
There are 1,395 People in the Labor Forcein in Barbourville.
What is the Percentage of People in the Labor Force in Barbourville?
46.8% of People are in the Labor Force in Barbourville.
What is the Unemployment Rate in Barbourville?
Unemployment Rate in Barbourville is 23.7%.