Rafael Capo, PR Map & Demographics
Rafael Capo Overview
$9,614
PER CAPITA INCOME
$19,784
AVG FAMILY INCOME
$18,596
AVG HOUSEHOLD INCOME
0.44
INEQUALITY / GINI INDEX
1,627
TOTAL POPULATION
756
MALE POPULATION
871
FEMALE POPULATION
86.80
MALES / 100 FEMALES
115.21
FEMALES / 100 MALES
54.3
MEDIAN AGE
2.9
AVG FAMILY SIZE
2.6
AVG HOUSEHOLD SIZE
205
LABOR FORCE [ PEOPLE ]
14.7%
PERCENT IN LABOR FORCE
Income in Rafael Capo
Income Overview in Rafael Capo
Per Capita Income in Rafael Capo is $9,614, while median incomes of families and households are $19,784 and $18,596 respectively.
| Characteristic | Number | Measure |
| Per Capita Income | 1,627 | $9,614 |
| Median Family Income | 544 | $19,784 |
| Mean Family Income | 544 | $25,806 |
| Median Household Income | 621 | $18,596 |
| Mean Household Income | 621 | $23,649 |
| Income Deficit | 544 | $0 |
| Wage / Income Gap (%) | 1,627 | 0.00% |
| Wage / Income Gap ($) | 1,627 | 100.00¢ per $1 |
| Gini / Inequality Index | 1,627 | 0.44 |
Earnings by Sex in Rafael Capo
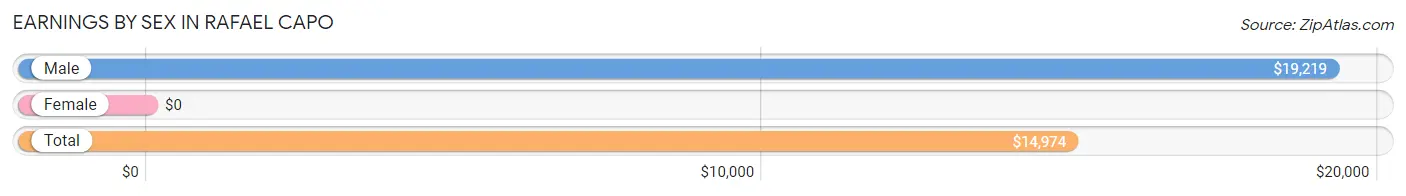
| Sex | Number | Average Earnings |
| Male | 109 (53.2%) | $19,219 |
| Female | 96 (46.8%) | $0 |
| Total | 205 (100.0%) | $14,974 |
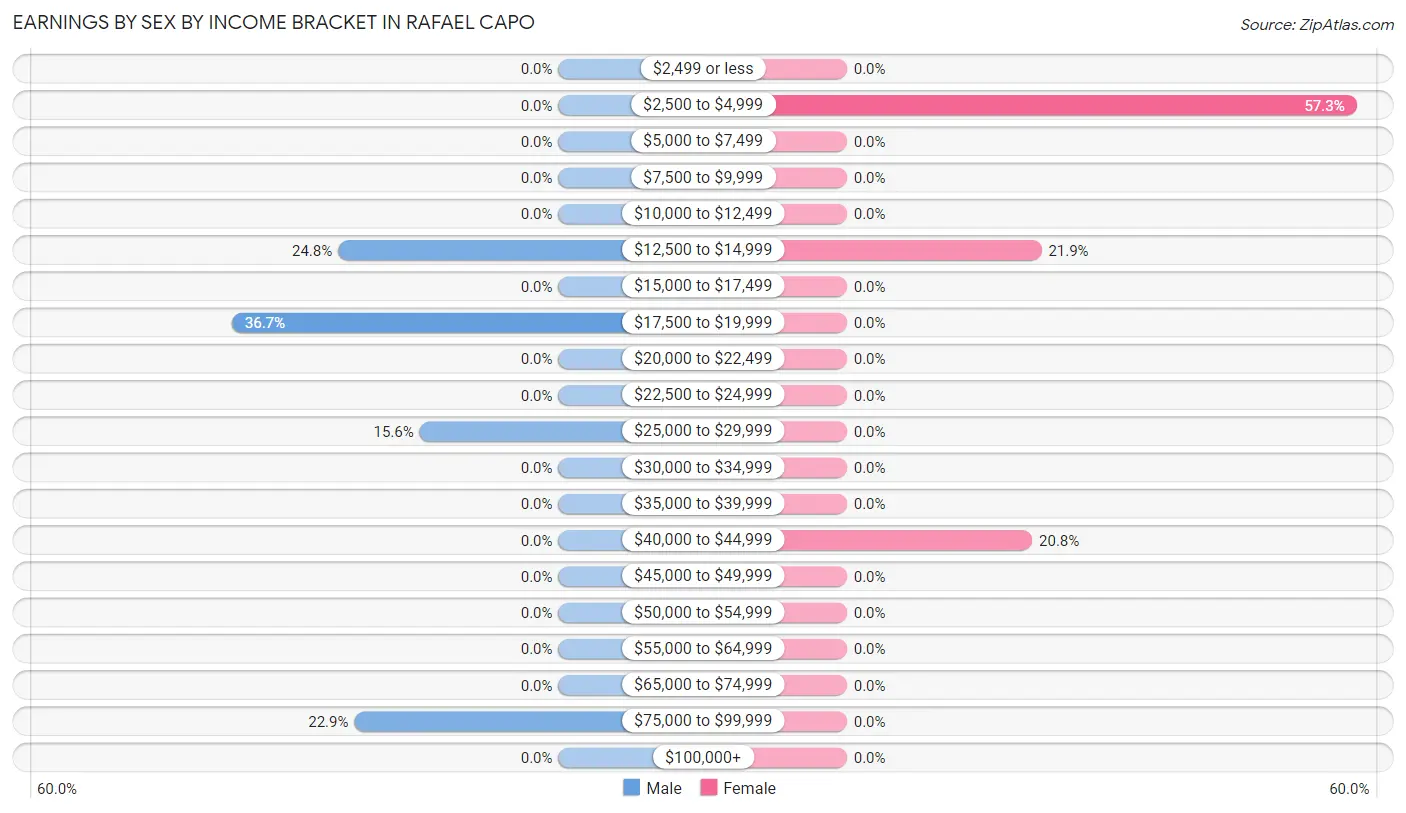
Earnings by Sex by Income Bracket in Rafael Capo
The most common earnings brackets in Rafael Capo are $17,500 to $19,999 for men (40 | 36.7%) and $2,500 to $4,999 for women (55 | 57.3%).
| Income | Male | Female |
| $2,499 or less | 0 (0.0%) | 0 (0.0%) |
| $2,500 to $4,999 | 0 (0.0%) | 55 (57.3%) |
| $5,000 to $7,499 | 0 (0.0%) | 0 (0.0%) |
| $7,500 to $9,999 | 0 (0.0%) | 0 (0.0%) |
| $10,000 to $12,499 | 0 (0.0%) | 0 (0.0%) |
| $12,500 to $14,999 | 27 (24.8%) | 21 (21.9%) |
| $15,000 to $17,499 | 0 (0.0%) | 0 (0.0%) |
| $17,500 to $19,999 | 40 (36.7%) | 0 (0.0%) |
| $20,000 to $22,499 | 0 (0.0%) | 0 (0.0%) |
| $22,500 to $24,999 | 0 (0.0%) | 0 (0.0%) |
| $25,000 to $29,999 | 17 (15.6%) | 0 (0.0%) |
| $30,000 to $34,999 | 0 (0.0%) | 0 (0.0%) |
| $35,000 to $39,999 | 0 (0.0%) | 0 (0.0%) |
| $40,000 to $44,999 | 0 (0.0%) | 20 (20.8%) |
| $45,000 to $49,999 | 0 (0.0%) | 0 (0.0%) |
| $50,000 to $54,999 | 0 (0.0%) | 0 (0.0%) |
| $55,000 to $64,999 | 0 (0.0%) | 0 (0.0%) |
| $65,000 to $74,999 | 0 (0.0%) | 0 (0.0%) |
| $75,000 to $99,999 | 25 (22.9%) | 0 (0.0%) |
| $100,000+ | 0 (0.0%) | 0 (0.0%) |
| Total | 109 (100.0%) | 96 (100.0%) |
Earnings by Sex by Educational Attainment in Rafael Capo
| Educational Attainment | Male Income | Female Income |
| Less than High School | - | - |
| High School Diploma | - | - |
| College or Associate's Degree | - | - |
| Bachelor's Degree | - | - |
| Graduate Degree | - | - |
| Total | $19,219 | $0 |
Family Income in Rafael Capo
Family Income Brackets in Rafael Capo
According to the Rafael Capo family income data, there are 171 families falling into the $15,000 to $24,999 income range, which is the most common income bracket and makes up 31.4% of all families.
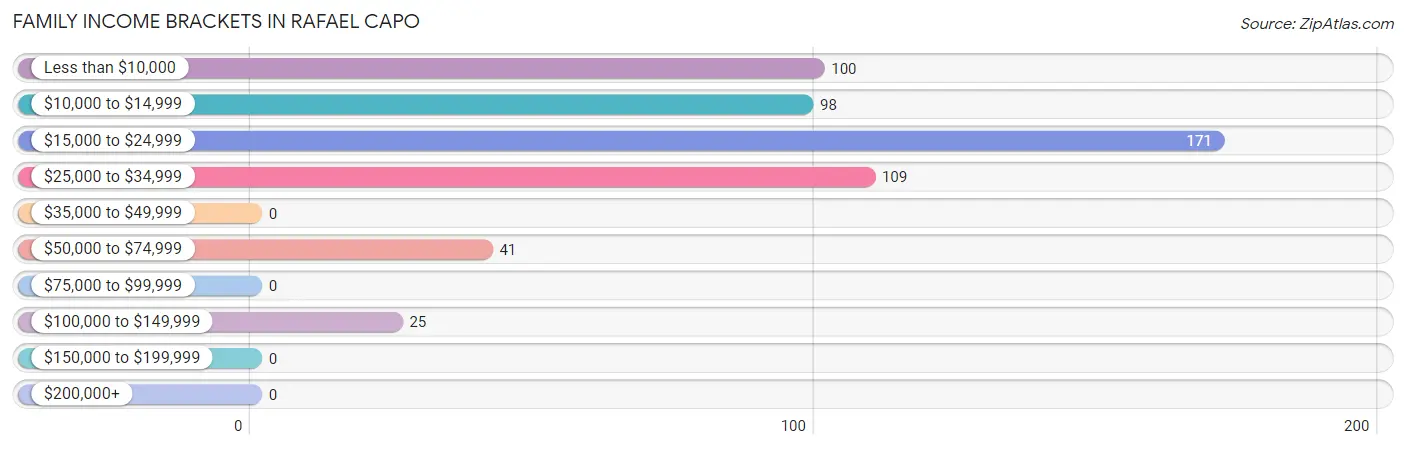
| Income Bracket | # Families | % Families |
| Less than $10,000 | 100 | 18.4% |
| $10,000 to $14,999 | 98 | 18.0% |
| $15,000 to $24,999 | 171 | 31.4% |
| $25,000 to $34,999 | 109 | 20.0% |
| $35,000 to $49,999 | 0 | 0.0% |
| $50,000 to $74,999 | 41 | 7.5% |
| $75,000 to $99,999 | 0 | 0.0% |
| $100,000 to $149,999 | 25 | 4.6% |
| $150,000 to $199,999 | 0 | 0.0% |
| $200,000+ | 0 | 0.0% |
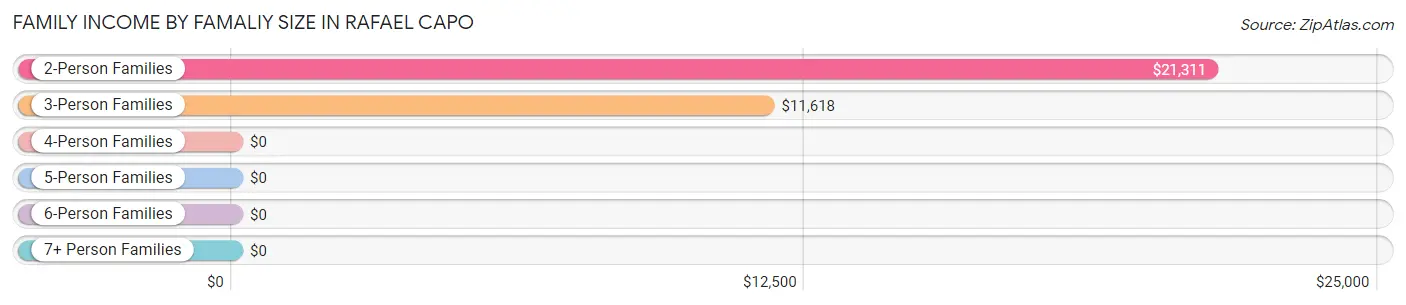
Family Income by Famaliy Size in Rafael Capo
2-person families (329 | 60.5%) account for the highest median family income in Rafael Capo with $21,311 per family, while 2-person families (329 | 60.5%) have the highest median income of $10,656 per family member.
| Income Bracket | # Families | Median Income |
| 2-Person Families | 329 (60.5%) | $21,311 |
| 3-Person Families | 158 (29.0%) | $11,618 |
| 4-Person Families | 57 (10.5%) | $0 |
| 5-Person Families | 0 (0.0%) | $0 |
| 6-Person Families | 0 (0.0%) | $0 |
| 7+ Person Families | 0 (0.0%) | $0 |
| Total | 544 (100.0%) | $19,784 |
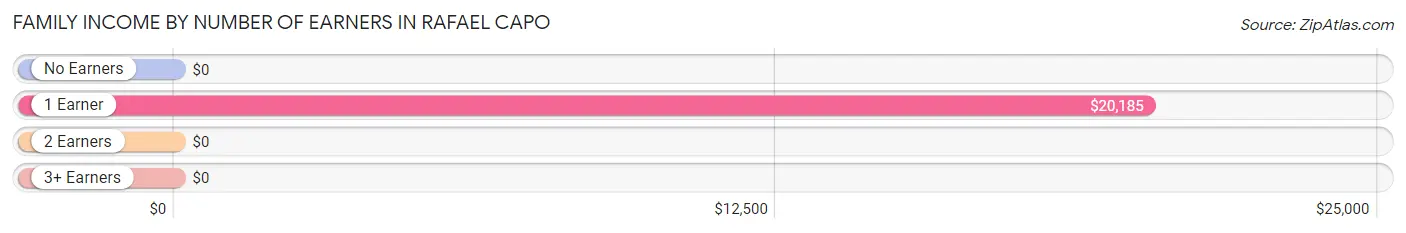
Family Income by Number of Earners in Rafael Capo
| Number of Earners | # Families | Median Income |
| No Earners | 378 (69.5%) | $0 |
| 1 Earner | 166 (30.5%) | $20,185 |
| 2 Earners | 0 (0.0%) | $0 |
| 3+ Earners | 0 (0.0%) | $0 |
| Total | 544 (100.0%) | $19,784 |
Household Income in Rafael Capo
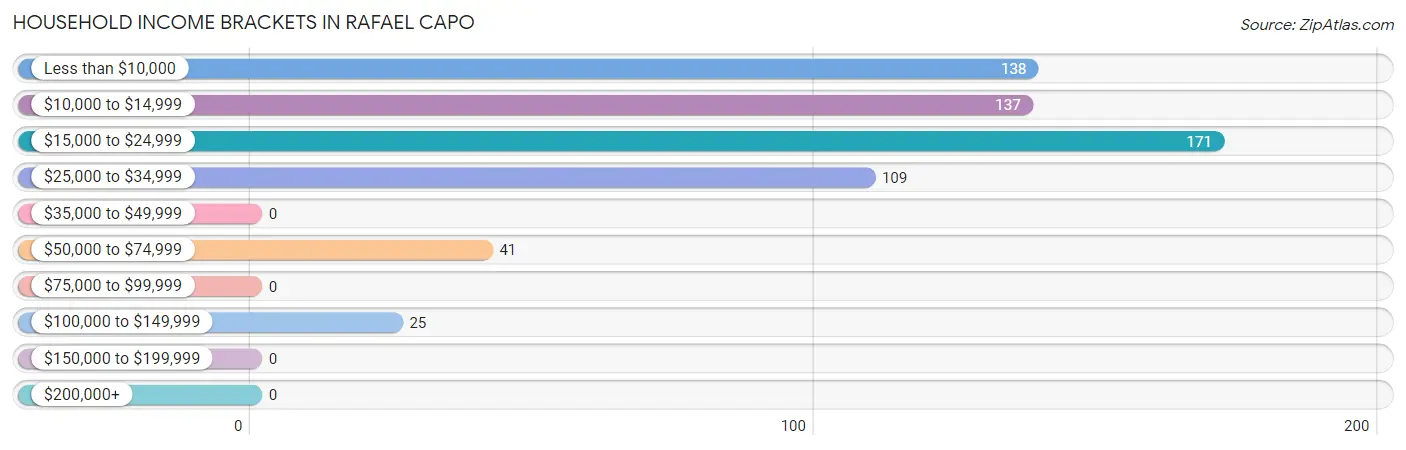
Household Income Brackets in Rafael Capo
With 171 households falling in the category, the $15,000 to $24,999 income range is the most frequent in Rafael Capo, accounting for 27.5% of all households.
| Income Bracket | # Households | % Households |
| Less than $10,000 | 138 | 22.2% |
| $10,000 to $14,999 | 137 | 22.1% |
| $15,000 to $24,999 | 171 | 27.5% |
| $25,000 to $34,999 | 109 | 17.6% |
| $35,000 to $49,999 | 0 | 0.0% |
| $50,000 to $74,999 | 41 | 6.6% |
| $75,000 to $99,999 | 0 | 0.0% |
| $100,000 to $149,999 | 25 | 4.0% |
| $150,000 to $199,999 | 0 | 0.0% |
| $200,000+ | 0 | 0.0% |
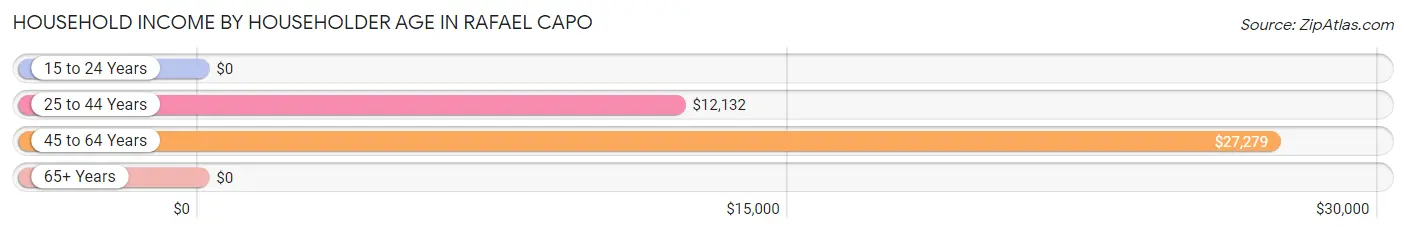
Household Income by Householder Age in Rafael Capo
The median household income in Rafael Capo is $18,596, with the highest median household income of $27,279 found in the 45 to 64 years age bracket for the primary householder. A total of 125 households (20.1%) fall into this category.
| Income Bracket | # Households | Median Income |
| 15 to 24 Years | 0 (0.0%) | $0 |
| 25 to 44 Years | 173 (27.9%) | $12,132 |
| 45 to 64 Years | 125 (20.1%) | $27,279 |
| 65+ Years | 323 (52.0%) | $0 |
| Total | 621 (100.0%) | $18,596 |
Poverty in Rafael Capo
Income Below Poverty by Sex and Age in Rafael Capo
With 60.7% poverty level for males and 73.4% for females among the residents of Rafael Capo, under 5 year old males and 6 to 11 year old females are the most vulnerable to poverty, with 29 males (100.0%) and 23 females (100.0%) in their respective age groups living below the poverty level.
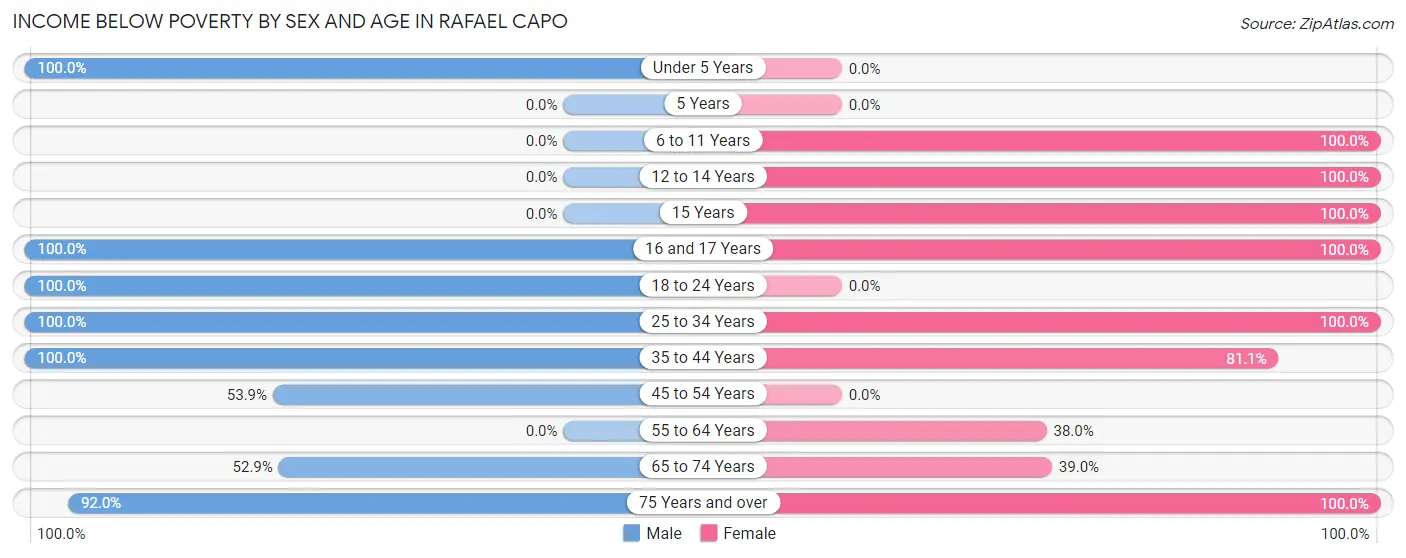
| Age Bracket | Male | Female |
| Under 5 Years | 29 (100.0%) | 0 (0.0%) |
| 5 Years | 0 (0.0%) | 0 (0.0%) |
| 6 to 11 Years | 0 (0.0%) | 23 (100.0%) |
| 12 to 14 Years | 0 (0.0%) | 63 (100.0%) |
| 15 Years | 0 (0.0%) | 34 (100.0%) |
| 16 and 17 Years | 23 (100.0%) | 97 (100.0%) |
| 18 to 24 Years | 23 (100.0%) | 0 (0.0%) |
| 25 to 34 Years | 40 (100.0%) | 83 (100.0%) |
| 35 to 44 Years | 27 (100.0%) | 137 (81.1%) |
| 45 to 54 Years | 55 (53.9%) | 0 (0.0%) |
| 55 to 64 Years | 0 (0.0%) | 65 (38.0%) |
| 65 to 74 Years | 102 (52.8%) | 39 (39.0%) |
| 75 Years and over | 160 (91.9%) | 98 (100.0%) |
| Total | 459 (60.7%) | 639 (73.4%) |
Income Above Poverty by Sex and Age in Rafael Capo
According to the poverty statistics in Rafael Capo, males aged 6 to 11 years and females aged 45 to 54 years are the age groups that are most secure financially, with 100.0% of males and 100.0% of females in these age groups living above the poverty line.
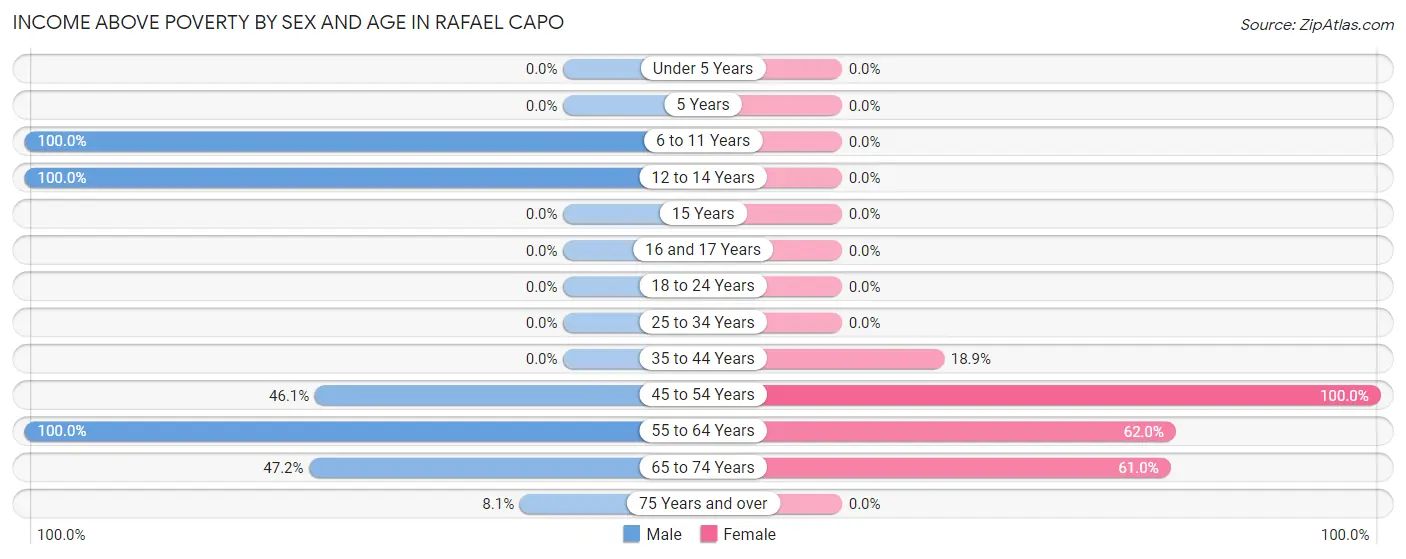
| Age Bracket | Male | Female |
| Under 5 Years | 0 (0.0%) | 0 (0.0%) |
| 5 Years | 0 (0.0%) | 0 (0.0%) |
| 6 to 11 Years | 41 (100.0%) | 0 (0.0%) |
| 12 to 14 Years | 41 (100.0%) | 0 (0.0%) |
| 15 Years | 0 (0.0%) | 0 (0.0%) |
| 16 and 17 Years | 0 (0.0%) | 0 (0.0%) |
| 18 to 24 Years | 0 (0.0%) | 0 (0.0%) |
| 25 to 34 Years | 0 (0.0%) | 0 (0.0%) |
| 35 to 44 Years | 0 (0.0%) | 32 (18.9%) |
| 45 to 54 Years | 47 (46.1%) | 33 (100.0%) |
| 55 to 64 Years | 63 (100.0%) | 106 (62.0%) |
| 65 to 74 Years | 91 (47.1%) | 61 (61.0%) |
| 75 Years and over | 14 (8.1%) | 0 (0.0%) |
| Total | 297 (39.3%) | 232 (26.6%) |
Income Below Poverty Among Married-Couple Families in Rafael Capo
The poverty statistics for married-couple families in Rafael Capo show that 41.1% or 141 of the total 343 families live below the poverty line. Families with 1 or 2 children have the highest poverty rate of 47.4%, comprising of 27 families. On the other hand, families with no children have the lowest poverty rate of 39.9%, which includes 114 families.
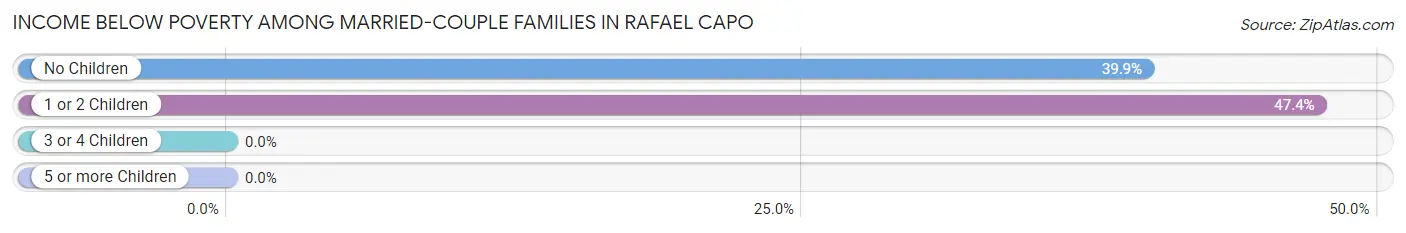
| Children | Above Poverty | Below Poverty |
| No Children | 172 (60.1%) | 114 (39.9%) |
| 1 or 2 Children | 30 (52.6%) | 27 (47.4%) |
| 3 or 4 Children | 0 (0.0%) | 0 (0.0%) |
| 5 or more Children | 0 (0.0%) | 0 (0.0%) |
| Total | 202 (58.9%) | 141 (41.1%) |
Income Below Poverty Among Single-Parent Households in Rafael Capo
According to the poverty data in Rafael Capo, 72.6% or 37 single-father households and 100.0% or 150 single-mother households are living below the poverty line. Among single-father households, those with no children have the highest poverty rate, with 37 households (72.6%) experiencing poverty. Likewise, among single-mother households, those with no children have the highest poverty rate, with 44 households (100.0%) falling below the poverty line.
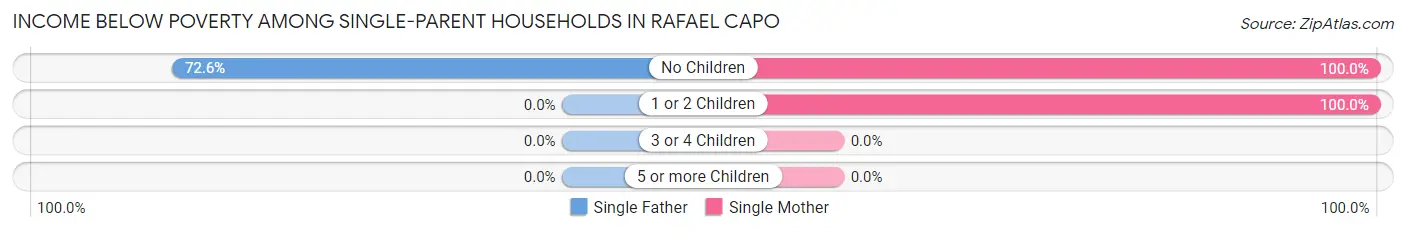
| Children | Single Father | Single Mother |
| No Children | 37 (72.6%) | 44 (100.0%) |
| 1 or 2 Children | 0 (0.0%) | 106 (100.0%) |
| 3 or 4 Children | 0 (0.0%) | 0 (0.0%) |
| 5 or more Children | 0 (0.0%) | 0 (0.0%) |
| Total | 37 (72.6%) | 150 (100.0%) |
Income Below Poverty Among Married-Couple vs Single-Parent Households in Rafael Capo
The poverty data for Rafael Capo shows that 141 of the married-couple family households (41.1%) and 187 of the single-parent households (93.0%) are living below the poverty level. Within the married-couple family households, those with 1 or 2 children have the highest poverty rate, with 27 households (47.4%) falling below the poverty line. Among the single-parent households, those with 1 or 2 children have the highest poverty rate, with 106 household (100.0%) living below poverty.
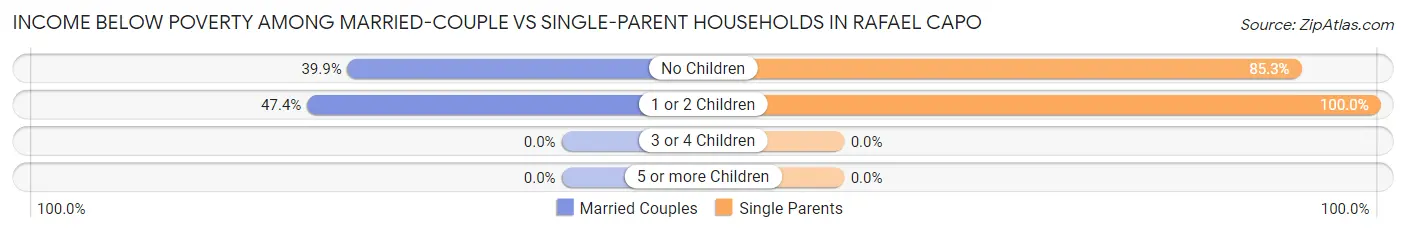
| Children | Married-Couple Families | Single-Parent Households |
| No Children | 114 (39.9%) | 81 (85.3%) |
| 1 or 2 Children | 27 (47.4%) | 106 (100.0%) |
| 3 or 4 Children | 0 (0.0%) | 0 (0.0%) |
| 5 or more Children | 0 (0.0%) | 0 (0.0%) |
| Total | 141 (41.1%) | 187 (93.0%) |
Race in Rafael Capo
The most populous races in Rafael Capo are Hispanic or Latino (1,627 | 100.0%), White / Caucasian (1,449 | 89.1%), and Some other Race (105 | 6.5%).
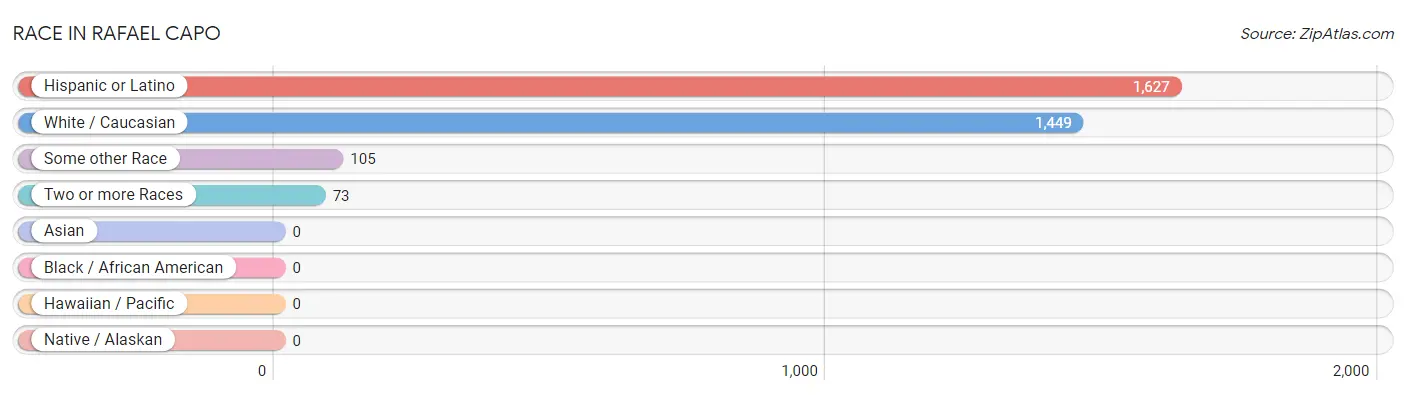
| Race | # Population | % Population |
| Asian | 0 | 0.0% |
| Black / African American | 0 | 0.0% |
| Hawaiian / Pacific | 0 | 0.0% |
| Hispanic or Latino | 1,627 | 100.0% |
| Native / Alaskan | 0 | 0.0% |
| White / Caucasian | 1,449 | 89.1% |
| Two or more Races | 73 | 4.5% |
| Some other Race | 105 | 6.5% |
| Total | 1,627 | 100.0% |
Ancestry in Rafael Capo
The most populous ancestries reported in Rafael Capo are Puerto Rican (1,627 | 100.0%), American (77 | 4.7%), Central American Indian (30 | 1.8%), and West Indian (30 | 1.8%), together accounting for 108.4% of all Rafael Capo residents.
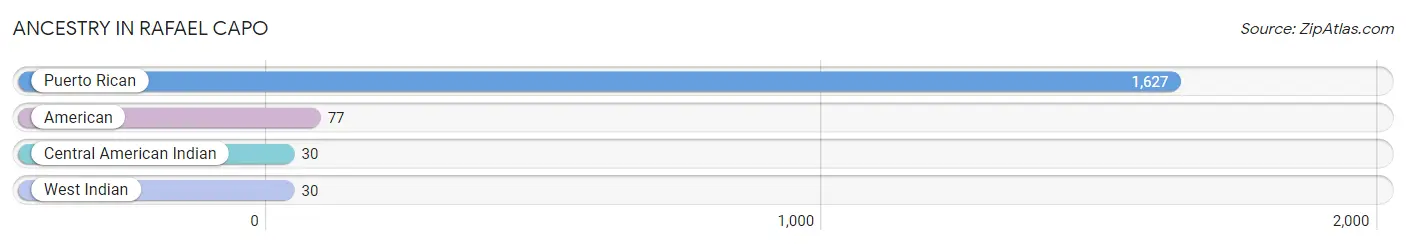
| Ancestry | # Population | % Population |
| American | 77 | 4.7% |
| Central American Indian | 30 | 1.8% |
| Puerto Rican | 1,627 | 100.0% |
| West Indian | 30 | 1.8% | View All 4 Rows |
Immigrants in Rafael Capo

| Immigration Origin | # Population | % Population | View All 0 Rows |
Sex and Age in Rafael Capo
Sex and Age in Rafael Capo
The most populous age groups in Rafael Capo are 75 to 79 Years (128 | 16.9%) for men and 15 to 19 Years (131 | 15.0%) for women.
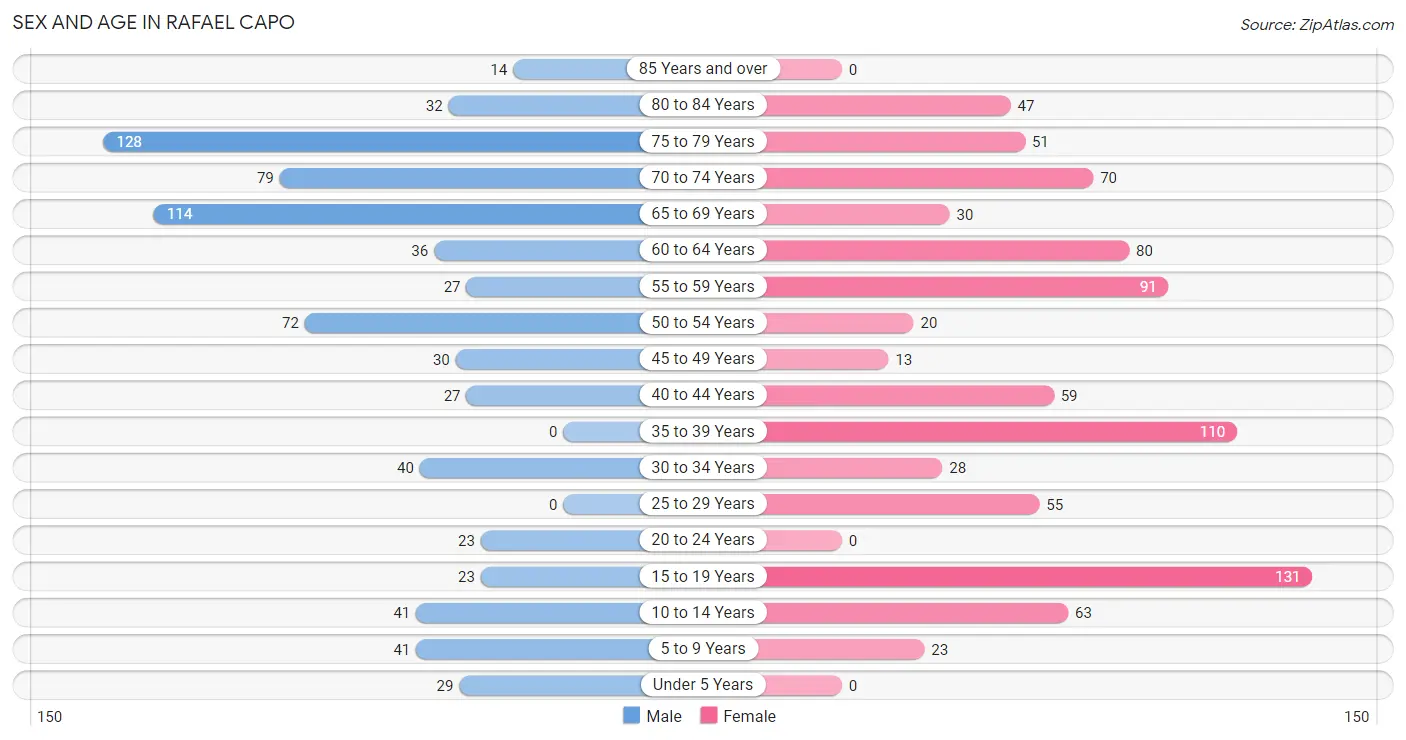
| Age Bracket | Male | Female |
| Under 5 Years | 29 (3.8%) | 0 (0.0%) |
| 5 to 9 Years | 41 (5.4%) | 23 (2.6%) |
| 10 to 14 Years | 41 (5.4%) | 63 (7.2%) |
| 15 to 19 Years | 23 (3.0%) | 131 (15.0%) |
| 20 to 24 Years | 23 (3.0%) | 0 (0.0%) |
| 25 to 29 Years | 0 (0.0%) | 55 (6.3%) |
| 30 to 34 Years | 40 (5.3%) | 28 (3.2%) |
| 35 to 39 Years | 0 (0.0%) | 110 (12.6%) |
| 40 to 44 Years | 27 (3.6%) | 59 (6.8%) |
| 45 to 49 Years | 30 (4.0%) | 13 (1.5%) |
| 50 to 54 Years | 72 (9.5%) | 20 (2.3%) |
| 55 to 59 Years | 27 (3.6%) | 91 (10.4%) |
| 60 to 64 Years | 36 (4.8%) | 80 (9.2%) |
| 65 to 69 Years | 114 (15.1%) | 30 (3.4%) |
| 70 to 74 Years | 79 (10.4%) | 70 (8.0%) |
| 75 to 79 Years | 128 (16.9%) | 51 (5.9%) |
| 80 to 84 Years | 32 (4.2%) | 47 (5.4%) |
| 85 Years and over | 14 (1.8%) | 0 (0.0%) |
| Total | 756 (100.0%) | 871 (100.0%) |
Families and Households in Rafael Capo
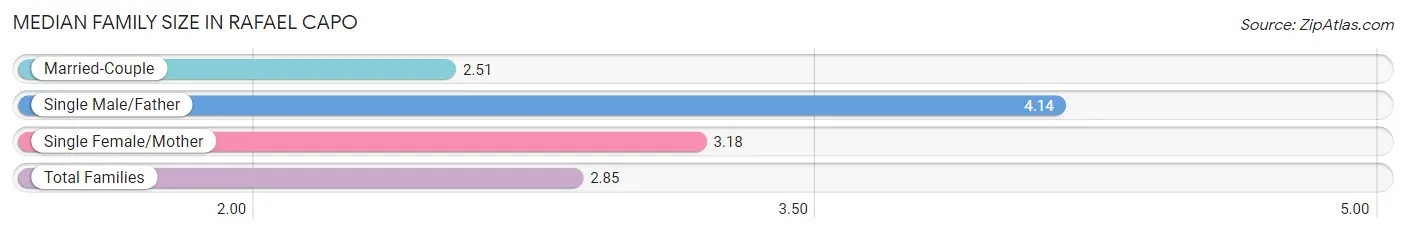
Median Family Size in Rafael Capo
The median family size in Rafael Capo is 2.85 persons per family, with single male/father families (51 | 9.4%) accounting for the largest median family size of 4.14 persons per family. On the other hand, married-couple families (343 | 63.0%) represent the smallest median family size with 2.51 persons per family.
| Family Type | # Families | Family Size |
| Married-Couple | 343 (63.0%) | 2.51 |
| Single Male/Father | 51 (9.4%) | 4.14 |
| Single Female/Mother | 150 (27.6%) | 3.18 |
| Total Families | 544 (100.0%) | 2.85 |
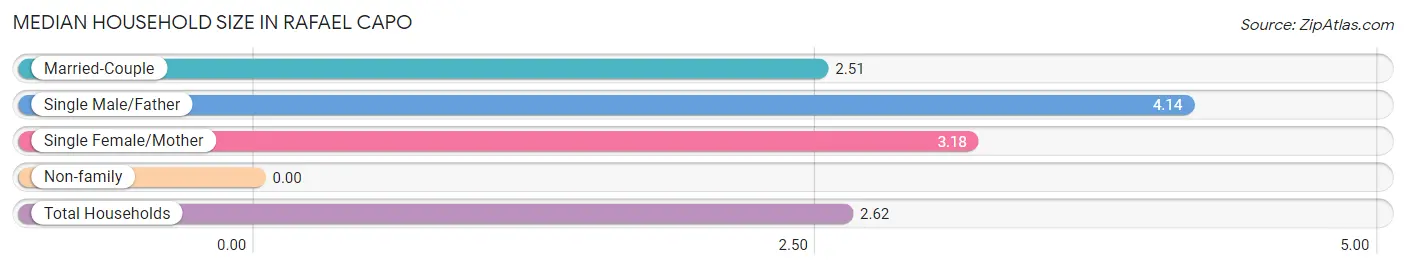
Median Household Size in Rafael Capo
| Household Type | # Households | Household Size |
| Married-Couple | 343 (55.2%) | 2.51 |
| Single Male/Father | 51 (8.2%) | 4.14 |
| Single Female/Mother | 150 (24.1%) | 3.18 |
| Non-family | 77 (12.4%) | - |
| Total Households | 621 (100.0%) | 2.62 |
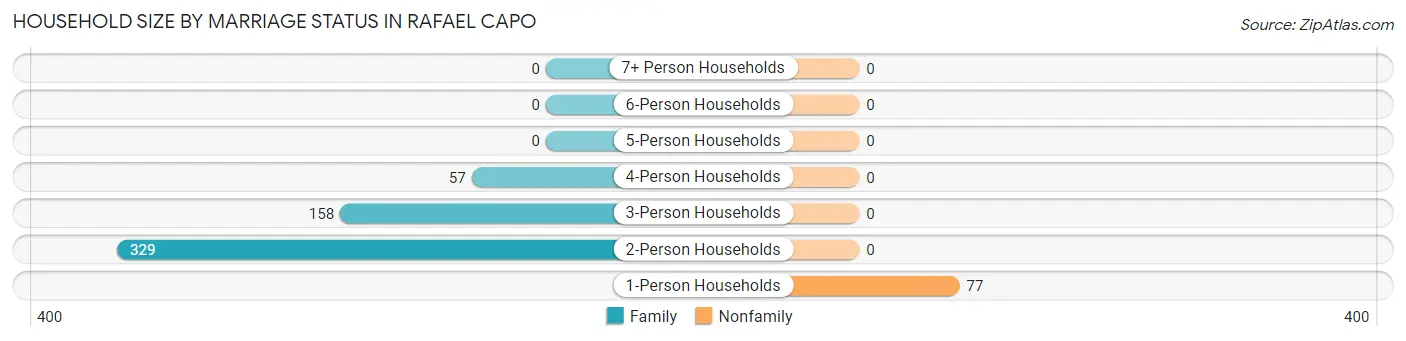
Household Size by Marriage Status in Rafael Capo
Out of a total of 621 households in Rafael Capo, 544 (87.6%) are family households, while 77 (12.4%) are nonfamily households. The most numerous type of family households are 2-person households, comprising 329, and the most common type of nonfamily households are 1-person households, comprising 77.
| Household Size | Family Households | Nonfamily Households |
| 1-Person Households | - | 77 (12.4%) |
| 2-Person Households | 329 (53.0%) | 0 (0.0%) |
| 3-Person Households | 158 (25.4%) | 0 (0.0%) |
| 4-Person Households | 57 (9.2%) | 0 (0.0%) |
| 5-Person Households | 0 (0.0%) | 0 (0.0%) |
| 6-Person Households | 0 (0.0%) | 0 (0.0%) |
| 7+ Person Households | 0 (0.0%) | 0 (0.0%) |
| Total | 544 (87.6%) | 77 (12.4%) |
Female Fertility in Rafael Capo
Fertility by Age in Rafael Capo
| Age Bracket | Women with Births | Births / 1,000 Women |
| 15 to 19 years | 0 (0.0%) | 0.0 |
| 20 to 34 years | 0 (0.0%) | 0.0 |
| 35 to 50 years | 0 (0.0%) | 0.0 |
| Total | 0 (0.0%) | 0.0 |
Fertility by Age by Marriage Status in Rafael Capo
| Age Bracket | Married | Unmarried |
| 15 to 19 years | 0 (0.0%) | 0 (0.0%) |
| 20 to 34 years | 0 (0.0%) | 0 (0.0%) |
| 35 to 50 years | 0 (0.0%) | 0 (0.0%) |
| Total | 0 (0.0%) | 0 (0.0%) |
Fertility by Education in Rafael Capo
| Educational Attainment | Women with Births | Births / 1,000 Women |
| Less than High School | 0 (0.0%) | 0.0 |
| High School Diploma | 0 (0.0%) | 0.0 |
| College or Associate's Degree | 0 (0.0%) | 0.0 |
| Bachelor's Degree | 0 (0.0%) | 0.0 |
| Graduate Degree | 0 (0.0%) | 0.0 |
| Total | 0 (0.0%) | 0.0 |
Fertility by Education by Marriage Status in Rafael Capo
| Educational Attainment | Married | Unmarried |
| Less than High School | 0 (0.0%) | 0 (0.0%) |
| High School Diploma | 0 (0.0%) | 0 (0.0%) |
| College or Associate's Degree | 0 (0.0%) | 0 (0.0%) |
| Bachelor's Degree | 0 (0.0%) | 0 (0.0%) |
| Graduate Degree | 0 (0.0%) | 0 (0.0%) |
| Total | 0 (0.0%) | 0 (0.0%) |
Employment Characteristics in Rafael Capo
Employment by Class of Employer in Rafael Capo
Among the 205 employed individuals in Rafael Capo, private company employees (139 | 67.8%), state government employees (41 | 20.0%), and self-employed (not incorporated) (25 | 12.2%) make up the most common classes of employment.
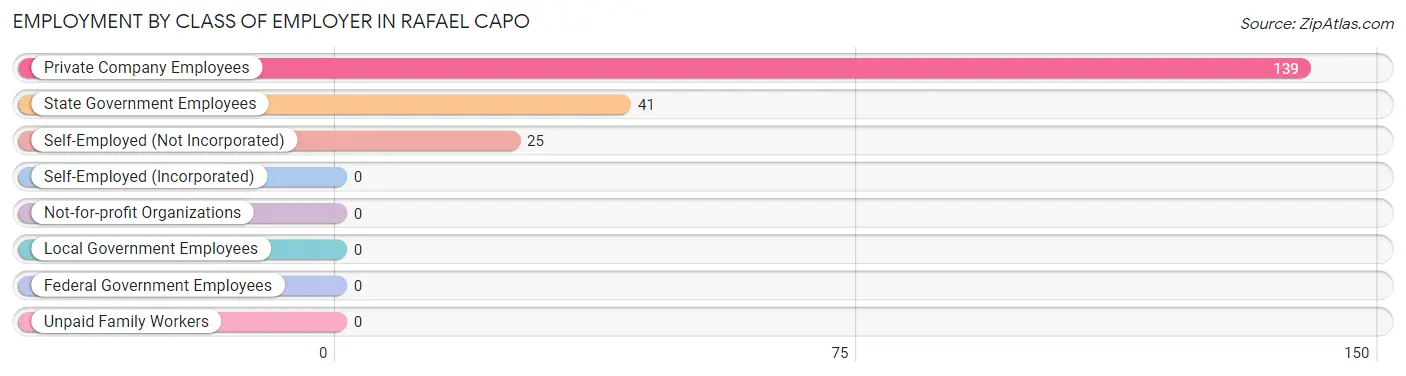
| Employer Class | # Employees | % Employees |
| Private Company Employees | 139 | 67.8% |
| Self-Employed (Incorporated) | 0 | 0.0% |
| Self-Employed (Not Incorporated) | 25 | 12.2% |
| Not-for-profit Organizations | 0 | 0.0% |
| Local Government Employees | 0 | 0.0% |
| State Government Employees | 41 | 20.0% |
| Federal Government Employees | 0 | 0.0% |
| Unpaid Family Workers | 0 | 0.0% |
| Total | 205 | 100.0% |
Employment Status by Age in Rafael Capo
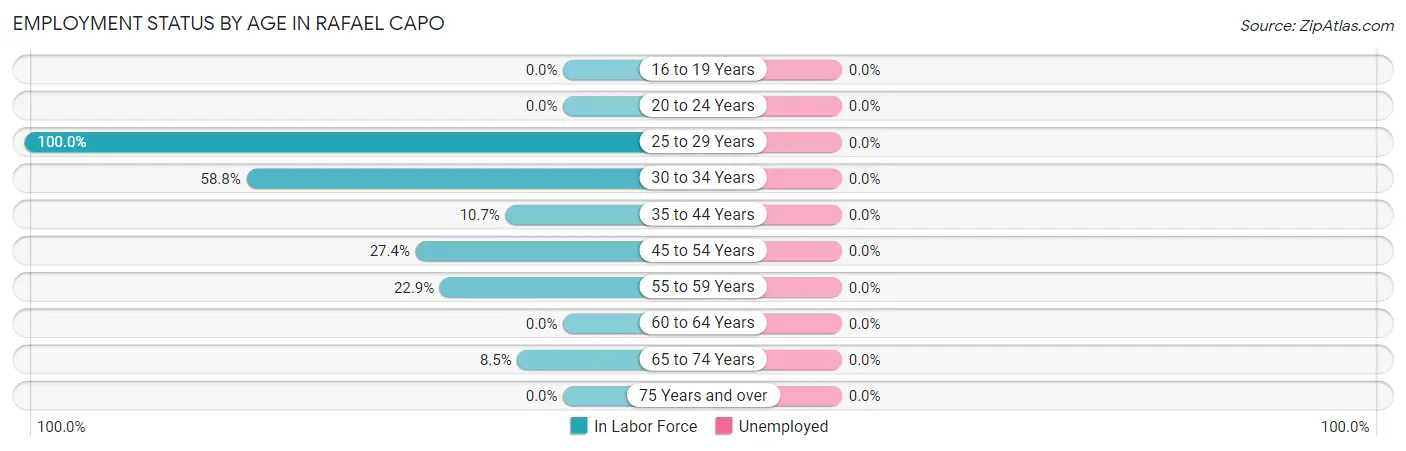
| Age Bracket | In Labor Force | Unemployed |
| 16 to 19 Years | 0 (0.0%) | 0 (0.0%) |
| 20 to 24 Years | 0 (0.0%) | 0 (0.0%) |
| 25 to 29 Years | 55 (100.0%) | 0 (0.0%) |
| 30 to 34 Years | 40 (58.8%) | 0 (0.0%) |
| 35 to 44 Years | 21 (10.7%) | 0 (0.0%) |
| 45 to 54 Years | 37 (27.4%) | 0 (0.0%) |
| 55 to 59 Years | 27 (22.9%) | 0 (0.0%) |
| 60 to 64 Years | 0 (0.0%) | 0 (0.0%) |
| 65 to 74 Years | 25 (8.5%) | 0 (0.0%) |
| 75 Years and over | 0 (0.0%) | 0 (0.0%) |
| Total | 205 (14.7%) | 0 (0.0%) |
Employment Status by Educational Attainment in Rafael Capo
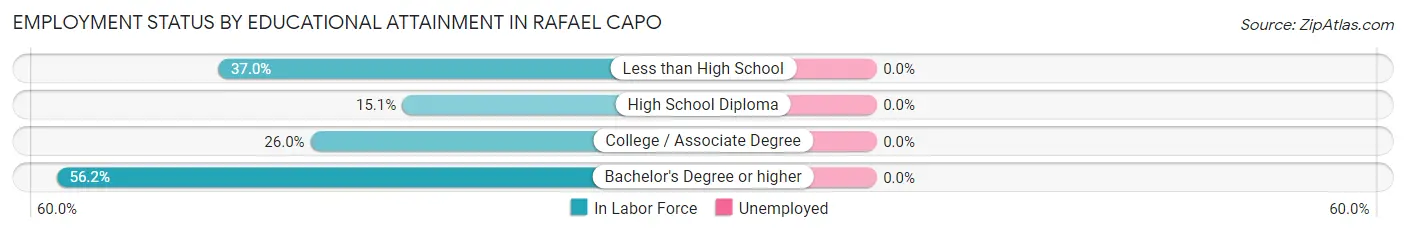
| Educational Attainment | In Labor Force | Unemployed |
| Less than High School | 27 (37.0%) | 0 (0.0%) |
| High School Diploma | 40 (15.1%) | 0 (0.0%) |
| College / Associate Degree | 72 (26.0%) | 0 (0.0%) |
| Bachelor's Degree or higher | 41 (56.2%) | 0 (0.0%) |
| Total | 180 (26.2%) | 0 (0.0%) |
Employment Occupations by Sex in Rafael Capo
Management, Business, Science and Arts Occupations
The most common Management, Business, Science and Arts occupations in Rafael Capo are Community & Social Service (96 | 46.8%), Education Instruction & Library (96 | 46.8%), and Management (52 | 25.4%).
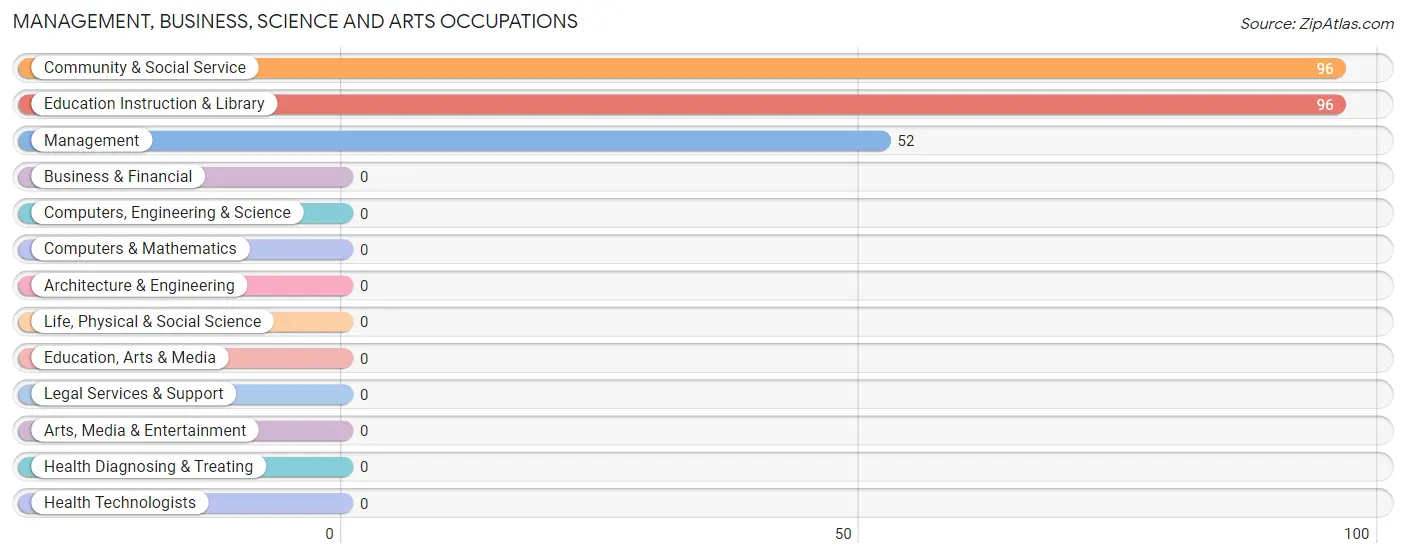
Management, Business, Science and Arts Occupations by Sex
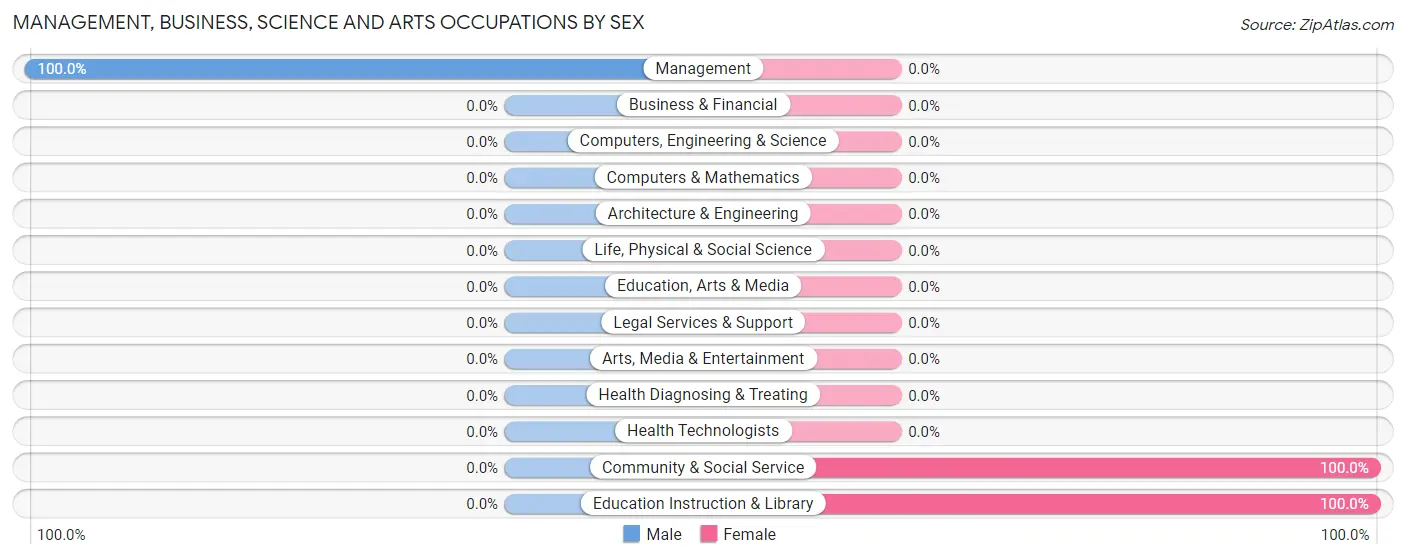
| Occupation | Male | Female |
| Management | 52 (100.0%) | 0 (0.0%) |
| Business & Financial | 0 (0.0%) | 0 (0.0%) |
| Computers, Engineering & Science | 0 (0.0%) | 0 (0.0%) |
| Computers & Mathematics | 0 (0.0%) | 0 (0.0%) |
| Architecture & Engineering | 0 (0.0%) | 0 (0.0%) |
| Life, Physical & Social Science | 0 (0.0%) | 0 (0.0%) |
| Community & Social Service | 0 (0.0%) | 96 (100.0%) |
| Education, Arts & Media | 0 (0.0%) | 0 (0.0%) |
| Legal Services & Support | 0 (0.0%) | 0 (0.0%) |
| Education Instruction & Library | 0 (0.0%) | 96 (100.0%) |
| Arts, Media & Entertainment | 0 (0.0%) | 0 (0.0%) |
| Health Diagnosing & Treating | 0 (0.0%) | 0 (0.0%) |
| Health Technologists | 0 (0.0%) | 0 (0.0%) |
| Total (Category) | 52 (35.1%) | 96 (64.9%) |
| Total (Overall) | 109 (53.2%) | 96 (46.8%) |
Services Occupations
Services Occupations by Sex
| Occupation | Male | Female |
| Healthcare Support | 0 (0.0%) | 0 (0.0%) |
| Security & Protection | 0 (0.0%) | 0 (0.0%) |
| Firefighting & Prevention | 0 (0.0%) | 0 (0.0%) |
| Law Enforcement | 0 (0.0%) | 0 (0.0%) |
| Food Preparation & Serving | 0 (0.0%) | 0 (0.0%) |
| Cleaning & Maintenance | 0 (0.0%) | 0 (0.0%) |
| Personal Care & Service | 0 (0.0%) | 0 (0.0%) |
| Total (Category) | 0 (0.0%) | 0 (0.0%) |
| Total (Overall) | 109 (53.2%) | 96 (46.8%) |
Sales and Office Occupations
Sales and Office Occupations by Sex
| Occupation | Male | Female |
| Sales & Related | 0 (0.0%) | 0 (0.0%) |
| Office & Administration | 0 (0.0%) | 0 (0.0%) |
| Total (Category) | 0 (0.0%) | 0 (0.0%) |
| Total (Overall) | 109 (53.2%) | 96 (46.8%) |
Natural Resources, Construction and Maintenance Occupations
Natural Resources, Construction and Maintenance Occupations by Sex
| Occupation | Male | Female |
| Farming, Fishing & Forestry | 0 (0.0%) | 0 (0.0%) |
| Construction & Extraction | 0 (0.0%) | 0 (0.0%) |
| Installation, Maintenance & Repair | 0 (0.0%) | 0 (0.0%) |
| Total (Category) | 0 (0.0%) | 0 (0.0%) |
| Total (Overall) | 109 (53.2%) | 96 (46.8%) |
Production, Transportation and Moving Occupations
The most common Production, Transportation and Moving occupations in Rafael Capo are , and Production (57 | 27.8%).
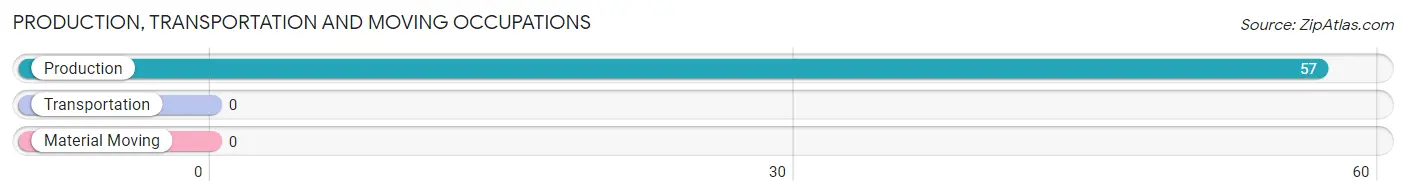
Production, Transportation and Moving Occupations by Sex
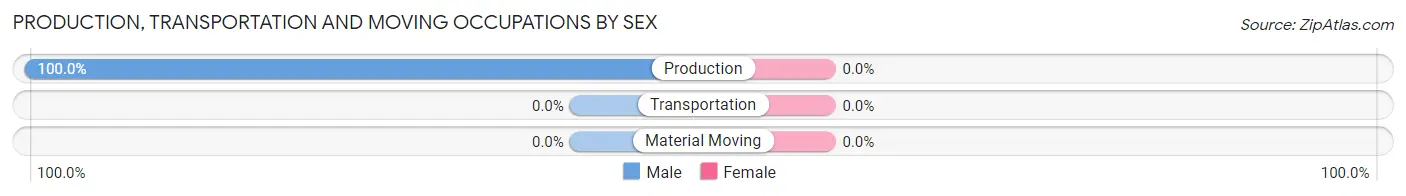
| Occupation | Male | Female |
| Production | 57 (100.0%) | 0 (0.0%) |
| Transportation | 0 (0.0%) | 0 (0.0%) |
| Material Moving | 0 (0.0%) | 0 (0.0%) |
| Total (Category) | 57 (100.0%) | 0 (0.0%) |
| Total (Overall) | 109 (53.2%) | 96 (46.8%) |
Employment Industries by Sex in Rafael Capo
Employment Industries in Rafael Capo
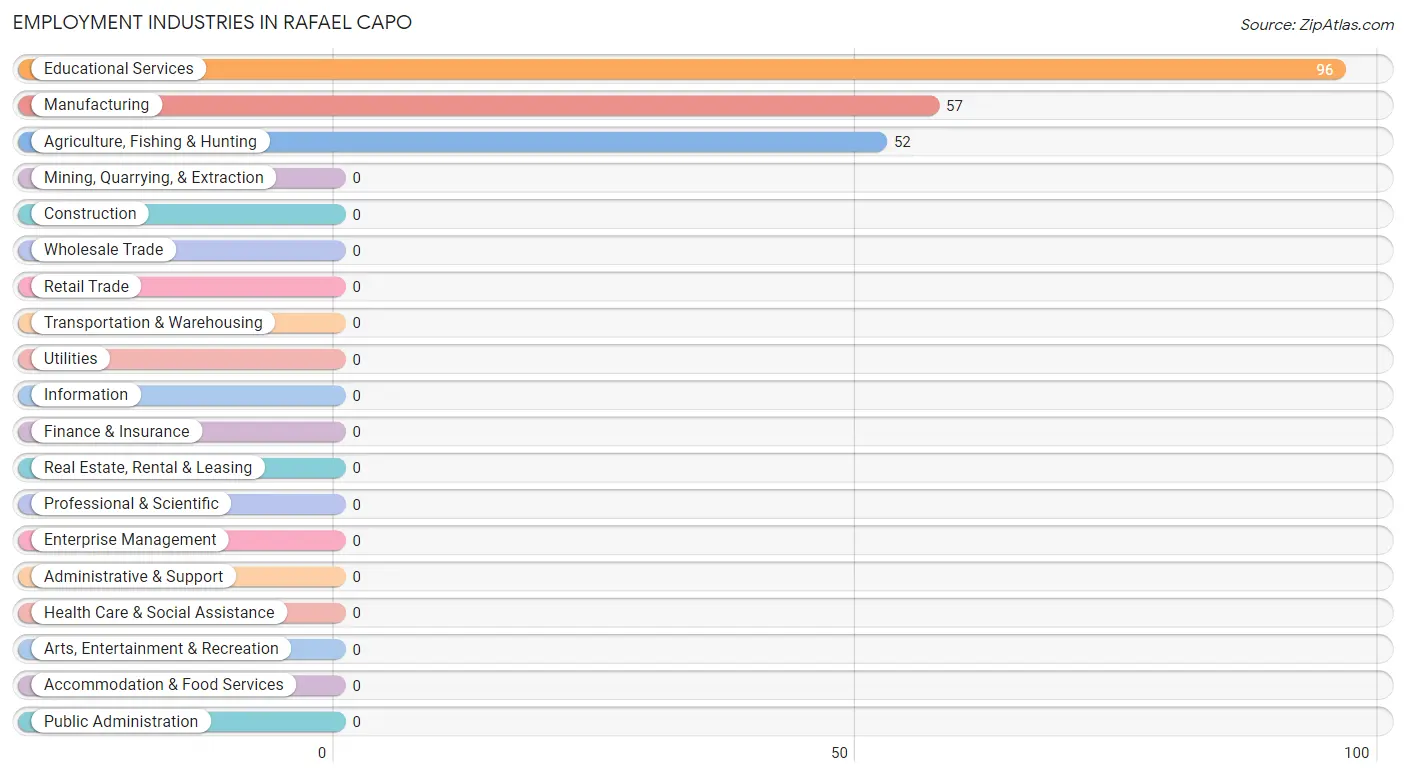
The major employment industries in Rafael Capo include Educational Services (96 | 46.8%), Manufacturing (57 | 27.8%), and Agriculture, Fishing & Hunting (52 | 25.4%).
Employment Industries by Sex in Rafael Capo
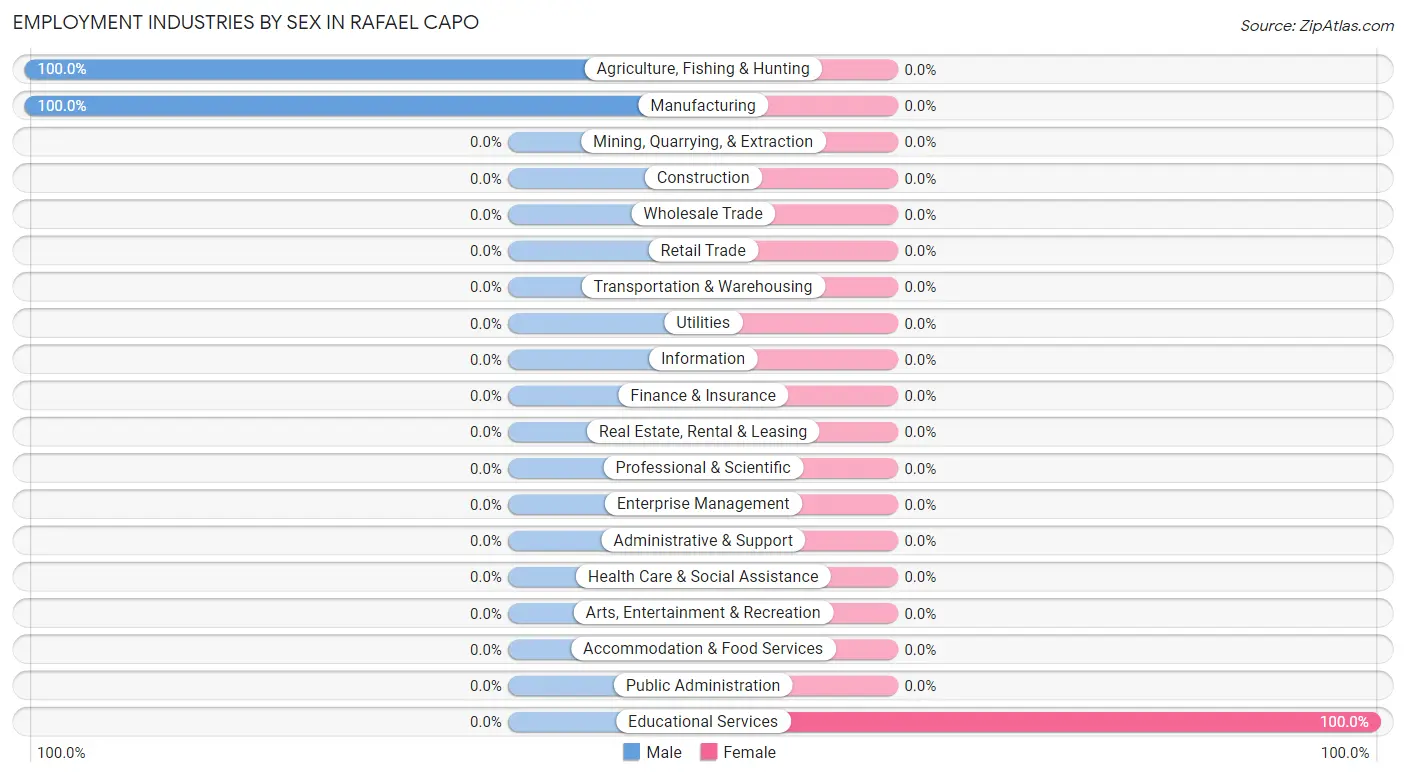
| Industry | Male | Female |
| Agriculture, Fishing & Hunting | 52 (100.0%) | 0 (0.0%) |
| Mining, Quarrying, & Extraction | 0 (0.0%) | 0 (0.0%) |
| Construction | 0 (0.0%) | 0 (0.0%) |
| Manufacturing | 57 (100.0%) | 0 (0.0%) |
| Wholesale Trade | 0 (0.0%) | 0 (0.0%) |
| Retail Trade | 0 (0.0%) | 0 (0.0%) |
| Transportation & Warehousing | 0 (0.0%) | 0 (0.0%) |
| Utilities | 0 (0.0%) | 0 (0.0%) |
| Information | 0 (0.0%) | 0 (0.0%) |
| Finance & Insurance | 0 (0.0%) | 0 (0.0%) |
| Real Estate, Rental & Leasing | 0 (0.0%) | 0 (0.0%) |
| Professional & Scientific | 0 (0.0%) | 0 (0.0%) |
| Enterprise Management | 0 (0.0%) | 0 (0.0%) |
| Administrative & Support | 0 (0.0%) | 0 (0.0%) |
| Educational Services | 0 (0.0%) | 96 (100.0%) |
| Health Care & Social Assistance | 0 (0.0%) | 0 (0.0%) |
| Arts, Entertainment & Recreation | 0 (0.0%) | 0 (0.0%) |
| Accommodation & Food Services | 0 (0.0%) | 0 (0.0%) |
| Public Administration | 0 (0.0%) | 0 (0.0%) |
| Total | 109 (53.2%) | 96 (46.8%) |
Education in Rafael Capo
School Enrollment in Rafael Capo
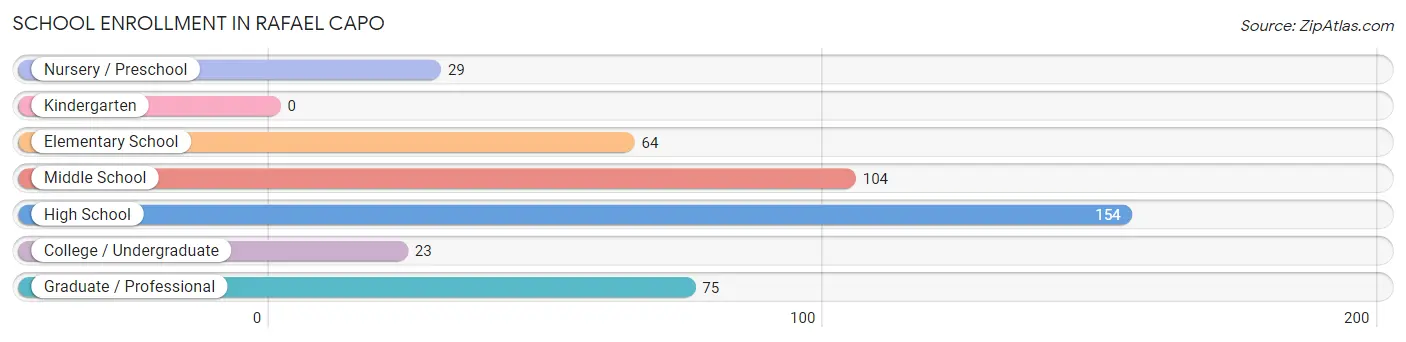
The most common levels of schooling among the 449 students in Rafael Capo are high school (154 | 34.3%), middle school (104 | 23.2%), and graduate / professional (75 | 16.7%).
| School Level | # Students | % Students |
| Nursery / Preschool | 29 | 6.5% |
| Kindergarten | 0 | 0.0% |
| Elementary School | 64 | 14.2% |
| Middle School | 104 | 23.2% |
| High School | 154 | 34.3% |
| College / Undergraduate | 23 | 5.1% |
| Graduate / Professional | 75 | 16.7% |
| Total | 449 | 100.0% |
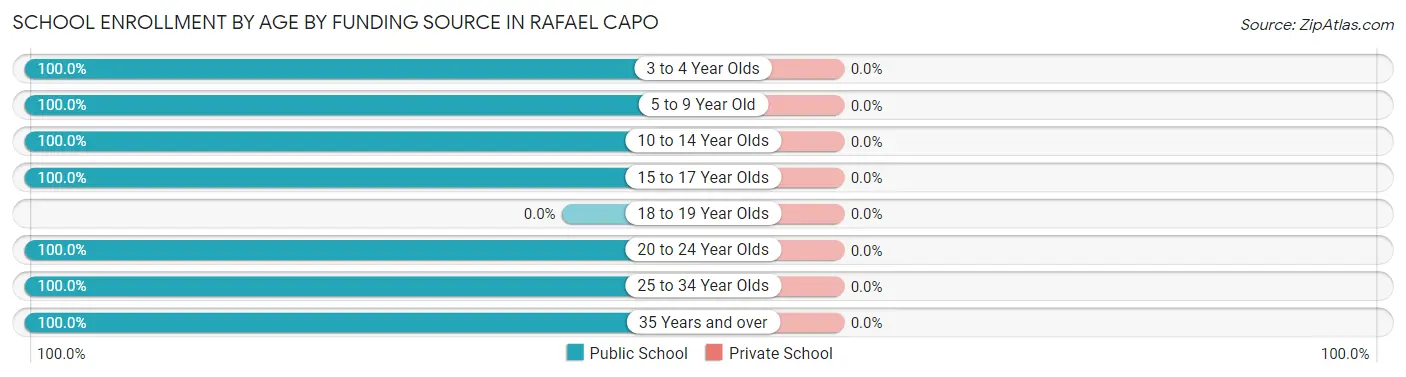
School Enrollment by Age by Funding Source in Rafael Capo
| Age Bracket | Public School | Private School |
| 3 to 4 Year Olds | 29 (100.0%) | 0 (0.0%) |
| 5 to 9 Year Old | 64 (100.0%) | 0 (0.0%) |
| 10 to 14 Year Olds | 104 (100.0%) | 0 (0.0%) |
| 15 to 17 Year Olds | 154 (100.0%) | 0 (0.0%) |
| 18 to 19 Year Olds | 0 (0.0%) | 0 (0.0%) |
| 20 to 24 Year Olds | 23 (100.0%) | 0 (0.0%) |
| 25 to 34 Year Olds | 55 (100.0%) | 0 (0.0%) |
| 35 Years and over | 20 (100.0%) | 0 (0.0%) |
| Total | 449 (100.0%) | 0 (0.0%) |
Educational Attainment by Field of Study in Rafael Capo
Bio, nature & agricultural (48 | 33.1%), education (41 | 28.3%), communications (32 | 22.1%), and business (24 | 16.6%) are the most common fields of study among 145 individuals in Rafael Capo who have obtained a bachelor's degree or higher.
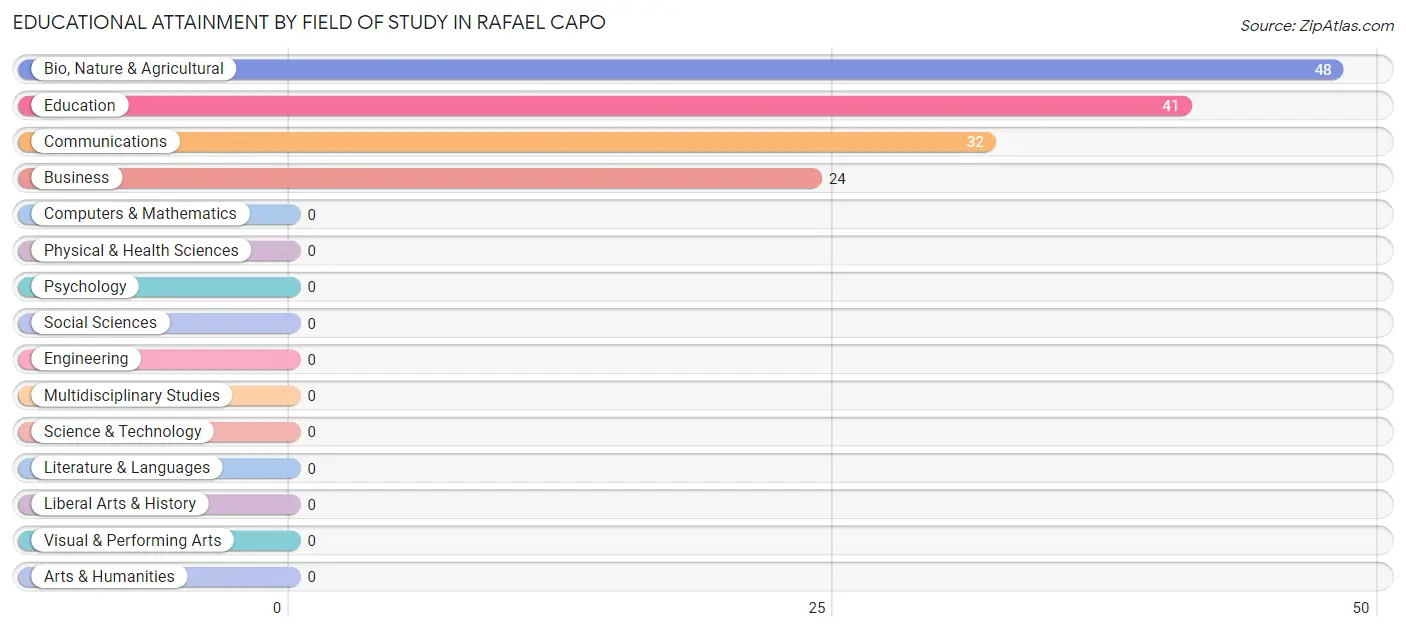
| Field of Study | # Graduates | % Graduates |
| Computers & Mathematics | 0 | 0.0% |
| Bio, Nature & Agricultural | 48 | 33.1% |
| Physical & Health Sciences | 0 | 0.0% |
| Psychology | 0 | 0.0% |
| Social Sciences | 0 | 0.0% |
| Engineering | 0 | 0.0% |
| Multidisciplinary Studies | 0 | 0.0% |
| Science & Technology | 0 | 0.0% |
| Business | 24 | 16.6% |
| Education | 41 | 28.3% |
| Literature & Languages | 0 | 0.0% |
| Liberal Arts & History | 0 | 0.0% |
| Visual & Performing Arts | 0 | 0.0% |
| Communications | 32 | 22.1% |
| Arts & Humanities | 0 | 0.0% |
| Total | 145 | 100.0% |
Transportation & Commute in Rafael Capo
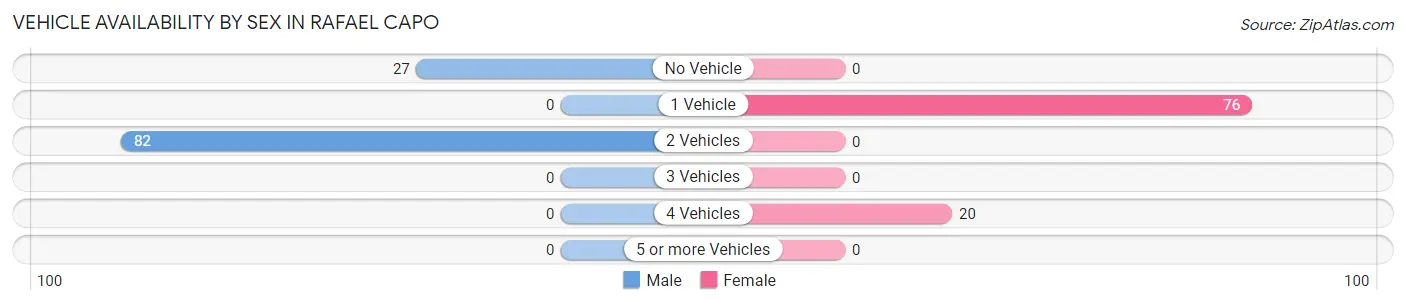
Vehicle Availability by Sex in Rafael Capo
The most prevalent vehicle ownership categories in Rafael Capo are males with 2 vehicles (82, accounting for 75.2%) and females with 2 vehicles (0, making up 85.4%).
| Vehicles Available | Male | Female |
| No Vehicle | 27 (24.8%) | 0 (0.0%) |
| 1 Vehicle | 0 (0.0%) | 76 (79.2%) |
| 2 Vehicles | 82 (75.2%) | 0 (0.0%) |
| 3 Vehicles | 0 (0.0%) | 0 (0.0%) |
| 4 Vehicles | 0 (0.0%) | 20 (20.8%) |
| 5 or more Vehicles | 0 (0.0%) | 0 (0.0%) |
| Total | 109 (100.0%) | 96 (100.0%) |
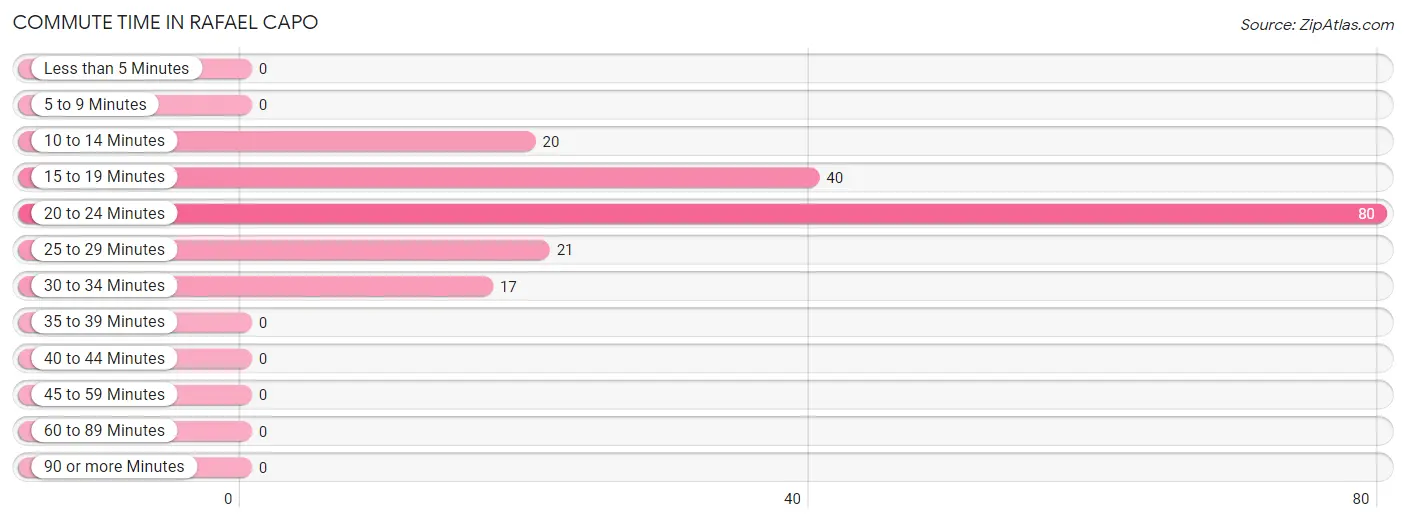
Commute Time in Rafael Capo
The most frequently occuring commute durations in Rafael Capo are 20 to 24 minutes (80 commuters, 44.9%), 15 to 19 minutes (40 commuters, 22.5%), and 25 to 29 minutes (21 commuters, 11.8%).
| Commute Time | # Commuters | % Commuters |
| Less than 5 Minutes | 0 | 0.0% |
| 5 to 9 Minutes | 0 | 0.0% |
| 10 to 14 Minutes | 20 | 11.2% |
| 15 to 19 Minutes | 40 | 22.5% |
| 20 to 24 Minutes | 80 | 44.9% |
| 25 to 29 Minutes | 21 | 11.8% |
| 30 to 34 Minutes | 17 | 9.6% |
| 35 to 39 Minutes | 0 | 0.0% |
| 40 to 44 Minutes | 0 | 0.0% |
| 45 to 59 Minutes | 0 | 0.0% |
| 60 to 89 Minutes | 0 | 0.0% |
| 90 or more Minutes | 0 | 0.0% |
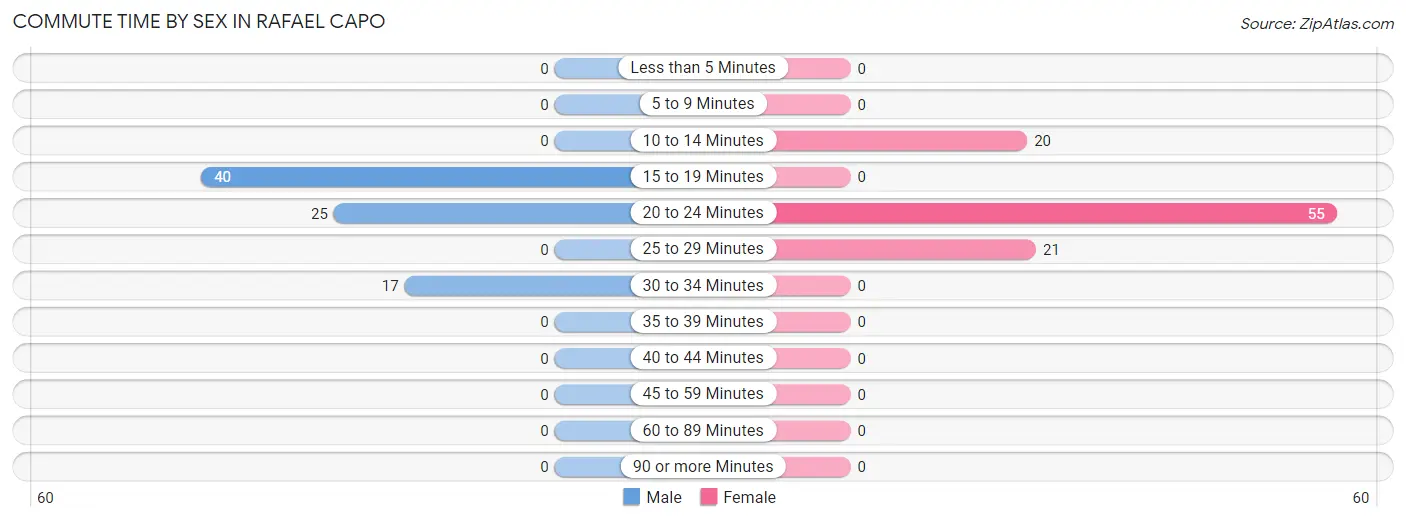
Commute Time by Sex in Rafael Capo
The most common commute times in Rafael Capo are 15 to 19 minutes (40 commuters, 48.8%) for males and 20 to 24 minutes (55 commuters, 57.3%) for females.
| Commute Time | Male | Female |
| Less than 5 Minutes | 0 (0.0%) | 0 (0.0%) |
| 5 to 9 Minutes | 0 (0.0%) | 0 (0.0%) |
| 10 to 14 Minutes | 0 (0.0%) | 20 (20.8%) |
| 15 to 19 Minutes | 40 (48.8%) | 0 (0.0%) |
| 20 to 24 Minutes | 25 (30.5%) | 55 (57.3%) |
| 25 to 29 Minutes | 0 (0.0%) | 21 (21.9%) |
| 30 to 34 Minutes | 17 (20.7%) | 0 (0.0%) |
| 35 to 39 Minutes | 0 (0.0%) | 0 (0.0%) |
| 40 to 44 Minutes | 0 (0.0%) | 0 (0.0%) |
| 45 to 59 Minutes | 0 (0.0%) | 0 (0.0%) |
| 60 to 89 Minutes | 0 (0.0%) | 0 (0.0%) |
| 90 or more Minutes | 0 (0.0%) | 0 (0.0%) |
Time of Departure to Work by Sex in Rafael Capo
The most frequent times of departure to work in Rafael Capo are 8:00 AM to 8:29 AM (40, 48.8%) for males and 9:00 AM to 9:59 AM (55, 57.3%) for females.
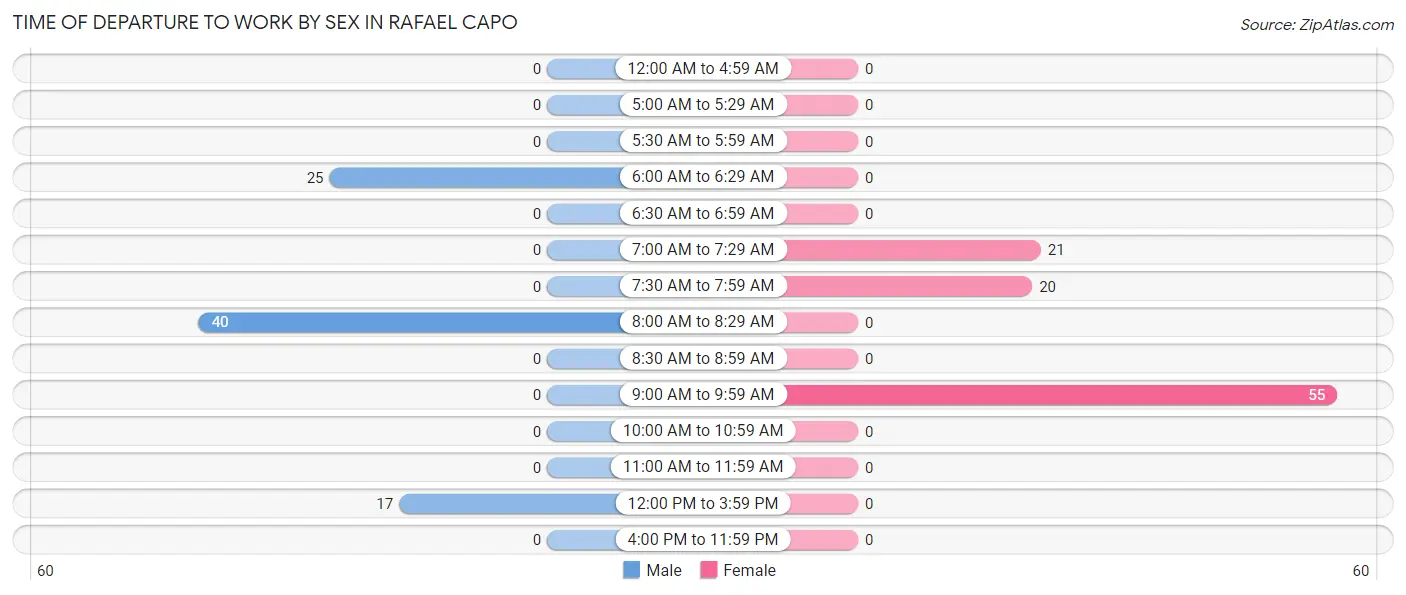
| Time of Departure | Male | Female |
| 12:00 AM to 4:59 AM | 0 (0.0%) | 0 (0.0%) |
| 5:00 AM to 5:29 AM | 0 (0.0%) | 0 (0.0%) |
| 5:30 AM to 5:59 AM | 0 (0.0%) | 0 (0.0%) |
| 6:00 AM to 6:29 AM | 25 (30.5%) | 0 (0.0%) |
| 6:30 AM to 6:59 AM | 0 (0.0%) | 0 (0.0%) |
| 7:00 AM to 7:29 AM | 0 (0.0%) | 21 (21.9%) |
| 7:30 AM to 7:59 AM | 0 (0.0%) | 20 (20.8%) |
| 8:00 AM to 8:29 AM | 40 (48.8%) | 0 (0.0%) |
| 8:30 AM to 8:59 AM | 0 (0.0%) | 0 (0.0%) |
| 9:00 AM to 9:59 AM | 0 (0.0%) | 55 (57.3%) |
| 10:00 AM to 10:59 AM | 0 (0.0%) | 0 (0.0%) |
| 11:00 AM to 11:59 AM | 0 (0.0%) | 0 (0.0%) |
| 12:00 PM to 3:59 PM | 17 (20.7%) | 0 (0.0%) |
| 4:00 PM to 11:59 PM | 0 (0.0%) | 0 (0.0%) |
| Total | 82 (100.0%) | 96 (100.0%) |
Housing Occupancy in Rafael Capo
Occupancy by Ownership in Rafael Capo
Of the total 621 dwellings in Rafael Capo, owner-occupied units account for 550 (88.6%), while renter-occupied units make up 71 (11.4%).
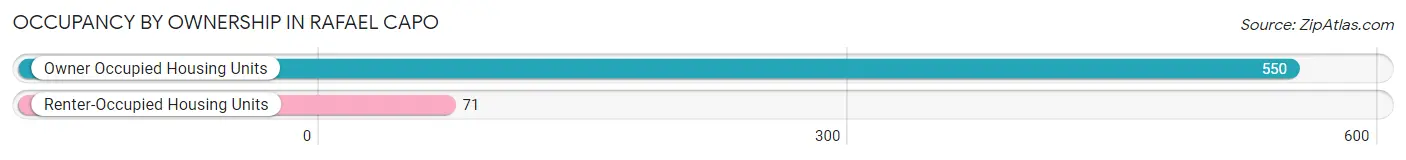
| Occupancy | # Housing Units | % Housing Units |
| Owner Occupied Housing Units | 550 | 88.6% |
| Renter-Occupied Housing Units | 71 | 11.4% |
| Total Occupied Housing Units | 621 | 100.0% |
Occupancy by Household Size in Rafael Capo
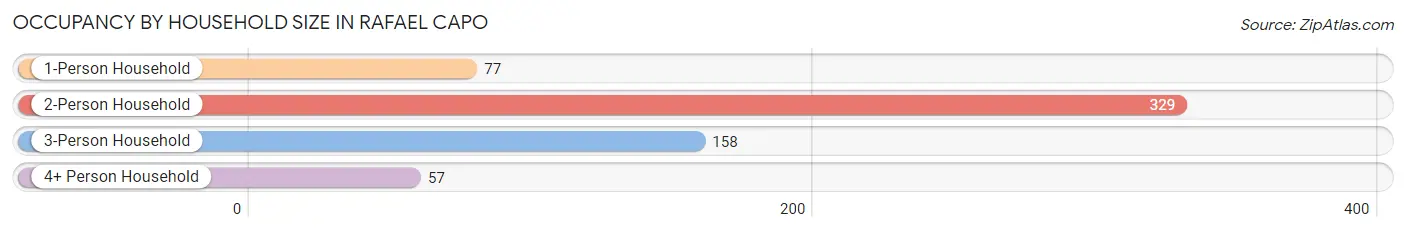
| Household Size | # Housing Units | % Housing Units |
| 1-Person Household | 77 | 12.4% |
| 2-Person Household | 329 | 53.0% |
| 3-Person Household | 158 | 25.4% |
| 4+ Person Household | 57 | 9.2% |
| Total Housing Units | 621 | 100.0% |
Occupancy by Ownership by Household Size in Rafael Capo
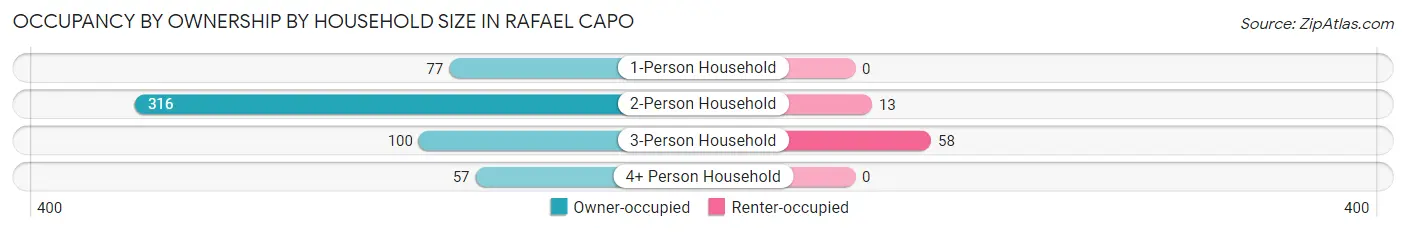
| Household Size | Owner-occupied | Renter-occupied |
| 1-Person Household | 77 (100.0%) | 0 (0.0%) |
| 2-Person Household | 316 (96.1%) | 13 (4.0%) |
| 3-Person Household | 100 (63.3%) | 58 (36.7%) |
| 4+ Person Household | 57 (100.0%) | 0 (0.0%) |
| Total Housing Units | 550 (88.6%) | 71 (11.4%) |
Occupancy by Educational Attainment in Rafael Capo
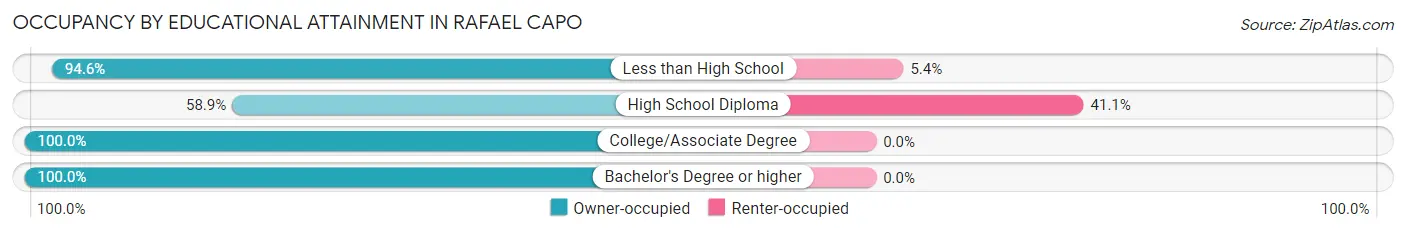
| Household Size | Owner-occupied | Renter-occupied |
| Less than High School | 227 (94.6%) | 13 (5.4%) |
| High School Diploma | 83 (58.9%) | 58 (41.1%) |
| College/Associate Degree | 195 (100.0%) | 0 (0.0%) |
| Bachelor's Degree or higher | 45 (100.0%) | 0 (0.0%) |
Occupancy by Age of Householder in Rafael Capo
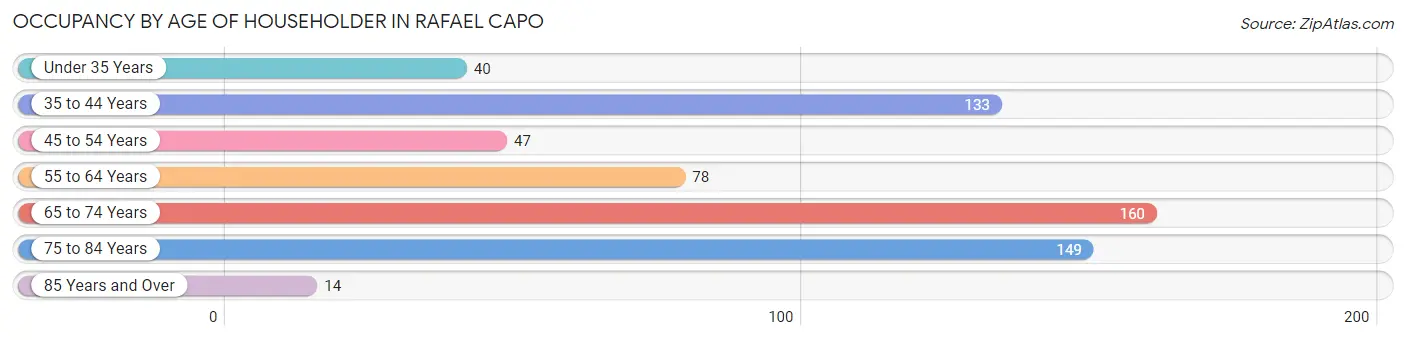
| Age Bracket | # Households | % Households |
| Under 35 Years | 40 | 6.4% |
| 35 to 44 Years | 133 | 21.4% |
| 45 to 54 Years | 47 | 7.6% |
| 55 to 64 Years | 78 | 12.6% |
| 65 to 74 Years | 160 | 25.8% |
| 75 to 84 Years | 149 | 24.0% |
| 85 Years and Over | 14 | 2.2% |
| Total | 621 | 100.0% |
Housing Finances in Rafael Capo
Median Income by Occupancy in Rafael Capo
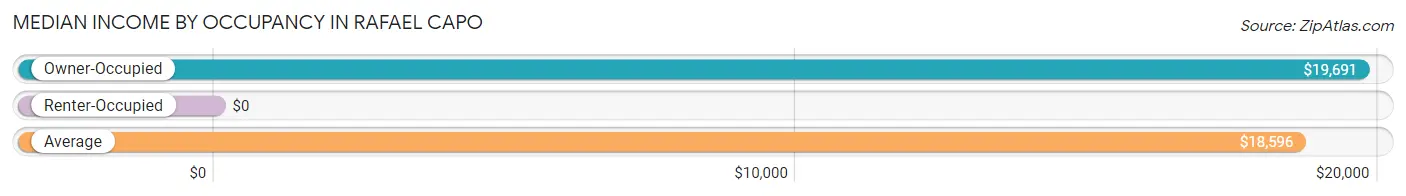
| Occupancy Type | # Households | Median Income |
| Owner-Occupied | 550 (88.6%) | $19,691 |
| Renter-Occupied | 71 (11.4%) | $0 |
| Average | 621 (100.0%) | $18,596 |
Occupancy by Householder Income Bracket in Rafael Capo
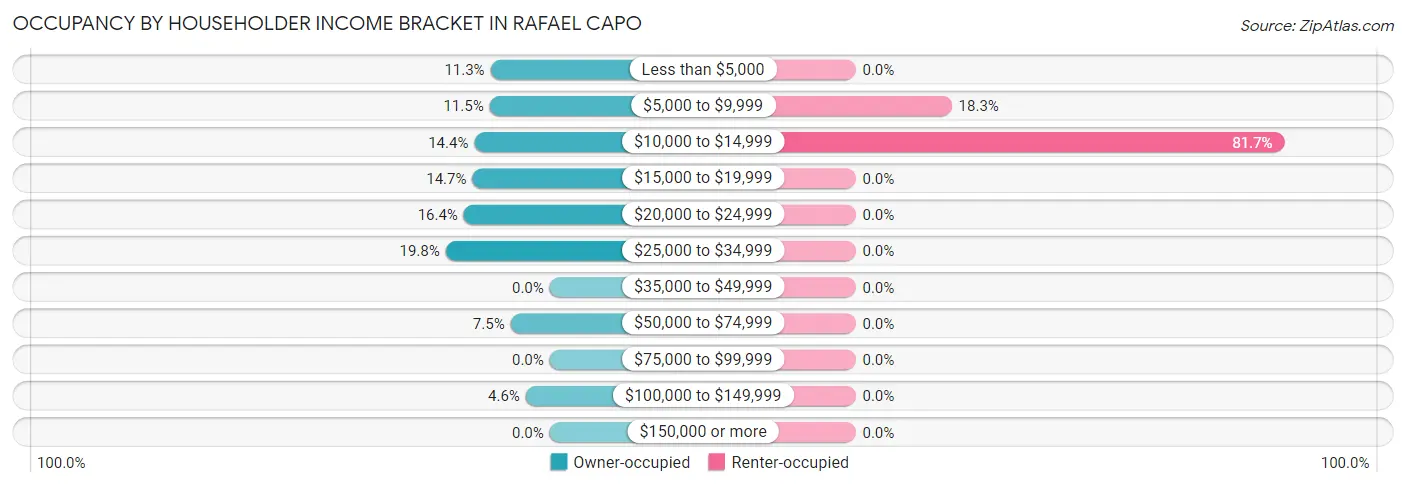
| Income Bracket | Owner-occupied | Renter-occupied |
| Less than $5,000 | 62 (11.3%) | 0 (0.0%) |
| $5,000 to $9,999 | 63 (11.5%) | 13 (18.3%) |
| $10,000 to $14,999 | 79 (14.4%) | 58 (81.7%) |
| $15,000 to $19,999 | 81 (14.7%) | 0 (0.0%) |
| $20,000 to $24,999 | 90 (16.4%) | 0 (0.0%) |
| $25,000 to $34,999 | 109 (19.8%) | 0 (0.0%) |
| $35,000 to $49,999 | 0 (0.0%) | 0 (0.0%) |
| $50,000 to $74,999 | 41 (7.4%) | 0 (0.0%) |
| $75,000 to $99,999 | 0 (0.0%) | 0 (0.0%) |
| $100,000 to $149,999 | 25 (4.5%) | 0 (0.0%) |
| $150,000 or more | 0 (0.0%) | 0 (0.0%) |
| Total | 550 (100.0%) | 71 (100.0%) |
Monthly Housing Cost Tiers in Rafael Capo
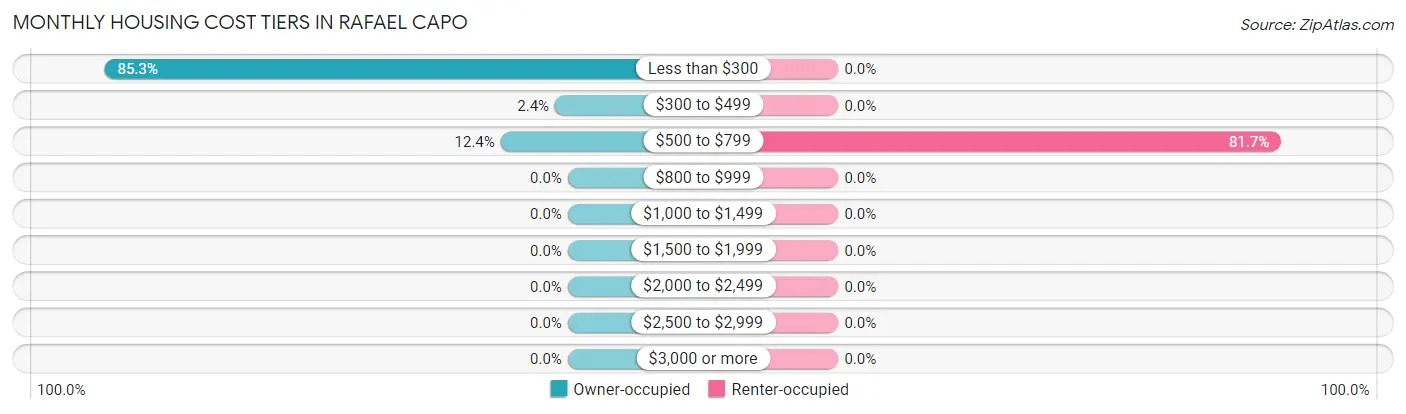
| Monthly Cost | Owner-occupied | Renter-occupied |
| Less than $300 | 469 (85.3%) | 0 (0.0%) |
| $300 to $499 | 13 (2.4%) | 0 (0.0%) |
| $500 to $799 | 68 (12.4%) | 58 (81.7%) |
| $800 to $999 | 0 (0.0%) | 0 (0.0%) |
| $1,000 to $1,499 | 0 (0.0%) | 0 (0.0%) |
| $1,500 to $1,999 | 0 (0.0%) | 0 (0.0%) |
| $2,000 to $2,499 | 0 (0.0%) | 0 (0.0%) |
| $2,500 to $2,999 | 0 (0.0%) | 0 (0.0%) |
| $3,000 or more | 0 (0.0%) | 0 (0.0%) |
| Total | 550 (100.0%) | 71 (100.0%) |
Physical Housing Characteristics in Rafael Capo
Housing Structures in Rafael Capo
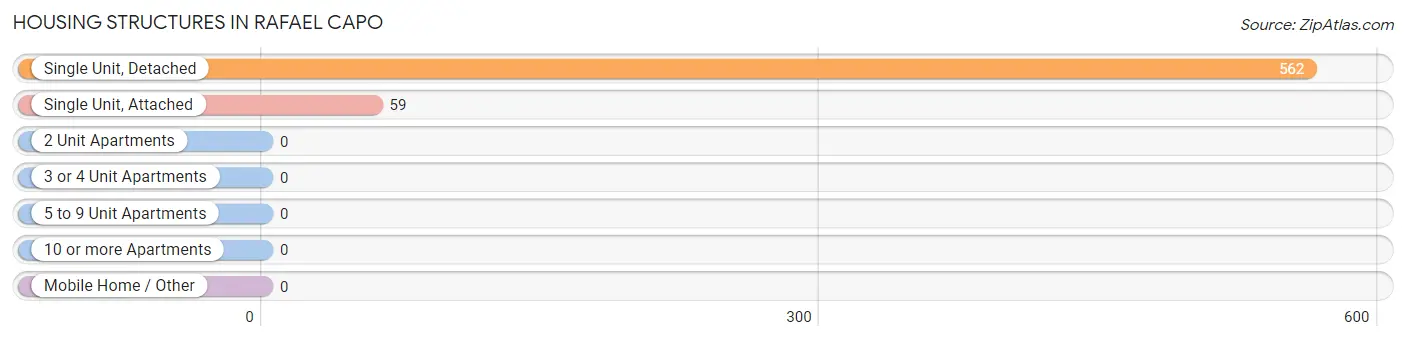
| Structure Type | # Housing Units | % Housing Units |
| Single Unit, Detached | 562 | 90.5% |
| Single Unit, Attached | 59 | 9.5% |
| 2 Unit Apartments | 0 | 0.0% |
| 3 or 4 Unit Apartments | 0 | 0.0% |
| 5 to 9 Unit Apartments | 0 | 0.0% |
| 10 or more Apartments | 0 | 0.0% |
| Mobile Home / Other | 0 | 0.0% |
| Total | 621 | 100.0% |
Housing Structures by Occupancy in Rafael Capo
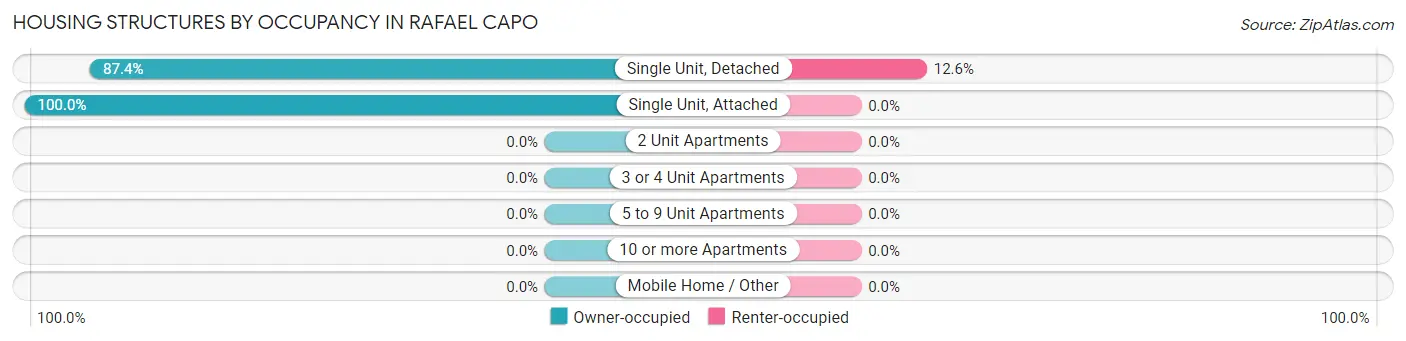
| Structure Type | Owner-occupied | Renter-occupied |
| Single Unit, Detached | 491 (87.4%) | 71 (12.6%) |
| Single Unit, Attached | 59 (100.0%) | 0 (0.0%) |
| 2 Unit Apartments | 0 (0.0%) | 0 (0.0%) |
| 3 or 4 Unit Apartments | 0 (0.0%) | 0 (0.0%) |
| 5 to 9 Unit Apartments | 0 (0.0%) | 0 (0.0%) |
| 10 or more Apartments | 0 (0.0%) | 0 (0.0%) |
| Mobile Home / Other | 0 (0.0%) | 0 (0.0%) |
| Total | 550 (88.6%) | 71 (11.4%) |
Housing Structures by Number of Rooms in Rafael Capo
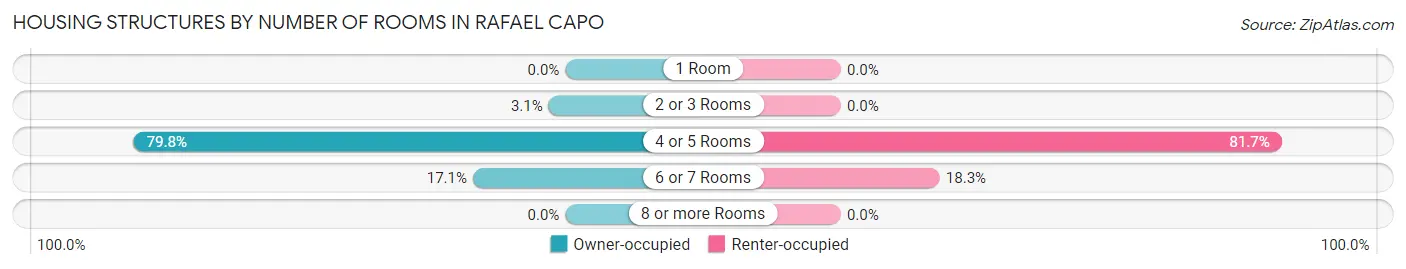
| Number of Rooms | Owner-occupied | Renter-occupied |
| 1 Room | 0 (0.0%) | 0 (0.0%) |
| 2 or 3 Rooms | 17 (3.1%) | 0 (0.0%) |
| 4 or 5 Rooms | 439 (79.8%) | 58 (81.7%) |
| 6 or 7 Rooms | 94 (17.1%) | 13 (18.3%) |
| 8 or more Rooms | 0 (0.0%) | 0 (0.0%) |
| Total | 550 (100.0%) | 71 (100.0%) |
Housing Structure by Heating Type in Rafael Capo
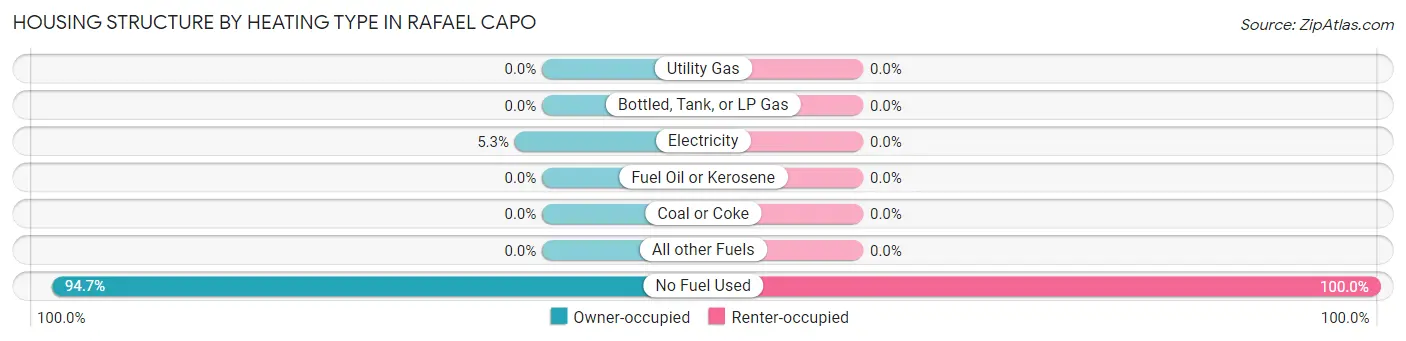
| Heating Type | Owner-occupied | Renter-occupied |
| Utility Gas | 0 (0.0%) | 0 (0.0%) |
| Bottled, Tank, or LP Gas | 0 (0.0%) | 0 (0.0%) |
| Electricity | 29 (5.3%) | 0 (0.0%) |
| Fuel Oil or Kerosene | 0 (0.0%) | 0 (0.0%) |
| Coal or Coke | 0 (0.0%) | 0 (0.0%) |
| All other Fuels | 0 (0.0%) | 0 (0.0%) |
| No Fuel Used | 521 (94.7%) | 71 (100.0%) |
| Total | 550 (100.0%) | 71 (100.0%) |
Household Vehicle Usage in Rafael Capo
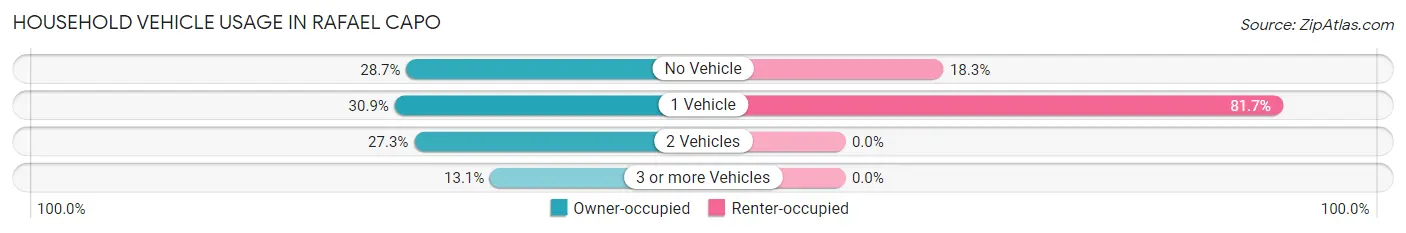
| Vehicles per Household | Owner-occupied | Renter-occupied |
| No Vehicle | 158 (28.7%) | 13 (18.3%) |
| 1 Vehicle | 170 (30.9%) | 58 (81.7%) |
| 2 Vehicles | 150 (27.3%) | 0 (0.0%) |
| 3 or more Vehicles | 72 (13.1%) | 0 (0.0%) |
| Total | 550 (100.0%) | 71 (100.0%) |
Real Estate & Mortgages in Rafael Capo
Real Estate and Mortgage Overview in Rafael Capo
| Characteristic | Without Mortgage | With Mortgage |
| Housing Units | 498 | 52 |
| Median Property Value | $97,000 | $0 |
| Median Household Income | $19,375 | $0 |
| Monthly Housing Costs | $140 | $0 |
| Real Estate Taxes | - | - |
Property Value by Mortgage Status in Rafael Capo
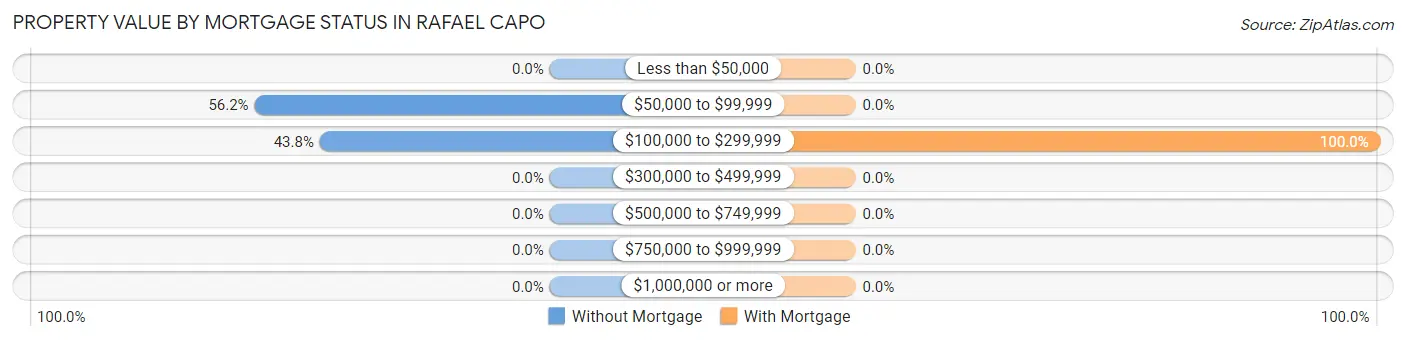
| Property Value | Without Mortgage | With Mortgage |
| Less than $50,000 | 0 (0.0%) | 0 (0.0%) |
| $50,000 to $99,999 | 280 (56.2%) | 0 (0.0%) |
| $100,000 to $299,999 | 218 (43.8%) | 52 (100.0%) |
| $300,000 to $499,999 | 0 (0.0%) | 0 (0.0%) |
| $500,000 to $749,999 | 0 (0.0%) | 0 (0.0%) |
| $750,000 to $999,999 | 0 (0.0%) | 0 (0.0%) |
| $1,000,000 or more | 0 (0.0%) | 0 (0.0%) |
| Total | 498 (100.0%) | 52 (100.0%) |
Household Income by Mortgage Status in Rafael Capo
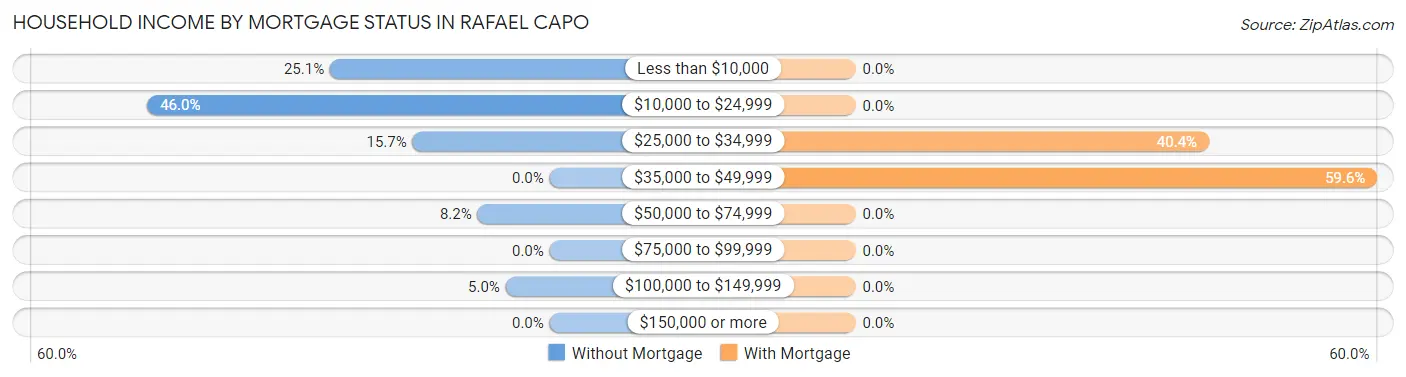
| Household Income | Without Mortgage | With Mortgage |
| Less than $10,000 | 125 (25.1%) | 0 (0.0%) |
| $10,000 to $24,999 | 229 (46.0%) | 0 (0.0%) |
| $25,000 to $34,999 | 78 (15.7%) | 21 (40.4%) |
| $35,000 to $49,999 | 0 (0.0%) | 31 (59.6%) |
| $50,000 to $74,999 | 41 (8.2%) | 0 (0.0%) |
| $75,000 to $99,999 | 0 (0.0%) | 0 (0.0%) |
| $100,000 to $149,999 | 25 (5.0%) | 0 (0.0%) |
| $150,000 or more | 0 (0.0%) | 0 (0.0%) |
| Total | 498 (100.0%) | 52 (100.0%) |
Property Value to Household Income Ratio in Rafael Capo
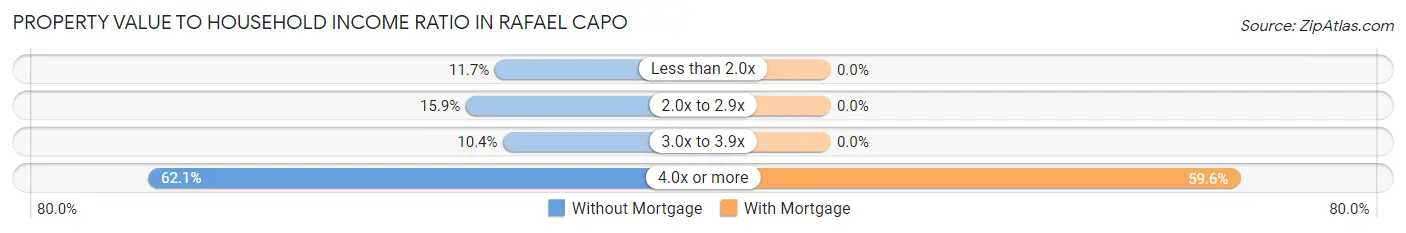
| Value-to-Income Ratio | Without Mortgage | With Mortgage |
| Less than 2.0x | 58 (11.7%) | 0 (0.0%) |
| 2.0x to 2.9x | 79 (15.9%) | 0 (0.0%) |
| 3.0x to 3.9x | 52 (10.4%) | 0 (0.0%) |
| 4.0x or more | 309 (62.1%) | 31 (59.6%) |
| Total | 498 (100.0%) | 52 (100.0%) |
Real Estate Taxes by Mortgage Status in Rafael Capo
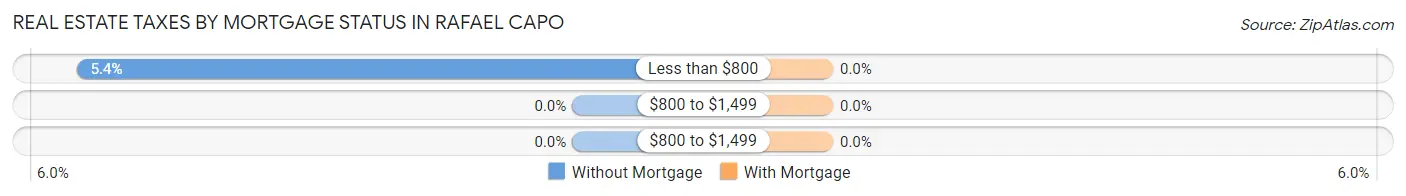
| Property Taxes | Without Mortgage | With Mortgage |
| Less than $800 | 27 (5.4%) | 0 (0.0%) |
| $800 to $1,499 | 0 (0.0%) | 0 (0.0%) |
| $800 to $1,499 | 0 (0.0%) | 0 (0.0%) |
| Total | 498 (100.0%) | 52 (100.0%) |
Health & Disability in Rafael Capo
Health Insurance Coverage by Age in Rafael Capo
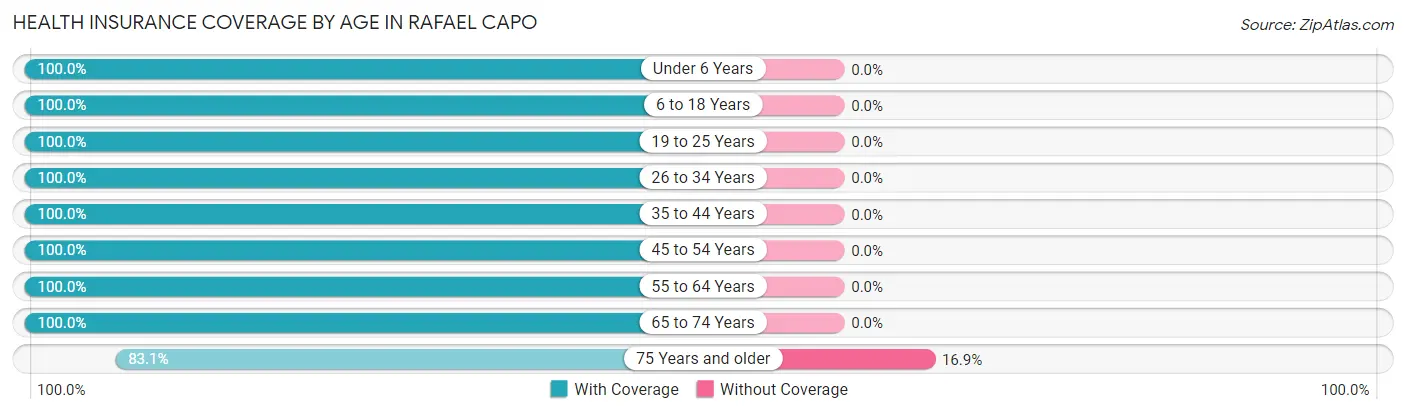
| Age Bracket | With Coverage | Without Coverage |
| Under 6 Years | 29 (100.0%) | 0 (0.0%) |
| 6 to 18 Years | 322 (100.0%) | 0 (0.0%) |
| 19 to 25 Years | 23 (100.0%) | 0 (0.0%) |
| 26 to 34 Years | 123 (100.0%) | 0 (0.0%) |
| 35 to 44 Years | 196 (100.0%) | 0 (0.0%) |
| 45 to 54 Years | 135 (100.0%) | 0 (0.0%) |
| 55 to 64 Years | 234 (100.0%) | 0 (0.0%) |
| 65 to 74 Years | 293 (100.0%) | 0 (0.0%) |
| 75 Years and older | 226 (83.1%) | 46 (16.9%) |
| Total | 1,581 (97.2%) | 46 (2.8%) |
Health Insurance Coverage by Citizenship Status in Rafael Capo
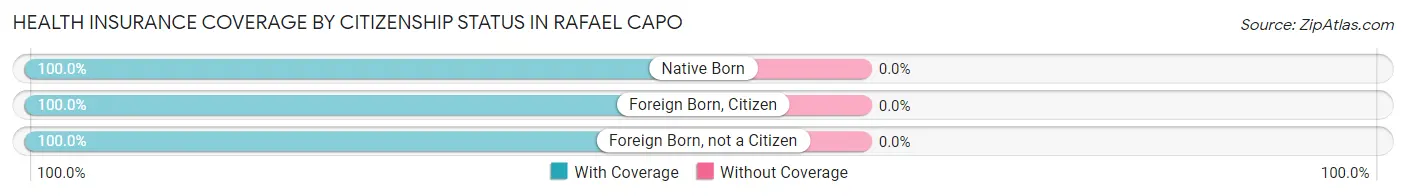
| Citizenship Status | With Coverage | Without Coverage |
| Native Born | 29 (100.0%) | 0 (0.0%) |
| Foreign Born, Citizen | 322 (100.0%) | 0 (0.0%) |
| Foreign Born, not a Citizen | 23 (100.0%) | 0 (0.0%) |
Health Insurance Coverage by Household Income in Rafael Capo
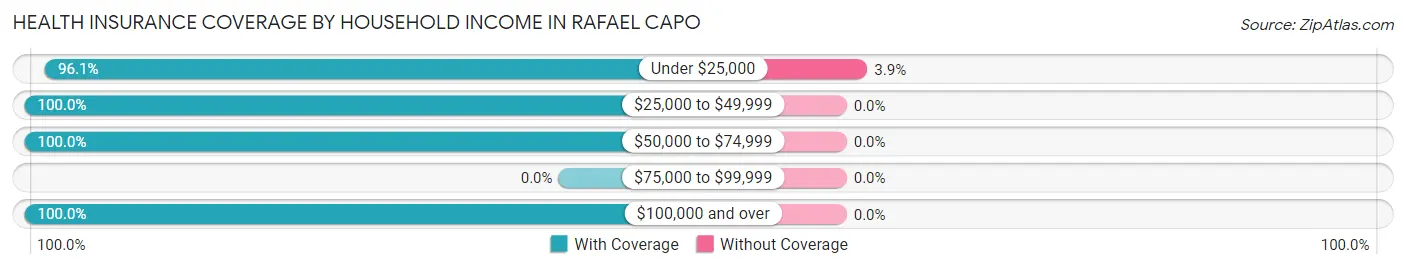
| Household Income | With Coverage | Without Coverage |
| Under $25,000 | 1,145 (96.1%) | 46 (3.9%) |
| $25,000 to $49,999 | 297 (100.0%) | 0 (0.0%) |
| $50,000 to $74,999 | 91 (100.0%) | 0 (0.0%) |
| $75,000 to $99,999 | 0 (0.0%) | 0 (0.0%) |
| $100,000 and over | 48 (100.0%) | 0 (0.0%) |
Public vs Private Health Insurance Coverage by Age in Rafael Capo
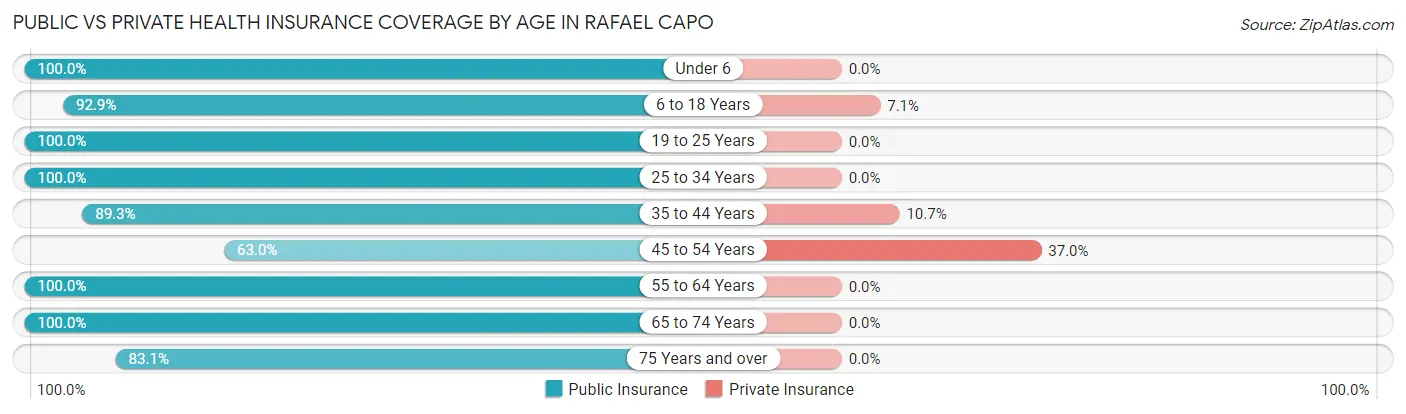
| Age Bracket | Public Insurance | Private Insurance |
| Under 6 | 29 (100.0%) | 0 (0.0%) |
| 6 to 18 Years | 299 (92.9%) | 23 (7.1%) |
| 19 to 25 Years | 23 (100.0%) | 0 (0.0%) |
| 25 to 34 Years | 123 (100.0%) | 0 (0.0%) |
| 35 to 44 Years | 175 (89.3%) | 21 (10.7%) |
| 45 to 54 Years | 85 (63.0%) | 50 (37.0%) |
| 55 to 64 Years | 234 (100.0%) | 0 (0.0%) |
| 65 to 74 Years | 293 (100.0%) | 0 (0.0%) |
| 75 Years and over | 226 (83.1%) | 0 (0.0%) |
| Total | 1,487 (91.4%) | 94 (5.8%) |
Disability Status by Sex by Age in Rafael Capo
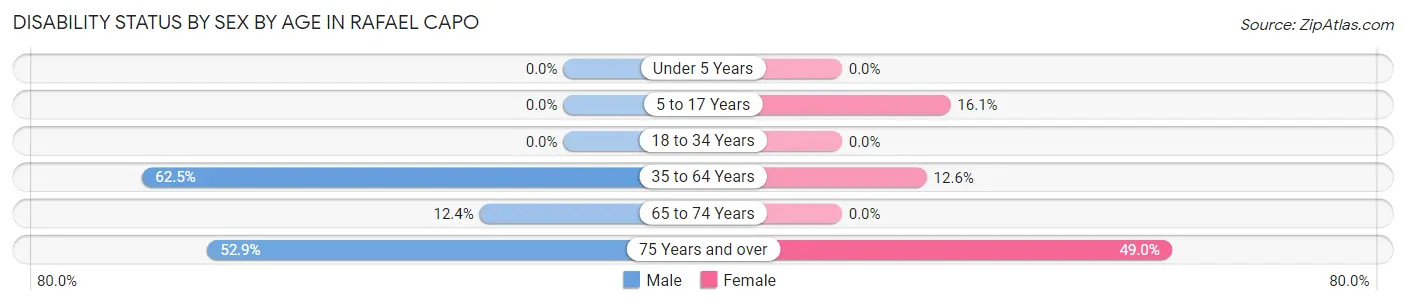
| Age Bracket | Male | Female |
| Under 5 Years | 0 (0.0%) | 0 (0.0%) |
| 5 to 17 Years | 0 (0.0%) | 35 (16.1%) |
| 18 to 34 Years | 0 (0.0%) | 0 (0.0%) |
| 35 to 64 Years | 120 (62.5%) | 47 (12.6%) |
| 65 to 74 Years | 24 (12.4%) | 0 (0.0%) |
| 75 Years and over | 92 (52.9%) | 48 (49.0%) |
Disability Class by Sex by Age in Rafael Capo
Disability Class: Hearing Difficulty
| Age Bracket | Male | Female |
| Under 5 Years | 0 (0.0%) | 0 (0.0%) |
| 5 to 17 Years | 0 (0.0%) | 0 (0.0%) |
| 18 to 34 Years | 0 (0.0%) | 0 (0.0%) |
| 35 to 64 Years | 0 (0.0%) | 0 (0.0%) |
| 65 to 74 Years | 0 (0.0%) | 0 (0.0%) |
| 75 Years and over | 0 (0.0%) | 0 (0.0%) |
Disability Class: Vision Difficulty
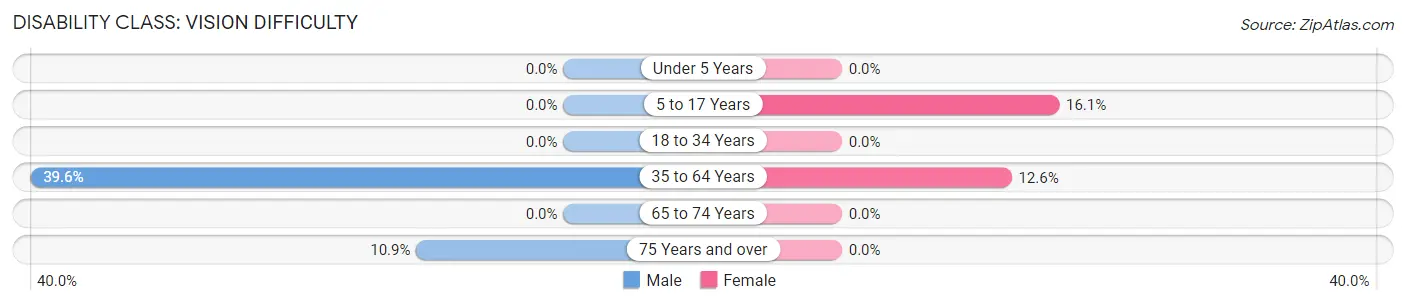
| Age Bracket | Male | Female |
| Under 5 Years | 0 (0.0%) | 0 (0.0%) |
| 5 to 17 Years | 0 (0.0%) | 35 (16.1%) |
| 18 to 34 Years | 0 (0.0%) | 0 (0.0%) |
| 35 to 64 Years | 76 (39.6%) | 47 (12.6%) |
| 65 to 74 Years | 0 (0.0%) | 0 (0.0%) |
| 75 Years and over | 19 (10.9%) | 0 (0.0%) |
Disability Class: Cognitive Difficulty
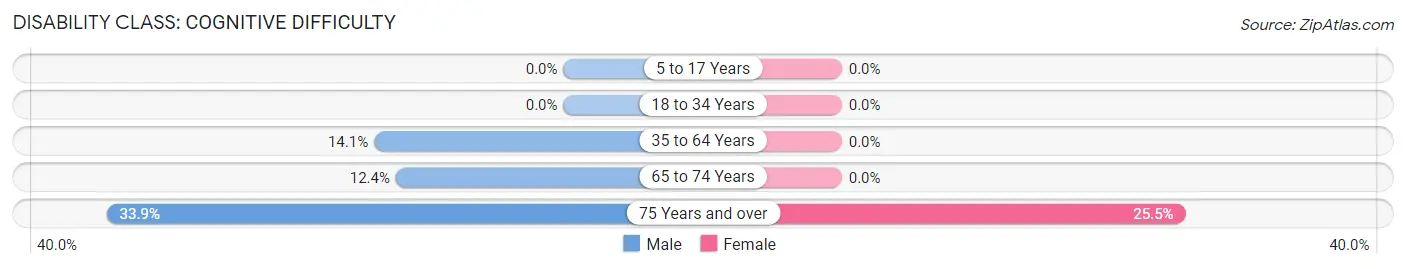
| Age Bracket | Male | Female |
| 5 to 17 Years | 0 (0.0%) | 0 (0.0%) |
| 18 to 34 Years | 0 (0.0%) | 0 (0.0%) |
| 35 to 64 Years | 27 (14.1%) | 0 (0.0%) |
| 65 to 74 Years | 24 (12.4%) | 0 (0.0%) |
| 75 Years and over | 59 (33.9%) | 25 (25.5%) |
Disability Class: Ambulatory Difficulty
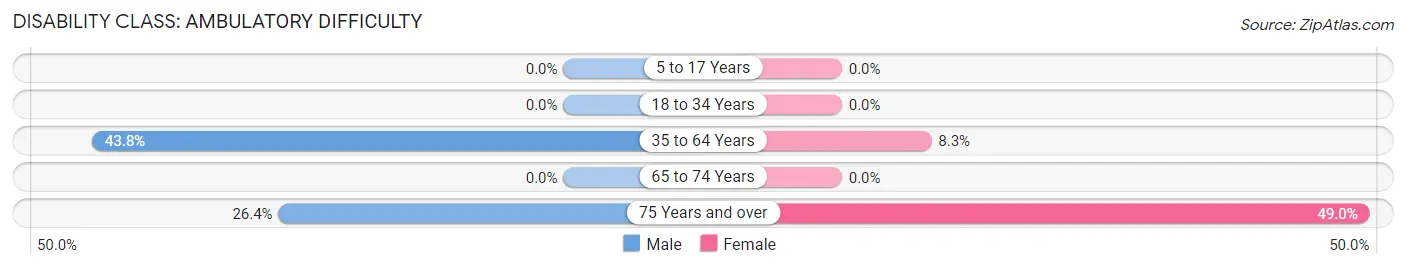
| Age Bracket | Male | Female |
| 5 to 17 Years | 0 (0.0%) | 0 (0.0%) |
| 18 to 34 Years | 0 (0.0%) | 0 (0.0%) |
| 35 to 64 Years | 84 (43.8%) | 31 (8.3%) |
| 65 to 74 Years | 0 (0.0%) | 0 (0.0%) |
| 75 Years and over | 46 (26.4%) | 48 (49.0%) |
Disability Class: Self-Care Difficulty
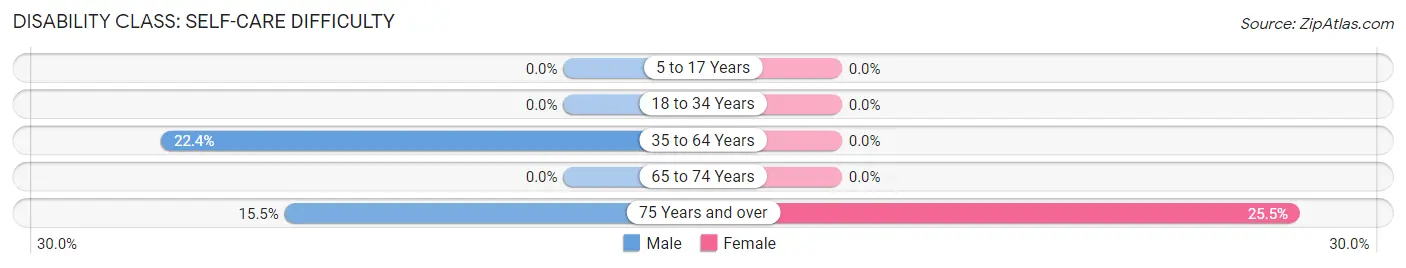
| Age Bracket | Male | Female |
| 5 to 17 Years | 0 (0.0%) | 0 (0.0%) |
| 18 to 34 Years | 0 (0.0%) | 0 (0.0%) |
| 35 to 64 Years | 43 (22.4%) | 0 (0.0%) |
| 65 to 74 Years | 0 (0.0%) | 0 (0.0%) |
| 75 Years and over | 27 (15.5%) | 25 (25.5%) |
Technology Access in Rafael Capo
Computing Device Access in Rafael Capo
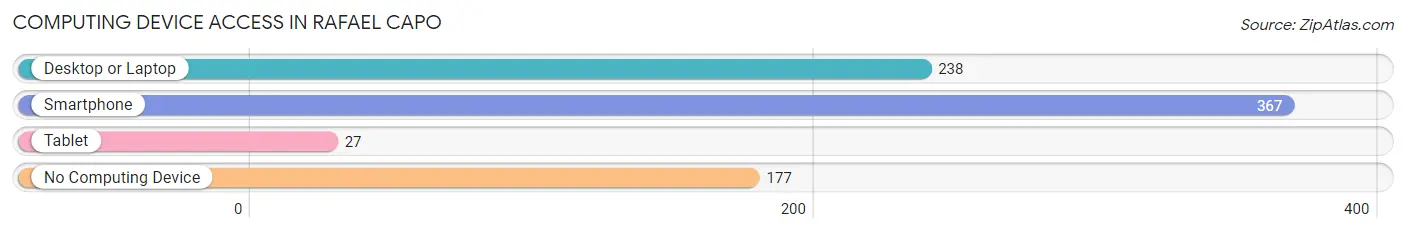
| Device Type | # Households | % Households |
| Desktop or Laptop | 238 | 38.3% |
| Smartphone | 367 | 59.1% |
| Tablet | 27 | 4.3% |
| No Computing Device | 177 | 28.5% |
| Total | 621 | 100.0% |
Internet Access in Rafael Capo
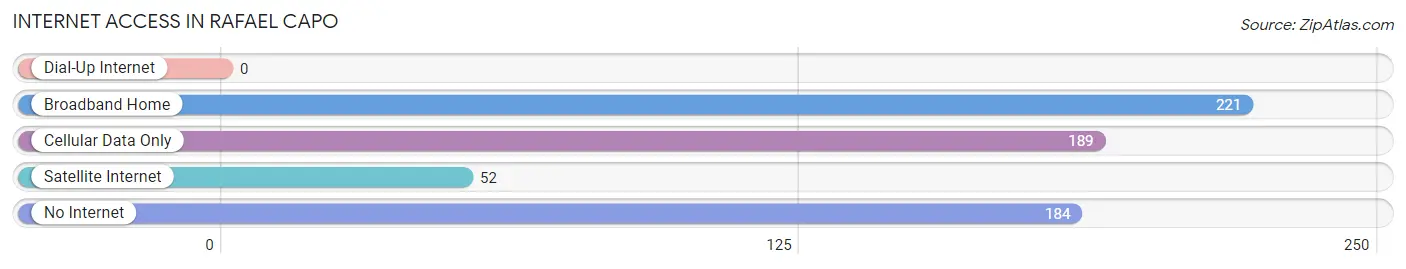
| Internet Type | # Households | % Households |
| Dial-Up Internet | 0 | 0.0% |
| Broadband Home | 221 | 35.6% |
| Cellular Data Only | 189 | 30.4% |
| Satellite Internet | 52 | 8.4% |
| No Internet | 184 | 29.6% |
| Total | 621 | 100.0% |
Rafael Capo Summary
Puerto Rico is an unincorporated territory of the United States located in the Caribbean Sea. It is an archipelago composed of the main island of Puerto Rico and several smaller islands. The main island is the smallest and most populated of the Greater Antilles. It is located east of the Dominican Republic and west of the Virgin Islands. The population of Puerto Rico is estimated to be 3.2 million people, making it the second most populous island in the Caribbean after Cuba.
The history of Puerto Rico dates back to the early 16th century when it was colonized by the Spanish. The island was ceded to the United States in 1898 following the Spanish-American War. Since then, Puerto Rico has been an unincorporated territory of the United States, with its own constitution and government.
Geographically, Puerto Rico is located in the Caribbean Sea, south of the Dominican Republic and east of the Virgin Islands. It is the smallest and most populated of the Greater Antilles. The main island is approximately 100 miles long and 35 miles wide. It is divided into 78 municipalities, each with its own government. The capital and largest city is San Juan.
The economy of Puerto Rico is largely based on services, with tourism being the largest sector. Other important sectors include manufacturing, finance, and agriculture. The island is also home to a large pharmaceutical industry. The government of Puerto Rico is responsible for providing public services, such as education, health care, and public safety.
Demographically, Puerto Rico is a diverse society. The majority of the population is of Hispanic or Latino origin, with the largest ethnic group being Puerto Ricans. Other ethnic groups include African Americans, Europeans, and Asians. The official language is Spanish, although English is also widely spoken. The majority of the population is Roman Catholic, although there are also other religious groups present.
Puerto Rico is a vibrant and diverse society with a rich history and culture. It is an important part of the United States and has a unique relationship with the mainland. Its economy is largely based on services, with tourism being the largest sector. The population is diverse, with the majority being of Hispanic or Latino origin. Puerto Rico is an important part of the Caribbean and is an important part of the United States.
Common Questions
What is Per Capita Income in Rafael Capo?
Per Capita income in Rafael Capo is $9,614.
What is the Median Family Income in Rafael Capo?
Median Family Income in Rafael Capo is $19,784.
What is the Median Household income in Rafael Capo?
Median Household Income in Rafael Capo is $18,596.
What is Inequality or Gini Index in Rafael Capo?
Inequality or Gini Index in Rafael Capo is 0.44.
What is the Total Population of Rafael Capo?
Total Population of Rafael Capo is 1,627.
What is the Total Male Population of Rafael Capo?
Total Male Population of Rafael Capo is 756.
What is the Total Female Population of Rafael Capo?
Total Female Population of Rafael Capo is 871.
What is the Ratio of Males per 100 Females in Rafael Capo?
There are 86.80 Males per 100 Females in Rafael Capo.
What is the Ratio of Females per 100 Males in Rafael Capo?
There are 115.21 Females per 100 Males in Rafael Capo.
What is the Median Population Age in Rafael Capo?
Median Population Age in Rafael Capo is 54.3 Years.
What is the Average Family Size in Rafael Capo
Average Family Size in Rafael Capo is 2.9 People.
What is the Average Household Size in Rafael Capo
Average Household Size in Rafael Capo is 2.6 People.
How Large is the Labor Force in Rafael Capo?
There are 205 People in the Labor Forcein in Rafael Capo.
What is the Percentage of People in the Labor Force in Rafael Capo?
14.7% of People are in the Labor Force in Rafael Capo.