Hill n Dale, FL Map & Demographics
Hill n Dale Map
Hill n Dale Overview
$22,462
PER CAPITA INCOME
$71,900
AVG FAMILY INCOME
$52,250
AVG HOUSEHOLD INCOME
44.2%
WAGE / INCOME GAP [ % ]
55.8¢/ $1
WAGE / INCOME GAP [ $ ]
0.37
INEQUALITY / GINI INDEX
3,010
TOTAL POPULATION
1,607
MALE POPULATION
1,403
FEMALE POPULATION
114.54
MALES / 100 FEMALES
87.31
FEMALES / 100 MALES
44.8
MEDIAN AGE
3.4
AVG FAMILY SIZE
3.3
AVG HOUSEHOLD SIZE
1,517
LABOR FORCE [ PEOPLE ]
61.2%
PERCENT IN LABOR FORCE
3.4%
UNEMPLOYMENT RATE
Income in Hill n Dale
Income Overview in Hill n Dale
Per Capita Income in Hill n Dale is $22,462, while median incomes of families and households are $71,900 and $52,250 respectively.
| Characteristic | Number | Measure |
| Per Capita Income | 3,010 | $22,462 |
| Median Family Income | 780 | $71,900 |
| Mean Family Income | 780 | $66,839 |
| Median Household Income | 903 | $52,250 |
| Mean Household Income | 903 | $66,682 |
| Income Deficit | 780 | $0 |
| Wage / Income Gap (%) | 3,010 | 44.21% |
| Wage / Income Gap ($) | 3,010 | 55.79¢ per $1 |
| Gini / Inequality Index | 3,010 | 0.37 |
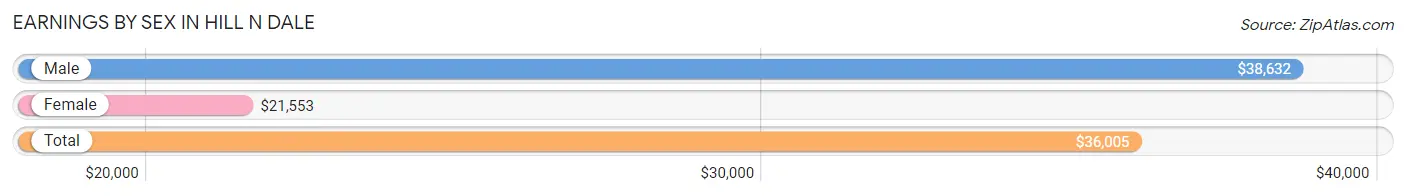
Earnings by Sex in Hill n Dale
Average Earnings in Hill n Dale are $36,005, $38,632 for men and $21,553 for women, a difference of 44.2%.
| Sex | Number | Average Earnings |
| Male | 921 (62.8%) | $38,632 |
| Female | 545 (37.2%) | $21,553 |
| Total | 1,466 (100.0%) | $36,005 |
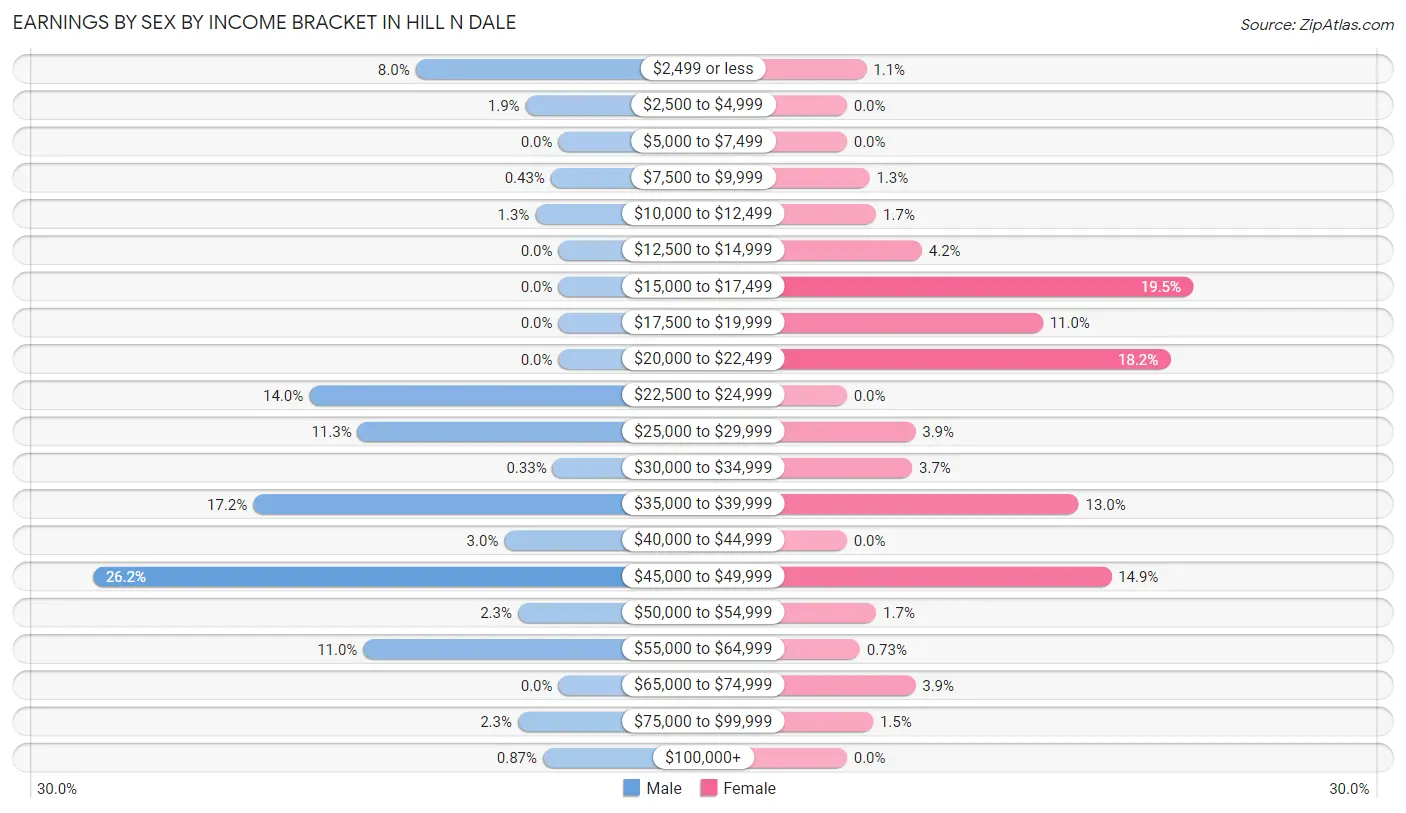
Earnings by Sex by Income Bracket in Hill n Dale
The most common earnings brackets in Hill n Dale are $45,000 to $49,999 for men (241 | 26.2%) and $15,000 to $17,499 for women (106 | 19.5%).
| Income | Male | Female |
| $2,499 or less | 74 (8.0%) | 6 (1.1%) |
| $2,500 to $4,999 | 17 (1.8%) | 0 (0.0%) |
| $5,000 to $7,499 | 0 (0.0%) | 0 (0.0%) |
| $7,500 to $9,999 | 4 (0.4%) | 7 (1.3%) |
| $10,000 to $12,499 | 12 (1.3%) | 9 (1.7%) |
| $12,500 to $14,999 | 0 (0.0%) | 23 (4.2%) |
| $15,000 to $17,499 | 0 (0.0%) | 106 (19.5%) |
| $17,500 to $19,999 | 0 (0.0%) | 60 (11.0%) |
| $20,000 to $22,499 | 0 (0.0%) | 99 (18.2%) |
| $22,500 to $24,999 | 129 (14.0%) | 0 (0.0%) |
| $25,000 to $29,999 | 104 (11.3%) | 21 (3.8%) |
| $30,000 to $34,999 | 3 (0.3%) | 20 (3.7%) |
| $35,000 to $39,999 | 158 (17.2%) | 71 (13.0%) |
| $40,000 to $44,999 | 28 (3.0%) | 0 (0.0%) |
| $45,000 to $49,999 | 241 (26.2%) | 81 (14.9%) |
| $50,000 to $54,999 | 21 (2.3%) | 9 (1.7%) |
| $55,000 to $64,999 | 101 (11.0%) | 4 (0.7%) |
| $65,000 to $74,999 | 0 (0.0%) | 21 (3.8%) |
| $75,000 to $99,999 | 21 (2.3%) | 8 (1.5%) |
| $100,000+ | 8 (0.9%) | 0 (0.0%) |
| Total | 921 (100.0%) | 545 (100.0%) |
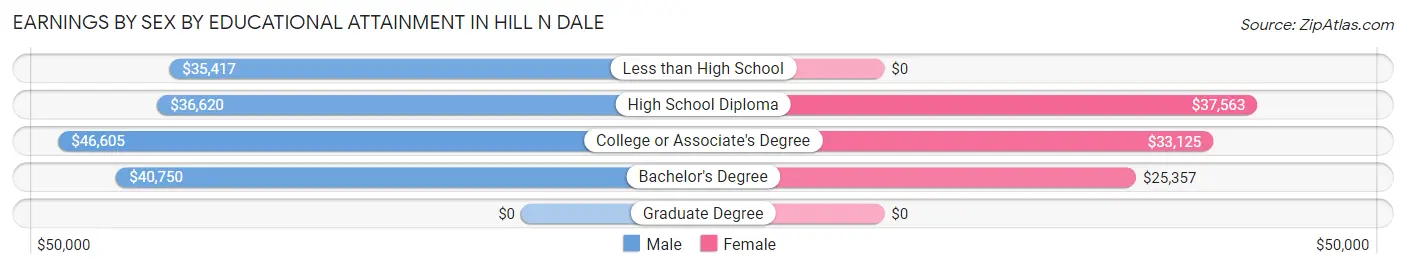
Earnings by Sex by Educational Attainment in Hill n Dale
Average earnings in Hill n Dale are $39,882 for men and $25,119 for women, a difference of 37.0%. Men with an educational attainment of college or associate's degree enjoy the highest average annual earnings of $46,605, while those with less than high school education earn the least with $35,417. Women with an educational attainment of high school diploma earn the most with the average annual earnings of $37,563, while those with bachelor's degree education have the smallest earnings of $25,357.
| Educational Attainment | Male Income | Female Income |
| Less than High School | $35,417 | $0 |
| High School Diploma | $36,620 | $37,563 |
| College or Associate's Degree | $46,605 | $33,125 |
| Bachelor's Degree | $40,750 | $25,357 |
| Graduate Degree | - | - |
| Total | $39,882 | $25,119 |
Family Income in Hill n Dale
Family Income Brackets in Hill n Dale
According to the Hill n Dale family income data, there are 234 families falling into the $75,000 to $99,999 income range, which is the most common income bracket and makes up 30.0% of all families.
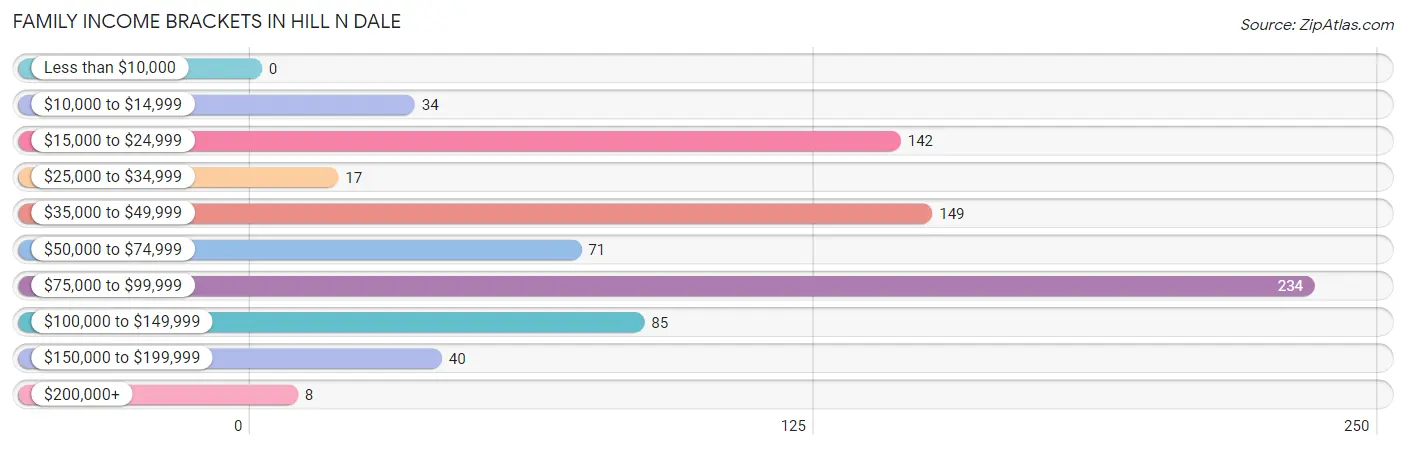
| Income Bracket | # Families | % Families |
| Less than $10,000 | 0 | 0.0% |
| $10,000 to $14,999 | 34 | 4.4% |
| $15,000 to $24,999 | 142 | 18.2% |
| $25,000 to $34,999 | 17 | 2.2% |
| $35,000 to $49,999 | 149 | 19.1% |
| $50,000 to $74,999 | 71 | 9.1% |
| $75,000 to $99,999 | 234 | 30.0% |
| $100,000 to $149,999 | 85 | 10.9% |
| $150,000 to $199,999 | 40 | 5.1% |
| $200,000+ | 8 | 1.0% |
Family Income by Famaliy Size in Hill n Dale
3-person families (240 | 30.8%) account for the highest median family income in Hill n Dale with $78,266 per family, while 3-person families (240 | 30.8%) have the highest median income of $26,089 per family member.
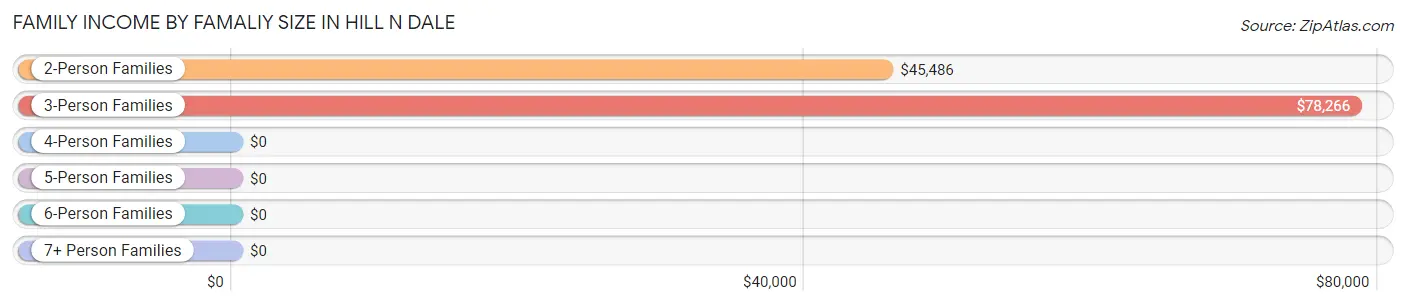
| Income Bracket | # Families | Median Income |
| 2-Person Families | 261 (33.5%) | $45,486 |
| 3-Person Families | 240 (30.8%) | $78,266 |
| 4-Person Families | 247 (31.7%) | $0 |
| 5-Person Families | 0 (0.0%) | $0 |
| 6-Person Families | 0 (0.0%) | $0 |
| 7+ Person Families | 32 (4.1%) | $0 |
| Total | 780 (100.0%) | $71,900 |
Family Income by Number of Earners in Hill n Dale
The median family income in Hill n Dale is $71,900, with families comprising 3+ earners (179) having the highest median family income of $110,893, while families with 1 earner (342) have the lowest median family income of $38,438, accounting for 23.0% and 43.9% of families, respectively.
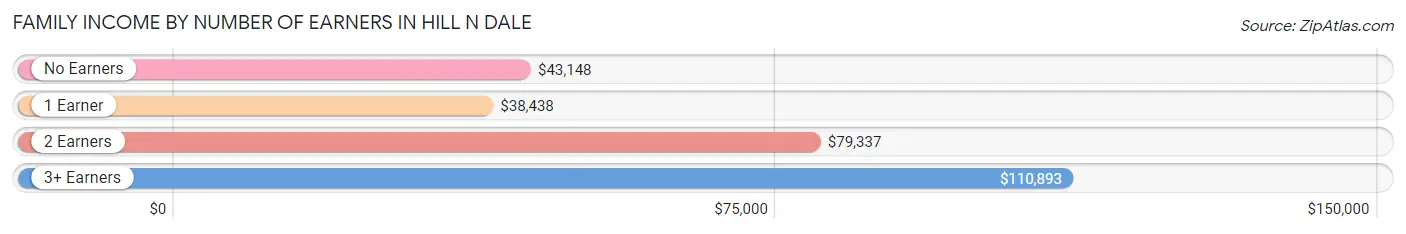
| Number of Earners | # Families | Median Income |
| No Earners | 154 (19.7%) | $43,148 |
| 1 Earner | 342 (43.9%) | $38,438 |
| 2 Earners | 105 (13.5%) | $79,337 |
| 3+ Earners | 179 (23.0%) | $110,893 |
| Total | 780 (100.0%) | $71,900 |
Household Income in Hill n Dale
Household Income Brackets in Hill n Dale
With 196 households falling in the category, the $15,000 to $24,999 income range is the most frequent in Hill n Dale, accounting for 21.7% of all households. In contrast, only 8 households (0.9%) fall into the $200,000+ income bracket, making it the least populous group.
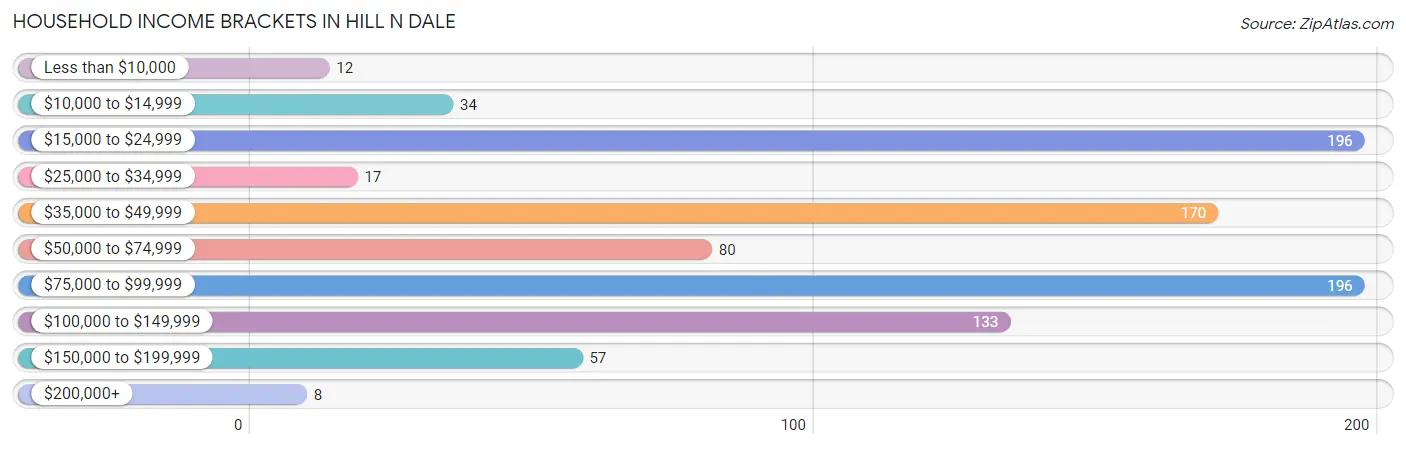
| Income Bracket | # Households | % Households |
| Less than $10,000 | 12 | 1.3% |
| $10,000 to $14,999 | 34 | 3.8% |
| $15,000 to $24,999 | 196 | 21.7% |
| $25,000 to $34,999 | 17 | 1.9% |
| $35,000 to $49,999 | 170 | 18.8% |
| $50,000 to $74,999 | 80 | 8.9% |
| $75,000 to $99,999 | 196 | 21.7% |
| $100,000 to $149,999 | 133 | 14.7% |
| $150,000 to $199,999 | 57 | 6.3% |
| $200,000+ | 8 | 0.9% |
Household Income by Householder Age in Hill n Dale
The median household income in Hill n Dale is $52,250, with the highest median household income of $77,581 found in the 45 to 64 years age bracket for the primary householder. A total of 518 households (57.4%) fall into this category.
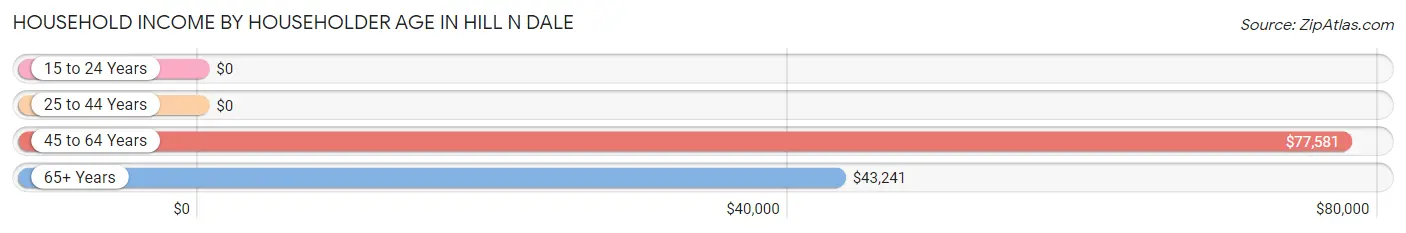
| Income Bracket | # Households | Median Income |
| 15 to 24 Years | 0 (0.0%) | $0 |
| 25 to 44 Years | 107 (11.8%) | $0 |
| 45 to 64 Years | 518 (57.4%) | $77,581 |
| 65+ Years | 278 (30.8%) | $43,241 |
| Total | 903 (100.0%) | $52,250 |
Poverty in Hill n Dale
Income Below Poverty by Sex and Age in Hill n Dale
With 22.1% poverty level for males and 22.7% for females among the residents of Hill n Dale, 12 to 14 year old males and under 5 year old females are the most vulnerable to poverty, with 206 males (81.8%) and 9 females (100.0%) in their respective age groups living below the poverty level.
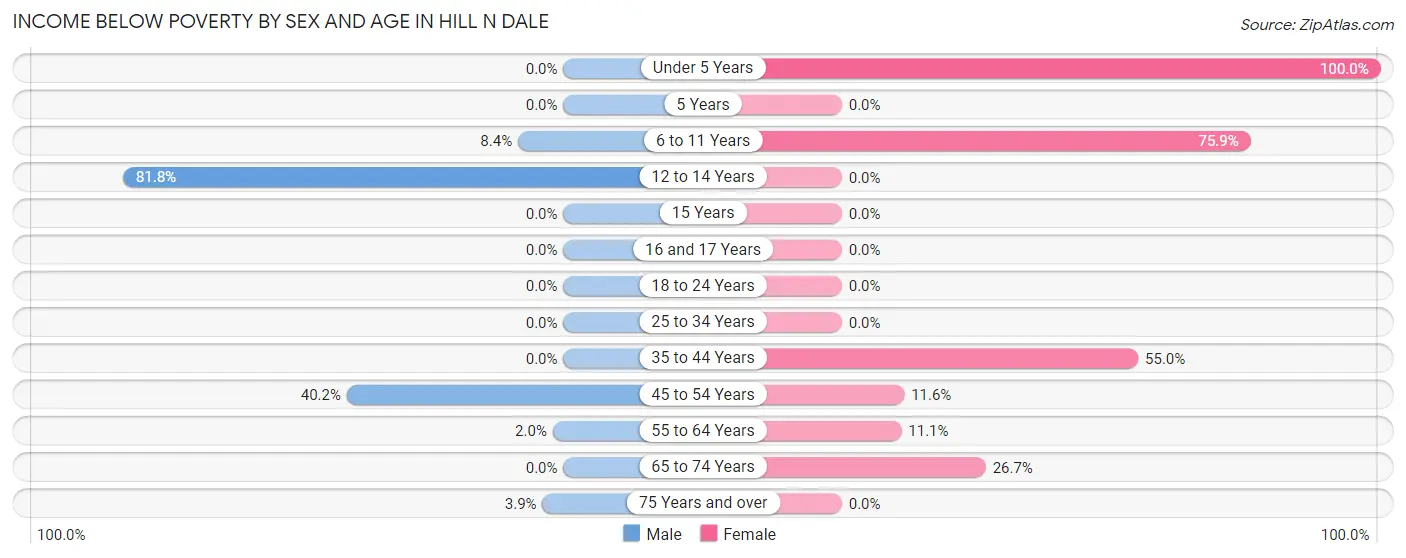
| Age Bracket | Male | Female |
| Under 5 Years | 0 (0.0%) | 9 (100.0%) |
| 5 Years | 0 (0.0%) | 0 (0.0%) |
| 6 to 11 Years | 8 (8.4%) | 88 (75.9%) |
| 12 to 14 Years | 206 (81.8%) | 0 (0.0%) |
| 15 Years | 0 (0.0%) | 0 (0.0%) |
| 16 and 17 Years | 0 (0.0%) | 0 (0.0%) |
| 18 to 24 Years | 0 (0.0%) | 0 (0.0%) |
| 25 to 34 Years | 0 (0.0%) | 0 (0.0%) |
| 35 to 44 Years | 0 (0.0%) | 121 (55.0%) |
| 45 to 54 Years | 129 (40.2%) | 41 (11.6%) |
| 55 to 64 Years | 3 (2.0%) | 20 (11.1%) |
| 65 to 74 Years | 0 (0.0%) | 39 (26.7%) |
| 75 Years and over | 5 (3.9%) | 0 (0.0%) |
| Total | 351 (22.1%) | 318 (22.7%) |
Income Above Poverty by Sex and Age in Hill n Dale
According to the poverty statistics in Hill n Dale, males aged 5 years and females aged 15 years are the age groups that are most secure financially, with 100.0% of males and 100.0% of females in these age groups living above the poverty line.
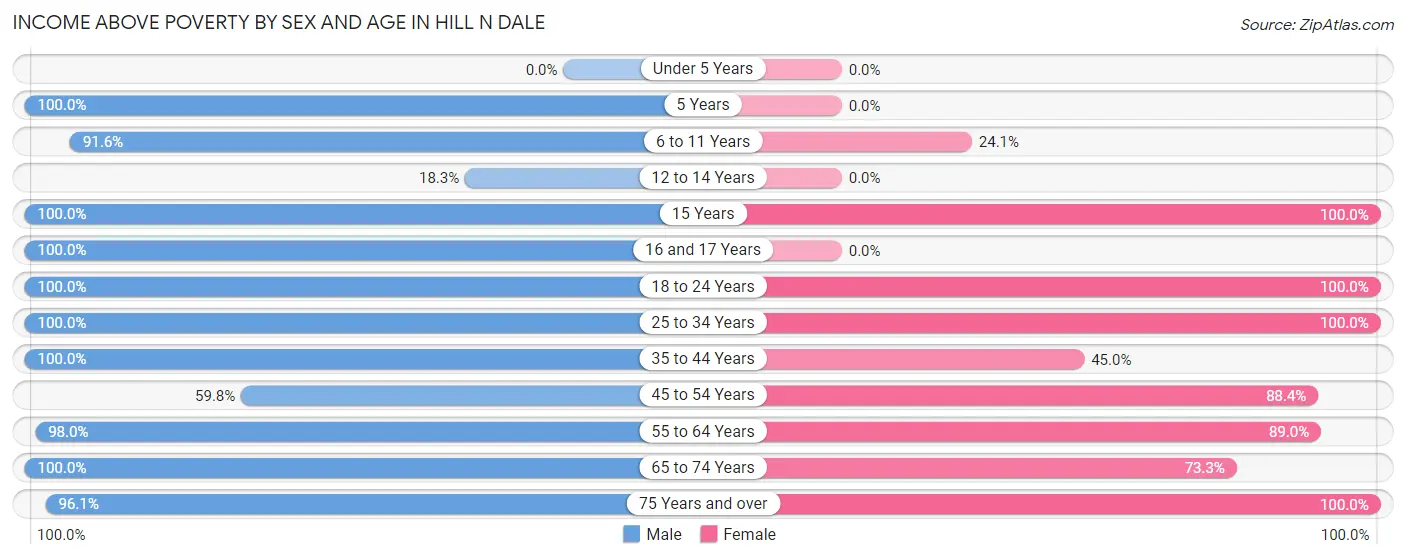
| Age Bracket | Male | Female |
| Under 5 Years | 0 (0.0%) | 0 (0.0%) |
| 5 Years | 21 (100.0%) | 0 (0.0%) |
| 6 to 11 Years | 87 (91.6%) | 28 (24.1%) |
| 12 to 14 Years | 46 (18.2%) | 0 (0.0%) |
| 15 Years | 11 (100.0%) | 12 (100.0%) |
| 16 and 17 Years | 57 (100.0%) | 0 (0.0%) |
| 18 to 24 Years | 17 (100.0%) | 103 (100.0%) |
| 25 to 34 Years | 311 (100.0%) | 163 (100.0%) |
| 35 to 44 Years | 112 (100.0%) | 99 (45.0%) |
| 45 to 54 Years | 192 (59.8%) | 313 (88.4%) |
| 55 to 64 Years | 149 (98.0%) | 161 (88.9%) |
| 65 to 74 Years | 113 (100.0%) | 107 (73.3%) |
| 75 Years and over | 124 (96.1%) | 99 (100.0%) |
| Total | 1,240 (77.9%) | 1,085 (77.3%) |
Income Below Poverty Among Married-Couple Families in Hill n Dale
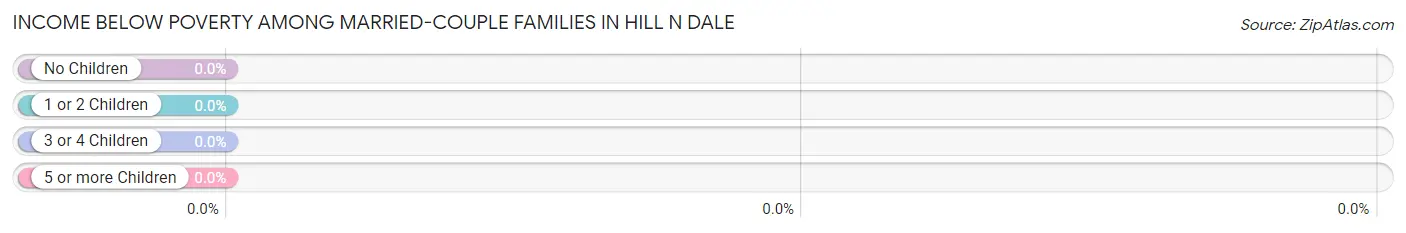
| Children | Above Poverty | Below Poverty |
| No Children | 387 (100.0%) | 0 (0.0%) |
| 1 or 2 Children | 110 (100.0%) | 0 (0.0%) |
| 3 or 4 Children | 0 (0.0%) | 0 (0.0%) |
| 5 or more Children | 0 (0.0%) | 0 (0.0%) |
| Total | 497 (100.0%) | 0 (0.0%) |
Income Below Poverty Among Single-Parent Households in Hill n Dale
According to the poverty data in Hill n Dale, 76.3% or 129 single-father households and 29.8% or 34 single-mother households are living below the poverty line. Among single-father households, those with 3 or 4 children have the highest poverty rate, with 129 households (80.1%) experiencing poverty. Likewise, among single-mother households, those with no children have the highest poverty rate, with 27 households (47.4%) falling below the poverty line.
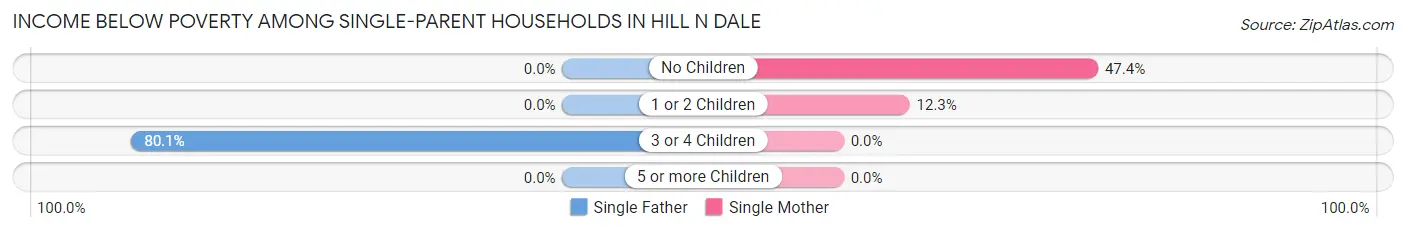
| Children | Single Father | Single Mother |
| No Children | 0 (0.0%) | 27 (47.4%) |
| 1 or 2 Children | 0 (0.0%) | 7 (12.3%) |
| 3 or 4 Children | 129 (80.1%) | 0 (0.0%) |
| 5 or more Children | 0 (0.0%) | 0 (0.0%) |
| Total | 129 (76.3%) | 34 (29.8%) |
Income Below Poverty Among Married-Couple vs Single-Parent Households in Hill n Dale
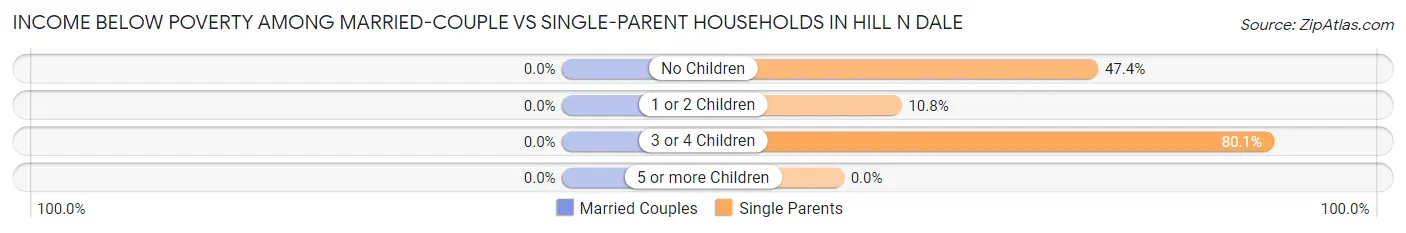
| Children | Married-Couple Families | Single-Parent Households |
| No Children | 0 (0.0%) | 27 (47.4%) |
| 1 or 2 Children | 0 (0.0%) | 7 (10.8%) |
| 3 or 4 Children | 0 (0.0%) | 129 (80.1%) |
| 5 or more Children | 0 (0.0%) | 0 (0.0%) |
| Total | 0 (0.0%) | 163 (57.6%) |
Race in Hill n Dale
The most populous races in Hill n Dale are White / Caucasian (2,003 | 66.5%), Black / African American (852 | 28.3%), and Hispanic or Latino (399 | 13.3%).
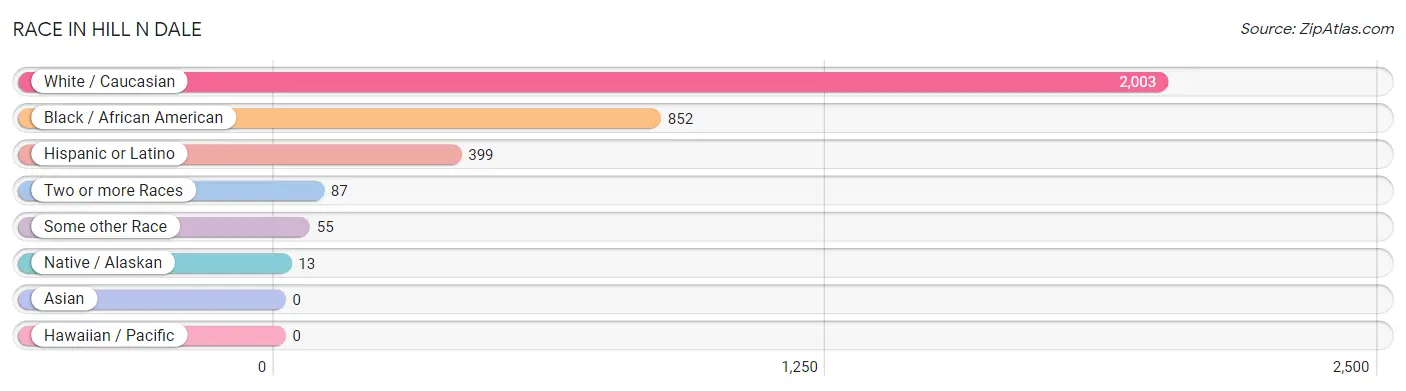
| Race | # Population | % Population |
| Asian | 0 | 0.0% |
| Black / African American | 852 | 28.3% |
| Hawaiian / Pacific | 0 | 0.0% |
| Hispanic or Latino | 399 | 13.3% |
| Native / Alaskan | 13 | 0.4% |
| White / Caucasian | 2,003 | 66.5% |
| Two or more Races | 87 | 2.9% |
| Some other Race | 55 | 1.8% |
| Total | 3,010 | 100.0% |
Ancestry in Hill n Dale
The most populous ancestries reported in Hill n Dale are American (1,328 | 44.1%), Mexican (363 | 12.1%), German (261 | 8.7%), Irish (136 | 4.5%), and Italian (118 | 3.9%), together accounting for 73.3% of all Hill n Dale residents.
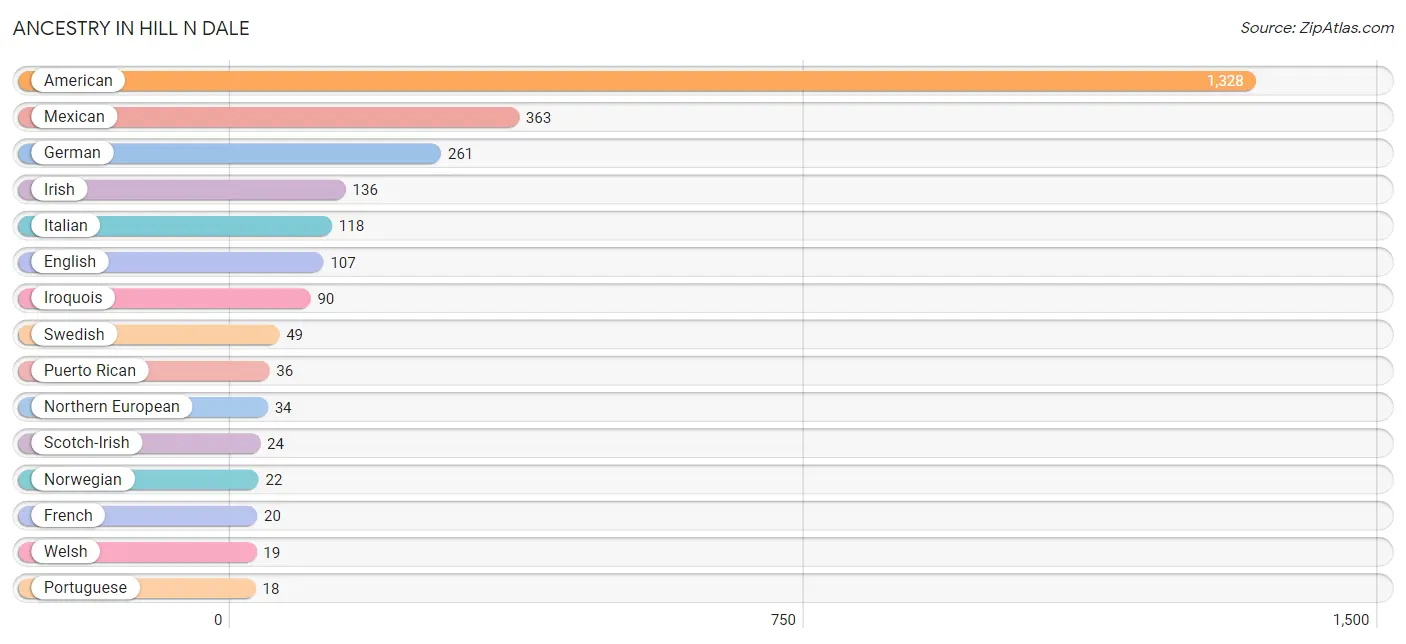
| Ancestry | # Population | % Population |
| American | 1,328 | 44.1% |
| English | 107 | 3.5% |
| European | 14 | 0.5% |
| French | 20 | 0.7% |
| French Canadian | 5 | 0.2% |
| German | 261 | 8.7% |
| Greek | 6 | 0.2% |
| Hungarian | 8 | 0.3% |
| Irish | 136 | 4.5% |
| Iroquois | 90 | 3.0% |
| Italian | 118 | 3.9% |
| Mexican | 363 | 12.1% |
| Northern European | 34 | 1.1% |
| Norwegian | 22 | 0.7% |
| Polish | 6 | 0.2% |
| Portuguese | 18 | 0.6% |
| Puerto Rican | 36 | 1.2% |
| Russian | 3 | 0.1% |
| Scotch-Irish | 24 | 0.8% |
| Scottish | 12 | 0.4% |
| Swedish | 49 | 1.6% |
| Welsh | 19 | 0.6% | View All 22 Rows |
Immigrants in Hill n Dale
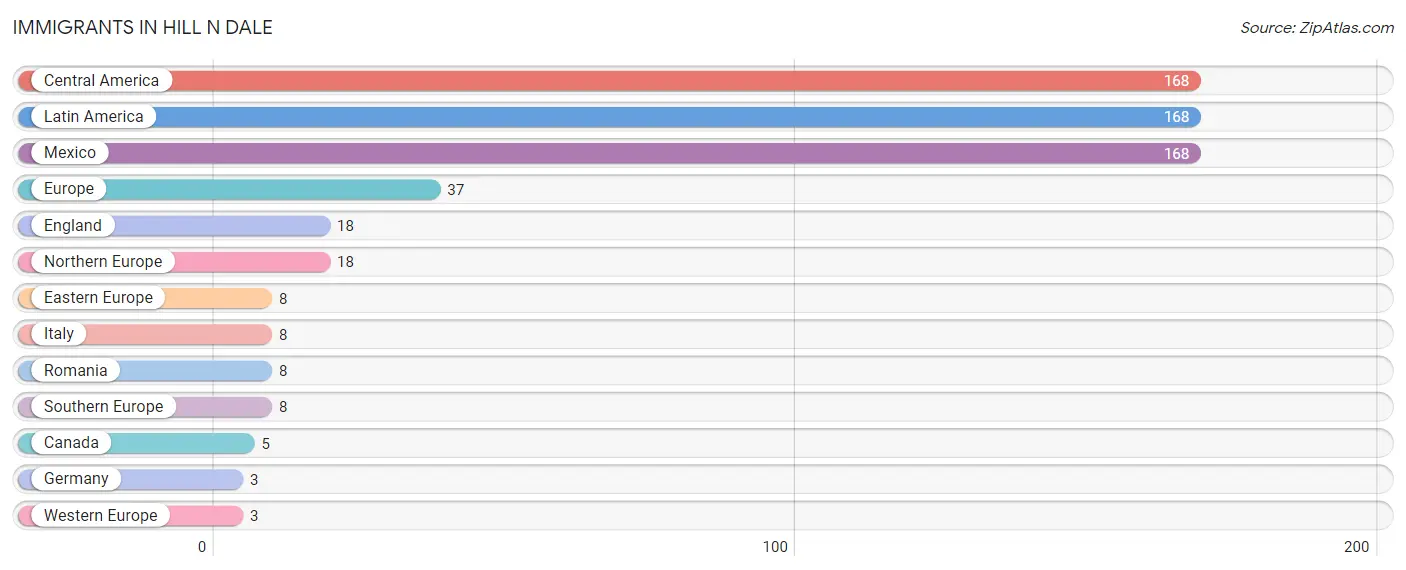
The most numerous immigrant groups reported in Hill n Dale came from Central America (168 | 5.6%), Latin America (168 | 5.6%), Mexico (168 | 5.6%), Europe (37 | 1.2%), and England (18 | 0.6%), together accounting for 18.6% of all Hill n Dale residents.
| Immigration Origin | # Population | % Population |
| Canada | 5 | 0.2% |
| Central America | 168 | 5.6% |
| Eastern Europe | 8 | 0.3% |
| England | 18 | 0.6% |
| Europe | 37 | 1.2% |
| Germany | 3 | 0.1% |
| Italy | 8 | 0.3% |
| Latin America | 168 | 5.6% |
| Mexico | 168 | 5.6% |
| Northern Europe | 18 | 0.6% |
| Romania | 8 | 0.3% |
| Southern Europe | 8 | 0.3% |
| Western Europe | 3 | 0.1% | View All 13 Rows |
Sex and Age in Hill n Dale
Sex and Age in Hill n Dale
The most populous age groups in Hill n Dale are 10 to 14 Years (305 | 19.0%) for men and 45 to 49 Years (324 | 23.1%) for women.
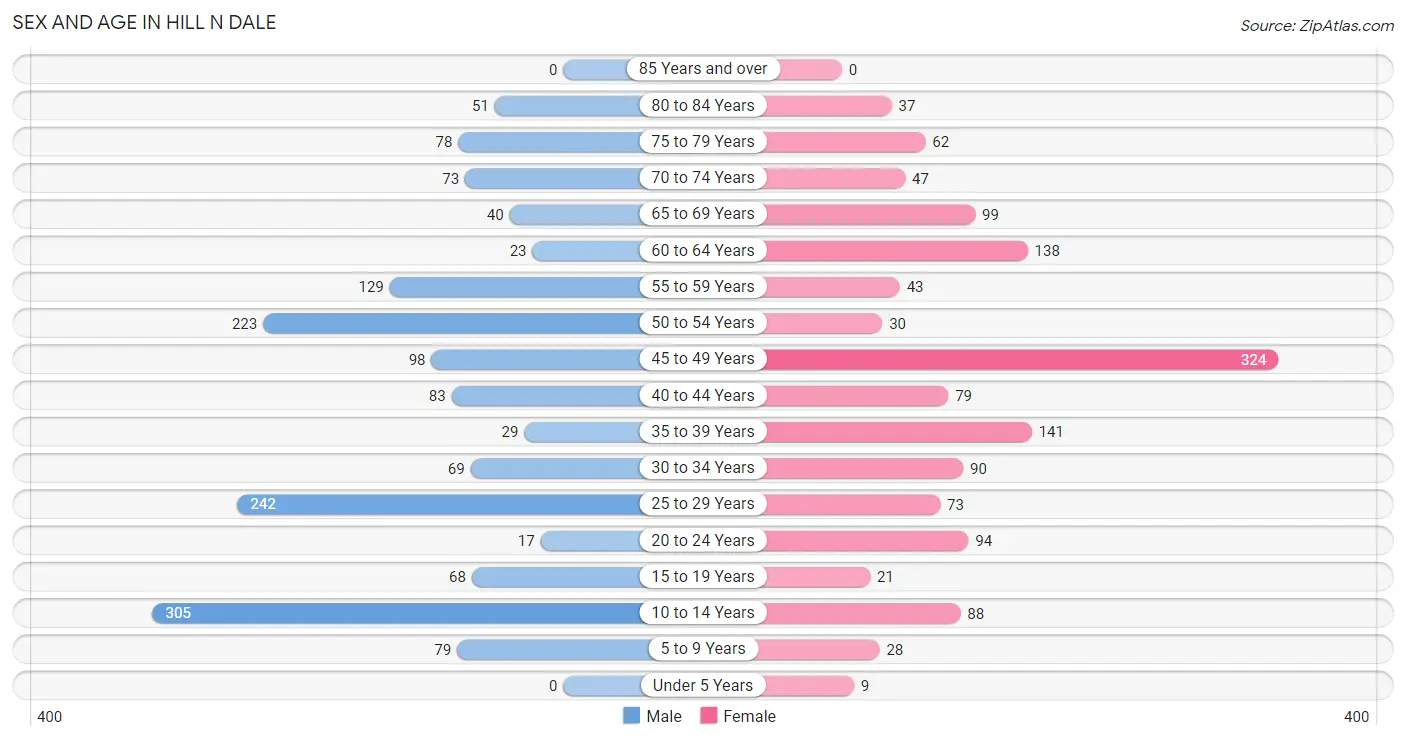
| Age Bracket | Male | Female |
| Under 5 Years | 0 (0.0%) | 9 (0.6%) |
| 5 to 9 Years | 79 (4.9%) | 28 (2.0%) |
| 10 to 14 Years | 305 (19.0%) | 88 (6.3%) |
| 15 to 19 Years | 68 (4.2%) | 21 (1.5%) |
| 20 to 24 Years | 17 (1.1%) | 94 (6.7%) |
| 25 to 29 Years | 242 (15.1%) | 73 (5.2%) |
| 30 to 34 Years | 69 (4.3%) | 90 (6.4%) |
| 35 to 39 Years | 29 (1.8%) | 141 (10.1%) |
| 40 to 44 Years | 83 (5.2%) | 79 (5.6%) |
| 45 to 49 Years | 98 (6.1%) | 324 (23.1%) |
| 50 to 54 Years | 223 (13.9%) | 30 (2.1%) |
| 55 to 59 Years | 129 (8.0%) | 43 (3.1%) |
| 60 to 64 Years | 23 (1.4%) | 138 (9.8%) |
| 65 to 69 Years | 40 (2.5%) | 99 (7.1%) |
| 70 to 74 Years | 73 (4.5%) | 47 (3.4%) |
| 75 to 79 Years | 78 (4.9%) | 62 (4.4%) |
| 80 to 84 Years | 51 (3.2%) | 37 (2.6%) |
| 85 Years and over | 0 (0.0%) | 0 (0.0%) |
| Total | 1,607 (100.0%) | 1,403 (100.0%) |
Families and Households in Hill n Dale
Median Family Size in Hill n Dale
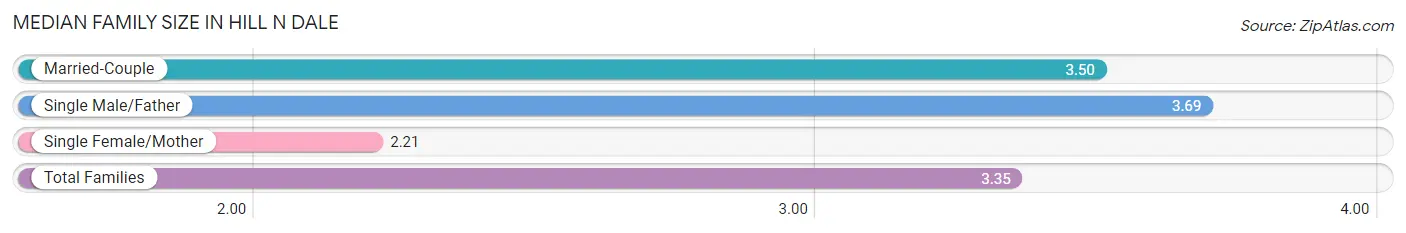
The median family size in Hill n Dale is 3.35 persons per family, with single male/father families (169 | 21.7%) accounting for the largest median family size of 3.69 persons per family. On the other hand, single female/mother families (114 | 14.6%) represent the smallest median family size with 2.21 persons per family.
| Family Type | # Families | Family Size |
| Married-Couple | 497 (63.7%) | 3.50 |
| Single Male/Father | 169 (21.7%) | 3.69 |
| Single Female/Mother | 114 (14.6%) | 2.21 |
| Total Families | 780 (100.0%) | 3.35 |
Median Household Size in Hill n Dale
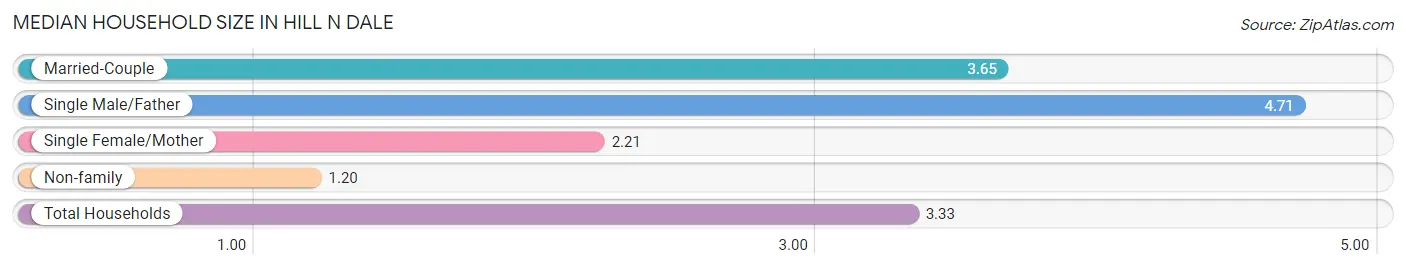
The median household size in Hill n Dale is 3.33 persons per household, with single male/father households (169 | 18.7%) accounting for the largest median household size of 4.71 persons per household. non-family households (123 | 13.6%) represent the smallest median household size with 1.20 persons per household.
| Household Type | # Households | Household Size |
| Married-Couple | 497 (55.0%) | 3.65 |
| Single Male/Father | 169 (18.7%) | 4.71 |
| Single Female/Mother | 114 (12.6%) | 2.21 |
| Non-family | 123 (13.6%) | 1.20 |
| Total Households | 903 (100.0%) | 3.33 |
Household Size by Marriage Status in Hill n Dale
Out of a total of 903 households in Hill n Dale, 780 (86.4%) are family households, while 123 (13.6%) are nonfamily households. The most numerous type of family households are 2-person households, comprising 261, and the most common type of nonfamily households are 1-person households, comprising 98.
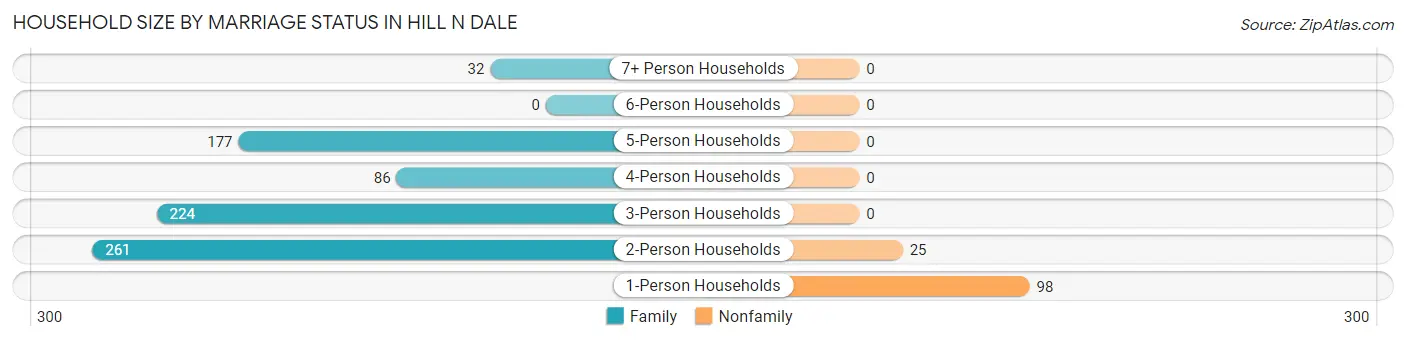
| Household Size | Family Households | Nonfamily Households |
| 1-Person Households | - | 98 (10.8%) |
| 2-Person Households | 261 (28.9%) | 25 (2.8%) |
| 3-Person Households | 224 (24.8%) | 0 (0.0%) |
| 4-Person Households | 86 (9.5%) | 0 (0.0%) |
| 5-Person Households | 177 (19.6%) | 0 (0.0%) |
| 6-Person Households | 0 (0.0%) | 0 (0.0%) |
| 7+ Person Households | 32 (3.5%) | 0 (0.0%) |
| Total | 780 (86.4%) | 123 (13.6%) |
Female Fertility in Hill n Dale
Fertility by Age in Hill n Dale
| Age Bracket | Women with Births | Births / 1,000 Women |
| 15 to 19 years | 0 (0.0%) | 0.0 |
| 20 to 34 years | 0 (0.0%) | 0.0 |
| 35 to 50 years | 0 (0.0%) | 0.0 |
| Total | 0 (0.0%) | 0.0 |
Fertility by Age by Marriage Status in Hill n Dale
| Age Bracket | Married | Unmarried |
| 15 to 19 years | 0 (0.0%) | 0 (0.0%) |
| 20 to 34 years | 0 (0.0%) | 0 (0.0%) |
| 35 to 50 years | 0 (0.0%) | 0 (0.0%) |
| Total | 0 (0.0%) | 0 (0.0%) |
Fertility by Education in Hill n Dale
| Educational Attainment | Women with Births | Births / 1,000 Women |
| Less than High School | 0 (0.0%) | 0.0 |
| High School Diploma | 0 (0.0%) | 0.0 |
| College or Associate's Degree | 0 (0.0%) | 0.0 |
| Bachelor's Degree | 0 (0.0%) | 0.0 |
| Graduate Degree | 0 (0.0%) | 0.0 |
| Total | 0 (0.0%) | 0.0 |
Fertility by Education by Marriage Status in Hill n Dale
| Educational Attainment | Married | Unmarried |
| Less than High School | 0 (0.0%) | 0 (0.0%) |
| High School Diploma | 0 (0.0%) | 0 (0.0%) |
| College or Associate's Degree | 0 (0.0%) | 0 (0.0%) |
| Bachelor's Degree | 0 (0.0%) | 0 (0.0%) |
| Graduate Degree | 0 (0.0%) | 0 (0.0%) |
| Total | 0 (0.0%) | 0 (0.0%) |
Employment Characteristics in Hill n Dale
Employment by Class of Employer in Hill n Dale
Among the 1,456 employed individuals in Hill n Dale, private company employees (1,271 | 87.3%), self-employed (incorporated) (75 | 5.1%), and local government employees (63 | 4.3%) make up the most common classes of employment.
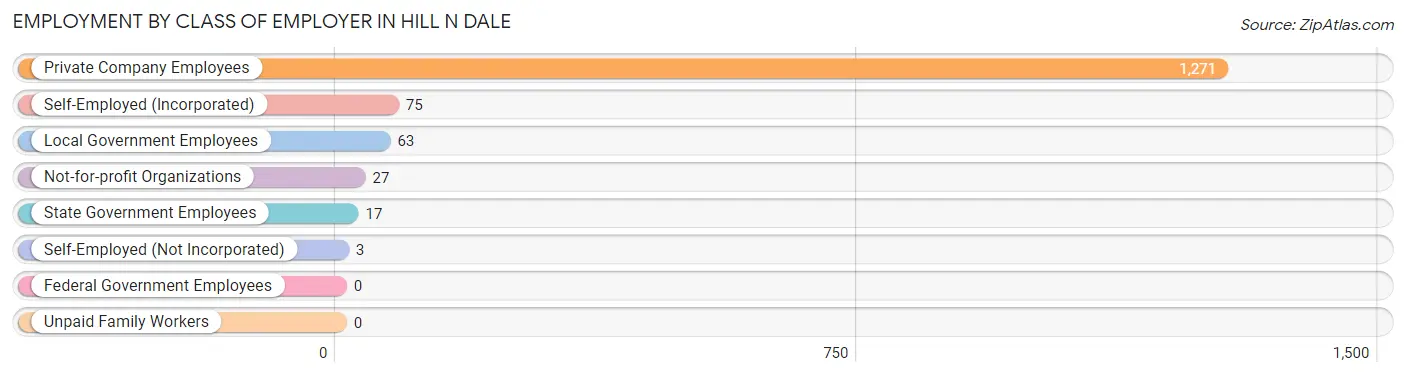
| Employer Class | # Employees | % Employees |
| Private Company Employees | 1,271 | 87.3% |
| Self-Employed (Incorporated) | 75 | 5.1% |
| Self-Employed (Not Incorporated) | 3 | 0.2% |
| Not-for-profit Organizations | 27 | 1.8% |
| Local Government Employees | 63 | 4.3% |
| State Government Employees | 17 | 1.2% |
| Federal Government Employees | 0 | 0.0% |
| Unpaid Family Workers | 0 | 0.0% |
| Total | 1,456 | 100.0% |
Employment Status by Age in Hill n Dale
According to the labor force statistics for Hill n Dale, out of the total population over 16 years of age (2,478), 61.2% or 1,517 individuals are in the labor force, with 3.4% or 52 of them unemployed. The age group with the highest labor force participation rate is 16 to 19 years, with 100.0% or 66 individuals in the labor force. Within the labor force, the 45 to 54 years age range has the highest percentage of unemployed individuals, with 8.5% or 41 of them being unemployed.
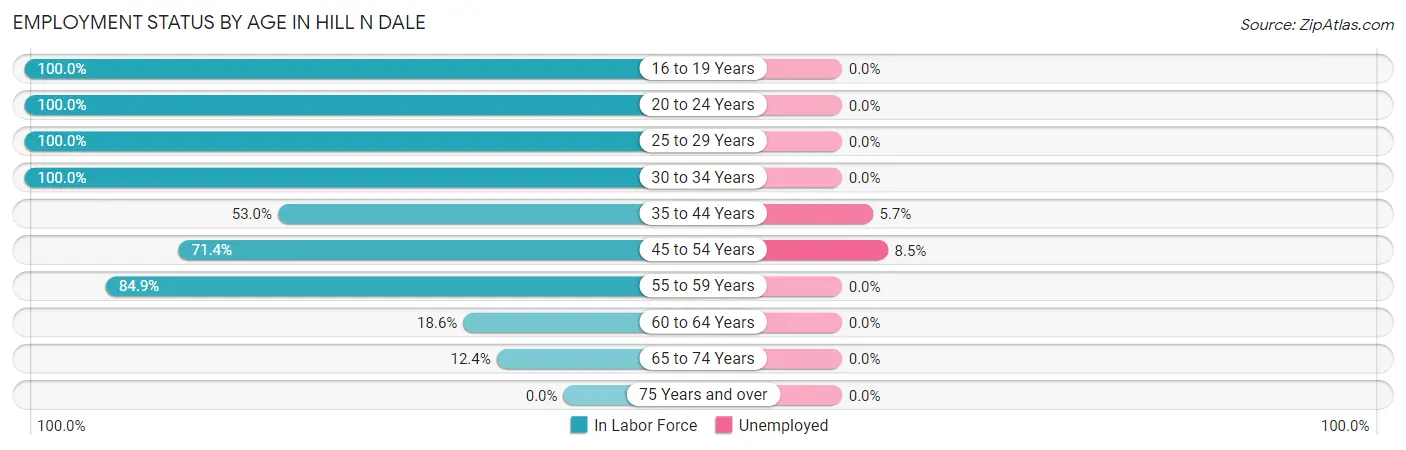
| Age Bracket | In Labor Force | Unemployed |
| 16 to 19 Years | 66 (100.0%) | 0 (0.0%) |
| 20 to 24 Years | 111 (100.0%) | 0 (0.0%) |
| 25 to 29 Years | 315 (100.0%) | 0 (0.0%) |
| 30 to 34 Years | 159 (100.0%) | 0 (0.0%) |
| 35 to 44 Years | 176 (53.0%) | 10 (5.7%) |
| 45 to 54 Years | 482 (71.4%) | 41 (8.5%) |
| 55 to 59 Years | 146 (84.9%) | 0 (0.0%) |
| 60 to 64 Years | 30 (18.6%) | 0 (0.0%) |
| 65 to 74 Years | 32 (12.4%) | 0 (0.0%) |
| 75 Years and over | 0 (0.0%) | 0 (0.0%) |
| Total | 1,517 (61.2%) | 52 (3.4%) |
Employment Status by Educational Attainment in Hill n Dale
According to labor force statistics for Hill n Dale, 72.1% of individuals (1,308) out of the total population between 25 and 64 years of age (1,814) are in the labor force, with 3.9% or 51 of them being unemployed. The group with the highest labor force participation rate are those with the educational attainment of high school diploma, with 87.6% or 654 individuals in the labor force. Within the labor force, individuals with high school diploma education have the highest percentage of unemployment, with 6.3% or 41 of them being unemployed.
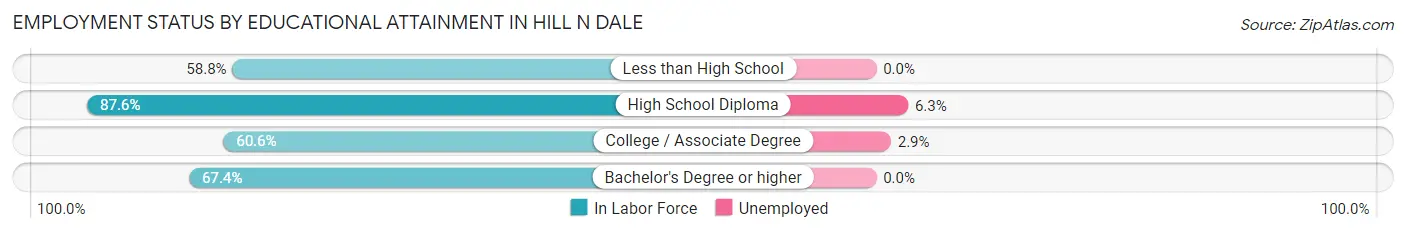
| Educational Attainment | In Labor Force | Unemployed |
| Less than High School | 177 (58.8%) | 0 (0.0%) |
| High School Diploma | 654 (87.6%) | 47 (6.3%) |
| College / Associate Degree | 349 (60.6%) | 17 (2.9%) |
| Bachelor's Degree or higher | 128 (67.4%) | 0 (0.0%) |
| Total | 1,308 (72.1%) | 71 (3.9%) |
Employment Occupations by Sex in Hill n Dale
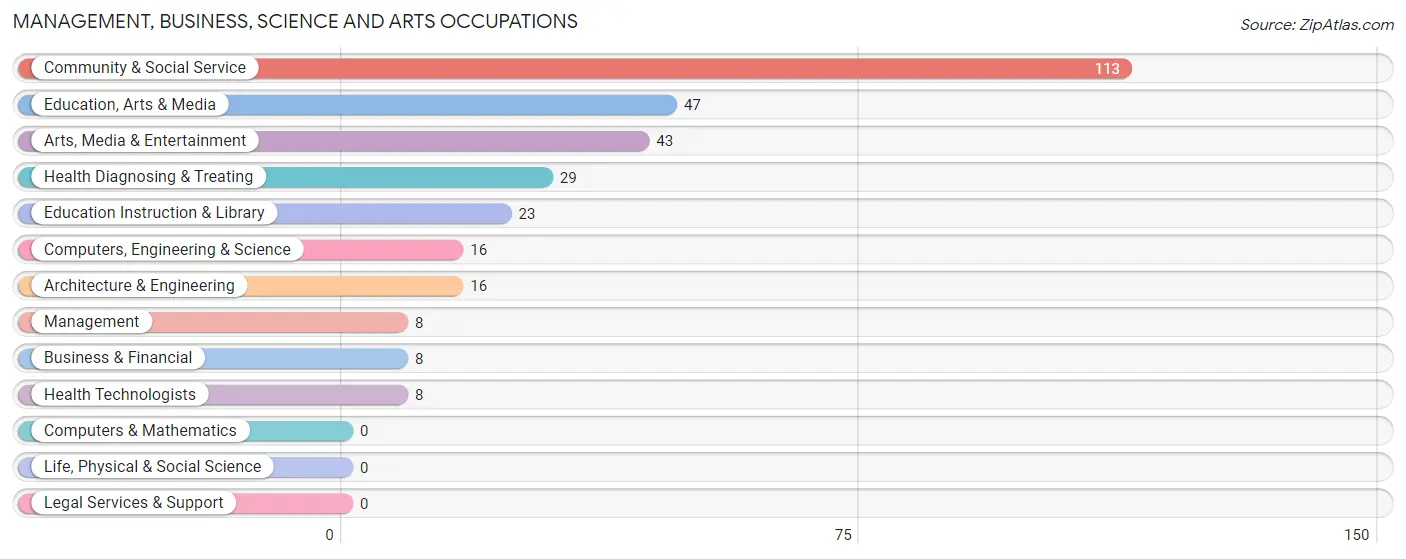
Management, Business, Science and Arts Occupations
The most common Management, Business, Science and Arts occupations in Hill n Dale are Community & Social Service (113 | 7.7%), Education, Arts & Media (47 | 3.2%), Arts, Media & Entertainment (43 | 2.9%), Health Diagnosing & Treating (29 | 2.0%), and Education Instruction & Library (23 | 1.6%).
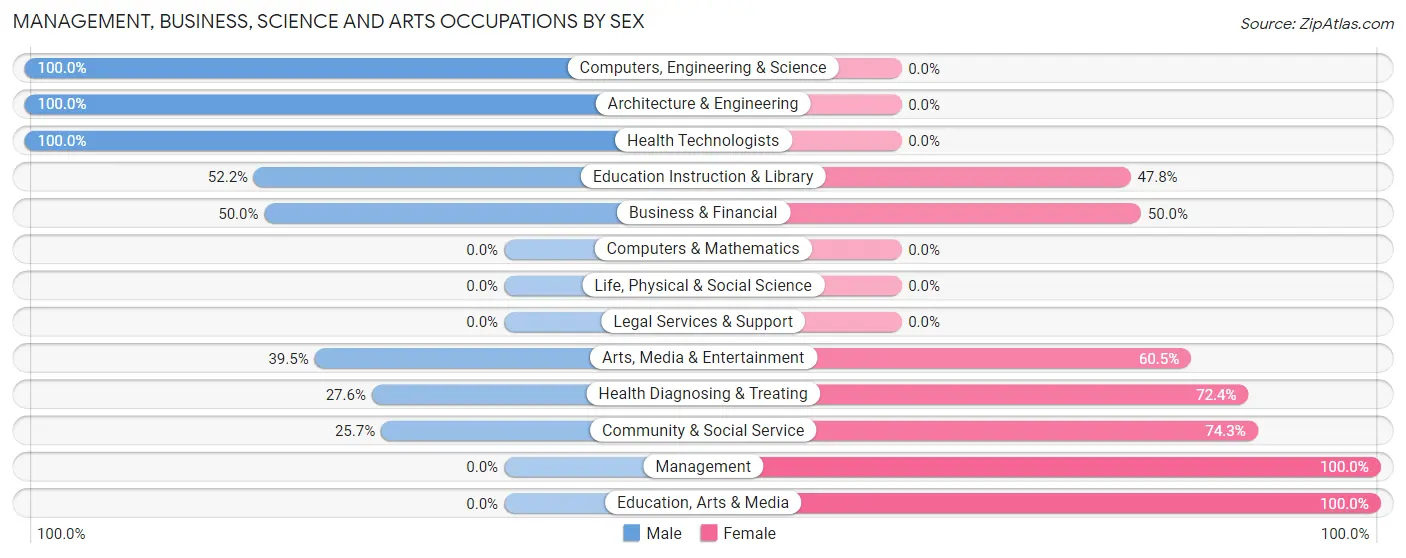
Management, Business, Science and Arts Occupations by Sex
Within the Management, Business, Science and Arts occupations in Hill n Dale, the most male-oriented occupations are Computers, Engineering & Science (100.0%), Architecture & Engineering (100.0%), and Health Technologists (100.0%), while the most female-oriented occupations are Management (100.0%), Education, Arts & Media (100.0%), and Community & Social Service (74.3%).
| Occupation | Male | Female |
| Management | 0 (0.0%) | 8 (100.0%) |
| Business & Financial | 4 (50.0%) | 4 (50.0%) |
| Computers, Engineering & Science | 16 (100.0%) | 0 (0.0%) |
| Computers & Mathematics | 0 (0.0%) | 0 (0.0%) |
| Architecture & Engineering | 16 (100.0%) | 0 (0.0%) |
| Life, Physical & Social Science | 0 (0.0%) | 0 (0.0%) |
| Community & Social Service | 29 (25.7%) | 84 (74.3%) |
| Education, Arts & Media | 0 (0.0%) | 47 (100.0%) |
| Legal Services & Support | 0 (0.0%) | 0 (0.0%) |
| Education Instruction & Library | 12 (52.2%) | 11 (47.8%) |
| Arts, Media & Entertainment | 17 (39.5%) | 26 (60.5%) |
| Health Diagnosing & Treating | 8 (27.6%) | 21 (72.4%) |
| Health Technologists | 8 (100.0%) | 0 (0.0%) |
| Total (Category) | 57 (32.8%) | 117 (67.2%) |
| Total (Overall) | 921 (62.8%) | 545 (37.2%) |
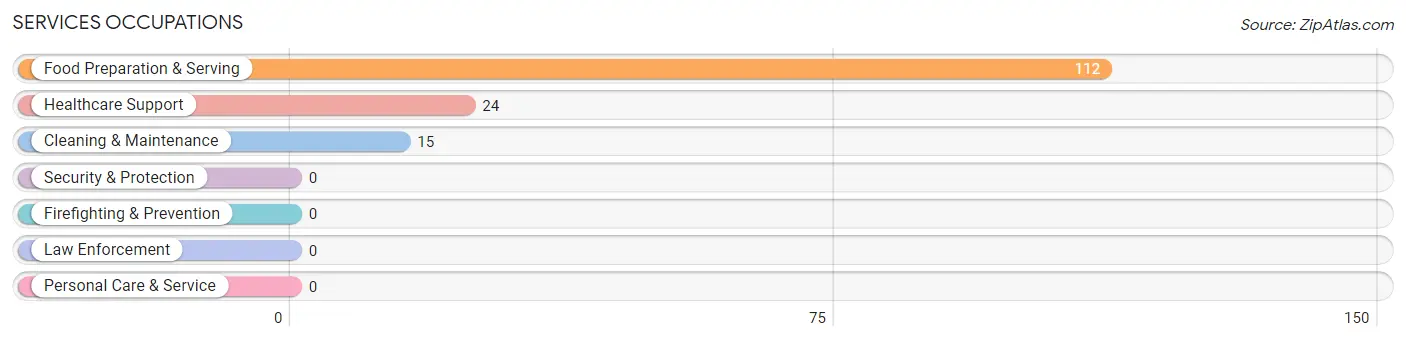
Services Occupations
The most common Services occupations in Hill n Dale are Food Preparation & Serving (112 | 7.6%), Healthcare Support (24 | 1.6%), and Cleaning & Maintenance (15 | 1.0%).
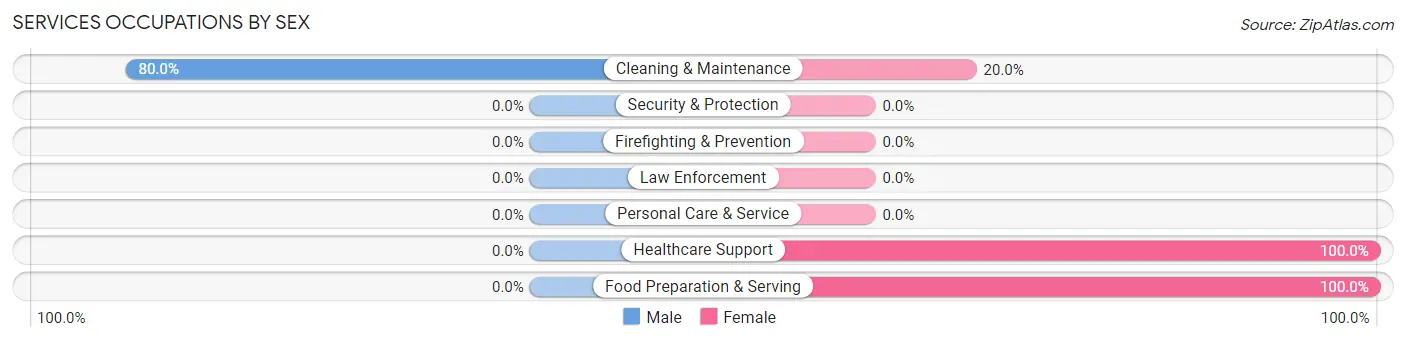
Services Occupations by Sex
| Occupation | Male | Female |
| Healthcare Support | 0 (0.0%) | 24 (100.0%) |
| Security & Protection | 0 (0.0%) | 0 (0.0%) |
| Firefighting & Prevention | 0 (0.0%) | 0 (0.0%) |
| Law Enforcement | 0 (0.0%) | 0 (0.0%) |
| Food Preparation & Serving | 0 (0.0%) | 112 (100.0%) |
| Cleaning & Maintenance | 12 (80.0%) | 3 (20.0%) |
| Personal Care & Service | 0 (0.0%) | 0 (0.0%) |
| Total (Category) | 12 (8.0%) | 139 (92.0%) |
| Total (Overall) | 921 (62.8%) | 545 (37.2%) |
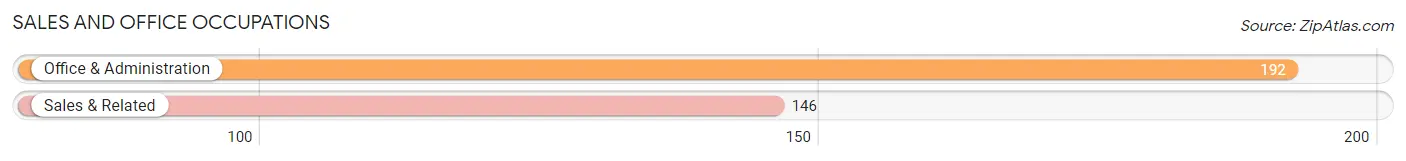
Sales and Office Occupations
The most common Sales and Office occupations in Hill n Dale are Office & Administration (192 | 13.1%), and Sales & Related (146 | 10.0%).
Sales and Office Occupations by Sex
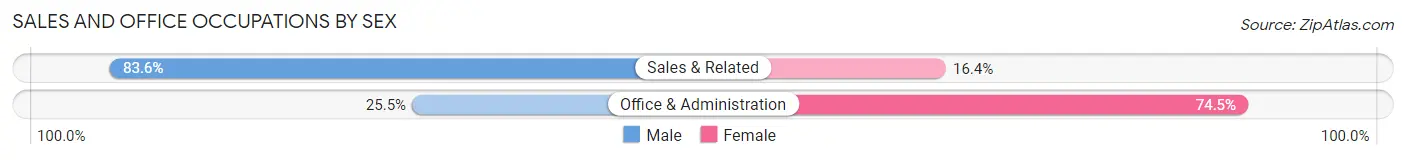
| Occupation | Male | Female |
| Sales & Related | 122 (83.6%) | 24 (16.4%) |
| Office & Administration | 49 (25.5%) | 143 (74.5%) |
| Total (Category) | 171 (50.6%) | 167 (49.4%) |
| Total (Overall) | 921 (62.8%) | 545 (37.2%) |
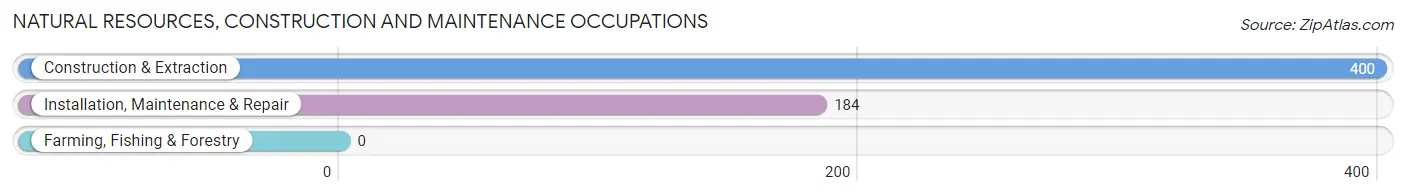
Natural Resources, Construction and Maintenance Occupations
The most common Natural Resources, Construction and Maintenance occupations in Hill n Dale are Construction & Extraction (400 | 27.3%), and Installation, Maintenance & Repair (184 | 12.6%).
Natural Resources, Construction and Maintenance Occupations by Sex
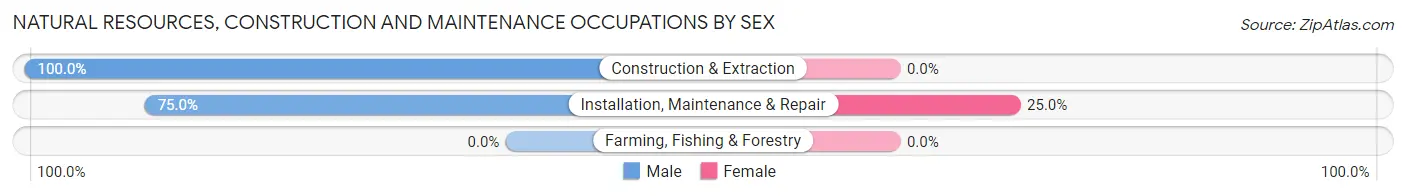
| Occupation | Male | Female |
| Farming, Fishing & Forestry | 0 (0.0%) | 0 (0.0%) |
| Construction & Extraction | 400 (100.0%) | 0 (0.0%) |
| Installation, Maintenance & Repair | 138 (75.0%) | 46 (25.0%) |
| Total (Category) | 538 (92.1%) | 46 (7.9%) |
| Total (Overall) | 921 (62.8%) | 545 (37.2%) |
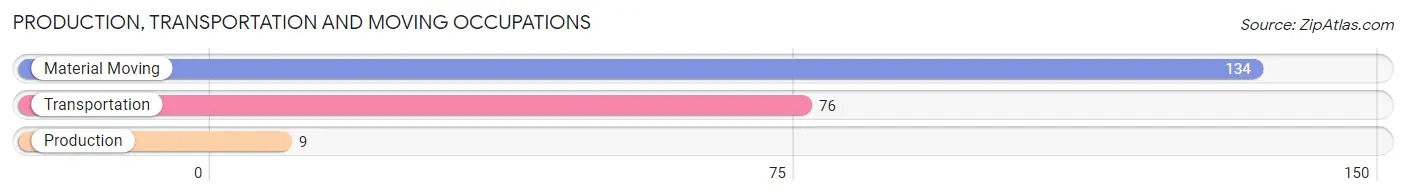
Production, Transportation and Moving Occupations
The most common Production, Transportation and Moving occupations in Hill n Dale are Material Moving (134 | 9.1%), Transportation (76 | 5.2%), and Production (9 | 0.6%).
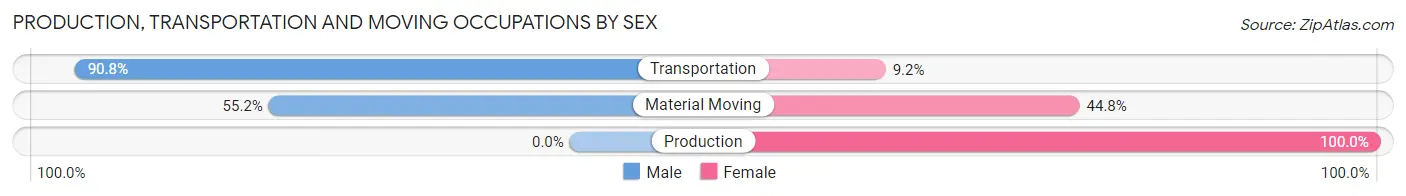
Production, Transportation and Moving Occupations by Sex
| Occupation | Male | Female |
| Production | 0 (0.0%) | 9 (100.0%) |
| Transportation | 69 (90.8%) | 7 (9.2%) |
| Material Moving | 74 (55.2%) | 60 (44.8%) |
| Total (Category) | 143 (65.3%) | 76 (34.7%) |
| Total (Overall) | 921 (62.8%) | 545 (37.2%) |
Employment Industries by Sex in Hill n Dale
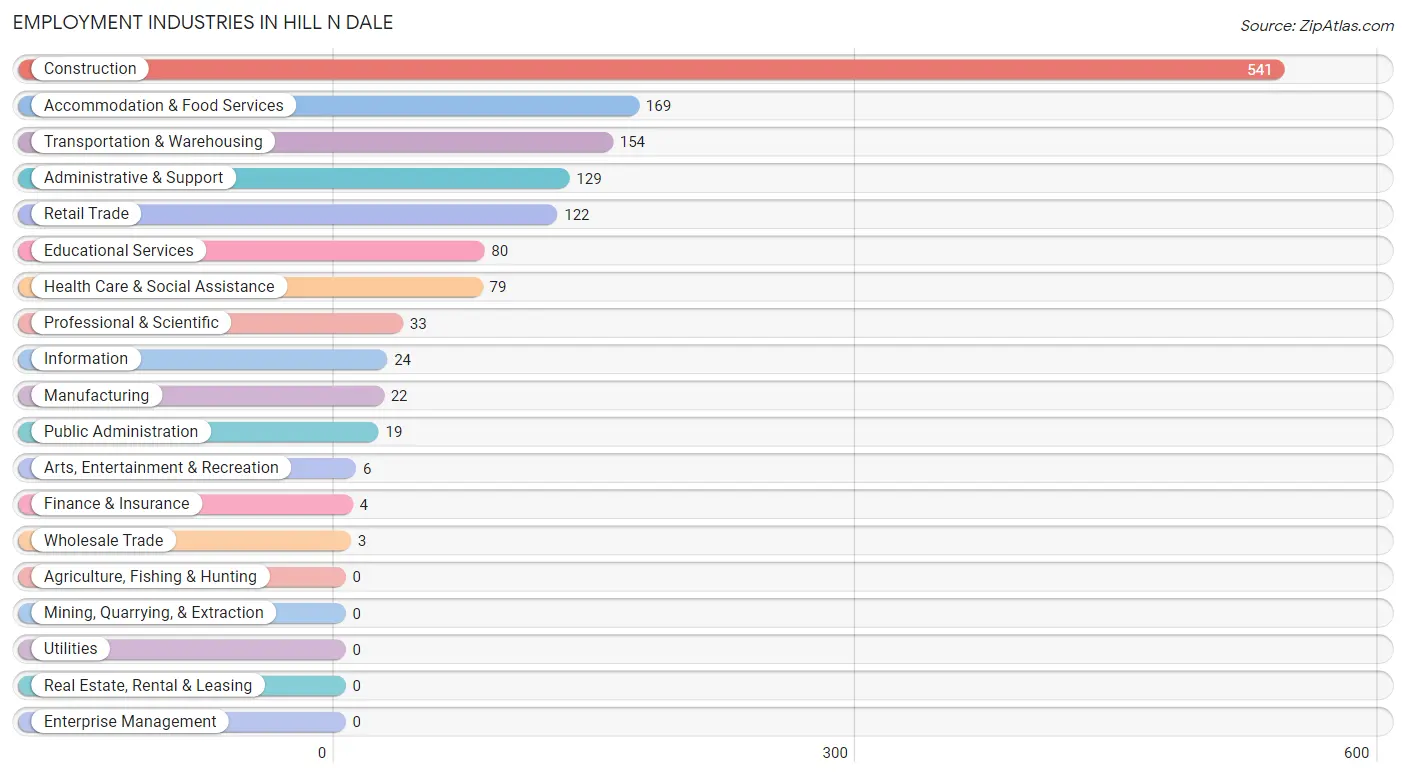
Employment Industries in Hill n Dale
The major employment industries in Hill n Dale include Construction (541 | 36.9%), Accommodation & Food Services (169 | 11.5%), Transportation & Warehousing (154 | 10.5%), Administrative & Support (129 | 8.8%), and Retail Trade (122 | 8.3%).
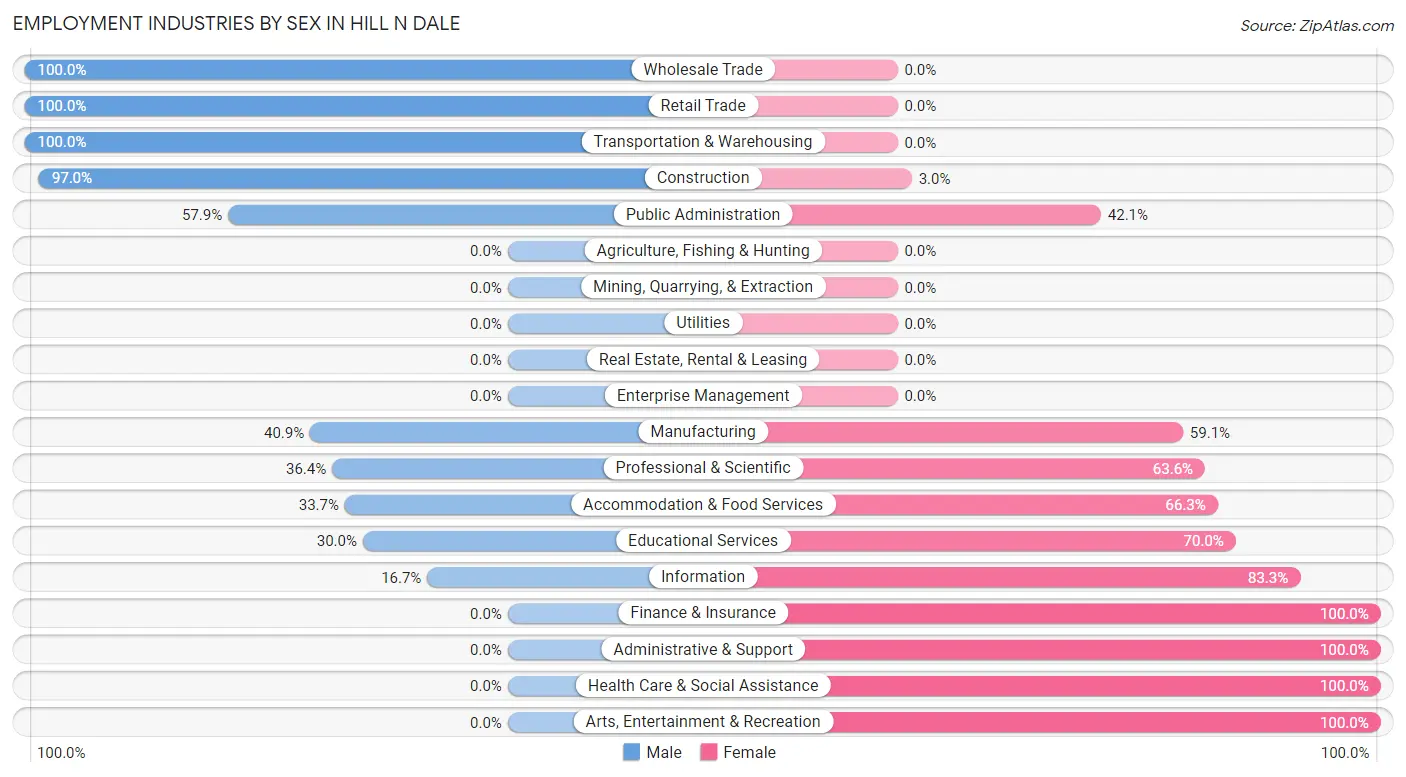
Employment Industries by Sex in Hill n Dale
The Hill n Dale industries that see more men than women are Wholesale Trade (100.0%), Retail Trade (100.0%), and Transportation & Warehousing (100.0%), whereas the industries that tend to have a higher number of women are Finance & Insurance (100.0%), Administrative & Support (100.0%), and Health Care & Social Assistance (100.0%).
| Industry | Male | Female |
| Agriculture, Fishing & Hunting | 0 (0.0%) | 0 (0.0%) |
| Mining, Quarrying, & Extraction | 0 (0.0%) | 0 (0.0%) |
| Construction | 525 (97.0%) | 16 (3.0%) |
| Manufacturing | 9 (40.9%) | 13 (59.1%) |
| Wholesale Trade | 3 (100.0%) | 0 (0.0%) |
| Retail Trade | 122 (100.0%) | 0 (0.0%) |
| Transportation & Warehousing | 154 (100.0%) | 0 (0.0%) |
| Utilities | 0 (0.0%) | 0 (0.0%) |
| Information | 4 (16.7%) | 20 (83.3%) |
| Finance & Insurance | 0 (0.0%) | 4 (100.0%) |
| Real Estate, Rental & Leasing | 0 (0.0%) | 0 (0.0%) |
| Professional & Scientific | 12 (36.4%) | 21 (63.6%) |
| Enterprise Management | 0 (0.0%) | 0 (0.0%) |
| Administrative & Support | 0 (0.0%) | 129 (100.0%) |
| Educational Services | 24 (30.0%) | 56 (70.0%) |
| Health Care & Social Assistance | 0 (0.0%) | 79 (100.0%) |
| Arts, Entertainment & Recreation | 0 (0.0%) | 6 (100.0%) |
| Accommodation & Food Services | 57 (33.7%) | 112 (66.3%) |
| Public Administration | 11 (57.9%) | 8 (42.1%) |
| Total | 921 (62.8%) | 545 (37.2%) |
Education in Hill n Dale
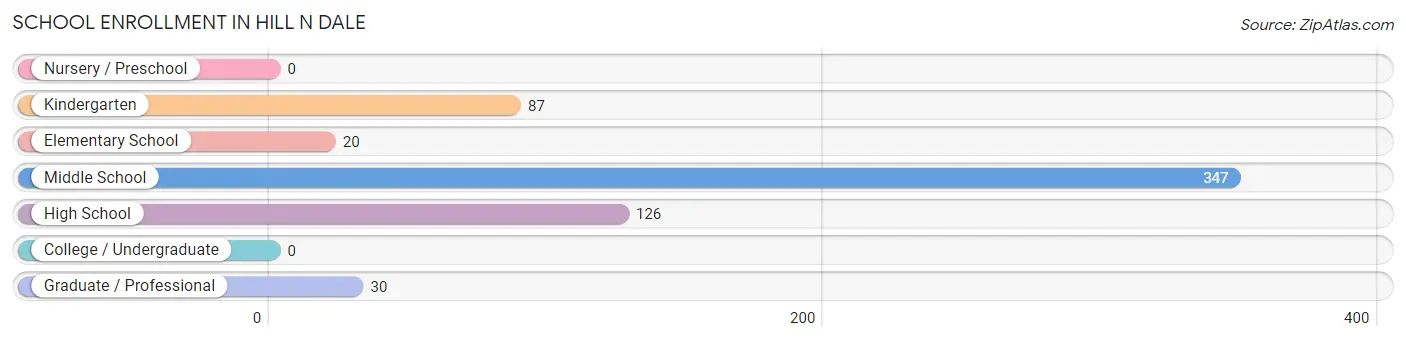
School Enrollment in Hill n Dale
The most common levels of schooling among the 610 students in Hill n Dale are middle school (347 | 56.9%), high school (126 | 20.7%), and kindergarten (87 | 14.3%).
| School Level | # Students | % Students |
| Nursery / Preschool | 0 | 0.0% |
| Kindergarten | 87 | 14.3% |
| Elementary School | 20 | 3.3% |
| Middle School | 347 | 56.9% |
| High School | 126 | 20.7% |
| College / Undergraduate | 0 | 0.0% |
| Graduate / Professional | 30 | 4.9% |
| Total | 610 | 100.0% |
School Enrollment by Age by Funding Source in Hill n Dale
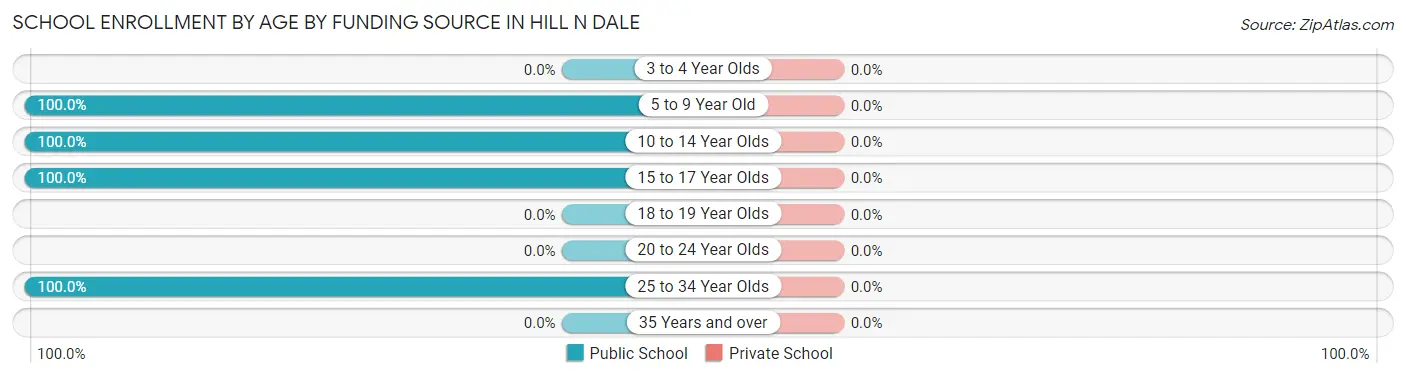
| Age Bracket | Public School | Private School |
| 3 to 4 Year Olds | 0 (0.0%) | 0 (0.0%) |
| 5 to 9 Year Old | 107 (100.0%) | 0 (0.0%) |
| 10 to 14 Year Olds | 393 (100.0%) | 0 (0.0%) |
| 15 to 17 Year Olds | 80 (100.0%) | 0 (0.0%) |
| 18 to 19 Year Olds | 0 (0.0%) | 0 (0.0%) |
| 20 to 24 Year Olds | 0 (0.0%) | 0 (0.0%) |
| 25 to 34 Year Olds | 30 (100.0%) | 0 (0.0%) |
| 35 Years and over | 0 (0.0%) | 0 (0.0%) |
| Total | 610 (100.0%) | 0 (0.0%) |
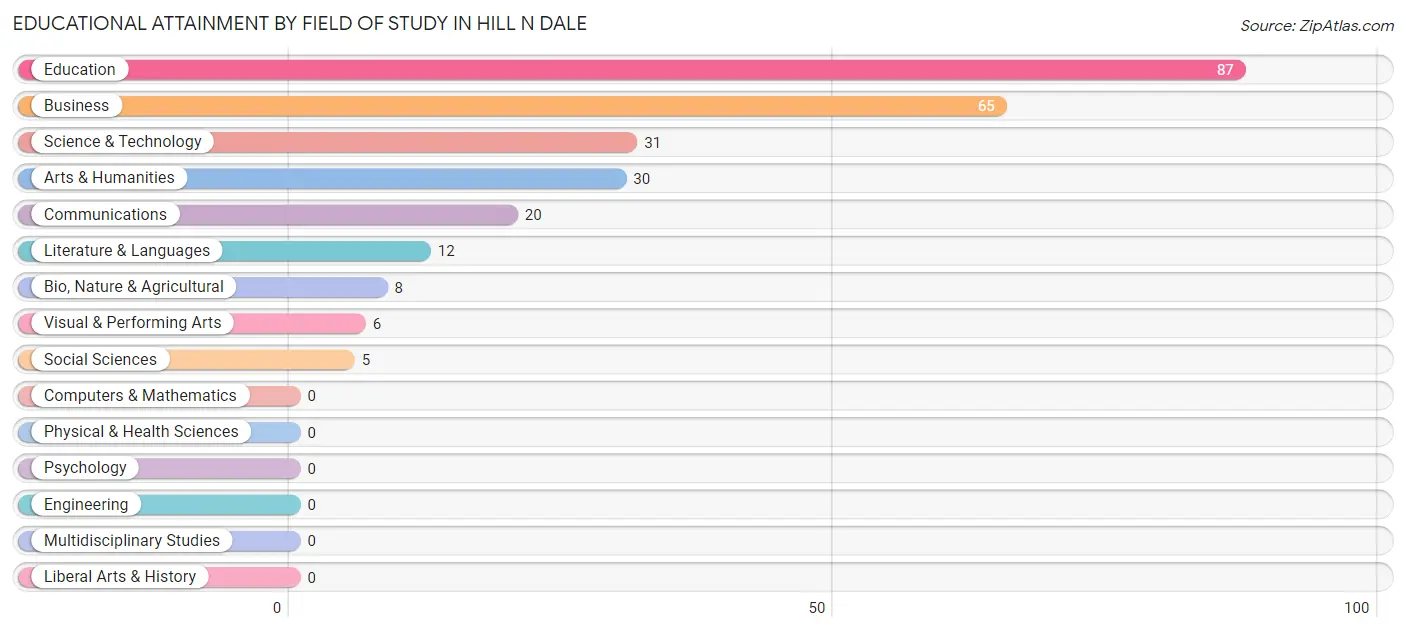
Educational Attainment by Field of Study in Hill n Dale
Education (87 | 33.0%), business (65 | 24.6%), science & technology (31 | 11.7%), arts & humanities (30 | 11.4%), and communications (20 | 7.6%) are the most common fields of study among 264 individuals in Hill n Dale who have obtained a bachelor's degree or higher.
| Field of Study | # Graduates | % Graduates |
| Computers & Mathematics | 0 | 0.0% |
| Bio, Nature & Agricultural | 8 | 3.0% |
| Physical & Health Sciences | 0 | 0.0% |
| Psychology | 0 | 0.0% |
| Social Sciences | 5 | 1.9% |
| Engineering | 0 | 0.0% |
| Multidisciplinary Studies | 0 | 0.0% |
| Science & Technology | 31 | 11.7% |
| Business | 65 | 24.6% |
| Education | 87 | 33.0% |
| Literature & Languages | 12 | 4.5% |
| Liberal Arts & History | 0 | 0.0% |
| Visual & Performing Arts | 6 | 2.3% |
| Communications | 20 | 7.6% |
| Arts & Humanities | 30 | 11.4% |
| Total | 264 | 100.0% |
Transportation & Commute in Hill n Dale
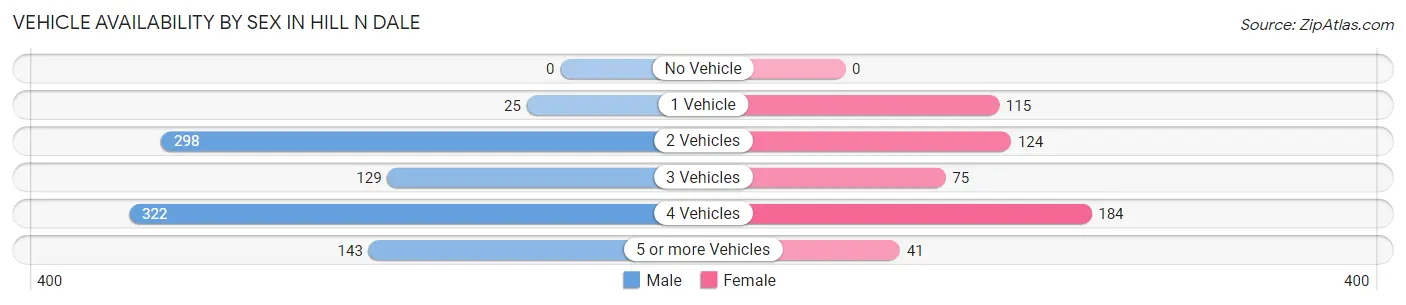
Vehicle Availability by Sex in Hill n Dale
The most prevalent vehicle ownership categories in Hill n Dale are males with 4 vehicles (322, accounting for 35.1%) and females with 4 vehicles (184, making up 59.7%).
| Vehicles Available | Male | Female |
| No Vehicle | 0 (0.0%) | 0 (0.0%) |
| 1 Vehicle | 25 (2.7%) | 115 (21.3%) |
| 2 Vehicles | 298 (32.5%) | 124 (23.0%) |
| 3 Vehicles | 129 (14.1%) | 75 (13.9%) |
| 4 Vehicles | 322 (35.1%) | 184 (34.1%) |
| 5 or more Vehicles | 143 (15.6%) | 41 (7.6%) |
| Total | 917 (100.0%) | 539 (100.0%) |
Commute Time in Hill n Dale
The most frequently occuring commute durations in Hill n Dale are 60 to 89 minutes (252 commuters, 18.4%), 5 to 9 minutes (201 commuters, 14.7%), and 30 to 34 minutes (177 commuters, 12.9%).

| Commute Time | # Commuters | % Commuters |
| Less than 5 Minutes | 4 | 0.3% |
| 5 to 9 Minutes | 201 | 14.7% |
| 10 to 14 Minutes | 77 | 5.6% |
| 15 to 19 Minutes | 163 | 11.9% |
| 20 to 24 Minutes | 45 | 3.3% |
| 25 to 29 Minutes | 135 | 9.9% |
| 30 to 34 Minutes | 177 | 12.9% |
| 35 to 39 Minutes | 0 | 0.0% |
| 40 to 44 Minutes | 154 | 11.2% |
| 45 to 59 Minutes | 142 | 10.4% |
| 60 to 89 Minutes | 252 | 18.4% |
| 90 or more Minutes | 21 | 1.5% |
Commute Time by Sex in Hill n Dale
The most common commute times in Hill n Dale are 60 to 89 minutes (252 commuters, 28.1%) for males and 5 to 9 minutes (193 commuters, 40.7%) for females.
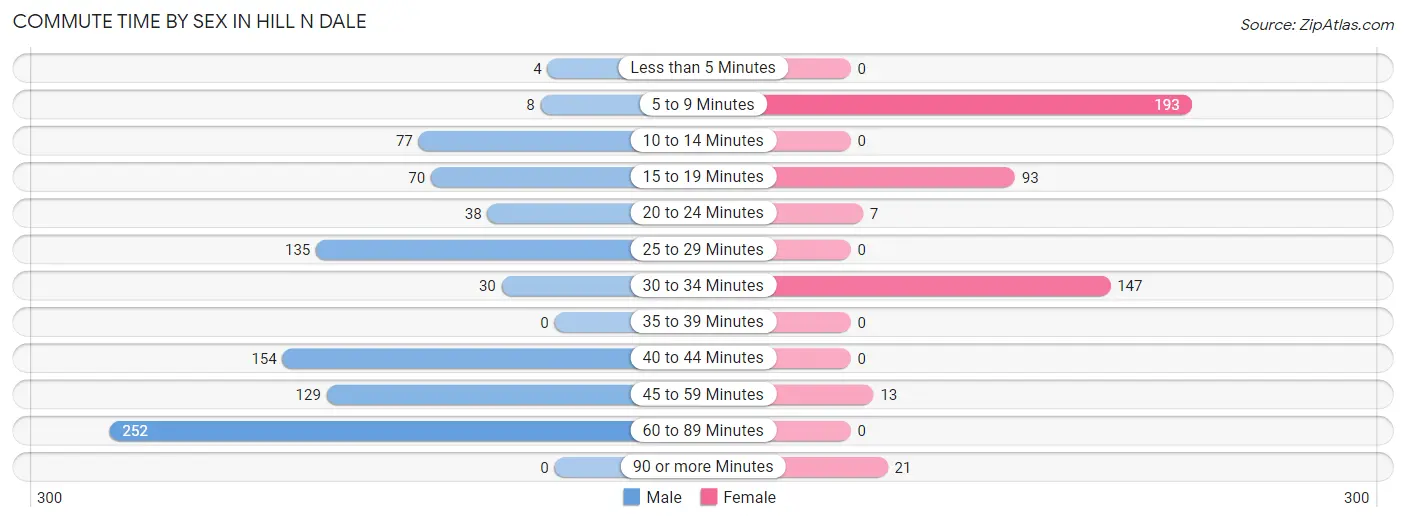
| Commute Time | Male | Female |
| Less than 5 Minutes | 4 (0.4%) | 0 (0.0%) |
| 5 to 9 Minutes | 8 (0.9%) | 193 (40.7%) |
| 10 to 14 Minutes | 77 (8.6%) | 0 (0.0%) |
| 15 to 19 Minutes | 70 (7.8%) | 93 (19.6%) |
| 20 to 24 Minutes | 38 (4.2%) | 7 (1.5%) |
| 25 to 29 Minutes | 135 (15.0%) | 0 (0.0%) |
| 30 to 34 Minutes | 30 (3.3%) | 147 (31.0%) |
| 35 to 39 Minutes | 0 (0.0%) | 0 (0.0%) |
| 40 to 44 Minutes | 154 (17.2%) | 0 (0.0%) |
| 45 to 59 Minutes | 129 (14.4%) | 13 (2.7%) |
| 60 to 89 Minutes | 252 (28.1%) | 0 (0.0%) |
| 90 or more Minutes | 0 (0.0%) | 21 (4.4%) |
Time of Departure to Work by Sex in Hill n Dale
The most frequent times of departure to work in Hill n Dale are 12:00 AM to 4:59 AM (268, 29.9%) for males and 7:00 AM to 7:29 AM (108, 22.8%) for females.
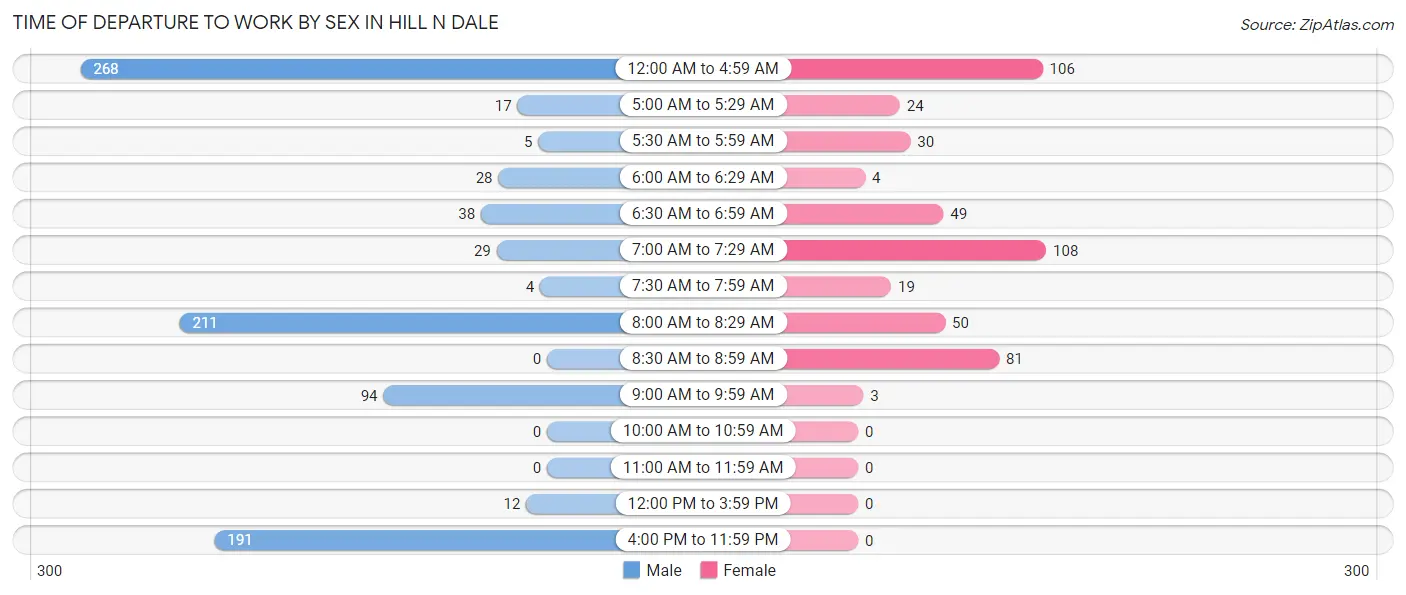
| Time of Departure | Male | Female |
| 12:00 AM to 4:59 AM | 268 (29.9%) | 106 (22.4%) |
| 5:00 AM to 5:29 AM | 17 (1.9%) | 24 (5.1%) |
| 5:30 AM to 5:59 AM | 5 (0.6%) | 30 (6.3%) |
| 6:00 AM to 6:29 AM | 28 (3.1%) | 4 (0.8%) |
| 6:30 AM to 6:59 AM | 38 (4.2%) | 49 (10.3%) |
| 7:00 AM to 7:29 AM | 29 (3.2%) | 108 (22.8%) |
| 7:30 AM to 7:59 AM | 4 (0.4%) | 19 (4.0%) |
| 8:00 AM to 8:29 AM | 211 (23.5%) | 50 (10.5%) |
| 8:30 AM to 8:59 AM | 0 (0.0%) | 81 (17.1%) |
| 9:00 AM to 9:59 AM | 94 (10.5%) | 3 (0.6%) |
| 10:00 AM to 10:59 AM | 0 (0.0%) | 0 (0.0%) |
| 11:00 AM to 11:59 AM | 0 (0.0%) | 0 (0.0%) |
| 12:00 PM to 3:59 PM | 12 (1.3%) | 0 (0.0%) |
| 4:00 PM to 11:59 PM | 191 (21.3%) | 0 (0.0%) |
| Total | 897 (100.0%) | 474 (100.0%) |
Housing Occupancy in Hill n Dale
Occupancy by Ownership in Hill n Dale
Of the total 903 dwellings in Hill n Dale, owner-occupied units account for 737 (81.6%), while renter-occupied units make up 166 (18.4%).
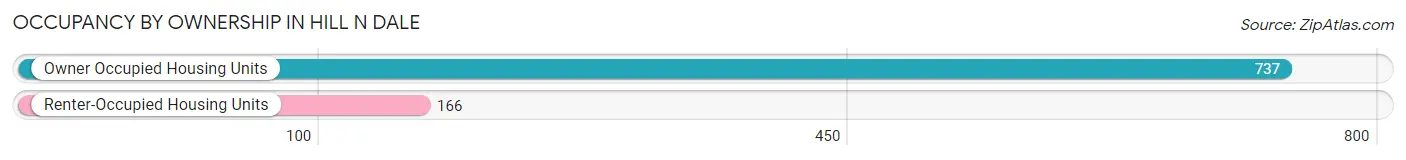
| Occupancy | # Housing Units | % Housing Units |
| Owner Occupied Housing Units | 737 | 81.6% |
| Renter-Occupied Housing Units | 166 | 18.4% |
| Total Occupied Housing Units | 903 | 100.0% |
Occupancy by Household Size in Hill n Dale
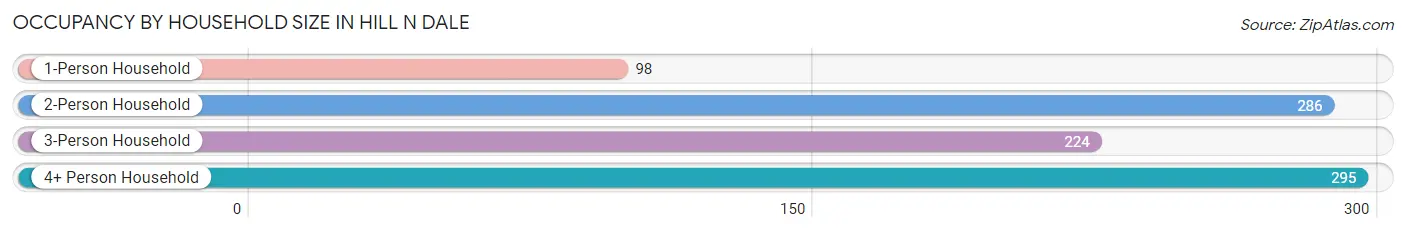
| Household Size | # Housing Units | % Housing Units |
| 1-Person Household | 98 | 10.8% |
| 2-Person Household | 286 | 31.7% |
| 3-Person Household | 224 | 24.8% |
| 4+ Person Household | 295 | 32.7% |
| Total Housing Units | 903 | 100.0% |
Occupancy by Ownership by Household Size in Hill n Dale
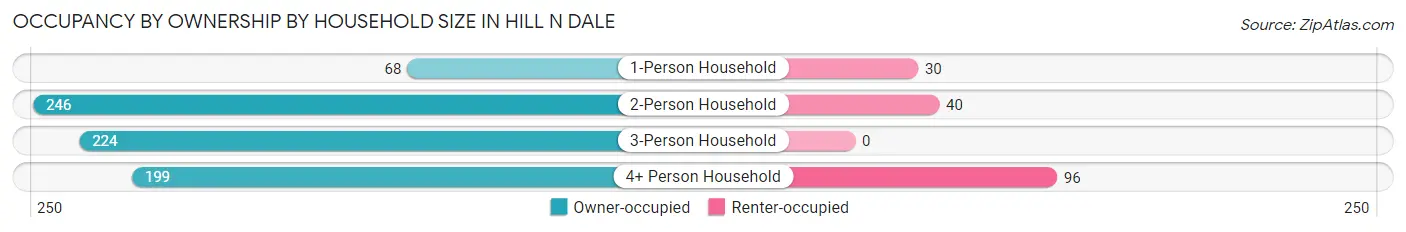
| Household Size | Owner-occupied | Renter-occupied |
| 1-Person Household | 68 (69.4%) | 30 (30.6%) |
| 2-Person Household | 246 (86.0%) | 40 (14.0%) |
| 3-Person Household | 224 (100.0%) | 0 (0.0%) |
| 4+ Person Household | 199 (67.5%) | 96 (32.5%) |
| Total Housing Units | 737 (81.6%) | 166 (18.4%) |
Occupancy by Educational Attainment in Hill n Dale
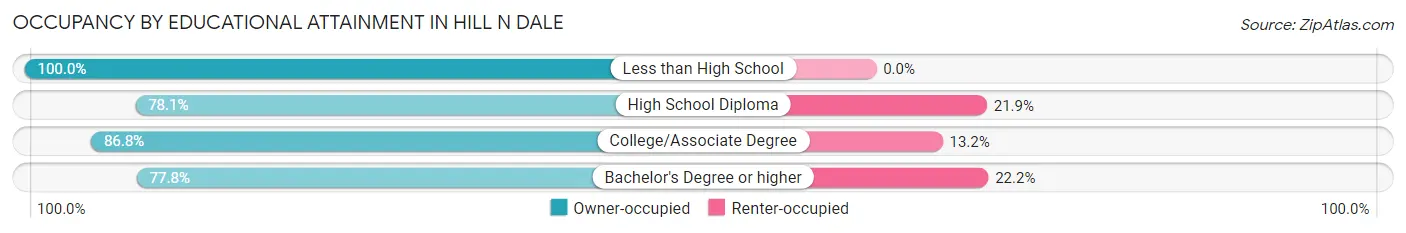
| Household Size | Owner-occupied | Renter-occupied |
| Less than High School | 41 (100.0%) | 0 (0.0%) |
| High School Diploma | 395 (78.1%) | 111 (21.9%) |
| College/Associate Degree | 231 (86.8%) | 35 (13.2%) |
| Bachelor's Degree or higher | 70 (77.8%) | 20 (22.2%) |
Occupancy by Age of Householder in Hill n Dale
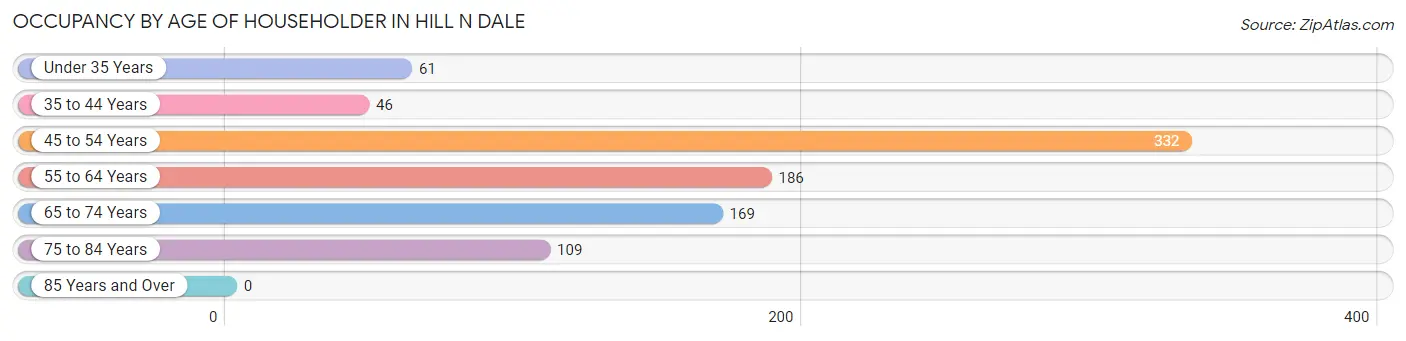
| Age Bracket | # Households | % Households |
| Under 35 Years | 61 | 6.8% |
| 35 to 44 Years | 46 | 5.1% |
| 45 to 54 Years | 332 | 36.8% |
| 55 to 64 Years | 186 | 20.6% |
| 65 to 74 Years | 169 | 18.7% |
| 75 to 84 Years | 109 | 12.1% |
| 85 Years and Over | 0 | 0.0% |
| Total | 903 | 100.0% |
Housing Finances in Hill n Dale
Median Income by Occupancy in Hill n Dale
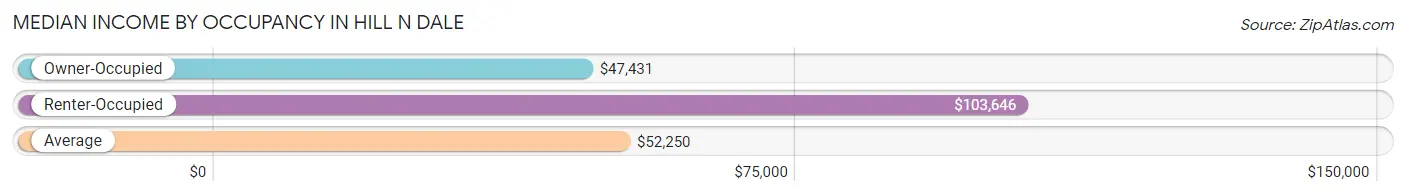
| Occupancy Type | # Households | Median Income |
| Owner-Occupied | 737 (81.6%) | $47,431 |
| Renter-Occupied | 166 (18.4%) | $103,646 |
| Average | 903 (100.0%) | $52,250 |
Occupancy by Householder Income Bracket in Hill n Dale
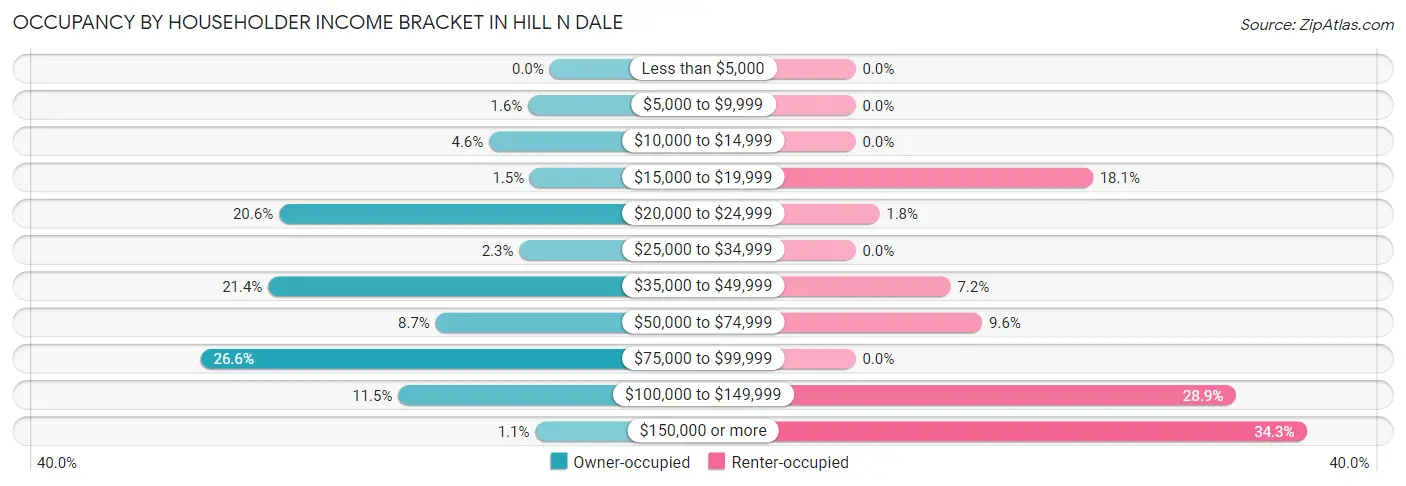
| Income Bracket | Owner-occupied | Renter-occupied |
| Less than $5,000 | 0 (0.0%) | 0 (0.0%) |
| $5,000 to $9,999 | 12 (1.6%) | 0 (0.0%) |
| $10,000 to $14,999 | 34 (4.6%) | 0 (0.0%) |
| $15,000 to $19,999 | 11 (1.5%) | 30 (18.1%) |
| $20,000 to $24,999 | 152 (20.6%) | 3 (1.8%) |
| $25,000 to $34,999 | 17 (2.3%) | 0 (0.0%) |
| $35,000 to $49,999 | 158 (21.4%) | 12 (7.2%) |
| $50,000 to $74,999 | 64 (8.7%) | 16 (9.6%) |
| $75,000 to $99,999 | 196 (26.6%) | 0 (0.0%) |
| $100,000 to $149,999 | 85 (11.5%) | 48 (28.9%) |
| $150,000 or more | 8 (1.1%) | 57 (34.3%) |
| Total | 737 (100.0%) | 166 (100.0%) |
Monthly Housing Cost Tiers in Hill n Dale
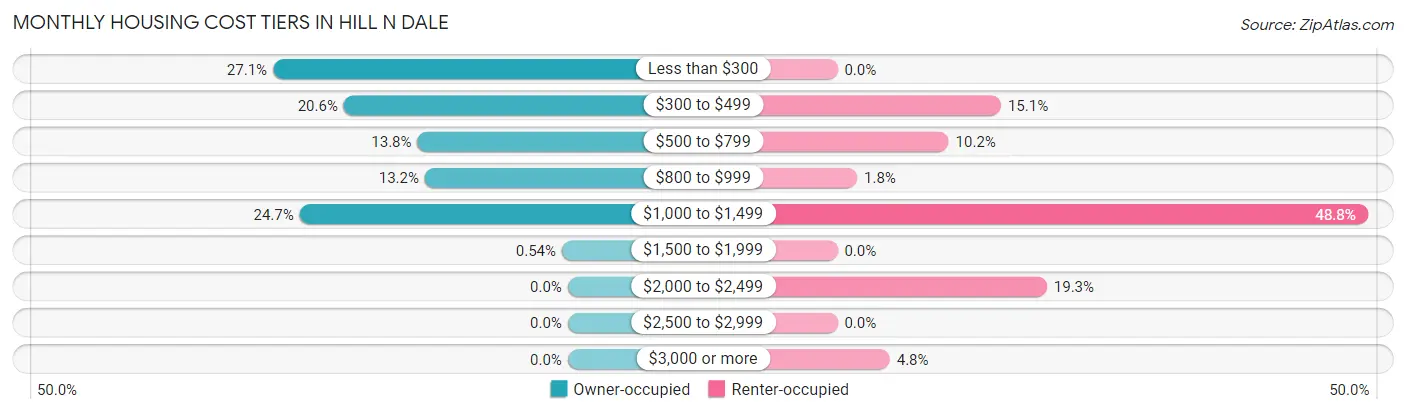
| Monthly Cost | Owner-occupied | Renter-occupied |
| Less than $300 | 200 (27.1%) | 0 (0.0%) |
| $300 to $499 | 152 (20.6%) | 25 (15.1%) |
| $500 to $799 | 102 (13.8%) | 17 (10.2%) |
| $800 to $999 | 97 (13.2%) | 3 (1.8%) |
| $1,000 to $1,499 | 182 (24.7%) | 81 (48.8%) |
| $1,500 to $1,999 | 4 (0.5%) | 0 (0.0%) |
| $2,000 to $2,499 | 0 (0.0%) | 32 (19.3%) |
| $2,500 to $2,999 | 0 (0.0%) | 0 (0.0%) |
| $3,000 or more | 0 (0.0%) | 8 (4.8%) |
| Total | 737 (100.0%) | 166 (100.0%) |
Physical Housing Characteristics in Hill n Dale
Housing Structures in Hill n Dale
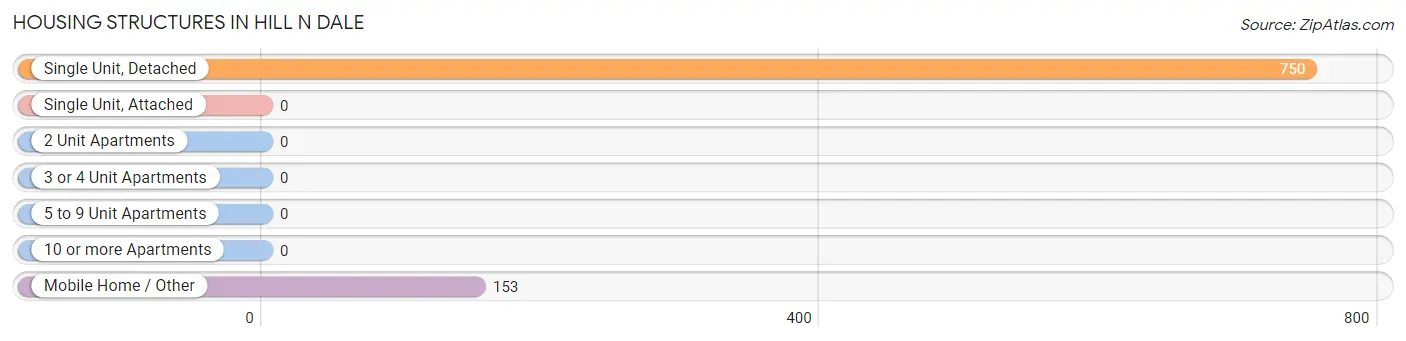
| Structure Type | # Housing Units | % Housing Units |
| Single Unit, Detached | 750 | 83.1% |
| Single Unit, Attached | 0 | 0.0% |
| 2 Unit Apartments | 0 | 0.0% |
| 3 or 4 Unit Apartments | 0 | 0.0% |
| 5 to 9 Unit Apartments | 0 | 0.0% |
| 10 or more Apartments | 0 | 0.0% |
| Mobile Home / Other | 153 | 16.9% |
| Total | 903 | 100.0% |
Housing Structures by Occupancy in Hill n Dale
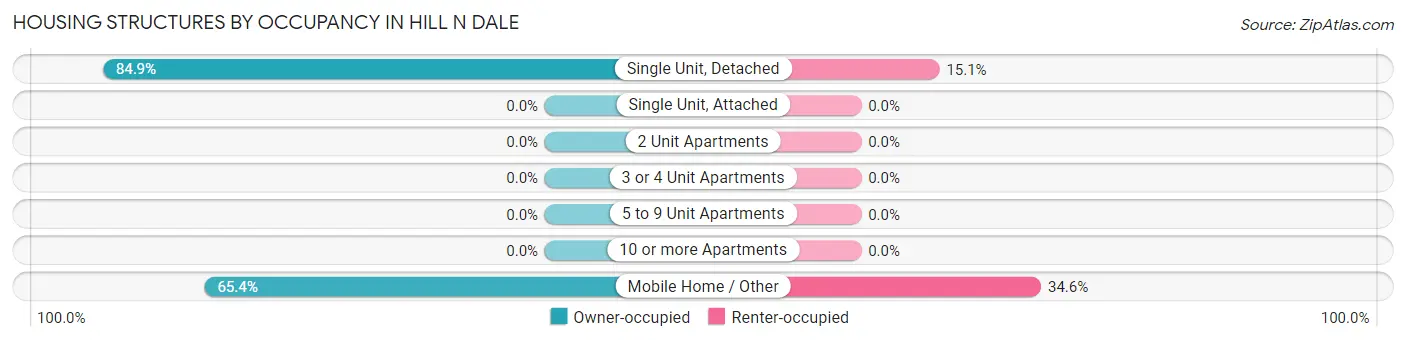
| Structure Type | Owner-occupied | Renter-occupied |
| Single Unit, Detached | 637 (84.9%) | 113 (15.1%) |
| Single Unit, Attached | 0 (0.0%) | 0 (0.0%) |
| 2 Unit Apartments | 0 (0.0%) | 0 (0.0%) |
| 3 or 4 Unit Apartments | 0 (0.0%) | 0 (0.0%) |
| 5 to 9 Unit Apartments | 0 (0.0%) | 0 (0.0%) |
| 10 or more Apartments | 0 (0.0%) | 0 (0.0%) |
| Mobile Home / Other | 100 (65.4%) | 53 (34.6%) |
| Total | 737 (81.6%) | 166 (18.4%) |
Housing Structures by Number of Rooms in Hill n Dale
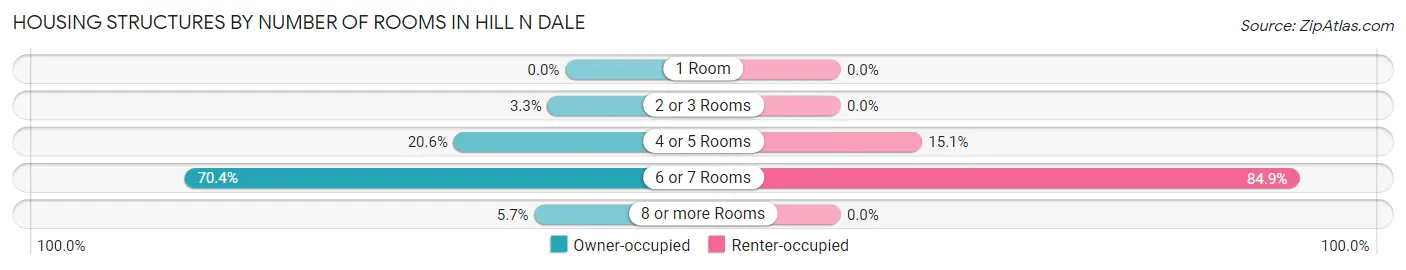
| Number of Rooms | Owner-occupied | Renter-occupied |
| 1 Room | 0 (0.0%) | 0 (0.0%) |
| 2 or 3 Rooms | 24 (3.3%) | 0 (0.0%) |
| 4 or 5 Rooms | 152 (20.6%) | 25 (15.1%) |
| 6 or 7 Rooms | 519 (70.4%) | 141 (84.9%) |
| 8 or more Rooms | 42 (5.7%) | 0 (0.0%) |
| Total | 737 (100.0%) | 166 (100.0%) |
Housing Structure by Heating Type in Hill n Dale
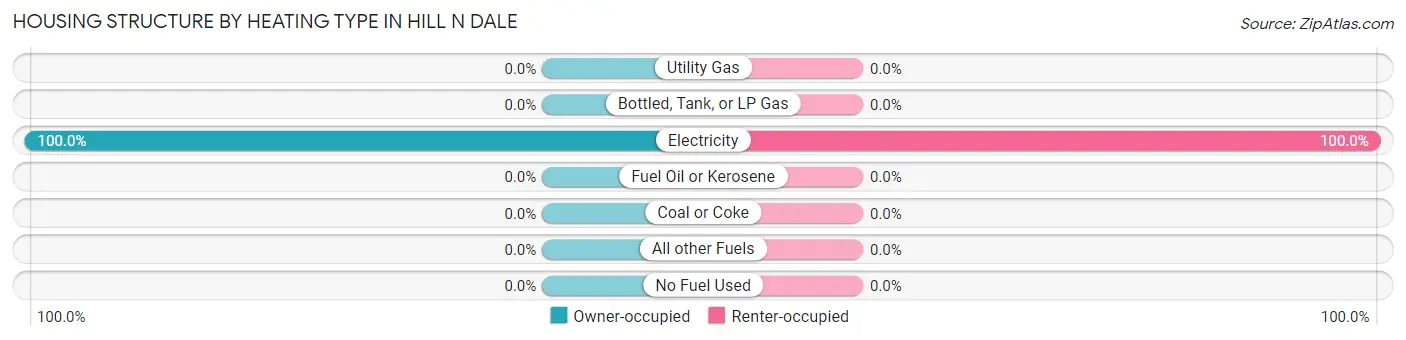
| Heating Type | Owner-occupied | Renter-occupied |
| Utility Gas | 0 (0.0%) | 0 (0.0%) |
| Bottled, Tank, or LP Gas | 0 (0.0%) | 0 (0.0%) |
| Electricity | 737 (100.0%) | 166 (100.0%) |
| Fuel Oil or Kerosene | 0 (0.0%) | 0 (0.0%) |
| Coal or Coke | 0 (0.0%) | 0 (0.0%) |
| All other Fuels | 0 (0.0%) | 0 (0.0%) |
| No Fuel Used | 0 (0.0%) | 0 (0.0%) |
| Total | 737 (100.0%) | 166 (100.0%) |
Household Vehicle Usage in Hill n Dale
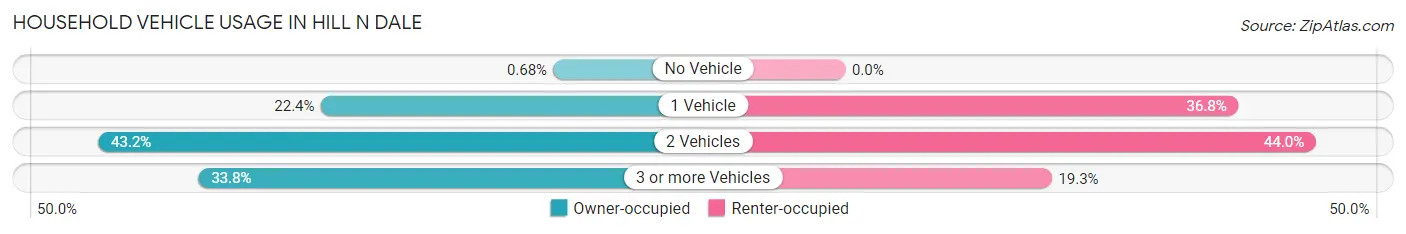
| Vehicles per Household | Owner-occupied | Renter-occupied |
| No Vehicle | 5 (0.7%) | 0 (0.0%) |
| 1 Vehicle | 165 (22.4%) | 61 (36.7%) |
| 2 Vehicles | 318 (43.1%) | 73 (44.0%) |
| 3 or more Vehicles | 249 (33.8%) | 32 (19.3%) |
| Total | 737 (100.0%) | 166 (100.0%) |
Real Estate & Mortgages in Hill n Dale
Real Estate and Mortgage Overview in Hill n Dale
| Characteristic | Without Mortgage | With Mortgage |
| Housing Units | 391 | 346 |
| Median Property Value | $151,700 | $96,200 |
| Median Household Income | $71,650 | $0 |
| Monthly Housing Costs | $298 | $0 |
| Real Estate Taxes | $751 | $0 |
Property Value by Mortgage Status in Hill n Dale
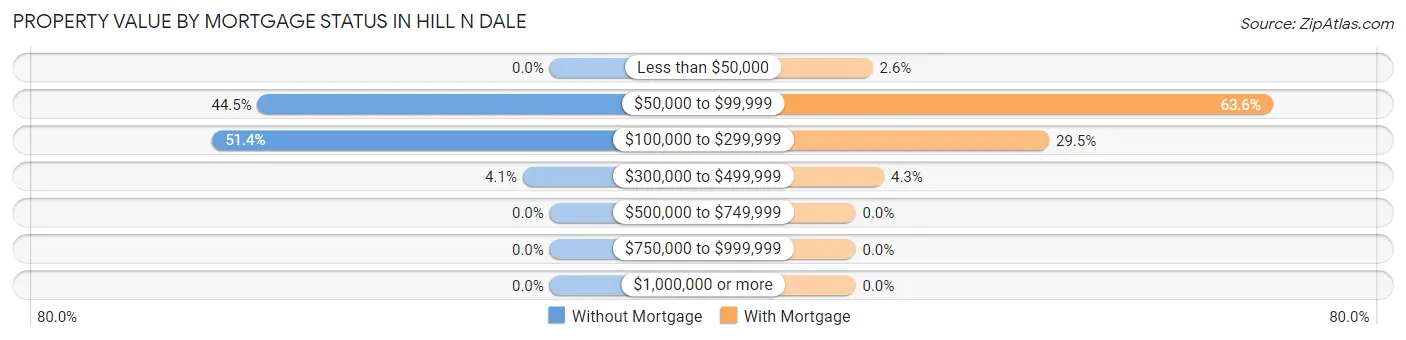
| Property Value | Without Mortgage | With Mortgage |
| Less than $50,000 | 0 (0.0%) | 9 (2.6%) |
| $50,000 to $99,999 | 174 (44.5%) | 220 (63.6%) |
| $100,000 to $299,999 | 201 (51.4%) | 102 (29.5%) |
| $300,000 to $499,999 | 16 (4.1%) | 15 (4.3%) |
| $500,000 to $749,999 | 0 (0.0%) | 0 (0.0%) |
| $750,000 to $999,999 | 0 (0.0%) | 0 (0.0%) |
| $1,000,000 or more | 0 (0.0%) | 0 (0.0%) |
| Total | 391 (100.0%) | 346 (100.0%) |
Household Income by Mortgage Status in Hill n Dale
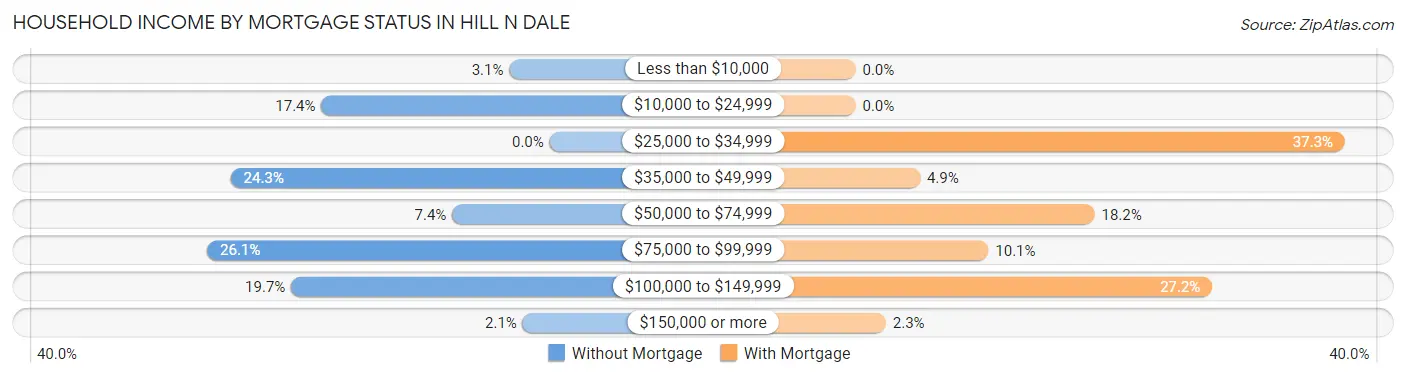
| Household Income | Without Mortgage | With Mortgage |
| Less than $10,000 | 12 (3.1%) | 0 (0.0%) |
| $10,000 to $24,999 | 68 (17.4%) | 0 (0.0%) |
| $25,000 to $34,999 | 0 (0.0%) | 129 (37.3%) |
| $35,000 to $49,999 | 95 (24.3%) | 17 (4.9%) |
| $50,000 to $74,999 | 29 (7.4%) | 63 (18.2%) |
| $75,000 to $99,999 | 102 (26.1%) | 35 (10.1%) |
| $100,000 to $149,999 | 77 (19.7%) | 94 (27.2%) |
| $150,000 or more | 8 (2.1%) | 8 (2.3%) |
| Total | 391 (100.0%) | 346 (100.0%) |
Property Value to Household Income Ratio in Hill n Dale
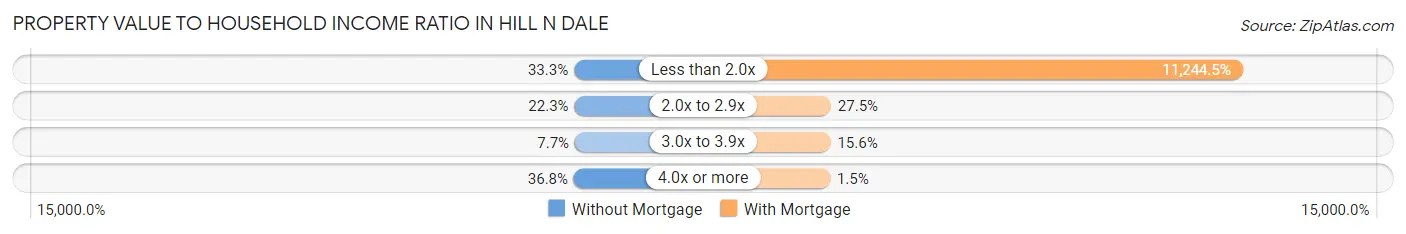
| Value-to-Income Ratio | Without Mortgage | With Mortgage |
| Less than 2.0x | 130 (33.3%) | 38,906 (11,244.5%) |
| 2.0x to 2.9x | 87 (22.3%) | 95 (27.5%) |
| 3.0x to 3.9x | 30 (7.7%) | 54 (15.6%) |
| 4.0x or more | 144 (36.8%) | 5 (1.5%) |
| Total | 391 (100.0%) | 346 (100.0%) |
Real Estate Taxes by Mortgage Status in Hill n Dale
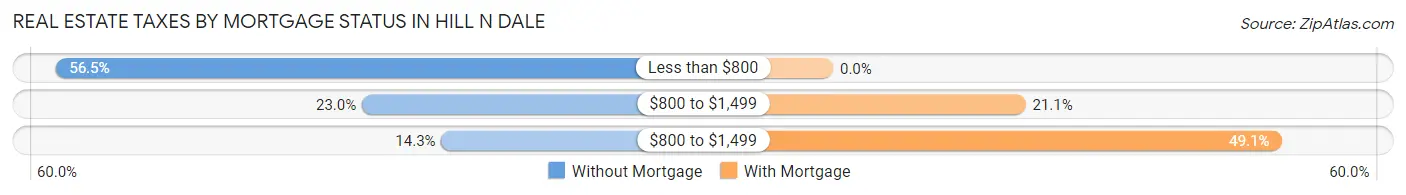
| Property Taxes | Without Mortgage | With Mortgage |
| Less than $800 | 221 (56.5%) | 0 (0.0%) |
| $800 to $1,499 | 90 (23.0%) | 73 (21.1%) |
| $800 to $1,499 | 56 (14.3%) | 170 (49.1%) |
| Total | 391 (100.0%) | 346 (100.0%) |
Health & Disability in Hill n Dale
Health Insurance Coverage by Age in Hill n Dale
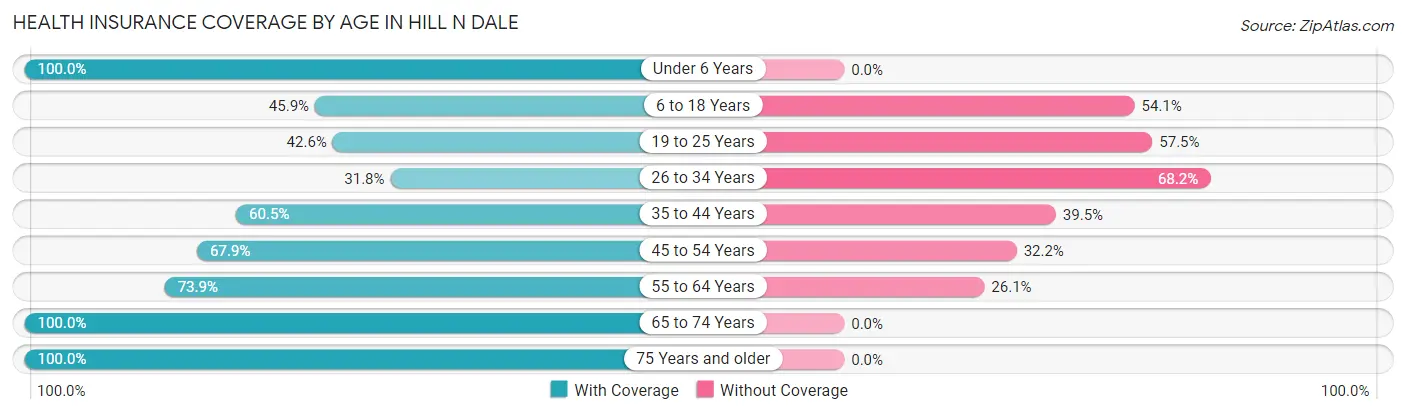
| Age Bracket | With Coverage | Without Coverage |
| Under 6 Years | 46 (100.0%) | 0 (0.0%) |
| 6 to 18 Years | 249 (45.9%) | 294 (54.1%) |
| 19 to 25 Years | 60 (42.5%) | 81 (57.5%) |
| 26 to 34 Years | 144 (31.8%) | 309 (68.2%) |
| 35 to 44 Years | 201 (60.5%) | 131 (39.5%) |
| 45 to 54 Years | 458 (67.8%) | 217 (32.2%) |
| 55 to 64 Years | 246 (73.9%) | 87 (26.1%) |
| 65 to 74 Years | 259 (100.0%) | 0 (0.0%) |
| 75 Years and older | 228 (100.0%) | 0 (0.0%) |
| Total | 1,891 (62.8%) | 1,119 (37.2%) |
Health Insurance Coverage by Citizenship Status in Hill n Dale
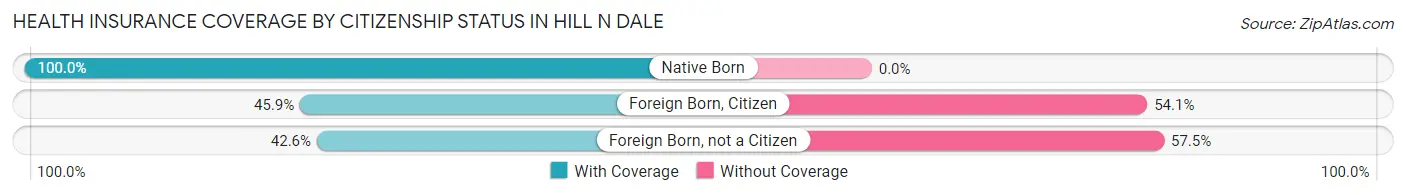
| Citizenship Status | With Coverage | Without Coverage |
| Native Born | 46 (100.0%) | 0 (0.0%) |
| Foreign Born, Citizen | 249 (45.9%) | 294 (54.1%) |
| Foreign Born, not a Citizen | 60 (42.5%) | 81 (57.5%) |
Health Insurance Coverage by Household Income in Hill n Dale
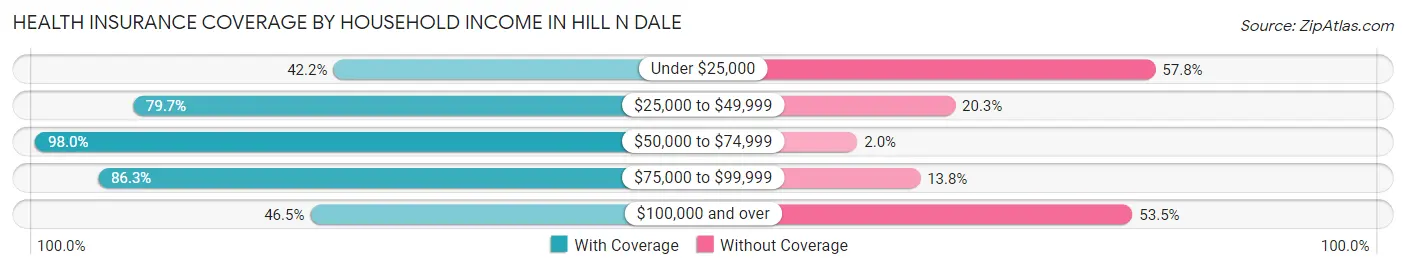
| Household Income | With Coverage | Without Coverage |
| Under $25,000 | 310 (42.2%) | 425 (57.8%) |
| $25,000 to $49,999 | 444 (79.7%) | 113 (20.3%) |
| $50,000 to $74,999 | 198 (98.0%) | 4 (2.0%) |
| $75,000 to $99,999 | 508 (86.3%) | 81 (13.8%) |
| $100,000 and over | 431 (46.5%) | 496 (53.5%) |
Public vs Private Health Insurance Coverage by Age in Hill n Dale
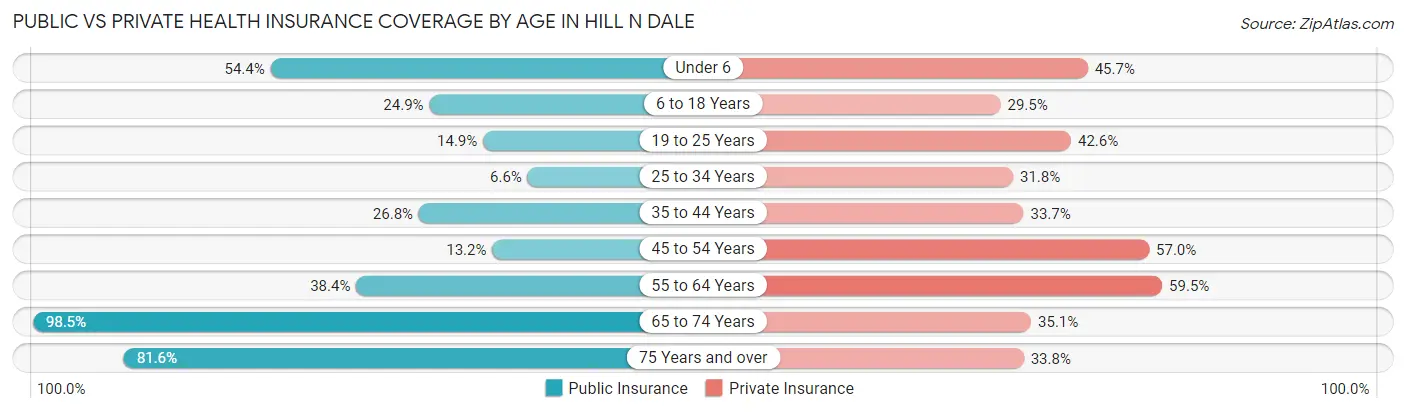
| Age Bracket | Public Insurance | Private Insurance |
| Under 6 | 25 (54.3%) | 21 (45.7%) |
| 6 to 18 Years | 135 (24.9%) | 160 (29.5%) |
| 19 to 25 Years | 21 (14.9%) | 60 (42.5%) |
| 25 to 34 Years | 30 (6.6%) | 144 (31.8%) |
| 35 to 44 Years | 89 (26.8%) | 112 (33.7%) |
| 45 to 54 Years | 89 (13.2%) | 385 (57.0%) |
| 55 to 64 Years | 128 (38.4%) | 198 (59.5%) |
| 65 to 74 Years | 255 (98.5%) | 91 (35.1%) |
| 75 Years and over | 186 (81.6%) | 77 (33.8%) |
| Total | 958 (31.8%) | 1,248 (41.5%) |
Disability Status by Sex by Age in Hill n Dale
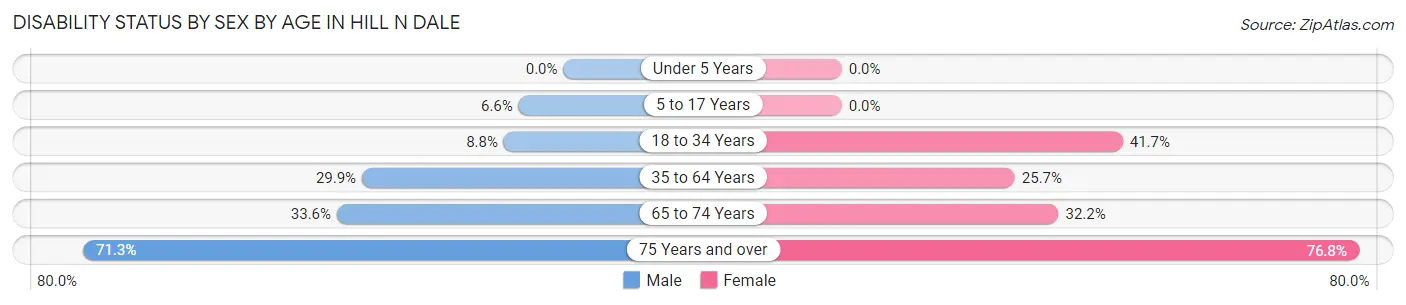
| Age Bracket | Male | Female |
| Under 5 Years | 0 (0.0%) | 0 (0.0%) |
| 5 to 17 Years | 30 (6.6%) | 0 (0.0%) |
| 18 to 34 Years | 29 (8.8%) | 111 (41.7%) |
| 35 to 64 Years | 175 (29.9%) | 194 (25.7%) |
| 65 to 74 Years | 38 (33.6%) | 47 (32.2%) |
| 75 Years and over | 92 (71.3%) | 76 (76.8%) |
Disability Class by Sex by Age in Hill n Dale
Disability Class: Hearing Difficulty
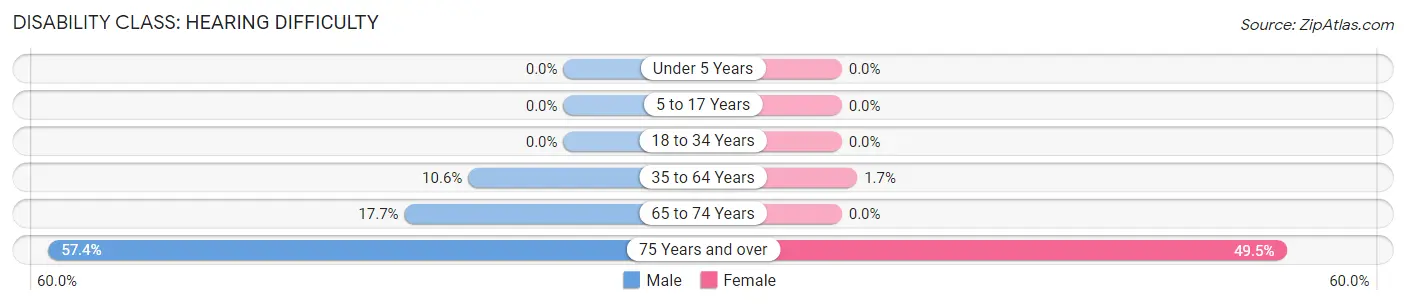
| Age Bracket | Male | Female |
| Under 5 Years | 0 (0.0%) | 0 (0.0%) |
| 5 to 17 Years | 0 (0.0%) | 0 (0.0%) |
| 18 to 34 Years | 0 (0.0%) | 0 (0.0%) |
| 35 to 64 Years | 62 (10.6%) | 13 (1.7%) |
| 65 to 74 Years | 20 (17.7%) | 0 (0.0%) |
| 75 Years and over | 74 (57.4%) | 49 (49.5%) |
Disability Class: Vision Difficulty
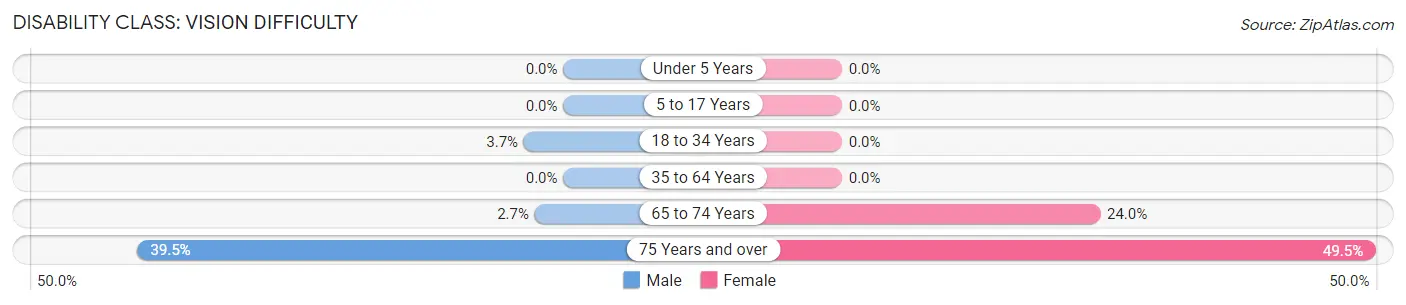
| Age Bracket | Male | Female |
| Under 5 Years | 0 (0.0%) | 0 (0.0%) |
| 5 to 17 Years | 0 (0.0%) | 0 (0.0%) |
| 18 to 34 Years | 12 (3.7%) | 0 (0.0%) |
| 35 to 64 Years | 0 (0.0%) | 0 (0.0%) |
| 65 to 74 Years | 3 (2.6%) | 35 (24.0%) |
| 75 Years and over | 51 (39.5%) | 49 (49.5%) |
Disability Class: Cognitive Difficulty
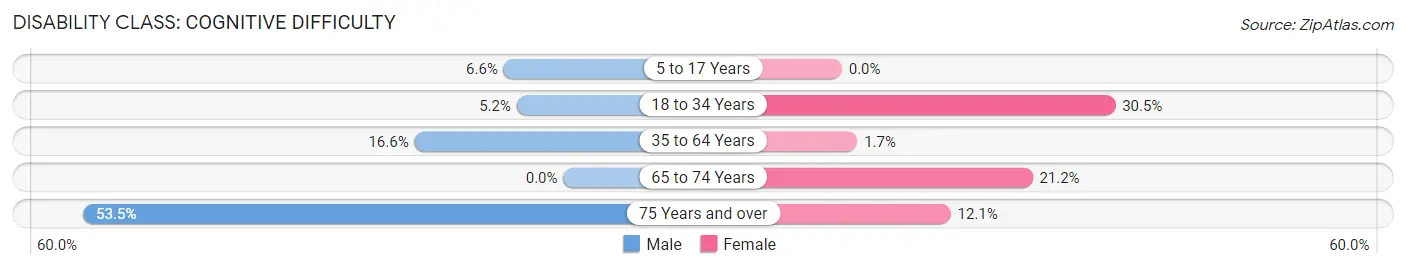
| Age Bracket | Male | Female |
| 5 to 17 Years | 30 (6.6%) | 0 (0.0%) |
| 18 to 34 Years | 17 (5.2%) | 81 (30.4%) |
| 35 to 64 Years | 97 (16.6%) | 13 (1.7%) |
| 65 to 74 Years | 0 (0.0%) | 31 (21.2%) |
| 75 Years and over | 69 (53.5%) | 12 (12.1%) |
Disability Class: Ambulatory Difficulty
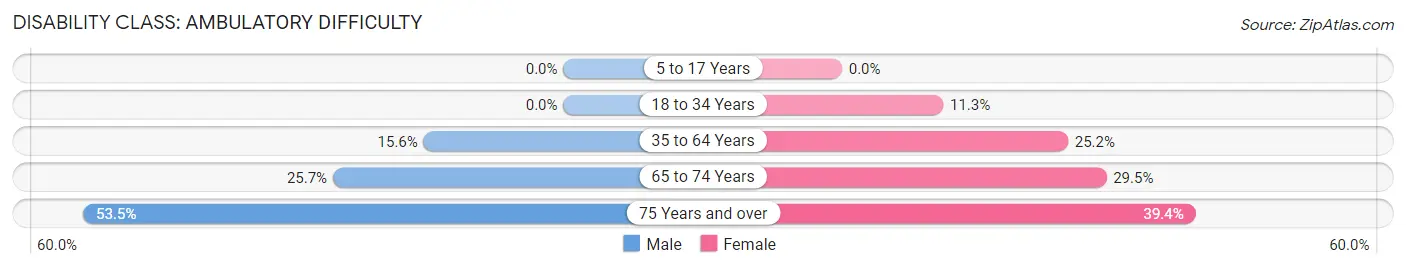
| Age Bracket | Male | Female |
| 5 to 17 Years | 0 (0.0%) | 0 (0.0%) |
| 18 to 34 Years | 0 (0.0%) | 30 (11.3%) |
| 35 to 64 Years | 91 (15.6%) | 190 (25.2%) |
| 65 to 74 Years | 29 (25.7%) | 43 (29.4%) |
| 75 Years and over | 69 (53.5%) | 39 (39.4%) |
Disability Class: Self-Care Difficulty
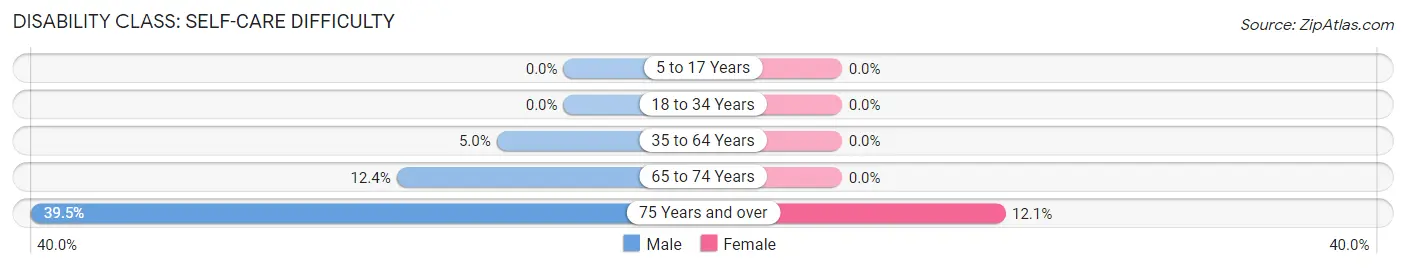
| Age Bracket | Male | Female |
| 5 to 17 Years | 0 (0.0%) | 0 (0.0%) |
| 18 to 34 Years | 0 (0.0%) | 0 (0.0%) |
| 35 to 64 Years | 29 (5.0%) | 0 (0.0%) |
| 65 to 74 Years | 14 (12.4%) | 0 (0.0%) |
| 75 Years and over | 51 (39.5%) | 12 (12.1%) |
Technology Access in Hill n Dale
Computing Device Access in Hill n Dale
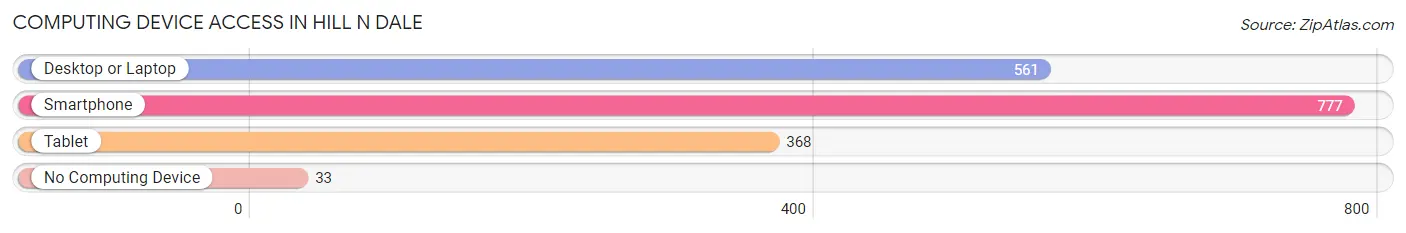
| Device Type | # Households | % Households |
| Desktop or Laptop | 561 | 62.1% |
| Smartphone | 777 | 86.1% |
| Tablet | 368 | 40.7% |
| No Computing Device | 33 | 3.6% |
| Total | 903 | 100.0% |
Internet Access in Hill n Dale
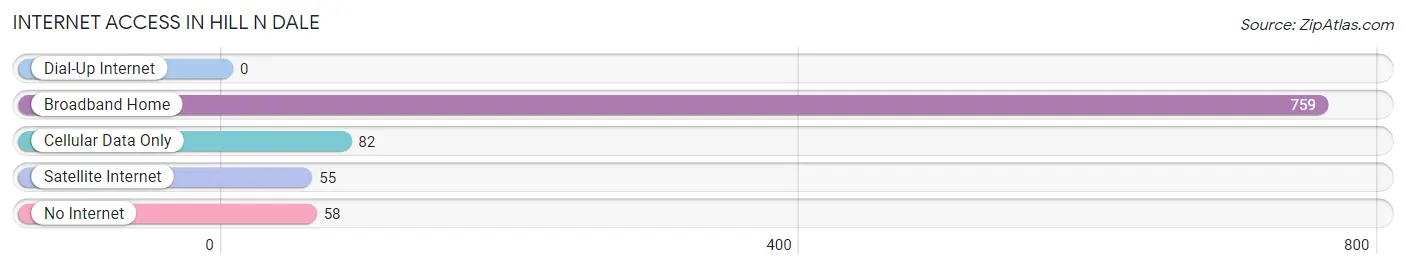
| Internet Type | # Households | % Households |
| Dial-Up Internet | 0 | 0.0% |
| Broadband Home | 759 | 84.1% |
| Cellular Data Only | 82 | 9.1% |
| Satellite Internet | 55 | 6.1% |
| No Internet | 58 | 6.4% |
| Total | 903 | 100.0% |
Hill n Dale Summary
Hill N Dale is a small unincorporated community located in Pasco County, Florida. It is situated in the northern part of the county, approximately 20 miles north of Tampa. The community is bordered by the cities of Dade City and Zephyrhills. The population of Hill N Dale was estimated to be around 1,000 people in 2020.
History
The area that is now Hill N Dale was first settled in the late 1800s by a group of settlers from Georgia. The settlers were attracted to the area due to its fertile soil and abundant wildlife. The community was originally known as “Hill and Dale”, but the name was eventually shortened to Hill N Dale.
The community was officially incorporated in 1925 and was primarily an agricultural community. The main crops grown in the area were citrus, vegetables, and hay. The community also had a few small businesses, such as a general store, a post office, and a blacksmith shop.
In the 1950s, the area began to experience rapid growth due to the influx of new residents from the Tampa Bay area. This growth continued into the 1960s and 1970s, and the population of Hill N Dale increased to over 1,000 people.
Geography
Hill N Dale is located in Pasco County, Florida. It is situated in the northern part of the county, approximately 20 miles north of Tampa. The community is bordered by the cities of Dade City and Zephyrhills.
The terrain of Hill N Dale is mostly flat, with some rolling hills. The area is mostly rural, with some residential development. The community is located in a humid subtropical climate zone, with hot, humid summers and mild winters.
Economy
The economy of Hill N Dale is primarily based on agriculture. The main crops grown in the area are citrus, vegetables, and hay. The community also has a few small businesses, such as a general store, a post office, and a blacksmith shop.
The community is also home to several small manufacturing companies, such as a furniture manufacturer and a plastics manufacturer. The community also has a few small retail stores, such as a grocery store and a hardware store.
Demographics
The population of Hill N Dale was estimated to be around 1,000 people in 2020. The racial makeup of the community is predominantly white (90.2%), with a small percentage of African Americans (4.2%), Hispanics (3.2%), and Asians (2.4%). The median household income in Hill N Dale is $45,000, and the median home value is $150,000.
The majority of the population is Christian (90%), with a small percentage of other religions (10%). The primary language spoken in Hill N Dale is English (90%), with a small percentage of Spanish (10%).
Conclusion
Hill N Dale is a small unincorporated community located in Pasco County, Florida. It is situated in the northern part of the county, approximately 20 miles north of Tampa. The population of Hill N Dale was estimated to be around 1,000 people in 2020. The economy of Hill N Dale is primarily based on agriculture, with some small businesses and manufacturing companies. The racial makeup of the community is predominantly white, with a small percentage of African Americans, Hispanics, and Asians. The majority of the population is Christian, with a small percentage of other religions. The primary language spoken in Hill N Dale is English, with a small percentage of Spanish.
Common Questions
What is Per Capita Income in Hill n Dale?
Per Capita income in Hill n Dale is $22,462.
What is the Median Family Income in Hill n Dale?
Median Family Income in Hill n Dale is $71,900.
What is the Median Household income in Hill n Dale?
Median Household Income in Hill n Dale is $52,250.
What is Income or Wage Gap in Hill n Dale?
Income or Wage Gap in Hill n Dale is 44.2%.
Women in Hill n Dale earn 55.8 cents for every dollar earned by a man.
What is Inequality or Gini Index in Hill n Dale?
Inequality or Gini Index in Hill n Dale is 0.37.
What is the Total Population of Hill n Dale?
Total Population of Hill n Dale is 3,010.
What is the Total Male Population of Hill n Dale?
Total Male Population of Hill n Dale is 1,607.
What is the Total Female Population of Hill n Dale?
Total Female Population of Hill n Dale is 1,403.
What is the Ratio of Males per 100 Females in Hill n Dale?
There are 114.54 Males per 100 Females in Hill n Dale.
What is the Ratio of Females per 100 Males in Hill n Dale?
There are 87.31 Females per 100 Males in Hill n Dale.
What is the Median Population Age in Hill n Dale?
Median Population Age in Hill n Dale is 44.8 Years.
What is the Average Family Size in Hill n Dale
Average Family Size in Hill n Dale is 3.4 People.
What is the Average Household Size in Hill n Dale
Average Household Size in Hill n Dale is 3.3 People.
How Large is the Labor Force in Hill n Dale?
There are 1,517 People in the Labor Forcein in Hill n Dale.
What is the Percentage of People in the Labor Force in Hill n Dale?
61.2% of People are in the Labor Force in Hill n Dale.
What is the Unemployment Rate in Hill n Dale?
Unemployment Rate in Hill n Dale is 3.4%.