Wellston, MO Map & Demographics
Wellston Map
Wellston Overview
$18,897
PER CAPITA INCOME
$37,454
AVG FAMILY INCOME
$35,278
AVG HOUSEHOLD INCOME
$15,943
FAMILY INCOME DEFICIT
0.40
INEQUALITY / GINI INDEX
1,913
TOTAL POPULATION
766
MALE POPULATION
1,147
FEMALE POPULATION
66.78
MALES / 100 FEMALES
149.74
FEMALES / 100 MALES
33.9
MEDIAN AGE
3.0
AVG FAMILY SIZE
2.5
AVG HOUSEHOLD SIZE
894
LABOR FORCE [ PEOPLE ]
62.2%
PERCENT IN LABOR FORCE
3.0%
UNEMPLOYMENT RATE
Income in Wellston
Income Overview in Wellston
Per Capita Income in Wellston is $18,897, while median incomes of families and households are $37,454 and $35,278 respectively.
| Characteristic | Number | Measure |
| Per Capita Income | 1,913 | $18,897 |
| Median Family Income | 451 | $37,454 |
| Mean Family Income | 451 | $51,042 |
| Median Household Income | 776 | $35,278 |
| Mean Household Income | 776 | $45,436 |
| Income Deficit | 451 | $15,943 |
| Wage / Income Gap (%) | 1,913 | 0.00% |
| Wage / Income Gap ($) | 1,913 | 100.00¢ per $1 |
| Gini / Inequality Index | 1,913 | 0.40 |
Earnings by Sex in Wellston
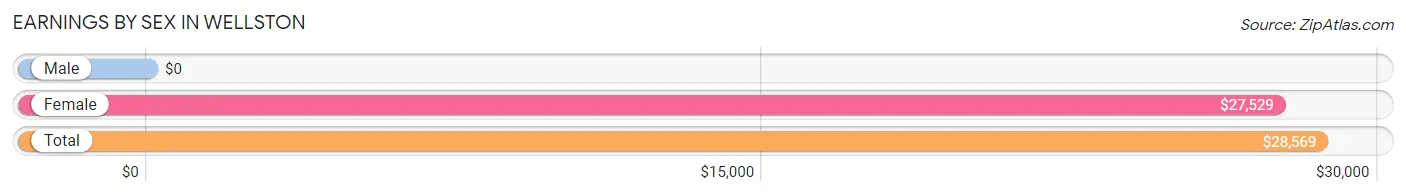
| Sex | Number | Average Earnings |
| Male | 276 (27.0%) | $0 |
| Female | 747 (73.0%) | $27,529 |
| Total | 1,023 (100.0%) | $28,569 |
Earnings by Sex by Income Bracket in Wellston
The most common earnings brackets in Wellston are $55,000 to $64,999 for men (89 | 32.3%) and $45,000 to $49,999 for women (178 | 23.8%).
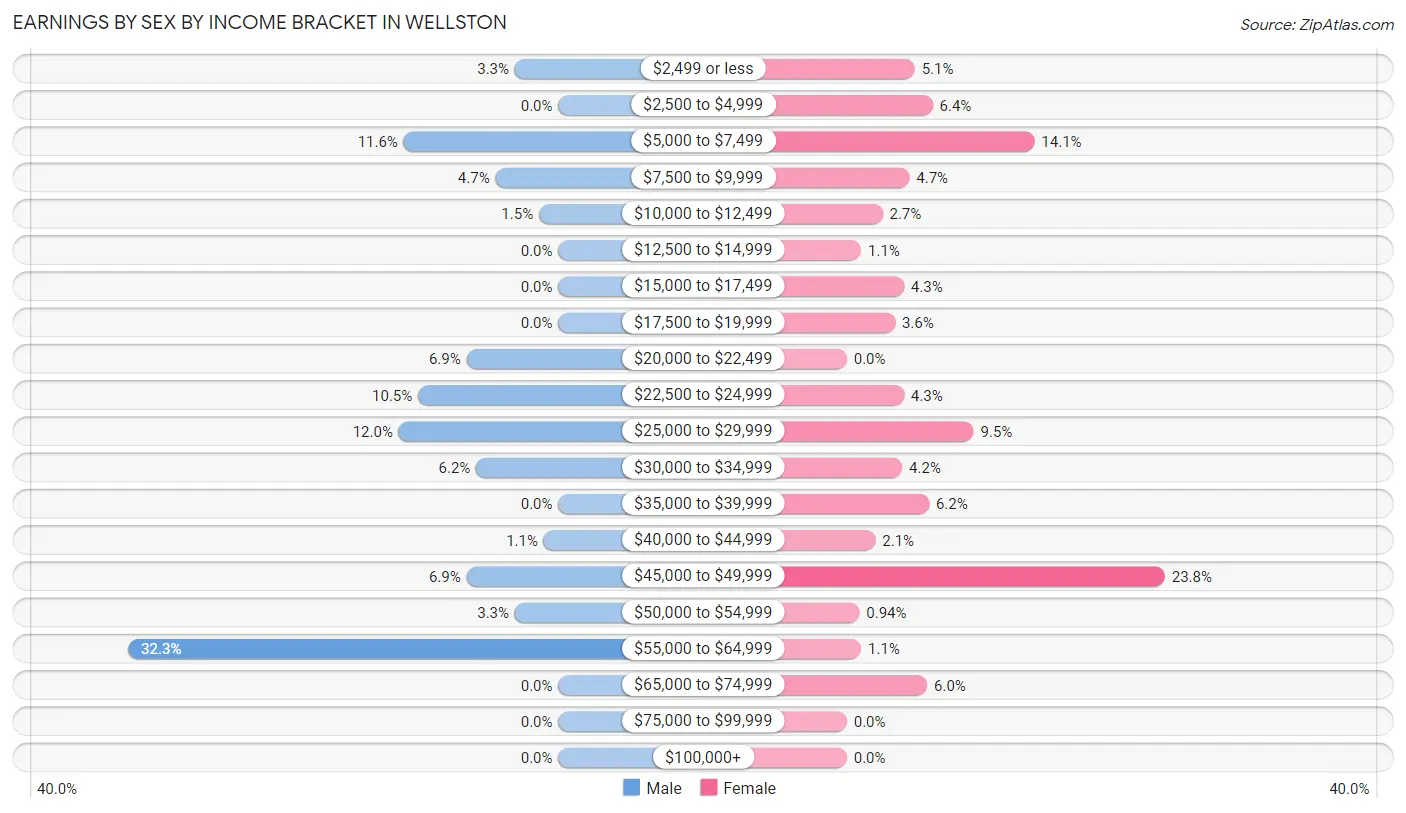
| Income | Male | Female |
| $2,499 or less | 9 (3.3%) | 38 (5.1%) |
| $2,500 to $4,999 | 0 (0.0%) | 48 (6.4%) |
| $5,000 to $7,499 | 32 (11.6%) | 105 (14.1%) |
| $7,500 to $9,999 | 13 (4.7%) | 35 (4.7%) |
| $10,000 to $12,499 | 4 (1.5%) | 20 (2.7%) |
| $12,500 to $14,999 | 0 (0.0%) | 8 (1.1%) |
| $15,000 to $17,499 | 0 (0.0%) | 32 (4.3%) |
| $17,500 to $19,999 | 0 (0.0%) | 27 (3.6%) |
| $20,000 to $22,499 | 19 (6.9%) | 0 (0.0%) |
| $22,500 to $24,999 | 29 (10.5%) | 32 (4.3%) |
| $25,000 to $29,999 | 33 (12.0%) | 71 (9.5%) |
| $30,000 to $34,999 | 17 (6.2%) | 31 (4.2%) |
| $35,000 to $39,999 | 0 (0.0%) | 46 (6.2%) |
| $40,000 to $44,999 | 3 (1.1%) | 16 (2.1%) |
| $45,000 to $49,999 | 19 (6.9%) | 178 (23.8%) |
| $50,000 to $54,999 | 9 (3.3%) | 7 (0.9%) |
| $55,000 to $64,999 | 89 (32.3%) | 8 (1.1%) |
| $65,000 to $74,999 | 0 (0.0%) | 45 (6.0%) |
| $75,000 to $99,999 | 0 (0.0%) | 0 (0.0%) |
| $100,000+ | 0 (0.0%) | 0 (0.0%) |
| Total | 276 (100.0%) | 747 (100.0%) |
Earnings by Sex by Educational Attainment in Wellston
Average earnings in Wellston are $34,118 for men and $28,401 for women, a difference of 16.8%. Men with an educational attainment of high school diploma enjoy the highest average annual earnings of $57,598, while those with high school diploma education earn the least with $57,598. Women with an educational attainment of high school diploma earn the most with the average annual earnings of $47,597, while those with college or associate's degree education have the smallest earnings of $9,643.
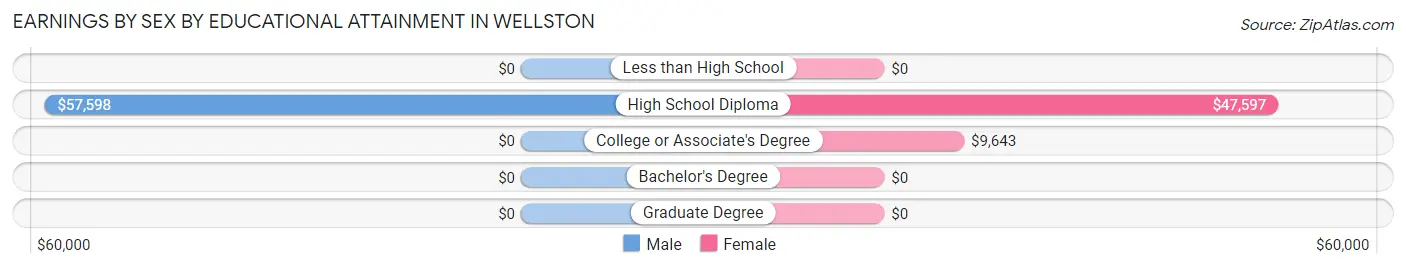
| Educational Attainment | Male Income | Female Income |
| Less than High School | - | - |
| High School Diploma | $57,598 | $47,597 |
| College or Associate's Degree | - | - |
| Bachelor's Degree | - | - |
| Graduate Degree | - | - |
| Total | $34,118 | $28,401 |
Family Income in Wellston
Family Income Brackets in Wellston
According to the Wellston family income data, there are 112 families falling into the $100,000 to $149,999 income range, which is the most common income bracket and makes up 24.8% of all families.
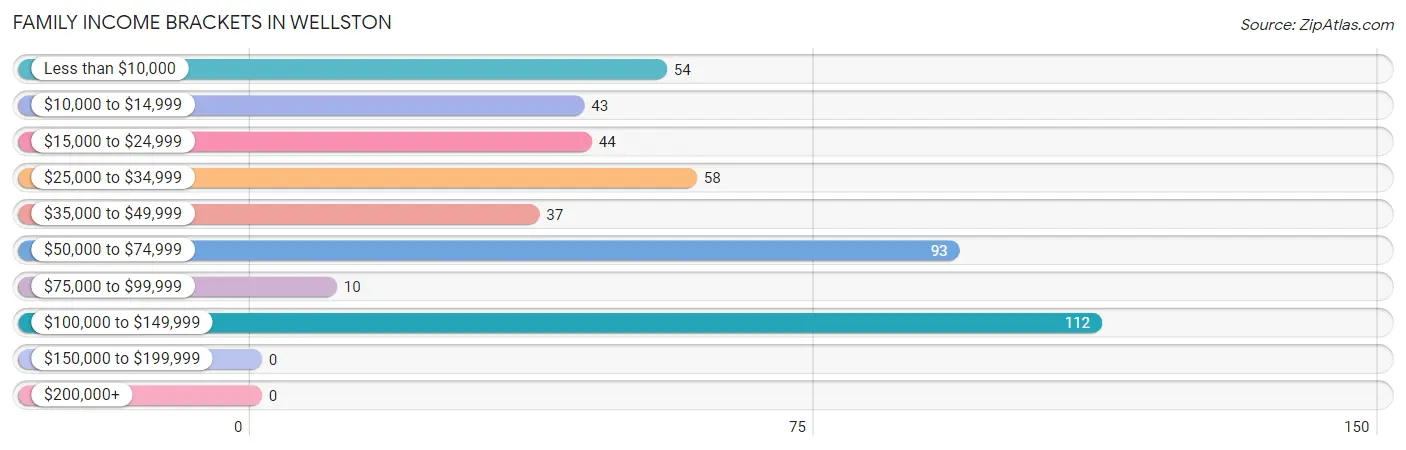
| Income Bracket | # Families | % Families |
| Less than $10,000 | 54 | 12.0% |
| $10,000 to $14,999 | 43 | 9.5% |
| $15,000 to $24,999 | 44 | 9.8% |
| $25,000 to $34,999 | 58 | 12.9% |
| $35,000 to $49,999 | 37 | 8.2% |
| $50,000 to $74,999 | 93 | 20.6% |
| $75,000 to $99,999 | 10 | 2.2% |
| $100,000 to $149,999 | 112 | 24.8% |
| $150,000 to $199,999 | 0 | 0.0% |
| $200,000+ | 0 | 0.0% |
Family Income by Famaliy Size in Wellston
2-person families (272 | 60.3%) account for the highest median family income in Wellston with $67,885 per family, while 2-person families (272 | 60.3%) have the highest median income of $33,942 per family member.
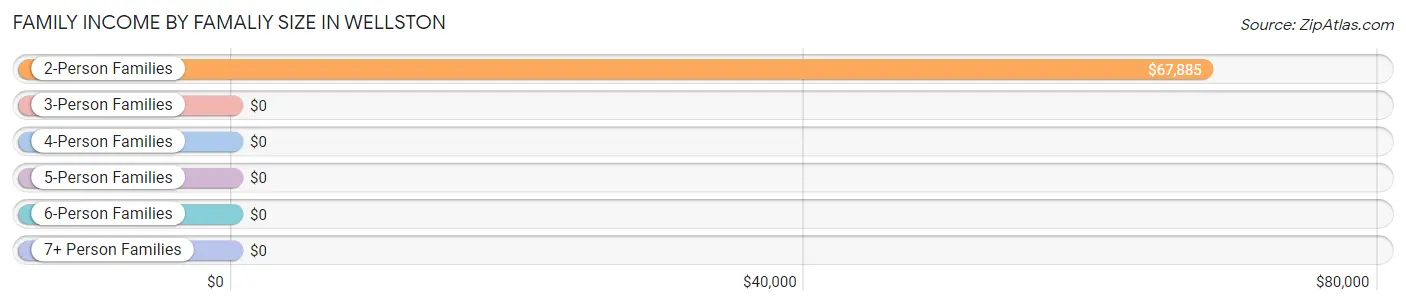
| Income Bracket | # Families | Median Income |
| 2-Person Families | 272 (60.3%) | $67,885 |
| 3-Person Families | 74 (16.4%) | $0 |
| 4-Person Families | 39 (8.6%) | $0 |
| 5-Person Families | 42 (9.3%) | $0 |
| 6-Person Families | 18 (4.0%) | $0 |
| 7+ Person Families | 6 (1.3%) | $0 |
| Total | 451 (100.0%) | $37,454 |
Family Income by Number of Earners in Wellston
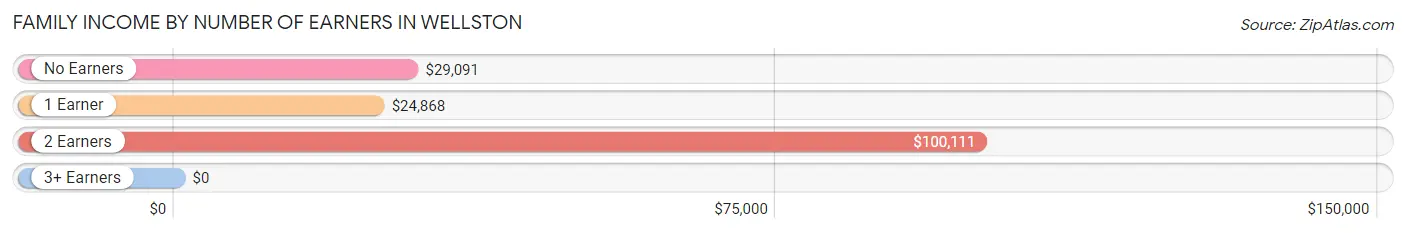
| Number of Earners | # Families | Median Income |
| No Earners | 46 (10.2%) | $29,091 |
| 1 Earner | 194 (43.0%) | $24,868 |
| 2 Earners | 188 (41.7%) | $100,111 |
| 3+ Earners | 23 (5.1%) | $0 |
| Total | 451 (100.0%) | $37,454 |
Household Income in Wellston
Household Income Brackets in Wellston
With 203 households falling in the category, the $50,000 to $74,999 income range is the most frequent in Wellston, accounting for 26.2% of all households.
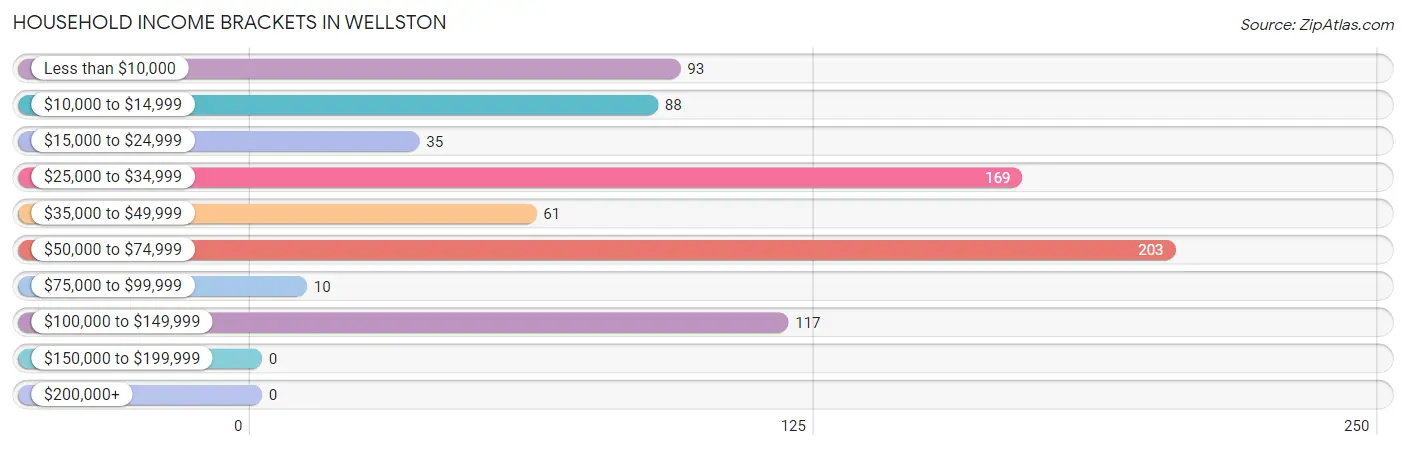
| Income Bracket | # Households | % Households |
| Less than $10,000 | 93 | 12.0% |
| $10,000 to $14,999 | 88 | 11.3% |
| $15,000 to $24,999 | 35 | 4.5% |
| $25,000 to $34,999 | 169 | 21.8% |
| $35,000 to $49,999 | 61 | 7.9% |
| $50,000 to $74,999 | 203 | 26.2% |
| $75,000 to $99,999 | 10 | 1.3% |
| $100,000 to $149,999 | 117 | 15.1% |
| $150,000 to $199,999 | 0 | 0.0% |
| $200,000+ | 0 | 0.0% |
Household Income by Householder Age in Wellston
The median household income in Wellston is $35,278, with the highest median household income of $49,444 found in the 45 to 64 years age bracket for the primary householder. A total of 464 households (59.8%) fall into this category.
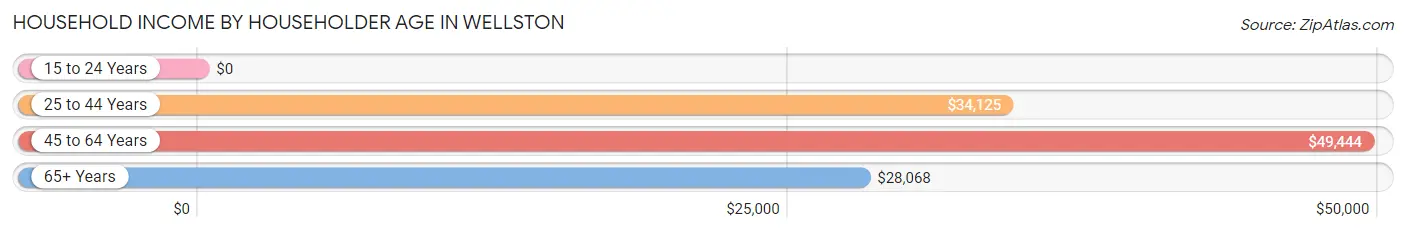
| Income Bracket | # Households | Median Income |
| 15 to 24 Years | 0 (0.0%) | $0 |
| 25 to 44 Years | 211 (27.2%) | $34,125 |
| 45 to 64 Years | 464 (59.8%) | $49,444 |
| 65+ Years | 101 (13.0%) | $28,068 |
| Total | 776 (100.0%) | $35,278 |
Poverty in Wellston
Income Below Poverty by Sex and Age in Wellston
With 46.4% poverty level for males and 32.4% for females among the residents of Wellston, under 5 year old males and under 5 year old females are the most vulnerable to poverty, with 73 males (100.0%) and 38 females (100.0%) in their respective age groups living below the poverty level.
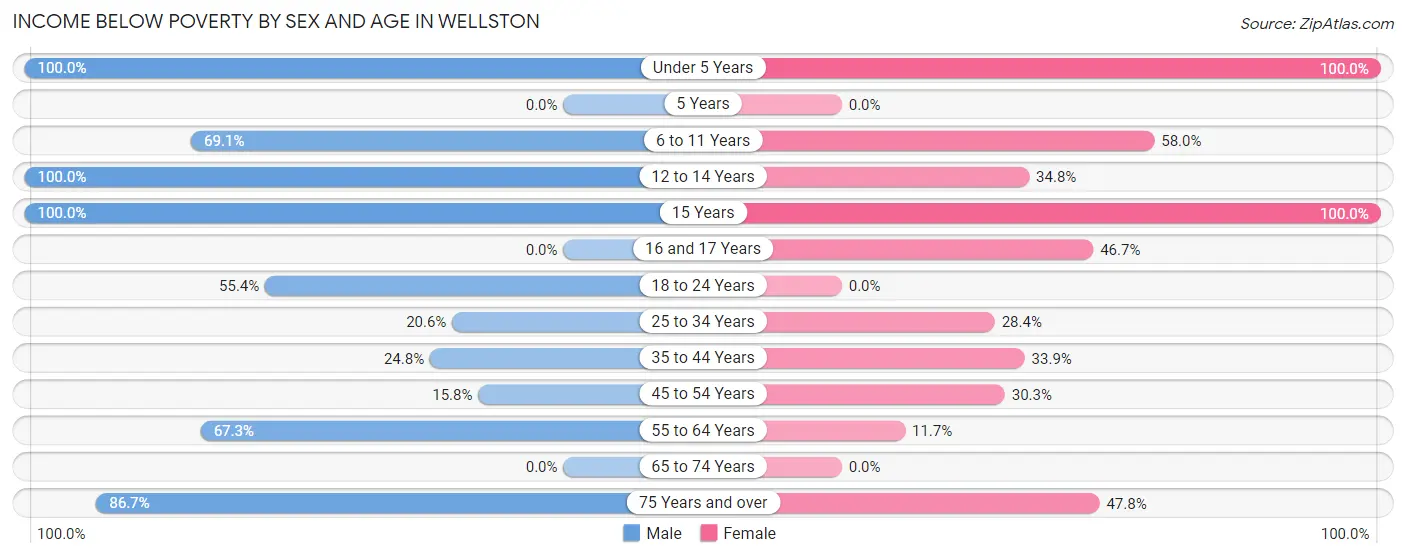
| Age Bracket | Male | Female |
| Under 5 Years | 73 (100.0%) | 38 (100.0%) |
| 5 Years | 0 (0.0%) | 0 (0.0%) |
| 6 to 11 Years | 76 (69.1%) | 58 (58.0%) |
| 12 to 14 Years | 18 (100.0%) | 8 (34.8%) |
| 15 Years | 9 (100.0%) | 20 (100.0%) |
| 16 and 17 Years | 0 (0.0%) | 42 (46.7%) |
| 18 to 24 Years | 31 (55.4%) | 0 (0.0%) |
| 25 to 34 Years | 13 (20.6%) | 67 (28.4%) |
| 35 to 44 Years | 25 (24.7%) | 37 (33.9%) |
| 45 to 54 Years | 18 (15.8%) | 36 (30.2%) |
| 55 to 64 Years | 70 (67.3%) | 31 (11.7%) |
| 65 to 74 Years | 0 (0.0%) | 0 (0.0%) |
| 75 Years and over | 13 (86.7%) | 22 (47.8%) |
| Total | 346 (46.4%) | 359 (32.4%) |
Income Above Poverty by Sex and Age in Wellston
According to the poverty statistics in Wellston, males aged 5 years and females aged 18 to 24 years are the age groups that are most secure financially, with 100.0% of males and 100.0% of females in these age groups living above the poverty line.
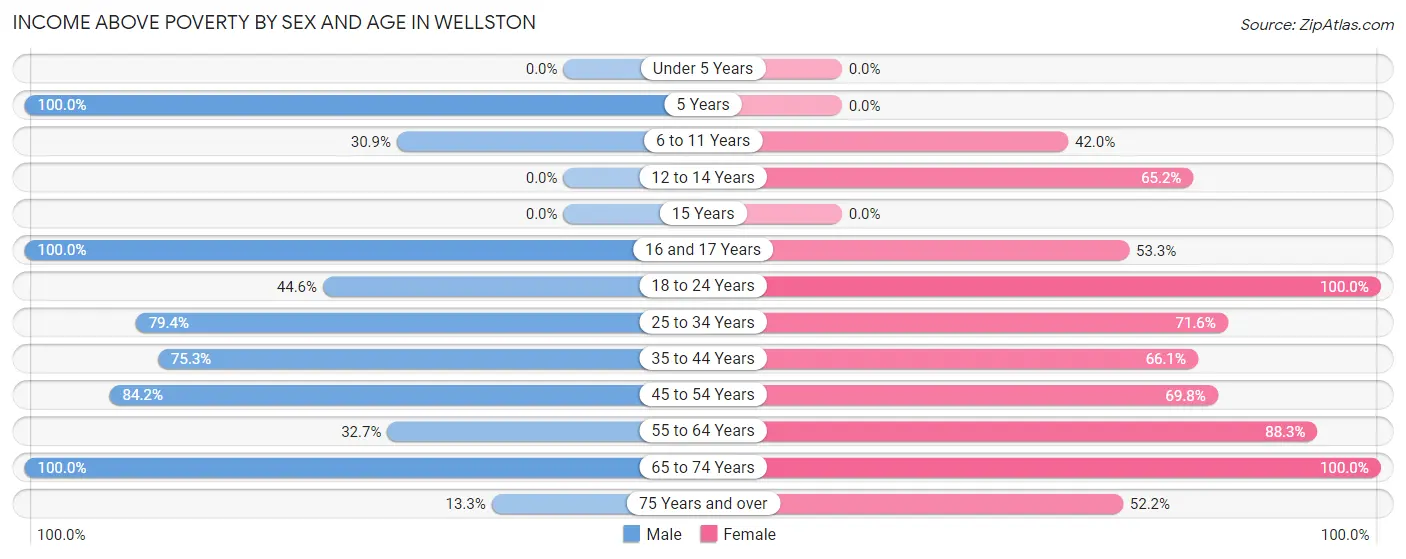
| Age Bracket | Male | Female |
| Under 5 Years | 0 (0.0%) | 0 (0.0%) |
| 5 Years | 24 (100.0%) | 0 (0.0%) |
| 6 to 11 Years | 34 (30.9%) | 42 (42.0%) |
| 12 to 14 Years | 0 (0.0%) | 15 (65.2%) |
| 15 Years | 0 (0.0%) | 0 (0.0%) |
| 16 and 17 Years | 9 (100.0%) | 48 (53.3%) |
| 18 to 24 Years | 25 (44.6%) | 35 (100.0%) |
| 25 to 34 Years | 50 (79.4%) | 169 (71.6%) |
| 35 to 44 Years | 76 (75.2%) | 72 (66.1%) |
| 45 to 54 Years | 96 (84.2%) | 83 (69.8%) |
| 55 to 64 Years | 34 (32.7%) | 233 (88.3%) |
| 65 to 74 Years | 50 (100.0%) | 27 (100.0%) |
| 75 Years and over | 2 (13.3%) | 24 (52.2%) |
| Total | 400 (53.6%) | 748 (67.6%) |
Income Below Poverty Among Married-Couple Families in Wellston
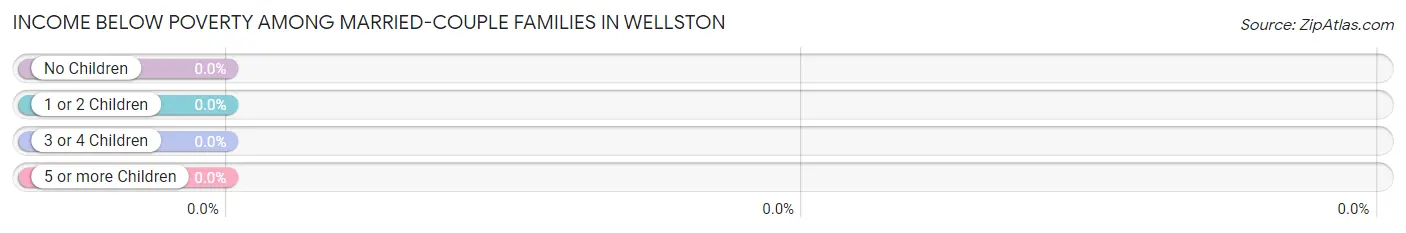
| Children | Above Poverty | Below Poverty |
| No Children | 39 (100.0%) | 0 (0.0%) |
| 1 or 2 Children | 19 (100.0%) | 0 (0.0%) |
| 3 or 4 Children | 0 (0.0%) | 0 (0.0%) |
| 5 or more Children | 0 (0.0%) | 0 (0.0%) |
| Total | 58 (100.0%) | 0 (0.0%) |
Income Below Poverty Among Single-Parent Households in Wellston
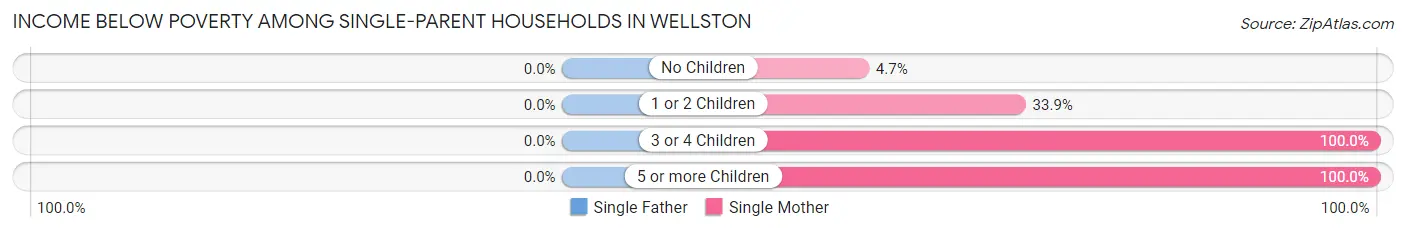
| Children | Single Father | Single Mother |
| No Children | 0 (0.0%) | 7 (4.7%) |
| 1 or 2 Children | 0 (0.0%) | 40 (33.9%) |
| 3 or 4 Children | 0 (0.0%) | 62 (100.0%) |
| 5 or more Children | 0 (0.0%) | 18 (100.0%) |
| Total | 0 (0.0%) | 127 (36.6%) |
Income Below Poverty Among Married-Couple vs Single-Parent Households in Wellston
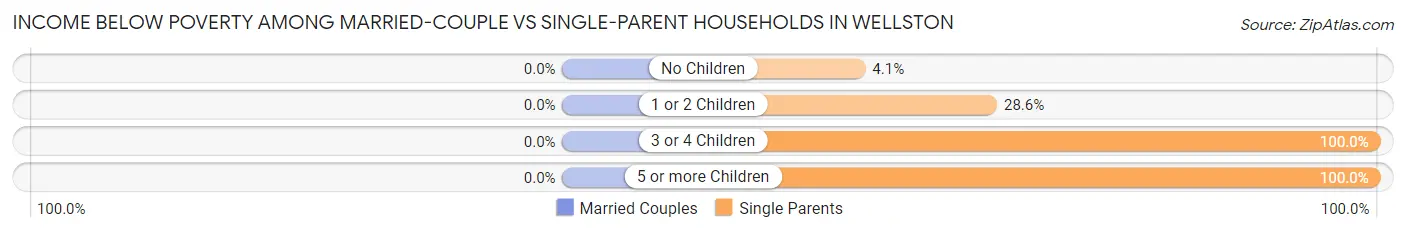
| Children | Married-Couple Families | Single-Parent Households |
| No Children | 0 (0.0%) | 7 (4.1%) |
| 1 or 2 Children | 0 (0.0%) | 40 (28.6%) |
| 3 or 4 Children | 0 (0.0%) | 62 (100.0%) |
| 5 or more Children | 0 (0.0%) | 18 (100.0%) |
| Total | 0 (0.0%) | 127 (32.3%) |
Race in Wellston
The most populous races in Wellston are Black / African American (1,769 | 92.5%), White / Caucasian (84 | 4.4%), and Two or more Races (60 | 3.1%).
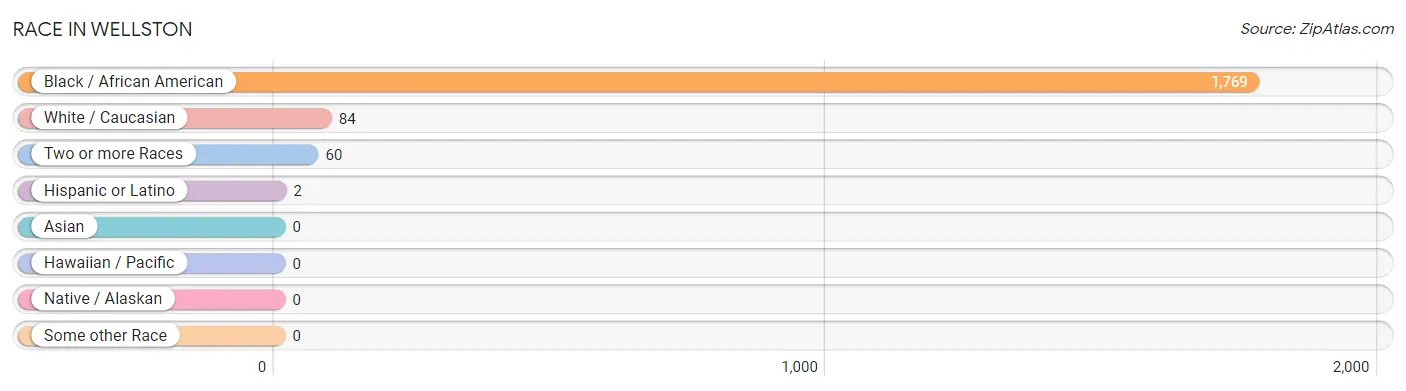
| Race | # Population | % Population |
| Asian | 0 | 0.0% |
| Black / African American | 1,769 | 92.5% |
| Hawaiian / Pacific | 0 | 0.0% |
| Hispanic or Latino | 2 | 0.1% |
| Native / Alaskan | 0 | 0.0% |
| White / Caucasian | 84 | 4.4% |
| Two or more Races | 60 | 3.1% |
| Some other Race | 0 | 0.0% |
| Total | 1,913 | 100.0% |
Ancestry in Wellston
The most populous ancestries reported in Wellston are American (129 | 6.7%), Italian (22 | 1.1%), European (18 | 0.9%), German (17 | 0.9%), and French (2 | 0.1%), together accounting for 9.8% of all Wellston residents.
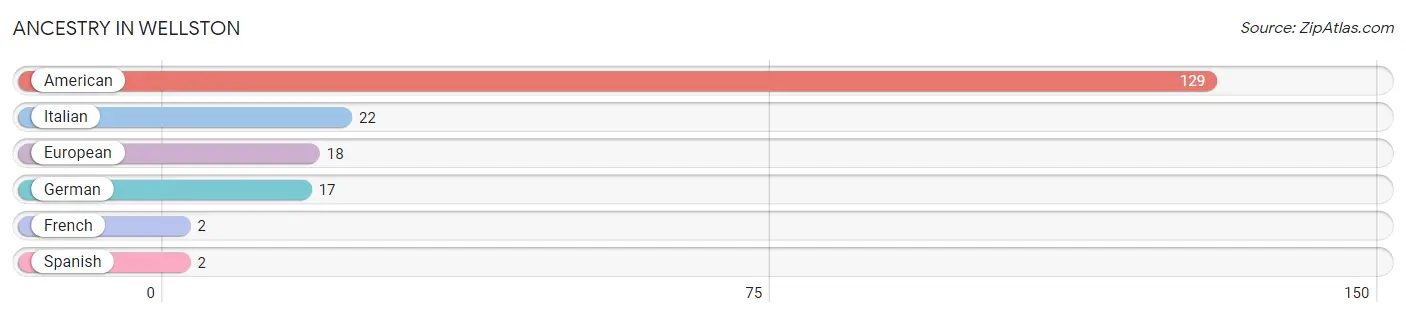
| Ancestry | # Population | % Population |
| American | 129 | 6.7% |
| European | 18 | 0.9% |
| French | 2 | 0.1% |
| German | 17 | 0.9% |
| Italian | 22 | 1.1% |
| Spanish | 2 | 0.1% | View All 6 Rows |
Immigrants in Wellston

| Immigration Origin | # Population | % Population | View All 0 Rows |
Sex and Age in Wellston
Sex and Age in Wellston
The most populous age groups in Wellston are 50 to 54 Years (107 | 14.0%) for men and 30 to 34 Years (152 | 13.3%) for women.
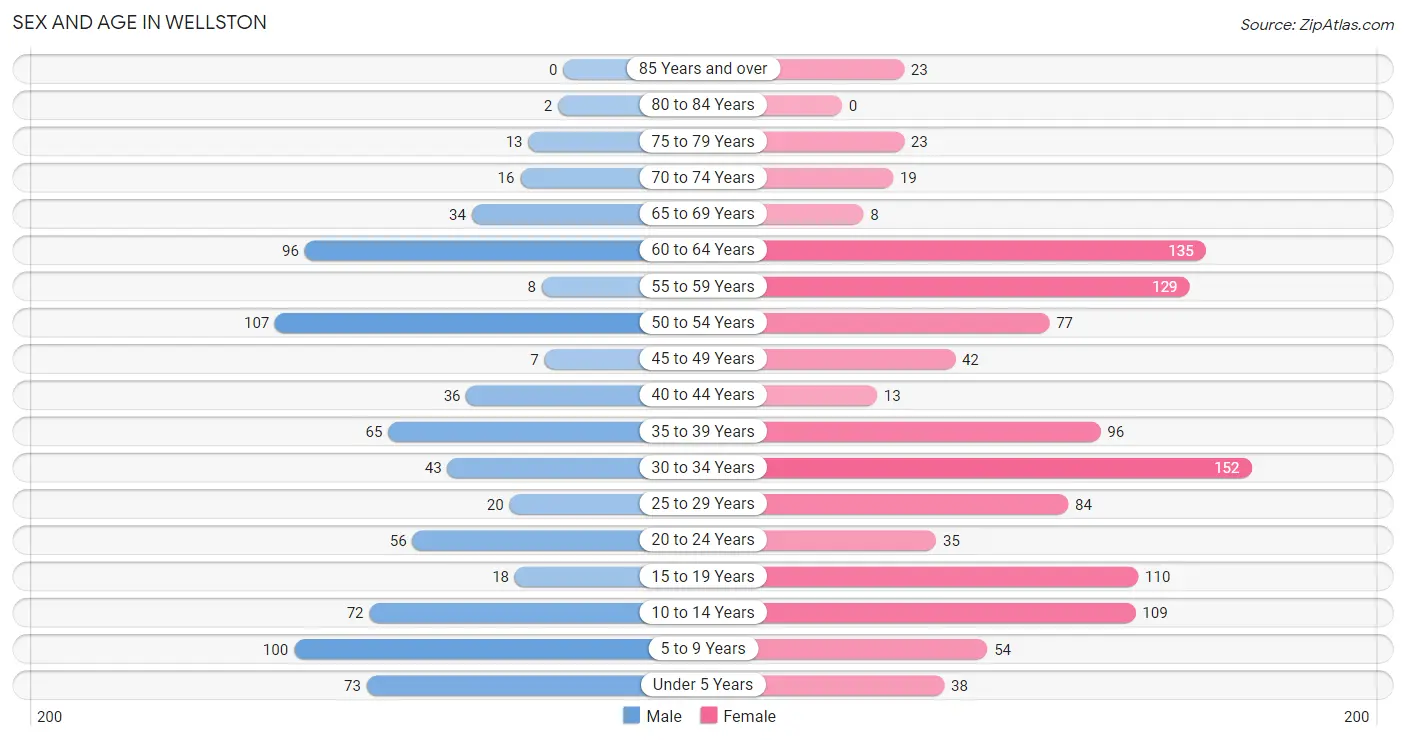
| Age Bracket | Male | Female |
| Under 5 Years | 73 (9.5%) | 38 (3.3%) |
| 5 to 9 Years | 100 (13.1%) | 54 (4.7%) |
| 10 to 14 Years | 72 (9.4%) | 109 (9.5%) |
| 15 to 19 Years | 18 (2.4%) | 110 (9.6%) |
| 20 to 24 Years | 56 (7.3%) | 35 (3.0%) |
| 25 to 29 Years | 20 (2.6%) | 84 (7.3%) |
| 30 to 34 Years | 43 (5.6%) | 152 (13.3%) |
| 35 to 39 Years | 65 (8.5%) | 96 (8.4%) |
| 40 to 44 Years | 36 (4.7%) | 13 (1.1%) |
| 45 to 49 Years | 7 (0.9%) | 42 (3.7%) |
| 50 to 54 Years | 107 (14.0%) | 77 (6.7%) |
| 55 to 59 Years | 8 (1.0%) | 129 (11.3%) |
| 60 to 64 Years | 96 (12.5%) | 135 (11.8%) |
| 65 to 69 Years | 34 (4.4%) | 8 (0.7%) |
| 70 to 74 Years | 16 (2.1%) | 19 (1.7%) |
| 75 to 79 Years | 13 (1.7%) | 23 (2.0%) |
| 80 to 84 Years | 2 (0.3%) | 0 (0.0%) |
| 85 Years and over | 0 (0.0%) | 23 (2.0%) |
| Total | 766 (100.0%) | 1,147 (100.0%) |
Families and Households in Wellston
Median Family Size in Wellston
The median family size in Wellston is 3.01 persons per family, with married-couple families (58 | 12.9%) accounting for the largest median family size of 3.28 persons per family. On the other hand, single female/mother families (347 | 76.9%) represent the smallest median family size with 2.96 persons per family.
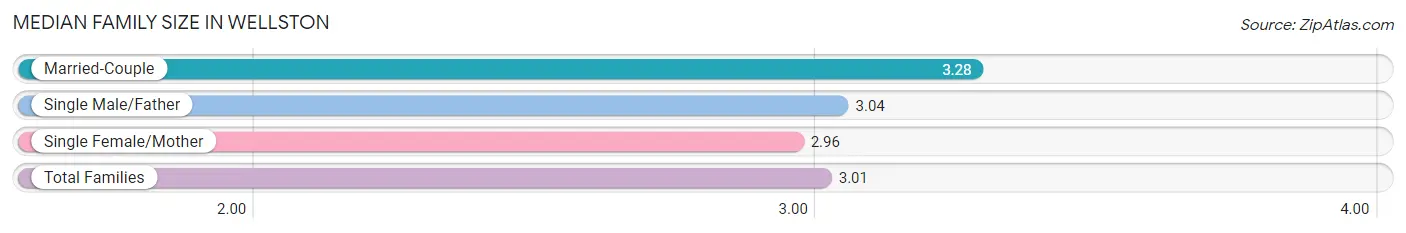
| Family Type | # Families | Family Size |
| Married-Couple | 58 (12.9%) | 3.28 |
| Single Male/Father | 46 (10.2%) | 3.04 |
| Single Female/Mother | 347 (76.9%) | 2.96 |
| Total Families | 451 (100.0%) | 3.01 |
Median Household Size in Wellston
The median household size in Wellston is 2.47 persons per household, with single male/father households (46 | 5.9%) accounting for the largest median household size of 3.65 persons per household. non-family households (325 | 41.9%) represent the smallest median household size with 1.58 persons per household.
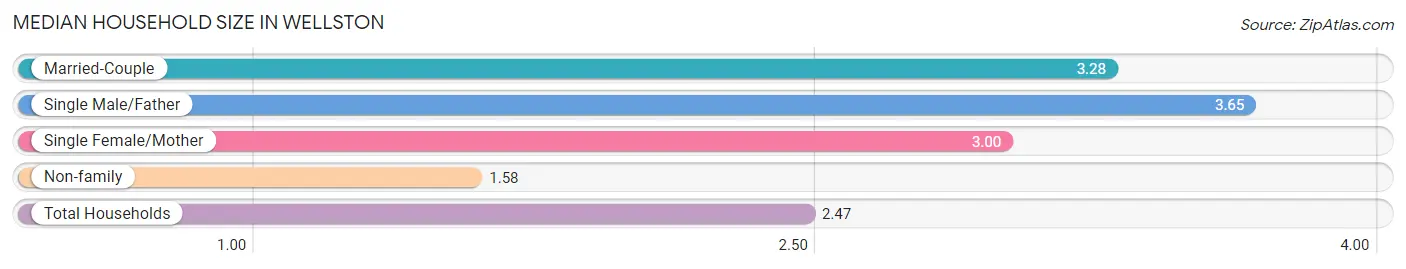
| Household Type | # Households | Household Size |
| Married-Couple | 58 (7.5%) | 3.28 |
| Single Male/Father | 46 (5.9%) | 3.65 |
| Single Female/Mother | 347 (44.7%) | 3.00 |
| Non-family | 325 (41.9%) | 1.58 |
| Total Households | 776 (100.0%) | 2.47 |
Household Size by Marriage Status in Wellston
Out of a total of 776 households in Wellston, 451 (58.1%) are family households, while 325 (41.9%) are nonfamily households. The most numerous type of family households are 2-person households, comprising 246, and the most common type of nonfamily households are 1-person households, comprising 228.
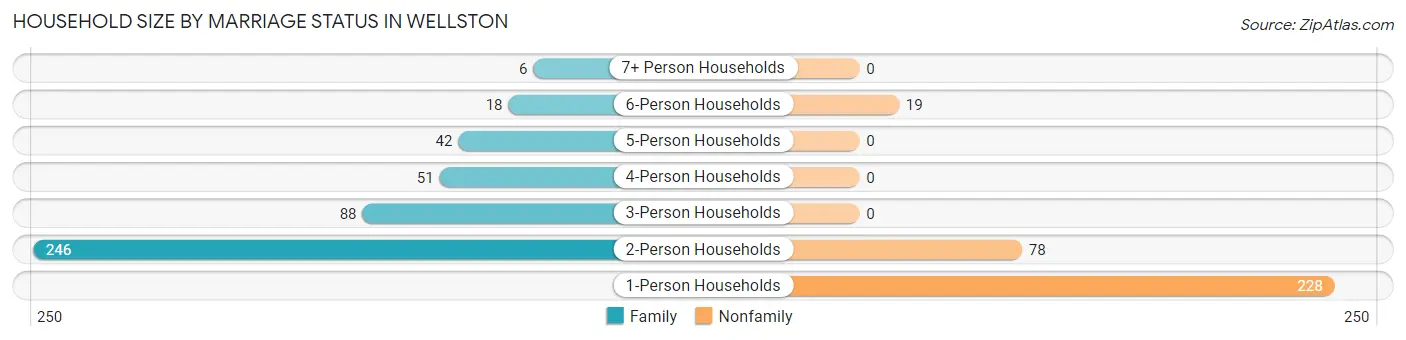
| Household Size | Family Households | Nonfamily Households |
| 1-Person Households | - | 228 (29.4%) |
| 2-Person Households | 246 (31.7%) | 78 (10.1%) |
| 3-Person Households | 88 (11.3%) | 0 (0.0%) |
| 4-Person Households | 51 (6.6%) | 0 (0.0%) |
| 5-Person Households | 42 (5.4%) | 0 (0.0%) |
| 6-Person Households | 18 (2.3%) | 19 (2.5%) |
| 7+ Person Households | 6 (0.8%) | 0 (0.0%) |
| Total | 451 (58.1%) | 325 (41.9%) |
Female Fertility in Wellston
Fertility by Age in Wellston
Average fertility rate in Wellston is 68.0 births per 1,000 women. Women in the age bracket of 20 to 34 years have the highest fertility rate with 133.0 births per 1,000 women. Women in the age bracket of 20 to 34 years acount for 100.0% of all women with births.
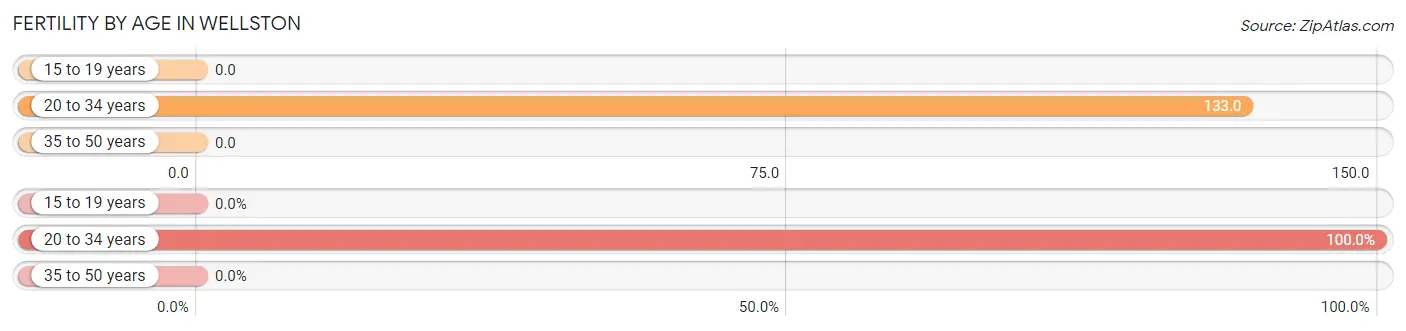
| Age Bracket | Women with Births | Births / 1,000 Women |
| 15 to 19 years | 0 (0.0%) | 0.0 |
| 20 to 34 years | 36 (100.0%) | 133.0 |
| 35 to 50 years | 0 (0.0%) | 0.0 |
| Total | 36 (100.0%) | 68.0 |
Fertility by Age by Marriage Status in Wellston
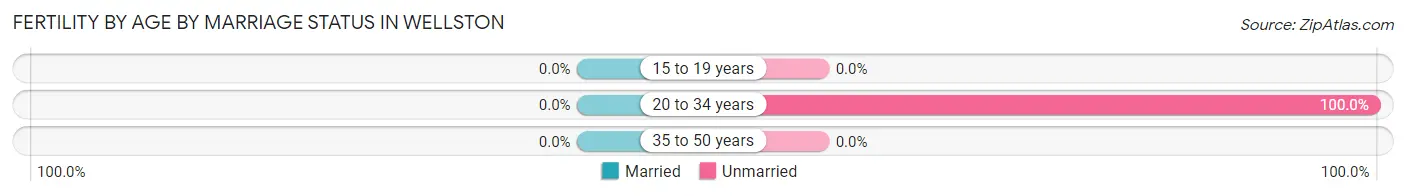
| Age Bracket | Married | Unmarried |
| 15 to 19 years | 0 (0.0%) | 0 (0.0%) |
| 20 to 34 years | 0 (0.0%) | 36 (100.0%) |
| 35 to 50 years | 0 (0.0%) | 0 (0.0%) |
| Total | 0 (0.0%) | 36 (100.0%) |
Fertility by Education in Wellston
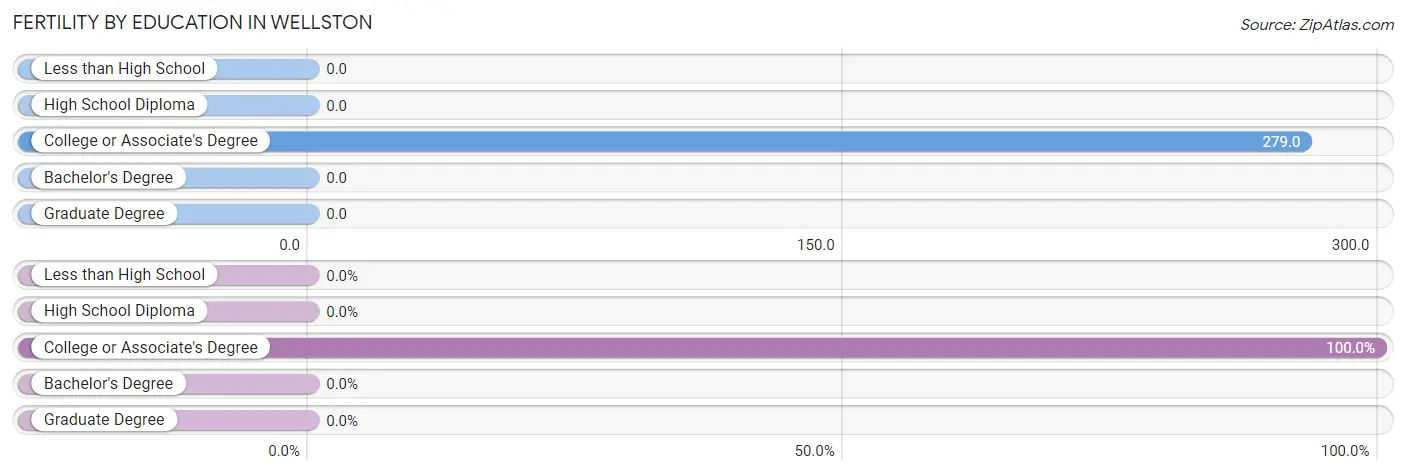
| Educational Attainment | Women with Births | Births / 1,000 Women |
| Less than High School | 0 (0.0%) | 0.0 |
| High School Diploma | 0 (0.0%) | 0.0 |
| College or Associate's Degree | 36 (100.0%) | 279.0 |
| Bachelor's Degree | 0 (0.0%) | 0.0 |
| Graduate Degree | 0 (0.0%) | 0.0 |
| Total | 36 (100.0%) | 68.0 |
Fertility by Education by Marriage Status in Wellston
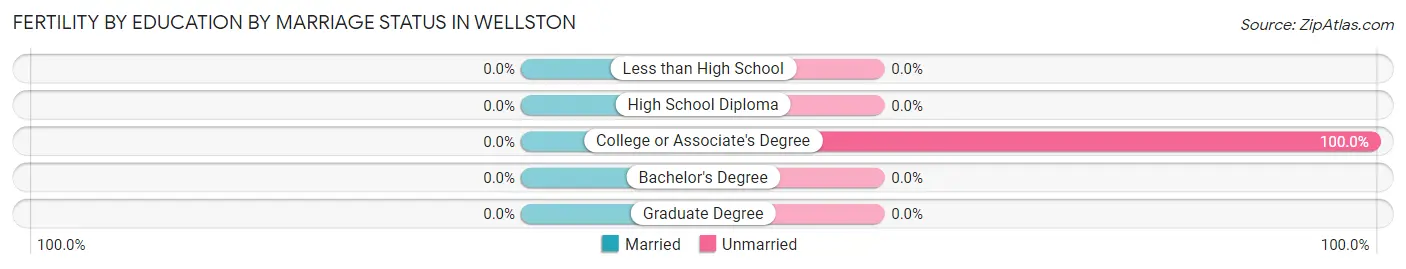
| Educational Attainment | Married | Unmarried |
| Less than High School | 0 (0.0%) | 0 (0.0%) |
| High School Diploma | 0 (0.0%) | 0 (0.0%) |
| College or Associate's Degree | 0 (0.0%) | 36 (100.0%) |
| Bachelor's Degree | 0 (0.0%) | 0 (0.0%) |
| Graduate Degree | 0 (0.0%) | 0 (0.0%) |
| Total | 0 (0.0%) | 36 (100.0%) |
Employment Characteristics in Wellston
Employment by Class of Employer in Wellston
Among the 836 employed individuals in Wellston, private company employees (658 | 78.7%), not-for-profit organizations (102 | 12.2%), and state government employees (22 | 2.6%) make up the most common classes of employment.
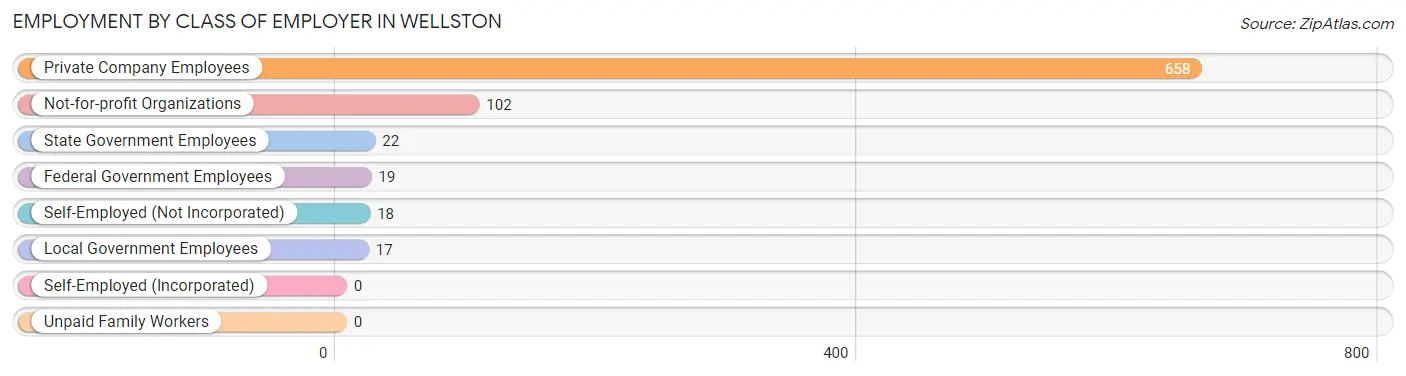
| Employer Class | # Employees | % Employees |
| Private Company Employees | 658 | 78.7% |
| Self-Employed (Incorporated) | 0 | 0.0% |
| Self-Employed (Not Incorporated) | 18 | 2.1% |
| Not-for-profit Organizations | 102 | 12.2% |
| Local Government Employees | 17 | 2.0% |
| State Government Employees | 22 | 2.6% |
| Federal Government Employees | 19 | 2.3% |
| Unpaid Family Workers | 0 | 0.0% |
| Total | 836 | 100.0% |
Employment Status by Age in Wellston
According to the labor force statistics for Wellston, out of the total population over 16 years of age (1,438), 62.2% or 894 individuals are in the labor force, with 3.0% or 27 of them unemployed. The age group with the highest labor force participation rate is 25 to 29 years, with 100.0% or 104 individuals in the labor force. Within the labor force, the 20 to 24 years age range has the highest percentage of unemployed individuals, with 30.0% or 15 of them being unemployed.
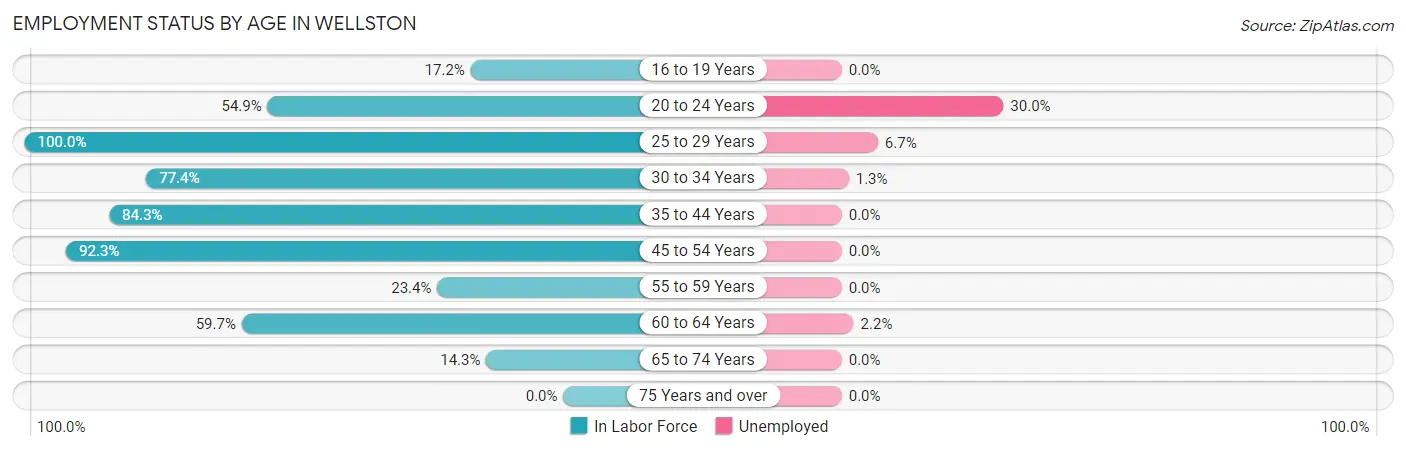
| Age Bracket | In Labor Force | Unemployed |
| 16 to 19 Years | 17 (17.2%) | 0 (0.0%) |
| 20 to 24 Years | 50 (54.9%) | 15 (30.0%) |
| 25 to 29 Years | 104 (100.0%) | 7 (6.7%) |
| 30 to 34 Years | 151 (77.4%) | 2 (1.3%) |
| 35 to 44 Years | 177 (84.3%) | 0 (0.0%) |
| 45 to 54 Years | 215 (92.3%) | 0 (0.0%) |
| 55 to 59 Years | 32 (23.4%) | 0 (0.0%) |
| 60 to 64 Years | 138 (59.7%) | 3 (2.2%) |
| 65 to 74 Years | 11 (14.3%) | 0 (0.0%) |
| 75 Years and over | 0 (0.0%) | 0 (0.0%) |
| Total | 894 (62.2%) | 27 (3.0%) |
Employment Status by Educational Attainment in Wellston
According to labor force statistics for Wellston, 73.6% of individuals (817) out of the total population between 25 and 64 years of age (1,110) are in the labor force, with 1.5% or 12 of them being unemployed. The group with the highest labor force participation rate are those with the educational attainment of bachelor's degree or higher, with 100.0% or 105 individuals in the labor force. Within the labor force, individuals with college / associate degree education have the highest percentage of unemployment, with 4.9% or 10 of them being unemployed.
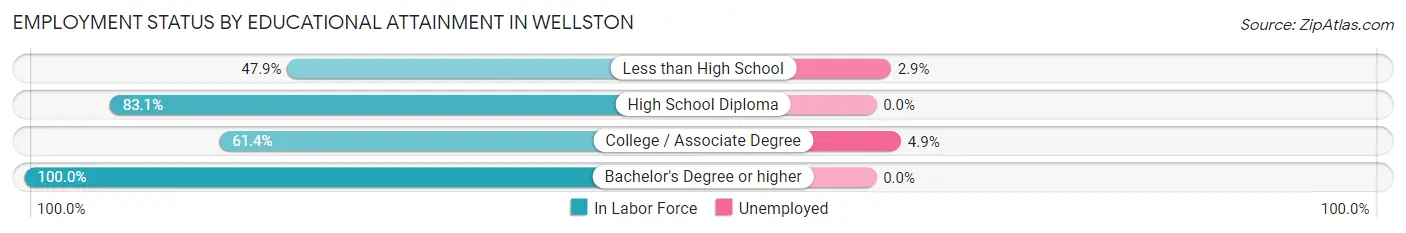
| Educational Attainment | In Labor Force | Unemployed |
| Less than High School | 69 (47.9%) | 4 (2.9%) |
| High School Diploma | 438 (83.1%) | 0 (0.0%) |
| College / Associate Degree | 205 (61.4%) | 16 (4.9%) |
| Bachelor's Degree or higher | 105 (100.0%) | 0 (0.0%) |
| Total | 817 (73.6%) | 17 (1.5%) |
Employment Occupations by Sex in Wellston
Management, Business, Science and Arts Occupations
The most common Management, Business, Science and Arts occupations in Wellston are Health Diagnosing & Treating (237 | 27.3%), Management (108 | 12.4%), Community & Social Service (23 | 2.6%), Education, Arts & Media (17 | 2.0%), and Legal Services & Support (6 | 0.7%).
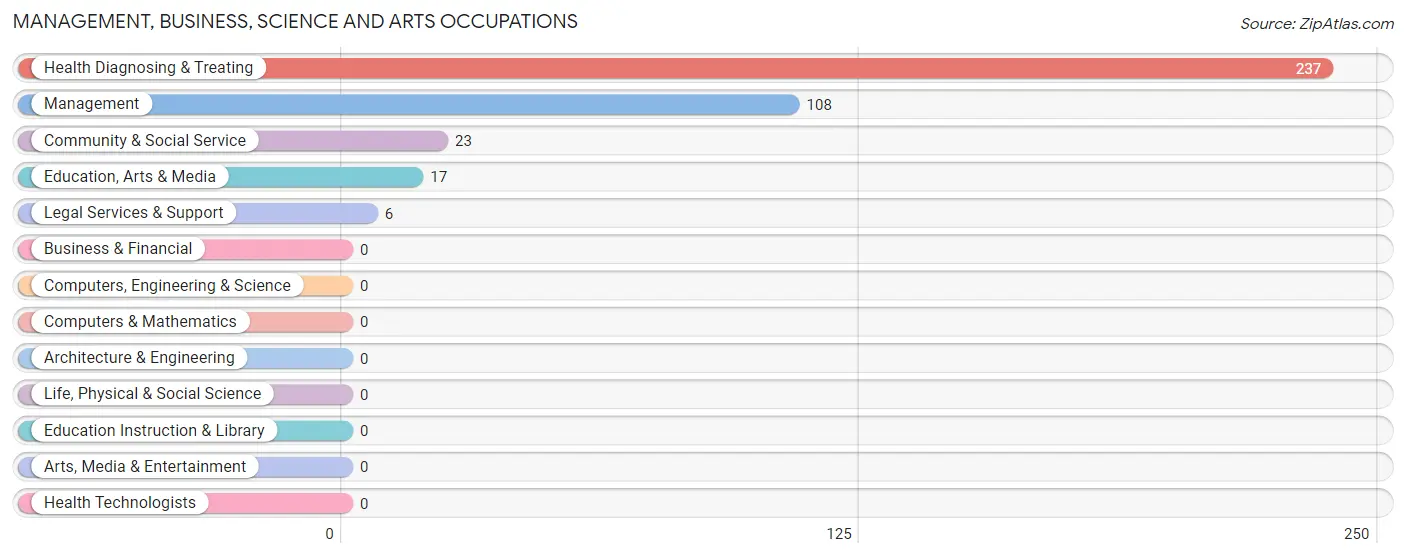
Management, Business, Science and Arts Occupations by Sex
Within the Management, Business, Science and Arts occupations in Wellston, the most male-oriented occupations are Education, Arts & Media (100.0%), Management (82.4%), and Community & Social Service (73.9%), while the most female-oriented occupations are Legal Services & Support (100.0%), Health Diagnosing & Treating (100.0%), and Community & Social Service (26.1%).
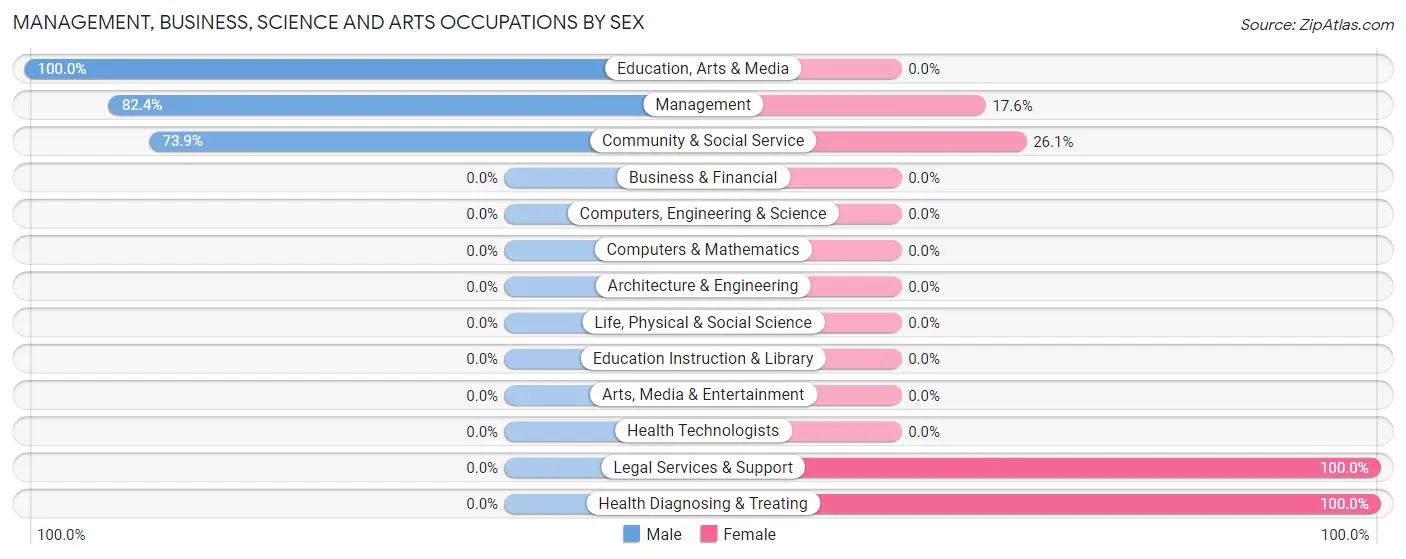
| Occupation | Male | Female |
| Management | 89 (82.4%) | 19 (17.6%) |
| Business & Financial | 0 (0.0%) | 0 (0.0%) |
| Computers, Engineering & Science | 0 (0.0%) | 0 (0.0%) |
| Computers & Mathematics | 0 (0.0%) | 0 (0.0%) |
| Architecture & Engineering | 0 (0.0%) | 0 (0.0%) |
| Life, Physical & Social Science | 0 (0.0%) | 0 (0.0%) |
| Community & Social Service | 17 (73.9%) | 6 (26.1%) |
| Education, Arts & Media | 17 (100.0%) | 0 (0.0%) |
| Legal Services & Support | 0 (0.0%) | 6 (100.0%) |
| Education Instruction & Library | 0 (0.0%) | 0 (0.0%) |
| Arts, Media & Entertainment | 0 (0.0%) | 0 (0.0%) |
| Health Diagnosing & Treating | 0 (0.0%) | 237 (100.0%) |
| Health Technologists | 0 (0.0%) | 0 (0.0%) |
| Total (Category) | 106 (28.8%) | 262 (71.2%) |
| Total (Overall) | 245 (28.2%) | 623 (71.8%) |
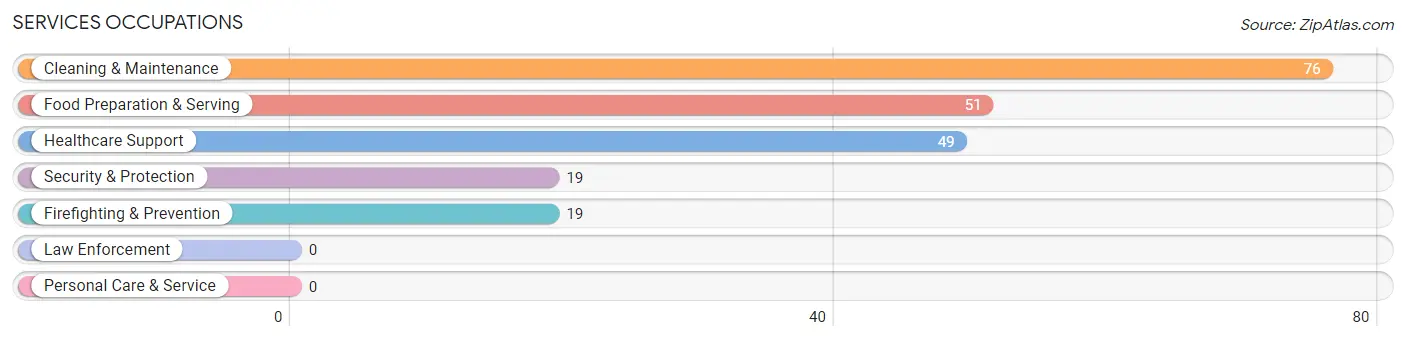
Services Occupations
The most common Services occupations in Wellston are Cleaning & Maintenance (76 | 8.8%), Food Preparation & Serving (51 | 5.9%), Healthcare Support (49 | 5.7%), Security & Protection (19 | 2.2%), and Firefighting & Prevention (19 | 2.2%).
Services Occupations by Sex
Within the Services occupations in Wellston, the most male-oriented occupations are Security & Protection (100.0%), Firefighting & Prevention (100.0%), and Healthcare Support (53.1%), while the most female-oriented occupations are Cleaning & Maintenance (92.1%), Food Preparation & Serving (66.7%), and Healthcare Support (46.9%).
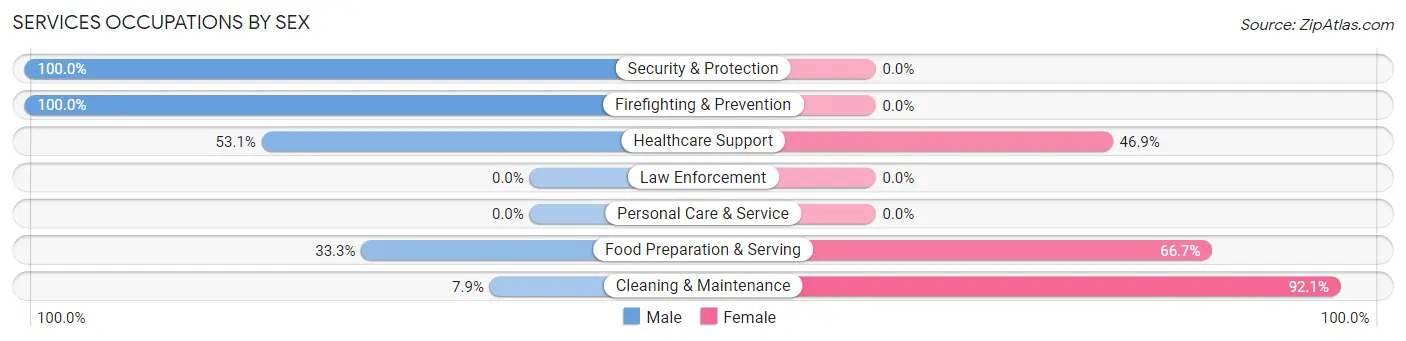
| Occupation | Male | Female |
| Healthcare Support | 26 (53.1%) | 23 (46.9%) |
| Security & Protection | 19 (100.0%) | 0 (0.0%) |
| Firefighting & Prevention | 19 (100.0%) | 0 (0.0%) |
| Law Enforcement | 0 (0.0%) | 0 (0.0%) |
| Food Preparation & Serving | 17 (33.3%) | 34 (66.7%) |
| Cleaning & Maintenance | 6 (7.9%) | 70 (92.1%) |
| Personal Care & Service | 0 (0.0%) | 0 (0.0%) |
| Total (Category) | 68 (34.9%) | 127 (65.1%) |
| Total (Overall) | 245 (28.2%) | 623 (71.8%) |
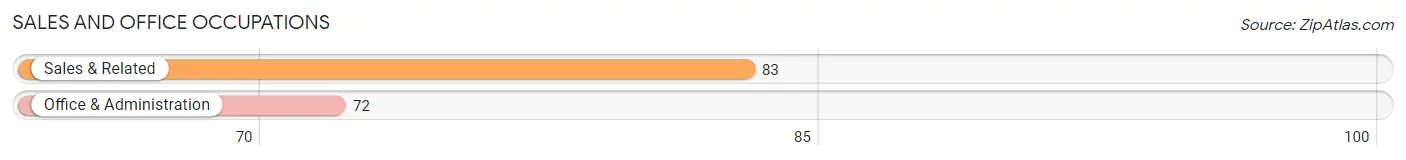
Sales and Office Occupations
The most common Sales and Office occupations in Wellston are Sales & Related (83 | 9.6%), and Office & Administration (72 | 8.3%).
Sales and Office Occupations by Sex
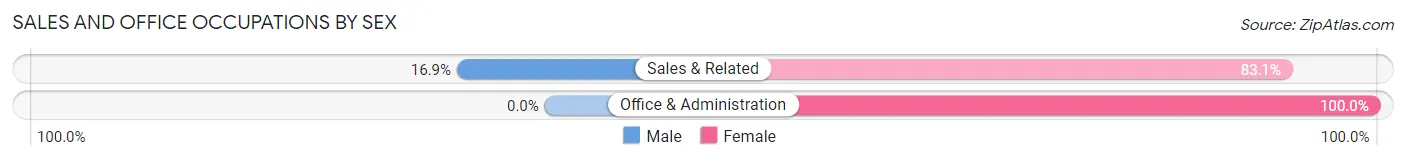
| Occupation | Male | Female |
| Sales & Related | 14 (16.9%) | 69 (83.1%) |
| Office & Administration | 0 (0.0%) | 72 (100.0%) |
| Total (Category) | 14 (9.0%) | 141 (91.0%) |
| Total (Overall) | 245 (28.2%) | 623 (71.8%) |
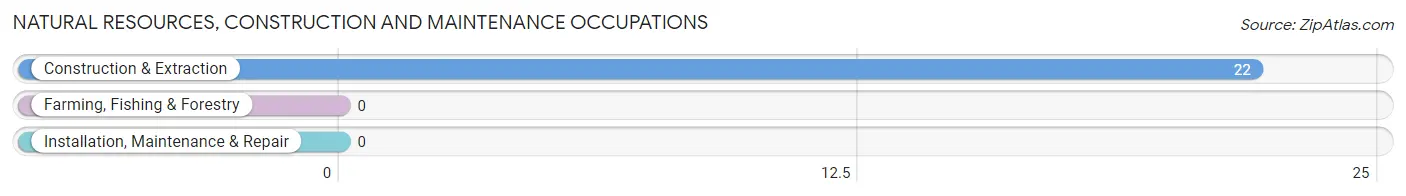
Natural Resources, Construction and Maintenance Occupations
The most common Natural Resources, Construction and Maintenance occupations in Wellston are , and Construction & Extraction (22 | 2.5%).
Natural Resources, Construction and Maintenance Occupations by Sex
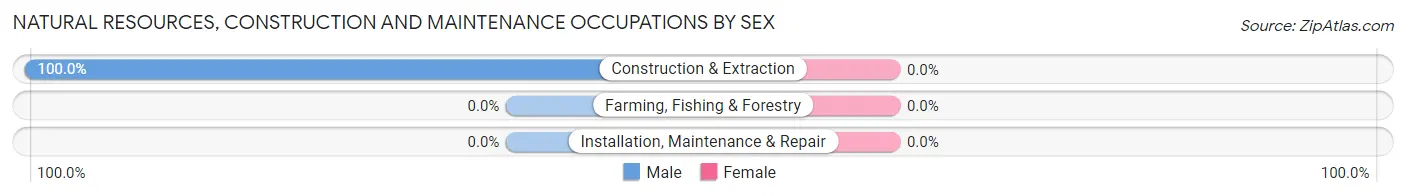
| Occupation | Male | Female |
| Farming, Fishing & Forestry | 0 (0.0%) | 0 (0.0%) |
| Construction & Extraction | 22 (100.0%) | 0 (0.0%) |
| Installation, Maintenance & Repair | 0 (0.0%) | 0 (0.0%) |
| Total (Category) | 22 (100.0%) | 0 (0.0%) |
| Total (Overall) | 245 (28.2%) | 623 (71.8%) |
Production, Transportation and Moving Occupations
The most common Production, Transportation and Moving occupations in Wellston are Material Moving (57 | 6.6%), Production (52 | 6.0%), and Transportation (19 | 2.2%).
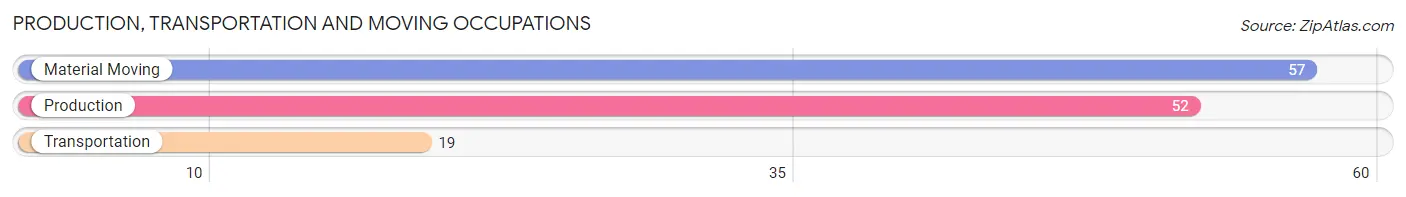
Production, Transportation and Moving Occupations by Sex
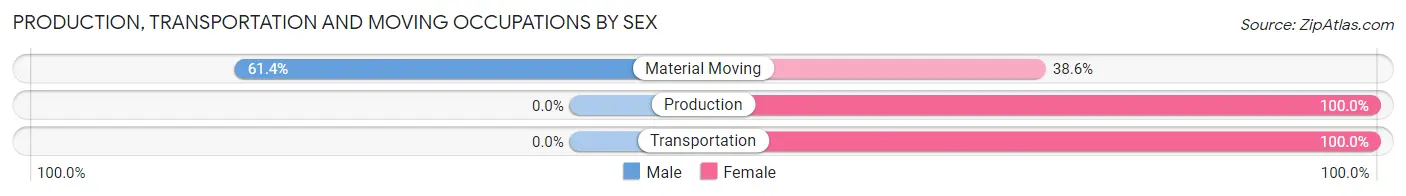
| Occupation | Male | Female |
| Production | 0 (0.0%) | 52 (100.0%) |
| Transportation | 0 (0.0%) | 19 (100.0%) |
| Material Moving | 35 (61.4%) | 22 (38.6%) |
| Total (Category) | 35 (27.3%) | 93 (72.7%) |
| Total (Overall) | 245 (28.2%) | 623 (71.8%) |
Employment Industries by Sex in Wellston
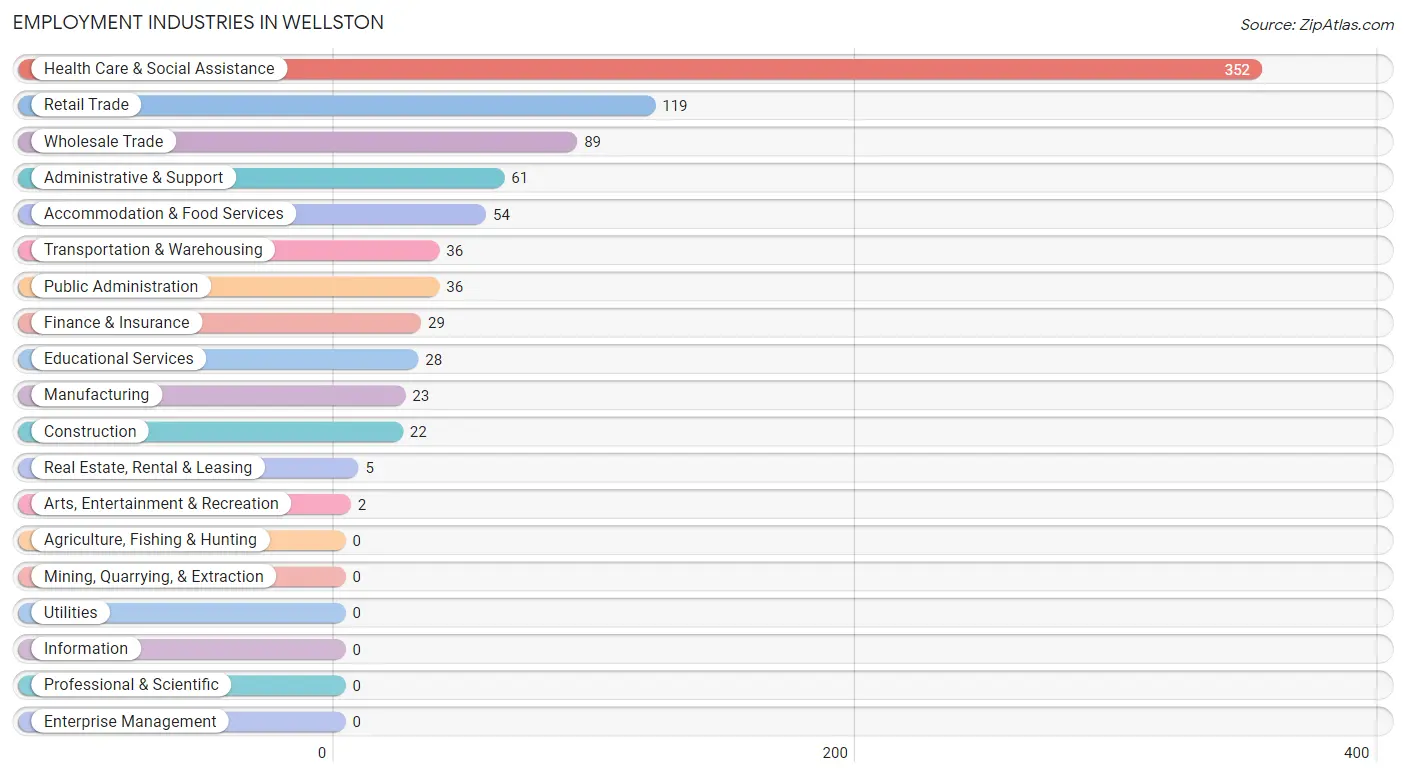
Employment Industries in Wellston
The major employment industries in Wellston include Health Care & Social Assistance (352 | 40.6%), Retail Trade (119 | 13.7%), Wholesale Trade (89 | 10.2%), Administrative & Support (61 | 7.0%), and Accommodation & Food Services (54 | 6.2%).
Employment Industries by Sex in Wellston
The Wellston industries that see more men than women are Construction (100.0%), Wholesale Trade (100.0%), and Public Administration (100.0%), whereas the industries that tend to have a higher number of women are Manufacturing (100.0%), Finance & Insurance (100.0%), and Real Estate, Rental & Leasing (100.0%).
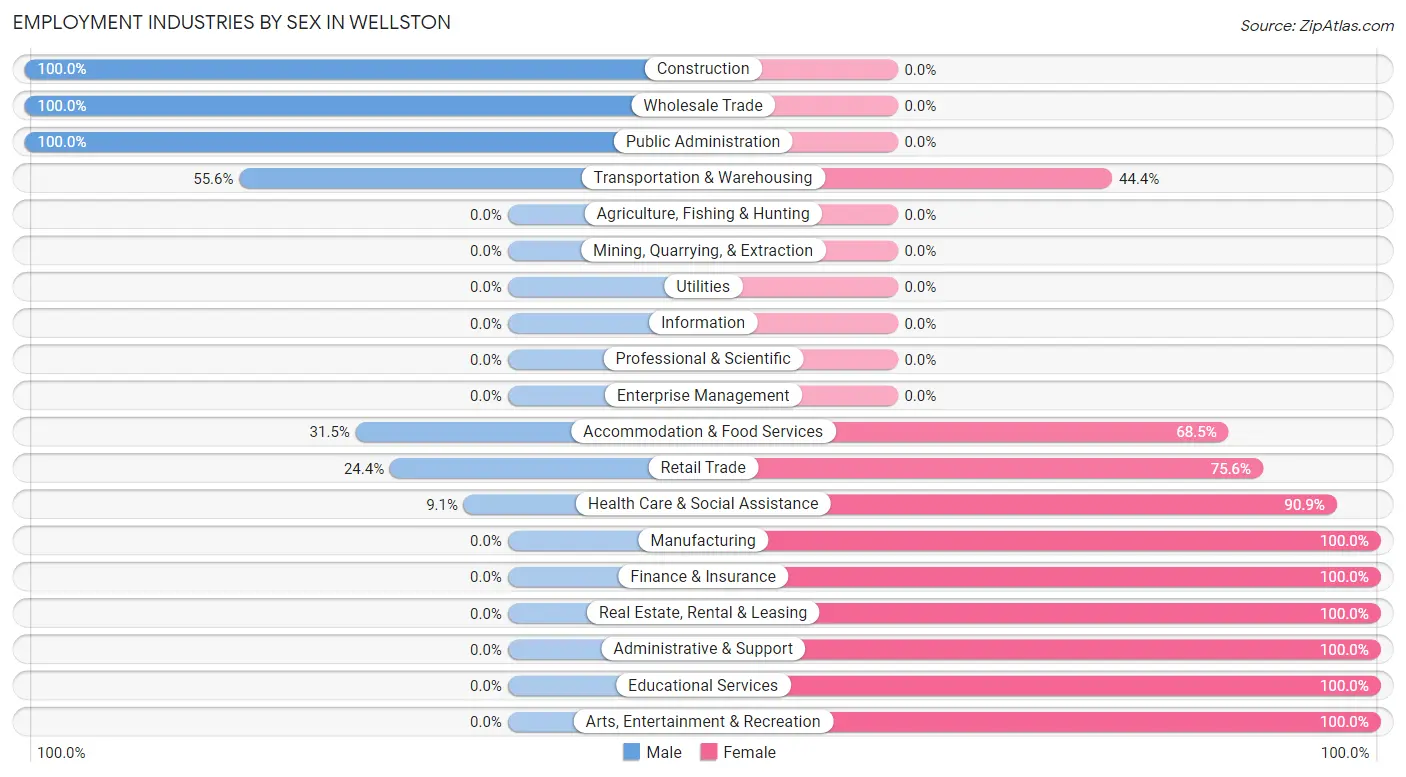
| Industry | Male | Female |
| Agriculture, Fishing & Hunting | 0 (0.0%) | 0 (0.0%) |
| Mining, Quarrying, & Extraction | 0 (0.0%) | 0 (0.0%) |
| Construction | 22 (100.0%) | 0 (0.0%) |
| Manufacturing | 0 (0.0%) | 23 (100.0%) |
| Wholesale Trade | 89 (100.0%) | 0 (0.0%) |
| Retail Trade | 29 (24.4%) | 90 (75.6%) |
| Transportation & Warehousing | 20 (55.6%) | 16 (44.4%) |
| Utilities | 0 (0.0%) | 0 (0.0%) |
| Information | 0 (0.0%) | 0 (0.0%) |
| Finance & Insurance | 0 (0.0%) | 29 (100.0%) |
| Real Estate, Rental & Leasing | 0 (0.0%) | 5 (100.0%) |
| Professional & Scientific | 0 (0.0%) | 0 (0.0%) |
| Enterprise Management | 0 (0.0%) | 0 (0.0%) |
| Administrative & Support | 0 (0.0%) | 61 (100.0%) |
| Educational Services | 0 (0.0%) | 28 (100.0%) |
| Health Care & Social Assistance | 32 (9.1%) | 320 (90.9%) |
| Arts, Entertainment & Recreation | 0 (0.0%) | 2 (100.0%) |
| Accommodation & Food Services | 17 (31.5%) | 37 (68.5%) |
| Public Administration | 36 (100.0%) | 0 (0.0%) |
| Total | 245 (28.2%) | 623 (71.8%) |
Education in Wellston
School Enrollment in Wellston
The most common levels of schooling among the 484 students in Wellston are elementary school (152 | 31.4%), middle school (144 | 29.7%), and high school (95 | 19.6%).
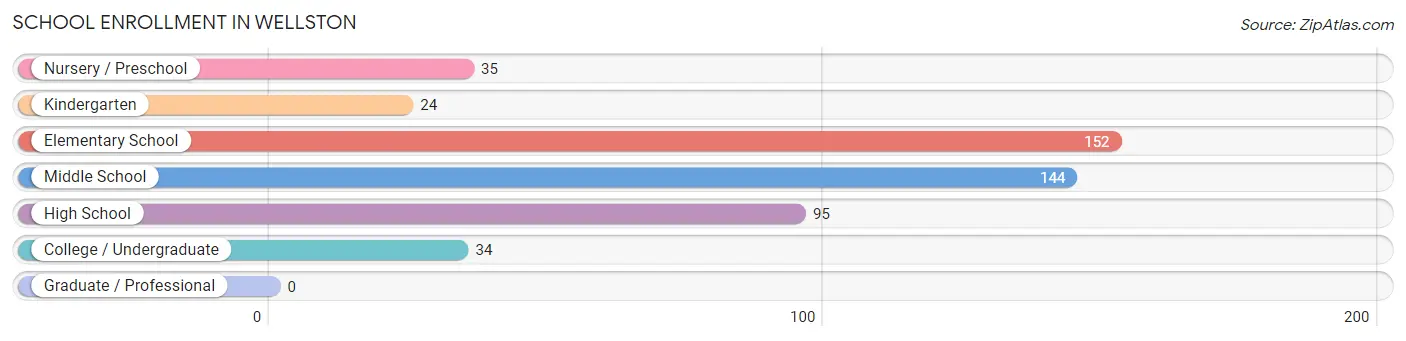
| School Level | # Students | % Students |
| Nursery / Preschool | 35 | 7.2% |
| Kindergarten | 24 | 5.0% |
| Elementary School | 152 | 31.4% |
| Middle School | 144 | 29.7% |
| High School | 95 | 19.6% |
| College / Undergraduate | 34 | 7.0% |
| Graduate / Professional | 0 | 0.0% |
| Total | 484 | 100.0% |
School Enrollment by Age by Funding Source in Wellston
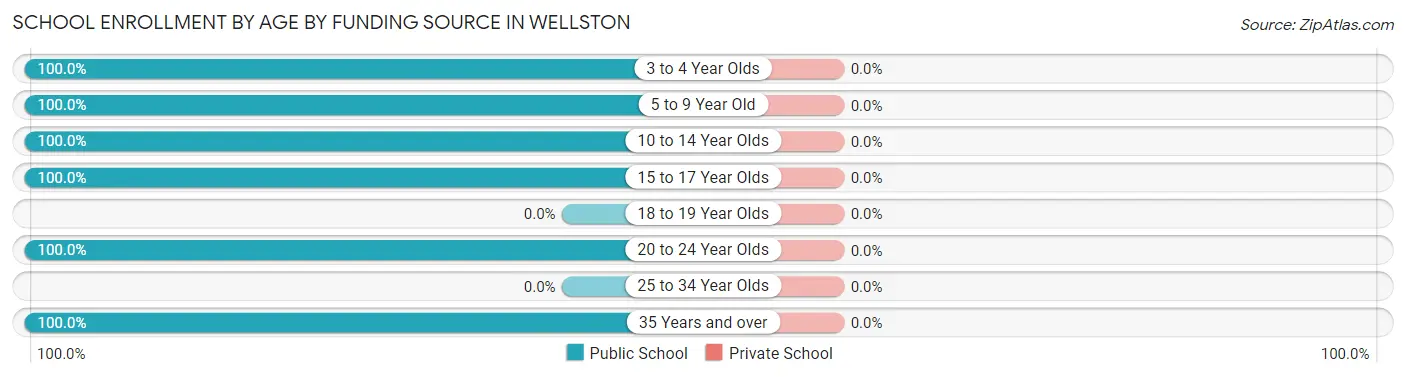
| Age Bracket | Public School | Private School |
| 3 to 4 Year Olds | 35 (100.0%) | 0 (0.0%) |
| 5 to 9 Year Old | 141 (100.0%) | 0 (0.0%) |
| 10 to 14 Year Olds | 170 (100.0%) | 0 (0.0%) |
| 15 to 17 Year Olds | 104 (100.0%) | 0 (0.0%) |
| 18 to 19 Year Olds | 0 (0.0%) | 0 (0.0%) |
| 20 to 24 Year Olds | 10 (100.0%) | 0 (0.0%) |
| 25 to 34 Year Olds | 0 (0.0%) | 0 (0.0%) |
| 35 Years and over | 24 (100.0%) | 0 (0.0%) |
| Total | 484 (100.0%) | 0 (0.0%) |
Educational Attainment by Field of Study in Wellston
Computers & mathematics (82 | 78.1%), liberal arts & history (17 | 16.2%), and arts & humanities (6 | 5.7%) are the most common fields of study among 105 individuals in Wellston who have obtained a bachelor's degree or higher.
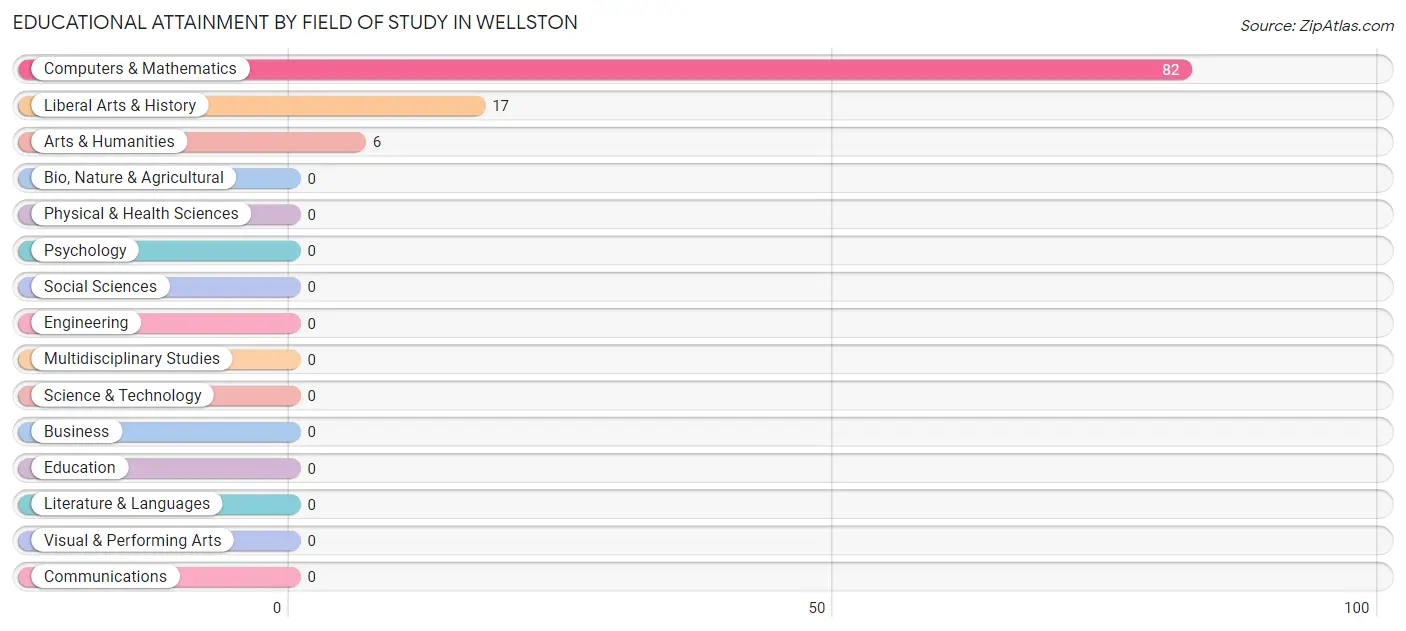
| Field of Study | # Graduates | % Graduates |
| Computers & Mathematics | 82 | 78.1% |
| Bio, Nature & Agricultural | 0 | 0.0% |
| Physical & Health Sciences | 0 | 0.0% |
| Psychology | 0 | 0.0% |
| Social Sciences | 0 | 0.0% |
| Engineering | 0 | 0.0% |
| Multidisciplinary Studies | 0 | 0.0% |
| Science & Technology | 0 | 0.0% |
| Business | 0 | 0.0% |
| Education | 0 | 0.0% |
| Literature & Languages | 0 | 0.0% |
| Liberal Arts & History | 17 | 16.2% |
| Visual & Performing Arts | 0 | 0.0% |
| Communications | 0 | 0.0% |
| Arts & Humanities | 6 | 5.7% |
| Total | 105 | 100.0% |
Transportation & Commute in Wellston
Vehicle Availability by Sex in Wellston
The most prevalent vehicle ownership categories in Wellston are males with 1 vehicle (110, accounting for 44.9%) and females with 1 vehicle (153, making up 18.6%).
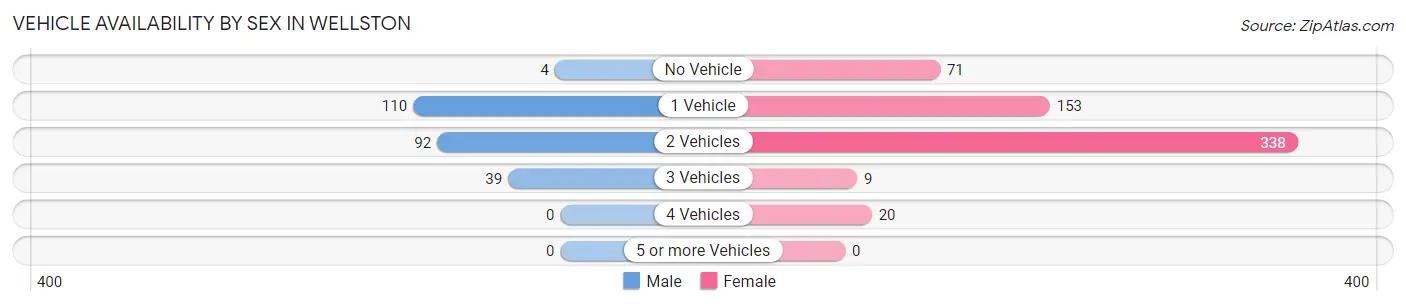
| Vehicles Available | Male | Female |
| No Vehicle | 4 (1.6%) | 71 (12.0%) |
| 1 Vehicle | 110 (44.9%) | 153 (25.9%) |
| 2 Vehicles | 92 (37.6%) | 338 (57.2%) |
| 3 Vehicles | 39 (15.9%) | 9 (1.5%) |
| 4 Vehicles | 0 (0.0%) | 20 (3.4%) |
| 5 or more Vehicles | 0 (0.0%) | 0 (0.0%) |
| Total | 245 (100.0%) | 591 (100.0%) |
Commute Time in Wellston
The most frequently occuring commute durations in Wellston are 20 to 24 minutes (327 commuters, 40.7%), 10 to 14 minutes (194 commuters, 24.2%), and 30 to 34 minutes (107 commuters, 13.3%).
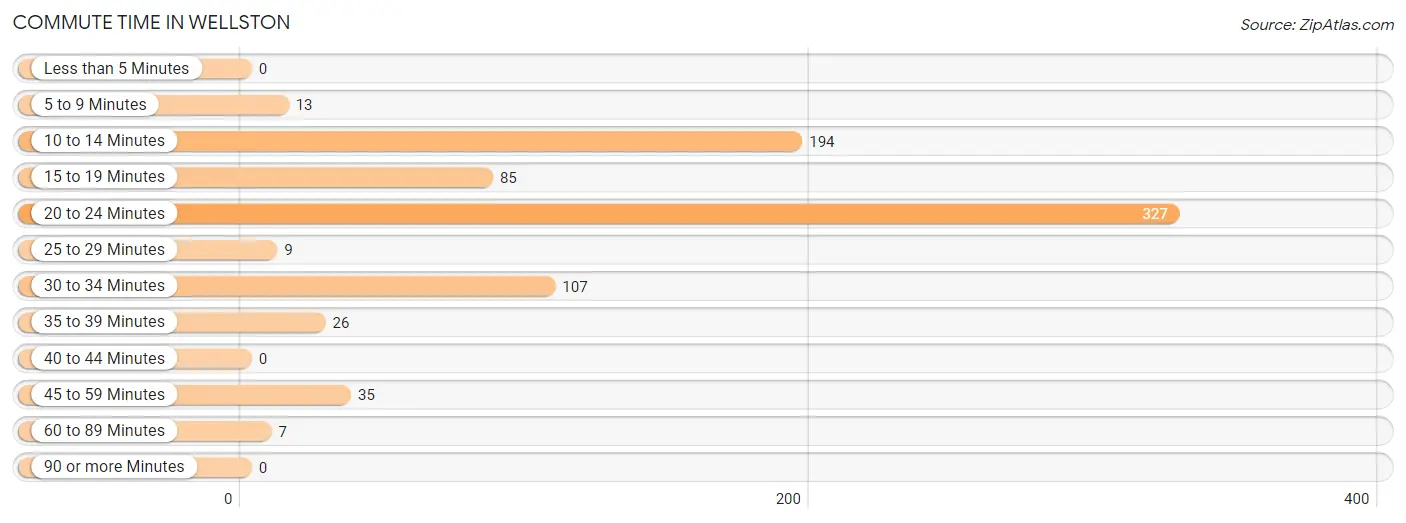
| Commute Time | # Commuters | % Commuters |
| Less than 5 Minutes | 0 | 0.0% |
| 5 to 9 Minutes | 13 | 1.6% |
| 10 to 14 Minutes | 194 | 24.2% |
| 15 to 19 Minutes | 85 | 10.6% |
| 20 to 24 Minutes | 327 | 40.7% |
| 25 to 29 Minutes | 9 | 1.1% |
| 30 to 34 Minutes | 107 | 13.3% |
| 35 to 39 Minutes | 26 | 3.2% |
| 40 to 44 Minutes | 0 | 0.0% |
| 45 to 59 Minutes | 35 | 4.4% |
| 60 to 89 Minutes | 7 | 0.9% |
| 90 or more Minutes | 0 | 0.0% |
Commute Time by Sex in Wellston
The most common commute times in Wellston are 20 to 24 minutes (162 commuters, 66.1%) for males and 10 to 14 minutes (188 commuters, 33.7%) for females.
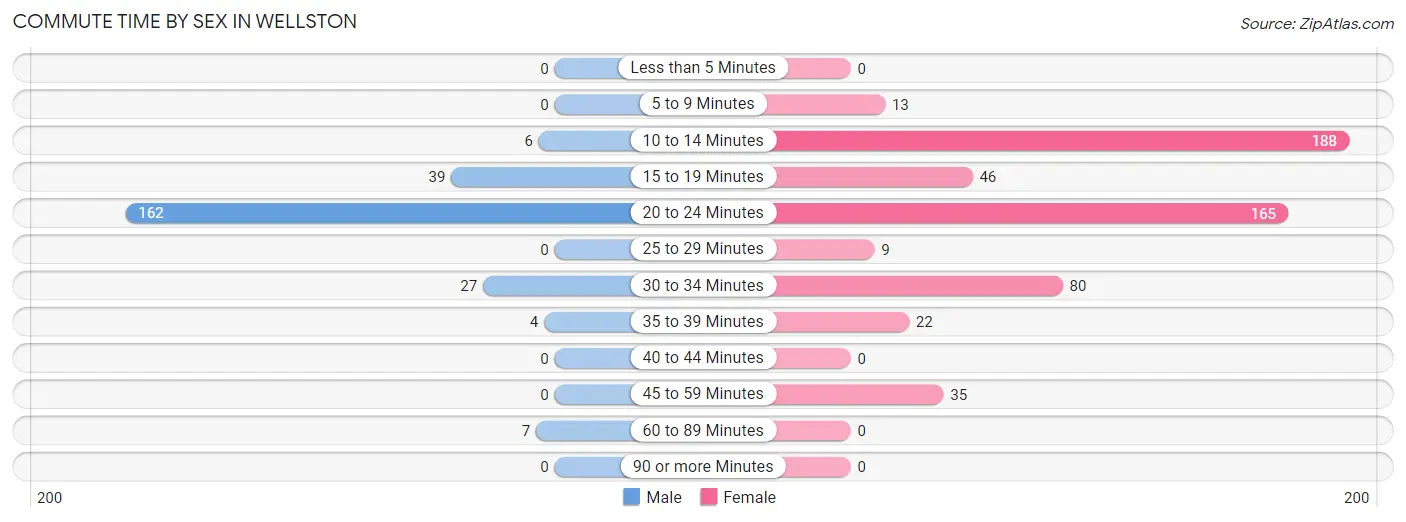
| Commute Time | Male | Female |
| Less than 5 Minutes | 0 (0.0%) | 0 (0.0%) |
| 5 to 9 Minutes | 0 (0.0%) | 13 (2.3%) |
| 10 to 14 Minutes | 6 (2.5%) | 188 (33.7%) |
| 15 to 19 Minutes | 39 (15.9%) | 46 (8.2%) |
| 20 to 24 Minutes | 162 (66.1%) | 165 (29.6%) |
| 25 to 29 Minutes | 0 (0.0%) | 9 (1.6%) |
| 30 to 34 Minutes | 27 (11.0%) | 80 (14.3%) |
| 35 to 39 Minutes | 4 (1.6%) | 22 (3.9%) |
| 40 to 44 Minutes | 0 (0.0%) | 0 (0.0%) |
| 45 to 59 Minutes | 0 (0.0%) | 35 (6.3%) |
| 60 to 89 Minutes | 7 (2.9%) | 0 (0.0%) |
| 90 or more Minutes | 0 (0.0%) | 0 (0.0%) |
Time of Departure to Work by Sex in Wellston
The most frequent times of departure to work in Wellston are 7:30 AM to 7:59 AM (119, 48.6%) for males and 7:30 AM to 7:59 AM (133, 23.8%) for females.
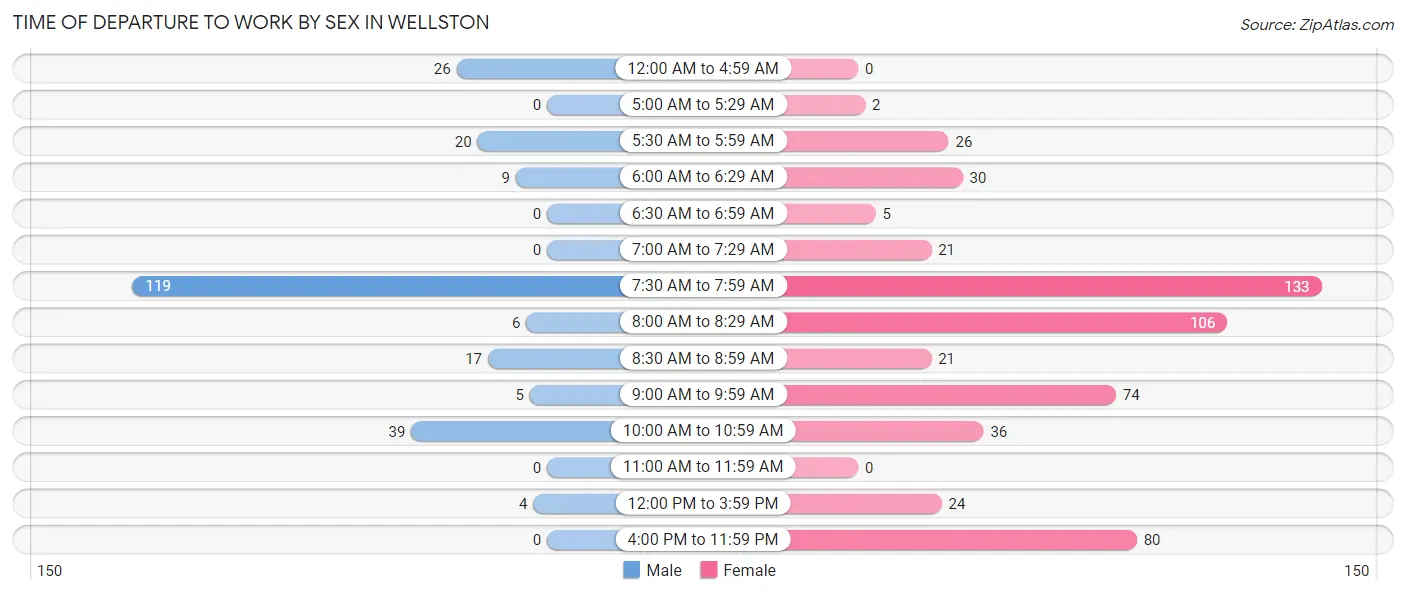
| Time of Departure | Male | Female |
| 12:00 AM to 4:59 AM | 26 (10.6%) | 0 (0.0%) |
| 5:00 AM to 5:29 AM | 0 (0.0%) | 2 (0.4%) |
| 5:30 AM to 5:59 AM | 20 (8.2%) | 26 (4.7%) |
| 6:00 AM to 6:29 AM | 9 (3.7%) | 30 (5.4%) |
| 6:30 AM to 6:59 AM | 0 (0.0%) | 5 (0.9%) |
| 7:00 AM to 7:29 AM | 0 (0.0%) | 21 (3.8%) |
| 7:30 AM to 7:59 AM | 119 (48.6%) | 133 (23.8%) |
| 8:00 AM to 8:29 AM | 6 (2.5%) | 106 (19.0%) |
| 8:30 AM to 8:59 AM | 17 (6.9%) | 21 (3.8%) |
| 9:00 AM to 9:59 AM | 5 (2.0%) | 74 (13.3%) |
| 10:00 AM to 10:59 AM | 39 (15.9%) | 36 (6.5%) |
| 11:00 AM to 11:59 AM | 0 (0.0%) | 0 (0.0%) |
| 12:00 PM to 3:59 PM | 4 (1.6%) | 24 (4.3%) |
| 4:00 PM to 11:59 PM | 0 (0.0%) | 80 (14.3%) |
| Total | 245 (100.0%) | 558 (100.0%) |
Housing Occupancy in Wellston
Occupancy by Ownership in Wellston
Of the total 776 dwellings in Wellston, owner-occupied units account for 377 (48.6%), while renter-occupied units make up 399 (51.4%).
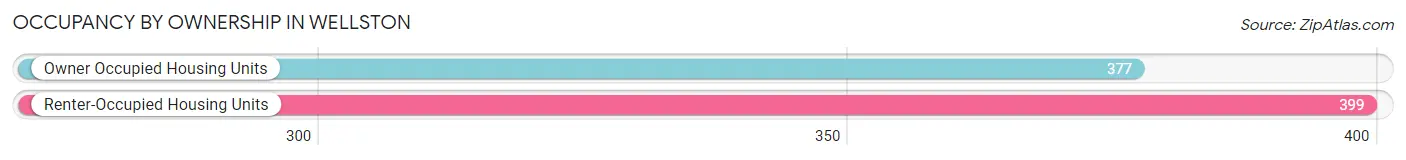
| Occupancy | # Housing Units | % Housing Units |
| Owner Occupied Housing Units | 377 | 48.6% |
| Renter-Occupied Housing Units | 399 | 51.4% |
| Total Occupied Housing Units | 776 | 100.0% |
Occupancy by Household Size in Wellston
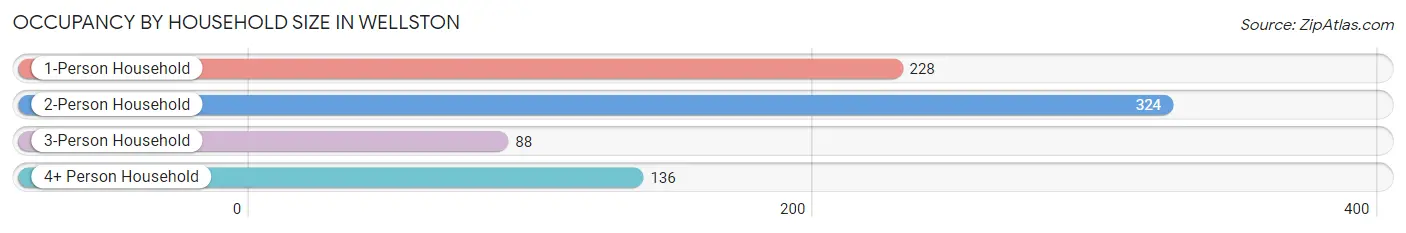
| Household Size | # Housing Units | % Housing Units |
| 1-Person Household | 228 | 29.4% |
| 2-Person Household | 324 | 41.7% |
| 3-Person Household | 88 | 11.3% |
| 4+ Person Household | 136 | 17.5% |
| Total Housing Units | 776 | 100.0% |
Occupancy by Ownership by Household Size in Wellston
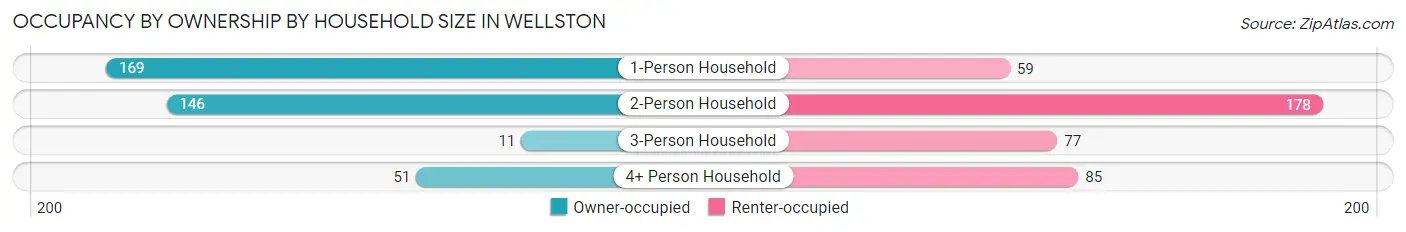
| Household Size | Owner-occupied | Renter-occupied |
| 1-Person Household | 169 (74.1%) | 59 (25.9%) |
| 2-Person Household | 146 (45.1%) | 178 (54.9%) |
| 3-Person Household | 11 (12.5%) | 77 (87.5%) |
| 4+ Person Household | 51 (37.5%) | 85 (62.5%) |
| Total Housing Units | 377 (48.6%) | 399 (51.4%) |
Occupancy by Educational Attainment in Wellston
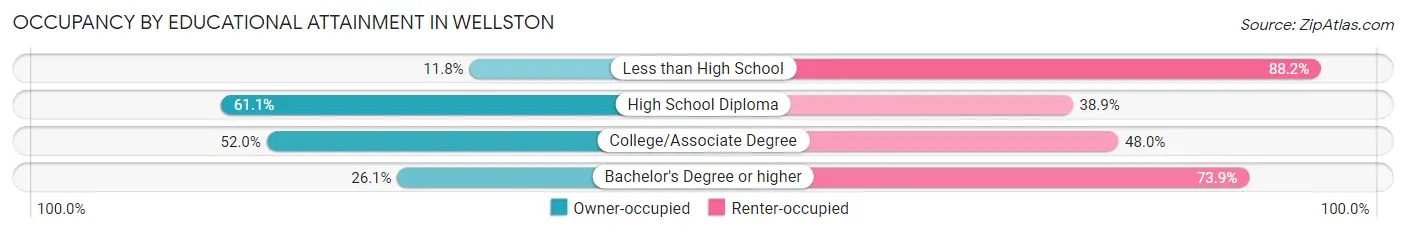
| Household Size | Owner-occupied | Renter-occupied |
| Less than High School | 17 (11.8%) | 127 (88.2%) |
| High School Diploma | 251 (61.1%) | 160 (38.9%) |
| College/Associate Degree | 103 (52.0%) | 95 (48.0%) |
| Bachelor's Degree or higher | 6 (26.1%) | 17 (73.9%) |
Occupancy by Age of Householder in Wellston
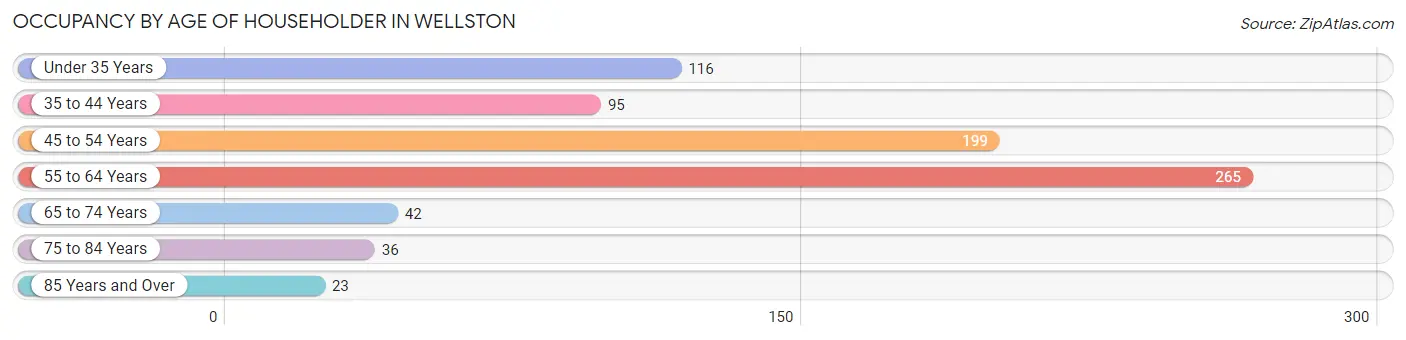
| Age Bracket | # Households | % Households |
| Under 35 Years | 116 | 14.9% |
| 35 to 44 Years | 95 | 12.2% |
| 45 to 54 Years | 199 | 25.6% |
| 55 to 64 Years | 265 | 34.2% |
| 65 to 74 Years | 42 | 5.4% |
| 75 to 84 Years | 36 | 4.6% |
| 85 Years and Over | 23 | 3.0% |
| Total | 776 | 100.0% |
Housing Finances in Wellston
Median Income by Occupancy in Wellston
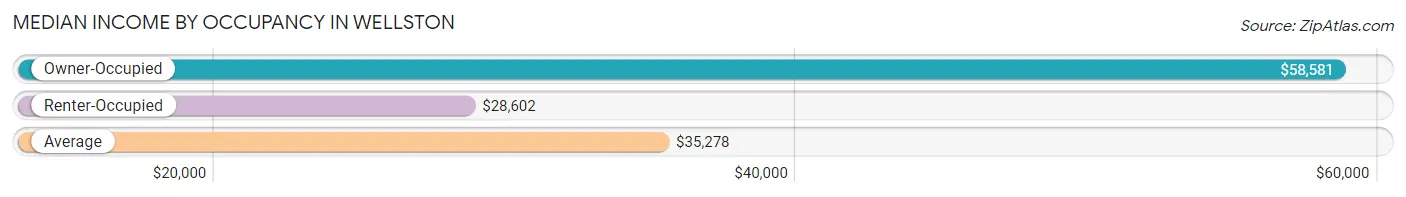
| Occupancy Type | # Households | Median Income |
| Owner-Occupied | 377 (48.6%) | $58,581 |
| Renter-Occupied | 399 (51.4%) | $28,602 |
| Average | 776 (100.0%) | $35,278 |
Occupancy by Householder Income Bracket in Wellston
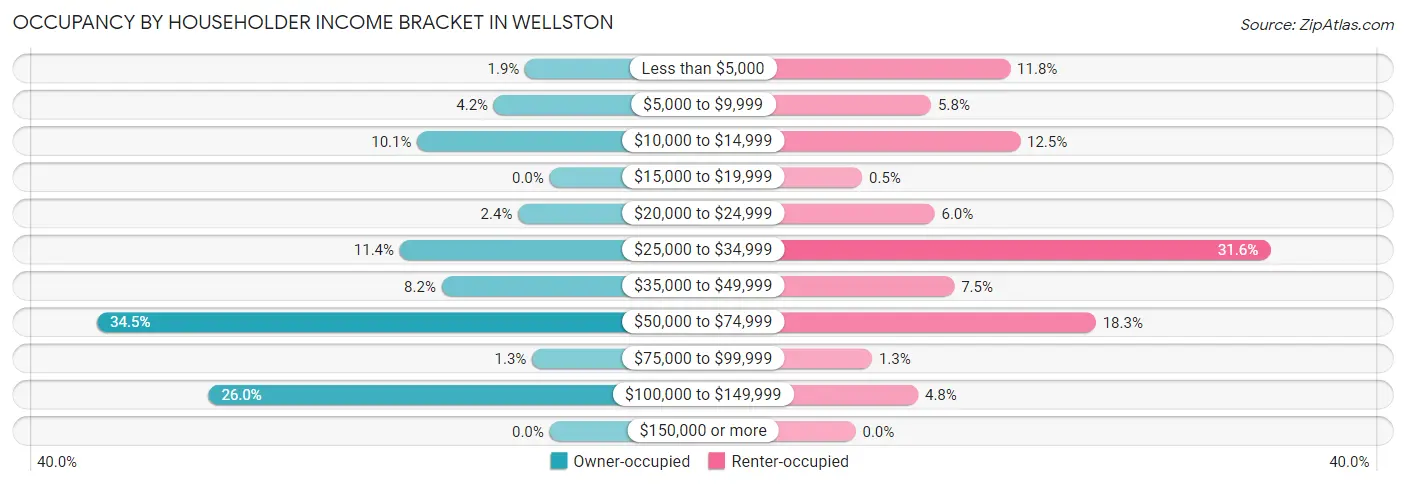
| Income Bracket | Owner-occupied | Renter-occupied |
| Less than $5,000 | 7 (1.9%) | 47 (11.8%) |
| $5,000 to $9,999 | 16 (4.2%) | 23 (5.8%) |
| $10,000 to $14,999 | 38 (10.1%) | 50 (12.5%) |
| $15,000 to $19,999 | 0 (0.0%) | 2 (0.5%) |
| $20,000 to $24,999 | 9 (2.4%) | 24 (6.0%) |
| $25,000 to $34,999 | 43 (11.4%) | 126 (31.6%) |
| $35,000 to $49,999 | 31 (8.2%) | 30 (7.5%) |
| $50,000 to $74,999 | 130 (34.5%) | 73 (18.3%) |
| $75,000 to $99,999 | 5 (1.3%) | 5 (1.3%) |
| $100,000 to $149,999 | 98 (26.0%) | 19 (4.8%) |
| $150,000 or more | 0 (0.0%) | 0 (0.0%) |
| Total | 377 (100.0%) | 399 (100.0%) |
Monthly Housing Cost Tiers in Wellston
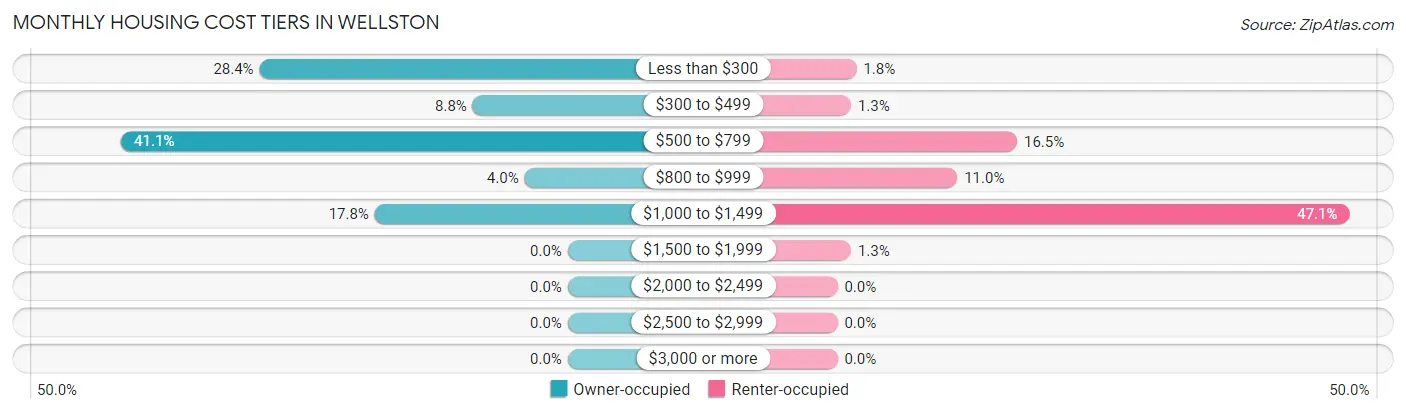
| Monthly Cost | Owner-occupied | Renter-occupied |
| Less than $300 | 107 (28.4%) | 7 (1.8%) |
| $300 to $499 | 33 (8.7%) | 5 (1.3%) |
| $500 to $799 | 155 (41.1%) | 66 (16.5%) |
| $800 to $999 | 15 (4.0%) | 44 (11.0%) |
| $1,000 to $1,499 | 67 (17.8%) | 188 (47.1%) |
| $1,500 to $1,999 | 0 (0.0%) | 5 (1.3%) |
| $2,000 to $2,499 | 0 (0.0%) | 0 (0.0%) |
| $2,500 to $2,999 | 0 (0.0%) | 0 (0.0%) |
| $3,000 or more | 0 (0.0%) | 0 (0.0%) |
| Total | 377 (100.0%) | 399 (100.0%) |
Physical Housing Characteristics in Wellston
Housing Structures in Wellston
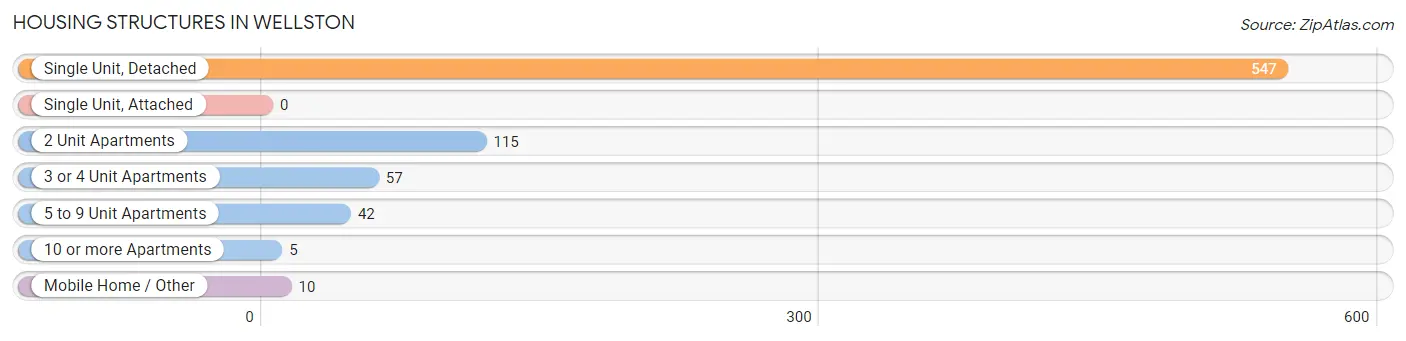
| Structure Type | # Housing Units | % Housing Units |
| Single Unit, Detached | 547 | 70.5% |
| Single Unit, Attached | 0 | 0.0% |
| 2 Unit Apartments | 115 | 14.8% |
| 3 or 4 Unit Apartments | 57 | 7.3% |
| 5 to 9 Unit Apartments | 42 | 5.4% |
| 10 or more Apartments | 5 | 0.6% |
| Mobile Home / Other | 10 | 1.3% |
| Total | 776 | 100.0% |
Housing Structures by Occupancy in Wellston
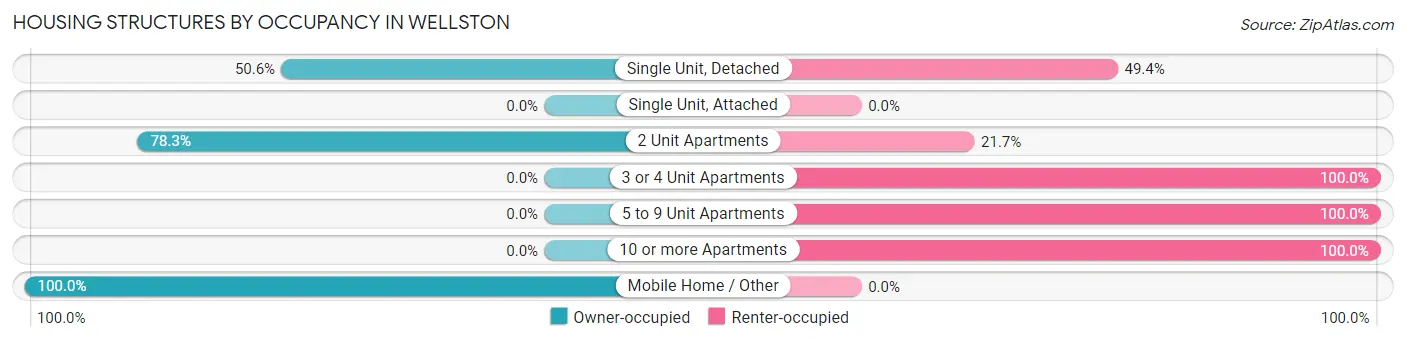
| Structure Type | Owner-occupied | Renter-occupied |
| Single Unit, Detached | 277 (50.6%) | 270 (49.4%) |
| Single Unit, Attached | 0 (0.0%) | 0 (0.0%) |
| 2 Unit Apartments | 90 (78.3%) | 25 (21.7%) |
| 3 or 4 Unit Apartments | 0 (0.0%) | 57 (100.0%) |
| 5 to 9 Unit Apartments | 0 (0.0%) | 42 (100.0%) |
| 10 or more Apartments | 0 (0.0%) | 5 (100.0%) |
| Mobile Home / Other | 10 (100.0%) | 0 (0.0%) |
| Total | 377 (48.6%) | 399 (51.4%) |
Housing Structures by Number of Rooms in Wellston
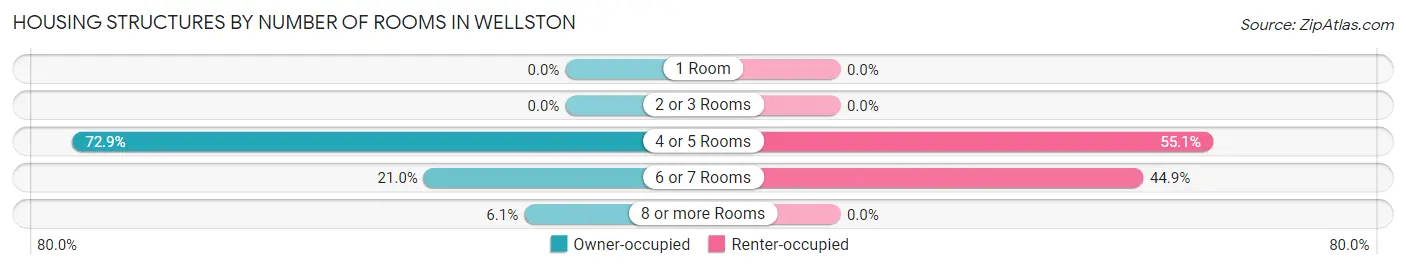
| Number of Rooms | Owner-occupied | Renter-occupied |
| 1 Room | 0 (0.0%) | 0 (0.0%) |
| 2 or 3 Rooms | 0 (0.0%) | 0 (0.0%) |
| 4 or 5 Rooms | 275 (72.9%) | 220 (55.1%) |
| 6 or 7 Rooms | 79 (20.9%) | 179 (44.9%) |
| 8 or more Rooms | 23 (6.1%) | 0 (0.0%) |
| Total | 377 (100.0%) | 399 (100.0%) |
Housing Structure by Heating Type in Wellston
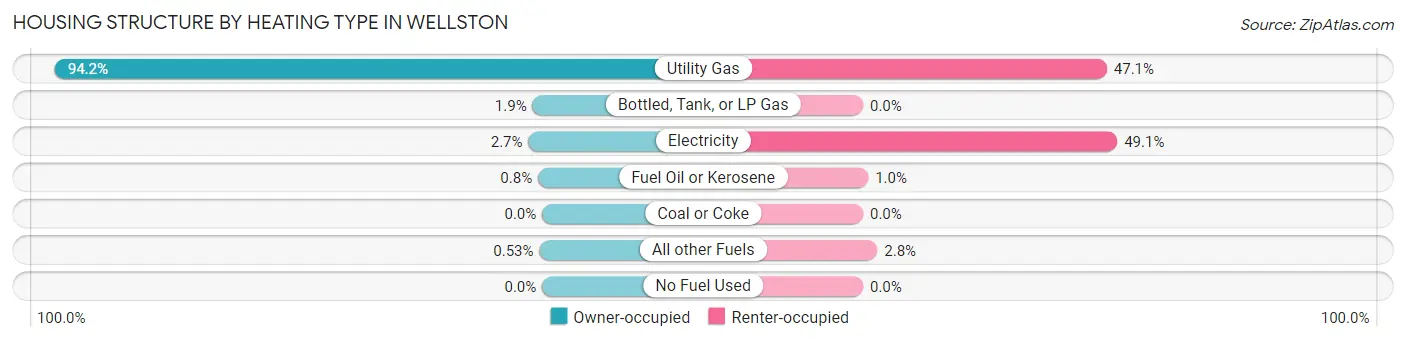
| Heating Type | Owner-occupied | Renter-occupied |
| Utility Gas | 355 (94.2%) | 188 (47.1%) |
| Bottled, Tank, or LP Gas | 7 (1.9%) | 0 (0.0%) |
| Electricity | 10 (2.6%) | 196 (49.1%) |
| Fuel Oil or Kerosene | 3 (0.8%) | 4 (1.0%) |
| Coal or Coke | 0 (0.0%) | 0 (0.0%) |
| All other Fuels | 2 (0.5%) | 11 (2.8%) |
| No Fuel Used | 0 (0.0%) | 0 (0.0%) |
| Total | 377 (100.0%) | 399 (100.0%) |
Household Vehicle Usage in Wellston
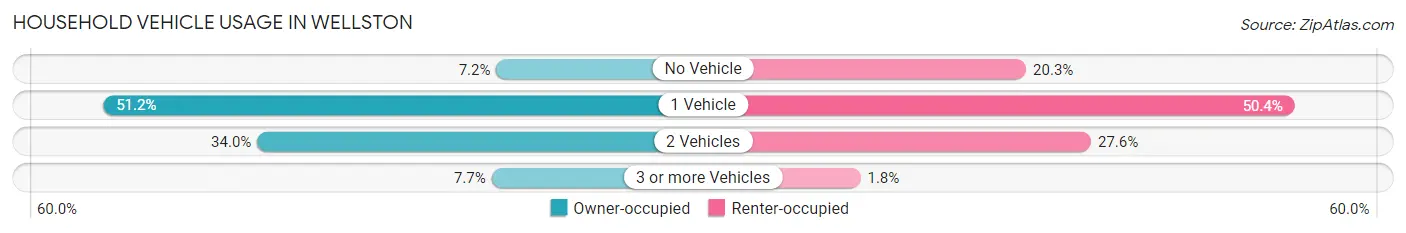
| Vehicles per Household | Owner-occupied | Renter-occupied |
| No Vehicle | 27 (7.2%) | 81 (20.3%) |
| 1 Vehicle | 193 (51.2%) | 201 (50.4%) |
| 2 Vehicles | 128 (34.0%) | 110 (27.6%) |
| 3 or more Vehicles | 29 (7.7%) | 7 (1.8%) |
| Total | 377 (100.0%) | 399 (100.0%) |
Real Estate & Mortgages in Wellston
Real Estate and Mortgage Overview in Wellston
| Characteristic | Without Mortgage | With Mortgage |
| Housing Units | 295 | 82 |
| Median Property Value | - | - |
| Median Household Income | $59,480 | $0 |
| Monthly Housing Costs | $550 | $0 |
| Real Estate Taxes | $717 | $7 |
Property Value by Mortgage Status in Wellston
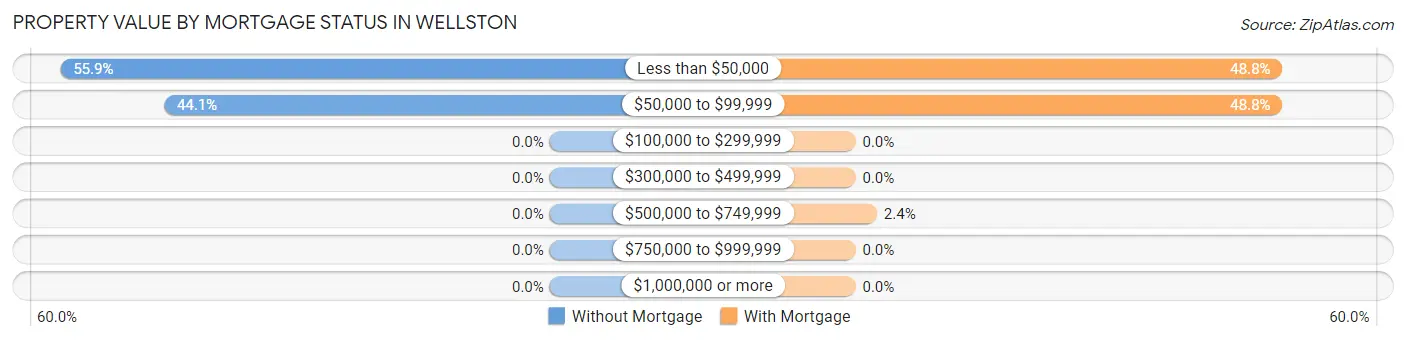
| Property Value | Without Mortgage | With Mortgage |
| Less than $50,000 | 165 (55.9%) | 40 (48.8%) |
| $50,000 to $99,999 | 130 (44.1%) | 40 (48.8%) |
| $100,000 to $299,999 | 0 (0.0%) | 0 (0.0%) |
| $300,000 to $499,999 | 0 (0.0%) | 0 (0.0%) |
| $500,000 to $749,999 | 0 (0.0%) | 2 (2.4%) |
| $750,000 to $999,999 | 0 (0.0%) | 0 (0.0%) |
| $1,000,000 or more | 0 (0.0%) | 0 (0.0%) |
| Total | 295 (100.0%) | 82 (100.0%) |
Household Income by Mortgage Status in Wellston
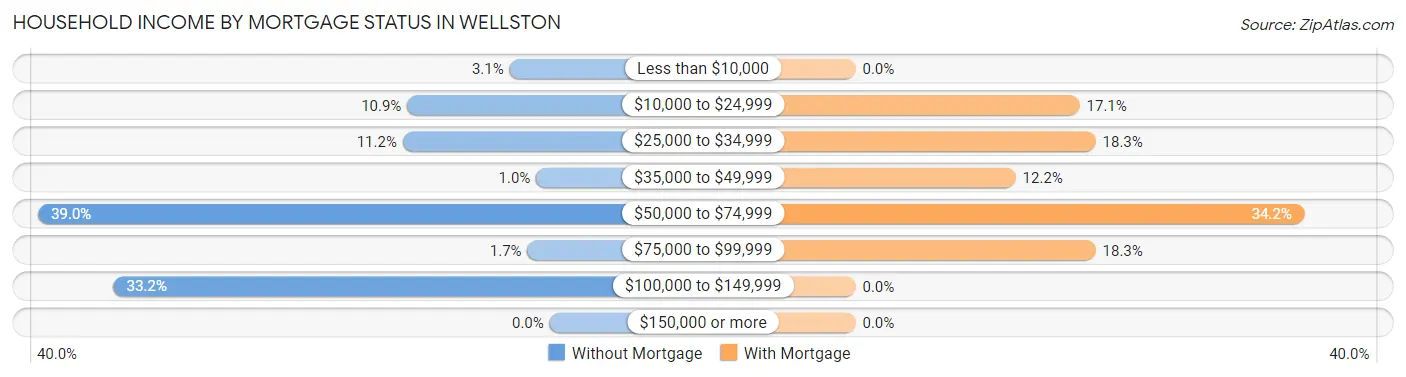
| Household Income | Without Mortgage | With Mortgage |
| Less than $10,000 | 9 (3.0%) | 0 (0.0%) |
| $10,000 to $24,999 | 32 (10.8%) | 14 (17.1%) |
| $25,000 to $34,999 | 33 (11.2%) | 15 (18.3%) |
| $35,000 to $49,999 | 3 (1.0%) | 10 (12.2%) |
| $50,000 to $74,999 | 115 (39.0%) | 28 (34.2%) |
| $75,000 to $99,999 | 5 (1.7%) | 15 (18.3%) |
| $100,000 to $149,999 | 98 (33.2%) | 0 (0.0%) |
| $150,000 or more | 0 (0.0%) | 0 (0.0%) |
| Total | 295 (100.0%) | 82 (100.0%) |
Property Value to Household Income Ratio in Wellston
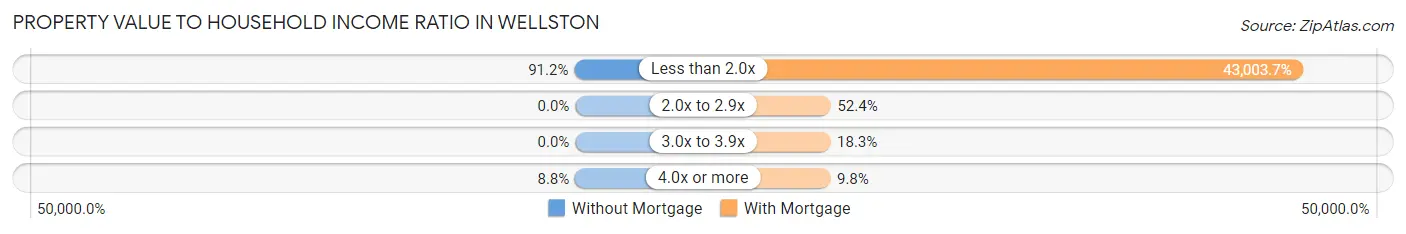
| Value-to-Income Ratio | Without Mortgage | With Mortgage |
| Less than 2.0x | 269 (91.2%) | 35,263 (43,003.7%) |
| 2.0x to 2.9x | 0 (0.0%) | 43 (52.4%) |
| 3.0x to 3.9x | 0 (0.0%) | 15 (18.3%) |
| 4.0x or more | 26 (8.8%) | 8 (9.8%) |
| Total | 295 (100.0%) | 82 (100.0%) |
Real Estate Taxes by Mortgage Status in Wellston
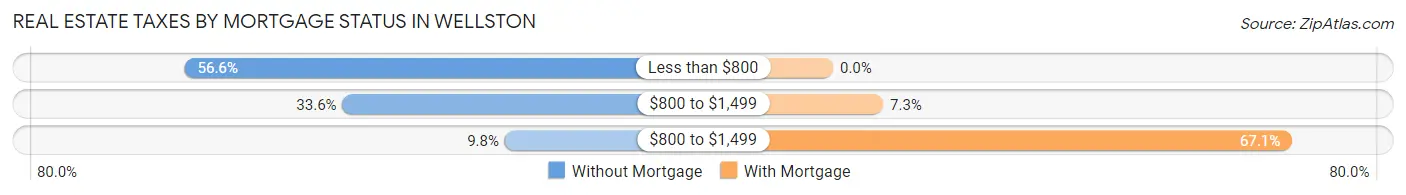
| Property Taxes | Without Mortgage | With Mortgage |
| Less than $800 | 167 (56.6%) | 0 (0.0%) |
| $800 to $1,499 | 99 (33.6%) | 6 (7.3%) |
| $800 to $1,499 | 29 (9.8%) | 55 (67.1%) |
| Total | 295 (100.0%) | 82 (100.0%) |
Health & Disability in Wellston
Health Insurance Coverage by Age in Wellston
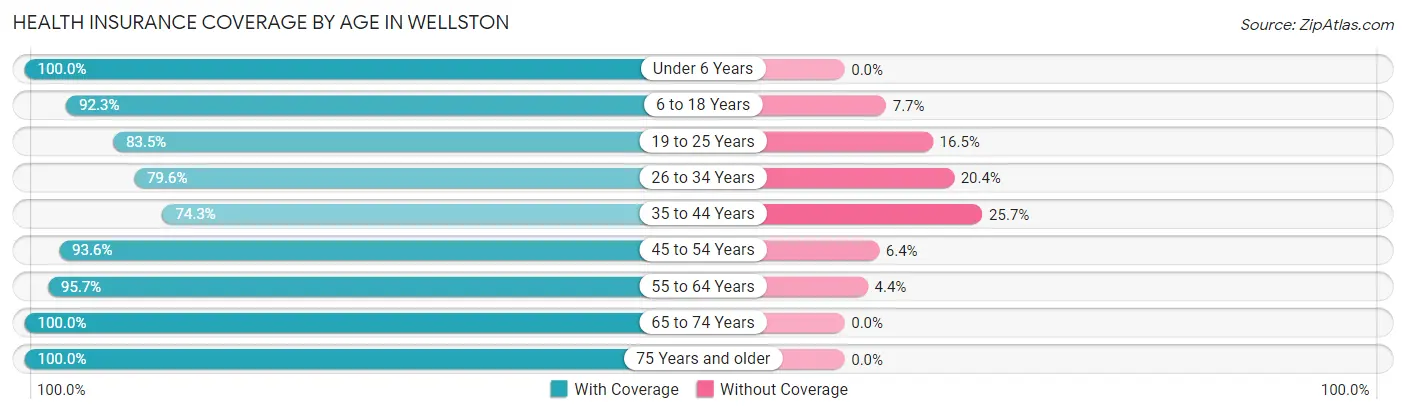
| Age Bracket | With Coverage | Without Coverage |
| Under 6 Years | 135 (100.0%) | 0 (0.0%) |
| 6 to 18 Years | 405 (92.3%) | 34 (7.7%) |
| 19 to 25 Years | 76 (83.5%) | 15 (16.5%) |
| 26 to 34 Years | 238 (79.6%) | 61 (20.4%) |
| 35 to 44 Years | 156 (74.3%) | 54 (25.7%) |
| 45 to 54 Years | 218 (93.6%) | 15 (6.4%) |
| 55 to 64 Years | 352 (95.7%) | 16 (4.3%) |
| 65 to 74 Years | 77 (100.0%) | 0 (0.0%) |
| 75 Years and older | 61 (100.0%) | 0 (0.0%) |
| Total | 1,718 (89.8%) | 195 (10.2%) |
Health Insurance Coverage by Citizenship Status in Wellston
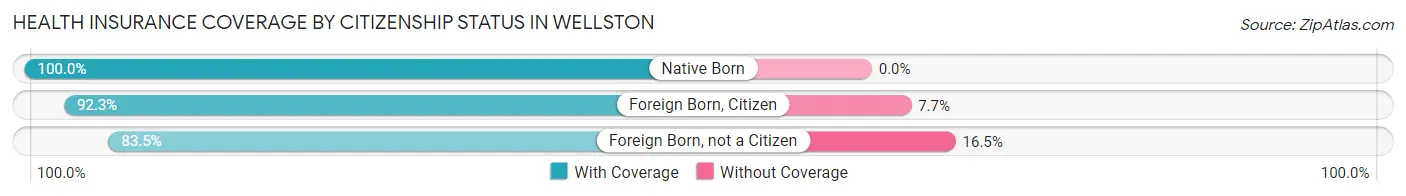
| Citizenship Status | With Coverage | Without Coverage |
| Native Born | 135 (100.0%) | 0 (0.0%) |
| Foreign Born, Citizen | 405 (92.3%) | 34 (7.7%) |
| Foreign Born, not a Citizen | 76 (83.5%) | 15 (16.5%) |
Health Insurance Coverage by Household Income in Wellston
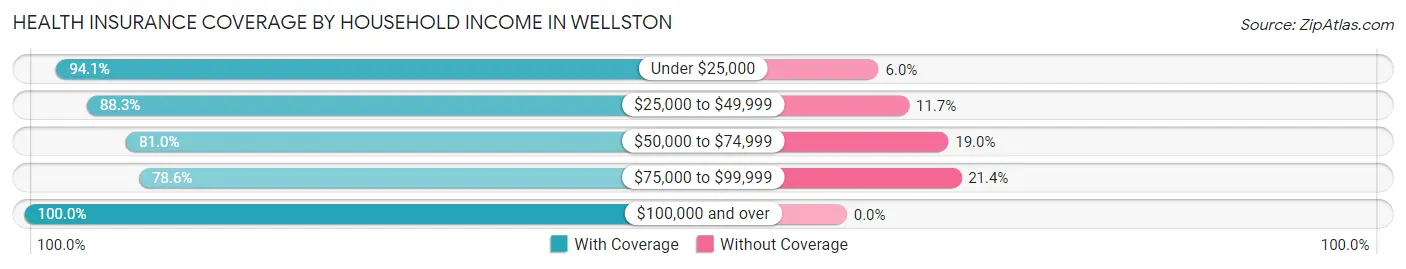
| Household Income | With Coverage | Without Coverage |
| Under $25,000 | 569 (94.1%) | 36 (5.9%) |
| $25,000 to $49,999 | 484 (88.3%) | 64 (11.7%) |
| $50,000 to $74,999 | 379 (81.0%) | 89 (19.0%) |
| $75,000 to $99,999 | 22 (78.6%) | 6 (21.4%) |
| $100,000 and over | 264 (100.0%) | 0 (0.0%) |
Public vs Private Health Insurance Coverage by Age in Wellston
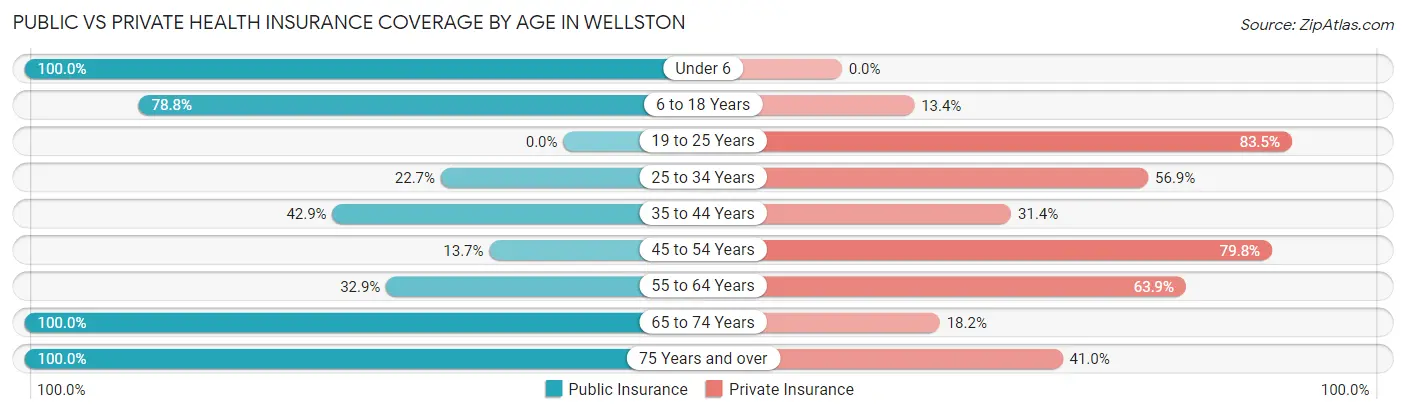
| Age Bracket | Public Insurance | Private Insurance |
| Under 6 | 135 (100.0%) | 0 (0.0%) |
| 6 to 18 Years | 346 (78.8%) | 59 (13.4%) |
| 19 to 25 Years | 0 (0.0%) | 76 (83.5%) |
| 25 to 34 Years | 68 (22.7%) | 170 (56.9%) |
| 35 to 44 Years | 90 (42.9%) | 66 (31.4%) |
| 45 to 54 Years | 32 (13.7%) | 186 (79.8%) |
| 55 to 64 Years | 121 (32.9%) | 235 (63.9%) |
| 65 to 74 Years | 77 (100.0%) | 14 (18.2%) |
| 75 Years and over | 61 (100.0%) | 25 (41.0%) |
| Total | 930 (48.6%) | 831 (43.4%) |
Disability Status by Sex by Age in Wellston
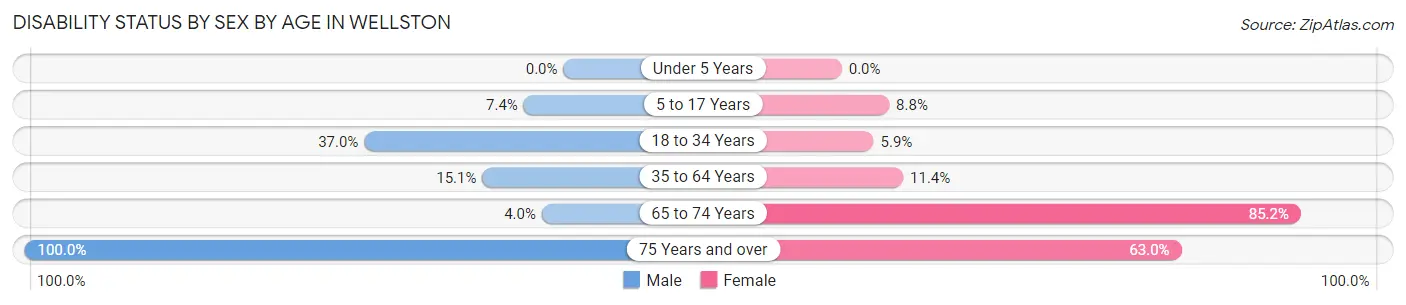
| Age Bracket | Male | Female |
| Under 5 Years | 0 (0.0%) | 0 (0.0%) |
| 5 to 17 Years | 14 (7.4%) | 24 (8.8%) |
| 18 to 34 Years | 44 (37.0%) | 16 (5.9%) |
| 35 to 64 Years | 48 (15.0%) | 56 (11.4%) |
| 65 to 74 Years | 2 (4.0%) | 23 (85.2%) |
| 75 Years and over | 15 (100.0%) | 29 (63.0%) |
Disability Class by Sex by Age in Wellston
Disability Class: Hearing Difficulty
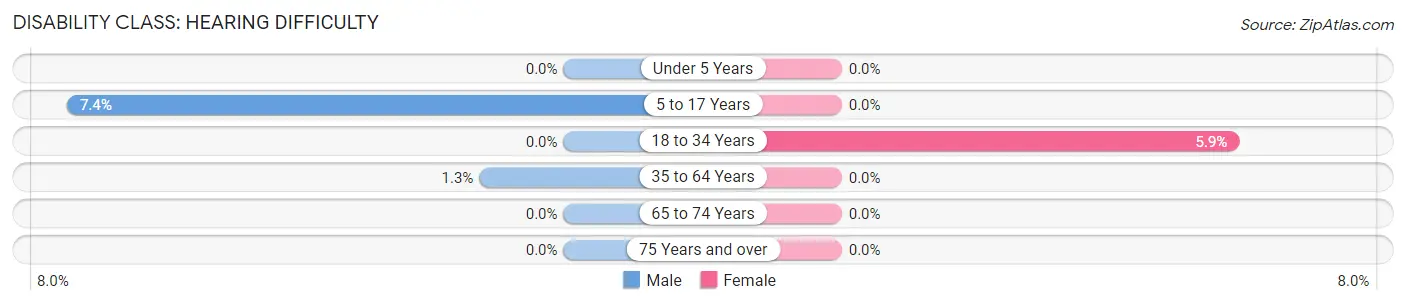
| Age Bracket | Male | Female |
| Under 5 Years | 0 (0.0%) | 0 (0.0%) |
| 5 to 17 Years | 14 (7.4%) | 0 (0.0%) |
| 18 to 34 Years | 0 (0.0%) | 16 (5.9%) |
| 35 to 64 Years | 4 (1.3%) | 0 (0.0%) |
| 65 to 74 Years | 0 (0.0%) | 0 (0.0%) |
| 75 Years and over | 0 (0.0%) | 0 (0.0%) |
Disability Class: Vision Difficulty
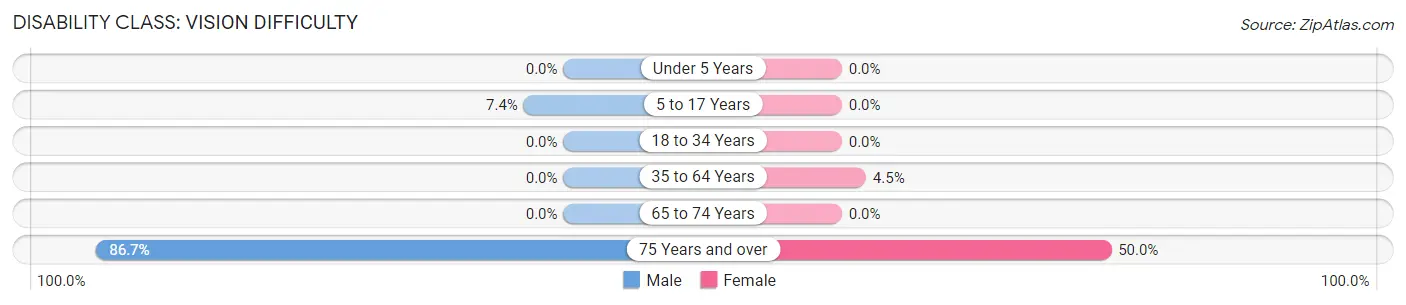
| Age Bracket | Male | Female |
| Under 5 Years | 0 (0.0%) | 0 (0.0%) |
| 5 to 17 Years | 14 (7.4%) | 0 (0.0%) |
| 18 to 34 Years | 0 (0.0%) | 0 (0.0%) |
| 35 to 64 Years | 0 (0.0%) | 22 (4.5%) |
| 65 to 74 Years | 0 (0.0%) | 0 (0.0%) |
| 75 Years and over | 13 (86.7%) | 23 (50.0%) |
Disability Class: Cognitive Difficulty
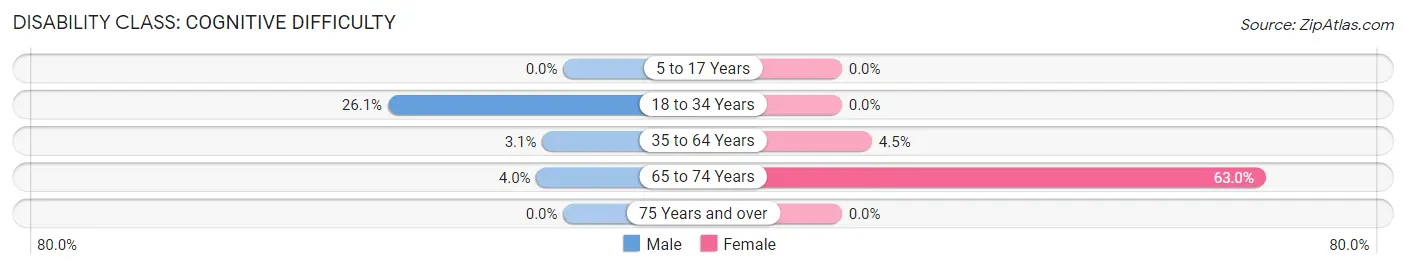
| Age Bracket | Male | Female |
| 5 to 17 Years | 0 (0.0%) | 0 (0.0%) |
| 18 to 34 Years | 31 (26.1%) | 0 (0.0%) |
| 35 to 64 Years | 10 (3.1%) | 22 (4.5%) |
| 65 to 74 Years | 2 (4.0%) | 17 (63.0%) |
| 75 Years and over | 0 (0.0%) | 0 (0.0%) |
Disability Class: Ambulatory Difficulty
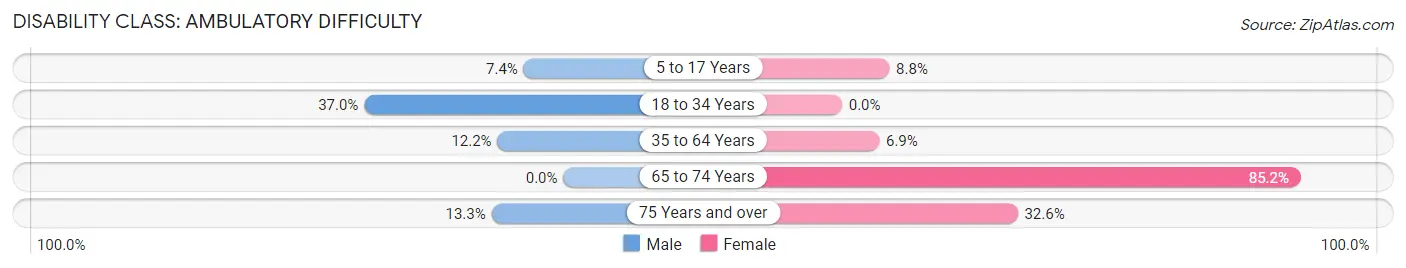
| Age Bracket | Male | Female |
| 5 to 17 Years | 14 (7.4%) | 24 (8.8%) |
| 18 to 34 Years | 44 (37.0%) | 0 (0.0%) |
| 35 to 64 Years | 39 (12.2%) | 34 (6.9%) |
| 65 to 74 Years | 0 (0.0%) | 23 (85.2%) |
| 75 Years and over | 2 (13.3%) | 15 (32.6%) |
Disability Class: Self-Care Difficulty
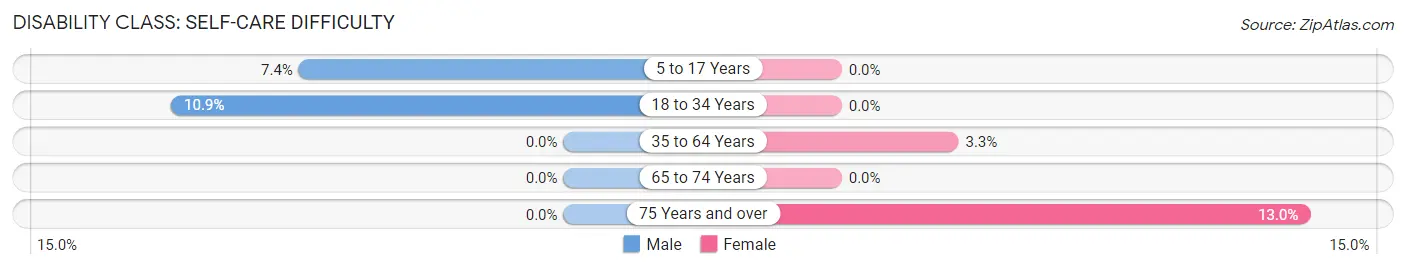
| Age Bracket | Male | Female |
| 5 to 17 Years | 14 (7.4%) | 0 (0.0%) |
| 18 to 34 Years | 13 (10.9%) | 0 (0.0%) |
| 35 to 64 Years | 0 (0.0%) | 16 (3.3%) |
| 65 to 74 Years | 0 (0.0%) | 0 (0.0%) |
| 75 Years and over | 0 (0.0%) | 6 (13.0%) |
Technology Access in Wellston
Computing Device Access in Wellston
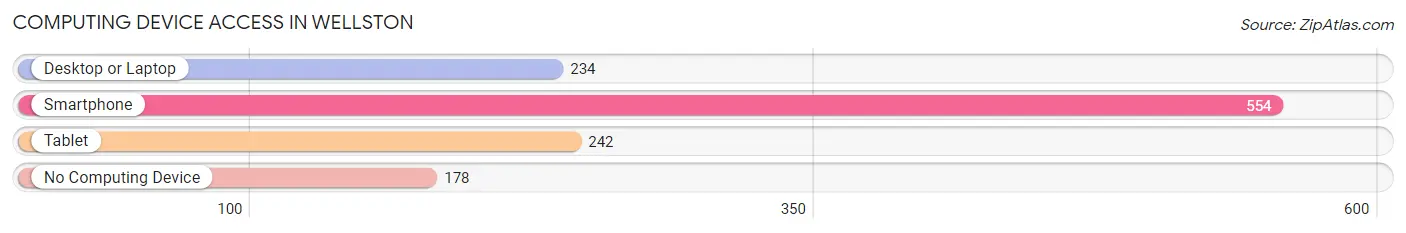
| Device Type | # Households | % Households |
| Desktop or Laptop | 234 | 30.1% |
| Smartphone | 554 | 71.4% |
| Tablet | 242 | 31.2% |
| No Computing Device | 178 | 22.9% |
| Total | 776 | 100.0% |
Internet Access in Wellston
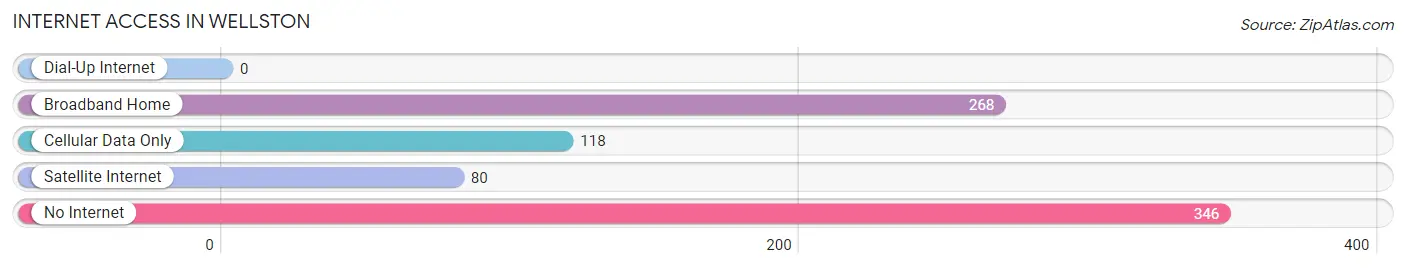
| Internet Type | # Households | % Households |
| Dial-Up Internet | 0 | 0.0% |
| Broadband Home | 268 | 34.5% |
| Cellular Data Only | 118 | 15.2% |
| Satellite Internet | 80 | 10.3% |
| No Internet | 346 | 44.6% |
| Total | 776 | 100.0% |
Wellston Summary
Wellston, Missouri is a small city located in St. Louis County, Missouri. It is situated about 15 miles northwest of downtown St. Louis. The city has a population of approximately 4,000 people and is part of the Greater St. Louis metropolitan area.
History
Wellston was founded in 1876 by a group of German immigrants who had recently arrived in the United States. The city was named after the Wellston family, who had owned the land on which the city was built. The city was incorporated in 1887 and quickly grew to become a thriving community.
In the early 1900s, Wellston was a major center for coal mining and steel production. The city was home to several large steel mills, which provided employment for many of the city’s residents. The city also had a thriving retail sector, with several stores and shops located in the downtown area.
In the 1950s, the city began to decline as the steel industry moved away from the area. The city’s population began to decline as well, and by the 1970s, the city was in a state of economic decline. In the 1980s, the city began to experience a resurgence as new businesses moved into the area and the city began to attract new residents.
Geography
Wellston is located in St. Louis County, Missouri. The city is situated about 15 miles northwest of downtown St. Louis. The city is located on the banks of the Meramec River and is surrounded by rolling hills and forests. The city has a total area of 2.2 square miles, all of which is land.
Economy
Wellston’s economy is largely based on the service sector. The city is home to several small businesses, including restaurants, retail stores, and professional services. The city also has a small manufacturing sector, which produces a variety of products, including furniture and clothing.
The city is also home to several educational institutions, including a community college and a technical school. These institutions provide employment for many of the city’s residents.
Demographics
As of the 2010 census, the population of Wellston was 4,000. The city has a population that is predominantly white, with African Americans making up the largest minority group. The median household income in the city is $30,000, and the median age is 37.
Conclusion
Wellston, Missouri is a small city located in St. Louis County, Missouri. It is situated about 15 miles northwest of downtown St. Louis and has a population of approximately 4,000 people. The city has a long history of coal mining and steel production, but in recent years has shifted to a service-based economy. The city is predominantly white, with African Americans making up the largest minority group. The median household income in the city is $30,000, and the median age is 37.
Common Questions
What is Per Capita Income in Wellston?
Per Capita income in Wellston is $18,897.
What is the Median Family Income in Wellston?
Median Family Income in Wellston is $37,454.
What is the Median Household income in Wellston?
Median Household Income in Wellston is $35,278.
What is Family Income Deficit in Wellston?
Family Income Deficit in Wellston is $15,943.
Families that are below poverty line in Wellston earn $15,943 less on average than the poverty threshold level.
What is Inequality or Gini Index in Wellston?
Inequality or Gini Index in Wellston is 0.40.
What is the Total Population of Wellston?
Total Population of Wellston is 1,913.
What is the Total Male Population of Wellston?
Total Male Population of Wellston is 766.
What is the Total Female Population of Wellston?
Total Female Population of Wellston is 1,147.
What is the Ratio of Males per 100 Females in Wellston?
There are 66.78 Males per 100 Females in Wellston.
What is the Ratio of Females per 100 Males in Wellston?
There are 149.74 Females per 100 Males in Wellston.
What is the Median Population Age in Wellston?
Median Population Age in Wellston is 33.9 Years.
What is the Average Family Size in Wellston
Average Family Size in Wellston is 3.0 People.
What is the Average Household Size in Wellston
Average Household Size in Wellston is 2.5 People.
How Large is the Labor Force in Wellston?
There are 894 People in the Labor Forcein in Wellston.
What is the Percentage of People in the Labor Force in Wellston?
62.2% of People are in the Labor Force in Wellston.
What is the Unemployment Rate in Wellston?
Unemployment Rate in Wellston is 3.0%.