Franquez, PR Map & Demographics
Franquez Overview
$12,593
PER CAPITA INCOME
$43,125
AVG FAMILY INCOME
$23,232
AVG HOUSEHOLD INCOME
23.9%
WAGE / INCOME GAP [ % ]
76.1¢/ $1
WAGE / INCOME GAP [ $ ]
0.48
INEQUALITY / GINI INDEX
1,705
TOTAL POPULATION
764
MALE POPULATION
941
FEMALE POPULATION
81.19
MALES / 100 FEMALES
123.17
FEMALES / 100 MALES
41.2
MEDIAN AGE
3.4
AVG FAMILY SIZE
3.0
AVG HOUSEHOLD SIZE
735
LABOR FORCE [ PEOPLE ]
49.4%
PERCENT IN LABOR FORCE
14.0%
UNEMPLOYMENT RATE
Income in Franquez
Income Overview in Franquez
Per Capita Income in Franquez is $12,593, while median incomes of families and households are $43,125 and $23,232 respectively.
| Characteristic | Number | Measure |
| Per Capita Income | 1,705 | $12,593 |
| Median Family Income | 397 | $43,125 |
| Mean Family Income | 397 | $39,092 |
| Median Household Income | 564 | $23,232 |
| Mean Household Income | 564 | $33,960 |
| Income Deficit | 397 | $0 |
| Wage / Income Gap (%) | 1,705 | 23.94% |
| Wage / Income Gap ($) | 1,705 | 76.06¢ per $1 |
| Gini / Inequality Index | 1,705 | 0.48 |
Earnings by Sex in Franquez
Average Earnings in Franquez are $20,733, $21,800 for men and $16,582 for women, a difference of 23.9%.
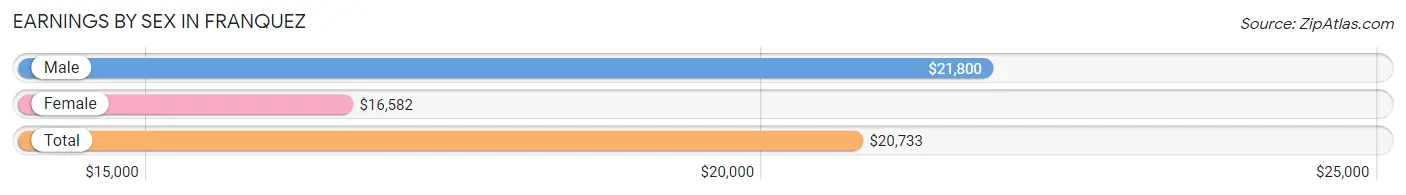
| Sex | Number | Average Earnings |
| Male | 398 (61.0%) | $21,800 |
| Female | 254 (39.0%) | $16,582 |
| Total | 652 (100.0%) | $20,733 |
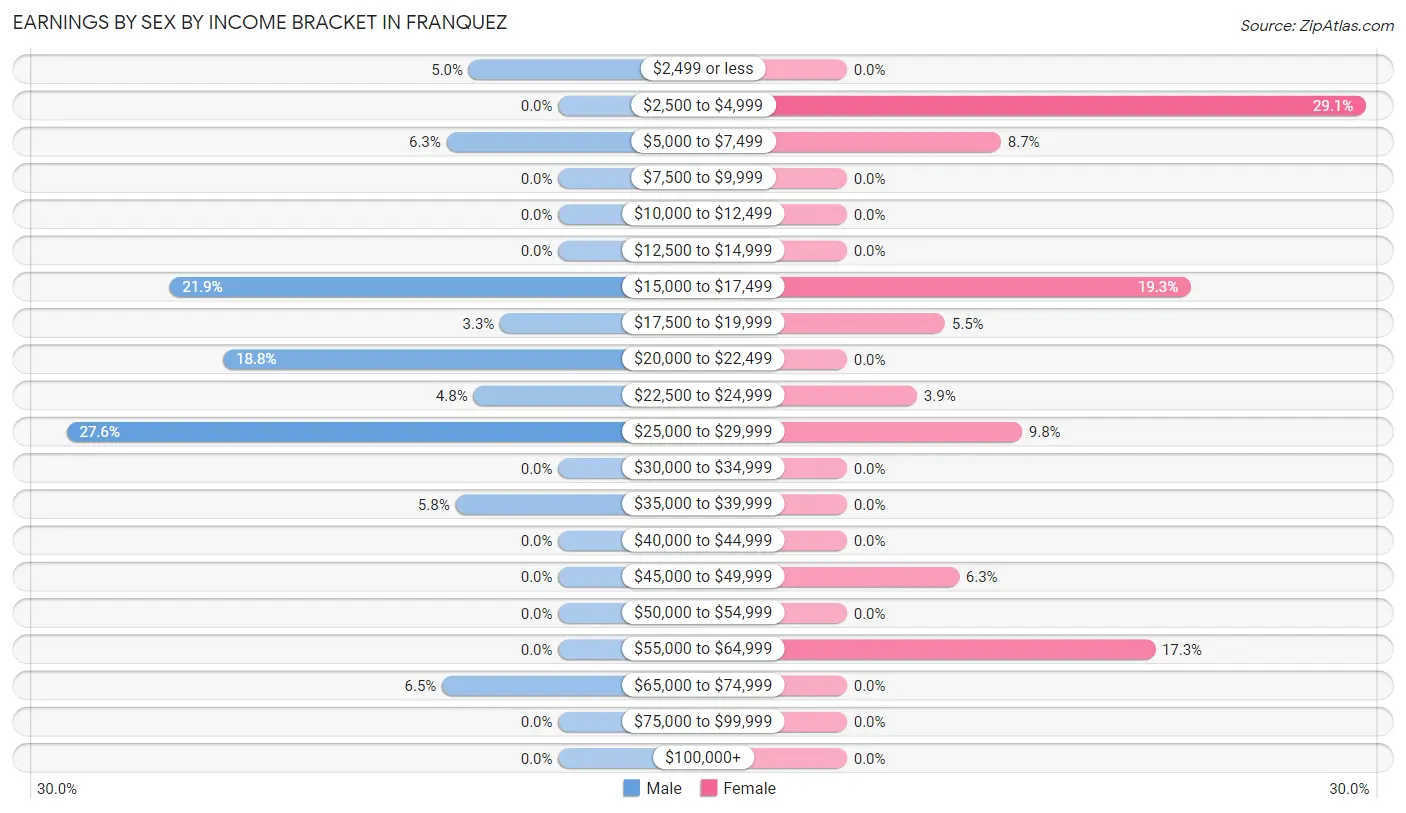
Earnings by Sex by Income Bracket in Franquez
The most common earnings brackets in Franquez are $25,000 to $29,999 for men (110 | 27.6%) and $2,500 to $4,999 for women (74 | 29.1%).
| Income | Male | Female |
| $2,499 or less | 20 (5.0%) | 0 (0.0%) |
| $2,500 to $4,999 | 0 (0.0%) | 74 (29.1%) |
| $5,000 to $7,499 | 25 (6.3%) | 22 (8.7%) |
| $7,500 to $9,999 | 0 (0.0%) | 0 (0.0%) |
| $10,000 to $12,499 | 0 (0.0%) | 0 (0.0%) |
| $12,500 to $14,999 | 0 (0.0%) | 0 (0.0%) |
| $15,000 to $17,499 | 87 (21.9%) | 49 (19.3%) |
| $17,500 to $19,999 | 13 (3.3%) | 14 (5.5%) |
| $20,000 to $22,499 | 75 (18.8%) | 0 (0.0%) |
| $22,500 to $24,999 | 19 (4.8%) | 10 (3.9%) |
| $25,000 to $29,999 | 110 (27.6%) | 25 (9.8%) |
| $30,000 to $34,999 | 0 (0.0%) | 0 (0.0%) |
| $35,000 to $39,999 | 23 (5.8%) | 0 (0.0%) |
| $40,000 to $44,999 | 0 (0.0%) | 0 (0.0%) |
| $45,000 to $49,999 | 0 (0.0%) | 16 (6.3%) |
| $50,000 to $54,999 | 0 (0.0%) | 0 (0.0%) |
| $55,000 to $64,999 | 0 (0.0%) | 44 (17.3%) |
| $65,000 to $74,999 | 26 (6.5%) | 0 (0.0%) |
| $75,000 to $99,999 | 0 (0.0%) | 0 (0.0%) |
| $100,000+ | 0 (0.0%) | 0 (0.0%) |
| Total | 398 (100.0%) | 254 (100.0%) |
Earnings by Sex by Educational Attainment in Franquez
Average earnings in Franquez are $25,091 for men and $16,964 for women, a difference of 32.4%. Men with an educational attainment of high school diploma enjoy the highest average annual earnings of $25,386, while those with high school diploma education earn the least with $25,386. Women with an educational attainment of high school diploma earn the most with the average annual earnings of $16,684, while those with high school diploma education have the smallest earnings of $16,684.
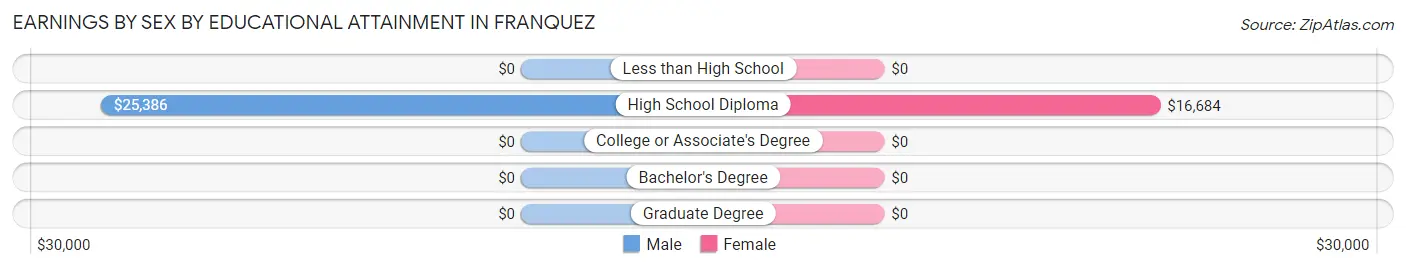
| Educational Attainment | Male Income | Female Income |
| Less than High School | - | - |
| High School Diploma | $25,386 | $16,684 |
| College or Associate's Degree | - | - |
| Bachelor's Degree | - | - |
| Graduate Degree | - | - |
| Total | $25,091 | $16,964 |
Family Income in Franquez
Family Income Brackets in Franquez
According to the Franquez family income data, there are 162 families falling into the $50,000 to $74,999 income range, which is the most common income bracket and makes up 40.8% of all families.
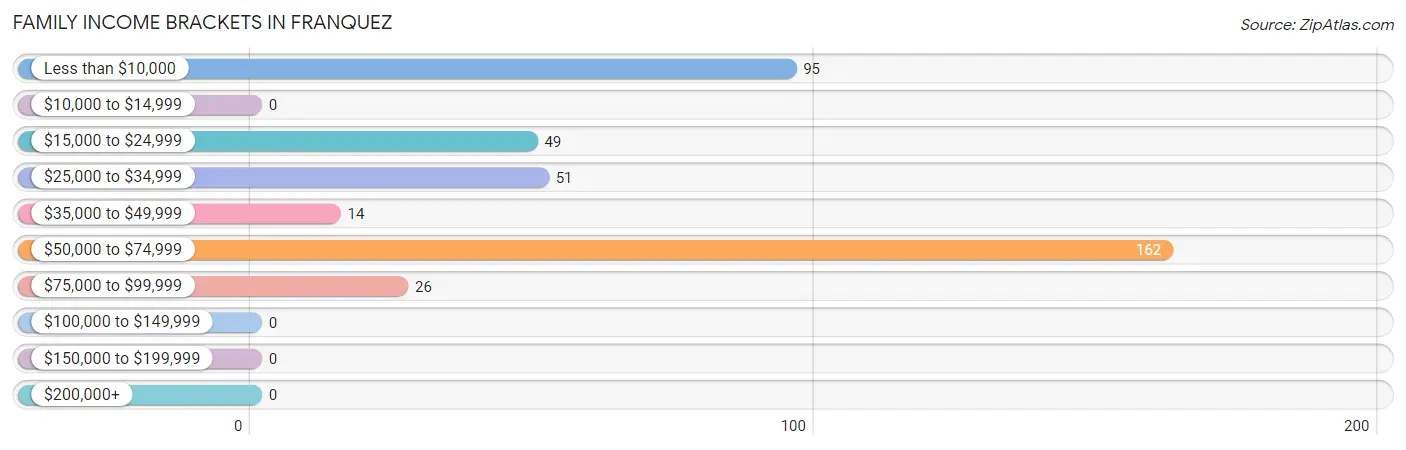
| Income Bracket | # Families | % Families |
| Less than $10,000 | 95 | 23.9% |
| $10,000 to $14,999 | 0 | 0.0% |
| $15,000 to $24,999 | 49 | 12.3% |
| $25,000 to $34,999 | 51 | 12.8% |
| $35,000 to $49,999 | 14 | 3.5% |
| $50,000 to $74,999 | 162 | 40.8% |
| $75,000 to $99,999 | 26 | 6.5% |
| $100,000 to $149,999 | 0 | 0.0% |
| $150,000 to $199,999 | 0 | 0.0% |
| $200,000+ | 0 | 0.0% |
Family Income by Famaliy Size in Franquez
3-person families (228 | 57.4%) account for the highest median family income in Franquez with $53,795 per family, while 3-person families (228 | 57.4%) have the highest median income of $17,932 per family member.
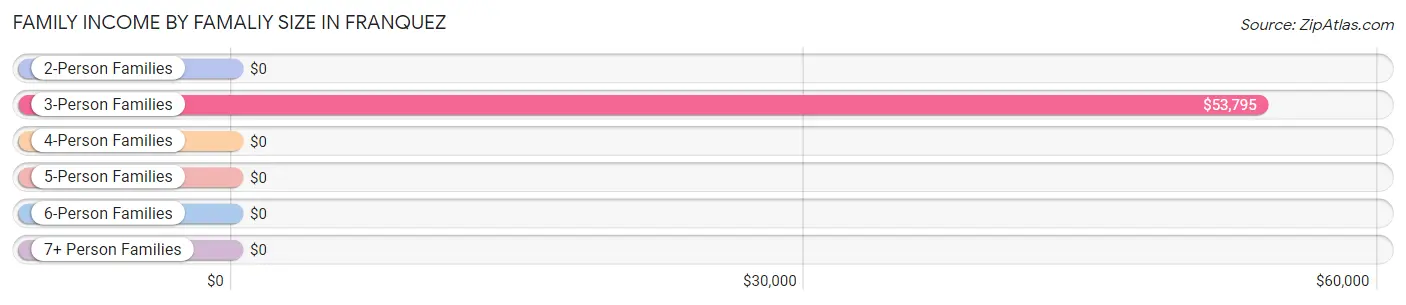
| Income Bracket | # Families | Median Income |
| 2-Person Families | 147 (37.0%) | $0 |
| 3-Person Families | 228 (57.4%) | $53,795 |
| 4-Person Families | 0 (0.0%) | $0 |
| 5-Person Families | 0 (0.0%) | $0 |
| 6-Person Families | 0 (0.0%) | $0 |
| 7+ Person Families | 22 (5.5%) | $0 |
| Total | 397 (100.0%) | $43,125 |
Family Income by Number of Earners in Franquez
| Number of Earners | # Families | Median Income |
| No Earners | 131 (33.0%) | $0 |
| 1 Earner | 170 (42.8%) | $0 |
| 2 Earners | 40 (10.1%) | $0 |
| 3+ Earners | 56 (14.1%) | $0 |
| Total | 397 (100.0%) | $43,125 |
Household Income in Franquez
Household Income Brackets in Franquez
With 180 households falling in the category, the less than $10,000 income range is the most frequent in Franquez, accounting for 31.9% of all households.
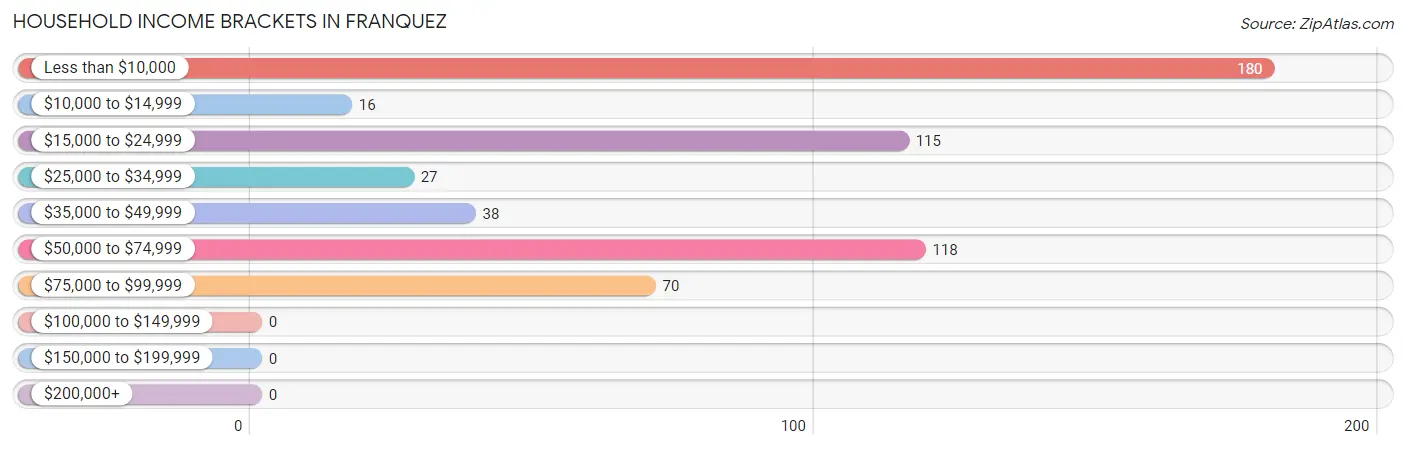
| Income Bracket | # Households | % Households |
| Less than $10,000 | 180 | 31.9% |
| $10,000 to $14,999 | 16 | 2.8% |
| $15,000 to $24,999 | 115 | 20.4% |
| $25,000 to $34,999 | 27 | 4.8% |
| $35,000 to $49,999 | 38 | 6.7% |
| $50,000 to $74,999 | 118 | 20.9% |
| $75,000 to $99,999 | 70 | 12.4% |
| $100,000 to $149,999 | 0 | 0.0% |
| $150,000 to $199,999 | 0 | 0.0% |
| $200,000+ | 0 | 0.0% |
Household Income by Householder Age in Franquez
The median household income in Franquez is $23,232, with the highest median household income of $22,639 found in the 65+ years age bracket for the primary householder. A total of 174 households (30.8%) fall into this category. Meanwhile, the 15 to 24 years age bracket for the primary householder has the lowest median household income of $0, with 13 households (2.3%) in this group.
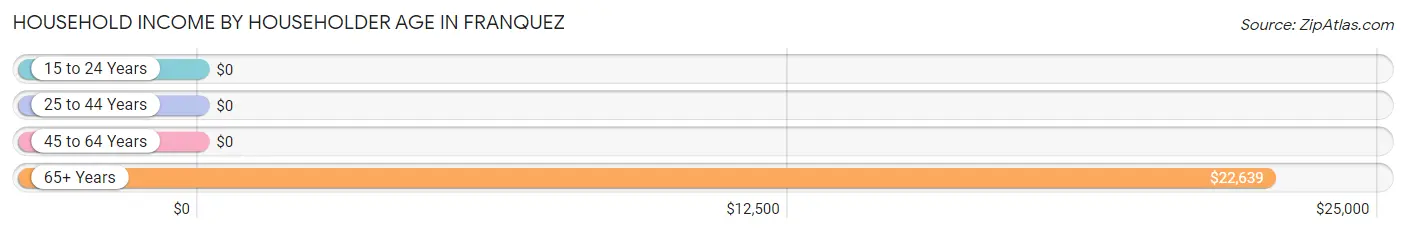
| Income Bracket | # Households | Median Income |
| 15 to 24 Years | 13 (2.3%) | $0 |
| 25 to 44 Years | 173 (30.7%) | $0 |
| 45 to 64 Years | 204 (36.2%) | $0 |
| 65+ Years | 174 (30.8%) | $22,639 |
| Total | 564 (100.0%) | $23,232 |
Poverty in Franquez
Income Below Poverty by Sex and Age in Franquez
With 26.4% poverty level for males and 54.8% for females among the residents of Franquez, under 5 year old males and 6 to 11 year old females are the most vulnerable to poverty, with 43 males (100.0%) and 97 females (100.0%) in their respective age groups living below the poverty level.
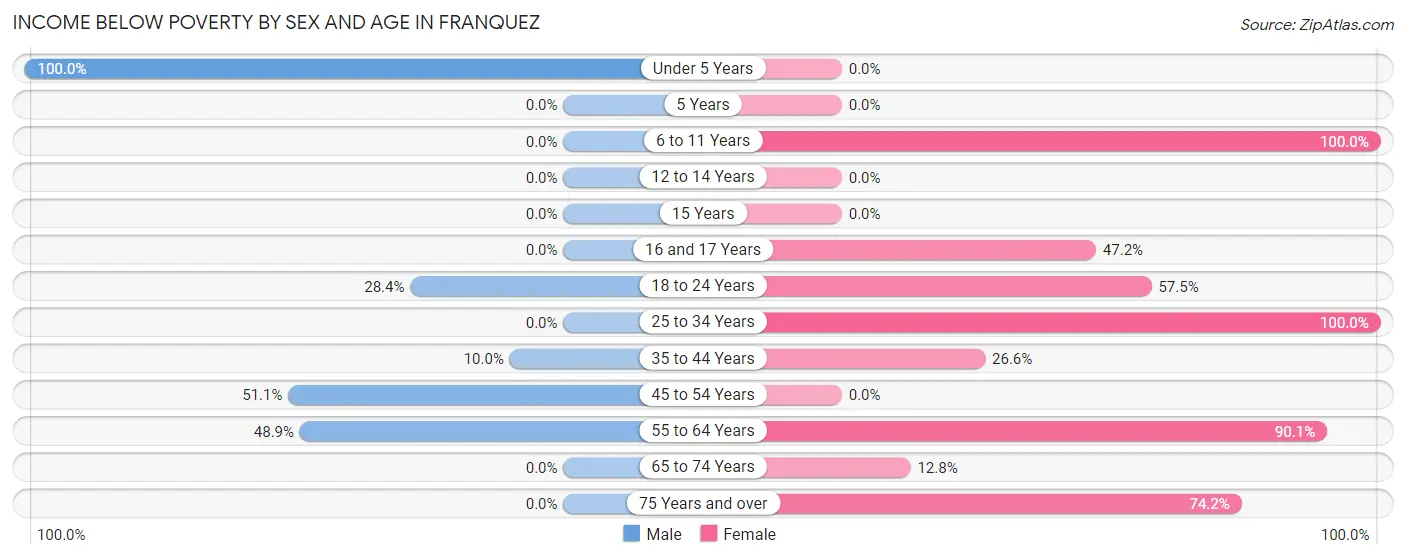
| Age Bracket | Male | Female |
| Under 5 Years | 43 (100.0%) | 0 (0.0%) |
| 5 Years | 0 (0.0%) | 0 (0.0%) |
| 6 to 11 Years | 0 (0.0%) | 97 (100.0%) |
| 12 to 14 Years | 0 (0.0%) | 0 (0.0%) |
| 15 Years | 0 (0.0%) | 0 (0.0%) |
| 16 and 17 Years | 0 (0.0%) | 25 (47.2%) |
| 18 to 24 Years | 25 (28.4%) | 73 (57.5%) |
| 25 to 34 Years | 0 (0.0%) | 110 (100.0%) |
| 35 to 44 Years | 20 (10.0%) | 25 (26.6%) |
| 45 to 54 Years | 24 (51.1%) | 0 (0.0%) |
| 55 to 64 Years | 90 (48.9%) | 127 (90.1%) |
| 65 to 74 Years | 0 (0.0%) | 13 (12.8%) |
| 75 Years and over | 0 (0.0%) | 46 (74.2%) |
| Total | 202 (26.4%) | 516 (54.8%) |
Income Above Poverty by Sex and Age in Franquez
According to the poverty statistics in Franquez, males aged 12 to 14 years and females aged 15 years are the age groups that are most secure financially, with 100.0% of males and 100.0% of females in these age groups living above the poverty line.
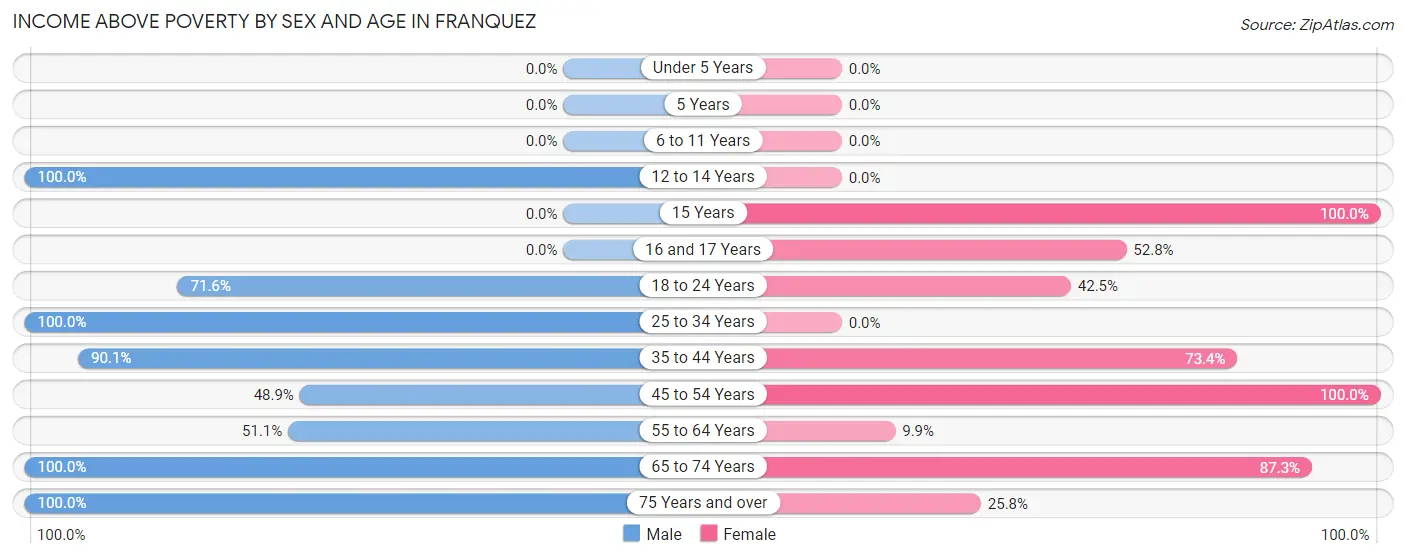
| Age Bracket | Male | Female |
| Under 5 Years | 0 (0.0%) | 0 (0.0%) |
| 5 Years | 0 (0.0%) | 0 (0.0%) |
| 6 to 11 Years | 0 (0.0%) | 0 (0.0%) |
| 12 to 14 Years | 29 (100.0%) | 0 (0.0%) |
| 15 Years | 0 (0.0%) | 48 (100.0%) |
| 16 and 17 Years | 0 (0.0%) | 28 (52.8%) |
| 18 to 24 Years | 63 (71.6%) | 54 (42.5%) |
| 25 to 34 Years | 56 (100.0%) | 0 (0.0%) |
| 35 to 44 Years | 181 (90.0%) | 69 (73.4%) |
| 45 to 54 Years | 23 (48.9%) | 107 (100.0%) |
| 55 to 64 Years | 94 (51.1%) | 14 (9.9%) |
| 65 to 74 Years | 84 (100.0%) | 89 (87.3%) |
| 75 Years and over | 32 (100.0%) | 16 (25.8%) |
| Total | 562 (73.6%) | 425 (45.2%) |
Income Below Poverty Among Married-Couple Families in Franquez
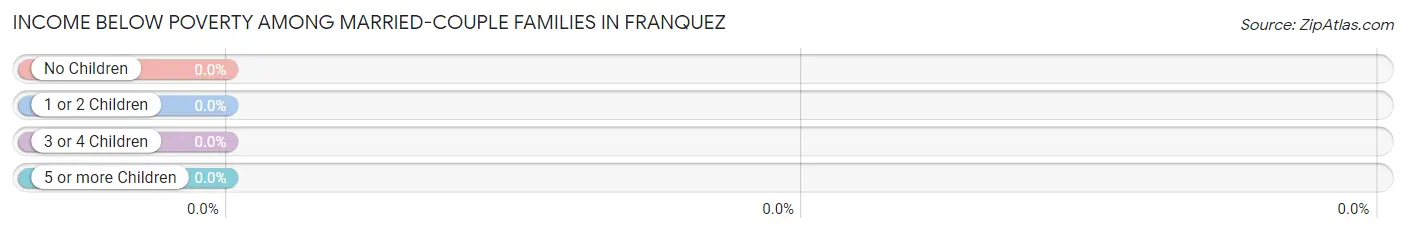
| Children | Above Poverty | Below Poverty |
| No Children | 212 (100.0%) | 0 (0.0%) |
| 1 or 2 Children | 0 (0.0%) | 0 (0.0%) |
| 3 or 4 Children | 0 (0.0%) | 0 (0.0%) |
| 5 or more Children | 0 (0.0%) | 0 (0.0%) |
| Total | 212 (100.0%) | 0 (0.0%) |
Income Below Poverty Among Single-Parent Households in Franquez
According to the poverty data in Franquez, 56.4% or 31 single-father households and 66.1% or 86 single-mother households are living below the poverty line. Among single-father households, those with no children have the highest poverty rate, with 31 households (100.0%) experiencing poverty. Likewise, among single-mother households, those with no children have the highest poverty rate, with 30 households (100.0%) falling below the poverty line.
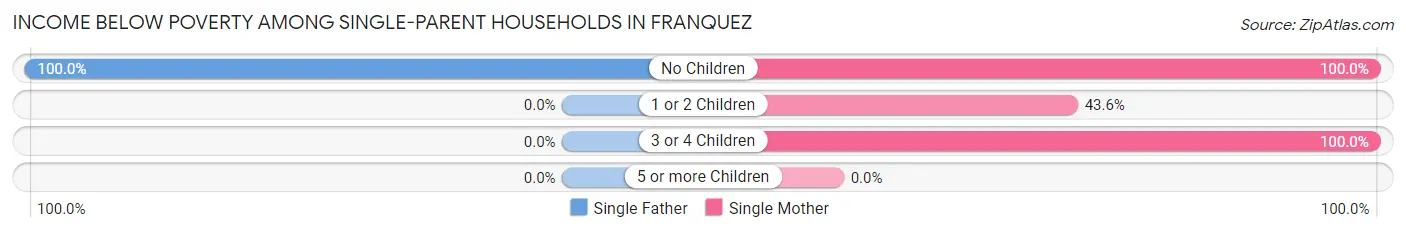
| Children | Single Father | Single Mother |
| No Children | 31 (100.0%) | 30 (100.0%) |
| 1 or 2 Children | 0 (0.0%) | 34 (43.6%) |
| 3 or 4 Children | 0 (0.0%) | 22 (100.0%) |
| 5 or more Children | 0 (0.0%) | 0 (0.0%) |
| Total | 31 (56.4%) | 86 (66.1%) |
Income Below Poverty Among Married-Couple vs Single-Parent Households in Franquez
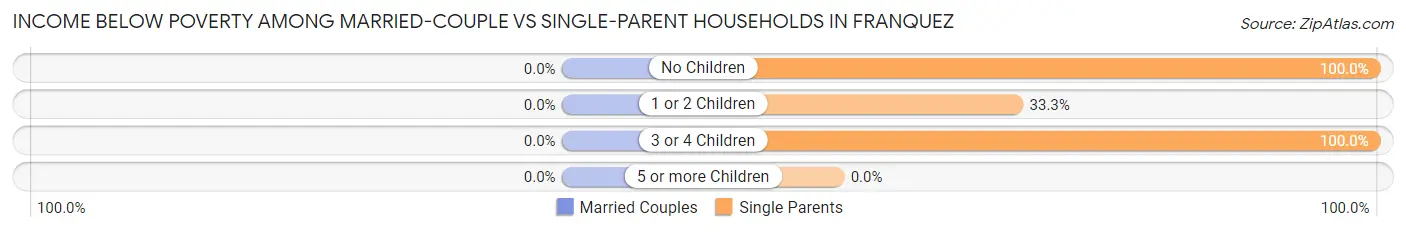
| Children | Married-Couple Families | Single-Parent Households |
| No Children | 0 (0.0%) | 61 (100.0%) |
| 1 or 2 Children | 0 (0.0%) | 34 (33.3%) |
| 3 or 4 Children | 0 (0.0%) | 22 (100.0%) |
| 5 or more Children | 0 (0.0%) | 0 (0.0%) |
| Total | 0 (0.0%) | 117 (63.2%) |
Race in Franquez
The most populous races in Franquez are Hispanic or Latino (1,680 | 98.5%), Two or more Races (775 | 45.5%), and White / Caucasian (770 | 45.2%).
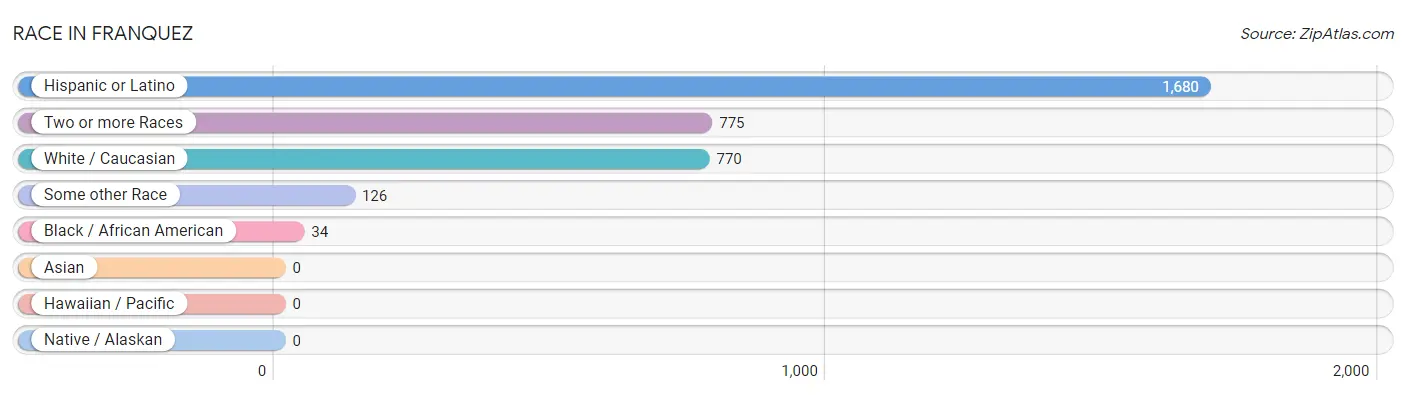
| Race | # Population | % Population |
| Asian | 0 | 0.0% |
| Black / African American | 34 | 2.0% |
| Hawaiian / Pacific | 0 | 0.0% |
| Hispanic or Latino | 1,680 | 98.5% |
| Native / Alaskan | 0 | 0.0% |
| White / Caucasian | 770 | 45.2% |
| Two or more Races | 775 | 45.5% |
| Some other Race | 126 | 7.4% |
| Total | 1,705 | 100.0% |
Ancestry in Franquez
The most populous ancestries reported in Franquez are Puerto Rican (1,680 | 98.5%), and American (16 | 0.9%), together accounting for 99.5% of all Franquez residents.
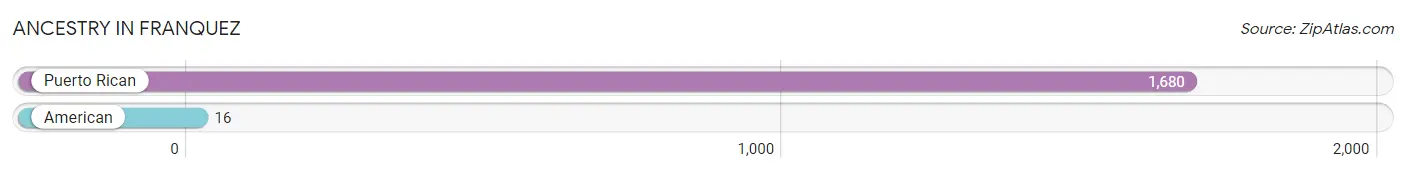
| Ancestry | # Population | % Population |
| American | 16 | 0.9% |
| Puerto Rican | 1,680 | 98.5% | View All 2 Rows |
Immigrants in Franquez

| Immigration Origin | # Population | % Population | View All 0 Rows |
Sex and Age in Franquez
Sex and Age in Franquez
The most populous age groups in Franquez are 35 to 39 Years (136 | 17.8%) for men and 55 to 59 Years (141 | 15.0%) for women.
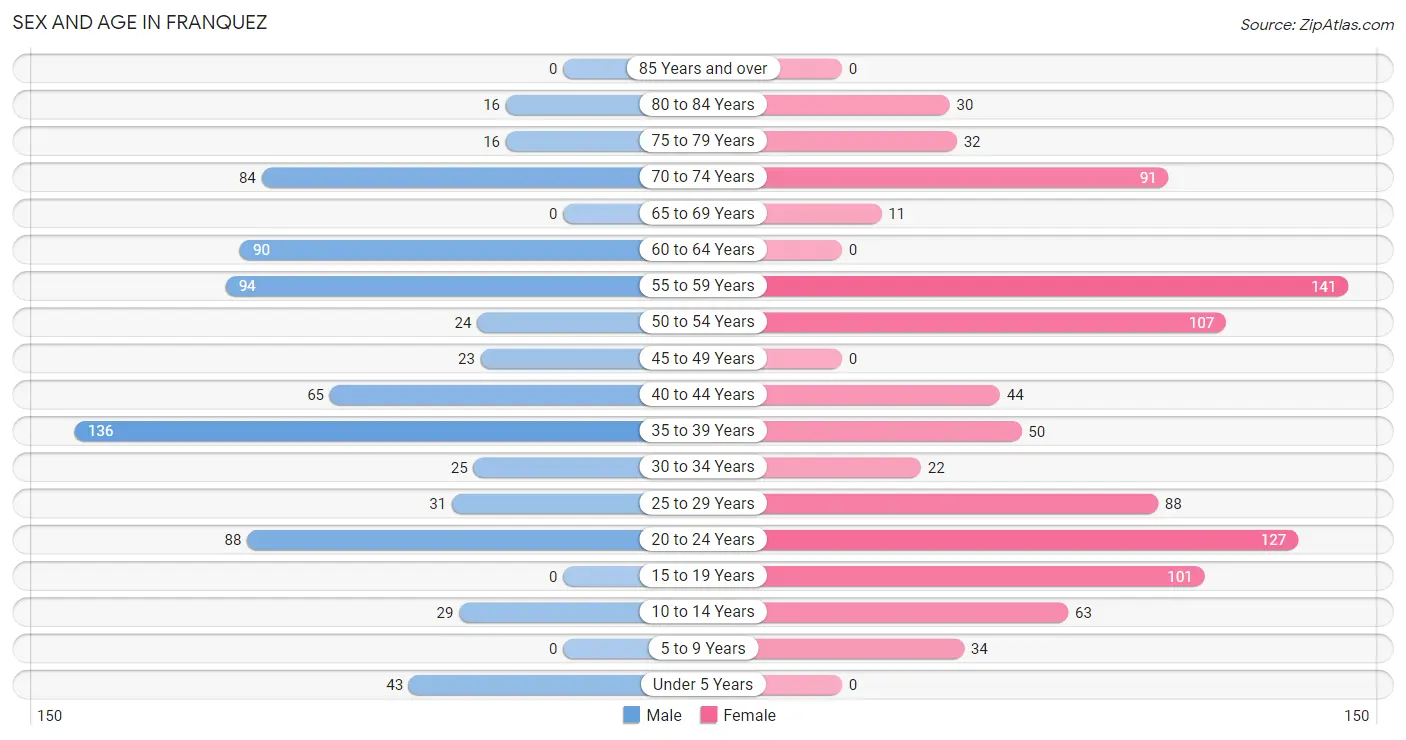
| Age Bracket | Male | Female |
| Under 5 Years | 43 (5.6%) | 0 (0.0%) |
| 5 to 9 Years | 0 (0.0%) | 34 (3.6%) |
| 10 to 14 Years | 29 (3.8%) | 63 (6.7%) |
| 15 to 19 Years | 0 (0.0%) | 101 (10.7%) |
| 20 to 24 Years | 88 (11.5%) | 127 (13.5%) |
| 25 to 29 Years | 31 (4.1%) | 88 (9.3%) |
| 30 to 34 Years | 25 (3.3%) | 22 (2.3%) |
| 35 to 39 Years | 136 (17.8%) | 50 (5.3%) |
| 40 to 44 Years | 65 (8.5%) | 44 (4.7%) |
| 45 to 49 Years | 23 (3.0%) | 0 (0.0%) |
| 50 to 54 Years | 24 (3.1%) | 107 (11.4%) |
| 55 to 59 Years | 94 (12.3%) | 141 (15.0%) |
| 60 to 64 Years | 90 (11.8%) | 0 (0.0%) |
| 65 to 69 Years | 0 (0.0%) | 11 (1.2%) |
| 70 to 74 Years | 84 (11.0%) | 91 (9.7%) |
| 75 to 79 Years | 16 (2.1%) | 32 (3.4%) |
| 80 to 84 Years | 16 (2.1%) | 30 (3.2%) |
| 85 Years and over | 0 (0.0%) | 0 (0.0%) |
| Total | 764 (100.0%) | 941 (100.0%) |
Families and Households in Franquez
Median Family Size in Franquez
The median family size in Franquez is 3.44 persons per family, with single female/mother families (130 | 32.8%) accounting for the largest median family size of 4.52 persons per family. On the other hand, married-couple families (212 | 53.4%) represent the smallest median family size with 2.87 persons per family.
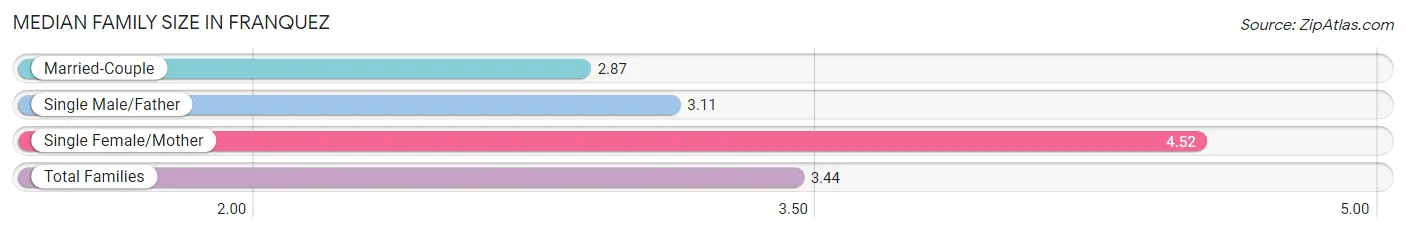
| Family Type | # Families | Family Size |
| Married-Couple | 212 (53.4%) | 2.87 |
| Single Male/Father | 55 (13.9%) | 3.11 |
| Single Female/Mother | 130 (32.8%) | 4.52 |
| Total Families | 397 (100.0%) | 3.44 |
Median Household Size in Franquez
The median household size in Franquez is 3.02 persons per household, with single female/mother households (130 | 23.1%) accounting for the largest median household size of 5.18 persons per household. non-family households (167 | 29.6%) represent the smallest median household size with 1.37 persons per household.
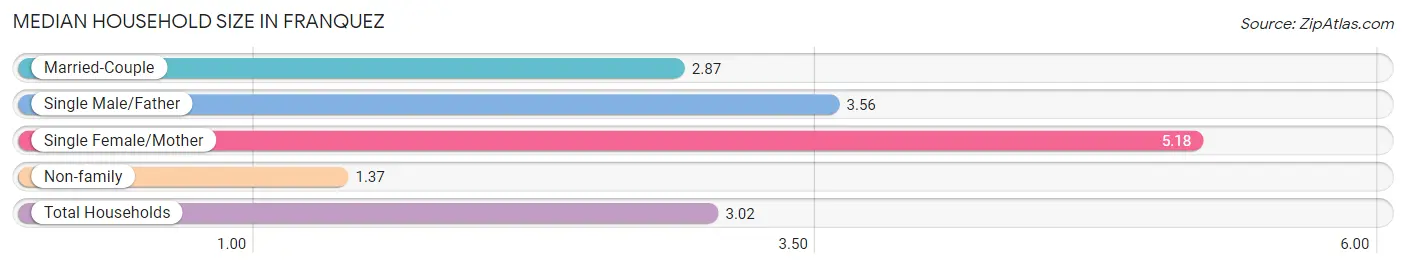
| Household Type | # Households | Household Size |
| Married-Couple | 212 (37.6%) | 2.87 |
| Single Male/Father | 55 (9.8%) | 3.56 |
| Single Female/Mother | 130 (23.1%) | 5.18 |
| Non-family | 167 (29.6%) | 1.37 |
| Total Households | 564 (100.0%) | 3.02 |
Household Size by Marriage Status in Franquez
Out of a total of 564 households in Franquez, 397 (70.4%) are family households, while 167 (29.6%) are nonfamily households. The most numerous type of family households are 3-person households, comprising 160, and the most common type of nonfamily households are 1-person households, comprising 116.
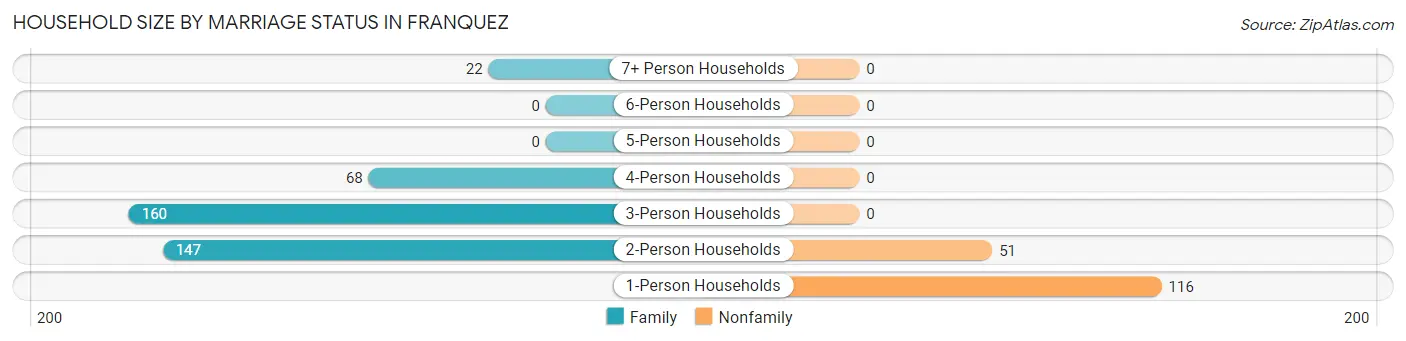
| Household Size | Family Households | Nonfamily Households |
| 1-Person Households | - | 116 (20.6%) |
| 2-Person Households | 147 (26.1%) | 51 (9.0%) |
| 3-Person Households | 160 (28.4%) | 0 (0.0%) |
| 4-Person Households | 68 (12.1%) | 0 (0.0%) |
| 5-Person Households | 0 (0.0%) | 0 (0.0%) |
| 6-Person Households | 0 (0.0%) | 0 (0.0%) |
| 7+ Person Households | 22 (3.9%) | 0 (0.0%) |
| Total | 397 (70.4%) | 167 (29.6%) |
Female Fertility in Franquez
Fertility by Age in Franquez
Average fertility rate in Franquez is 63.0 births per 1,000 women. Women in the age bracket of 20 to 34 years have the highest fertility rate with 122.0 births per 1,000 women. Women in the age bracket of 20 to 34 years acount for 100.0% of all women with births.
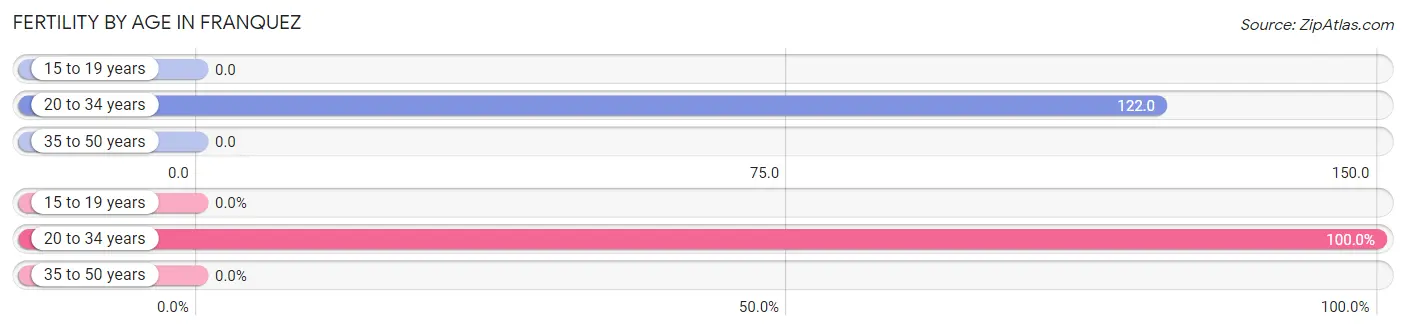
| Age Bracket | Women with Births | Births / 1,000 Women |
| 15 to 19 years | 0 (0.0%) | 0.0 |
| 20 to 34 years | 29 (100.0%) | 122.0 |
| 35 to 50 years | 0 (0.0%) | 0.0 |
| Total | 29 (100.0%) | 63.0 |
Fertility by Age by Marriage Status in Franquez
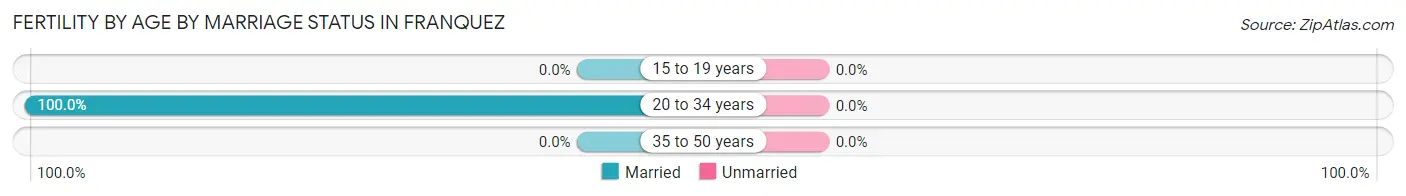
| Age Bracket | Married | Unmarried |
| 15 to 19 years | 0 (0.0%) | 0 (0.0%) |
| 20 to 34 years | 29 (100.0%) | 0 (0.0%) |
| 35 to 50 years | 0 (0.0%) | 0 (0.0%) |
| Total | 29 (100.0%) | 0 (0.0%) |
Fertility by Education in Franquez
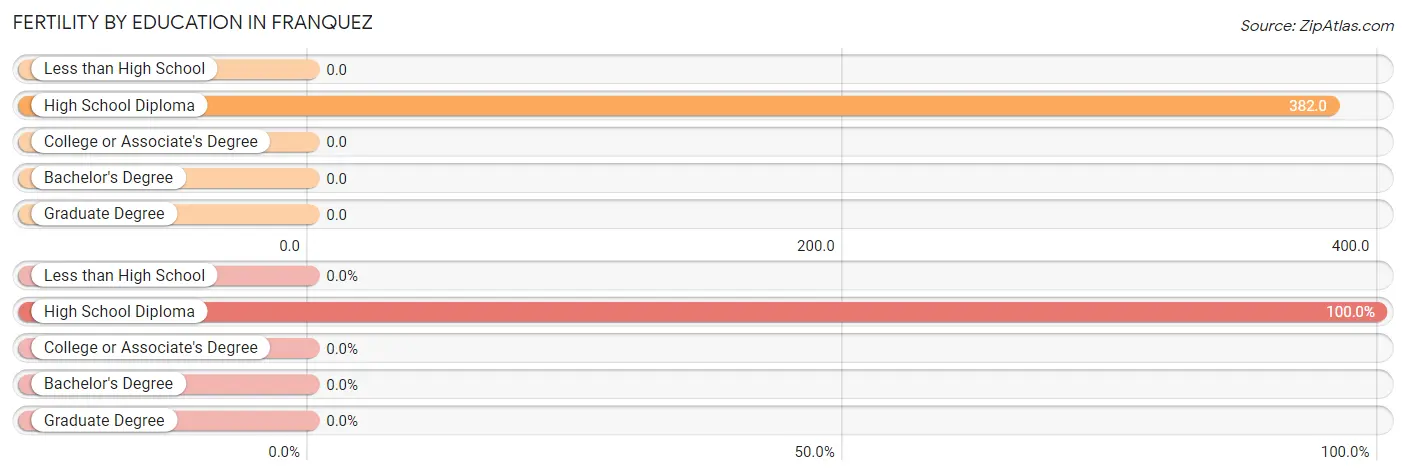
| Educational Attainment | Women with Births | Births / 1,000 Women |
| Less than High School | 0 (0.0%) | 0.0 |
| High School Diploma | 29 (100.0%) | 382.0 |
| College or Associate's Degree | 0 (0.0%) | 0.0 |
| Bachelor's Degree | 0 (0.0%) | 0.0 |
| Graduate Degree | 0 (0.0%) | 0.0 |
| Total | 29 (100.0%) | 63.0 |
Fertility by Education by Marriage Status in Franquez
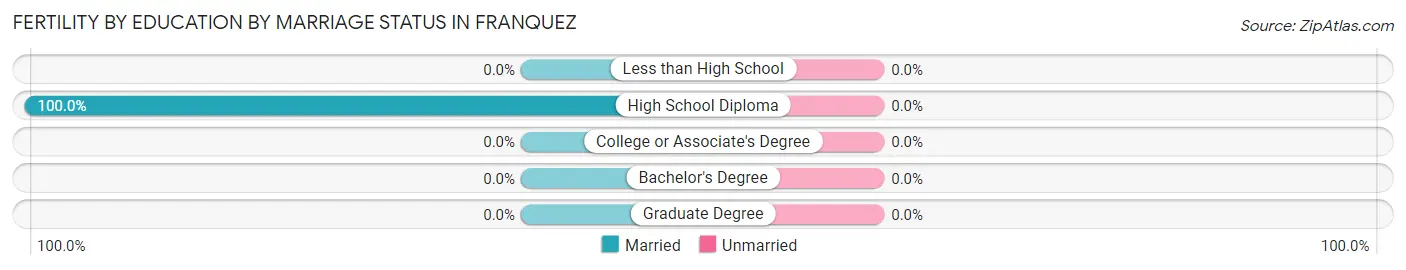
| Educational Attainment | Married | Unmarried |
| Less than High School | 0 (0.0%) | 0 (0.0%) |
| High School Diploma | 29 (100.0%) | 0 (0.0%) |
| College or Associate's Degree | 0 (0.0%) | 0 (0.0%) |
| Bachelor's Degree | 0 (0.0%) | 0 (0.0%) |
| Graduate Degree | 0 (0.0%) | 0 (0.0%) |
| Total | 29 (100.0%) | 0 (0.0%) |
Employment Characteristics in Franquez
Employment by Class of Employer in Franquez
Among the 599 employed individuals in Franquez, private company employees (454 | 75.8%), local government employees (72 | 12.0%), and state government employees (26 | 4.3%) make up the most common classes of employment.
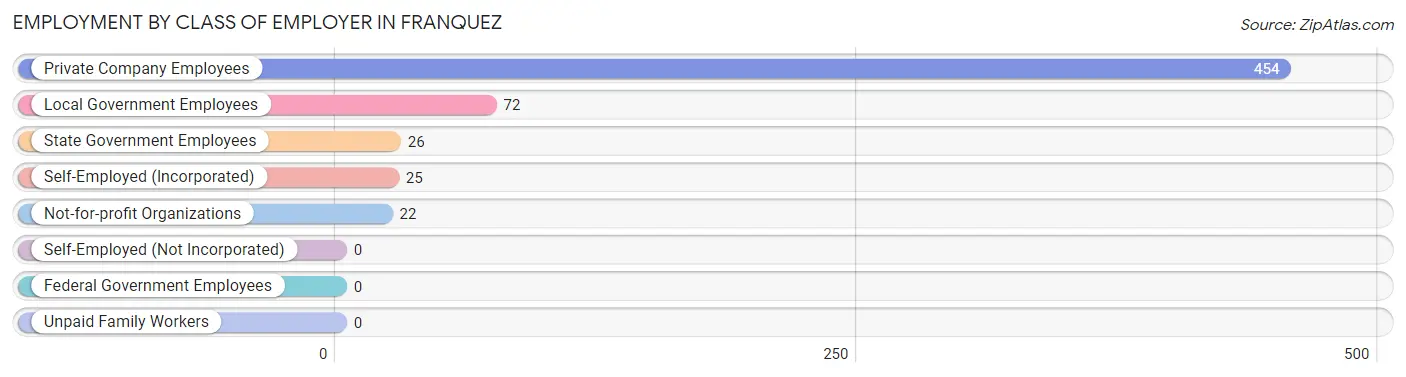
| Employer Class | # Employees | % Employees |
| Private Company Employees | 454 | 75.8% |
| Self-Employed (Incorporated) | 25 | 4.2% |
| Self-Employed (Not Incorporated) | 0 | 0.0% |
| Not-for-profit Organizations | 22 | 3.7% |
| Local Government Employees | 72 | 12.0% |
| State Government Employees | 26 | 4.3% |
| Federal Government Employees | 0 | 0.0% |
| Unpaid Family Workers | 0 | 0.0% |
| Total | 599 | 100.0% |
Employment Status by Age in Franquez
According to the labor force statistics for Franquez, out of the total population over 16 years of age (1,488), 49.4% or 735 individuals are in the labor force, with 14.0% or 103 of them unemployed. The age group with the highest labor force participation rate is 25 to 29 years, with 100.0% or 119 individuals in the labor force. Within the labor force, the 25 to 29 years age range has the highest percentage of unemployed individuals, with 45.4% or 54 of them being unemployed.
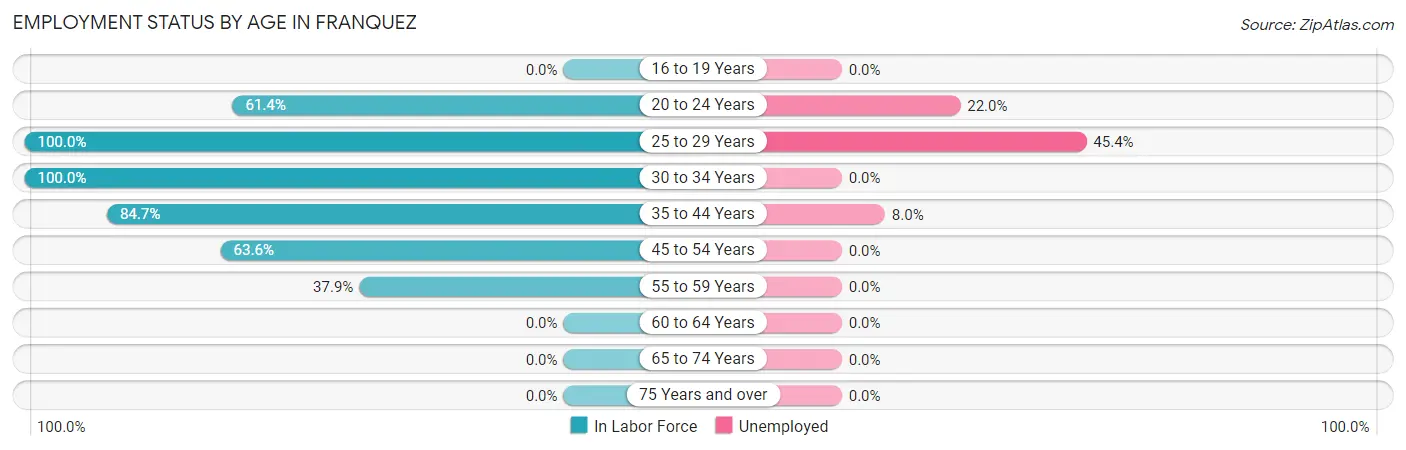
| Age Bracket | In Labor Force | Unemployed |
| 16 to 19 Years | 0 (0.0%) | 0 (0.0%) |
| 20 to 24 Years | 132 (61.4%) | 29 (22.0%) |
| 25 to 29 Years | 119 (100.0%) | 54 (45.4%) |
| 30 to 34 Years | 47 (100.0%) | 0 (0.0%) |
| 35 to 44 Years | 250 (84.7%) | 20 (8.0%) |
| 45 to 54 Years | 98 (63.6%) | 0 (0.0%) |
| 55 to 59 Years | 89 (37.9%) | 0 (0.0%) |
| 60 to 64 Years | 0 (0.0%) | 0 (0.0%) |
| 65 to 74 Years | 0 (0.0%) | 0 (0.0%) |
| 75 Years and over | 0 (0.0%) | 0 (0.0%) |
| Total | 735 (49.4%) | 103 (14.0%) |
Employment Status by Educational Attainment in Franquez
According to labor force statistics for Franquez, 64.1% of individuals (603) out of the total population between 25 and 64 years of age (940) are in the labor force, with 12.3% or 74 of them being unemployed. The group with the highest labor force participation rate are those with the educational attainment of bachelor's degree or higher, with 87.0% or 127 individuals in the labor force. Within the labor force, individuals with less than high school education have the highest percentage of unemployment, with 74.0% or 54 of them being unemployed.
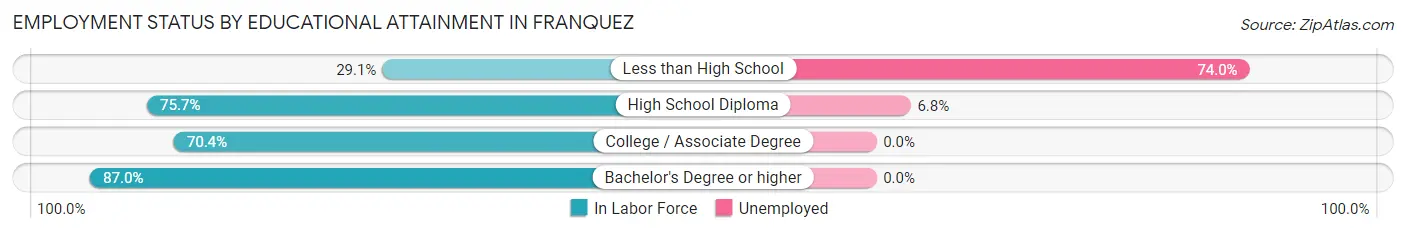
| Educational Attainment | In Labor Force | Unemployed |
| Less than High School | 73 (29.1%) | 186 (74.0%) |
| High School Diploma | 296 (75.7%) | 27 (6.8%) |
| College / Associate Degree | 107 (70.4%) | 0 (0.0%) |
| Bachelor's Degree or higher | 127 (87.0%) | 0 (0.0%) |
| Total | 603 (64.1%) | 116 (12.3%) |
Employment Occupations by Sex in Franquez
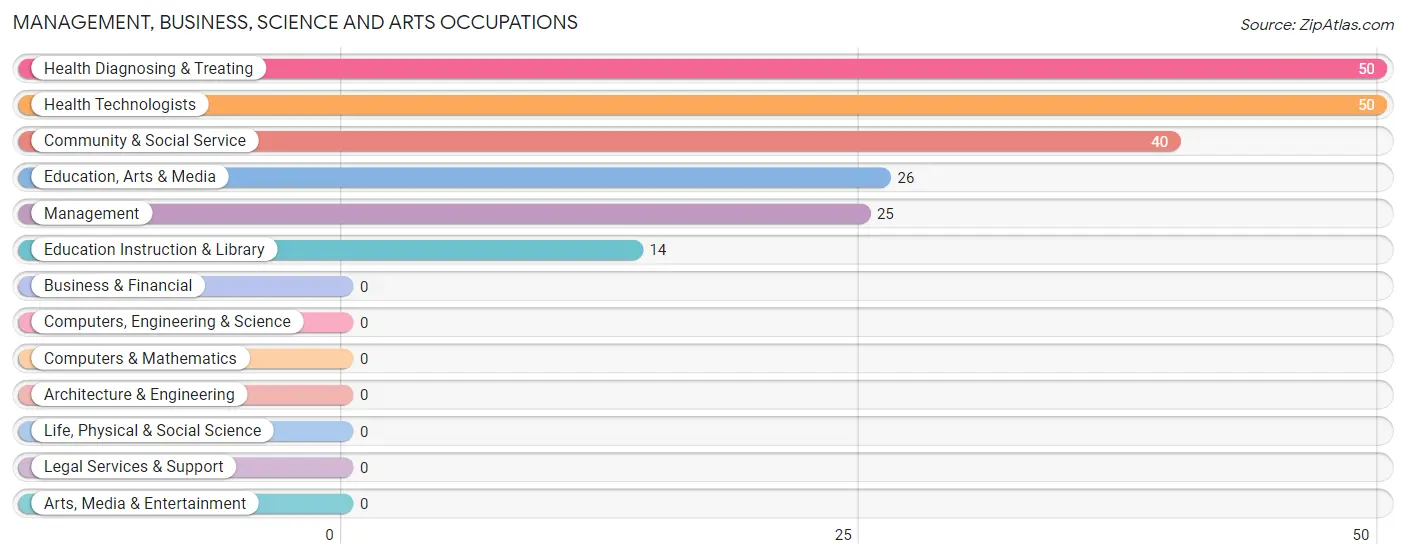
Management, Business, Science and Arts Occupations
The most common Management, Business, Science and Arts occupations in Franquez are Health Diagnosing & Treating (50 | 7.9%), Health Technologists (50 | 7.9%), Community & Social Service (40 | 6.3%), Education, Arts & Media (26 | 4.1%), and Management (25 | 4.0%).
Management, Business, Science and Arts Occupations by Sex
Within the Management, Business, Science and Arts occupations in Franquez, the most male-oriented occupations are Management (100.0%), Health Diagnosing & Treating (100.0%), and Health Technologists (100.0%), while the most female-oriented occupations are Community & Social Service (100.0%), Education, Arts & Media (100.0%), and Education Instruction & Library (100.0%).
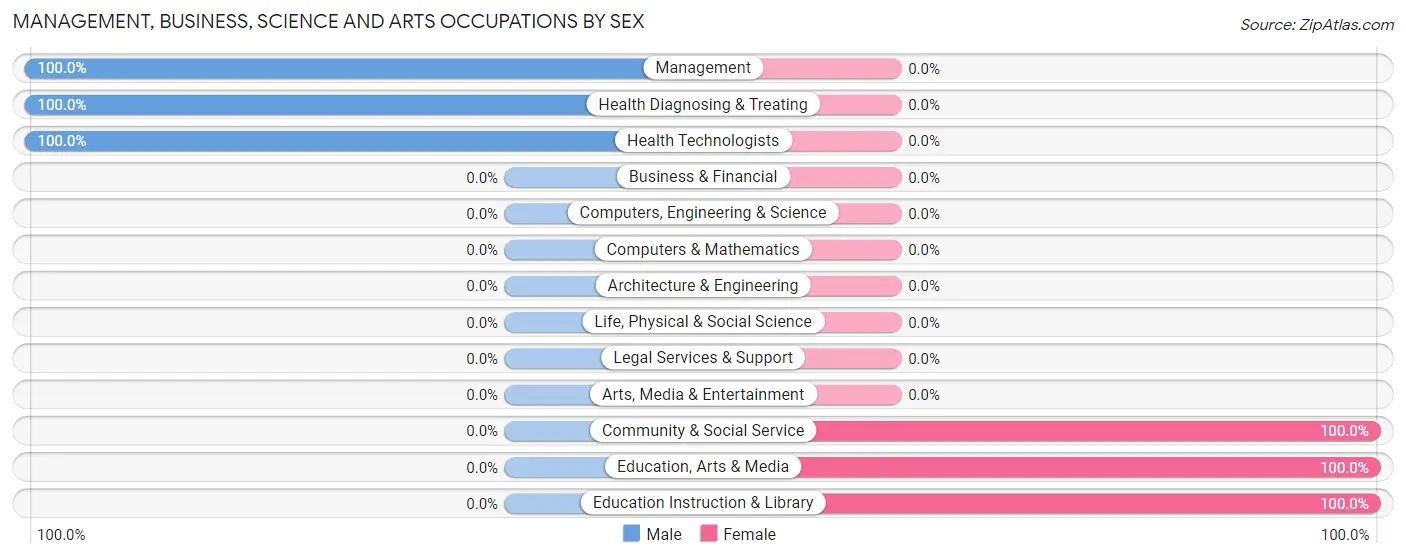
| Occupation | Male | Female |
| Management | 25 (100.0%) | 0 (0.0%) |
| Business & Financial | 0 (0.0%) | 0 (0.0%) |
| Computers, Engineering & Science | 0 (0.0%) | 0 (0.0%) |
| Computers & Mathematics | 0 (0.0%) | 0 (0.0%) |
| Architecture & Engineering | 0 (0.0%) | 0 (0.0%) |
| Life, Physical & Social Science | 0 (0.0%) | 0 (0.0%) |
| Community & Social Service | 0 (0.0%) | 40 (100.0%) |
| Education, Arts & Media | 0 (0.0%) | 26 (100.0%) |
| Legal Services & Support | 0 (0.0%) | 0 (0.0%) |
| Education Instruction & Library | 0 (0.0%) | 14 (100.0%) |
| Arts, Media & Entertainment | 0 (0.0%) | 0 (0.0%) |
| Health Diagnosing & Treating | 50 (100.0%) | 0 (0.0%) |
| Health Technologists | 50 (100.0%) | 0 (0.0%) |
| Total (Category) | 75 (65.2%) | 40 (34.8%) |
| Total (Overall) | 378 (59.8%) | 254 (40.2%) |
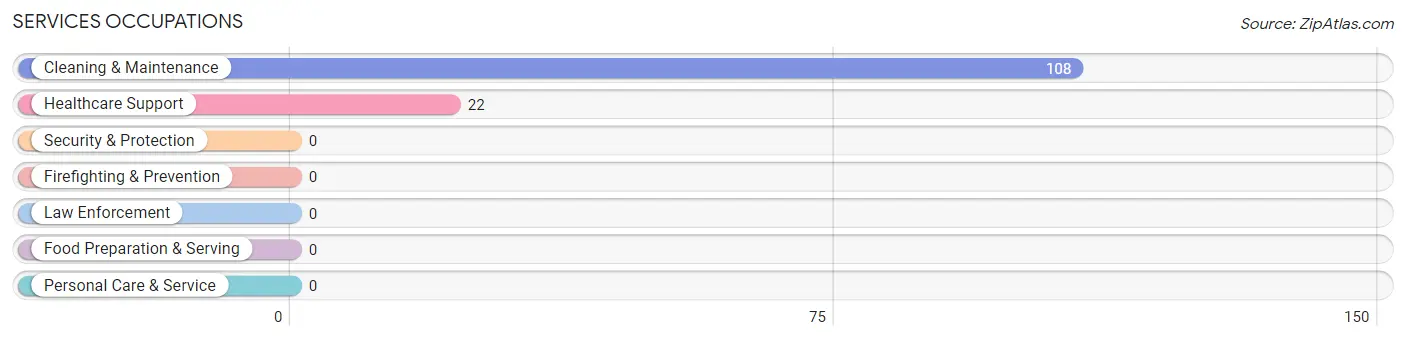
Services Occupations
The most common Services occupations in Franquez are Cleaning & Maintenance (108 | 17.1%), and Healthcare Support (22 | 3.5%).
Services Occupations by Sex
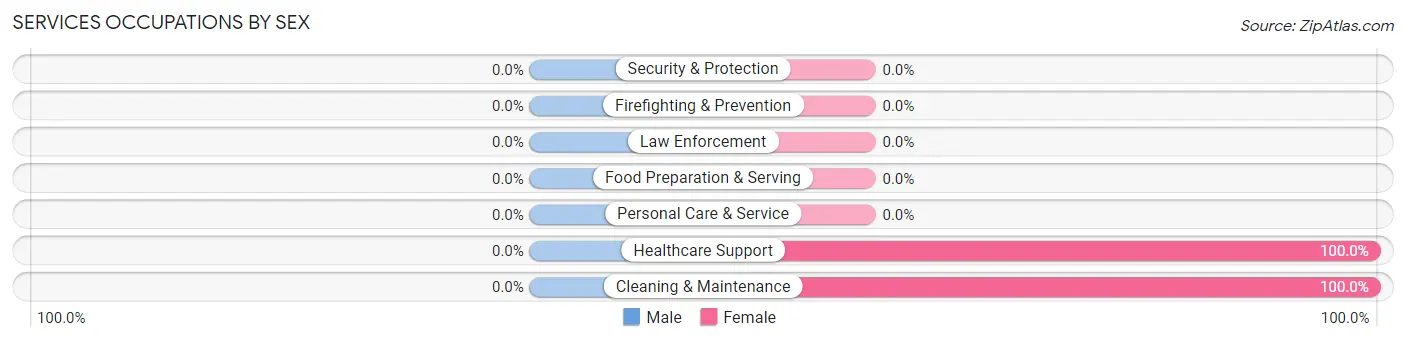
| Occupation | Male | Female |
| Healthcare Support | 0 (0.0%) | 22 (100.0%) |
| Security & Protection | 0 (0.0%) | 0 (0.0%) |
| Firefighting & Prevention | 0 (0.0%) | 0 (0.0%) |
| Law Enforcement | 0 (0.0%) | 0 (0.0%) |
| Food Preparation & Serving | 0 (0.0%) | 0 (0.0%) |
| Cleaning & Maintenance | 0 (0.0%) | 108 (100.0%) |
| Personal Care & Service | 0 (0.0%) | 0 (0.0%) |
| Total (Category) | 0 (0.0%) | 130 (100.0%) |
| Total (Overall) | 378 (59.8%) | 254 (40.2%) |
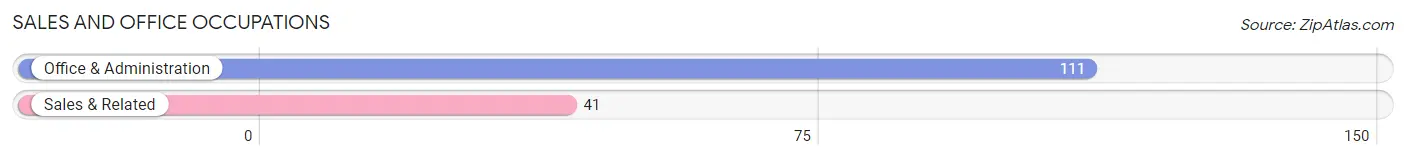
Sales and Office Occupations
The most common Sales and Office occupations in Franquez are Office & Administration (111 | 17.6%), and Sales & Related (41 | 6.5%).
Sales and Office Occupations by Sex
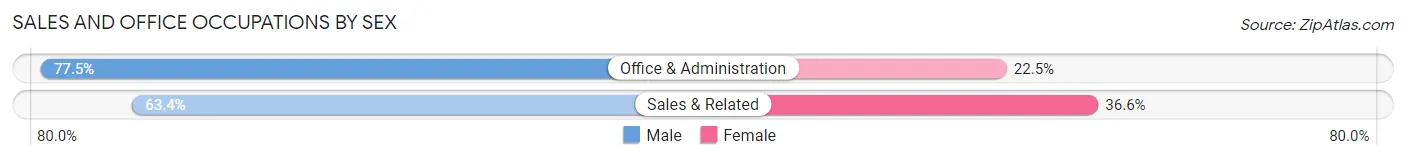
| Occupation | Male | Female |
| Sales & Related | 26 (63.4%) | 15 (36.6%) |
| Office & Administration | 86 (77.5%) | 25 (22.5%) |
| Total (Category) | 112 (73.7%) | 40 (26.3%) |
| Total (Overall) | 378 (59.8%) | 254 (40.2%) |
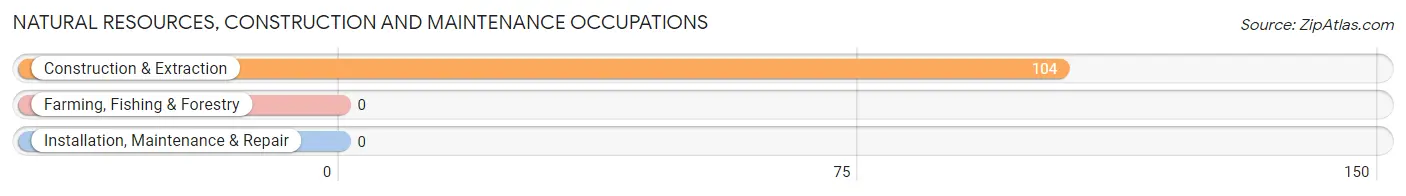
Natural Resources, Construction and Maintenance Occupations
The most common Natural Resources, Construction and Maintenance occupations in Franquez are , and Construction & Extraction (104 | 16.5%).
Natural Resources, Construction and Maintenance Occupations by Sex
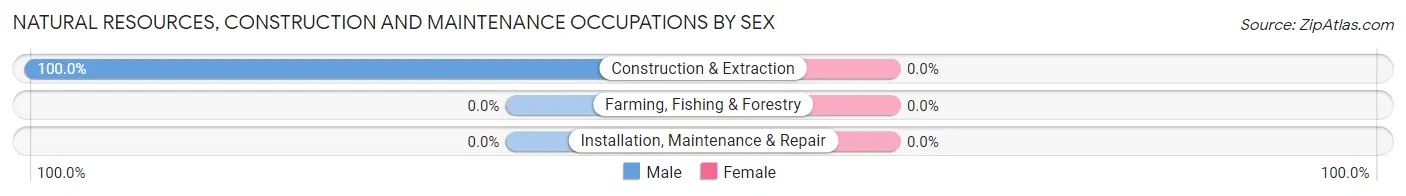
| Occupation | Male | Female |
| Farming, Fishing & Forestry | 0 (0.0%) | 0 (0.0%) |
| Construction & Extraction | 104 (100.0%) | 0 (0.0%) |
| Installation, Maintenance & Repair | 0 (0.0%) | 0 (0.0%) |
| Total (Category) | 104 (100.0%) | 0 (0.0%) |
| Total (Overall) | 378 (59.8%) | 254 (40.2%) |
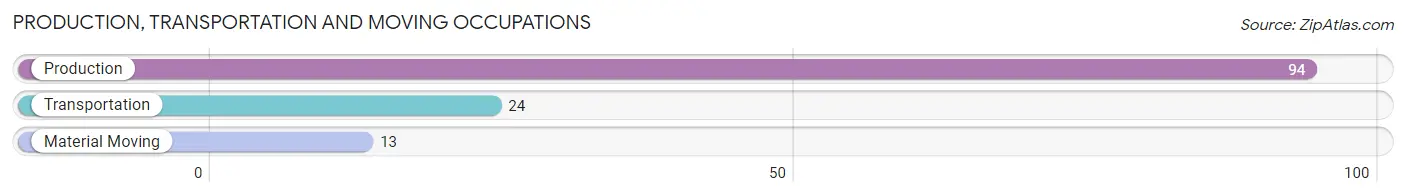
Production, Transportation and Moving Occupations
The most common Production, Transportation and Moving occupations in Franquez are Production (94 | 14.9%), Transportation (24 | 3.8%), and Material Moving (13 | 2.1%).
Production, Transportation and Moving Occupations by Sex
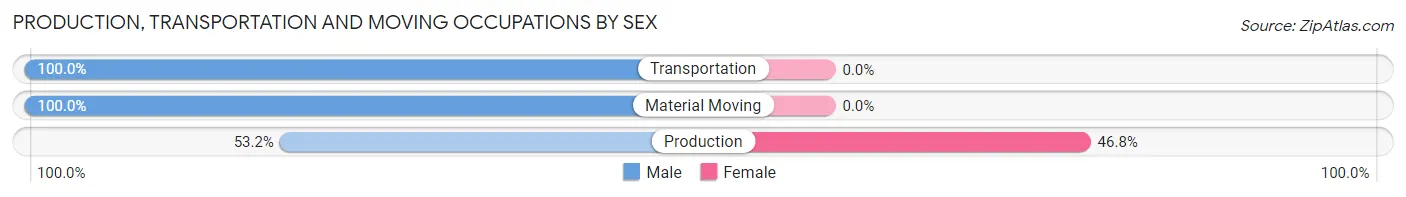
| Occupation | Male | Female |
| Production | 50 (53.2%) | 44 (46.8%) |
| Transportation | 24 (100.0%) | 0 (0.0%) |
| Material Moving | 13 (100.0%) | 0 (0.0%) |
| Total (Category) | 87 (66.4%) | 44 (33.6%) |
| Total (Overall) | 378 (59.8%) | 254 (40.2%) |
Employment Industries by Sex in Franquez
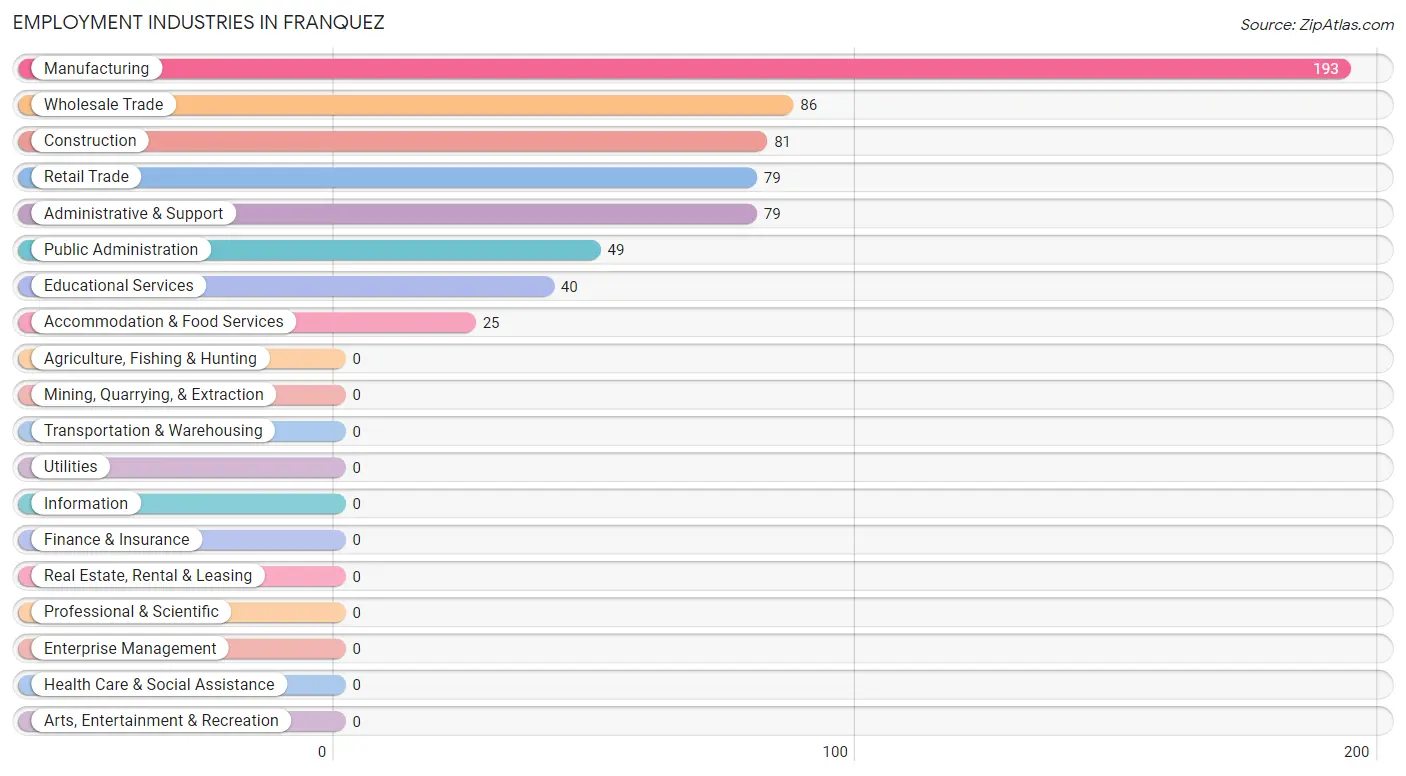
Employment Industries in Franquez
The major employment industries in Franquez include Manufacturing (193 | 30.5%), Wholesale Trade (86 | 13.6%), Construction (81 | 12.8%), Retail Trade (79 | 12.5%), and Administrative & Support (79 | 12.5%).
Employment Industries by Sex in Franquez
The Franquez industries that see more men than women are Construction (100.0%), Wholesale Trade (100.0%), and Accommodation & Food Services (100.0%), whereas the industries that tend to have a higher number of women are Educational Services (100.0%), Public Administration (100.0%), and Administrative & Support (70.9%).
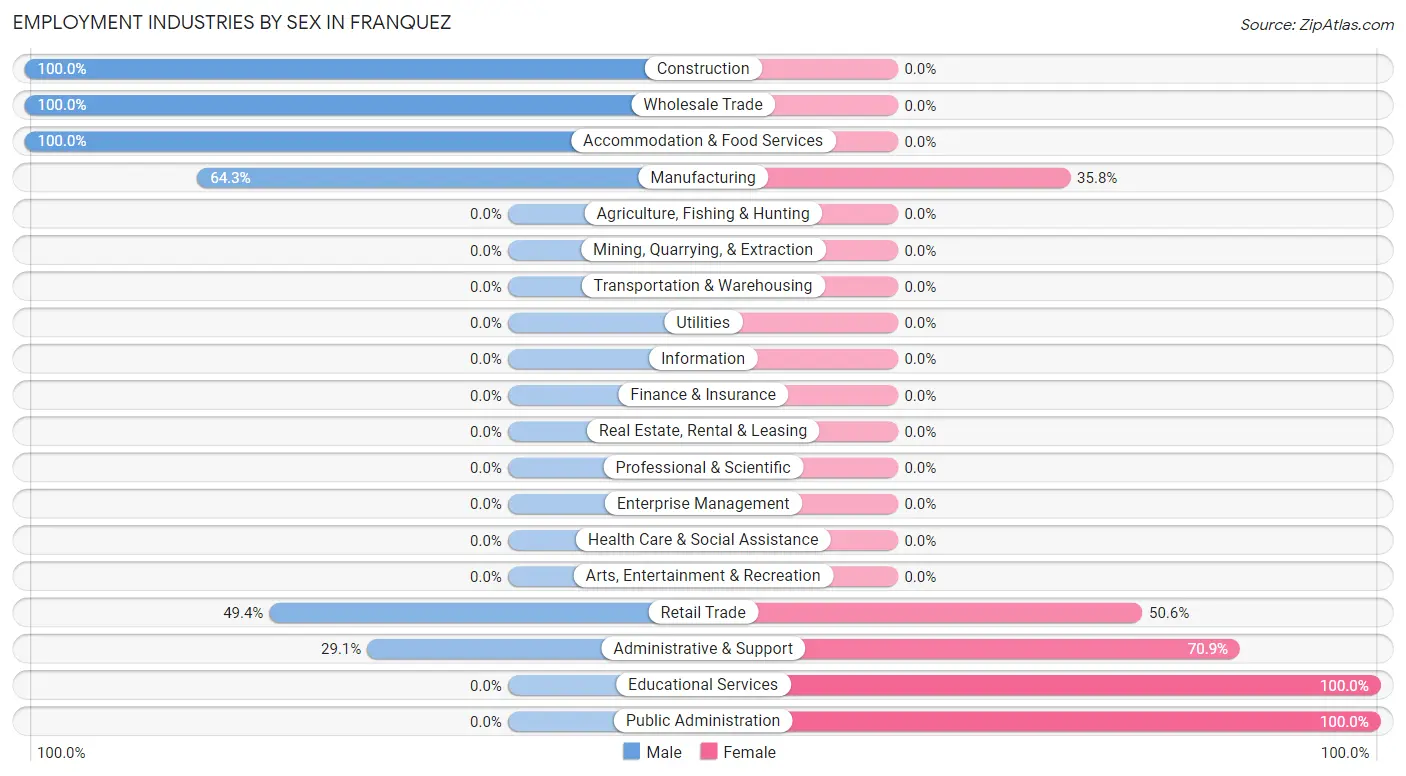
| Industry | Male | Female |
| Agriculture, Fishing & Hunting | 0 (0.0%) | 0 (0.0%) |
| Mining, Quarrying, & Extraction | 0 (0.0%) | 0 (0.0%) |
| Construction | 81 (100.0%) | 0 (0.0%) |
| Manufacturing | 124 (64.2%) | 69 (35.7%) |
| Wholesale Trade | 86 (100.0%) | 0 (0.0%) |
| Retail Trade | 39 (49.4%) | 40 (50.6%) |
| Transportation & Warehousing | 0 (0.0%) | 0 (0.0%) |
| Utilities | 0 (0.0%) | 0 (0.0%) |
| Information | 0 (0.0%) | 0 (0.0%) |
| Finance & Insurance | 0 (0.0%) | 0 (0.0%) |
| Real Estate, Rental & Leasing | 0 (0.0%) | 0 (0.0%) |
| Professional & Scientific | 0 (0.0%) | 0 (0.0%) |
| Enterprise Management | 0 (0.0%) | 0 (0.0%) |
| Administrative & Support | 23 (29.1%) | 56 (70.9%) |
| Educational Services | 0 (0.0%) | 40 (100.0%) |
| Health Care & Social Assistance | 0 (0.0%) | 0 (0.0%) |
| Arts, Entertainment & Recreation | 0 (0.0%) | 0 (0.0%) |
| Accommodation & Food Services | 25 (100.0%) | 0 (0.0%) |
| Public Administration | 0 (0.0%) | 49 (100.0%) |
| Total | 378 (59.8%) | 254 (40.2%) |
Education in Franquez
School Enrollment in Franquez
The most common levels of schooling among the 332 students in Franquez are high school (130 | 39.2%), elementary school (63 | 19.0%), and middle school (63 | 19.0%).
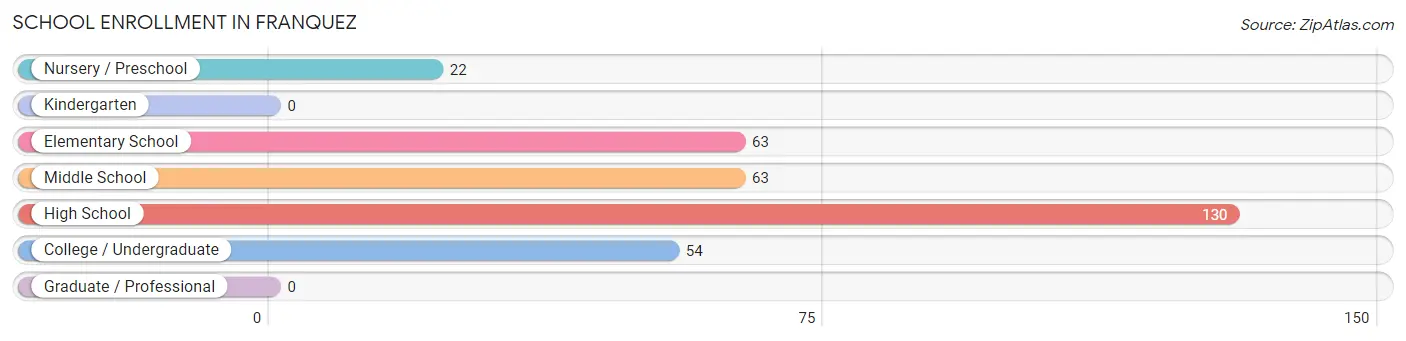
| School Level | # Students | % Students |
| Nursery / Preschool | 22 | 6.6% |
| Kindergarten | 0 | 0.0% |
| Elementary School | 63 | 19.0% |
| Middle School | 63 | 19.0% |
| High School | 130 | 39.2% |
| College / Undergraduate | 54 | 16.3% |
| Graduate / Professional | 0 | 0.0% |
| Total | 332 | 100.0% |
School Enrollment by Age by Funding Source in Franquez
Out of a total of 332 students who are enrolled in schools in Franquez, 54 (16.3%) attend a private institution, while the remaining 278 (83.7%) are enrolled in public schools. The age group of 20 to 24 year olds has the highest likelihood of being enrolled in private schools, with 54 (65.1% in the age bracket) enrolled. Conversely, the age group of 3 to 4 year olds has the lowest likelihood of being enrolled in a private school, with 22 (100.0% in the age bracket) attending a public institution.
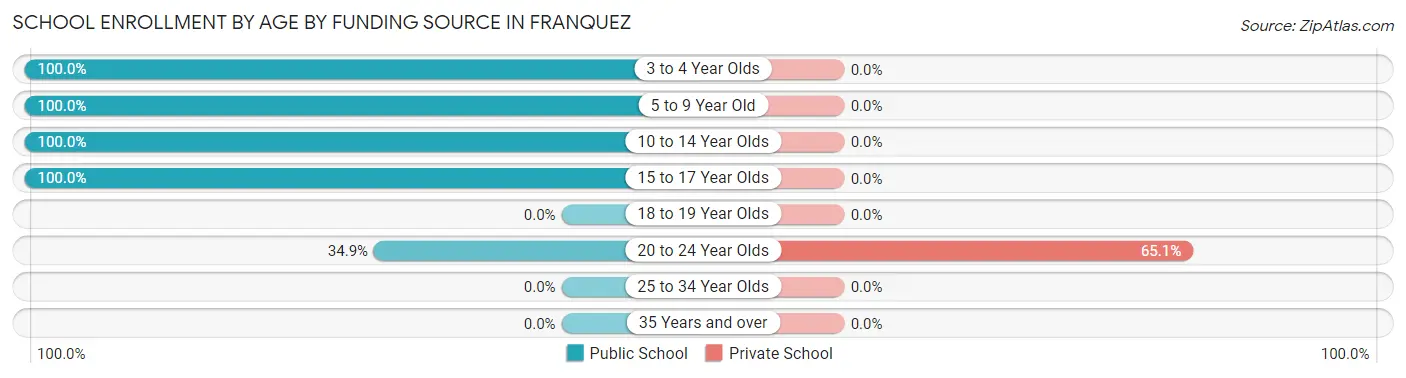
| Age Bracket | Public School | Private School |
| 3 to 4 Year Olds | 22 (100.0%) | 0 (0.0%) |
| 5 to 9 Year Old | 34 (100.0%) | 0 (0.0%) |
| 10 to 14 Year Olds | 92 (100.0%) | 0 (0.0%) |
| 15 to 17 Year Olds | 101 (100.0%) | 0 (0.0%) |
| 18 to 19 Year Olds | 0 (0.0%) | 0 (0.0%) |
| 20 to 24 Year Olds | 29 (34.9%) | 54 (65.1%) |
| 25 to 34 Year Olds | 0 (0.0%) | 0 (0.0%) |
| 35 Years and over | 0 (0.0%) | 0 (0.0%) |
| Total | 278 (83.7%) | 54 (16.3%) |
Educational Attainment by Field of Study in Franquez
Arts & humanities (70 | 47.9%), science & technology (34 | 23.3%), bio, nature & agricultural (23 | 15.8%), and business (19 | 13.0%) are the most common fields of study among 146 individuals in Franquez who have obtained a bachelor's degree or higher.
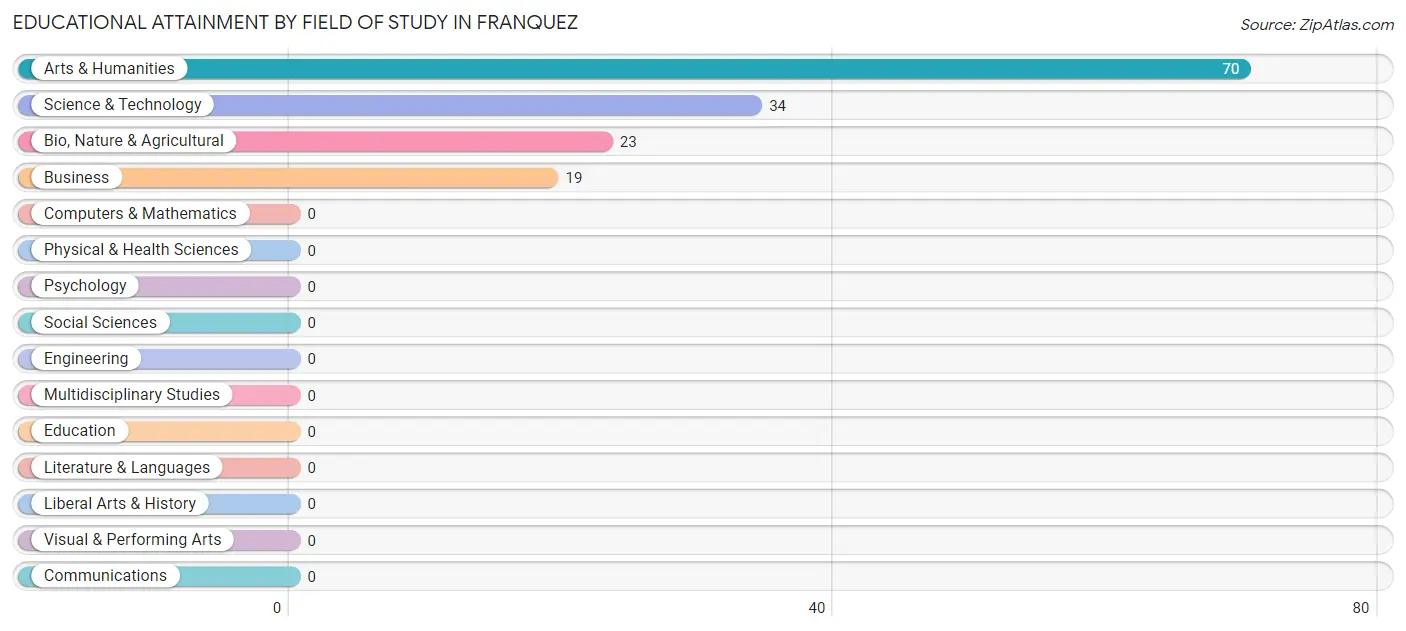
| Field of Study | # Graduates | % Graduates |
| Computers & Mathematics | 0 | 0.0% |
| Bio, Nature & Agricultural | 23 | 15.8% |
| Physical & Health Sciences | 0 | 0.0% |
| Psychology | 0 | 0.0% |
| Social Sciences | 0 | 0.0% |
| Engineering | 0 | 0.0% |
| Multidisciplinary Studies | 0 | 0.0% |
| Science & Technology | 34 | 23.3% |
| Business | 19 | 13.0% |
| Education | 0 | 0.0% |
| Literature & Languages | 0 | 0.0% |
| Liberal Arts & History | 0 | 0.0% |
| Visual & Performing Arts | 0 | 0.0% |
| Communications | 0 | 0.0% |
| Arts & Humanities | 70 | 47.9% |
| Total | 146 | 100.0% |
Transportation & Commute in Franquez
Vehicle Availability by Sex in Franquez
The most prevalent vehicle ownership categories in Franquez are males with 3 vehicles (218, accounting for 60.7%) and females with 3 vehicles (118, making up 90.8%).
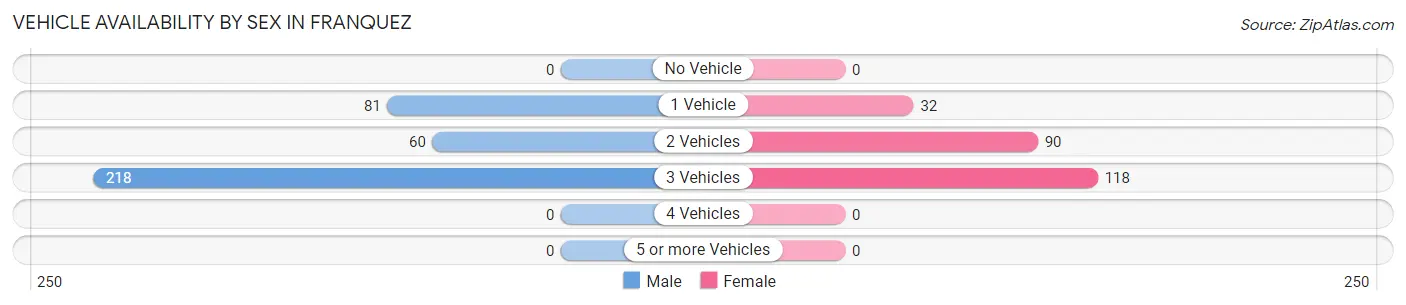
| Vehicles Available | Male | Female |
| No Vehicle | 0 (0.0%) | 0 (0.0%) |
| 1 Vehicle | 81 (22.6%) | 32 (13.3%) |
| 2 Vehicles | 60 (16.7%) | 90 (37.5%) |
| 3 Vehicles | 218 (60.7%) | 118 (49.2%) |
| 4 Vehicles | 0 (0.0%) | 0 (0.0%) |
| 5 or more Vehicles | 0 (0.0%) | 0 (0.0%) |
| Total | 359 (100.0%) | 240 (100.0%) |
Commute Time in Franquez
The most frequently occuring commute durations in Franquez are 10 to 14 minutes (129 commuters, 21.5%), 40 to 44 minutes (121 commuters, 20.2%), and 45 to 59 minutes (111 commuters, 18.5%).
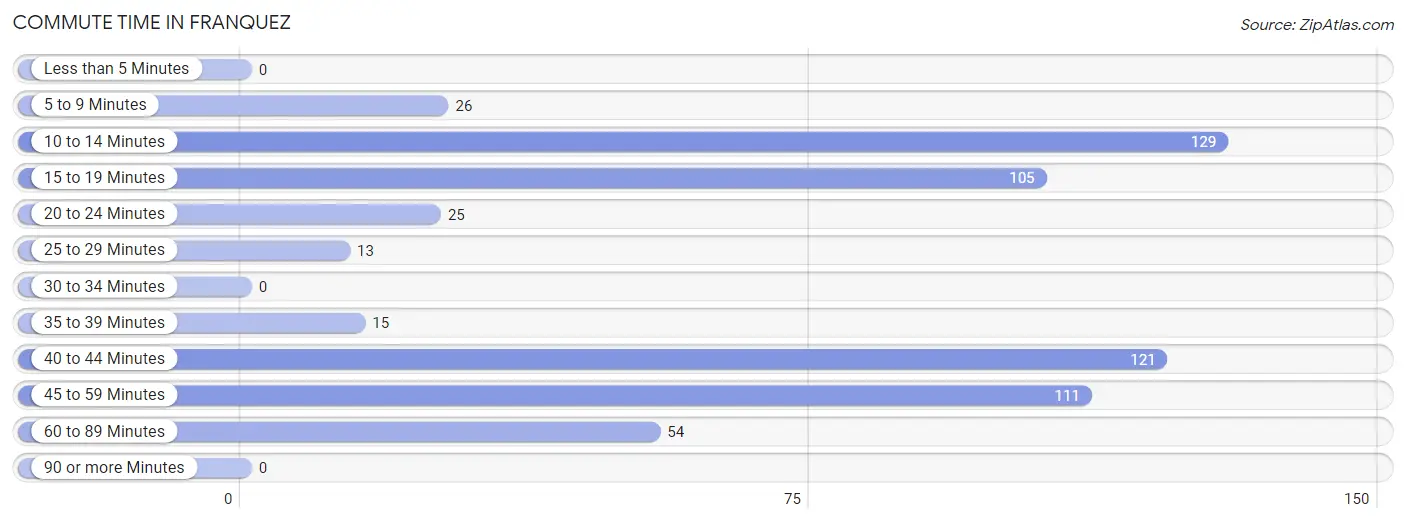
| Commute Time | # Commuters | % Commuters |
| Less than 5 Minutes | 0 | 0.0% |
| 5 to 9 Minutes | 26 | 4.3% |
| 10 to 14 Minutes | 129 | 21.5% |
| 15 to 19 Minutes | 105 | 17.5% |
| 20 to 24 Minutes | 25 | 4.2% |
| 25 to 29 Minutes | 13 | 2.2% |
| 30 to 34 Minutes | 0 | 0.0% |
| 35 to 39 Minutes | 15 | 2.5% |
| 40 to 44 Minutes | 121 | 20.2% |
| 45 to 59 Minutes | 111 | 18.5% |
| 60 to 89 Minutes | 54 | 9.0% |
| 90 or more Minutes | 0 | 0.0% |
Commute Time by Sex in Franquez
The most common commute times in Franquez are 45 to 59 minutes (111 commuters, 30.9%) for males and 10 to 14 minutes (103 commuters, 42.9%) for females.
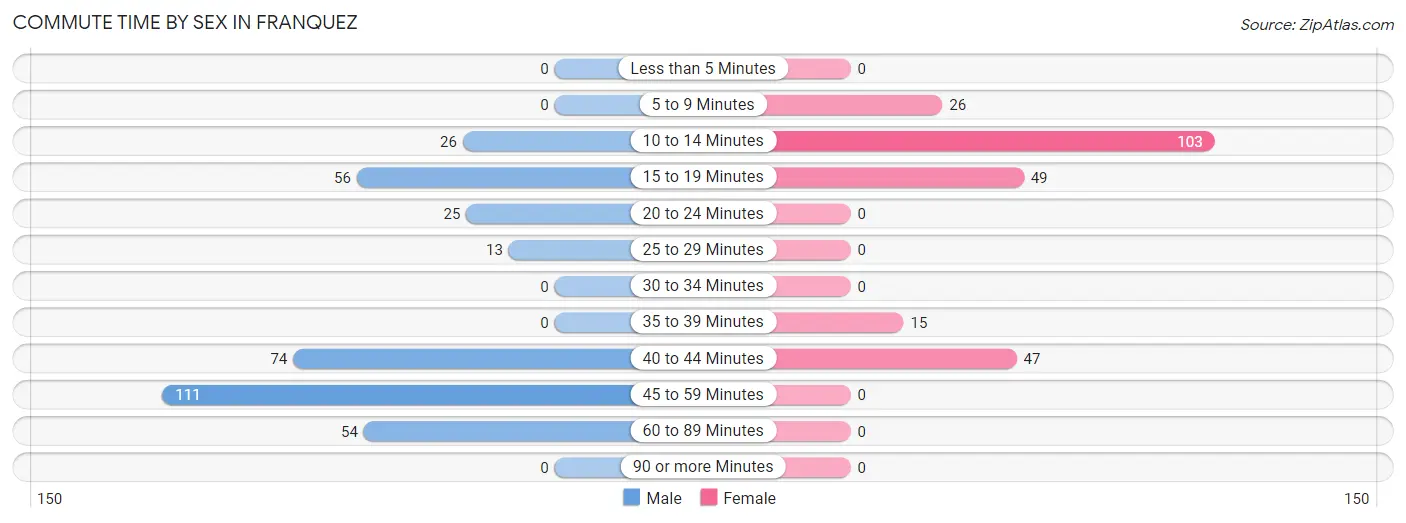
| Commute Time | Male | Female |
| Less than 5 Minutes | 0 (0.0%) | 0 (0.0%) |
| 5 to 9 Minutes | 0 (0.0%) | 26 (10.8%) |
| 10 to 14 Minutes | 26 (7.2%) | 103 (42.9%) |
| 15 to 19 Minutes | 56 (15.6%) | 49 (20.4%) |
| 20 to 24 Minutes | 25 (7.0%) | 0 (0.0%) |
| 25 to 29 Minutes | 13 (3.6%) | 0 (0.0%) |
| 30 to 34 Minutes | 0 (0.0%) | 0 (0.0%) |
| 35 to 39 Minutes | 0 (0.0%) | 15 (6.2%) |
| 40 to 44 Minutes | 74 (20.6%) | 47 (19.6%) |
| 45 to 59 Minutes | 111 (30.9%) | 0 (0.0%) |
| 60 to 89 Minutes | 54 (15.0%) | 0 (0.0%) |
| 90 or more Minutes | 0 (0.0%) | 0 (0.0%) |
Time of Departure to Work by Sex in Franquez
The most frequent times of departure to work in Franquez are 7:00 AM to 7:29 AM (155, 43.2%) for males and 7:00 AM to 7:29 AM (98, 40.8%) for females.
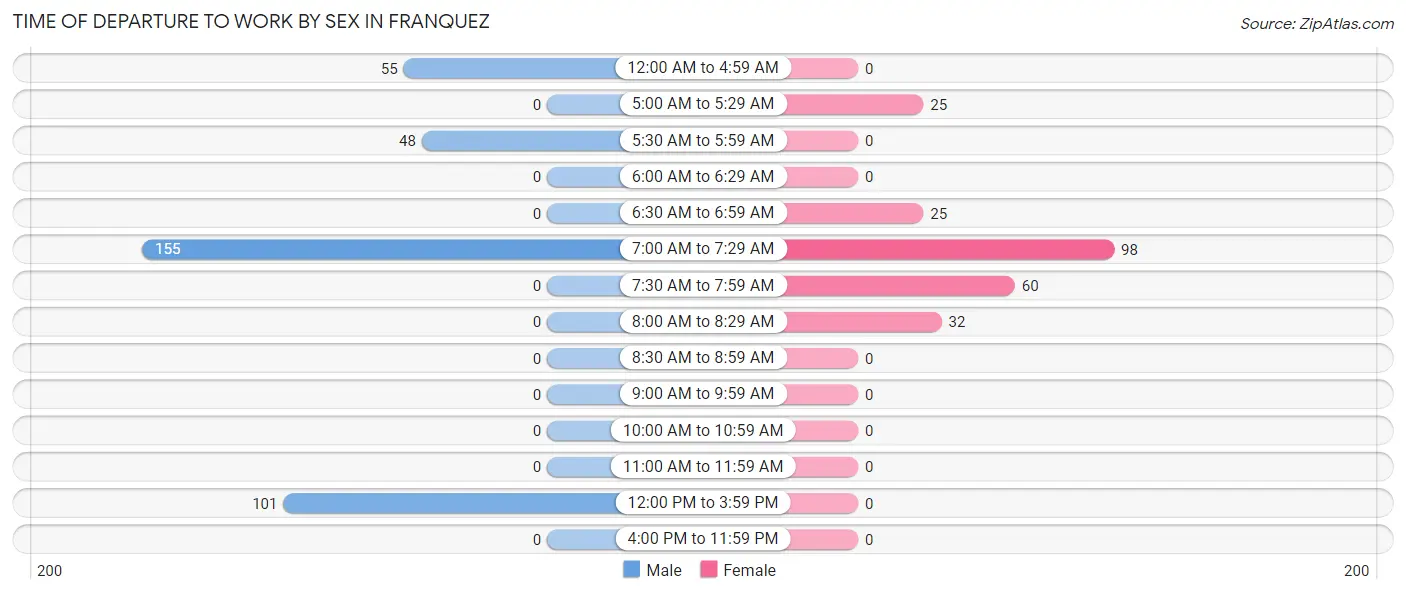
| Time of Departure | Male | Female |
| 12:00 AM to 4:59 AM | 55 (15.3%) | 0 (0.0%) |
| 5:00 AM to 5:29 AM | 0 (0.0%) | 25 (10.4%) |
| 5:30 AM to 5:59 AM | 48 (13.4%) | 0 (0.0%) |
| 6:00 AM to 6:29 AM | 0 (0.0%) | 0 (0.0%) |
| 6:30 AM to 6:59 AM | 0 (0.0%) | 25 (10.4%) |
| 7:00 AM to 7:29 AM | 155 (43.2%) | 98 (40.8%) |
| 7:30 AM to 7:59 AM | 0 (0.0%) | 60 (25.0%) |
| 8:00 AM to 8:29 AM | 0 (0.0%) | 32 (13.3%) |
| 8:30 AM to 8:59 AM | 0 (0.0%) | 0 (0.0%) |
| 9:00 AM to 9:59 AM | 0 (0.0%) | 0 (0.0%) |
| 10:00 AM to 10:59 AM | 0 (0.0%) | 0 (0.0%) |
| 11:00 AM to 11:59 AM | 0 (0.0%) | 0 (0.0%) |
| 12:00 PM to 3:59 PM | 101 (28.1%) | 0 (0.0%) |
| 4:00 PM to 11:59 PM | 0 (0.0%) | 0 (0.0%) |
| Total | 359 (100.0%) | 240 (100.0%) |
Housing Occupancy in Franquez
Occupancy by Ownership in Franquez
Of the total 564 dwellings in Franquez, owner-occupied units account for 435 (77.1%), while renter-occupied units make up 129 (22.9%).
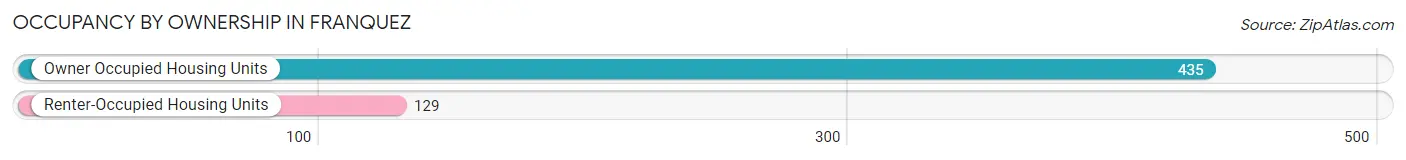
| Occupancy | # Housing Units | % Housing Units |
| Owner Occupied Housing Units | 435 | 77.1% |
| Renter-Occupied Housing Units | 129 | 22.9% |
| Total Occupied Housing Units | 564 | 100.0% |
Occupancy by Household Size in Franquez
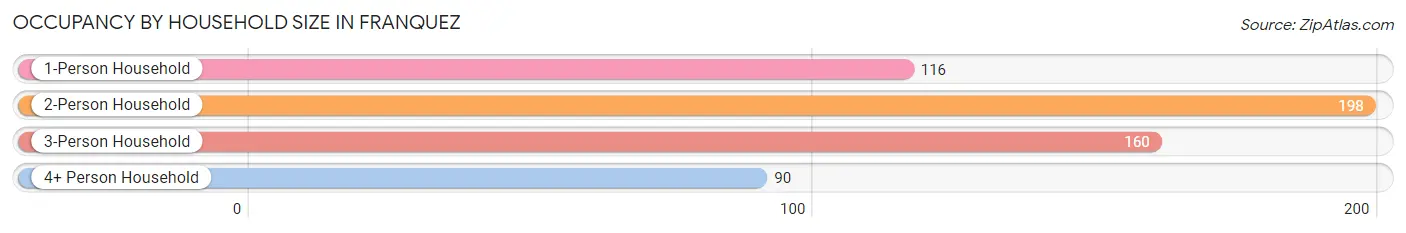
| Household Size | # Housing Units | % Housing Units |
| 1-Person Household | 116 | 20.6% |
| 2-Person Household | 198 | 35.1% |
| 3-Person Household | 160 | 28.4% |
| 4+ Person Household | 90 | 16.0% |
| Total Housing Units | 564 | 100.0% |
Occupancy by Ownership by Household Size in Franquez
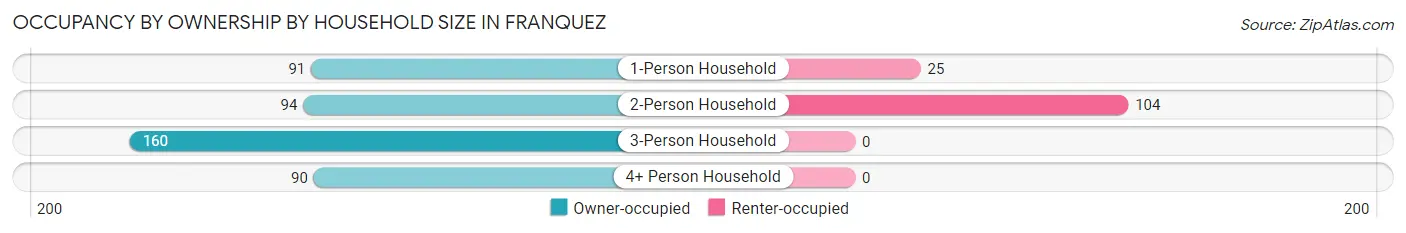
| Household Size | Owner-occupied | Renter-occupied |
| 1-Person Household | 91 (78.4%) | 25 (21.5%) |
| 2-Person Household | 94 (47.5%) | 104 (52.5%) |
| 3-Person Household | 160 (100.0%) | 0 (0.0%) |
| 4+ Person Household | 90 (100.0%) | 0 (0.0%) |
| Total Housing Units | 435 (77.1%) | 129 (22.9%) |
Occupancy by Educational Attainment in Franquez
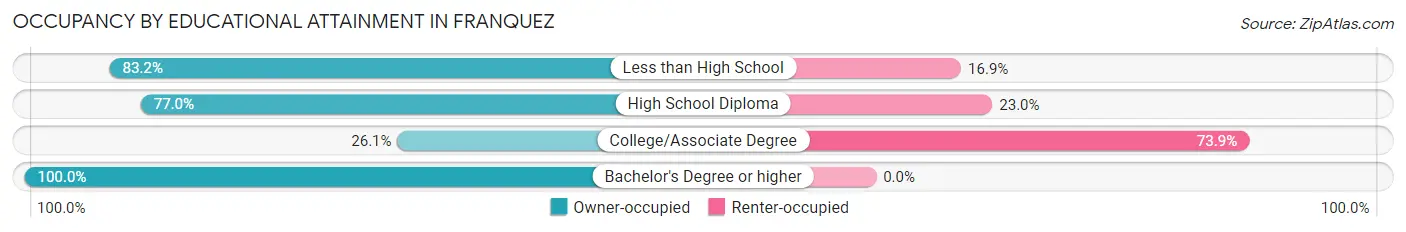
| Household Size | Owner-occupied | Renter-occupied |
| Less than High School | 153 (83.2%) | 31 (16.9%) |
| High School Diploma | 157 (77.0%) | 47 (23.0%) |
| College/Associate Degree | 18 (26.1%) | 51 (73.9%) |
| Bachelor's Degree or higher | 107 (100.0%) | 0 (0.0%) |
Occupancy by Age of Householder in Franquez
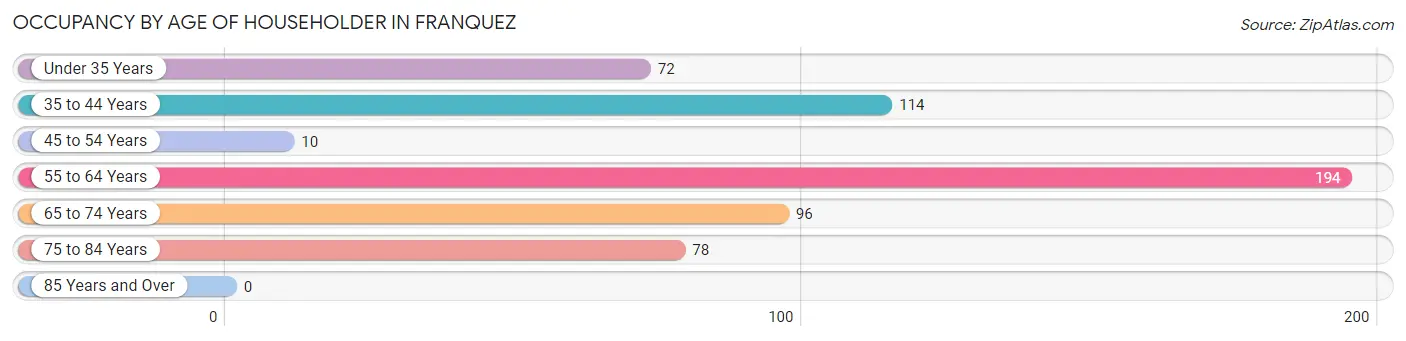
| Age Bracket | # Households | % Households |
| Under 35 Years | 72 | 12.8% |
| 35 to 44 Years | 114 | 20.2% |
| 45 to 54 Years | 10 | 1.8% |
| 55 to 64 Years | 194 | 34.4% |
| 65 to 74 Years | 96 | 17.0% |
| 75 to 84 Years | 78 | 13.8% |
| 85 Years and Over | 0 | 0.0% |
| Total | 564 | 100.0% |
Housing Finances in Franquez
Median Income by Occupancy in Franquez
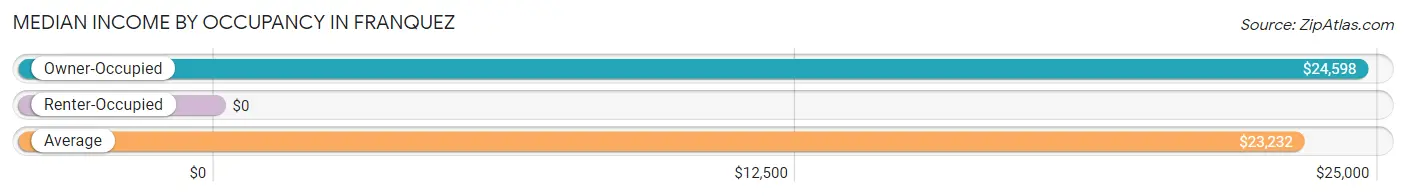
| Occupancy Type | # Households | Median Income |
| Owner-Occupied | 435 (77.1%) | $24,598 |
| Renter-Occupied | 129 (22.9%) | $0 |
| Average | 564 (100.0%) | $23,232 |
Occupancy by Householder Income Bracket in Franquez
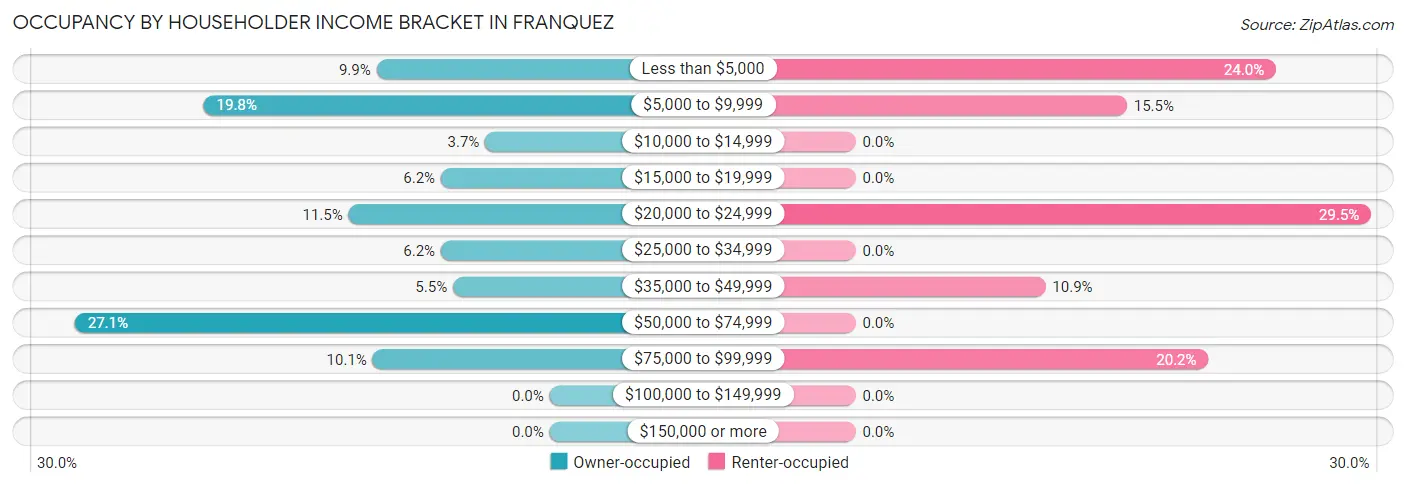
| Income Bracket | Owner-occupied | Renter-occupied |
| Less than $5,000 | 43 (9.9%) | 31 (24.0%) |
| $5,000 to $9,999 | 86 (19.8%) | 20 (15.5%) |
| $10,000 to $14,999 | 16 (3.7%) | 0 (0.0%) |
| $15,000 to $19,999 | 27 (6.2%) | 0 (0.0%) |
| $20,000 to $24,999 | 50 (11.5%) | 38 (29.5%) |
| $25,000 to $34,999 | 27 (6.2%) | 0 (0.0%) |
| $35,000 to $49,999 | 24 (5.5%) | 14 (10.8%) |
| $50,000 to $74,999 | 118 (27.1%) | 0 (0.0%) |
| $75,000 to $99,999 | 44 (10.1%) | 26 (20.2%) |
| $100,000 to $149,999 | 0 (0.0%) | 0 (0.0%) |
| $150,000 or more | 0 (0.0%) | 0 (0.0%) |
| Total | 435 (100.0%) | 129 (100.0%) |
Monthly Housing Cost Tiers in Franquez
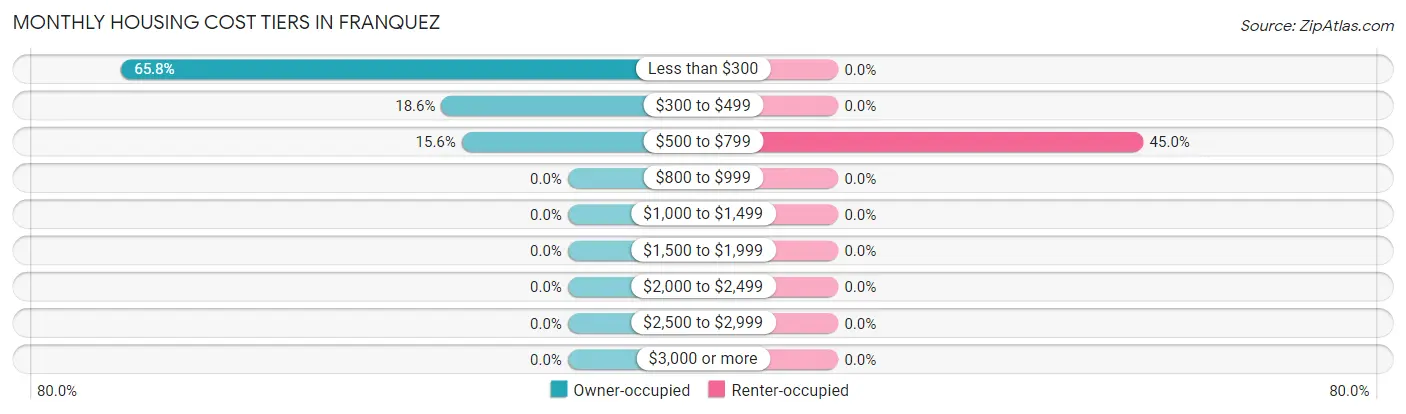
| Monthly Cost | Owner-occupied | Renter-occupied |
| Less than $300 | 286 (65.7%) | 0 (0.0%) |
| $300 to $499 | 81 (18.6%) | 0 (0.0%) |
| $500 to $799 | 68 (15.6%) | 58 (45.0%) |
| $800 to $999 | 0 (0.0%) | 0 (0.0%) |
| $1,000 to $1,499 | 0 (0.0%) | 0 (0.0%) |
| $1,500 to $1,999 | 0 (0.0%) | 0 (0.0%) |
| $2,000 to $2,499 | 0 (0.0%) | 0 (0.0%) |
| $2,500 to $2,999 | 0 (0.0%) | 0 (0.0%) |
| $3,000 or more | 0 (0.0%) | 0 (0.0%) |
| Total | 435 (100.0%) | 129 (100.0%) |
Physical Housing Characteristics in Franquez
Housing Structures in Franquez
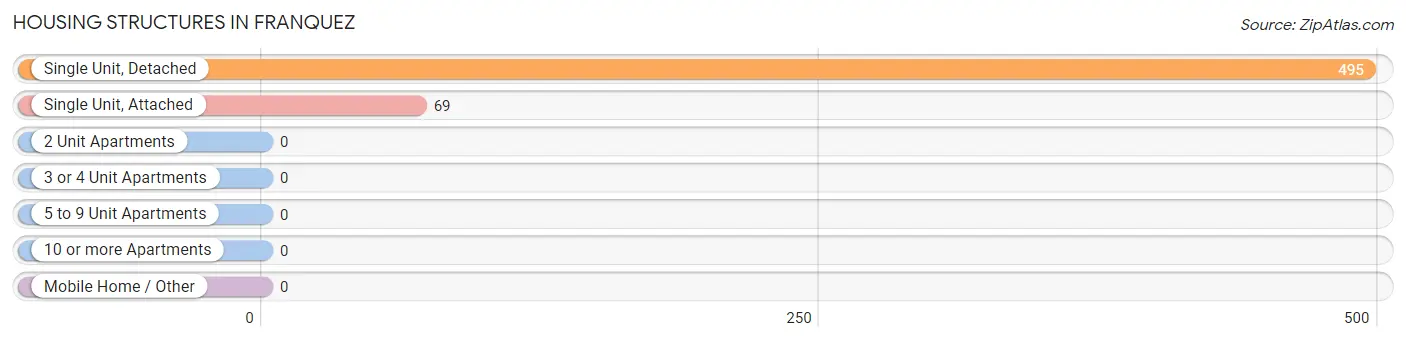
| Structure Type | # Housing Units | % Housing Units |
| Single Unit, Detached | 495 | 87.8% |
| Single Unit, Attached | 69 | 12.2% |
| 2 Unit Apartments | 0 | 0.0% |
| 3 or 4 Unit Apartments | 0 | 0.0% |
| 5 to 9 Unit Apartments | 0 | 0.0% |
| 10 or more Apartments | 0 | 0.0% |
| Mobile Home / Other | 0 | 0.0% |
| Total | 564 | 100.0% |
Housing Structures by Occupancy in Franquez
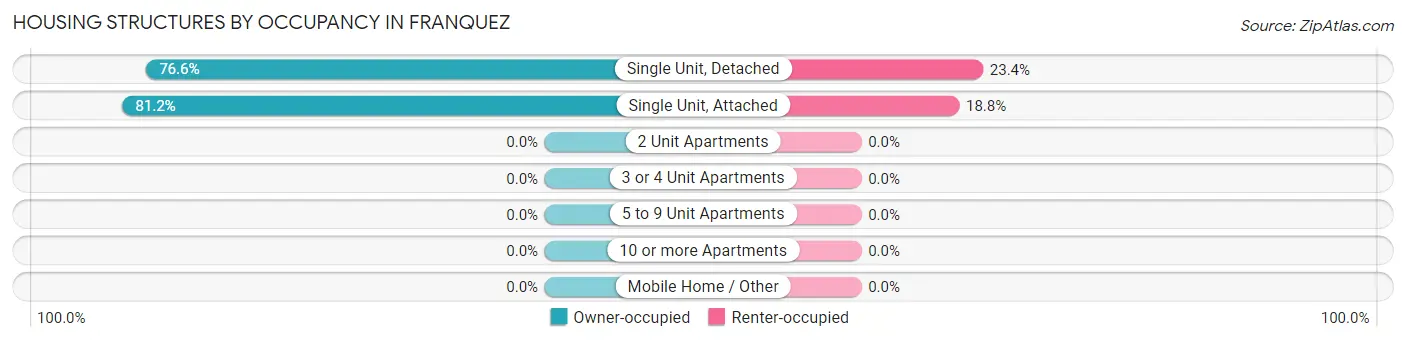
| Structure Type | Owner-occupied | Renter-occupied |
| Single Unit, Detached | 379 (76.6%) | 116 (23.4%) |
| Single Unit, Attached | 56 (81.2%) | 13 (18.8%) |
| 2 Unit Apartments | 0 (0.0%) | 0 (0.0%) |
| 3 or 4 Unit Apartments | 0 (0.0%) | 0 (0.0%) |
| 5 to 9 Unit Apartments | 0 (0.0%) | 0 (0.0%) |
| 10 or more Apartments | 0 (0.0%) | 0 (0.0%) |
| Mobile Home / Other | 0 (0.0%) | 0 (0.0%) |
| Total | 435 (77.1%) | 129 (22.9%) |
Housing Structures by Number of Rooms in Franquez
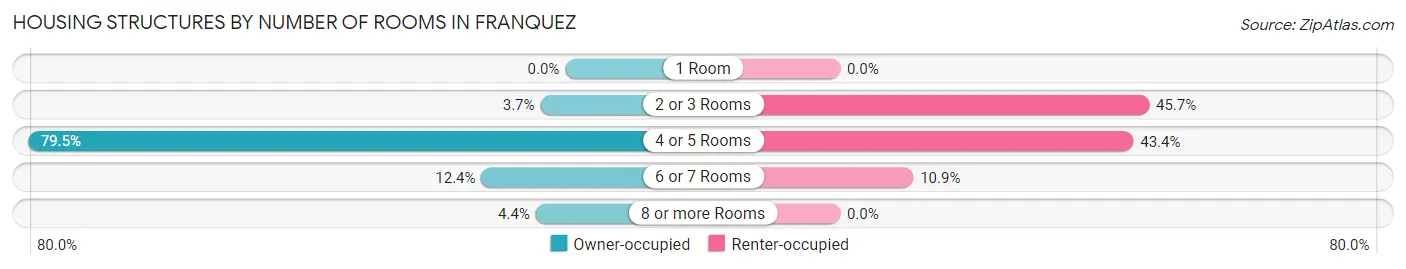
| Number of Rooms | Owner-occupied | Renter-occupied |
| 1 Room | 0 (0.0%) | 0 (0.0%) |
| 2 or 3 Rooms | 16 (3.7%) | 59 (45.7%) |
| 4 or 5 Rooms | 346 (79.5%) | 56 (43.4%) |
| 6 or 7 Rooms | 54 (12.4%) | 14 (10.8%) |
| 8 or more Rooms | 19 (4.4%) | 0 (0.0%) |
| Total | 435 (100.0%) | 129 (100.0%) |
Housing Structure by Heating Type in Franquez
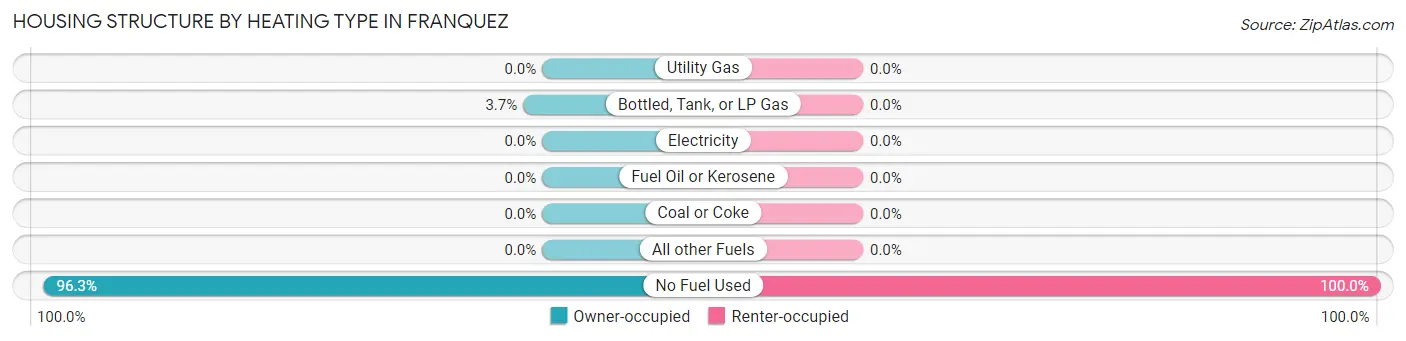
| Heating Type | Owner-occupied | Renter-occupied |
| Utility Gas | 0 (0.0%) | 0 (0.0%) |
| Bottled, Tank, or LP Gas | 16 (3.7%) | 0 (0.0%) |
| Electricity | 0 (0.0%) | 0 (0.0%) |
| Fuel Oil or Kerosene | 0 (0.0%) | 0 (0.0%) |
| Coal or Coke | 0 (0.0%) | 0 (0.0%) |
| All other Fuels | 0 (0.0%) | 0 (0.0%) |
| No Fuel Used | 419 (96.3%) | 129 (100.0%) |
| Total | 435 (100.0%) | 129 (100.0%) |
Household Vehicle Usage in Franquez
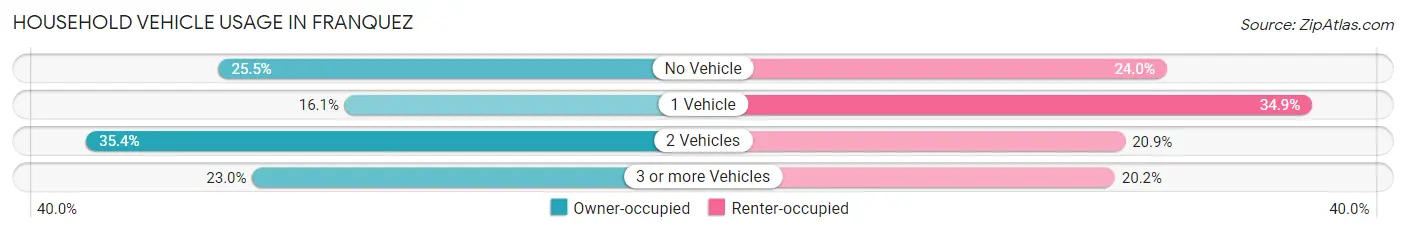
| Vehicles per Household | Owner-occupied | Renter-occupied |
| No Vehicle | 111 (25.5%) | 31 (24.0%) |
| 1 Vehicle | 70 (16.1%) | 45 (34.9%) |
| 2 Vehicles | 154 (35.4%) | 27 (20.9%) |
| 3 or more Vehicles | 100 (23.0%) | 26 (20.2%) |
| Total | 435 (100.0%) | 129 (100.0%) |
Real Estate & Mortgages in Franquez
Real Estate and Mortgage Overview in Franquez
| Characteristic | Without Mortgage | With Mortgage |
| Housing Units | 367 | 68 |
| Median Property Value | $105,300 | $0 |
| Median Household Income | $21,307 | $0 |
| Monthly Housing Costs | $226 | $0 |
| Real Estate Taxes | - | - |
Property Value by Mortgage Status in Franquez
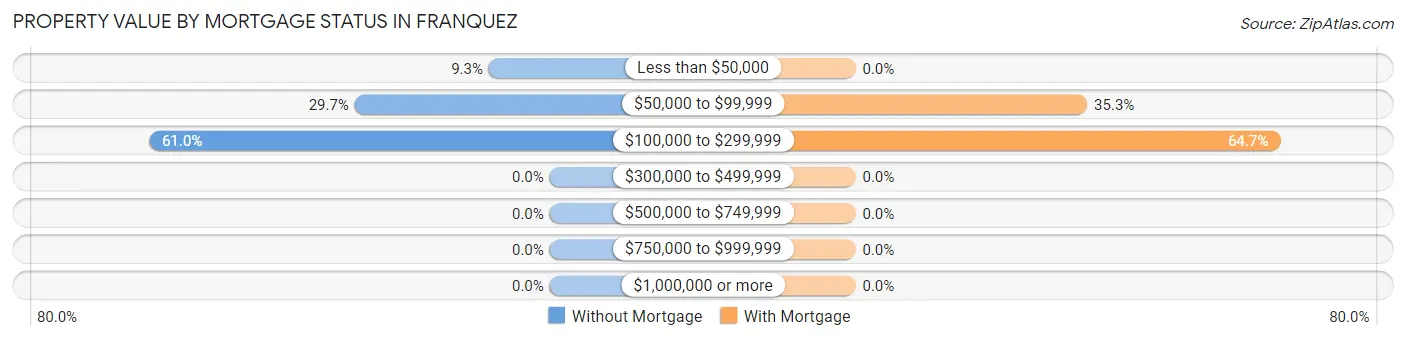
| Property Value | Without Mortgage | With Mortgage |
| Less than $50,000 | 34 (9.3%) | 0 (0.0%) |
| $50,000 to $99,999 | 109 (29.7%) | 24 (35.3%) |
| $100,000 to $299,999 | 224 (61.0%) | 44 (64.7%) |
| $300,000 to $499,999 | 0 (0.0%) | 0 (0.0%) |
| $500,000 to $749,999 | 0 (0.0%) | 0 (0.0%) |
| $750,000 to $999,999 | 0 (0.0%) | 0 (0.0%) |
| $1,000,000 or more | 0 (0.0%) | 0 (0.0%) |
| Total | 367 (100.0%) | 68 (100.0%) |
Household Income by Mortgage Status in Franquez
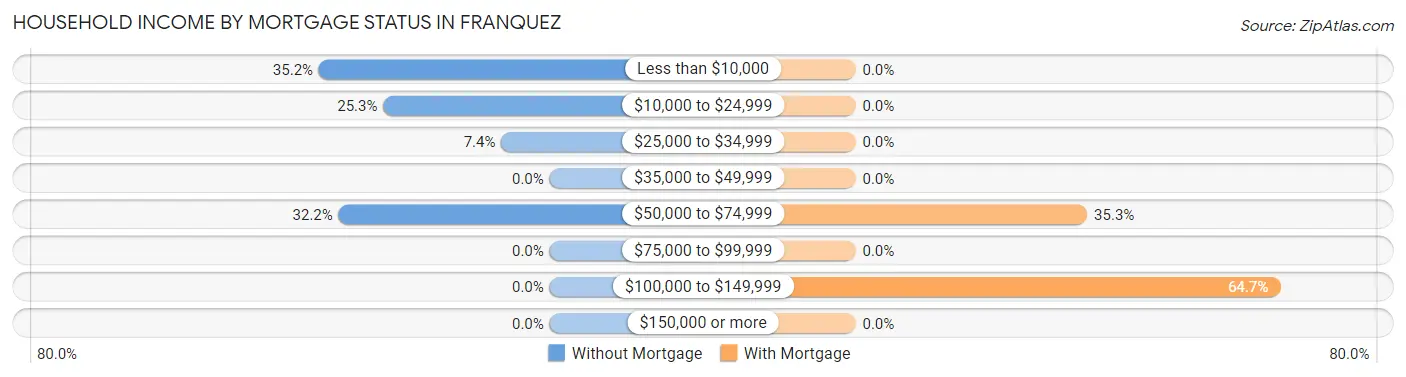
| Household Income | Without Mortgage | With Mortgage |
| Less than $10,000 | 129 (35.1%) | 0 (0.0%) |
| $10,000 to $24,999 | 93 (25.3%) | 0 (0.0%) |
| $25,000 to $34,999 | 27 (7.4%) | 0 (0.0%) |
| $35,000 to $49,999 | 0 (0.0%) | 0 (0.0%) |
| $50,000 to $74,999 | 118 (32.2%) | 24 (35.3%) |
| $75,000 to $99,999 | 0 (0.0%) | 0 (0.0%) |
| $100,000 to $149,999 | 0 (0.0%) | 44 (64.7%) |
| $150,000 or more | 0 (0.0%) | 0 (0.0%) |
| Total | 367 (100.0%) | 68 (100.0%) |
Property Value to Household Income Ratio in Franquez
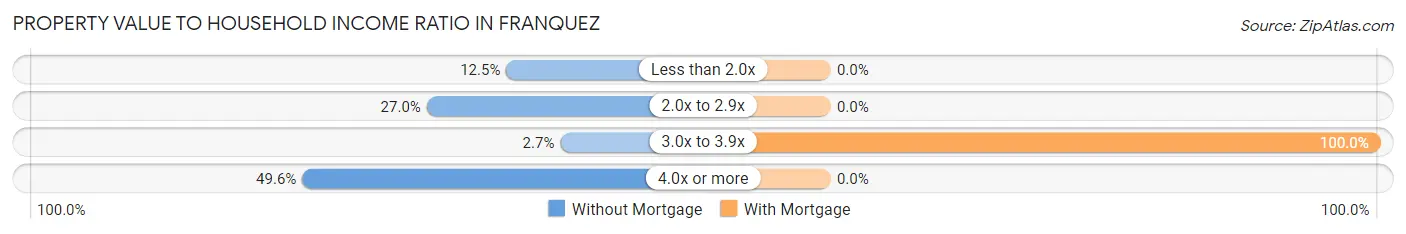
| Value-to-Income Ratio | Without Mortgage | With Mortgage |
| Less than 2.0x | 46 (12.5%) | 0 (0.0%) |
| 2.0x to 2.9x | 99 (27.0%) | 0 (0.0%) |
| 3.0x to 3.9x | 10 (2.7%) | 68 (100.0%) |
| 4.0x or more | 182 (49.6%) | 0 (0.0%) |
| Total | 367 (100.0%) | 68 (100.0%) |
Real Estate Taxes by Mortgage Status in Franquez
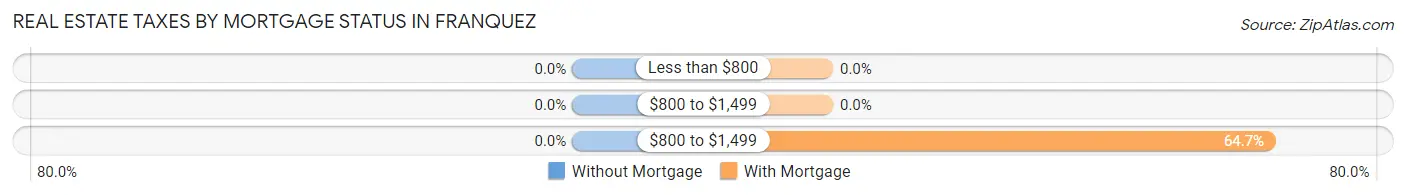
| Property Taxes | Without Mortgage | With Mortgage |
| Less than $800 | 0 (0.0%) | 0 (0.0%) |
| $800 to $1,499 | 0 (0.0%) | 0 (0.0%) |
| $800 to $1,499 | 0 (0.0%) | 44 (64.7%) |
| Total | 367 (100.0%) | 68 (100.0%) |
Health & Disability in Franquez
Health Insurance Coverage by Age in Franquez
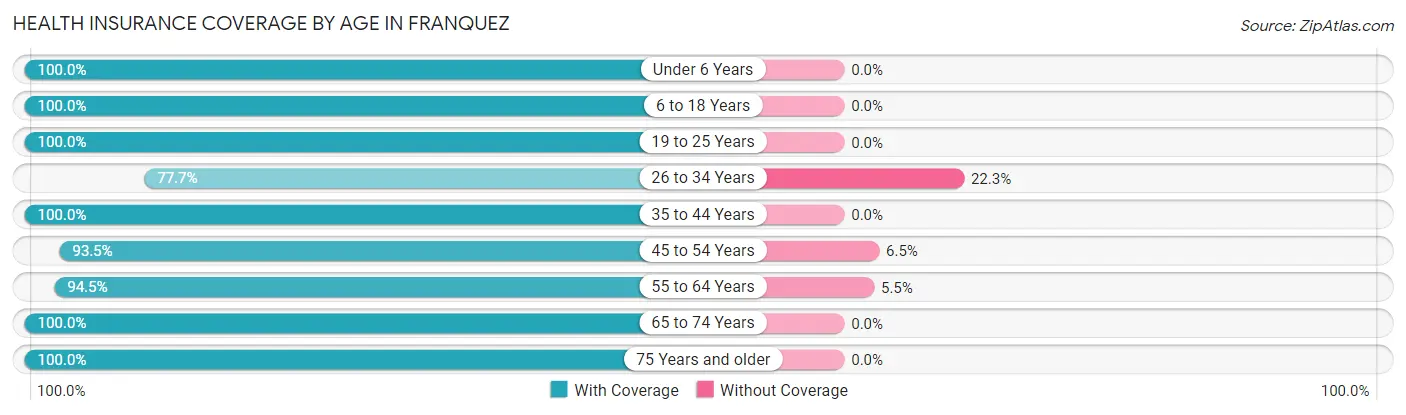
| Age Bracket | With Coverage | Without Coverage |
| Under 6 Years | 43 (100.0%) | 0 (0.0%) |
| 6 to 18 Years | 227 (100.0%) | 0 (0.0%) |
| 19 to 25 Years | 269 (100.0%) | 0 (0.0%) |
| 26 to 34 Years | 87 (77.7%) | 25 (22.3%) |
| 35 to 44 Years | 295 (100.0%) | 0 (0.0%) |
| 45 to 54 Years | 144 (93.5%) | 10 (6.5%) |
| 55 to 64 Years | 307 (94.5%) | 18 (5.5%) |
| 65 to 74 Years | 186 (100.0%) | 0 (0.0%) |
| 75 Years and older | 94 (100.0%) | 0 (0.0%) |
| Total | 1,652 (96.9%) | 53 (3.1%) |
Health Insurance Coverage by Citizenship Status in Franquez
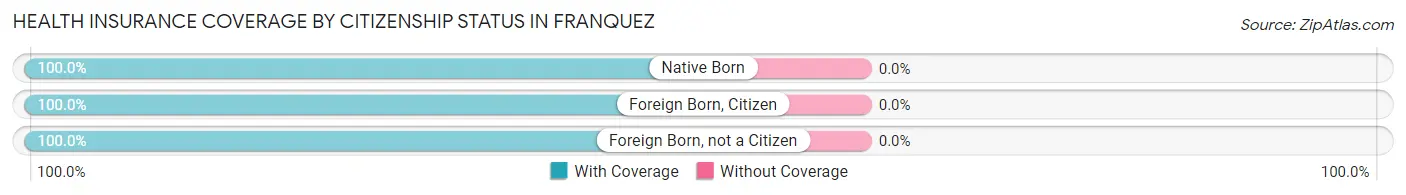
| Citizenship Status | With Coverage | Without Coverage |
| Native Born | 43 (100.0%) | 0 (0.0%) |
| Foreign Born, Citizen | 227 (100.0%) | 0 (0.0%) |
| Foreign Born, not a Citizen | 269 (100.0%) | 0 (0.0%) |
Health Insurance Coverage by Household Income in Franquez
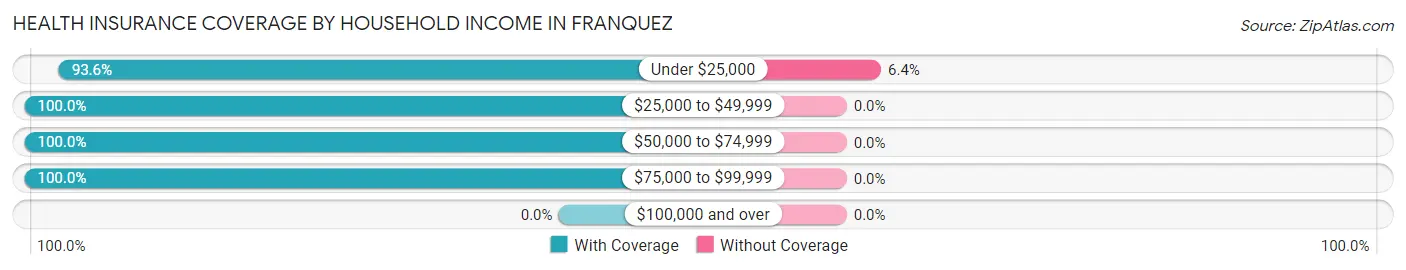
| Household Income | With Coverage | Without Coverage |
| Under $25,000 | 773 (93.6%) | 53 (6.4%) |
| $25,000 to $49,999 | 262 (100.0%) | 0 (0.0%) |
| $50,000 to $74,999 | 334 (100.0%) | 0 (0.0%) |
| $75,000 to $99,999 | 283 (100.0%) | 0 (0.0%) |
| $100,000 and over | 0 (0.0%) | 0 (0.0%) |
Public vs Private Health Insurance Coverage by Age in Franquez
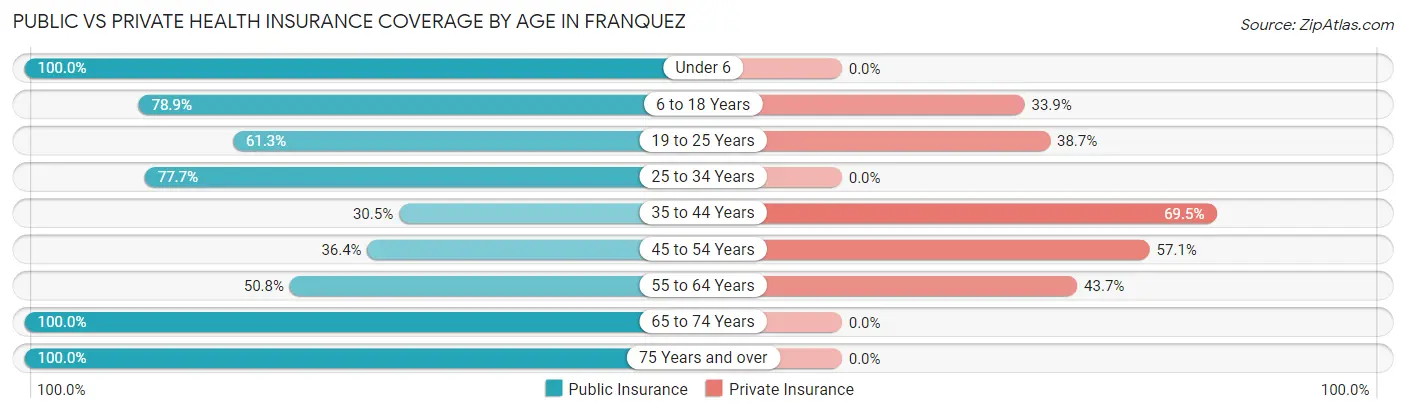
| Age Bracket | Public Insurance | Private Insurance |
| Under 6 | 43 (100.0%) | 0 (0.0%) |
| 6 to 18 Years | 179 (78.8%) | 77 (33.9%) |
| 19 to 25 Years | 165 (61.3%) | 104 (38.7%) |
| 25 to 34 Years | 87 (77.7%) | 0 (0.0%) |
| 35 to 44 Years | 90 (30.5%) | 205 (69.5%) |
| 45 to 54 Years | 56 (36.4%) | 88 (57.1%) |
| 55 to 64 Years | 165 (50.8%) | 142 (43.7%) |
| 65 to 74 Years | 186 (100.0%) | 0 (0.0%) |
| 75 Years and over | 94 (100.0%) | 0 (0.0%) |
| Total | 1,065 (62.5%) | 616 (36.1%) |
Disability Status by Sex by Age in Franquez
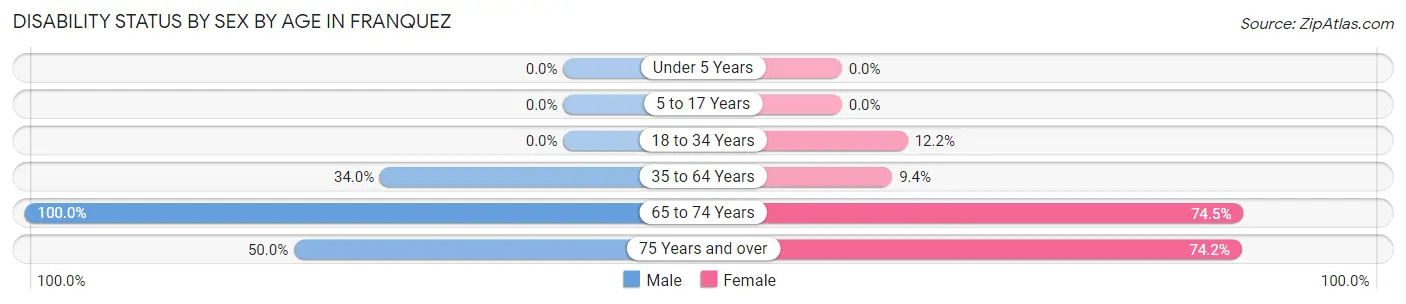
| Age Bracket | Male | Female |
| Under 5 Years | 0 (0.0%) | 0 (0.0%) |
| 5 to 17 Years | 0 (0.0%) | 0 (0.0%) |
| 18 to 34 Years | 0 (0.0%) | 29 (12.2%) |
| 35 to 64 Years | 147 (34.0%) | 32 (9.4%) |
| 65 to 74 Years | 84 (100.0%) | 76 (74.5%) |
| 75 Years and over | 16 (50.0%) | 46 (74.2%) |
Disability Class by Sex by Age in Franquez
Disability Class: Hearing Difficulty
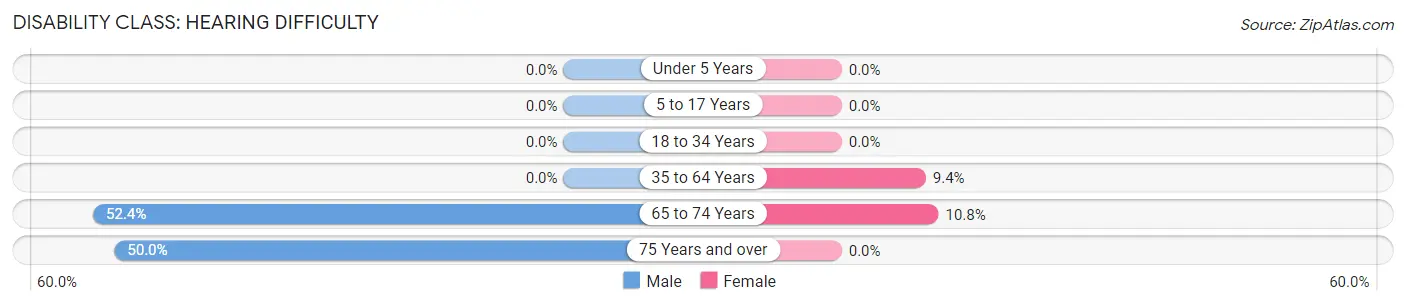
| Age Bracket | Male | Female |
| Under 5 Years | 0 (0.0%) | 0 (0.0%) |
| 5 to 17 Years | 0 (0.0%) | 0 (0.0%) |
| 18 to 34 Years | 0 (0.0%) | 0 (0.0%) |
| 35 to 64 Years | 0 (0.0%) | 32 (9.4%) |
| 65 to 74 Years | 44 (52.4%) | 11 (10.8%) |
| 75 Years and over | 16 (50.0%) | 0 (0.0%) |
Disability Class: Vision Difficulty
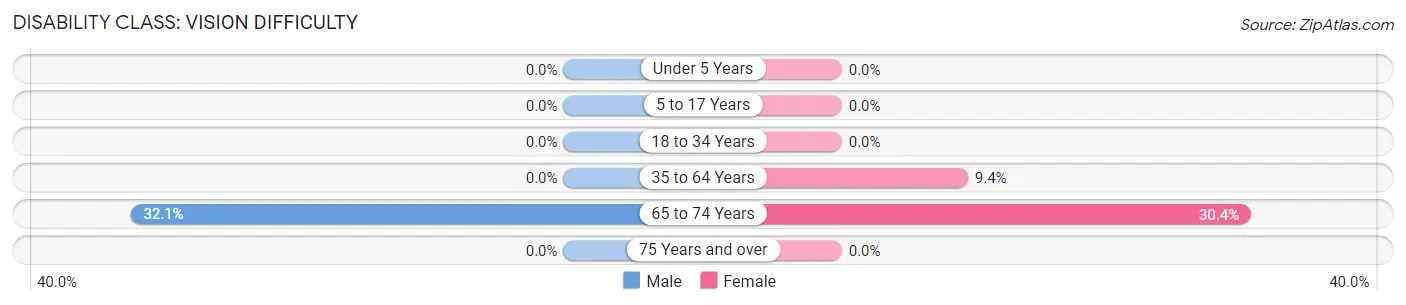
| Age Bracket | Male | Female |
| Under 5 Years | 0 (0.0%) | 0 (0.0%) |
| 5 to 17 Years | 0 (0.0%) | 0 (0.0%) |
| 18 to 34 Years | 0 (0.0%) | 0 (0.0%) |
| 35 to 64 Years | 0 (0.0%) | 32 (9.4%) |
| 65 to 74 Years | 27 (32.1%) | 31 (30.4%) |
| 75 Years and over | 0 (0.0%) | 0 (0.0%) |
Disability Class: Cognitive Difficulty
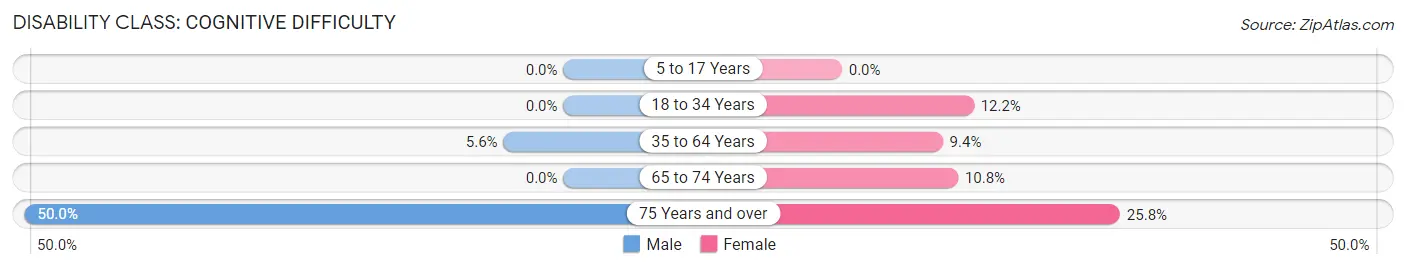
| Age Bracket | Male | Female |
| 5 to 17 Years | 0 (0.0%) | 0 (0.0%) |
| 18 to 34 Years | 0 (0.0%) | 29 (12.2%) |
| 35 to 64 Years | 24 (5.6%) | 32 (9.4%) |
| 65 to 74 Years | 0 (0.0%) | 11 (10.8%) |
| 75 Years and over | 16 (50.0%) | 16 (25.8%) |
Disability Class: Ambulatory Difficulty
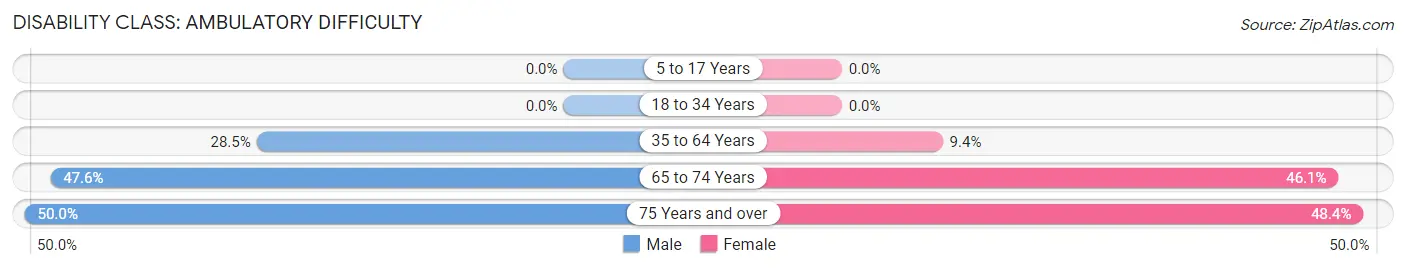
| Age Bracket | Male | Female |
| 5 to 17 Years | 0 (0.0%) | 0 (0.0%) |
| 18 to 34 Years | 0 (0.0%) | 0 (0.0%) |
| 35 to 64 Years | 123 (28.5%) | 32 (9.4%) |
| 65 to 74 Years | 40 (47.6%) | 47 (46.1%) |
| 75 Years and over | 16 (50.0%) | 30 (48.4%) |
Disability Class: Self-Care Difficulty
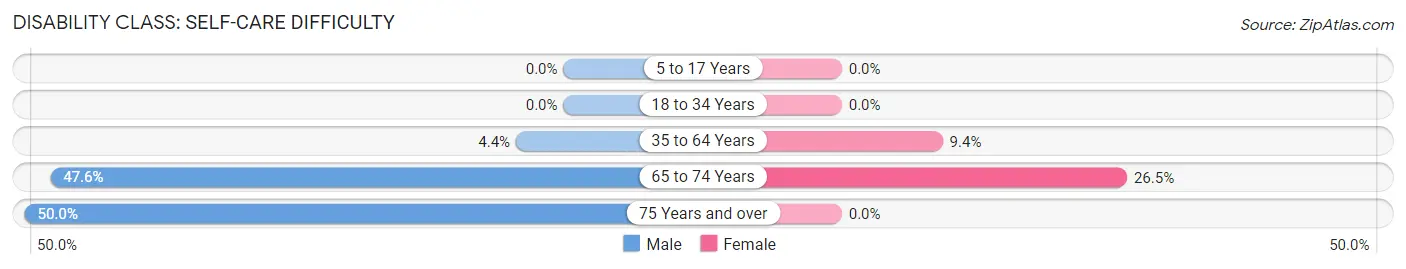
| Age Bracket | Male | Female |
| 5 to 17 Years | 0 (0.0%) | 0 (0.0%) |
| 18 to 34 Years | 0 (0.0%) | 0 (0.0%) |
| 35 to 64 Years | 19 (4.4%) | 32 (9.4%) |
| 65 to 74 Years | 40 (47.6%) | 27 (26.5%) |
| 75 Years and over | 16 (50.0%) | 0 (0.0%) |
Technology Access in Franquez
Computing Device Access in Franquez
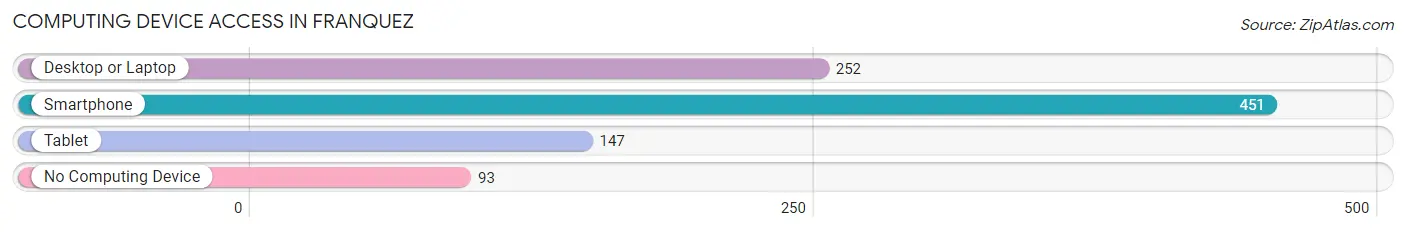
| Device Type | # Households | % Households |
| Desktop or Laptop | 252 | 44.7% |
| Smartphone | 451 | 80.0% |
| Tablet | 147 | 26.1% |
| No Computing Device | 93 | 16.5% |
| Total | 564 | 100.0% |
Internet Access in Franquez
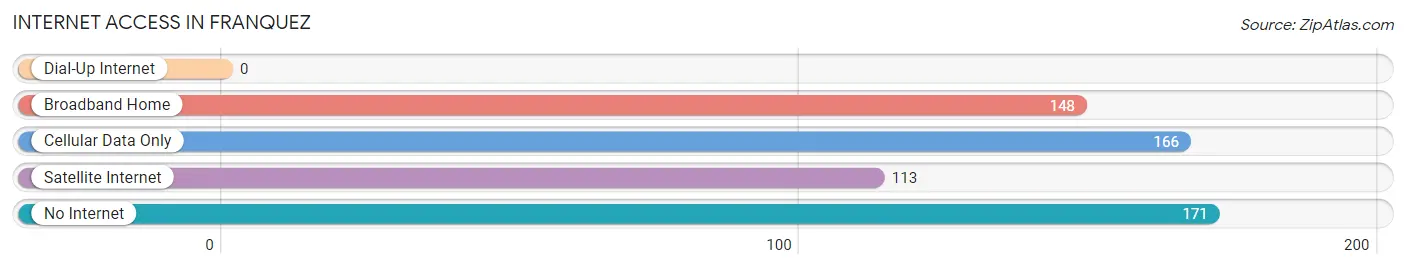
| Internet Type | # Households | % Households |
| Dial-Up Internet | 0 | 0.0% |
| Broadband Home | 148 | 26.2% |
| Cellular Data Only | 166 | 29.4% |
| Satellite Internet | 113 | 20.0% |
| No Internet | 171 | 30.3% |
| Total | 564 | 100.0% |
Franquez Summary
Puerto Rico is an unincorporated territory of the United States located in the Caribbean Sea. It is the easternmost and smallest of the Greater Antilles, and is composed of the main island of Puerto Rico and several smaller islands. The island has a rich history, diverse geography, vibrant economy, and unique demographics.
History
Puerto Rico has a long and varied history, beginning with the arrival of the Taíno people in the region around 1000 AD. The Taíno were a peaceful people who lived in small villages and practiced agriculture. They were eventually conquered by the Spanish in the late 15th century, and the island became a Spanish colony. During the colonial period, the island was used as a base for Spanish exploration and conquest of the Americas.
In 1898, Puerto Rico was ceded to the United States as part of the Treaty of Paris, which ended the Spanish-American War. The island became an unincorporated territory of the United States, and was granted limited autonomy. In 1917, the Jones-Shafroth Act granted Puerto Ricans US citizenship, and in 1952, the island was granted the status of a Commonwealth of the United States.
Geography
Puerto Rico is located in the Caribbean Sea, east of the Dominican Republic and west of the Virgin Islands. The main island is approximately 100 miles long and 35 miles wide, and is surrounded by several smaller islands. The terrain is mostly mountainous, with the highest peak being Cerro de Punta at 4,390 feet. The climate is tropical, with temperatures ranging from the mid-70s to the mid-80s year-round.
Economy
Puerto Rico has a vibrant economy, with a GDP of $103 billion in 2019. The economy is largely driven by tourism, manufacturing, and services. The island is home to several large pharmaceutical companies, and is a major producer of medical devices. The government also plays a major role in the economy, providing jobs and services to the population.
Demographics
Puerto Rico has a population of 3.2 million people, with the majority of the population being of Hispanic or Latino descent. Spanish is the official language, although English is also widely spoken. The majority of the population is Roman Catholic, and the island has a vibrant culture with a mix of Spanish, African, and indigenous influences.
Puerto Rico is a unique and vibrant place, with a rich history, diverse geography, vibrant economy, and unique demographics. It is an important part of the United States, and its people are proud of their heritage and culture.
Common Questions
What is Per Capita Income in Franquez?
Per Capita income in Franquez is $12,593.
What is the Median Family Income in Franquez?
Median Family Income in Franquez is $43,125.
What is the Median Household income in Franquez?
Median Household Income in Franquez is $23,232.
What is Income or Wage Gap in Franquez?
Income or Wage Gap in Franquez is 23.9%.
Women in Franquez earn 76.1 cents for every dollar earned by a man.
What is Inequality or Gini Index in Franquez?
Inequality or Gini Index in Franquez is 0.48.
What is the Total Population of Franquez?
Total Population of Franquez is 1,705.
What is the Total Male Population of Franquez?
Total Male Population of Franquez is 764.
What is the Total Female Population of Franquez?
Total Female Population of Franquez is 941.
What is the Ratio of Males per 100 Females in Franquez?
There are 81.19 Males per 100 Females in Franquez.
What is the Ratio of Females per 100 Males in Franquez?
There are 123.17 Females per 100 Males in Franquez.
What is the Median Population Age in Franquez?
Median Population Age in Franquez is 41.2 Years.
What is the Average Family Size in Franquez
Average Family Size in Franquez is 3.4 People.
What is the Average Household Size in Franquez
Average Household Size in Franquez is 3.0 People.
How Large is the Labor Force in Franquez?
There are 735 People in the Labor Forcein in Franquez.
What is the Percentage of People in the Labor Force in Franquez?
49.4% of People are in the Labor Force in Franquez.
What is the Unemployment Rate in Franquez?
Unemployment Rate in Franquez is 14.0%.