Siesta Key, FL Map & Demographics
Siesta Key Map
Siesta Key Overview
$108,974
PER CAPITA INCOME
$136,080
AVG FAMILY INCOME
$113,500
AVG HOUSEHOLD INCOME
57.0%
WAGE / INCOME GAP [ % ]
43.0¢/ $1
WAGE / INCOME GAP [ $ ]
0.56
INEQUALITY / GINI INDEX
5,535
TOTAL POPULATION
2,739
MALE POPULATION
2,796
FEMALE POPULATION
97.96
MALES / 100 FEMALES
102.08
FEMALES / 100 MALES
66.9
MEDIAN AGE
2.2
AVG FAMILY SIZE
1.9
AVG HOUSEHOLD SIZE
1,689
LABOR FORCE [ PEOPLE ]
32.3%
PERCENT IN LABOR FORCE
4.9%
UNEMPLOYMENT RATE
Siesta Key Area Codes
Income in Siesta Key
Income Overview in Siesta Key
Per Capita Income in Siesta Key is $108,974, while median incomes of families and households are $136,080 and $113,500 respectively.
| Characteristic | Number | Measure |
| Per Capita Income | 5,535 | $108,974 |
| Median Family Income | 1,881 | $136,080 |
| Mean Family Income | 1,881 | $255,808 |
| Median Household Income | 2,986 | $113,500 |
| Mean Household Income | 2,986 | $202,158 |
| Income Deficit | 1,881 | $0 |
| Wage / Income Gap (%) | 5,535 | 57.03% |
| Wage / Income Gap ($) | 5,535 | 42.97¢ per $1 |
| Gini / Inequality Index | 5,535 | 0.56 |
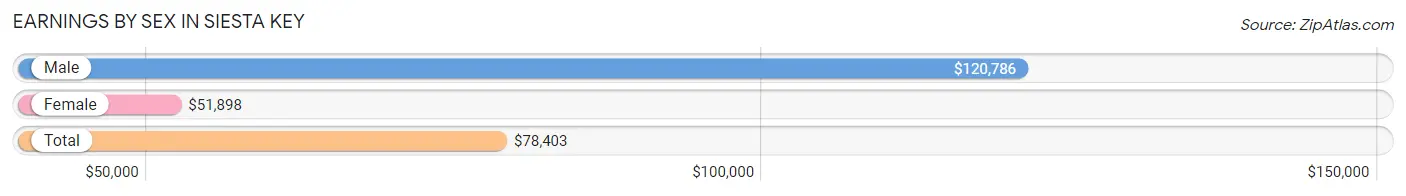
Earnings by Sex in Siesta Key
Average Earnings in Siesta Key are $78,403, $120,786 for men and $51,898 for women, a difference of 57.0%.
| Sex | Number | Average Earnings |
| Male | 996 (55.5%) | $120,786 |
| Female | 797 (44.5%) | $51,898 |
| Total | 1,793 (100.0%) | $78,403 |
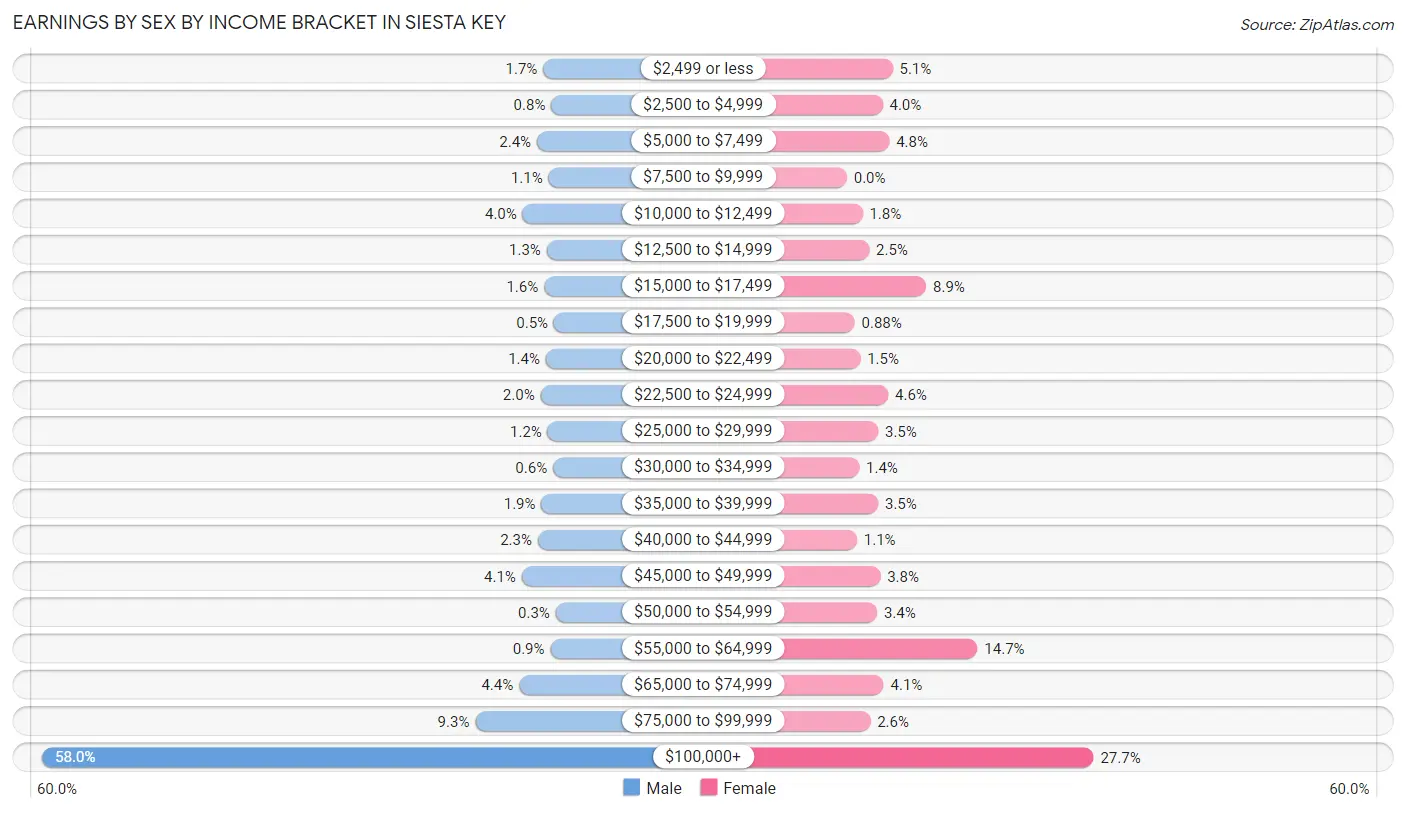
Earnings by Sex by Income Bracket in Siesta Key
The most common earnings brackets in Siesta Key are $100,000+ for men (578 | 58.0%) and $100,000+ for women (221 | 27.7%).
| Income | Male | Female |
| $2,499 or less | 17 (1.7%) | 41 (5.1%) |
| $2,500 to $4,999 | 8 (0.8%) | 32 (4.0%) |
| $5,000 to $7,499 | 24 (2.4%) | 38 (4.8%) |
| $7,500 to $9,999 | 11 (1.1%) | 0 (0.0%) |
| $10,000 to $12,499 | 40 (4.0%) | 14 (1.8%) |
| $12,500 to $14,999 | 13 (1.3%) | 20 (2.5%) |
| $15,000 to $17,499 | 16 (1.6%) | 71 (8.9%) |
| $17,500 to $19,999 | 5 (0.5%) | 7 (0.9%) |
| $20,000 to $22,499 | 14 (1.4%) | 12 (1.5%) |
| $22,500 to $24,999 | 20 (2.0%) | 37 (4.6%) |
| $25,000 to $29,999 | 12 (1.2%) | 28 (3.5%) |
| $30,000 to $34,999 | 6 (0.6%) | 11 (1.4%) |
| $35,000 to $39,999 | 19 (1.9%) | 28 (3.5%) |
| $40,000 to $44,999 | 23 (2.3%) | 9 (1.1%) |
| $45,000 to $49,999 | 41 (4.1%) | 30 (3.8%) |
| $50,000 to $54,999 | 3 (0.3%) | 27 (3.4%) |
| $55,000 to $64,999 | 9 (0.9%) | 117 (14.7%) |
| $65,000 to $74,999 | 44 (4.4%) | 33 (4.1%) |
| $75,000 to $99,999 | 93 (9.3%) | 21 (2.6%) |
| $100,000+ | 578 (58.0%) | 221 (27.7%) |
| Total | 996 (100.0%) | 797 (100.0%) |
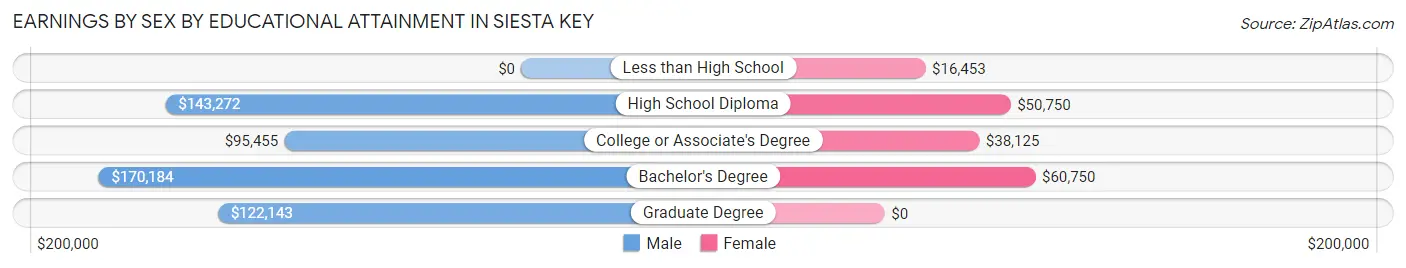
Earnings by Sex by Educational Attainment in Siesta Key
Average earnings in Siesta Key are $123,750 for men and $57,617 for women, a difference of 53.4%. Men with an educational attainment of bachelor's degree enjoy the highest average annual earnings of $170,184, while those with college or associate's degree education earn the least with $95,455. Women with an educational attainment of bachelor's degree earn the most with the average annual earnings of $60,750, while those with less than high school education have the smallest earnings of $16,453.
| Educational Attainment | Male Income | Female Income |
| Less than High School | - | - |
| High School Diploma | $143,272 | $50,750 |
| College or Associate's Degree | $95,455 | $38,125 |
| Bachelor's Degree | $170,184 | $60,750 |
| Graduate Degree | $122,143 | $0 |
| Total | $123,750 | $57,617 |
Family Income in Siesta Key
Family Income Brackets in Siesta Key
According to the Siesta Key family income data, there are 685 families falling into the $200,000+ income range, which is the most common income bracket and makes up 36.4% of all families. Conversely, the $25,000 to $34,999 income bracket is the least frequent group with only 11 families (0.6%) belonging to this category.
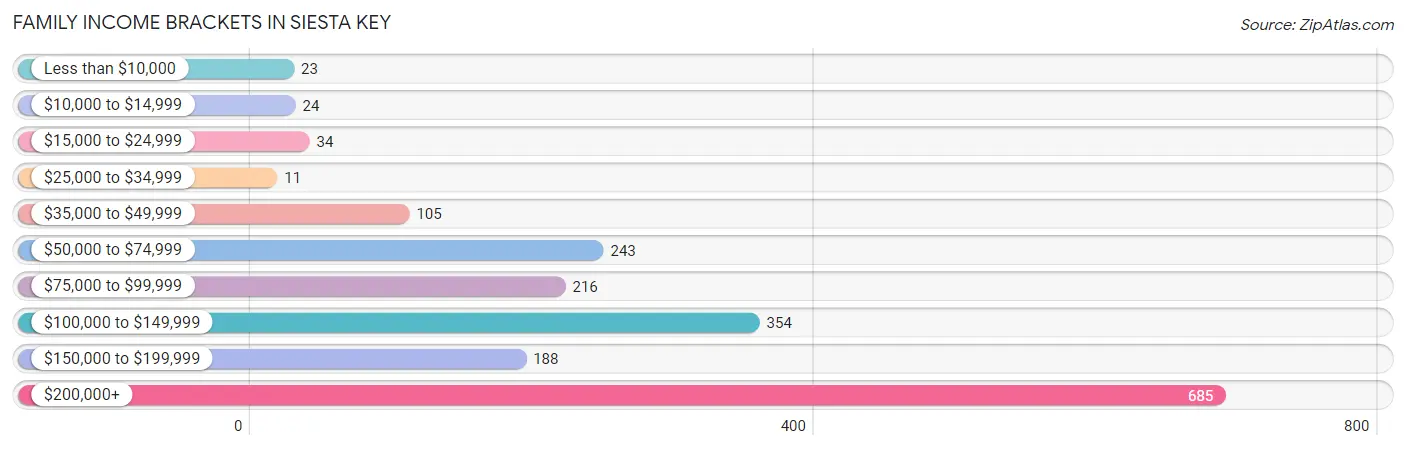
| Income Bracket | # Families | % Families |
| Less than $10,000 | 23 | 1.2% |
| $10,000 to $14,999 | 24 | 1.3% |
| $15,000 to $24,999 | 34 | 1.8% |
| $25,000 to $34,999 | 11 | 0.6% |
| $35,000 to $49,999 | 105 | 5.6% |
| $50,000 to $74,999 | 243 | 12.9% |
| $75,000 to $99,999 | 216 | 11.5% |
| $100,000 to $149,999 | 354 | 18.8% |
| $150,000 to $199,999 | 188 | 10.0% |
| $200,000+ | 685 | 36.4% |
Family Income by Famaliy Size in Siesta Key
5-person families (29 | 1.5%) account for the highest median family income in Siesta Key with $250,001 per family, while 2-person families (1,643 | 87.4%) have the highest median income of $63,108 per family member.
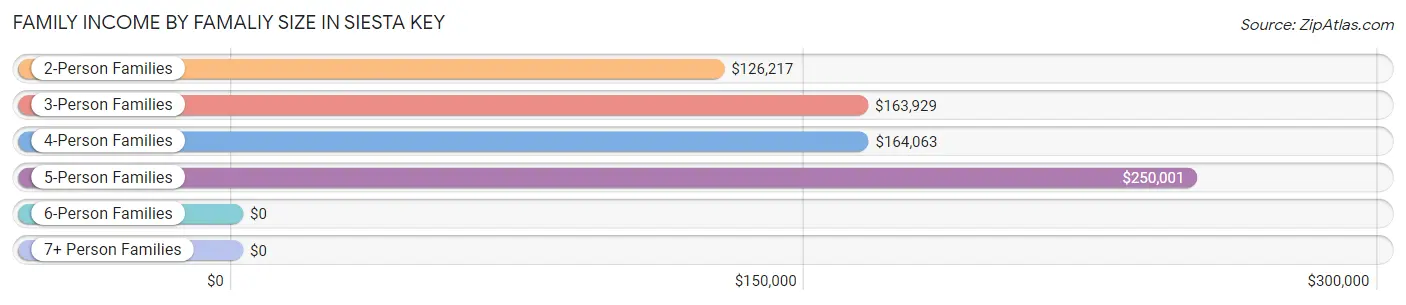
| Income Bracket | # Families | Median Income |
| 2-Person Families | 1,643 (87.4%) | $126,217 |
| 3-Person Families | 134 (7.1%) | $163,929 |
| 4-Person Families | 56 (3.0%) | $164,063 |
| 5-Person Families | 29 (1.5%) | $250,001 |
| 6-Person Families | 19 (1.0%) | $0 |
| 7+ Person Families | 0 (0.0%) | $0 |
| Total | 1,881 (100.0%) | $136,080 |
Family Income by Number of Earners in Siesta Key
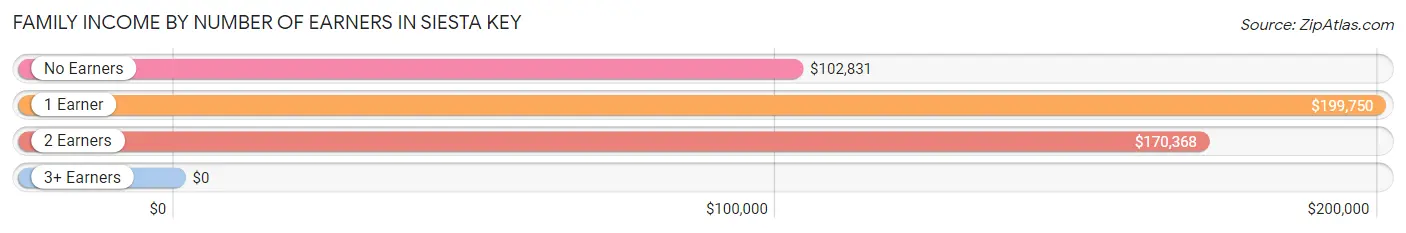
| Number of Earners | # Families | Median Income |
| No Earners | 986 (52.4%) | $102,831 |
| 1 Earner | 559 (29.7%) | $199,750 |
| 2 Earners | 285 (15.1%) | $170,368 |
| 3+ Earners | 51 (2.7%) | $0 |
| Total | 1,881 (100.0%) | $136,080 |
Household Income in Siesta Key
Household Income Brackets in Siesta Key
With 839 households falling in the category, the $200,000+ income range is the most frequent in Siesta Key, accounting for 28.1% of all households. In contrast, only 69 households (2.3%) fall into the less than $10,000 income bracket, making it the least populous group.
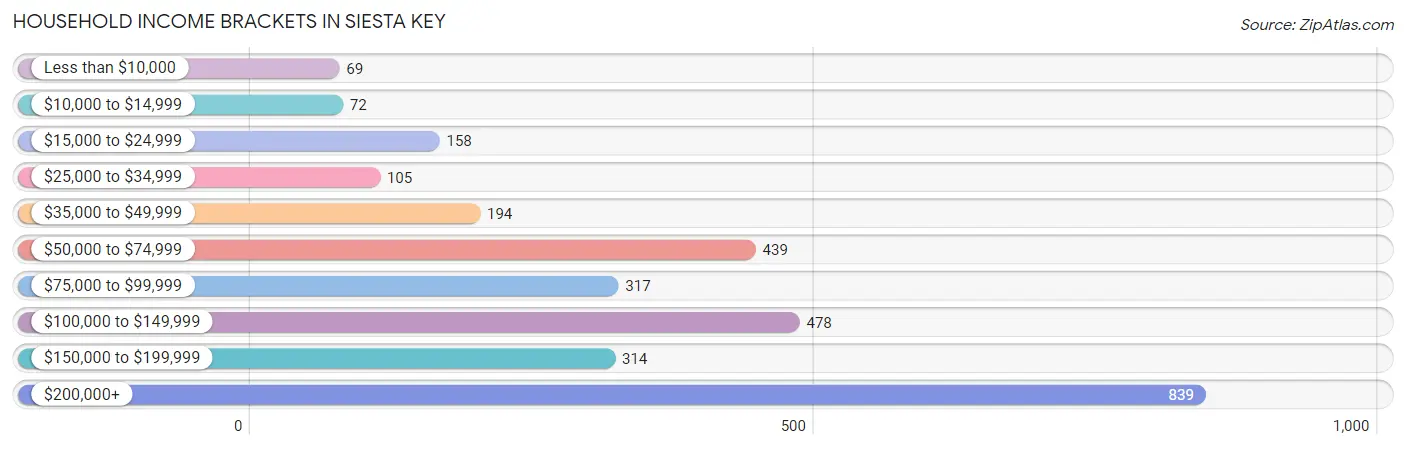
| Income Bracket | # Households | % Households |
| Less than $10,000 | 69 | 2.3% |
| $10,000 to $14,999 | 72 | 2.4% |
| $15,000 to $24,999 | 158 | 5.3% |
| $25,000 to $34,999 | 105 | 3.5% |
| $35,000 to $49,999 | 194 | 6.5% |
| $50,000 to $74,999 | 439 | 14.7% |
| $75,000 to $99,999 | 317 | 10.6% |
| $100,000 to $149,999 | 478 | 16.0% |
| $150,000 to $199,999 | 314 | 10.5% |
| $200,000+ | 839 | 28.1% |
Household Income by Householder Age in Siesta Key
The median household income in Siesta Key is $113,500, with the highest median household income of $156,932 found in the 45 to 64 years age bracket for the primary householder. A total of 1,015 households (34.0%) fall into this category.
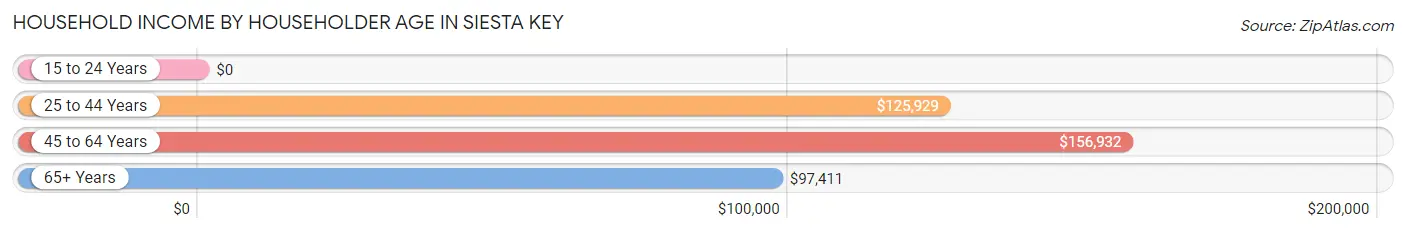
| Income Bracket | # Households | Median Income |
| 15 to 24 Years | 0 (0.0%) | $0 |
| 25 to 44 Years | 158 (5.3%) | $125,929 |
| 45 to 64 Years | 1,015 (34.0%) | $156,932 |
| 65+ Years | 1,813 (60.7%) | $97,411 |
| Total | 2,986 (100.0%) | $113,500 |
Poverty in Siesta Key
Income Below Poverty by Sex and Age in Siesta Key
With 6.4% poverty level for males and 7.5% for females among the residents of Siesta Key, under 5 year old males and under 5 year old females are the most vulnerable to poverty, with 32 males (100.0%) and 15 females (100.0%) in their respective age groups living below the poverty level.
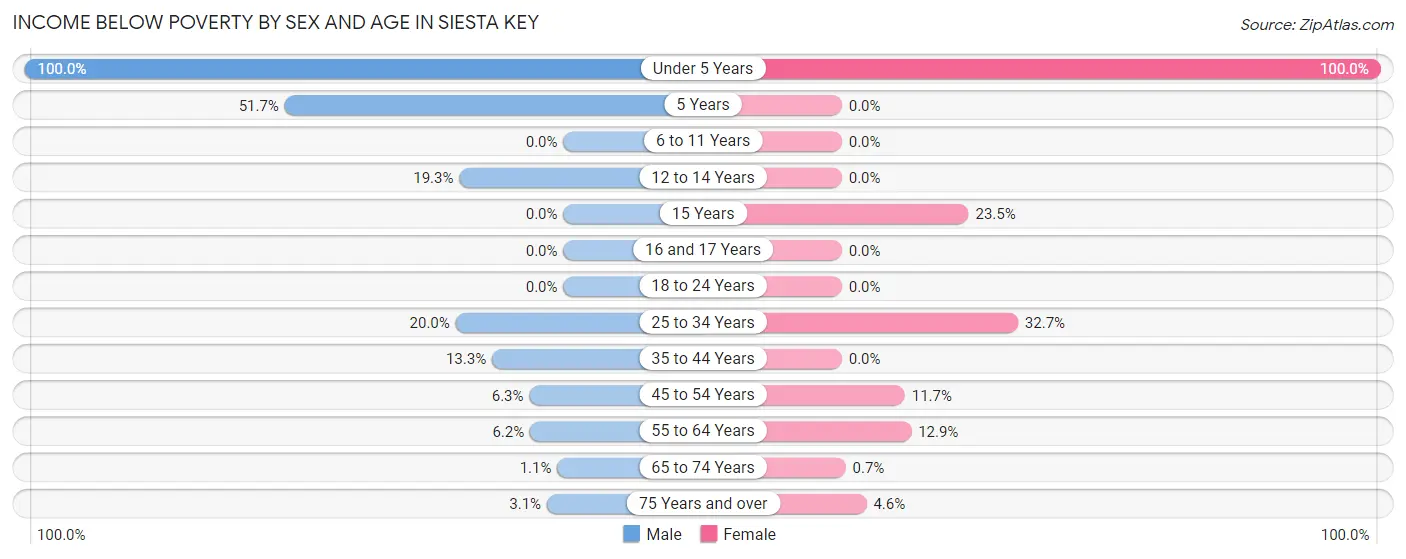
| Age Bracket | Male | Female |
| Under 5 Years | 32 (100.0%) | 15 (100.0%) |
| 5 Years | 15 (51.7%) | 0 (0.0%) |
| 6 to 11 Years | 0 (0.0%) | 0 (0.0%) |
| 12 to 14 Years | 17 (19.3%) | 0 (0.0%) |
| 15 Years | 0 (0.0%) | 4 (23.5%) |
| 16 and 17 Years | 0 (0.0%) | 0 (0.0%) |
| 18 to 24 Years | 0 (0.0%) | 0 (0.0%) |
| 25 to 34 Years | 15 (20.0%) | 34 (32.7%) |
| 35 to 44 Years | 11 (13.3%) | 0 (0.0%) |
| 45 to 54 Years | 13 (6.3%) | 31 (11.7%) |
| 55 to 64 Years | 40 (6.2%) | 84 (12.9%) |
| 65 to 74 Years | 7 (1.1%) | 5 (0.7%) |
| 75 Years and over | 25 (3.0%) | 38 (4.6%) |
| Total | 175 (6.4%) | 211 (7.5%) |
Income Above Poverty by Sex and Age in Siesta Key
According to the poverty statistics in Siesta Key, males aged 6 to 11 years and females aged 6 to 11 years are the age groups that are most secure financially, with 100.0% of males and 100.0% of females in these age groups living above the poverty line.
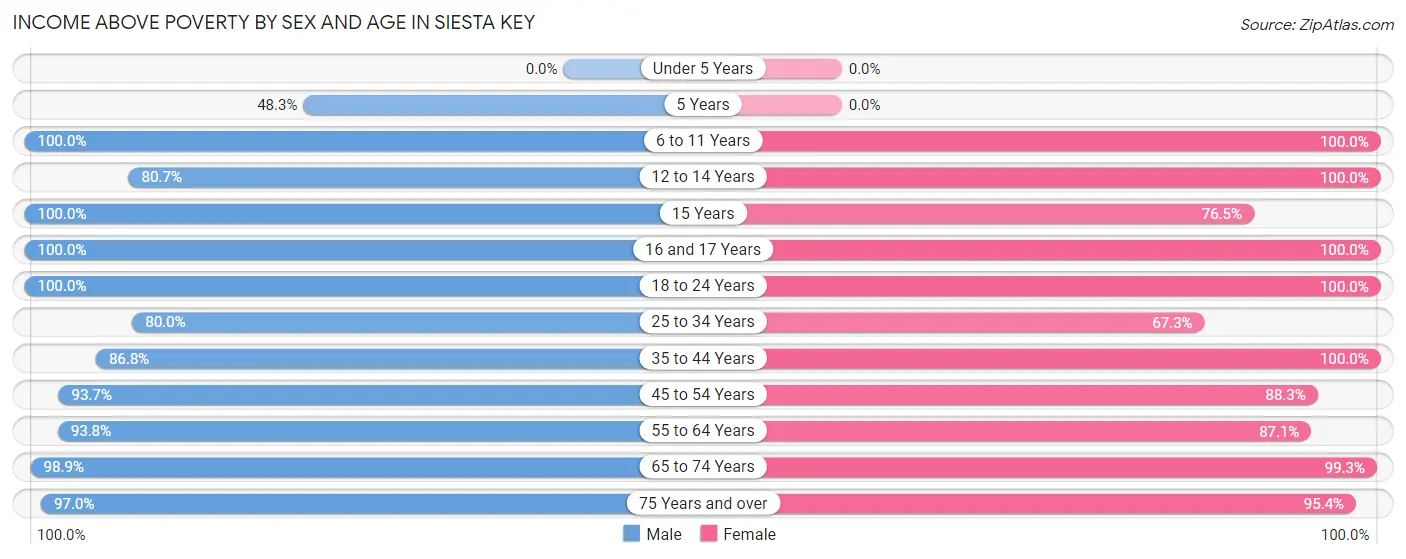
| Age Bracket | Male | Female |
| Under 5 Years | 0 (0.0%) | 0 (0.0%) |
| 5 Years | 14 (48.3%) | 0 (0.0%) |
| 6 to 11 Years | 25 (100.0%) | 24 (100.0%) |
| 12 to 14 Years | 71 (80.7%) | 39 (100.0%) |
| 15 Years | 36 (100.0%) | 13 (76.5%) |
| 16 and 17 Years | 31 (100.0%) | 41 (100.0%) |
| 18 to 24 Years | 48 (100.0%) | 37 (100.0%) |
| 25 to 34 Years | 60 (80.0%) | 70 (67.3%) |
| 35 to 44 Years | 72 (86.8%) | 58 (100.0%) |
| 45 to 54 Years | 193 (93.7%) | 234 (88.3%) |
| 55 to 64 Years | 607 (93.8%) | 568 (87.1%) |
| 65 to 74 Years | 612 (98.9%) | 709 (99.3%) |
| 75 Years and over | 795 (97.0%) | 792 (95.4%) |
| Total | 2,564 (93.6%) | 2,585 (92.4%) |
Income Below Poverty Among Married-Couple Families in Siesta Key
The poverty statistics for married-couple families in Siesta Key show that 2.5% or 44 of the total 1,768 families live below the poverty line. Families with 3 or 4 children have the highest poverty rate of 36.1%, comprising of 13 families. On the other hand, families with 1 or 2 children have the lowest poverty rate of 0.0%, which includes 0 families.
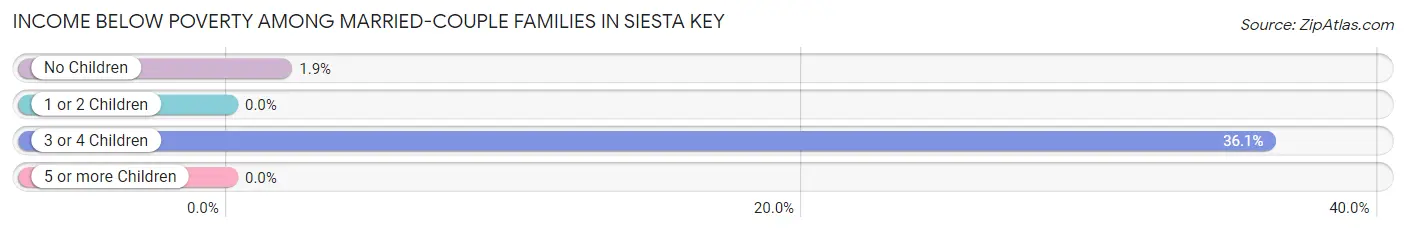
| Children | Above Poverty | Below Poverty |
| No Children | 1,609 (98.1%) | 31 (1.9%) |
| 1 or 2 Children | 92 (100.0%) | 0 (0.0%) |
| 3 or 4 Children | 23 (63.9%) | 13 (36.1%) |
| 5 or more Children | 0 (0.0%) | 0 (0.0%) |
| Total | 1,724 (97.5%) | 44 (2.5%) |
Income Below Poverty Among Single-Parent Households in Siesta Key
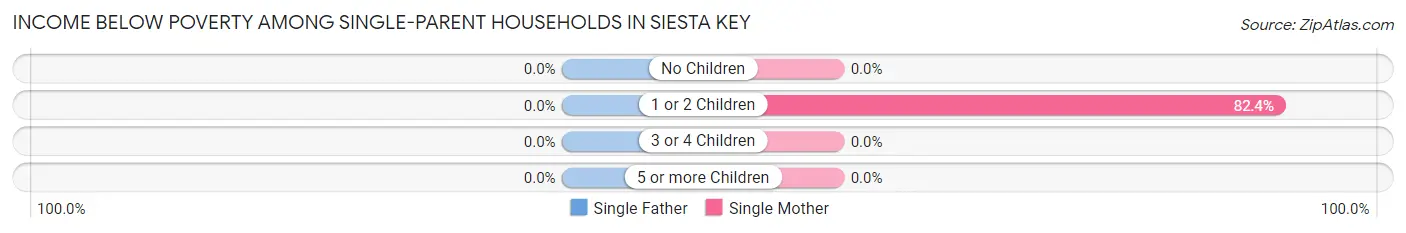
| Children | Single Father | Single Mother |
| No Children | 0 (0.0%) | 0 (0.0%) |
| 1 or 2 Children | 0 (0.0%) | 14 (82.4%) |
| 3 or 4 Children | 0 (0.0%) | 0 (0.0%) |
| 5 or more Children | 0 (0.0%) | 0 (0.0%) |
| Total | 0 (0.0%) | 14 (28.0%) |
Income Below Poverty Among Married-Couple vs Single-Parent Households in Siesta Key
The poverty data for Siesta Key shows that 44 of the married-couple family households (2.5%) and 14 of the single-parent households (12.4%) are living below the poverty level. Within the married-couple family households, those with 3 or 4 children have the highest poverty rate, with 13 households (36.1%) falling below the poverty line. Among the single-parent households, those with 1 or 2 children have the highest poverty rate, with 14 household (23.0%) living below poverty.
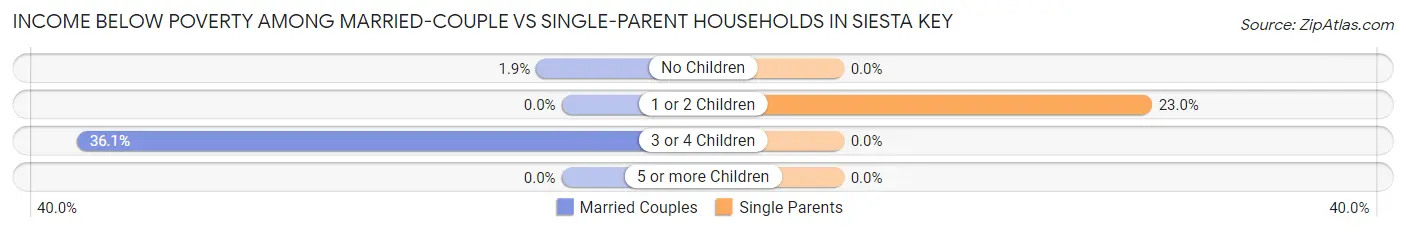
| Children | Married-Couple Families | Single-Parent Households |
| No Children | 31 (1.9%) | 0 (0.0%) |
| 1 or 2 Children | 0 (0.0%) | 14 (23.0%) |
| 3 or 4 Children | 13 (36.1%) | 0 (0.0%) |
| 5 or more Children | 0 (0.0%) | 0 (0.0%) |
| Total | 44 (2.5%) | 14 (12.4%) |
Race in Siesta Key
The most populous races in Siesta Key are White / Caucasian (5,103 | 92.2%), Two or more Races (253 | 4.6%), and Hispanic or Latino (229 | 4.1%).
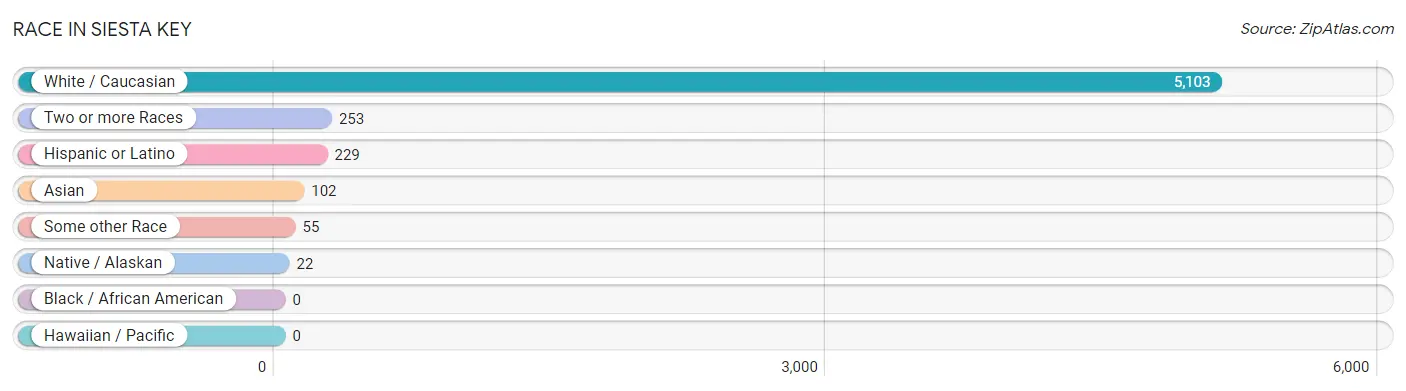
| Race | # Population | % Population |
| Asian | 102 | 1.8% |
| Black / African American | 0 | 0.0% |
| Hawaiian / Pacific | 0 | 0.0% |
| Hispanic or Latino | 229 | 4.1% |
| Native / Alaskan | 22 | 0.4% |
| White / Caucasian | 5,103 | 92.2% |
| Two or more Races | 253 | 4.6% |
| Some other Race | 55 | 1.0% |
| Total | 5,535 | 100.0% |
Ancestry in Siesta Key
The most populous ancestries reported in Siesta Key are German (1,159 | 20.9%), English (768 | 13.9%), American (703 | 12.7%), Irish (606 | 11.0%), and Italian (517 | 9.3%), together accounting for 67.8% of all Siesta Key residents.
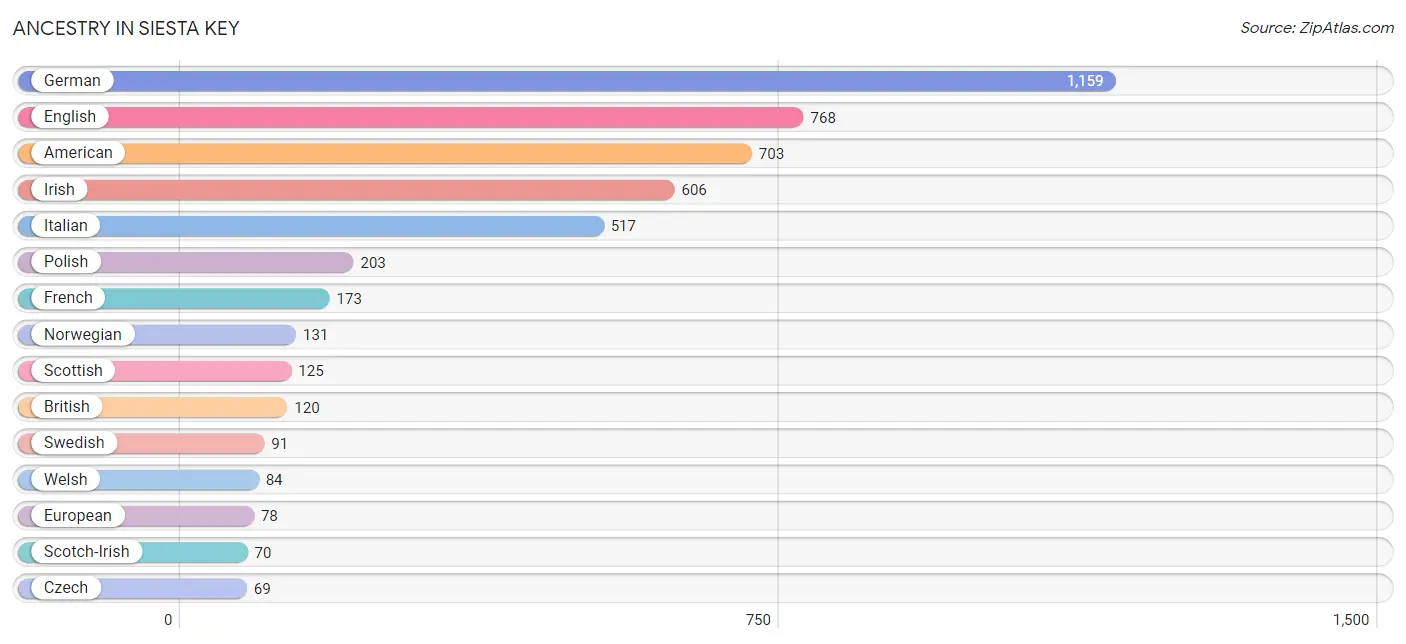
| Ancestry | # Population | % Population |
| American | 703 | 12.7% |
| Arab | 37 | 0.7% |
| Armenian | 3 | 0.1% |
| Australian | 7 | 0.1% |
| Austrian | 54 | 1.0% |
| Brazilian | 3 | 0.1% |
| British | 120 | 2.2% |
| Bulgarian | 41 | 0.7% |
| Canadian | 38 | 0.7% |
| Central American | 37 | 0.7% |
| Cherokee | 5 | 0.1% |
| Colombian | 32 | 0.6% |
| Cuban | 26 | 0.5% |
| Czech | 69 | 1.3% |
| Danish | 13 | 0.2% |
| Dutch | 29 | 0.5% |
| Eastern European | 26 | 0.5% |
| English | 768 | 13.9% |
| European | 78 | 1.4% |
| Finnish | 57 | 1.0% |
| French | 173 | 3.1% |
| French American Indian | 26 | 0.5% |
| French Canadian | 17 | 0.3% |
| German | 1,159 | 20.9% |
| Greek | 35 | 0.6% |
| Hungarian | 40 | 0.7% |
| Indian (Asian) | 21 | 0.4% |
| Iranian | 33 | 0.6% |
| Irish | 606 | 11.0% |
| Iroquois | 4 | 0.1% |
| Israeli | 17 | 0.3% |
| Italian | 517 | 9.3% |
| Korean | 26 | 0.5% |
| Laotian | 40 | 0.7% |
| Lebanese | 24 | 0.4% |
| Lithuanian | 17 | 0.3% |
| Mexican | 27 | 0.5% |
| Nicaraguan | 37 | 0.7% |
| Norwegian | 131 | 2.4% |
| Pakistani | 38 | 0.7% |
| Peruvian | 19 | 0.3% |
| Polish | 203 | 3.7% |
| Portuguese | 21 | 0.4% |
| Puerto Rican | 10 | 0.2% |
| Romanian | 13 | 0.2% |
| Russian | 28 | 0.5% |
| Scandinavian | 20 | 0.4% |
| Scotch-Irish | 70 | 1.3% |
| Scottish | 125 | 2.3% |
| Serbian | 29 | 0.5% |
| Sioux | 5 | 0.1% |
| Slavic | 5 | 0.1% |
| Slovak | 15 | 0.3% |
| Slovene | 7 | 0.1% |
| Somali | 12 | 0.2% |
| South American | 51 | 0.9% |
| Spaniard | 32 | 0.6% |
| Spanish | 46 | 0.8% |
| Sri Lankan | 11 | 0.2% |
| Subsaharan African | 12 | 0.2% |
| Swedish | 91 | 1.6% |
| Swiss | 45 | 0.8% |
| Syrian | 5 | 0.1% |
| Thai | 33 | 0.6% |
| Ukrainian | 34 | 0.6% |
| Welsh | 84 | 1.5% | View All 66 Rows |
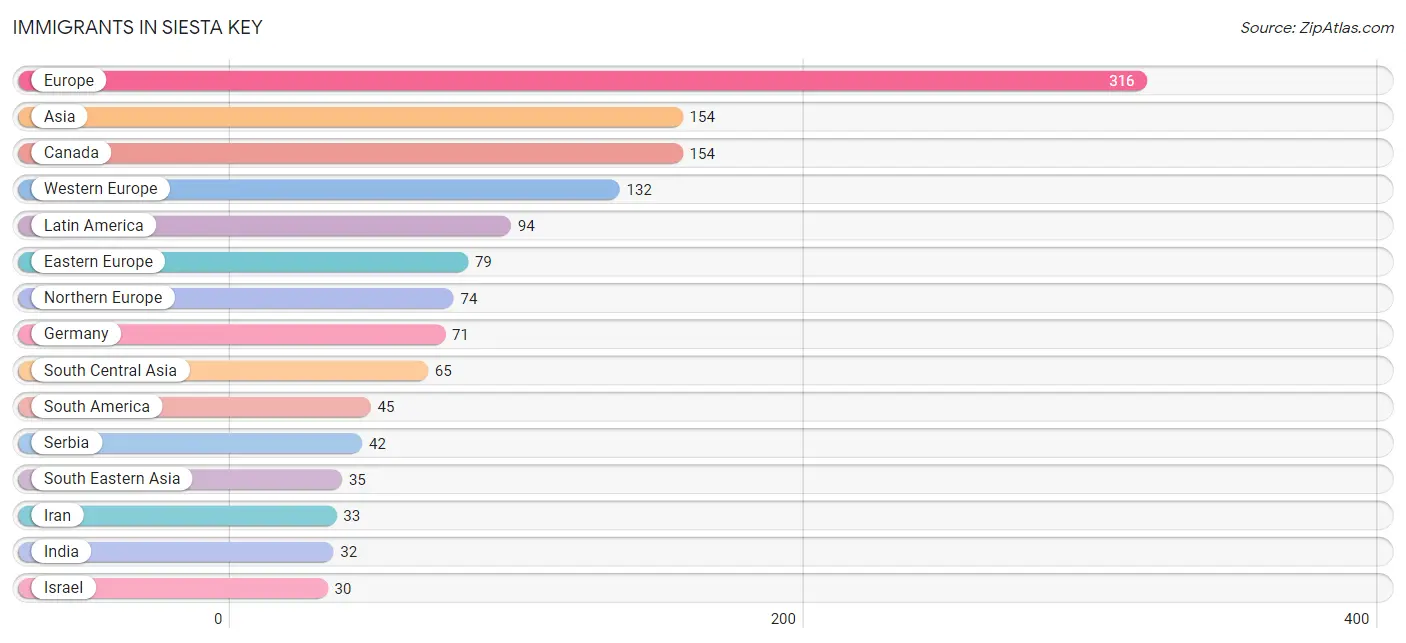
Immigrants in Siesta Key
The most numerous immigrant groups reported in Siesta Key came from Europe (316 | 5.7%), Asia (154 | 2.8%), Canada (154 | 2.8%), Western Europe (132 | 2.4%), and Latin America (94 | 1.7%), together accounting for 15.4% of all Siesta Key residents.
| Immigration Origin | # Population | % Population |
| Africa | 16 | 0.3% |
| Argentina | 4 | 0.1% |
| Asia | 154 | 2.8% |
| Austria | 27 | 0.5% |
| Bolivia | 12 | 0.2% |
| Brazil | 6 | 0.1% |
| Canada | 154 | 2.8% |
| Caribbean | 26 | 0.5% |
| Central America | 23 | 0.4% |
| China | 18 | 0.3% |
| Colombia | 18 | 0.3% |
| Cuba | 26 | 0.5% |
| Eastern Africa | 16 | 0.3% |
| Eastern Asia | 24 | 0.4% |
| Eastern Europe | 79 | 1.4% |
| England | 22 | 0.4% |
| Europe | 316 | 5.7% |
| France | 28 | 0.5% |
| Germany | 71 | 1.3% |
| Hungary | 6 | 0.1% |
| India | 32 | 0.6% |
| Iran | 33 | 0.6% |
| Israel | 30 | 0.5% |
| Japan | 6 | 0.1% |
| Kenya | 16 | 0.3% |
| Latin America | 94 | 1.7% |
| Mexico | 15 | 0.3% |
| Netherlands | 6 | 0.1% |
| Nicaragua | 8 | 0.1% |
| Northern Europe | 74 | 1.3% |
| Peru | 5 | 0.1% |
| Philippines | 15 | 0.3% |
| Poland | 20 | 0.4% |
| Serbia | 42 | 0.8% |
| South America | 45 | 0.8% |
| South Central Asia | 65 | 1.2% |
| South Eastern Asia | 35 | 0.6% |
| Sweden | 11 | 0.2% |
| Thailand | 15 | 0.3% |
| Ukraine | 11 | 0.2% |
| Vietnam | 5 | 0.1% |
| Western Asia | 30 | 0.5% |
| Western Europe | 132 | 2.4% | View All 43 Rows |
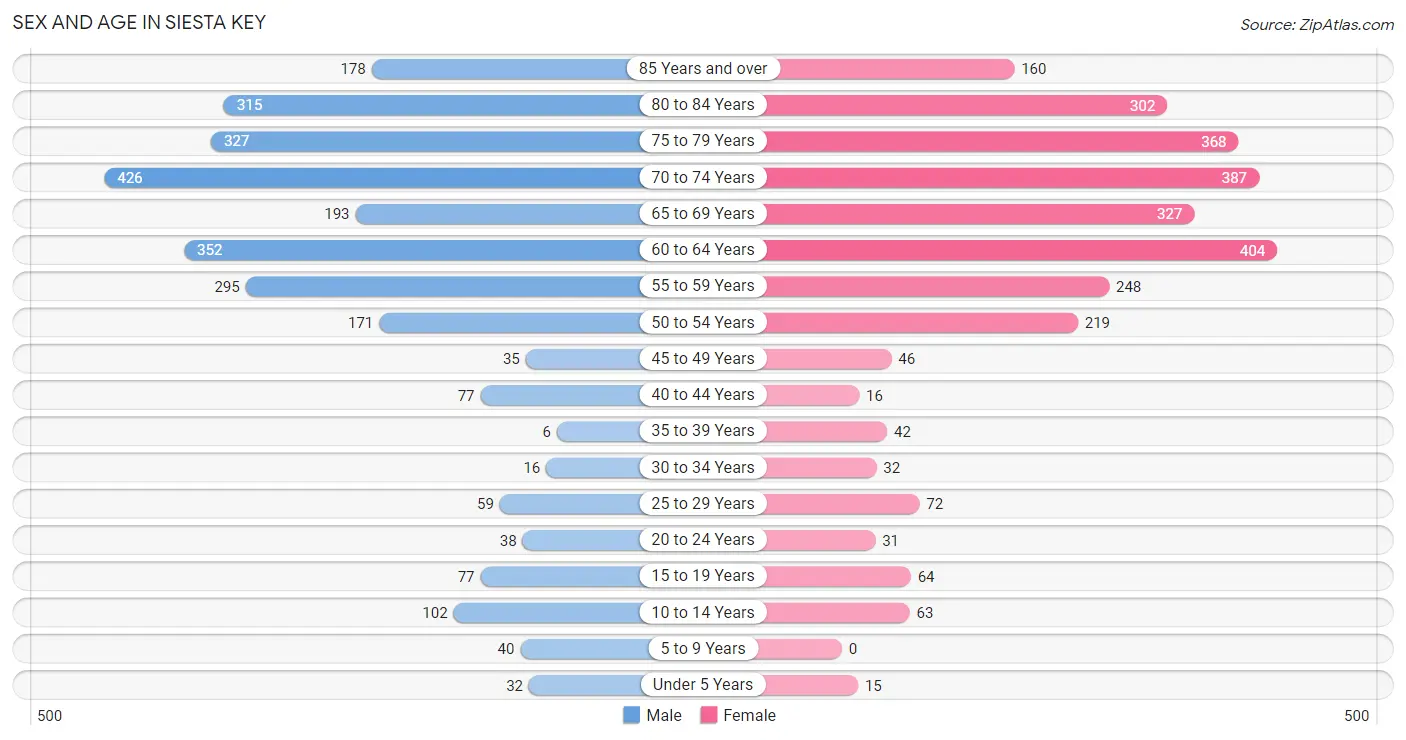
Sex and Age in Siesta Key
Sex and Age in Siesta Key
The most populous age groups in Siesta Key are 70 to 74 Years (426 | 15.5%) for men and 60 to 64 Years (404 | 14.4%) for women.
| Age Bracket | Male | Female |
| Under 5 Years | 32 (1.2%) | 15 (0.5%) |
| 5 to 9 Years | 40 (1.5%) | 0 (0.0%) |
| 10 to 14 Years | 102 (3.7%) | 63 (2.2%) |
| 15 to 19 Years | 77 (2.8%) | 64 (2.3%) |
| 20 to 24 Years | 38 (1.4%) | 31 (1.1%) |
| 25 to 29 Years | 59 (2.1%) | 72 (2.6%) |
| 30 to 34 Years | 16 (0.6%) | 32 (1.1%) |
| 35 to 39 Years | 6 (0.2%) | 42 (1.5%) |
| 40 to 44 Years | 77 (2.8%) | 16 (0.6%) |
| 45 to 49 Years | 35 (1.3%) | 46 (1.7%) |
| 50 to 54 Years | 171 (6.2%) | 219 (7.8%) |
| 55 to 59 Years | 295 (10.8%) | 248 (8.9%) |
| 60 to 64 Years | 352 (12.9%) | 404 (14.4%) |
| 65 to 69 Years | 193 (7.0%) | 327 (11.7%) |
| 70 to 74 Years | 426 (15.5%) | 387 (13.8%) |
| 75 to 79 Years | 327 (11.9%) | 368 (13.2%) |
| 80 to 84 Years | 315 (11.5%) | 302 (10.8%) |
| 85 Years and over | 178 (6.5%) | 160 (5.7%) |
| Total | 2,739 (100.0%) | 2,796 (100.0%) |
Families and Households in Siesta Key
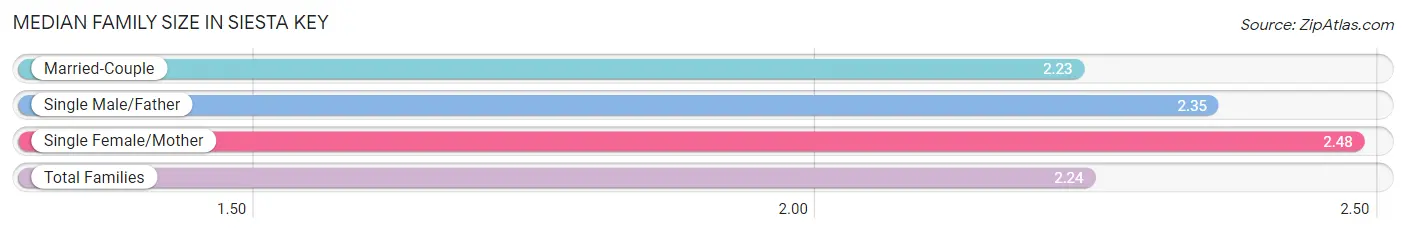
Median Family Size in Siesta Key
The median family size in Siesta Key is 2.24 persons per family, with single female/mother families (50 | 2.7%) accounting for the largest median family size of 2.48 persons per family. On the other hand, married-couple families (1,768 | 94.0%) represent the smallest median family size with 2.23 persons per family.
| Family Type | # Families | Family Size |
| Married-Couple | 1,768 (94.0%) | 2.23 |
| Single Male/Father | 63 (3.4%) | 2.35 |
| Single Female/Mother | 50 (2.7%) | 2.48 |
| Total Families | 1,881 (100.0%) | 2.24 |
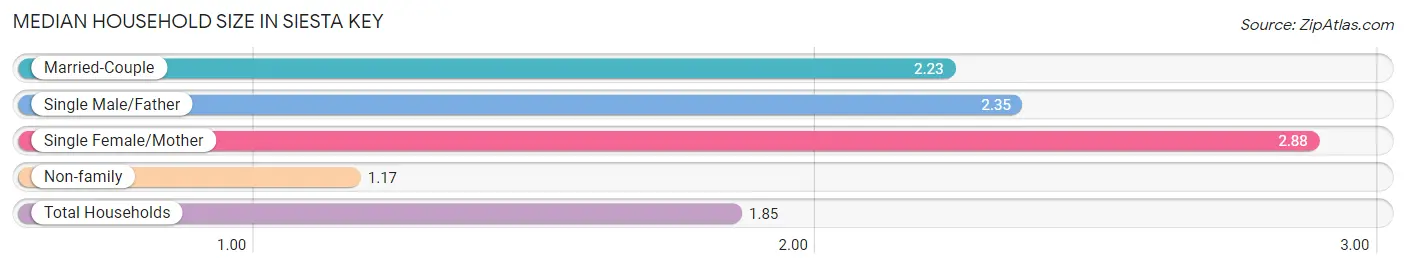
Median Household Size in Siesta Key
The median household size in Siesta Key is 1.85 persons per household, with single female/mother households (50 | 1.7%) accounting for the largest median household size of 2.88 persons per household. non-family households (1,105 | 37.0%) represent the smallest median household size with 1.17 persons per household.
| Household Type | # Households | Household Size |
| Married-Couple | 1,768 (59.2%) | 2.23 |
| Single Male/Father | 63 (2.1%) | 2.35 |
| Single Female/Mother | 50 (1.7%) | 2.88 |
| Non-family | 1,105 (37.0%) | 1.17 |
| Total Households | 2,986 (100.0%) | 1.85 |
Household Size by Marriage Status in Siesta Key
Out of a total of 2,986 households in Siesta Key, 1,881 (63.0%) are family households, while 1,105 (37.0%) are nonfamily households. The most numerous type of family households are 2-person households, comprising 1,643, and the most common type of nonfamily households are 1-person households, comprising 920.
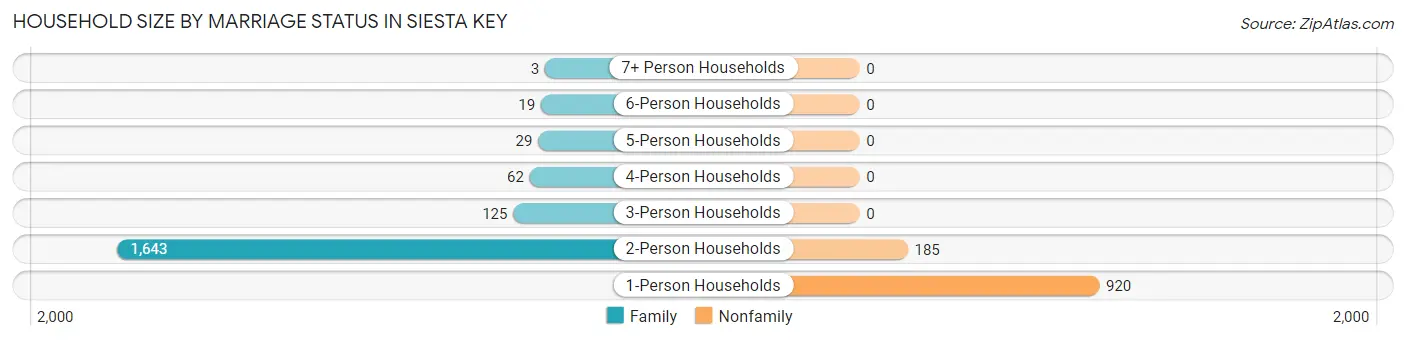
| Household Size | Family Households | Nonfamily Households |
| 1-Person Households | - | 920 (30.8%) |
| 2-Person Households | 1,643 (55.0%) | 185 (6.2%) |
| 3-Person Households | 125 (4.2%) | 0 (0.0%) |
| 4-Person Households | 62 (2.1%) | 0 (0.0%) |
| 5-Person Households | 29 (1.0%) | 0 (0.0%) |
| 6-Person Households | 19 (0.6%) | 0 (0.0%) |
| 7+ Person Households | 3 (0.1%) | 0 (0.0%) |
| Total | 1,881 (63.0%) | 1,105 (37.0%) |
Female Fertility in Siesta Key
Fertility by Age in Siesta Key
| Age Bracket | Women with Births | Births / 1,000 Women |
| 15 to 19 years | 0 (0.0%) | 0.0 |
| 20 to 34 years | 0 (0.0%) | 0.0 |
| 35 to 50 years | 0 (0.0%) | 0.0 |
| Total | 0 (0.0%) | 0.0 |
Fertility by Age by Marriage Status in Siesta Key
| Age Bracket | Married | Unmarried |
| 15 to 19 years | 0 (0.0%) | 0 (0.0%) |
| 20 to 34 years | 0 (0.0%) | 0 (0.0%) |
| 35 to 50 years | 0 (0.0%) | 0 (0.0%) |
| Total | 0 (0.0%) | 0 (0.0%) |
Fertility by Education in Siesta Key
| Educational Attainment | Women with Births | Births / 1,000 Women |
| Less than High School | 0 (0.0%) | 0.0 |
| High School Diploma | 0 (0.0%) | 0.0 |
| College or Associate's Degree | 0 (0.0%) | 0.0 |
| Bachelor's Degree | 0 (0.0%) | 0.0 |
| Graduate Degree | 0 (0.0%) | 0.0 |
| Total | 0 (0.0%) | 0.0 |
Fertility by Education by Marriage Status in Siesta Key
| Educational Attainment | Married | Unmarried |
| Less than High School | 0 (0.0%) | 0 (0.0%) |
| High School Diploma | 0 (0.0%) | 0 (0.0%) |
| College or Associate's Degree | 0 (0.0%) | 0 (0.0%) |
| Bachelor's Degree | 0 (0.0%) | 0 (0.0%) |
| Graduate Degree | 0 (0.0%) | 0 (0.0%) |
| Total | 0 (0.0%) | 0 (0.0%) |
Employment Characteristics in Siesta Key
Employment by Class of Employer in Siesta Key
Among the 1,554 employed individuals in Siesta Key, private company employees (934 | 60.1%), self-employed (incorporated) (237 | 15.2%), and self-employed (not incorporated) (154 | 9.9%) make up the most common classes of employment.
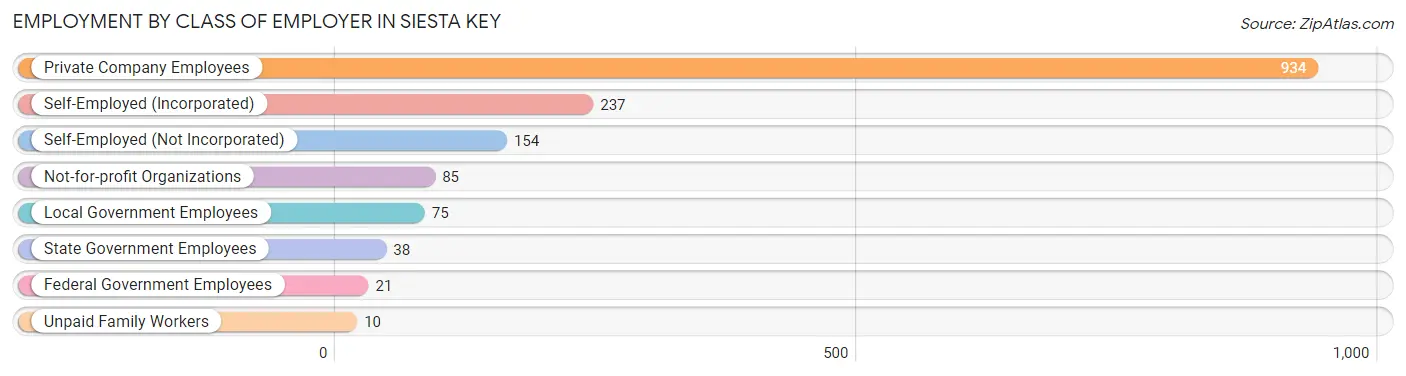
| Employer Class | # Employees | % Employees |
| Private Company Employees | 934 | 60.1% |
| Self-Employed (Incorporated) | 237 | 15.2% |
| Self-Employed (Not Incorporated) | 154 | 9.9% |
| Not-for-profit Organizations | 85 | 5.5% |
| Local Government Employees | 75 | 4.8% |
| State Government Employees | 38 | 2.5% |
| Federal Government Employees | 21 | 1.3% |
| Unpaid Family Workers | 10 | 0.6% |
| Total | 1,554 | 100.0% |
Employment Status by Age in Siesta Key
According to the labor force statistics for Siesta Key, out of the total population over 16 years of age (5,230), 32.3% or 1,689 individuals are in the labor force, with 4.9% or 83 of them unemployed. The age group with the highest labor force participation rate is 20 to 24 years, with 100.0% or 69 individuals in the labor force. Within the labor force, the 25 to 29 years age range has the highest percentage of unemployed individuals, with 19.8% or 18 of them being unemployed.
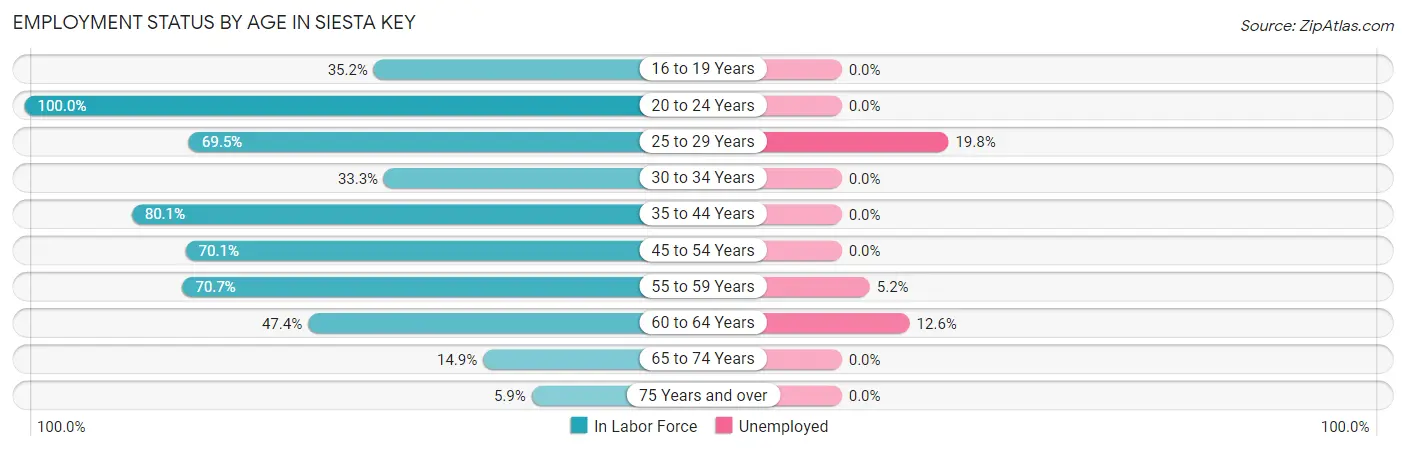
| Age Bracket | In Labor Force | Unemployed |
| 16 to 19 Years | 31 (35.2%) | 0 (0.0%) |
| 20 to 24 Years | 69 (100.0%) | 0 (0.0%) |
| 25 to 29 Years | 91 (69.5%) | 18 (19.8%) |
| 30 to 34 Years | 16 (33.3%) | 0 (0.0%) |
| 35 to 44 Years | 113 (80.1%) | 0 (0.0%) |
| 45 to 54 Years | 330 (70.1%) | 0 (0.0%) |
| 55 to 59 Years | 384 (70.7%) | 20 (5.2%) |
| 60 to 64 Years | 358 (47.4%) | 45 (12.6%) |
| 65 to 74 Years | 199 (14.9%) | 0 (0.0%) |
| 75 Years and over | 97 (5.9%) | 0 (0.0%) |
| Total | 1,689 (32.3%) | 83 (4.9%) |
Employment Status by Educational Attainment in Siesta Key
According to labor force statistics for Siesta Key, 61.8% of individuals (1,292) out of the total population between 25 and 64 years of age (2,090) are in the labor force, with 6.4% or 83 of them being unemployed. The group with the highest labor force participation rate are those with the educational attainment of bachelor's degree or higher, with 66.0% or 874 individuals in the labor force. Within the labor force, individuals with less than high school education have the highest percentage of unemployment, with 48.1% or 13 of them being unemployed.
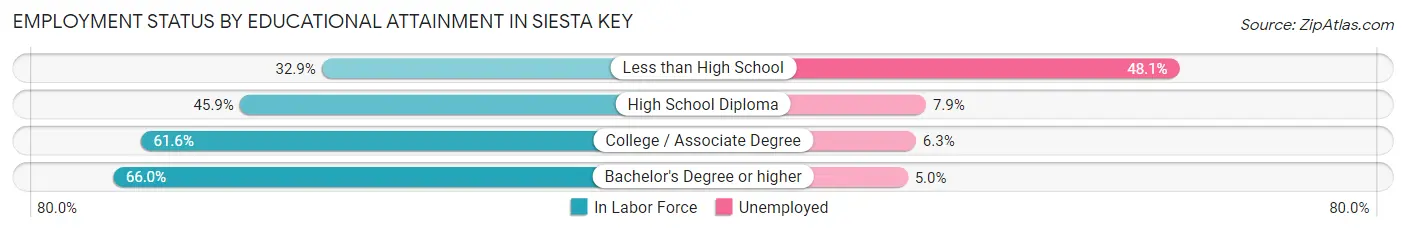
| Educational Attainment | In Labor Force | Unemployed |
| Less than High School | 27 (32.9%) | 39 (48.1%) |
| High School Diploma | 89 (45.9%) | 15 (7.9%) |
| College / Associate Degree | 301 (61.6%) | 31 (6.3%) |
| Bachelor's Degree or higher | 874 (66.0%) | 66 (5.0%) |
| Total | 1,292 (61.8%) | 134 (6.4%) |
Employment Occupations by Sex in Siesta Key
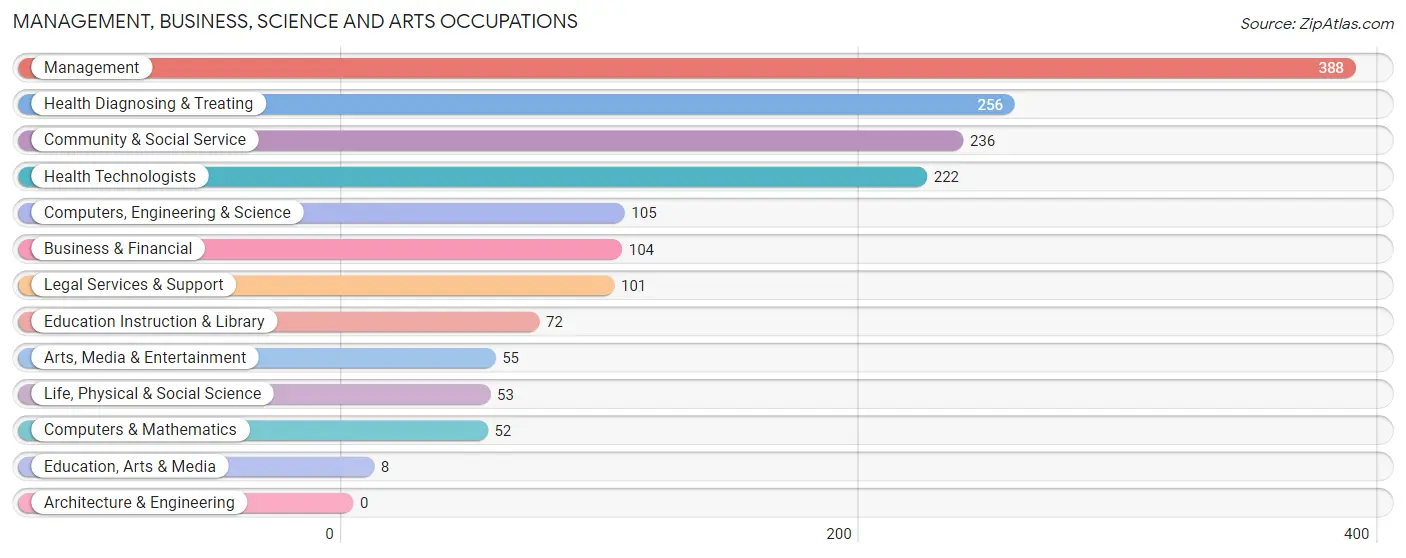
Management, Business, Science and Arts Occupations
The most common Management, Business, Science and Arts occupations in Siesta Key are Management (388 | 24.2%), Health Diagnosing & Treating (256 | 16.0%), Community & Social Service (236 | 14.7%), Health Technologists (222 | 13.8%), and Computers, Engineering & Science (105 | 6.6%).
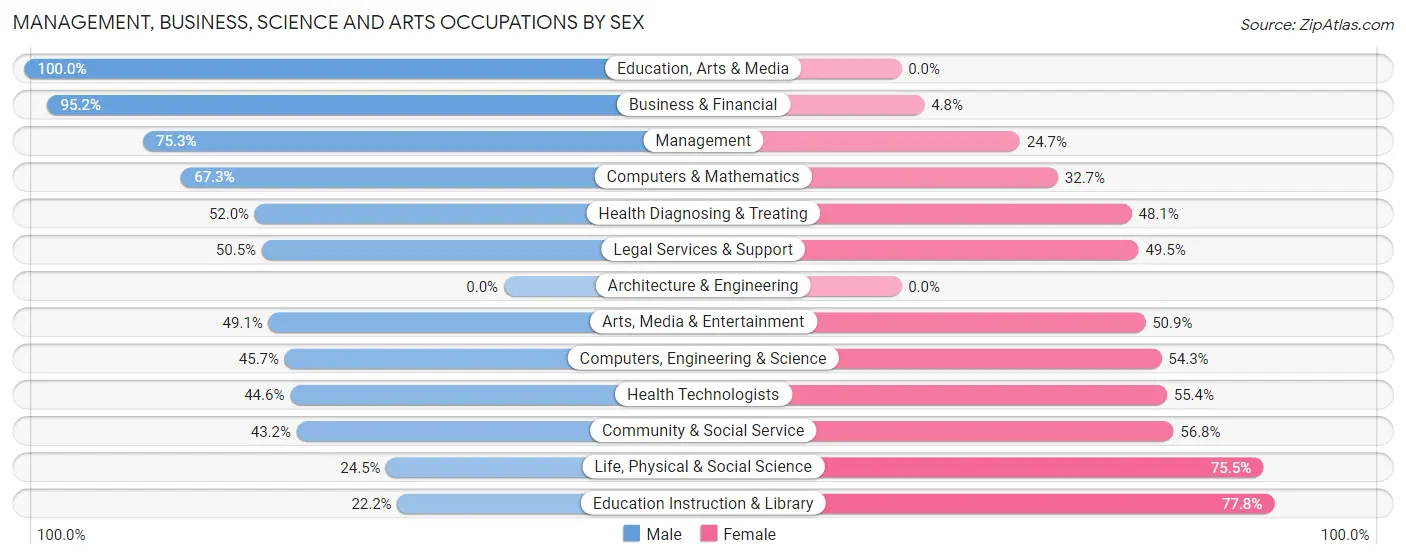
Management, Business, Science and Arts Occupations by Sex
Within the Management, Business, Science and Arts occupations in Siesta Key, the most male-oriented occupations are Education, Arts & Media (100.0%), Business & Financial (95.2%), and Management (75.3%), while the most female-oriented occupations are Education Instruction & Library (77.8%), Life, Physical & Social Science (75.5%), and Community & Social Service (56.8%).
| Occupation | Male | Female |
| Management | 292 (75.3%) | 96 (24.7%) |
| Business & Financial | 99 (95.2%) | 5 (4.8%) |
| Computers, Engineering & Science | 48 (45.7%) | 57 (54.3%) |
| Computers & Mathematics | 35 (67.3%) | 17 (32.7%) |
| Architecture & Engineering | 0 (0.0%) | 0 (0.0%) |
| Life, Physical & Social Science | 13 (24.5%) | 40 (75.5%) |
| Community & Social Service | 102 (43.2%) | 134 (56.8%) |
| Education, Arts & Media | 8 (100.0%) | 0 (0.0%) |
| Legal Services & Support | 51 (50.5%) | 50 (49.5%) |
| Education Instruction & Library | 16 (22.2%) | 56 (77.8%) |
| Arts, Media & Entertainment | 27 (49.1%) | 28 (50.9%) |
| Health Diagnosing & Treating | 133 (51.9%) | 123 (48.0%) |
| Health Technologists | 99 (44.6%) | 123 (55.4%) |
| Total (Category) | 674 (61.9%) | 415 (38.1%) |
| Total (Overall) | 903 (56.3%) | 701 (43.7%) |
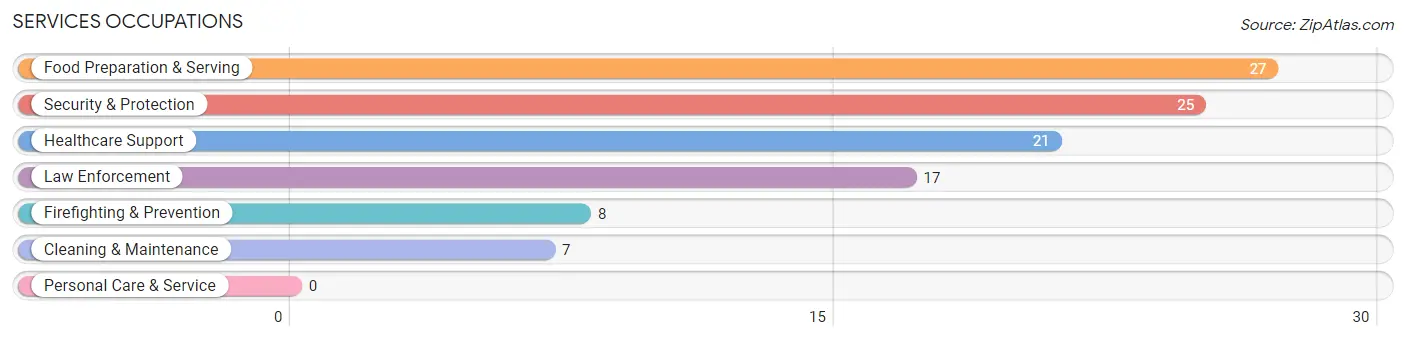
Services Occupations
The most common Services occupations in Siesta Key are Food Preparation & Serving (27 | 1.7%), Security & Protection (25 | 1.6%), Healthcare Support (21 | 1.3%), Law Enforcement (17 | 1.1%), and Firefighting & Prevention (8 | 0.5%).
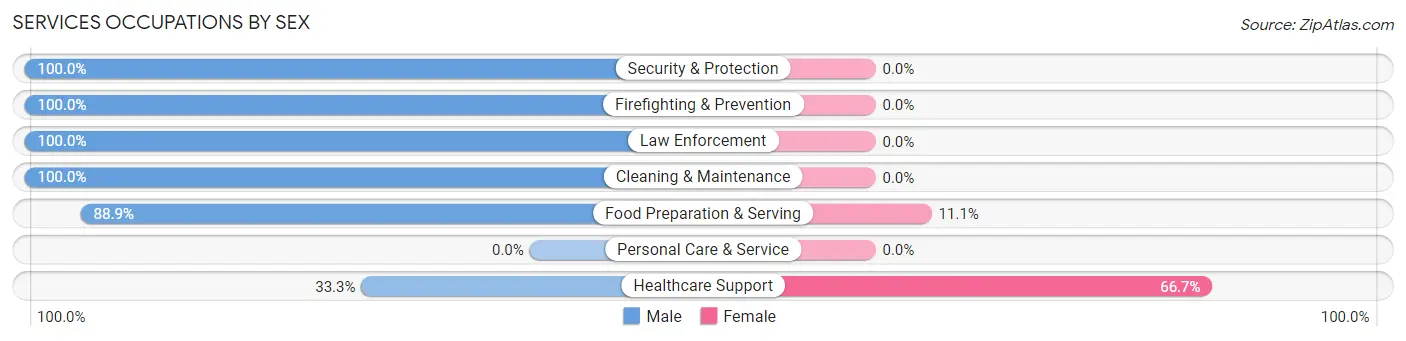
Services Occupations by Sex
Within the Services occupations in Siesta Key, the most male-oriented occupations are Security & Protection (100.0%), Firefighting & Prevention (100.0%), and Law Enforcement (100.0%), while the most female-oriented occupations are Healthcare Support (66.7%), and Food Preparation & Serving (11.1%).
| Occupation | Male | Female |
| Healthcare Support | 7 (33.3%) | 14 (66.7%) |
| Security & Protection | 25 (100.0%) | 0 (0.0%) |
| Firefighting & Prevention | 8 (100.0%) | 0 (0.0%) |
| Law Enforcement | 17 (100.0%) | 0 (0.0%) |
| Food Preparation & Serving | 24 (88.9%) | 3 (11.1%) |
| Cleaning & Maintenance | 7 (100.0%) | 0 (0.0%) |
| Personal Care & Service | 0 (0.0%) | 0 (0.0%) |
| Total (Category) | 63 (78.7%) | 17 (21.2%) |
| Total (Overall) | 903 (56.3%) | 701 (43.7%) |
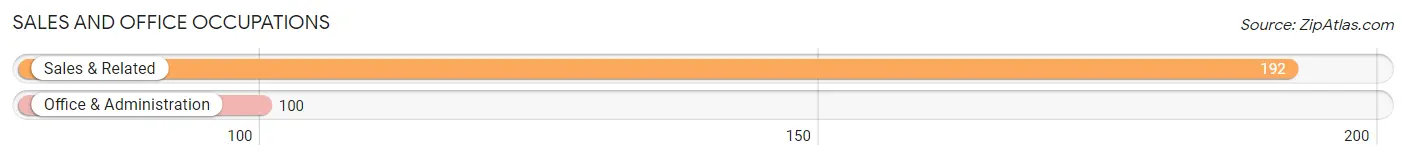
Sales and Office Occupations
The most common Sales and Office occupations in Siesta Key are Sales & Related (192 | 12.0%), and Office & Administration (100 | 6.2%).
Sales and Office Occupations by Sex
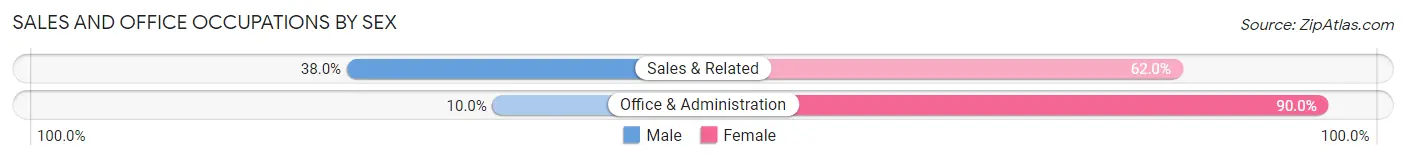
| Occupation | Male | Female |
| Sales & Related | 73 (38.0%) | 119 (62.0%) |
| Office & Administration | 10 (10.0%) | 90 (90.0%) |
| Total (Category) | 83 (28.4%) | 209 (71.6%) |
| Total (Overall) | 903 (56.3%) | 701 (43.7%) |
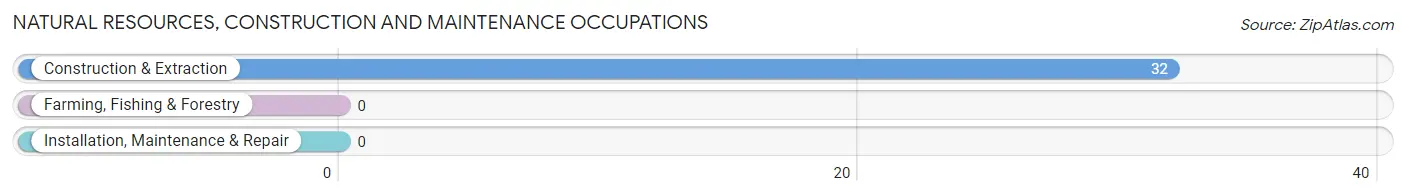
Natural Resources, Construction and Maintenance Occupations
The most common Natural Resources, Construction and Maintenance occupations in Siesta Key are , and Construction & Extraction (32 | 2.0%).
Natural Resources, Construction and Maintenance Occupations by Sex
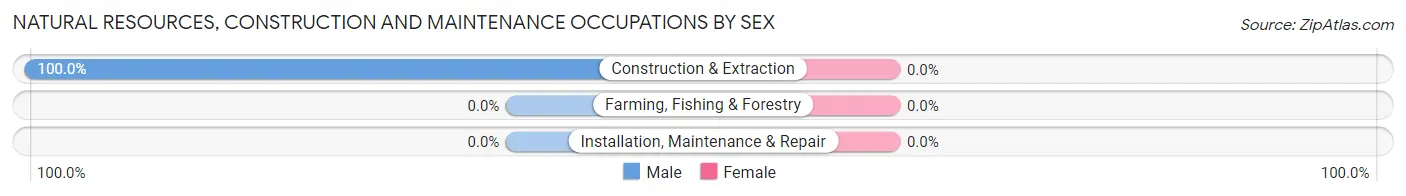
| Occupation | Male | Female |
| Farming, Fishing & Forestry | 0 (0.0%) | 0 (0.0%) |
| Construction & Extraction | 32 (100.0%) | 0 (0.0%) |
| Installation, Maintenance & Repair | 0 (0.0%) | 0 (0.0%) |
| Total (Category) | 32 (100.0%) | 0 (0.0%) |
| Total (Overall) | 903 (56.3%) | 701 (43.7%) |
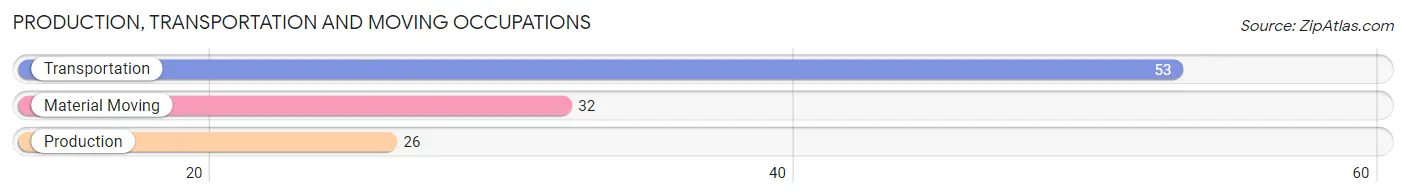
Production, Transportation and Moving Occupations
The most common Production, Transportation and Moving occupations in Siesta Key are Transportation (53 | 3.3%), Material Moving (32 | 2.0%), and Production (26 | 1.6%).
Production, Transportation and Moving Occupations by Sex
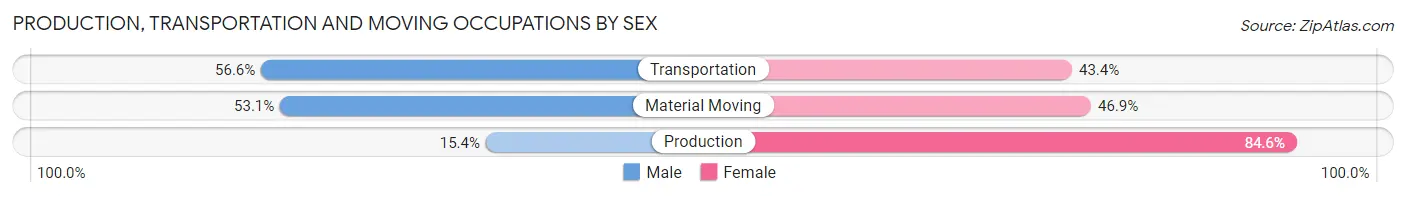
| Occupation | Male | Female |
| Production | 4 (15.4%) | 22 (84.6%) |
| Transportation | 30 (56.6%) | 23 (43.4%) |
| Material Moving | 17 (53.1%) | 15 (46.9%) |
| Total (Category) | 51 (46.0%) | 60 (54.0%) |
| Total (Overall) | 903 (56.3%) | 701 (43.7%) |
Employment Industries by Sex in Siesta Key
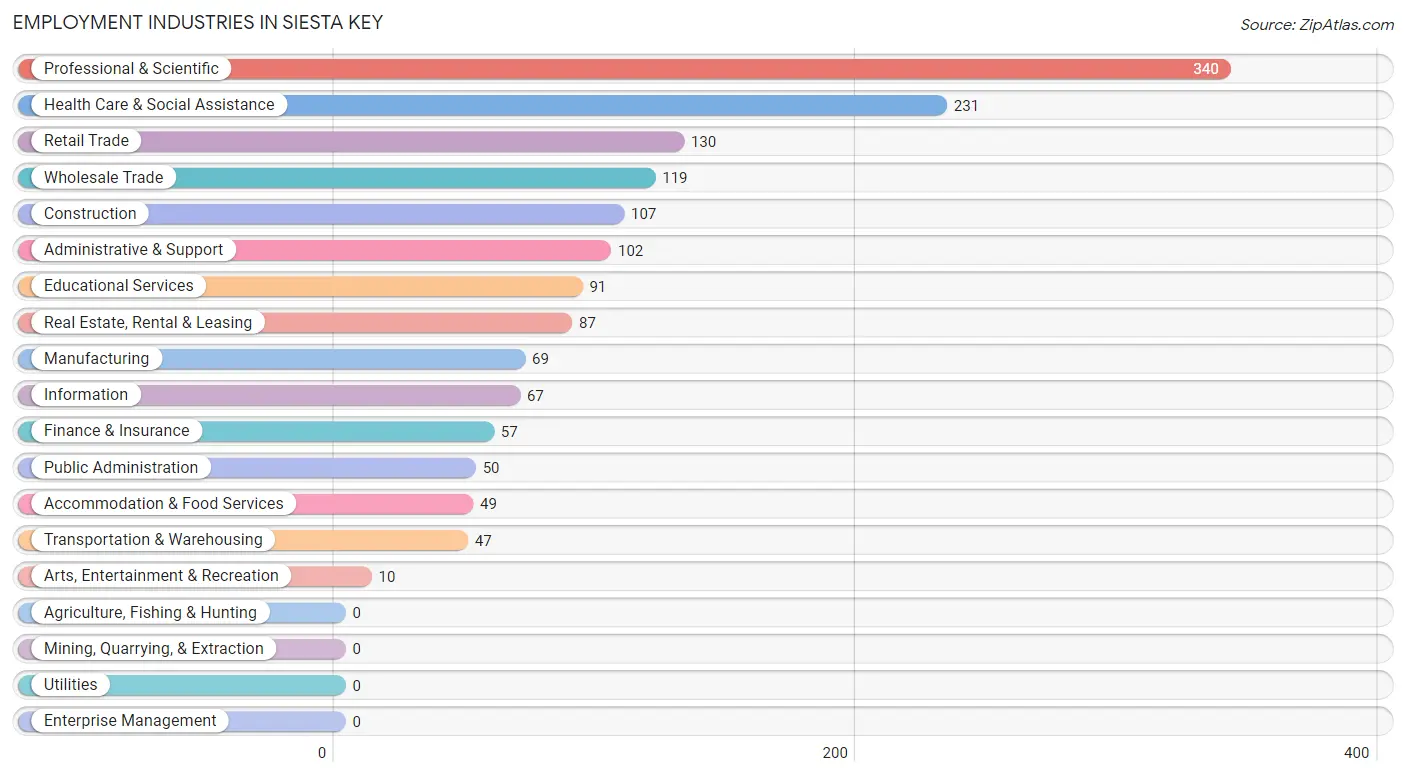
Employment Industries in Siesta Key
The major employment industries in Siesta Key include Professional & Scientific (340 | 21.2%), Health Care & Social Assistance (231 | 14.4%), Retail Trade (130 | 8.1%), Wholesale Trade (119 | 7.4%), and Construction (107 | 6.7%).
Employment Industries by Sex in Siesta Key
The Siesta Key industries that see more men than women are Information (88.1%), Construction (86.9%), and Manufacturing (84.1%), whereas the industries that tend to have a higher number of women are Arts, Entertainment & Recreation (100.0%), Educational Services (74.7%), and Real Estate, Rental & Leasing (67.8%).
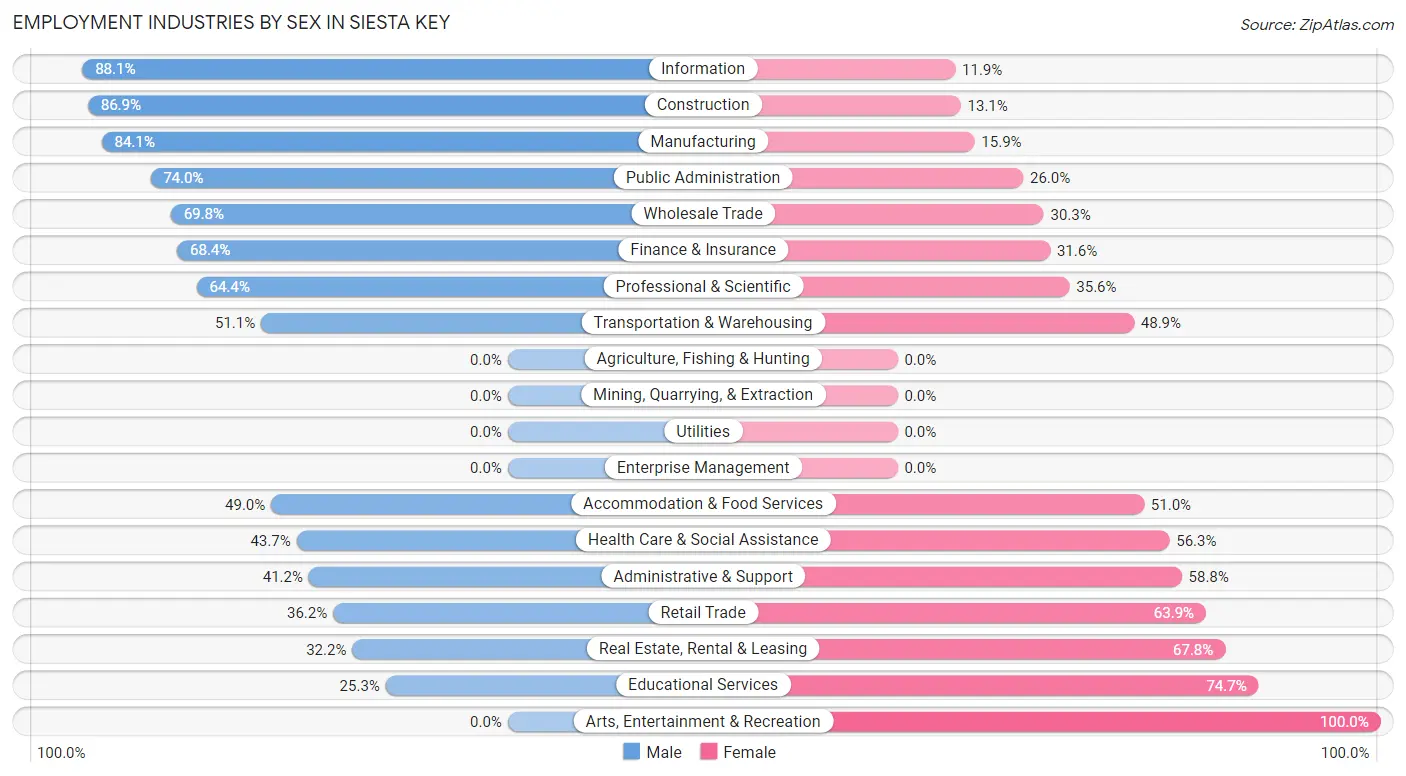
| Industry | Male | Female |
| Agriculture, Fishing & Hunting | 0 (0.0%) | 0 (0.0%) |
| Mining, Quarrying, & Extraction | 0 (0.0%) | 0 (0.0%) |
| Construction | 93 (86.9%) | 14 (13.1%) |
| Manufacturing | 58 (84.1%) | 11 (15.9%) |
| Wholesale Trade | 83 (69.8%) | 36 (30.2%) |
| Retail Trade | 47 (36.1%) | 83 (63.8%) |
| Transportation & Warehousing | 24 (51.1%) | 23 (48.9%) |
| Utilities | 0 (0.0%) | 0 (0.0%) |
| Information | 59 (88.1%) | 8 (11.9%) |
| Finance & Insurance | 39 (68.4%) | 18 (31.6%) |
| Real Estate, Rental & Leasing | 28 (32.2%) | 59 (67.8%) |
| Professional & Scientific | 219 (64.4%) | 121 (35.6%) |
| Enterprise Management | 0 (0.0%) | 0 (0.0%) |
| Administrative & Support | 42 (41.2%) | 60 (58.8%) |
| Educational Services | 23 (25.3%) | 68 (74.7%) |
| Health Care & Social Assistance | 101 (43.7%) | 130 (56.3%) |
| Arts, Entertainment & Recreation | 0 (0.0%) | 10 (100.0%) |
| Accommodation & Food Services | 24 (49.0%) | 25 (51.0%) |
| Public Administration | 37 (74.0%) | 13 (26.0%) |
| Total | 903 (56.3%) | 701 (43.7%) |
Education in Siesta Key
School Enrollment in Siesta Key
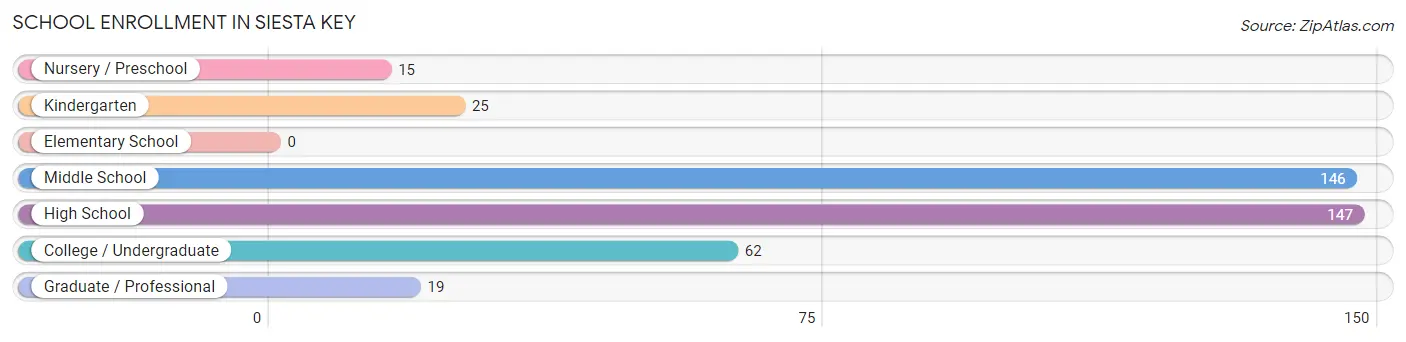
The most common levels of schooling among the 414 students in Siesta Key are high school (147 | 35.5%), middle school (146 | 35.3%), and college / undergraduate (62 | 15.0%).
| School Level | # Students | % Students |
| Nursery / Preschool | 15 | 3.6% |
| Kindergarten | 25 | 6.0% |
| Elementary School | 0 | 0.0% |
| Middle School | 146 | 35.3% |
| High School | 147 | 35.5% |
| College / Undergraduate | 62 | 15.0% |
| Graduate / Professional | 19 | 4.6% |
| Total | 414 | 100.0% |
School Enrollment by Age by Funding Source in Siesta Key
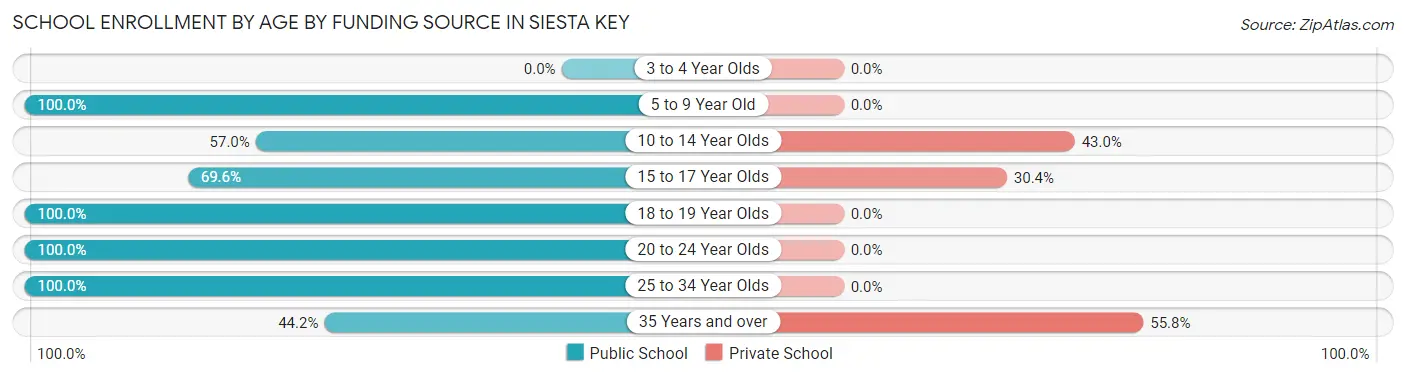
Out of a total of 414 students who are enrolled in schools in Siesta Key, 133 (32.1%) attend a private institution, while the remaining 281 (67.9%) are enrolled in public schools. The age group of 35 years and over has the highest likelihood of being enrolled in private schools, with 24 (55.8% in the age bracket) enrolled. Conversely, the age group of 5 to 9 year old has the lowest likelihood of being enrolled in a private school, with 40 (100.0% in the age bracket) attending a public institution.
| Age Bracket | Public School | Private School |
| 3 to 4 Year Olds | 0 (0.0%) | 0 (0.0%) |
| 5 to 9 Year Old | 40 (100.0%) | 0 (0.0%) |
| 10 to 14 Year Olds | 94 (57.0%) | 71 (43.0%) |
| 15 to 17 Year Olds | 87 (69.6%) | 38 (30.4%) |
| 18 to 19 Year Olds | 13 (100.0%) | 0 (0.0%) |
| 20 to 24 Year Olds | 10 (100.0%) | 0 (0.0%) |
| 25 to 34 Year Olds | 18 (100.0%) | 0 (0.0%) |
| 35 Years and over | 19 (44.2%) | 24 (55.8%) |
| Total | 281 (67.9%) | 133 (32.1%) |
Educational Attainment by Field of Study in Siesta Key
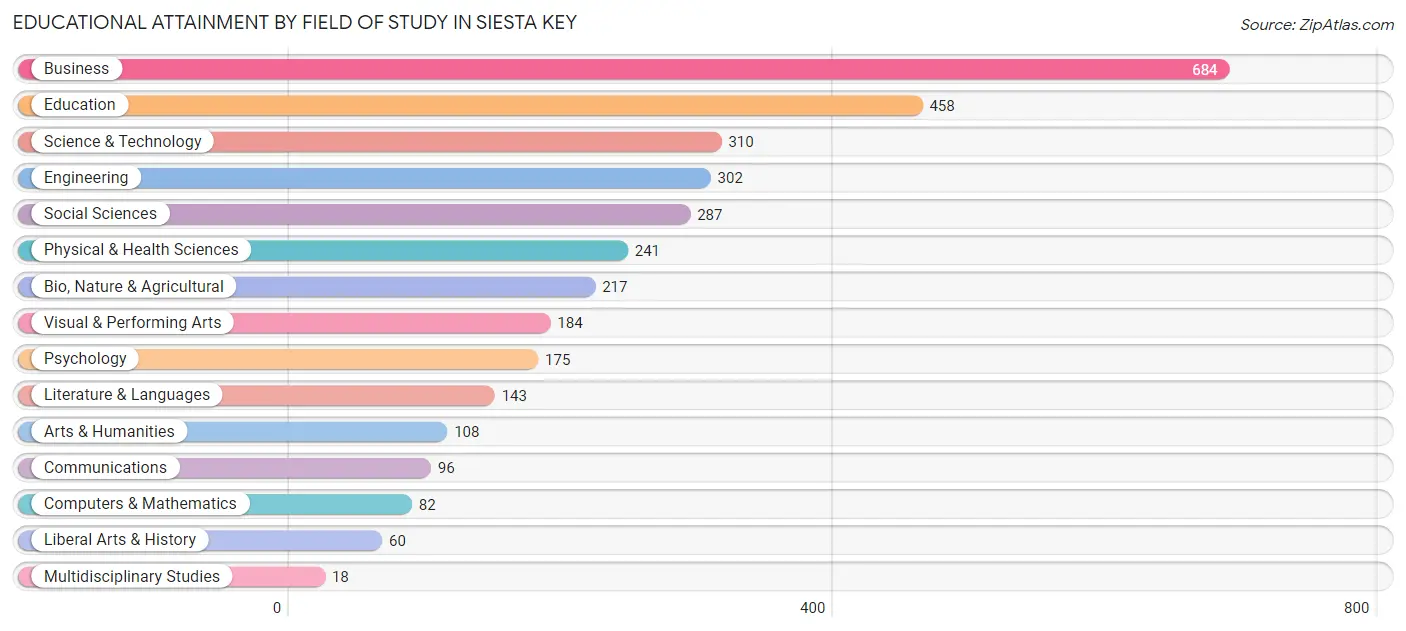
Business (684 | 20.3%), education (458 | 13.6%), science & technology (310 | 9.2%), engineering (302 | 9.0%), and social sciences (287 | 8.5%) are the most common fields of study among 3,365 individuals in Siesta Key who have obtained a bachelor's degree or higher.
| Field of Study | # Graduates | % Graduates |
| Computers & Mathematics | 82 | 2.4% |
| Bio, Nature & Agricultural | 217 | 6.5% |
| Physical & Health Sciences | 241 | 7.2% |
| Psychology | 175 | 5.2% |
| Social Sciences | 287 | 8.5% |
| Engineering | 302 | 9.0% |
| Multidisciplinary Studies | 18 | 0.5% |
| Science & Technology | 310 | 9.2% |
| Business | 684 | 20.3% |
| Education | 458 | 13.6% |
| Literature & Languages | 143 | 4.3% |
| Liberal Arts & History | 60 | 1.8% |
| Visual & Performing Arts | 184 | 5.5% |
| Communications | 96 | 2.9% |
| Arts & Humanities | 108 | 3.2% |
| Total | 3,365 | 100.0% |
Transportation & Commute in Siesta Key
Vehicle Availability by Sex in Siesta Key
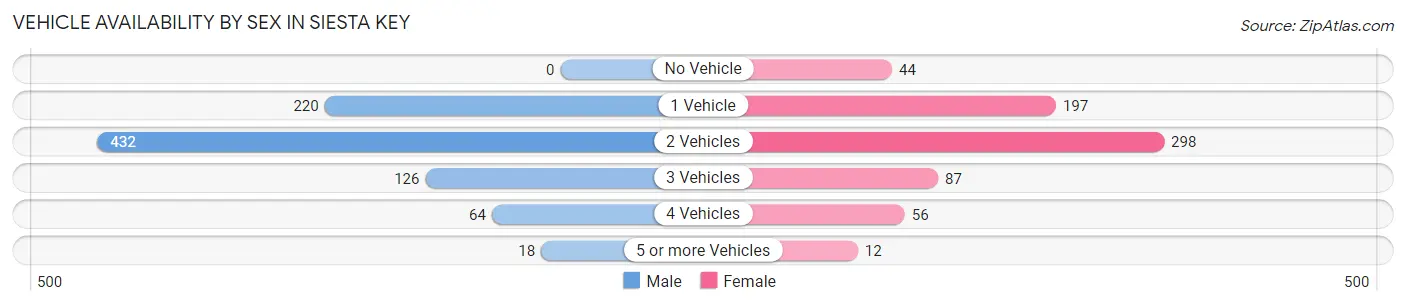
The most prevalent vehicle ownership categories in Siesta Key are males with 2 vehicles (432, accounting for 50.2%) and females with 2 vehicles (298, making up 62.3%).
| Vehicles Available | Male | Female |
| No Vehicle | 0 (0.0%) | 44 (6.3%) |
| 1 Vehicle | 220 (25.6%) | 197 (28.4%) |
| 2 Vehicles | 432 (50.2%) | 298 (42.9%) |
| 3 Vehicles | 126 (14.6%) | 87 (12.5%) |
| 4 Vehicles | 64 (7.4%) | 56 (8.1%) |
| 5 or more Vehicles | 18 (2.1%) | 12 (1.7%) |
| Total | 860 (100.0%) | 694 (100.0%) |
Commute Time in Siesta Key
The most frequently occuring commute durations in Siesta Key are 20 to 24 minutes (249 commuters, 23.9%), 15 to 19 minutes (201 commuters, 19.3%), and 10 to 14 minutes (193 commuters, 18.5%).
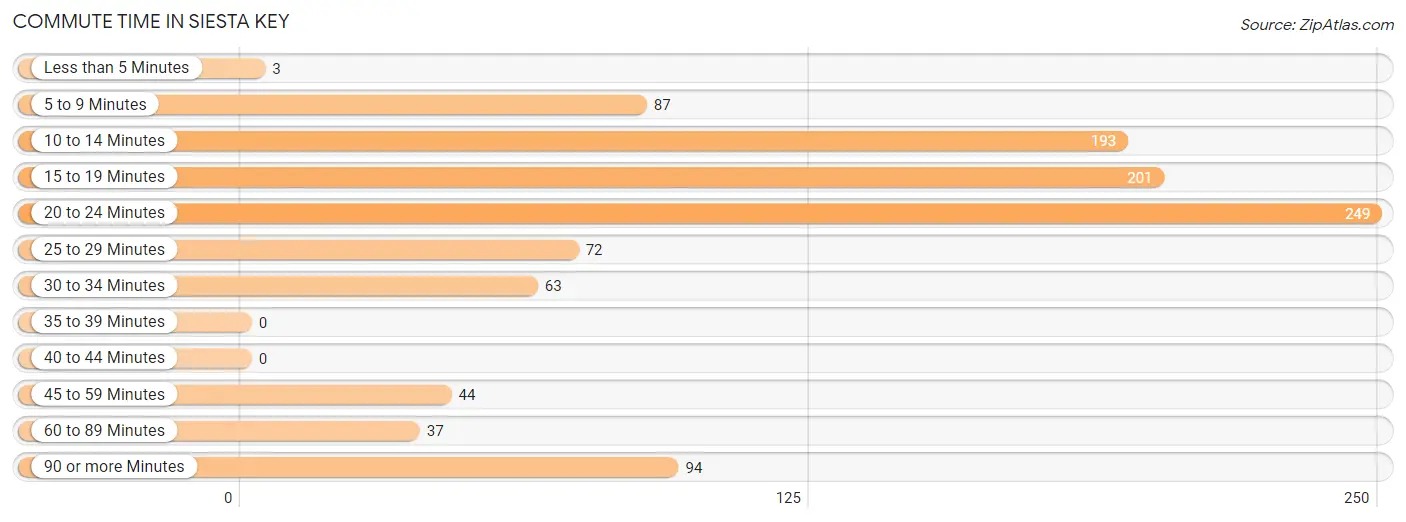
| Commute Time | # Commuters | % Commuters |
| Less than 5 Minutes | 3 | 0.3% |
| 5 to 9 Minutes | 87 | 8.3% |
| 10 to 14 Minutes | 193 | 18.5% |
| 15 to 19 Minutes | 201 | 19.3% |
| 20 to 24 Minutes | 249 | 23.9% |
| 25 to 29 Minutes | 72 | 6.9% |
| 30 to 34 Minutes | 63 | 6.0% |
| 35 to 39 Minutes | 0 | 0.0% |
| 40 to 44 Minutes | 0 | 0.0% |
| 45 to 59 Minutes | 44 | 4.2% |
| 60 to 89 Minutes | 37 | 3.5% |
| 90 or more Minutes | 94 | 9.0% |
Commute Time by Sex in Siesta Key
The most common commute times in Siesta Key are 20 to 24 minutes (133 commuters, 25.5%) for males and 20 to 24 minutes (116 commuters, 22.3%) for females.
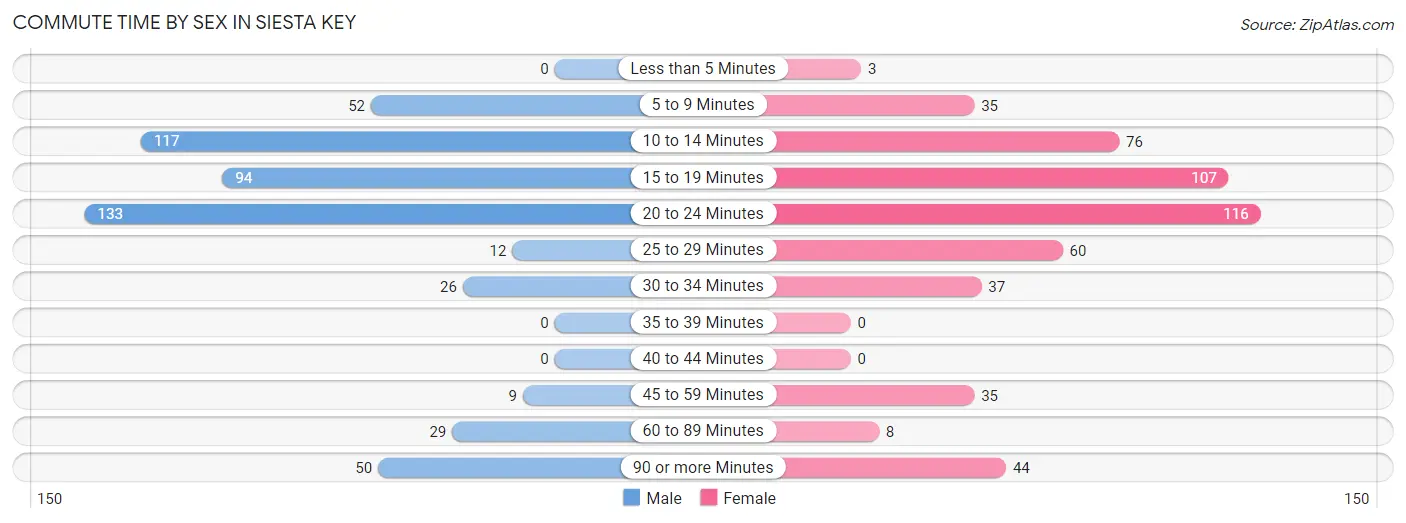
| Commute Time | Male | Female |
| Less than 5 Minutes | 0 (0.0%) | 3 (0.6%) |
| 5 to 9 Minutes | 52 (10.0%) | 35 (6.7%) |
| 10 to 14 Minutes | 117 (22.4%) | 76 (14.6%) |
| 15 to 19 Minutes | 94 (18.0%) | 107 (20.5%) |
| 20 to 24 Minutes | 133 (25.5%) | 116 (22.3%) |
| 25 to 29 Minutes | 12 (2.3%) | 60 (11.5%) |
| 30 to 34 Minutes | 26 (5.0%) | 37 (7.1%) |
| 35 to 39 Minutes | 0 (0.0%) | 0 (0.0%) |
| 40 to 44 Minutes | 0 (0.0%) | 0 (0.0%) |
| 45 to 59 Minutes | 9 (1.7%) | 35 (6.7%) |
| 60 to 89 Minutes | 29 (5.6%) | 8 (1.5%) |
| 90 or more Minutes | 50 (9.6%) | 44 (8.5%) |
Time of Departure to Work by Sex in Siesta Key
The most frequent times of departure to work in Siesta Key are 8:30 AM to 8:59 AM (137, 26.3%) for males and 7:30 AM to 7:59 AM (142, 27.3%) for females.
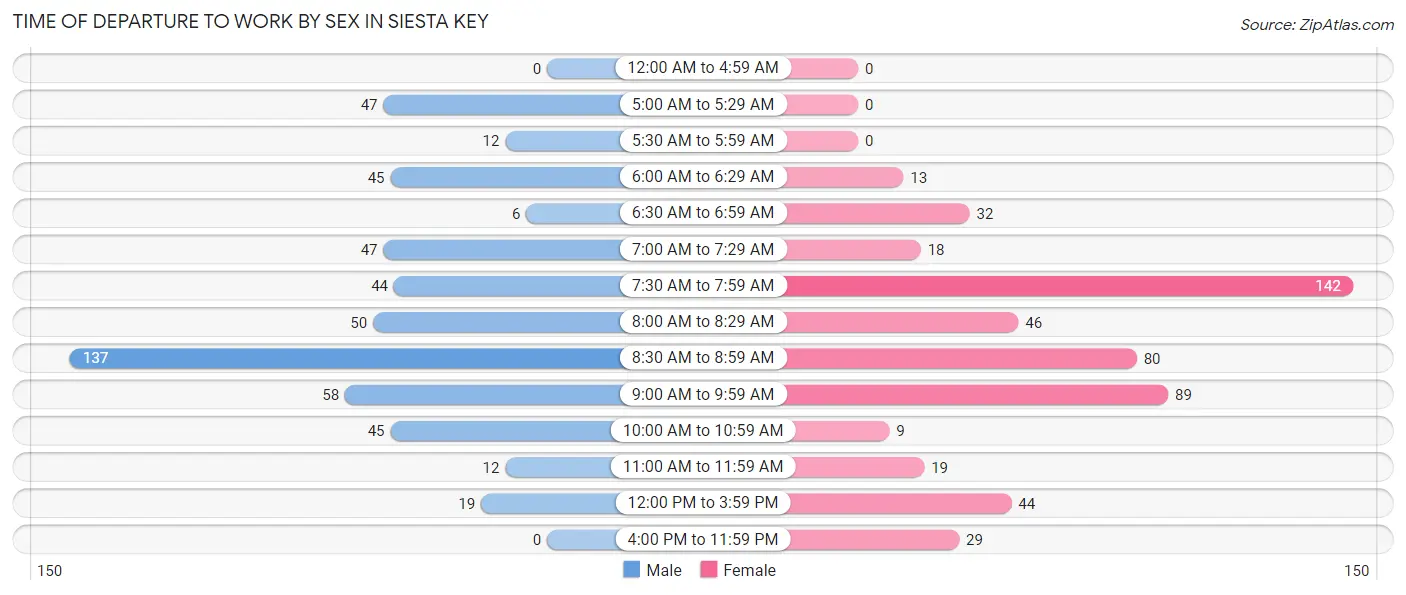
| Time of Departure | Male | Female |
| 12:00 AM to 4:59 AM | 0 (0.0%) | 0 (0.0%) |
| 5:00 AM to 5:29 AM | 47 (9.0%) | 0 (0.0%) |
| 5:30 AM to 5:59 AM | 12 (2.3%) | 0 (0.0%) |
| 6:00 AM to 6:29 AM | 45 (8.6%) | 13 (2.5%) |
| 6:30 AM to 6:59 AM | 6 (1.1%) | 32 (6.1%) |
| 7:00 AM to 7:29 AM | 47 (9.0%) | 18 (3.5%) |
| 7:30 AM to 7:59 AM | 44 (8.4%) | 142 (27.3%) |
| 8:00 AM to 8:29 AM | 50 (9.6%) | 46 (8.8%) |
| 8:30 AM to 8:59 AM | 137 (26.3%) | 80 (15.4%) |
| 9:00 AM to 9:59 AM | 58 (11.1%) | 89 (17.1%) |
| 10:00 AM to 10:59 AM | 45 (8.6%) | 9 (1.7%) |
| 11:00 AM to 11:59 AM | 12 (2.3%) | 19 (3.6%) |
| 12:00 PM to 3:59 PM | 19 (3.6%) | 44 (8.5%) |
| 4:00 PM to 11:59 PM | 0 (0.0%) | 29 (5.6%) |
| Total | 522 (100.0%) | 521 (100.0%) |
Housing Occupancy in Siesta Key
Occupancy by Ownership in Siesta Key
Of the total 2,986 dwellings in Siesta Key, owner-occupied units account for 2,665 (89.2%), while renter-occupied units make up 321 (10.7%).
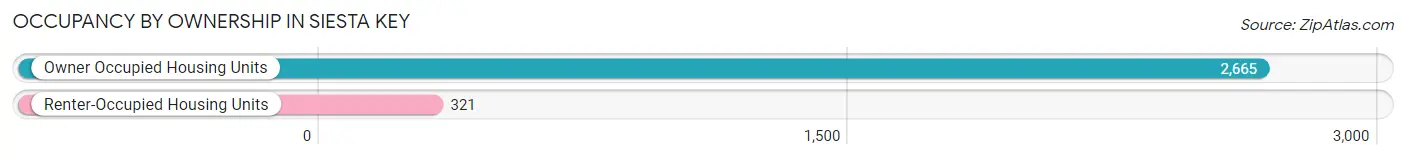
| Occupancy | # Housing Units | % Housing Units |
| Owner Occupied Housing Units | 2,665 | 89.2% |
| Renter-Occupied Housing Units | 321 | 10.7% |
| Total Occupied Housing Units | 2,986 | 100.0% |
Occupancy by Household Size in Siesta Key
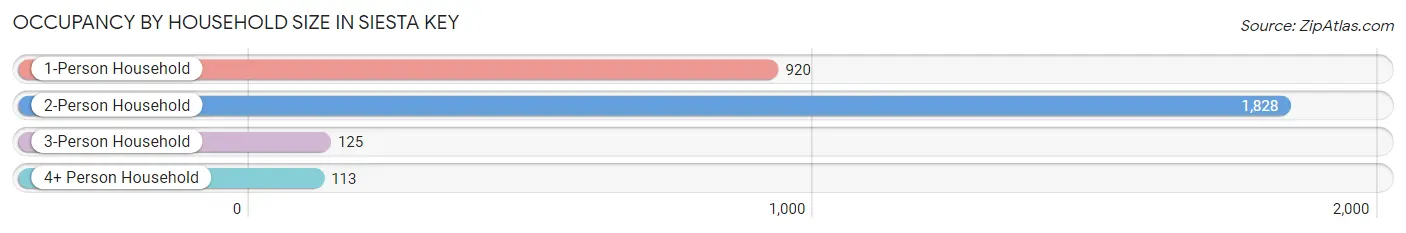
| Household Size | # Housing Units | % Housing Units |
| 1-Person Household | 920 | 30.8% |
| 2-Person Household | 1,828 | 61.2% |
| 3-Person Household | 125 | 4.2% |
| 4+ Person Household | 113 | 3.8% |
| Total Housing Units | 2,986 | 100.0% |
Occupancy by Ownership by Household Size in Siesta Key
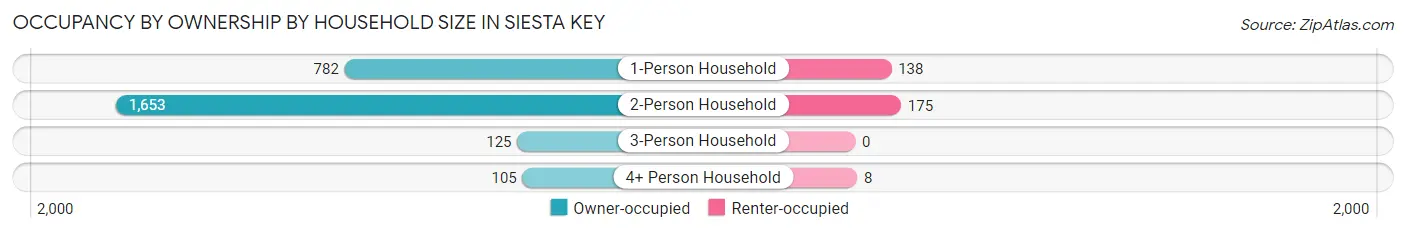
| Household Size | Owner-occupied | Renter-occupied |
| 1-Person Household | 782 (85.0%) | 138 (15.0%) |
| 2-Person Household | 1,653 (90.4%) | 175 (9.6%) |
| 3-Person Household | 125 (100.0%) | 0 (0.0%) |
| 4+ Person Household | 105 (92.9%) | 8 (7.1%) |
| Total Housing Units | 2,665 (89.2%) | 321 (10.7%) |
Occupancy by Educational Attainment in Siesta Key
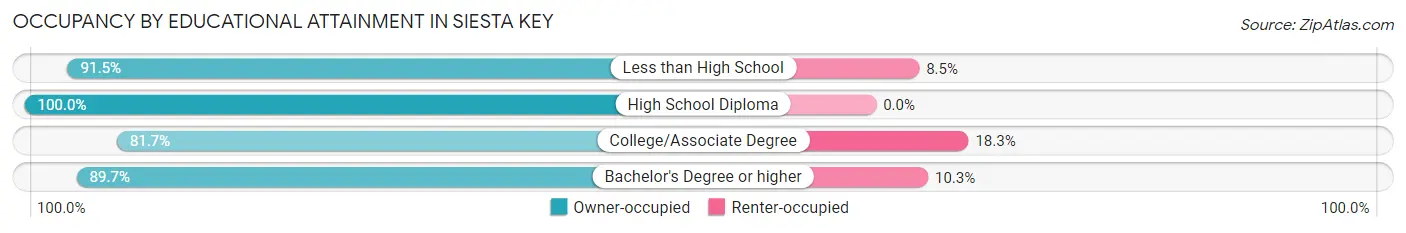
| Household Size | Owner-occupied | Renter-occupied |
| Less than High School | 75 (91.5%) | 7 (8.5%) |
| High School Diploma | 273 (100.0%) | 0 (0.0%) |
| College/Associate Degree | 442 (81.7%) | 99 (18.3%) |
| Bachelor's Degree or higher | 1,875 (89.7%) | 215 (10.3%) |
Occupancy by Age of Householder in Siesta Key
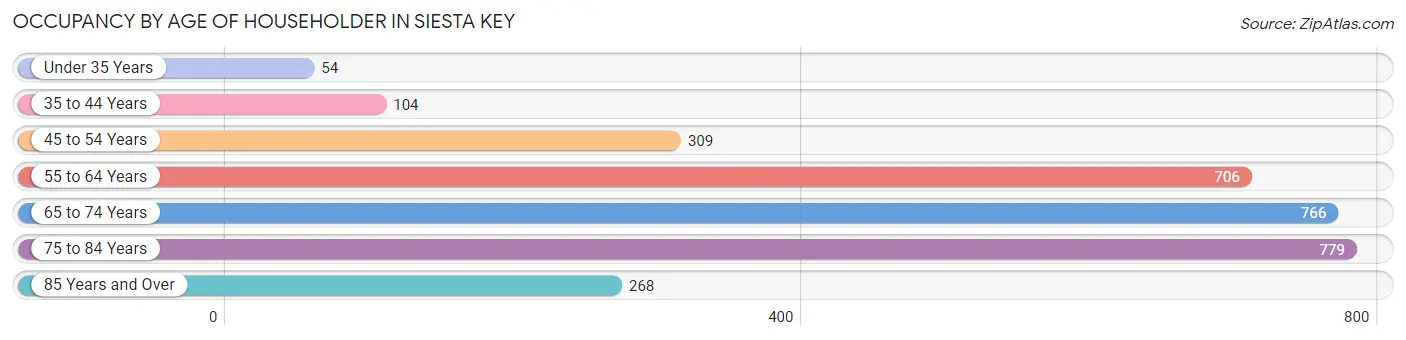
| Age Bracket | # Households | % Households |
| Under 35 Years | 54 | 1.8% |
| 35 to 44 Years | 104 | 3.5% |
| 45 to 54 Years | 309 | 10.3% |
| 55 to 64 Years | 706 | 23.6% |
| 65 to 74 Years | 766 | 25.7% |
| 75 to 84 Years | 779 | 26.1% |
| 85 Years and Over | 268 | 9.0% |
| Total | 2,986 | 100.0% |
Housing Finances in Siesta Key
Median Income by Occupancy in Siesta Key
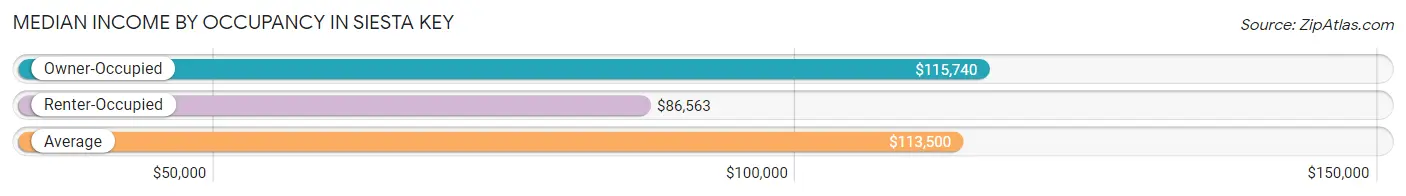
| Occupancy Type | # Households | Median Income |
| Owner-Occupied | 2,665 (89.2%) | $115,740 |
| Renter-Occupied | 321 (10.7%) | $86,563 |
| Average | 2,986 (100.0%) | $113,500 |
Occupancy by Householder Income Bracket in Siesta Key
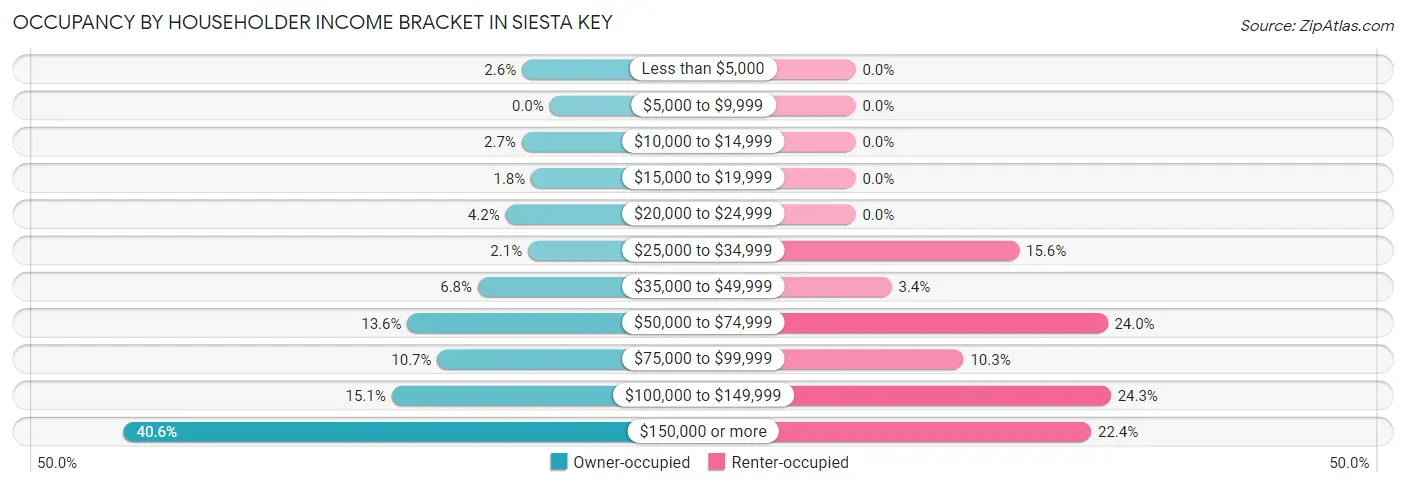
| Income Bracket | Owner-occupied | Renter-occupied |
| Less than $5,000 | 70 (2.6%) | 0 (0.0%) |
| $5,000 to $9,999 | 0 (0.0%) | 0 (0.0%) |
| $10,000 to $14,999 | 71 (2.7%) | 0 (0.0%) |
| $15,000 to $19,999 | 47 (1.8%) | 0 (0.0%) |
| $20,000 to $24,999 | 112 (4.2%) | 0 (0.0%) |
| $25,000 to $34,999 | 55 (2.1%) | 50 (15.6%) |
| $35,000 to $49,999 | 182 (6.8%) | 11 (3.4%) |
| $50,000 to $74,999 | 361 (13.6%) | 77 (24.0%) |
| $75,000 to $99,999 | 285 (10.7%) | 33 (10.3%) |
| $100,000 to $149,999 | 401 (15.0%) | 78 (24.3%) |
| $150,000 or more | 1,081 (40.6%) | 72 (22.4%) |
| Total | 2,665 (100.0%) | 321 (100.0%) |
Monthly Housing Cost Tiers in Siesta Key
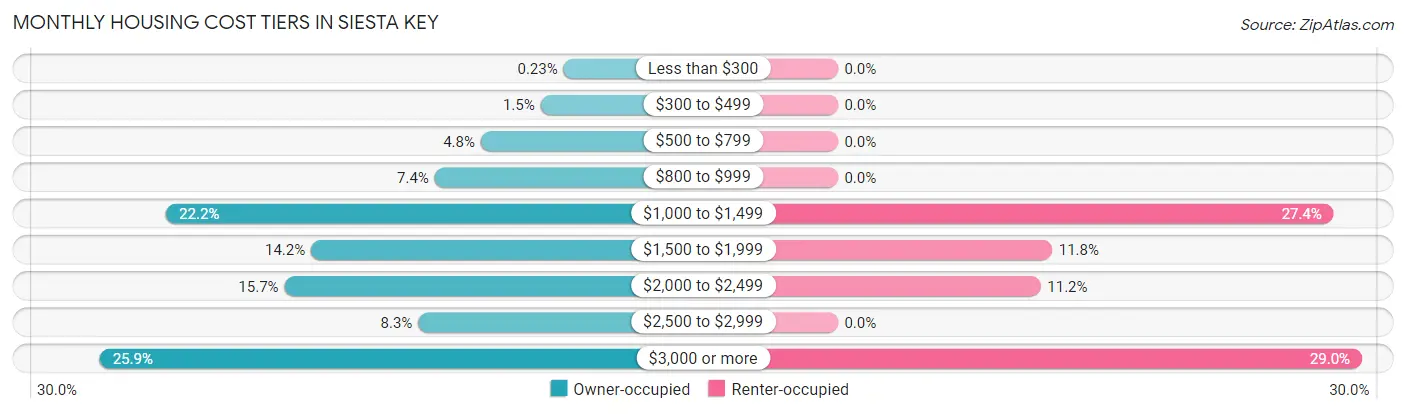
| Monthly Cost | Owner-occupied | Renter-occupied |
| Less than $300 | 6 (0.2%) | 0 (0.0%) |
| $300 to $499 | 40 (1.5%) | 0 (0.0%) |
| $500 to $799 | 128 (4.8%) | 0 (0.0%) |
| $800 to $999 | 196 (7.3%) | 0 (0.0%) |
| $1,000 to $1,499 | 591 (22.2%) | 88 (27.4%) |
| $1,500 to $1,999 | 378 (14.2%) | 38 (11.8%) |
| $2,000 to $2,499 | 417 (15.7%) | 36 (11.2%) |
| $2,500 to $2,999 | 220 (8.3%) | 0 (0.0%) |
| $3,000 or more | 689 (25.9%) | 93 (29.0%) |
| Total | 2,665 (100.0%) | 321 (100.0%) |
Physical Housing Characteristics in Siesta Key
Housing Structures in Siesta Key
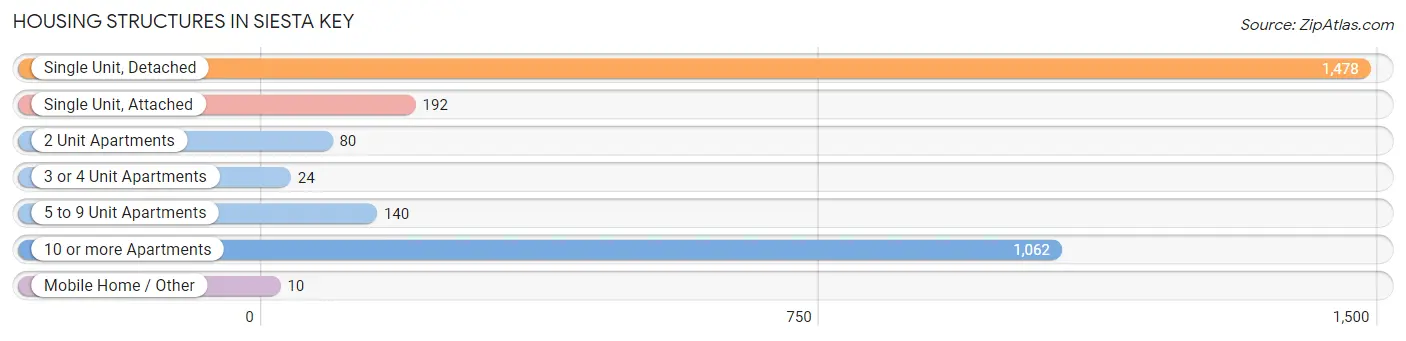
| Structure Type | # Housing Units | % Housing Units |
| Single Unit, Detached | 1,478 | 49.5% |
| Single Unit, Attached | 192 | 6.4% |
| 2 Unit Apartments | 80 | 2.7% |
| 3 or 4 Unit Apartments | 24 | 0.8% |
| 5 to 9 Unit Apartments | 140 | 4.7% |
| 10 or more Apartments | 1,062 | 35.6% |
| Mobile Home / Other | 10 | 0.3% |
| Total | 2,986 | 100.0% |
Housing Structures by Occupancy in Siesta Key
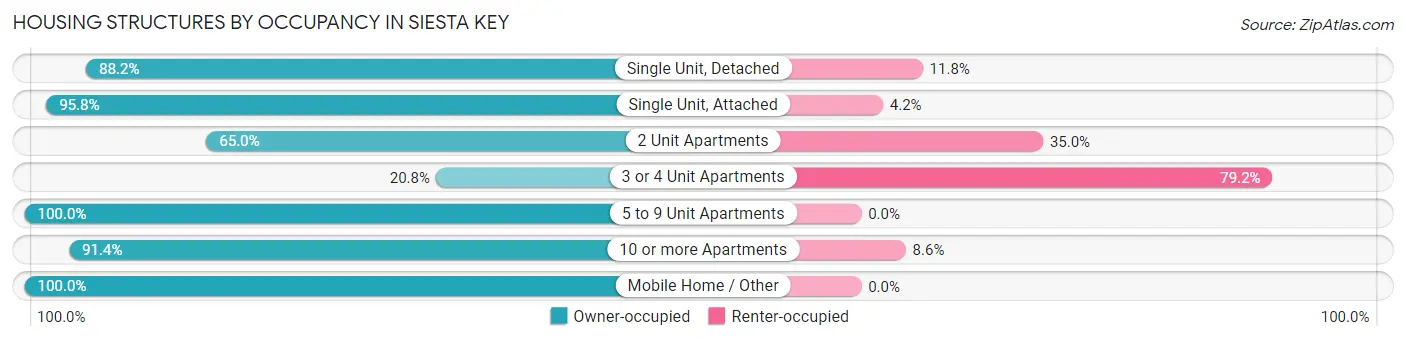
| Structure Type | Owner-occupied | Renter-occupied |
| Single Unit, Detached | 1,303 (88.2%) | 175 (11.8%) |
| Single Unit, Attached | 184 (95.8%) | 8 (4.2%) |
| 2 Unit Apartments | 52 (65.0%) | 28 (35.0%) |
| 3 or 4 Unit Apartments | 5 (20.8%) | 19 (79.2%) |
| 5 to 9 Unit Apartments | 140 (100.0%) | 0 (0.0%) |
| 10 or more Apartments | 971 (91.4%) | 91 (8.6%) |
| Mobile Home / Other | 10 (100.0%) | 0 (0.0%) |
| Total | 2,665 (89.2%) | 321 (10.7%) |
Housing Structures by Number of Rooms in Siesta Key
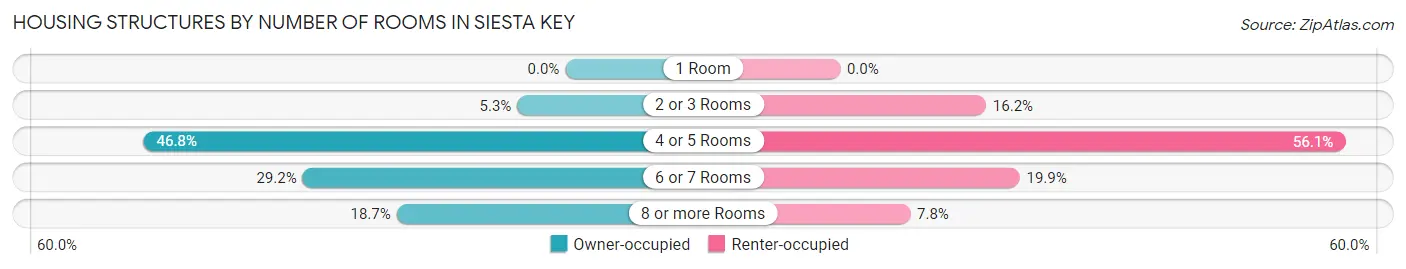
| Number of Rooms | Owner-occupied | Renter-occupied |
| 1 Room | 0 (0.0%) | 0 (0.0%) |
| 2 or 3 Rooms | 142 (5.3%) | 52 (16.2%) |
| 4 or 5 Rooms | 1,247 (46.8%) | 180 (56.1%) |
| 6 or 7 Rooms | 777 (29.2%) | 64 (19.9%) |
| 8 or more Rooms | 499 (18.7%) | 25 (7.8%) |
| Total | 2,665 (100.0%) | 321 (100.0%) |
Housing Structure by Heating Type in Siesta Key
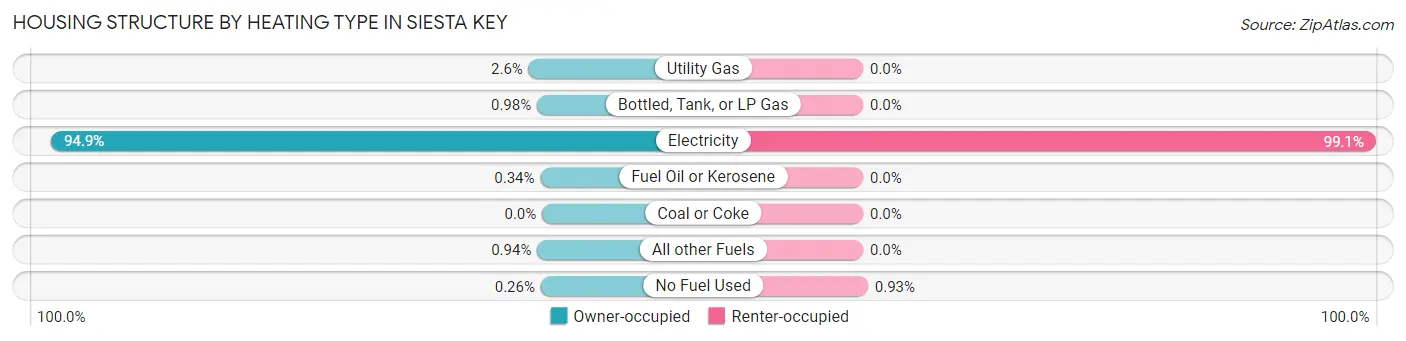
| Heating Type | Owner-occupied | Renter-occupied |
| Utility Gas | 69 (2.6%) | 0 (0.0%) |
| Bottled, Tank, or LP Gas | 26 (1.0%) | 0 (0.0%) |
| Electricity | 2,529 (94.9%) | 318 (99.1%) |
| Fuel Oil or Kerosene | 9 (0.3%) | 0 (0.0%) |
| Coal or Coke | 0 (0.0%) | 0 (0.0%) |
| All other Fuels | 25 (0.9%) | 0 (0.0%) |
| No Fuel Used | 7 (0.3%) | 3 (0.9%) |
| Total | 2,665 (100.0%) | 321 (100.0%) |
Household Vehicle Usage in Siesta Key
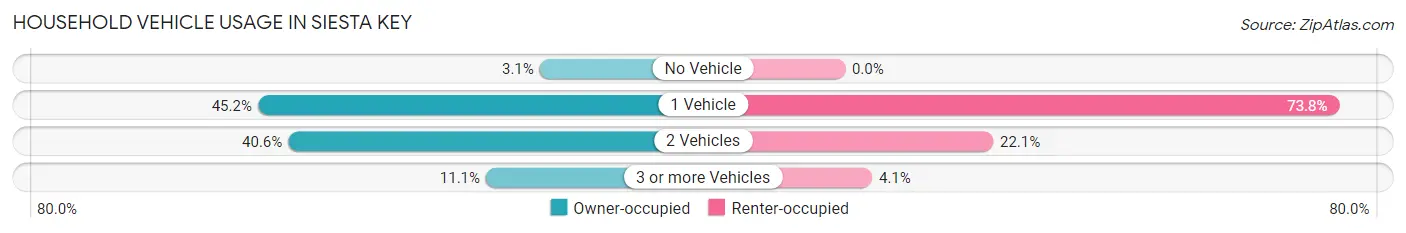
| Vehicles per Household | Owner-occupied | Renter-occupied |
| No Vehicle | 82 (3.1%) | 0 (0.0%) |
| 1 Vehicle | 1,204 (45.2%) | 237 (73.8%) |
| 2 Vehicles | 1,083 (40.6%) | 71 (22.1%) |
| 3 or more Vehicles | 296 (11.1%) | 13 (4.1%) |
| Total | 2,665 (100.0%) | 321 (100.0%) |
Real Estate & Mortgages in Siesta Key
Real Estate and Mortgage Overview in Siesta Key
| Characteristic | Without Mortgage | With Mortgage |
| Housing Units | 1,626 | 1,039 |
| Median Property Value | $850,400 | $874,100 |
| Median Household Income | $92,833 | $519 |
| Monthly Housing Costs | $1,359 | $610 |
| Real Estate Taxes | $6,186 | $7 |
Property Value by Mortgage Status in Siesta Key
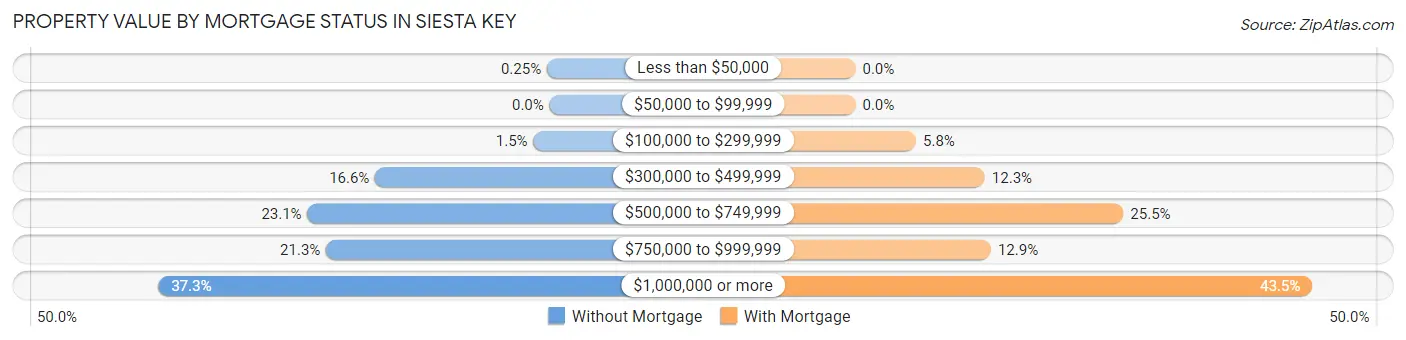
| Property Value | Without Mortgage | With Mortgage |
| Less than $50,000 | 4 (0.3%) | 0 (0.0%) |
| $50,000 to $99,999 | 0 (0.0%) | 0 (0.0%) |
| $100,000 to $299,999 | 25 (1.5%) | 60 (5.8%) |
| $300,000 to $499,999 | 270 (16.6%) | 128 (12.3%) |
| $500,000 to $749,999 | 375 (23.1%) | 265 (25.5%) |
| $750,000 to $999,999 | 346 (21.3%) | 134 (12.9%) |
| $1,000,000 or more | 606 (37.3%) | 452 (43.5%) |
| Total | 1,626 (100.0%) | 1,039 (100.0%) |
Household Income by Mortgage Status in Siesta Key
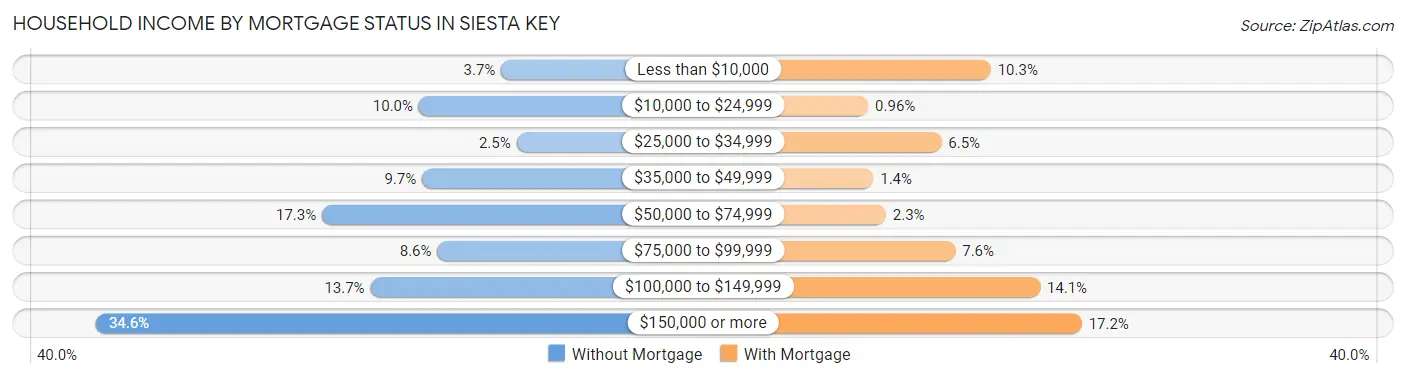
| Household Income | Without Mortgage | With Mortgage |
| Less than $10,000 | 60 (3.7%) | 107 (10.3%) |
| $10,000 to $24,999 | 162 (10.0%) | 10 (1.0%) |
| $25,000 to $34,999 | 41 (2.5%) | 68 (6.5%) |
| $35,000 to $49,999 | 158 (9.7%) | 14 (1.3%) |
| $50,000 to $74,999 | 282 (17.3%) | 24 (2.3%) |
| $75,000 to $99,999 | 139 (8.6%) | 79 (7.6%) |
| $100,000 to $149,999 | 222 (13.7%) | 146 (14.1%) |
| $150,000 or more | 562 (34.6%) | 179 (17.2%) |
| Total | 1,626 (100.0%) | 1,039 (100.0%) |
Property Value to Household Income Ratio in Siesta Key
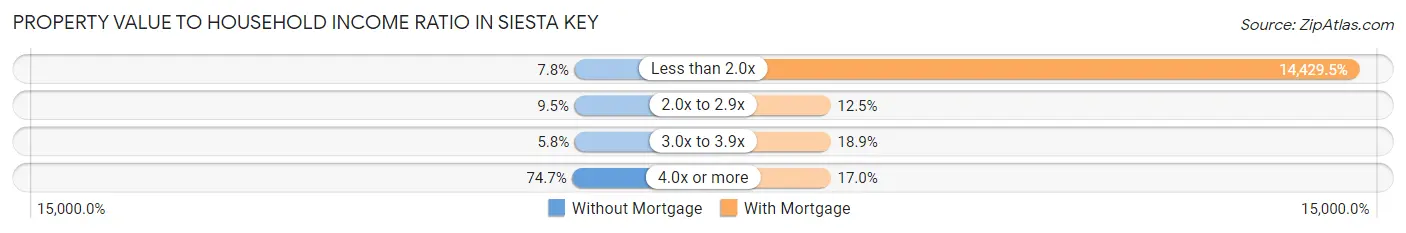
| Value-to-Income Ratio | Without Mortgage | With Mortgage |
| Less than 2.0x | 127 (7.8%) | 149,922 (14,429.4%) |
| 2.0x to 2.9x | 154 (9.5%) | 130 (12.5%) |
| 3.0x to 3.9x | 95 (5.8%) | 196 (18.9%) |
| 4.0x or more | 1,215 (74.7%) | 177 (17.0%) |
| Total | 1,626 (100.0%) | 1,039 (100.0%) |
Real Estate Taxes by Mortgage Status in Siesta Key
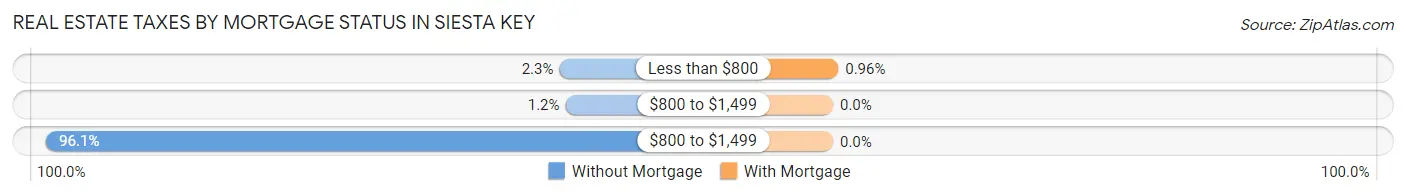
| Property Taxes | Without Mortgage | With Mortgage |
| Less than $800 | 38 (2.3%) | 10 (1.0%) |
| $800 to $1,499 | 20 (1.2%) | 0 (0.0%) |
| $800 to $1,499 | 1,562 (96.1%) | 0 (0.0%) |
| Total | 1,626 (100.0%) | 1,039 (100.0%) |
Health & Disability in Siesta Key
Health Insurance Coverage by Age in Siesta Key
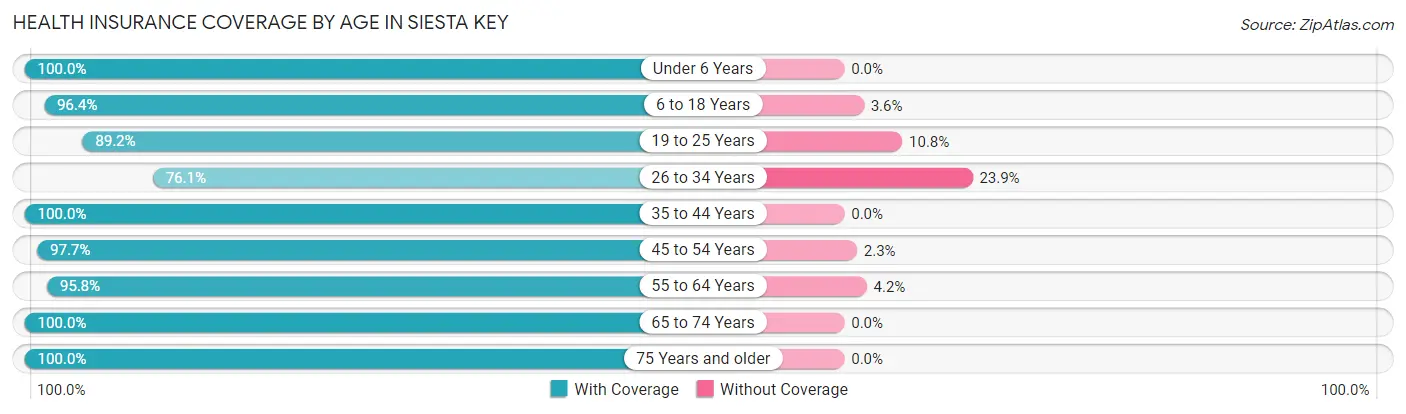
| Age Bracket | With Coverage | Without Coverage |
| Under 6 Years | 76 (100.0%) | 0 (0.0%) |
| 6 to 18 Years | 293 (96.4%) | 11 (3.6%) |
| 19 to 25 Years | 91 (89.2%) | 11 (10.8%) |
| 26 to 34 Years | 121 (76.1%) | 38 (23.9%) |
| 35 to 44 Years | 141 (100.0%) | 0 (0.0%) |
| 45 to 54 Years | 460 (97.7%) | 11 (2.3%) |
| 55 to 64 Years | 1,245 (95.8%) | 54 (4.2%) |
| 65 to 74 Years | 1,333 (100.0%) | 0 (0.0%) |
| 75 Years and older | 1,650 (100.0%) | 0 (0.0%) |
| Total | 5,410 (97.7%) | 125 (2.3%) |
Health Insurance Coverage by Citizenship Status in Siesta Key
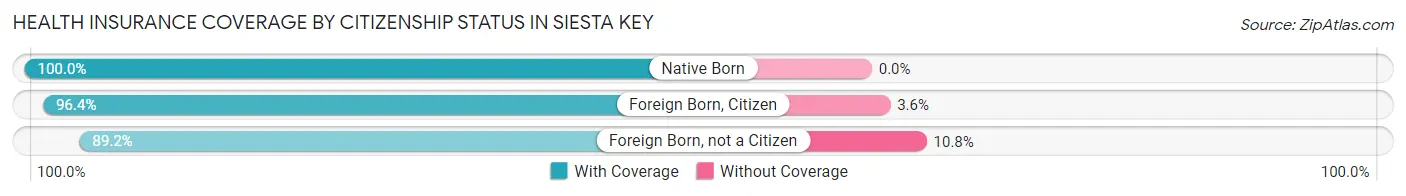
| Citizenship Status | With Coverage | Without Coverage |
| Native Born | 76 (100.0%) | 0 (0.0%) |
| Foreign Born, Citizen | 293 (96.4%) | 11 (3.6%) |
| Foreign Born, not a Citizen | 91 (89.2%) | 11 (10.8%) |
Health Insurance Coverage by Household Income in Siesta Key
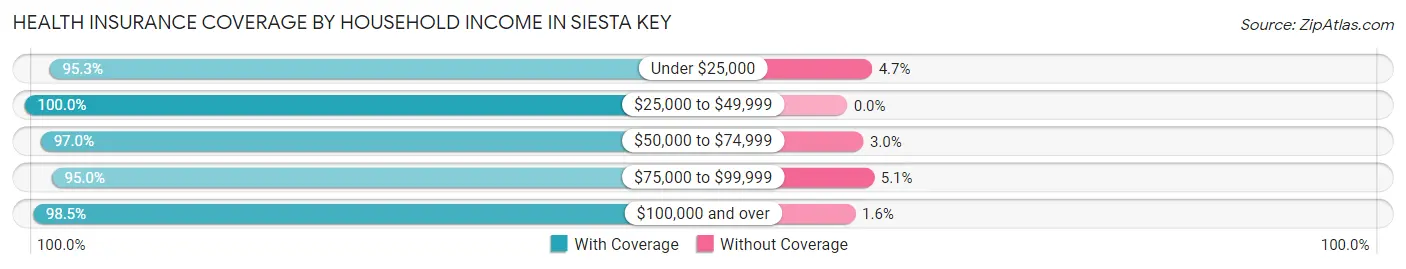
| Household Income | With Coverage | Without Coverage |
| Under $25,000 | 469 (95.3%) | 23 (4.7%) |
| $25,000 to $49,999 | 415 (100.0%) | 0 (0.0%) |
| $50,000 to $74,999 | 705 (97.0%) | 22 (3.0%) |
| $75,000 to $99,999 | 526 (95.0%) | 28 (5.1%) |
| $100,000 and over | 3,295 (98.5%) | 52 (1.5%) |
Public vs Private Health Insurance Coverage by Age in Siesta Key
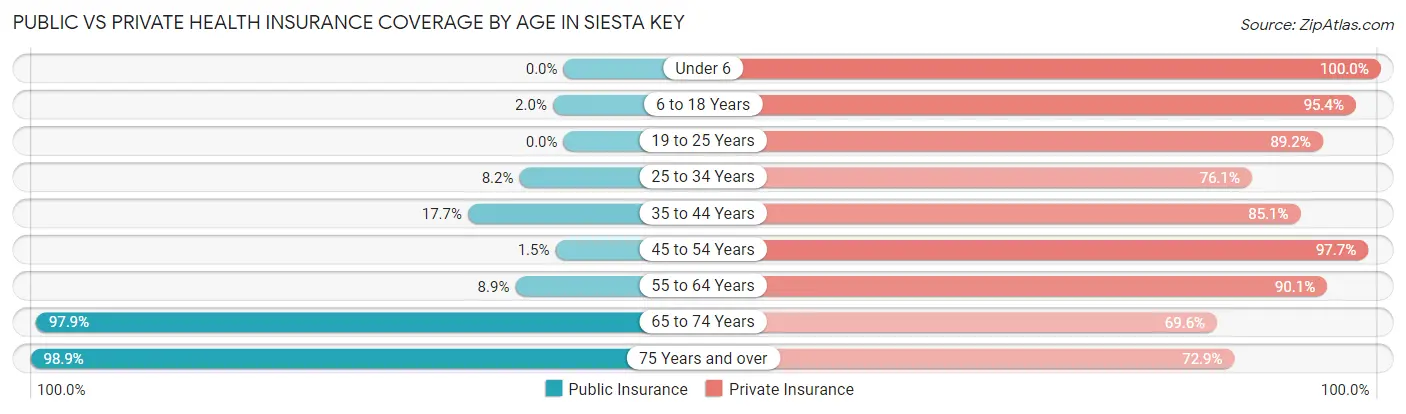
| Age Bracket | Public Insurance | Private Insurance |
| Under 6 | 0 (0.0%) | 76 (100.0%) |
| 6 to 18 Years | 6 (2.0%) | 290 (95.4%) |
| 19 to 25 Years | 0 (0.0%) | 91 (89.2%) |
| 25 to 34 Years | 13 (8.2%) | 121 (76.1%) |
| 35 to 44 Years | 25 (17.7%) | 120 (85.1%) |
| 45 to 54 Years | 7 (1.5%) | 460 (97.7%) |
| 55 to 64 Years | 116 (8.9%) | 1,170 (90.1%) |
| 65 to 74 Years | 1,305 (97.9%) | 928 (69.6%) |
| 75 Years and over | 1,632 (98.9%) | 1,202 (72.9%) |
| Total | 3,104 (56.1%) | 4,458 (80.5%) |
Disability Status by Sex by Age in Siesta Key
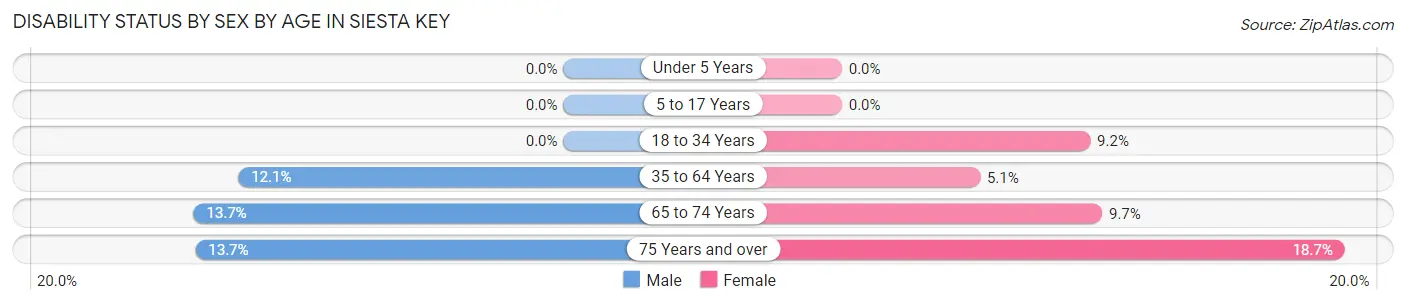
| Age Bracket | Male | Female |
| Under 5 Years | 0 (0.0%) | 0 (0.0%) |
| 5 to 17 Years | 0 (0.0%) | 0 (0.0%) |
| 18 to 34 Years | 0 (0.0%) | 13 (9.2%) |
| 35 to 64 Years | 113 (12.1%) | 50 (5.1%) |
| 65 to 74 Years | 85 (13.7%) | 69 (9.7%) |
| 75 Years and over | 112 (13.7%) | 155 (18.7%) |
Disability Class by Sex by Age in Siesta Key
Disability Class: Hearing Difficulty
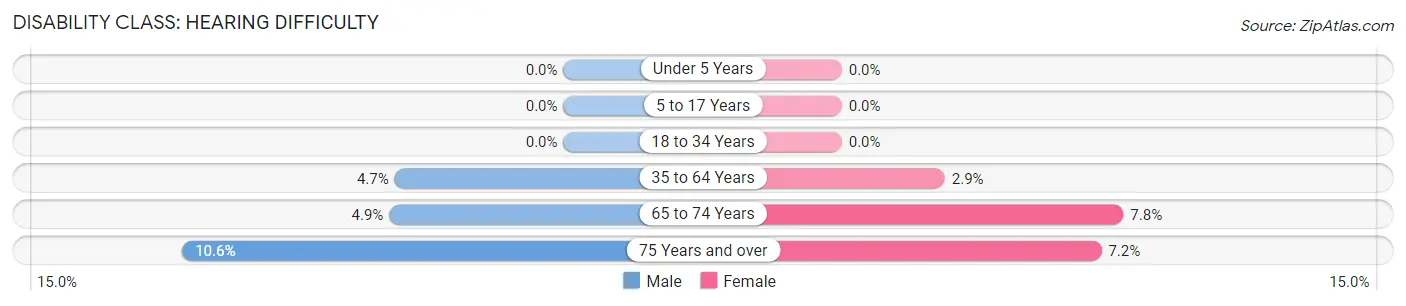
| Age Bracket | Male | Female |
| Under 5 Years | 0 (0.0%) | 0 (0.0%) |
| 5 to 17 Years | 0 (0.0%) | 0 (0.0%) |
| 18 to 34 Years | 0 (0.0%) | 0 (0.0%) |
| 35 to 64 Years | 44 (4.7%) | 28 (2.9%) |
| 65 to 74 Years | 30 (4.9%) | 56 (7.8%) |
| 75 Years and over | 87 (10.6%) | 60 (7.2%) |
Disability Class: Vision Difficulty
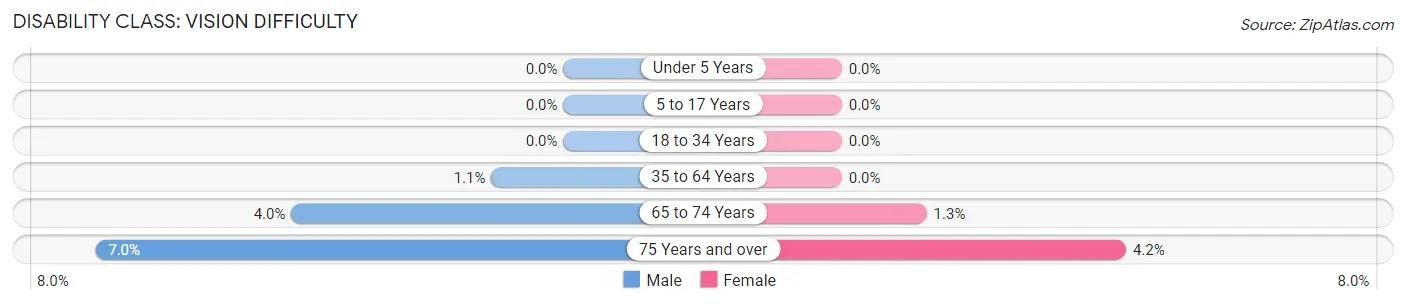
| Age Bracket | Male | Female |
| Under 5 Years | 0 (0.0%) | 0 (0.0%) |
| 5 to 17 Years | 0 (0.0%) | 0 (0.0%) |
| 18 to 34 Years | 0 (0.0%) | 0 (0.0%) |
| 35 to 64 Years | 10 (1.1%) | 0 (0.0%) |
| 65 to 74 Years | 25 (4.0%) | 9 (1.3%) |
| 75 Years and over | 57 (7.0%) | 35 (4.2%) |
Disability Class: Cognitive Difficulty
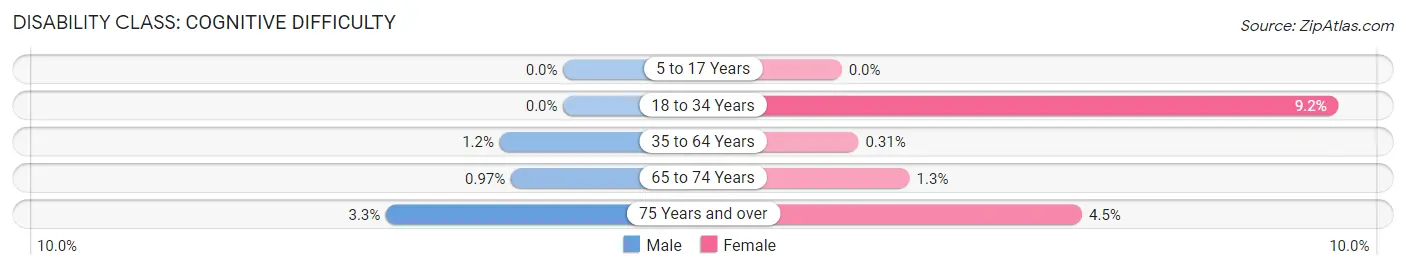
| Age Bracket | Male | Female |
| 5 to 17 Years | 0 (0.0%) | 0 (0.0%) |
| 18 to 34 Years | 0 (0.0%) | 13 (9.2%) |
| 35 to 64 Years | 11 (1.2%) | 3 (0.3%) |
| 65 to 74 Years | 6 (1.0%) | 9 (1.3%) |
| 75 Years and over | 27 (3.3%) | 37 (4.5%) |
Disability Class: Ambulatory Difficulty
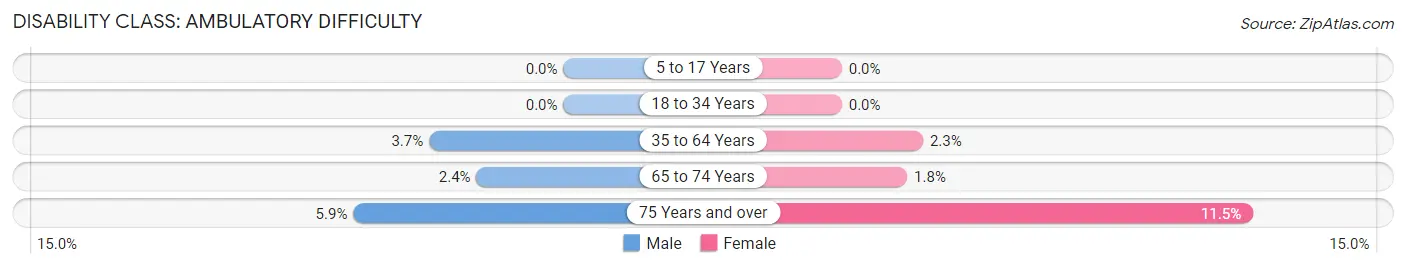
| Age Bracket | Male | Female |
| 5 to 17 Years | 0 (0.0%) | 0 (0.0%) |
| 18 to 34 Years | 0 (0.0%) | 0 (0.0%) |
| 35 to 64 Years | 35 (3.7%) | 22 (2.3%) |
| 65 to 74 Years | 15 (2.4%) | 13 (1.8%) |
| 75 Years and over | 48 (5.9%) | 95 (11.5%) |
Disability Class: Self-Care Difficulty
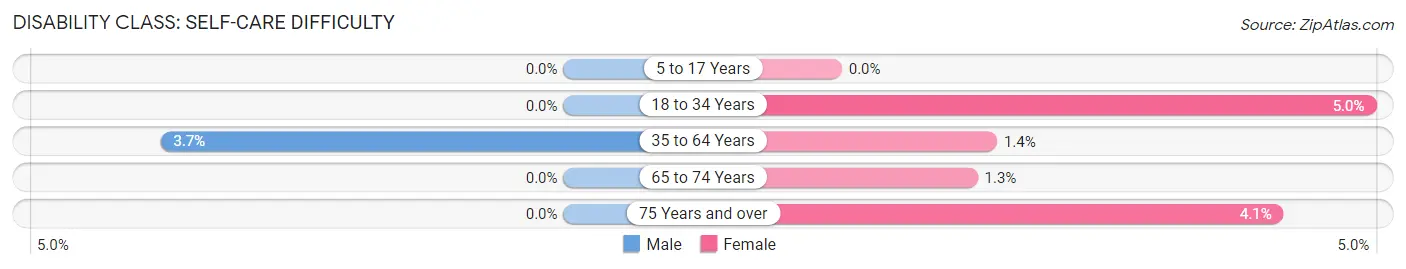
| Age Bracket | Male | Female |
| 5 to 17 Years | 0 (0.0%) | 0 (0.0%) |
| 18 to 34 Years | 0 (0.0%) | 7 (5.0%) |
| 35 to 64 Years | 35 (3.7%) | 14 (1.4%) |
| 65 to 74 Years | 0 (0.0%) | 9 (1.3%) |
| 75 Years and over | 0 (0.0%) | 34 (4.1%) |
Technology Access in Siesta Key
Computing Device Access in Siesta Key
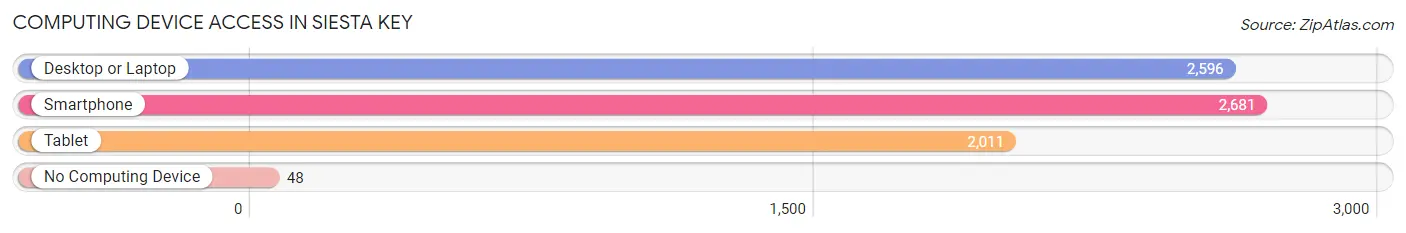
| Device Type | # Households | % Households |
| Desktop or Laptop | 2,596 | 86.9% |
| Smartphone | 2,681 | 89.8% |
| Tablet | 2,011 | 67.3% |
| No Computing Device | 48 | 1.6% |
| Total | 2,986 | 100.0% |
Internet Access in Siesta Key
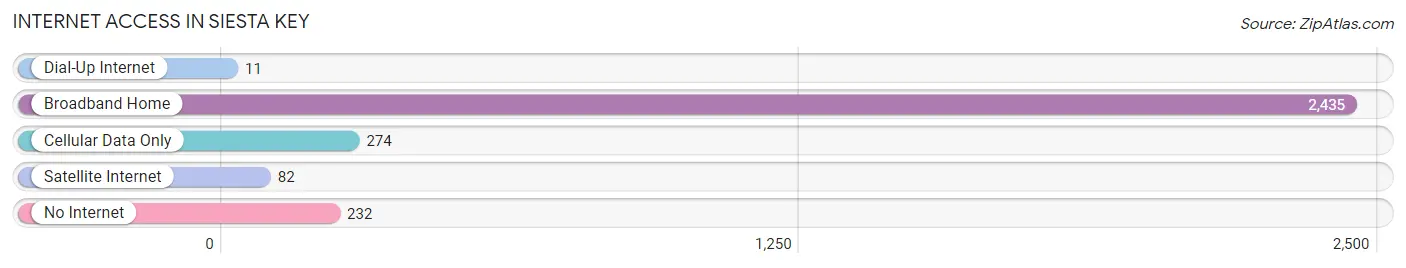
| Internet Type | # Households | % Households |
| Dial-Up Internet | 11 | 0.4% |
| Broadband Home | 2,435 | 81.6% |
| Cellular Data Only | 274 | 9.2% |
| Satellite Internet | 82 | 2.8% |
| No Internet | 232 | 7.8% |
| Total | 2,986 | 100.0% |
Siesta Key Summary
Siesta Key is a barrier island located off the coast of Sarasota, Florida. It is known for its white sand beaches, crystal clear waters, and vibrant nightlife. The island is 8 miles long and is home to a variety of businesses, restaurants, and resorts.
History
Siesta Key was first inhabited by the Timucua Indians, who lived in the area for centuries before the arrival of Europeans. The first Europeans to settle on the island were the Spanish, who established a mission in the area in the late 1700s. The island was later used as a base for the US Navy during the Second Seminole War.
In the early 1900s, the island was developed as a resort destination. The first hotel was built in 1912, and the island quickly became a popular destination for tourists. The island was also home to a number of fishing camps, which attracted anglers from all over the country.
In the 1950s, the island was developed further with the construction of a bridge connecting it to the mainland. This allowed for easier access to the island and helped to spur further development.
Geography
Siesta Key is located off the coast of Sarasota, Florida. It is 8 miles long and is bordered by the Gulf of Mexico to the west and Sarasota Bay to the east. The island is connected to the mainland by two bridges, the Stickney Point Bridge and the Siesta Drive Bridge.
The island is home to a variety of wildlife, including dolphins, manatees, sea turtles, and a variety of birds. The island is also home to a number of protected areas, including the Siesta Key Aquatic Preserve and the Siesta Key Wildlife Refuge.
Economy
Siesta Key is a popular tourist destination, and the island’s economy is largely dependent on tourism. The island is home to a variety of businesses, including hotels, restaurants, and shops. The island is also home to a number of resorts, which attract visitors from all over the world.
The island is also home to a number of marinas, which provide services to boaters and fishermen. The island is also home to a number of charter fishing companies, which offer deep sea fishing trips.
Demographics
As of the 2010 census, the population of Siesta Key was 6,565. The population is largely white (90.3%), with a small percentage of African Americans (3.2%) and Hispanics (2.7%). The median household income is $68,945, and the median age is 48.
Conclusion
Siesta Key is a beautiful barrier island located off the coast of Sarasota, Florida. It is known for its white sand beaches, crystal clear waters, and vibrant nightlife. The island is home to a variety of businesses, restaurants, and resorts, and is a popular tourist destination. The island’s economy is largely dependent on tourism, and the population is largely white. Siesta Key is a great place to visit, and its unique history, geography, economy, and demographics make it a truly special place.
Common Questions
What is Per Capita Income in Siesta Key?
Per Capita income in Siesta Key is $108,974.
What is the Median Family Income in Siesta Key?
Median Family Income in Siesta Key is $136,080.
What is the Median Household income in Siesta Key?
Median Household Income in Siesta Key is $113,500.
What is Income or Wage Gap in Siesta Key?
Income or Wage Gap in Siesta Key is 57.0%.
Women in Siesta Key earn 43.0 cents for every dollar earned by a man.
What is Inequality or Gini Index in Siesta Key?
Inequality or Gini Index in Siesta Key is 0.56.
What is the Total Population of Siesta Key?
Total Population of Siesta Key is 5,535.
What is the Total Male Population of Siesta Key?
Total Male Population of Siesta Key is 2,739.
What is the Total Female Population of Siesta Key?
Total Female Population of Siesta Key is 2,796.
What is the Ratio of Males per 100 Females in Siesta Key?
There are 97.96 Males per 100 Females in Siesta Key.
What is the Ratio of Females per 100 Males in Siesta Key?
There are 102.08 Females per 100 Males in Siesta Key.
What is the Median Population Age in Siesta Key?
Median Population Age in Siesta Key is 66.9 Years.
What is the Average Family Size in Siesta Key
Average Family Size in Siesta Key is 2.2 People.
What is the Average Household Size in Siesta Key
Average Household Size in Siesta Key is 1.9 People.
How Large is the Labor Force in Siesta Key?
There are 1,689 People in the Labor Forcein in Siesta Key.
What is the Percentage of People in the Labor Force in Siesta Key?
32.3% of People are in the Labor Force in Siesta Key.
What is the Unemployment Rate in Siesta Key?
Unemployment Rate in Siesta Key is 4.9%.