Eden, TX Map & Demographics
Eden Map
Eden Overview
$19,421
PER CAPITA INCOME
$76,429
AVG FAMILY INCOME
$45,000
AVG HOUSEHOLD INCOME
59.7%
WAGE / INCOME GAP [ % ]
40.3¢/ $1
WAGE / INCOME GAP [ $ ]
$10,813
FAMILY INCOME DEFICIT
0.43
INEQUALITY / GINI INDEX
1,822
TOTAL POPULATION
1,198
MALE POPULATION
624
FEMALE POPULATION
191.99
MALES / 100 FEMALES
52.09
FEMALES / 100 MALES
39.3
MEDIAN AGE
3.3
AVG FAMILY SIZE
2.6
AVG HOUSEHOLD SIZE
427
LABOR FORCE [ PEOPLE ]
26.7%
PERCENT IN LABOR FORCE
1.4%
UNEMPLOYMENT RATE
Eden Zip Codes
Eden Area Codes
Income in Eden
Income Overview in Eden
Per Capita Income in Eden is $19,421, while median incomes of families and households are $76,429 and $45,000 respectively.
| Characteristic | Number | Measure |
| Per Capita Income | 1,822 | $19,421 |
| Median Family Income | 252 | $76,429 |
| Mean Family Income | 252 | $77,247 |
| Median Household Income | 390 | $45,000 |
| Mean Household Income | 390 | $61,359 |
| Income Deficit | 252 | $10,813 |
| Wage / Income Gap (%) | 1,822 | 59.69% |
| Wage / Income Gap ($) | 1,822 | 40.31¢ per $1 |
| Gini / Inequality Index | 1,822 | 0.43 |
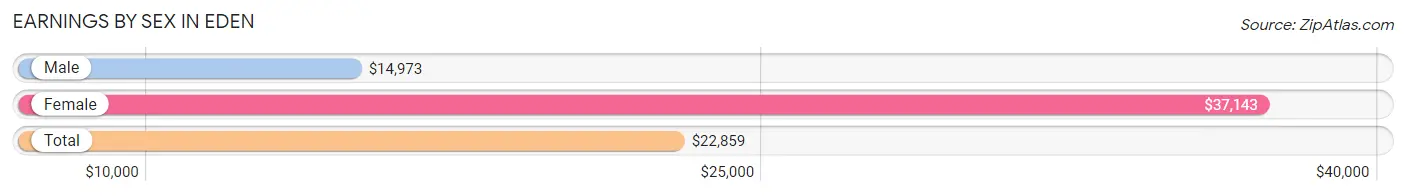
Earnings by Sex in Eden
Average Earnings in Eden are $22,859, $14,973 for men and $37,143 for women, a difference of 59.7%.
| Sex | Number | Average Earnings |
| Male | 439 (59.6%) | $14,973 |
| Female | 298 (40.4%) | $37,143 |
| Total | 737 (100.0%) | $22,859 |
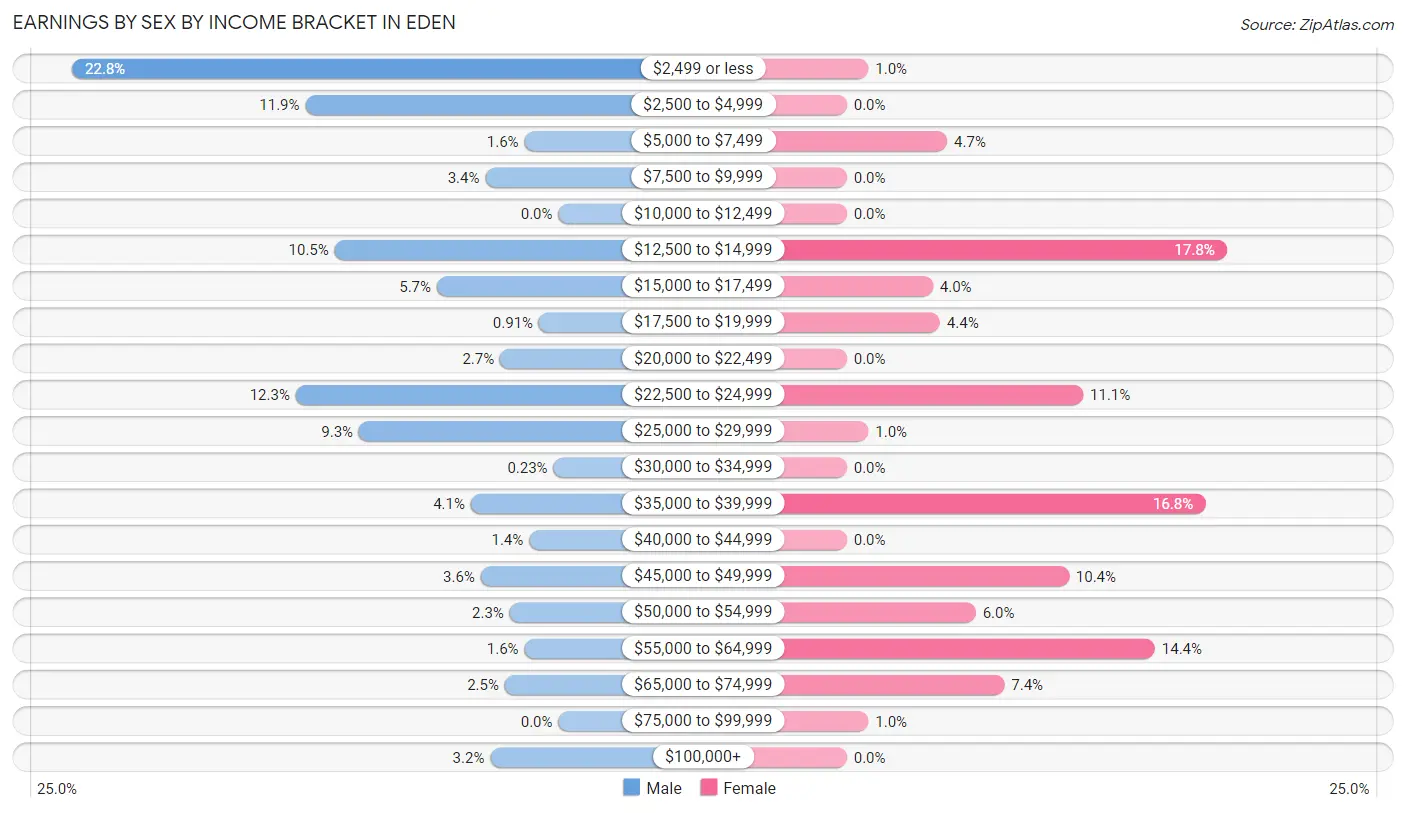
Earnings by Sex by Income Bracket in Eden
The most common earnings brackets in Eden are $2,499 or less for men (100 | 22.8%) and $12,500 to $14,999 for women (53 | 17.8%).
| Income | Male | Female |
| $2,499 or less | 100 (22.8%) | 3 (1.0%) |
| $2,500 to $4,999 | 52 (11.8%) | 0 (0.0%) |
| $5,000 to $7,499 | 7 (1.6%) | 14 (4.7%) |
| $7,500 to $9,999 | 15 (3.4%) | 0 (0.0%) |
| $10,000 to $12,499 | 0 (0.0%) | 0 (0.0%) |
| $12,500 to $14,999 | 46 (10.5%) | 53 (17.8%) |
| $15,000 to $17,499 | 25 (5.7%) | 12 (4.0%) |
| $17,500 to $19,999 | 4 (0.9%) | 13 (4.4%) |
| $20,000 to $22,499 | 12 (2.7%) | 0 (0.0%) |
| $22,500 to $24,999 | 54 (12.3%) | 33 (11.1%) |
| $25,000 to $29,999 | 41 (9.3%) | 3 (1.0%) |
| $30,000 to $34,999 | 1 (0.2%) | 0 (0.0%) |
| $35,000 to $39,999 | 18 (4.1%) | 50 (16.8%) |
| $40,000 to $44,999 | 6 (1.4%) | 0 (0.0%) |
| $45,000 to $49,999 | 16 (3.6%) | 31 (10.4%) |
| $50,000 to $54,999 | 10 (2.3%) | 18 (6.0%) |
| $55,000 to $64,999 | 7 (1.6%) | 43 (14.4%) |
| $65,000 to $74,999 | 11 (2.5%) | 22 (7.4%) |
| $75,000 to $99,999 | 0 (0.0%) | 3 (1.0%) |
| $100,000+ | 14 (3.2%) | 0 (0.0%) |
| Total | 439 (100.0%) | 298 (100.0%) |
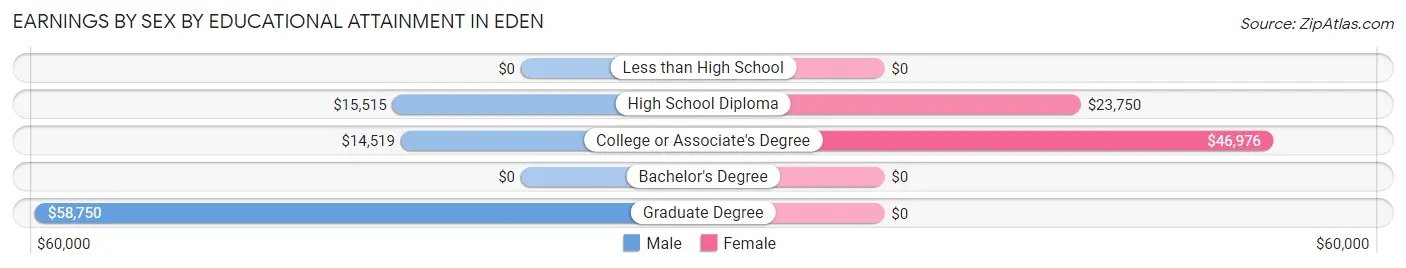
Earnings by Sex by Educational Attainment in Eden
Average earnings in Eden are $14,429 for men and $38,793 for women, a difference of 62.8%. Men with an educational attainment of graduate degree enjoy the highest average annual earnings of $58,750, while those with college or associate's degree education earn the least with $14,519. Women with an educational attainment of college or associate's degree earn the most with the average annual earnings of $46,976, while those with high school diploma education have the smallest earnings of $23,750.
| Educational Attainment | Male Income | Female Income |
| Less than High School | - | - |
| High School Diploma | $15,515 | $23,750 |
| College or Associate's Degree | $14,519 | $46,976 |
| Bachelor's Degree | - | - |
| Graduate Degree | $58,750 | $0 |
| Total | $14,429 | $38,793 |
Family Income in Eden
Family Income Brackets in Eden
According to the Eden family income data, there are 76 families falling into the $100,000 to $149,999 income range, which is the most common income bracket and makes up 30.2% of all families.
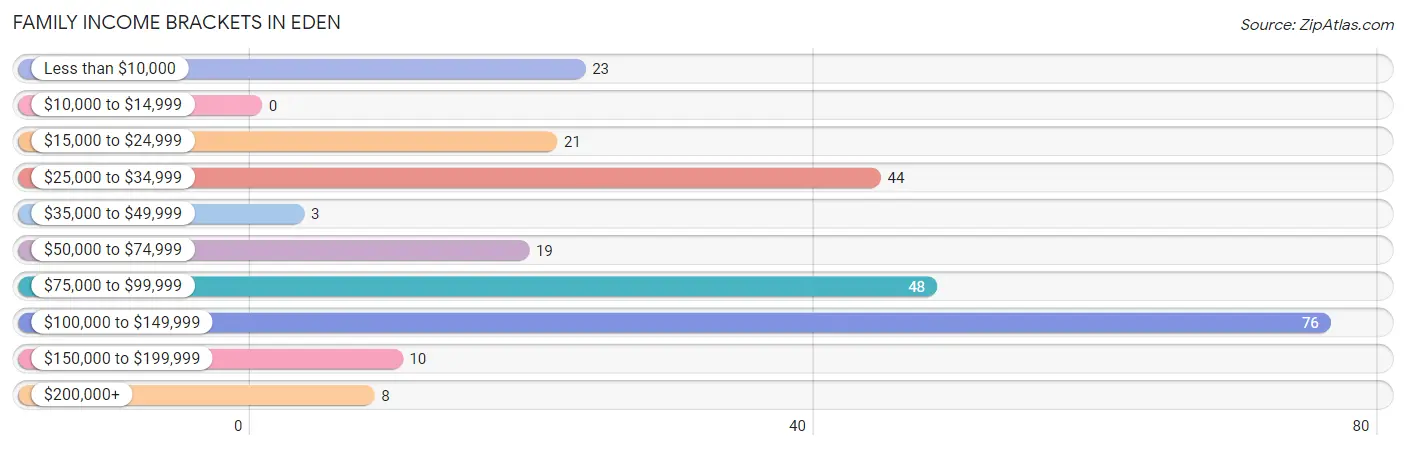
| Income Bracket | # Families | % Families |
| Less than $10,000 | 23 | 9.1% |
| $10,000 to $14,999 | 0 | 0.0% |
| $15,000 to $24,999 | 21 | 8.3% |
| $25,000 to $34,999 | 44 | 17.5% |
| $35,000 to $49,999 | 3 | 1.2% |
| $50,000 to $74,999 | 19 | 7.5% |
| $75,000 to $99,999 | 48 | 19.0% |
| $100,000 to $149,999 | 76 | 30.2% |
| $150,000 to $199,999 | 10 | 4.0% |
| $200,000+ | 8 | 3.2% |
Family Income by Famaliy Size in Eden
2-person families (167 | 66.3%) account for the highest median family income in Eden with $86,458 per family, while 2-person families (167 | 66.3%) have the highest median income of $43,229 per family member.
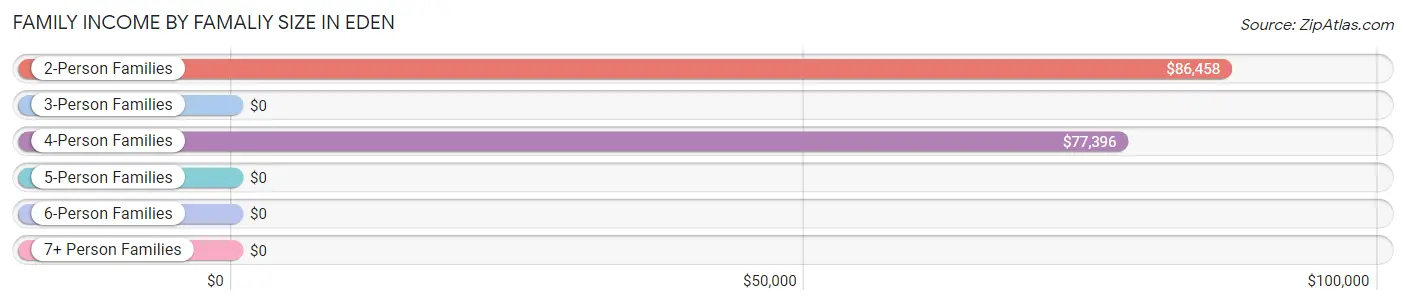
| Income Bracket | # Families | Median Income |
| 2-Person Families | 167 (66.3%) | $86,458 |
| 3-Person Families | 44 (17.5%) | $0 |
| 4-Person Families | 41 (16.3%) | $77,396 |
| 5-Person Families | 0 (0.0%) | $0 |
| 6-Person Families | 0 (0.0%) | $0 |
| 7+ Person Families | 0 (0.0%) | $0 |
| Total | 252 (100.0%) | $76,429 |
Family Income by Number of Earners in Eden
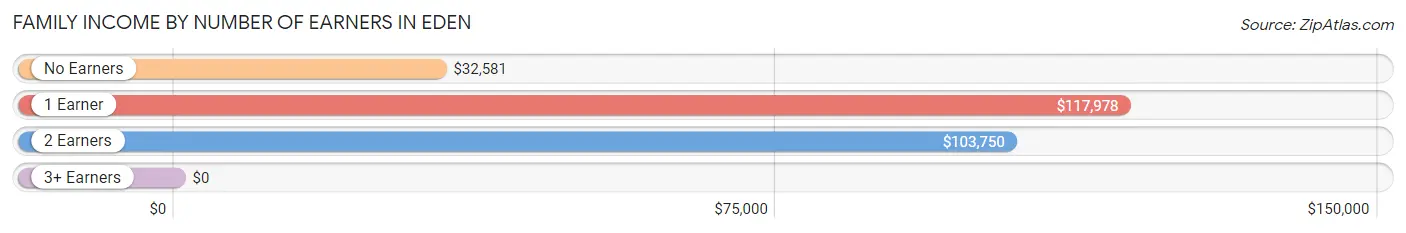
| Number of Earners | # Families | Median Income |
| No Earners | 78 (30.9%) | $32,581 |
| 1 Earner | 95 (37.7%) | $117,978 |
| 2 Earners | 79 (31.4%) | $103,750 |
| 3+ Earners | 0 (0.0%) | $0 |
| Total | 252 (100.0%) | $76,429 |
Household Income in Eden
Household Income Brackets in Eden
With 76 households falling in the category, the $100,000 to $149,999 income range is the most frequent in Eden, accounting for 19.5% of all households. In contrast, only 8 households (2.1%) fall into the $200,000+ income bracket, making it the least populous group.
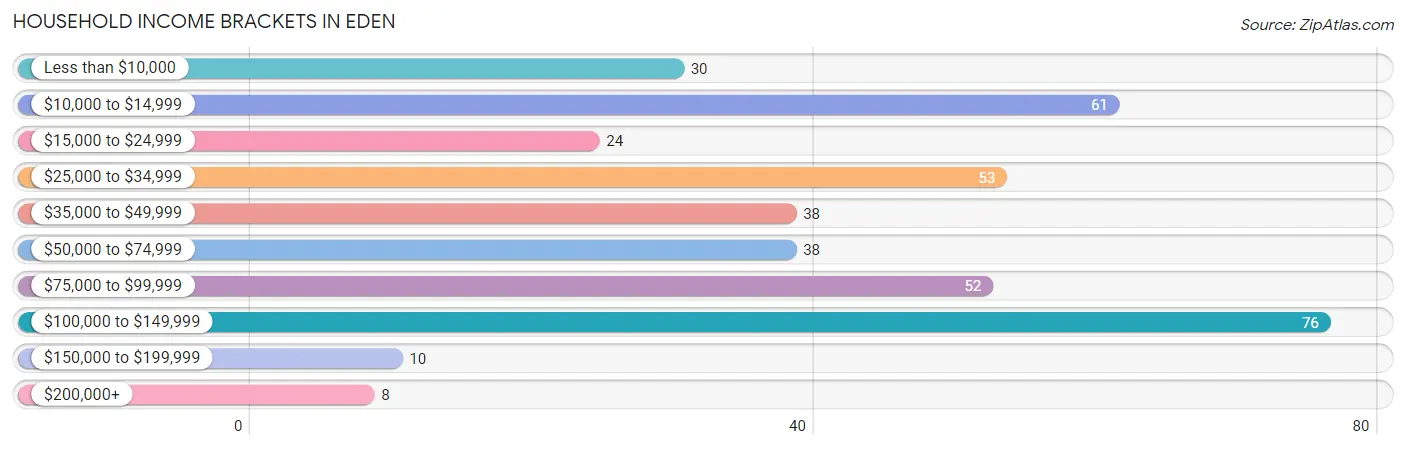
| Income Bracket | # Households | % Households |
| Less than $10,000 | 30 | 7.7% |
| $10,000 to $14,999 | 61 | 15.6% |
| $15,000 to $24,999 | 24 | 6.2% |
| $25,000 to $34,999 | 53 | 13.6% |
| $35,000 to $49,999 | 38 | 9.7% |
| $50,000 to $74,999 | 38 | 9.7% |
| $75,000 to $99,999 | 52 | 13.3% |
| $100,000 to $149,999 | 76 | 19.5% |
| $150,000 to $199,999 | 10 | 2.6% |
| $200,000+ | 8 | 2.1% |
Household Income by Householder Age in Eden
The median household income in Eden is $45,000, with the highest median household income of $85,833 found in the 45 to 64 years age bracket for the primary householder. A total of 168 households (43.1%) fall into this category. Meanwhile, the 15 to 24 years age bracket for the primary householder has the lowest median household income of $0, with 8 households (2.1%) in this group.
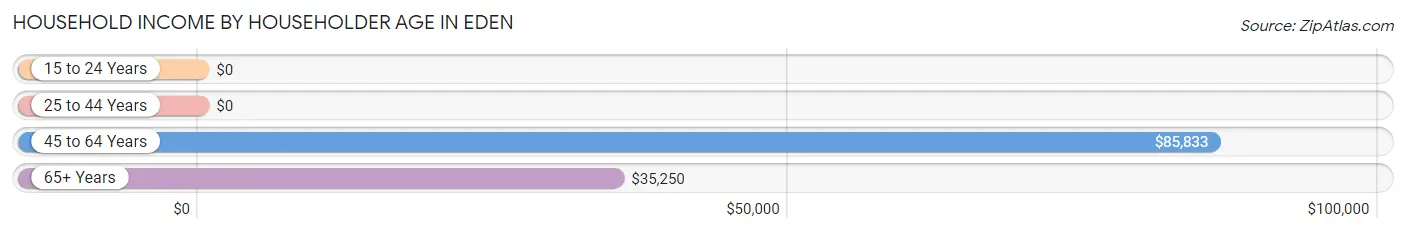
| Income Bracket | # Households | Median Income |
| 15 to 24 Years | 8 (2.1%) | $0 |
| 25 to 44 Years | 85 (21.8%) | $0 |
| 45 to 64 Years | 168 (43.1%) | $85,833 |
| 65+ Years | 129 (33.1%) | $35,250 |
| Total | 390 (100.0%) | $45,000 |
Poverty in Eden
Income Below Poverty by Sex and Age in Eden
With 28.0% poverty level for males and 16.2% for females among the residents of Eden, under 5 year old males and under 5 year old females are the most vulnerable to poverty, with 11 males (100.0%) and 3 females (100.0%) in their respective age groups living below the poverty level.
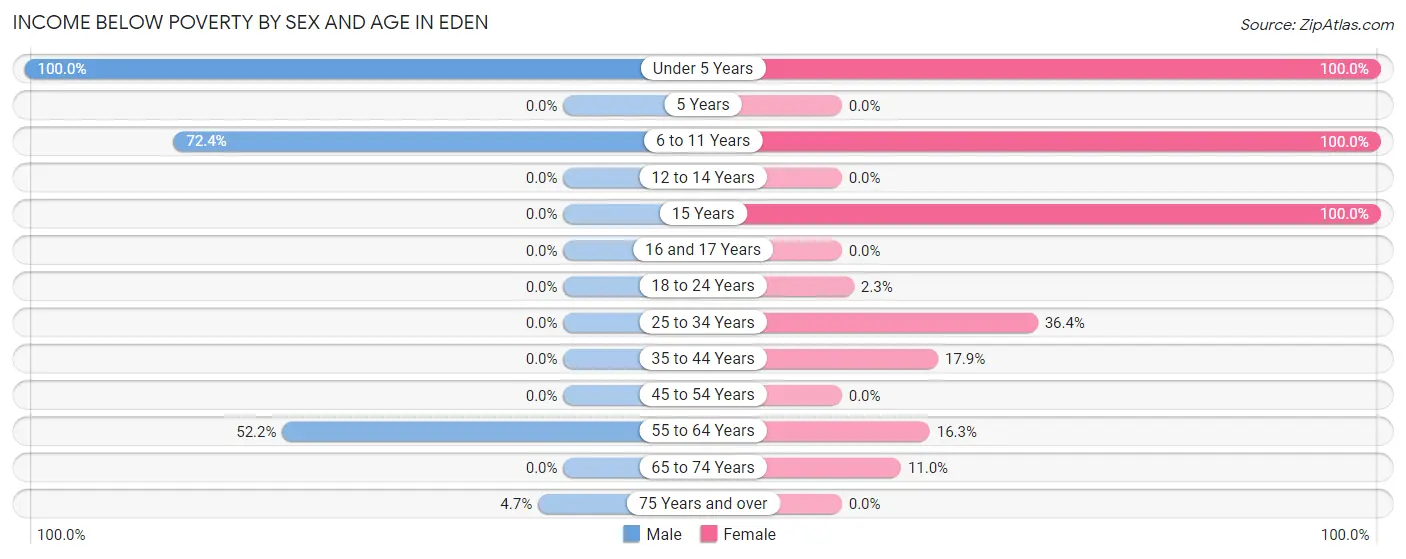
| Age Bracket | Male | Female |
| Under 5 Years | 11 (100.0%) | 3 (100.0%) |
| 5 Years | 0 (0.0%) | 0 (0.0%) |
| 6 to 11 Years | 55 (72.4%) | 25 (100.0%) |
| 12 to 14 Years | 0 (0.0%) | 0 (0.0%) |
| 15 Years | 0 (0.0%) | 9 (100.0%) |
| 16 and 17 Years | 0 (0.0%) | 0 (0.0%) |
| 18 to 24 Years | 0 (0.0%) | 2 (2.2%) |
| 25 to 34 Years | 0 (0.0%) | 20 (36.4%) |
| 35 to 44 Years | 0 (0.0%) | 10 (17.9%) |
| 45 to 54 Years | 0 (0.0%) | 0 (0.0%) |
| 55 to 64 Years | 48 (52.2%) | 16 (16.3%) |
| 65 to 74 Years | 0 (0.0%) | 9 (11.0%) |
| 75 Years and over | 4 (4.7%) | 0 (0.0%) |
| Total | 118 (28.0%) | 94 (16.2%) |
Income Above Poverty by Sex and Age in Eden
According to the poverty statistics in Eden, males aged 12 to 14 years and females aged 12 to 14 years are the age groups that are most secure financially, with 100.0% of males and 100.0% of females in these age groups living above the poverty line.
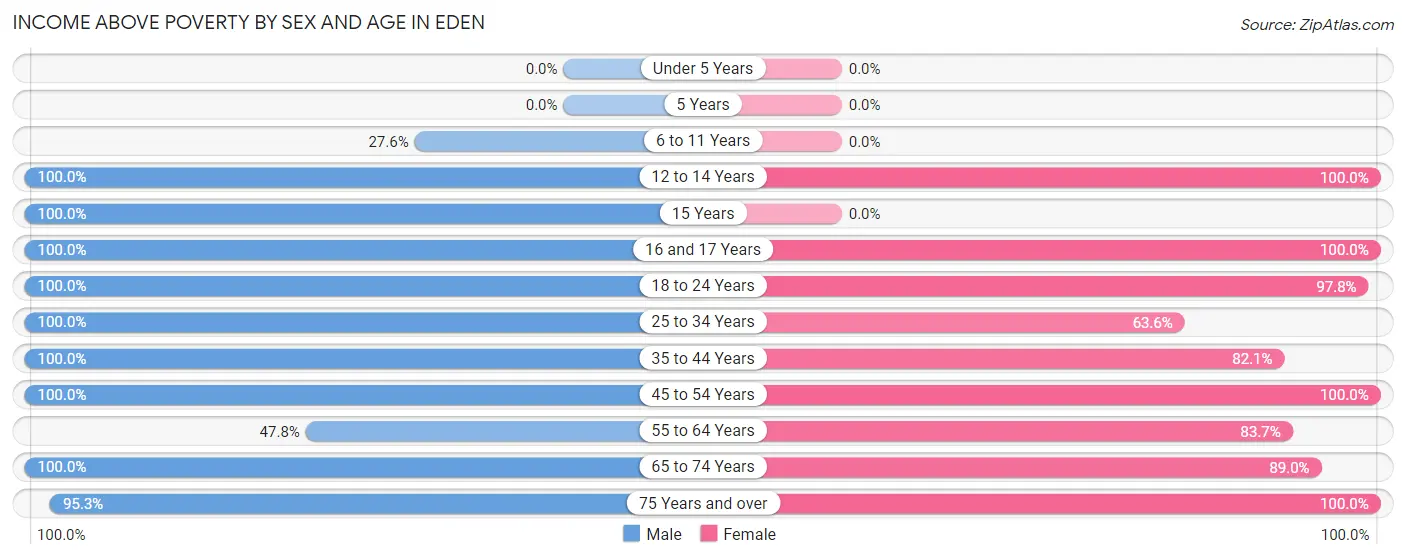
| Age Bracket | Male | Female |
| Under 5 Years | 0 (0.0%) | 0 (0.0%) |
| 5 Years | 0 (0.0%) | 0 (0.0%) |
| 6 to 11 Years | 21 (27.6%) | 0 (0.0%) |
| 12 to 14 Years | 56 (100.0%) | 25 (100.0%) |
| 15 Years | 16 (100.0%) | 0 (0.0%) |
| 16 and 17 Years | 9 (100.0%) | 17 (100.0%) |
| 18 to 24 Years | 10 (100.0%) | 87 (97.8%) |
| 25 to 34 Years | 1 (100.0%) | 35 (63.6%) |
| 35 to 44 Years | 15 (100.0%) | 46 (82.1%) |
| 45 to 54 Years | 18 (100.0%) | 73 (100.0%) |
| 55 to 64 Years | 44 (47.8%) | 82 (83.7%) |
| 65 to 74 Years | 33 (100.0%) | 73 (89.0%) |
| 75 Years and over | 81 (95.3%) | 50 (100.0%) |
| Total | 304 (72.0%) | 488 (83.9%) |
Income Below Poverty Among Married-Couple Families in Eden
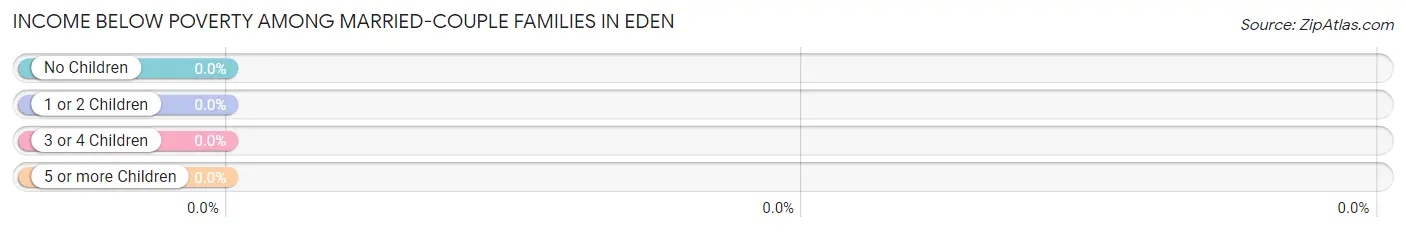
| Children | Above Poverty | Below Poverty |
| No Children | 155 (100.0%) | 0 (0.0%) |
| 1 or 2 Children | 32 (100.0%) | 0 (0.0%) |
| 3 or 4 Children | 0 (0.0%) | 0 (0.0%) |
| 5 or more Children | 0 (0.0%) | 0 (0.0%) |
| Total | 187 (100.0%) | 0 (0.0%) |
Income Below Poverty Among Single-Parent Households in Eden
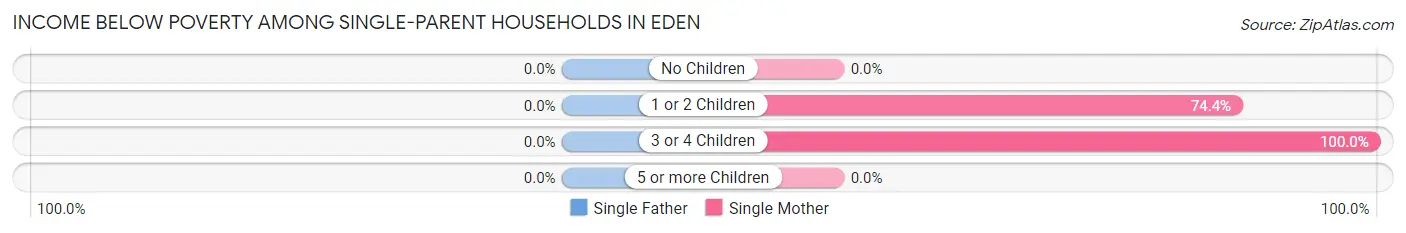
| Children | Single Father | Single Mother |
| No Children | 0 (0.0%) | 0 (0.0%) |
| 1 or 2 Children | 0 (0.0%) | 29 (74.4%) |
| 3 or 4 Children | 0 (0.0%) | 3 (100.0%) |
| 5 or more Children | 0 (0.0%) | 0 (0.0%) |
| Total | 0 (0.0%) | 32 (53.3%) |
Income Below Poverty Among Married-Couple vs Single-Parent Households in Eden
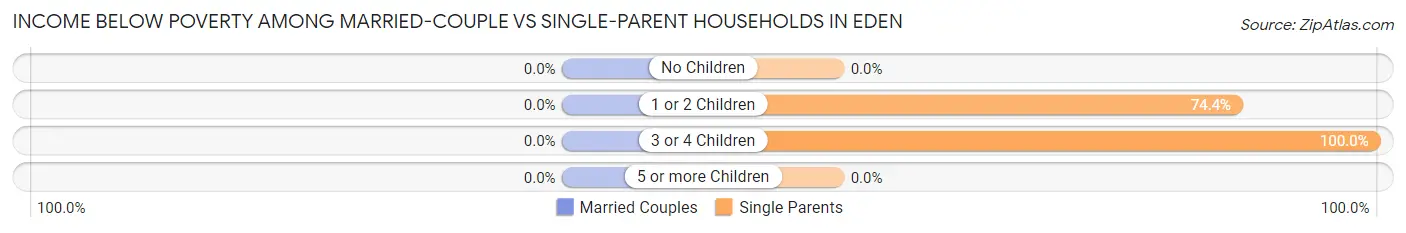
| Children | Married-Couple Families | Single-Parent Households |
| No Children | 0 (0.0%) | 0 (0.0%) |
| 1 or 2 Children | 0 (0.0%) | 29 (74.4%) |
| 3 or 4 Children | 0 (0.0%) | 3 (100.0%) |
| 5 or more Children | 0 (0.0%) | 0 (0.0%) |
| Total | 0 (0.0%) | 32 (49.2%) |
Race in Eden
The most populous races in Eden are White / Caucasian (1,396 | 76.6%), Hispanic or Latino (884 | 48.5%), and Two or more Races (242 | 13.3%).
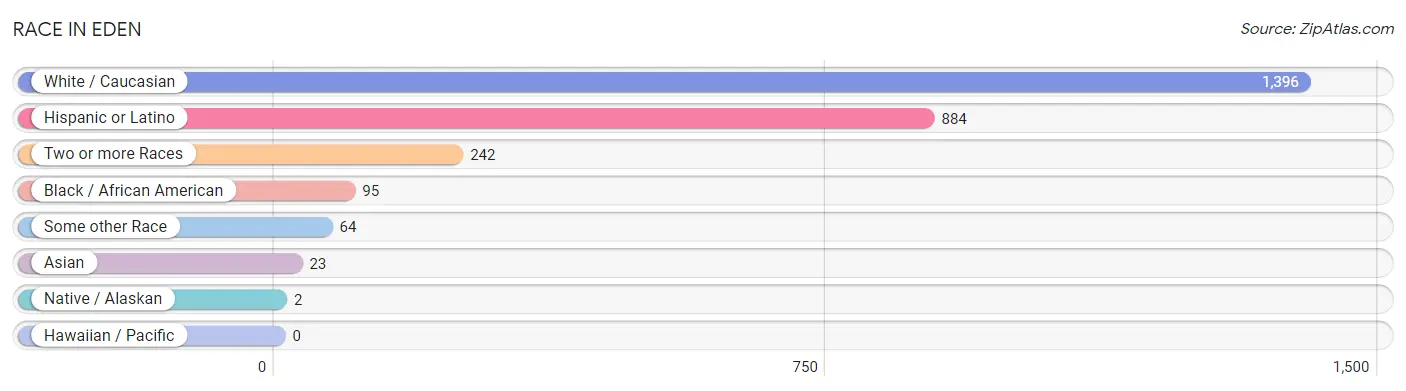
| Race | # Population | % Population |
| Asian | 23 | 1.3% |
| Black / African American | 95 | 5.2% |
| Hawaiian / Pacific | 0 | 0.0% |
| Hispanic or Latino | 884 | 48.5% |
| Native / Alaskan | 2 | 0.1% |
| White / Caucasian | 1,396 | 76.6% |
| Two or more Races | 242 | 13.3% |
| Some other Race | 64 | 3.5% |
| Total | 1,822 | 100.0% |
Ancestry in Eden
The most populous ancestries reported in Eden are Mexican (564 | 30.9%), English (184 | 10.1%), German (175 | 9.6%), European (131 | 7.2%), and Irish (118 | 6.5%), together accounting for 64.3% of all Eden residents.
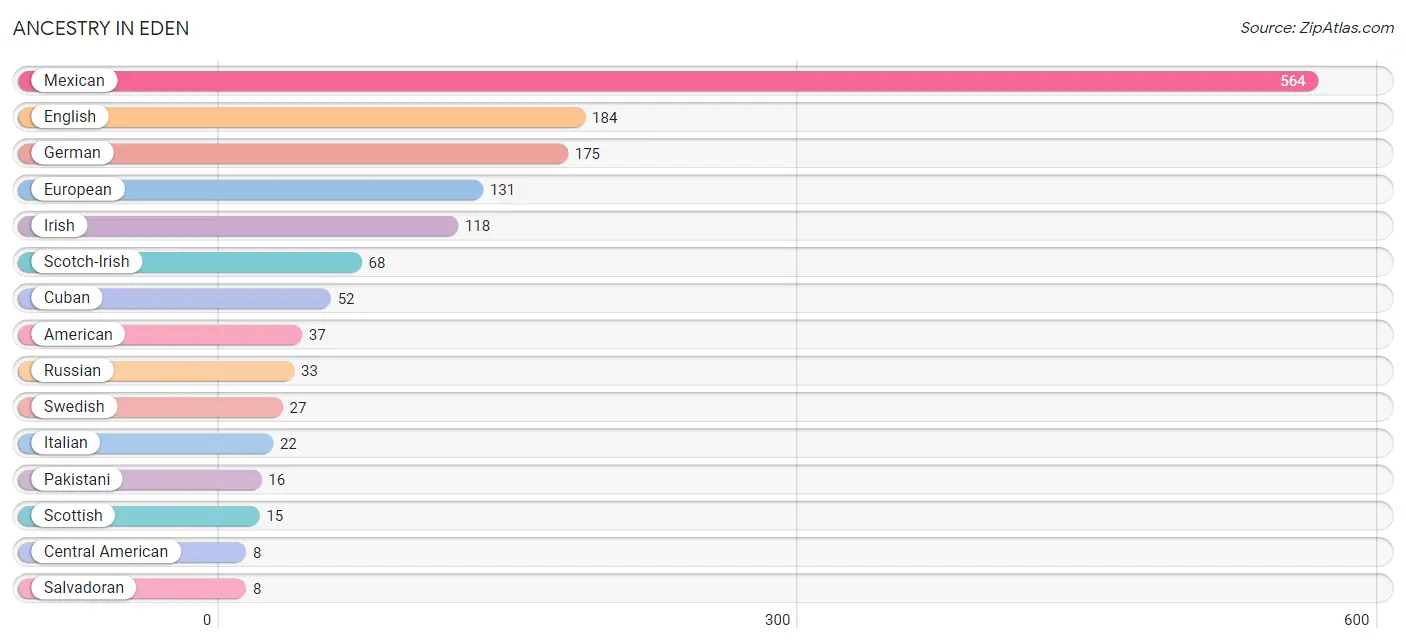
| Ancestry | # Population | % Population |
| American | 37 | 2.0% |
| Brazilian | 6 | 0.3% |
| British | 1 | 0.1% |
| Central American | 8 | 0.4% |
| Cuban | 52 | 2.9% |
| Dutch | 5 | 0.3% |
| Dutch West Indian | 3 | 0.2% |
| English | 184 | 10.1% |
| European | 131 | 7.2% |
| German | 175 | 9.6% |
| Irish | 118 | 6.5% |
| Italian | 22 | 1.2% |
| Mexican | 564 | 30.9% |
| Pakistani | 16 | 0.9% |
| Pima | 2 | 0.1% |
| Russian | 33 | 1.8% |
| Salvadoran | 8 | 0.4% |
| Scotch-Irish | 68 | 3.7% |
| Scottish | 15 | 0.8% |
| Spaniard | 2 | 0.1% |
| Swedish | 27 | 1.5% | View All 21 Rows |
Immigrants in Eden
The most numerous immigrant groups reported in Eden came from Latin America (274 | 15.0%), Central America (200 | 11.0%), Mexico (161 | 8.8%), Caribbean (68 | 3.7%), and Cuba (68 | 3.7%), together accounting for 42.3% of all Eden residents.
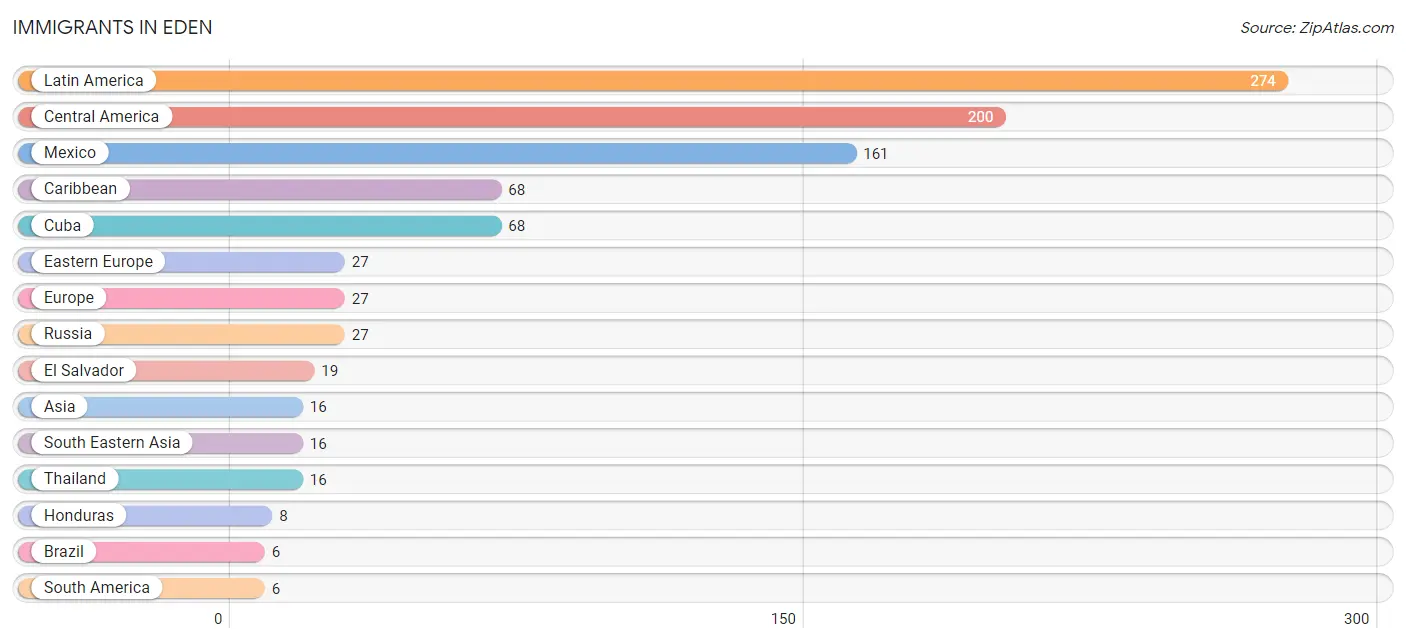
| Immigration Origin | # Population | % Population |
| Asia | 16 | 0.9% |
| Brazil | 6 | 0.3% |
| Caribbean | 68 | 3.7% |
| Central America | 200 | 11.0% |
| Cuba | 68 | 3.7% |
| Eastern Europe | 27 | 1.5% |
| El Salvador | 19 | 1.0% |
| Europe | 27 | 1.5% |
| Honduras | 8 | 0.4% |
| Latin America | 274 | 15.0% |
| Mexico | 161 | 8.8% |
| Russia | 27 | 1.5% |
| South America | 6 | 0.3% |
| South Eastern Asia | 16 | 0.9% |
| Thailand | 16 | 0.9% | View All 15 Rows |
Sex and Age in Eden
Sex and Age in Eden
The most populous age groups in Eden are 35 to 39 Years (166 | 13.9%) for men and 15 to 19 Years (73 | 11.7%) for women.
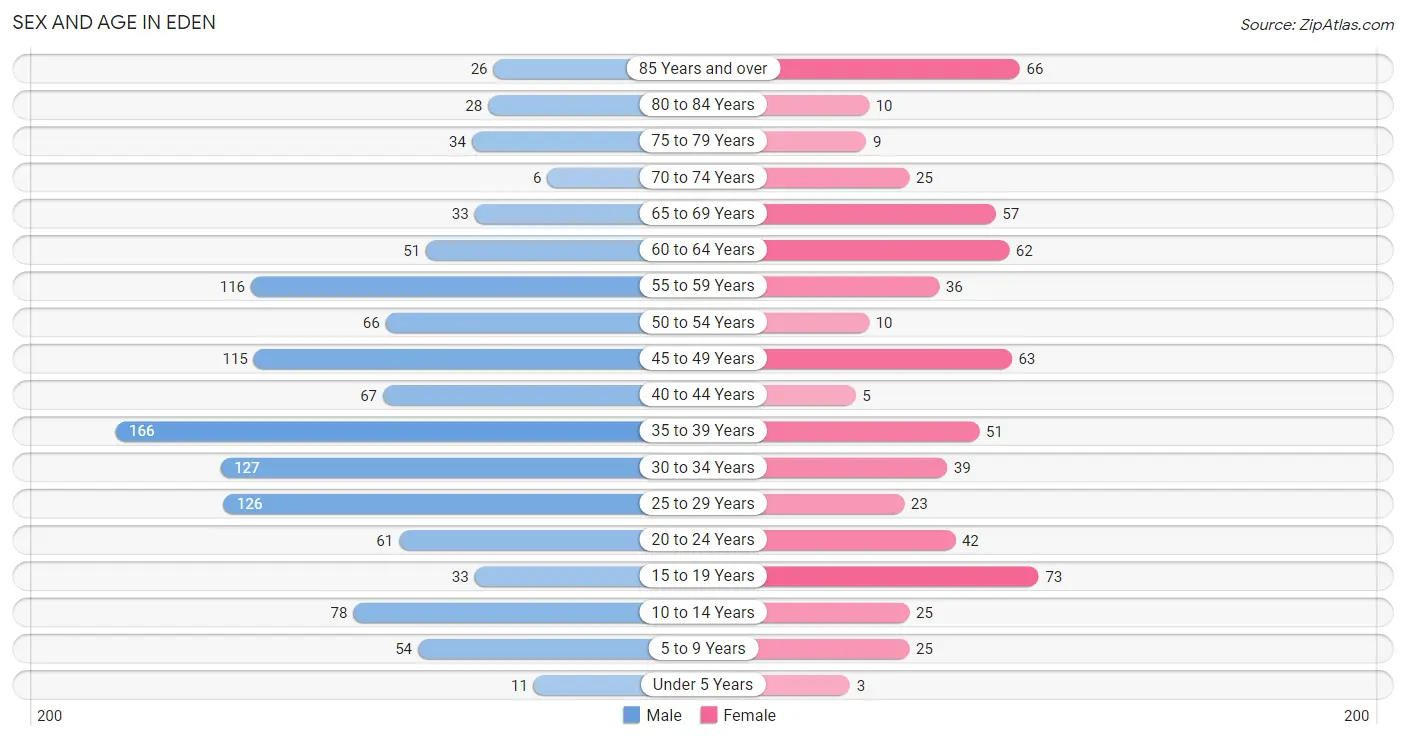
| Age Bracket | Male | Female |
| Under 5 Years | 11 (0.9%) | 3 (0.5%) |
| 5 to 9 Years | 54 (4.5%) | 25 (4.0%) |
| 10 to 14 Years | 78 (6.5%) | 25 (4.0%) |
| 15 to 19 Years | 33 (2.8%) | 73 (11.7%) |
| 20 to 24 Years | 61 (5.1%) | 42 (6.7%) |
| 25 to 29 Years | 126 (10.5%) | 23 (3.7%) |
| 30 to 34 Years | 127 (10.6%) | 39 (6.2%) |
| 35 to 39 Years | 166 (13.9%) | 51 (8.2%) |
| 40 to 44 Years | 67 (5.6%) | 5 (0.8%) |
| 45 to 49 Years | 115 (9.6%) | 63 (10.1%) |
| 50 to 54 Years | 66 (5.5%) | 10 (1.6%) |
| 55 to 59 Years | 116 (9.7%) | 36 (5.8%) |
| 60 to 64 Years | 51 (4.3%) | 62 (9.9%) |
| 65 to 69 Years | 33 (2.8%) | 57 (9.1%) |
| 70 to 74 Years | 6 (0.5%) | 25 (4.0%) |
| 75 to 79 Years | 34 (2.8%) | 9 (1.4%) |
| 80 to 84 Years | 28 (2.3%) | 10 (1.6%) |
| 85 Years and over | 26 (2.2%) | 66 (10.6%) |
| Total | 1,198 (100.0%) | 624 (100.0%) |
Families and Households in Eden
Median Family Size in Eden
The median family size in Eden is 3.27 persons per family, with single male/father families (5 | 2.0%) accounting for the largest median family size of 5.2 persons per family. On the other hand, married-couple families (187 | 74.2%) represent the smallest median family size with 3.09 persons per family.
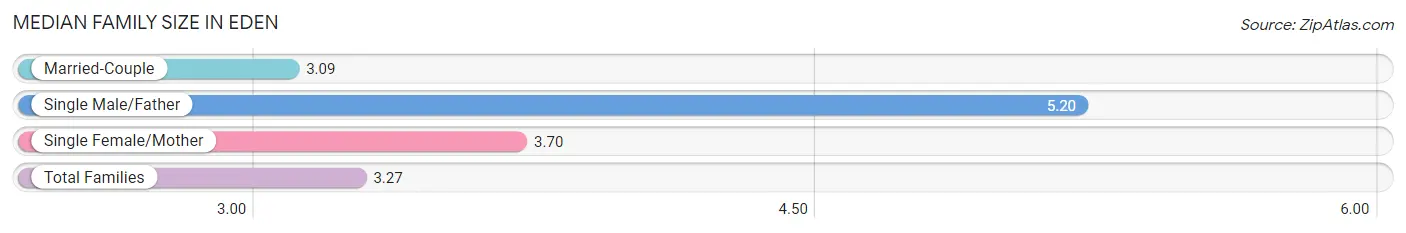
| Family Type | # Families | Family Size |
| Married-Couple | 187 (74.2%) | 3.09 |
| Single Male/Father | 5 (2.0%) | 5.20 |
| Single Female/Mother | 60 (23.8%) | 3.70 |
| Total Families | 252 (100.0%) | 3.27 |
Median Household Size in Eden
The median household size in Eden is 2.57 persons per household, with single male/father households (5 | 1.3%) accounting for the largest median household size of 5.8 persons per household. non-family households (138 | 35.4%) represent the smallest median household size with 1.28 persons per household.
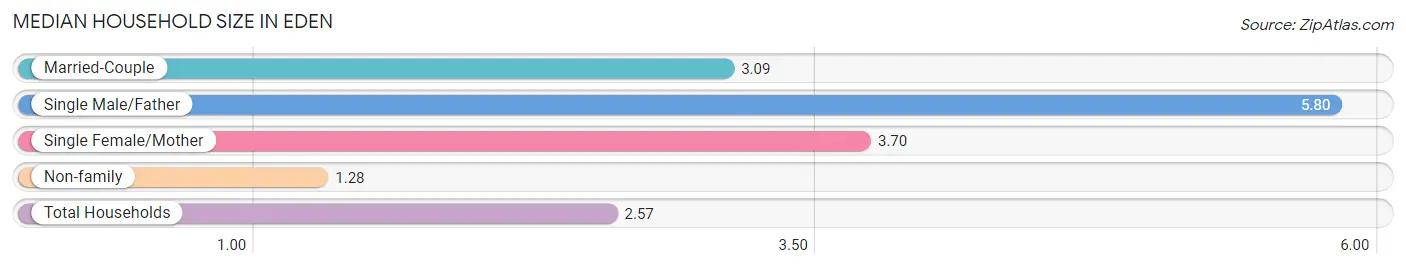
| Household Type | # Households | Household Size |
| Married-Couple | 187 (47.9%) | 3.09 |
| Single Male/Father | 5 (1.3%) | 5.80 |
| Single Female/Mother | 60 (15.4%) | 3.70 |
| Non-family | 138 (35.4%) | 1.28 |
| Total Households | 390 (100.0%) | 2.57 |
Household Size by Marriage Status in Eden
Out of a total of 390 households in Eden, 252 (64.6%) are family households, while 138 (35.4%) are nonfamily households. The most numerous type of family households are 2-person households, comprising 162, and the most common type of nonfamily households are 1-person households, comprising 125.
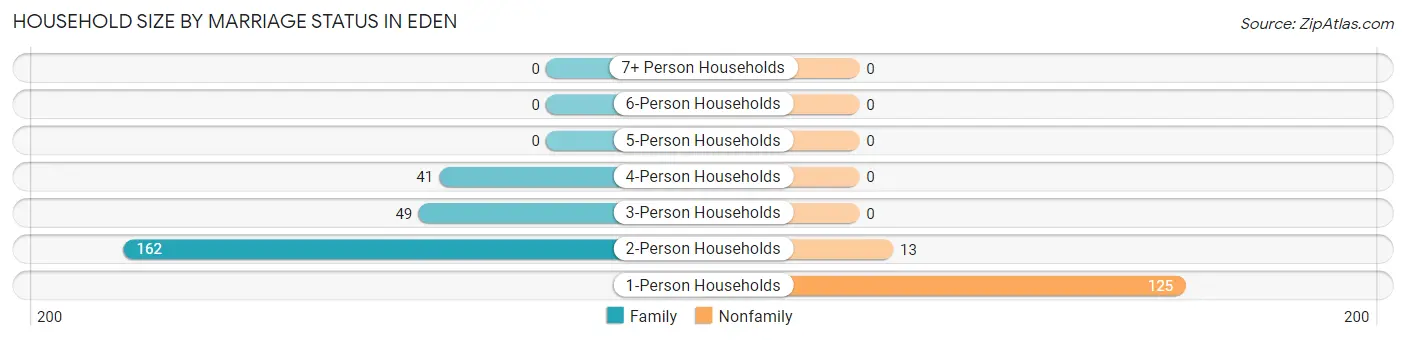
| Household Size | Family Households | Nonfamily Households |
| 1-Person Households | - | 125 (32.1%) |
| 2-Person Households | 162 (41.5%) | 13 (3.3%) |
| 3-Person Households | 49 (12.6%) | 0 (0.0%) |
| 4-Person Households | 41 (10.5%) | 0 (0.0%) |
| 5-Person Households | 0 (0.0%) | 0 (0.0%) |
| 6-Person Households | 0 (0.0%) | 0 (0.0%) |
| 7+ Person Households | 0 (0.0%) | 0 (0.0%) |
| Total | 252 (64.6%) | 138 (35.4%) |
Female Fertility in Eden
Fertility by Age in Eden
Average fertility rate in Eden is 7.0 births per 1,000 women. Women in the age bracket of 20 to 34 years have the highest fertility rate with 19.0 births per 1,000 women. Women in the age bracket of 20 to 34 years acount for 100.0% of all women with births.
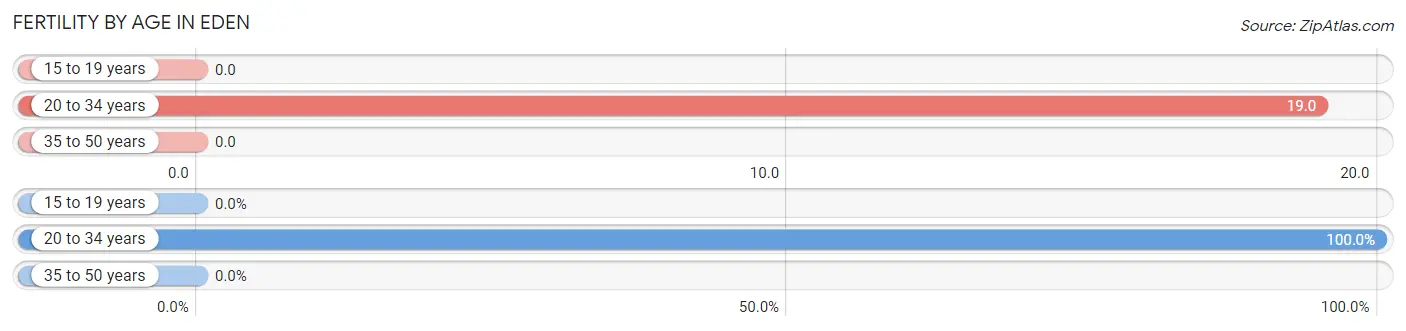
| Age Bracket | Women with Births | Births / 1,000 Women |
| 15 to 19 years | 0 (0.0%) | 0.0 |
| 20 to 34 years | 2 (100.0%) | 19.0 |
| 35 to 50 years | 0 (0.0%) | 0.0 |
| Total | 2 (100.0%) | 7.0 |
Fertility by Age by Marriage Status in Eden
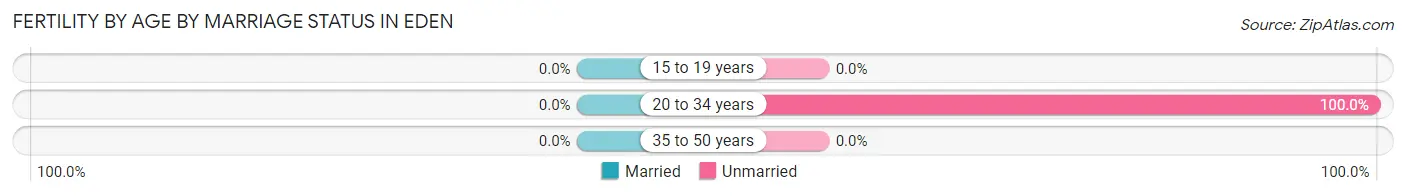
| Age Bracket | Married | Unmarried |
| 15 to 19 years | 0 (0.0%) | 0 (0.0%) |
| 20 to 34 years | 0 (0.0%) | 2 (100.0%) |
| 35 to 50 years | 0 (0.0%) | 0 (0.0%) |
| Total | 0 (0.0%) | 2 (100.0%) |
Fertility by Education in Eden
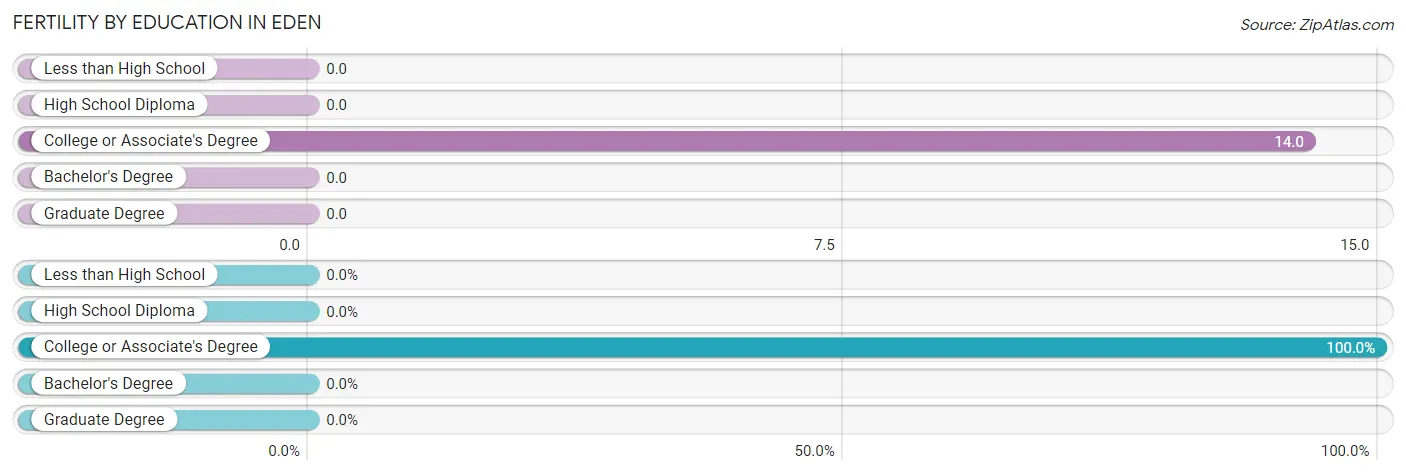
| Educational Attainment | Women with Births | Births / 1,000 Women |
| Less than High School | 0 (0.0%) | 0.0 |
| High School Diploma | 0 (0.0%) | 0.0 |
| College or Associate's Degree | 2 (100.0%) | 14.0 |
| Bachelor's Degree | 0 (0.0%) | 0.0 |
| Graduate Degree | 0 (0.0%) | 0.0 |
| Total | 2 (100.0%) | 7.0 |
Fertility by Education by Marriage Status in Eden
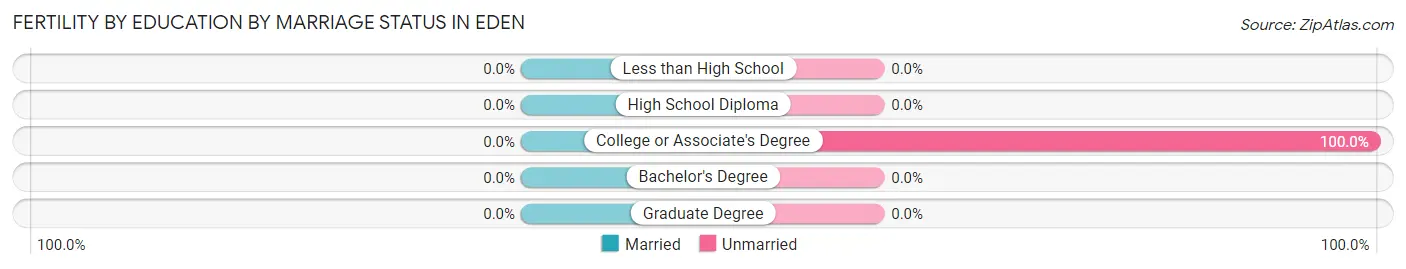
| Educational Attainment | Married | Unmarried |
| Less than High School | 0 (0.0%) | 0 (0.0%) |
| High School Diploma | 0 (0.0%) | 0 (0.0%) |
| College or Associate's Degree | 0 (0.0%) | 2 (100.0%) |
| Bachelor's Degree | 0 (0.0%) | 0 (0.0%) |
| Graduate Degree | 0 (0.0%) | 0 (0.0%) |
| Total | 0 (0.0%) | 2 (100.0%) |
Employment Characteristics in Eden
Employment by Class of Employer in Eden
Among the 420 employed individuals in Eden, private company employees (318 | 75.7%), self-employed (not incorporated) (59 | 14.1%), and local government employees (26 | 6.2%) make up the most common classes of employment.
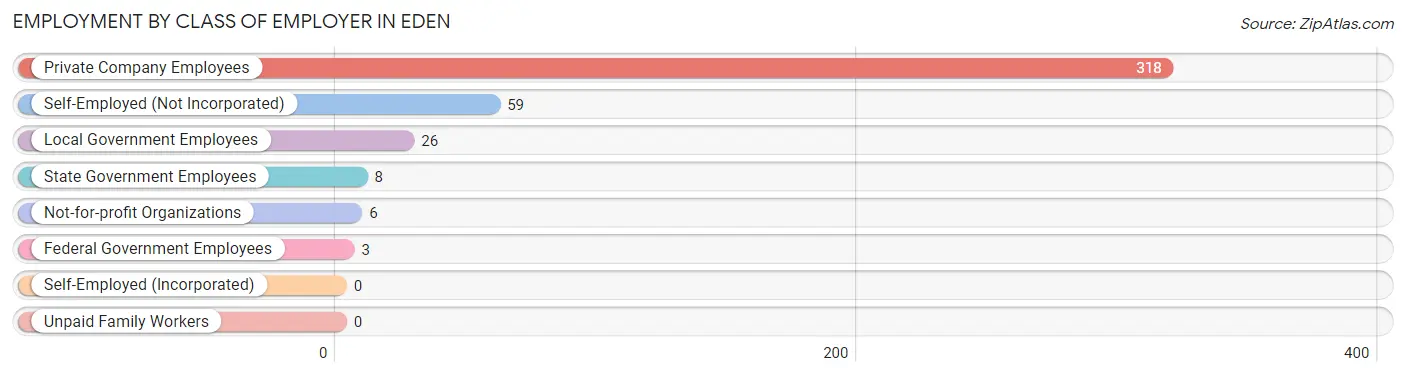
| Employer Class | # Employees | % Employees |
| Private Company Employees | 318 | 75.7% |
| Self-Employed (Incorporated) | 0 | 0.0% |
| Self-Employed (Not Incorporated) | 59 | 14.1% |
| Not-for-profit Organizations | 6 | 1.4% |
| Local Government Employees | 26 | 6.2% |
| State Government Employees | 8 | 1.9% |
| Federal Government Employees | 3 | 0.7% |
| Unpaid Family Workers | 0 | 0.0% |
| Total | 420 | 100.0% |
Employment Status by Age in Eden
According to the labor force statistics for Eden, out of the total population over 16 years of age (1,601), 26.7% or 427 individuals are in the labor force, with 1.4% or 6 of them unemployed. The age group with the highest labor force participation rate is 60 to 64 years, with 73.5% or 83 individuals in the labor force. Within the labor force, the 65 to 74 years age range has the highest percentage of unemployed individuals, with 22.2% or 6 of them being unemployed.
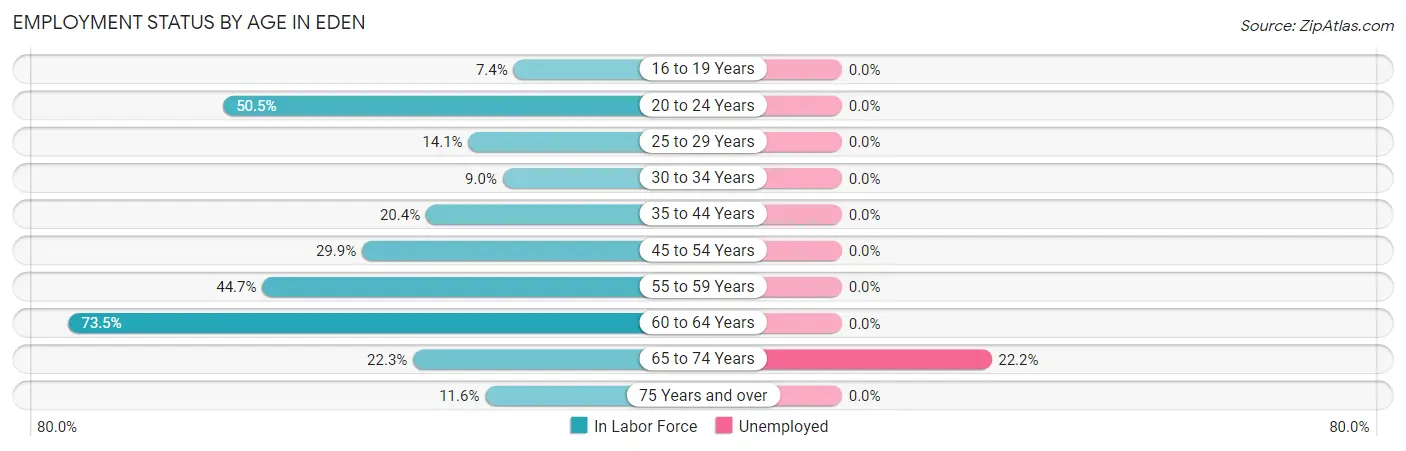
| Age Bracket | In Labor Force | Unemployed |
| 16 to 19 Years | 6 (7.4%) | 0 (0.0%) |
| 20 to 24 Years | 52 (50.5%) | 0 (0.0%) |
| 25 to 29 Years | 21 (14.1%) | 0 (0.0%) |
| 30 to 34 Years | 15 (9.0%) | 0 (0.0%) |
| 35 to 44 Years | 59 (20.4%) | 0 (0.0%) |
| 45 to 54 Years | 76 (29.9%) | 0 (0.0%) |
| 55 to 59 Years | 68 (44.7%) | 0 (0.0%) |
| 60 to 64 Years | 83 (73.5%) | 0 (0.0%) |
| 65 to 74 Years | 27 (22.3%) | 6 (22.2%) |
| 75 Years and over | 20 (11.6%) | 0 (0.0%) |
| Total | 427 (26.7%) | 6 (1.4%) |
Employment Status by Educational Attainment in Eden
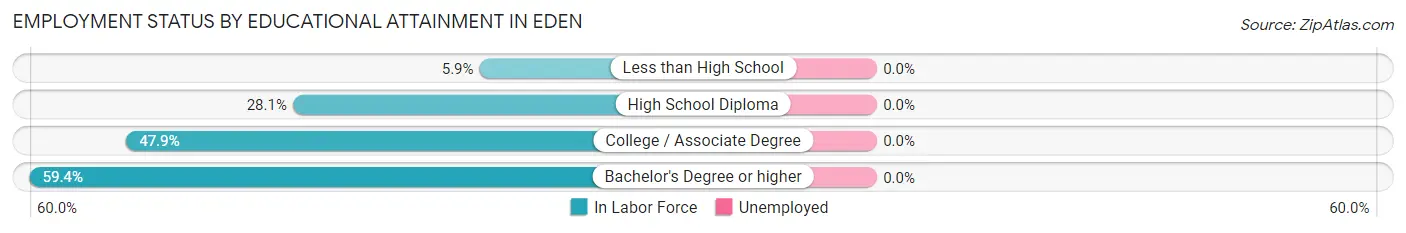
| Educational Attainment | In Labor Force | Unemployed |
| Less than High School | 20 (5.9%) | 0 (0.0%) |
| High School Diploma | 116 (28.1%) | 0 (0.0%) |
| College / Associate Degree | 148 (47.9%) | 0 (0.0%) |
| Bachelor's Degree or higher | 38 (59.4%) | 0 (0.0%) |
| Total | 322 (28.7%) | 0 (0.0%) |
Employment Occupations by Sex in Eden
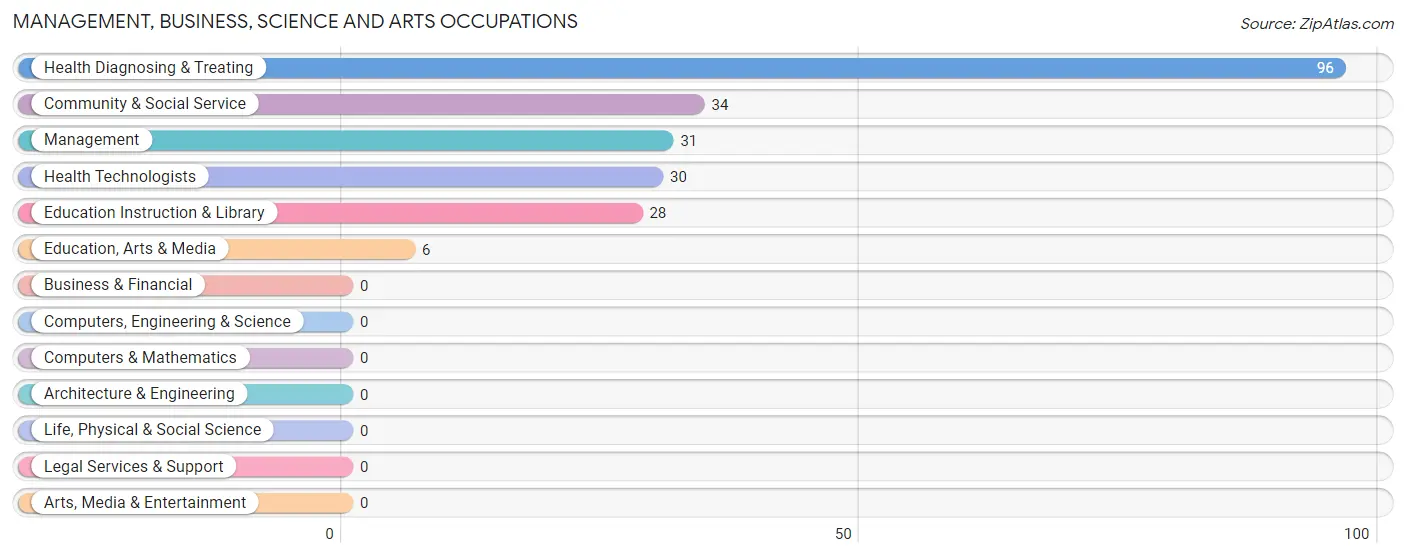
Management, Business, Science and Arts Occupations
The most common Management, Business, Science and Arts occupations in Eden are Health Diagnosing & Treating (96 | 22.8%), Community & Social Service (34 | 8.1%), Management (31 | 7.4%), Health Technologists (30 | 7.1%), and Education Instruction & Library (28 | 6.7%).
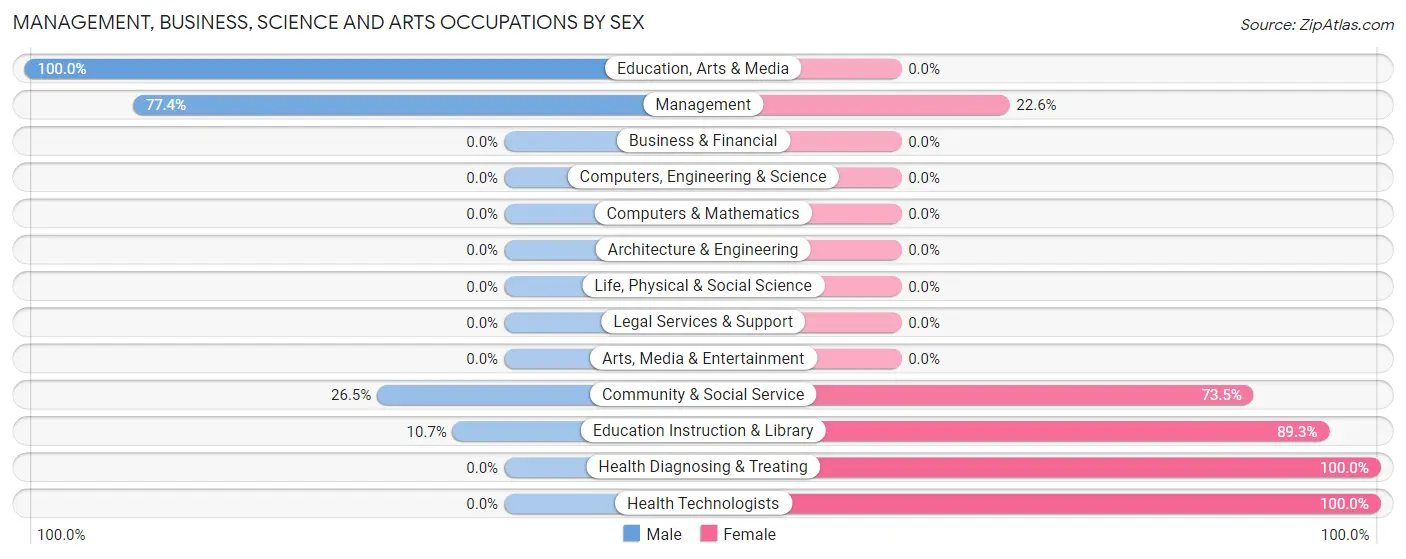
Management, Business, Science and Arts Occupations by Sex
Within the Management, Business, Science and Arts occupations in Eden, the most male-oriented occupations are Education, Arts & Media (100.0%), Management (77.4%), and Community & Social Service (26.5%), while the most female-oriented occupations are Health Diagnosing & Treating (100.0%), Health Technologists (100.0%), and Education Instruction & Library (89.3%).
| Occupation | Male | Female |
| Management | 24 (77.4%) | 7 (22.6%) |
| Business & Financial | 0 (0.0%) | 0 (0.0%) |
| Computers, Engineering & Science | 0 (0.0%) | 0 (0.0%) |
| Computers & Mathematics | 0 (0.0%) | 0 (0.0%) |
| Architecture & Engineering | 0 (0.0%) | 0 (0.0%) |
| Life, Physical & Social Science | 0 (0.0%) | 0 (0.0%) |
| Community & Social Service | 9 (26.5%) | 25 (73.5%) |
| Education, Arts & Media | 6 (100.0%) | 0 (0.0%) |
| Legal Services & Support | 0 (0.0%) | 0 (0.0%) |
| Education Instruction & Library | 3 (10.7%) | 25 (89.3%) |
| Arts, Media & Entertainment | 0 (0.0%) | 0 (0.0%) |
| Health Diagnosing & Treating | 0 (0.0%) | 96 (100.0%) |
| Health Technologists | 0 (0.0%) | 30 (100.0%) |
| Total (Category) | 33 (20.5%) | 128 (79.5%) |
| Total (Overall) | 153 (36.3%) | 268 (63.7%) |
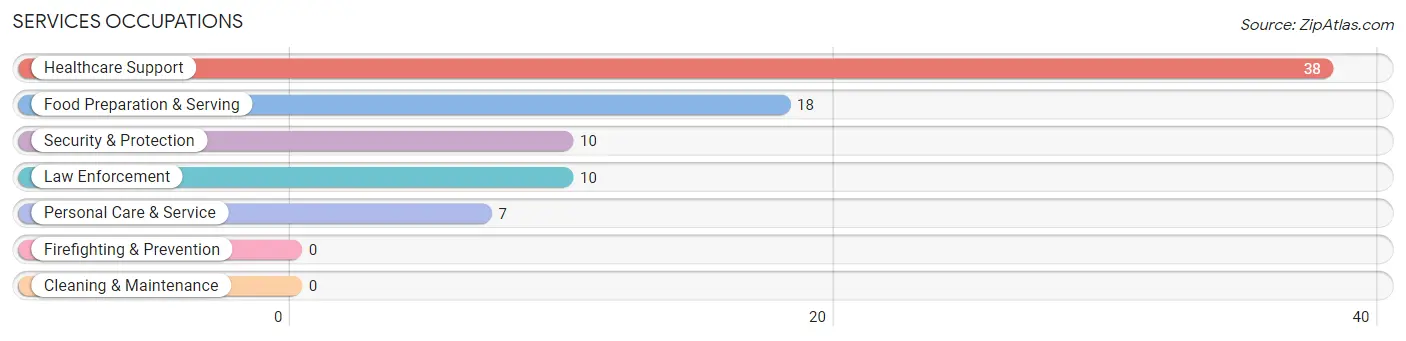
Services Occupations
The most common Services occupations in Eden are Healthcare Support (38 | 9.0%), Food Preparation & Serving (18 | 4.3%), Security & Protection (10 | 2.4%), Law Enforcement (10 | 2.4%), and Personal Care & Service (7 | 1.7%).
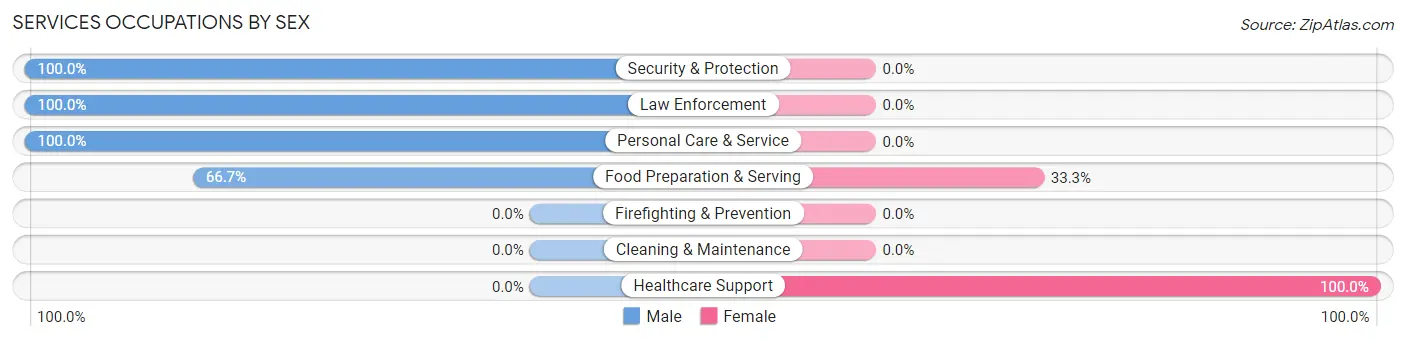
Services Occupations by Sex
Within the Services occupations in Eden, the most male-oriented occupations are Security & Protection (100.0%), Law Enforcement (100.0%), and Personal Care & Service (100.0%), while the most female-oriented occupations are Healthcare Support (100.0%), and Food Preparation & Serving (33.3%).
| Occupation | Male | Female |
| Healthcare Support | 0 (0.0%) | 38 (100.0%) |
| Security & Protection | 10 (100.0%) | 0 (0.0%) |
| Firefighting & Prevention | 0 (0.0%) | 0 (0.0%) |
| Law Enforcement | 10 (100.0%) | 0 (0.0%) |
| Food Preparation & Serving | 12 (66.7%) | 6 (33.3%) |
| Cleaning & Maintenance | 0 (0.0%) | 0 (0.0%) |
| Personal Care & Service | 7 (100.0%) | 0 (0.0%) |
| Total (Category) | 29 (39.7%) | 44 (60.3%) |
| Total (Overall) | 153 (36.3%) | 268 (63.7%) |
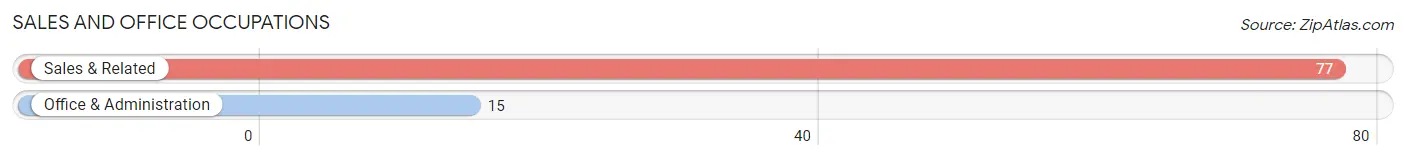
Sales and Office Occupations
The most common Sales and Office occupations in Eden are Sales & Related (77 | 18.3%), and Office & Administration (15 | 3.6%).
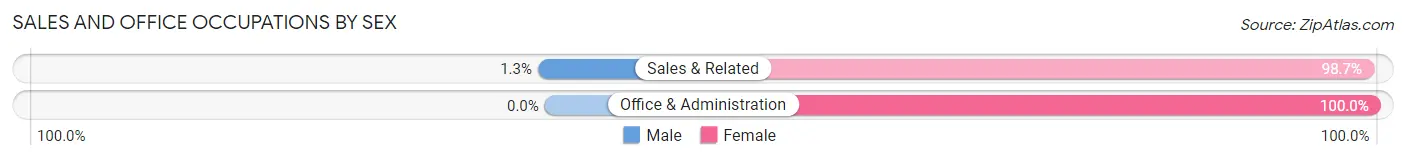
Sales and Office Occupations by Sex
| Occupation | Male | Female |
| Sales & Related | 1 (1.3%) | 76 (98.7%) |
| Office & Administration | 0 (0.0%) | 15 (100.0%) |
| Total (Category) | 1 (1.1%) | 91 (98.9%) |
| Total (Overall) | 153 (36.3%) | 268 (63.7%) |
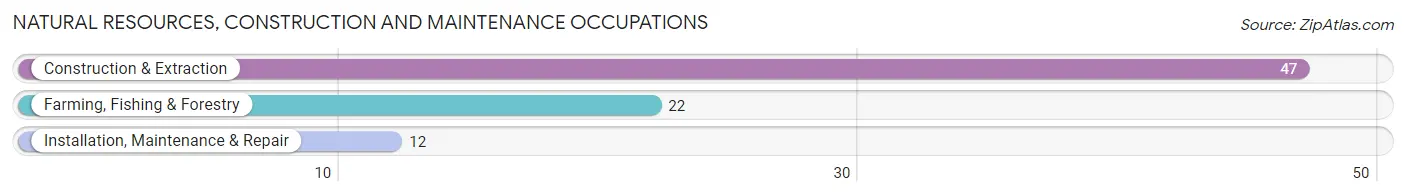
Natural Resources, Construction and Maintenance Occupations
The most common Natural Resources, Construction and Maintenance occupations in Eden are Construction & Extraction (47 | 11.2%), Farming, Fishing & Forestry (22 | 5.2%), and Installation, Maintenance & Repair (12 | 2.9%).
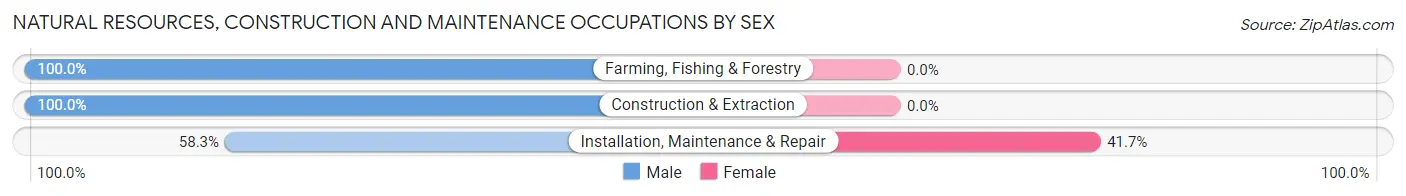
Natural Resources, Construction and Maintenance Occupations by Sex
| Occupation | Male | Female |
| Farming, Fishing & Forestry | 22 (100.0%) | 0 (0.0%) |
| Construction & Extraction | 47 (100.0%) | 0 (0.0%) |
| Installation, Maintenance & Repair | 7 (58.3%) | 5 (41.7%) |
| Total (Category) | 76 (93.8%) | 5 (6.2%) |
| Total (Overall) | 153 (36.3%) | 268 (63.7%) |
Production, Transportation and Moving Occupations
The most common Production, Transportation and Moving occupations in Eden are , and Material Moving (14 | 3.3%).
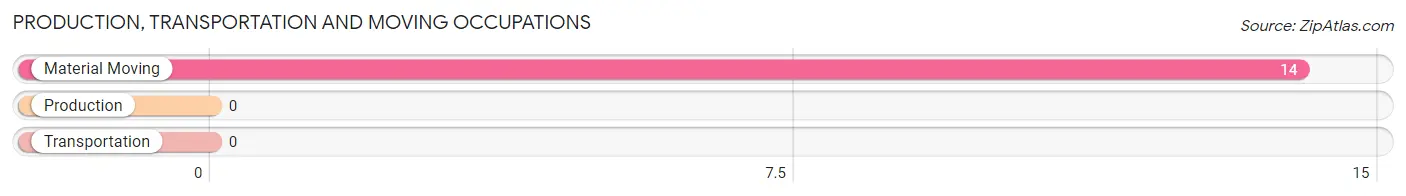
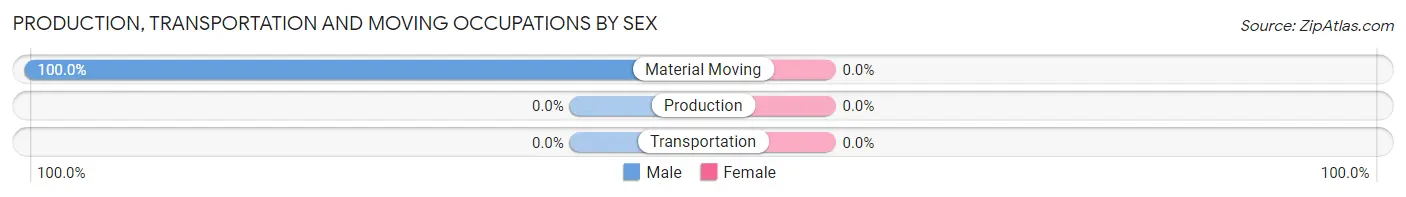
Production, Transportation and Moving Occupations by Sex
| Occupation | Male | Female |
| Production | 0 (0.0%) | 0 (0.0%) |
| Transportation | 0 (0.0%) | 0 (0.0%) |
| Material Moving | 14 (100.0%) | 0 (0.0%) |
| Total (Category) | 14 (100.0%) | 0 (0.0%) |
| Total (Overall) | 153 (36.3%) | 268 (63.7%) |
Employment Industries by Sex in Eden
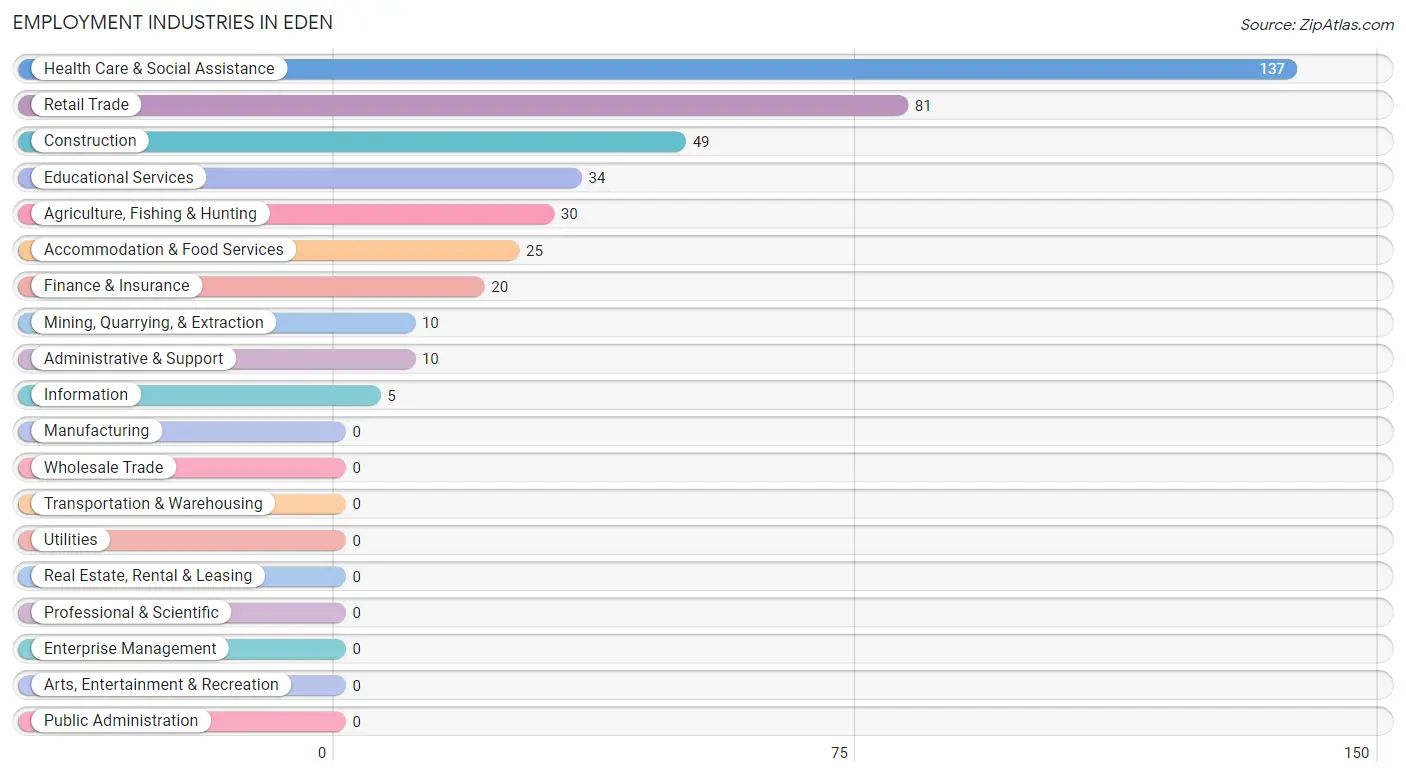
Employment Industries in Eden
The major employment industries in Eden include Health Care & Social Assistance (137 | 32.5%), Retail Trade (81 | 19.2%), Construction (49 | 11.6%), Educational Services (34 | 8.1%), and Agriculture, Fishing & Hunting (30 | 7.1%).
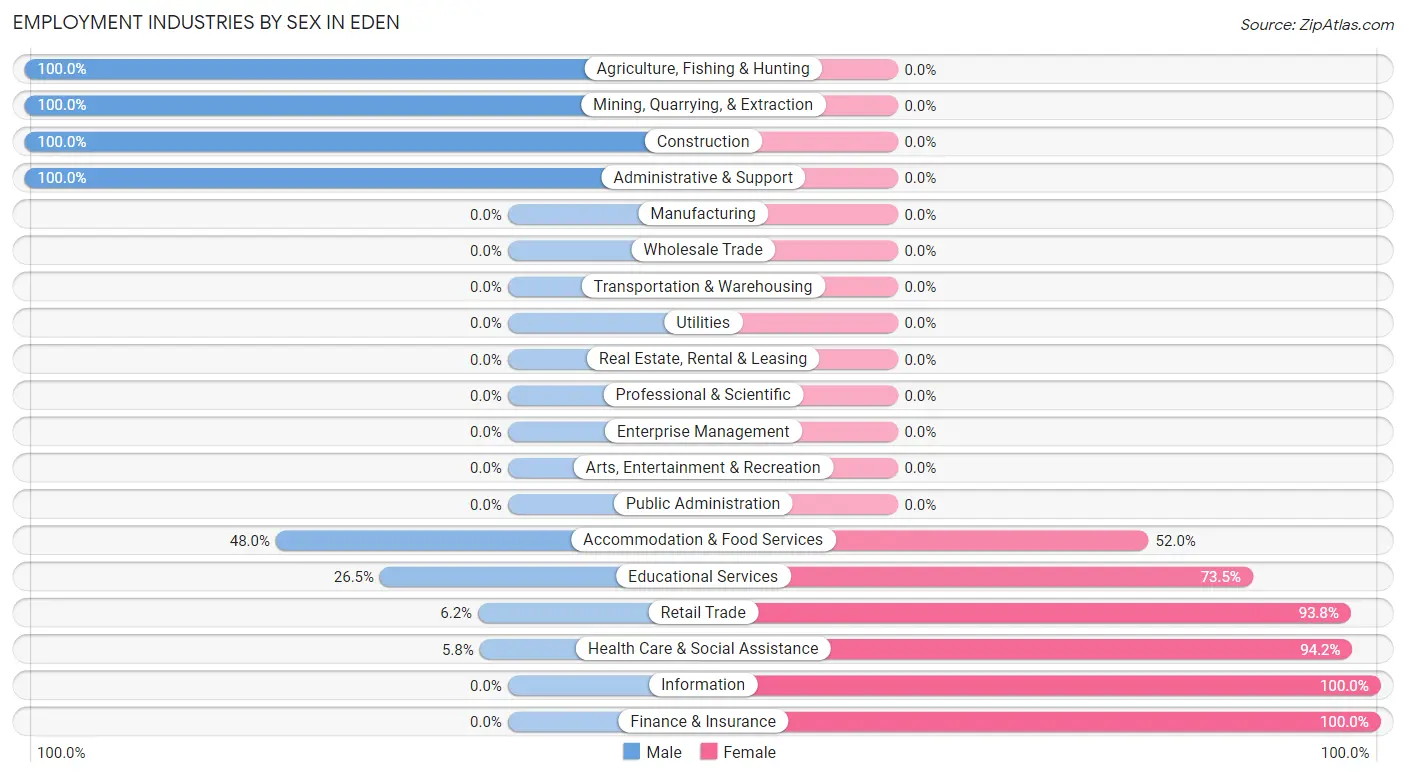
Employment Industries by Sex in Eden
The Eden industries that see more men than women are Agriculture, Fishing & Hunting (100.0%), Mining, Quarrying, & Extraction (100.0%), and Construction (100.0%), whereas the industries that tend to have a higher number of women are Information (100.0%), Finance & Insurance (100.0%), and Health Care & Social Assistance (94.2%).
| Industry | Male | Female |
| Agriculture, Fishing & Hunting | 30 (100.0%) | 0 (0.0%) |
| Mining, Quarrying, & Extraction | 10 (100.0%) | 0 (0.0%) |
| Construction | 49 (100.0%) | 0 (0.0%) |
| Manufacturing | 0 (0.0%) | 0 (0.0%) |
| Wholesale Trade | 0 (0.0%) | 0 (0.0%) |
| Retail Trade | 5 (6.2%) | 76 (93.8%) |
| Transportation & Warehousing | 0 (0.0%) | 0 (0.0%) |
| Utilities | 0 (0.0%) | 0 (0.0%) |
| Information | 0 (0.0%) | 5 (100.0%) |
| Finance & Insurance | 0 (0.0%) | 20 (100.0%) |
| Real Estate, Rental & Leasing | 0 (0.0%) | 0 (0.0%) |
| Professional & Scientific | 0 (0.0%) | 0 (0.0%) |
| Enterprise Management | 0 (0.0%) | 0 (0.0%) |
| Administrative & Support | 10 (100.0%) | 0 (0.0%) |
| Educational Services | 9 (26.5%) | 25 (73.5%) |
| Health Care & Social Assistance | 8 (5.8%) | 129 (94.2%) |
| Arts, Entertainment & Recreation | 0 (0.0%) | 0 (0.0%) |
| Accommodation & Food Services | 12 (48.0%) | 13 (52.0%) |
| Public Administration | 0 (0.0%) | 0 (0.0%) |
| Total | 153 (36.3%) | 268 (63.7%) |
Education in Eden
School Enrollment in Eden
The most common levels of schooling among the 394 students in Eden are high school (154 | 39.1%), middle school (103 | 26.1%), and elementary school (72 | 18.3%).
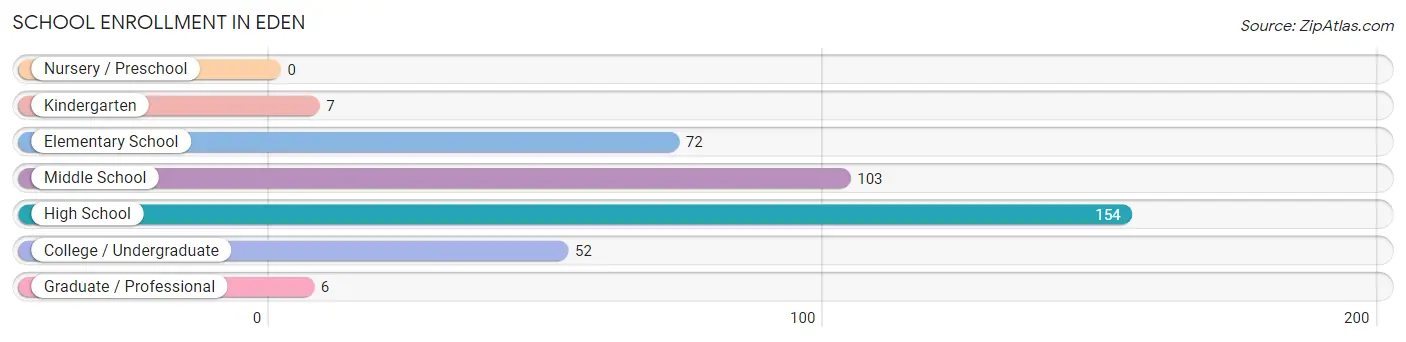
| School Level | # Students | % Students |
| Nursery / Preschool | 0 | 0.0% |
| Kindergarten | 7 | 1.8% |
| Elementary School | 72 | 18.3% |
| Middle School | 103 | 26.1% |
| High School | 154 | 39.1% |
| College / Undergraduate | 52 | 13.2% |
| Graduate / Professional | 6 | 1.5% |
| Total | 394 | 100.0% |
School Enrollment by Age by Funding Source in Eden
Out of a total of 394 students who are enrolled in schools in Eden, 6 (1.5%) attend a private institution, while the remaining 388 (98.5%) are enrolled in public schools. The age group of 35 years and over has the highest likelihood of being enrolled in private schools, with 6 (8.8% in the age bracket) enrolled. Conversely, the age group of 5 to 9 year old has the lowest likelihood of being enrolled in a private school, with 79 (100.0% in the age bracket) attending a public institution.
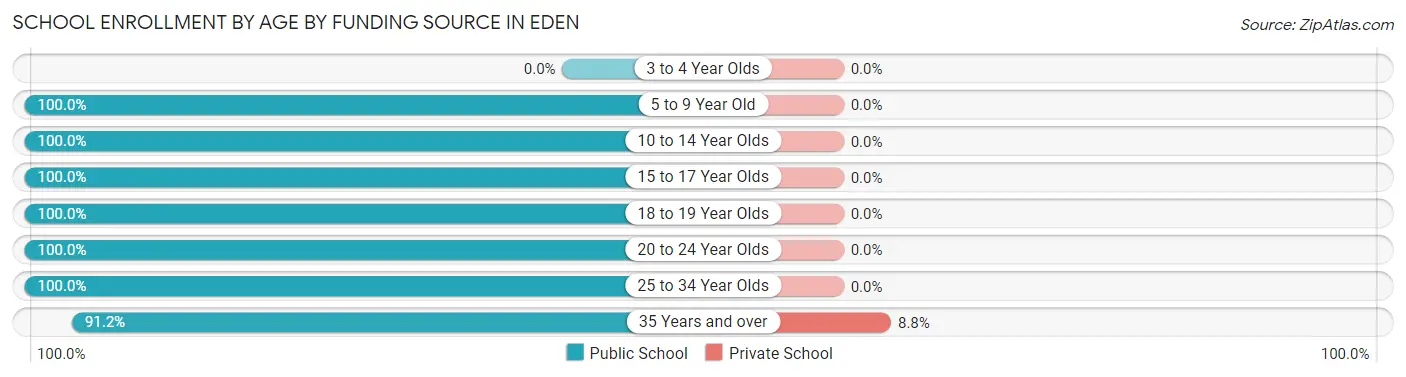
| Age Bracket | Public School | Private School |
| 3 to 4 Year Olds | 0 (0.0%) | 0 (0.0%) |
| 5 to 9 Year Old | 79 (100.0%) | 0 (0.0%) |
| 10 to 14 Year Olds | 103 (100.0%) | 0 (0.0%) |
| 15 to 17 Year Olds | 51 (100.0%) | 0 (0.0%) |
| 18 to 19 Year Olds | 41 (100.0%) | 0 (0.0%) |
| 20 to 24 Year Olds | 6 (100.0%) | 0 (0.0%) |
| 25 to 34 Year Olds | 46 (100.0%) | 0 (0.0%) |
| 35 Years and over | 62 (91.2%) | 6 (8.8%) |
| Total | 388 (98.5%) | 6 (1.5%) |
Educational Attainment by Field of Study in Eden
Education (36 | 34.9%), engineering (14 | 13.6%), physical & health sciences (12 | 11.7%), arts & humanities (12 | 11.7%), and liberal arts & history (11 | 10.7%) are the most common fields of study among 103 individuals in Eden who have obtained a bachelor's degree or higher.
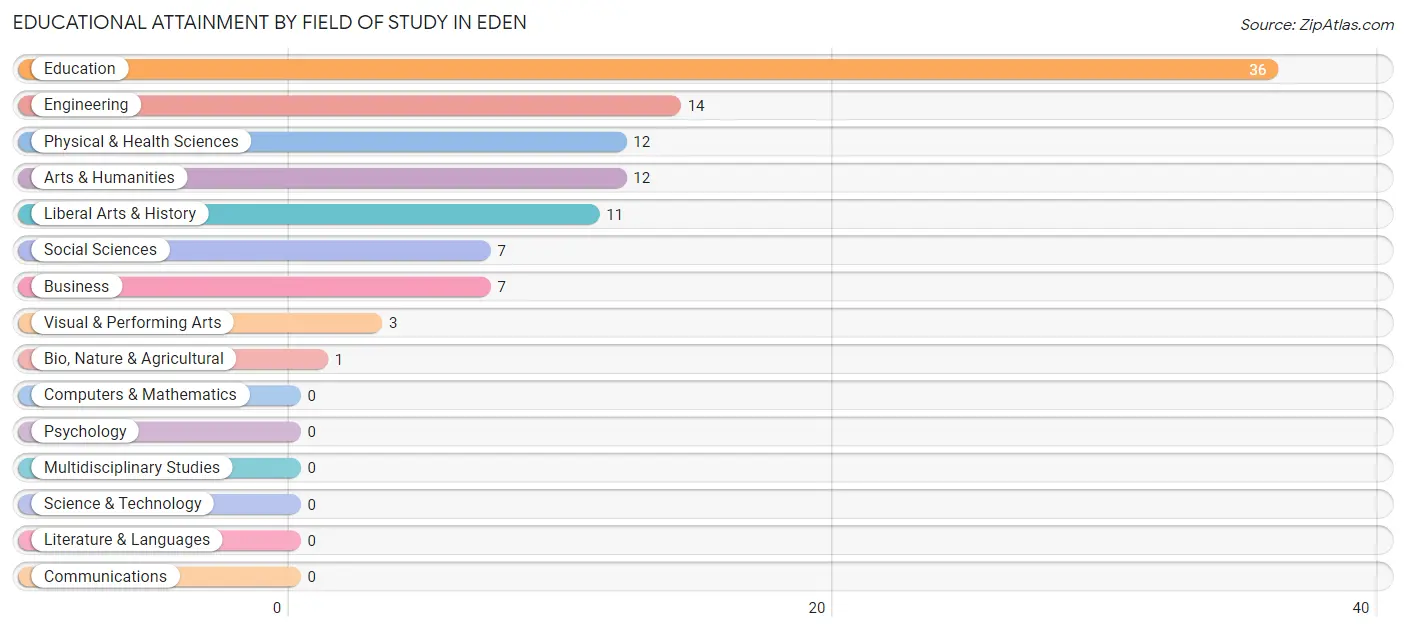
| Field of Study | # Graduates | % Graduates |
| Computers & Mathematics | 0 | 0.0% |
| Bio, Nature & Agricultural | 1 | 1.0% |
| Physical & Health Sciences | 12 | 11.7% |
| Psychology | 0 | 0.0% |
| Social Sciences | 7 | 6.8% |
| Engineering | 14 | 13.6% |
| Multidisciplinary Studies | 0 | 0.0% |
| Science & Technology | 0 | 0.0% |
| Business | 7 | 6.8% |
| Education | 36 | 34.9% |
| Literature & Languages | 0 | 0.0% |
| Liberal Arts & History | 11 | 10.7% |
| Visual & Performing Arts | 3 | 2.9% |
| Communications | 0 | 0.0% |
| Arts & Humanities | 12 | 11.7% |
| Total | 103 | 100.0% |
Transportation & Commute in Eden
Vehicle Availability by Sex in Eden
The most prevalent vehicle ownership categories in Eden are males with 2 vehicles (75, accounting for 49.3%) and females with 2 vehicles (93, making up 28.0%).
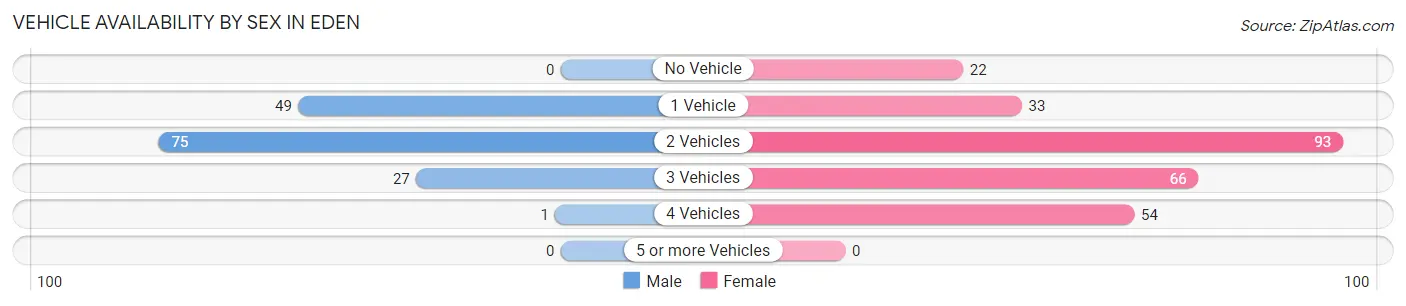
| Vehicles Available | Male | Female |
| No Vehicle | 0 (0.0%) | 22 (8.2%) |
| 1 Vehicle | 49 (32.2%) | 33 (12.3%) |
| 2 Vehicles | 75 (49.3%) | 93 (34.7%) |
| 3 Vehicles | 27 (17.8%) | 66 (24.6%) |
| 4 Vehicles | 1 (0.7%) | 54 (20.2%) |
| 5 or more Vehicles | 0 (0.0%) | 0 (0.0%) |
| Total | 152 (100.0%) | 268 (100.0%) |
Commute Time in Eden
The most frequently occuring commute durations in Eden are 5 to 9 minutes (118 commuters, 28.4%), less than 5 minutes (114 commuters, 27.5%), and 40 to 44 minutes (35 commuters, 8.4%).
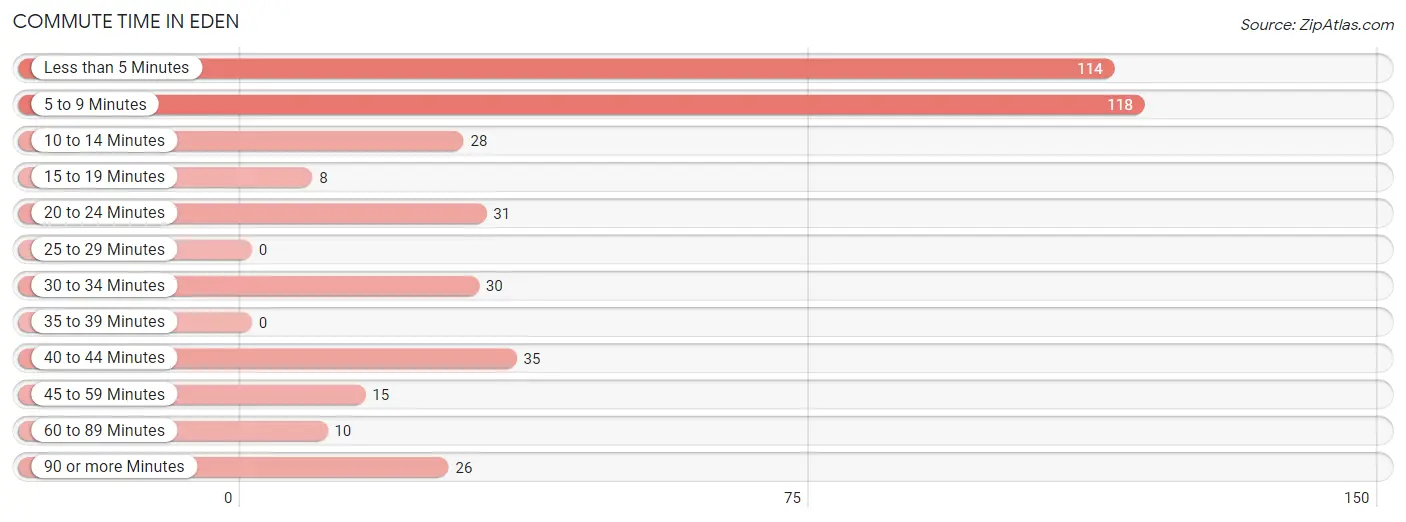
| Commute Time | # Commuters | % Commuters |
| Less than 5 Minutes | 114 | 27.5% |
| 5 to 9 Minutes | 118 | 28.4% |
| 10 to 14 Minutes | 28 | 6.8% |
| 15 to 19 Minutes | 8 | 1.9% |
| 20 to 24 Minutes | 31 | 7.5% |
| 25 to 29 Minutes | 0 | 0.0% |
| 30 to 34 Minutes | 30 | 7.2% |
| 35 to 39 Minutes | 0 | 0.0% |
| 40 to 44 Minutes | 35 | 8.4% |
| 45 to 59 Minutes | 15 | 3.6% |
| 60 to 89 Minutes | 10 | 2.4% |
| 90 or more Minutes | 26 | 6.3% |
Commute Time by Sex in Eden
The most common commute times in Eden are 5 to 9 minutes (38 commuters, 25.0%) for males and less than 5 minutes (88 commuters, 33.5%) for females.
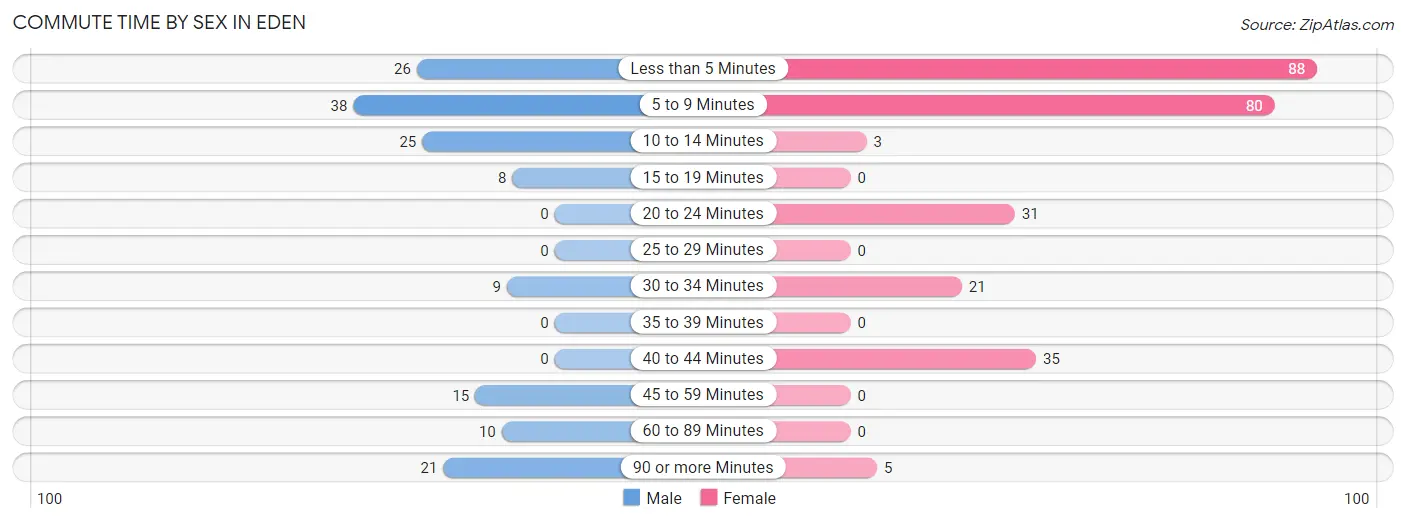
| Commute Time | Male | Female |
| Less than 5 Minutes | 26 (17.1%) | 88 (33.5%) |
| 5 to 9 Minutes | 38 (25.0%) | 80 (30.4%) |
| 10 to 14 Minutes | 25 (16.5%) | 3 (1.1%) |
| 15 to 19 Minutes | 8 (5.3%) | 0 (0.0%) |
| 20 to 24 Minutes | 0 (0.0%) | 31 (11.8%) |
| 25 to 29 Minutes | 0 (0.0%) | 0 (0.0%) |
| 30 to 34 Minutes | 9 (5.9%) | 21 (8.0%) |
| 35 to 39 Minutes | 0 (0.0%) | 0 (0.0%) |
| 40 to 44 Minutes | 0 (0.0%) | 35 (13.3%) |
| 45 to 59 Minutes | 15 (9.9%) | 0 (0.0%) |
| 60 to 89 Minutes | 10 (6.6%) | 0 (0.0%) |
| 90 or more Minutes | 21 (13.8%) | 5 (1.9%) |
Time of Departure to Work by Sex in Eden
The most frequent times of departure to work in Eden are 6:30 AM to 6:59 AM (38, 25.0%) for males and 8:00 AM to 8:29 AM (64, 24.3%) for females.
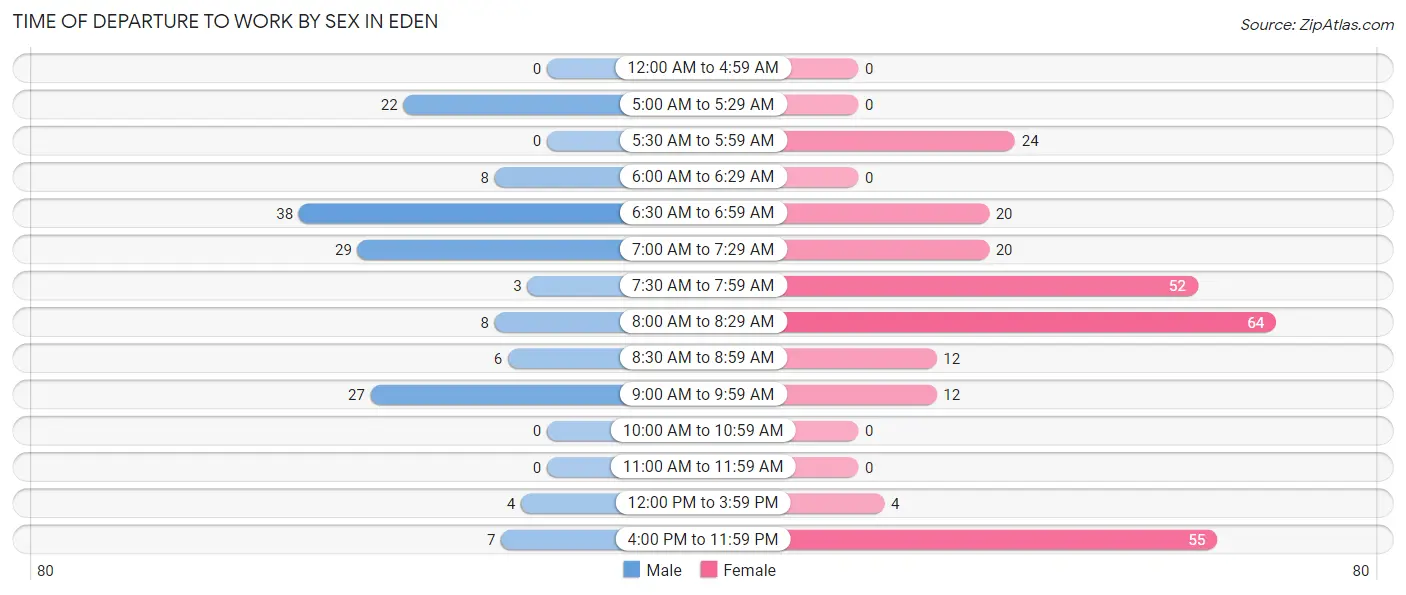
| Time of Departure | Male | Female |
| 12:00 AM to 4:59 AM | 0 (0.0%) | 0 (0.0%) |
| 5:00 AM to 5:29 AM | 22 (14.5%) | 0 (0.0%) |
| 5:30 AM to 5:59 AM | 0 (0.0%) | 24 (9.1%) |
| 6:00 AM to 6:29 AM | 8 (5.3%) | 0 (0.0%) |
| 6:30 AM to 6:59 AM | 38 (25.0%) | 20 (7.6%) |
| 7:00 AM to 7:29 AM | 29 (19.1%) | 20 (7.6%) |
| 7:30 AM to 7:59 AM | 3 (2.0%) | 52 (19.8%) |
| 8:00 AM to 8:29 AM | 8 (5.3%) | 64 (24.3%) |
| 8:30 AM to 8:59 AM | 6 (4.0%) | 12 (4.6%) |
| 9:00 AM to 9:59 AM | 27 (17.8%) | 12 (4.6%) |
| 10:00 AM to 10:59 AM | 0 (0.0%) | 0 (0.0%) |
| 11:00 AM to 11:59 AM | 0 (0.0%) | 0 (0.0%) |
| 12:00 PM to 3:59 PM | 4 (2.6%) | 4 (1.5%) |
| 4:00 PM to 11:59 PM | 7 (4.6%) | 55 (20.9%) |
| Total | 152 (100.0%) | 263 (100.0%) |
Housing Occupancy in Eden
Occupancy by Ownership in Eden
Of the total 390 dwellings in Eden, owner-occupied units account for 285 (73.1%), while renter-occupied units make up 105 (26.9%).
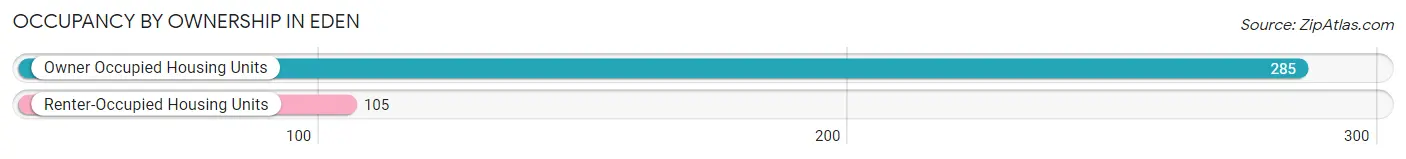
| Occupancy | # Housing Units | % Housing Units |
| Owner Occupied Housing Units | 285 | 73.1% |
| Renter-Occupied Housing Units | 105 | 26.9% |
| Total Occupied Housing Units | 390 | 100.0% |
Occupancy by Household Size in Eden
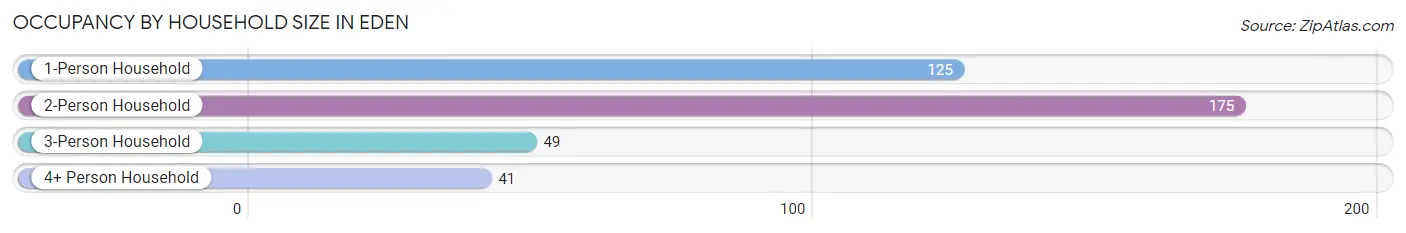
| Household Size | # Housing Units | % Housing Units |
| 1-Person Household | 125 | 32.1% |
| 2-Person Household | 175 | 44.9% |
| 3-Person Household | 49 | 12.6% |
| 4+ Person Household | 41 | 10.5% |
| Total Housing Units | 390 | 100.0% |
Occupancy by Ownership by Household Size in Eden
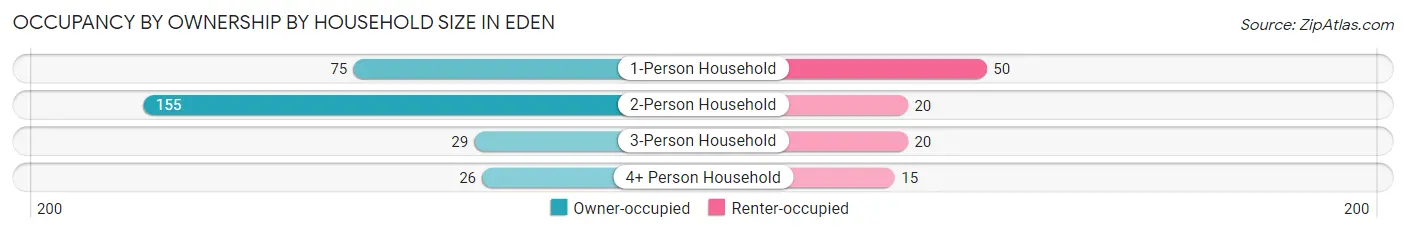
| Household Size | Owner-occupied | Renter-occupied |
| 1-Person Household | 75 (60.0%) | 50 (40.0%) |
| 2-Person Household | 155 (88.6%) | 20 (11.4%) |
| 3-Person Household | 29 (59.2%) | 20 (40.8%) |
| 4+ Person Household | 26 (63.4%) | 15 (36.6%) |
| Total Housing Units | 285 (73.1%) | 105 (26.9%) |
Occupancy by Educational Attainment in Eden
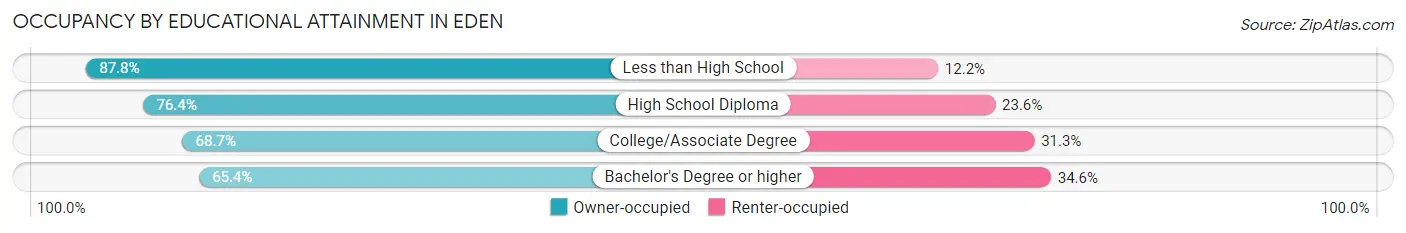
| Household Size | Owner-occupied | Renter-occupied |
| Less than High School | 43 (87.8%) | 6 (12.2%) |
| High School Diploma | 94 (76.4%) | 29 (23.6%) |
| College/Associate Degree | 114 (68.7%) | 52 (31.3%) |
| Bachelor's Degree or higher | 34 (65.4%) | 18 (34.6%) |
Occupancy by Age of Householder in Eden
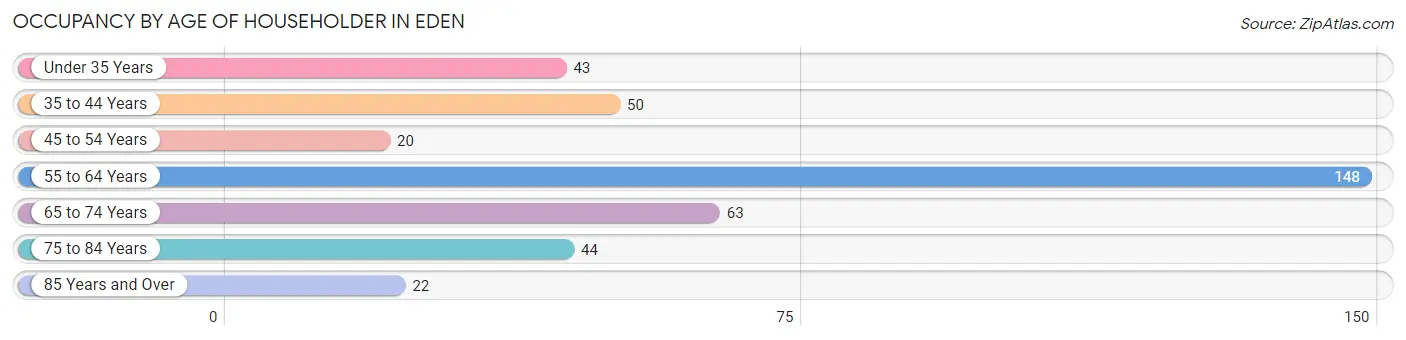
| Age Bracket | # Households | % Households |
| Under 35 Years | 43 | 11.0% |
| 35 to 44 Years | 50 | 12.8% |
| 45 to 54 Years | 20 | 5.1% |
| 55 to 64 Years | 148 | 38.0% |
| 65 to 74 Years | 63 | 16.2% |
| 75 to 84 Years | 44 | 11.3% |
| 85 Years and Over | 22 | 5.6% |
| Total | 390 | 100.0% |
Housing Finances in Eden
Median Income by Occupancy in Eden
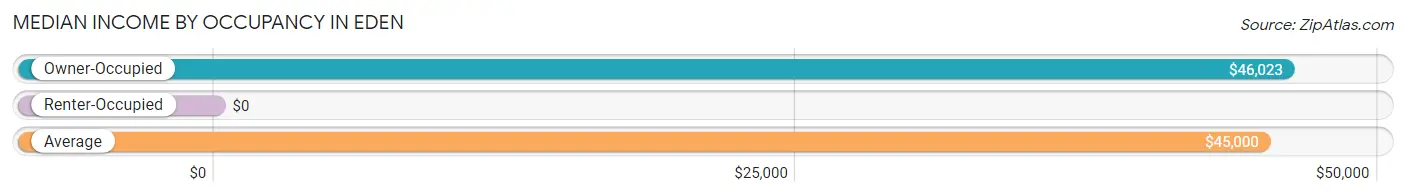
| Occupancy Type | # Households | Median Income |
| Owner-Occupied | 285 (73.1%) | $46,023 |
| Renter-Occupied | 105 (26.9%) | $0 |
| Average | 390 (100.0%) | $45,000 |
Occupancy by Householder Income Bracket in Eden
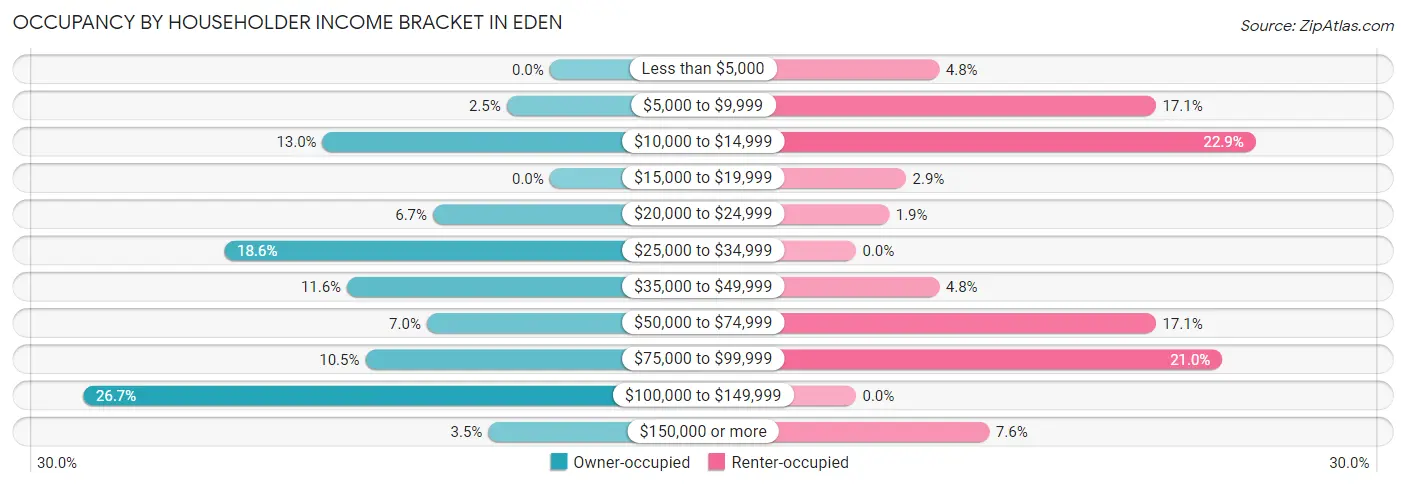
| Income Bracket | Owner-occupied | Renter-occupied |
| Less than $5,000 | 0 (0.0%) | 5 (4.8%) |
| $5,000 to $9,999 | 7 (2.5%) | 18 (17.1%) |
| $10,000 to $14,999 | 37 (13.0%) | 24 (22.9%) |
| $15,000 to $19,999 | 0 (0.0%) | 3 (2.9%) |
| $20,000 to $24,999 | 19 (6.7%) | 2 (1.9%) |
| $25,000 to $34,999 | 53 (18.6%) | 0 (0.0%) |
| $35,000 to $49,999 | 33 (11.6%) | 5 (4.8%) |
| $50,000 to $74,999 | 20 (7.0%) | 18 (17.1%) |
| $75,000 to $99,999 | 30 (10.5%) | 22 (20.9%) |
| $100,000 to $149,999 | 76 (26.7%) | 0 (0.0%) |
| $150,000 or more | 10 (3.5%) | 8 (7.6%) |
| Total | 285 (100.0%) | 105 (100.0%) |
Monthly Housing Cost Tiers in Eden
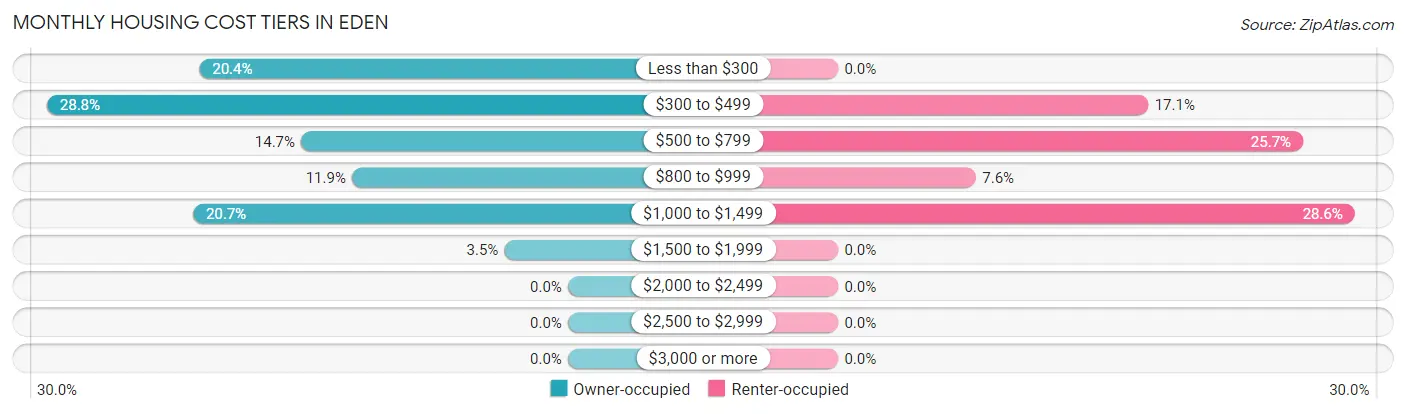
| Monthly Cost | Owner-occupied | Renter-occupied |
| Less than $300 | 58 (20.3%) | 0 (0.0%) |
| $300 to $499 | 82 (28.8%) | 18 (17.1%) |
| $500 to $799 | 42 (14.7%) | 27 (25.7%) |
| $800 to $999 | 34 (11.9%) | 8 (7.6%) |
| $1,000 to $1,499 | 59 (20.7%) | 30 (28.6%) |
| $1,500 to $1,999 | 10 (3.5%) | 0 (0.0%) |
| $2,000 to $2,499 | 0 (0.0%) | 0 (0.0%) |
| $2,500 to $2,999 | 0 (0.0%) | 0 (0.0%) |
| $3,000 or more | 0 (0.0%) | 0 (0.0%) |
| Total | 285 (100.0%) | 105 (100.0%) |
Physical Housing Characteristics in Eden
Housing Structures in Eden
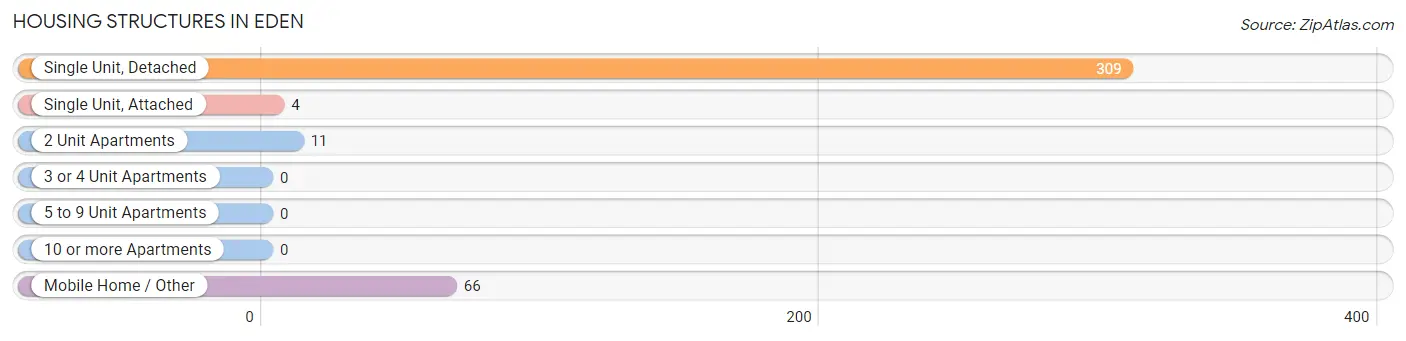
| Structure Type | # Housing Units | % Housing Units |
| Single Unit, Detached | 309 | 79.2% |
| Single Unit, Attached | 4 | 1.0% |
| 2 Unit Apartments | 11 | 2.8% |
| 3 or 4 Unit Apartments | 0 | 0.0% |
| 5 to 9 Unit Apartments | 0 | 0.0% |
| 10 or more Apartments | 0 | 0.0% |
| Mobile Home / Other | 66 | 16.9% |
| Total | 390 | 100.0% |
Housing Structures by Occupancy in Eden
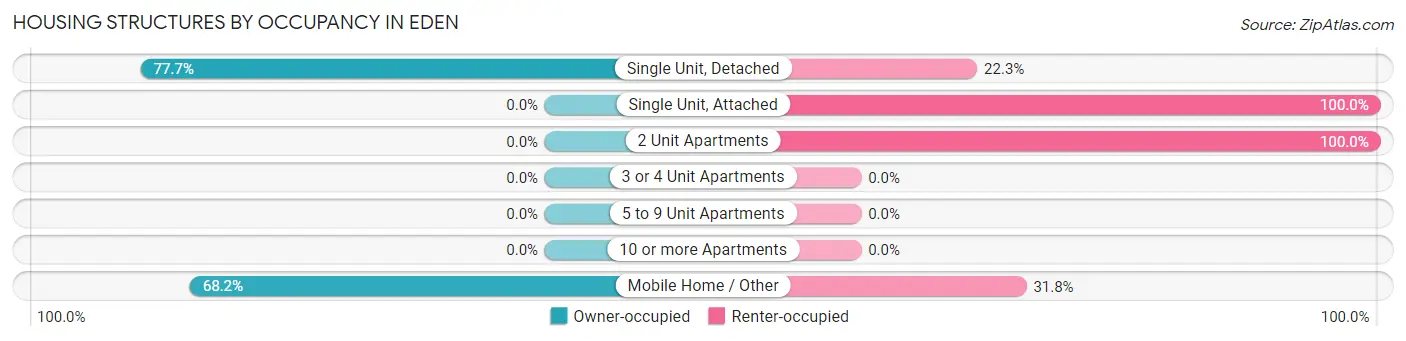
| Structure Type | Owner-occupied | Renter-occupied |
| Single Unit, Detached | 240 (77.7%) | 69 (22.3%) |
| Single Unit, Attached | 0 (0.0%) | 4 (100.0%) |
| 2 Unit Apartments | 0 (0.0%) | 11 (100.0%) |
| 3 or 4 Unit Apartments | 0 (0.0%) | 0 (0.0%) |
| 5 to 9 Unit Apartments | 0 (0.0%) | 0 (0.0%) |
| 10 or more Apartments | 0 (0.0%) | 0 (0.0%) |
| Mobile Home / Other | 45 (68.2%) | 21 (31.8%) |
| Total | 285 (73.1%) | 105 (26.9%) |
Housing Structures by Number of Rooms in Eden
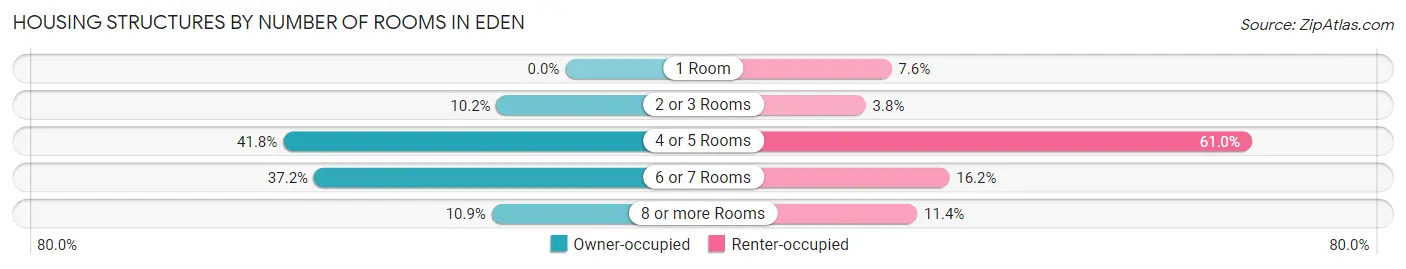
| Number of Rooms | Owner-occupied | Renter-occupied |
| 1 Room | 0 (0.0%) | 8 (7.6%) |
| 2 or 3 Rooms | 29 (10.2%) | 4 (3.8%) |
| 4 or 5 Rooms | 119 (41.7%) | 64 (61.0%) |
| 6 or 7 Rooms | 106 (37.2%) | 17 (16.2%) |
| 8 or more Rooms | 31 (10.9%) | 12 (11.4%) |
| Total | 285 (100.0%) | 105 (100.0%) |
Housing Structure by Heating Type in Eden
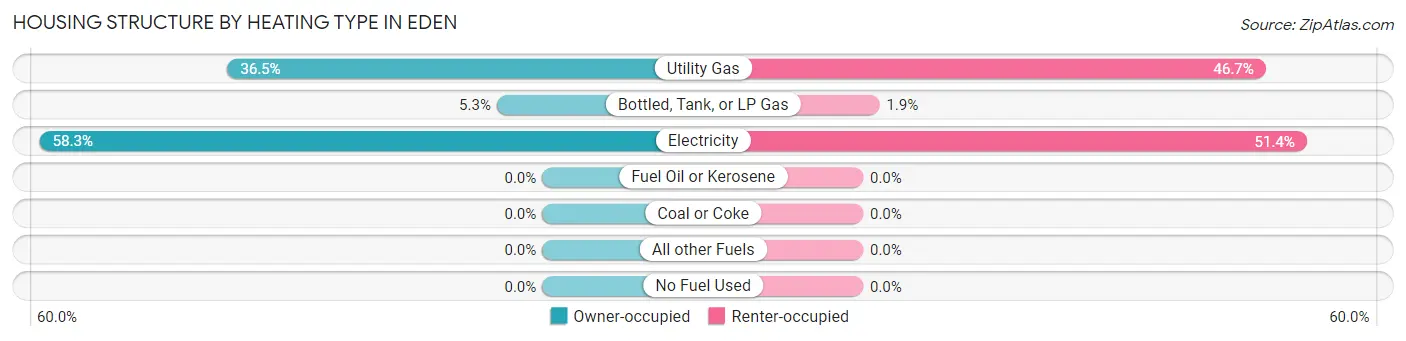
| Heating Type | Owner-occupied | Renter-occupied |
| Utility Gas | 104 (36.5%) | 49 (46.7%) |
| Bottled, Tank, or LP Gas | 15 (5.3%) | 2 (1.9%) |
| Electricity | 166 (58.3%) | 54 (51.4%) |
| Fuel Oil or Kerosene | 0 (0.0%) | 0 (0.0%) |
| Coal or Coke | 0 (0.0%) | 0 (0.0%) |
| All other Fuels | 0 (0.0%) | 0 (0.0%) |
| No Fuel Used | 0 (0.0%) | 0 (0.0%) |
| Total | 285 (100.0%) | 105 (100.0%) |
Household Vehicle Usage in Eden
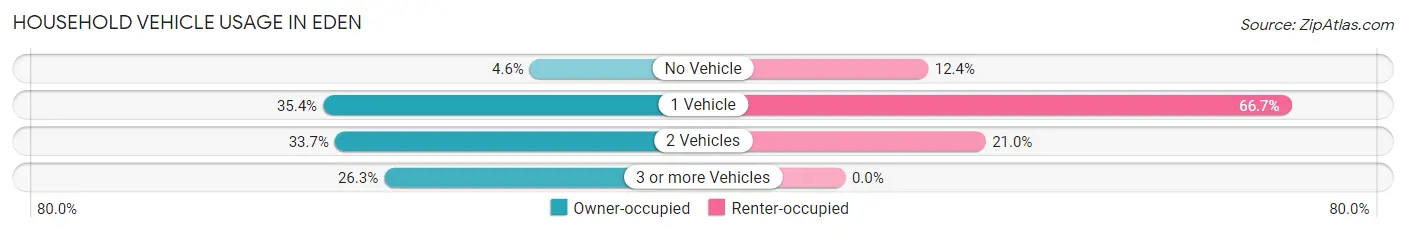
| Vehicles per Household | Owner-occupied | Renter-occupied |
| No Vehicle | 13 (4.6%) | 13 (12.4%) |
| 1 Vehicle | 101 (35.4%) | 70 (66.7%) |
| 2 Vehicles | 96 (33.7%) | 22 (20.9%) |
| 3 or more Vehicles | 75 (26.3%) | 0 (0.0%) |
| Total | 285 (100.0%) | 105 (100.0%) |
Real Estate & Mortgages in Eden
Real Estate and Mortgage Overview in Eden
| Characteristic | Without Mortgage | With Mortgage |
| Housing Units | 182 | 103 |
| Median Property Value | $59,000 | $96,500 |
| Median Household Income | $39,375 | $0 |
| Monthly Housing Costs | $402 | $0 |
| Real Estate Taxes | $875 | $0 |
Property Value by Mortgage Status in Eden
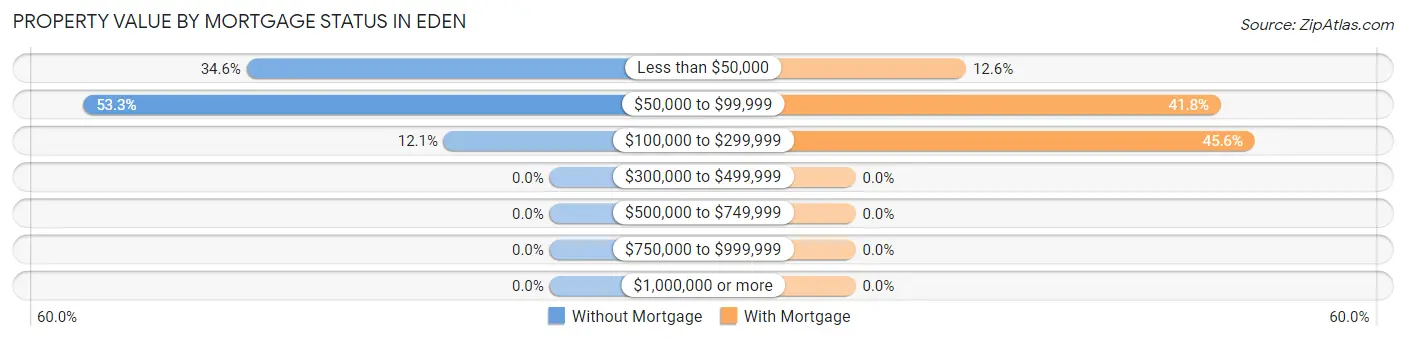
| Property Value | Without Mortgage | With Mortgage |
| Less than $50,000 | 63 (34.6%) | 13 (12.6%) |
| $50,000 to $99,999 | 97 (53.3%) | 43 (41.7%) |
| $100,000 to $299,999 | 22 (12.1%) | 47 (45.6%) |
| $300,000 to $499,999 | 0 (0.0%) | 0 (0.0%) |
| $500,000 to $749,999 | 0 (0.0%) | 0 (0.0%) |
| $750,000 to $999,999 | 0 (0.0%) | 0 (0.0%) |
| $1,000,000 or more | 0 (0.0%) | 0 (0.0%) |
| Total | 182 (100.0%) | 103 (100.0%) |
Household Income by Mortgage Status in Eden
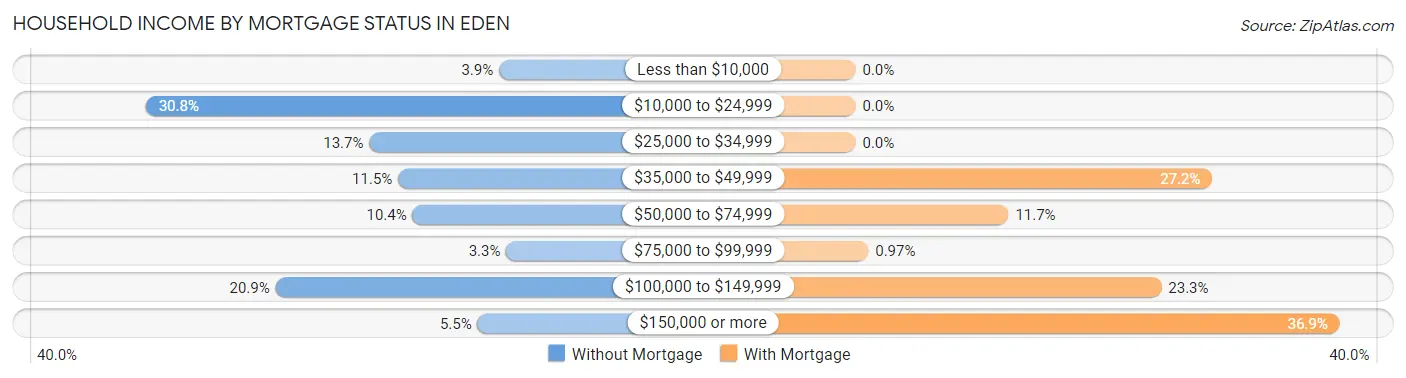
| Household Income | Without Mortgage | With Mortgage |
| Less than $10,000 | 7 (3.8%) | 0 (0.0%) |
| $10,000 to $24,999 | 56 (30.8%) | 0 (0.0%) |
| $25,000 to $34,999 | 25 (13.7%) | 0 (0.0%) |
| $35,000 to $49,999 | 21 (11.5%) | 28 (27.2%) |
| $50,000 to $74,999 | 19 (10.4%) | 12 (11.7%) |
| $75,000 to $99,999 | 6 (3.3%) | 1 (1.0%) |
| $100,000 to $149,999 | 38 (20.9%) | 24 (23.3%) |
| $150,000 or more | 10 (5.5%) | 38 (36.9%) |
| Total | 182 (100.0%) | 103 (100.0%) |
Property Value to Household Income Ratio in Eden
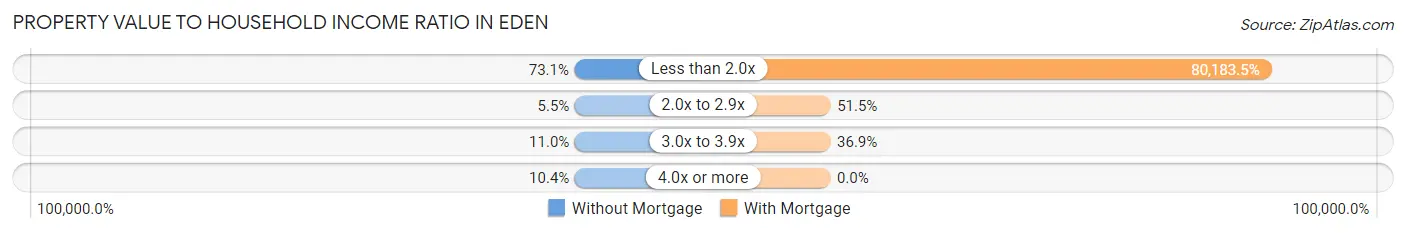
| Value-to-Income Ratio | Without Mortgage | With Mortgage |
| Less than 2.0x | 133 (73.1%) | 82,589 (80,183.5%) |
| 2.0x to 2.9x | 10 (5.5%) | 53 (51.5%) |
| 3.0x to 3.9x | 20 (11.0%) | 38 (36.9%) |
| 4.0x or more | 19 (10.4%) | 0 (0.0%) |
| Total | 182 (100.0%) | 103 (100.0%) |
Real Estate Taxes by Mortgage Status in Eden
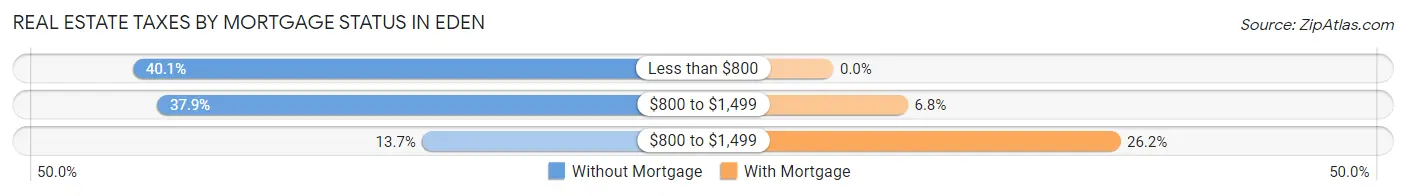
| Property Taxes | Without Mortgage | With Mortgage |
| Less than $800 | 73 (40.1%) | 0 (0.0%) |
| $800 to $1,499 | 69 (37.9%) | 7 (6.8%) |
| $800 to $1,499 | 25 (13.7%) | 27 (26.2%) |
| Total | 182 (100.0%) | 103 (100.0%) |
Health & Disability in Eden
Health Insurance Coverage by Age in Eden
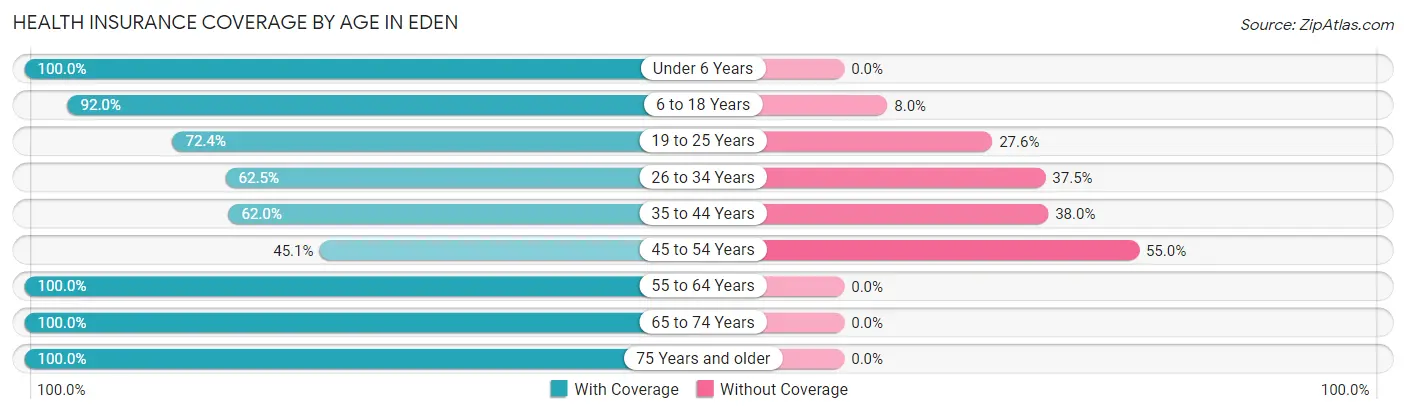
| Age Bracket | With Coverage | Without Coverage |
| Under 6 Years | 14 (100.0%) | 0 (0.0%) |
| 6 to 18 Years | 252 (92.0%) | 22 (8.0%) |
| 19 to 25 Years | 42 (72.4%) | 16 (27.6%) |
| 26 to 34 Years | 35 (62.5%) | 21 (37.5%) |
| 35 to 44 Years | 44 (62.0%) | 27 (38.0%) |
| 45 to 54 Years | 41 (45.1%) | 50 (54.9%) |
| 55 to 64 Years | 190 (100.0%) | 0 (0.0%) |
| 65 to 74 Years | 115 (100.0%) | 0 (0.0%) |
| 75 Years and older | 135 (100.0%) | 0 (0.0%) |
| Total | 868 (86.5%) | 136 (13.6%) |
Health Insurance Coverage by Citizenship Status in Eden
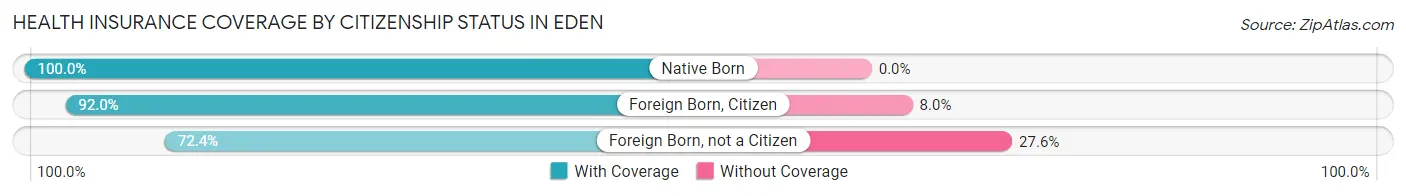
| Citizenship Status | With Coverage | Without Coverage |
| Native Born | 14 (100.0%) | 0 (0.0%) |
| Foreign Born, Citizen | 252 (92.0%) | 22 (8.0%) |
| Foreign Born, not a Citizen | 42 (72.4%) | 16 (27.6%) |
Health Insurance Coverage by Household Income in Eden
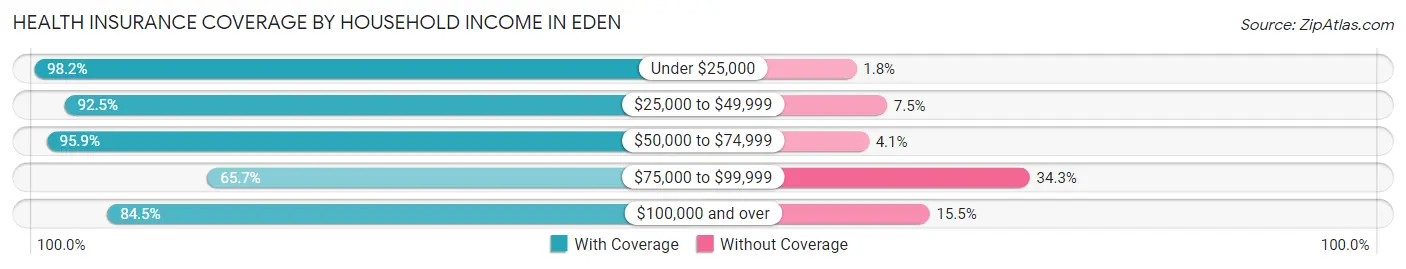
| Household Income | With Coverage | Without Coverage |
| Under $25,000 | 220 (98.2%) | 4 (1.8%) |
| $25,000 to $49,999 | 148 (92.5%) | 12 (7.5%) |
| $50,000 to $74,999 | 140 (95.9%) | 6 (4.1%) |
| $75,000 to $99,999 | 142 (65.7%) | 74 (34.3%) |
| $100,000 and over | 218 (84.5%) | 40 (15.5%) |
Public vs Private Health Insurance Coverage by Age in Eden
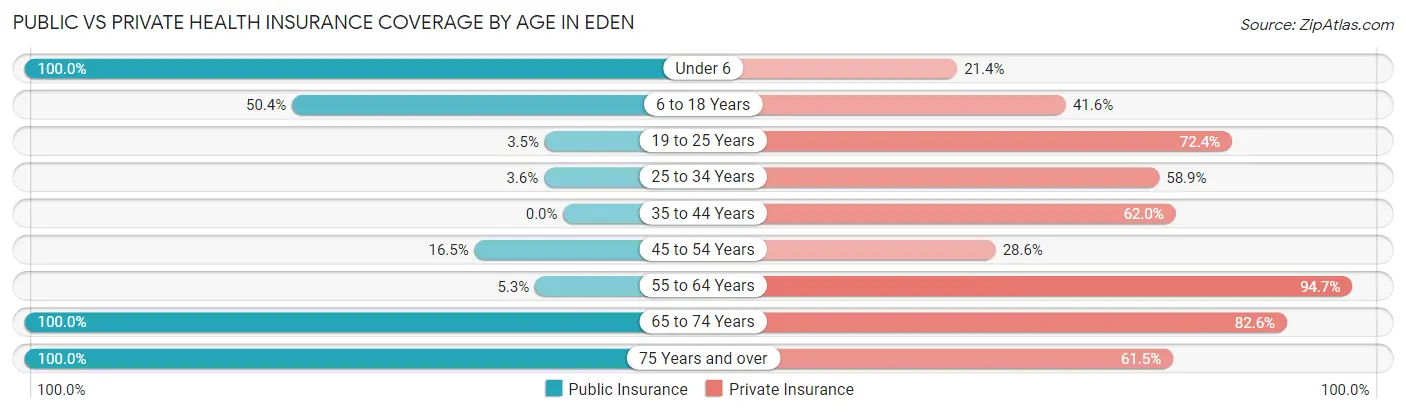
| Age Bracket | Public Insurance | Private Insurance |
| Under 6 | 14 (100.0%) | 3 (21.4%) |
| 6 to 18 Years | 138 (50.4%) | 114 (41.6%) |
| 19 to 25 Years | 2 (3.5%) | 42 (72.4%) |
| 25 to 34 Years | 2 (3.6%) | 33 (58.9%) |
| 35 to 44 Years | 0 (0.0%) | 44 (62.0%) |
| 45 to 54 Years | 15 (16.5%) | 26 (28.6%) |
| 55 to 64 Years | 10 (5.3%) | 180 (94.7%) |
| 65 to 74 Years | 115 (100.0%) | 95 (82.6%) |
| 75 Years and over | 135 (100.0%) | 83 (61.5%) |
| Total | 431 (42.9%) | 620 (61.8%) |
Disability Status by Sex by Age in Eden
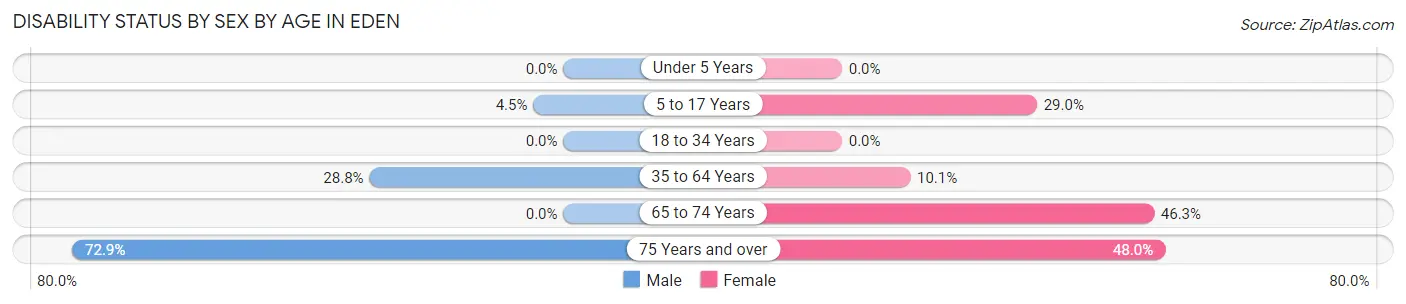
| Age Bracket | Male | Female |
| Under 5 Years | 0 (0.0%) | 0 (0.0%) |
| 5 to 17 Years | 7 (4.5%) | 22 (28.9%) |
| 18 to 34 Years | 0 (0.0%) | 0 (0.0%) |
| 35 to 64 Years | 36 (28.8%) | 23 (10.1%) |
| 65 to 74 Years | 0 (0.0%) | 38 (46.3%) |
| 75 Years and over | 62 (72.9%) | 24 (48.0%) |
Disability Class by Sex by Age in Eden
Disability Class: Hearing Difficulty
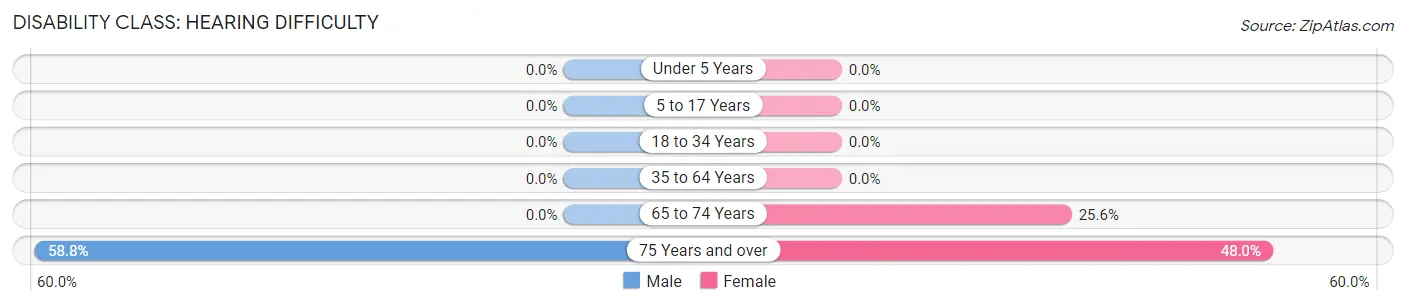
| Age Bracket | Male | Female |
| Under 5 Years | 0 (0.0%) | 0 (0.0%) |
| 5 to 17 Years | 0 (0.0%) | 0 (0.0%) |
| 18 to 34 Years | 0 (0.0%) | 0 (0.0%) |
| 35 to 64 Years | 0 (0.0%) | 0 (0.0%) |
| 65 to 74 Years | 0 (0.0%) | 21 (25.6%) |
| 75 Years and over | 50 (58.8%) | 24 (48.0%) |
Disability Class: Vision Difficulty
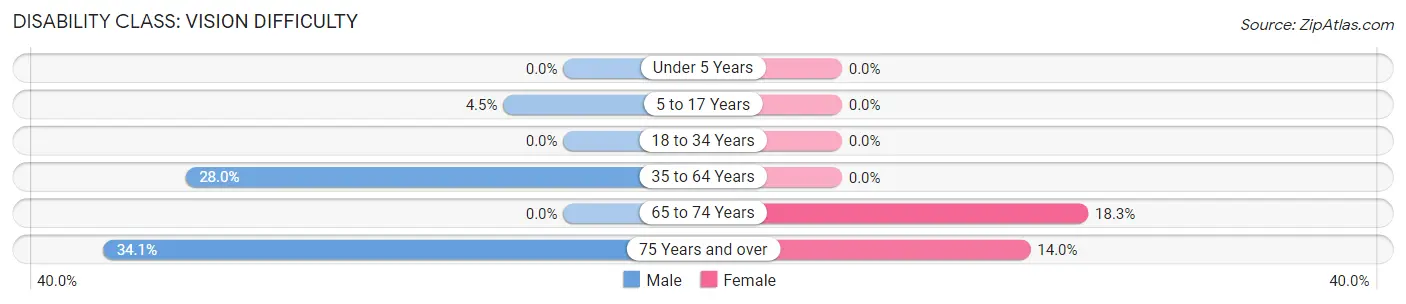
| Age Bracket | Male | Female |
| Under 5 Years | 0 (0.0%) | 0 (0.0%) |
| 5 to 17 Years | 7 (4.5%) | 0 (0.0%) |
| 18 to 34 Years | 0 (0.0%) | 0 (0.0%) |
| 35 to 64 Years | 35 (28.0%) | 0 (0.0%) |
| 65 to 74 Years | 0 (0.0%) | 15 (18.3%) |
| 75 Years and over | 29 (34.1%) | 7 (14.0%) |
Disability Class: Cognitive Difficulty
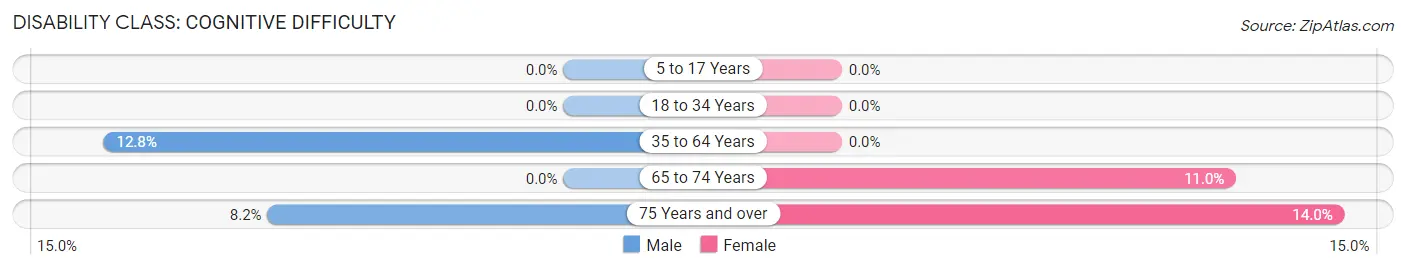
| Age Bracket | Male | Female |
| 5 to 17 Years | 0 (0.0%) | 0 (0.0%) |
| 18 to 34 Years | 0 (0.0%) | 0 (0.0%) |
| 35 to 64 Years | 16 (12.8%) | 0 (0.0%) |
| 65 to 74 Years | 0 (0.0%) | 9 (11.0%) |
| 75 Years and over | 7 (8.2%) | 7 (14.0%) |
Disability Class: Ambulatory Difficulty
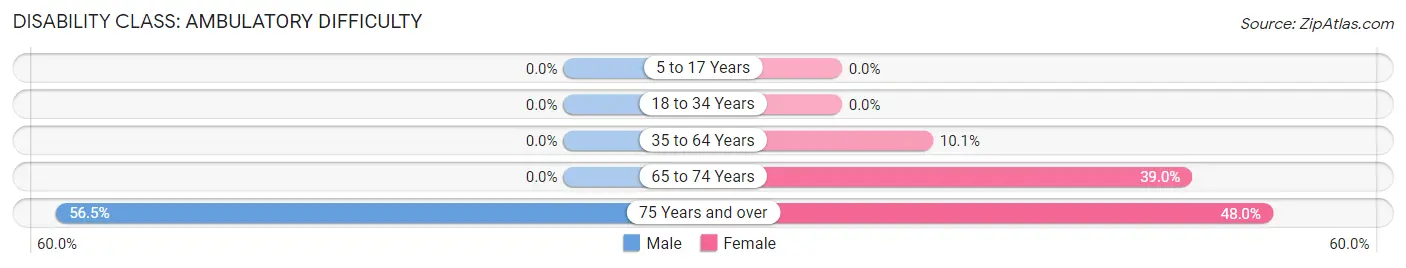
| Age Bracket | Male | Female |
| 5 to 17 Years | 0 (0.0%) | 0 (0.0%) |
| 18 to 34 Years | 0 (0.0%) | 0 (0.0%) |
| 35 to 64 Years | 0 (0.0%) | 23 (10.1%) |
| 65 to 74 Years | 0 (0.0%) | 32 (39.0%) |
| 75 Years and over | 48 (56.5%) | 24 (48.0%) |
Disability Class: Self-Care Difficulty
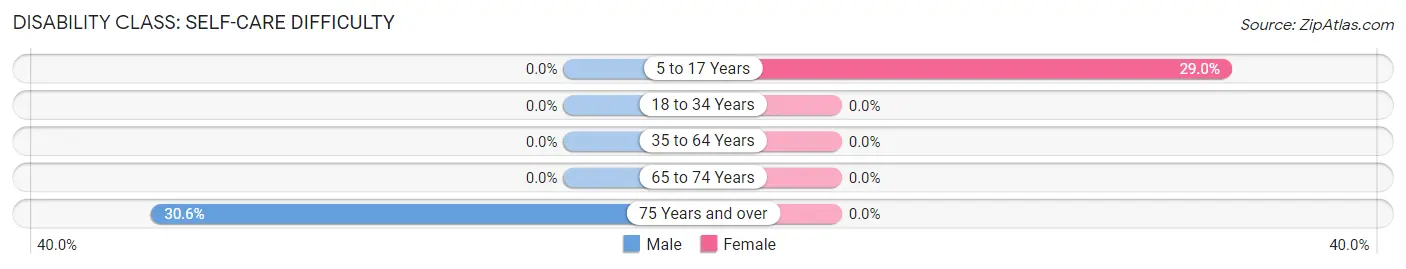
| Age Bracket | Male | Female |
| 5 to 17 Years | 0 (0.0%) | 22 (28.9%) |
| 18 to 34 Years | 0 (0.0%) | 0 (0.0%) |
| 35 to 64 Years | 0 (0.0%) | 0 (0.0%) |
| 65 to 74 Years | 0 (0.0%) | 0 (0.0%) |
| 75 Years and over | 26 (30.6%) | 0 (0.0%) |
Technology Access in Eden
Computing Device Access in Eden
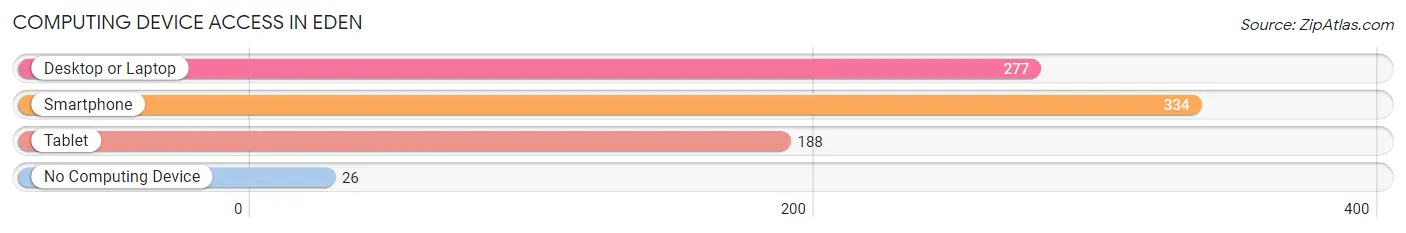
| Device Type | # Households | % Households |
| Desktop or Laptop | 277 | 71.0% |
| Smartphone | 334 | 85.6% |
| Tablet | 188 | 48.2% |
| No Computing Device | 26 | 6.7% |
| Total | 390 | 100.0% |
Internet Access in Eden
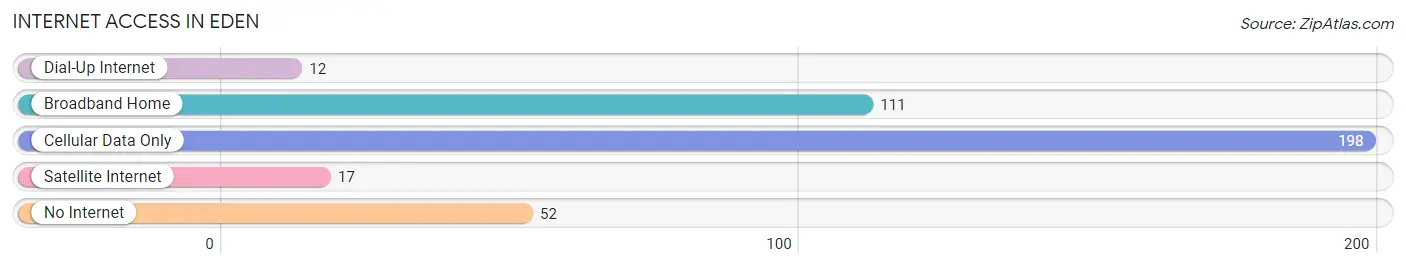
| Internet Type | # Households | % Households |
| Dial-Up Internet | 12 | 3.1% |
| Broadband Home | 111 | 28.5% |
| Cellular Data Only | 198 | 50.8% |
| Satellite Internet | 17 | 4.4% |
| No Internet | 52 | 13.3% |
| Total | 390 | 100.0% |
Eden Summary
Eden, Texas is a small town located in Concho County, Texas. It is situated in the heart of the Texas Hill Country, approximately 90 miles northwest of San Antonio. The town was founded in 1882 and has a population of approximately 1,500 people.
History
Eden was founded in 1882 by a group of settlers from the nearby town of Paint Rock. The settlers were looking for a place to settle and start a new life. The town was named after the biblical Garden of Eden. The first settlers were mostly ranchers and farmers, and the town quickly grew to become a thriving community.
In the early 1900s, the town was a major stop on the San Antonio and Aransas Pass Railway. This allowed the town to become a major shipping center for the surrounding area. The town also had a large cotton gin and a number of other businesses.
In the 1920s, the town was hit hard by the Great Depression. Many of the businesses closed and the population declined. However, the town was able to survive and eventually began to grow again.
In the 1950s, the town was revitalized with the construction of a new school and the opening of a new hospital. The town also began to attract new businesses, including a number of manufacturing plants.
Geography
Eden is located in the heart of the Texas Hill Country, approximately 90 miles northwest of San Antonio. The town is situated on the banks of the Concho River, which flows through the town. The town is surrounded by rolling hills and is home to a number of parks and recreational areas.
Economy
The economy of Eden is largely based on agriculture and tourism. The town is home to a number of farms and ranches, which produce a variety of crops and livestock. The town is also home to a number of tourist attractions, including the Eden Historical Museum and the Eden State Park.
The town is also home to a number of manufacturing plants, which produce a variety of products, including furniture, clothing, and electronics. The town is also home to a number of retail stores, restaurants, and other businesses.
Demographics
As of the 2010 census, the population of Eden was 1,500. The town is predominantly white, with a small Hispanic population. The median household income is $35,000 and the median home value is $90,000.
Conclusion
Eden, Texas is a small town located in Concho County, Texas. It is situated in the heart of the Texas Hill Country, approximately 90 miles northwest of San Antonio. The town was founded in 1882 and has a population of approximately 1,500 people. The economy of Eden is largely based on agriculture and tourism, and the town is home to a number of farms, ranches, manufacturing plants, retail stores, restaurants, and other businesses. The town is predominantly white, with a small Hispanic population.
Common Questions
What is Per Capita Income in Eden?
Per Capita income in Eden is $19,421.
What is the Median Family Income in Eden?
Median Family Income in Eden is $76,429.
What is the Median Household income in Eden?
Median Household Income in Eden is $45,000.
What is Income or Wage Gap in Eden?
Income or Wage Gap in Eden is 59.7%.
Women in Eden earn 40.3 cents for every dollar earned by a man.
What is Family Income Deficit in Eden?
Family Income Deficit in Eden is $10,813.
Families that are below poverty line in Eden earn $10,813 less on average than the poverty threshold level.
What is Inequality or Gini Index in Eden?
Inequality or Gini Index in Eden is 0.43.
What is the Total Population of Eden?
Total Population of Eden is 1,822.
What is the Total Male Population of Eden?
Total Male Population of Eden is 1,198.
What is the Total Female Population of Eden?
Total Female Population of Eden is 624.
What is the Ratio of Males per 100 Females in Eden?
There are 191.99 Males per 100 Females in Eden.
What is the Ratio of Females per 100 Males in Eden?
There are 52.09 Females per 100 Males in Eden.
What is the Median Population Age in Eden?
Median Population Age in Eden is 39.3 Years.
What is the Average Family Size in Eden
Average Family Size in Eden is 3.3 People.
What is the Average Household Size in Eden
Average Household Size in Eden is 2.6 People.
How Large is the Labor Force in Eden?
There are 427 People in the Labor Forcein in Eden.
What is the Percentage of People in the Labor Force in Eden?
26.7% of People are in the Labor Force in Eden.
What is the Unemployment Rate in Eden?
Unemployment Rate in Eden is 1.4%.