La Playa, PR Map & Demographics
La Playa Map
La Playa Overview
$10,853
PER CAPITA INCOME
$29,250
AVG FAMILY INCOME
$26,635
AVG HOUSEHOLD INCOME
36.0%
WAGE / INCOME GAP [ % ]
64.0¢/ $1
WAGE / INCOME GAP [ $ ]
0.36
INEQUALITY / GINI INDEX
1,632
TOTAL POPULATION
694
MALE POPULATION
938
FEMALE POPULATION
73.99
MALES / 100 FEMALES
135.16
FEMALES / 100 MALES
48.2
MEDIAN AGE
3.7
AVG FAMILY SIZE
3.0
AVG HOUSEHOLD SIZE
463
LABOR FORCE [ PEOPLE ]
34.9%
PERCENT IN LABOR FORCE
8.2%
UNEMPLOYMENT RATE
Income in La Playa
Income Overview in La Playa
Per Capita Income in La Playa is $10,853, while median incomes of families and households are $29,250 and $26,635 respectively.
| Characteristic | Number | Measure |
| Per Capita Income | 1,632 | $10,853 |
| Median Family Income | 359 | $29,250 |
| Mean Family Income | 359 | $31,017 |
| Median Household Income | 538 | $26,635 |
| Mean Household Income | 538 | $28,375 |
| Income Deficit | 359 | $0 |
| Wage / Income Gap (%) | 1,632 | 36.00% |
| Wage / Income Gap ($) | 1,632 | 64.00¢ per $1 |
| Gini / Inequality Index | 1,632 | 0.36 |
Earnings by Sex in La Playa
Average Earnings in La Playa are $16,529, $18,672 for men and $11,951 for women, a difference of 36.0%.
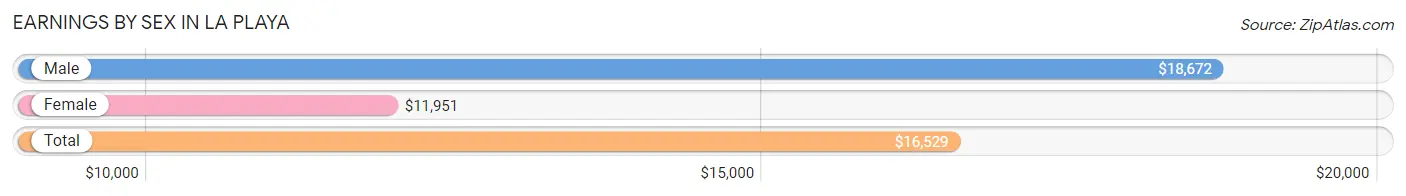
| Sex | Number | Average Earnings |
| Male | 222 (49.5%) | $18,672 |
| Female | 226 (50.4%) | $11,951 |
| Total | 448 (100.0%) | $16,529 |
Earnings by Sex by Income Bracket in La Playa
The most common earnings brackets in La Playa are $15,000 to $17,499 for men (86 | 38.7%) and $10,000 to $12,499 for women (91 | 40.3%).
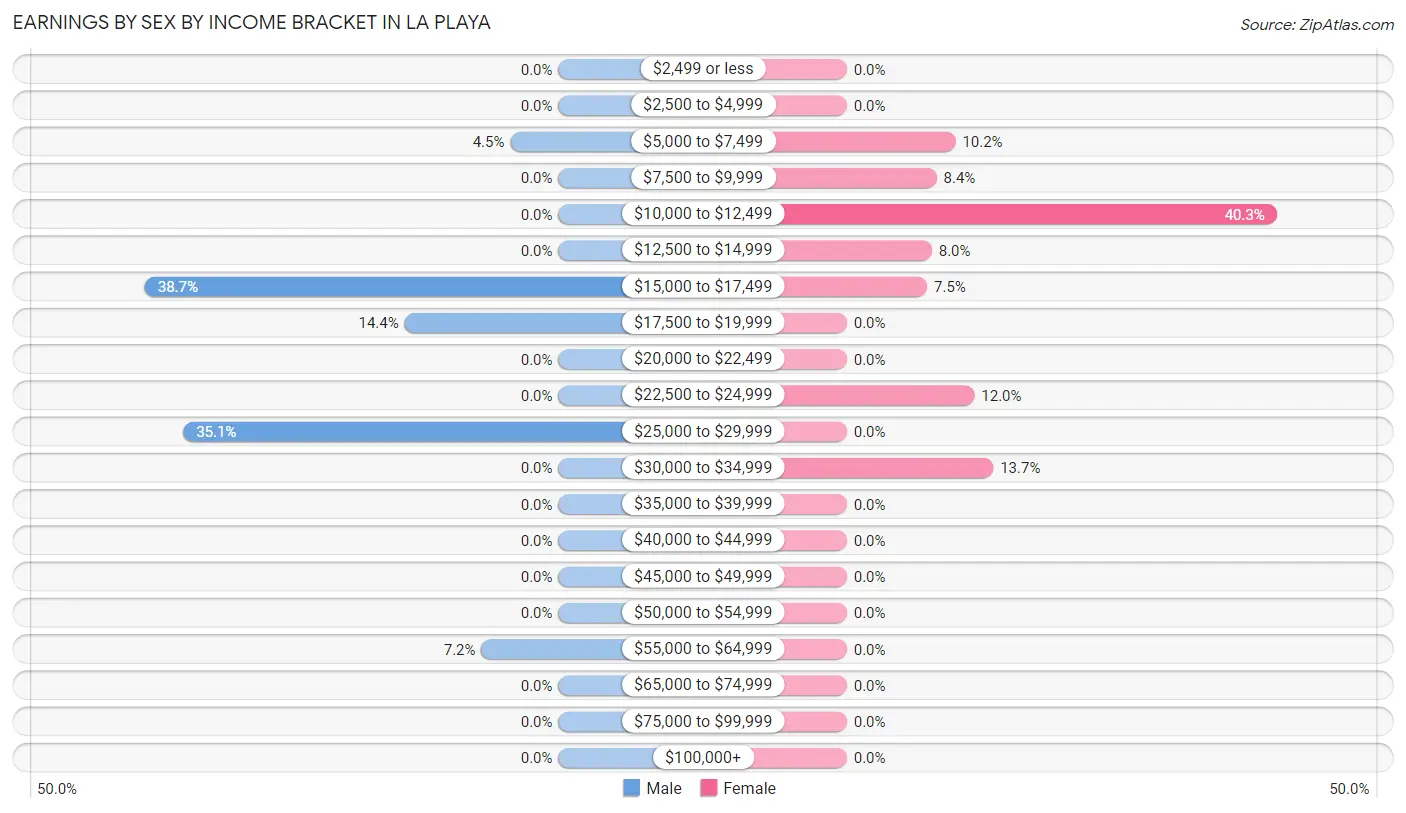
| Income | Male | Female |
| $2,499 or less | 0 (0.0%) | 0 (0.0%) |
| $2,500 to $4,999 | 0 (0.0%) | 0 (0.0%) |
| $5,000 to $7,499 | 10 (4.5%) | 23 (10.2%) |
| $7,500 to $9,999 | 0 (0.0%) | 19 (8.4%) |
| $10,000 to $12,499 | 0 (0.0%) | 91 (40.3%) |
| $12,500 to $14,999 | 0 (0.0%) | 18 (8.0%) |
| $15,000 to $17,499 | 86 (38.7%) | 17 (7.5%) |
| $17,500 to $19,999 | 32 (14.4%) | 0 (0.0%) |
| $20,000 to $22,499 | 0 (0.0%) | 0 (0.0%) |
| $22,500 to $24,999 | 0 (0.0%) | 27 (11.9%) |
| $25,000 to $29,999 | 78 (35.1%) | 0 (0.0%) |
| $30,000 to $34,999 | 0 (0.0%) | 31 (13.7%) |
| $35,000 to $39,999 | 0 (0.0%) | 0 (0.0%) |
| $40,000 to $44,999 | 0 (0.0%) | 0 (0.0%) |
| $45,000 to $49,999 | 0 (0.0%) | 0 (0.0%) |
| $50,000 to $54,999 | 0 (0.0%) | 0 (0.0%) |
| $55,000 to $64,999 | 16 (7.2%) | 0 (0.0%) |
| $65,000 to $74,999 | 0 (0.0%) | 0 (0.0%) |
| $75,000 to $99,999 | 0 (0.0%) | 0 (0.0%) |
| $100,000+ | 0 (0.0%) | 0 (0.0%) |
| Total | 222 (100.0%) | 226 (100.0%) |
Earnings by Sex by Educational Attainment in La Playa
Average earnings in La Playa are $19,102 for men and $11,951 for women, a difference of 37.4%. Men with an educational attainment of less than high school enjoy the highest average annual earnings of $26,250, while those with high school diploma education earn the least with $25,795. Women with an educational attainment of high school diploma earn the most with the average annual earnings of $11,935, while those with college or associate's degree education have the smallest earnings of $11,708.
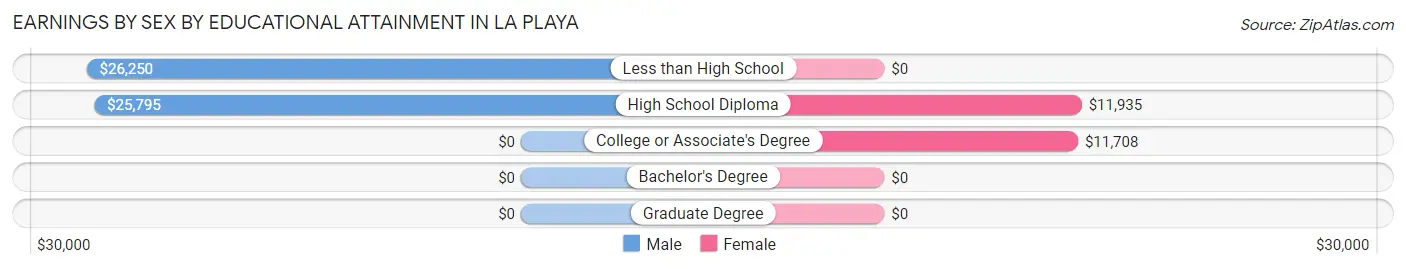
| Educational Attainment | Male Income | Female Income |
| Less than High School | $26,250 | $0 |
| High School Diploma | $25,795 | $11,935 |
| College or Associate's Degree | - | - |
| Bachelor's Degree | - | - |
| Graduate Degree | - | - |
| Total | $19,102 | $11,951 |
Family Income in La Playa
Family Income Brackets in La Playa
According to the La Playa family income data, there are 95 families falling into the $35,000 to $49,999 income range, which is the most common income bracket and makes up 26.5% of all families.
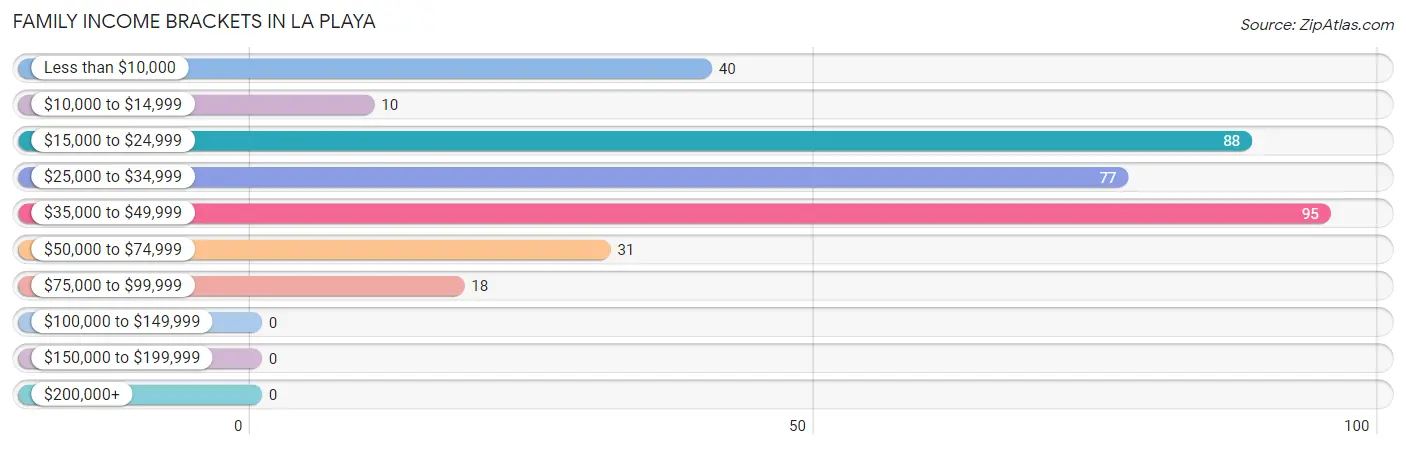
| Income Bracket | # Families | % Families |
| Less than $10,000 | 40 | 11.1% |
| $10,000 to $14,999 | 10 | 2.8% |
| $15,000 to $24,999 | 88 | 24.5% |
| $25,000 to $34,999 | 77 | 21.4% |
| $35,000 to $49,999 | 95 | 26.5% |
| $50,000 to $74,999 | 31 | 8.6% |
| $75,000 to $99,999 | 18 | 5.0% |
| $100,000 to $149,999 | 0 | 0.0% |
| $150,000 to $199,999 | 0 | 0.0% |
| $200,000+ | 0 | 0.0% |
Family Income by Famaliy Size in La Playa
3-person families (122 | 34.0%) account for the highest median family income in La Playa with $37,273 per family, while 3-person families (122 | 34.0%) have the highest median income of $12,424 per family member.
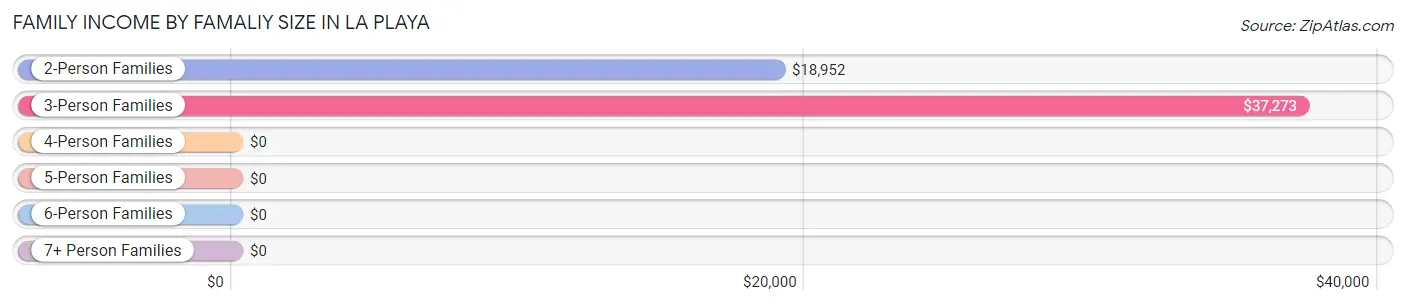
| Income Bracket | # Families | Median Income |
| 2-Person Families | 148 (41.2%) | $18,952 |
| 3-Person Families | 122 (34.0%) | $37,273 |
| 4-Person Families | 56 (15.6%) | $0 |
| 5-Person Families | 33 (9.2%) | $0 |
| 6-Person Families | 0 (0.0%) | $0 |
| 7+ Person Families | 0 (0.0%) | $0 |
| Total | 359 (100.0%) | $29,250 |
Family Income by Number of Earners in La Playa
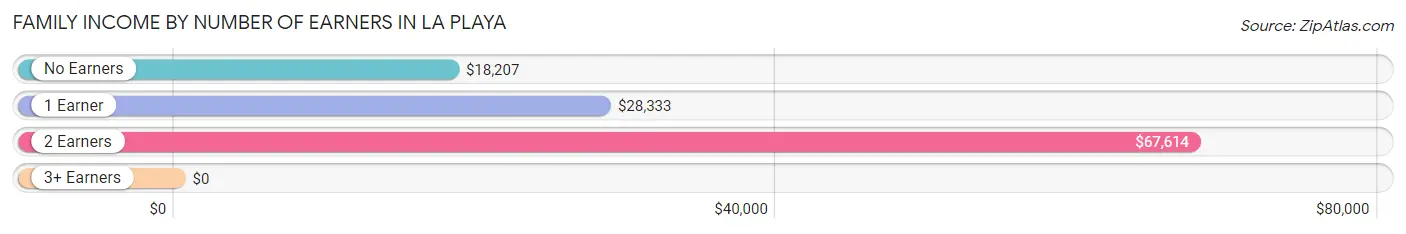
| Number of Earners | # Families | Median Income |
| No Earners | 153 (42.6%) | $18,207 |
| 1 Earner | 128 (35.6%) | $28,333 |
| 2 Earners | 78 (21.7%) | $67,614 |
| 3+ Earners | 0 (0.0%) | $0 |
| Total | 359 (100.0%) | $29,250 |
Household Income in La Playa
Household Income Brackets in La Playa
With 134 households falling in the category, the $35,000 to $49,999 income range is the most frequent in La Playa, accounting for 24.9% of all households.
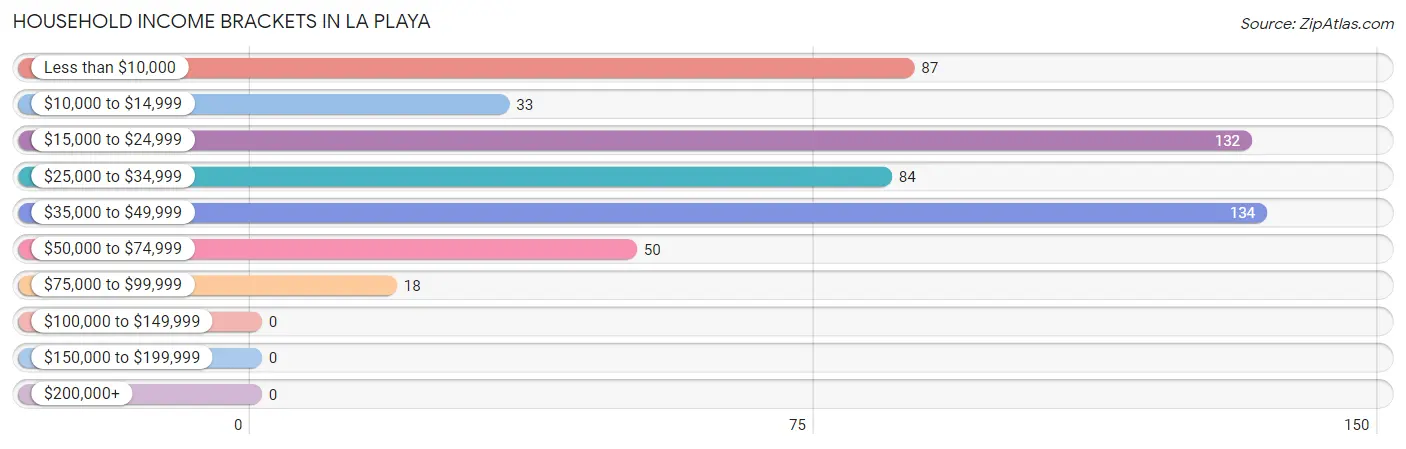
| Income Bracket | # Households | % Households |
| Less than $10,000 | 87 | 16.2% |
| $10,000 to $14,999 | 33 | 6.1% |
| $15,000 to $24,999 | 132 | 24.5% |
| $25,000 to $34,999 | 84 | 15.6% |
| $35,000 to $49,999 | 134 | 24.9% |
| $50,000 to $74,999 | 50 | 9.3% |
| $75,000 to $99,999 | 18 | 3.3% |
| $100,000 to $149,999 | 0 | 0.0% |
| $150,000 to $199,999 | 0 | 0.0% |
| $200,000+ | 0 | 0.0% |
Household Income by Householder Age in La Playa
The median household income in La Playa is $26,635, with the highest median household income of $37,551 found in the 45 to 64 years age bracket for the primary householder. A total of 227 households (42.2%) fall into this category. Meanwhile, the 15 to 24 years age bracket for the primary householder has the lowest median household income of $0, with 11 households (2.0%) in this group.
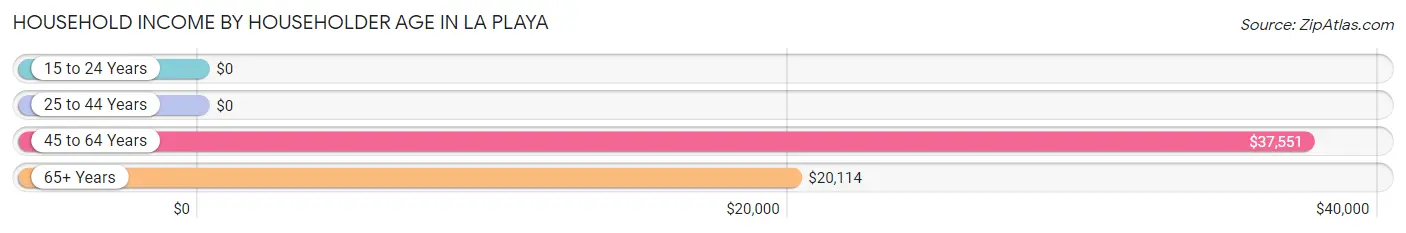
| Income Bracket | # Households | Median Income |
| 15 to 24 Years | 11 (2.0%) | $0 |
| 25 to 44 Years | 77 (14.3%) | $0 |
| 45 to 64 Years | 227 (42.2%) | $37,551 |
| 65+ Years | 223 (41.4%) | $20,114 |
| Total | 538 (100.0%) | $26,635 |
Poverty in La Playa
Income Below Poverty by Sex and Age in La Playa
With 37.2% poverty level for males and 53.6% for females among the residents of La Playa, under 5 year old males and under 5 year old females are the most vulnerable to poverty, with 23 males (100.0%) and 35 females (100.0%) in their respective age groups living below the poverty level.
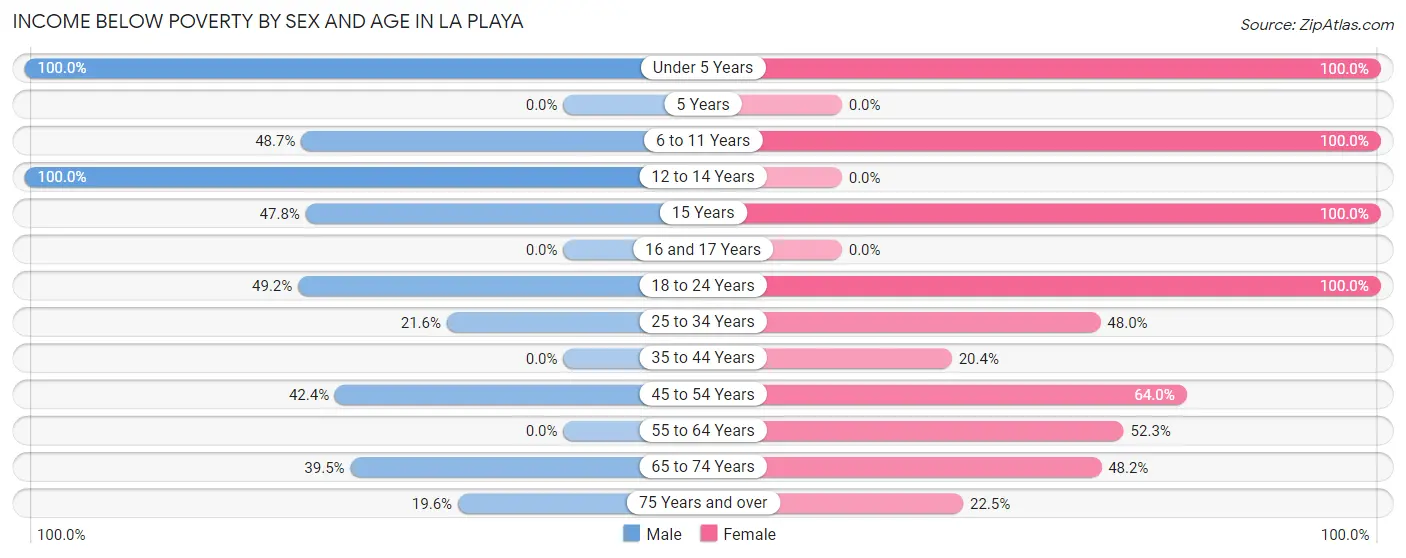
| Age Bracket | Male | Female |
| Under 5 Years | 23 (100.0%) | 35 (100.0%) |
| 5 Years | 0 (0.0%) | 0 (0.0%) |
| 6 to 11 Years | 18 (48.6%) | 95 (100.0%) |
| 12 to 14 Years | 18 (100.0%) | 0 (0.0%) |
| 15 Years | 22 (47.8%) | 32 (100.0%) |
| 16 and 17 Years | 0 (0.0%) | 0 (0.0%) |
| 18 to 24 Years | 32 (49.2%) | 13 (100.0%) |
| 25 to 34 Years | 29 (21.6%) | 72 (48.0%) |
| 35 to 44 Years | 0 (0.0%) | 20 (20.4%) |
| 45 to 54 Years | 39 (42.4%) | 48 (64.0%) |
| 55 to 64 Years | 0 (0.0%) | 79 (52.3%) |
| 65 to 74 Years | 68 (39.5%) | 91 (48.1%) |
| 75 Years and over | 9 (19.6%) | 18 (22.5%) |
| Total | 258 (37.2%) | 503 (53.6%) |
Income Above Poverty by Sex and Age in La Playa
According to the poverty statistics in La Playa, males aged 35 to 44 years and females aged 5 years are the age groups that are most secure financially, with 100.0% of males and 100.0% of females in these age groups living above the poverty line.
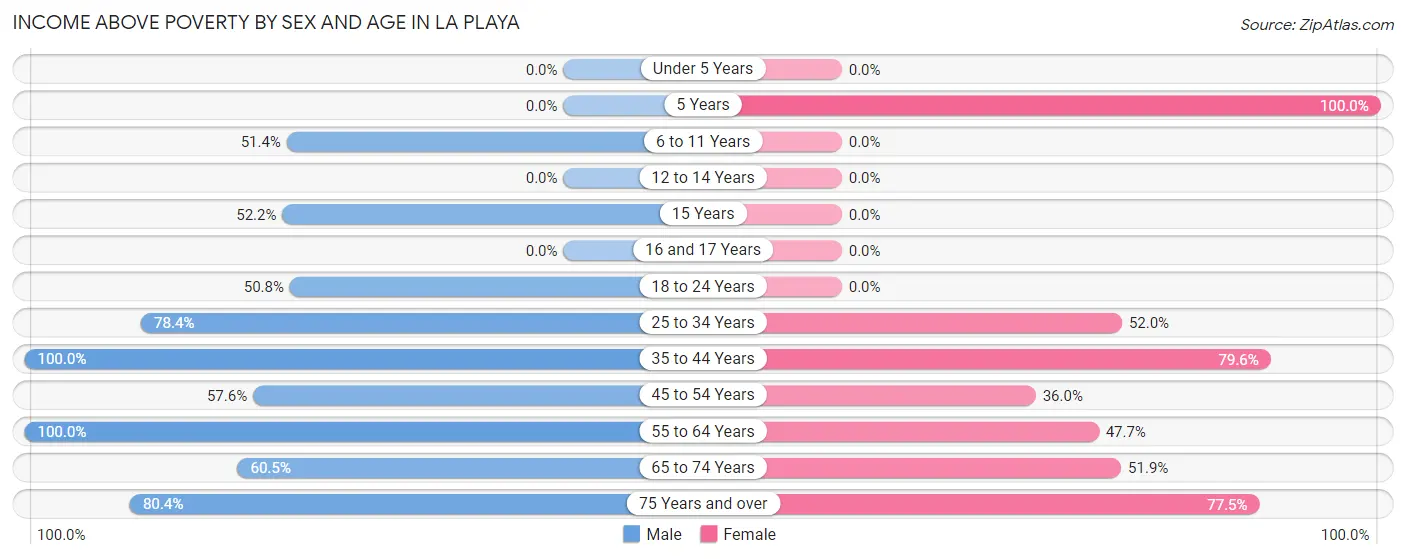
| Age Bracket | Male | Female |
| Under 5 Years | 0 (0.0%) | 0 (0.0%) |
| 5 Years | 0 (0.0%) | 20 (100.0%) |
| 6 to 11 Years | 19 (51.3%) | 0 (0.0%) |
| 12 to 14 Years | 0 (0.0%) | 0 (0.0%) |
| 15 Years | 24 (52.2%) | 0 (0.0%) |
| 16 and 17 Years | 0 (0.0%) | 0 (0.0%) |
| 18 to 24 Years | 33 (50.8%) | 0 (0.0%) |
| 25 to 34 Years | 105 (78.4%) | 78 (52.0%) |
| 35 to 44 Years | 19 (100.0%) | 78 (79.6%) |
| 45 to 54 Years | 53 (57.6%) | 27 (36.0%) |
| 55 to 64 Years | 42 (100.0%) | 72 (47.7%) |
| 65 to 74 Years | 104 (60.5%) | 98 (51.8%) |
| 75 Years and over | 37 (80.4%) | 62 (77.5%) |
| Total | 436 (62.8%) | 435 (46.4%) |
Income Below Poverty Among Married-Couple Families in La Playa
The poverty statistics for married-couple families in La Playa show that 27.4% or 65 of the total 237 families live below the poverty line. Families with 3 or 4 children have the highest poverty rate of 100.0%, comprising of 15 families. On the other hand, families with 1 or 2 children have the lowest poverty rate of 0.0%, which includes 0 families.
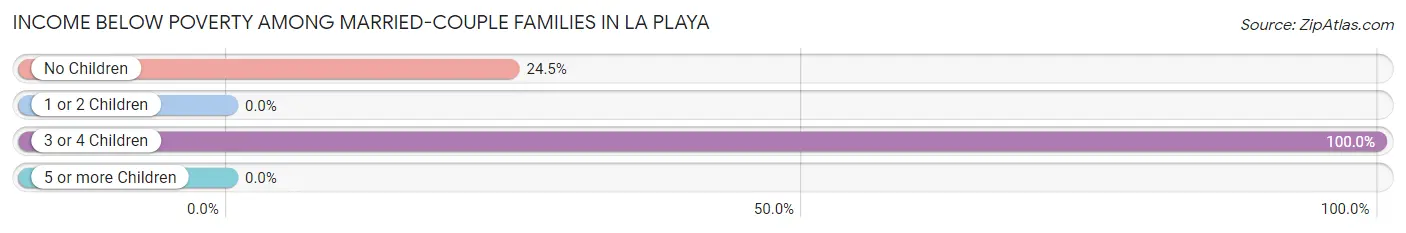
| Children | Above Poverty | Below Poverty |
| No Children | 154 (75.5%) | 50 (24.5%) |
| 1 or 2 Children | 18 (100.0%) | 0 (0.0%) |
| 3 or 4 Children | 0 (0.0%) | 15 (100.0%) |
| 5 or more Children | 0 (0.0%) | 0 (0.0%) |
| Total | 172 (72.6%) | 65 (27.4%) |
Income Below Poverty Among Single-Parent Households in La Playa
According to the poverty data in La Playa, 84.3% or 43 single-father households and 53.5% or 38 single-mother households are living below the poverty line. Among single-father households, those with 1 or 2 children have the highest poverty rate, with 43 households (100.0%) experiencing poverty. Likewise, among single-mother households, those with 1 or 2 children have the highest poverty rate, with 30 households (57.7%) falling below the poverty line.
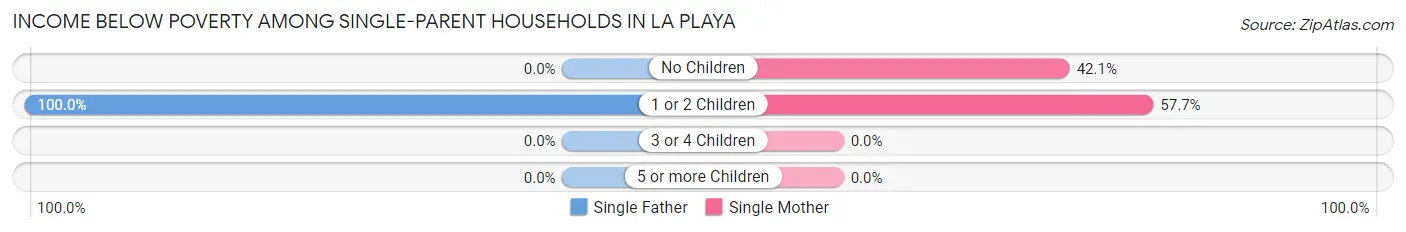
| Children | Single Father | Single Mother |
| No Children | 0 (0.0%) | 8 (42.1%) |
| 1 or 2 Children | 43 (100.0%) | 30 (57.7%) |
| 3 or 4 Children | 0 (0.0%) | 0 (0.0%) |
| 5 or more Children | 0 (0.0%) | 0 (0.0%) |
| Total | 43 (84.3%) | 38 (53.5%) |
Income Below Poverty Among Married-Couple vs Single-Parent Households in La Playa
The poverty data for La Playa shows that 65 of the married-couple family households (27.4%) and 81 of the single-parent households (66.4%) are living below the poverty level. Within the married-couple family households, those with 3 or 4 children have the highest poverty rate, with 15 households (100.0%) falling below the poverty line. Among the single-parent households, those with 1 or 2 children have the highest poverty rate, with 73 household (76.8%) living below poverty.
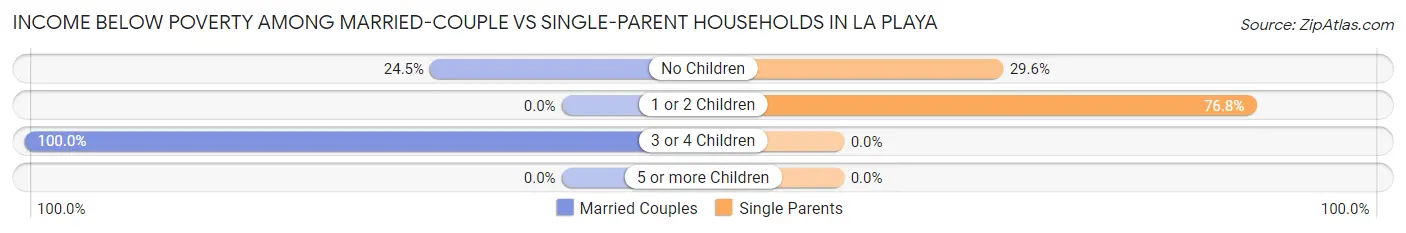
| Children | Married-Couple Families | Single-Parent Households |
| No Children | 50 (24.5%) | 8 (29.6%) |
| 1 or 2 Children | 0 (0.0%) | 73 (76.8%) |
| 3 or 4 Children | 15 (100.0%) | 0 (0.0%) |
| 5 or more Children | 0 (0.0%) | 0 (0.0%) |
| Total | 65 (27.4%) | 81 (66.4%) |
Race in La Playa
The most populous races in La Playa are Hispanic or Latino (1,614 | 98.9%), Two or more Races (963 | 59.0%), and White / Caucasian (449 | 27.5%).
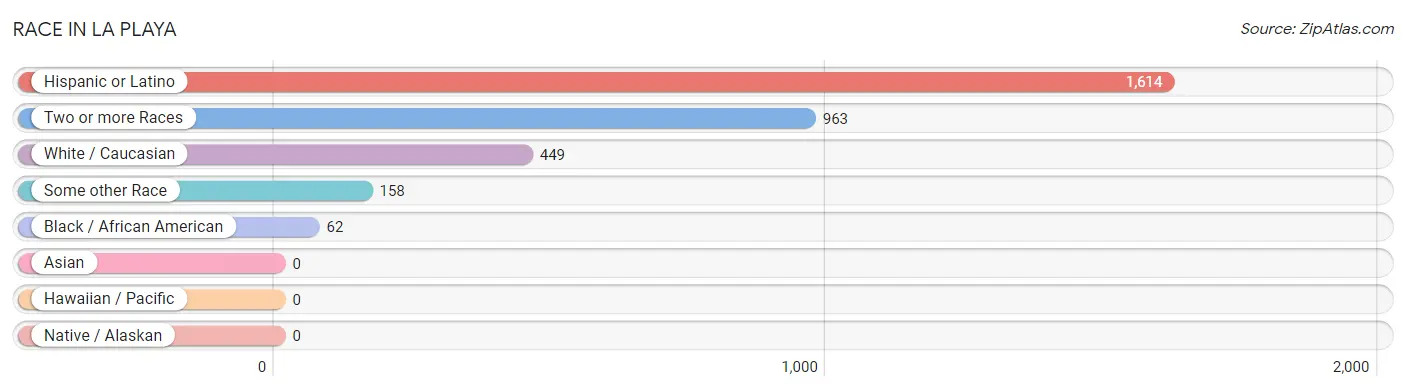
| Race | # Population | % Population |
| Asian | 0 | 0.0% |
| Black / African American | 62 | 3.8% |
| Hawaiian / Pacific | 0 | 0.0% |
| Hispanic or Latino | 1,614 | 98.9% |
| Native / Alaskan | 0 | 0.0% |
| White / Caucasian | 449 | 27.5% |
| Two or more Races | 963 | 59.0% |
| Some other Race | 158 | 9.7% |
| Total | 1,632 | 100.0% |
Ancestry in La Playa
The most populous ancestries reported in La Playa are Puerto Rican (1,614 | 98.9%), Central American Indian (486 | 29.8%), and American (7 | 0.4%), together accounting for 129.1% of all La Playa residents.
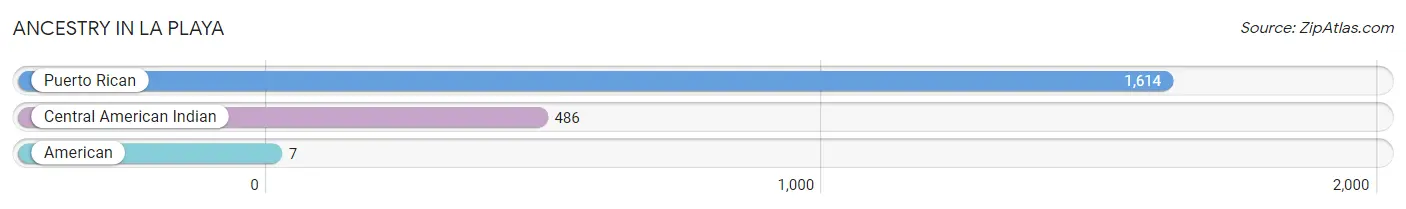
| Ancestry | # Population | % Population |
| American | 7 | 0.4% |
| Central American Indian | 486 | 29.8% |
| Puerto Rican | 1,614 | 98.9% | View All 3 Rows |
Immigrants in La Playa

| Immigration Origin | # Population | % Population | View All 0 Rows |
Sex and Age in La Playa
Sex and Age in La Playa
The most populous age groups in La Playa are 65 to 69 Years (105 | 15.1%) for men and 60 to 64 Years (125 | 13.3%) for women.
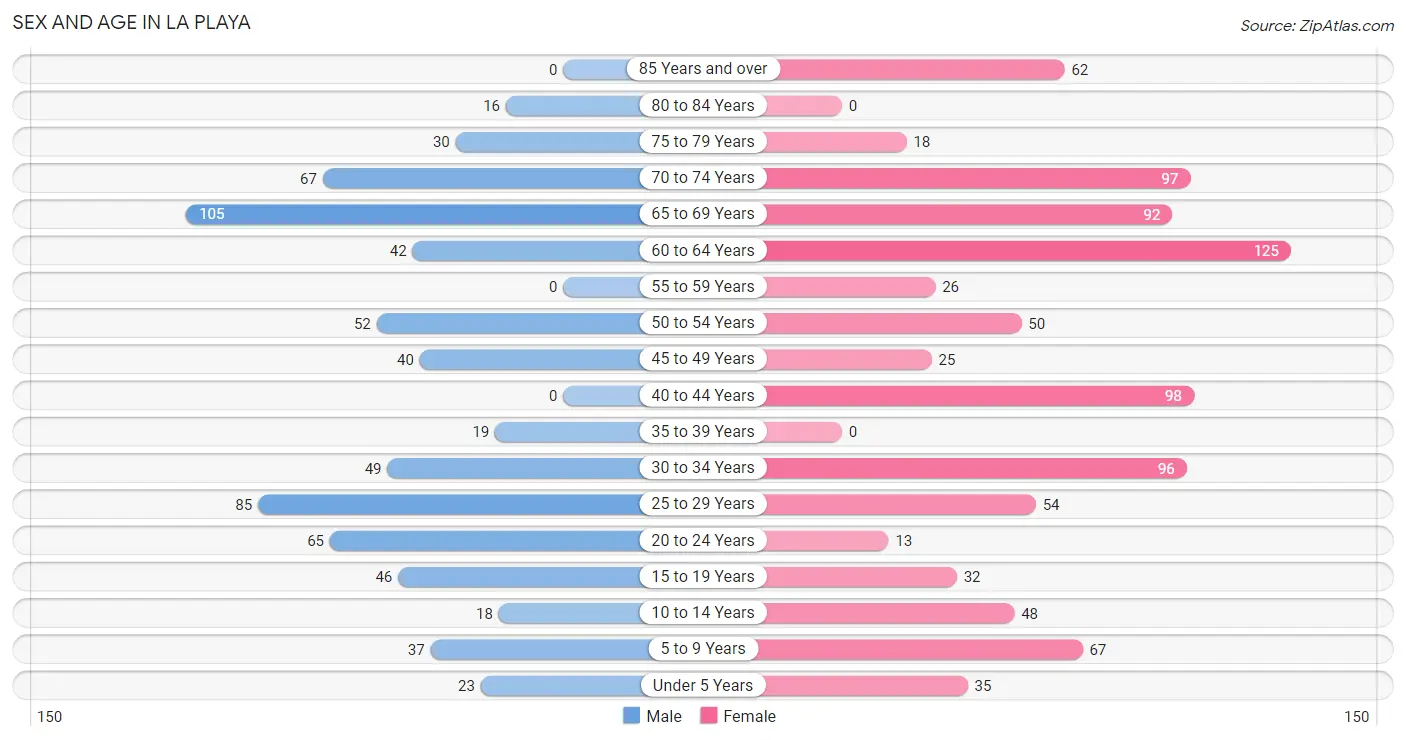
| Age Bracket | Male | Female |
| Under 5 Years | 23 (3.3%) | 35 (3.7%) |
| 5 to 9 Years | 37 (5.3%) | 67 (7.1%) |
| 10 to 14 Years | 18 (2.6%) | 48 (5.1%) |
| 15 to 19 Years | 46 (6.6%) | 32 (3.4%) |
| 20 to 24 Years | 65 (9.4%) | 13 (1.4%) |
| 25 to 29 Years | 85 (12.2%) | 54 (5.8%) |
| 30 to 34 Years | 49 (7.1%) | 96 (10.2%) |
| 35 to 39 Years | 19 (2.7%) | 0 (0.0%) |
| 40 to 44 Years | 0 (0.0%) | 98 (10.4%) |
| 45 to 49 Years | 40 (5.8%) | 25 (2.7%) |
| 50 to 54 Years | 52 (7.5%) | 50 (5.3%) |
| 55 to 59 Years | 0 (0.0%) | 26 (2.8%) |
| 60 to 64 Years | 42 (6.0%) | 125 (13.3%) |
| 65 to 69 Years | 105 (15.1%) | 92 (9.8%) |
| 70 to 74 Years | 67 (9.7%) | 97 (10.3%) |
| 75 to 79 Years | 30 (4.3%) | 18 (1.9%) |
| 80 to 84 Years | 16 (2.3%) | 0 (0.0%) |
| 85 Years and over | 0 (0.0%) | 62 (6.6%) |
| Total | 694 (100.0%) | 938 (100.0%) |
Families and Households in La Playa
Median Family Size in La Playa
The median family size in La Playa is 3.71 persons per family, with single male/father families (51 | 14.2%) accounting for the largest median family size of 4.33 persons per family. On the other hand, married-couple families (237 | 66.0%) represent the smallest median family size with 3.47 persons per family.
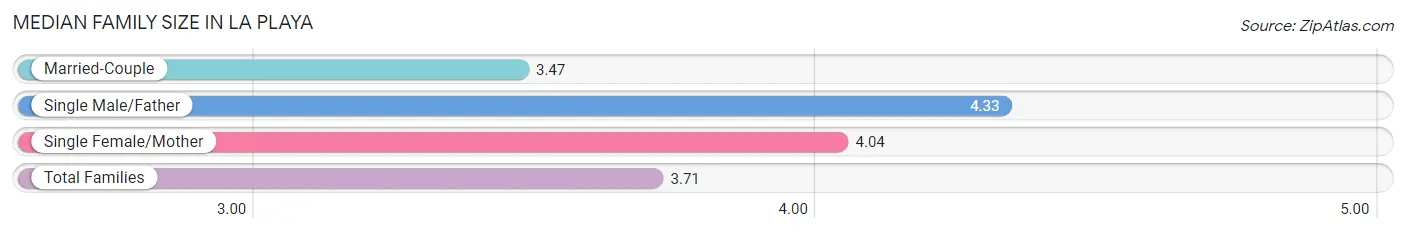
| Family Type | # Families | Family Size |
| Married-Couple | 237 (66.0%) | 3.47 |
| Single Male/Father | 51 (14.2%) | 4.33 |
| Single Female/Mother | 71 (19.8%) | 4.04 |
| Total Families | 359 (100.0%) | 3.71 |
Median Household Size in La Playa
The median household size in La Playa is 3.03 persons per household, with single male/father households (51 | 9.5%) accounting for the largest median household size of 5.39 persons per household. non-family households (179 | 33.3%) represent the smallest median household size with 1.30 persons per household.
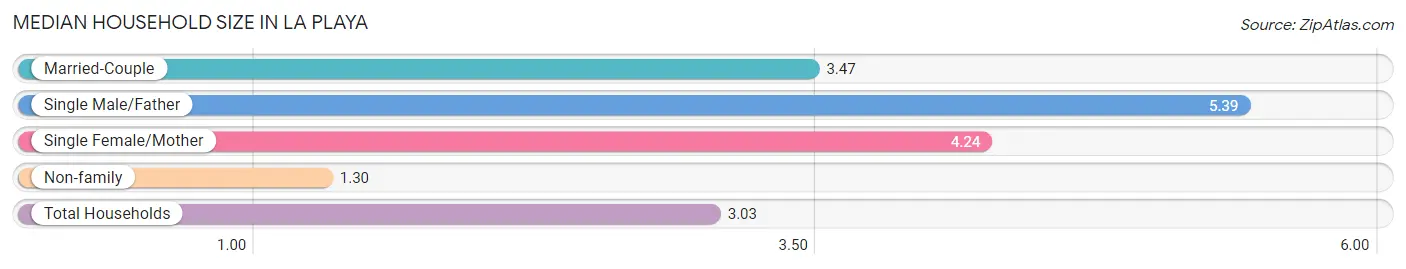
| Household Type | # Households | Household Size |
| Married-Couple | 237 (44.1%) | 3.47 |
| Single Male/Father | 51 (9.5%) | 5.39 |
| Single Female/Mother | 71 (13.2%) | 4.24 |
| Non-family | 179 (33.3%) | 1.30 |
| Total Households | 538 (100.0%) | 3.03 |
Household Size by Marriage Status in La Playa
Out of a total of 538 households in La Playa, 359 (66.7%) are family households, while 179 (33.3%) are nonfamily households. The most numerous type of family households are 2-person households, comprising 148, and the most common type of nonfamily households are 1-person households, comprising 134.
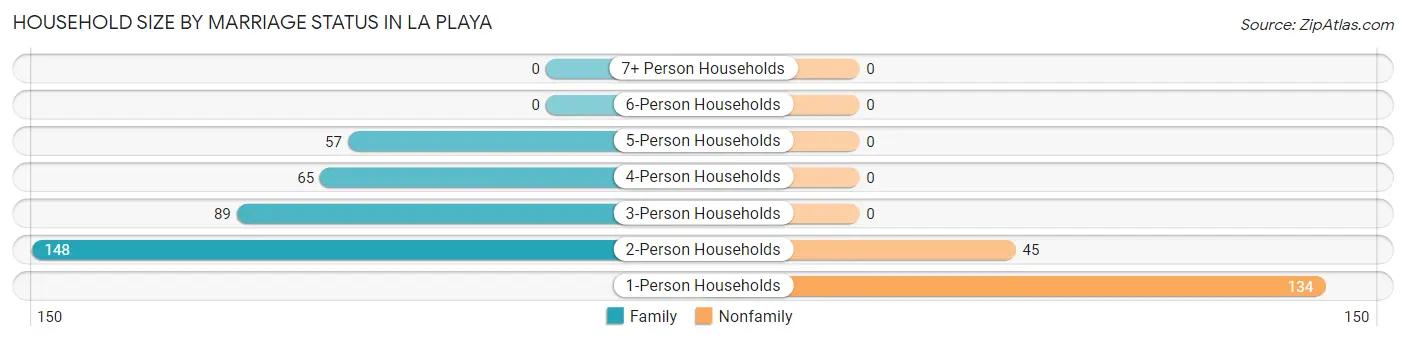
| Household Size | Family Households | Nonfamily Households |
| 1-Person Households | - | 134 (24.9%) |
| 2-Person Households | 148 (27.5%) | 45 (8.4%) |
| 3-Person Households | 89 (16.5%) | 0 (0.0%) |
| 4-Person Households | 65 (12.1%) | 0 (0.0%) |
| 5-Person Households | 57 (10.6%) | 0 (0.0%) |
| 6-Person Households | 0 (0.0%) | 0 (0.0%) |
| 7+ Person Households | 0 (0.0%) | 0 (0.0%) |
| Total | 359 (66.7%) | 179 (33.3%) |
Female Fertility in La Playa
Fertility by Age in La Playa
Average fertility rate in La Playa is 91.0 births per 1,000 women. Women in the age bracket of 20 to 34 years have the highest fertility rate with 190.0 births per 1,000 women. Women in the age bracket of 20 to 34 years acount for 100.0% of all women with births.
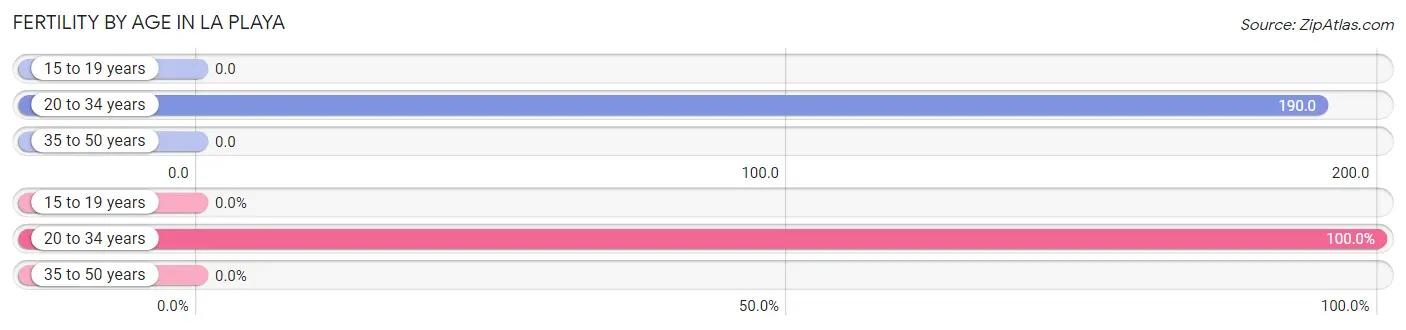
| Age Bracket | Women with Births | Births / 1,000 Women |
| 15 to 19 years | 0 (0.0%) | 0.0 |
| 20 to 34 years | 31 (100.0%) | 190.0 |
| 35 to 50 years | 0 (0.0%) | 0.0 |
| Total | 31 (100.0%) | 91.0 |
Fertility by Age by Marriage Status in La Playa
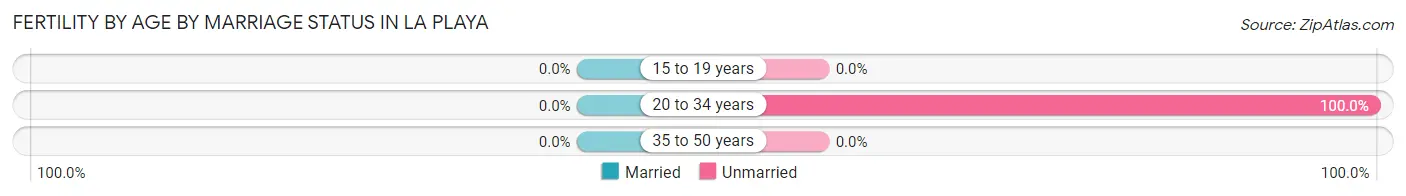
| Age Bracket | Married | Unmarried |
| 15 to 19 years | 0 (0.0%) | 0 (0.0%) |
| 20 to 34 years | 0 (0.0%) | 31 (100.0%) |
| 35 to 50 years | 0 (0.0%) | 0 (0.0%) |
| Total | 0 (0.0%) | 31 (100.0%) |
Fertility by Education in La Playa
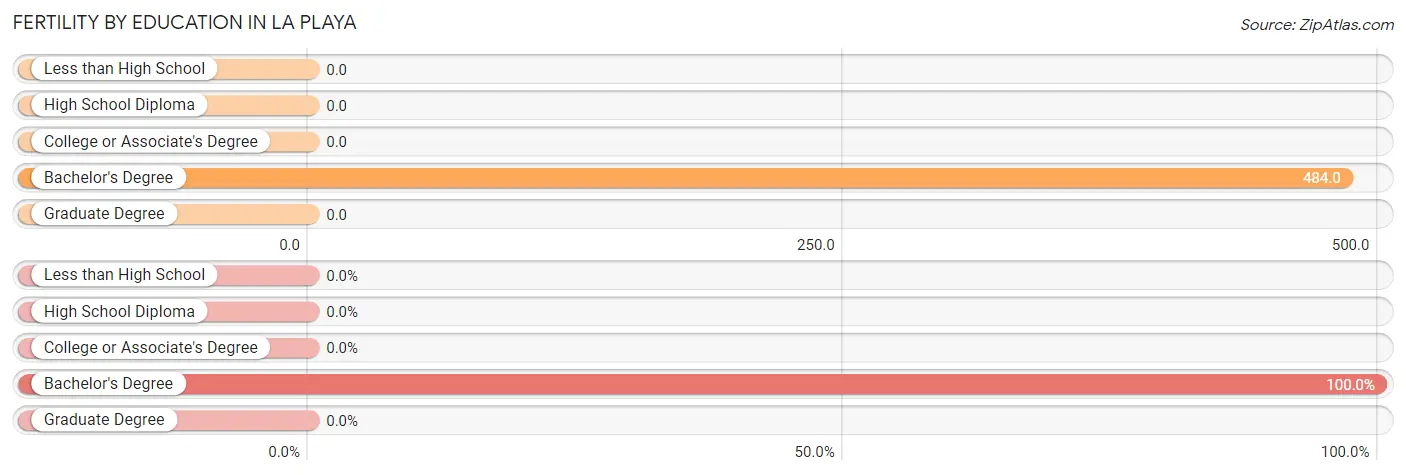
| Educational Attainment | Women with Births | Births / 1,000 Women |
| Less than High School | 0 (0.0%) | 0.0 |
| High School Diploma | 0 (0.0%) | 0.0 |
| College or Associate's Degree | 0 (0.0%) | 0.0 |
| Bachelor's Degree | 31 (100.0%) | 484.0 |
| Graduate Degree | 0 (0.0%) | 0.0 |
| Total | 31 (100.0%) | 91.0 |
Fertility by Education by Marriage Status in La Playa
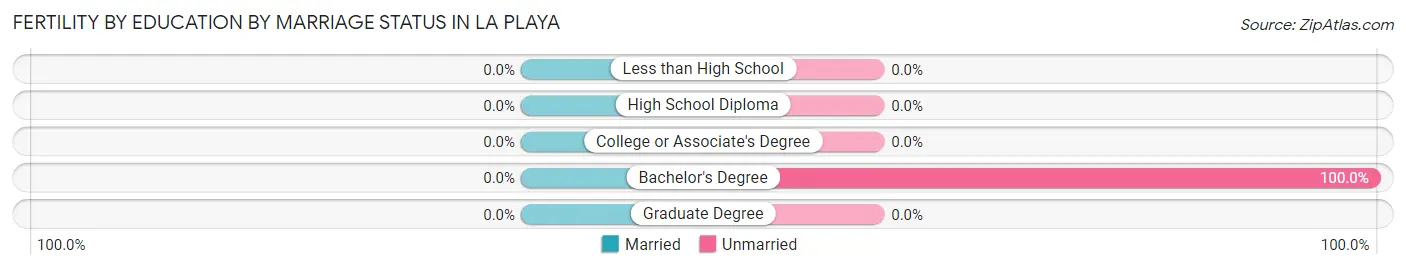
| Educational Attainment | Married | Unmarried |
| Less than High School | 0 (0.0%) | 0 (0.0%) |
| High School Diploma | 0 (0.0%) | 0 (0.0%) |
| College or Associate's Degree | 0 (0.0%) | 0 (0.0%) |
| Bachelor's Degree | 0 (0.0%) | 31 (100.0%) |
| Graduate Degree | 0 (0.0%) | 0 (0.0%) |
| Total | 0 (0.0%) | 31 (100.0%) |
Employment Characteristics in La Playa
Employment by Class of Employer in La Playa
Among the 425 employed individuals in La Playa, private company employees (289 | 68.0%), state government employees (68 | 16.0%), and self-employed (not incorporated) (24 | 5.7%) make up the most common classes of employment.
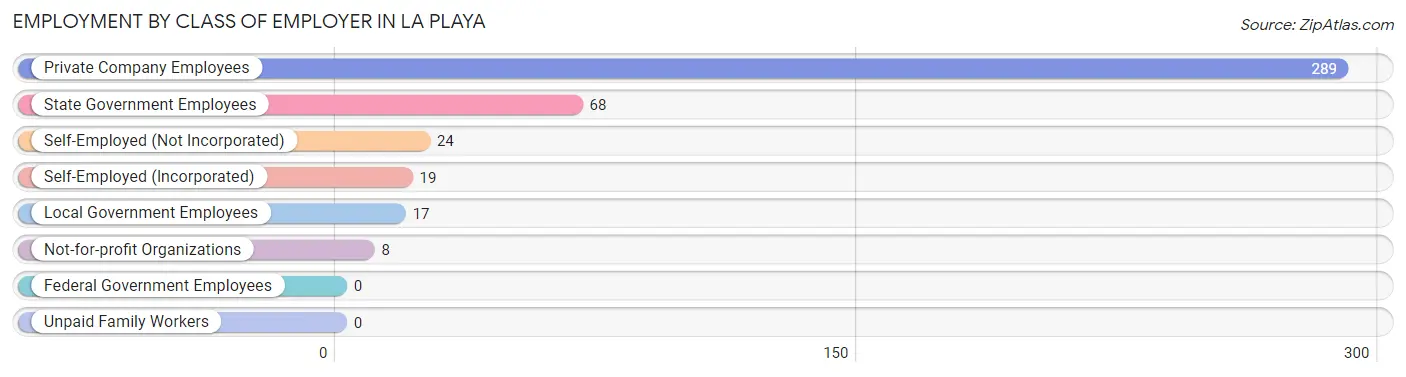
| Employer Class | # Employees | % Employees |
| Private Company Employees | 289 | 68.0% |
| Self-Employed (Incorporated) | 19 | 4.5% |
| Self-Employed (Not Incorporated) | 24 | 5.7% |
| Not-for-profit Organizations | 8 | 1.9% |
| Local Government Employees | 17 | 4.0% |
| State Government Employees | 68 | 16.0% |
| Federal Government Employees | 0 | 0.0% |
| Unpaid Family Workers | 0 | 0.0% |
| Total | 425 | 100.0% |
Employment Status by Age in La Playa
According to the labor force statistics for La Playa, out of the total population over 16 years of age (1,326), 34.9% or 463 individuals are in the labor force, with 8.2% or 38 of them unemployed. The age group with the highest labor force participation rate is 25 to 29 years, with 83.5% or 116 individuals in the labor force. Within the labor force, the 55 to 59 years age range has the highest percentage of unemployed individuals, with 100.0% or 8 of them being unemployed.
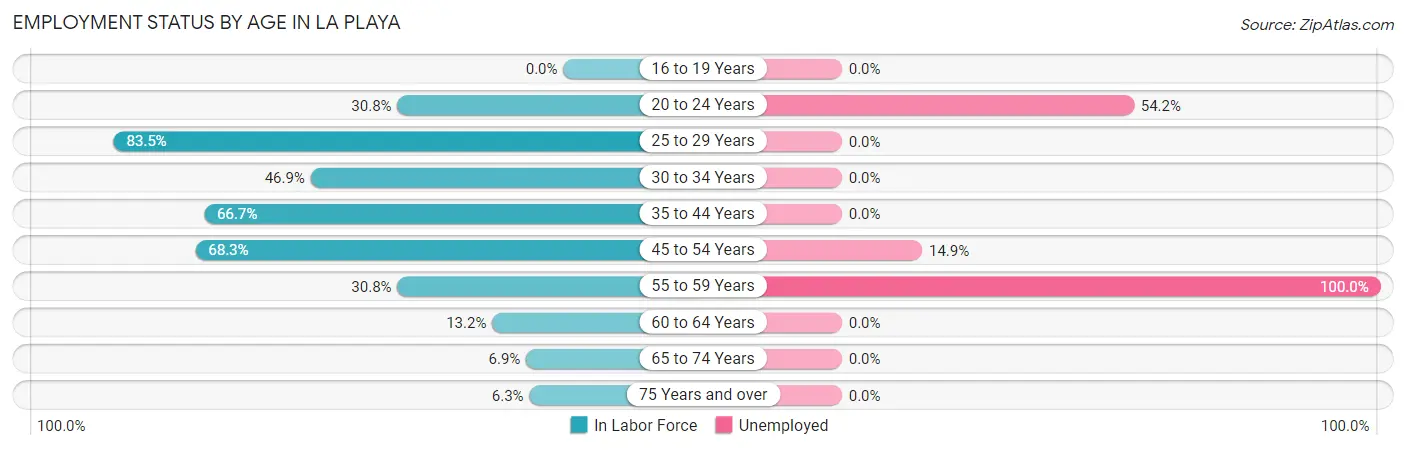
| Age Bracket | In Labor Force | Unemployed |
| 16 to 19 Years | 0 (0.0%) | 0 (0.0%) |
| 20 to 24 Years | 24 (30.8%) | 13 (54.2%) |
| 25 to 29 Years | 116 (83.5%) | 0 (0.0%) |
| 30 to 34 Years | 68 (46.9%) | 0 (0.0%) |
| 35 to 44 Years | 78 (66.7%) | 0 (0.0%) |
| 45 to 54 Years | 114 (68.3%) | 17 (14.9%) |
| 55 to 59 Years | 8 (30.8%) | 8 (100.0%) |
| 60 to 64 Years | 22 (13.2%) | 0 (0.0%) |
| 65 to 74 Years | 25 (6.9%) | 0 (0.0%) |
| 75 Years and over | 8 (6.3%) | 0 (0.0%) |
| Total | 463 (34.9%) | 38 (8.2%) |
Employment Status by Educational Attainment in La Playa
According to labor force statistics for La Playa, 53.4% of individuals (406) out of the total population between 25 and 64 years of age (761) are in the labor force, with 6.2% or 25 of them being unemployed. The group with the highest labor force participation rate are those with the educational attainment of bachelor's degree or higher, with 82.1% or 64 individuals in the labor force. Within the labor force, individuals with less than high school education have the highest percentage of unemployment, with 45.5% or 25 of them being unemployed.
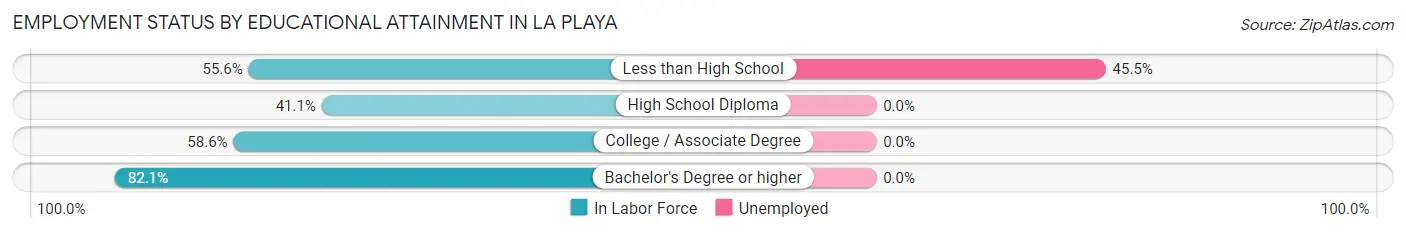
| Educational Attainment | In Labor Force | Unemployed |
| Less than High School | 55 (55.6%) | 45 (45.5%) |
| High School Diploma | 130 (41.1%) | 0 (0.0%) |
| College / Associate Degree | 157 (58.6%) | 0 (0.0%) |
| Bachelor's Degree or higher | 64 (82.1%) | 0 (0.0%) |
| Total | 406 (53.4%) | 47 (6.2%) |
Employment Occupations by Sex in La Playa
Management, Business, Science and Arts Occupations
The most common Management, Business, Science and Arts occupations in La Playa are Health Diagnosing & Treating (60 | 14.1%), Community & Social Service (35 | 8.2%), Education Instruction & Library (35 | 8.2%), and Management (19 | 4.5%).
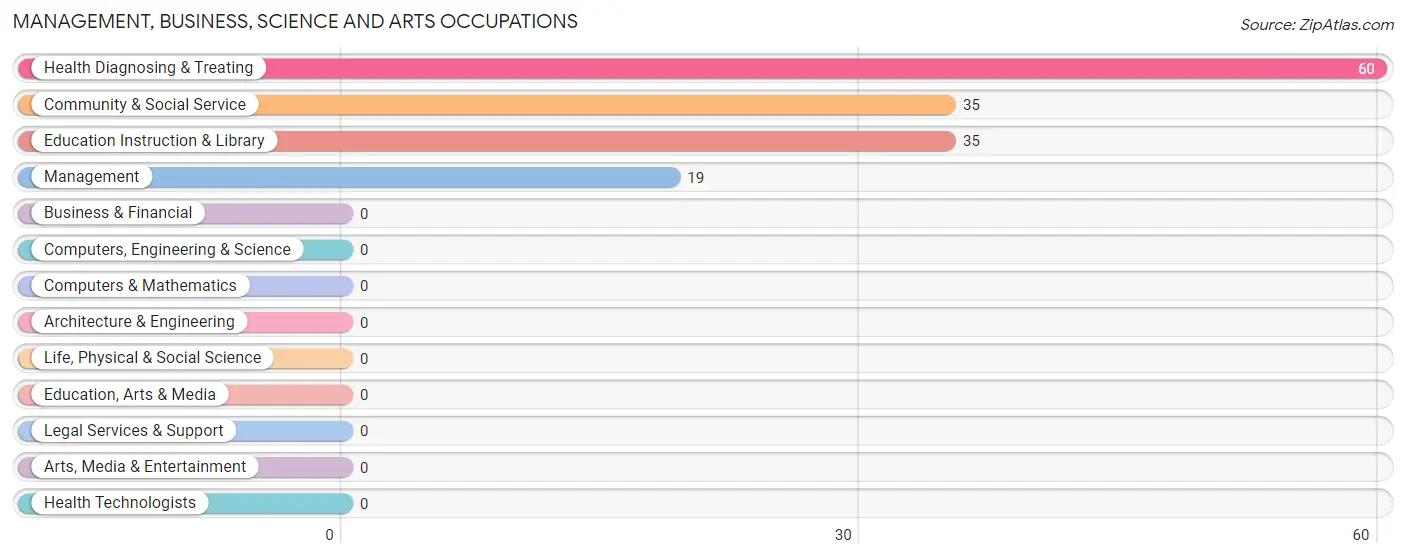
Management, Business, Science and Arts Occupations by Sex
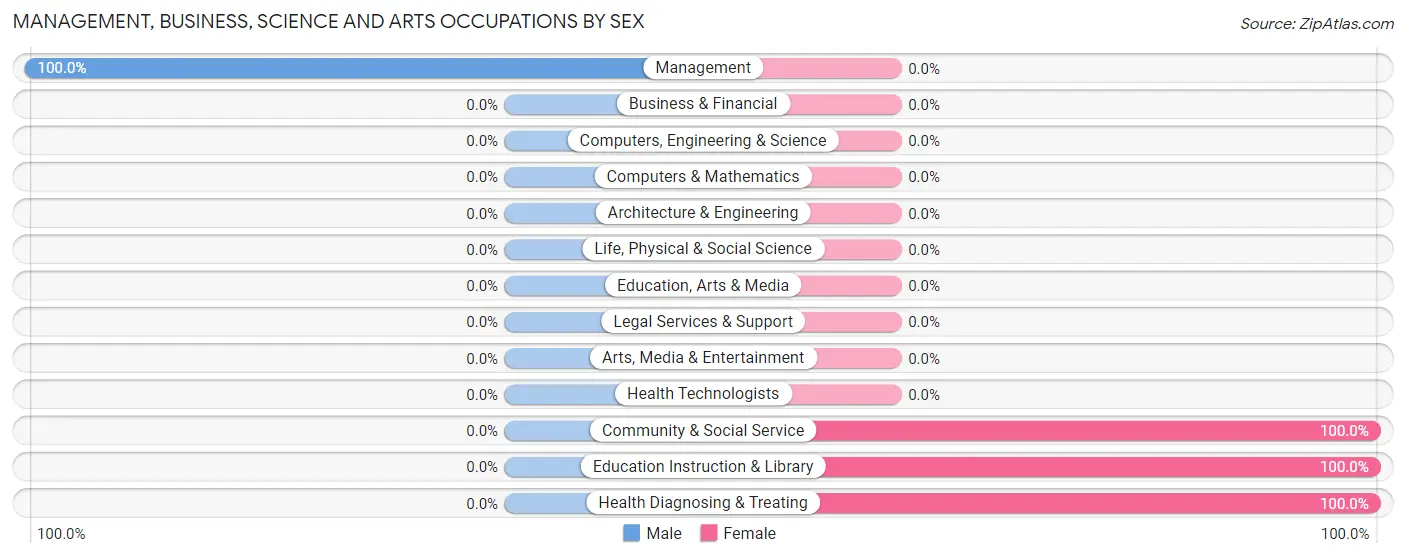
| Occupation | Male | Female |
| Management | 19 (100.0%) | 0 (0.0%) |
| Business & Financial | 0 (0.0%) | 0 (0.0%) |
| Computers, Engineering & Science | 0 (0.0%) | 0 (0.0%) |
| Computers & Mathematics | 0 (0.0%) | 0 (0.0%) |
| Architecture & Engineering | 0 (0.0%) | 0 (0.0%) |
| Life, Physical & Social Science | 0 (0.0%) | 0 (0.0%) |
| Community & Social Service | 0 (0.0%) | 35 (100.0%) |
| Education, Arts & Media | 0 (0.0%) | 0 (0.0%) |
| Legal Services & Support | 0 (0.0%) | 0 (0.0%) |
| Education Instruction & Library | 0 (0.0%) | 35 (100.0%) |
| Arts, Media & Entertainment | 0 (0.0%) | 0 (0.0%) |
| Health Diagnosing & Treating | 0 (0.0%) | 60 (100.0%) |
| Health Technologists | 0 (0.0%) | 0 (0.0%) |
| Total (Category) | 19 (16.7%) | 95 (83.3%) |
| Total (Overall) | 222 (52.2%) | 203 (47.8%) |
Services Occupations
The most common Services occupations in La Playa are Cleaning & Maintenance (46 | 10.8%), and Food Preparation & Serving (33 | 7.8%).
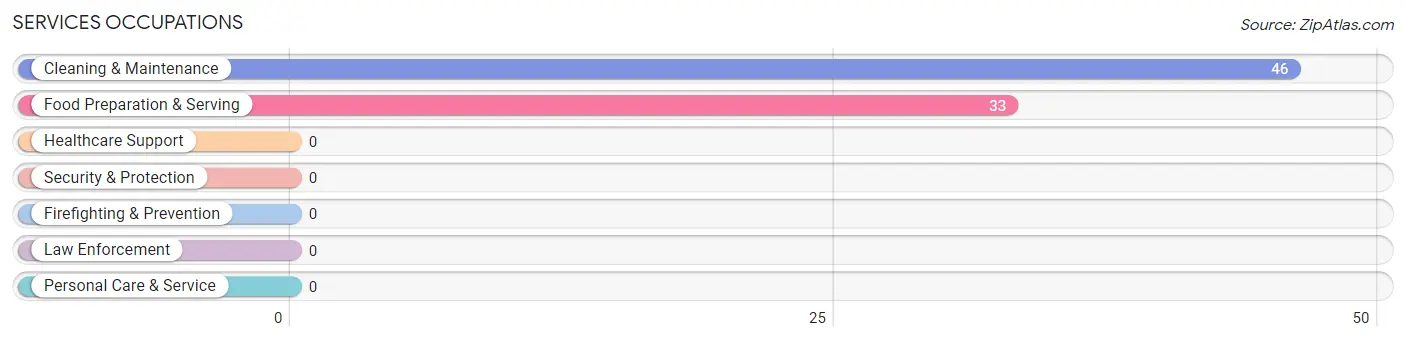
Services Occupations by Sex
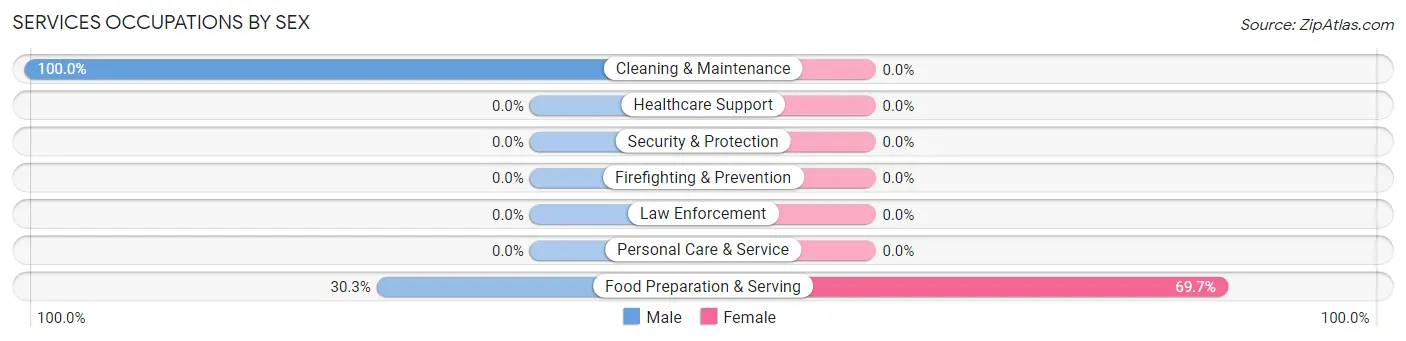
| Occupation | Male | Female |
| Healthcare Support | 0 (0.0%) | 0 (0.0%) |
| Security & Protection | 0 (0.0%) | 0 (0.0%) |
| Firefighting & Prevention | 0 (0.0%) | 0 (0.0%) |
| Law Enforcement | 0 (0.0%) | 0 (0.0%) |
| Food Preparation & Serving | 10 (30.3%) | 23 (69.7%) |
| Cleaning & Maintenance | 46 (100.0%) | 0 (0.0%) |
| Personal Care & Service | 0 (0.0%) | 0 (0.0%) |
| Total (Category) | 56 (70.9%) | 23 (29.1%) |
| Total (Overall) | 222 (52.2%) | 203 (47.8%) |
Sales and Office Occupations
The most common Sales and Office occupations in La Playa are Office & Administration (67 | 15.8%), and Sales & Related (53 | 12.5%).
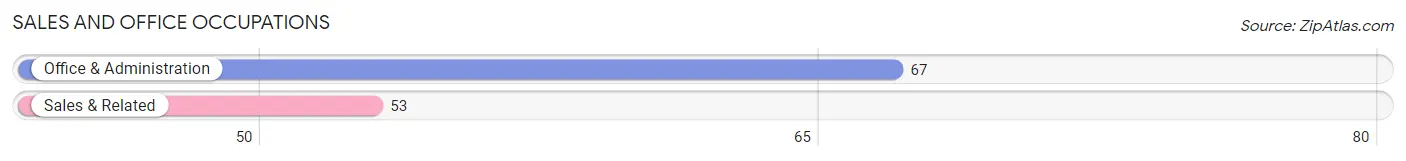
Sales and Office Occupations by Sex
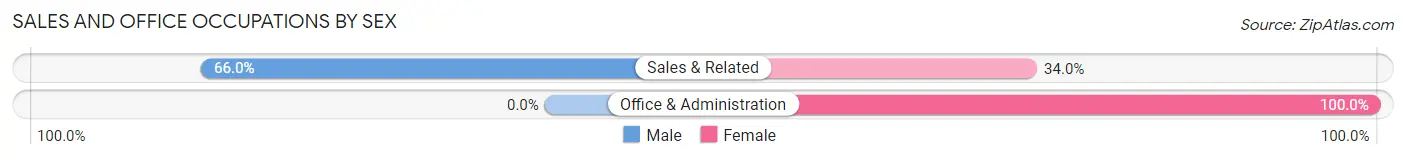
| Occupation | Male | Female |
| Sales & Related | 35 (66.0%) | 18 (34.0%) |
| Office & Administration | 0 (0.0%) | 67 (100.0%) |
| Total (Category) | 35 (29.2%) | 85 (70.8%) |
| Total (Overall) | 222 (52.2%) | 203 (47.8%) |
Natural Resources, Construction and Maintenance Occupations
The most common Natural Resources, Construction and Maintenance occupations in La Playa are , and Installation, Maintenance & Repair (42 | 9.9%).
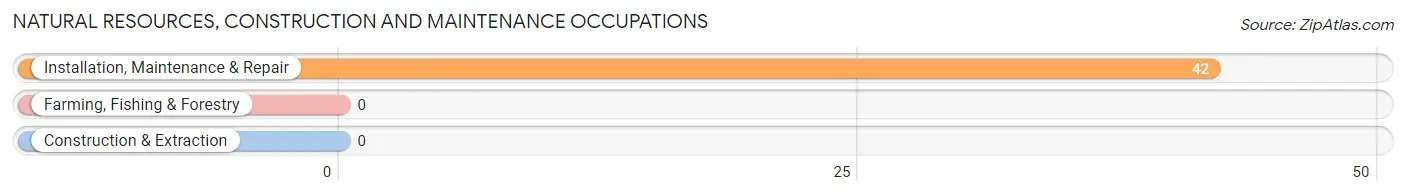
Natural Resources, Construction and Maintenance Occupations by Sex
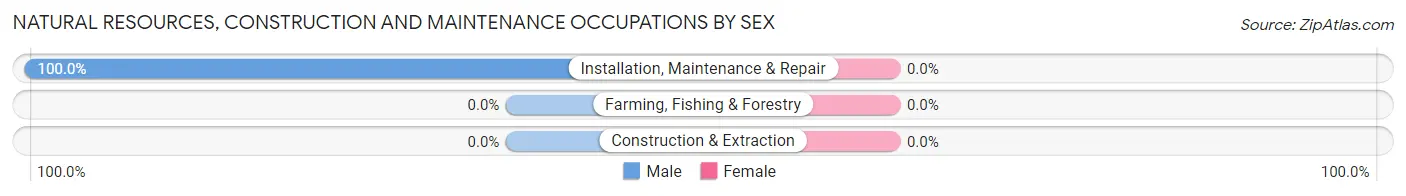
| Occupation | Male | Female |
| Farming, Fishing & Forestry | 0 (0.0%) | 0 (0.0%) |
| Construction & Extraction | 0 (0.0%) | 0 (0.0%) |
| Installation, Maintenance & Repair | 42 (100.0%) | 0 (0.0%) |
| Total (Category) | 42 (100.0%) | 0 (0.0%) |
| Total (Overall) | 222 (52.2%) | 203 (47.8%) |
Production, Transportation and Moving Occupations
The most common Production, Transportation and Moving occupations in La Playa are Material Moving (47 | 11.1%), and Production (23 | 5.4%).
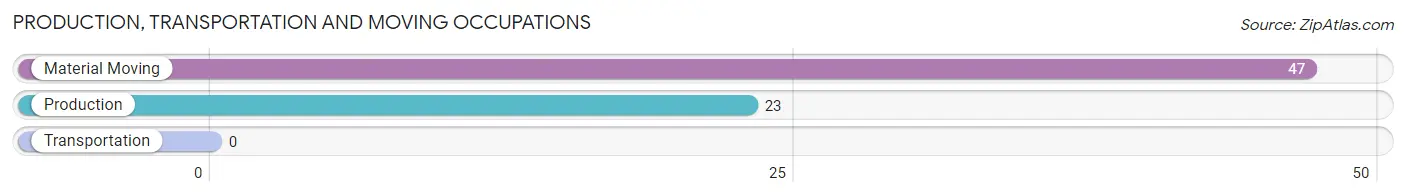
Production, Transportation and Moving Occupations by Sex
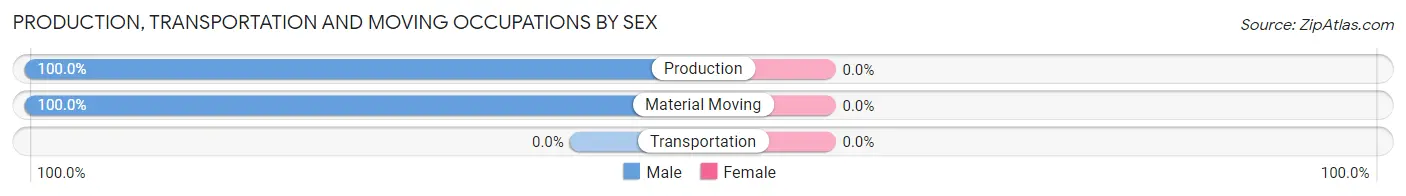
| Occupation | Male | Female |
| Production | 23 (100.0%) | 0 (0.0%) |
| Transportation | 0 (0.0%) | 0 (0.0%) |
| Material Moving | 47 (100.0%) | 0 (0.0%) |
| Total (Category) | 70 (100.0%) | 0 (0.0%) |
| Total (Overall) | 222 (52.2%) | 203 (47.8%) |
Employment Industries by Sex in La Playa
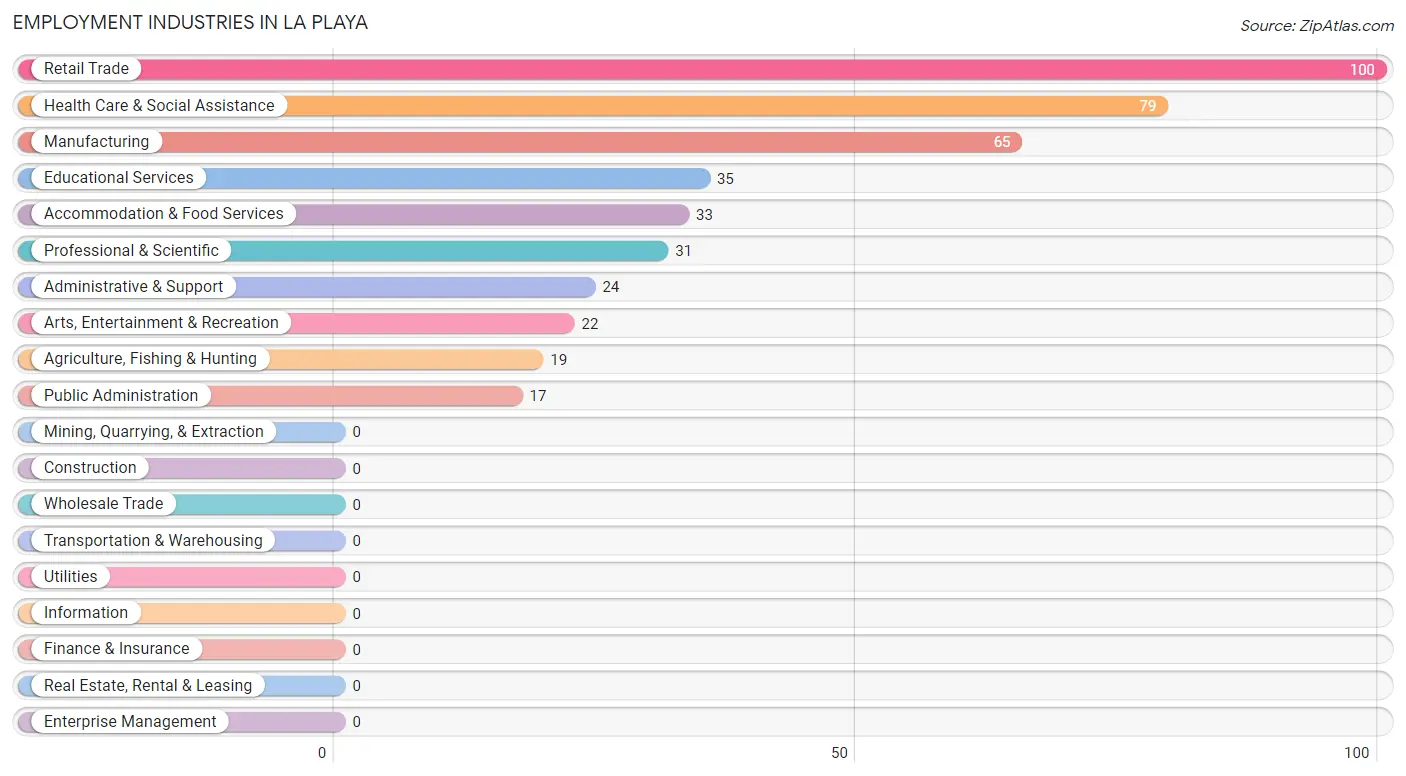
Employment Industries in La Playa
The major employment industries in La Playa include Retail Trade (100 | 23.5%), Health Care & Social Assistance (79 | 18.6%), Manufacturing (65 | 15.3%), Educational Services (35 | 8.2%), and Accommodation & Food Services (33 | 7.8%).
Employment Industries by Sex in La Playa
The La Playa industries that see more men than women are Agriculture, Fishing & Hunting (100.0%), Manufacturing (100.0%), and Administrative & Support (100.0%), whereas the industries that tend to have a higher number of women are Professional & Scientific (100.0%), Educational Services (100.0%), and Health Care & Social Assistance (100.0%).
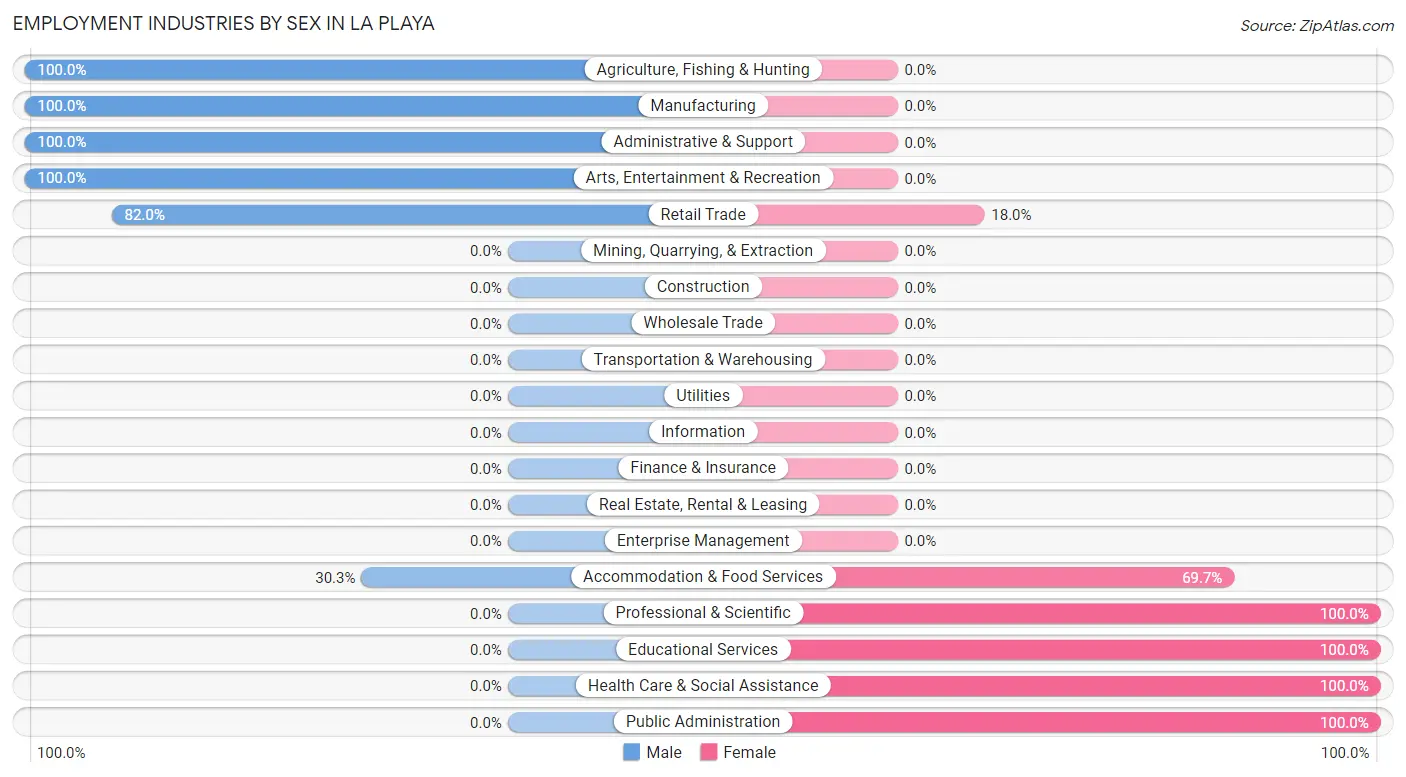
| Industry | Male | Female |
| Agriculture, Fishing & Hunting | 19 (100.0%) | 0 (0.0%) |
| Mining, Quarrying, & Extraction | 0 (0.0%) | 0 (0.0%) |
| Construction | 0 (0.0%) | 0 (0.0%) |
| Manufacturing | 65 (100.0%) | 0 (0.0%) |
| Wholesale Trade | 0 (0.0%) | 0 (0.0%) |
| Retail Trade | 82 (82.0%) | 18 (18.0%) |
| Transportation & Warehousing | 0 (0.0%) | 0 (0.0%) |
| Utilities | 0 (0.0%) | 0 (0.0%) |
| Information | 0 (0.0%) | 0 (0.0%) |
| Finance & Insurance | 0 (0.0%) | 0 (0.0%) |
| Real Estate, Rental & Leasing | 0 (0.0%) | 0 (0.0%) |
| Professional & Scientific | 0 (0.0%) | 31 (100.0%) |
| Enterprise Management | 0 (0.0%) | 0 (0.0%) |
| Administrative & Support | 24 (100.0%) | 0 (0.0%) |
| Educational Services | 0 (0.0%) | 35 (100.0%) |
| Health Care & Social Assistance | 0 (0.0%) | 79 (100.0%) |
| Arts, Entertainment & Recreation | 22 (100.0%) | 0 (0.0%) |
| Accommodation & Food Services | 10 (30.3%) | 23 (69.7%) |
| Public Administration | 0 (0.0%) | 17 (100.0%) |
| Total | 222 (52.2%) | 203 (47.8%) |
Education in La Playa
School Enrollment in La Playa
The most common levels of schooling among the 305 students in La Playa are high school (78 | 25.6%), middle school (66 | 21.6%), and elementary school (61 | 20.0%).
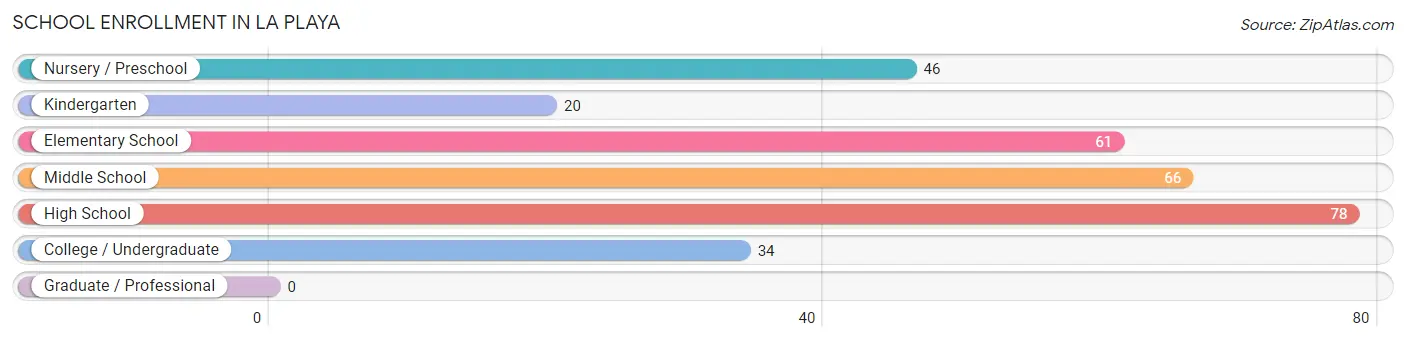
| School Level | # Students | % Students |
| Nursery / Preschool | 46 | 15.1% |
| Kindergarten | 20 | 6.6% |
| Elementary School | 61 | 20.0% |
| Middle School | 66 | 21.6% |
| High School | 78 | 25.6% |
| College / Undergraduate | 34 | 11.2% |
| Graduate / Professional | 0 | 0.0% |
| Total | 305 | 100.0% |
School Enrollment by Age by Funding Source in La Playa
Out of a total of 305 students who are enrolled in schools in La Playa, 35 (11.5%) attend a private institution, while the remaining 270 (88.5%) are enrolled in public schools. The age group of 3 to 4 year olds has the highest likelihood of being enrolled in private schools, with 23 (100.0% in the age bracket) enrolled. Conversely, the age group of 5 to 9 year old has the lowest likelihood of being enrolled in a private school, with 104 (100.0% in the age bracket) attending a public institution.
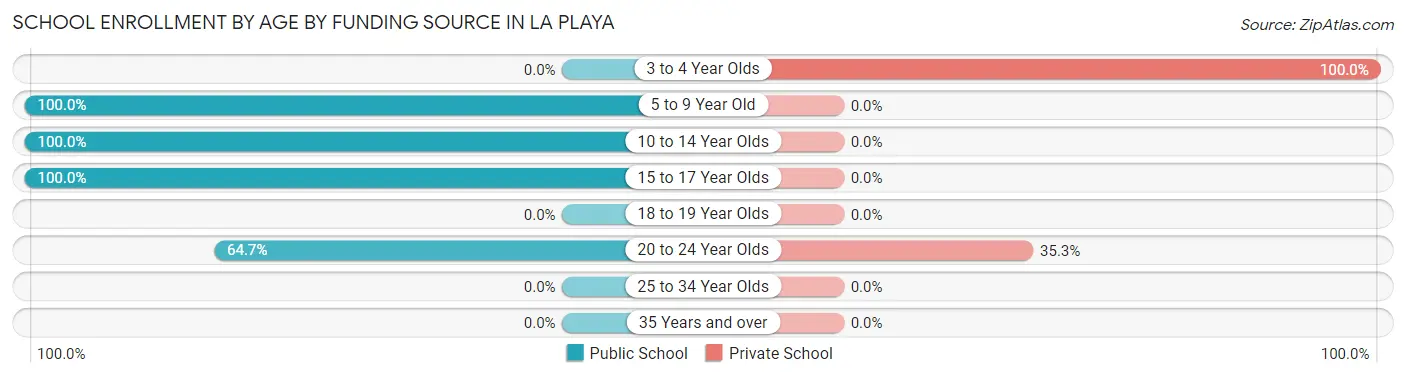
| Age Bracket | Public School | Private School |
| 3 to 4 Year Olds | 0 (0.0%) | 23 (100.0%) |
| 5 to 9 Year Old | 104 (100.0%) | 0 (0.0%) |
| 10 to 14 Year Olds | 66 (100.0%) | 0 (0.0%) |
| 15 to 17 Year Olds | 78 (100.0%) | 0 (0.0%) |
| 18 to 19 Year Olds | 0 (0.0%) | 0 (0.0%) |
| 20 to 24 Year Olds | 22 (64.7%) | 12 (35.3%) |
| 25 to 34 Year Olds | 0 (0.0%) | 0 (0.0%) |
| 35 Years and over | 0 (0.0%) | 0 (0.0%) |
| Total | 270 (88.5%) | 35 (11.5%) |
Educational Attainment by Field of Study in La Playa
Business (44 | 36.7%), arts & humanities (28 | 23.3%), psychology (19 | 15.8%), education (17 | 14.2%), and literature & languages (12 | 10.0%) are the most common fields of study among 120 individuals in La Playa who have obtained a bachelor's degree or higher.
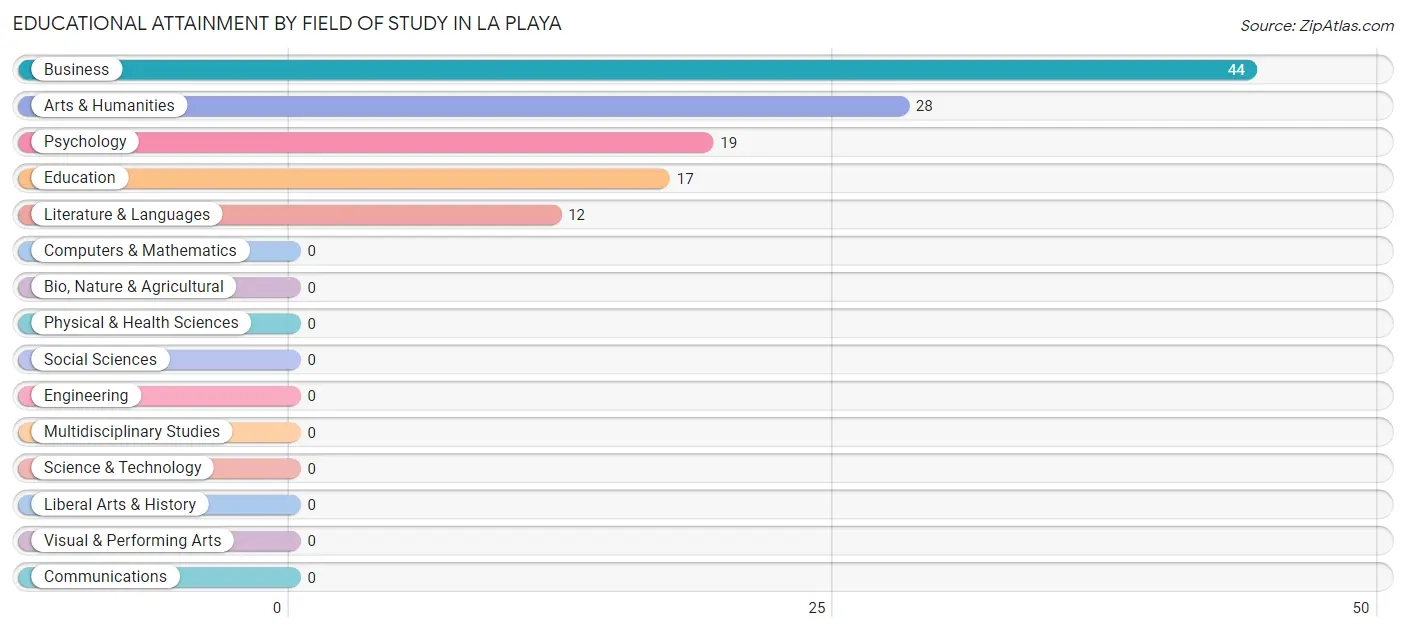
| Field of Study | # Graduates | % Graduates |
| Computers & Mathematics | 0 | 0.0% |
| Bio, Nature & Agricultural | 0 | 0.0% |
| Physical & Health Sciences | 0 | 0.0% |
| Psychology | 19 | 15.8% |
| Social Sciences | 0 | 0.0% |
| Engineering | 0 | 0.0% |
| Multidisciplinary Studies | 0 | 0.0% |
| Science & Technology | 0 | 0.0% |
| Business | 44 | 36.7% |
| Education | 17 | 14.2% |
| Literature & Languages | 12 | 10.0% |
| Liberal Arts & History | 0 | 0.0% |
| Visual & Performing Arts | 0 | 0.0% |
| Communications | 0 | 0.0% |
| Arts & Humanities | 28 | 23.3% |
| Total | 120 | 100.0% |
Transportation & Commute in La Playa
Vehicle Availability by Sex in La Playa
The most prevalent vehicle ownership categories in La Playa are males with 2 vehicles (87, accounting for 39.2%) and females with 2 vehicles (41, making up 42.9%).
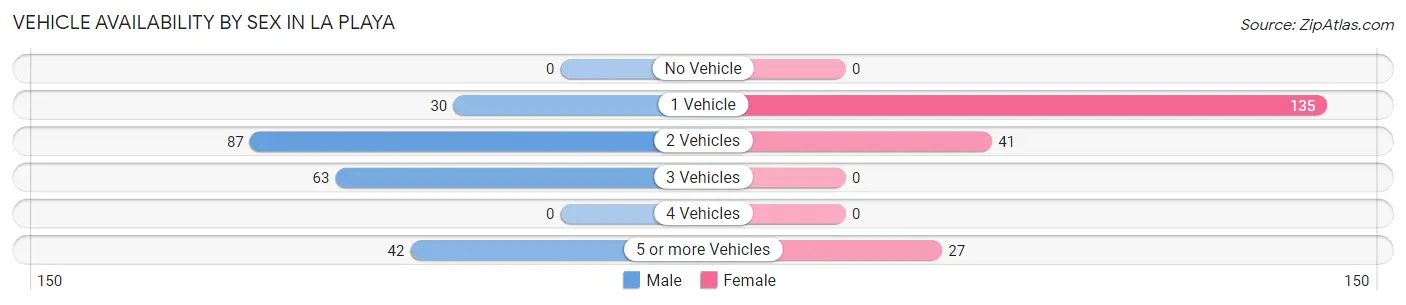
| Vehicles Available | Male | Female |
| No Vehicle | 0 (0.0%) | 0 (0.0%) |
| 1 Vehicle | 30 (13.5%) | 135 (66.5%) |
| 2 Vehicles | 87 (39.2%) | 41 (20.2%) |
| 3 Vehicles | 63 (28.4%) | 0 (0.0%) |
| 4 Vehicles | 0 (0.0%) | 0 (0.0%) |
| 5 or more Vehicles | 42 (18.9%) | 27 (13.3%) |
| Total | 222 (100.0%) | 203 (100.0%) |
Commute Time in La Playa
The most frequently occuring commute durations in La Playa are 5 to 9 minutes (157 commuters, 36.9%), 10 to 14 minutes (78 commuters, 18.3%), and 25 to 29 minutes (69 commuters, 16.2%).
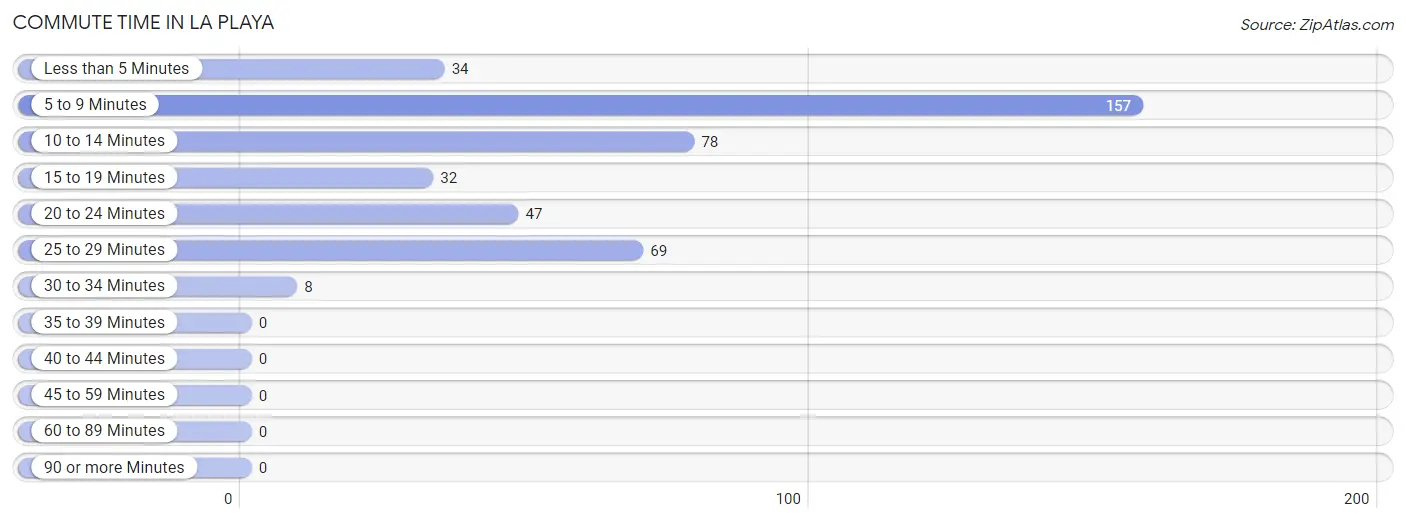
| Commute Time | # Commuters | % Commuters |
| Less than 5 Minutes | 34 | 8.0% |
| 5 to 9 Minutes | 157 | 36.9% |
| 10 to 14 Minutes | 78 | 18.3% |
| 15 to 19 Minutes | 32 | 7.5% |
| 20 to 24 Minutes | 47 | 11.1% |
| 25 to 29 Minutes | 69 | 16.2% |
| 30 to 34 Minutes | 8 | 1.9% |
| 35 to 39 Minutes | 0 | 0.0% |
| 40 to 44 Minutes | 0 | 0.0% |
| 45 to 59 Minutes | 0 | 0.0% |
| 60 to 89 Minutes | 0 | 0.0% |
| 90 or more Minutes | 0 | 0.0% |
Commute Time by Sex in La Playa
The most common commute times in La Playa are 5 to 9 minutes (97 commuters, 43.7%) for males and 5 to 9 minutes (60 commuters, 29.6%) for females.
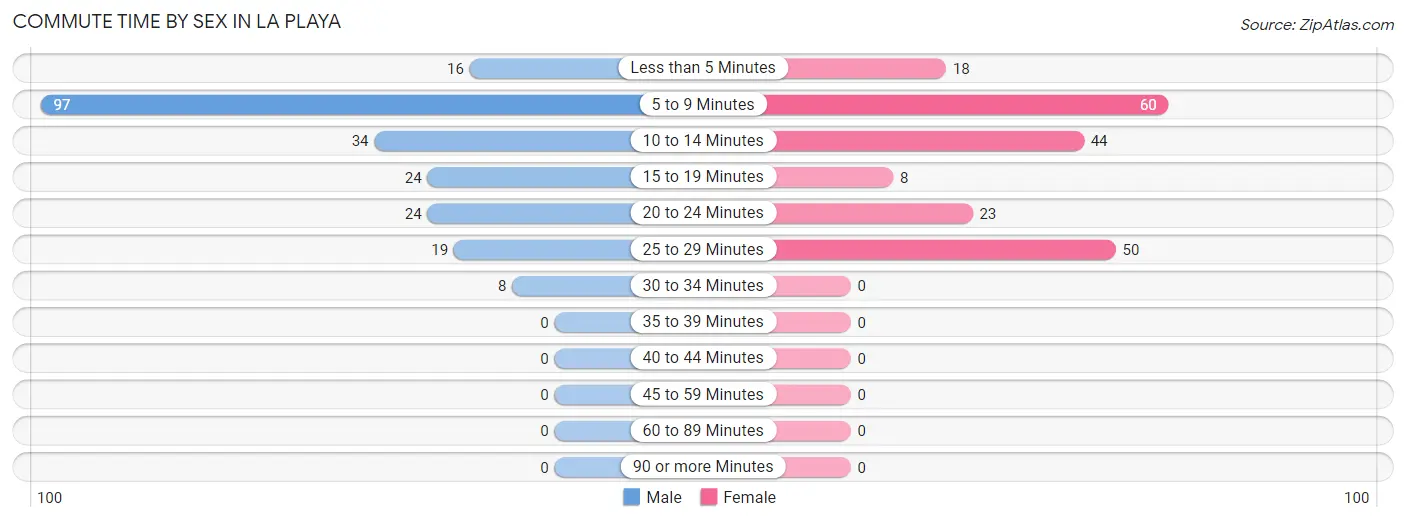
| Commute Time | Male | Female |
| Less than 5 Minutes | 16 (7.2%) | 18 (8.9%) |
| 5 to 9 Minutes | 97 (43.7%) | 60 (29.6%) |
| 10 to 14 Minutes | 34 (15.3%) | 44 (21.7%) |
| 15 to 19 Minutes | 24 (10.8%) | 8 (3.9%) |
| 20 to 24 Minutes | 24 (10.8%) | 23 (11.3%) |
| 25 to 29 Minutes | 19 (8.6%) | 50 (24.6%) |
| 30 to 34 Minutes | 8 (3.6%) | 0 (0.0%) |
| 35 to 39 Minutes | 0 (0.0%) | 0 (0.0%) |
| 40 to 44 Minutes | 0 (0.0%) | 0 (0.0%) |
| 45 to 59 Minutes | 0 (0.0%) | 0 (0.0%) |
| 60 to 89 Minutes | 0 (0.0%) | 0 (0.0%) |
| 90 or more Minutes | 0 (0.0%) | 0 (0.0%) |
Time of Departure to Work by Sex in La Playa
The most frequent times of departure to work in La Playa are 7:30 AM to 7:59 AM (63, 28.4%) for males and 7:00 AM to 7:29 AM (60, 29.6%) for females.
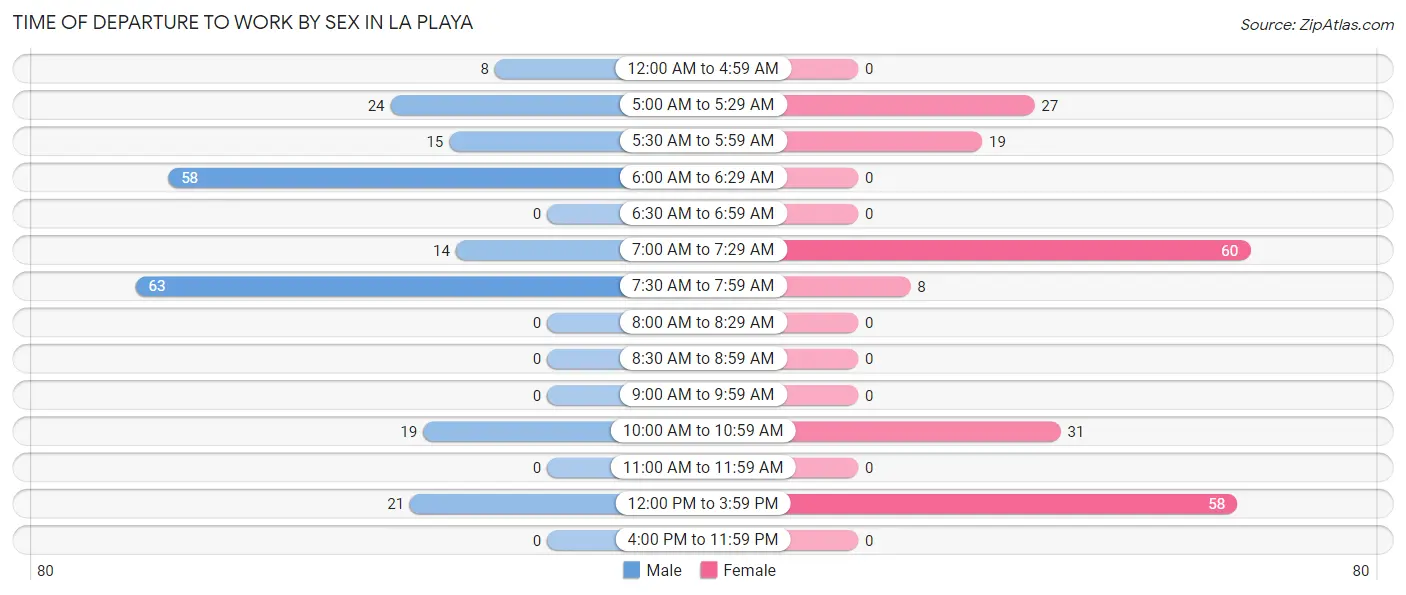
| Time of Departure | Male | Female |
| 12:00 AM to 4:59 AM | 8 (3.6%) | 0 (0.0%) |
| 5:00 AM to 5:29 AM | 24 (10.8%) | 27 (13.3%) |
| 5:30 AM to 5:59 AM | 15 (6.8%) | 19 (9.4%) |
| 6:00 AM to 6:29 AM | 58 (26.1%) | 0 (0.0%) |
| 6:30 AM to 6:59 AM | 0 (0.0%) | 0 (0.0%) |
| 7:00 AM to 7:29 AM | 14 (6.3%) | 60 (29.6%) |
| 7:30 AM to 7:59 AM | 63 (28.4%) | 8 (3.9%) |
| 8:00 AM to 8:29 AM | 0 (0.0%) | 0 (0.0%) |
| 8:30 AM to 8:59 AM | 0 (0.0%) | 0 (0.0%) |
| 9:00 AM to 9:59 AM | 0 (0.0%) | 0 (0.0%) |
| 10:00 AM to 10:59 AM | 19 (8.6%) | 31 (15.3%) |
| 11:00 AM to 11:59 AM | 0 (0.0%) | 0 (0.0%) |
| 12:00 PM to 3:59 PM | 21 (9.5%) | 58 (28.6%) |
| 4:00 PM to 11:59 PM | 0 (0.0%) | 0 (0.0%) |
| Total | 222 (100.0%) | 203 (100.0%) |
Housing Occupancy in La Playa
Occupancy by Ownership in La Playa
Of the total 538 dwellings in La Playa, owner-occupied units account for 375 (69.7%), while renter-occupied units make up 163 (30.3%).
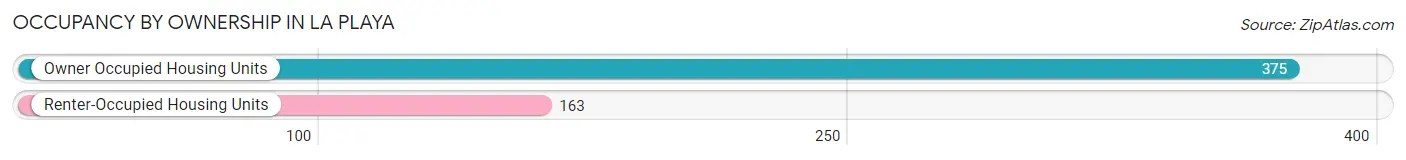
| Occupancy | # Housing Units | % Housing Units |
| Owner Occupied Housing Units | 375 | 69.7% |
| Renter-Occupied Housing Units | 163 | 30.3% |
| Total Occupied Housing Units | 538 | 100.0% |
Occupancy by Household Size in La Playa
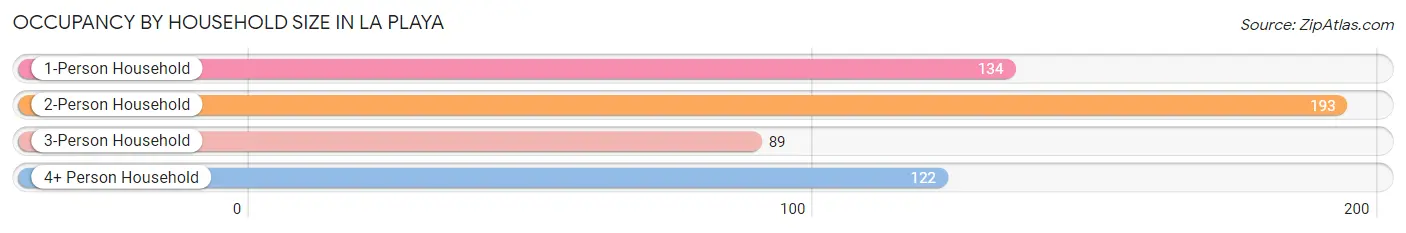
| Household Size | # Housing Units | % Housing Units |
| 1-Person Household | 134 | 24.9% |
| 2-Person Household | 193 | 35.9% |
| 3-Person Household | 89 | 16.5% |
| 4+ Person Household | 122 | 22.7% |
| Total Housing Units | 538 | 100.0% |
Occupancy by Ownership by Household Size in La Playa
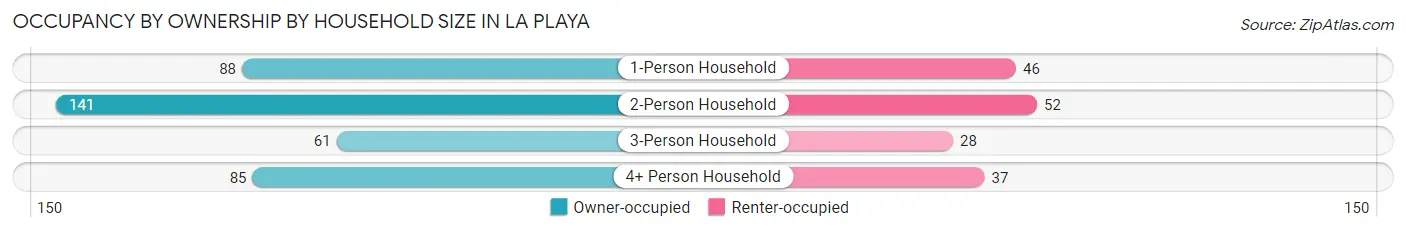
| Household Size | Owner-occupied | Renter-occupied |
| 1-Person Household | 88 (65.7%) | 46 (34.3%) |
| 2-Person Household | 141 (73.1%) | 52 (26.9%) |
| 3-Person Household | 61 (68.5%) | 28 (31.5%) |
| 4+ Person Household | 85 (69.7%) | 37 (30.3%) |
| Total Housing Units | 375 (69.7%) | 163 (30.3%) |
Occupancy by Educational Attainment in La Playa
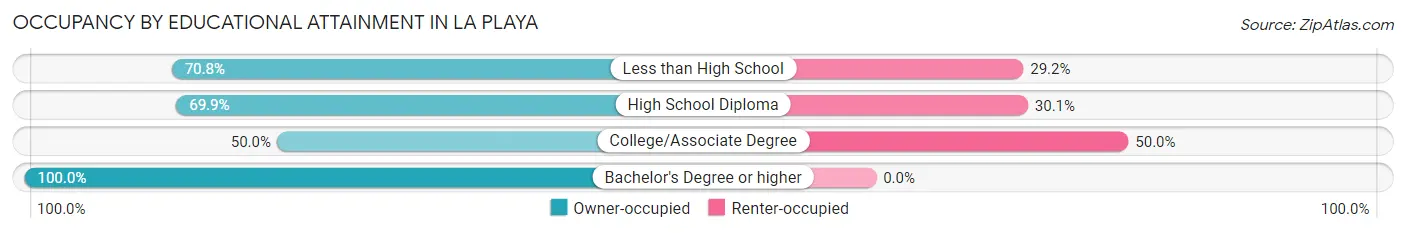
| Household Size | Owner-occupied | Renter-occupied |
| Less than High School | 119 (70.8%) | 49 (29.2%) |
| High School Diploma | 172 (69.9%) | 74 (30.1%) |
| College/Associate Degree | 40 (50.0%) | 40 (50.0%) |
| Bachelor's Degree or higher | 44 (100.0%) | 0 (0.0%) |
Occupancy by Age of Householder in La Playa
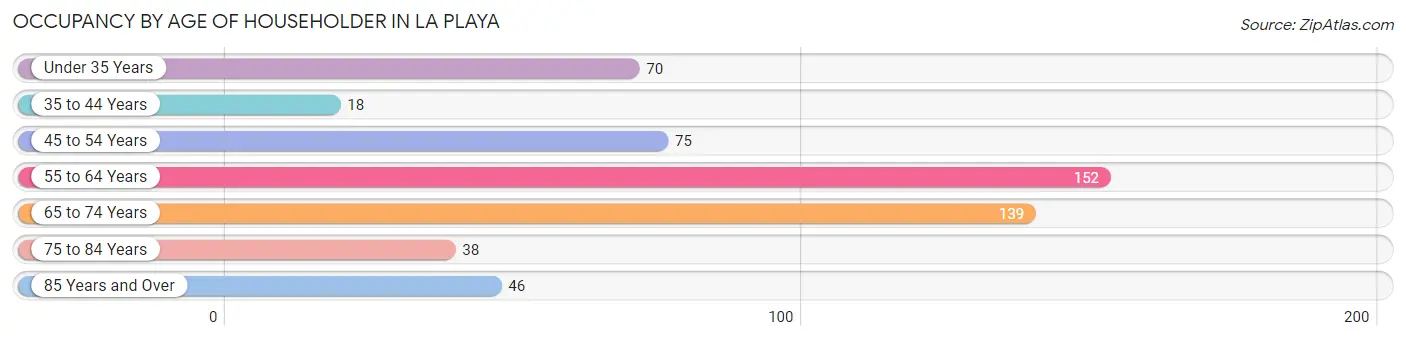
| Age Bracket | # Households | % Households |
| Under 35 Years | 70 | 13.0% |
| 35 to 44 Years | 18 | 3.4% |
| 45 to 54 Years | 75 | 13.9% |
| 55 to 64 Years | 152 | 28.2% |
| 65 to 74 Years | 139 | 25.8% |
| 75 to 84 Years | 38 | 7.1% |
| 85 Years and Over | 46 | 8.6% |
| Total | 538 | 100.0% |
Housing Finances in La Playa
Median Income by Occupancy in La Playa
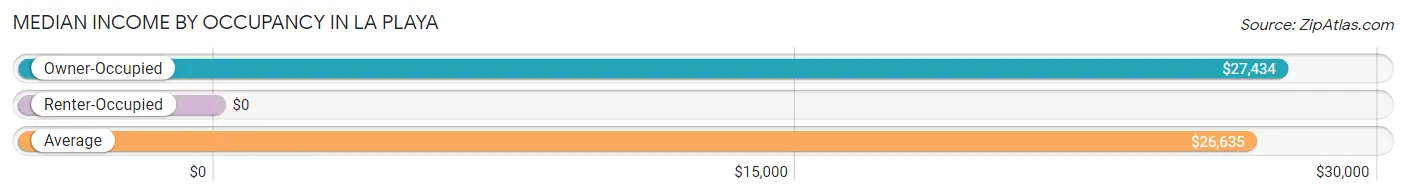
| Occupancy Type | # Households | Median Income |
| Owner-Occupied | 375 (69.7%) | $27,434 |
| Renter-Occupied | 163 (30.3%) | $0 |
| Average | 538 (100.0%) | $26,635 |
Occupancy by Householder Income Bracket in La Playa
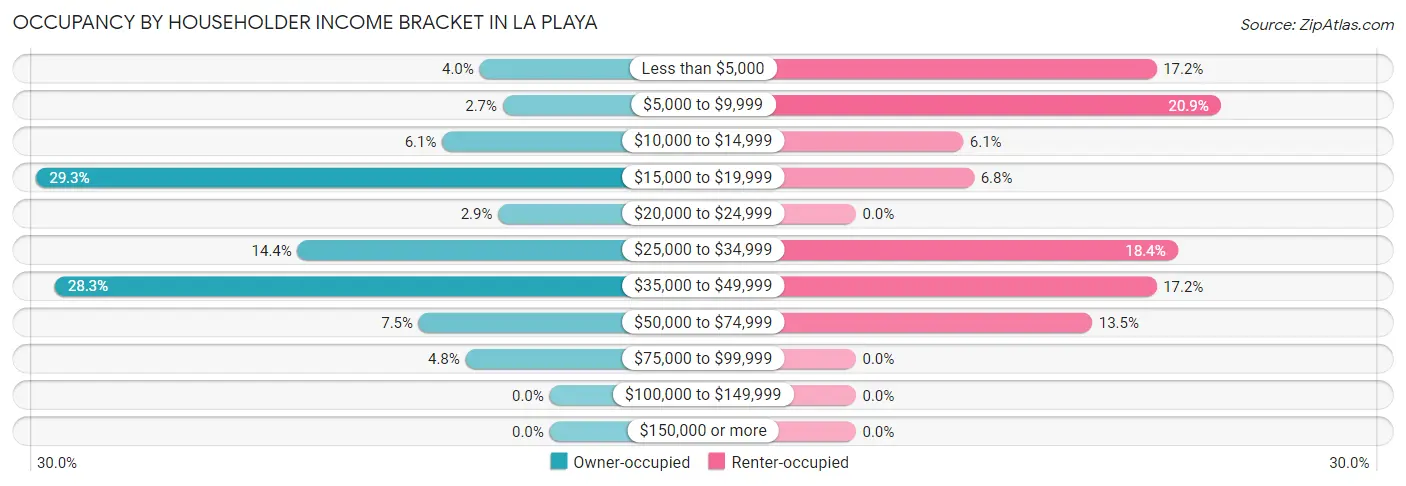
| Income Bracket | Owner-occupied | Renter-occupied |
| Less than $5,000 | 15 (4.0%) | 28 (17.2%) |
| $5,000 to $9,999 | 10 (2.7%) | 34 (20.9%) |
| $10,000 to $14,999 | 23 (6.1%) | 10 (6.1%) |
| $15,000 to $19,999 | 110 (29.3%) | 11 (6.8%) |
| $20,000 to $24,999 | 11 (2.9%) | 0 (0.0%) |
| $25,000 to $34,999 | 54 (14.4%) | 30 (18.4%) |
| $35,000 to $49,999 | 106 (28.3%) | 28 (17.2%) |
| $50,000 to $74,999 | 28 (7.5%) | 22 (13.5%) |
| $75,000 to $99,999 | 18 (4.8%) | 0 (0.0%) |
| $100,000 to $149,999 | 0 (0.0%) | 0 (0.0%) |
| $150,000 or more | 0 (0.0%) | 0 (0.0%) |
| Total | 375 (100.0%) | 163 (100.0%) |
Monthly Housing Cost Tiers in La Playa
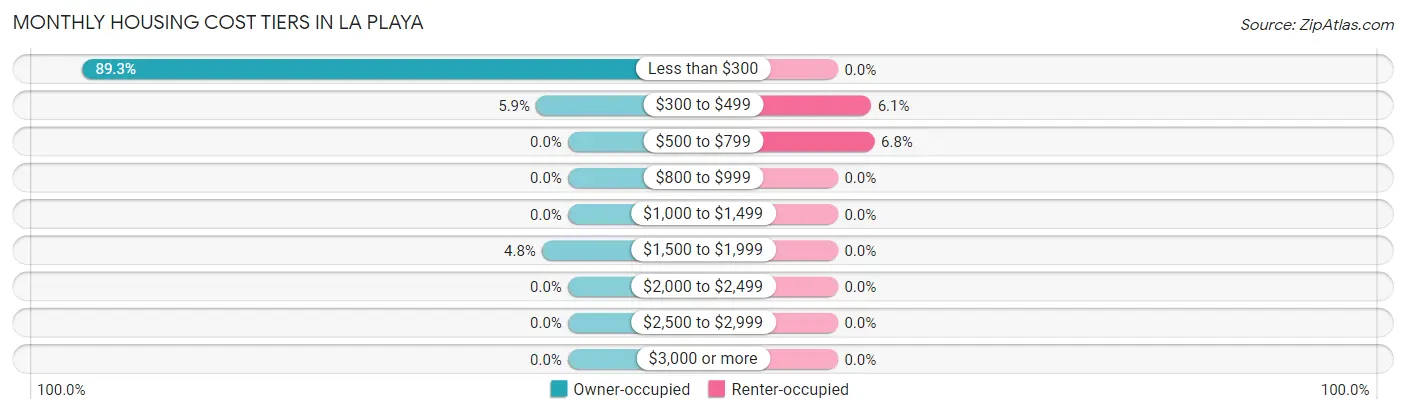
| Monthly Cost | Owner-occupied | Renter-occupied |
| Less than $300 | 335 (89.3%) | 0 (0.0%) |
| $300 to $499 | 22 (5.9%) | 10 (6.1%) |
| $500 to $799 | 0 (0.0%) | 11 (6.8%) |
| $800 to $999 | 0 (0.0%) | 0 (0.0%) |
| $1,000 to $1,499 | 0 (0.0%) | 0 (0.0%) |
| $1,500 to $1,999 | 18 (4.8%) | 0 (0.0%) |
| $2,000 to $2,499 | 0 (0.0%) | 0 (0.0%) |
| $2,500 to $2,999 | 0 (0.0%) | 0 (0.0%) |
| $3,000 or more | 0 (0.0%) | 0 (0.0%) |
| Total | 375 (100.0%) | 163 (100.0%) |
Physical Housing Characteristics in La Playa
Housing Structures in La Playa
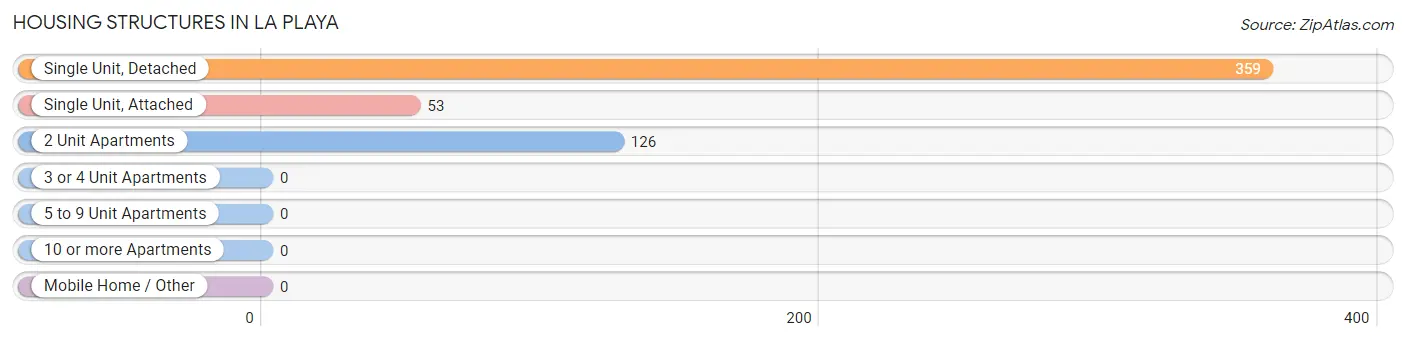
| Structure Type | # Housing Units | % Housing Units |
| Single Unit, Detached | 359 | 66.7% |
| Single Unit, Attached | 53 | 9.9% |
| 2 Unit Apartments | 126 | 23.4% |
| 3 or 4 Unit Apartments | 0 | 0.0% |
| 5 to 9 Unit Apartments | 0 | 0.0% |
| 10 or more Apartments | 0 | 0.0% |
| Mobile Home / Other | 0 | 0.0% |
| Total | 538 | 100.0% |
Housing Structures by Occupancy in La Playa
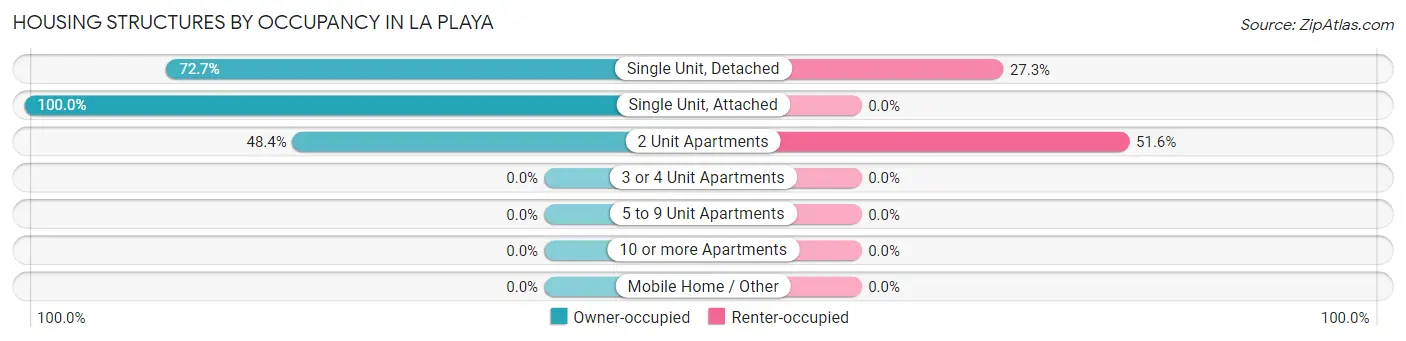
| Structure Type | Owner-occupied | Renter-occupied |
| Single Unit, Detached | 261 (72.7%) | 98 (27.3%) |
| Single Unit, Attached | 53 (100.0%) | 0 (0.0%) |
| 2 Unit Apartments | 61 (48.4%) | 65 (51.6%) |
| 3 or 4 Unit Apartments | 0 (0.0%) | 0 (0.0%) |
| 5 to 9 Unit Apartments | 0 (0.0%) | 0 (0.0%) |
| 10 or more Apartments | 0 (0.0%) | 0 (0.0%) |
| Mobile Home / Other | 0 (0.0%) | 0 (0.0%) |
| Total | 375 (69.7%) | 163 (30.3%) |
Housing Structures by Number of Rooms in La Playa
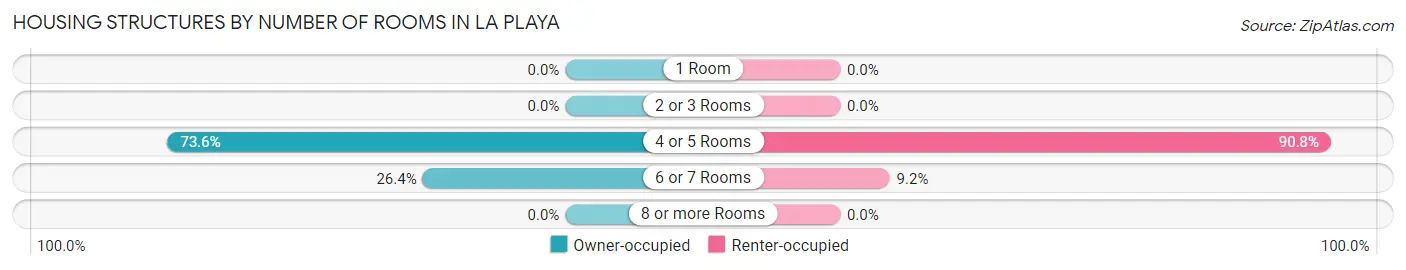
| Number of Rooms | Owner-occupied | Renter-occupied |
| 1 Room | 0 (0.0%) | 0 (0.0%) |
| 2 or 3 Rooms | 0 (0.0%) | 0 (0.0%) |
| 4 or 5 Rooms | 276 (73.6%) | 148 (90.8%) |
| 6 or 7 Rooms | 99 (26.4%) | 15 (9.2%) |
| 8 or more Rooms | 0 (0.0%) | 0 (0.0%) |
| Total | 375 (100.0%) | 163 (100.0%) |
Housing Structure by Heating Type in La Playa
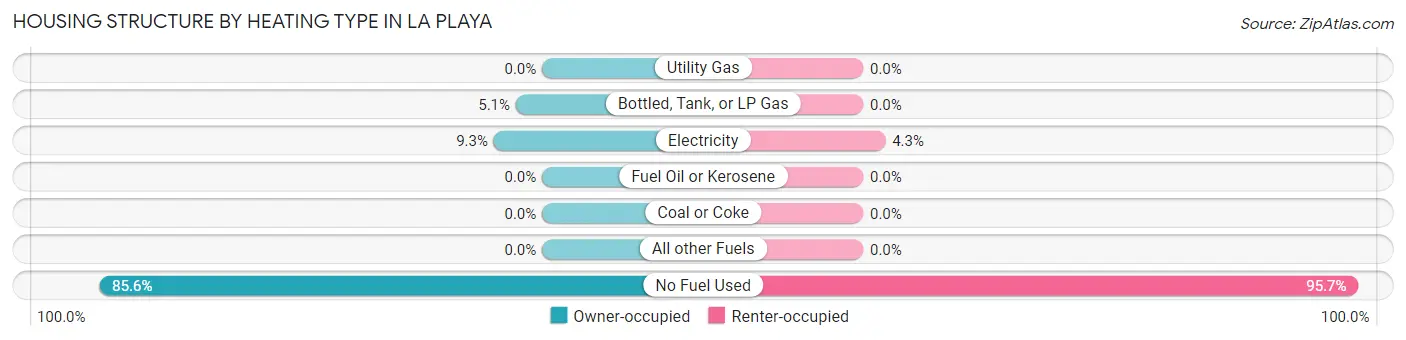
| Heating Type | Owner-occupied | Renter-occupied |
| Utility Gas | 0 (0.0%) | 0 (0.0%) |
| Bottled, Tank, or LP Gas | 19 (5.1%) | 0 (0.0%) |
| Electricity | 35 (9.3%) | 7 (4.3%) |
| Fuel Oil or Kerosene | 0 (0.0%) | 0 (0.0%) |
| Coal or Coke | 0 (0.0%) | 0 (0.0%) |
| All other Fuels | 0 (0.0%) | 0 (0.0%) |
| No Fuel Used | 321 (85.6%) | 156 (95.7%) |
| Total | 375 (100.0%) | 163 (100.0%) |
Household Vehicle Usage in La Playa
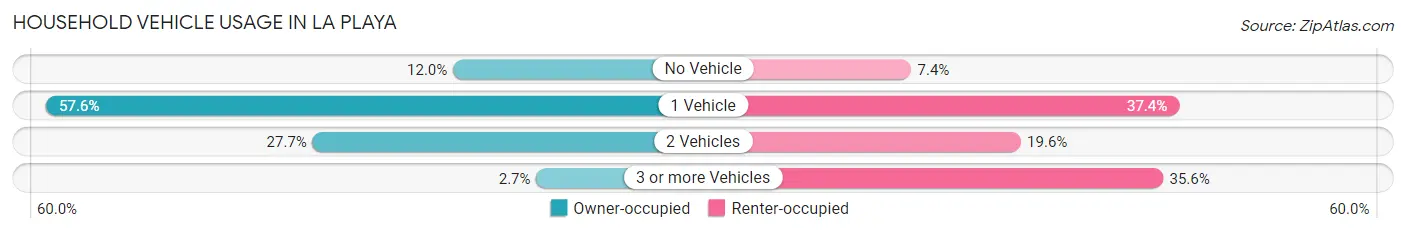
| Vehicles per Household | Owner-occupied | Renter-occupied |
| No Vehicle | 45 (12.0%) | 12 (7.4%) |
| 1 Vehicle | 216 (57.6%) | 61 (37.4%) |
| 2 Vehicles | 104 (27.7%) | 32 (19.6%) |
| 3 or more Vehicles | 10 (2.7%) | 58 (35.6%) |
| Total | 375 (100.0%) | 163 (100.0%) |
Real Estate & Mortgages in La Playa
Real Estate and Mortgage Overview in La Playa
| Characteristic | Without Mortgage | With Mortgage |
| Housing Units | 335 | 40 |
| Median Property Value | $90,600 | $0 |
| Median Household Income | $22,159 | $0 |
| Monthly Housing Costs | $138 | $0 |
| Real Estate Taxes | $228 | $40 |
Property Value by Mortgage Status in La Playa
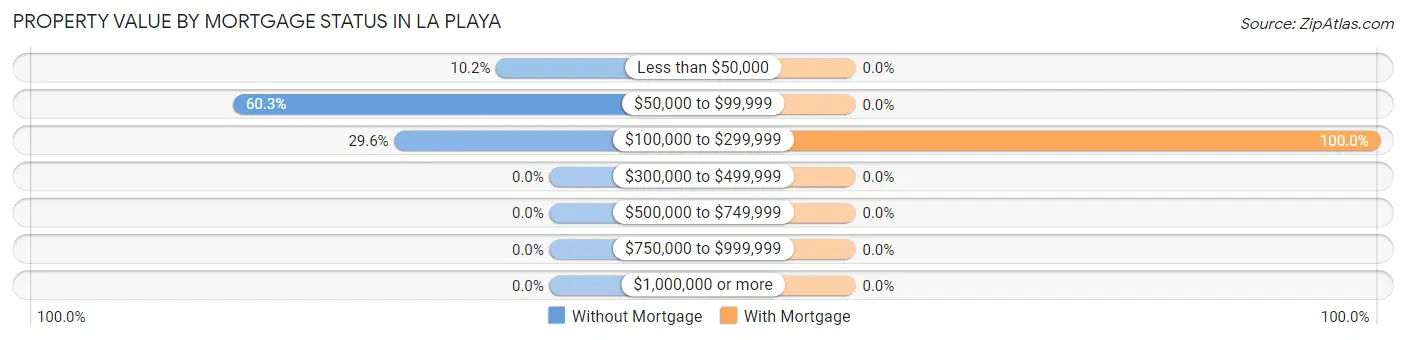
| Property Value | Without Mortgage | With Mortgage |
| Less than $50,000 | 34 (10.2%) | 0 (0.0%) |
| $50,000 to $99,999 | 202 (60.3%) | 0 (0.0%) |
| $100,000 to $299,999 | 99 (29.5%) | 40 (100.0%) |
| $300,000 to $499,999 | 0 (0.0%) | 0 (0.0%) |
| $500,000 to $749,999 | 0 (0.0%) | 0 (0.0%) |
| $750,000 to $999,999 | 0 (0.0%) | 0 (0.0%) |
| $1,000,000 or more | 0 (0.0%) | 0 (0.0%) |
| Total | 335 (100.0%) | 40 (100.0%) |
Household Income by Mortgage Status in La Playa
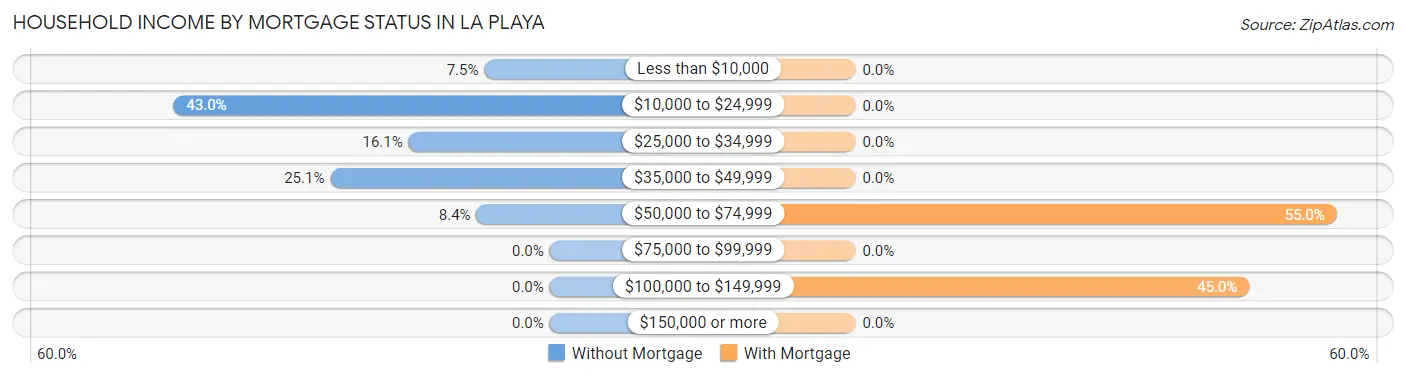
| Household Income | Without Mortgage | With Mortgage |
| Less than $10,000 | 25 (7.5%) | 0 (0.0%) |
| $10,000 to $24,999 | 144 (43.0%) | 0 (0.0%) |
| $25,000 to $34,999 | 54 (16.1%) | 0 (0.0%) |
| $35,000 to $49,999 | 84 (25.1%) | 0 (0.0%) |
| $50,000 to $74,999 | 28 (8.4%) | 22 (55.0%) |
| $75,000 to $99,999 | 0 (0.0%) | 0 (0.0%) |
| $100,000 to $149,999 | 0 (0.0%) | 18 (45.0%) |
| $150,000 or more | 0 (0.0%) | 0 (0.0%) |
| Total | 335 (100.0%) | 40 (100.0%) |
Property Value to Household Income Ratio in La Playa
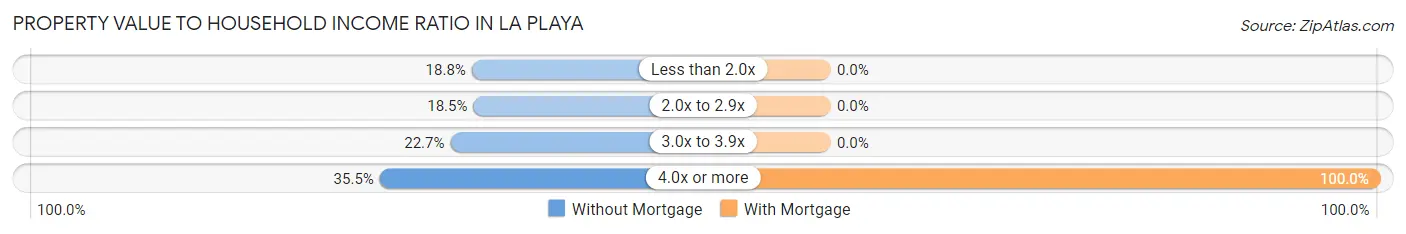
| Value-to-Income Ratio | Without Mortgage | With Mortgage |
| Less than 2.0x | 63 (18.8%) | 0 (0.0%) |
| 2.0x to 2.9x | 62 (18.5%) | 0 (0.0%) |
| 3.0x to 3.9x | 76 (22.7%) | 0 (0.0%) |
| 4.0x or more | 119 (35.5%) | 40 (100.0%) |
| Total | 335 (100.0%) | 40 (100.0%) |
Real Estate Taxes by Mortgage Status in La Playa
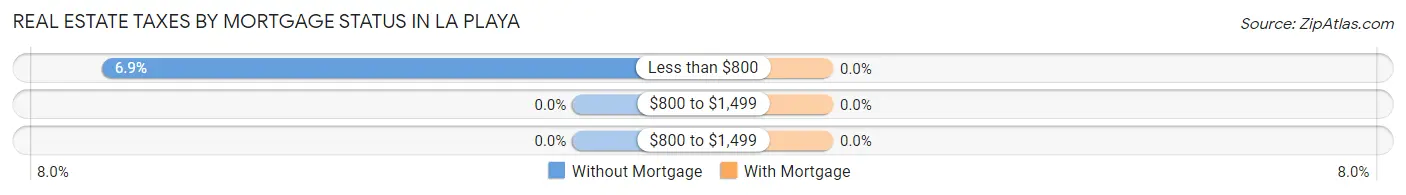
| Property Taxes | Without Mortgage | With Mortgage |
| Less than $800 | 23 (6.9%) | 0 (0.0%) |
| $800 to $1,499 | 0 (0.0%) | 0 (0.0%) |
| $800 to $1,499 | 0 (0.0%) | 0 (0.0%) |
| Total | 335 (100.0%) | 40 (100.0%) |
Health & Disability in La Playa
Health Insurance Coverage by Age in La Playa
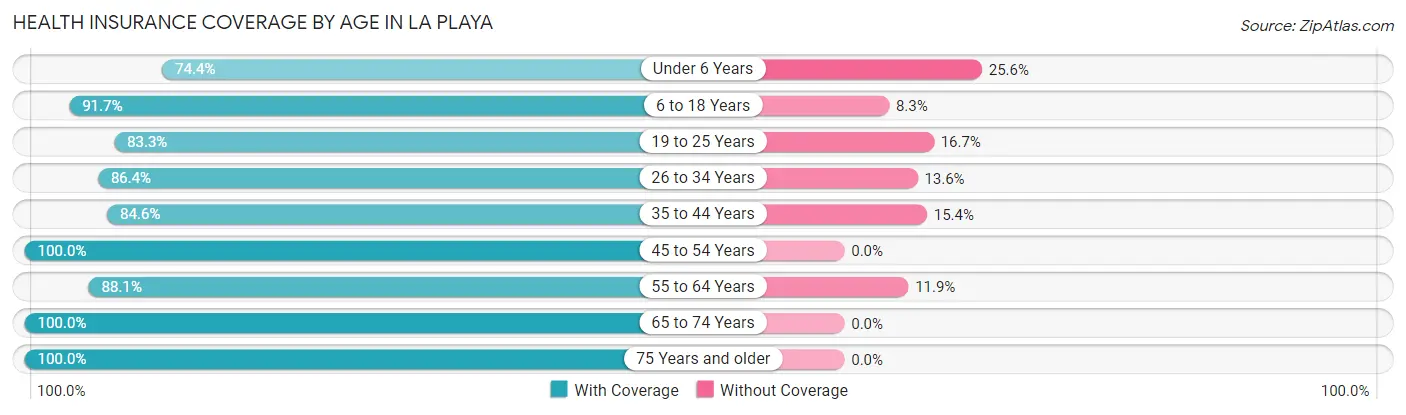
| Age Bracket | With Coverage | Without Coverage |
| Under 6 Years | 58 (74.4%) | 20 (25.6%) |
| 6 to 18 Years | 209 (91.7%) | 19 (8.3%) |
| 19 to 25 Years | 100 (83.3%) | 20 (16.7%) |
| 26 to 34 Years | 209 (86.4%) | 33 (13.6%) |
| 35 to 44 Years | 99 (84.6%) | 18 (15.4%) |
| 45 to 54 Years | 167 (100.0%) | 0 (0.0%) |
| 55 to 64 Years | 170 (88.1%) | 23 (11.9%) |
| 65 to 74 Years | 361 (100.0%) | 0 (0.0%) |
| 75 Years and older | 126 (100.0%) | 0 (0.0%) |
| Total | 1,499 (91.8%) | 133 (8.2%) |
Health Insurance Coverage by Citizenship Status in La Playa
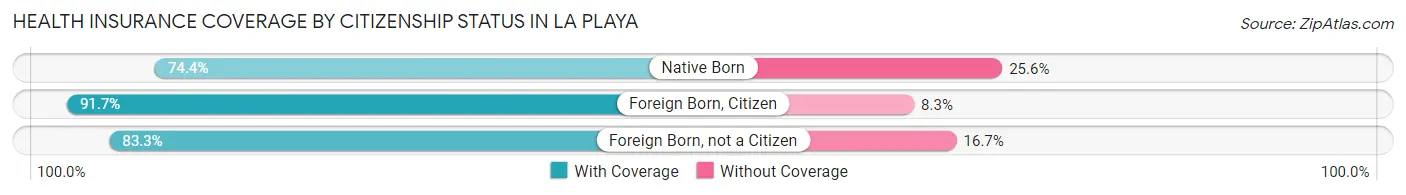
| Citizenship Status | With Coverage | Without Coverage |
| Native Born | 58 (74.4%) | 20 (25.6%) |
| Foreign Born, Citizen | 209 (91.7%) | 19 (8.3%) |
| Foreign Born, not a Citizen | 100 (83.3%) | 20 (16.7%) |
Health Insurance Coverage by Household Income in La Playa
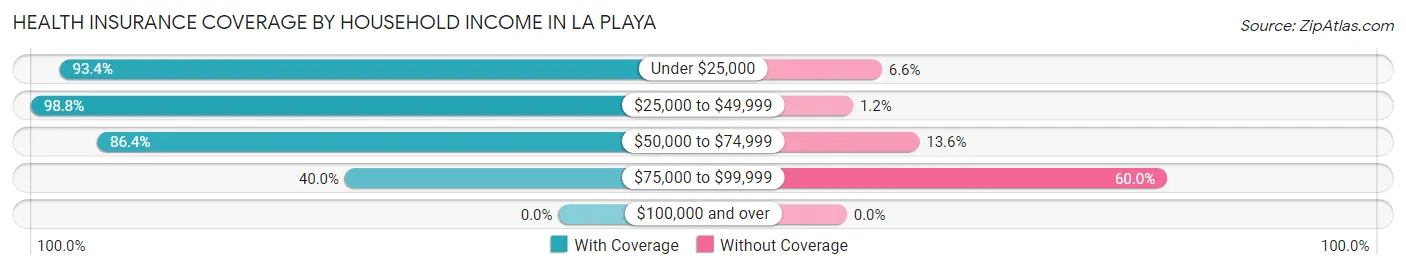
| Household Income | With Coverage | Without Coverage |
| Under $25,000 | 484 (93.4%) | 34 (6.6%) |
| $25,000 to $49,999 | 767 (98.8%) | 9 (1.2%) |
| $50,000 to $74,999 | 210 (86.4%) | 33 (13.6%) |
| $75,000 to $99,999 | 38 (40.0%) | 57 (60.0%) |
| $100,000 and over | 0 (0.0%) | 0 (0.0%) |
Public vs Private Health Insurance Coverage by Age in La Playa
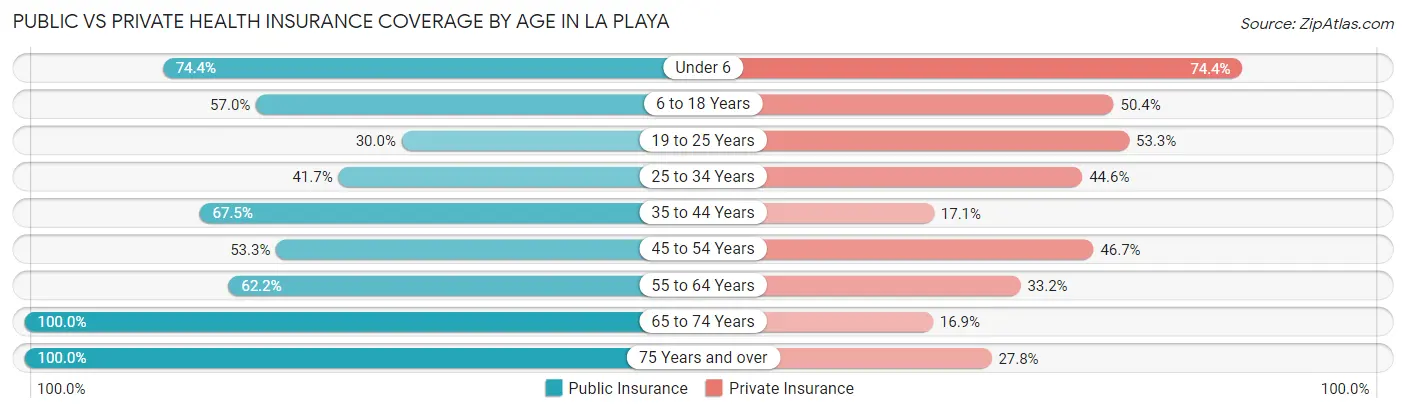
| Age Bracket | Public Insurance | Private Insurance |
| Under 6 | 58 (74.4%) | 58 (74.4%) |
| 6 to 18 Years | 130 (57.0%) | 115 (50.4%) |
| 19 to 25 Years | 36 (30.0%) | 64 (53.3%) |
| 25 to 34 Years | 101 (41.7%) | 108 (44.6%) |
| 35 to 44 Years | 79 (67.5%) | 20 (17.1%) |
| 45 to 54 Years | 89 (53.3%) | 78 (46.7%) |
| 55 to 64 Years | 120 (62.2%) | 64 (33.2%) |
| 65 to 74 Years | 361 (100.0%) | 61 (16.9%) |
| 75 Years and over | 126 (100.0%) | 35 (27.8%) |
| Total | 1,100 (67.4%) | 603 (36.9%) |
Disability Status by Sex by Age in La Playa
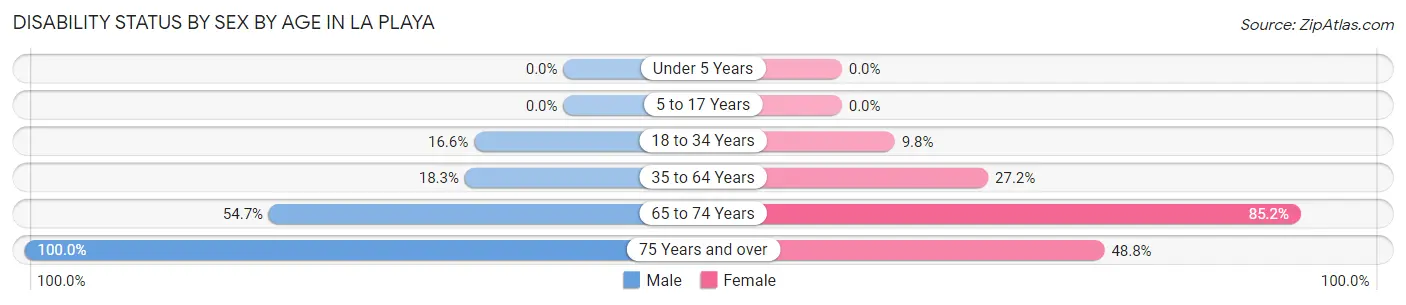
| Age Bracket | Male | Female |
| Under 5 Years | 0 (0.0%) | 0 (0.0%) |
| 5 to 17 Years | 0 (0.0%) | 0 (0.0%) |
| 18 to 34 Years | 33 (16.6%) | 16 (9.8%) |
| 35 to 64 Years | 28 (18.3%) | 88 (27.2%) |
| 65 to 74 Years | 94 (54.6%) | 161 (85.2%) |
| 75 Years and over | 46 (100.0%) | 39 (48.7%) |
Disability Class by Sex by Age in La Playa
Disability Class: Hearing Difficulty
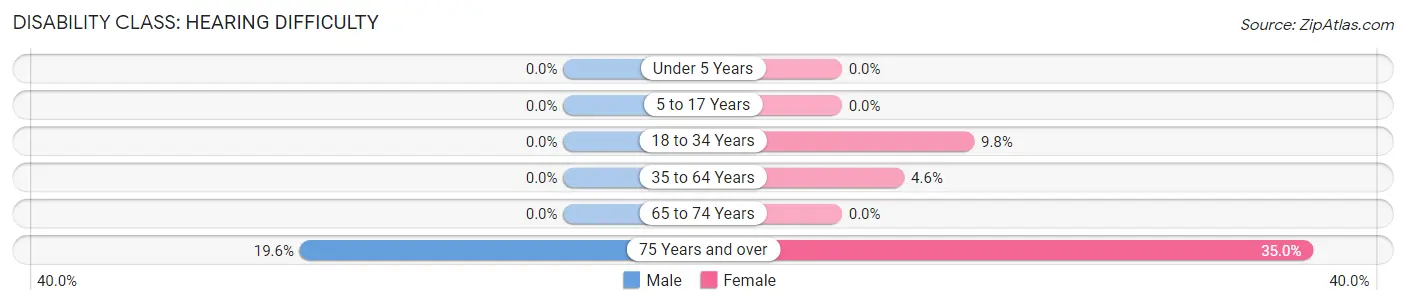
| Age Bracket | Male | Female |
| Under 5 Years | 0 (0.0%) | 0 (0.0%) |
| 5 to 17 Years | 0 (0.0%) | 0 (0.0%) |
| 18 to 34 Years | 0 (0.0%) | 16 (9.8%) |
| 35 to 64 Years | 0 (0.0%) | 15 (4.6%) |
| 65 to 74 Years | 0 (0.0%) | 0 (0.0%) |
| 75 Years and over | 9 (19.6%) | 28 (35.0%) |
Disability Class: Vision Difficulty
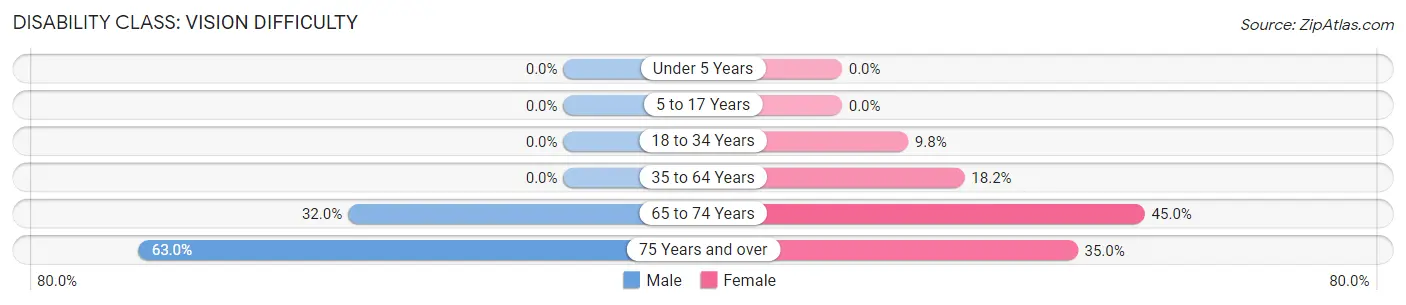
| Age Bracket | Male | Female |
| Under 5 Years | 0 (0.0%) | 0 (0.0%) |
| 5 to 17 Years | 0 (0.0%) | 0 (0.0%) |
| 18 to 34 Years | 0 (0.0%) | 16 (9.8%) |
| 35 to 64 Years | 0 (0.0%) | 59 (18.2%) |
| 65 to 74 Years | 55 (32.0%) | 85 (45.0%) |
| 75 Years and over | 29 (63.0%) | 28 (35.0%) |
Disability Class: Cognitive Difficulty
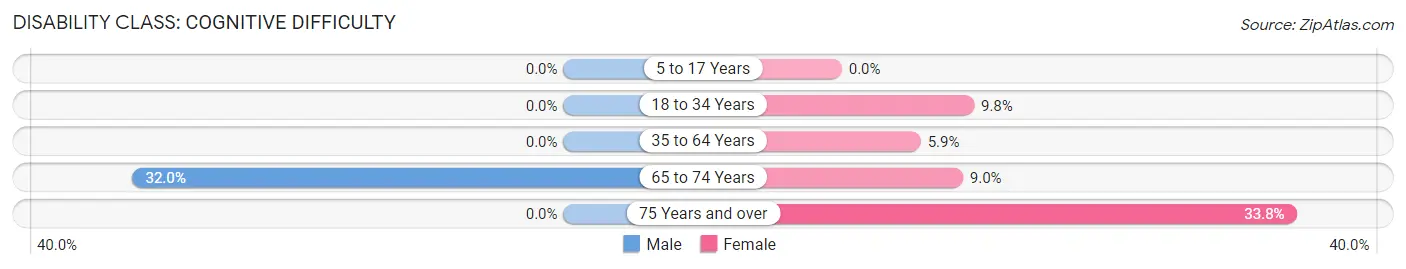
| Age Bracket | Male | Female |
| 5 to 17 Years | 0 (0.0%) | 0 (0.0%) |
| 18 to 34 Years | 0 (0.0%) | 16 (9.8%) |
| 35 to 64 Years | 0 (0.0%) | 19 (5.9%) |
| 65 to 74 Years | 55 (32.0%) | 17 (9.0%) |
| 75 Years and over | 0 (0.0%) | 27 (33.8%) |
Disability Class: Ambulatory Difficulty
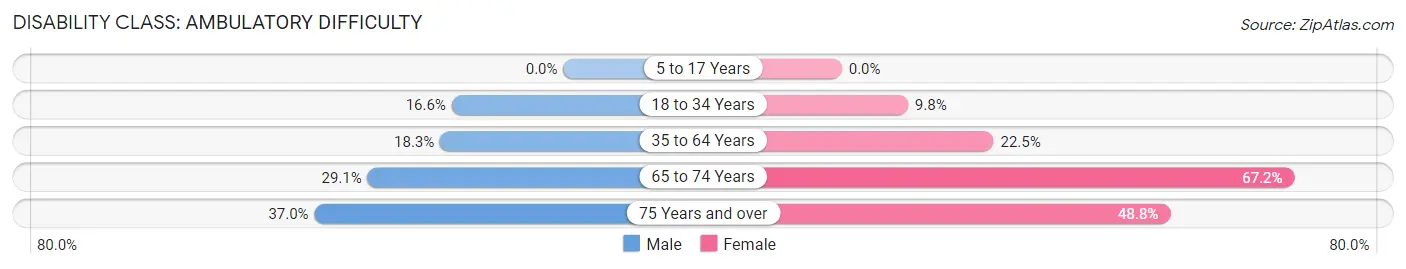
| Age Bracket | Male | Female |
| 5 to 17 Years | 0 (0.0%) | 0 (0.0%) |
| 18 to 34 Years | 33 (16.6%) | 16 (9.8%) |
| 35 to 64 Years | 28 (18.3%) | 73 (22.5%) |
| 65 to 74 Years | 50 (29.1%) | 127 (67.2%) |
| 75 Years and over | 17 (37.0%) | 39 (48.7%) |
Disability Class: Self-Care Difficulty
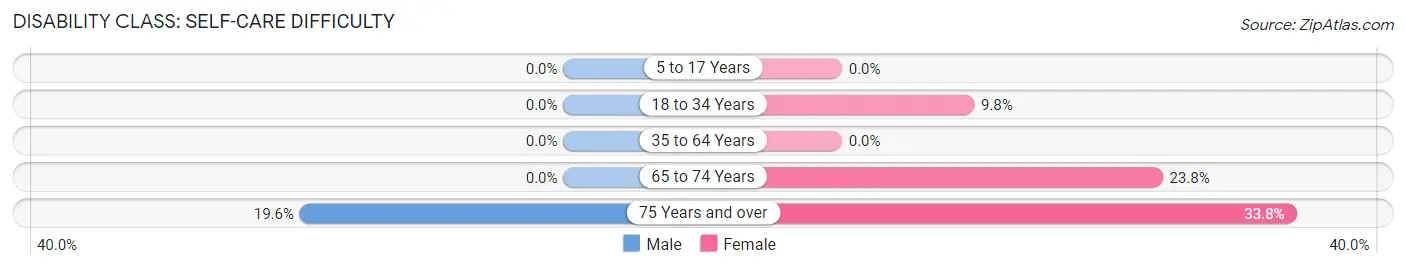
| Age Bracket | Male | Female |
| 5 to 17 Years | 0 (0.0%) | 0 (0.0%) |
| 18 to 34 Years | 0 (0.0%) | 16 (9.8%) |
| 35 to 64 Years | 0 (0.0%) | 0 (0.0%) |
| 65 to 74 Years | 0 (0.0%) | 45 (23.8%) |
| 75 Years and over | 9 (19.6%) | 27 (33.8%) |
Technology Access in La Playa
Computing Device Access in La Playa
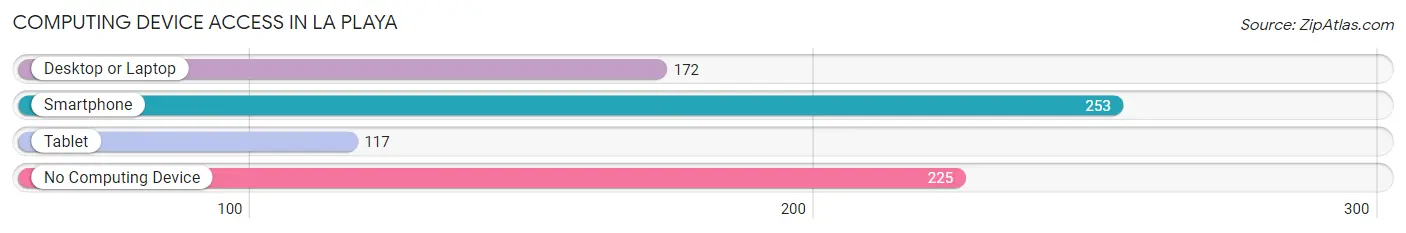
| Device Type | # Households | % Households |
| Desktop or Laptop | 172 | 32.0% |
| Smartphone | 253 | 47.0% |
| Tablet | 117 | 21.7% |
| No Computing Device | 225 | 41.8% |
| Total | 538 | 100.0% |
Internet Access in La Playa
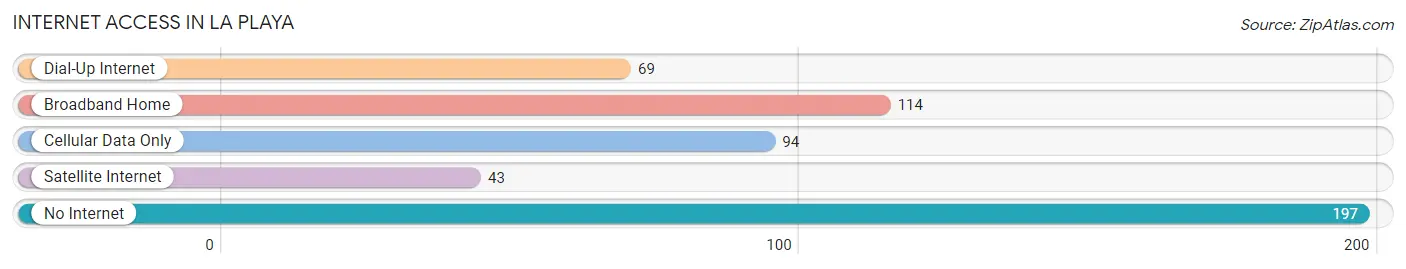
| Internet Type | # Households | % Households |
| Dial-Up Internet | 69 | 12.8% |
| Broadband Home | 114 | 21.2% |
| Cellular Data Only | 94 | 17.5% |
| Satellite Internet | 43 | 8.0% |
| No Internet | 197 | 36.6% |
| Total | 538 | 100.0% |
La Playa Summary
Playa, Puerto Rico is a small town located in the municipality of Loíza, Puerto Rico. It is located on the northern coast of the island, about 20 miles east of San Juan. The town has a population of approximately 4,000 people and is known for its beautiful beaches and its vibrant culture.
History
Playa, Puerto Rico was founded in the late 19th century by a group of fishermen from the nearby town of Loíza. The town was originally called “La Playa de Loíza”, which translates to “The Beach of Loíza”. The town was officially incorporated in 1891 and has since grown to become a popular tourist destination.
The town has a rich history of fishing and agriculture. In the early 20th century, the town was known for its production of sugar cane, tobacco, and coffee. The town also had a thriving fishing industry, with many of the town’s residents working as fishermen.
Geography
Playa, Puerto Rico is located on the northern coast of the island, about 20 miles east of San Juan. The town is situated on a small peninsula, surrounded by the Atlantic Ocean on one side and the Caribbean Sea on the other. The town is known for its beautiful beaches, which are popular with tourists and locals alike.
The town is also home to a number of small islands, including Isla de la Piedra, Isla de los Pájaros, and Isla de los Monos. These islands are popular with tourists and are home to a variety of wildlife, including seabirds, dolphins, and sea turtles.
Economy
The economy of Playa, Puerto Rico is largely based on tourism. The town is home to a number of hotels, restaurants, and other tourist attractions. The town is also home to a number of small businesses, including fishing and agricultural operations.
The town is also home to a number of manufacturing companies, including a factory that produces plastic products. The town is also home to a number of small shops and stores, which cater to both tourists and locals.
Demographics
As of the 2010 census, the population of Playa, Puerto Rico was 4,000. The town is predominantly Hispanic, with the majority of the population being of Puerto Rican descent. The town also has a small population of African-Americans, as well as a small population of other ethnicities.
The town has a median household income of $20,000, which is slightly lower than the national average. The town also has a high rate of poverty, with approximately 25% of the population living below the poverty line.
Conclusion
Playa, Puerto Rico is a small town located on the northern coast of the island, about 20 miles east of San Juan. The town has a population of approximately 4,000 people and is known for its beautiful beaches and its vibrant culture. The town has a rich history of fishing and agriculture, and its economy is largely based on tourism. The town is predominantly Hispanic, with the majority of the population being of Puerto Rican descent. The town also has a high rate of poverty, with approximately 25% of the population living below the poverty line.
Common Questions
What is Per Capita Income in La Playa?
Per Capita income in La Playa is $10,853.
What is the Median Family Income in La Playa?
Median Family Income in La Playa is $29,250.
What is the Median Household income in La Playa?
Median Household Income in La Playa is $26,635.
What is Income or Wage Gap in La Playa?
Income or Wage Gap in La Playa is 36.0%.
Women in La Playa earn 64.0 cents for every dollar earned by a man.
What is Inequality or Gini Index in La Playa?
Inequality or Gini Index in La Playa is 0.36.
What is the Total Population of La Playa?
Total Population of La Playa is 1,632.
What is the Total Male Population of La Playa?
Total Male Population of La Playa is 694.
What is the Total Female Population of La Playa?
Total Female Population of La Playa is 938.
What is the Ratio of Males per 100 Females in La Playa?
There are 73.99 Males per 100 Females in La Playa.
What is the Ratio of Females per 100 Males in La Playa?
There are 135.16 Females per 100 Males in La Playa.
What is the Median Population Age in La Playa?
Median Population Age in La Playa is 48.2 Years.
What is the Average Family Size in La Playa
Average Family Size in La Playa is 3.7 People.
What is the Average Household Size in La Playa
Average Household Size in La Playa is 3.0 People.
How Large is the Labor Force in La Playa?
There are 463 People in the Labor Forcein in La Playa.
What is the Percentage of People in the Labor Force in La Playa?
34.9% of People are in the Labor Force in La Playa.
What is the Unemployment Rate in La Playa?
Unemployment Rate in La Playa is 8.2%.