Aguas Claras, PR Map & Demographics
Aguas Claras Map
Aguas Claras Overview
$12,483
PER CAPITA INCOME
$24,241
AVG FAMILY INCOME
$22,265
AVG HOUSEHOLD INCOME
11.4%
WAGE / INCOME GAP [ % ]
88.6¢/ $1
WAGE / INCOME GAP [ $ ]
0.37
INEQUALITY / GINI INDEX
2,327
TOTAL POPULATION
979
MALE POPULATION
1,348
FEMALE POPULATION
72.63
MALES / 100 FEMALES
137.69
FEMALES / 100 MALES
49.4
MEDIAN AGE
3.4
AVG FAMILY SIZE
2.7
AVG HOUSEHOLD SIZE
774
LABOR FORCE [ PEOPLE ]
36.8%
PERCENT IN LABOR FORCE
9.7%
UNEMPLOYMENT RATE
Income in Aguas Claras
Income Overview in Aguas Claras
Per Capita Income in Aguas Claras is $12,483, while median incomes of families and households are $24,241 and $22,265 respectively.
| Characteristic | Number | Measure |
| Per Capita Income | 2,327 | $12,483 |
| Median Family Income | 580 | $24,241 |
| Mean Family Income | 580 | $34,612 |
| Median Household Income | 864 | $22,265 |
| Mean Household Income | 864 | $29,624 |
| Income Deficit | 580 | $0 |
| Wage / Income Gap (%) | 2,327 | 11.44% |
| Wage / Income Gap ($) | 2,327 | 88.56¢ per $1 |
| Gini / Inequality Index | 2,327 | 0.37 |
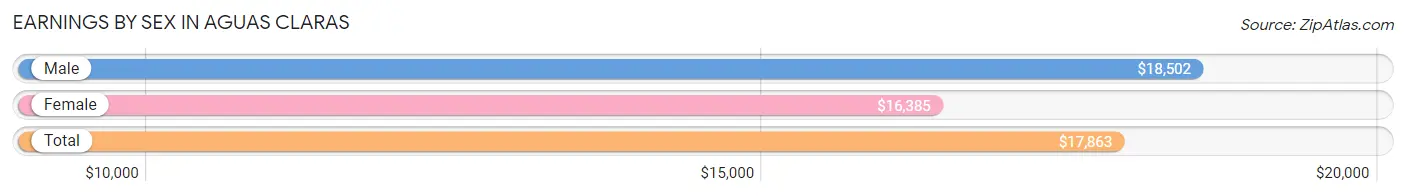
Earnings by Sex in Aguas Claras
Average Earnings in Aguas Claras are $17,863, $18,502 for men and $16,385 for women, a difference of 11.4%.
| Sex | Number | Average Earnings |
| Male | 407 (54.9%) | $18,502 |
| Female | 334 (45.1%) | $16,385 |
| Total | 741 (100.0%) | $17,863 |
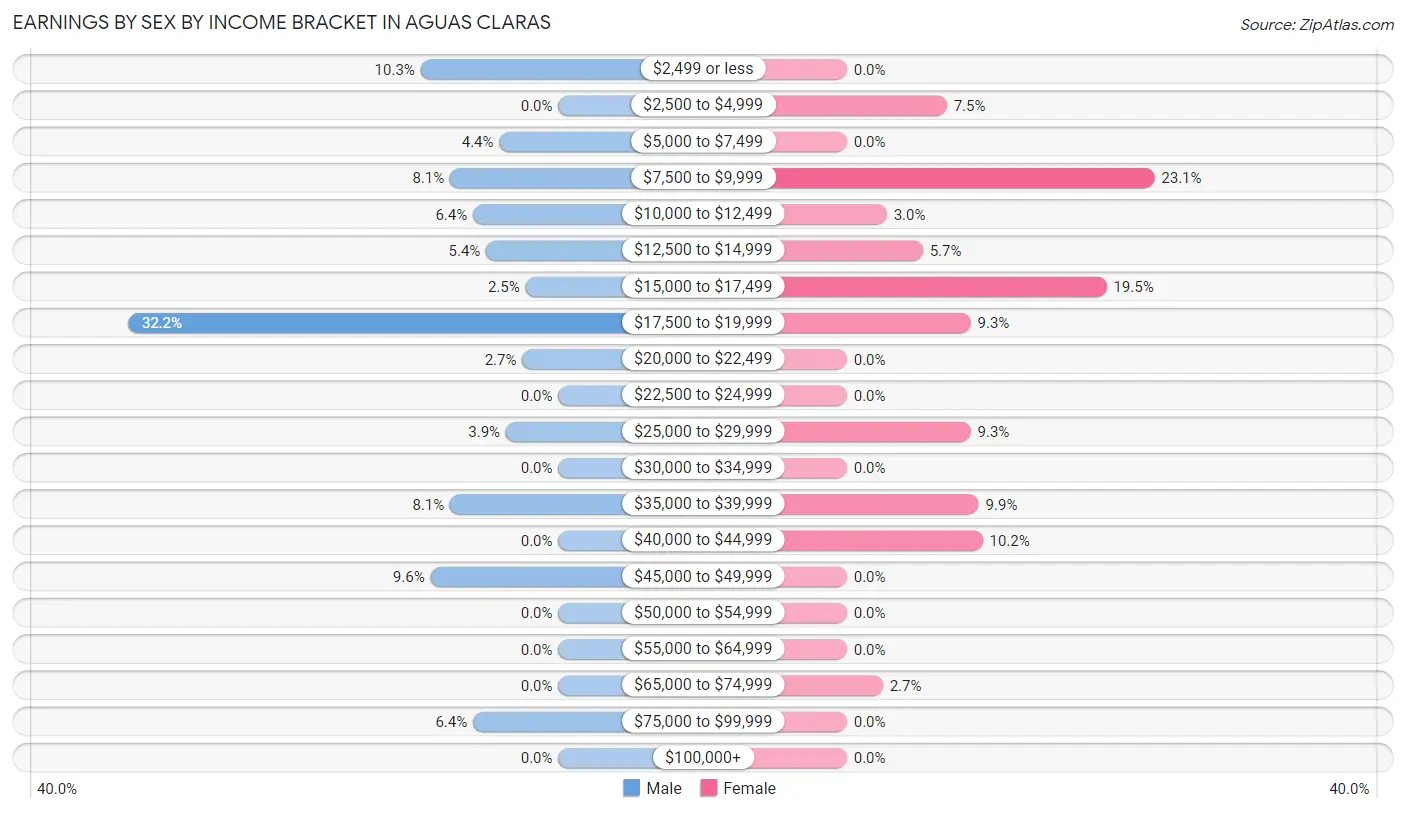
Earnings by Sex by Income Bracket in Aguas Claras
The most common earnings brackets in Aguas Claras are $17,500 to $19,999 for men (131 | 32.2%) and $7,500 to $9,999 for women (77 | 23.1%).
| Income | Male | Female |
| $2,499 or less | 42 (10.3%) | 0 (0.0%) |
| $2,500 to $4,999 | 0 (0.0%) | 25 (7.5%) |
| $5,000 to $7,499 | 18 (4.4%) | 0 (0.0%) |
| $7,500 to $9,999 | 33 (8.1%) | 77 (23.1%) |
| $10,000 to $12,499 | 26 (6.4%) | 10 (3.0%) |
| $12,500 to $14,999 | 22 (5.4%) | 19 (5.7%) |
| $15,000 to $17,499 | 10 (2.5%) | 65 (19.5%) |
| $17,500 to $19,999 | 131 (32.2%) | 31 (9.3%) |
| $20,000 to $22,499 | 11 (2.7%) | 0 (0.0%) |
| $22,500 to $24,999 | 0 (0.0%) | 0 (0.0%) |
| $25,000 to $29,999 | 16 (3.9%) | 31 (9.3%) |
| $30,000 to $34,999 | 0 (0.0%) | 0 (0.0%) |
| $35,000 to $39,999 | 33 (8.1%) | 33 (9.9%) |
| $40,000 to $44,999 | 0 (0.0%) | 34 (10.2%) |
| $45,000 to $49,999 | 39 (9.6%) | 0 (0.0%) |
| $50,000 to $54,999 | 0 (0.0%) | 0 (0.0%) |
| $55,000 to $64,999 | 0 (0.0%) | 0 (0.0%) |
| $65,000 to $74,999 | 0 (0.0%) | 9 (2.7%) |
| $75,000 to $99,999 | 26 (6.4%) | 0 (0.0%) |
| $100,000+ | 0 (0.0%) | 0 (0.0%) |
| Total | 407 (100.0%) | 334 (100.0%) |
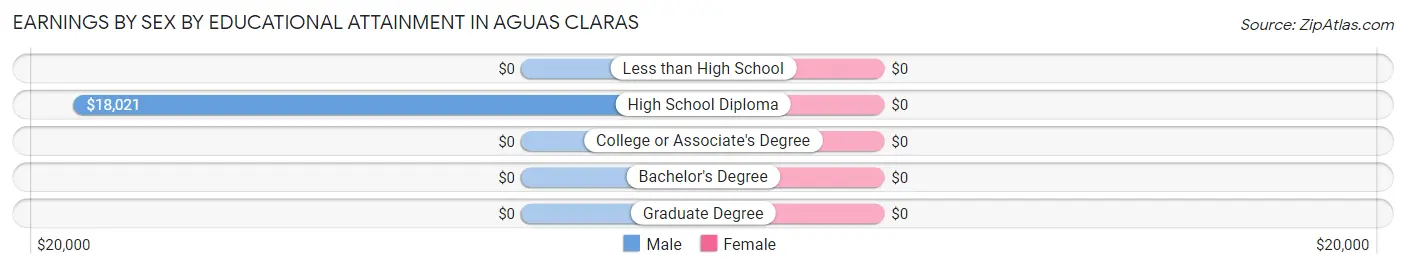
Earnings by Sex by Educational Attainment in Aguas Claras
| Educational Attainment | Male Income | Female Income |
| Less than High School | - | - |
| High School Diploma | $18,021 | $0 |
| College or Associate's Degree | - | - |
| Bachelor's Degree | - | - |
| Graduate Degree | - | - |
| Total | $19,151 | $16,846 |
Family Income in Aguas Claras
Family Income Brackets in Aguas Claras
According to the Aguas Claras family income data, there are 226 families falling into the $15,000 to $24,999 income range, which is the most common income bracket and makes up 39.0% of all families.
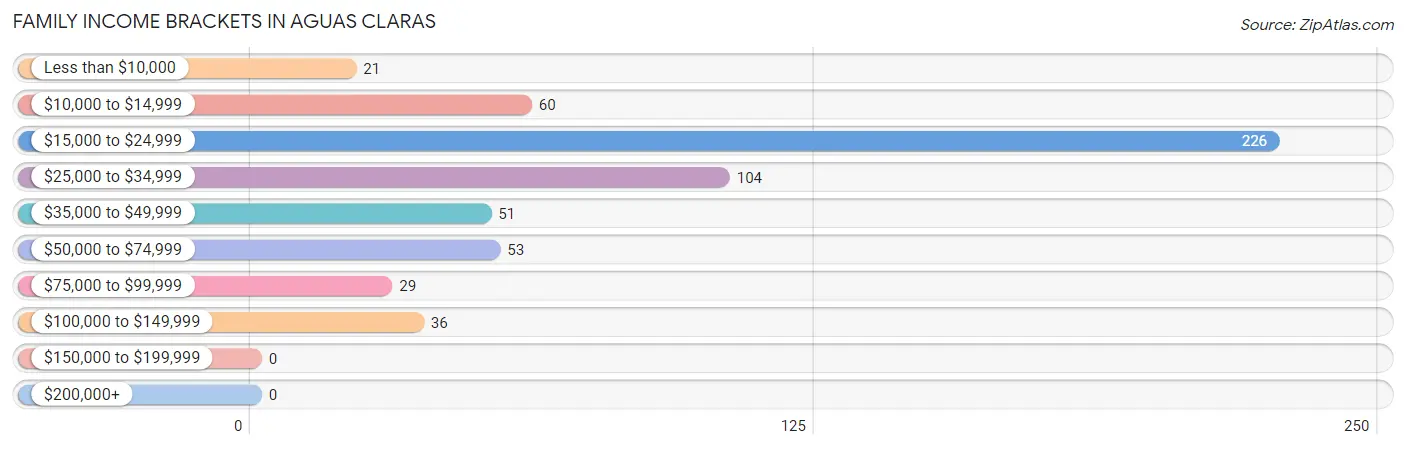
| Income Bracket | # Families | % Families |
| Less than $10,000 | 21 | 3.6% |
| $10,000 to $14,999 | 60 | 10.3% |
| $15,000 to $24,999 | 226 | 39.0% |
| $25,000 to $34,999 | 104 | 17.9% |
| $35,000 to $49,999 | 51 | 8.8% |
| $50,000 to $74,999 | 53 | 9.1% |
| $75,000 to $99,999 | 29 | 5.0% |
| $100,000 to $149,999 | 36 | 6.2% |
| $150,000 to $199,999 | 0 | 0.0% |
| $200,000+ | 0 | 0.0% |
Family Income by Famaliy Size in Aguas Claras
4-person families (110 | 19.0%) account for the highest median family income in Aguas Claras with $88,362 per family, while 4-person families (110 | 19.0%) have the highest median income of $22,090 per family member.
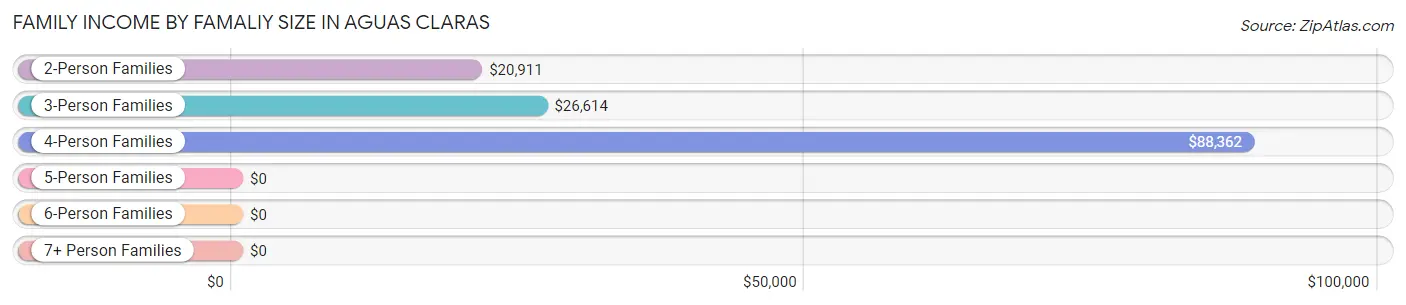
| Income Bracket | # Families | Median Income |
| 2-Person Families | 219 (37.8%) | $20,911 |
| 3-Person Families | 251 (43.3%) | $26,614 |
| 4-Person Families | 110 (19.0%) | $88,362 |
| 5-Person Families | 0 (0.0%) | $0 |
| 6-Person Families | 0 (0.0%) | $0 |
| 7+ Person Families | 0 (0.0%) | $0 |
| Total | 580 (100.0%) | $24,241 |
Family Income by Number of Earners in Aguas Claras
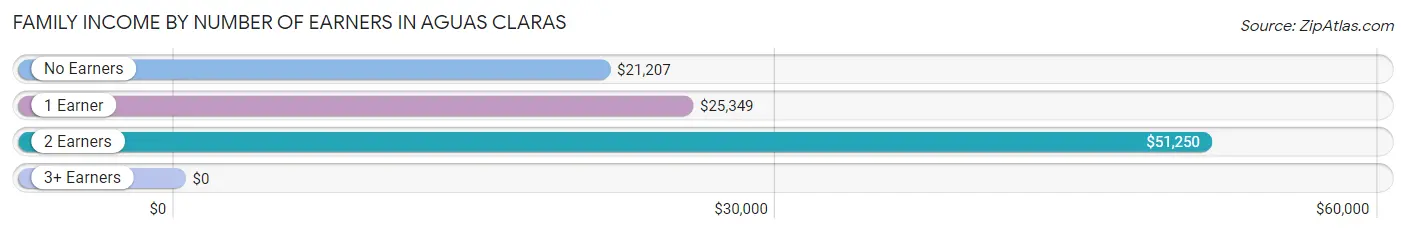
| Number of Earners | # Families | Median Income |
| No Earners | 240 (41.4%) | $21,207 |
| 1 Earner | 182 (31.4%) | $25,349 |
| 2 Earners | 158 (27.2%) | $51,250 |
| 3+ Earners | 0 (0.0%) | $0 |
| Total | 580 (100.0%) | $24,241 |
Household Income in Aguas Claras
Household Income Brackets in Aguas Claras
With 377 households falling in the category, the $15,000 to $24,999 income range is the most frequent in Aguas Claras, accounting for 43.6% of all households.

| Income Bracket | # Households | % Households |
| Less than $10,000 | 42 | 4.9% |
| $10,000 to $14,999 | 129 | 14.9% |
| $15,000 to $24,999 | 377 | 43.6% |
| $25,000 to $34,999 | 137 | 15.9% |
| $35,000 to $49,999 | 61 | 7.1% |
| $50,000 to $74,999 | 53 | 6.1% |
| $75,000 to $99,999 | 29 | 3.4% |
| $100,000 to $149,999 | 36 | 4.2% |
| $150,000 to $199,999 | 0 | 0.0% |
| $200,000+ | 0 | 0.0% |
Household Income by Householder Age in Aguas Claras
The median household income in Aguas Claras is $22,265, with the highest median household income of $22,788 found in the 45 to 64 years age bracket for the primary householder. A total of 284 households (32.9%) fall into this category.
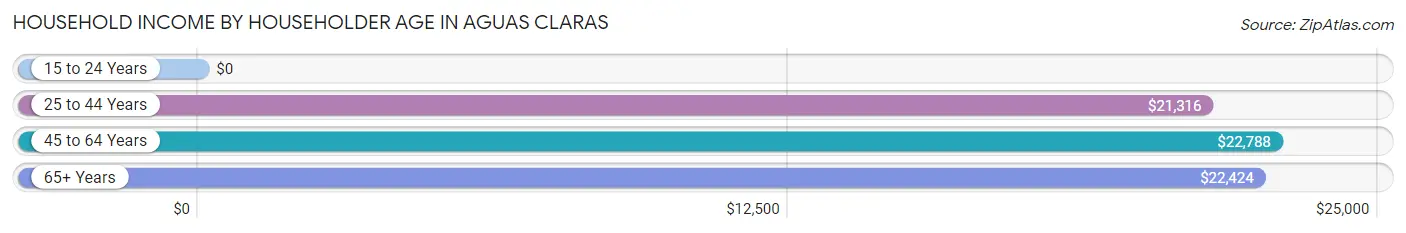
| Income Bracket | # Households | Median Income |
| 15 to 24 Years | 0 (0.0%) | $0 |
| 25 to 44 Years | 122 (14.1%) | $21,316 |
| 45 to 64 Years | 284 (32.9%) | $22,788 |
| 65+ Years | 458 (53.0%) | $22,424 |
| Total | 864 (100.0%) | $22,265 |
Poverty in Aguas Claras
Income Below Poverty by Sex and Age in Aguas Claras
With 32.9% poverty level for males and 33.4% for females among the residents of Aguas Claras, under 5 year old males and 5 year old females are the most vulnerable to poverty, with 16 males (100.0%) and 32 females (100.0%) in their respective age groups living below the poverty level.
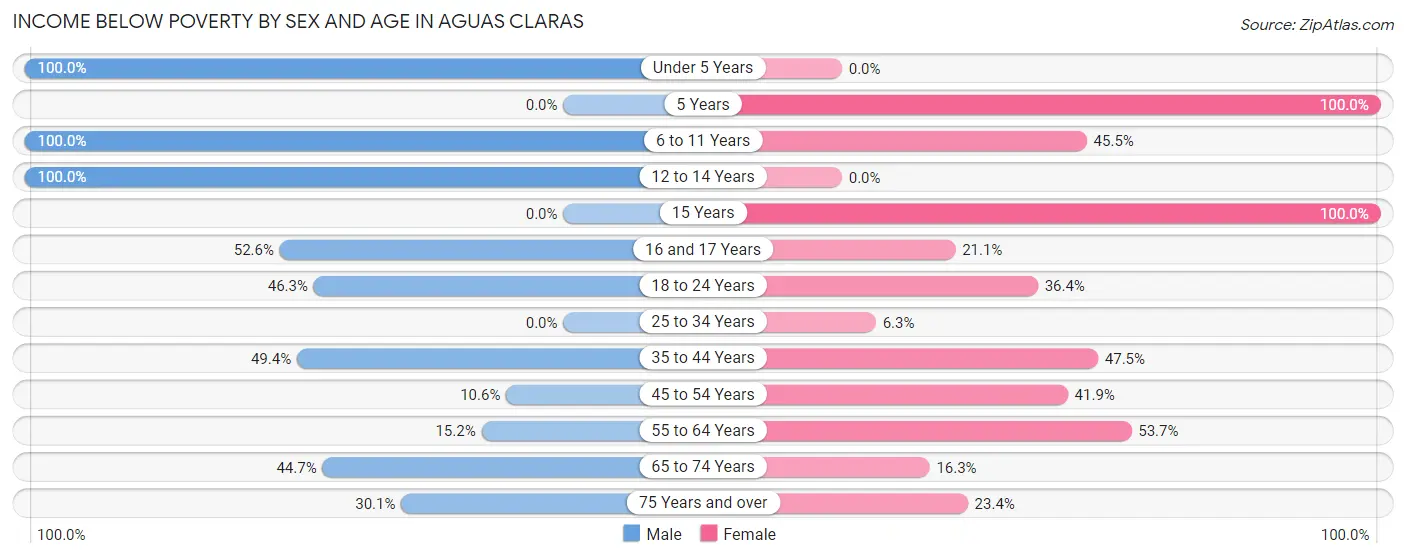
| Age Bracket | Male | Female |
| Under 5 Years | 16 (100.0%) | 0 (0.0%) |
| 5 Years | 0 (0.0%) | 32 (100.0%) |
| 6 to 11 Years | 36 (100.0%) | 20 (45.5%) |
| 12 to 14 Years | 24 (100.0%) | 0 (0.0%) |
| 15 Years | 0 (0.0%) | 23 (100.0%) |
| 16 and 17 Years | 10 (52.6%) | 12 (21.0%) |
| 18 to 24 Years | 44 (46.3%) | 24 (36.4%) |
| 25 to 34 Years | 0 (0.0%) | 10 (6.3%) |
| 35 to 44 Years | 44 (49.4%) | 77 (47.5%) |
| 45 to 54 Years | 16 (10.6%) | 70 (41.9%) |
| 55 to 64 Years | 19 (15.2%) | 79 (53.7%) |
| 65 to 74 Years | 76 (44.7%) | 27 (16.3%) |
| 75 Years and over | 37 (30.1%) | 75 (23.4%) |
| Total | 322 (32.9%) | 449 (33.4%) |
Income Above Poverty by Sex and Age in Aguas Claras
According to the poverty statistics in Aguas Claras, males aged 15 years and females aged 25 to 34 years are the age groups that are most secure financially, with 100.0% of males and 93.7% of females in these age groups living above the poverty line.
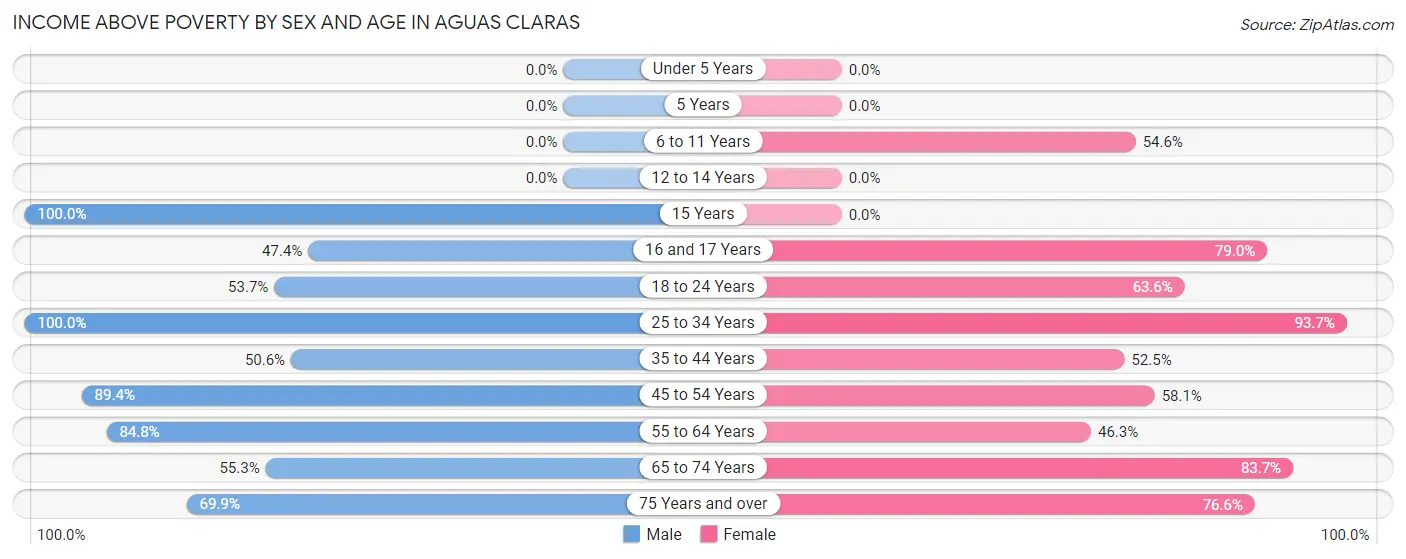
| Age Bracket | Male | Female |
| Under 5 Years | 0 (0.0%) | 0 (0.0%) |
| 5 Years | 0 (0.0%) | 0 (0.0%) |
| 6 to 11 Years | 0 (0.0%) | 24 (54.5%) |
| 12 to 14 Years | 0 (0.0%) | 0 (0.0%) |
| 15 Years | 49 (100.0%) | 0 (0.0%) |
| 16 and 17 Years | 9 (47.4%) | 45 (78.9%) |
| 18 to 24 Years | 51 (53.7%) | 42 (63.6%) |
| 25 to 34 Years | 81 (100.0%) | 149 (93.7%) |
| 35 to 44 Years | 45 (50.6%) | 85 (52.5%) |
| 45 to 54 Years | 135 (89.4%) | 97 (58.1%) |
| 55 to 64 Years | 106 (84.8%) | 68 (46.3%) |
| 65 to 74 Years | 94 (55.3%) | 139 (83.7%) |
| 75 Years and over | 86 (69.9%) | 246 (76.6%) |
| Total | 656 (67.1%) | 895 (66.6%) |
Income Below Poverty Among Married-Couple Families in Aguas Claras
The poverty statistics for married-couple families in Aguas Claras show that 28.0% or 102 of the total 364 families live below the poverty line. Families with 1 or 2 children have the highest poverty rate of 31.9%, comprising of 51 families. On the other hand, families with no children have the lowest poverty rate of 25.0%, which includes 51 families.
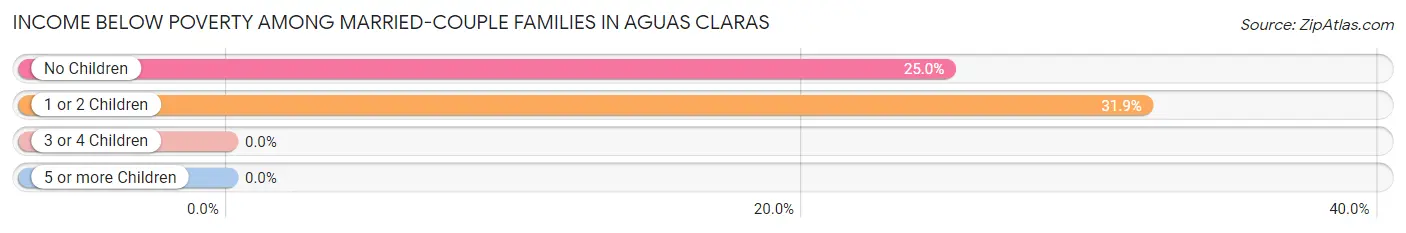
| Children | Above Poverty | Below Poverty |
| No Children | 153 (75.0%) | 51 (25.0%) |
| 1 or 2 Children | 109 (68.1%) | 51 (31.9%) |
| 3 or 4 Children | 0 (0.0%) | 0 (0.0%) |
| 5 or more Children | 0 (0.0%) | 0 (0.0%) |
| Total | 262 (72.0%) | 102 (28.0%) |
Income Below Poverty Among Single-Parent Households in Aguas Claras
According to the poverty data in Aguas Claras, 100.0% or 10 single-father households and 44.2% or 91 single-mother households are living below the poverty line. Among single-father households, those with 3 or 4 children have the highest poverty rate, with 10 households (100.0%) experiencing poverty. Likewise, among single-mother households, those with 1 or 2 children have the highest poverty rate, with 50 households (79.4%) falling below the poverty line.
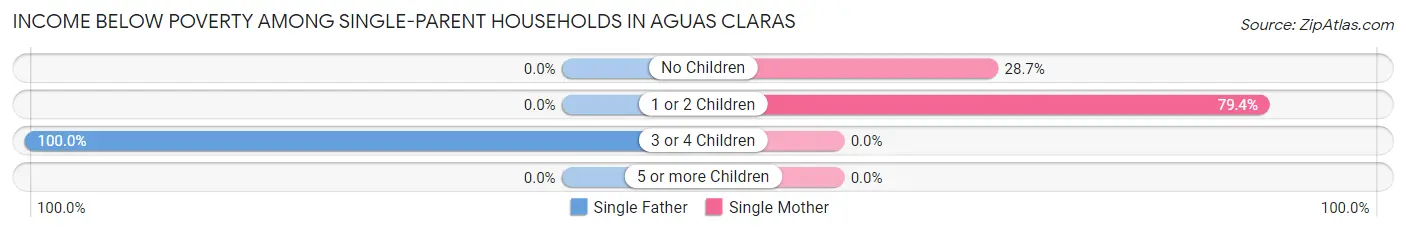
| Children | Single Father | Single Mother |
| No Children | 0 (0.0%) | 41 (28.7%) |
| 1 or 2 Children | 0 (0.0%) | 50 (79.4%) |
| 3 or 4 Children | 10 (100.0%) | 0 (0.0%) |
| 5 or more Children | 0 (0.0%) | 0 (0.0%) |
| Total | 10 (100.0%) | 91 (44.2%) |
Income Below Poverty Among Married-Couple vs Single-Parent Households in Aguas Claras
The poverty data for Aguas Claras shows that 102 of the married-couple family households (28.0%) and 101 of the single-parent households (46.8%) are living below the poverty level. Within the married-couple family households, those with 1 or 2 children have the highest poverty rate, with 51 households (31.9%) falling below the poverty line. Among the single-parent households, those with 3 or 4 children have the highest poverty rate, with 10 household (100.0%) living below poverty.
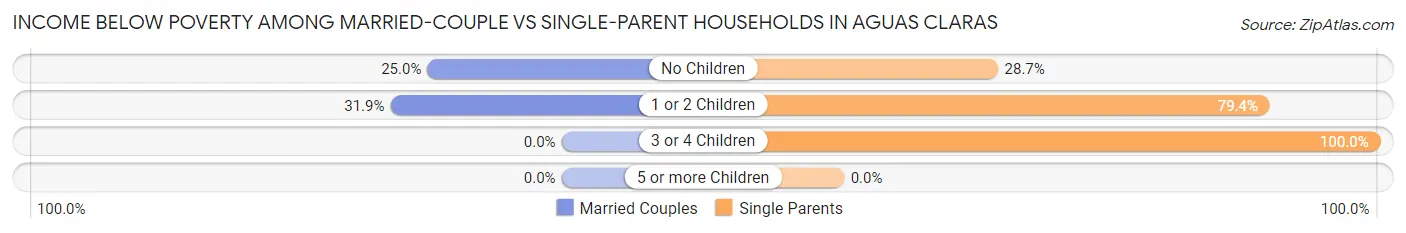
| Children | Married-Couple Families | Single-Parent Households |
| No Children | 51 (25.0%) | 41 (28.7%) |
| 1 or 2 Children | 51 (31.9%) | 50 (79.4%) |
| 3 or 4 Children | 0 (0.0%) | 10 (100.0%) |
| 5 or more Children | 0 (0.0%) | 0 (0.0%) |
| Total | 102 (28.0%) | 101 (46.8%) |
Race in Aguas Claras
The most populous races in Aguas Claras are Hispanic or Latino (2,326 | 100.0%), Some other Race (1,244 | 53.5%), and White / Caucasian (696 | 29.9%).
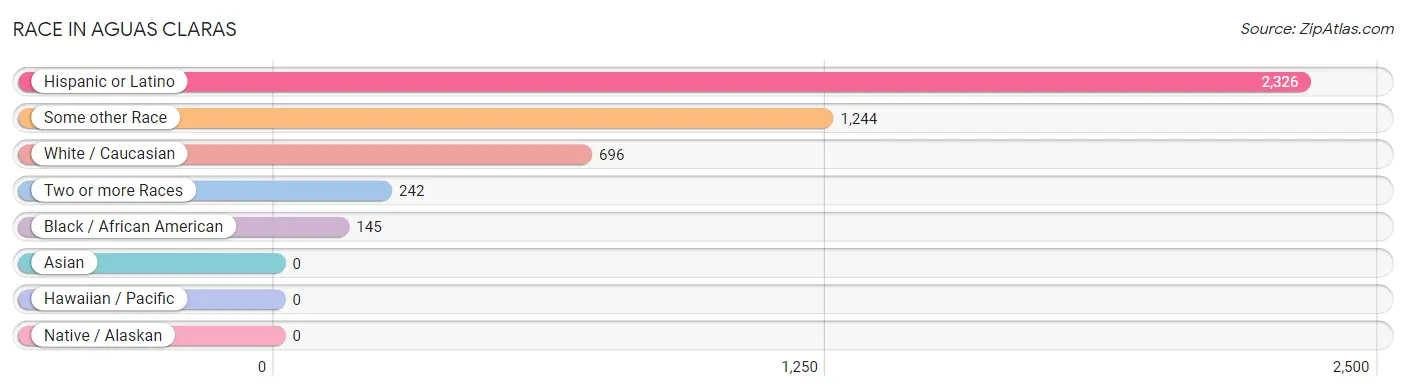
| Race | # Population | % Population |
| Asian | 0 | 0.0% |
| Black / African American | 145 | 6.2% |
| Hawaiian / Pacific | 0 | 0.0% |
| Hispanic or Latino | 2,326 | 100.0% |
| Native / Alaskan | 0 | 0.0% |
| White / Caucasian | 696 | 29.9% |
| Two or more Races | 242 | 10.4% |
| Some other Race | 1,244 | 53.5% |
| Total | 2,327 | 100.0% |
Ancestry in Aguas Claras
The most populous ancestries reported in Aguas Claras are Puerto Rican (2,326 | 100.0%), American (39 | 1.7%), and Thai (10 | 0.4%), together accounting for 102.1% of all Aguas Claras residents.
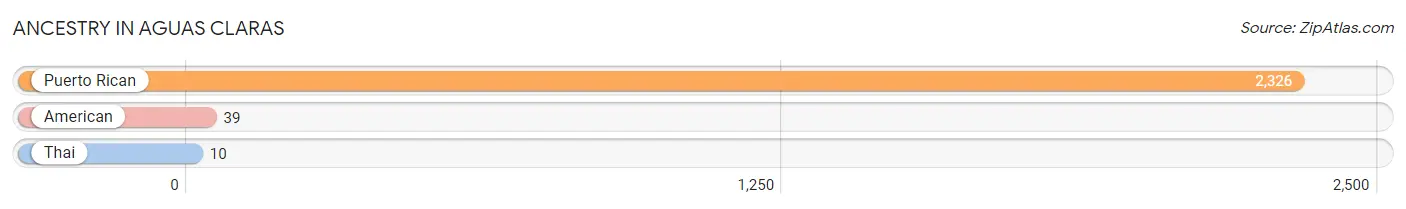
| Ancestry | # Population | % Population |
| American | 39 | 1.7% |
| Puerto Rican | 2,326 | 100.0% |
| Thai | 10 | 0.4% | View All 3 Rows |
Immigrants in Aguas Claras

| Immigration Origin | # Population | % Population | View All 0 Rows |
Sex and Age in Aguas Claras
Sex and Age in Aguas Claras
The most populous age groups in Aguas Claras are 45 to 49 Years (135 | 13.8%) for men and 75 to 79 Years (160 | 11.9%) for women.
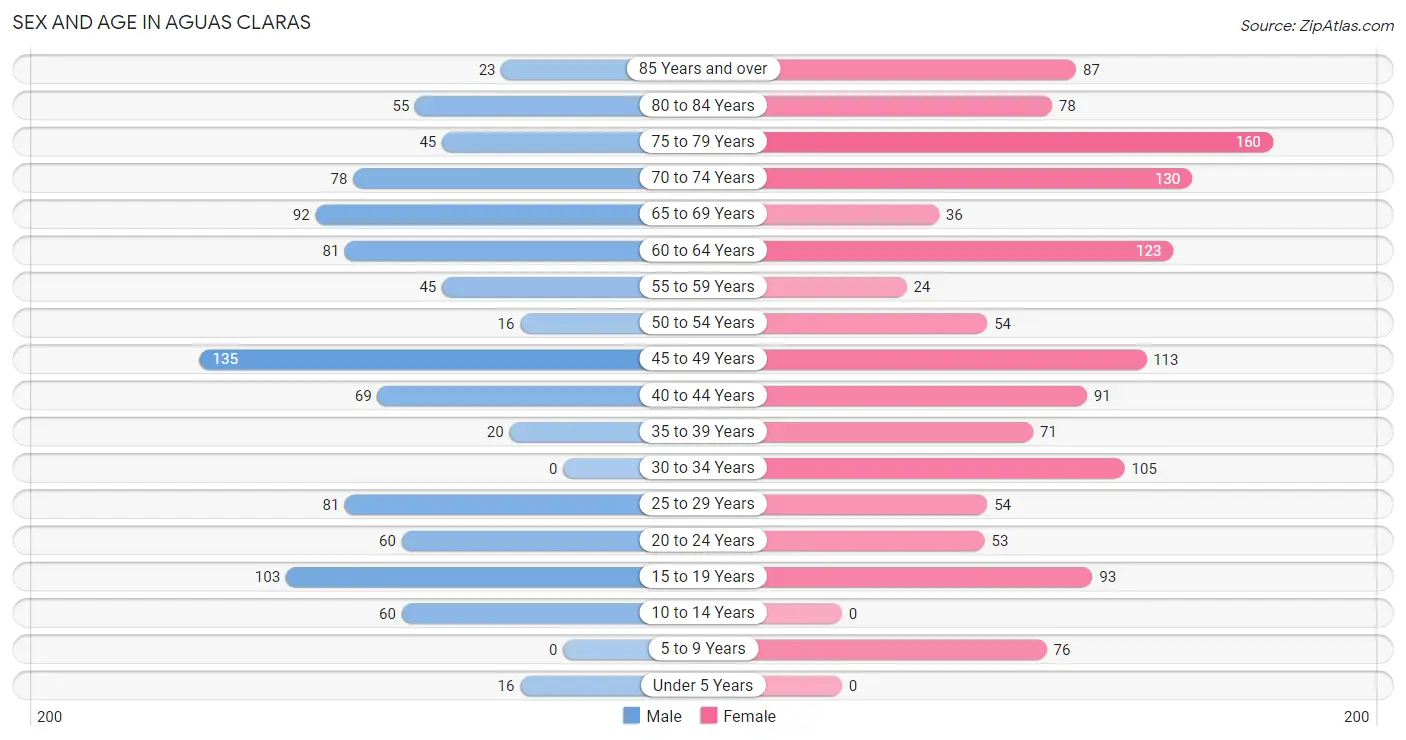
| Age Bracket | Male | Female |
| Under 5 Years | 16 (1.6%) | 0 (0.0%) |
| 5 to 9 Years | 0 (0.0%) | 76 (5.6%) |
| 10 to 14 Years | 60 (6.1%) | 0 (0.0%) |
| 15 to 19 Years | 103 (10.5%) | 93 (6.9%) |
| 20 to 24 Years | 60 (6.1%) | 53 (3.9%) |
| 25 to 29 Years | 81 (8.3%) | 54 (4.0%) |
| 30 to 34 Years | 0 (0.0%) | 105 (7.8%) |
| 35 to 39 Years | 20 (2.0%) | 71 (5.3%) |
| 40 to 44 Years | 69 (7.0%) | 91 (6.8%) |
| 45 to 49 Years | 135 (13.8%) | 113 (8.4%) |
| 50 to 54 Years | 16 (1.6%) | 54 (4.0%) |
| 55 to 59 Years | 45 (4.6%) | 24 (1.8%) |
| 60 to 64 Years | 81 (8.3%) | 123 (9.1%) |
| 65 to 69 Years | 92 (9.4%) | 36 (2.7%) |
| 70 to 74 Years | 78 (8.0%) | 130 (9.6%) |
| 75 to 79 Years | 45 (4.6%) | 160 (11.9%) |
| 80 to 84 Years | 55 (5.6%) | 78 (5.8%) |
| 85 Years and over | 23 (2.4%) | 87 (6.5%) |
| Total | 979 (100.0%) | 1,348 (100.0%) |
Families and Households in Aguas Claras
Median Family Size in Aguas Claras
The median family size in Aguas Claras is 3.35 persons per family, with single male/father families (10 | 1.7%) accounting for the largest median family size of 3.9 persons per family. On the other hand, married-couple families (364 | 62.8%) represent the smallest median family size with 3.13 persons per family.
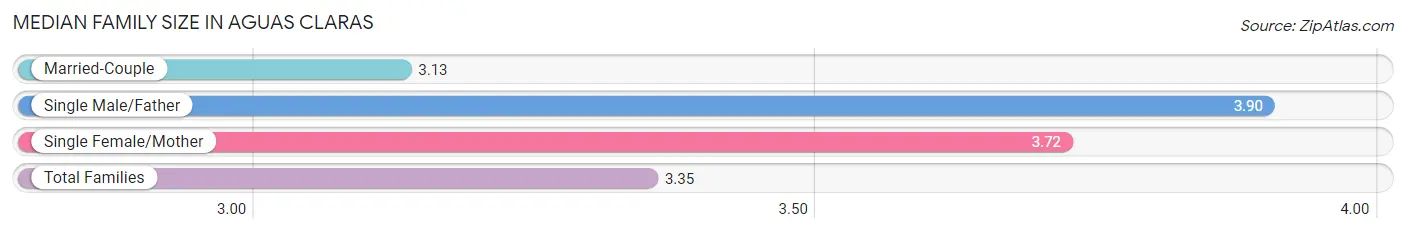
| Family Type | # Families | Family Size |
| Married-Couple | 364 (62.8%) | 3.13 |
| Single Male/Father | 10 (1.7%) | 3.90 |
| Single Female/Mother | 206 (35.5%) | 3.72 |
| Total Families | 580 (100.0%) | 3.35 |
Median Household Size in Aguas Claras
The median household size in Aguas Claras is 2.66 persons per household, with single male/father households (10 | 1.2%) accounting for the largest median household size of 4.8 persons per household. non-family households (284 | 32.9%) represent the smallest median household size with 1.11 persons per household.
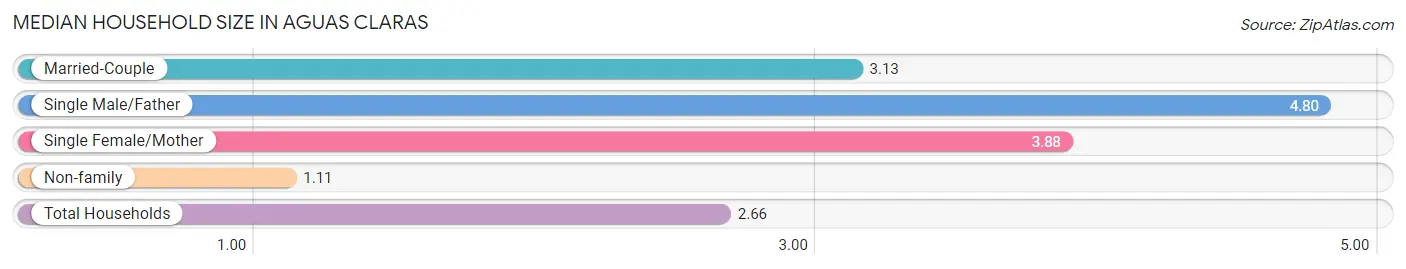
| Household Type | # Households | Household Size |
| Married-Couple | 364 (42.1%) | 3.13 |
| Single Male/Father | 10 (1.2%) | 4.80 |
| Single Female/Mother | 206 (23.8%) | 3.88 |
| Non-family | 284 (32.9%) | 1.11 |
| Total Households | 864 (100.0%) | 2.66 |
Household Size by Marriage Status in Aguas Claras
Out of a total of 864 households in Aguas Claras, 580 (67.1%) are family households, while 284 (32.9%) are nonfamily households. The most numerous type of family households are 3-person households, comprising 220, and the most common type of nonfamily households are 1-person households, comprising 249.
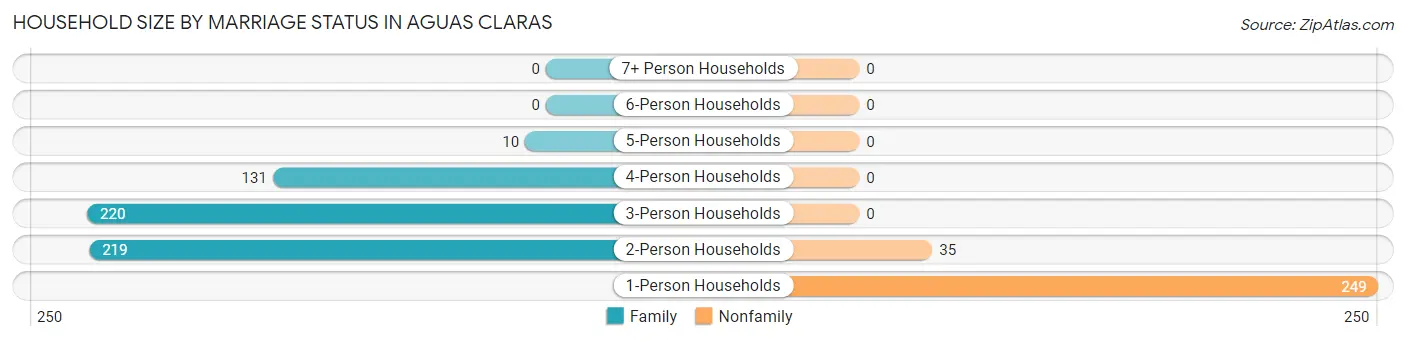
| Household Size | Family Households | Nonfamily Households |
| 1-Person Households | - | 249 (28.8%) |
| 2-Person Households | 219 (25.4%) | 35 (4.1%) |
| 3-Person Households | 220 (25.5%) | 0 (0.0%) |
| 4-Person Households | 131 (15.2%) | 0 (0.0%) |
| 5-Person Households | 10 (1.2%) | 0 (0.0%) |
| 6-Person Households | 0 (0.0%) | 0 (0.0%) |
| 7+ Person Households | 0 (0.0%) | 0 (0.0%) |
| Total | 580 (67.1%) | 284 (32.9%) |
Female Fertility in Aguas Claras
Fertility by Age in Aguas Claras
Average fertility rate in Aguas Claras is 93.0 births per 1,000 women. Women in the age bracket of 20 to 34 years have the highest fertility rate with 255.0 births per 1,000 women. Women in the age bracket of 20 to 34 years acount for 100.0% of all women with births.
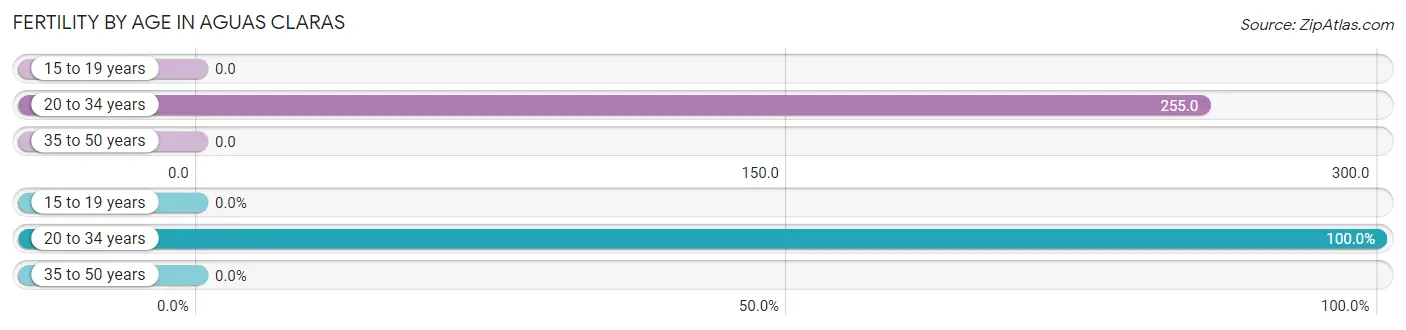
| Age Bracket | Women with Births | Births / 1,000 Women |
| 15 to 19 years | 0 (0.0%) | 0.0 |
| 20 to 34 years | 54 (100.0%) | 255.0 |
| 35 to 50 years | 0 (0.0%) | 0.0 |
| Total | 54 (100.0%) | 93.0 |
Fertility by Age by Marriage Status in Aguas Claras
18.5% of women with births (54) in Aguas Claras are married. The highest percentage of unmarried women with births falls into 20 to 34 years age bracket with 81.5% of them unmarried at the time of birth, while the lowest percentage of unmarried women with births belong to 20 to 34 years age bracket with 81.5% of them unmarried.
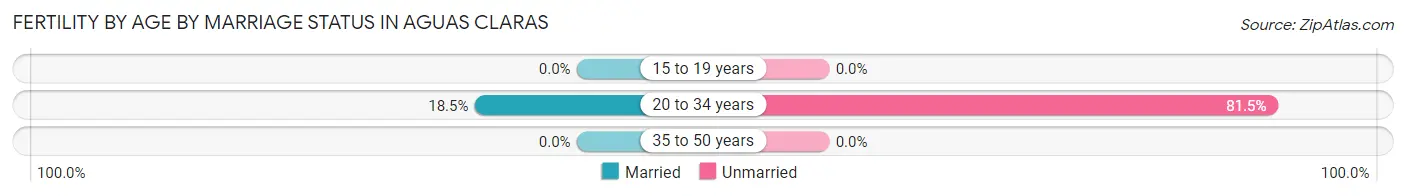
| Age Bracket | Married | Unmarried |
| 15 to 19 years | 0 (0.0%) | 0 (0.0%) |
| 20 to 34 years | 10 (18.5%) | 44 (81.5%) |
| 35 to 50 years | 0 (0.0%) | 0 (0.0%) |
| Total | 10 (18.5%) | 44 (81.5%) |
Fertility by Education in Aguas Claras
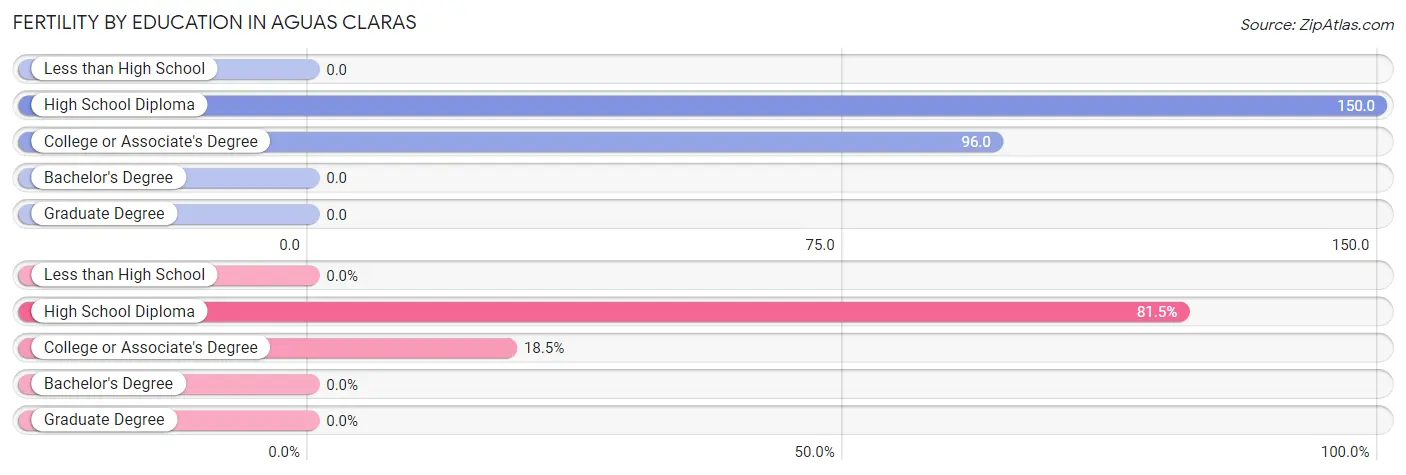
| Educational Attainment | Women with Births | Births / 1,000 Women |
| Less than High School | 0 (0.0%) | 0.0 |
| High School Diploma | 44 (81.5%) | 150.0 |
| College or Associate's Degree | 10 (18.5%) | 96.0 |
| Bachelor's Degree | 0 (0.0%) | 0.0 |
| Graduate Degree | 0 (0.0%) | 0.0 |
| Total | 54 (100.0%) | 93.0 |
Fertility by Education by Marriage Status in Aguas Claras
81.5% of women with births in Aguas Claras are unmarried. Women with the educational attainment of college or associate's degree are most likely to be married with 100.0% of them married at childbirth, while women with the educational attainment of high school diploma are least likely to be married with 100.0% of them unmarried at childbirth.
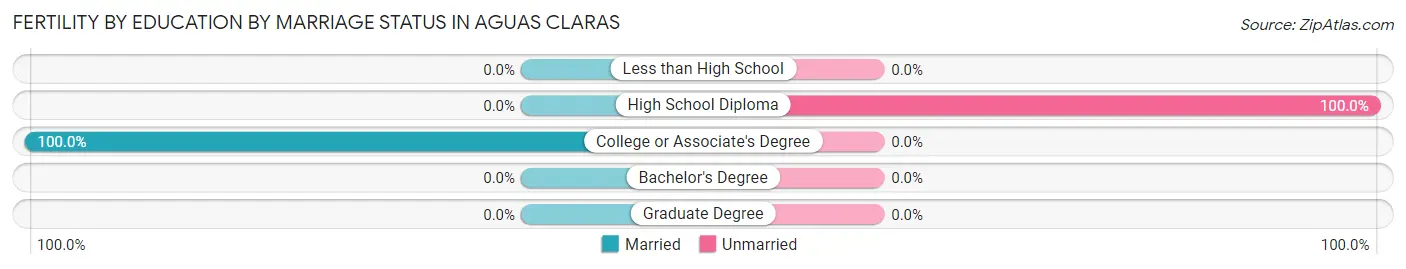
| Educational Attainment | Married | Unmarried |
| Less than High School | 0 (0.0%) | 0 (0.0%) |
| High School Diploma | 0 (0.0%) | 44 (100.0%) |
| College or Associate's Degree | 10 (100.0%) | 0 (0.0%) |
| Bachelor's Degree | 0 (0.0%) | 0 (0.0%) |
| Graduate Degree | 0 (0.0%) | 0 (0.0%) |
| Total | 10 (18.5%) | 44 (81.5%) |
Employment Characteristics in Aguas Claras
Employment by Class of Employer in Aguas Claras
Among the 698 employed individuals in Aguas Claras, private company employees (391 | 56.0%), self-employed (not incorporated) (210 | 30.1%), and not-for-profit organizations (43 | 6.2%) make up the most common classes of employment.
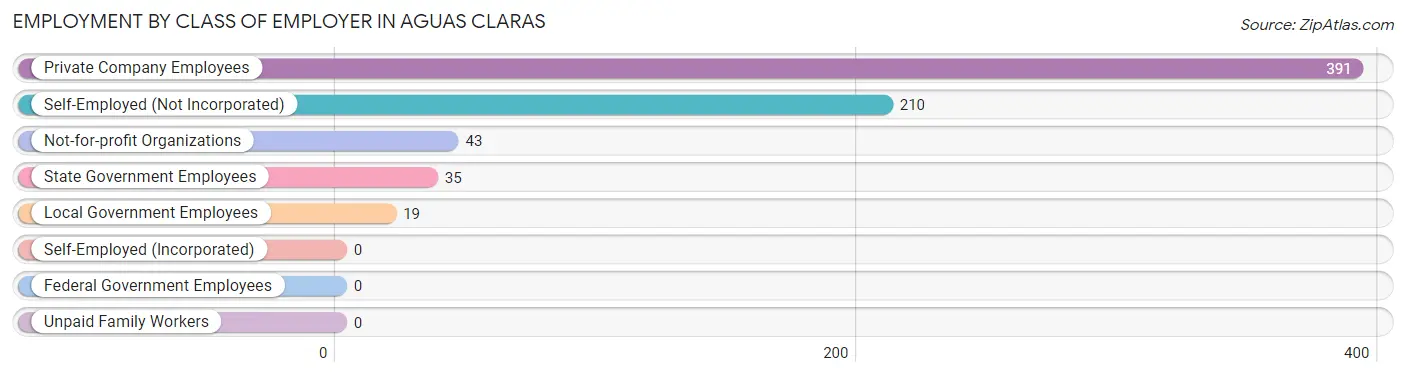
| Employer Class | # Employees | % Employees |
| Private Company Employees | 391 | 56.0% |
| Self-Employed (Incorporated) | 0 | 0.0% |
| Self-Employed (Not Incorporated) | 210 | 30.1% |
| Not-for-profit Organizations | 43 | 6.2% |
| Local Government Employees | 19 | 2.7% |
| State Government Employees | 35 | 5.0% |
| Federal Government Employees | 0 | 0.0% |
| Unpaid Family Workers | 0 | 0.0% |
| Total | 698 | 100.0% |
Employment Status by Age in Aguas Claras
According to the labor force statistics for Aguas Claras, out of the total population over 16 years of age (2,103), 36.8% or 774 individuals are in the labor force, with 9.7% or 75 of them unemployed. The age group with the highest labor force participation rate is 55 to 59 years, with 92.8% or 64 individuals in the labor force. Within the labor force, the 20 to 24 years age range has the highest percentage of unemployed individuals, with 32.4% or 24 of them being unemployed.
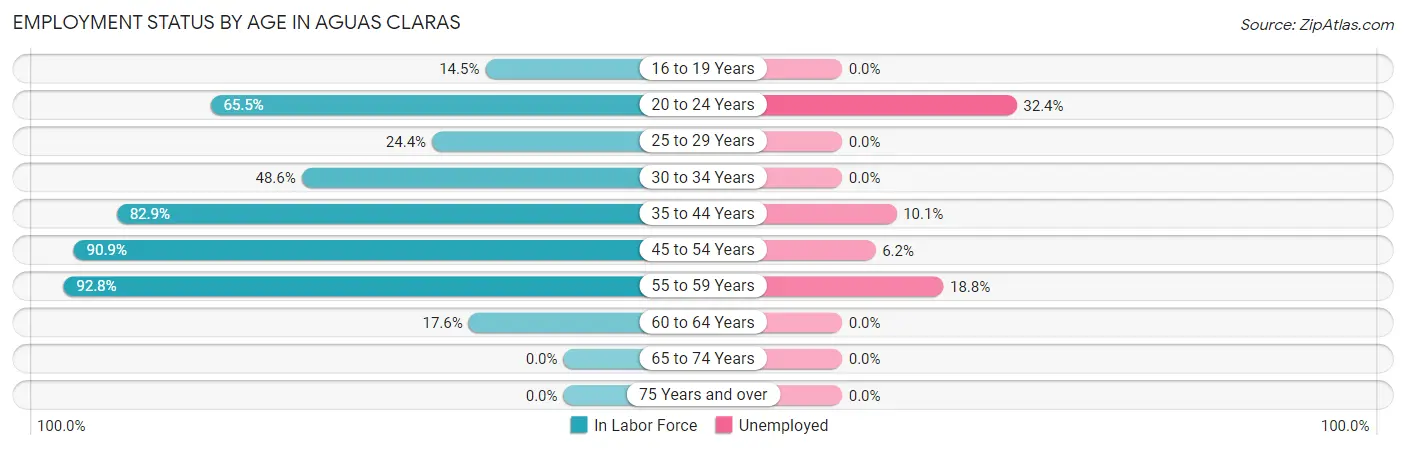
| Age Bracket | In Labor Force | Unemployed |
| 16 to 19 Years | 18 (14.5%) | 0 (0.0%) |
| 20 to 24 Years | 74 (65.5%) | 24 (32.4%) |
| 25 to 29 Years | 33 (24.4%) | 0 (0.0%) |
| 30 to 34 Years | 51 (48.6%) | 0 (0.0%) |
| 35 to 44 Years | 208 (82.9%) | 21 (10.1%) |
| 45 to 54 Years | 289 (90.9%) | 18 (6.2%) |
| 55 to 59 Years | 64 (92.8%) | 12 (18.8%) |
| 60 to 64 Years | 36 (17.6%) | 0 (0.0%) |
| 65 to 74 Years | 0 (0.0%) | 0 (0.0%) |
| 75 Years and over | 0 (0.0%) | 0 (0.0%) |
| Total | 774 (36.8%) | 75 (9.7%) |
Employment Status by Educational Attainment in Aguas Claras
According to labor force statistics for Aguas Claras, 62.9% of individuals (681) out of the total population between 25 and 64 years of age (1,082) are in the labor force, with 7.5% or 51 of them being unemployed. The group with the highest labor force participation rate are those with the educational attainment of bachelor's degree or higher, with 100.0% or 163 individuals in the labor force. Within the labor force, individuals with college / associate degree education have the highest percentage of unemployment, with 16.4% or 18 of them being unemployed.
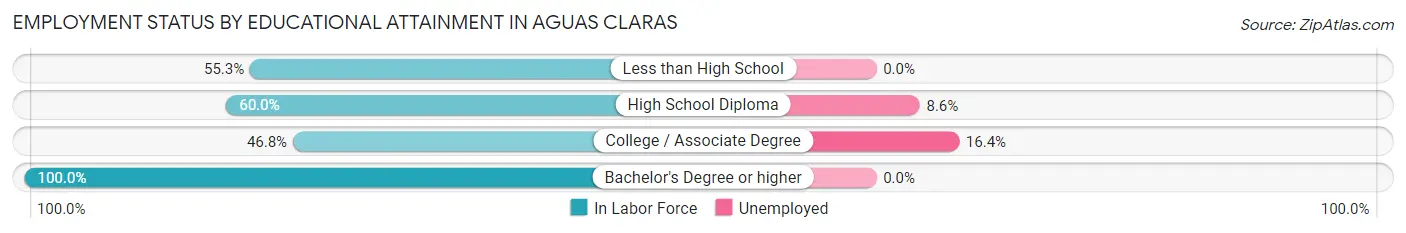
| Educational Attainment | In Labor Force | Unemployed |
| Less than High School | 26 (55.3%) | 0 (0.0%) |
| High School Diploma | 382 (60.0%) | 55 (8.6%) |
| College / Associate Degree | 110 (46.8%) | 39 (16.4%) |
| Bachelor's Degree or higher | 163 (100.0%) | 0 (0.0%) |
| Total | 681 (62.9%) | 81 (7.5%) |
Employment Occupations by Sex in Aguas Claras
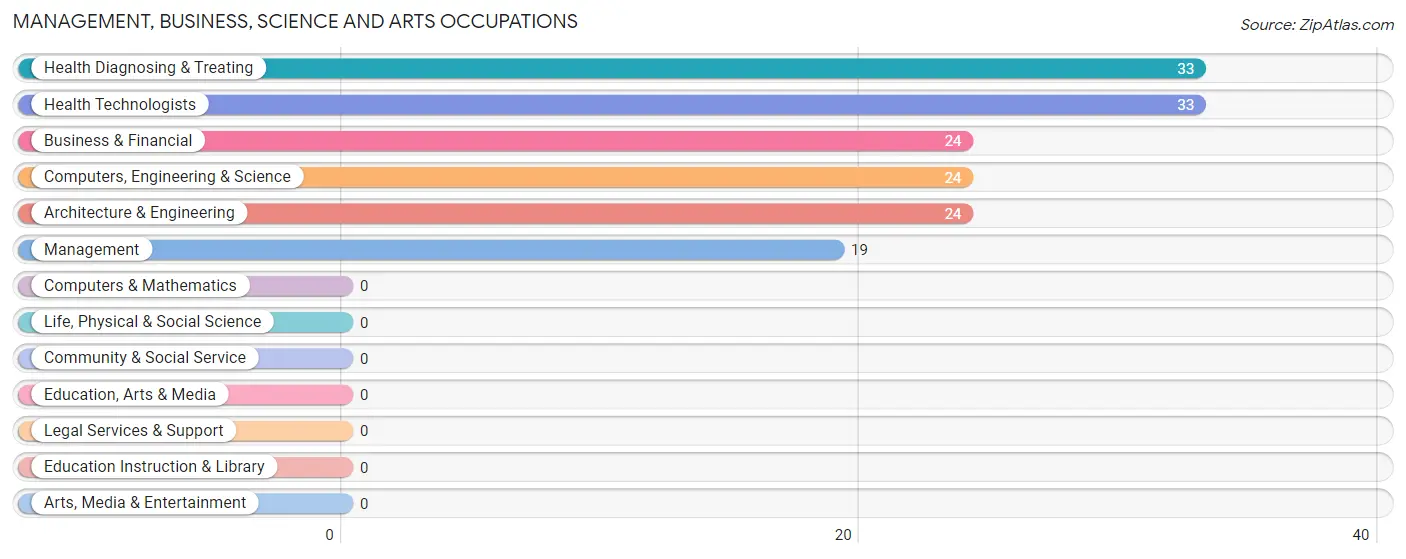
Management, Business, Science and Arts Occupations
The most common Management, Business, Science and Arts occupations in Aguas Claras are Health Diagnosing & Treating (33 | 4.7%), Health Technologists (33 | 4.7%), Business & Financial (24 | 3.4%), Computers, Engineering & Science (24 | 3.4%), and Architecture & Engineering (24 | 3.4%).
Management, Business, Science and Arts Occupations by Sex
Within the Management, Business, Science and Arts occupations in Aguas Claras, the most male-oriented occupations are Health Diagnosing & Treating (100.0%), and Health Technologists (100.0%), while the most female-oriented occupations are Management (100.0%), Business & Financial (100.0%), and Computers, Engineering & Science (100.0%).
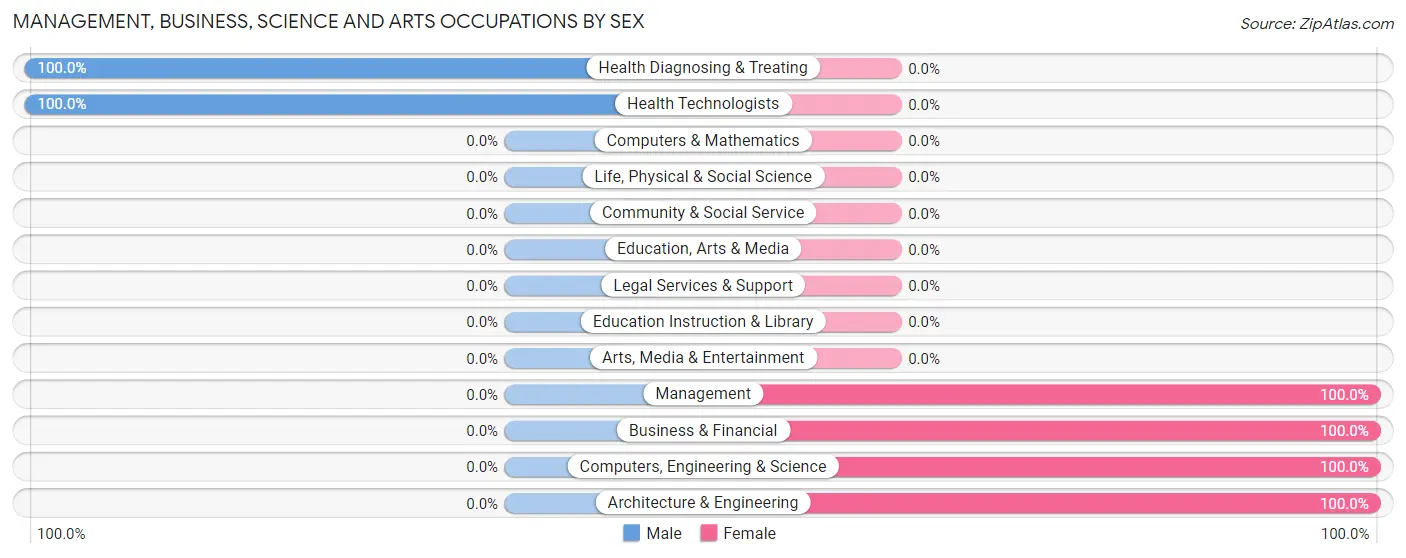
| Occupation | Male | Female |
| Management | 0 (0.0%) | 19 (100.0%) |
| Business & Financial | 0 (0.0%) | 24 (100.0%) |
| Computers, Engineering & Science | 0 (0.0%) | 24 (100.0%) |
| Computers & Mathematics | 0 (0.0%) | 0 (0.0%) |
| Architecture & Engineering | 0 (0.0%) | 24 (100.0%) |
| Life, Physical & Social Science | 0 (0.0%) | 0 (0.0%) |
| Community & Social Service | 0 (0.0%) | 0 (0.0%) |
| Education, Arts & Media | 0 (0.0%) | 0 (0.0%) |
| Legal Services & Support | 0 (0.0%) | 0 (0.0%) |
| Education Instruction & Library | 0 (0.0%) | 0 (0.0%) |
| Arts, Media & Entertainment | 0 (0.0%) | 0 (0.0%) |
| Health Diagnosing & Treating | 33 (100.0%) | 0 (0.0%) |
| Health Technologists | 33 (100.0%) | 0 (0.0%) |
| Total (Category) | 33 (33.0%) | 67 (67.0%) |
| Total (Overall) | 383 (54.9%) | 315 (45.1%) |
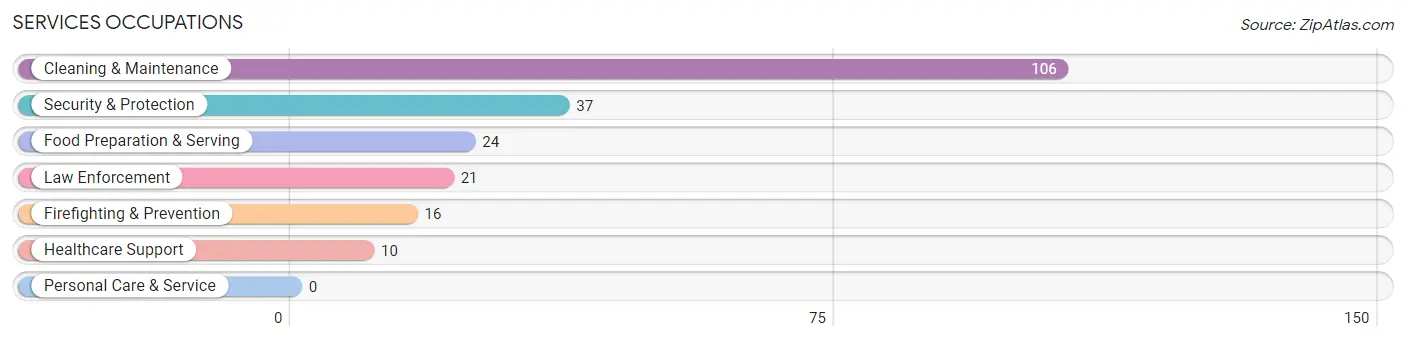
Services Occupations
The most common Services occupations in Aguas Claras are Cleaning & Maintenance (106 | 15.2%), Security & Protection (37 | 5.3%), Food Preparation & Serving (24 | 3.4%), Law Enforcement (21 | 3.0%), and Firefighting & Prevention (16 | 2.3%).
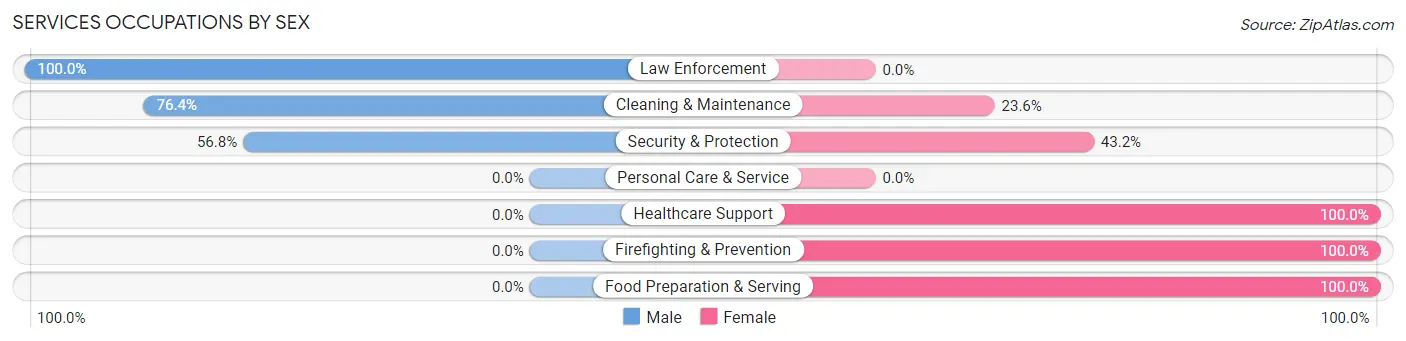
Services Occupations by Sex
Within the Services occupations in Aguas Claras, the most male-oriented occupations are Law Enforcement (100.0%), Cleaning & Maintenance (76.4%), and Security & Protection (56.8%), while the most female-oriented occupations are Healthcare Support (100.0%), Firefighting & Prevention (100.0%), and Food Preparation & Serving (100.0%).
| Occupation | Male | Female |
| Healthcare Support | 0 (0.0%) | 10 (100.0%) |
| Security & Protection | 21 (56.8%) | 16 (43.2%) |
| Firefighting & Prevention | 0 (0.0%) | 16 (100.0%) |
| Law Enforcement | 21 (100.0%) | 0 (0.0%) |
| Food Preparation & Serving | 0 (0.0%) | 24 (100.0%) |
| Cleaning & Maintenance | 81 (76.4%) | 25 (23.6%) |
| Personal Care & Service | 0 (0.0%) | 0 (0.0%) |
| Total (Category) | 102 (57.6%) | 75 (42.4%) |
| Total (Overall) | 383 (54.9%) | 315 (45.1%) |
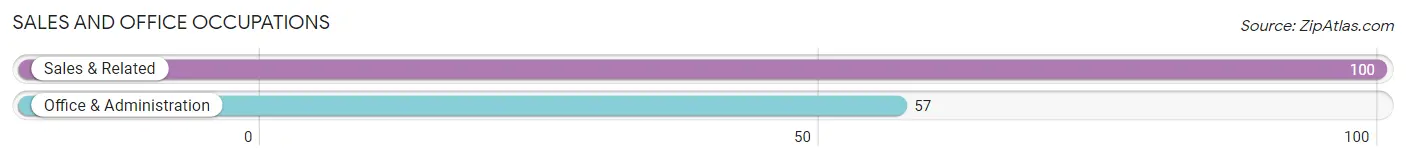
Sales and Office Occupations
The most common Sales and Office occupations in Aguas Claras are Sales & Related (100 | 14.3%), and Office & Administration (57 | 8.2%).
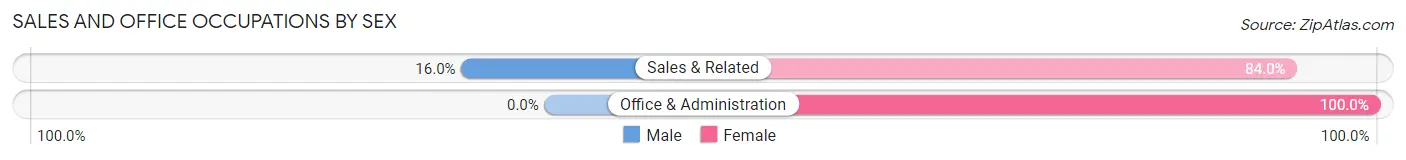
Sales and Office Occupations by Sex
| Occupation | Male | Female |
| Sales & Related | 16 (16.0%) | 84 (84.0%) |
| Office & Administration | 0 (0.0%) | 57 (100.0%) |
| Total (Category) | 16 (10.2%) | 141 (89.8%) |
| Total (Overall) | 383 (54.9%) | 315 (45.1%) |
Natural Resources, Construction and Maintenance Occupations
The most common Natural Resources, Construction and Maintenance occupations in Aguas Claras are Construction & Extraction (103 | 14.8%), and Installation, Maintenance & Repair (67 | 9.6%).
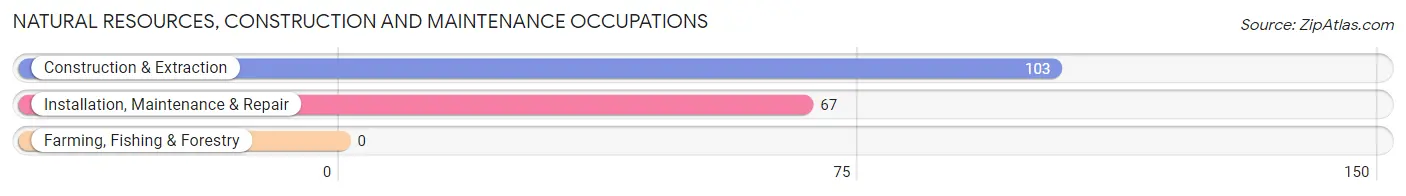
Natural Resources, Construction and Maintenance Occupations by Sex
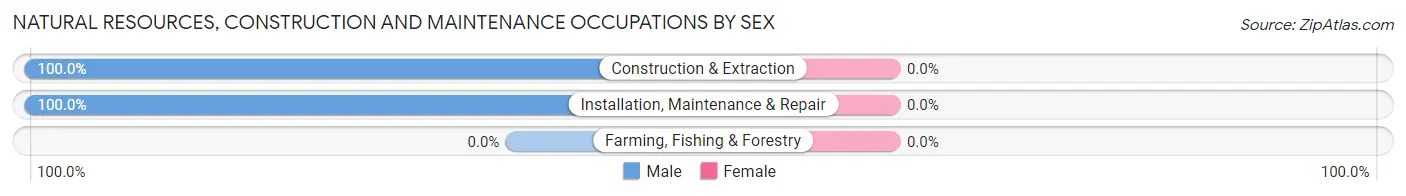
| Occupation | Male | Female |
| Farming, Fishing & Forestry | 0 (0.0%) | 0 (0.0%) |
| Construction & Extraction | 103 (100.0%) | 0 (0.0%) |
| Installation, Maintenance & Repair | 67 (100.0%) | 0 (0.0%) |
| Total (Category) | 170 (100.0%) | 0 (0.0%) |
| Total (Overall) | 383 (54.9%) | 315 (45.1%) |
Production, Transportation and Moving Occupations
The most common Production, Transportation and Moving occupations in Aguas Claras are Transportation (36 | 5.2%), Production (32 | 4.6%), and Material Moving (26 | 3.7%).
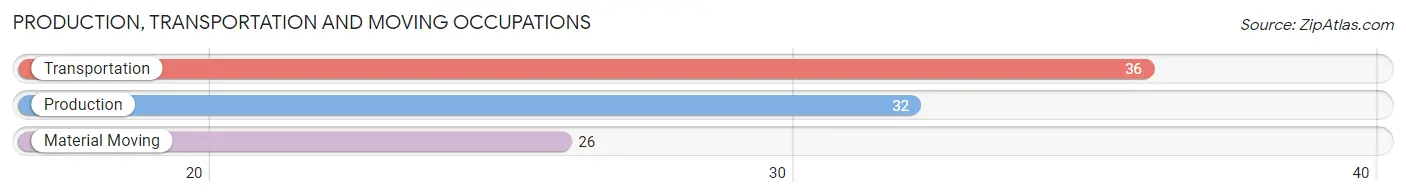
Production, Transportation and Moving Occupations by Sex
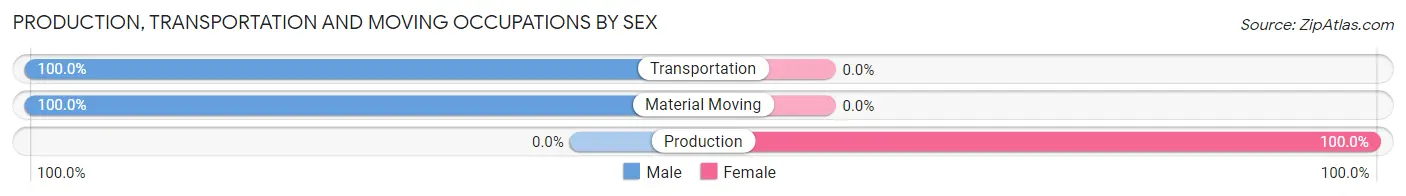
| Occupation | Male | Female |
| Production | 0 (0.0%) | 32 (100.0%) |
| Transportation | 36 (100.0%) | 0 (0.0%) |
| Material Moving | 26 (100.0%) | 0 (0.0%) |
| Total (Category) | 62 (66.0%) | 32 (34.0%) |
| Total (Overall) | 383 (54.9%) | 315 (45.1%) |
Employment Industries by Sex in Aguas Claras
Employment Industries in Aguas Claras
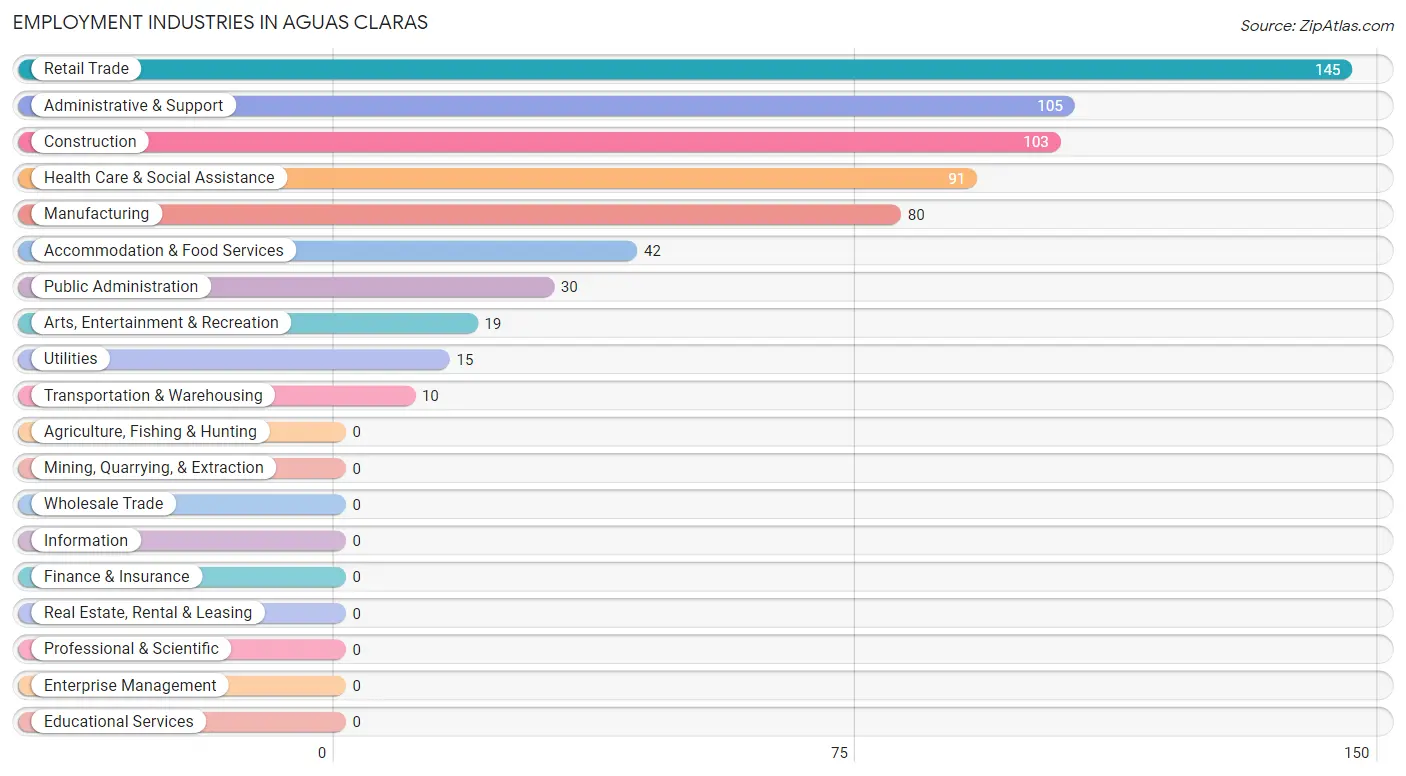
The major employment industries in Aguas Claras include Retail Trade (145 | 20.8%), Administrative & Support (105 | 15.0%), Construction (103 | 14.8%), Health Care & Social Assistance (91 | 13.0%), and Manufacturing (80 | 11.5%).
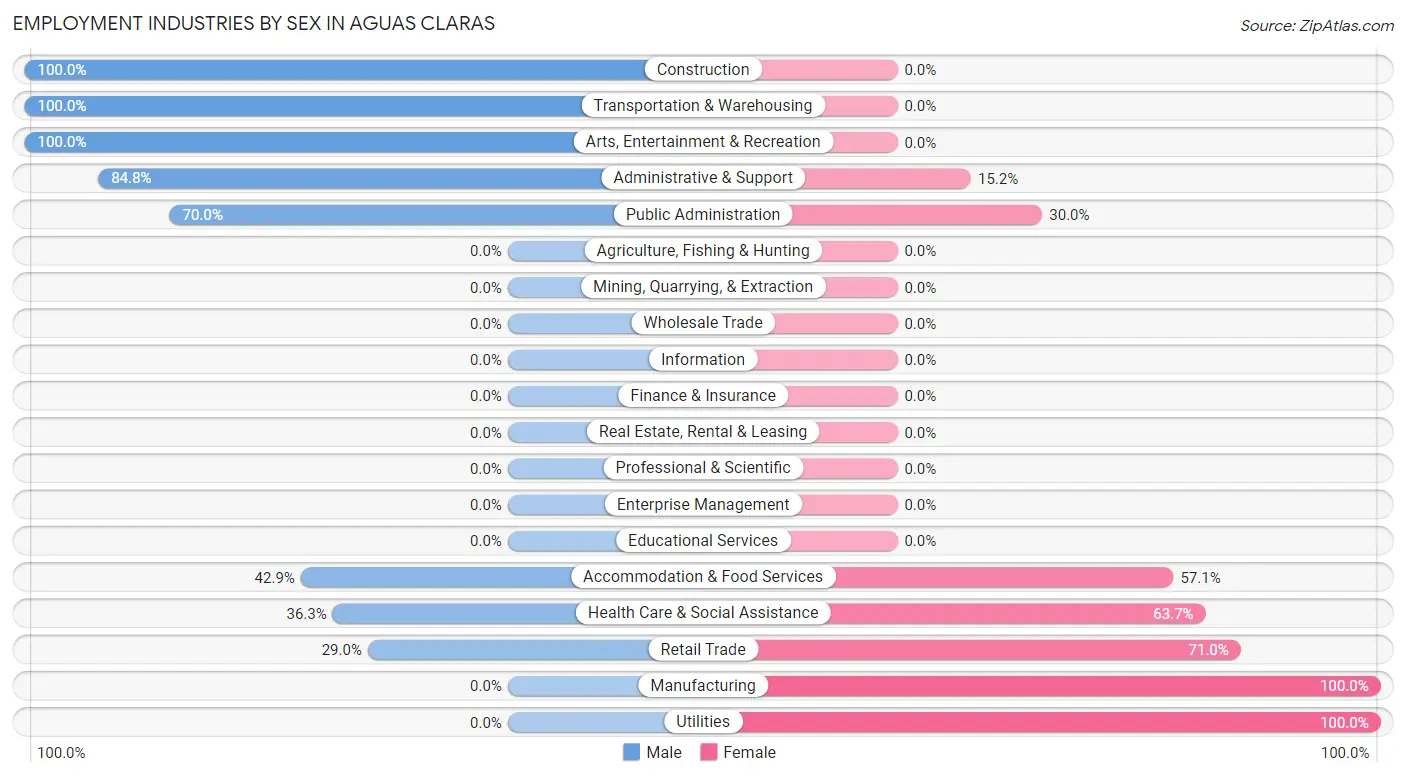
Employment Industries by Sex in Aguas Claras
The Aguas Claras industries that see more men than women are Construction (100.0%), Transportation & Warehousing (100.0%), and Arts, Entertainment & Recreation (100.0%), whereas the industries that tend to have a higher number of women are Manufacturing (100.0%), Utilities (100.0%), and Retail Trade (71.0%).
| Industry | Male | Female |
| Agriculture, Fishing & Hunting | 0 (0.0%) | 0 (0.0%) |
| Mining, Quarrying, & Extraction | 0 (0.0%) | 0 (0.0%) |
| Construction | 103 (100.0%) | 0 (0.0%) |
| Manufacturing | 0 (0.0%) | 80 (100.0%) |
| Wholesale Trade | 0 (0.0%) | 0 (0.0%) |
| Retail Trade | 42 (29.0%) | 103 (71.0%) |
| Transportation & Warehousing | 10 (100.0%) | 0 (0.0%) |
| Utilities | 0 (0.0%) | 15 (100.0%) |
| Information | 0 (0.0%) | 0 (0.0%) |
| Finance & Insurance | 0 (0.0%) | 0 (0.0%) |
| Real Estate, Rental & Leasing | 0 (0.0%) | 0 (0.0%) |
| Professional & Scientific | 0 (0.0%) | 0 (0.0%) |
| Enterprise Management | 0 (0.0%) | 0 (0.0%) |
| Administrative & Support | 89 (84.8%) | 16 (15.2%) |
| Educational Services | 0 (0.0%) | 0 (0.0%) |
| Health Care & Social Assistance | 33 (36.3%) | 58 (63.7%) |
| Arts, Entertainment & Recreation | 19 (100.0%) | 0 (0.0%) |
| Accommodation & Food Services | 18 (42.9%) | 24 (57.1%) |
| Public Administration | 21 (70.0%) | 9 (30.0%) |
| Total | 383 (54.9%) | 315 (45.1%) |
Education in Aguas Claras
School Enrollment in Aguas Claras
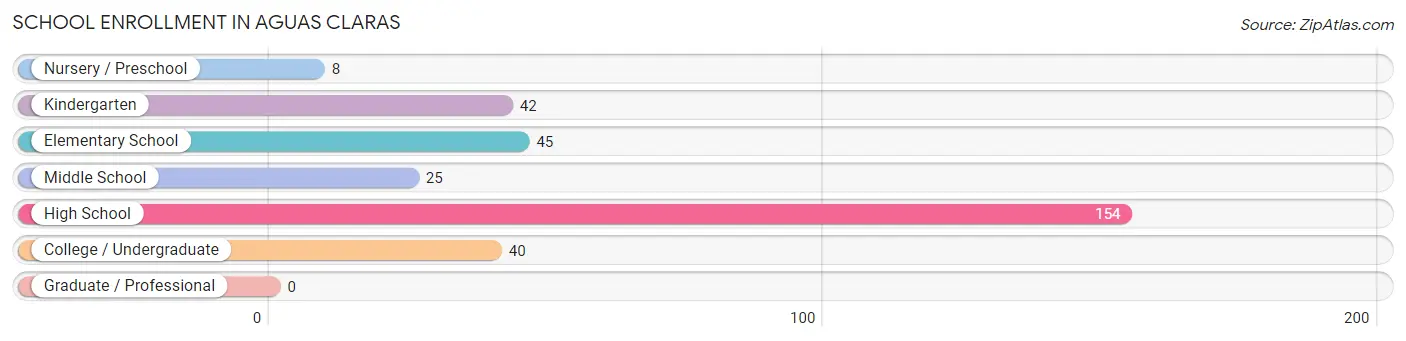
The most common levels of schooling among the 314 students in Aguas Claras are high school (154 | 49.0%), elementary school (45 | 14.3%), and kindergarten (42 | 13.4%).
| School Level | # Students | % Students |
| Nursery / Preschool | 8 | 2.5% |
| Kindergarten | 42 | 13.4% |
| Elementary School | 45 | 14.3% |
| Middle School | 25 | 8.0% |
| High School | 154 | 49.0% |
| College / Undergraduate | 40 | 12.7% |
| Graduate / Professional | 0 | 0.0% |
| Total | 314 | 100.0% |
School Enrollment by Age by Funding Source in Aguas Claras
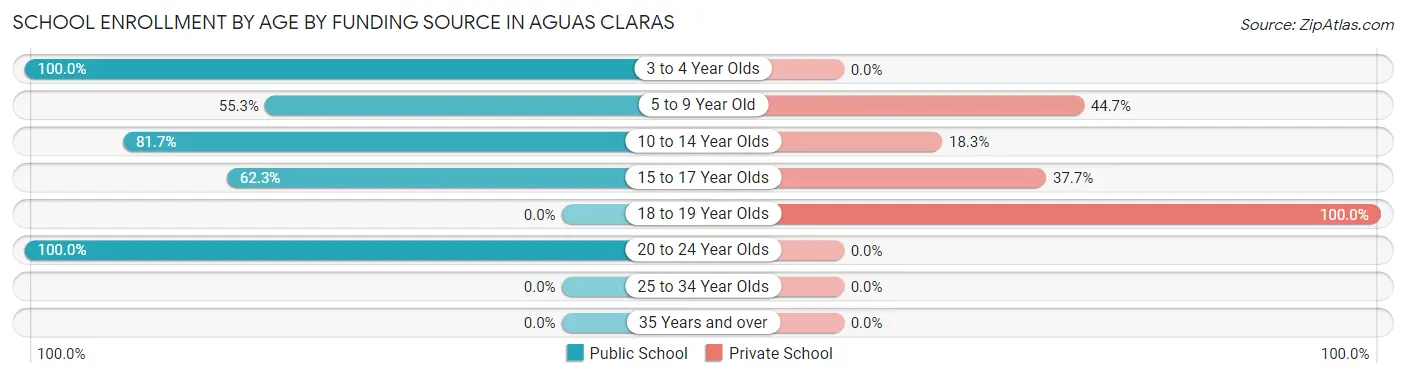
Out of a total of 314 students who are enrolled in schools in Aguas Claras, 124 (39.5%) attend a private institution, while the remaining 190 (60.5%) are enrolled in public schools. The age group of 18 to 19 year olds has the highest likelihood of being enrolled in private schools, with 30 (100.0% in the age bracket) enrolled. Conversely, the age group of 3 to 4 year olds has the lowest likelihood of being enrolled in a private school, with 8 (100.0% in the age bracket) attending a public institution.
| Age Bracket | Public School | Private School |
| 3 to 4 Year Olds | 8 (100.0%) | 0 (0.0%) |
| 5 to 9 Year Old | 42 (55.3%) | 34 (44.7%) |
| 10 to 14 Year Olds | 49 (81.7%) | 11 (18.3%) |
| 15 to 17 Year Olds | 81 (62.3%) | 49 (37.7%) |
| 18 to 19 Year Olds | 0 (0.0%) | 30 (100.0%) |
| 20 to 24 Year Olds | 10 (100.0%) | 0 (0.0%) |
| 25 to 34 Year Olds | 0 (0.0%) | 0 (0.0%) |
| 35 Years and over | 0 (0.0%) | 0 (0.0%) |
| Total | 190 (60.5%) | 124 (39.5%) |
Educational Attainment by Field of Study in Aguas Claras
Business (72 | 32.9%), science & technology (65 | 29.7%), education (36 | 16.4%), arts & humanities (26 | 11.9%), and physical & health sciences (14 | 6.4%) are the most common fields of study among 219 individuals in Aguas Claras who have obtained a bachelor's degree or higher.
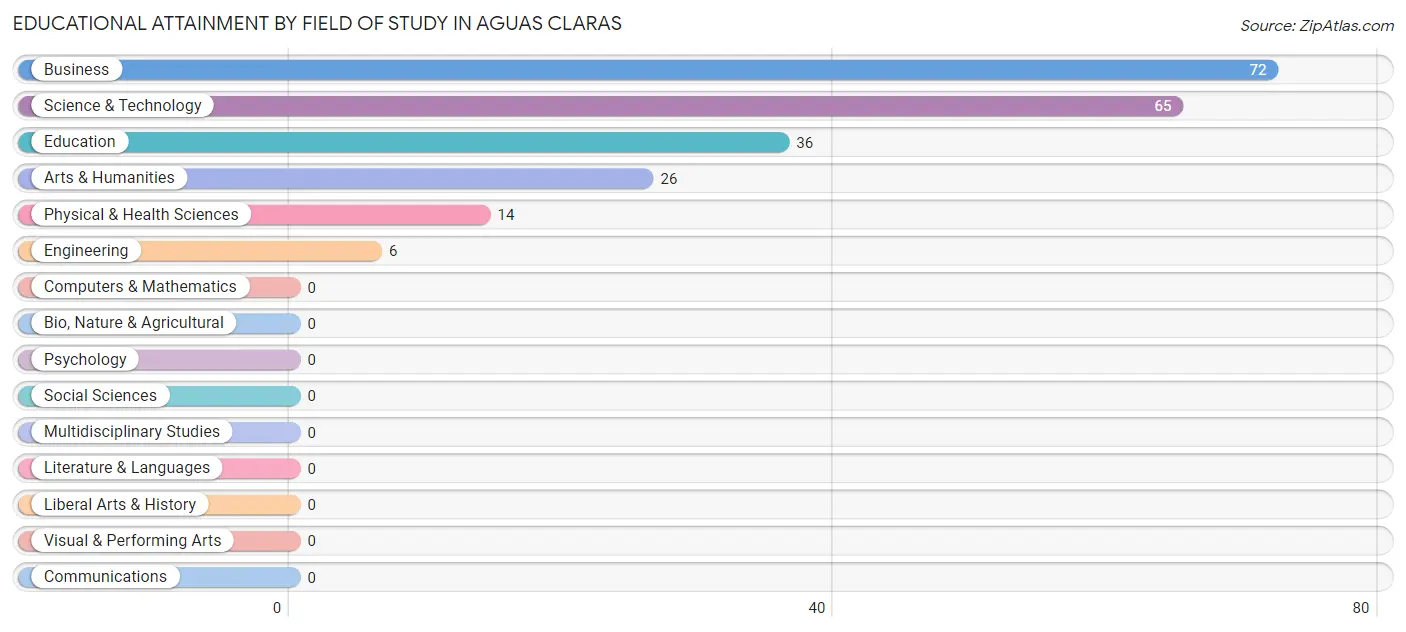
| Field of Study | # Graduates | % Graduates |
| Computers & Mathematics | 0 | 0.0% |
| Bio, Nature & Agricultural | 0 | 0.0% |
| Physical & Health Sciences | 14 | 6.4% |
| Psychology | 0 | 0.0% |
| Social Sciences | 0 | 0.0% |
| Engineering | 6 | 2.7% |
| Multidisciplinary Studies | 0 | 0.0% |
| Science & Technology | 65 | 29.7% |
| Business | 72 | 32.9% |
| Education | 36 | 16.4% |
| Literature & Languages | 0 | 0.0% |
| Liberal Arts & History | 0 | 0.0% |
| Visual & Performing Arts | 0 | 0.0% |
| Communications | 0 | 0.0% |
| Arts & Humanities | 26 | 11.9% |
| Total | 219 | 100.0% |
Transportation & Commute in Aguas Claras
Vehicle Availability by Sex in Aguas Claras
The most prevalent vehicle ownership categories in Aguas Claras are males with 2 vehicles (127, accounting for 33.2%) and females with 2 vehicles (184, making up 40.3%).
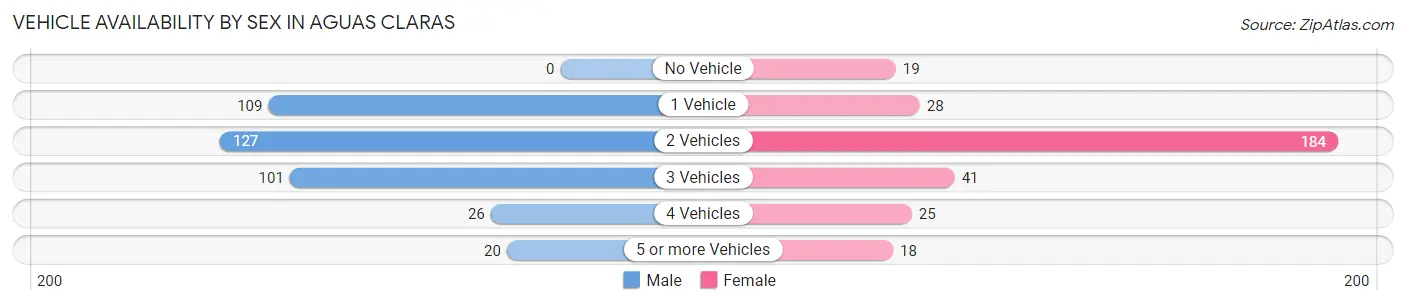
| Vehicles Available | Male | Female |
| No Vehicle | 0 (0.0%) | 19 (6.0%) |
| 1 Vehicle | 109 (28.5%) | 28 (8.9%) |
| 2 Vehicles | 127 (33.2%) | 184 (58.4%) |
| 3 Vehicles | 101 (26.4%) | 41 (13.0%) |
| 4 Vehicles | 26 (6.8%) | 25 (7.9%) |
| 5 or more Vehicles | 20 (5.2%) | 18 (5.7%) |
| Total | 383 (100.0%) | 315 (100.0%) |
Commute Time in Aguas Claras
The most frequently occuring commute durations in Aguas Claras are 15 to 19 minutes (192 commuters, 29.0%), 20 to 24 minutes (128 commuters, 19.3%), and 30 to 34 minutes (114 commuters, 17.2%).
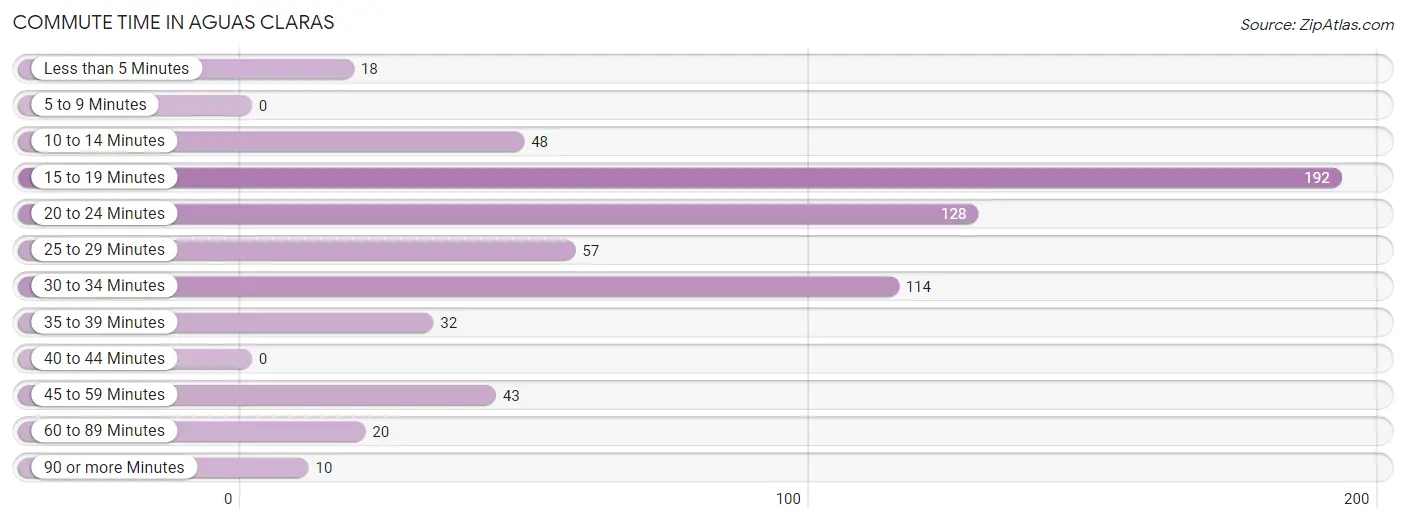
| Commute Time | # Commuters | % Commuters |
| Less than 5 Minutes | 18 | 2.7% |
| 5 to 9 Minutes | 0 | 0.0% |
| 10 to 14 Minutes | 48 | 7.2% |
| 15 to 19 Minutes | 192 | 29.0% |
| 20 to 24 Minutes | 128 | 19.3% |
| 25 to 29 Minutes | 57 | 8.6% |
| 30 to 34 Minutes | 114 | 17.2% |
| 35 to 39 Minutes | 32 | 4.8% |
| 40 to 44 Minutes | 0 | 0.0% |
| 45 to 59 Minutes | 43 | 6.5% |
| 60 to 89 Minutes | 20 | 3.0% |
| 90 or more Minutes | 10 | 1.5% |
Commute Time by Sex in Aguas Claras
The most common commute times in Aguas Claras are 15 to 19 minutes (133 commuters, 38.3%) for males and 20 to 24 minutes (84 commuters, 26.7%) for females.
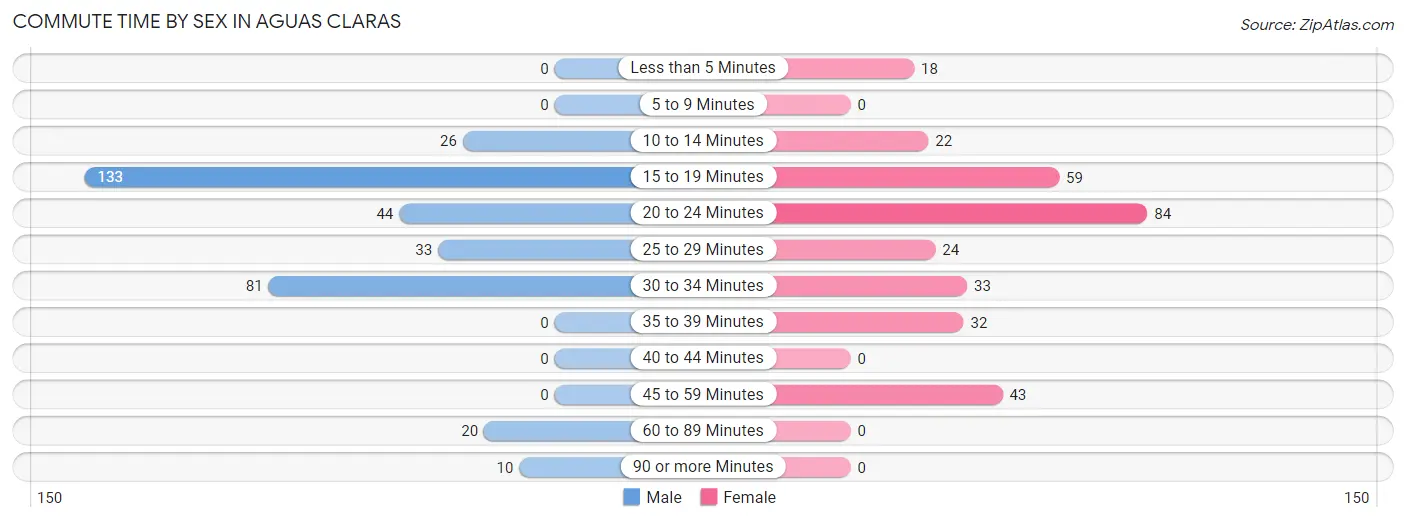
| Commute Time | Male | Female |
| Less than 5 Minutes | 0 (0.0%) | 18 (5.7%) |
| 5 to 9 Minutes | 0 (0.0%) | 0 (0.0%) |
| 10 to 14 Minutes | 26 (7.5%) | 22 (7.0%) |
| 15 to 19 Minutes | 133 (38.3%) | 59 (18.7%) |
| 20 to 24 Minutes | 44 (12.7%) | 84 (26.7%) |
| 25 to 29 Minutes | 33 (9.5%) | 24 (7.6%) |
| 30 to 34 Minutes | 81 (23.3%) | 33 (10.5%) |
| 35 to 39 Minutes | 0 (0.0%) | 32 (10.2%) |
| 40 to 44 Minutes | 0 (0.0%) | 0 (0.0%) |
| 45 to 59 Minutes | 0 (0.0%) | 43 (13.7%) |
| 60 to 89 Minutes | 20 (5.8%) | 0 (0.0%) |
| 90 or more Minutes | 10 (2.9%) | 0 (0.0%) |
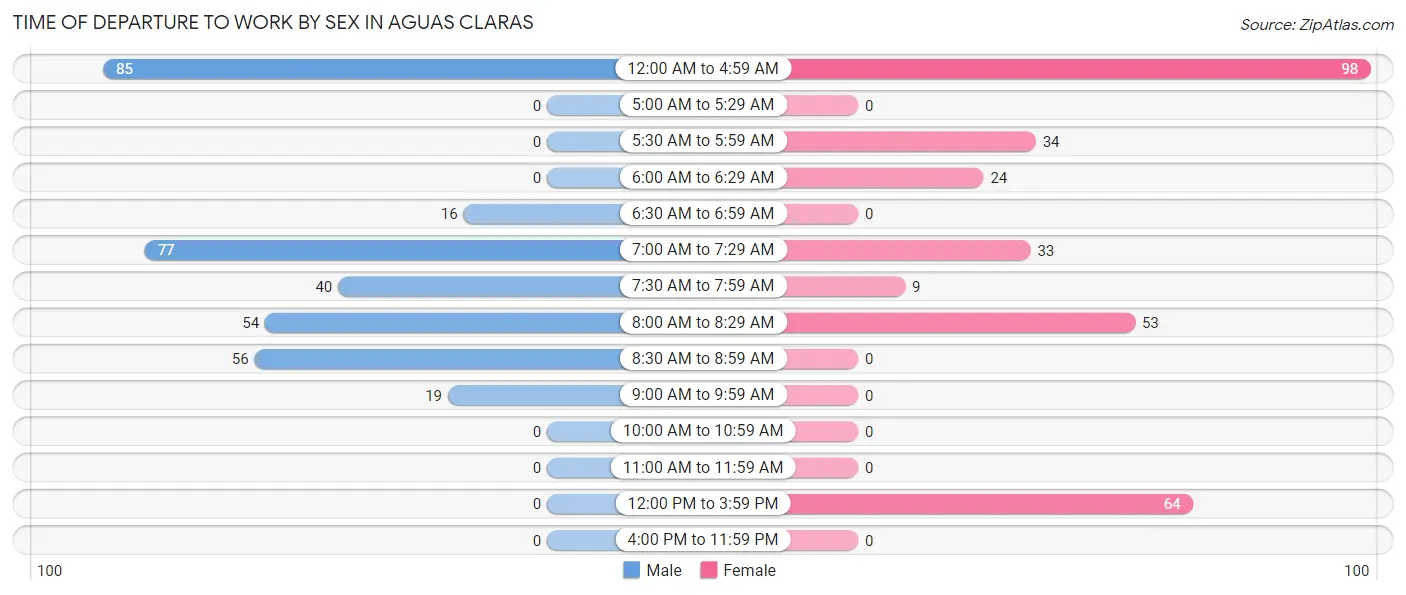
Time of Departure to Work by Sex in Aguas Claras
The most frequent times of departure to work in Aguas Claras are 12:00 AM to 4:59 AM (85, 24.5%) for males and 12:00 AM to 4:59 AM (98, 31.1%) for females.
| Time of Departure | Male | Female |
| 12:00 AM to 4:59 AM | 85 (24.5%) | 98 (31.1%) |
| 5:00 AM to 5:29 AM | 0 (0.0%) | 0 (0.0%) |
| 5:30 AM to 5:59 AM | 0 (0.0%) | 34 (10.8%) |
| 6:00 AM to 6:29 AM | 0 (0.0%) | 24 (7.6%) |
| 6:30 AM to 6:59 AM | 16 (4.6%) | 0 (0.0%) |
| 7:00 AM to 7:29 AM | 77 (22.2%) | 33 (10.5%) |
| 7:30 AM to 7:59 AM | 40 (11.5%) | 9 (2.9%) |
| 8:00 AM to 8:29 AM | 54 (15.6%) | 53 (16.8%) |
| 8:30 AM to 8:59 AM | 56 (16.1%) | 0 (0.0%) |
| 9:00 AM to 9:59 AM | 19 (5.5%) | 0 (0.0%) |
| 10:00 AM to 10:59 AM | 0 (0.0%) | 0 (0.0%) |
| 11:00 AM to 11:59 AM | 0 (0.0%) | 0 (0.0%) |
| 12:00 PM to 3:59 PM | 0 (0.0%) | 64 (20.3%) |
| 4:00 PM to 11:59 PM | 0 (0.0%) | 0 (0.0%) |
| Total | 347 (100.0%) | 315 (100.0%) |
Housing Occupancy in Aguas Claras
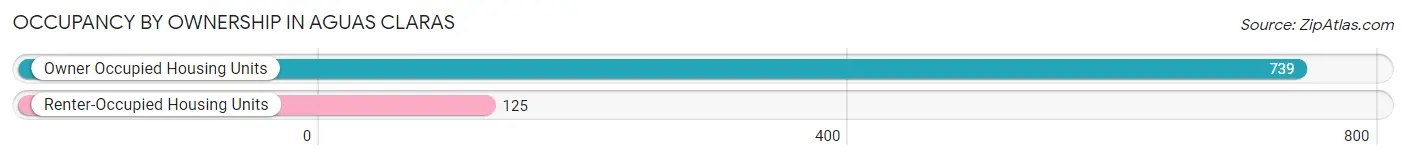
Occupancy by Ownership in Aguas Claras
Of the total 864 dwellings in Aguas Claras, owner-occupied units account for 739 (85.5%), while renter-occupied units make up 125 (14.5%).
| Occupancy | # Housing Units | % Housing Units |
| Owner Occupied Housing Units | 739 | 85.5% |
| Renter-Occupied Housing Units | 125 | 14.5% |
| Total Occupied Housing Units | 864 | 100.0% |
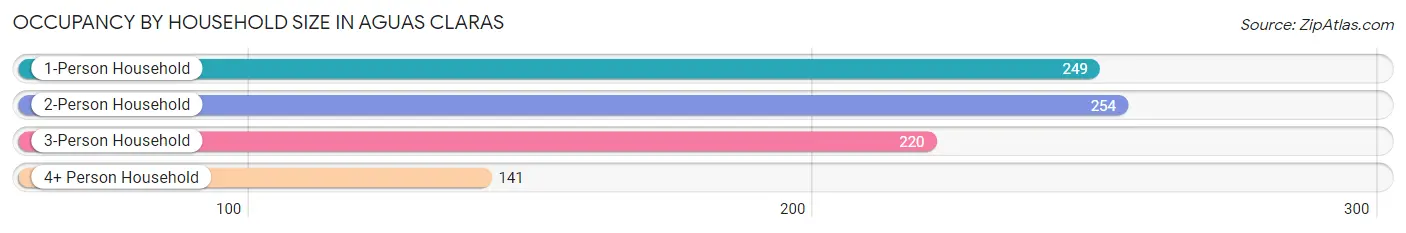
Occupancy by Household Size in Aguas Claras
| Household Size | # Housing Units | % Housing Units |
| 1-Person Household | 249 | 28.8% |
| 2-Person Household | 254 | 29.4% |
| 3-Person Household | 220 | 25.5% |
| 4+ Person Household | 141 | 16.3% |
| Total Housing Units | 864 | 100.0% |
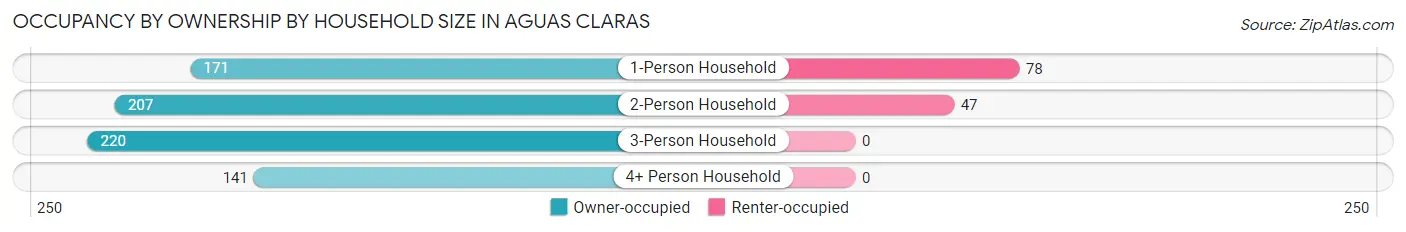
Occupancy by Ownership by Household Size in Aguas Claras
| Household Size | Owner-occupied | Renter-occupied |
| 1-Person Household | 171 (68.7%) | 78 (31.3%) |
| 2-Person Household | 207 (81.5%) | 47 (18.5%) |
| 3-Person Household | 220 (100.0%) | 0 (0.0%) |
| 4+ Person Household | 141 (100.0%) | 0 (0.0%) |
| Total Housing Units | 739 (85.5%) | 125 (14.5%) |
Occupancy by Educational Attainment in Aguas Claras
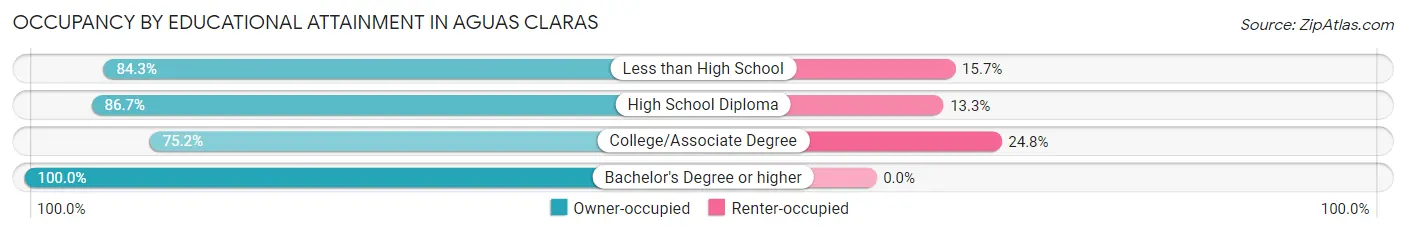
| Household Size | Owner-occupied | Renter-occupied |
| Less than High School | 237 (84.3%) | 44 (15.7%) |
| High School Diploma | 300 (86.7%) | 46 (13.3%) |
| College/Associate Degree | 106 (75.2%) | 35 (24.8%) |
| Bachelor's Degree or higher | 96 (100.0%) | 0 (0.0%) |
Occupancy by Age of Householder in Aguas Claras
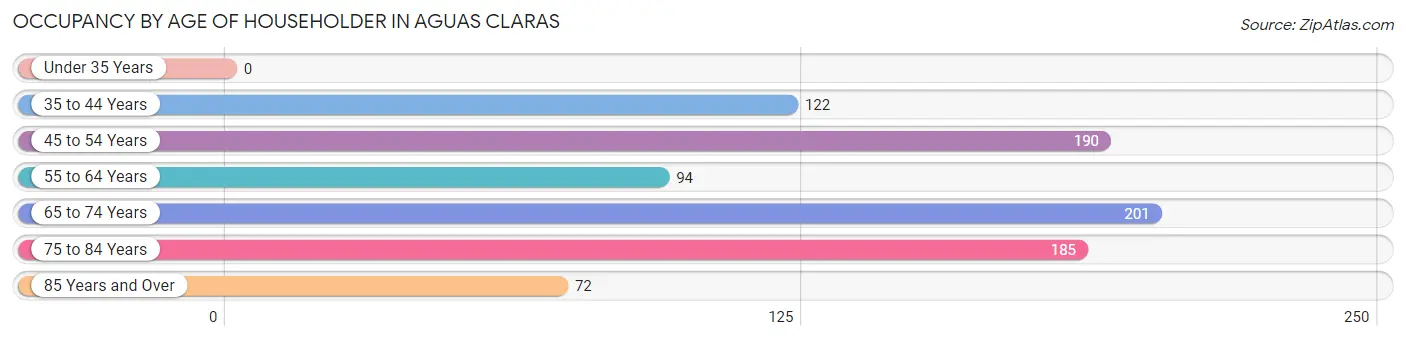
| Age Bracket | # Households | % Households |
| Under 35 Years | 0 | 0.0% |
| 35 to 44 Years | 122 | 14.1% |
| 45 to 54 Years | 190 | 22.0% |
| 55 to 64 Years | 94 | 10.9% |
| 65 to 74 Years | 201 | 23.3% |
| 75 to 84 Years | 185 | 21.4% |
| 85 Years and Over | 72 | 8.3% |
| Total | 864 | 100.0% |
Housing Finances in Aguas Claras
Median Income by Occupancy in Aguas Claras
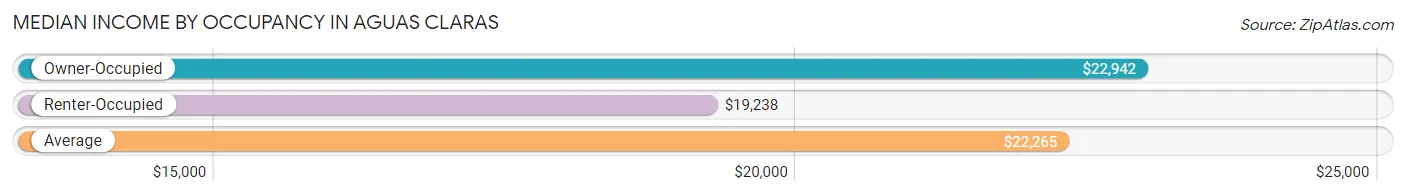
| Occupancy Type | # Households | Median Income |
| Owner-Occupied | 739 (85.5%) | $22,942 |
| Renter-Occupied | 125 (14.5%) | $19,238 |
| Average | 864 (100.0%) | $22,265 |
Occupancy by Householder Income Bracket in Aguas Claras
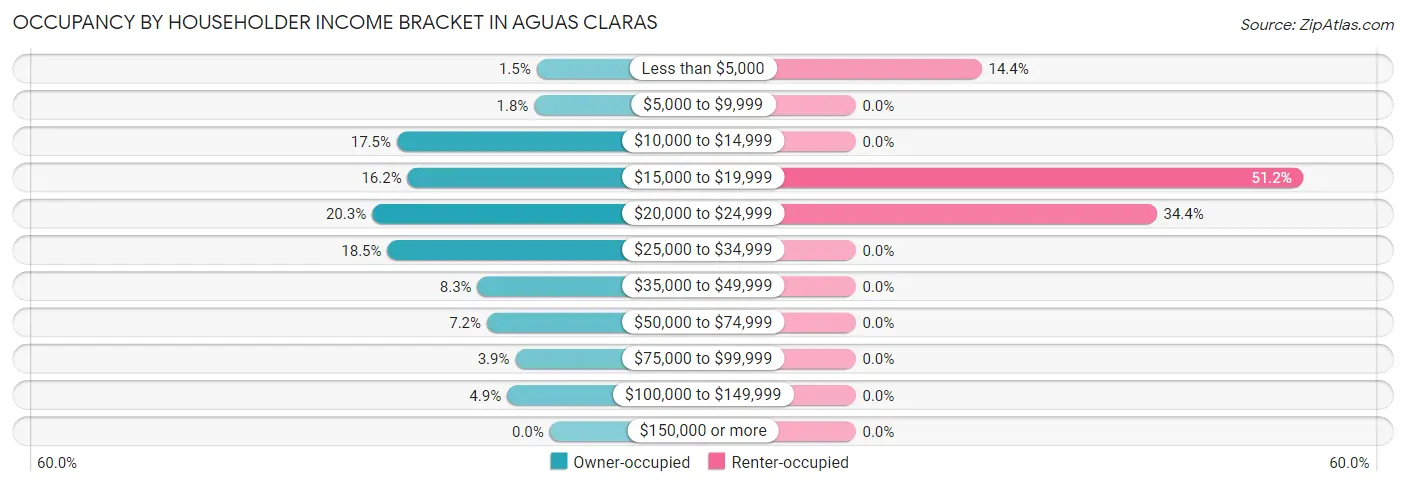
| Income Bracket | Owner-occupied | Renter-occupied |
| Less than $5,000 | 11 (1.5%) | 18 (14.4%) |
| $5,000 to $9,999 | 13 (1.8%) | 0 (0.0%) |
| $10,000 to $14,999 | 129 (17.5%) | 0 (0.0%) |
| $15,000 to $19,999 | 120 (16.2%) | 64 (51.2%) |
| $20,000 to $24,999 | 150 (20.3%) | 43 (34.4%) |
| $25,000 to $34,999 | 137 (18.5%) | 0 (0.0%) |
| $35,000 to $49,999 | 61 (8.3%) | 0 (0.0%) |
| $50,000 to $74,999 | 53 (7.2%) | 0 (0.0%) |
| $75,000 to $99,999 | 29 (3.9%) | 0 (0.0%) |
| $100,000 to $149,999 | 36 (4.9%) | 0 (0.0%) |
| $150,000 or more | 0 (0.0%) | 0 (0.0%) |
| Total | 739 (100.0%) | 125 (100.0%) |
Monthly Housing Cost Tiers in Aguas Claras
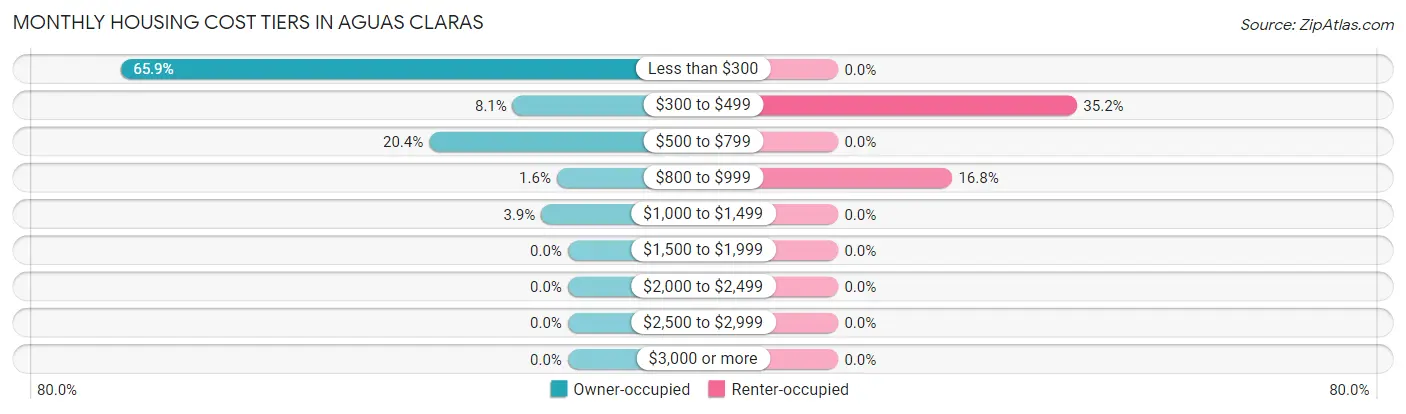
| Monthly Cost | Owner-occupied | Renter-occupied |
| Less than $300 | 487 (65.9%) | 0 (0.0%) |
| $300 to $499 | 60 (8.1%) | 44 (35.2%) |
| $500 to $799 | 151 (20.4%) | 0 (0.0%) |
| $800 to $999 | 12 (1.6%) | 21 (16.8%) |
| $1,000 to $1,499 | 29 (3.9%) | 0 (0.0%) |
| $1,500 to $1,999 | 0 (0.0%) | 0 (0.0%) |
| $2,000 to $2,499 | 0 (0.0%) | 0 (0.0%) |
| $2,500 to $2,999 | 0 (0.0%) | 0 (0.0%) |
| $3,000 or more | 0 (0.0%) | 0 (0.0%) |
| Total | 739 (100.0%) | 125 (100.0%) |
Physical Housing Characteristics in Aguas Claras
Housing Structures in Aguas Claras
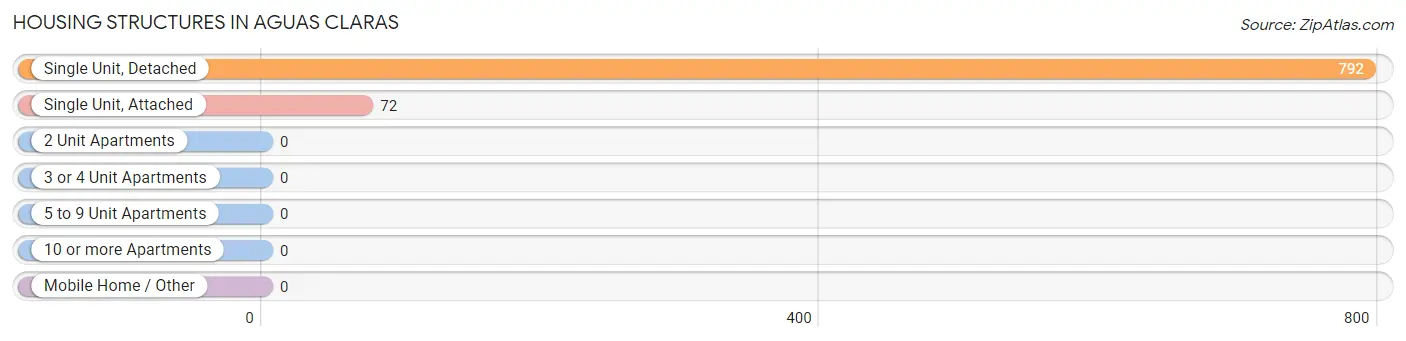
| Structure Type | # Housing Units | % Housing Units |
| Single Unit, Detached | 792 | 91.7% |
| Single Unit, Attached | 72 | 8.3% |
| 2 Unit Apartments | 0 | 0.0% |
| 3 or 4 Unit Apartments | 0 | 0.0% |
| 5 to 9 Unit Apartments | 0 | 0.0% |
| 10 or more Apartments | 0 | 0.0% |
| Mobile Home / Other | 0 | 0.0% |
| Total | 864 | 100.0% |
Housing Structures by Occupancy in Aguas Claras
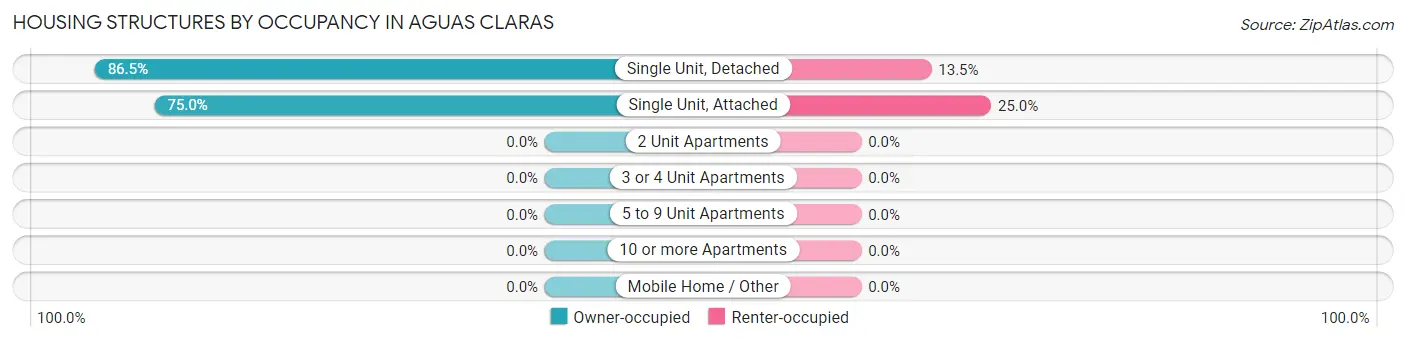
| Structure Type | Owner-occupied | Renter-occupied |
| Single Unit, Detached | 685 (86.5%) | 107 (13.5%) |
| Single Unit, Attached | 54 (75.0%) | 18 (25.0%) |
| 2 Unit Apartments | 0 (0.0%) | 0 (0.0%) |
| 3 or 4 Unit Apartments | 0 (0.0%) | 0 (0.0%) |
| 5 to 9 Unit Apartments | 0 (0.0%) | 0 (0.0%) |
| 10 or more Apartments | 0 (0.0%) | 0 (0.0%) |
| Mobile Home / Other | 0 (0.0%) | 0 (0.0%) |
| Total | 739 (85.5%) | 125 (14.5%) |
Housing Structures by Number of Rooms in Aguas Claras
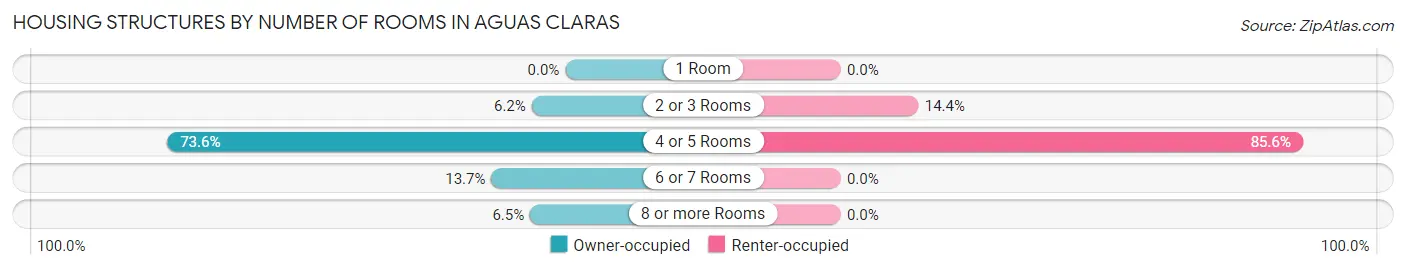
| Number of Rooms | Owner-occupied | Renter-occupied |
| 1 Room | 0 (0.0%) | 0 (0.0%) |
| 2 or 3 Rooms | 46 (6.2%) | 18 (14.4%) |
| 4 or 5 Rooms | 544 (73.6%) | 107 (85.6%) |
| 6 or 7 Rooms | 101 (13.7%) | 0 (0.0%) |
| 8 or more Rooms | 48 (6.5%) | 0 (0.0%) |
| Total | 739 (100.0%) | 125 (100.0%) |
Housing Structure by Heating Type in Aguas Claras
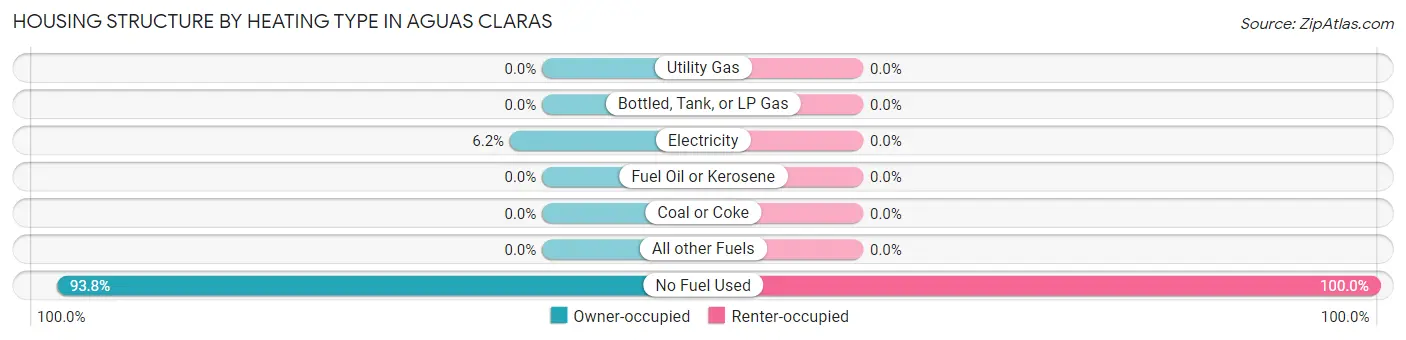
| Heating Type | Owner-occupied | Renter-occupied |
| Utility Gas | 0 (0.0%) | 0 (0.0%) |
| Bottled, Tank, or LP Gas | 0 (0.0%) | 0 (0.0%) |
| Electricity | 46 (6.2%) | 0 (0.0%) |
| Fuel Oil or Kerosene | 0 (0.0%) | 0 (0.0%) |
| Coal or Coke | 0 (0.0%) | 0 (0.0%) |
| All other Fuels | 0 (0.0%) | 0 (0.0%) |
| No Fuel Used | 693 (93.8%) | 125 (100.0%) |
| Total | 739 (100.0%) | 125 (100.0%) |
Household Vehicle Usage in Aguas Claras
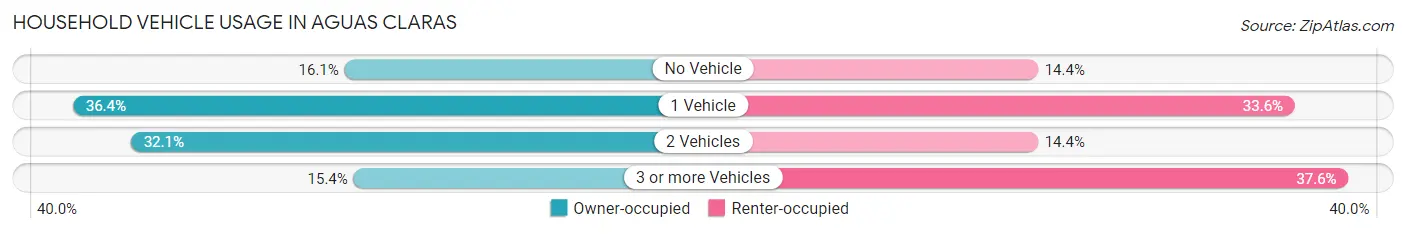
| Vehicles per Household | Owner-occupied | Renter-occupied |
| No Vehicle | 119 (16.1%) | 18 (14.4%) |
| 1 Vehicle | 269 (36.4%) | 42 (33.6%) |
| 2 Vehicles | 237 (32.1%) | 18 (14.4%) |
| 3 or more Vehicles | 114 (15.4%) | 47 (37.6%) |
| Total | 739 (100.0%) | 125 (100.0%) |
Real Estate & Mortgages in Aguas Claras
Real Estate and Mortgage Overview in Aguas Claras
| Characteristic | Without Mortgage | With Mortgage |
| Housing Units | 563 | 176 |
| Median Property Value | $99,800 | $76,700 |
| Median Household Income | $23,788 | $0 |
| Monthly Housing Costs | $147 | $0 |
| Real Estate Taxes | - | - |
Property Value by Mortgage Status in Aguas Claras
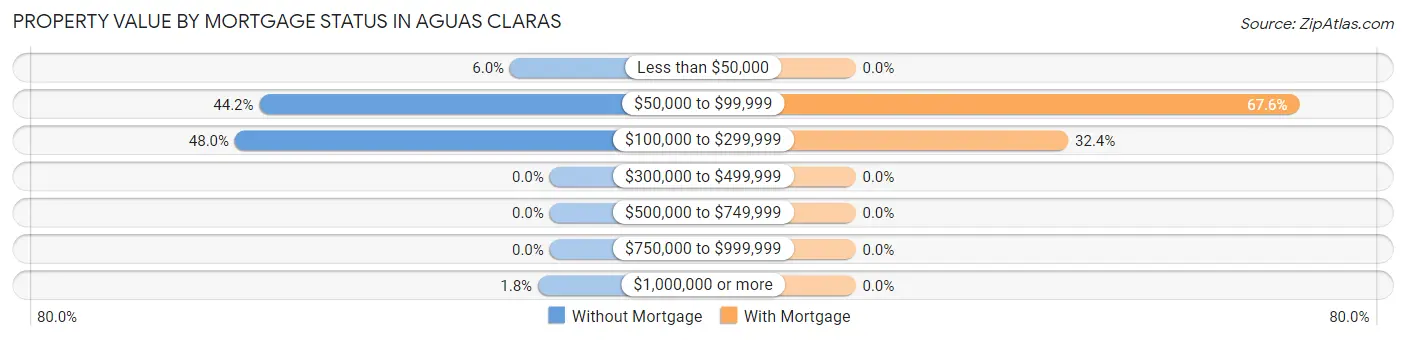
| Property Value | Without Mortgage | With Mortgage |
| Less than $50,000 | 34 (6.0%) | 0 (0.0%) |
| $50,000 to $99,999 | 249 (44.2%) | 119 (67.6%) |
| $100,000 to $299,999 | 270 (48.0%) | 57 (32.4%) |
| $300,000 to $499,999 | 0 (0.0%) | 0 (0.0%) |
| $500,000 to $749,999 | 0 (0.0%) | 0 (0.0%) |
| $750,000 to $999,999 | 0 (0.0%) | 0 (0.0%) |
| $1,000,000 or more | 10 (1.8%) | 0 (0.0%) |
| Total | 563 (100.0%) | 176 (100.0%) |
Household Income by Mortgage Status in Aguas Claras
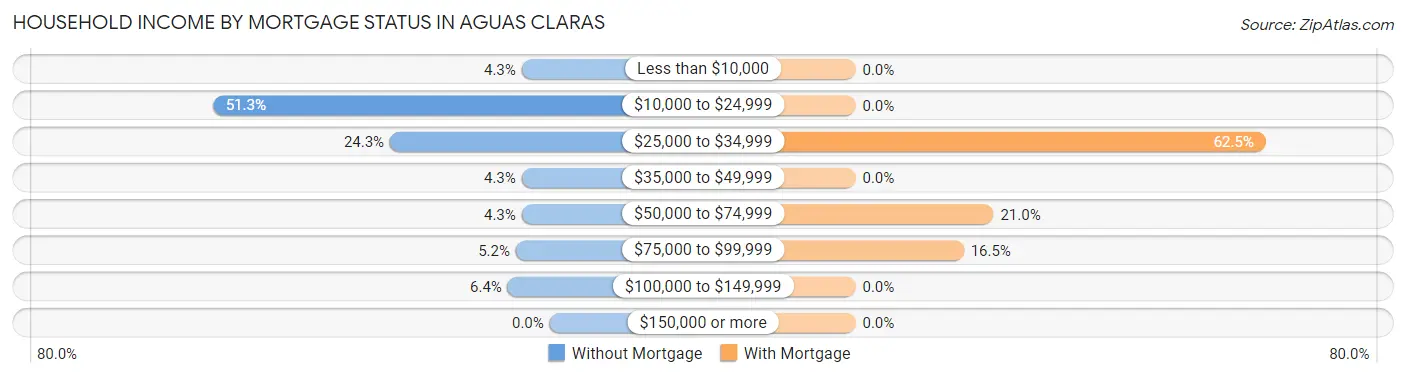
| Household Income | Without Mortgage | With Mortgage |
| Less than $10,000 | 24 (4.3%) | 0 (0.0%) |
| $10,000 to $24,999 | 289 (51.3%) | 0 (0.0%) |
| $25,000 to $34,999 | 137 (24.3%) | 110 (62.5%) |
| $35,000 to $49,999 | 24 (4.3%) | 0 (0.0%) |
| $50,000 to $74,999 | 24 (4.3%) | 37 (21.0%) |
| $75,000 to $99,999 | 29 (5.1%) | 29 (16.5%) |
| $100,000 to $149,999 | 36 (6.4%) | 0 (0.0%) |
| $150,000 or more | 0 (0.0%) | 0 (0.0%) |
| Total | 563 (100.0%) | 176 (100.0%) |
Property Value to Household Income Ratio in Aguas Claras
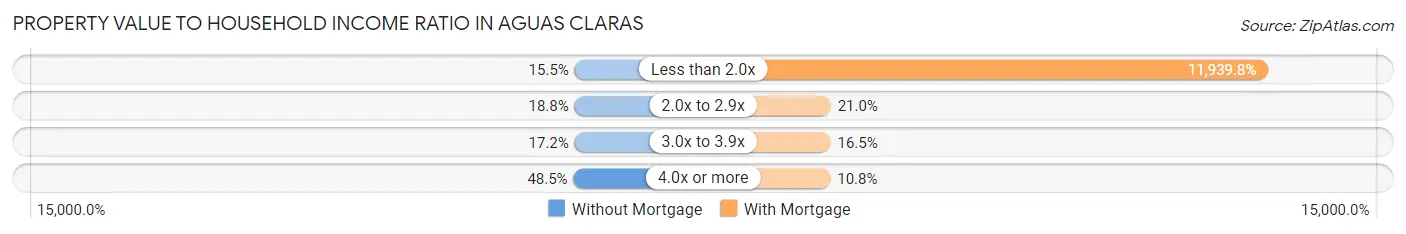
| Value-to-Income Ratio | Without Mortgage | With Mortgage |
| Less than 2.0x | 87 (15.4%) | 21,014 (11,939.8%) |
| 2.0x to 2.9x | 106 (18.8%) | 37 (21.0%) |
| 3.0x to 3.9x | 97 (17.2%) | 29 (16.5%) |
| 4.0x or more | 273 (48.5%) | 19 (10.8%) |
| Total | 563 (100.0%) | 176 (100.0%) |
Real Estate Taxes by Mortgage Status in Aguas Claras
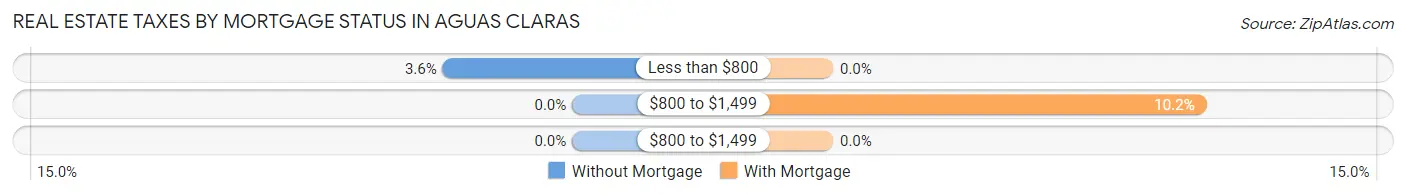
| Property Taxes | Without Mortgage | With Mortgage |
| Less than $800 | 20 (3.5%) | 0 (0.0%) |
| $800 to $1,499 | 0 (0.0%) | 18 (10.2%) |
| $800 to $1,499 | 0 (0.0%) | 0 (0.0%) |
| Total | 563 (100.0%) | 176 (100.0%) |
Health & Disability in Aguas Claras
Health Insurance Coverage by Age in Aguas Claras
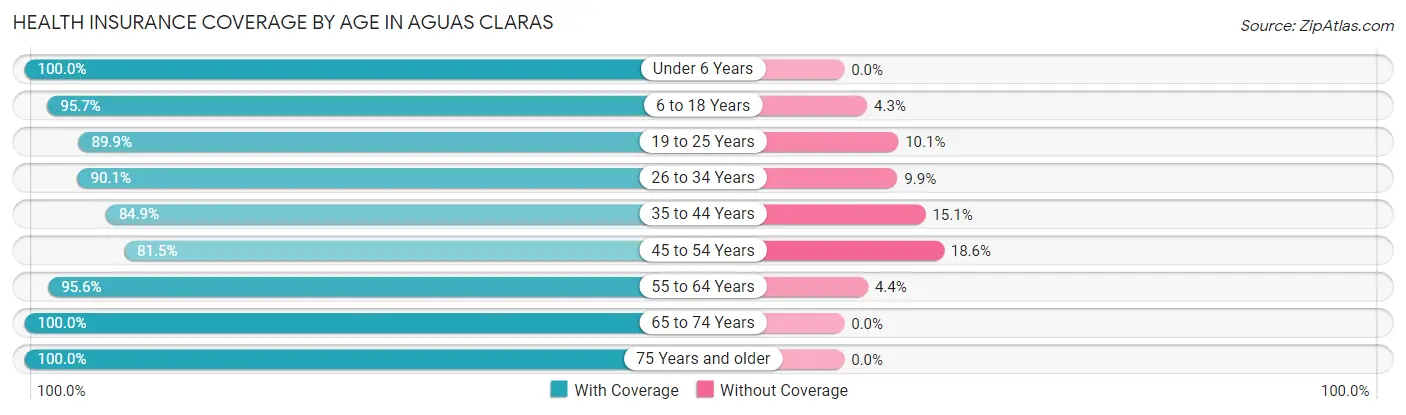
| Age Bracket | With Coverage | Without Coverage |
| Under 6 Years | 48 (100.0%) | 0 (0.0%) |
| 6 to 18 Years | 270 (95.7%) | 12 (4.3%) |
| 19 to 25 Years | 161 (89.9%) | 18 (10.1%) |
| 26 to 34 Years | 173 (90.1%) | 19 (9.9%) |
| 35 to 44 Years | 213 (84.9%) | 38 (15.1%) |
| 45 to 54 Years | 259 (81.5%) | 59 (18.5%) |
| 55 to 64 Years | 260 (95.6%) | 12 (4.4%) |
| 65 to 74 Years | 336 (100.0%) | 0 (0.0%) |
| 75 Years and older | 444 (100.0%) | 0 (0.0%) |
| Total | 2,164 (93.2%) | 158 (6.8%) |
Health Insurance Coverage by Citizenship Status in Aguas Claras
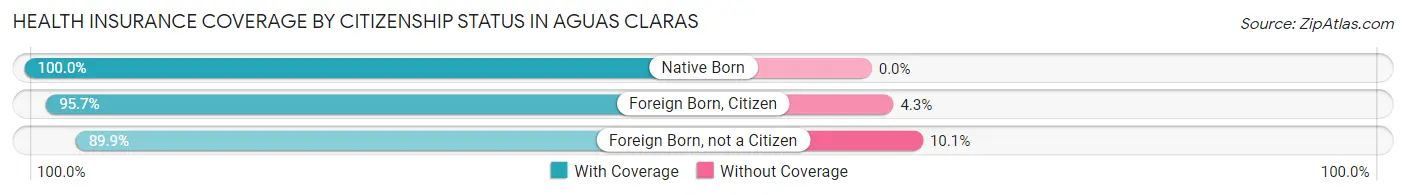
| Citizenship Status | With Coverage | Without Coverage |
| Native Born | 48 (100.0%) | 0 (0.0%) |
| Foreign Born, Citizen | 270 (95.7%) | 12 (4.3%) |
| Foreign Born, not a Citizen | 161 (89.9%) | 18 (10.1%) |
Health Insurance Coverage by Household Income in Aguas Claras
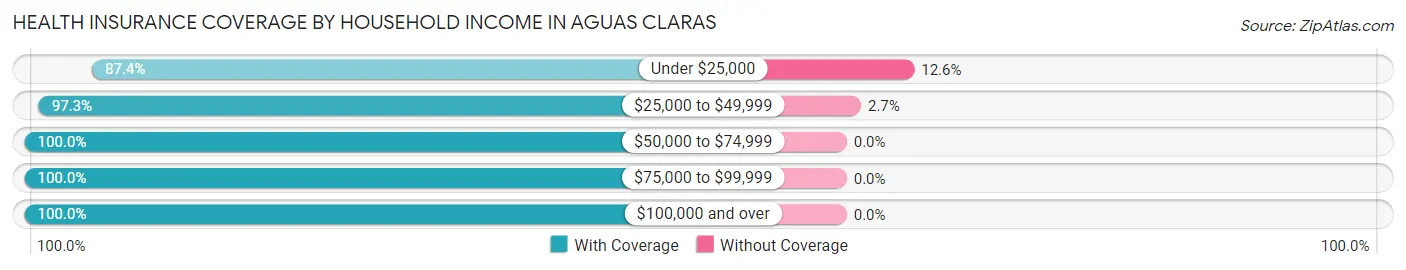
| Household Income | With Coverage | Without Coverage |
| Under $25,000 | 961 (87.4%) | 139 (12.6%) |
| $25,000 to $49,999 | 693 (97.3%) | 19 (2.7%) |
| $50,000 to $74,999 | 264 (100.0%) | 0 (0.0%) |
| $75,000 to $99,999 | 100 (100.0%) | 0 (0.0%) |
| $100,000 and over | 126 (100.0%) | 0 (0.0%) |
Public vs Private Health Insurance Coverage by Age in Aguas Claras
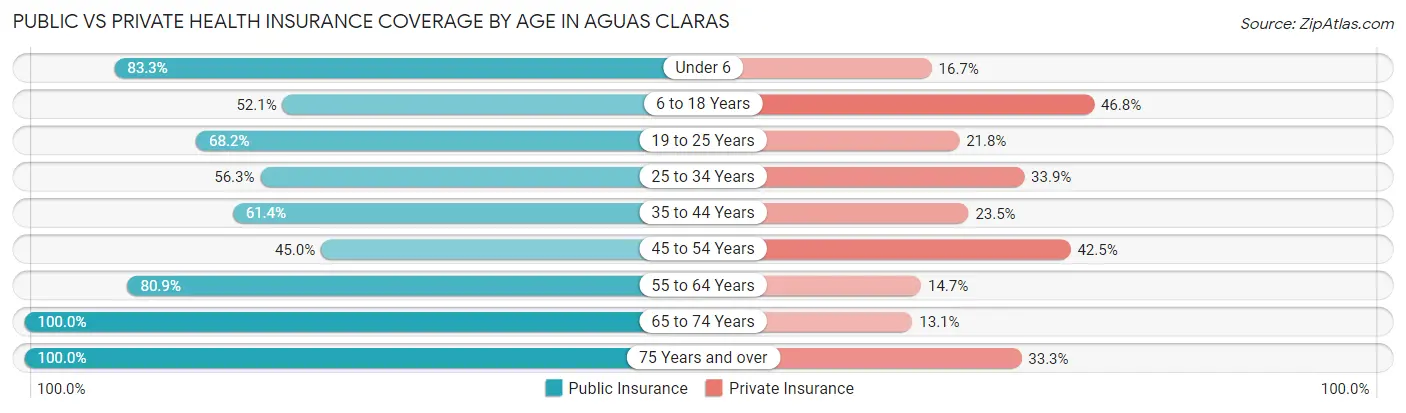
| Age Bracket | Public Insurance | Private Insurance |
| Under 6 | 40 (83.3%) | 8 (16.7%) |
| 6 to 18 Years | 147 (52.1%) | 132 (46.8%) |
| 19 to 25 Years | 122 (68.2%) | 39 (21.8%) |
| 25 to 34 Years | 108 (56.2%) | 65 (33.9%) |
| 35 to 44 Years | 154 (61.4%) | 59 (23.5%) |
| 45 to 54 Years | 143 (45.0%) | 135 (42.4%) |
| 55 to 64 Years | 220 (80.9%) | 40 (14.7%) |
| 65 to 74 Years | 336 (100.0%) | 44 (13.1%) |
| 75 Years and over | 444 (100.0%) | 148 (33.3%) |
| Total | 1,714 (73.8%) | 670 (28.8%) |
Disability Status by Sex by Age in Aguas Claras
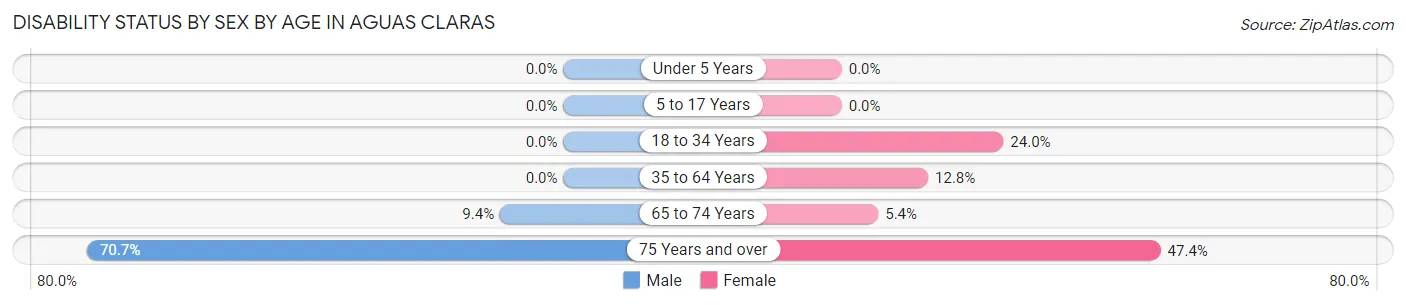
| Age Bracket | Male | Female |
| Under 5 Years | 0 (0.0%) | 0 (0.0%) |
| 5 to 17 Years | 0 (0.0%) | 0 (0.0%) |
| 18 to 34 Years | 0 (0.0%) | 54 (24.0%) |
| 35 to 64 Years | 0 (0.0%) | 61 (12.8%) |
| 65 to 74 Years | 16 (9.4%) | 9 (5.4%) |
| 75 Years and over | 87 (70.7%) | 152 (47.3%) |
Disability Class by Sex by Age in Aguas Claras
Disability Class: Hearing Difficulty
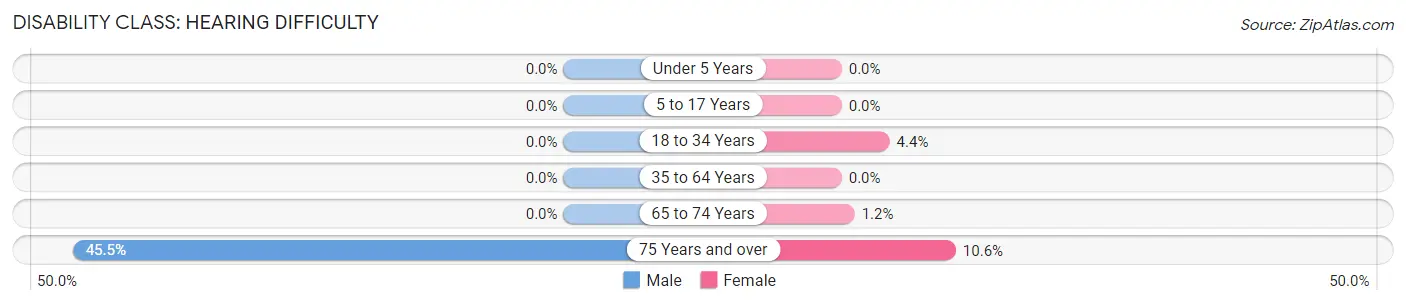
| Age Bracket | Male | Female |
| Under 5 Years | 0 (0.0%) | 0 (0.0%) |
| 5 to 17 Years | 0 (0.0%) | 0 (0.0%) |
| 18 to 34 Years | 0 (0.0%) | 10 (4.4%) |
| 35 to 64 Years | 0 (0.0%) | 0 (0.0%) |
| 65 to 74 Years | 0 (0.0%) | 2 (1.2%) |
| 75 Years and over | 56 (45.5%) | 34 (10.6%) |
Disability Class: Vision Difficulty
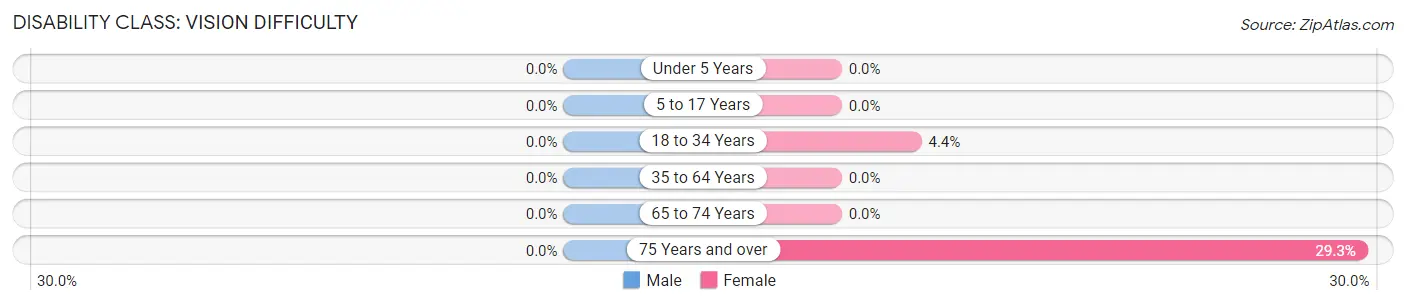
| Age Bracket | Male | Female |
| Under 5 Years | 0 (0.0%) | 0 (0.0%) |
| 5 to 17 Years | 0 (0.0%) | 0 (0.0%) |
| 18 to 34 Years | 0 (0.0%) | 10 (4.4%) |
| 35 to 64 Years | 0 (0.0%) | 0 (0.0%) |
| 65 to 74 Years | 0 (0.0%) | 0 (0.0%) |
| 75 Years and over | 0 (0.0%) | 94 (29.3%) |
Disability Class: Cognitive Difficulty
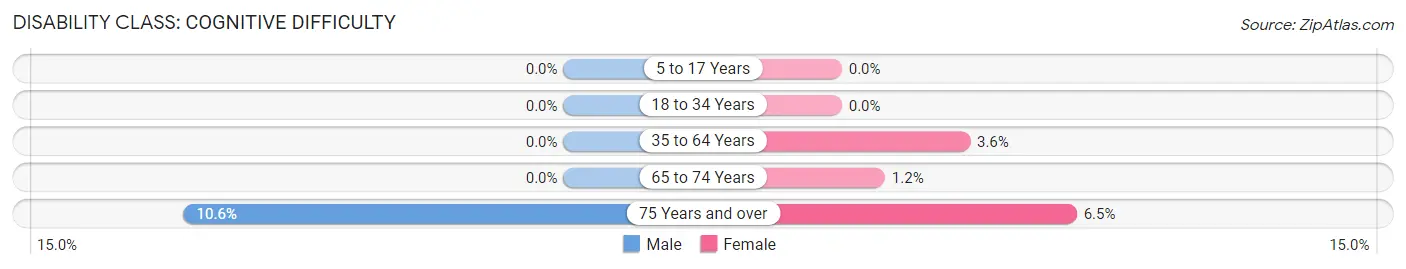
| Age Bracket | Male | Female |
| 5 to 17 Years | 0 (0.0%) | 0 (0.0%) |
| 18 to 34 Years | 0 (0.0%) | 0 (0.0%) |
| 35 to 64 Years | 0 (0.0%) | 17 (3.6%) |
| 65 to 74 Years | 0 (0.0%) | 2 (1.2%) |
| 75 Years and over | 13 (10.6%) | 21 (6.5%) |
Disability Class: Ambulatory Difficulty
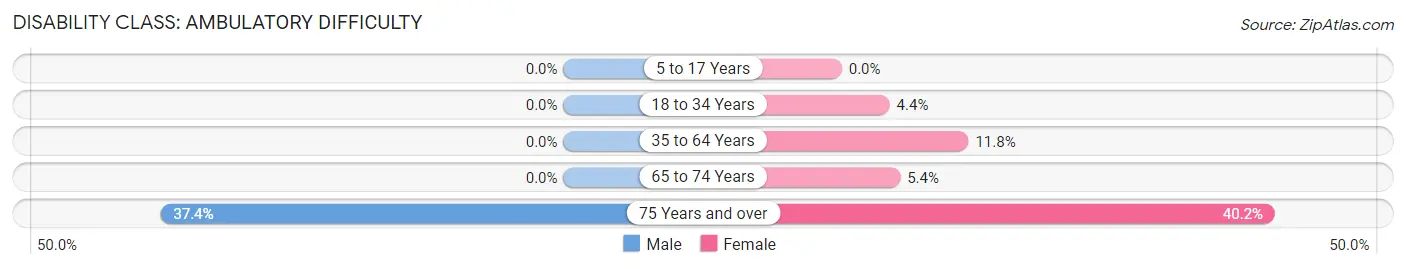
| Age Bracket | Male | Female |
| 5 to 17 Years | 0 (0.0%) | 0 (0.0%) |
| 18 to 34 Years | 0 (0.0%) | 10 (4.4%) |
| 35 to 64 Years | 0 (0.0%) | 56 (11.8%) |
| 65 to 74 Years | 0 (0.0%) | 9 (5.4%) |
| 75 Years and over | 46 (37.4%) | 129 (40.2%) |
Disability Class: Self-Care Difficulty
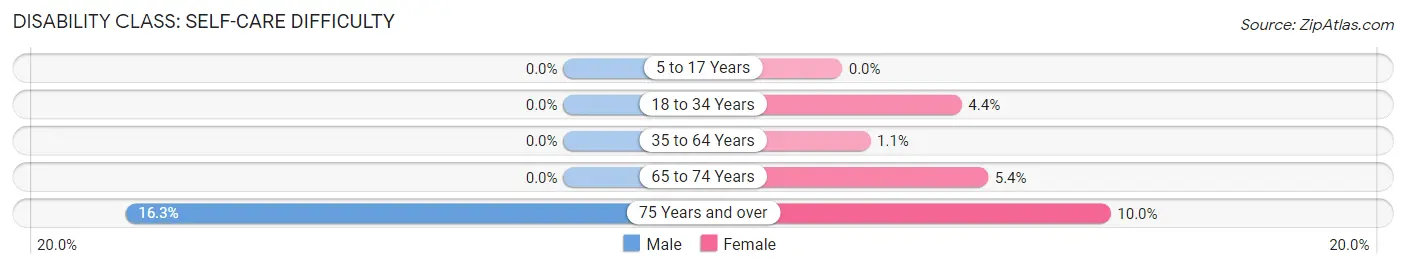
| Age Bracket | Male | Female |
| 5 to 17 Years | 0 (0.0%) | 0 (0.0%) |
| 18 to 34 Years | 0 (0.0%) | 10 (4.4%) |
| 35 to 64 Years | 0 (0.0%) | 5 (1.1%) |
| 65 to 74 Years | 0 (0.0%) | 9 (5.4%) |
| 75 Years and over | 20 (16.3%) | 32 (10.0%) |
Technology Access in Aguas Claras
Computing Device Access in Aguas Claras
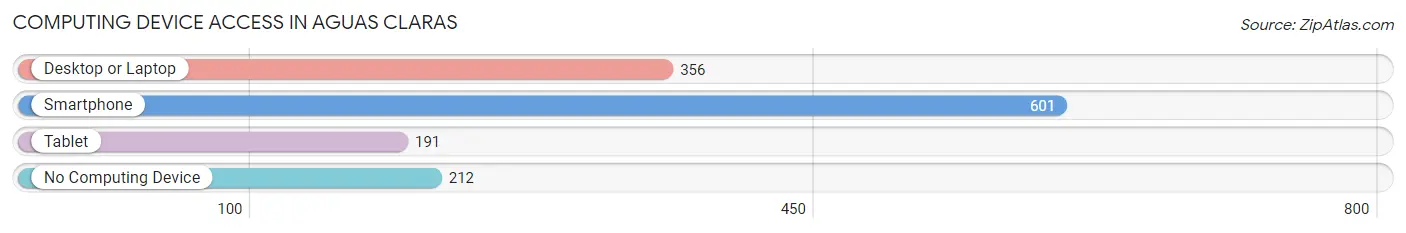
| Device Type | # Households | % Households |
| Desktop or Laptop | 356 | 41.2% |
| Smartphone | 601 | 69.6% |
| Tablet | 191 | 22.1% |
| No Computing Device | 212 | 24.5% |
| Total | 864 | 100.0% |
Internet Access in Aguas Claras
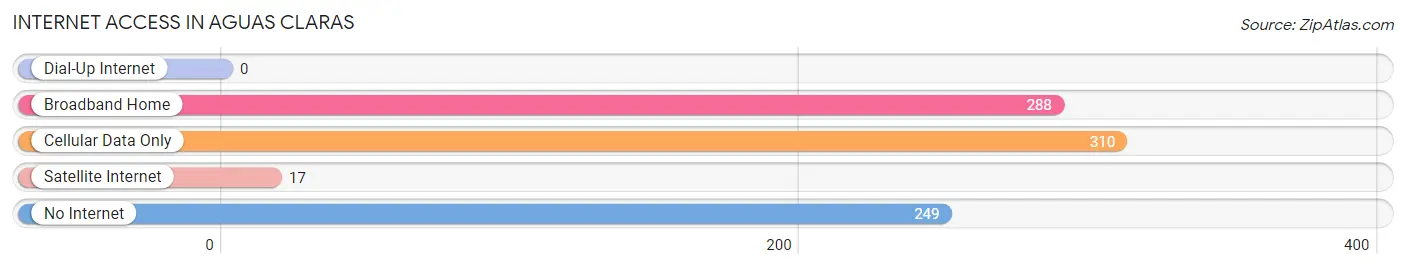
| Internet Type | # Households | % Households |
| Dial-Up Internet | 0 | 0.0% |
| Broadband Home | 288 | 33.3% |
| Cellular Data Only | 310 | 35.9% |
| Satellite Internet | 17 | 2.0% |
| No Internet | 249 | 28.8% |
| Total | 864 | 100.0% |
Aguas Claras Summary
Aguas Claras is a municipality located in the state of Paraná, Brazil. It is situated in the south-central region of the state, and is part of the metropolitan area of Curitiba. The municipality has an area of approximately 545 square kilometers, and a population of approximately 28,000 people.
History
The area that is now Aguas Claras was originally inhabited by the Kaingang and Guarani indigenous peoples. The first European settlers arrived in the area in the late 19th century, and the municipality was officially established in 1891. The name Aguas Claras is derived from the clear waters of the nearby rivers.
Geography
Aguas Claras is located in the south-central region of the state of Paraná, and is part of the metropolitan area of Curitiba. The municipality has an area of approximately 545 square kilometers, and is bordered by the municipalities of Campo Largo, São José dos Pinhais, and Pinhais. The terrain is mostly hilly, with some flat areas in the south. The climate is subtropical, with hot summers and mild winters.
Economy
The economy of Aguas Claras is largely based on agriculture and livestock. The main crops grown in the area are corn, soybeans, and wheat. Livestock production is also important, with cattle, pigs, and poultry being the main animals raised. The municipality also has a small industrial sector, with some factories producing food products, textiles, and furniture.
Demographics
As of the 2020 census, the population of Aguas Claras was approximately 28,000 people. The majority of the population is of European descent, with a small minority of African and indigenous descent. The majority of the population is Roman Catholic, with a small minority of other religions. The official language is Portuguese.
Conclusion
Aguas Claras is a municipality located in the south-central region of the state of Paraná, Brazil. It has an area of approximately 545 square kilometers, and a population of approximately 28,000 people. The economy of Aguas Claras is largely based on agriculture and livestock, and the majority of the population is of European descent. The official language is Portuguese.
Common Questions
What is Per Capita Income in Aguas Claras?
Per Capita income in Aguas Claras is $12,483.
What is the Median Family Income in Aguas Claras?
Median Family Income in Aguas Claras is $24,241.
What is the Median Household income in Aguas Claras?
Median Household Income in Aguas Claras is $22,265.
What is Income or Wage Gap in Aguas Claras?
Income or Wage Gap in Aguas Claras is 11.4%.
Women in Aguas Claras earn 88.6 cents for every dollar earned by a man.
What is Inequality or Gini Index in Aguas Claras?
Inequality or Gini Index in Aguas Claras is 0.37.
What is the Total Population of Aguas Claras?
Total Population of Aguas Claras is 2,327.
What is the Total Male Population of Aguas Claras?
Total Male Population of Aguas Claras is 979.
What is the Total Female Population of Aguas Claras?
Total Female Population of Aguas Claras is 1,348.
What is the Ratio of Males per 100 Females in Aguas Claras?
There are 72.63 Males per 100 Females in Aguas Claras.
What is the Ratio of Females per 100 Males in Aguas Claras?
There are 137.69 Females per 100 Males in Aguas Claras.
What is the Median Population Age in Aguas Claras?
Median Population Age in Aguas Claras is 49.4 Years.
What is the Average Family Size in Aguas Claras
Average Family Size in Aguas Claras is 3.4 People.
What is the Average Household Size in Aguas Claras
Average Household Size in Aguas Claras is 2.7 People.
How Large is the Labor Force in Aguas Claras?
There are 774 People in the Labor Forcein in Aguas Claras.
What is the Percentage of People in the Labor Force in Aguas Claras?
36.8% of People are in the Labor Force in Aguas Claras.
What is the Unemployment Rate in Aguas Claras?
Unemployment Rate in Aguas Claras is 9.7%.