Aguada, PR Map & Demographics
Aguada Map
Aguada Overview
$12,115
PER CAPITA INCOME
$18,167
AVG FAMILY INCOME
$25,709
AVG HOUSEHOLD INCOME
27.0%
WAGE / INCOME GAP [ % ]
73.0¢/ $1
WAGE / INCOME GAP [ $ ]
$14,939
FAMILY INCOME DEFICIT
0.42
INEQUALITY / GINI INDEX
3,233
TOTAL POPULATION
1,595
MALE POPULATION
1,638
FEMALE POPULATION
97.37
MALES / 100 FEMALES
102.70
FEMALES / 100 MALES
49.5
MEDIAN AGE
3.5
AVG FAMILY SIZE
2.5
AVG HOUSEHOLD SIZE
1,039
LABOR FORCE [ PEOPLE ]
37.7%
PERCENT IN LABOR FORCE
18.1%
UNEMPLOYMENT RATE
Aguada Zip Codes
Income in Aguada
Income Overview in Aguada
Per Capita Income in Aguada is $12,115, while median incomes of families and households are $18,167 and $25,709 respectively.
| Characteristic | Number | Measure |
| Per Capita Income | 3,233 | $12,115 |
| Median Family Income | 660 | $18,167 |
| Mean Family Income | 660 | $24,642 |
| Median Household Income | 1,301 | $25,709 |
| Mean Household Income | 1,301 | $26,342 |
| Income Deficit | 660 | $14,939 |
| Wage / Income Gap (%) | 3,233 | 27.02% |
| Wage / Income Gap ($) | 3,233 | 72.98¢ per $1 |
| Gini / Inequality Index | 3,233 | 0.42 |
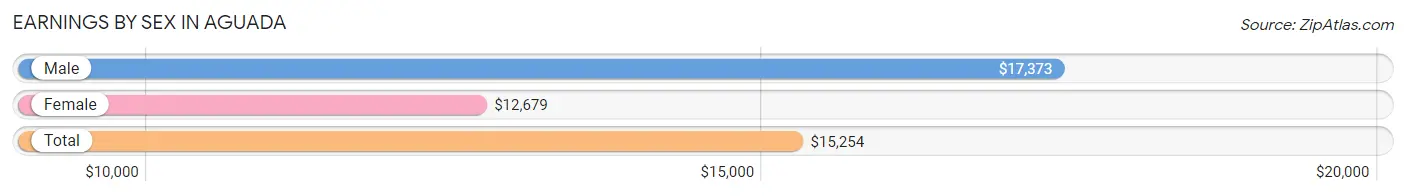
Earnings by Sex in Aguada
Average Earnings in Aguada are $15,254, $17,373 for men and $12,679 for women, a difference of 27.0%.
| Sex | Number | Average Earnings |
| Male | 469 (46.3%) | $17,373 |
| Female | 543 (53.7%) | $12,679 |
| Total | 1,012 (100.0%) | $15,254 |
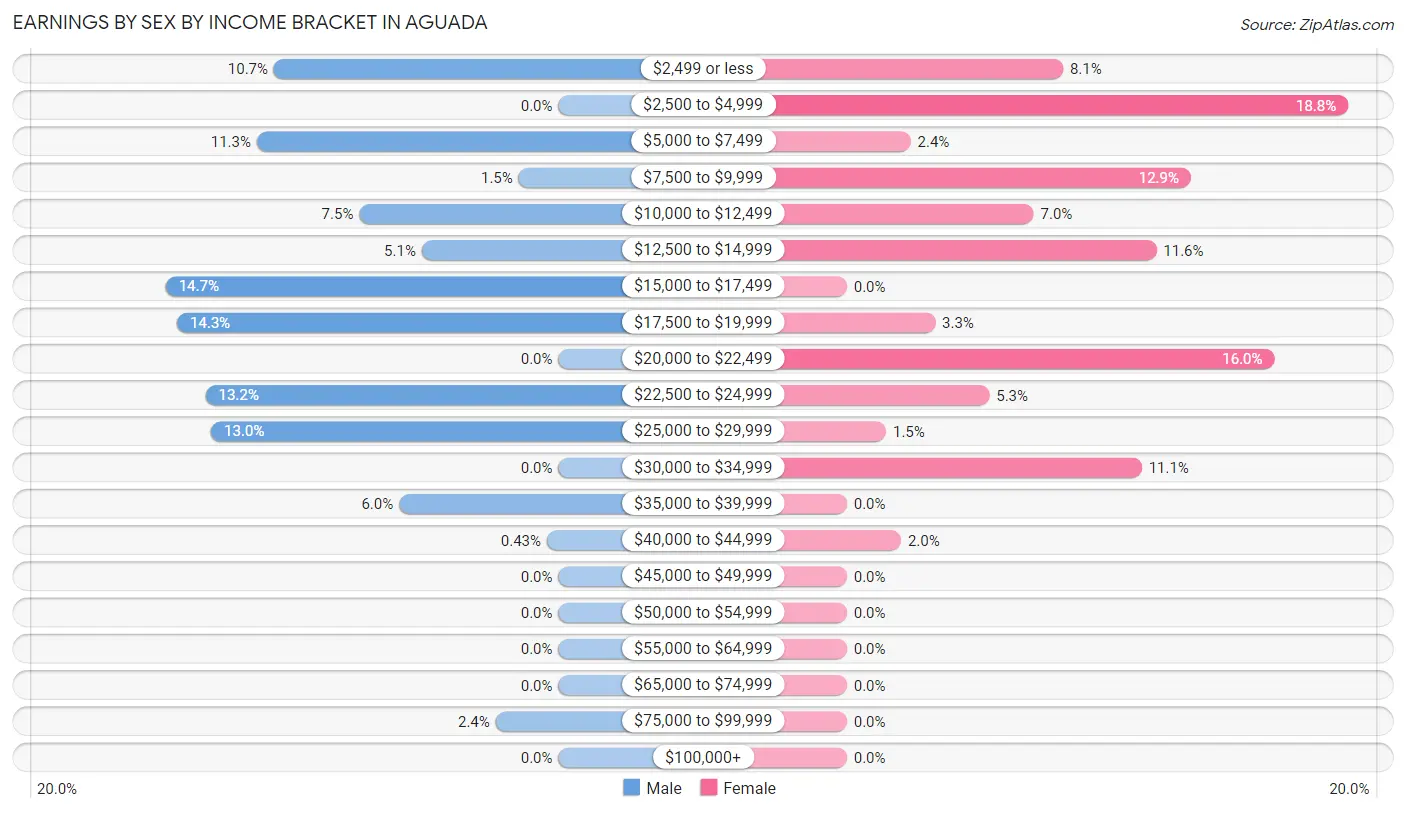
Earnings by Sex by Income Bracket in Aguada
The most common earnings brackets in Aguada are $15,000 to $17,499 for men (69 | 14.7%) and $2,500 to $4,999 for women (102 | 18.8%).
| Income | Male | Female |
| $2,499 or less | 50 (10.7%) | 44 (8.1%) |
| $2,500 to $4,999 | 0 (0.0%) | 102 (18.8%) |
| $5,000 to $7,499 | 53 (11.3%) | 13 (2.4%) |
| $7,500 to $9,999 | 7 (1.5%) | 70 (12.9%) |
| $10,000 to $12,499 | 35 (7.5%) | 38 (7.0%) |
| $12,500 to $14,999 | 24 (5.1%) | 63 (11.6%) |
| $15,000 to $17,499 | 69 (14.7%) | 0 (0.0%) |
| $17,500 to $19,999 | 67 (14.3%) | 18 (3.3%) |
| $20,000 to $22,499 | 0 (0.0%) | 87 (16.0%) |
| $22,500 to $24,999 | 62 (13.2%) | 29 (5.3%) |
| $25,000 to $29,999 | 61 (13.0%) | 8 (1.5%) |
| $30,000 to $34,999 | 0 (0.0%) | 60 (11.1%) |
| $35,000 to $39,999 | 28 (6.0%) | 0 (0.0%) |
| $40,000 to $44,999 | 2 (0.4%) | 11 (2.0%) |
| $45,000 to $49,999 | 0 (0.0%) | 0 (0.0%) |
| $50,000 to $54,999 | 0 (0.0%) | 0 (0.0%) |
| $55,000 to $64,999 | 0 (0.0%) | 0 (0.0%) |
| $65,000 to $74,999 | 0 (0.0%) | 0 (0.0%) |
| $75,000 to $99,999 | 11 (2.4%) | 0 (0.0%) |
| $100,000+ | 0 (0.0%) | 0 (0.0%) |
| Total | 469 (100.0%) | 543 (100.0%) |
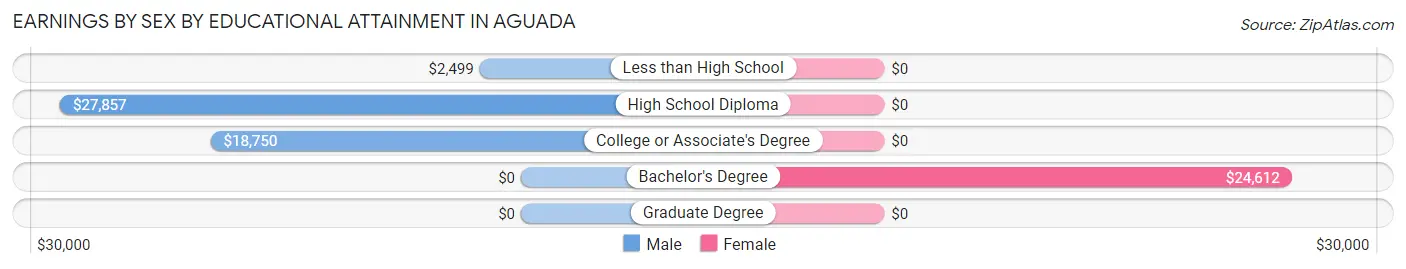
Earnings by Sex by Educational Attainment in Aguada
| Educational Attainment | Male Income | Female Income |
| Less than High School | $2,499 | $0 |
| High School Diploma | $27,857 | $0 |
| College or Associate's Degree | $18,750 | $0 |
| Bachelor's Degree | - | - |
| Graduate Degree | - | - |
| Total | $17,373 | $0 |
Family Income in Aguada
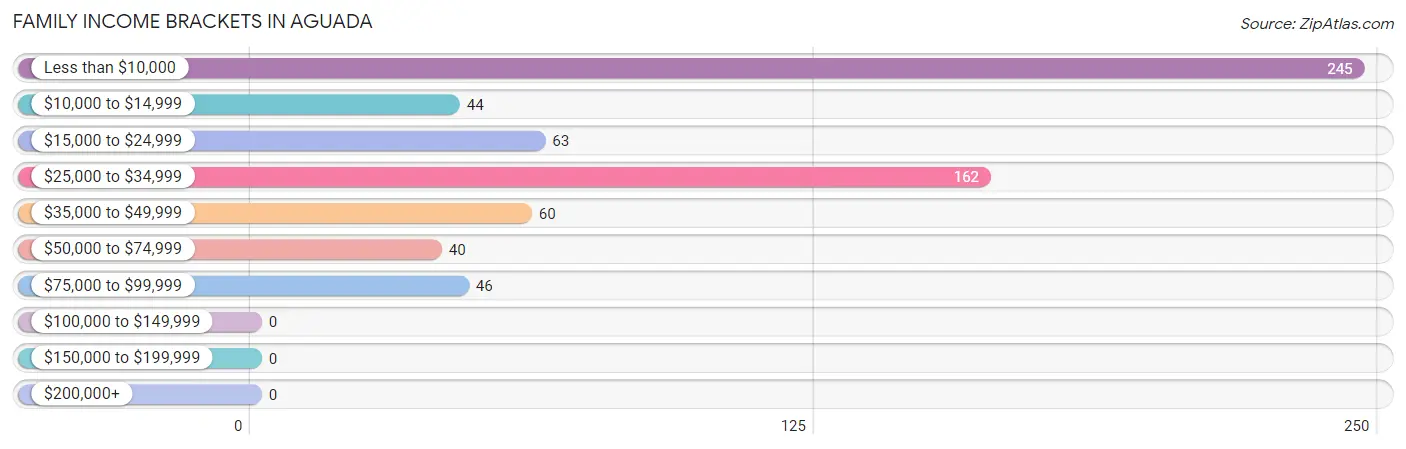
Family Income Brackets in Aguada
According to the Aguada family income data, there are 245 families falling into the less than $10,000 income range, which is the most common income bracket and makes up 37.1% of all families.
| Income Bracket | # Families | % Families |
| Less than $10,000 | 245 | 37.1% |
| $10,000 to $14,999 | 44 | 6.7% |
| $15,000 to $24,999 | 63 | 9.5% |
| $25,000 to $34,999 | 162 | 24.5% |
| $35,000 to $49,999 | 60 | 9.1% |
| $50,000 to $74,999 | 40 | 6.1% |
| $75,000 to $99,999 | 46 | 7.0% |
| $100,000 to $149,999 | 0 | 0.0% |
| $150,000 to $199,999 | 0 | 0.0% |
| $200,000+ | 0 | 0.0% |
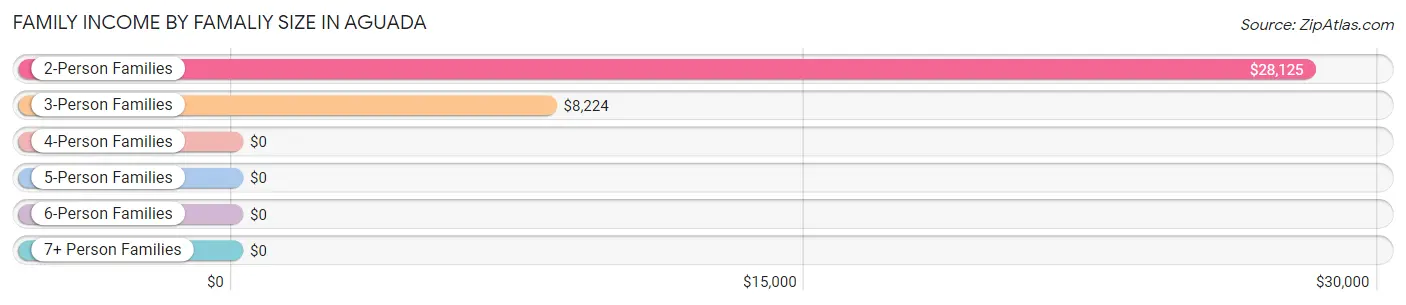
Family Income by Famaliy Size in Aguada
2-person families (359 | 54.4%) account for the highest median family income in Aguada with $28,125 per family, while 2-person families (359 | 54.4%) have the highest median income of $14,062 per family member.
| Income Bracket | # Families | Median Income |
| 2-Person Families | 359 (54.4%) | $28,125 |
| 3-Person Families | 150 (22.7%) | $8,224 |
| 4-Person Families | 133 (20.2%) | $0 |
| 5-Person Families | 18 (2.7%) | $0 |
| 6-Person Families | 0 (0.0%) | $0 |
| 7+ Person Families | 0 (0.0%) | $0 |
| Total | 660 (100.0%) | $18,167 |
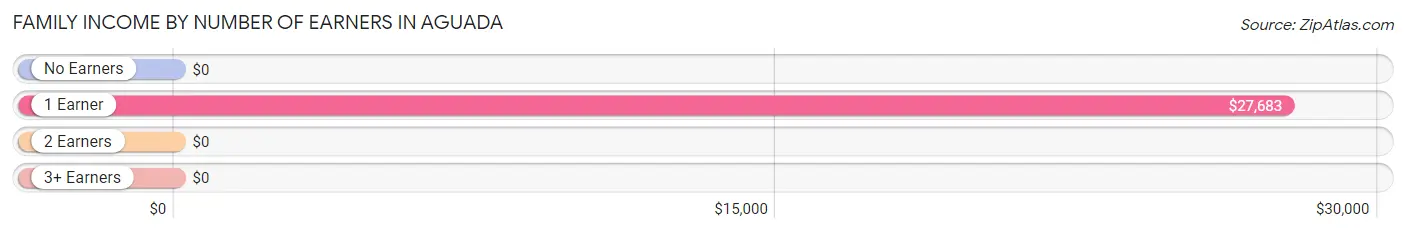
Family Income by Number of Earners in Aguada
| Number of Earners | # Families | Median Income |
| No Earners | 242 (36.7%) | $0 |
| 1 Earner | 317 (48.0%) | $27,683 |
| 2 Earners | 92 (13.9%) | $0 |
| 3+ Earners | 9 (1.4%) | $0 |
| Total | 660 (100.0%) | $18,167 |
Household Income in Aguada
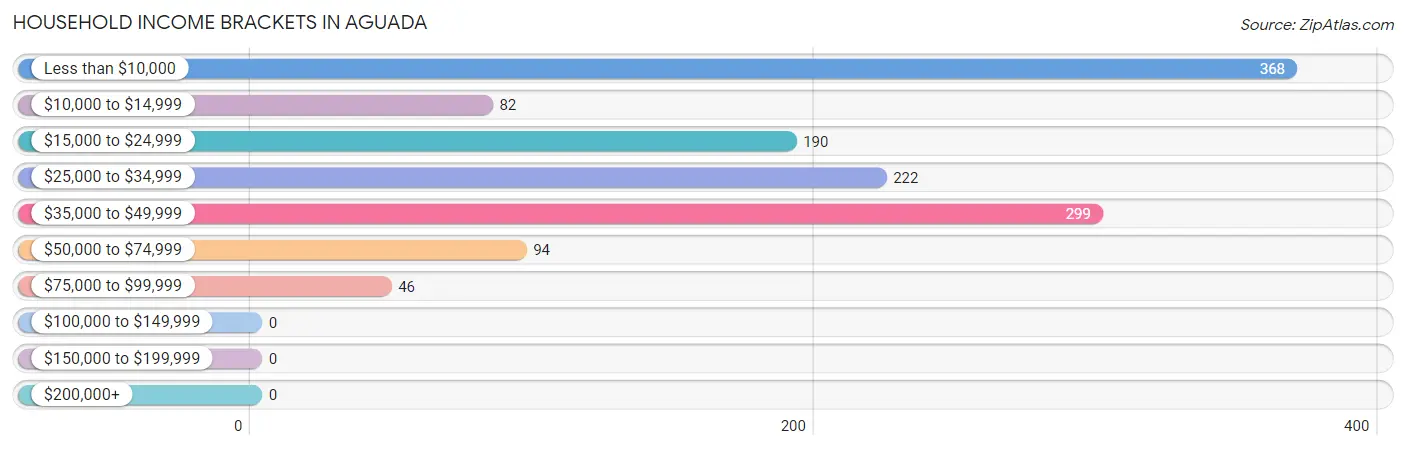
Household Income Brackets in Aguada
With 368 households falling in the category, the less than $10,000 income range is the most frequent in Aguada, accounting for 28.3% of all households.
| Income Bracket | # Households | % Households |
| Less than $10,000 | 368 | 28.3% |
| $10,000 to $14,999 | 82 | 6.3% |
| $15,000 to $24,999 | 190 | 14.6% |
| $25,000 to $34,999 | 222 | 17.1% |
| $35,000 to $49,999 | 299 | 23.0% |
| $50,000 to $74,999 | 94 | 7.2% |
| $75,000 to $99,999 | 46 | 3.5% |
| $100,000 to $149,999 | 0 | 0.0% |
| $150,000 to $199,999 | 0 | 0.0% |
| $200,000+ | 0 | 0.0% |
Household Income by Householder Age in Aguada
The median household income in Aguada is $25,709, with the highest median household income of $38,077 found in the 65+ years age bracket for the primary householder. A total of 512 households (39.4%) fall into this category. Meanwhile, the 15 to 24 years age bracket for the primary householder has the lowest median household income of $0, with 7 households (0.5%) in this group.
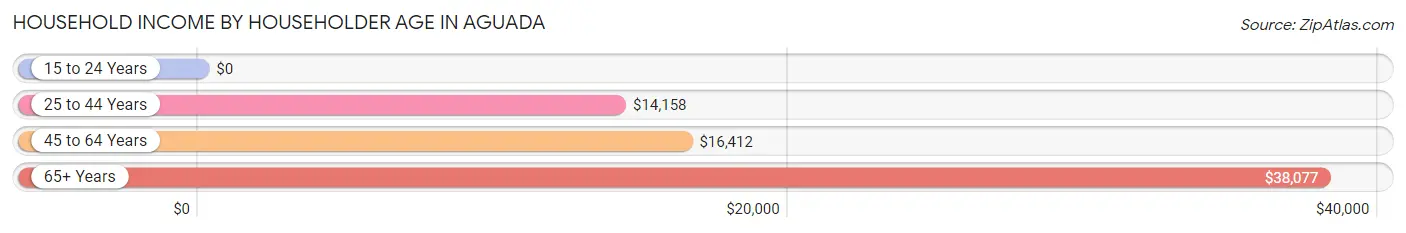
| Income Bracket | # Households | Median Income |
| 15 to 24 Years | 7 (0.5%) | $0 |
| 25 to 44 Years | 303 (23.3%) | $14,158 |
| 45 to 64 Years | 479 (36.8%) | $16,412 |
| 65+ Years | 512 (39.4%) | $38,077 |
| Total | 1,301 (100.0%) | $25,709 |
Poverty in Aguada
Income Below Poverty by Sex and Age in Aguada
With 43.9% poverty level for males and 47.6% for females among the residents of Aguada, 5 year old males and under 5 year old females are the most vulnerable to poverty, with 58 males (100.0%) and 34 females (100.0%) in their respective age groups living below the poverty level.
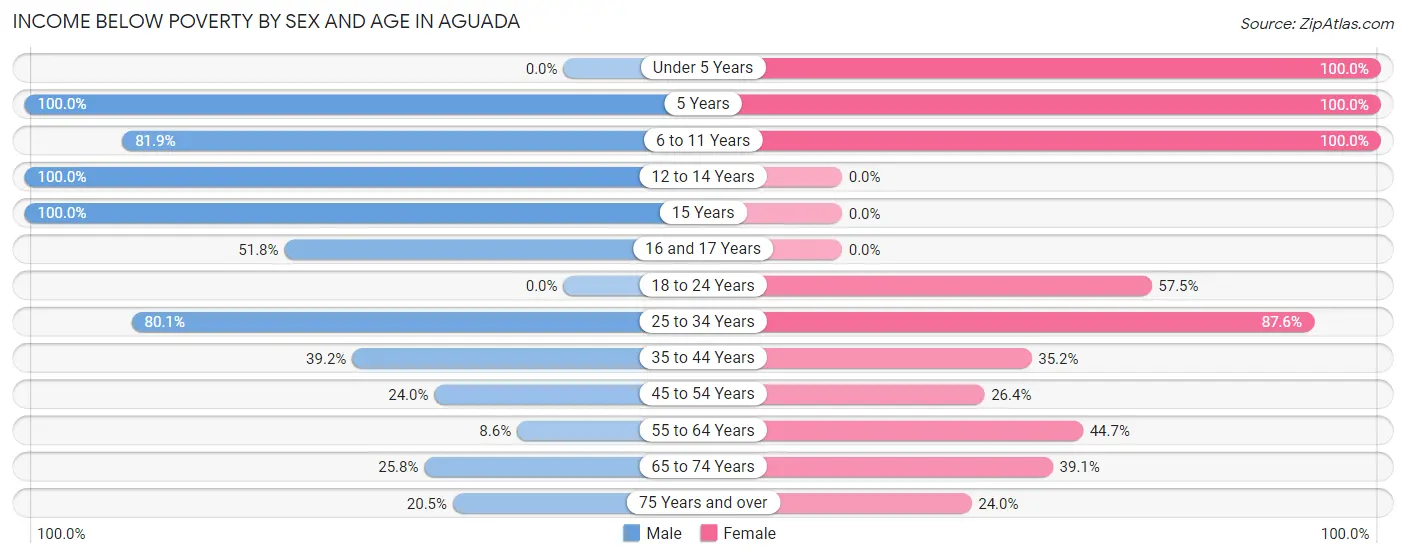
| Age Bracket | Male | Female |
| Under 5 Years | 0 (0.0%) | 34 (100.0%) |
| 5 Years | 58 (100.0%) | 17 (100.0%) |
| 6 to 11 Years | 149 (81.9%) | 30 (100.0%) |
| 12 to 14 Years | 95 (100.0%) | 0 (0.0%) |
| 15 Years | 26 (100.0%) | 0 (0.0%) |
| 16 and 17 Years | 29 (51.8%) | 0 (0.0%) |
| 18 to 24 Years | 0 (0.0%) | 104 (57.5%) |
| 25 to 34 Years | 125 (80.1%) | 205 (87.6%) |
| 35 to 44 Years | 69 (39.2%) | 51 (35.2%) |
| 45 to 54 Years | 46 (24.0%) | 55 (26.4%) |
| 55 to 64 Years | 23 (8.6%) | 165 (44.7%) |
| 65 to 74 Years | 40 (25.8%) | 72 (39.1%) |
| 75 Years and over | 40 (20.5%) | 44 (24.0%) |
| Total | 700 (43.9%) | 777 (47.6%) |
Income Above Poverty by Sex and Age in Aguada
According to the poverty statistics in Aguada, males aged 18 to 24 years and females aged 12 to 14 years are the age groups that are most secure financially, with 100.0% of males and 100.0% of females in these age groups living above the poverty line.
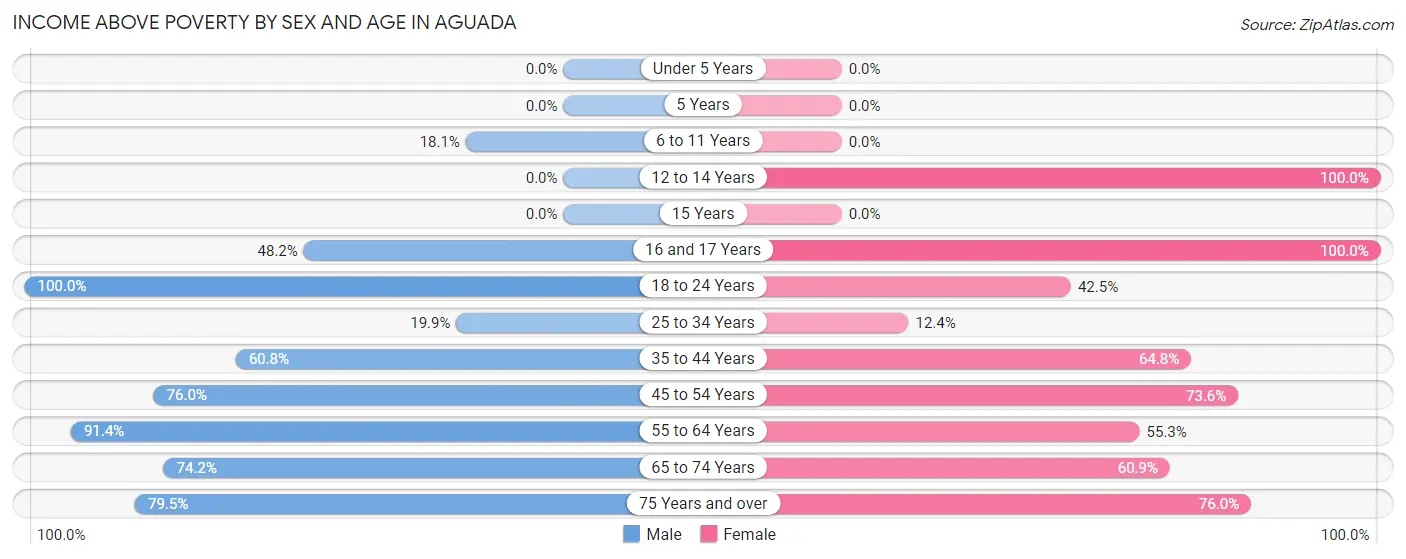
| Age Bracket | Male | Female |
| Under 5 Years | 0 (0.0%) | 0 (0.0%) |
| 5 Years | 0 (0.0%) | 0 (0.0%) |
| 6 to 11 Years | 33 (18.1%) | 0 (0.0%) |
| 12 to 14 Years | 0 (0.0%) | 36 (100.0%) |
| 15 Years | 0 (0.0%) | 0 (0.0%) |
| 16 and 17 Years | 27 (48.2%) | 11 (100.0%) |
| 18 to 24 Years | 37 (100.0%) | 77 (42.5%) |
| 25 to 34 Years | 31 (19.9%) | 29 (12.4%) |
| 35 to 44 Years | 107 (60.8%) | 94 (64.8%) |
| 45 to 54 Years | 146 (76.0%) | 153 (73.6%) |
| 55 to 64 Years | 244 (91.4%) | 204 (55.3%) |
| 65 to 74 Years | 115 (74.2%) | 112 (60.9%) |
| 75 Years and over | 155 (79.5%) | 139 (76.0%) |
| Total | 895 (56.1%) | 855 (52.4%) |
Income Below Poverty Among Married-Couple Families in Aguada
The poverty statistics for married-couple families in Aguada show that 35.6% or 93 of the total 261 families live below the poverty line. Families with 1 or 2 children have the highest poverty rate of 100.0%, comprising of 27 families. On the other hand, families with no children have the lowest poverty rate of 28.2%, which includes 66 families.
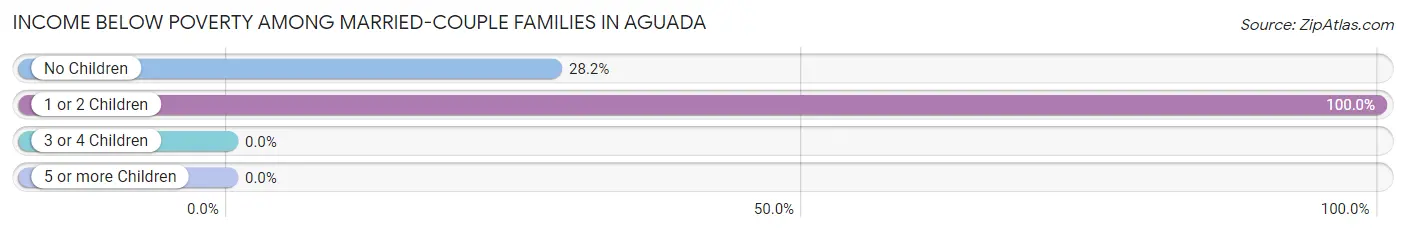
| Children | Above Poverty | Below Poverty |
| No Children | 168 (71.8%) | 66 (28.2%) |
| 1 or 2 Children | 0 (0.0%) | 27 (100.0%) |
| 3 or 4 Children | 0 (0.0%) | 0 (0.0%) |
| 5 or more Children | 0 (0.0%) | 0 (0.0%) |
| Total | 168 (64.4%) | 93 (35.6%) |
Income Below Poverty Among Single-Parent Households in Aguada
According to the poverty data in Aguada, 54.0% or 47 single-father households and 59.6% or 186 single-mother households are living below the poverty line. Among single-father households, those with 1 or 2 children have the highest poverty rate, with 36 households (58.1%) experiencing poverty. Likewise, among single-mother households, those with 3 or 4 children have the highest poverty rate, with 23 households (100.0%) falling below the poverty line.
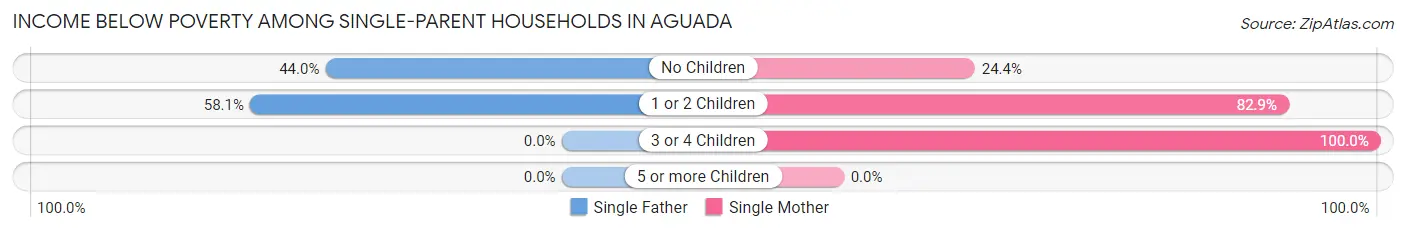
| Children | Single Father | Single Mother |
| No Children | 11 (44.0%) | 32 (24.4%) |
| 1 or 2 Children | 36 (58.1%) | 131 (82.9%) |
| 3 or 4 Children | 0 (0.0%) | 23 (100.0%) |
| 5 or more Children | 0 (0.0%) | 0 (0.0%) |
| Total | 47 (54.0%) | 186 (59.6%) |
Income Below Poverty Among Married-Couple vs Single-Parent Households in Aguada
The poverty data for Aguada shows that 93 of the married-couple family households (35.6%) and 233 of the single-parent households (58.4%) are living below the poverty level. Within the married-couple family households, those with 1 or 2 children have the highest poverty rate, with 27 households (100.0%) falling below the poverty line. Among the single-parent households, those with 3 or 4 children have the highest poverty rate, with 23 household (100.0%) living below poverty.
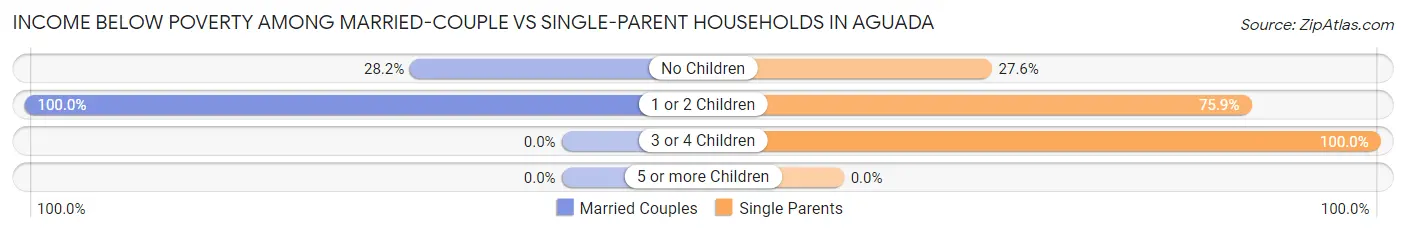
| Children | Married-Couple Families | Single-Parent Households |
| No Children | 66 (28.2%) | 43 (27.6%) |
| 1 or 2 Children | 27 (100.0%) | 167 (75.9%) |
| 3 or 4 Children | 0 (0.0%) | 23 (100.0%) |
| 5 or more Children | 0 (0.0%) | 0 (0.0%) |
| Total | 93 (35.6%) | 233 (58.4%) |
Race in Aguada
The most populous races in Aguada are Hispanic or Latino (2,877 | 89.0%), Two or more Races (1,537 | 47.5%), and White / Caucasian (1,412 | 43.7%).
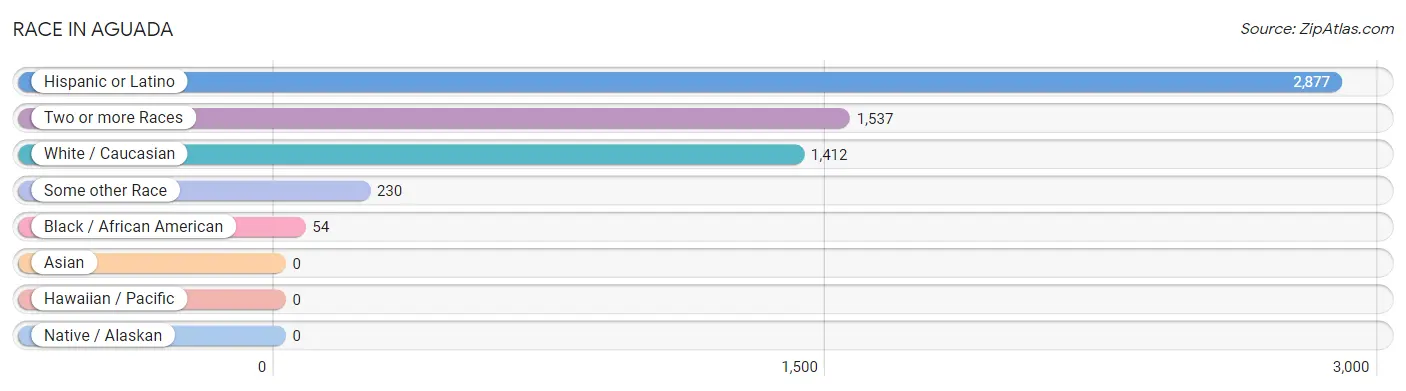
| Race | # Population | % Population |
| Asian | 0 | 0.0% |
| Black / African American | 54 | 1.7% |
| Hawaiian / Pacific | 0 | 0.0% |
| Hispanic or Latino | 2,877 | 89.0% |
| Native / Alaskan | 0 | 0.0% |
| White / Caucasian | 1,412 | 43.7% |
| Two or more Races | 1,537 | 47.5% |
| Some other Race | 230 | 7.1% |
| Total | 3,233 | 100.0% |
Ancestry in Aguada
The most populous ancestries reported in Aguada are Puerto Rican (2,694 | 83.3%), Central American Indian (878 | 27.2%), American (349 | 10.8%), Spaniard (138 | 4.3%), and African (28 | 0.9%), together accounting for 126.4% of all Aguada residents.
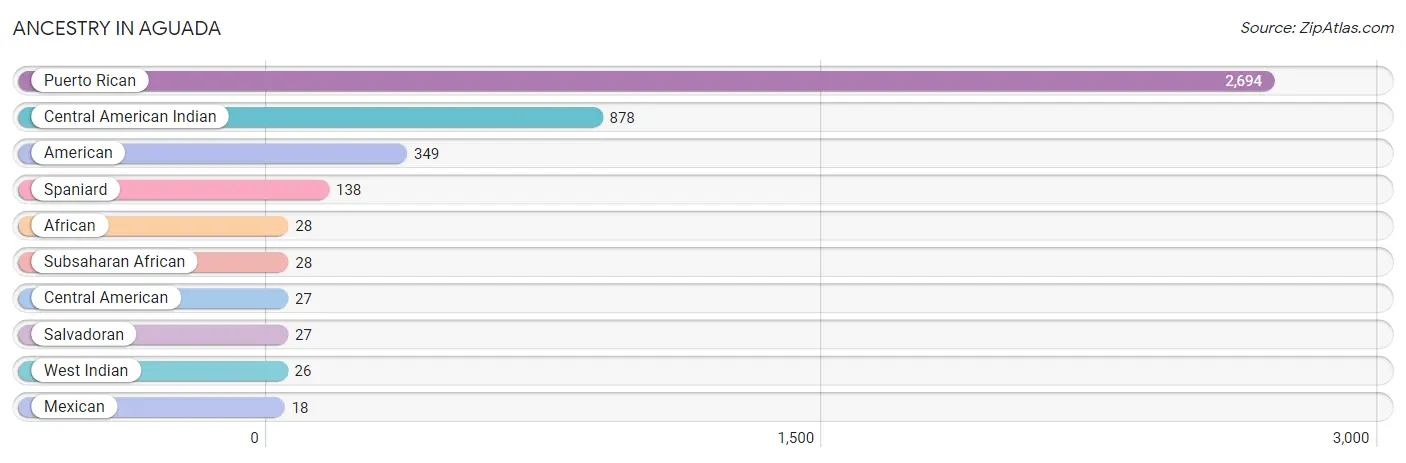
| Ancestry | # Population | % Population |
| African | 28 | 0.9% |
| American | 349 | 10.8% |
| Central American | 27 | 0.8% |
| Central American Indian | 878 | 27.2% |
| Mexican | 18 | 0.6% |
| Puerto Rican | 2,694 | 83.3% |
| Salvadoran | 27 | 0.8% |
| Spaniard | 138 | 4.3% |
| Subsaharan African | 28 | 0.9% |
| West Indian | 26 | 0.8% | View All 10 Rows |
Immigrants in Aguada

| Immigration Origin | # Population | % Population | View All 0 Rows |
Sex and Age in Aguada
Sex and Age in Aguada
The most populous age groups in Aguada are 5 to 9 Years (207 | 13.0%) for men and 55 to 59 Years (210 | 12.8%) for women.
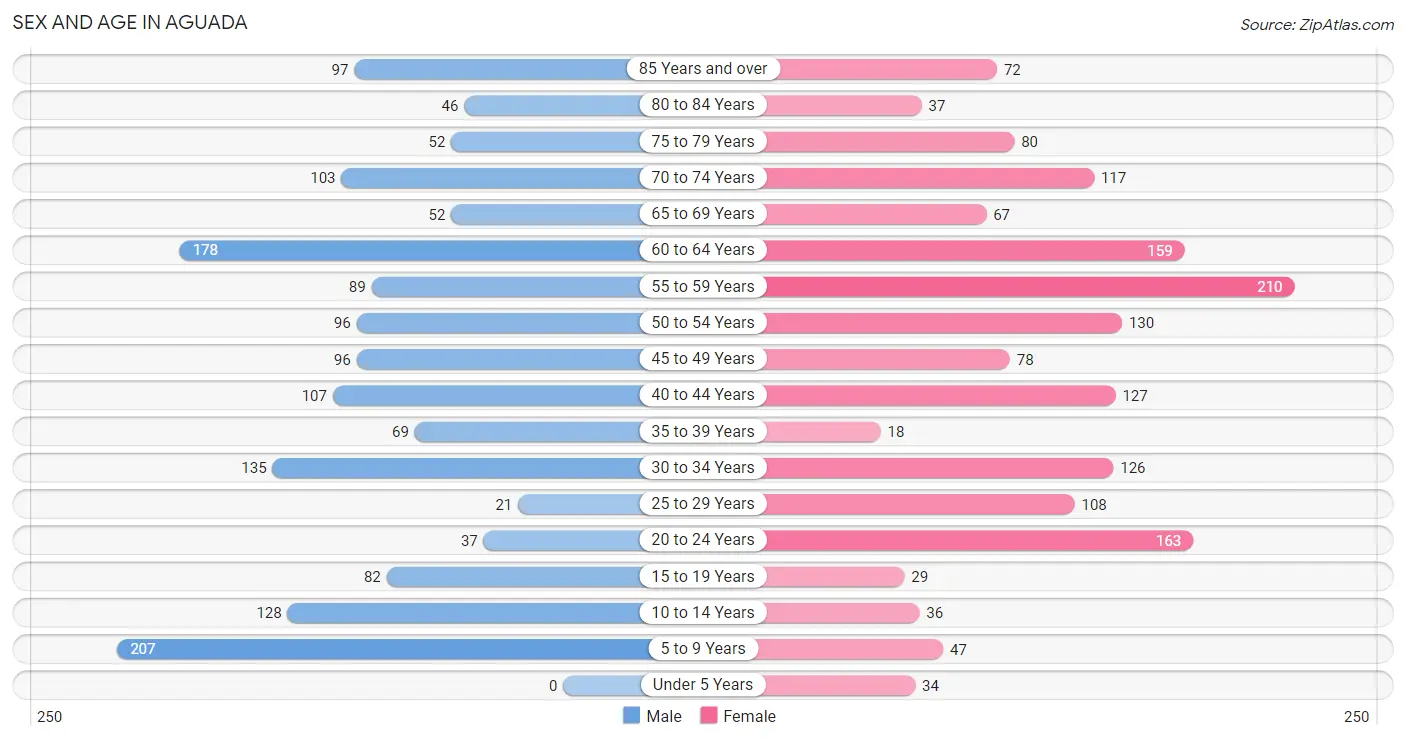
| Age Bracket | Male | Female |
| Under 5 Years | 0 (0.0%) | 34 (2.1%) |
| 5 to 9 Years | 207 (13.0%) | 47 (2.9%) |
| 10 to 14 Years | 128 (8.0%) | 36 (2.2%) |
| 15 to 19 Years | 82 (5.1%) | 29 (1.8%) |
| 20 to 24 Years | 37 (2.3%) | 163 (10.0%) |
| 25 to 29 Years | 21 (1.3%) | 108 (6.6%) |
| 30 to 34 Years | 135 (8.5%) | 126 (7.7%) |
| 35 to 39 Years | 69 (4.3%) | 18 (1.1%) |
| 40 to 44 Years | 107 (6.7%) | 127 (7.7%) |
| 45 to 49 Years | 96 (6.0%) | 78 (4.8%) |
| 50 to 54 Years | 96 (6.0%) | 130 (7.9%) |
| 55 to 59 Years | 89 (5.6%) | 210 (12.8%) |
| 60 to 64 Years | 178 (11.2%) | 159 (9.7%) |
| 65 to 69 Years | 52 (3.3%) | 67 (4.1%) |
| 70 to 74 Years | 103 (6.5%) | 117 (7.1%) |
| 75 to 79 Years | 52 (3.3%) | 80 (4.9%) |
| 80 to 84 Years | 46 (2.9%) | 37 (2.3%) |
| 85 Years and over | 97 (6.1%) | 72 (4.4%) |
| Total | 1,595 (100.0%) | 1,638 (100.0%) |
Families and Households in Aguada
Median Family Size in Aguada
The median family size in Aguada is 3.47 persons per family, with single female/mother families (312 | 47.3%) accounting for the largest median family size of 4.08 persons per family. On the other hand, single male/father families (87 | 13.2%) represent the smallest median family size with 2.79 persons per family.
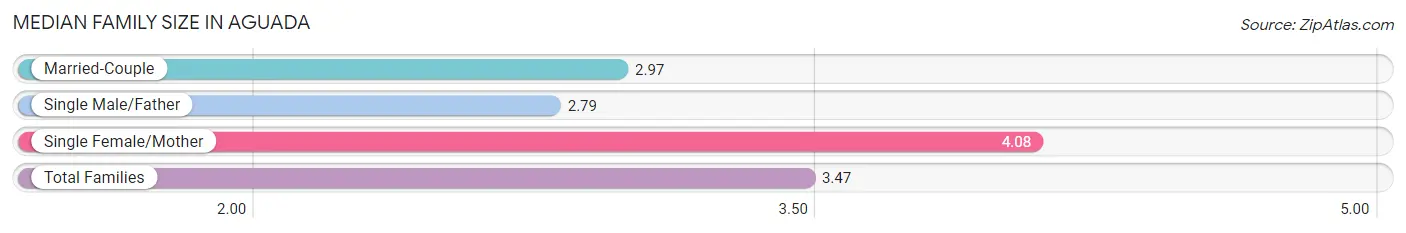
| Family Type | # Families | Family Size |
| Married-Couple | 261 (39.6%) | 2.97 |
| Single Male/Father | 87 (13.2%) | 2.79 |
| Single Female/Mother | 312 (47.3%) | 4.08 |
| Total Families | 660 (100.0%) | 3.47 |
Median Household Size in Aguada
The median household size in Aguada is 2.46 persons per household, with single female/mother households (312 | 24.0%) accounting for the largest median household size of 4.23 persons per household. non-family households (641 | 49.3%) represent the smallest median household size with 1.24 persons per household.
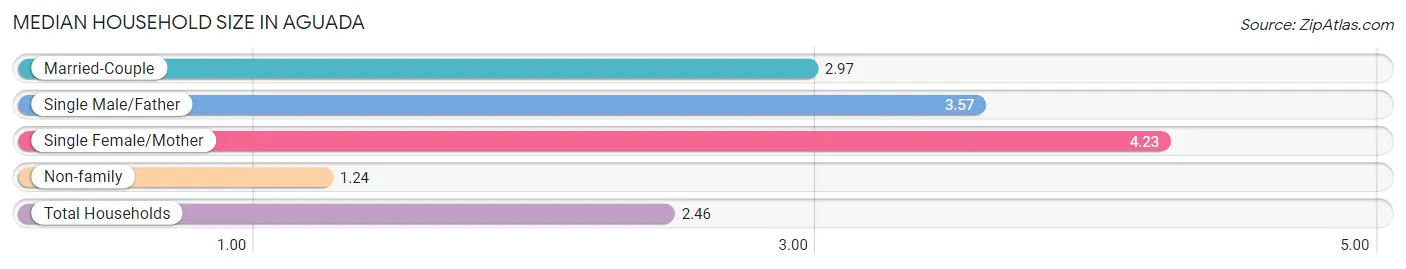
| Household Type | # Households | Household Size |
| Married-Couple | 261 (20.1%) | 2.97 |
| Single Male/Father | 87 (6.7%) | 3.57 |
| Single Female/Mother | 312 (24.0%) | 4.23 |
| Non-family | 641 (49.3%) | 1.24 |
| Total Households | 1,301 (100.0%) | 2.46 |
Household Size by Marriage Status in Aguada
Out of a total of 1,301 households in Aguada, 660 (50.7%) are family households, while 641 (49.3%) are nonfamily households. The most numerous type of family households are 2-person households, comprising 288, and the most common type of nonfamily households are 1-person households, comprising 504.
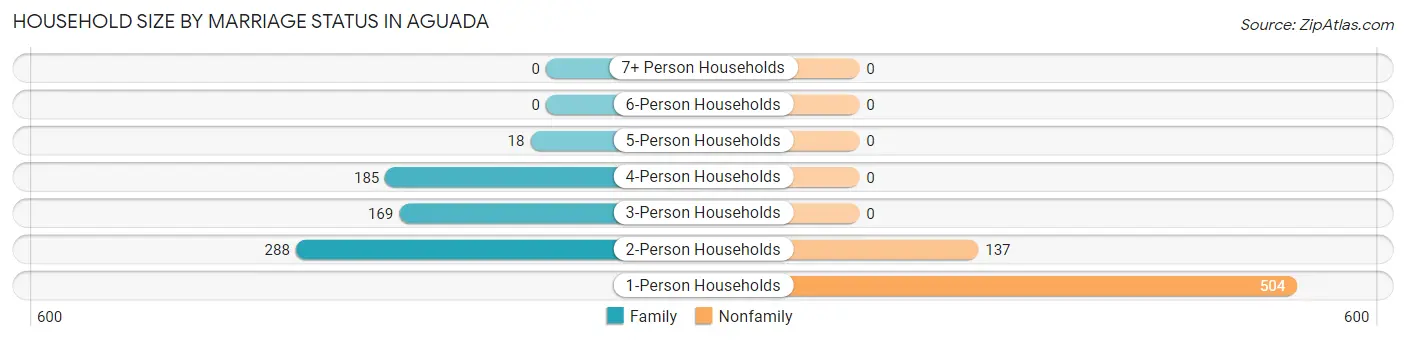
| Household Size | Family Households | Nonfamily Households |
| 1-Person Households | - | 504 (38.7%) |
| 2-Person Households | 288 (22.1%) | 137 (10.5%) |
| 3-Person Households | 169 (13.0%) | 0 (0.0%) |
| 4-Person Households | 185 (14.2%) | 0 (0.0%) |
| 5-Person Households | 18 (1.4%) | 0 (0.0%) |
| 6-Person Households | 0 (0.0%) | 0 (0.0%) |
| 7+ Person Households | 0 (0.0%) | 0 (0.0%) |
| Total | 660 (50.7%) | 641 (49.3%) |
Female Fertility in Aguada
Fertility by Age in Aguada
Average fertility rate in Aguada is 20.0 births per 1,000 women. Women in the age bracket of 20 to 34 years have the highest fertility rate with 33.0 births per 1,000 women. Women in the age bracket of 20 to 34 years acount for 100.0% of all women with births.
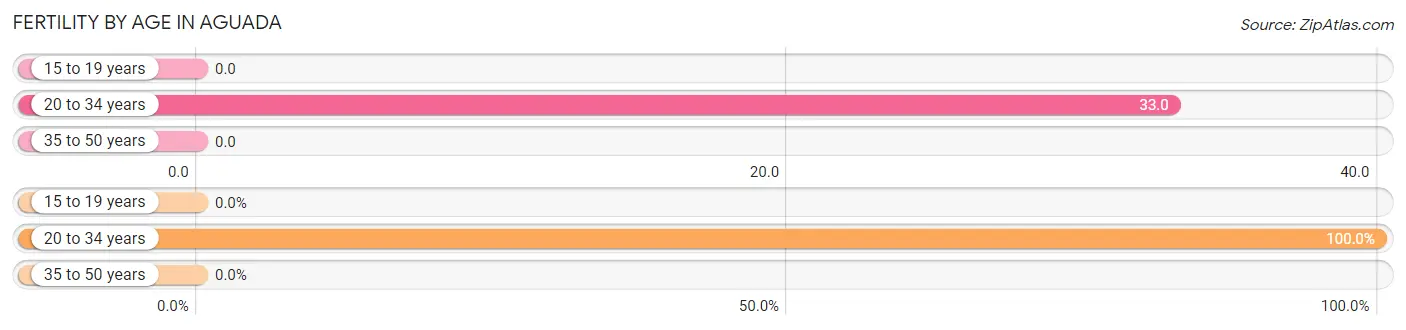
| Age Bracket | Women with Births | Births / 1,000 Women |
| 15 to 19 years | 0 (0.0%) | 0.0 |
| 20 to 34 years | 13 (100.0%) | 33.0 |
| 35 to 50 years | 0 (0.0%) | 0.0 |
| Total | 13 (100.0%) | 20.0 |
Fertility by Age by Marriage Status in Aguada

| Age Bracket | Married | Unmarried |
| 15 to 19 years | 0 (0.0%) | 0 (0.0%) |
| 20 to 34 years | 0 (0.0%) | 13 (100.0%) |
| 35 to 50 years | 0 (0.0%) | 0 (0.0%) |
| Total | 0 (0.0%) | 13 (100.0%) |
Fertility by Education in Aguada
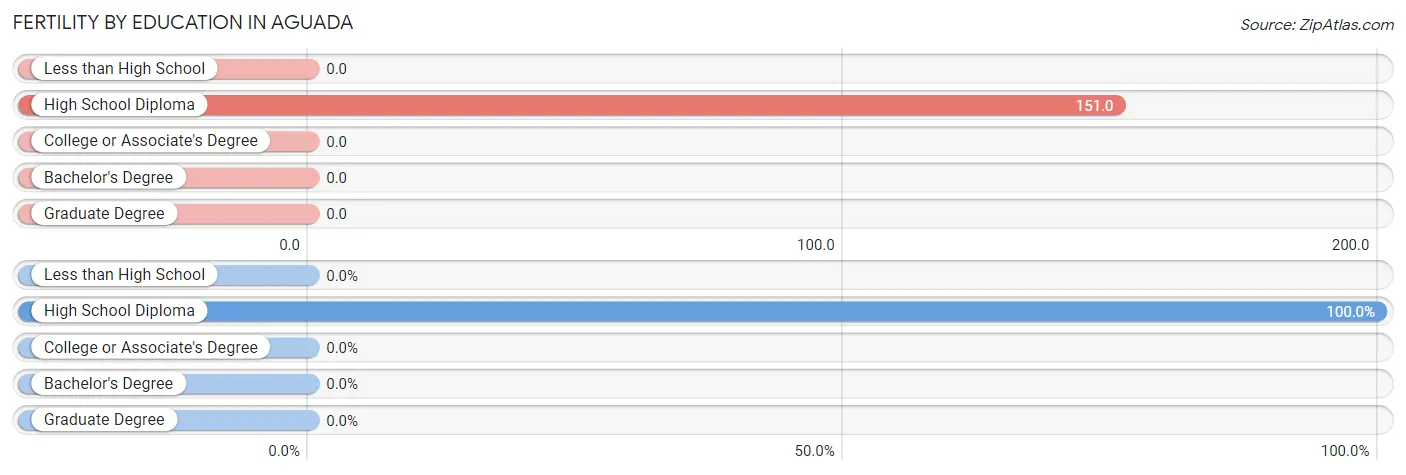
| Educational Attainment | Women with Births | Births / 1,000 Women |
| Less than High School | 0 (0.0%) | 0.0 |
| High School Diploma | 13 (100.0%) | 151.0 |
| College or Associate's Degree | 0 (0.0%) | 0.0 |
| Bachelor's Degree | 0 (0.0%) | 0.0 |
| Graduate Degree | 0 (0.0%) | 0.0 |
| Total | 13 (100.0%) | 20.0 |
Fertility by Education by Marriage Status in Aguada
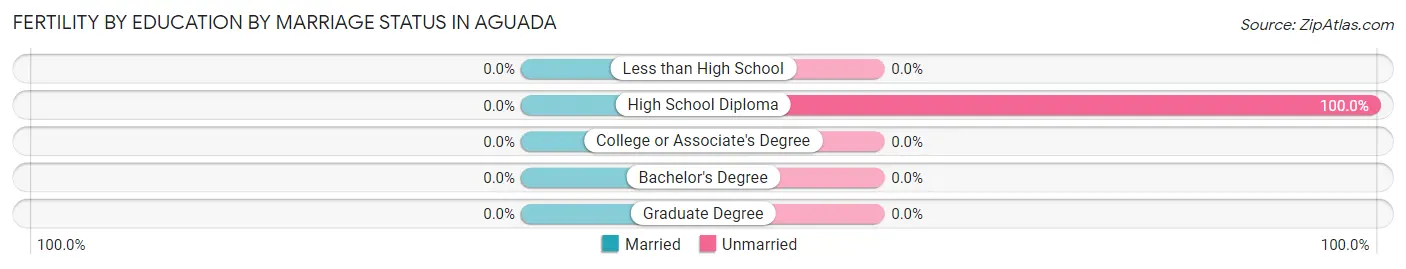
| Educational Attainment | Married | Unmarried |
| Less than High School | 0 (0.0%) | 0 (0.0%) |
| High School Diploma | 0 (0.0%) | 13 (100.0%) |
| College or Associate's Degree | 0 (0.0%) | 0 (0.0%) |
| Bachelor's Degree | 0 (0.0%) | 0 (0.0%) |
| Graduate Degree | 0 (0.0%) | 0 (0.0%) |
| Total | 0 (0.0%) | 13 (100.0%) |
Employment Characteristics in Aguada
Employment by Class of Employer in Aguada
Among the 852 employed individuals in Aguada, private company employees (490 | 57.5%), self-employed (not incorporated) (159 | 18.7%), and state government employees (106 | 12.4%) make up the most common classes of employment.
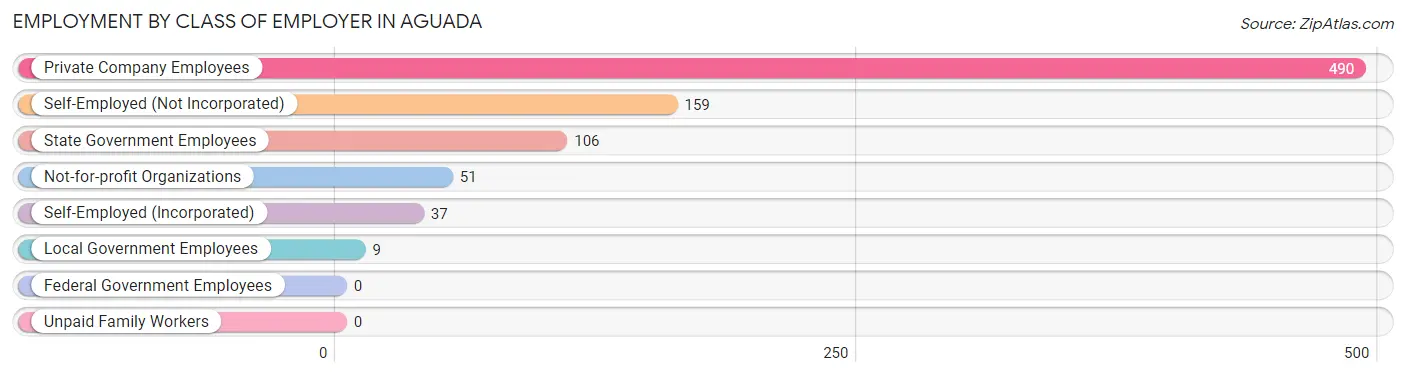
| Employer Class | # Employees | % Employees |
| Private Company Employees | 490 | 57.5% |
| Self-Employed (Incorporated) | 37 | 4.3% |
| Self-Employed (Not Incorporated) | 159 | 18.7% |
| Not-for-profit Organizations | 51 | 6.0% |
| Local Government Employees | 9 | 1.1% |
| State Government Employees | 106 | 12.4% |
| Federal Government Employees | 0 | 0.0% |
| Unpaid Family Workers | 0 | 0.0% |
| Total | 852 | 100.0% |
Employment Status by Age in Aguada
According to the labor force statistics for Aguada, out of the total population over 16 years of age (2,755), 37.7% or 1,039 individuals are in the labor force, with 18.1% or 188 of them unemployed. The age group with the highest labor force participation rate is 35 to 44 years, with 88.8% or 285 individuals in the labor force. Within the labor force, the 20 to 24 years age range has the highest percentage of unemployed individuals, with 41.8% or 33 of them being unemployed.
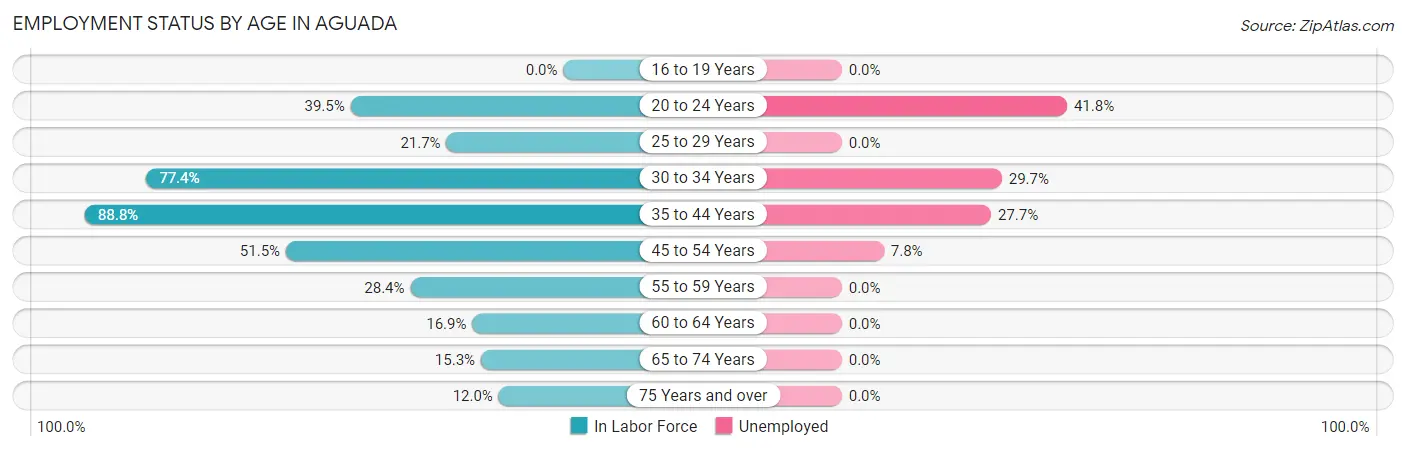
| Age Bracket | In Labor Force | Unemployed |
| 16 to 19 Years | 0 (0.0%) | 0 (0.0%) |
| 20 to 24 Years | 79 (39.5%) | 33 (41.8%) |
| 25 to 29 Years | 28 (21.7%) | 0 (0.0%) |
| 30 to 34 Years | 202 (77.4%) | 60 (29.7%) |
| 35 to 44 Years | 285 (88.8%) | 79 (27.7%) |
| 45 to 54 Years | 206 (51.5%) | 16 (7.8%) |
| 55 to 59 Years | 85 (28.4%) | 0 (0.0%) |
| 60 to 64 Years | 57 (16.9%) | 0 (0.0%) |
| 65 to 74 Years | 52 (15.3%) | 0 (0.0%) |
| 75 Years and over | 46 (12.0%) | 0 (0.0%) |
| Total | 1,039 (37.7%) | 188 (18.1%) |
Employment Status by Educational Attainment in Aguada
According to labor force statistics for Aguada, 49.4% of individuals (863) out of the total population between 25 and 64 years of age (1,747) are in the labor force, with 18.0% or 155 of them being unemployed. The group with the highest labor force participation rate are those with the educational attainment of college / associate degree, with 67.2% or 438 individuals in the labor force. Within the labor force, individuals with less than high school education have the highest percentage of unemployment, with 92.4% or 110 of them being unemployed.
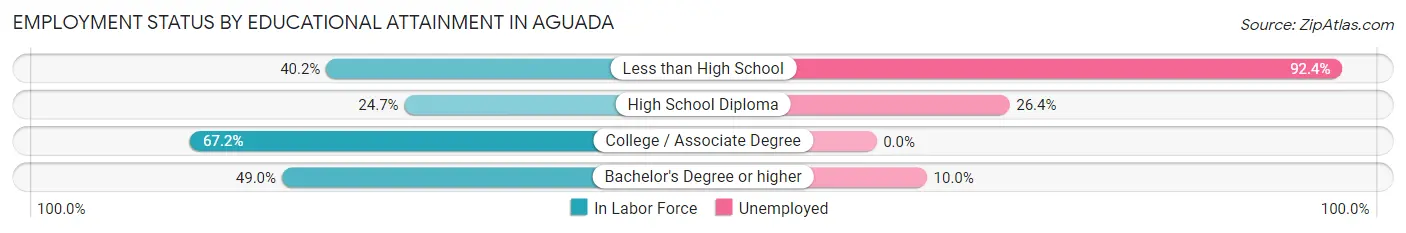
| Educational Attainment | In Labor Force | Unemployed |
| Less than High School | 119 (40.2%) | 274 (92.4%) |
| High School Diploma | 87 (24.7%) | 93 (26.4%) |
| College / Associate Degree | 438 (67.2%) | 0 (0.0%) |
| Bachelor's Degree or higher | 219 (49.0%) | 45 (10.0%) |
| Total | 863 (49.4%) | 314 (18.0%) |
Employment Occupations by Sex in Aguada
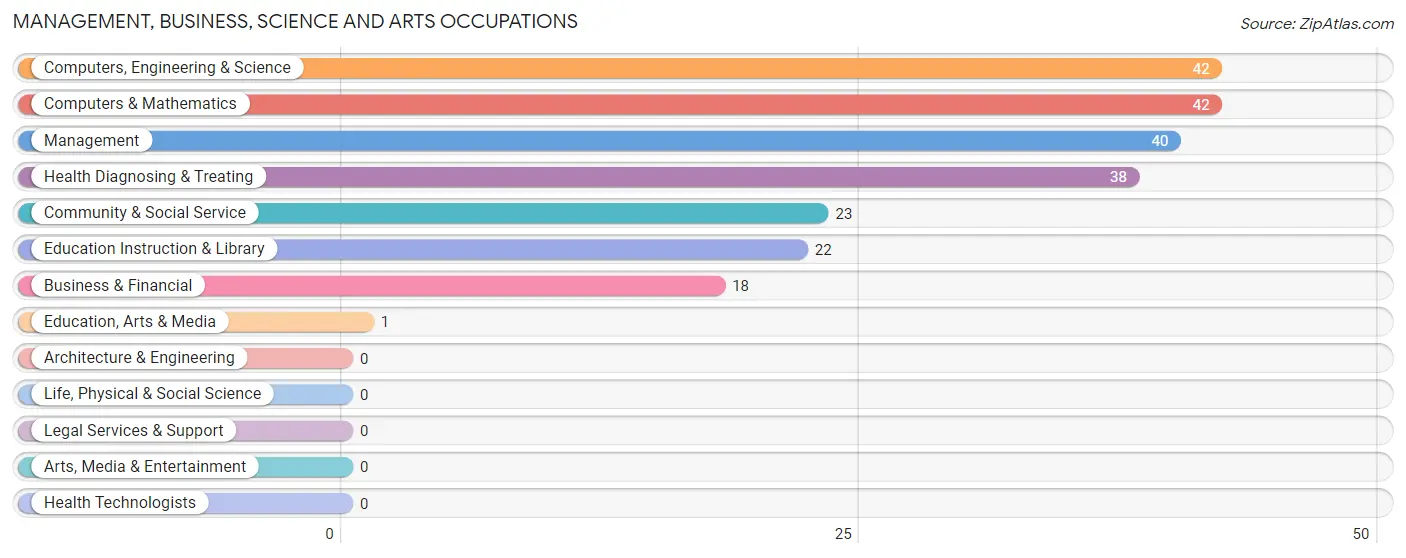
Management, Business, Science and Arts Occupations
The most common Management, Business, Science and Arts occupations in Aguada are Computers, Engineering & Science (42 | 4.9%), Computers & Mathematics (42 | 4.9%), Management (40 | 4.7%), Health Diagnosing & Treating (38 | 4.5%), and Community & Social Service (23 | 2.7%).
Management, Business, Science and Arts Occupations by Sex
Within the Management, Business, Science and Arts occupations in Aguada, the most male-oriented occupations are Computers, Engineering & Science (100.0%), Computers & Mathematics (100.0%), and Education, Arts & Media (100.0%), while the most female-oriented occupations are Education Instruction & Library (100.0%), Health Diagnosing & Treating (100.0%), and Community & Social Service (95.7%).
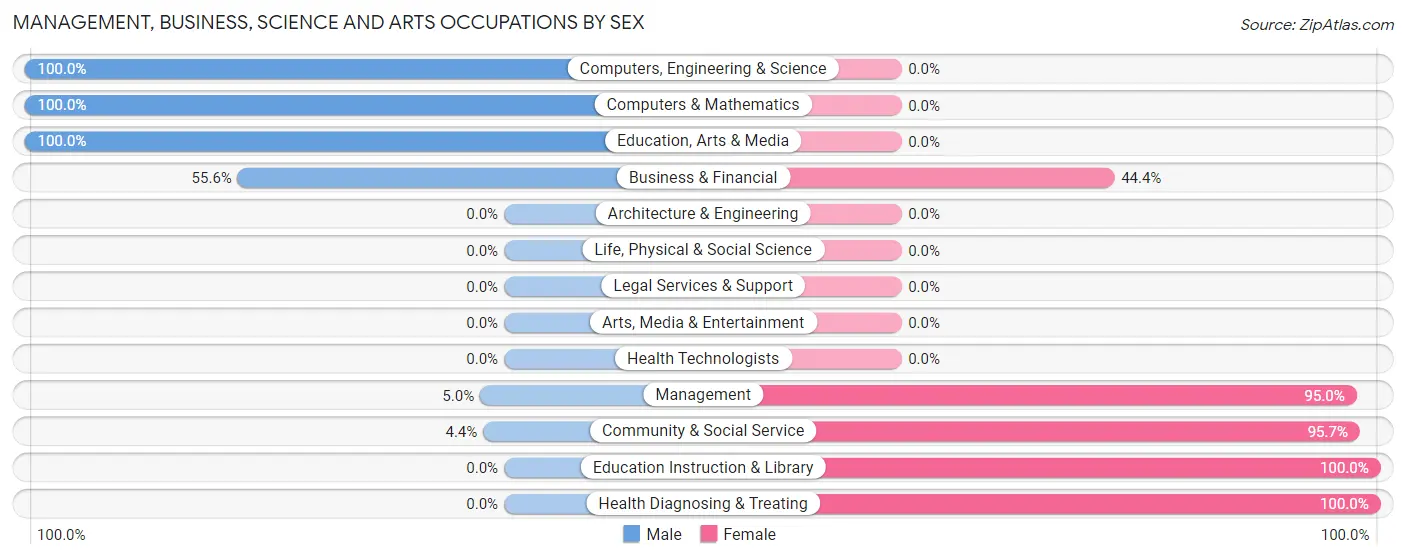
| Occupation | Male | Female |
| Management | 2 (5.0%) | 38 (95.0%) |
| Business & Financial | 10 (55.6%) | 8 (44.4%) |
| Computers, Engineering & Science | 42 (100.0%) | 0 (0.0%) |
| Computers & Mathematics | 42 (100.0%) | 0 (0.0%) |
| Architecture & Engineering | 0 (0.0%) | 0 (0.0%) |
| Life, Physical & Social Science | 0 (0.0%) | 0 (0.0%) |
| Community & Social Service | 1 (4.3%) | 22 (95.7%) |
| Education, Arts & Media | 1 (100.0%) | 0 (0.0%) |
| Legal Services & Support | 0 (0.0%) | 0 (0.0%) |
| Education Instruction & Library | 0 (0.0%) | 22 (100.0%) |
| Arts, Media & Entertainment | 0 (0.0%) | 0 (0.0%) |
| Health Diagnosing & Treating | 0 (0.0%) | 38 (100.0%) |
| Health Technologists | 0 (0.0%) | 0 (0.0%) |
| Total (Category) | 55 (34.2%) | 106 (65.8%) |
| Total (Overall) | 396 (46.5%) | 456 (53.5%) |
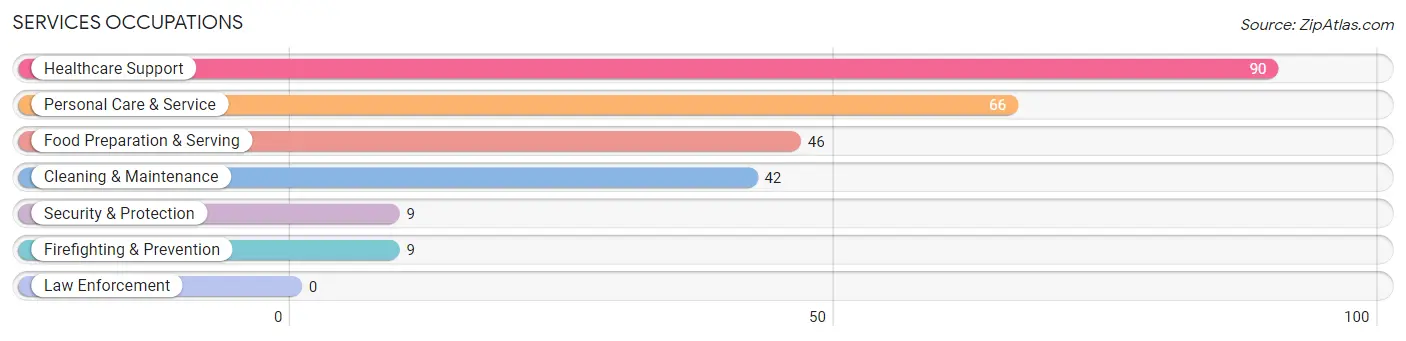
Services Occupations
The most common Services occupations in Aguada are Healthcare Support (90 | 10.6%), Personal Care & Service (66 | 7.7%), Food Preparation & Serving (46 | 5.4%), Cleaning & Maintenance (42 | 4.9%), and Security & Protection (9 | 1.1%).
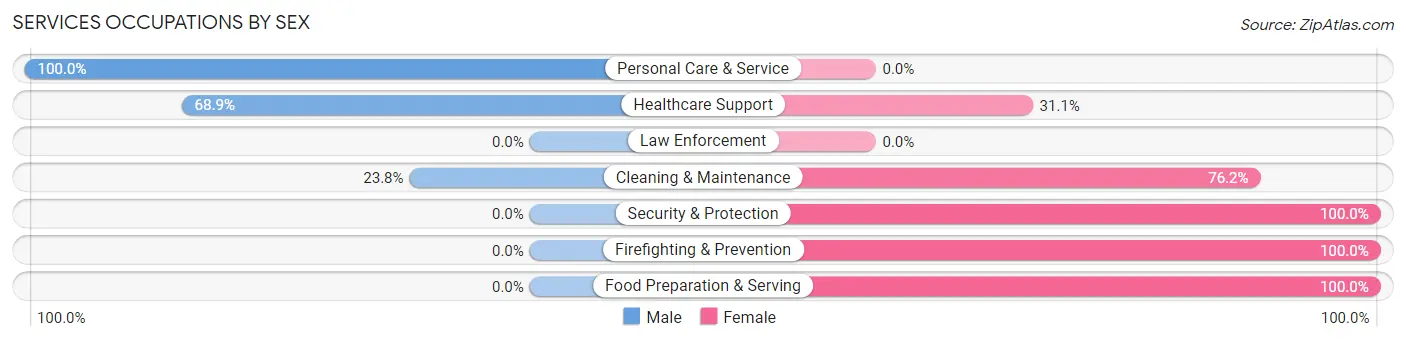
Services Occupations by Sex
Within the Services occupations in Aguada, the most male-oriented occupations are Personal Care & Service (100.0%), Healthcare Support (68.9%), and Cleaning & Maintenance (23.8%), while the most female-oriented occupations are Security & Protection (100.0%), Firefighting & Prevention (100.0%), and Food Preparation & Serving (100.0%).
| Occupation | Male | Female |
| Healthcare Support | 62 (68.9%) | 28 (31.1%) |
| Security & Protection | 0 (0.0%) | 9 (100.0%) |
| Firefighting & Prevention | 0 (0.0%) | 9 (100.0%) |
| Law Enforcement | 0 (0.0%) | 0 (0.0%) |
| Food Preparation & Serving | 0 (0.0%) | 46 (100.0%) |
| Cleaning & Maintenance | 10 (23.8%) | 32 (76.2%) |
| Personal Care & Service | 66 (100.0%) | 0 (0.0%) |
| Total (Category) | 138 (54.5%) | 115 (45.5%) |
| Total (Overall) | 396 (46.5%) | 456 (53.5%) |
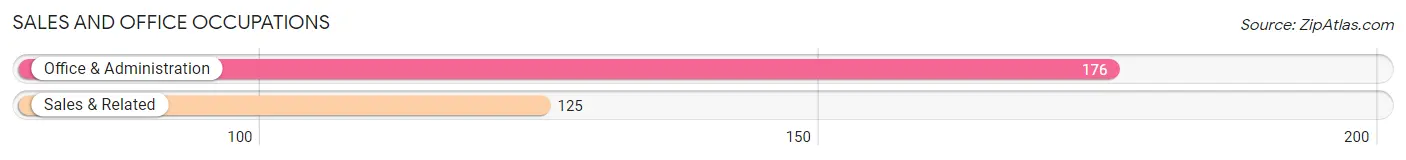
Sales and Office Occupations
The most common Sales and Office occupations in Aguada are Office & Administration (176 | 20.7%), and Sales & Related (125 | 14.7%).
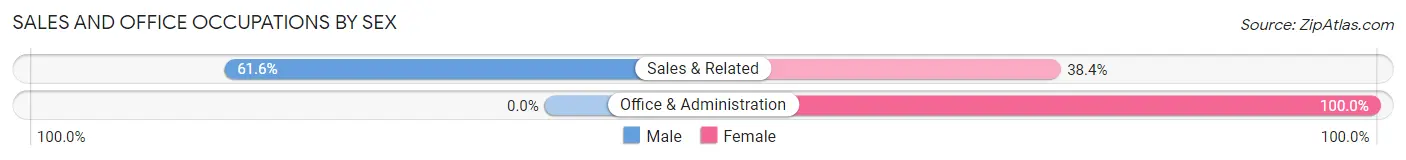
Sales and Office Occupations by Sex
| Occupation | Male | Female |
| Sales & Related | 77 (61.6%) | 48 (38.4%) |
| Office & Administration | 0 (0.0%) | 176 (100.0%) |
| Total (Category) | 77 (25.6%) | 224 (74.4%) |
| Total (Overall) | 396 (46.5%) | 456 (53.5%) |
Natural Resources, Construction and Maintenance Occupations
The most common Natural Resources, Construction and Maintenance occupations in Aguada are Installation, Maintenance & Repair (27 | 3.2%), and Construction & Extraction (24 | 2.8%).
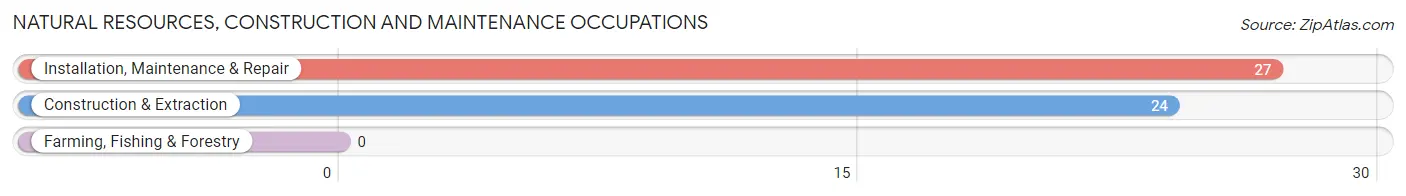
Natural Resources, Construction and Maintenance Occupations by Sex
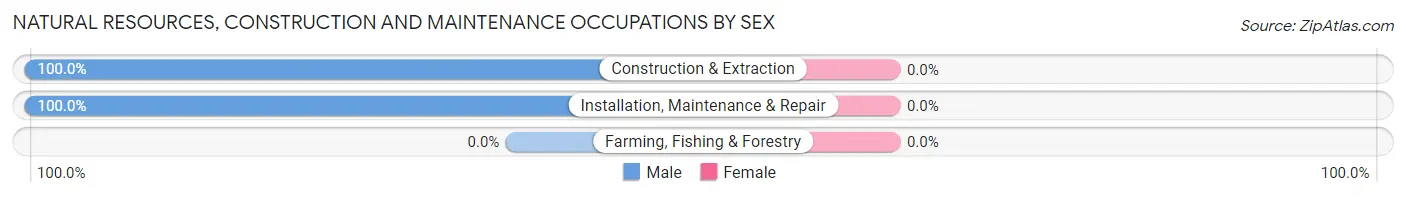
| Occupation | Male | Female |
| Farming, Fishing & Forestry | 0 (0.0%) | 0 (0.0%) |
| Construction & Extraction | 24 (100.0%) | 0 (0.0%) |
| Installation, Maintenance & Repair | 27 (100.0%) | 0 (0.0%) |
| Total (Category) | 51 (100.0%) | 0 (0.0%) |
| Total (Overall) | 396 (46.5%) | 456 (53.5%) |
Production, Transportation and Moving Occupations
The most common Production, Transportation and Moving occupations in Aguada are Material Moving (49 | 5.8%), and Production (37 | 4.3%).
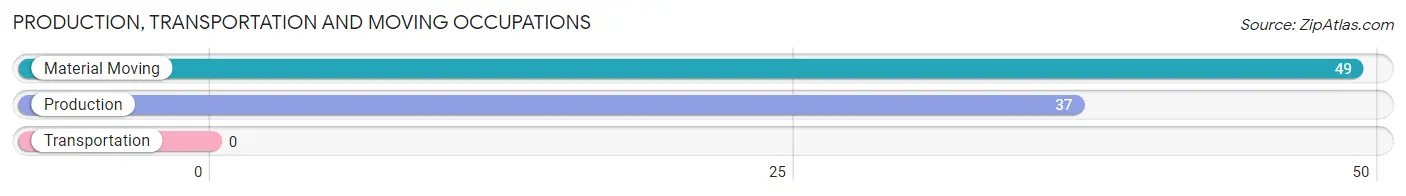
Production, Transportation and Moving Occupations by Sex
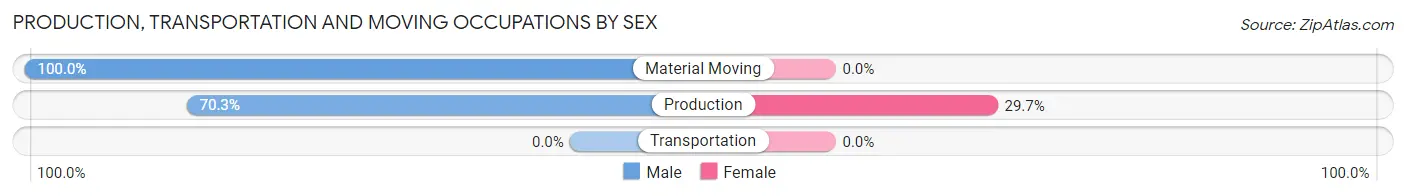
| Occupation | Male | Female |
| Production | 26 (70.3%) | 11 (29.7%) |
| Transportation | 0 (0.0%) | 0 (0.0%) |
| Material Moving | 49 (100.0%) | 0 (0.0%) |
| Total (Category) | 75 (87.2%) | 11 (12.8%) |
| Total (Overall) | 396 (46.5%) | 456 (53.5%) |
Employment Industries by Sex in Aguada
Employment Industries in Aguada
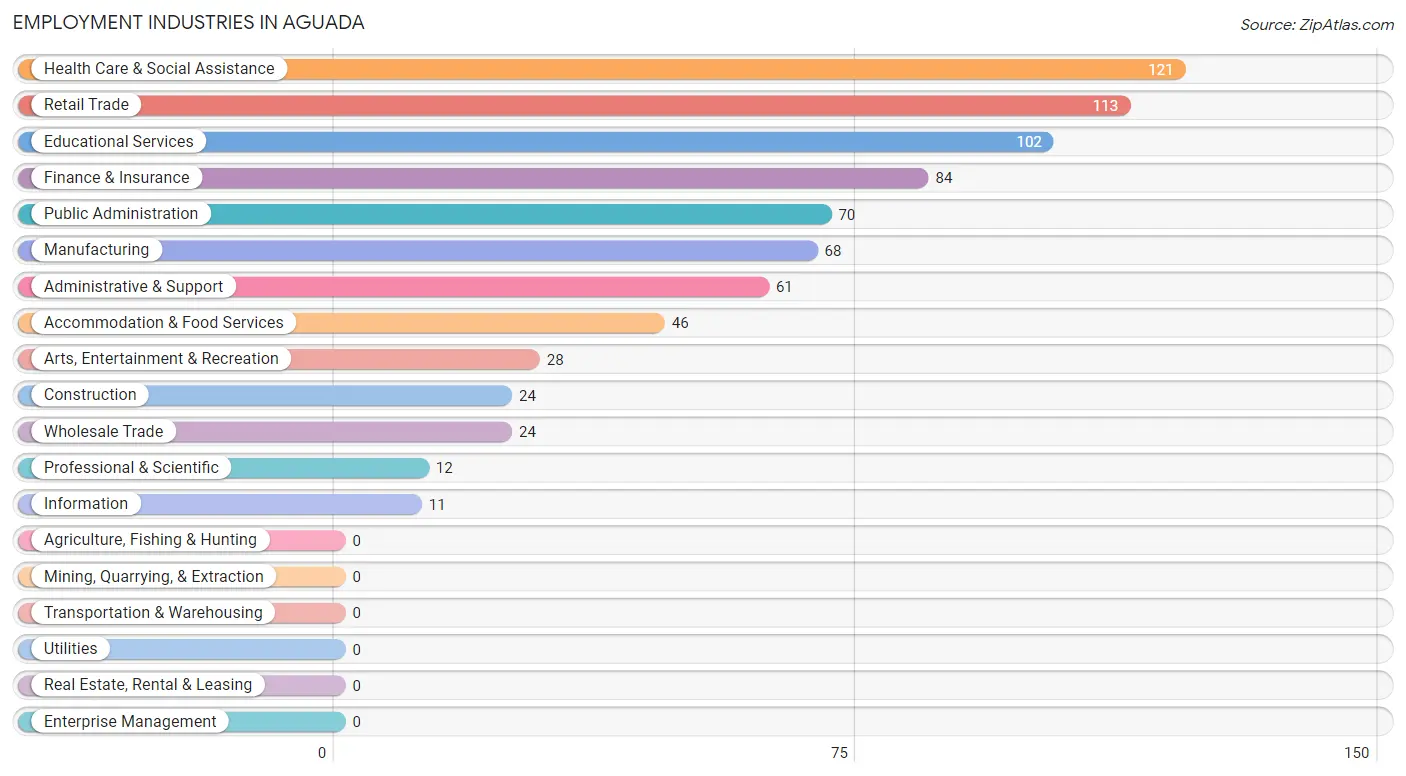
The major employment industries in Aguada include Health Care & Social Assistance (121 | 14.2%), Retail Trade (113 | 13.3%), Educational Services (102 | 12.0%), Finance & Insurance (84 | 9.9%), and Public Administration (70 | 8.2%).
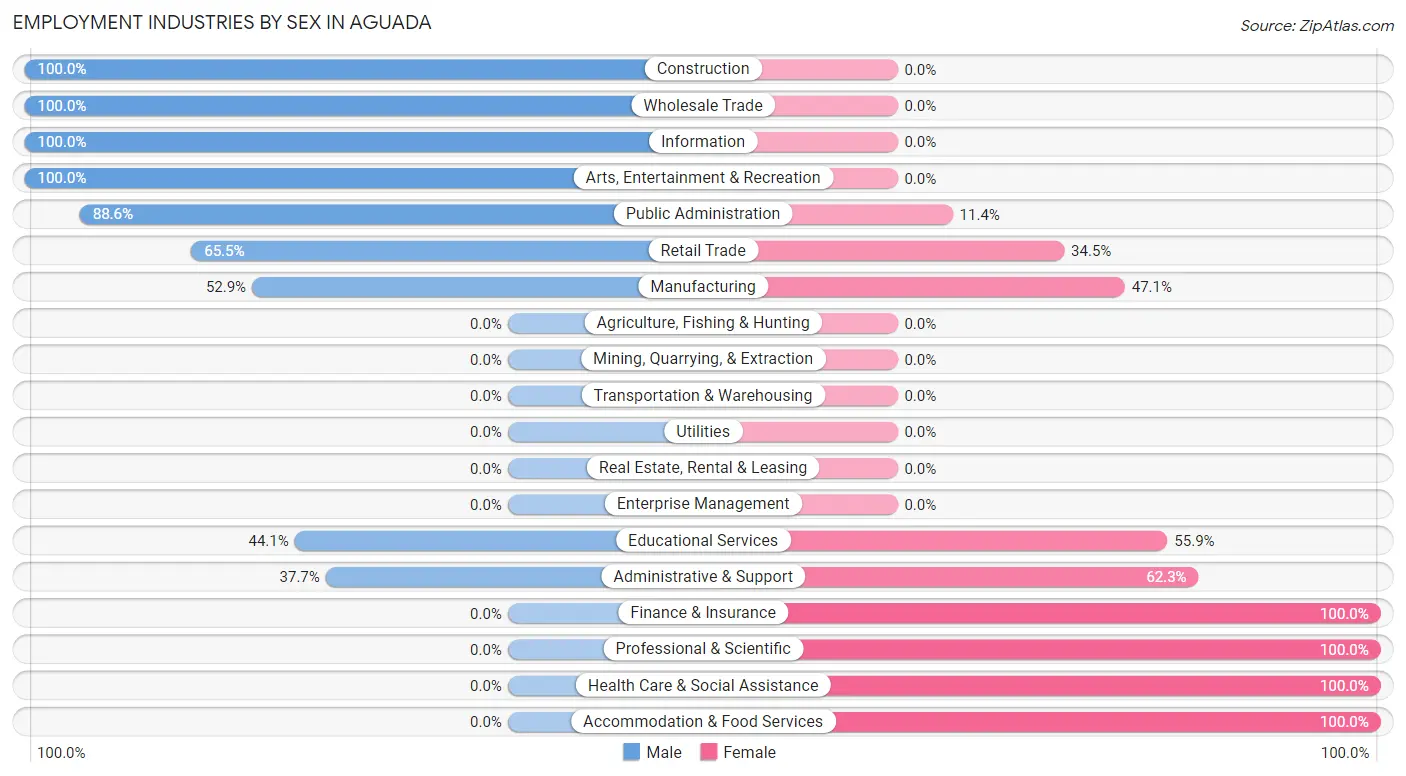
Employment Industries by Sex in Aguada
The Aguada industries that see more men than women are Construction (100.0%), Wholesale Trade (100.0%), and Information (100.0%), whereas the industries that tend to have a higher number of women are Finance & Insurance (100.0%), Professional & Scientific (100.0%), and Health Care & Social Assistance (100.0%).
| Industry | Male | Female |
| Agriculture, Fishing & Hunting | 0 (0.0%) | 0 (0.0%) |
| Mining, Quarrying, & Extraction | 0 (0.0%) | 0 (0.0%) |
| Construction | 24 (100.0%) | 0 (0.0%) |
| Manufacturing | 36 (52.9%) | 32 (47.1%) |
| Wholesale Trade | 24 (100.0%) | 0 (0.0%) |
| Retail Trade | 74 (65.5%) | 39 (34.5%) |
| Transportation & Warehousing | 0 (0.0%) | 0 (0.0%) |
| Utilities | 0 (0.0%) | 0 (0.0%) |
| Information | 11 (100.0%) | 0 (0.0%) |
| Finance & Insurance | 0 (0.0%) | 84 (100.0%) |
| Real Estate, Rental & Leasing | 0 (0.0%) | 0 (0.0%) |
| Professional & Scientific | 0 (0.0%) | 12 (100.0%) |
| Enterprise Management | 0 (0.0%) | 0 (0.0%) |
| Administrative & Support | 23 (37.7%) | 38 (62.3%) |
| Educational Services | 45 (44.1%) | 57 (55.9%) |
| Health Care & Social Assistance | 0 (0.0%) | 121 (100.0%) |
| Arts, Entertainment & Recreation | 28 (100.0%) | 0 (0.0%) |
| Accommodation & Food Services | 0 (0.0%) | 46 (100.0%) |
| Public Administration | 62 (88.6%) | 8 (11.4%) |
| Total | 396 (46.5%) | 456 (53.5%) |
Education in Aguada
School Enrollment in Aguada
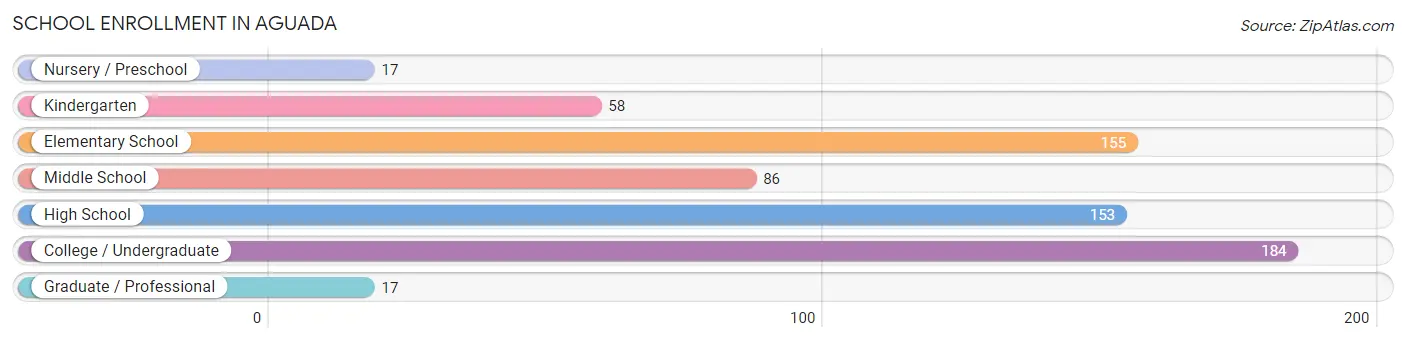
The most common levels of schooling among the 670 students in Aguada are college / undergraduate (184 | 27.5%), elementary school (155 | 23.1%), and high school (153 | 22.8%).
| School Level | # Students | % Students |
| Nursery / Preschool | 17 | 2.5% |
| Kindergarten | 58 | 8.7% |
| Elementary School | 155 | 23.1% |
| Middle School | 86 | 12.8% |
| High School | 153 | 22.8% |
| College / Undergraduate | 184 | 27.5% |
| Graduate / Professional | 17 | 2.5% |
| Total | 670 | 100.0% |
School Enrollment by Age by Funding Source in Aguada
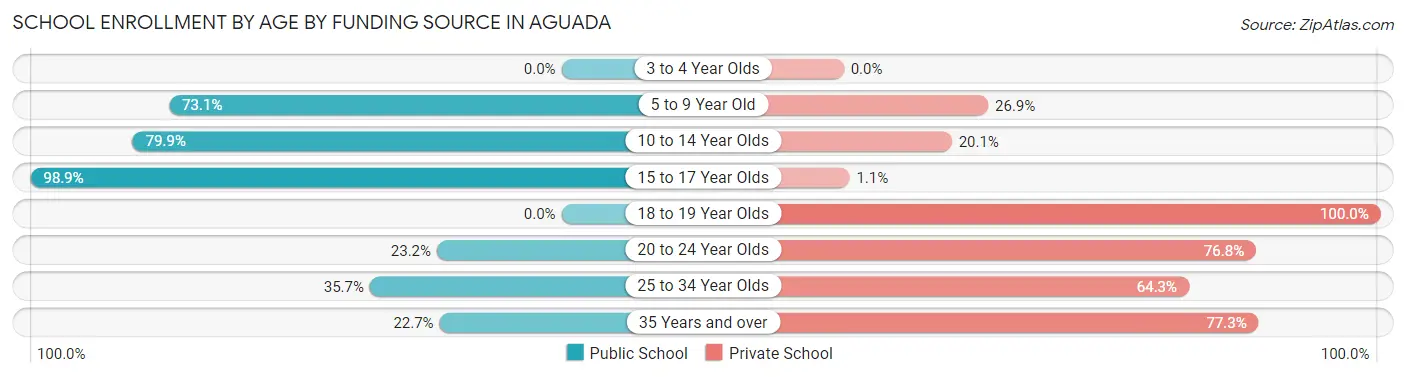
Out of a total of 670 students who are enrolled in schools in Aguada, 252 (37.6%) attend a private institution, while the remaining 418 (62.4%) are enrolled in public schools. The age group of 18 to 19 year olds has the highest likelihood of being enrolled in private schools, with 18 (100.0% in the age bracket) enrolled. Conversely, the age group of 15 to 17 year olds has the lowest likelihood of being enrolled in a private school, with 92 (98.9% in the age bracket) attending a public institution.
| Age Bracket | Public School | Private School |
| 3 to 4 Year Olds | 0 (0.0%) | 0 (0.0%) |
| 5 to 9 Year Old | 144 (73.1%) | 53 (26.9%) |
| 10 to 14 Year Olds | 131 (79.9%) | 33 (20.1%) |
| 15 to 17 Year Olds | 92 (98.9%) | 1 (1.1%) |
| 18 to 19 Year Olds | 0 (0.0%) | 18 (100.0%) |
| 20 to 24 Year Olds | 26 (23.2%) | 86 (76.8%) |
| 25 to 34 Year Olds | 15 (35.7%) | 27 (64.3%) |
| 35 Years and over | 10 (22.7%) | 34 (77.3%) |
| Total | 418 (62.4%) | 252 (37.6%) |
Educational Attainment by Field of Study in Aguada
Business (177 | 25.9%), psychology (96 | 14.1%), education (92 | 13.5%), arts & humanities (92 | 13.5%), and bio, nature & agricultural (38 | 5.6%) are the most common fields of study among 683 individuals in Aguada who have obtained a bachelor's degree or higher.
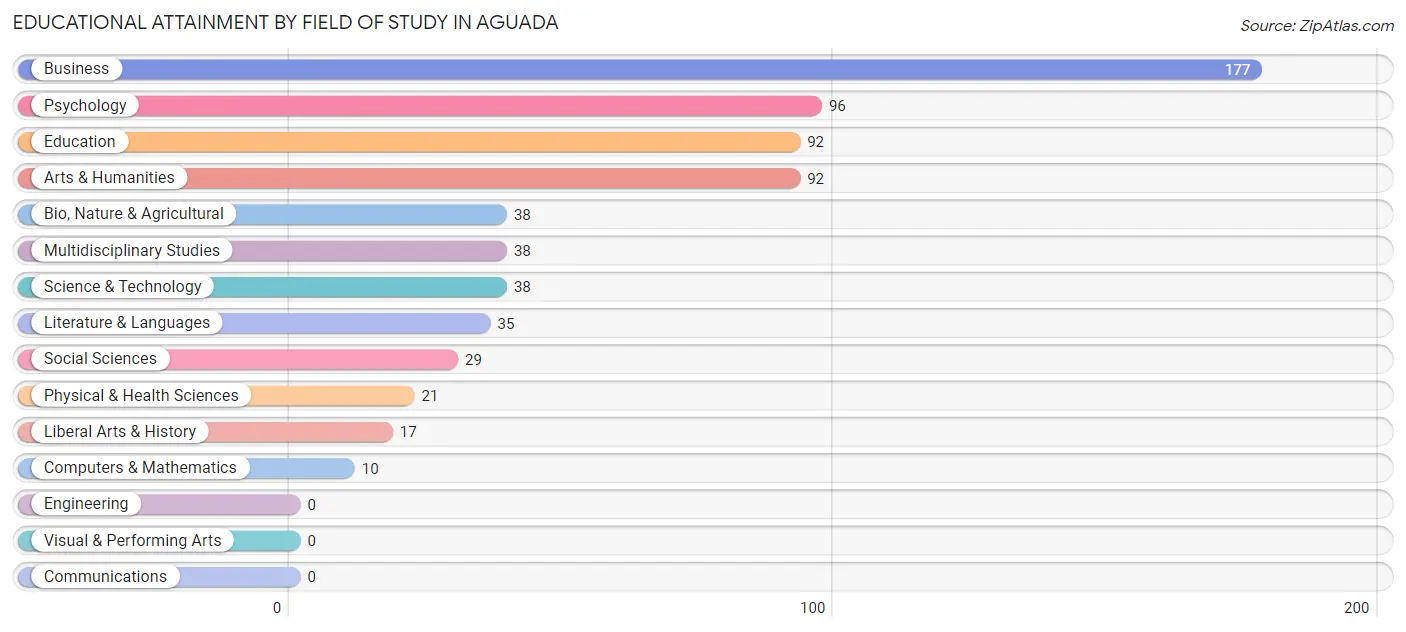
| Field of Study | # Graduates | % Graduates |
| Computers & Mathematics | 10 | 1.5% |
| Bio, Nature & Agricultural | 38 | 5.6% |
| Physical & Health Sciences | 21 | 3.1% |
| Psychology | 96 | 14.1% |
| Social Sciences | 29 | 4.3% |
| Engineering | 0 | 0.0% |
| Multidisciplinary Studies | 38 | 5.6% |
| Science & Technology | 38 | 5.6% |
| Business | 177 | 25.9% |
| Education | 92 | 13.5% |
| Literature & Languages | 35 | 5.1% |
| Liberal Arts & History | 17 | 2.5% |
| Visual & Performing Arts | 0 | 0.0% |
| Communications | 0 | 0.0% |
| Arts & Humanities | 92 | 13.5% |
| Total | 683 | 100.0% |
Transportation & Commute in Aguada
Vehicle Availability by Sex in Aguada
The most prevalent vehicle ownership categories in Aguada are males with 2 vehicles (133, accounting for 33.8%) and females with 2 vehicles (112, making up 29.2%).
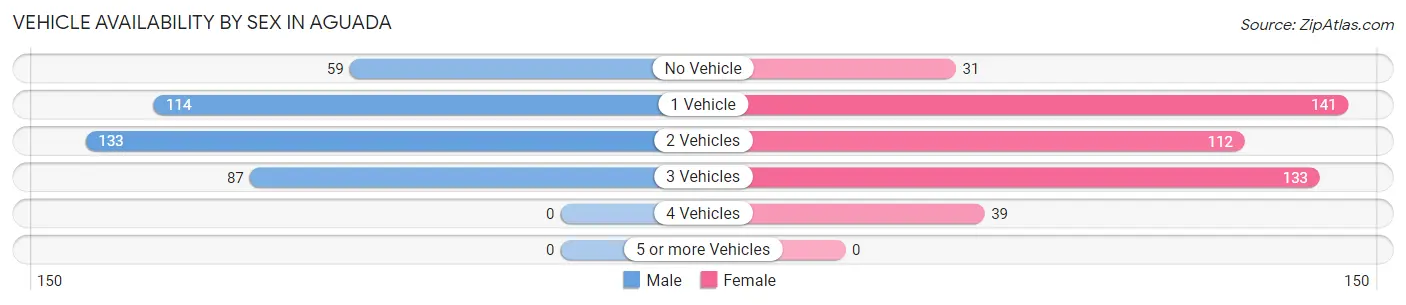
| Vehicles Available | Male | Female |
| No Vehicle | 59 (15.0%) | 31 (6.8%) |
| 1 Vehicle | 114 (29.0%) | 141 (30.9%) |
| 2 Vehicles | 133 (33.8%) | 112 (24.6%) |
| 3 Vehicles | 87 (22.1%) | 133 (29.2%) |
| 4 Vehicles | 0 (0.0%) | 39 (8.6%) |
| 5 or more Vehicles | 0 (0.0%) | 0 (0.0%) |
| Total | 393 (100.0%) | 456 (100.0%) |
Commute Time in Aguada
The most frequently occuring commute durations in Aguada are 5 to 9 minutes (174 commuters, 21.6%), 15 to 19 minutes (141 commuters, 17.5%), and 45 to 59 minutes (106 commuters, 13.2%).
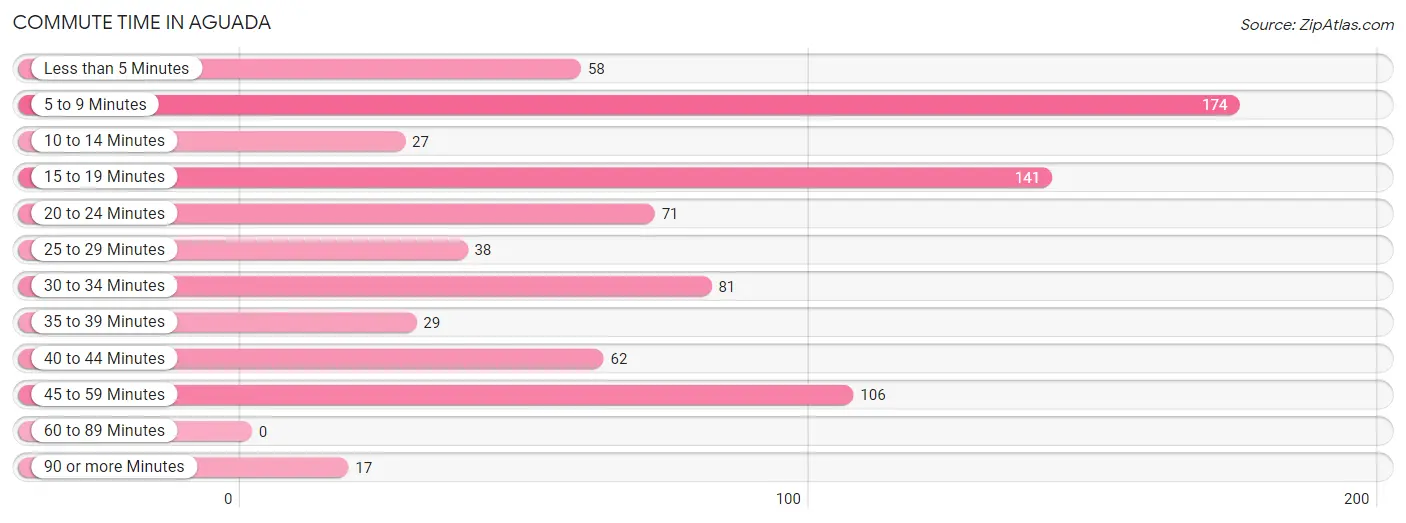
| Commute Time | # Commuters | % Commuters |
| Less than 5 Minutes | 58 | 7.2% |
| 5 to 9 Minutes | 174 | 21.6% |
| 10 to 14 Minutes | 27 | 3.4% |
| 15 to 19 Minutes | 141 | 17.5% |
| 20 to 24 Minutes | 71 | 8.8% |
| 25 to 29 Minutes | 38 | 4.7% |
| 30 to 34 Minutes | 81 | 10.1% |
| 35 to 39 Minutes | 29 | 3.6% |
| 40 to 44 Minutes | 62 | 7.7% |
| 45 to 59 Minutes | 106 | 13.2% |
| 60 to 89 Minutes | 0 | 0.0% |
| 90 or more Minutes | 17 | 2.1% |
Commute Time by Sex in Aguada
The most common commute times in Aguada are 15 to 19 minutes (83 commuters, 22.5%) for males and 5 to 9 minutes (119 commuters, 27.4%) for females.
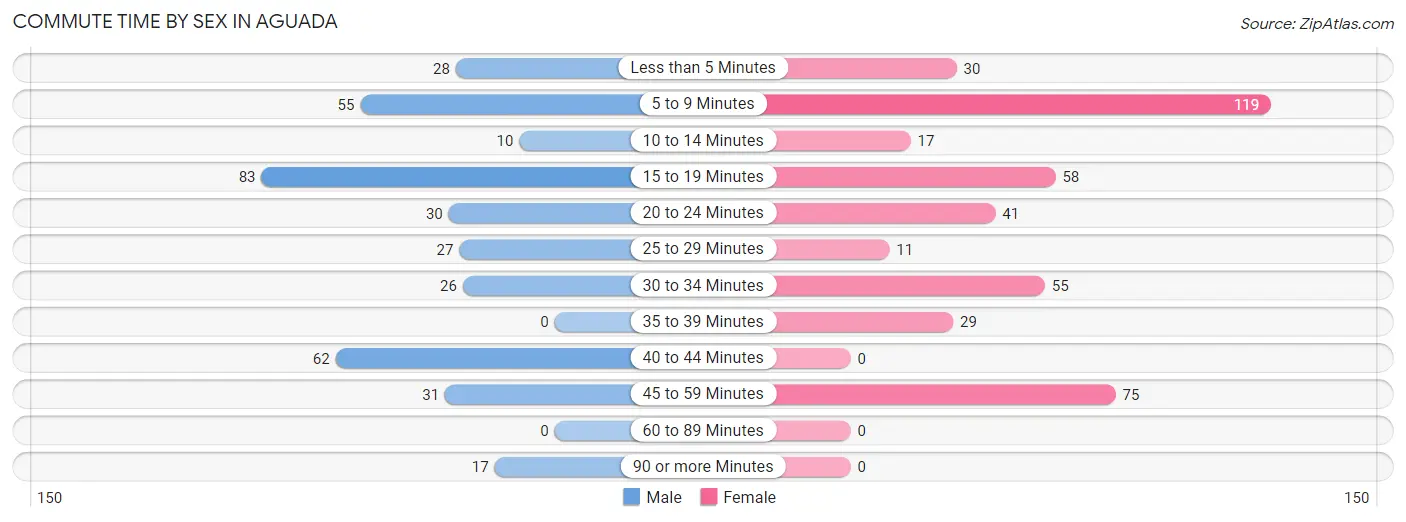
| Commute Time | Male | Female |
| Less than 5 Minutes | 28 (7.6%) | 30 (6.9%) |
| 5 to 9 Minutes | 55 (14.9%) | 119 (27.4%) |
| 10 to 14 Minutes | 10 (2.7%) | 17 (3.9%) |
| 15 to 19 Minutes | 83 (22.5%) | 58 (13.3%) |
| 20 to 24 Minutes | 30 (8.1%) | 41 (9.4%) |
| 25 to 29 Minutes | 27 (7.3%) | 11 (2.5%) |
| 30 to 34 Minutes | 26 (7.0%) | 55 (12.6%) |
| 35 to 39 Minutes | 0 (0.0%) | 29 (6.7%) |
| 40 to 44 Minutes | 62 (16.8%) | 0 (0.0%) |
| 45 to 59 Minutes | 31 (8.4%) | 75 (17.2%) |
| 60 to 89 Minutes | 0 (0.0%) | 0 (0.0%) |
| 90 or more Minutes | 17 (4.6%) | 0 (0.0%) |
Time of Departure to Work by Sex in Aguada
The most frequent times of departure to work in Aguada are 7:00 AM to 7:29 AM (116, 31.4%) for males and 7:00 AM to 7:29 AM (166, 38.2%) for females.
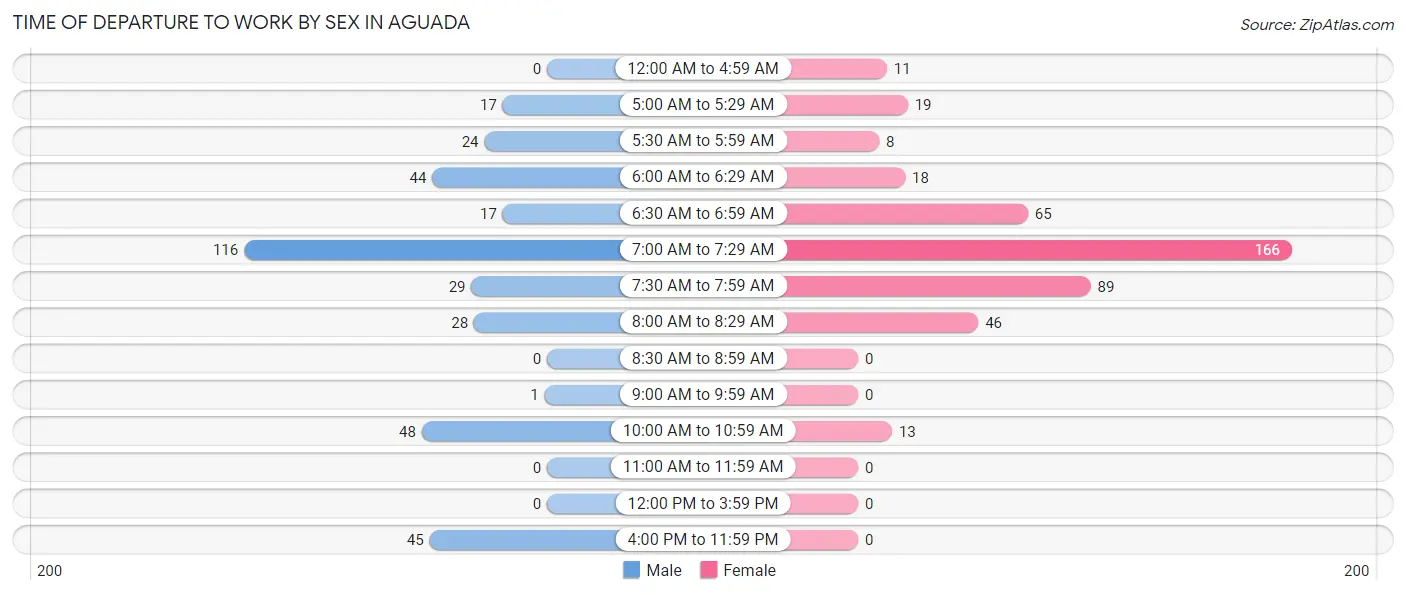
| Time of Departure | Male | Female |
| 12:00 AM to 4:59 AM | 0 (0.0%) | 11 (2.5%) |
| 5:00 AM to 5:29 AM | 17 (4.6%) | 19 (4.4%) |
| 5:30 AM to 5:59 AM | 24 (6.5%) | 8 (1.8%) |
| 6:00 AM to 6:29 AM | 44 (11.9%) | 18 (4.1%) |
| 6:30 AM to 6:59 AM | 17 (4.6%) | 65 (14.9%) |
| 7:00 AM to 7:29 AM | 116 (31.4%) | 166 (38.2%) |
| 7:30 AM to 7:59 AM | 29 (7.9%) | 89 (20.5%) |
| 8:00 AM to 8:29 AM | 28 (7.6%) | 46 (10.6%) |
| 8:30 AM to 8:59 AM | 0 (0.0%) | 0 (0.0%) |
| 9:00 AM to 9:59 AM | 1 (0.3%) | 0 (0.0%) |
| 10:00 AM to 10:59 AM | 48 (13.0%) | 13 (3.0%) |
| 11:00 AM to 11:59 AM | 0 (0.0%) | 0 (0.0%) |
| 12:00 PM to 3:59 PM | 0 (0.0%) | 0 (0.0%) |
| 4:00 PM to 11:59 PM | 45 (12.2%) | 0 (0.0%) |
| Total | 369 (100.0%) | 435 (100.0%) |
Housing Occupancy in Aguada
Occupancy by Ownership in Aguada
Of the total 1,301 dwellings in Aguada, owner-occupied units account for 797 (61.3%), while renter-occupied units make up 504 (38.7%).
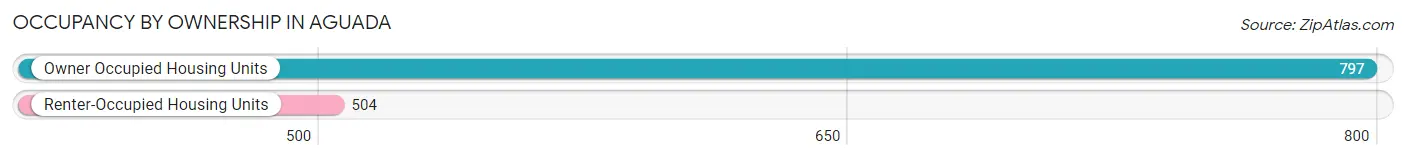
| Occupancy | # Housing Units | % Housing Units |
| Owner Occupied Housing Units | 797 | 61.3% |
| Renter-Occupied Housing Units | 504 | 38.7% |
| Total Occupied Housing Units | 1,301 | 100.0% |
Occupancy by Household Size in Aguada
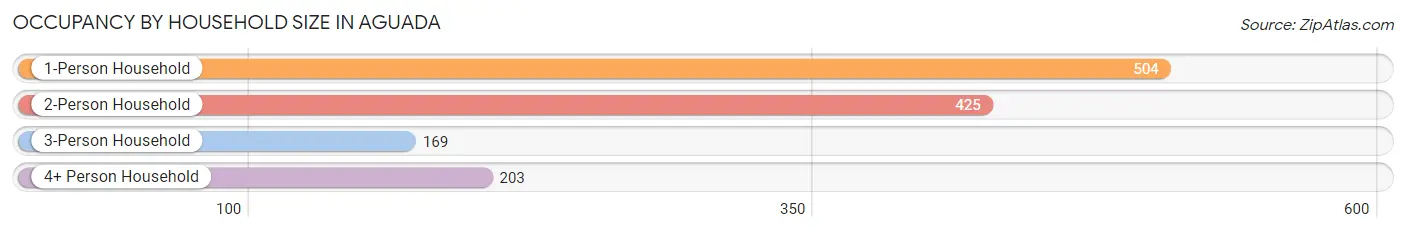
| Household Size | # Housing Units | % Housing Units |
| 1-Person Household | 504 | 38.7% |
| 2-Person Household | 425 | 32.7% |
| 3-Person Household | 169 | 13.0% |
| 4+ Person Household | 203 | 15.6% |
| Total Housing Units | 1,301 | 100.0% |
Occupancy by Ownership by Household Size in Aguada
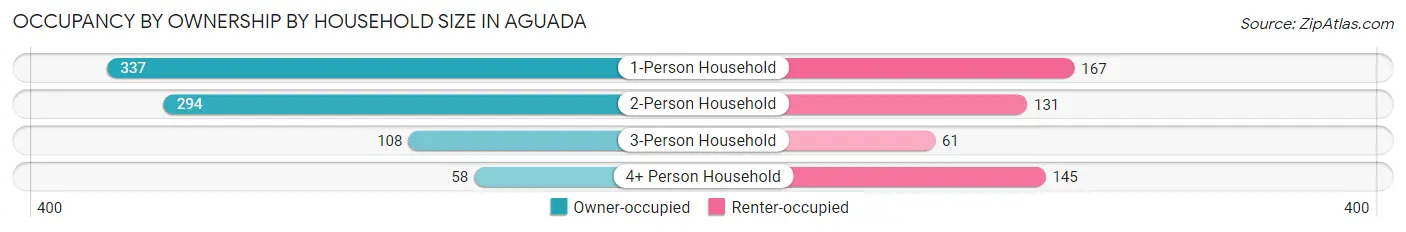
| Household Size | Owner-occupied | Renter-occupied |
| 1-Person Household | 337 (66.9%) | 167 (33.1%) |
| 2-Person Household | 294 (69.2%) | 131 (30.8%) |
| 3-Person Household | 108 (63.9%) | 61 (36.1%) |
| 4+ Person Household | 58 (28.6%) | 145 (71.4%) |
| Total Housing Units | 797 (61.3%) | 504 (38.7%) |
Occupancy by Educational Attainment in Aguada
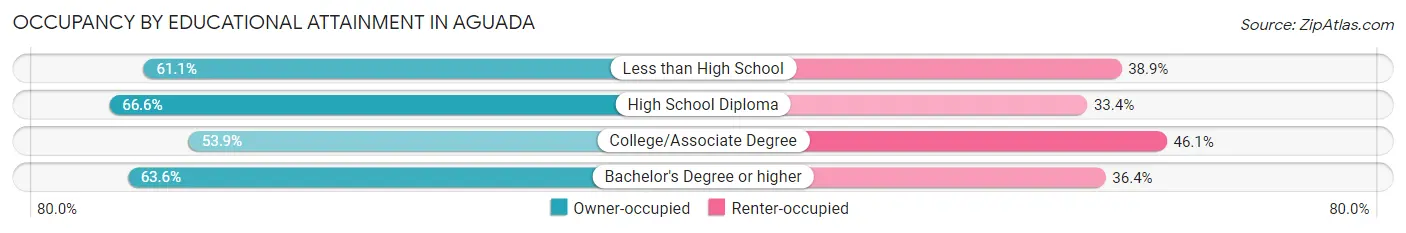
| Household Size | Owner-occupied | Renter-occupied |
| Less than High School | 225 (61.1%) | 143 (38.9%) |
| High School Diploma | 205 (66.6%) | 103 (33.4%) |
| College/Associate Degree | 171 (53.9%) | 146 (46.1%) |
| Bachelor's Degree or higher | 196 (63.6%) | 112 (36.4%) |
Occupancy by Age of Householder in Aguada
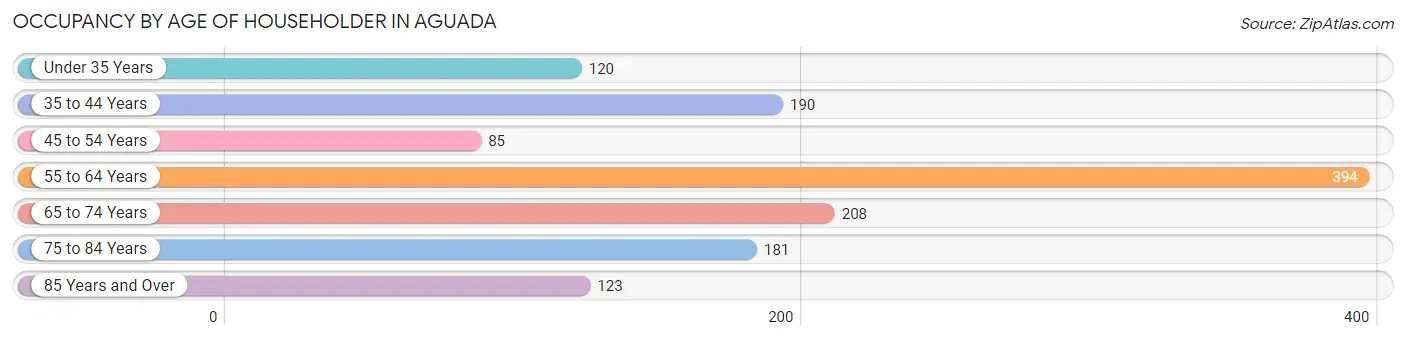
| Age Bracket | # Households | % Households |
| Under 35 Years | 120 | 9.2% |
| 35 to 44 Years | 190 | 14.6% |
| 45 to 54 Years | 85 | 6.5% |
| 55 to 64 Years | 394 | 30.3% |
| 65 to 74 Years | 208 | 16.0% |
| 75 to 84 Years | 181 | 13.9% |
| 85 Years and Over | 123 | 9.5% |
| Total | 1,301 | 100.0% |
Housing Finances in Aguada
Median Income by Occupancy in Aguada
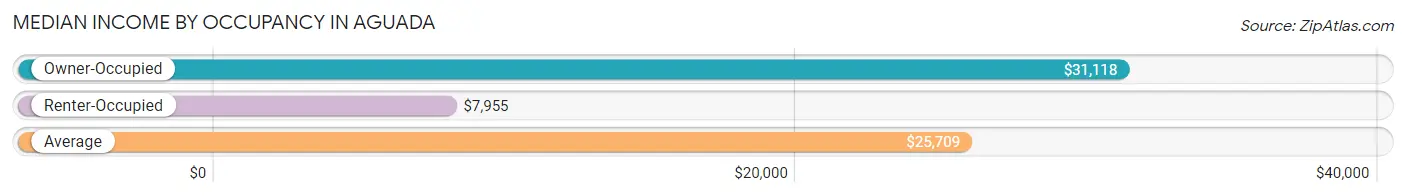
| Occupancy Type | # Households | Median Income |
| Owner-Occupied | 797 (61.3%) | $31,118 |
| Renter-Occupied | 504 (38.7%) | $7,955 |
| Average | 1,301 (100.0%) | $25,709 |
Occupancy by Householder Income Bracket in Aguada
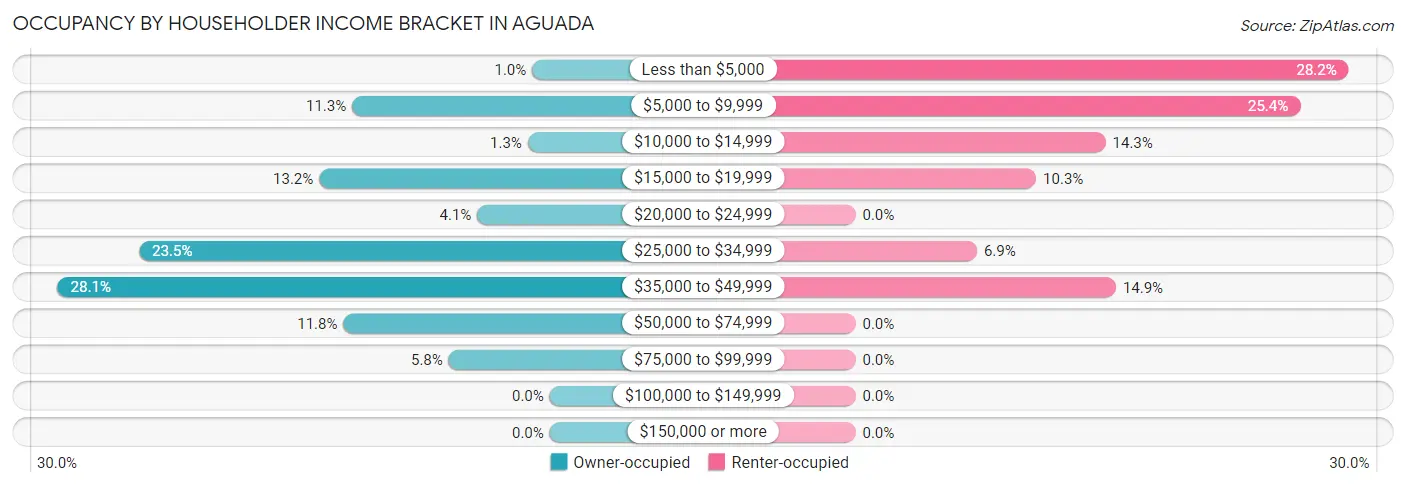
| Income Bracket | Owner-occupied | Renter-occupied |
| Less than $5,000 | 8 (1.0%) | 142 (28.2%) |
| $5,000 to $9,999 | 90 (11.3%) | 128 (25.4%) |
| $10,000 to $14,999 | 10 (1.3%) | 72 (14.3%) |
| $15,000 to $19,999 | 105 (13.2%) | 52 (10.3%) |
| $20,000 to $24,999 | 33 (4.1%) | 0 (0.0%) |
| $25,000 to $34,999 | 187 (23.5%) | 35 (6.9%) |
| $35,000 to $49,999 | 224 (28.1%) | 75 (14.9%) |
| $50,000 to $74,999 | 94 (11.8%) | 0 (0.0%) |
| $75,000 to $99,999 | 46 (5.8%) | 0 (0.0%) |
| $100,000 to $149,999 | 0 (0.0%) | 0 (0.0%) |
| $150,000 or more | 0 (0.0%) | 0 (0.0%) |
| Total | 797 (100.0%) | 504 (100.0%) |
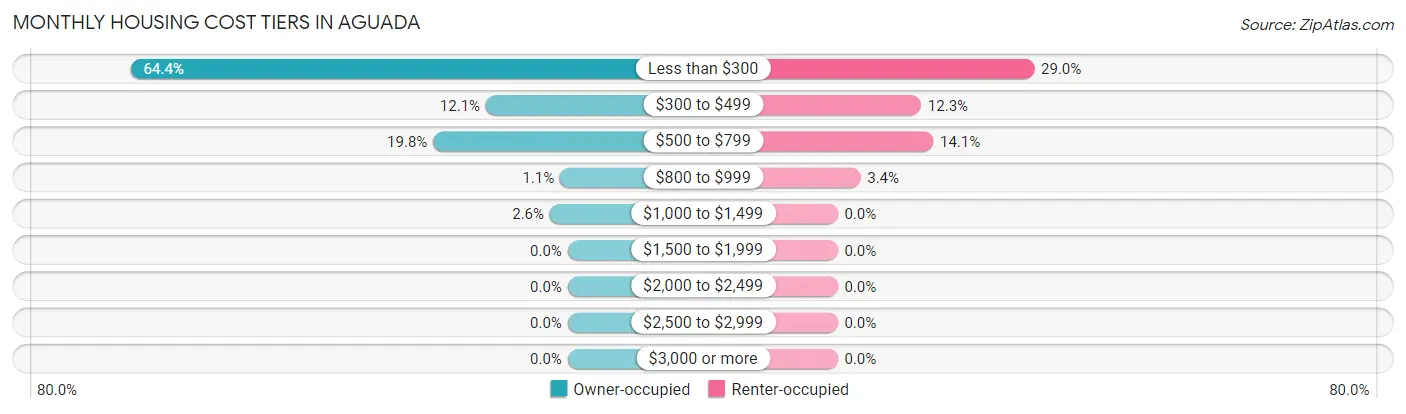
Monthly Housing Cost Tiers in Aguada
| Monthly Cost | Owner-occupied | Renter-occupied |
| Less than $300 | 513 (64.4%) | 146 (29.0%) |
| $300 to $499 | 96 (12.0%) | 62 (12.3%) |
| $500 to $799 | 158 (19.8%) | 71 (14.1%) |
| $800 to $999 | 9 (1.1%) | 17 (3.4%) |
| $1,000 to $1,499 | 21 (2.6%) | 0 (0.0%) |
| $1,500 to $1,999 | 0 (0.0%) | 0 (0.0%) |
| $2,000 to $2,499 | 0 (0.0%) | 0 (0.0%) |
| $2,500 to $2,999 | 0 (0.0%) | 0 (0.0%) |
| $3,000 or more | 0 (0.0%) | 0 (0.0%) |
| Total | 797 (100.0%) | 504 (100.0%) |
Physical Housing Characteristics in Aguada
Housing Structures in Aguada
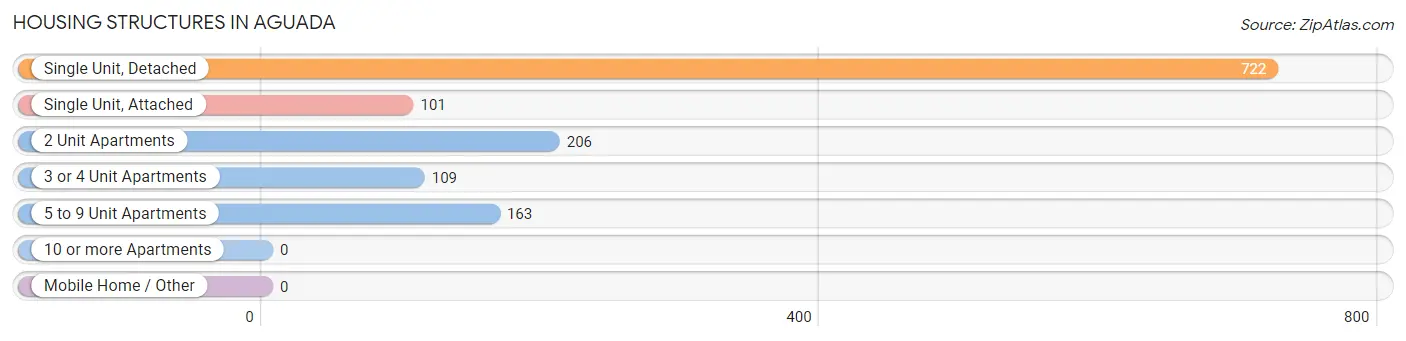
| Structure Type | # Housing Units | % Housing Units |
| Single Unit, Detached | 722 | 55.5% |
| Single Unit, Attached | 101 | 7.8% |
| 2 Unit Apartments | 206 | 15.8% |
| 3 or 4 Unit Apartments | 109 | 8.4% |
| 5 to 9 Unit Apartments | 163 | 12.5% |
| 10 or more Apartments | 0 | 0.0% |
| Mobile Home / Other | 0 | 0.0% |
| Total | 1,301 | 100.0% |
Housing Structures by Occupancy in Aguada
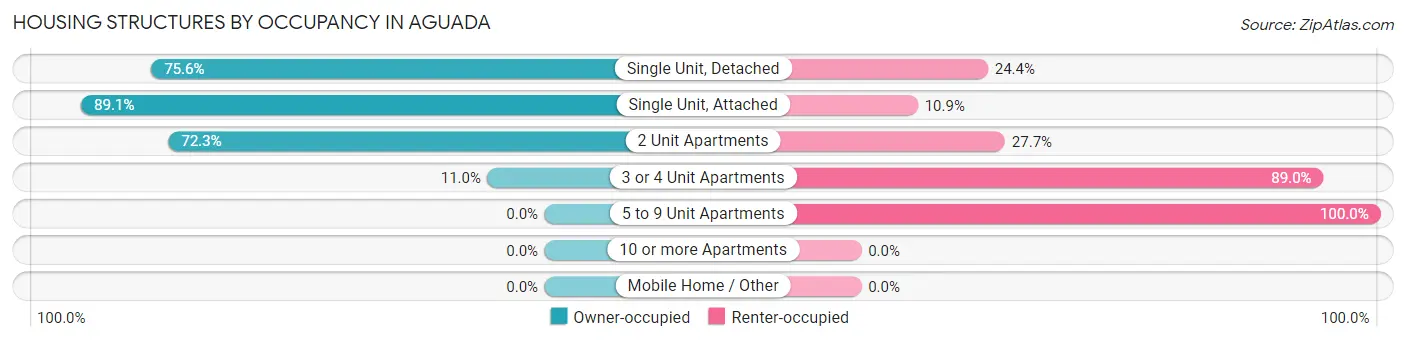
| Structure Type | Owner-occupied | Renter-occupied |
| Single Unit, Detached | 546 (75.6%) | 176 (24.4%) |
| Single Unit, Attached | 90 (89.1%) | 11 (10.9%) |
| 2 Unit Apartments | 149 (72.3%) | 57 (27.7%) |
| 3 or 4 Unit Apartments | 12 (11.0%) | 97 (89.0%) |
| 5 to 9 Unit Apartments | 0 (0.0%) | 163 (100.0%) |
| 10 or more Apartments | 0 (0.0%) | 0 (0.0%) |
| Mobile Home / Other | 0 (0.0%) | 0 (0.0%) |
| Total | 797 (61.3%) | 504 (38.7%) |
Housing Structures by Number of Rooms in Aguada
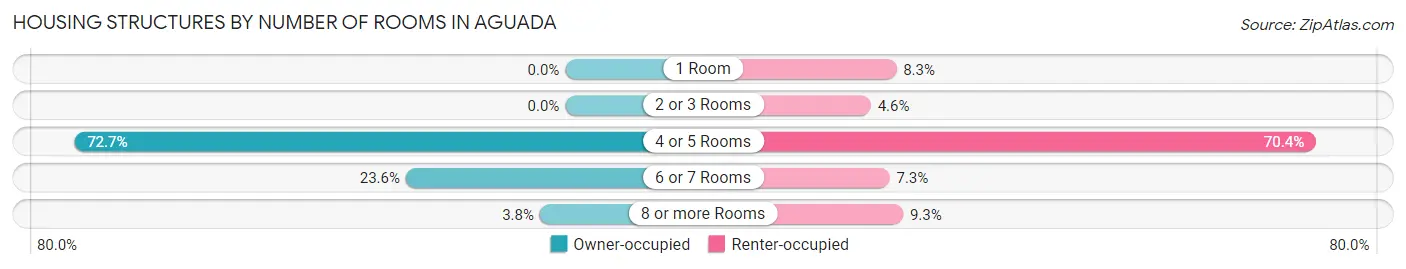
| Number of Rooms | Owner-occupied | Renter-occupied |
| 1 Room | 0 (0.0%) | 42 (8.3%) |
| 2 or 3 Rooms | 0 (0.0%) | 23 (4.6%) |
| 4 or 5 Rooms | 579 (72.7%) | 355 (70.4%) |
| 6 or 7 Rooms | 188 (23.6%) | 37 (7.3%) |
| 8 or more Rooms | 30 (3.8%) | 47 (9.3%) |
| Total | 797 (100.0%) | 504 (100.0%) |
Housing Structure by Heating Type in Aguada
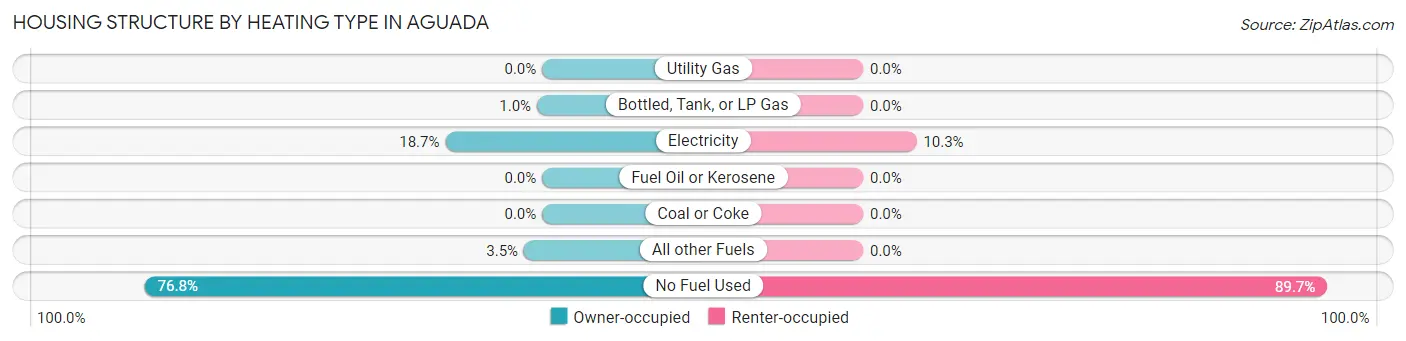
| Heating Type | Owner-occupied | Renter-occupied |
| Utility Gas | 0 (0.0%) | 0 (0.0%) |
| Bottled, Tank, or LP Gas | 8 (1.0%) | 0 (0.0%) |
| Electricity | 149 (18.7%) | 52 (10.3%) |
| Fuel Oil or Kerosene | 0 (0.0%) | 0 (0.0%) |
| Coal or Coke | 0 (0.0%) | 0 (0.0%) |
| All other Fuels | 28 (3.5%) | 0 (0.0%) |
| No Fuel Used | 612 (76.8%) | 452 (89.7%) |
| Total | 797 (100.0%) | 504 (100.0%) |
Household Vehicle Usage in Aguada
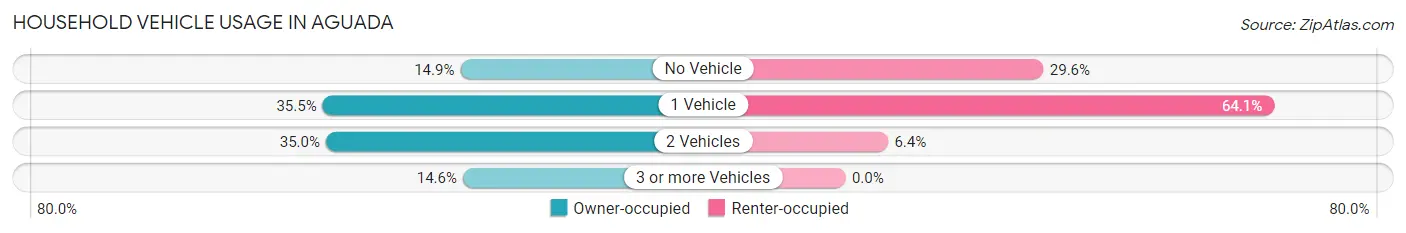
| Vehicles per Household | Owner-occupied | Renter-occupied |
| No Vehicle | 119 (14.9%) | 149 (29.6%) |
| 1 Vehicle | 283 (35.5%) | 323 (64.1%) |
| 2 Vehicles | 279 (35.0%) | 32 (6.4%) |
| 3 or more Vehicles | 116 (14.5%) | 0 (0.0%) |
| Total | 797 (100.0%) | 504 (100.0%) |
Real Estate & Mortgages in Aguada
Real Estate and Mortgage Overview in Aguada
| Characteristic | Without Mortgage | With Mortgage |
| Housing Units | 572 | 225 |
| Median Property Value | $97,100 | $117,000 |
| Median Household Income | $29,731 | $0 |
| Monthly Housing Costs | $157 | $0 |
| Real Estate Taxes | - | - |
Property Value by Mortgage Status in Aguada
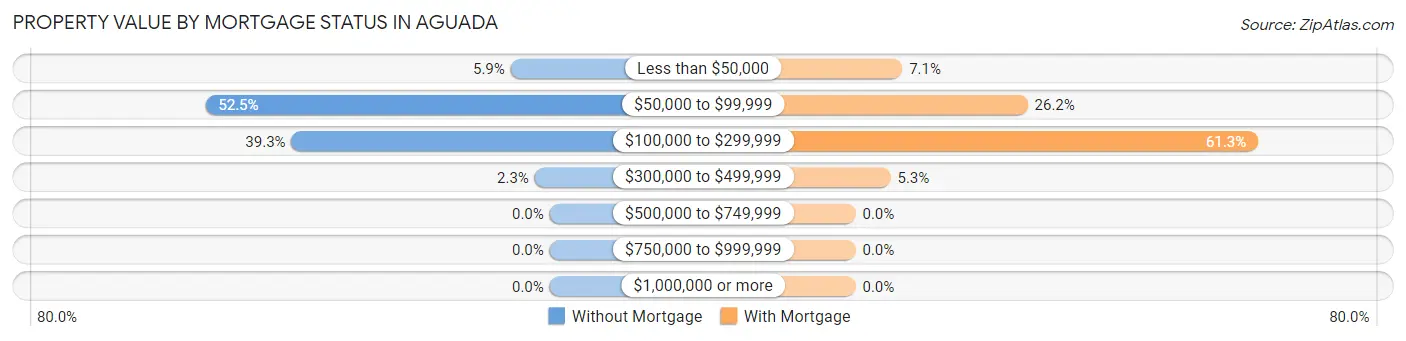
| Property Value | Without Mortgage | With Mortgage |
| Less than $50,000 | 34 (5.9%) | 16 (7.1%) |
| $50,000 to $99,999 | 300 (52.4%) | 59 (26.2%) |
| $100,000 to $299,999 | 225 (39.3%) | 138 (61.3%) |
| $300,000 to $499,999 | 13 (2.3%) | 12 (5.3%) |
| $500,000 to $749,999 | 0 (0.0%) | 0 (0.0%) |
| $750,000 to $999,999 | 0 (0.0%) | 0 (0.0%) |
| $1,000,000 or more | 0 (0.0%) | 0 (0.0%) |
| Total | 572 (100.0%) | 225 (100.0%) |
Household Income by Mortgage Status in Aguada
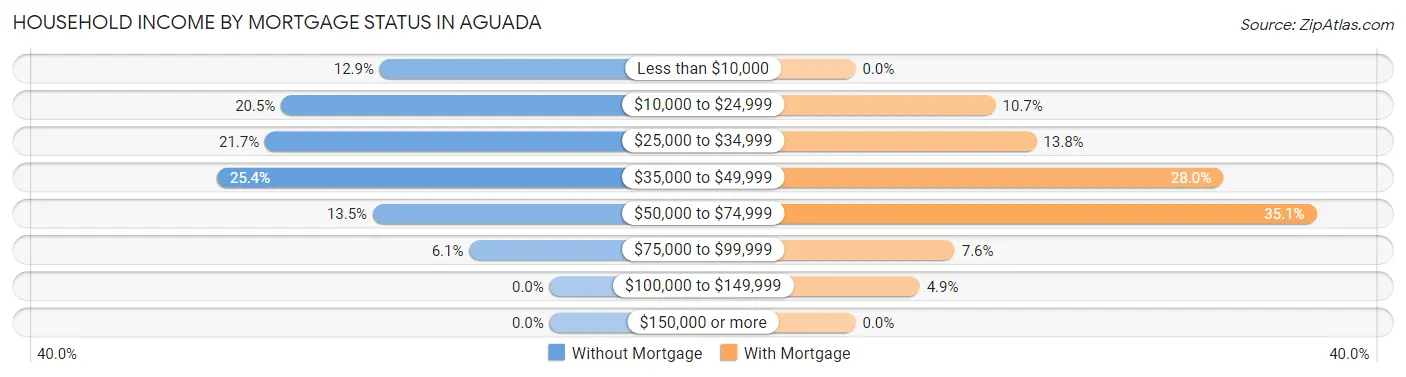
| Household Income | Without Mortgage | With Mortgage |
| Less than $10,000 | 74 (12.9%) | 0 (0.0%) |
| $10,000 to $24,999 | 117 (20.4%) | 24 (10.7%) |
| $25,000 to $34,999 | 124 (21.7%) | 31 (13.8%) |
| $35,000 to $49,999 | 145 (25.4%) | 63 (28.0%) |
| $50,000 to $74,999 | 77 (13.5%) | 79 (35.1%) |
| $75,000 to $99,999 | 35 (6.1%) | 17 (7.6%) |
| $100,000 to $149,999 | 0 (0.0%) | 11 (4.9%) |
| $150,000 or more | 0 (0.0%) | 0 (0.0%) |
| Total | 572 (100.0%) | 225 (100.0%) |
Property Value to Household Income Ratio in Aguada
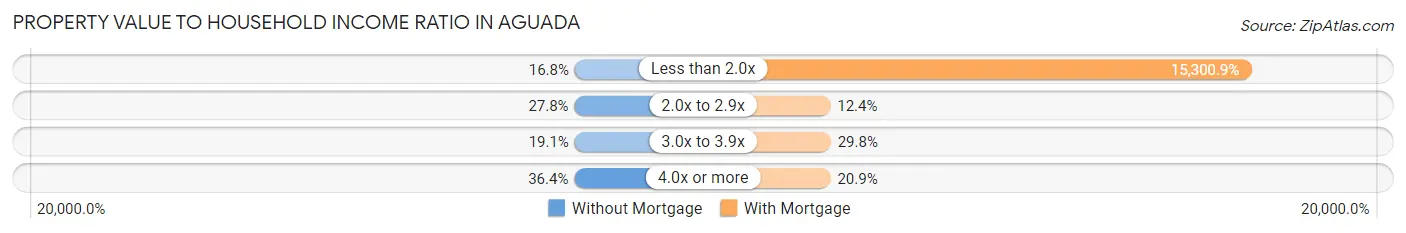
| Value-to-Income Ratio | Without Mortgage | With Mortgage |
| Less than 2.0x | 96 (16.8%) | 34,427 (15,300.9%) |
| 2.0x to 2.9x | 159 (27.8%) | 28 (12.4%) |
| 3.0x to 3.9x | 109 (19.1%) | 67 (29.8%) |
| 4.0x or more | 208 (36.4%) | 47 (20.9%) |
| Total | 572 (100.0%) | 225 (100.0%) |
Real Estate Taxes by Mortgage Status in Aguada
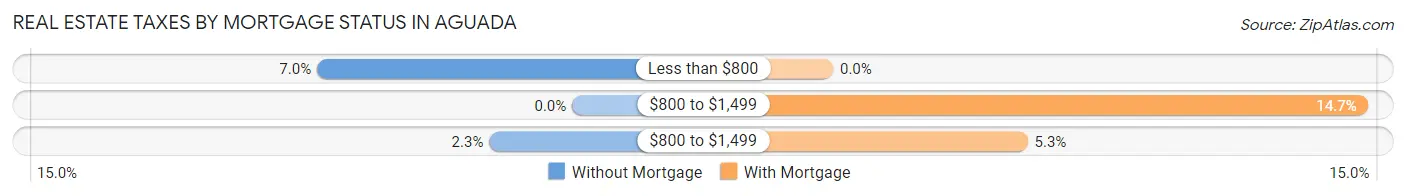
| Property Taxes | Without Mortgage | With Mortgage |
| Less than $800 | 40 (7.0%) | 0 (0.0%) |
| $800 to $1,499 | 0 (0.0%) | 33 (14.7%) |
| $800 to $1,499 | 13 (2.3%) | 12 (5.3%) |
| Total | 572 (100.0%) | 225 (100.0%) |
Health & Disability in Aguada
Health Insurance Coverage by Age in Aguada
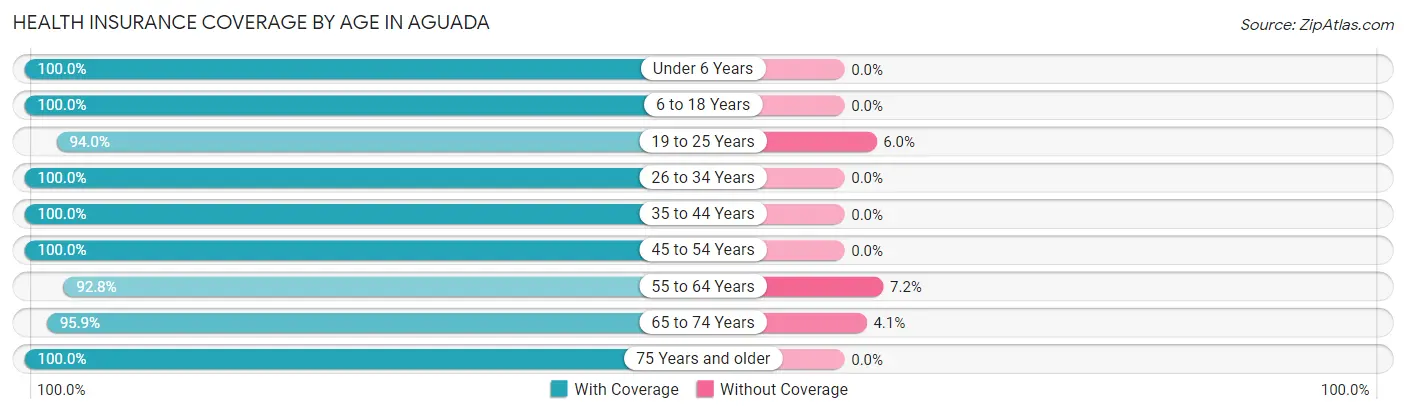
| Age Bracket | With Coverage | Without Coverage |
| Under 6 Years | 109 (100.0%) | 0 (0.0%) |
| 6 to 18 Years | 436 (100.0%) | 0 (0.0%) |
| 19 to 25 Years | 205 (94.0%) | 13 (6.0%) |
| 26 to 34 Years | 390 (100.0%) | 0 (0.0%) |
| 35 to 44 Years | 321 (100.0%) | 0 (0.0%) |
| 45 to 54 Years | 400 (100.0%) | 0 (0.0%) |
| 55 to 64 Years | 590 (92.8%) | 46 (7.2%) |
| 65 to 74 Years | 325 (95.9%) | 14 (4.1%) |
| 75 Years and older | 378 (100.0%) | 0 (0.0%) |
| Total | 3,154 (97.7%) | 73 (2.3%) |
Health Insurance Coverage by Citizenship Status in Aguada
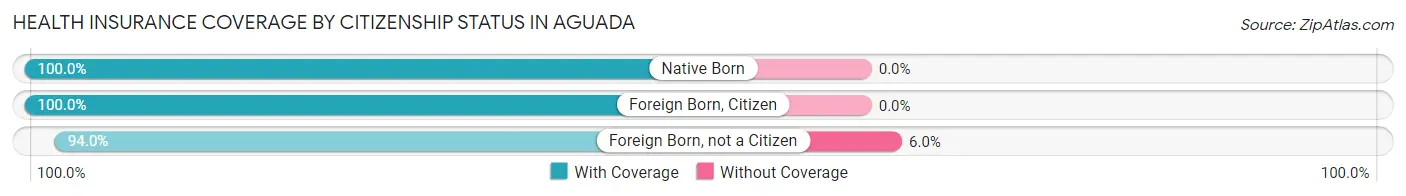
| Citizenship Status | With Coverage | Without Coverage |
| Native Born | 109 (100.0%) | 0 (0.0%) |
| Foreign Born, Citizen | 436 (100.0%) | 0 (0.0%) |
| Foreign Born, not a Citizen | 205 (94.0%) | 13 (6.0%) |
Health Insurance Coverage by Household Income in Aguada
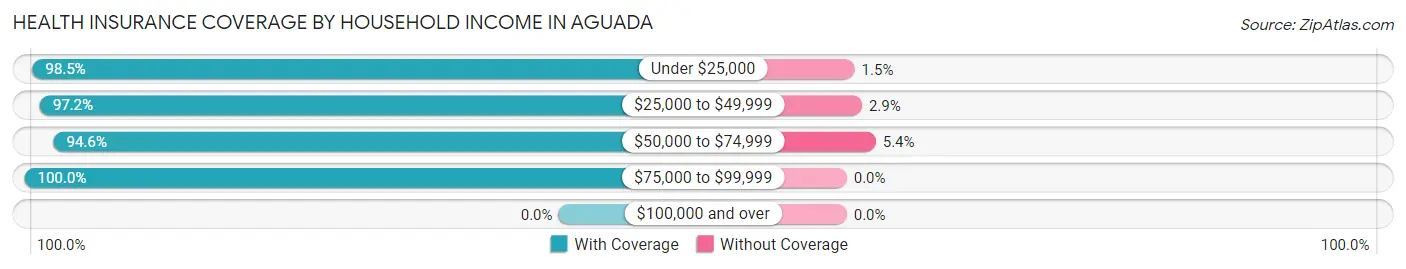
| Household Income | With Coverage | Without Coverage |
| Under $25,000 | 1,540 (98.5%) | 23 (1.5%) |
| $25,000 to $49,999 | 955 (97.2%) | 28 (2.9%) |
| $50,000 to $74,999 | 383 (94.6%) | 22 (5.4%) |
| $75,000 to $99,999 | 255 (100.0%) | 0 (0.0%) |
| $100,000 and over | 0 (0.0%) | 0 (0.0%) |
Public vs Private Health Insurance Coverage by Age in Aguada
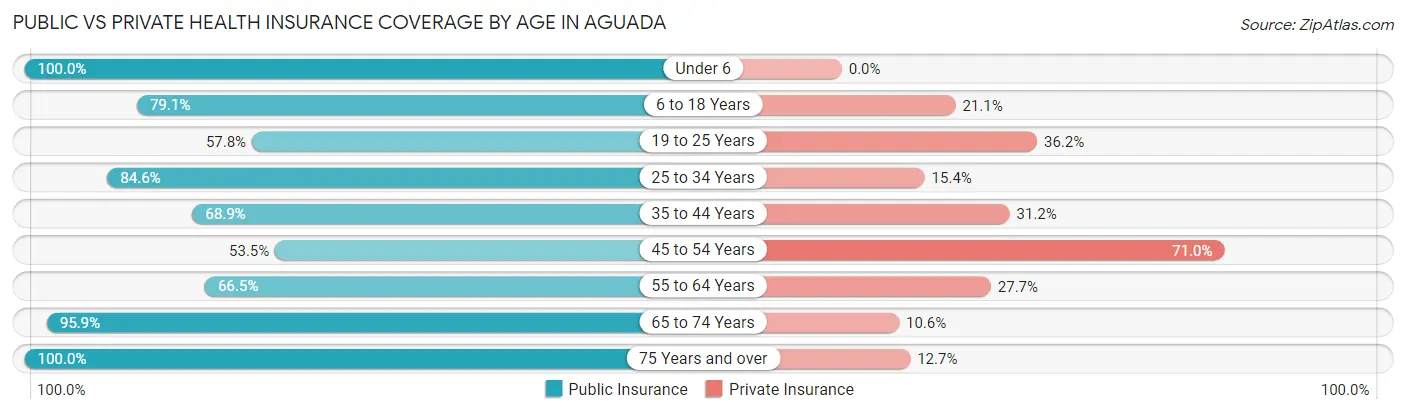
| Age Bracket | Public Insurance | Private Insurance |
| Under 6 | 109 (100.0%) | 0 (0.0%) |
| 6 to 18 Years | 345 (79.1%) | 92 (21.1%) |
| 19 to 25 Years | 126 (57.8%) | 79 (36.2%) |
| 25 to 34 Years | 330 (84.6%) | 60 (15.4%) |
| 35 to 44 Years | 221 (68.9%) | 100 (31.1%) |
| 45 to 54 Years | 214 (53.5%) | 284 (71.0%) |
| 55 to 64 Years | 423 (66.5%) | 176 (27.7%) |
| 65 to 74 Years | 325 (95.9%) | 36 (10.6%) |
| 75 Years and over | 378 (100.0%) | 48 (12.7%) |
| Total | 2,471 (76.6%) | 875 (27.1%) |
Disability Status by Sex by Age in Aguada
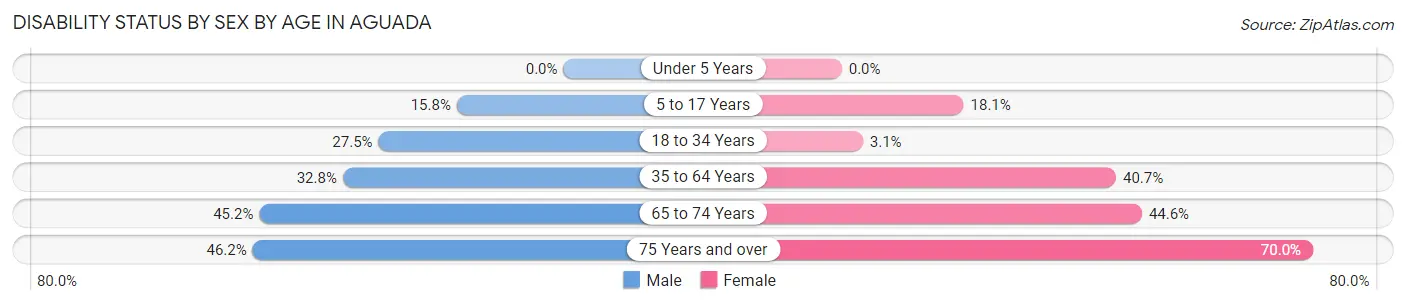
| Age Bracket | Male | Female |
| Under 5 Years | 0 (0.0%) | 0 (0.0%) |
| 5 to 17 Years | 66 (15.8%) | 17 (18.1%) |
| 18 to 34 Years | 53 (27.5%) | 13 (3.1%) |
| 35 to 64 Years | 208 (32.8%) | 294 (40.7%) |
| 65 to 74 Years | 70 (45.2%) | 82 (44.6%) |
| 75 Years and over | 90 (46.2%) | 128 (70.0%) |
Disability Class by Sex by Age in Aguada
Disability Class: Hearing Difficulty
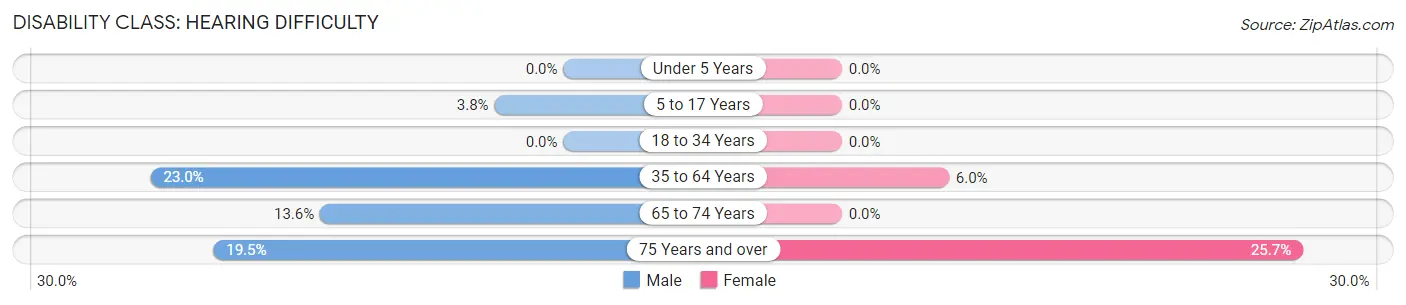
| Age Bracket | Male | Female |
| Under 5 Years | 0 (0.0%) | 0 (0.0%) |
| 5 to 17 Years | 16 (3.8%) | 0 (0.0%) |
| 18 to 34 Years | 0 (0.0%) | 0 (0.0%) |
| 35 to 64 Years | 146 (23.0%) | 43 (6.0%) |
| 65 to 74 Years | 21 (13.6%) | 0 (0.0%) |
| 75 Years and over | 38 (19.5%) | 47 (25.7%) |
Disability Class: Vision Difficulty
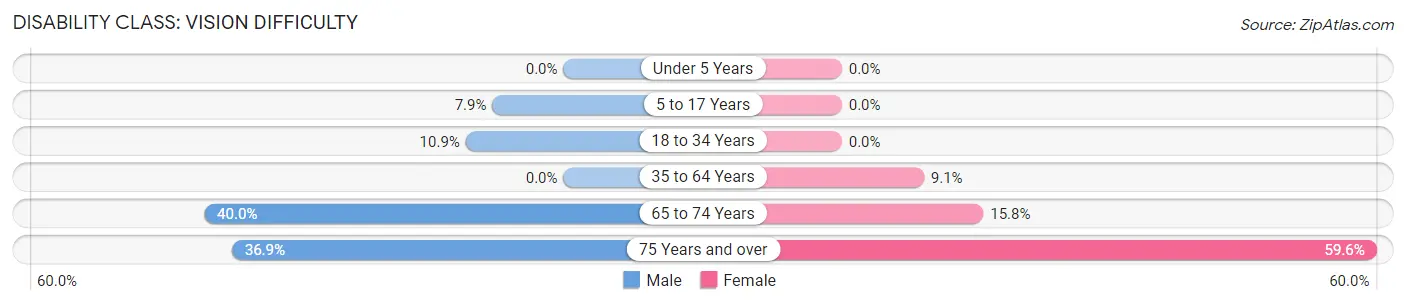
| Age Bracket | Male | Female |
| Under 5 Years | 0 (0.0%) | 0 (0.0%) |
| 5 to 17 Years | 33 (7.9%) | 0 (0.0%) |
| 18 to 34 Years | 21 (10.9%) | 0 (0.0%) |
| 35 to 64 Years | 0 (0.0%) | 66 (9.1%) |
| 65 to 74 Years | 62 (40.0%) | 29 (15.8%) |
| 75 Years and over | 72 (36.9%) | 109 (59.6%) |
Disability Class: Cognitive Difficulty
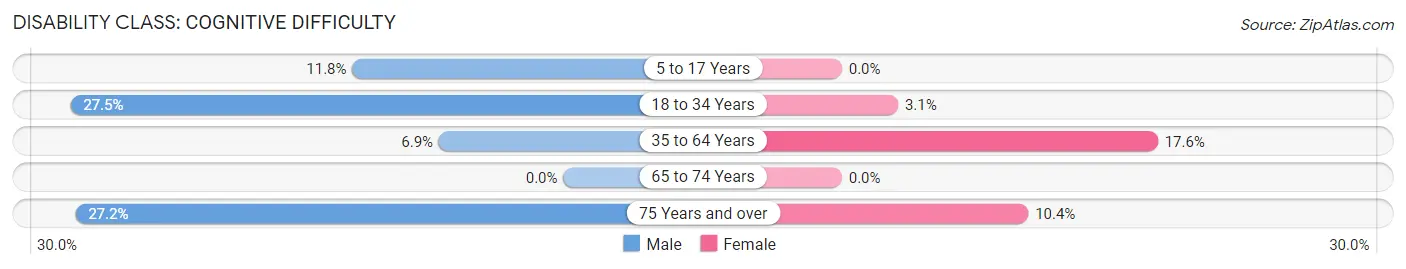
| Age Bracket | Male | Female |
| 5 to 17 Years | 49 (11.7%) | 0 (0.0%) |
| 18 to 34 Years | 53 (27.5%) | 13 (3.1%) |
| 35 to 64 Years | 44 (6.9%) | 127 (17.6%) |
| 65 to 74 Years | 0 (0.0%) | 0 (0.0%) |
| 75 Years and over | 53 (27.2%) | 19 (10.4%) |
Disability Class: Ambulatory Difficulty
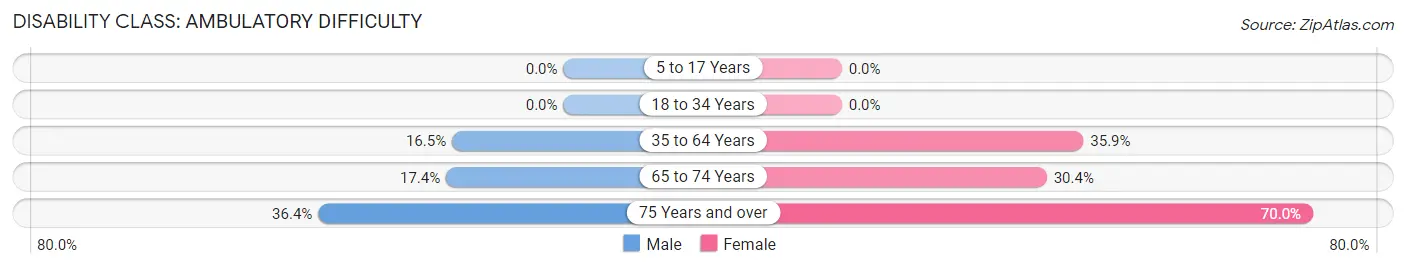
| Age Bracket | Male | Female |
| 5 to 17 Years | 0 (0.0%) | 0 (0.0%) |
| 18 to 34 Years | 0 (0.0%) | 0 (0.0%) |
| 35 to 64 Years | 105 (16.5%) | 259 (35.9%) |
| 65 to 74 Years | 27 (17.4%) | 56 (30.4%) |
| 75 Years and over | 71 (36.4%) | 128 (70.0%) |
Disability Class: Self-Care Difficulty
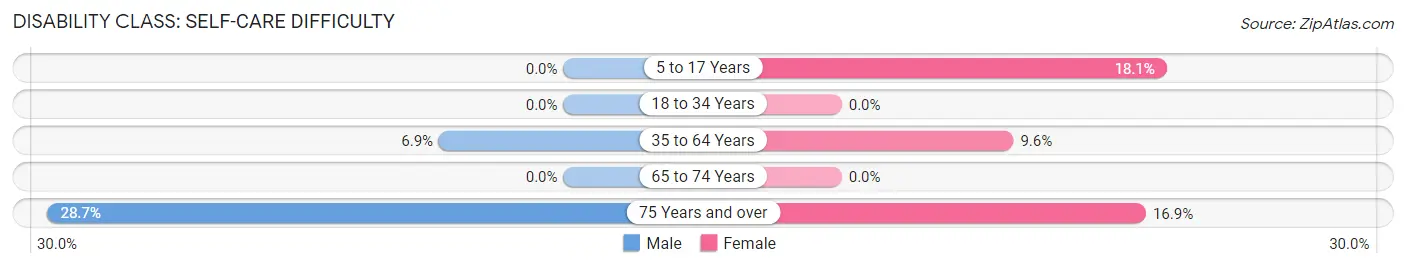
| Age Bracket | Male | Female |
| 5 to 17 Years | 0 (0.0%) | 17 (18.1%) |
| 18 to 34 Years | 0 (0.0%) | 0 (0.0%) |
| 35 to 64 Years | 44 (6.9%) | 69 (9.6%) |
| 65 to 74 Years | 0 (0.0%) | 0 (0.0%) |
| 75 Years and over | 56 (28.7%) | 31 (16.9%) |
Technology Access in Aguada
Computing Device Access in Aguada
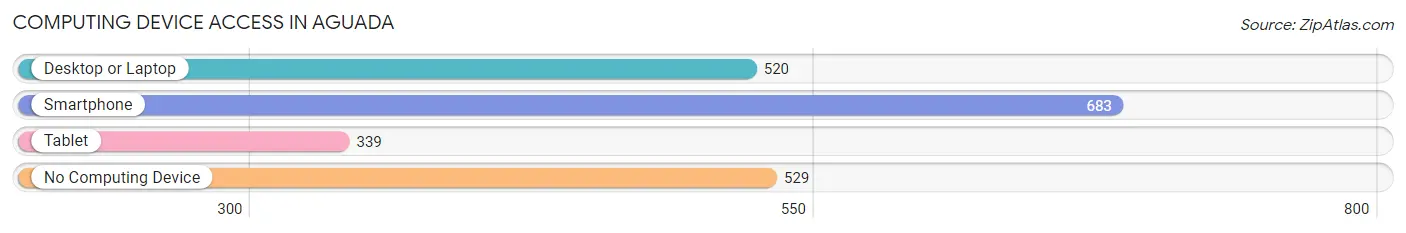
| Device Type | # Households | % Households |
| Desktop or Laptop | 520 | 40.0% |
| Smartphone | 683 | 52.5% |
| Tablet | 339 | 26.1% |
| No Computing Device | 529 | 40.7% |
| Total | 1,301 | 100.0% |
Internet Access in Aguada
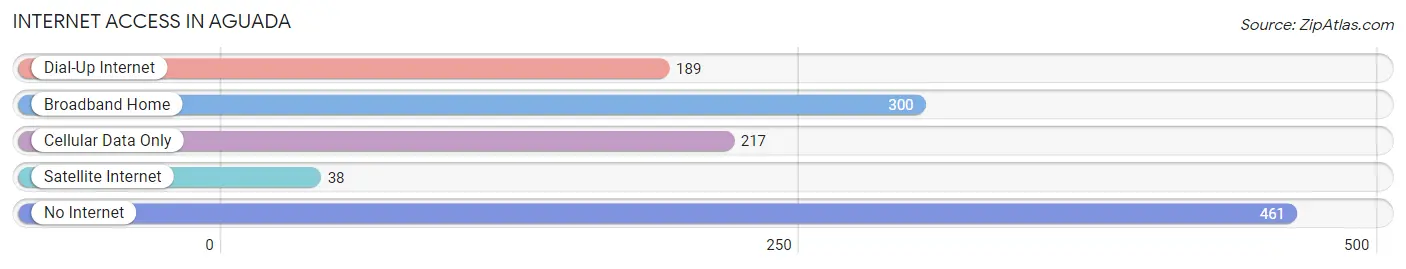
| Internet Type | # Households | % Households |
| Dial-Up Internet | 189 | 14.5% |
| Broadband Home | 300 | 23.1% |
| Cellular Data Only | 217 | 16.7% |
| Satellite Internet | 38 | 2.9% |
| No Internet | 461 | 35.4% |
| Total | 1,301 | 100.0% |
Aguada Summary
Aguada is a municipality located in the western region of Puerto Rico. It is bordered by the municipalities of Aguadilla, Moca, San Sebastián, and Rincón. The town is part of the Aguadilla-Isabela-San Sebastián Metropolitan Statistical Area. As of the 2010 census, Aguada had a population of 36,521.
History
The area of Aguada was originally inhabited by the Taíno Indians. The town was founded in 1775 by Don Juan de Aponte. The town was named after the nearby Aguada River. During the 19th century, the town was a major producer of sugar cane and coffee. In 1825, the town was divided into two parts, Aguada Pueblo and Aguada Playa.
Geography
Aguada is located in the western region of Puerto Rico. It is bordered by the municipalities of Aguadilla, Moca, San Sebastián, and Rincón. The town is part of the Aguadilla-Isabela-San Sebastián Metropolitan Statistical Area. The town has a total area of 28.2 square miles.
Economy
The economy of Aguada is mainly based on agriculture and tourism. The town is known for its production of sugar cane, coffee, and other agricultural products. Tourism is also an important part of the economy, as the town is home to several beaches and resorts.
Demographics
As of the 2010 census, Aguada had a population of 36,521. The population was spread out with 24.3% under the age of 18, 10.2% from 18 to 24, 28.3% from 25 to 44, 22.2% from 45 to 64, and 14.9% who were 65 years of age or older. The median age was 36.5 years. The median income for a household in the town was $20,845. The per capita income for the town was $10,845.
Common Questions
What is Per Capita Income in Aguada?
Per Capita income in Aguada is $12,115.
What is the Median Family Income in Aguada?
Median Family Income in Aguada is $18,167.
What is the Median Household income in Aguada?
Median Household Income in Aguada is $25,709.
What is Income or Wage Gap in Aguada?
Income or Wage Gap in Aguada is 27.0%.
Women in Aguada earn 73.0 cents for every dollar earned by a man.
What is Family Income Deficit in Aguada?
Family Income Deficit in Aguada is $14,939.
Families that are below poverty line in Aguada earn $14,939 less on average than the poverty threshold level.
What is Inequality or Gini Index in Aguada?
Inequality or Gini Index in Aguada is 0.42.
What is the Total Population of Aguada?
Total Population of Aguada is 3,233.
What is the Total Male Population of Aguada?
Total Male Population of Aguada is 1,595.
What is the Total Female Population of Aguada?
Total Female Population of Aguada is 1,638.
What is the Ratio of Males per 100 Females in Aguada?
There are 97.37 Males per 100 Females in Aguada.
What is the Ratio of Females per 100 Males in Aguada?
There are 102.70 Females per 100 Males in Aguada.
What is the Median Population Age in Aguada?
Median Population Age in Aguada is 49.5 Years.
What is the Average Family Size in Aguada
Average Family Size in Aguada is 3.5 People.
What is the Average Household Size in Aguada
Average Household Size in Aguada is 2.5 People.
How Large is the Labor Force in Aguada?
There are 1,039 People in the Labor Forcein in Aguada.
What is the Percentage of People in the Labor Force in Aguada?
37.7% of People are in the Labor Force in Aguada.
What is the Unemployment Rate in Aguada?
Unemployment Rate in Aguada is 18.1%.