Royal Palm Estates, FL Map & Demographics
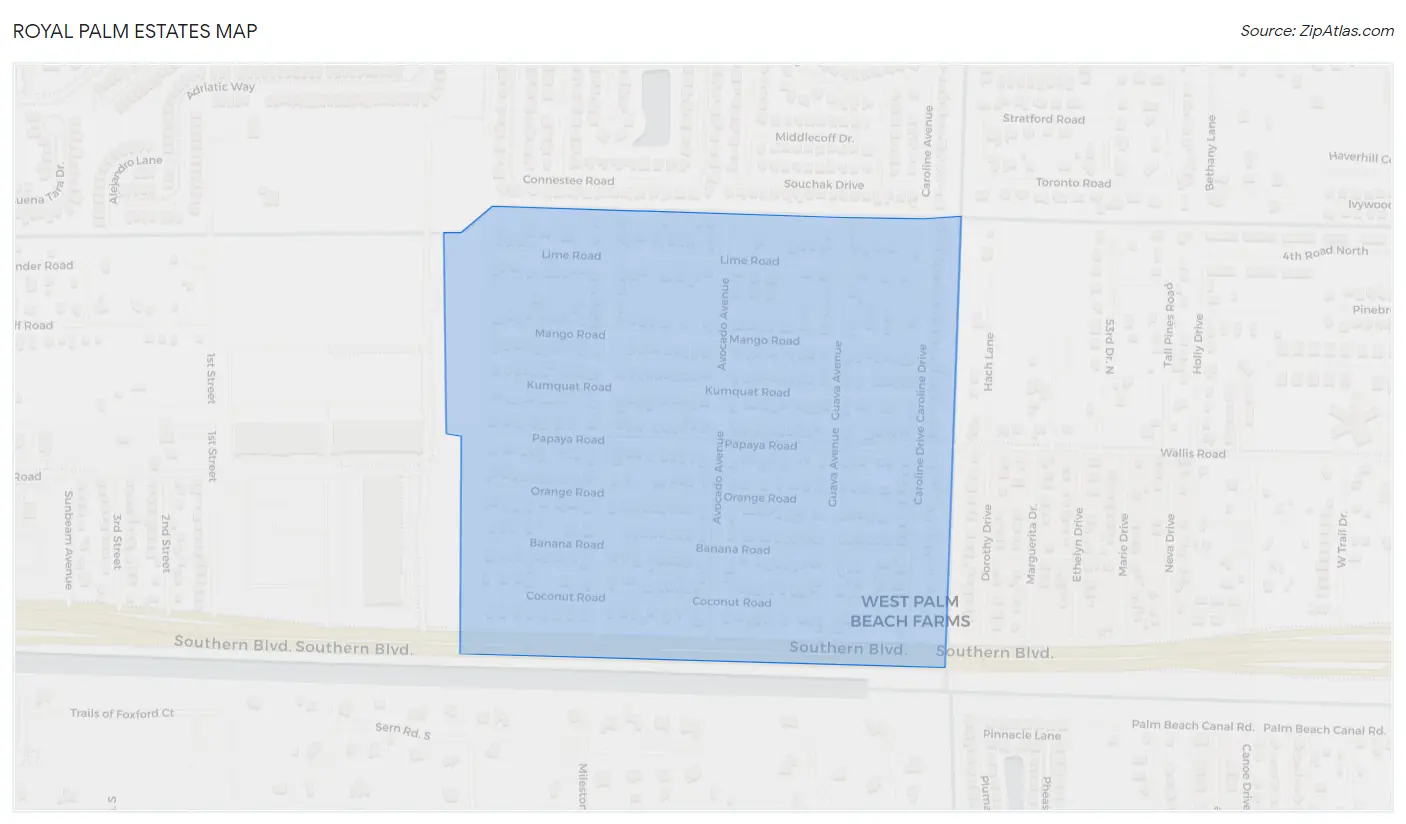
Royal Palm Estates Map
Royal Palm Estates Overview
$18,485
PER CAPITA INCOME
$33,864
AVG FAMILY INCOME
$47,982
AVG HOUSEHOLD INCOME
25.6%
WAGE / INCOME GAP [ % ]
74.4¢/ $1
WAGE / INCOME GAP [ $ ]
0.41
INEQUALITY / GINI INDEX
1,759
TOTAL POPULATION
814
MALE POPULATION
945
FEMALE POPULATION
86.14
MALES / 100 FEMALES
116.09
FEMALES / 100 MALES
35.7
MEDIAN AGE
3.9
AVG FAMILY SIZE
3.3
AVG HOUSEHOLD SIZE
816
LABOR FORCE [ PEOPLE ]
59.3%
PERCENT IN LABOR FORCE
7.1%
UNEMPLOYMENT RATE
Income in Royal Palm Estates
Income Overview in Royal Palm Estates
Per Capita Income in Royal Palm Estates is $18,485, while median incomes of families and households are $33,864 and $47,982 respectively.
| Characteristic | Number | Measure |
| Per Capita Income | 1,759 | $18,485 |
| Median Family Income | 362 | $33,864 |
| Mean Family Income | 362 | $44,485 |
| Median Household Income | 524 | $47,982 |
| Mean Household Income | 524 | $59,294 |
| Income Deficit | 362 | $0 |
| Wage / Income Gap (%) | 1,759 | 25.64% |
| Wage / Income Gap ($) | 1,759 | 74.36¢ per $1 |
| Gini / Inequality Index | 1,759 | 0.41 |
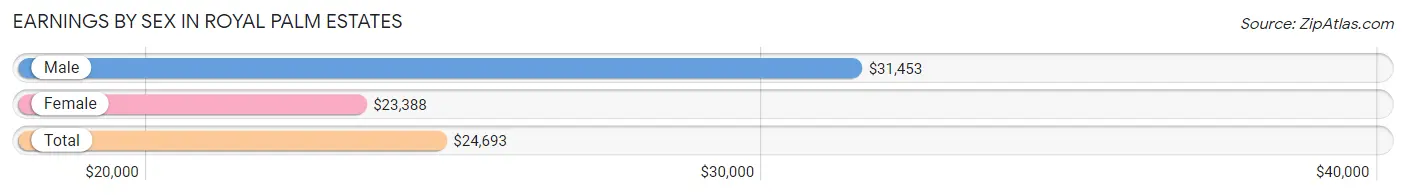
Earnings by Sex in Royal Palm Estates
Average Earnings in Royal Palm Estates are $24,693, $31,453 for men and $23,388 for women, a difference of 25.6%.
| Sex | Number | Average Earnings |
| Male | 402 (53.0%) | $31,453 |
| Female | 356 (47.0%) | $23,388 |
| Total | 758 (100.0%) | $24,693 |
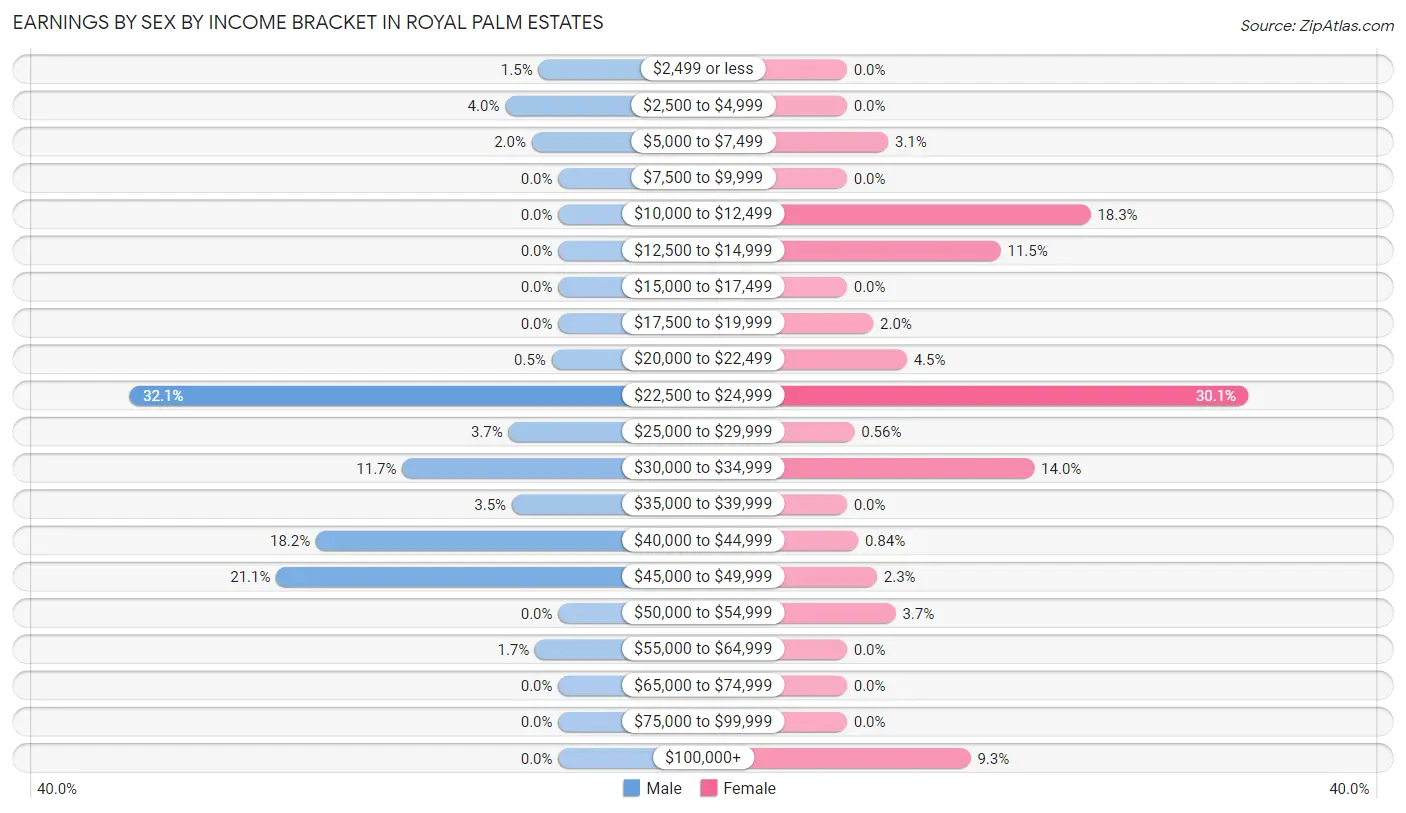
Earnings by Sex by Income Bracket in Royal Palm Estates
The most common earnings brackets in Royal Palm Estates are $22,500 to $24,999 for men (129 | 32.1%) and $22,500 to $24,999 for women (107 | 30.1%).
| Income | Male | Female |
| $2,499 or less | 6 (1.5%) | 0 (0.0%) |
| $2,500 to $4,999 | 16 (4.0%) | 0 (0.0%) |
| $5,000 to $7,499 | 8 (2.0%) | 11 (3.1%) |
| $7,500 to $9,999 | 0 (0.0%) | 0 (0.0%) |
| $10,000 to $12,499 | 0 (0.0%) | 65 (18.3%) |
| $12,500 to $14,999 | 0 (0.0%) | 41 (11.5%) |
| $15,000 to $17,499 | 0 (0.0%) | 0 (0.0%) |
| $17,500 to $19,999 | 0 (0.0%) | 7 (2.0%) |
| $20,000 to $22,499 | 2 (0.5%) | 16 (4.5%) |
| $22,500 to $24,999 | 129 (32.1%) | 107 (30.1%) |
| $25,000 to $29,999 | 15 (3.7%) | 2 (0.6%) |
| $30,000 to $34,999 | 47 (11.7%) | 50 (14.0%) |
| $35,000 to $39,999 | 14 (3.5%) | 0 (0.0%) |
| $40,000 to $44,999 | 73 (18.2%) | 3 (0.8%) |
| $45,000 to $49,999 | 85 (21.1%) | 8 (2.2%) |
| $50,000 to $54,999 | 0 (0.0%) | 13 (3.6%) |
| $55,000 to $64,999 | 7 (1.7%) | 0 (0.0%) |
| $65,000 to $74,999 | 0 (0.0%) | 0 (0.0%) |
| $75,000 to $99,999 | 0 (0.0%) | 0 (0.0%) |
| $100,000+ | 0 (0.0%) | 33 (9.3%) |
| Total | 402 (100.0%) | 356 (100.0%) |
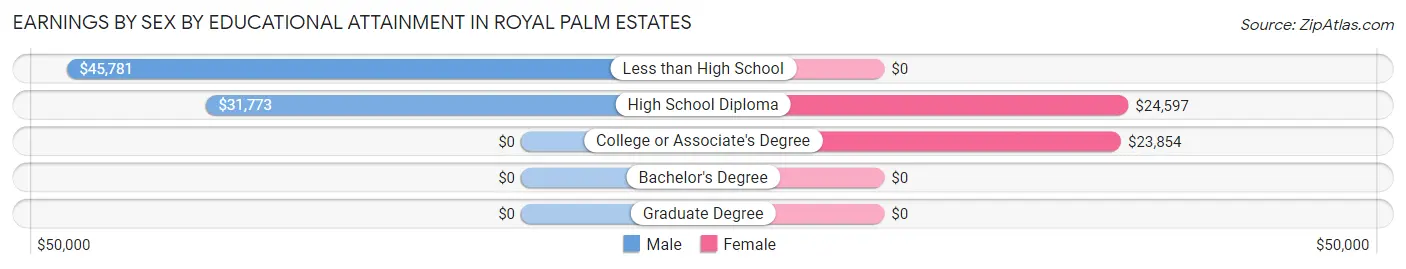
Earnings by Sex by Educational Attainment in Royal Palm Estates
Average earnings in Royal Palm Estates are $40,560 for men and $24,276 for women, a difference of 40.2%. Men with an educational attainment of less than high school enjoy the highest average annual earnings of $45,781, while those with high school diploma education earn the least with $31,773. Women with an educational attainment of high school diploma earn the most with the average annual earnings of $24,597, while those with college or associate's degree education have the smallest earnings of $23,854.
| Educational Attainment | Male Income | Female Income |
| Less than High School | $45,781 | $0 |
| High School Diploma | $31,773 | $24,597 |
| College or Associate's Degree | - | - |
| Bachelor's Degree | - | - |
| Graduate Degree | - | - |
| Total | $40,560 | $24,276 |
Family Income in Royal Palm Estates
Family Income Brackets in Royal Palm Estates
According to the Royal Palm Estates family income data, there are 87 families falling into the $25,000 to $34,999 income range, which is the most common income bracket and makes up 24.0% of all families.
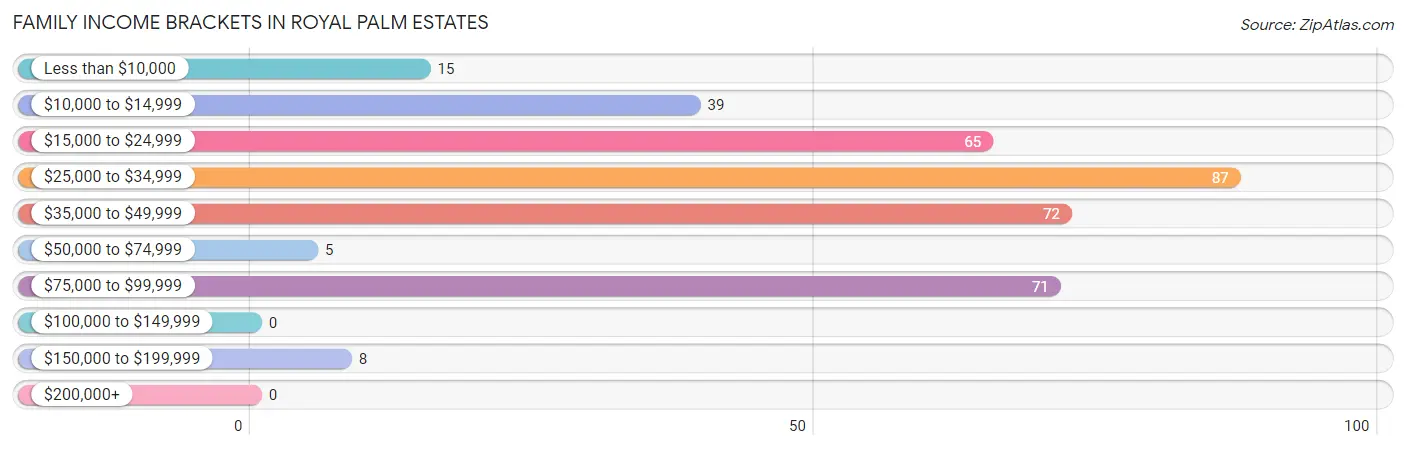
| Income Bracket | # Families | % Families |
| Less than $10,000 | 15 | 4.1% |
| $10,000 to $14,999 | 39 | 10.8% |
| $15,000 to $24,999 | 65 | 18.0% |
| $25,000 to $34,999 | 87 | 24.0% |
| $35,000 to $49,999 | 72 | 19.9% |
| $50,000 to $74,999 | 5 | 1.4% |
| $75,000 to $99,999 | 71 | 19.6% |
| $100,000 to $149,999 | 0 | 0.0% |
| $150,000 to $199,999 | 8 | 2.2% |
| $200,000+ | 0 | 0.0% |
Family Income by Famaliy Size in Royal Palm Estates
3-person families (88 | 24.3%) account for the highest median family income in Royal Palm Estates with $23,729 per family, while 3-person families (88 | 24.3%) have the highest median income of $7,910 per family member.
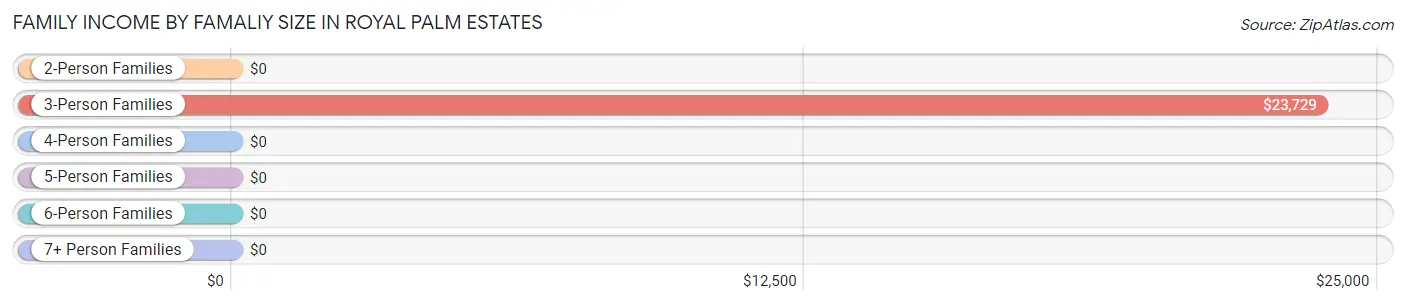
| Income Bracket | # Families | Median Income |
| 2-Person Families | 77 (21.3%) | $0 |
| 3-Person Families | 88 (24.3%) | $23,729 |
| 4-Person Families | 138 (38.1%) | $0 |
| 5-Person Families | 4 (1.1%) | $0 |
| 6-Person Families | 55 (15.2%) | $0 |
| 7+ Person Families | 0 (0.0%) | $0 |
| Total | 362 (100.0%) | $33,864 |
Family Income by Number of Earners in Royal Palm Estates
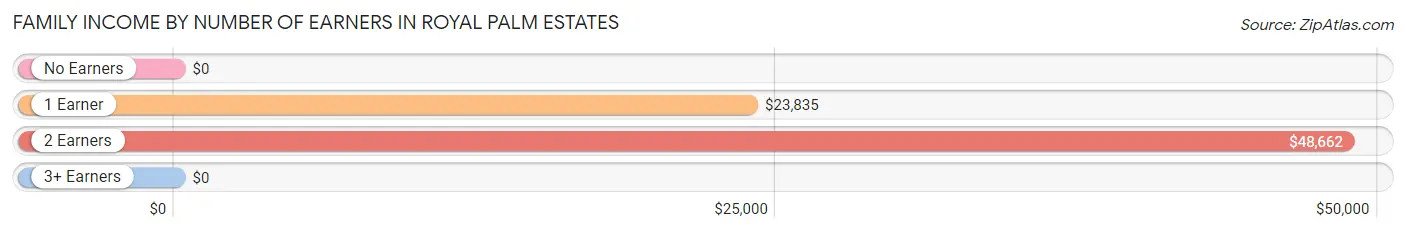
| Number of Earners | # Families | Median Income |
| No Earners | 96 (26.5%) | $0 |
| 1 Earner | 75 (20.7%) | $23,835 |
| 2 Earners | 163 (45.0%) | $48,662 |
| 3+ Earners | 28 (7.7%) | $0 |
| Total | 362 (100.0%) | $33,864 |
Household Income in Royal Palm Estates
Household Income Brackets in Royal Palm Estates
With 126 households falling in the category, the $75,000 to $99,999 income range is the most frequent in Royal Palm Estates, accounting for 24.0% of all households.
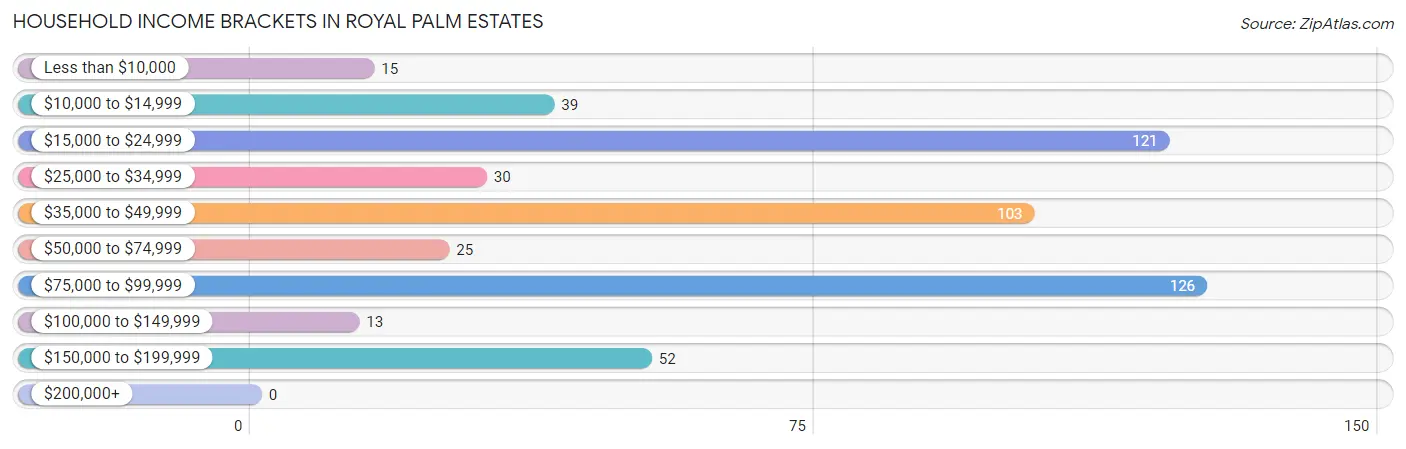
| Income Bracket | # Households | % Households |
| Less than $10,000 | 15 | 2.9% |
| $10,000 to $14,999 | 39 | 7.4% |
| $15,000 to $24,999 | 121 | 23.1% |
| $25,000 to $34,999 | 30 | 5.7% |
| $35,000 to $49,999 | 103 | 19.7% |
| $50,000 to $74,999 | 25 | 4.8% |
| $75,000 to $99,999 | 126 | 24.0% |
| $100,000 to $149,999 | 13 | 2.5% |
| $150,000 to $199,999 | 52 | 9.9% |
| $200,000+ | 0 | 0.0% |
Household Income by Householder Age in Royal Palm Estates
The median household income in Royal Palm Estates is $47,982, with the highest median household income of $19,444 found in the 65+ years age bracket for the primary householder. A total of 84 households (16.0%) fall into this category.
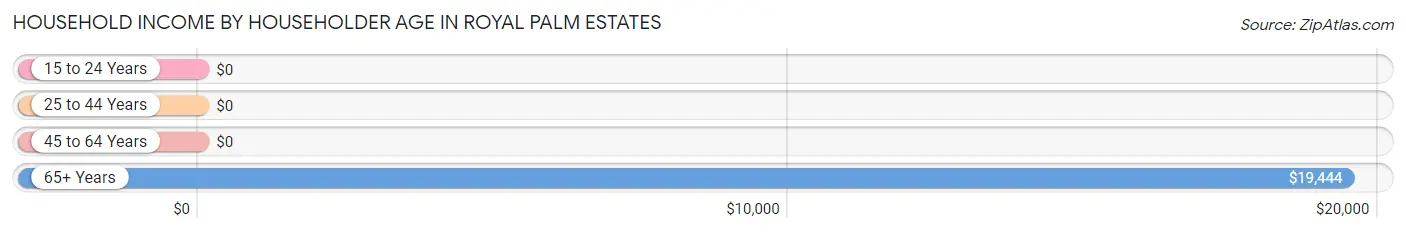
| Income Bracket | # Households | Median Income |
| 15 to 24 Years | 0 (0.0%) | $0 |
| 25 to 44 Years | 213 (40.6%) | $0 |
| 45 to 64 Years | 227 (43.3%) | $0 |
| 65+ Years | 84 (16.0%) | $19,444 |
| Total | 524 (100.0%) | $47,982 |
Poverty in Royal Palm Estates
Income Below Poverty by Sex and Age in Royal Palm Estates
With 31.1% poverty level for males and 59.4% for females among the residents of Royal Palm Estates, 18 to 24 year old males and under 5 year old females are the most vulnerable to poverty, with 118 males (89.4%) and 69 females (100.0%) in their respective age groups living below the poverty level.
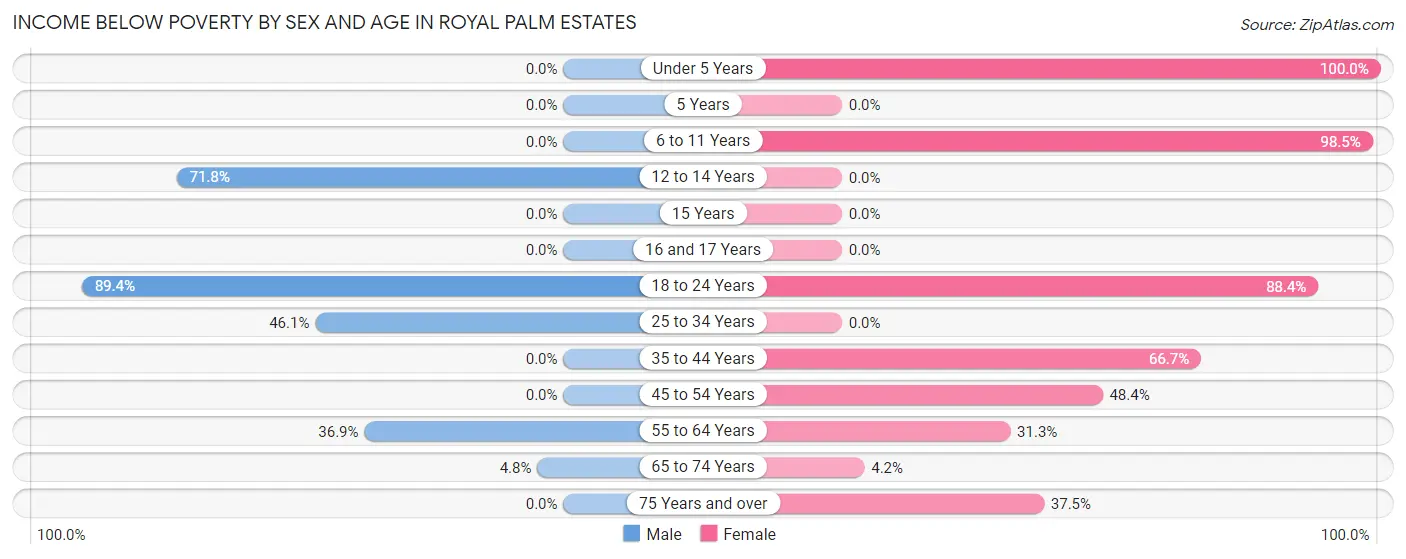
| Age Bracket | Male | Female |
| Under 5 Years | 0 (0.0%) | 69 (100.0%) |
| 5 Years | 0 (0.0%) | 0 (0.0%) |
| 6 to 11 Years | 0 (0.0%) | 200 (98.5%) |
| 12 to 14 Years | 56 (71.8%) | 0 (0.0%) |
| 15 Years | 0 (0.0%) | 0 (0.0%) |
| 16 and 17 Years | 0 (0.0%) | 0 (0.0%) |
| 18 to 24 Years | 118 (89.4%) | 84 (88.4%) |
| 25 to 34 Years | 35 (46.1%) | 0 (0.0%) |
| 35 to 44 Years | 0 (0.0%) | 114 (66.7%) |
| 45 to 54 Years | 0 (0.0%) | 45 (48.4%) |
| 55 to 64 Years | 41 (36.9%) | 45 (31.2%) |
| 65 to 74 Years | 3 (4.8%) | 1 (4.2%) |
| 75 Years and over | 0 (0.0%) | 3 (37.5%) |
| Total | 253 (31.1%) | 561 (59.4%) |
Income Above Poverty by Sex and Age in Royal Palm Estates
According to the poverty statistics in Royal Palm Estates, males aged 15 years and females aged 12 to 14 years are the age groups that are most secure financially, with 100.0% of males and 100.0% of females in these age groups living above the poverty line.
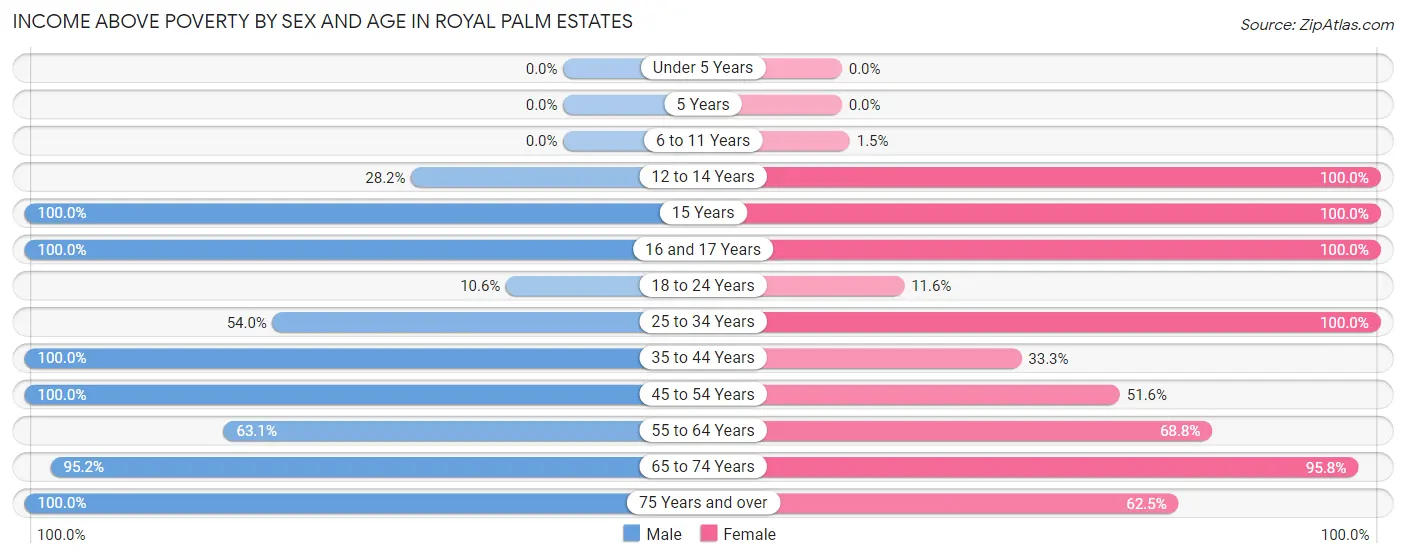
| Age Bracket | Male | Female |
| Under 5 Years | 0 (0.0%) | 0 (0.0%) |
| 5 Years | 0 (0.0%) | 0 (0.0%) |
| 6 to 11 Years | 0 (0.0%) | 3 (1.5%) |
| 12 to 14 Years | 22 (28.2%) | 15 (100.0%) |
| 15 Years | 3 (100.0%) | 15 (100.0%) |
| 16 and 17 Years | 45 (100.0%) | 45 (100.0%) |
| 18 to 24 Years | 14 (10.6%) | 11 (11.6%) |
| 25 to 34 Years | 41 (53.9%) | 63 (100.0%) |
| 35 to 44 Years | 175 (100.0%) | 57 (33.3%) |
| 45 to 54 Years | 97 (100.0%) | 48 (51.6%) |
| 55 to 64 Years | 70 (63.1%) | 99 (68.8%) |
| 65 to 74 Years | 59 (95.2%) | 23 (95.8%) |
| 75 Years and over | 35 (100.0%) | 5 (62.5%) |
| Total | 561 (68.9%) | 384 (40.6%) |
Income Below Poverty Among Married-Couple Families in Royal Palm Estates
The poverty statistics for married-couple families in Royal Palm Estates show that 20.2% or 39 of the total 193 families live below the poverty line. Families with no children have the highest poverty rate of 30.0%, comprising of 39 families. On the other hand, families with 1 or 2 children have the lowest poverty rate of 0.0%, which includes 0 families.
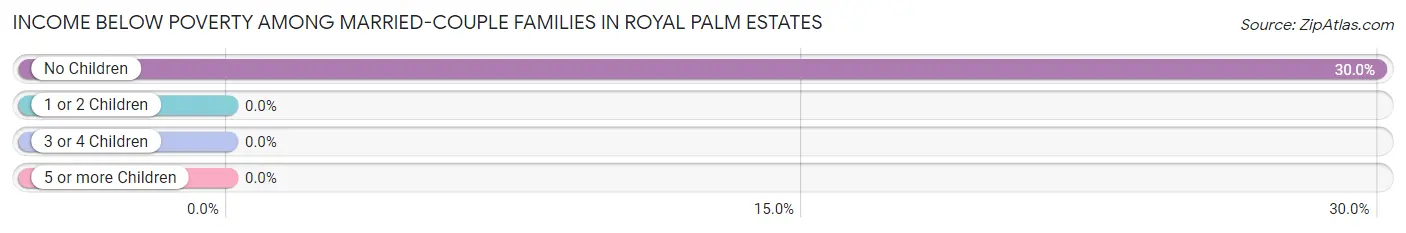
| Children | Above Poverty | Below Poverty |
| No Children | 91 (70.0%) | 39 (30.0%) |
| 1 or 2 Children | 63 (100.0%) | 0 (0.0%) |
| 3 or 4 Children | 0 (0.0%) | 0 (0.0%) |
| 5 or more Children | 0 (0.0%) | 0 (0.0%) |
| Total | 154 (79.8%) | 39 (20.2%) |
Income Below Poverty Among Single-Parent Households in Royal Palm Estates
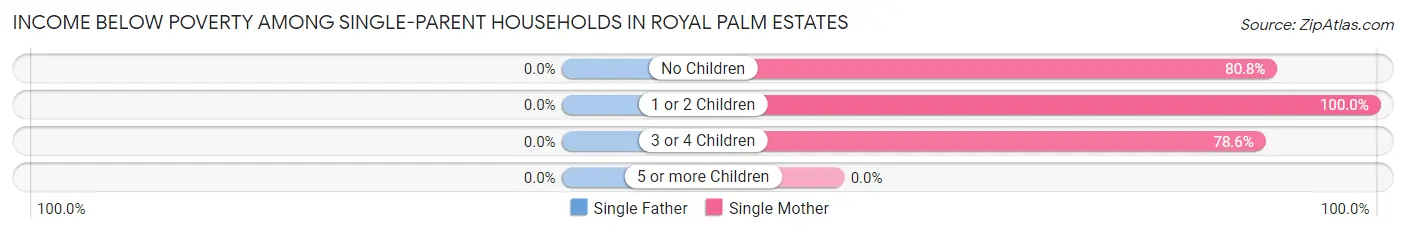
| Children | Single Father | Single Mother |
| No Children | 0 (0.0%) | 21 (80.8%) |
| 1 or 2 Children | 0 (0.0%) | 59 (100.0%) |
| 3 or 4 Children | 0 (0.0%) | 55 (78.6%) |
| 5 or more Children | 0 (0.0%) | 0 (0.0%) |
| Total | 0 (0.0%) | 135 (87.1%) |
Income Below Poverty Among Married-Couple vs Single-Parent Households in Royal Palm Estates
The poverty data for Royal Palm Estates shows that 39 of the married-couple family households (20.2%) and 135 of the single-parent households (79.9%) are living below the poverty level. Within the married-couple family households, those with no children have the highest poverty rate, with 39 households (30.0%) falling below the poverty line. Among the single-parent households, those with 1 or 2 children have the highest poverty rate, with 59 household (92.2%) living below poverty.
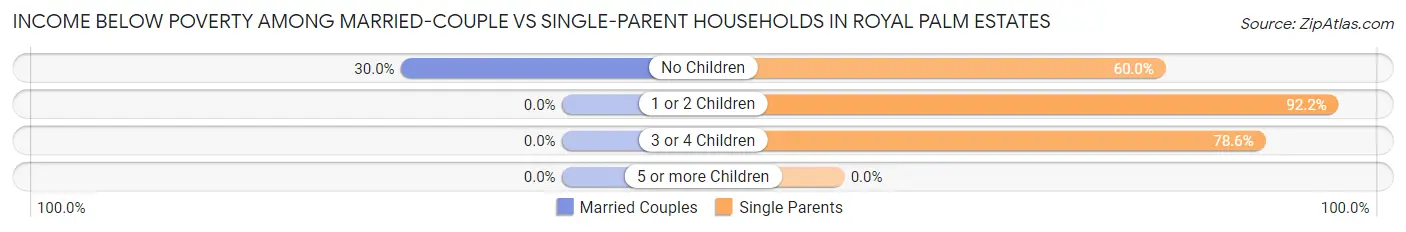
| Children | Married-Couple Families | Single-Parent Households |
| No Children | 39 (30.0%) | 21 (60.0%) |
| 1 or 2 Children | 0 (0.0%) | 59 (92.2%) |
| 3 or 4 Children | 0 (0.0%) | 55 (78.6%) |
| 5 or more Children | 0 (0.0%) | 0 (0.0%) |
| Total | 39 (20.2%) | 135 (79.9%) |
Race in Royal Palm Estates
The most populous races in Royal Palm Estates are Hispanic or Latino (1,202 | 68.3%), White / Caucasian (1,013 | 57.6%), and Two or more Races (395 | 22.5%).
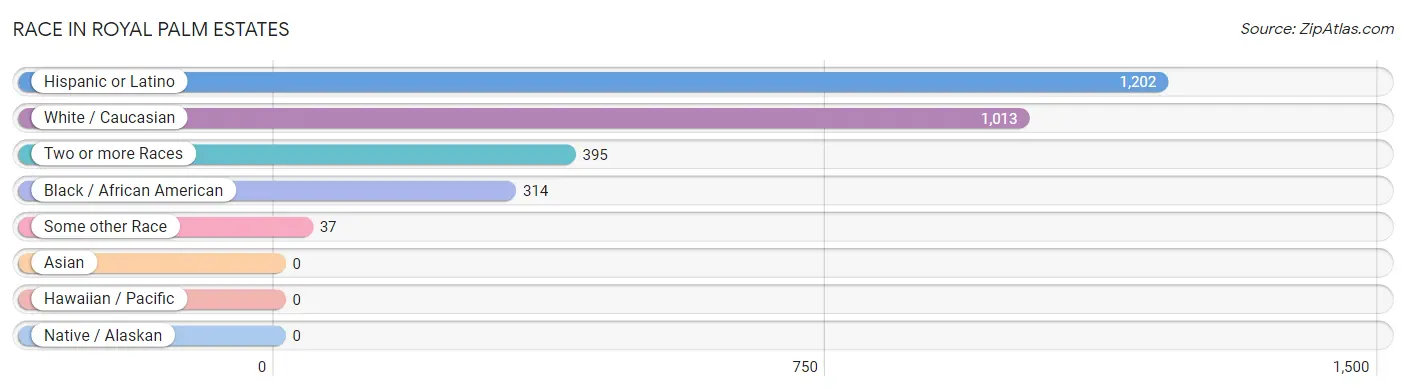
| Race | # Population | % Population |
| Asian | 0 | 0.0% |
| Black / African American | 314 | 17.8% |
| Hawaiian / Pacific | 0 | 0.0% |
| Hispanic or Latino | 1,202 | 68.3% |
| Native / Alaskan | 0 | 0.0% |
| White / Caucasian | 1,013 | 57.6% |
| Two or more Races | 395 | 22.5% |
| Some other Race | 37 | 2.1% |
| Total | 1,759 | 100.0% |
Ancestry in Royal Palm Estates
The most populous ancestries reported in Royal Palm Estates are Mexican (369 | 21.0%), Puerto Rican (364 | 20.7%), Central American (212 | 12.0%), Guatemalan (212 | 12.0%), and African (205 | 11.7%), together accounting for 77.4% of all Royal Palm Estates residents.
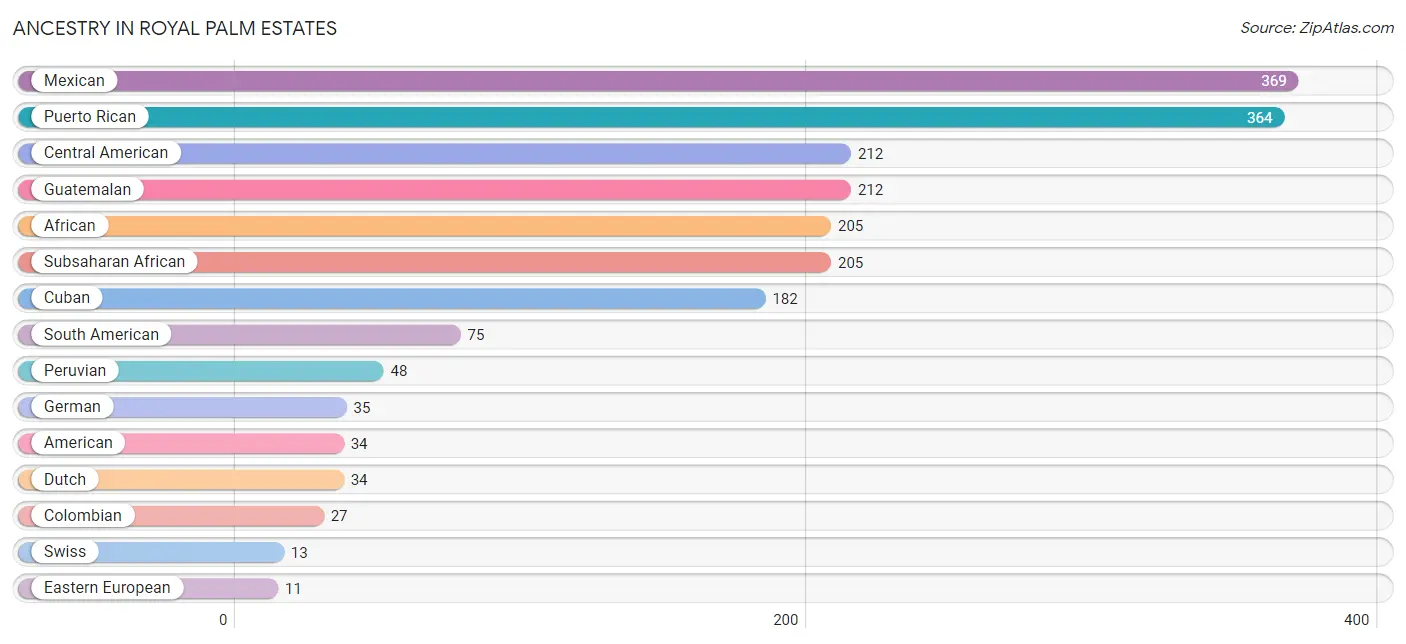
| Ancestry | # Population | % Population |
| African | 205 | 11.7% |
| American | 34 | 1.9% |
| Bahamian | 2 | 0.1% |
| Central American | 212 | 12.0% |
| Colombian | 27 | 1.5% |
| Cuban | 182 | 10.3% |
| Dutch | 34 | 1.9% |
| Eastern European | 11 | 0.6% |
| English | 6 | 0.3% |
| German | 35 | 2.0% |
| Guatemalan | 212 | 12.0% |
| Irish | 7 | 0.4% |
| Italian | 2 | 0.1% |
| Mexican | 369 | 21.0% |
| Peruvian | 48 | 2.7% |
| Puerto Rican | 364 | 20.7% |
| South American | 75 | 4.3% |
| Subsaharan African | 205 | 11.7% |
| Swiss | 13 | 0.7% | View All 19 Rows |
Immigrants in Royal Palm Estates
The most numerous immigrant groups reported in Royal Palm Estates came from Latin America (559 | 31.8%), Central America (309 | 17.6%), Mexico (187 | 10.6%), Caribbean (175 | 10.0%), and Cuba (173 | 9.8%), together accounting for 79.8% of all Royal Palm Estates residents.
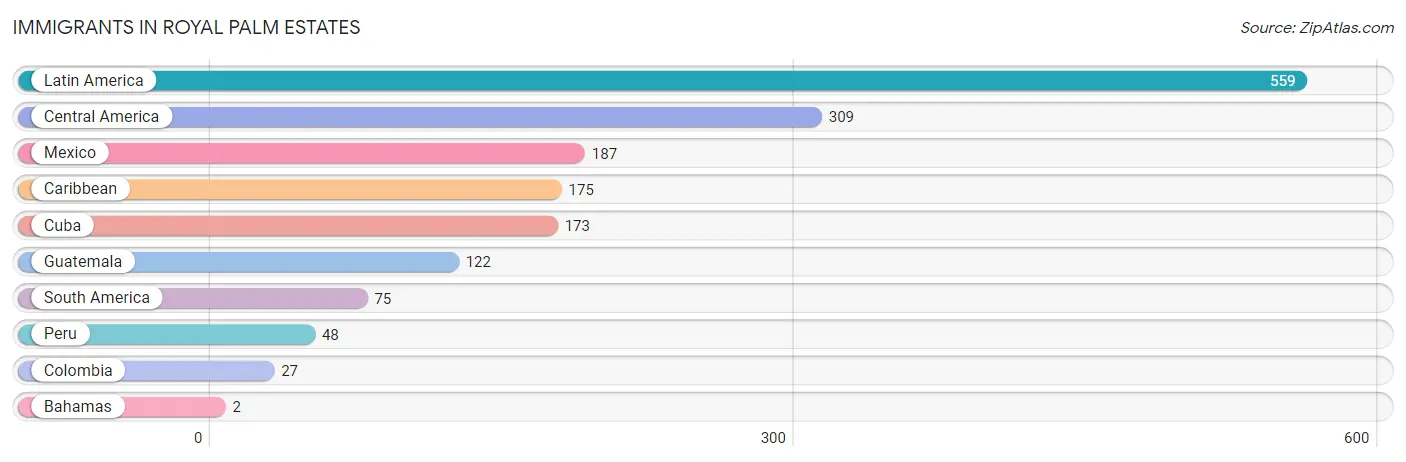
| Immigration Origin | # Population | % Population |
| Bahamas | 2 | 0.1% |
| Caribbean | 175 | 10.0% |
| Central America | 309 | 17.6% |
| Colombia | 27 | 1.5% |
| Cuba | 173 | 9.8% |
| Guatemala | 122 | 6.9% |
| Latin America | 559 | 31.8% |
| Mexico | 187 | 10.6% |
| Peru | 48 | 2.7% |
| South America | 75 | 4.3% | View All 10 Rows |
Sex and Age in Royal Palm Estates
Sex and Age in Royal Palm Estates
The most populous age groups in Royal Palm Estates are 20 to 24 Years (132 | 16.2%) for men and 15 to 19 Years (144 | 15.2%) for women.
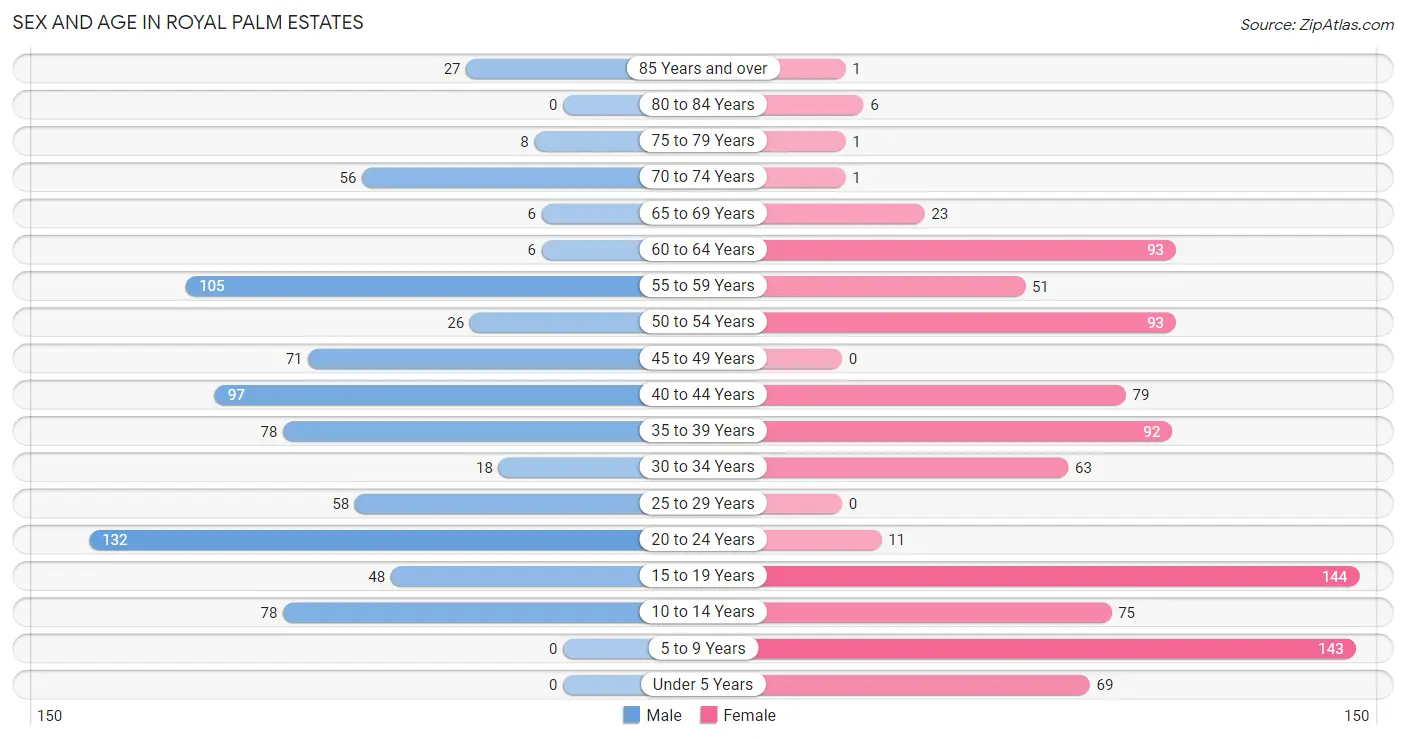
| Age Bracket | Male | Female |
| Under 5 Years | 0 (0.0%) | 69 (7.3%) |
| 5 to 9 Years | 0 (0.0%) | 143 (15.1%) |
| 10 to 14 Years | 78 (9.6%) | 75 (7.9%) |
| 15 to 19 Years | 48 (5.9%) | 144 (15.2%) |
| 20 to 24 Years | 132 (16.2%) | 11 (1.2%) |
| 25 to 29 Years | 58 (7.1%) | 0 (0.0%) |
| 30 to 34 Years | 18 (2.2%) | 63 (6.7%) |
| 35 to 39 Years | 78 (9.6%) | 92 (9.7%) |
| 40 to 44 Years | 97 (11.9%) | 79 (8.4%) |
| 45 to 49 Years | 71 (8.7%) | 0 (0.0%) |
| 50 to 54 Years | 26 (3.2%) | 93 (9.8%) |
| 55 to 59 Years | 105 (12.9%) | 51 (5.4%) |
| 60 to 64 Years | 6 (0.7%) | 93 (9.8%) |
| 65 to 69 Years | 6 (0.7%) | 23 (2.4%) |
| 70 to 74 Years | 56 (6.9%) | 1 (0.1%) |
| 75 to 79 Years | 8 (1.0%) | 1 (0.1%) |
| 80 to 84 Years | 0 (0.0%) | 6 (0.6%) |
| 85 Years and over | 27 (3.3%) | 1 (0.1%) |
| Total | 814 (100.0%) | 945 (100.0%) |
Families and Households in Royal Palm Estates
Median Family Size in Royal Palm Estates
The median family size in Royal Palm Estates is 3.88 persons per family, with single female/mother families (155 | 42.8%) accounting for the largest median family size of 4.65 persons per family. On the other hand, single male/father families (14 | 3.9%) represent the smallest median family size with 3.29 persons per family.
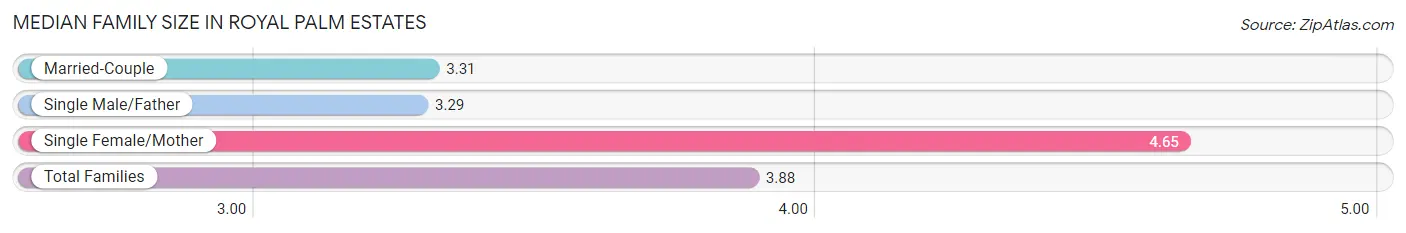
| Family Type | # Families | Family Size |
| Married-Couple | 193 (53.3%) | 3.31 |
| Single Male/Father | 14 (3.9%) | 3.29 |
| Single Female/Mother | 155 (42.8%) | 4.65 |
| Total Families | 362 (100.0%) | 3.88 |
Median Household Size in Royal Palm Estates
The median household size in Royal Palm Estates is 3.34 persons per household, with single female/mother households (155 | 29.6%) accounting for the largest median household size of 5.1 persons per household. non-family households (162 | 30.9%) represent the smallest median household size with 1.69 persons per household.
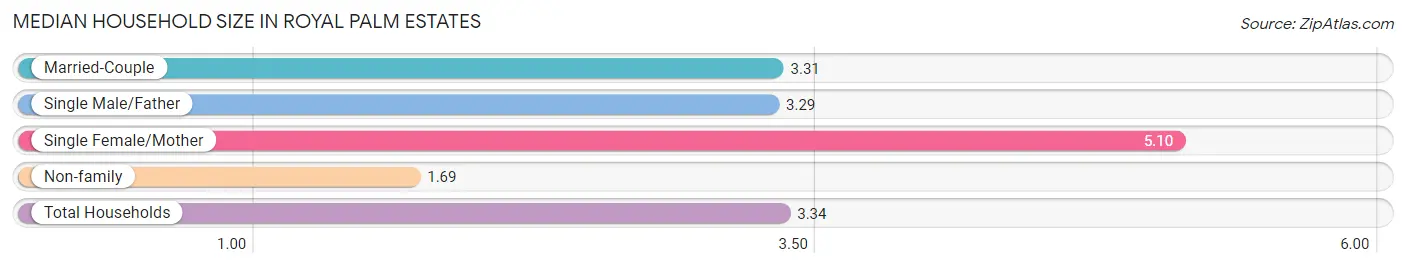
| Household Type | # Households | Household Size |
| Married-Couple | 193 (36.8%) | 3.31 |
| Single Male/Father | 14 (2.7%) | 3.29 |
| Single Female/Mother | 155 (29.6%) | 5.10 |
| Non-family | 162 (30.9%) | 1.69 |
| Total Households | 524 (100.0%) | 3.34 |
Household Size by Marriage Status in Royal Palm Estates
Out of a total of 524 households in Royal Palm Estates, 362 (69.1%) are family households, while 162 (30.9%) are nonfamily households. The most numerous type of family households are 4-person households, comprising 138, and the most common type of nonfamily households are 1-person households, comprising 105.
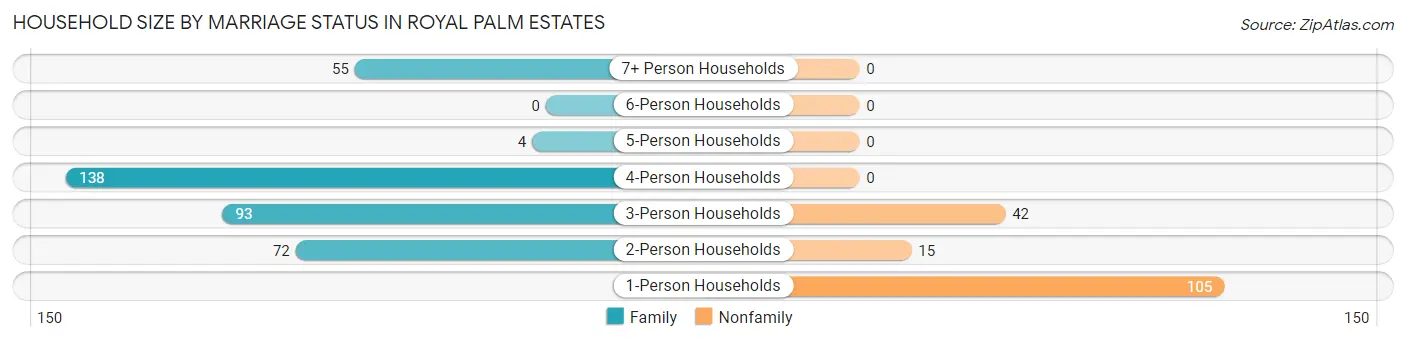
| Household Size | Family Households | Nonfamily Households |
| 1-Person Households | - | 105 (20.0%) |
| 2-Person Households | 72 (13.7%) | 15 (2.9%) |
| 3-Person Households | 93 (17.7%) | 42 (8.0%) |
| 4-Person Households | 138 (26.3%) | 0 (0.0%) |
| 5-Person Households | 4 (0.8%) | 0 (0.0%) |
| 6-Person Households | 0 (0.0%) | 0 (0.0%) |
| 7+ Person Households | 55 (10.5%) | 0 (0.0%) |
| Total | 362 (69.1%) | 162 (30.9%) |
Female Fertility in Royal Palm Estates
Fertility by Age in Royal Palm Estates
| Age Bracket | Women with Births | Births / 1,000 Women |
| 15 to 19 years | 0 (0.0%) | 0.0 |
| 20 to 34 years | 0 (0.0%) | 0.0 |
| 35 to 50 years | 0 (0.0%) | 0.0 |
| Total | 0 (0.0%) | 0.0 |
Fertility by Age by Marriage Status in Royal Palm Estates
| Age Bracket | Married | Unmarried |
| 15 to 19 years | 0 (0.0%) | 0 (0.0%) |
| 20 to 34 years | 0 (0.0%) | 0 (0.0%) |
| 35 to 50 years | 0 (0.0%) | 0 (0.0%) |
| Total | 0 (0.0%) | 0 (0.0%) |
Fertility by Education in Royal Palm Estates
| Educational Attainment | Women with Births | Births / 1,000 Women |
| Less than High School | 0 (0.0%) | 0.0 |
| High School Diploma | 0 (0.0%) | 0.0 |
| College or Associate's Degree | 0 (0.0%) | 0.0 |
| Bachelor's Degree | 0 (0.0%) | 0.0 |
| Graduate Degree | 0 (0.0%) | 0.0 |
| Total | 0 (0.0%) | 0.0 |
Fertility by Education by Marriage Status in Royal Palm Estates
| Educational Attainment | Married | Unmarried |
| Less than High School | 0 (0.0%) | 0 (0.0%) |
| High School Diploma | 0 (0.0%) | 0 (0.0%) |
| College or Associate's Degree | 0 (0.0%) | 0 (0.0%) |
| Bachelor's Degree | 0 (0.0%) | 0 (0.0%) |
| Graduate Degree | 0 (0.0%) | 0 (0.0%) |
| Total | 0 (0.0%) | 0 (0.0%) |
Employment Characteristics in Royal Palm Estates
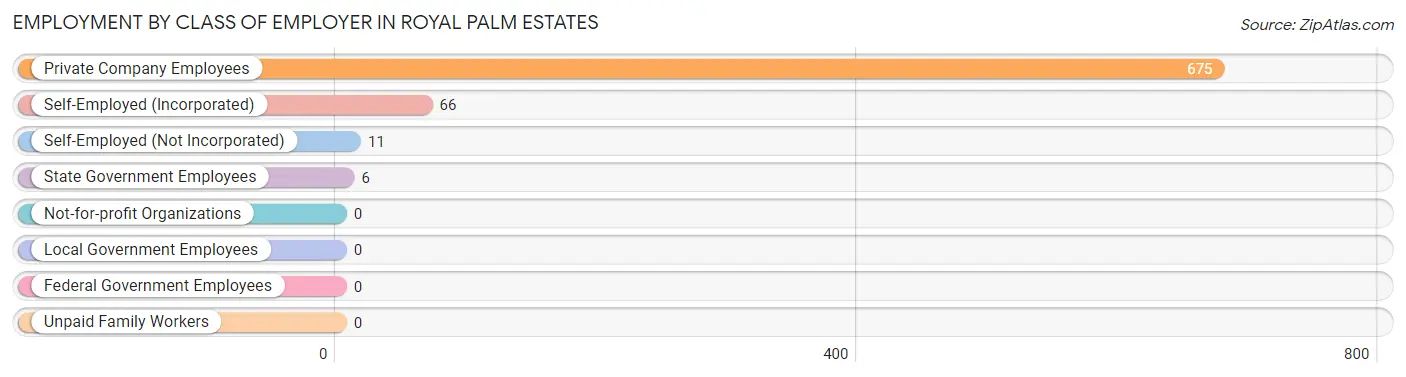
Employment by Class of Employer in Royal Palm Estates
Among the 758 employed individuals in Royal Palm Estates, private company employees (675 | 89.0%), self-employed (incorporated) (66 | 8.7%), and self-employed (not incorporated) (11 | 1.5%) make up the most common classes of employment.
| Employer Class | # Employees | % Employees |
| Private Company Employees | 675 | 89.0% |
| Self-Employed (Incorporated) | 66 | 8.7% |
| Self-Employed (Not Incorporated) | 11 | 1.5% |
| Not-for-profit Organizations | 0 | 0.0% |
| Local Government Employees | 0 | 0.0% |
| State Government Employees | 6 | 0.8% |
| Federal Government Employees | 0 | 0.0% |
| Unpaid Family Workers | 0 | 0.0% |
| Total | 758 | 100.0% |
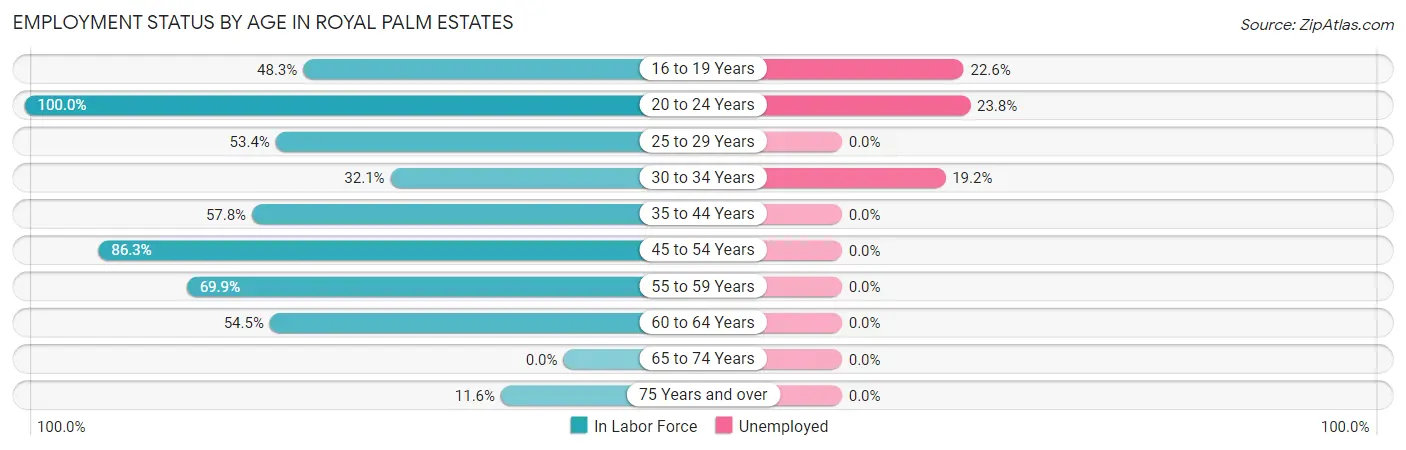
Employment Status by Age in Royal Palm Estates
According to the labor force statistics for Royal Palm Estates, out of the total population over 16 years of age (1,376), 59.3% or 816 individuals are in the labor force, with 7.1% or 58 of them unemployed. The age group with the highest labor force participation rate is 20 to 24 years, with 100.0% or 143 individuals in the labor force. Within the labor force, the 20 to 24 years age range has the highest percentage of unemployed individuals, with 23.8% or 34 of them being unemployed.
| Age Bracket | In Labor Force | Unemployed |
| 16 to 19 Years | 84 (48.3%) | 19 (22.6%) |
| 20 to 24 Years | 143 (100.0%) | 34 (23.8%) |
| 25 to 29 Years | 31 (53.4%) | 0 (0.0%) |
| 30 to 34 Years | 26 (32.1%) | 5 (19.2%) |
| 35 to 44 Years | 200 (57.8%) | 0 (0.0%) |
| 45 to 54 Years | 164 (86.3%) | 0 (0.0%) |
| 55 to 59 Years | 109 (69.9%) | 0 (0.0%) |
| 60 to 64 Years | 54 (54.5%) | 0 (0.0%) |
| 65 to 74 Years | 0 (0.0%) | 0 (0.0%) |
| 75 Years and over | 5 (11.6%) | 0 (0.0%) |
| Total | 816 (59.3%) | 58 (7.1%) |
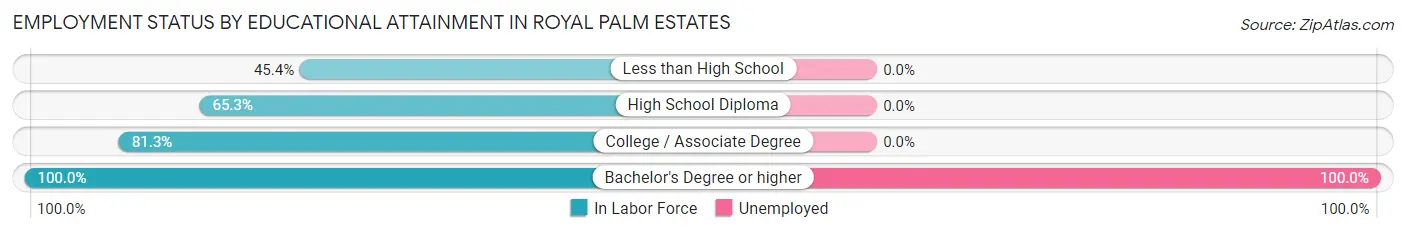
Employment Status by Educational Attainment in Royal Palm Estates
According to labor force statistics for Royal Palm Estates, 62.8% of individuals (584) out of the total population between 25 and 64 years of age (930) are in the labor force, with 0.9% or 5 of them being unemployed. The group with the highest labor force participation rate are those with the educational attainment of bachelor's degree or higher, with 100.0% or 5 individuals in the labor force. Within the labor force, individuals with bachelor's degree or higher education have the highest percentage of unemployment, with 100.0% or 5 of them being unemployed.
| Educational Attainment | In Labor Force | Unemployed |
| Less than High School | 98 (45.4%) | 0 (0.0%) |
| High School Diploma | 390 (65.3%) | 0 (0.0%) |
| College / Associate Degree | 91 (81.3%) | 0 (0.0%) |
| Bachelor's Degree or higher | 5 (100.0%) | 5 (100.0%) |
| Total | 584 (62.8%) | 8 (0.9%) |
Employment Occupations by Sex in Royal Palm Estates
Management, Business, Science and Arts Occupations
The most common Management, Business, Science and Arts occupations in Royal Palm Estates are Management (5 | 0.7%), Business & Financial (4 | 0.5%), Computers, Engineering & Science (4 | 0.5%), and Computers & Mathematics (4 | 0.5%).

Management, Business, Science and Arts Occupations by Sex
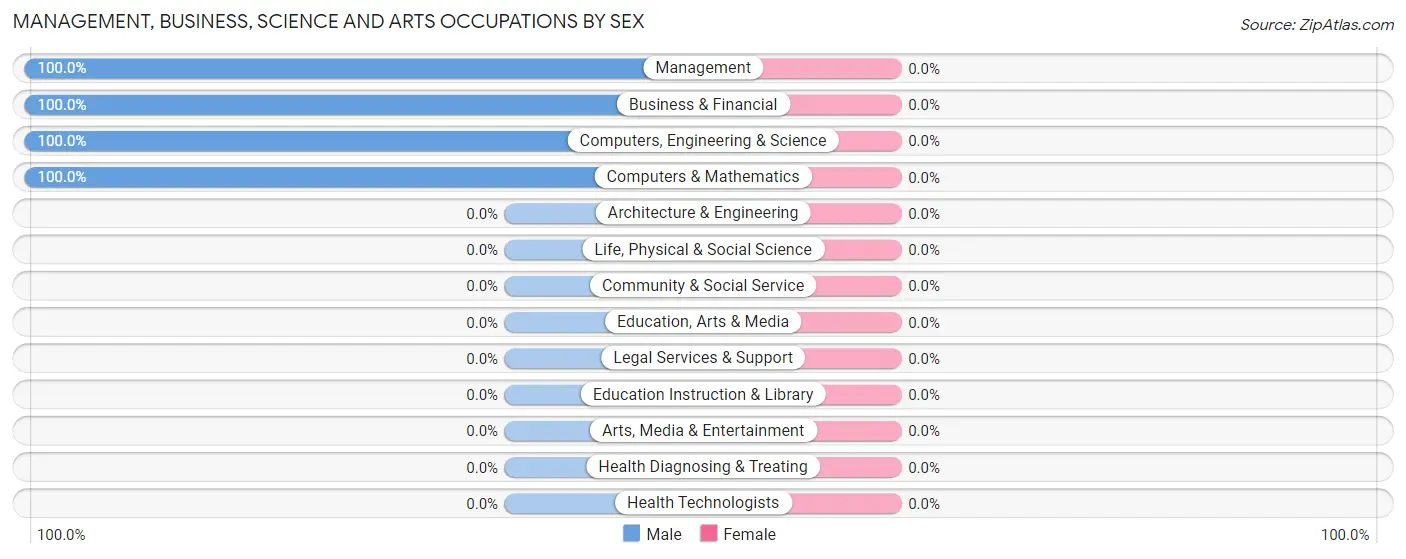
| Occupation | Male | Female |
| Management | 5 (100.0%) | 0 (0.0%) |
| Business & Financial | 4 (100.0%) | 0 (0.0%) |
| Computers, Engineering & Science | 4 (100.0%) | 0 (0.0%) |
| Computers & Mathematics | 4 (100.0%) | 0 (0.0%) |
| Architecture & Engineering | 0 (0.0%) | 0 (0.0%) |
| Life, Physical & Social Science | 0 (0.0%) | 0 (0.0%) |
| Community & Social Service | 0 (0.0%) | 0 (0.0%) |
| Education, Arts & Media | 0 (0.0%) | 0 (0.0%) |
| Legal Services & Support | 0 (0.0%) | 0 (0.0%) |
| Education Instruction & Library | 0 (0.0%) | 0 (0.0%) |
| Arts, Media & Entertainment | 0 (0.0%) | 0 (0.0%) |
| Health Diagnosing & Treating | 0 (0.0%) | 0 (0.0%) |
| Health Technologists | 0 (0.0%) | 0 (0.0%) |
| Total (Category) | 13 (100.0%) | 0 (0.0%) |
| Total (Overall) | 402 (53.0%) | 356 (47.0%) |
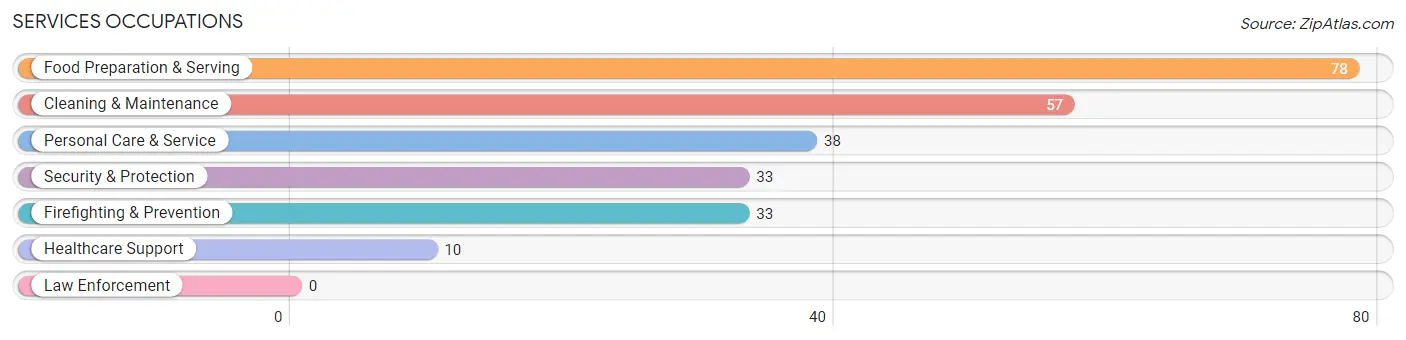
Services Occupations
The most common Services occupations in Royal Palm Estates are Food Preparation & Serving (78 | 10.3%), Cleaning & Maintenance (57 | 7.5%), Personal Care & Service (38 | 5.0%), Security & Protection (33 | 4.3%), and Firefighting & Prevention (33 | 4.3%).
Services Occupations by Sex
Within the Services occupations in Royal Palm Estates, the most male-oriented occupations are Cleaning & Maintenance (100.0%), and Personal Care & Service (57.9%), while the most female-oriented occupations are Healthcare Support (100.0%), Security & Protection (100.0%), and Firefighting & Prevention (100.0%).
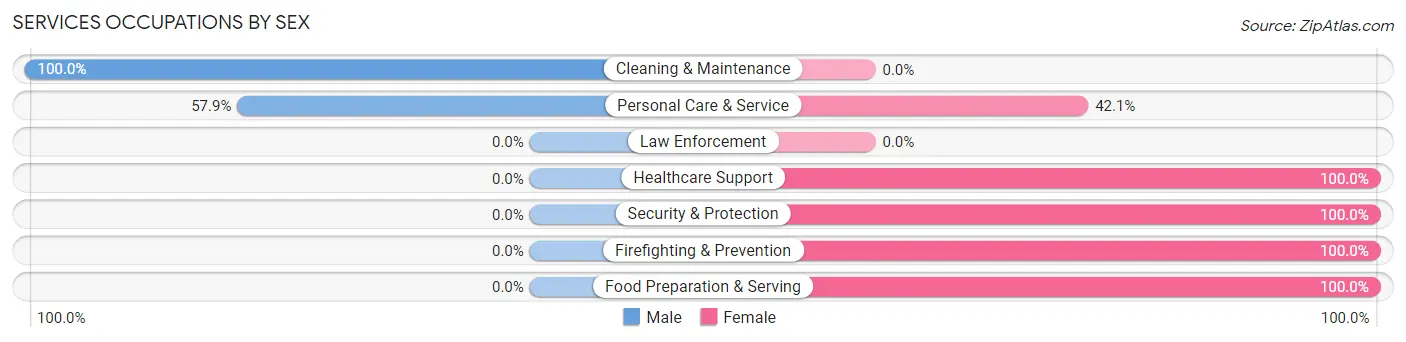
| Occupation | Male | Female |
| Healthcare Support | 0 (0.0%) | 10 (100.0%) |
| Security & Protection | 0 (0.0%) | 33 (100.0%) |
| Firefighting & Prevention | 0 (0.0%) | 33 (100.0%) |
| Law Enforcement | 0 (0.0%) | 0 (0.0%) |
| Food Preparation & Serving | 0 (0.0%) | 78 (100.0%) |
| Cleaning & Maintenance | 57 (100.0%) | 0 (0.0%) |
| Personal Care & Service | 22 (57.9%) | 16 (42.1%) |
| Total (Category) | 79 (36.6%) | 137 (63.4%) |
| Total (Overall) | 402 (53.0%) | 356 (47.0%) |
Sales and Office Occupations
The most common Sales and Office occupations in Royal Palm Estates are Sales & Related (115 | 15.2%), and Office & Administration (15 | 2.0%).
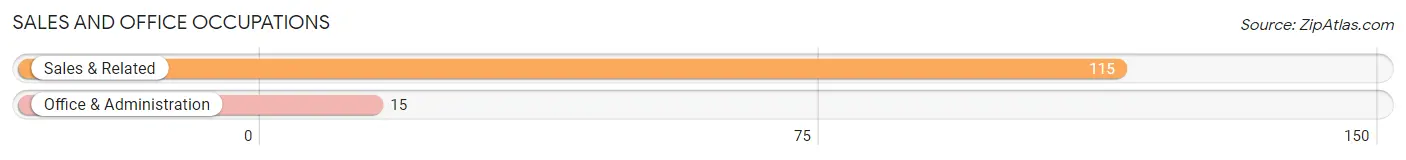
Sales and Office Occupations by Sex
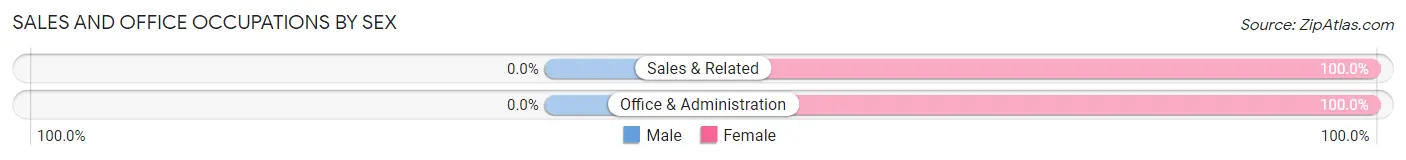
| Occupation | Male | Female |
| Sales & Related | 0 (0.0%) | 115 (100.0%) |
| Office & Administration | 0 (0.0%) | 15 (100.0%) |
| Total (Category) | 0 (0.0%) | 130 (100.0%) |
| Total (Overall) | 402 (53.0%) | 356 (47.0%) |
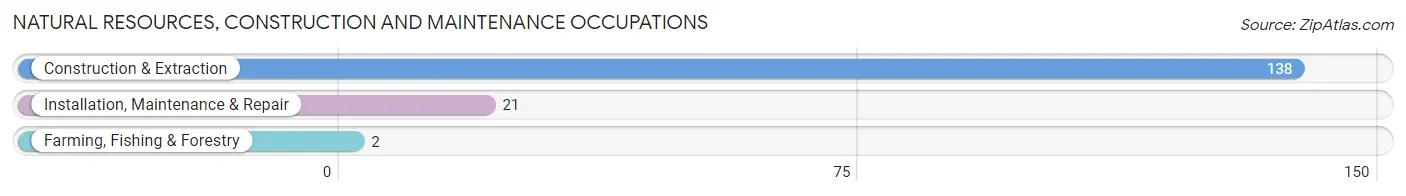
Natural Resources, Construction and Maintenance Occupations
The most common Natural Resources, Construction and Maintenance occupations in Royal Palm Estates are Construction & Extraction (138 | 18.2%), Installation, Maintenance & Repair (21 | 2.8%), and Farming, Fishing & Forestry (2 | 0.3%).
Natural Resources, Construction and Maintenance Occupations by Sex
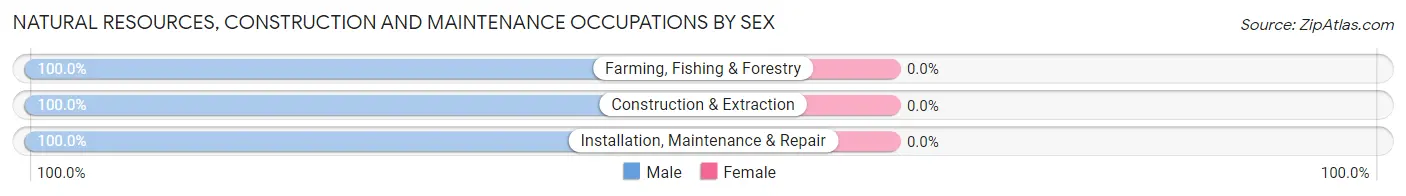
| Occupation | Male | Female |
| Farming, Fishing & Forestry | 2 (100.0%) | 0 (0.0%) |
| Construction & Extraction | 138 (100.0%) | 0 (0.0%) |
| Installation, Maintenance & Repair | 21 (100.0%) | 0 (0.0%) |
| Total (Category) | 161 (100.0%) | 0 (0.0%) |
| Total (Overall) | 402 (53.0%) | 356 (47.0%) |
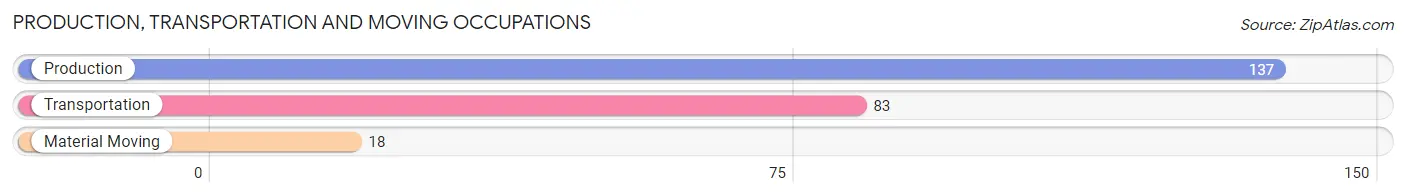
Production, Transportation and Moving Occupations
The most common Production, Transportation and Moving occupations in Royal Palm Estates are Production (137 | 18.1%), Transportation (83 | 11.0%), and Material Moving (18 | 2.4%).
Production, Transportation and Moving Occupations by Sex
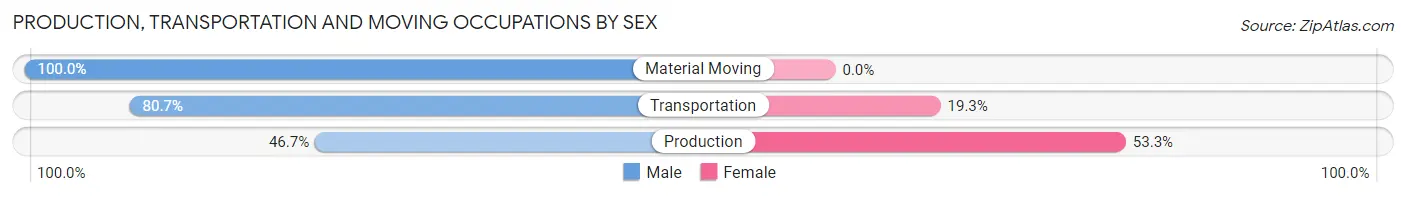
| Occupation | Male | Female |
| Production | 64 (46.7%) | 73 (53.3%) |
| Transportation | 67 (80.7%) | 16 (19.3%) |
| Material Moving | 18 (100.0%) | 0 (0.0%) |
| Total (Category) | 149 (62.6%) | 89 (37.4%) |
| Total (Overall) | 402 (53.0%) | 356 (47.0%) |
Employment Industries by Sex in Royal Palm Estates
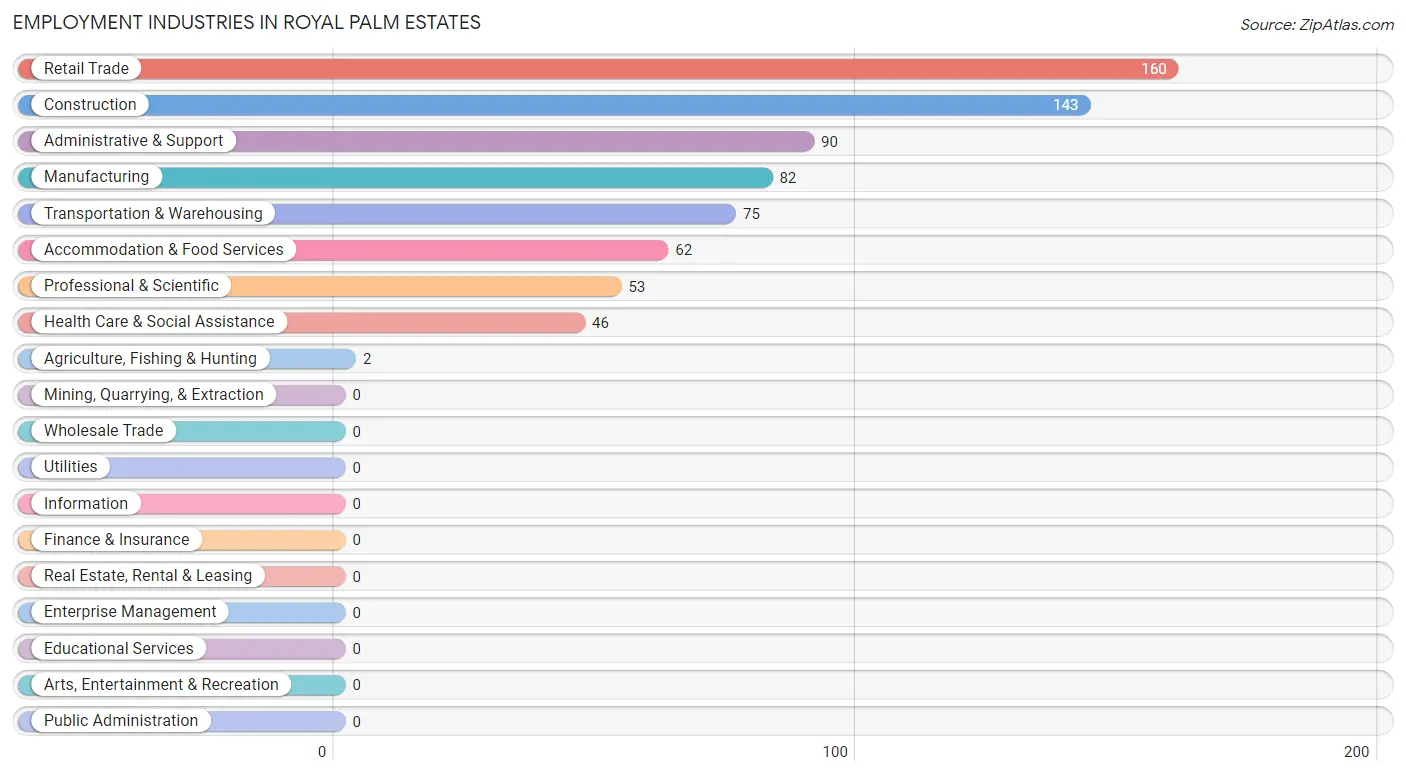
Employment Industries in Royal Palm Estates
The major employment industries in Royal Palm Estates include Retail Trade (160 | 21.1%), Construction (143 | 18.9%), Administrative & Support (90 | 11.9%), Manufacturing (82 | 10.8%), and Transportation & Warehousing (75 | 9.9%).
Employment Industries by Sex in Royal Palm Estates
The Royal Palm Estates industries that see more men than women are Agriculture, Fishing & Hunting (100.0%), Construction (100.0%), and Professional & Scientific (100.0%), whereas the industries that tend to have a higher number of women are Health Care & Social Assistance (91.3%), Manufacturing (89.0%), and Accommodation & Food Services (77.4%).
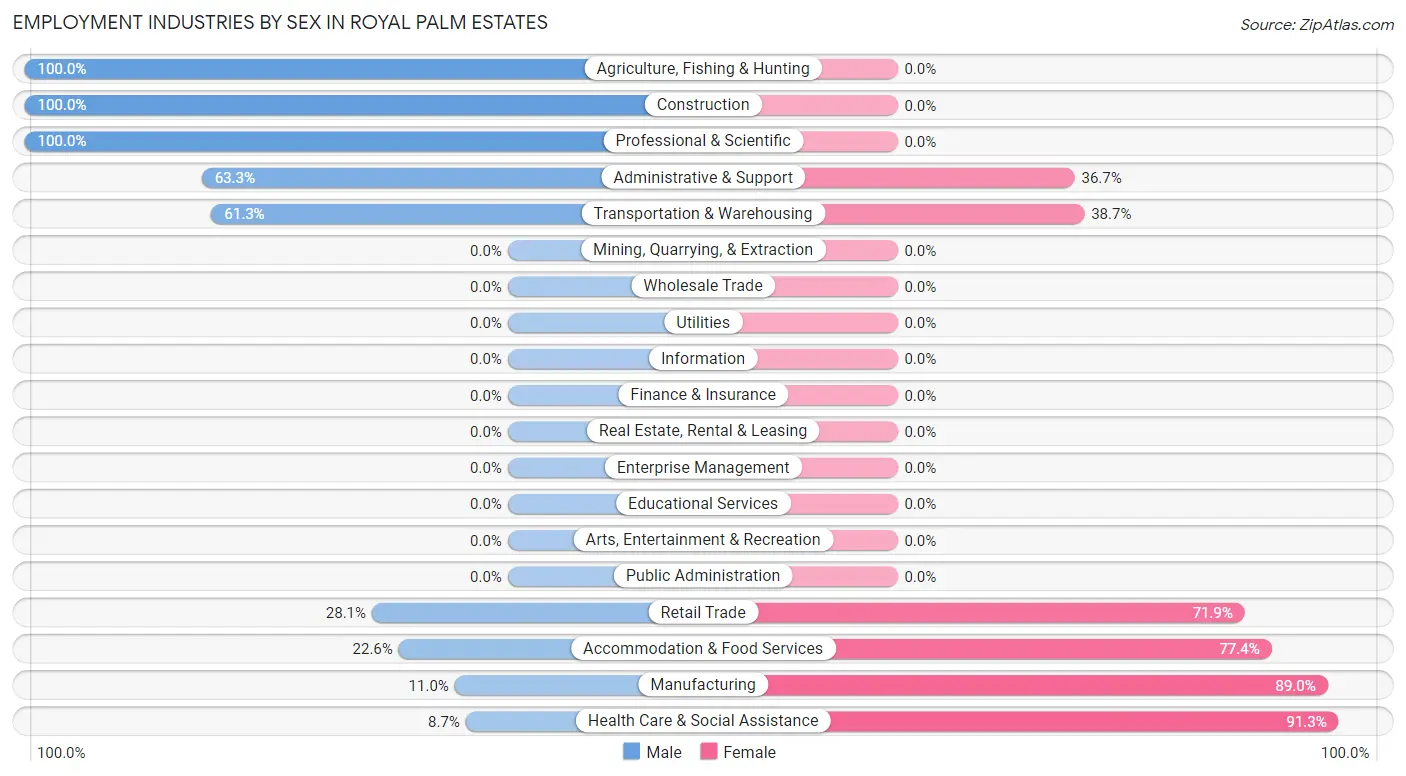
| Industry | Male | Female |
| Agriculture, Fishing & Hunting | 2 (100.0%) | 0 (0.0%) |
| Mining, Quarrying, & Extraction | 0 (0.0%) | 0 (0.0%) |
| Construction | 143 (100.0%) | 0 (0.0%) |
| Manufacturing | 9 (11.0%) | 73 (89.0%) |
| Wholesale Trade | 0 (0.0%) | 0 (0.0%) |
| Retail Trade | 45 (28.1%) | 115 (71.9%) |
| Transportation & Warehousing | 46 (61.3%) | 29 (38.7%) |
| Utilities | 0 (0.0%) | 0 (0.0%) |
| Information | 0 (0.0%) | 0 (0.0%) |
| Finance & Insurance | 0 (0.0%) | 0 (0.0%) |
| Real Estate, Rental & Leasing | 0 (0.0%) | 0 (0.0%) |
| Professional & Scientific | 53 (100.0%) | 0 (0.0%) |
| Enterprise Management | 0 (0.0%) | 0 (0.0%) |
| Administrative & Support | 57 (63.3%) | 33 (36.7%) |
| Educational Services | 0 (0.0%) | 0 (0.0%) |
| Health Care & Social Assistance | 4 (8.7%) | 42 (91.3%) |
| Arts, Entertainment & Recreation | 0 (0.0%) | 0 (0.0%) |
| Accommodation & Food Services | 14 (22.6%) | 48 (77.4%) |
| Public Administration | 0 (0.0%) | 0 (0.0%) |
| Total | 402 (53.0%) | 356 (47.0%) |
Education in Royal Palm Estates
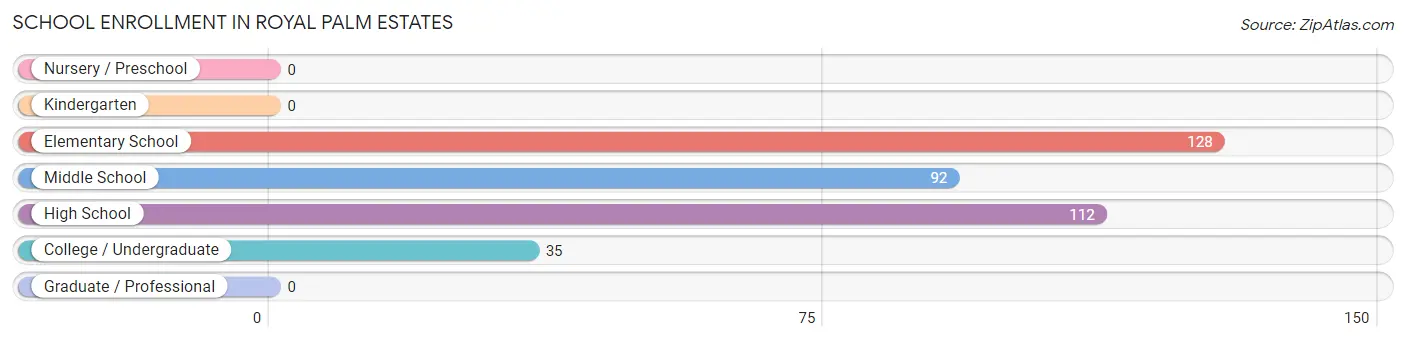
School Enrollment in Royal Palm Estates
The most common levels of schooling among the 367 students in Royal Palm Estates are elementary school (128 | 34.9%), high school (112 | 30.5%), and middle school (92 | 25.1%).
| School Level | # Students | % Students |
| Nursery / Preschool | 0 | 0.0% |
| Kindergarten | 0 | 0.0% |
| Elementary School | 128 | 34.9% |
| Middle School | 92 | 25.1% |
| High School | 112 | 30.5% |
| College / Undergraduate | 35 | 9.5% |
| Graduate / Professional | 0 | 0.0% |
| Total | 367 | 100.0% |
School Enrollment by Age by Funding Source in Royal Palm Estates
Out of a total of 367 students who are enrolled in schools in Royal Palm Estates, 45 (12.3%) attend a private institution, while the remaining 322 (87.7%) are enrolled in public schools. The age group of 10 to 14 year olds has the highest likelihood of being enrolled in private schools, with 30 (19.6% in the age bracket) enrolled. Conversely, the age group of 5 to 9 year old has the lowest likelihood of being enrolled in a private school, with 71 (100.0% in the age bracket) attending a public institution.
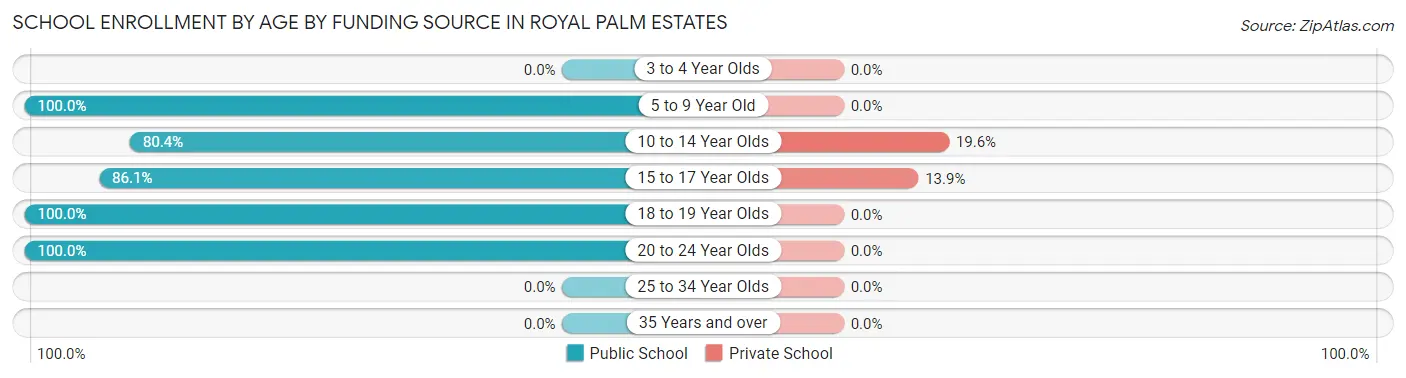
| Age Bracket | Public School | Private School |
| 3 to 4 Year Olds | 0 (0.0%) | 0 (0.0%) |
| 5 to 9 Year Old | 71 (100.0%) | 0 (0.0%) |
| 10 to 14 Year Olds | 123 (80.4%) | 30 (19.6%) |
| 15 to 17 Year Olds | 93 (86.1%) | 15 (13.9%) |
| 18 to 19 Year Olds | 19 (100.0%) | 0 (0.0%) |
| 20 to 24 Year Olds | 16 (100.0%) | 0 (0.0%) |
| 25 to 34 Year Olds | 0 (0.0%) | 0 (0.0%) |
| 35 Years and over | 0 (0.0%) | 0 (0.0%) |
| Total | 322 (87.7%) | 45 (12.3%) |
Educational Attainment by Field of Study in Royal Palm Estates
Arts & humanities (5 | 71.4%), and science & technology (2 | 28.6%) are the most common fields of study among 7 individuals in Royal Palm Estates who have obtained a bachelor's degree or higher.
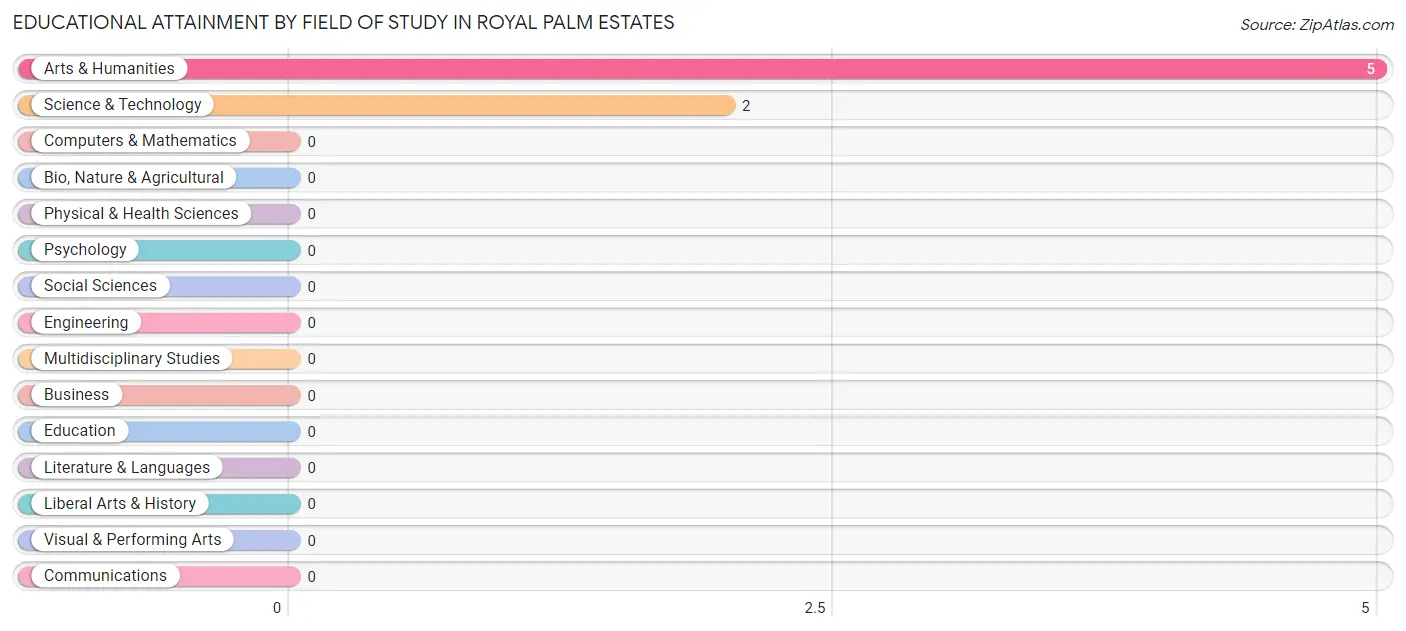
| Field of Study | # Graduates | % Graduates |
| Computers & Mathematics | 0 | 0.0% |
| Bio, Nature & Agricultural | 0 | 0.0% |
| Physical & Health Sciences | 0 | 0.0% |
| Psychology | 0 | 0.0% |
| Social Sciences | 0 | 0.0% |
| Engineering | 0 | 0.0% |
| Multidisciplinary Studies | 0 | 0.0% |
| Science & Technology | 2 | 28.6% |
| Business | 0 | 0.0% |
| Education | 0 | 0.0% |
| Literature & Languages | 0 | 0.0% |
| Liberal Arts & History | 0 | 0.0% |
| Visual & Performing Arts | 0 | 0.0% |
| Communications | 0 | 0.0% |
| Arts & Humanities | 5 | 71.4% |
| Total | 7 | 100.0% |
Transportation & Commute in Royal Palm Estates
Vehicle Availability by Sex in Royal Palm Estates
The most prevalent vehicle ownership categories in Royal Palm Estates are males with 2 vehicles (172, accounting for 42.8%) and females with 2 vehicles (86, making up 48.3%).
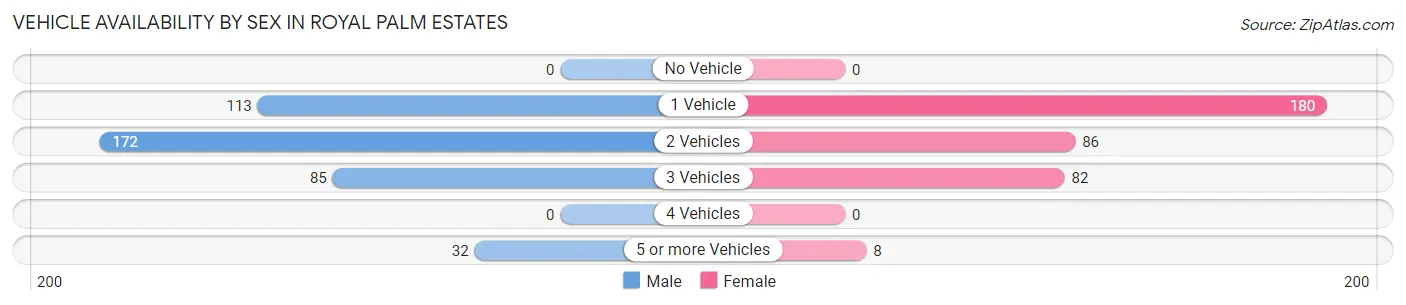
| Vehicles Available | Male | Female |
| No Vehicle | 0 (0.0%) | 0 (0.0%) |
| 1 Vehicle | 113 (28.1%) | 180 (50.6%) |
| 2 Vehicles | 172 (42.8%) | 86 (24.2%) |
| 3 Vehicles | 85 (21.1%) | 82 (23.0%) |
| 4 Vehicles | 0 (0.0%) | 0 (0.0%) |
| 5 or more Vehicles | 32 (8.0%) | 8 (2.2%) |
| Total | 402 (100.0%) | 356 (100.0%) |
Commute Time in Royal Palm Estates
The most frequently occuring commute durations in Royal Palm Estates are 25 to 29 minutes (192 commuters, 25.5%), 10 to 14 minutes (122 commuters, 16.2%), and 30 to 34 minutes (108 commuters, 14.3%).
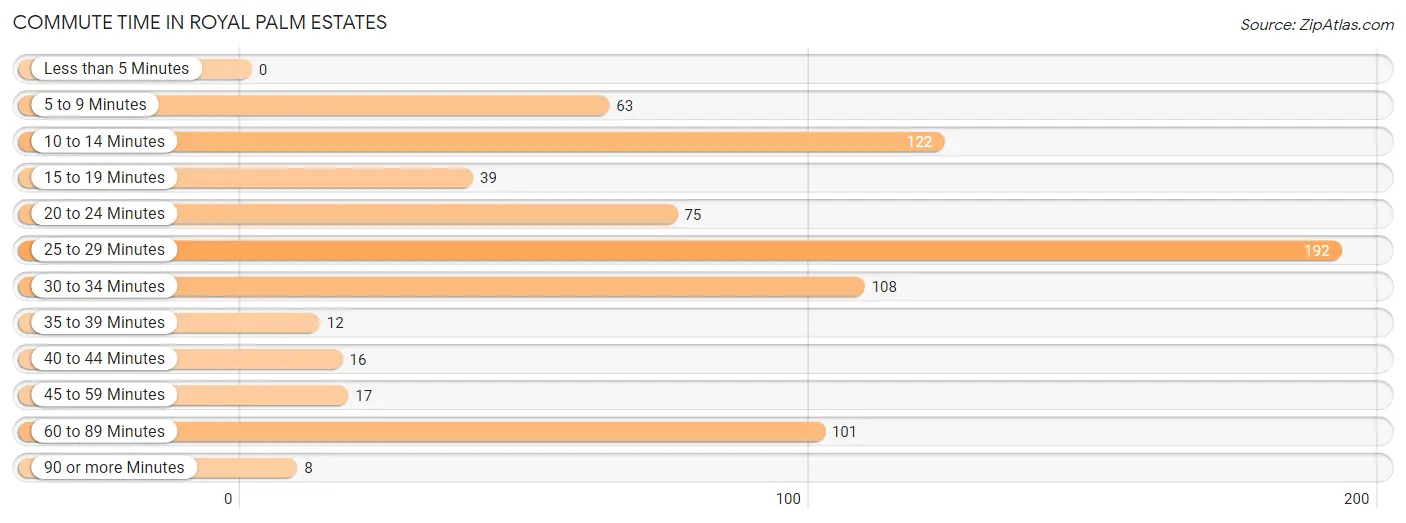
| Commute Time | # Commuters | % Commuters |
| Less than 5 Minutes | 0 | 0.0% |
| 5 to 9 Minutes | 63 | 8.4% |
| 10 to 14 Minutes | 122 | 16.2% |
| 15 to 19 Minutes | 39 | 5.2% |
| 20 to 24 Minutes | 75 | 10.0% |
| 25 to 29 Minutes | 192 | 25.5% |
| 30 to 34 Minutes | 108 | 14.3% |
| 35 to 39 Minutes | 12 | 1.6% |
| 40 to 44 Minutes | 16 | 2.1% |
| 45 to 59 Minutes | 17 | 2.3% |
| 60 to 89 Minutes | 101 | 13.4% |
| 90 or more Minutes | 8 | 1.1% |
Commute Time by Sex in Royal Palm Estates
The most common commute times in Royal Palm Estates are 10 to 14 minutes (115 commuters, 29.0%) for males and 25 to 29 minutes (110 commuters, 30.9%) for females.
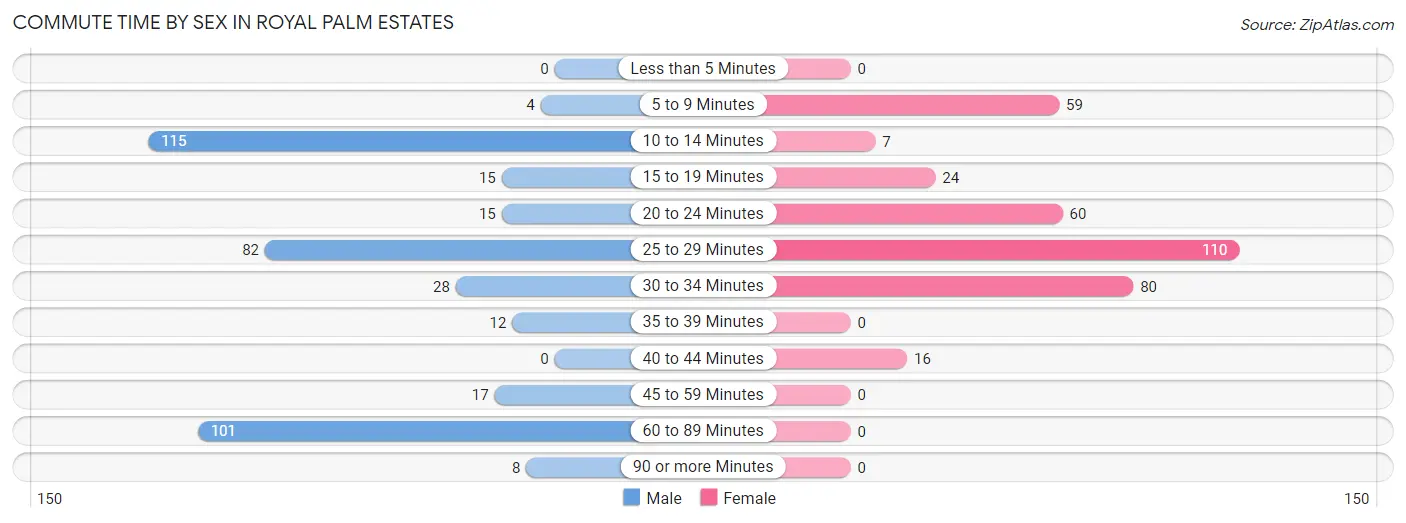
| Commute Time | Male | Female |
| Less than 5 Minutes | 0 (0.0%) | 0 (0.0%) |
| 5 to 9 Minutes | 4 (1.0%) | 59 (16.6%) |
| 10 to 14 Minutes | 115 (29.0%) | 7 (2.0%) |
| 15 to 19 Minutes | 15 (3.8%) | 24 (6.7%) |
| 20 to 24 Minutes | 15 (3.8%) | 60 (16.9%) |
| 25 to 29 Minutes | 82 (20.6%) | 110 (30.9%) |
| 30 to 34 Minutes | 28 (7.0%) | 80 (22.5%) |
| 35 to 39 Minutes | 12 (3.0%) | 0 (0.0%) |
| 40 to 44 Minutes | 0 (0.0%) | 16 (4.5%) |
| 45 to 59 Minutes | 17 (4.3%) | 0 (0.0%) |
| 60 to 89 Minutes | 101 (25.4%) | 0 (0.0%) |
| 90 or more Minutes | 8 (2.0%) | 0 (0.0%) |
Time of Departure to Work by Sex in Royal Palm Estates
The most frequent times of departure to work in Royal Palm Estates are 7:00 AM to 7:29 AM (109, 27.5%) for males and 6:00 AM to 6:29 AM (80, 22.5%) for females.
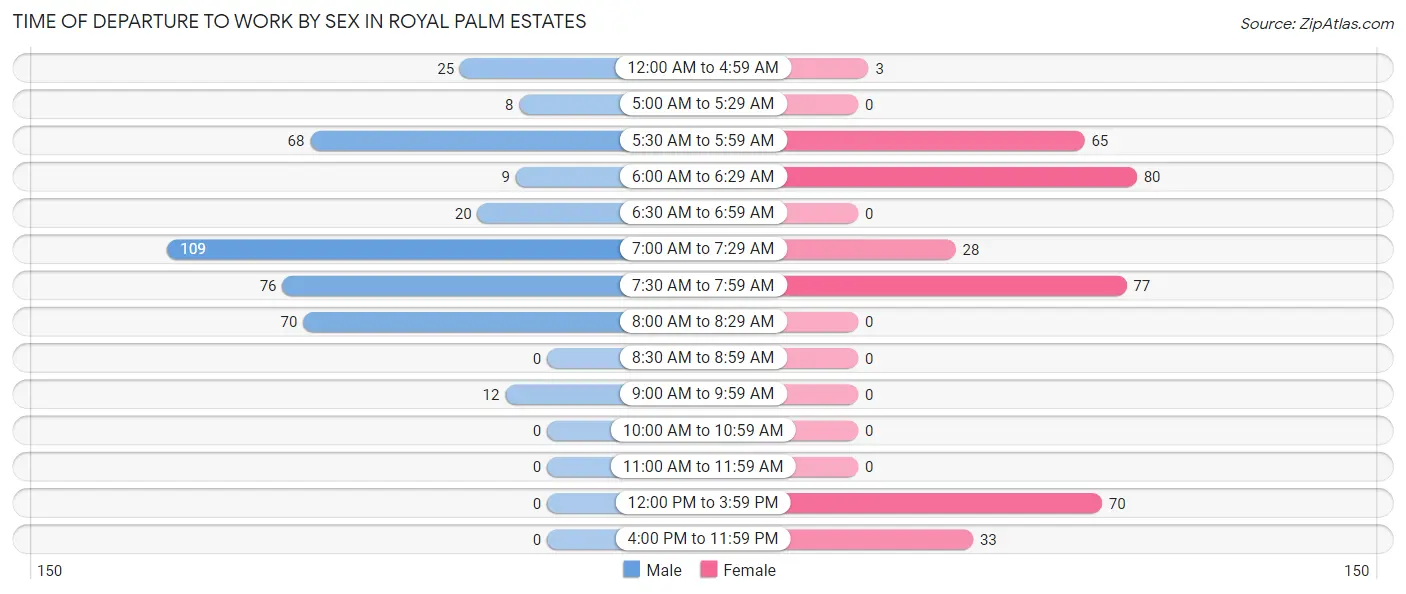
| Time of Departure | Male | Female |
| 12:00 AM to 4:59 AM | 25 (6.3%) | 3 (0.8%) |
| 5:00 AM to 5:29 AM | 8 (2.0%) | 0 (0.0%) |
| 5:30 AM to 5:59 AM | 68 (17.1%) | 65 (18.3%) |
| 6:00 AM to 6:29 AM | 9 (2.3%) | 80 (22.5%) |
| 6:30 AM to 6:59 AM | 20 (5.0%) | 0 (0.0%) |
| 7:00 AM to 7:29 AM | 109 (27.5%) | 28 (7.9%) |
| 7:30 AM to 7:59 AM | 76 (19.1%) | 77 (21.6%) |
| 8:00 AM to 8:29 AM | 70 (17.6%) | 0 (0.0%) |
| 8:30 AM to 8:59 AM | 0 (0.0%) | 0 (0.0%) |
| 9:00 AM to 9:59 AM | 12 (3.0%) | 0 (0.0%) |
| 10:00 AM to 10:59 AM | 0 (0.0%) | 0 (0.0%) |
| 11:00 AM to 11:59 AM | 0 (0.0%) | 0 (0.0%) |
| 12:00 PM to 3:59 PM | 0 (0.0%) | 70 (19.7%) |
| 4:00 PM to 11:59 PM | 0 (0.0%) | 33 (9.3%) |
| Total | 397 (100.0%) | 356 (100.0%) |
Housing Occupancy in Royal Palm Estates
Occupancy by Ownership in Royal Palm Estates
Of the total 524 dwellings in Royal Palm Estates, owner-occupied units account for 247 (47.1%), while renter-occupied units make up 277 (52.9%).
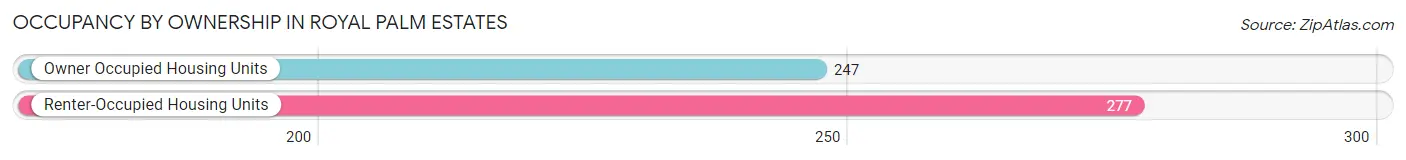
| Occupancy | # Housing Units | % Housing Units |
| Owner Occupied Housing Units | 247 | 47.1% |
| Renter-Occupied Housing Units | 277 | 52.9% |
| Total Occupied Housing Units | 524 | 100.0% |
Occupancy by Household Size in Royal Palm Estates
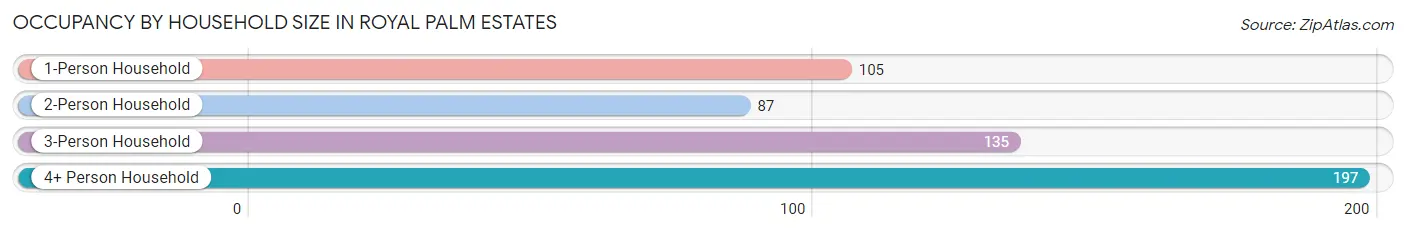
| Household Size | # Housing Units | % Housing Units |
| 1-Person Household | 105 | 20.0% |
| 2-Person Household | 87 | 16.6% |
| 3-Person Household | 135 | 25.8% |
| 4+ Person Household | 197 | 37.6% |
| Total Housing Units | 524 | 100.0% |
Occupancy by Ownership by Household Size in Royal Palm Estates
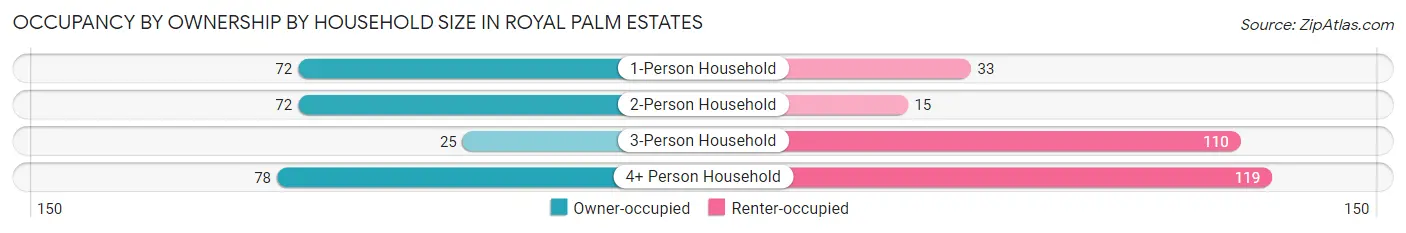
| Household Size | Owner-occupied | Renter-occupied |
| 1-Person Household | 72 (68.6%) | 33 (31.4%) |
| 2-Person Household | 72 (82.8%) | 15 (17.2%) |
| 3-Person Household | 25 (18.5%) | 110 (81.5%) |
| 4+ Person Household | 78 (39.6%) | 119 (60.4%) |
| Total Housing Units | 247 (47.1%) | 277 (52.9%) |
Occupancy by Educational Attainment in Royal Palm Estates
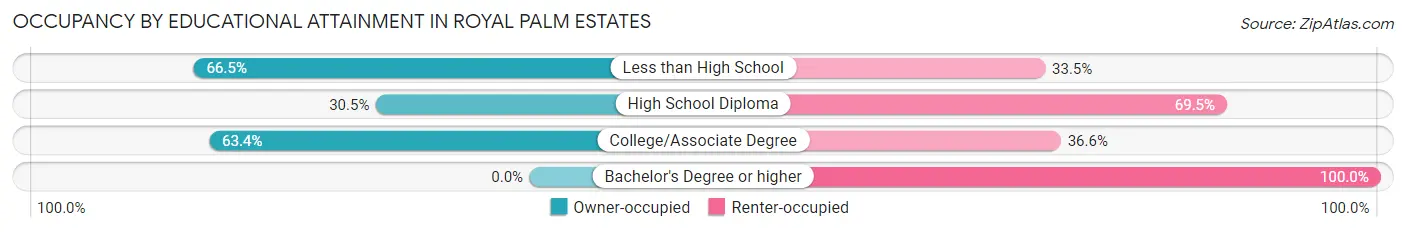
| Household Size | Owner-occupied | Renter-occupied |
| Less than High School | 139 (66.5%) | 70 (33.5%) |
| High School Diploma | 82 (30.5%) | 187 (69.5%) |
| College/Associate Degree | 26 (63.4%) | 15 (36.6%) |
| Bachelor's Degree or higher | 0 (0.0%) | 5 (100.0%) |
Occupancy by Age of Householder in Royal Palm Estates
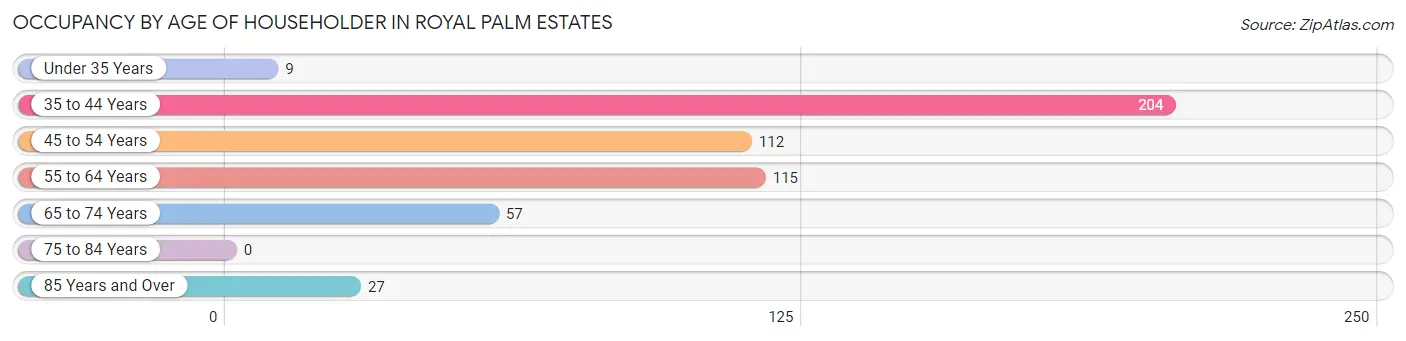
| Age Bracket | # Households | % Households |
| Under 35 Years | 9 | 1.7% |
| 35 to 44 Years | 204 | 38.9% |
| 45 to 54 Years | 112 | 21.4% |
| 55 to 64 Years | 115 | 22.0% |
| 65 to 74 Years | 57 | 10.9% |
| 75 to 84 Years | 0 | 0.0% |
| 85 Years and Over | 27 | 5.1% |
| Total | 524 | 100.0% |
Housing Finances in Royal Palm Estates
Median Income by Occupancy in Royal Palm Estates
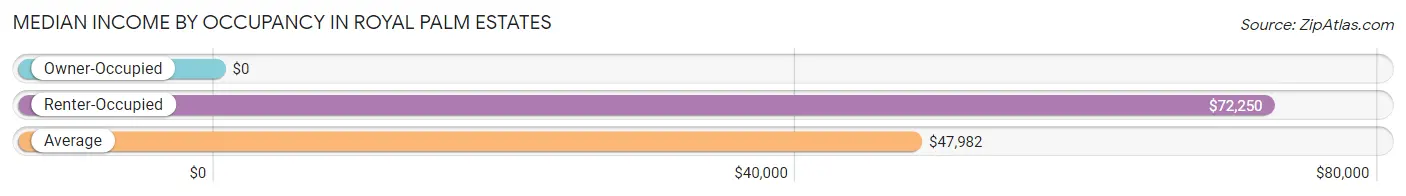
| Occupancy Type | # Households | Median Income |
| Owner-Occupied | 247 (47.1%) | $0 |
| Renter-Occupied | 277 (52.9%) | $72,250 |
| Average | 524 (100.0%) | $47,982 |
Occupancy by Householder Income Bracket in Royal Palm Estates
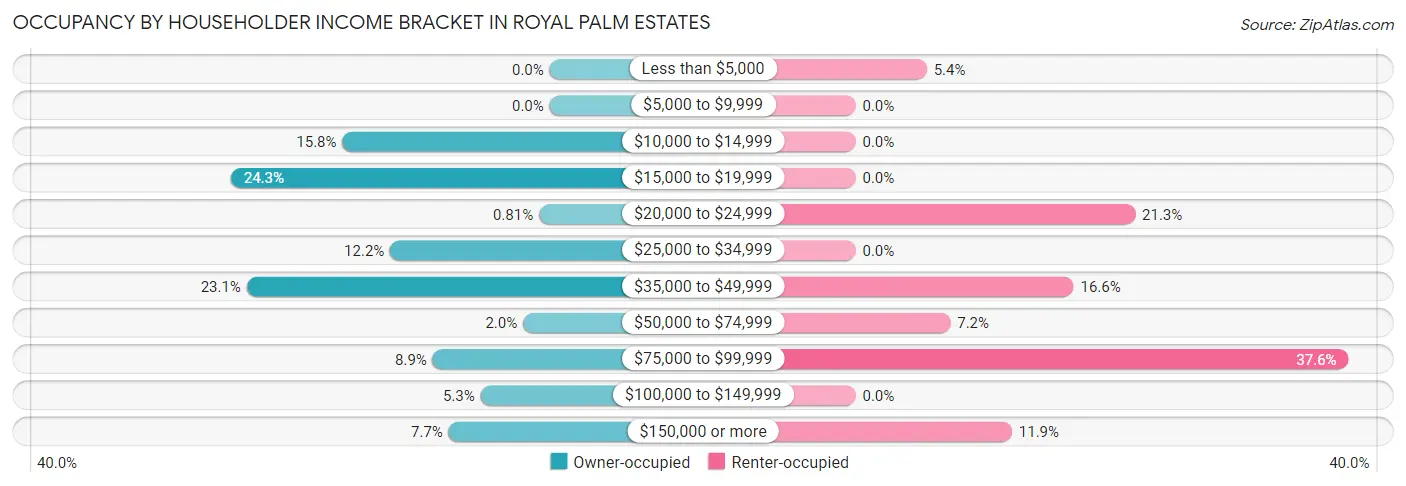
| Income Bracket | Owner-occupied | Renter-occupied |
| Less than $5,000 | 0 (0.0%) | 15 (5.4%) |
| $5,000 to $9,999 | 0 (0.0%) | 0 (0.0%) |
| $10,000 to $14,999 | 39 (15.8%) | 0 (0.0%) |
| $15,000 to $19,999 | 60 (24.3%) | 0 (0.0%) |
| $20,000 to $24,999 | 2 (0.8%) | 59 (21.3%) |
| $25,000 to $34,999 | 30 (12.1%) | 0 (0.0%) |
| $35,000 to $49,999 | 57 (23.1%) | 46 (16.6%) |
| $50,000 to $74,999 | 5 (2.0%) | 20 (7.2%) |
| $75,000 to $99,999 | 22 (8.9%) | 104 (37.6%) |
| $100,000 to $149,999 | 13 (5.3%) | 0 (0.0%) |
| $150,000 or more | 19 (7.7%) | 33 (11.9%) |
| Total | 247 (100.0%) | 277 (100.0%) |
Monthly Housing Cost Tiers in Royal Palm Estates
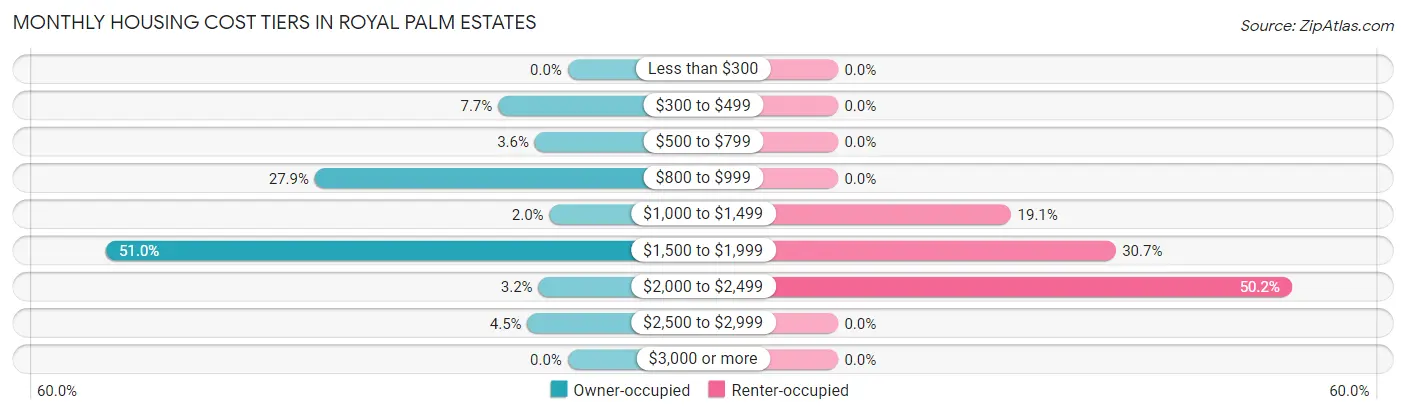
| Monthly Cost | Owner-occupied | Renter-occupied |
| Less than $300 | 0 (0.0%) | 0 (0.0%) |
| $300 to $499 | 19 (7.7%) | 0 (0.0%) |
| $500 to $799 | 9 (3.6%) | 0 (0.0%) |
| $800 to $999 | 69 (27.9%) | 0 (0.0%) |
| $1,000 to $1,499 | 5 (2.0%) | 53 (19.1%) |
| $1,500 to $1,999 | 126 (51.0%) | 85 (30.7%) |
| $2,000 to $2,499 | 8 (3.2%) | 139 (50.2%) |
| $2,500 to $2,999 | 11 (4.4%) | 0 (0.0%) |
| $3,000 or more | 0 (0.0%) | 0 (0.0%) |
| Total | 247 (100.0%) | 277 (100.0%) |
Physical Housing Characteristics in Royal Palm Estates
Housing Structures in Royal Palm Estates
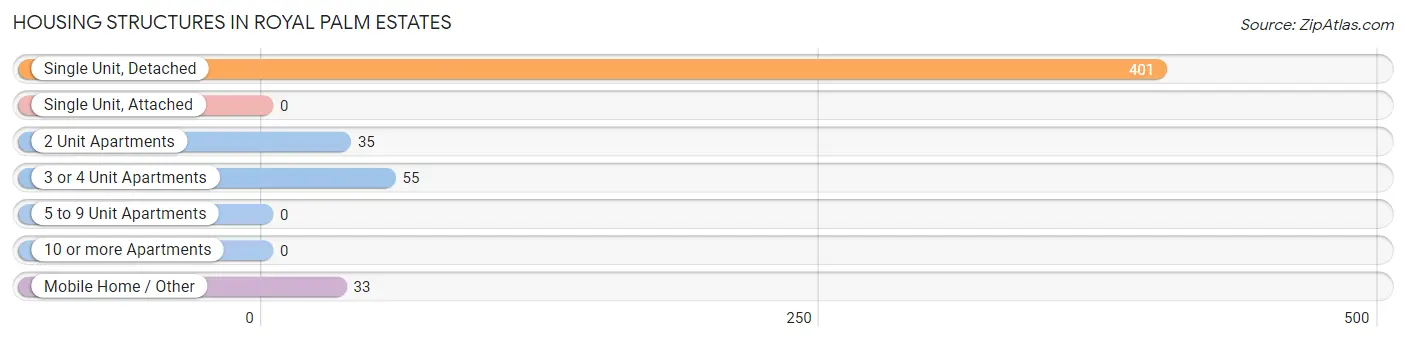
| Structure Type | # Housing Units | % Housing Units |
| Single Unit, Detached | 401 | 76.5% |
| Single Unit, Attached | 0 | 0.0% |
| 2 Unit Apartments | 35 | 6.7% |
| 3 or 4 Unit Apartments | 55 | 10.5% |
| 5 to 9 Unit Apartments | 0 | 0.0% |
| 10 or more Apartments | 0 | 0.0% |
| Mobile Home / Other | 33 | 6.3% |
| Total | 524 | 100.0% |
Housing Structures by Occupancy in Royal Palm Estates
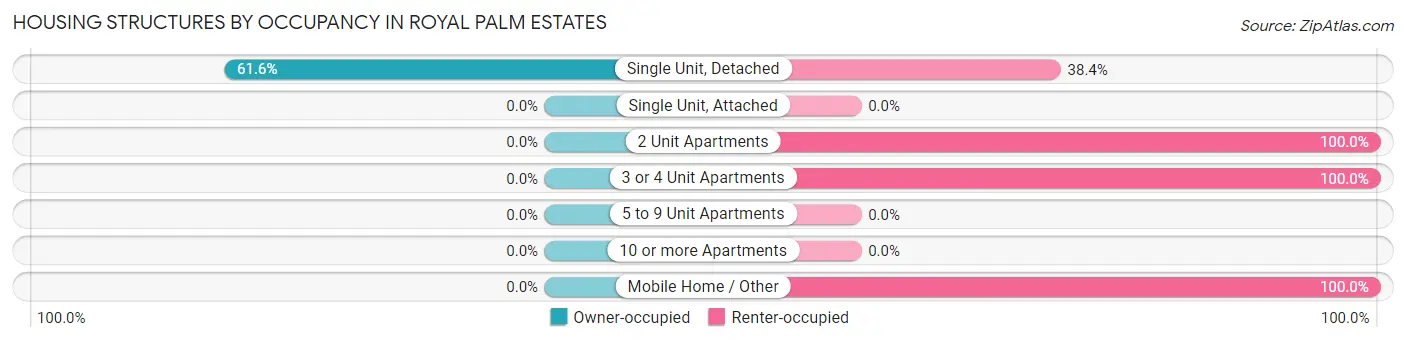
| Structure Type | Owner-occupied | Renter-occupied |
| Single Unit, Detached | 247 (61.6%) | 154 (38.4%) |
| Single Unit, Attached | 0 (0.0%) | 0 (0.0%) |
| 2 Unit Apartments | 0 (0.0%) | 35 (100.0%) |
| 3 or 4 Unit Apartments | 0 (0.0%) | 55 (100.0%) |
| 5 to 9 Unit Apartments | 0 (0.0%) | 0 (0.0%) |
| 10 or more Apartments | 0 (0.0%) | 0 (0.0%) |
| Mobile Home / Other | 0 (0.0%) | 33 (100.0%) |
| Total | 247 (47.1%) | 277 (52.9%) |
Housing Structures by Number of Rooms in Royal Palm Estates
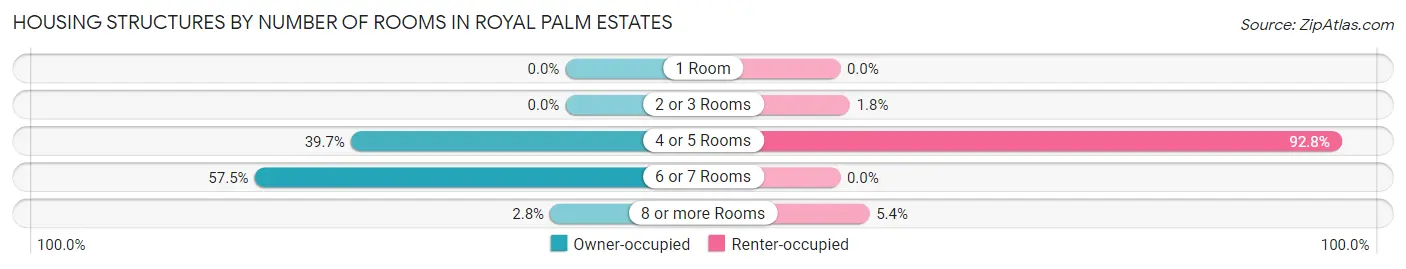
| Number of Rooms | Owner-occupied | Renter-occupied |
| 1 Room | 0 (0.0%) | 0 (0.0%) |
| 2 or 3 Rooms | 0 (0.0%) | 5 (1.8%) |
| 4 or 5 Rooms | 98 (39.7%) | 257 (92.8%) |
| 6 or 7 Rooms | 142 (57.5%) | 0 (0.0%) |
| 8 or more Rooms | 7 (2.8%) | 15 (5.4%) |
| Total | 247 (100.0%) | 277 (100.0%) |
Housing Structure by Heating Type in Royal Palm Estates
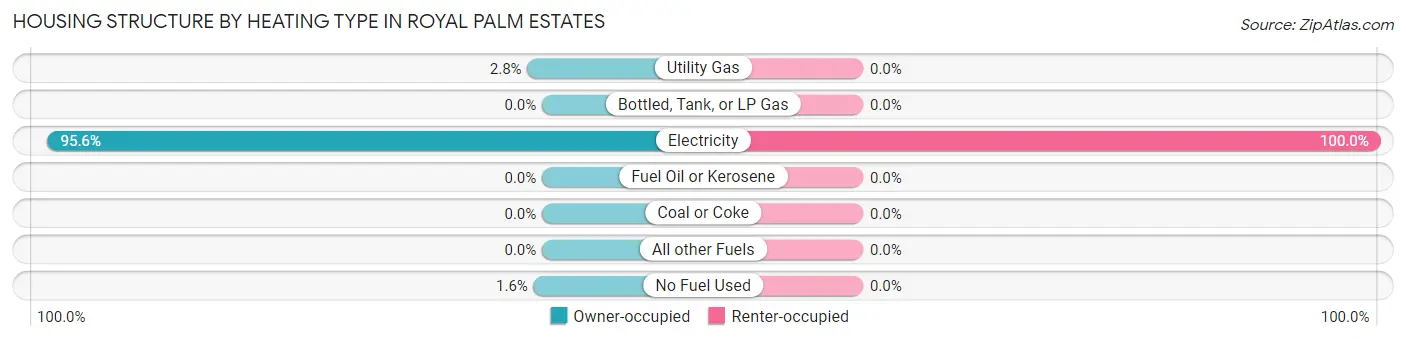
| Heating Type | Owner-occupied | Renter-occupied |
| Utility Gas | 7 (2.8%) | 0 (0.0%) |
| Bottled, Tank, or LP Gas | 0 (0.0%) | 0 (0.0%) |
| Electricity | 236 (95.6%) | 277 (100.0%) |
| Fuel Oil or Kerosene | 0 (0.0%) | 0 (0.0%) |
| Coal or Coke | 0 (0.0%) | 0 (0.0%) |
| All other Fuels | 0 (0.0%) | 0 (0.0%) |
| No Fuel Used | 4 (1.6%) | 0 (0.0%) |
| Total | 247 (100.0%) | 277 (100.0%) |
Household Vehicle Usage in Royal Palm Estates
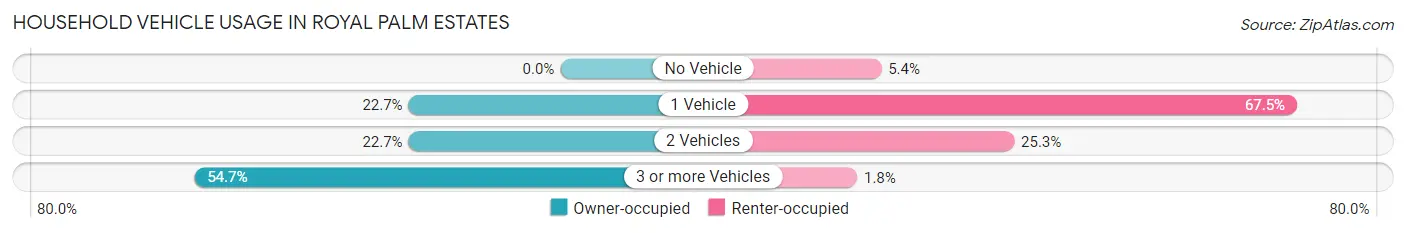
| Vehicles per Household | Owner-occupied | Renter-occupied |
| No Vehicle | 0 (0.0%) | 15 (5.4%) |
| 1 Vehicle | 56 (22.7%) | 187 (67.5%) |
| 2 Vehicles | 56 (22.7%) | 70 (25.3%) |
| 3 or more Vehicles | 135 (54.7%) | 5 (1.8%) |
| Total | 247 (100.0%) | 277 (100.0%) |
Real Estate & Mortgages in Royal Palm Estates
Real Estate and Mortgage Overview in Royal Palm Estates
| Characteristic | Without Mortgage | With Mortgage |
| Housing Units | 19 | 228 |
| Median Property Value | - | - |
| Median Household Income | - | - |
| Monthly Housing Costs | - | - |
| Real Estate Taxes | - | - |
Property Value by Mortgage Status in Royal Palm Estates
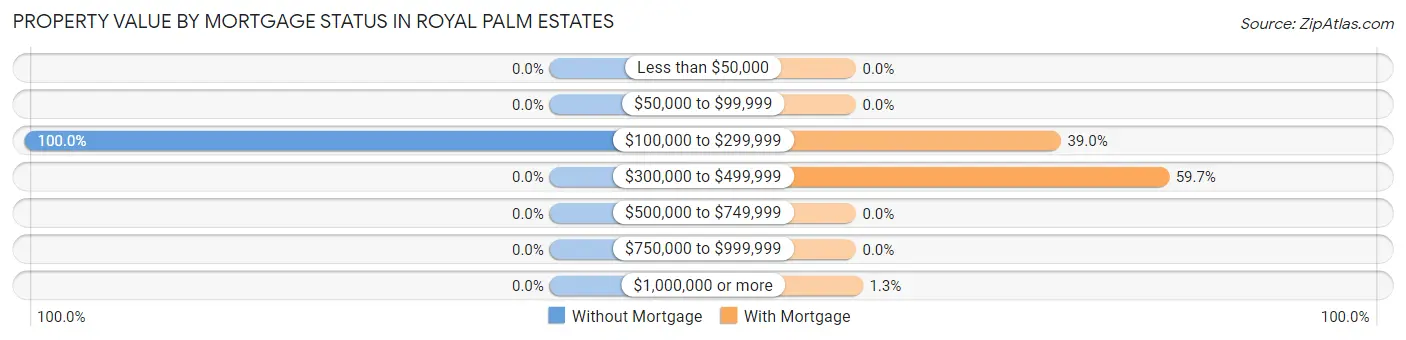
| Property Value | Without Mortgage | With Mortgage |
| Less than $50,000 | 0 (0.0%) | 0 (0.0%) |
| $50,000 to $99,999 | 0 (0.0%) | 0 (0.0%) |
| $100,000 to $299,999 | 19 (100.0%) | 89 (39.0%) |
| $300,000 to $499,999 | 0 (0.0%) | 136 (59.7%) |
| $500,000 to $749,999 | 0 (0.0%) | 0 (0.0%) |
| $750,000 to $999,999 | 0 (0.0%) | 0 (0.0%) |
| $1,000,000 or more | 0 (0.0%) | 3 (1.3%) |
| Total | 19 (100.0%) | 228 (100.0%) |
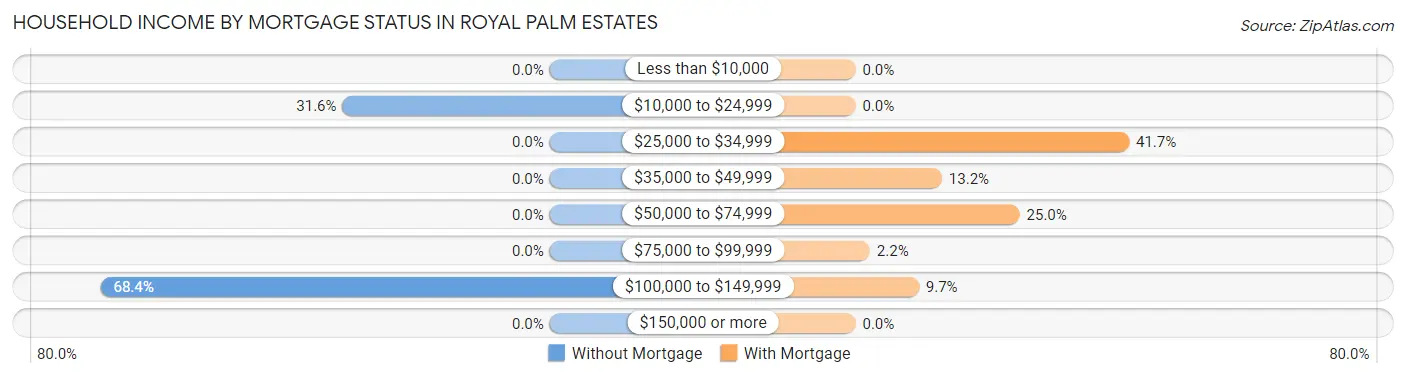
Household Income by Mortgage Status in Royal Palm Estates
| Household Income | Without Mortgage | With Mortgage |
| Less than $10,000 | 0 (0.0%) | 0 (0.0%) |
| $10,000 to $24,999 | 6 (31.6%) | 0 (0.0%) |
| $25,000 to $34,999 | 0 (0.0%) | 95 (41.7%) |
| $35,000 to $49,999 | 0 (0.0%) | 30 (13.2%) |
| $50,000 to $74,999 | 0 (0.0%) | 57 (25.0%) |
| $75,000 to $99,999 | 0 (0.0%) | 5 (2.2%) |
| $100,000 to $149,999 | 13 (68.4%) | 22 (9.7%) |
| $150,000 or more | 0 (0.0%) | 0 (0.0%) |
| Total | 19 (100.0%) | 228 (100.0%) |
Property Value to Household Income Ratio in Royal Palm Estates
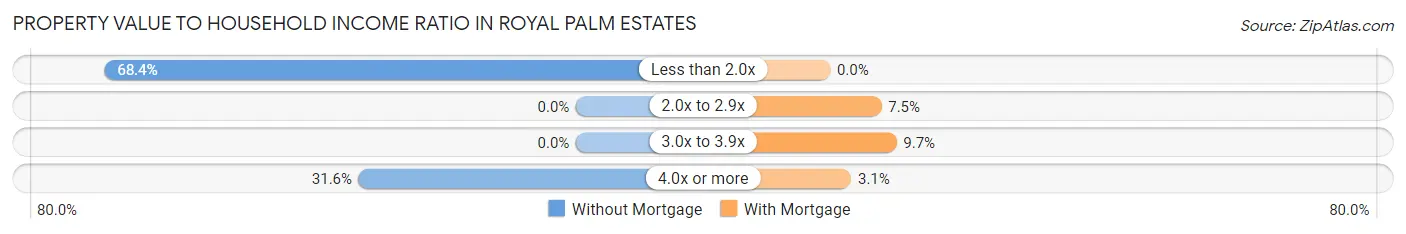
| Value-to-Income Ratio | Without Mortgage | With Mortgage |
| Less than 2.0x | 13 (68.4%) | 0 (0.0%) |
| 2.0x to 2.9x | 0 (0.0%) | 17 (7.5%) |
| 3.0x to 3.9x | 0 (0.0%) | 22 (9.7%) |
| 4.0x or more | 6 (31.6%) | 7 (3.1%) |
| Total | 19 (100.0%) | 228 (100.0%) |
Real Estate Taxes by Mortgage Status in Royal Palm Estates
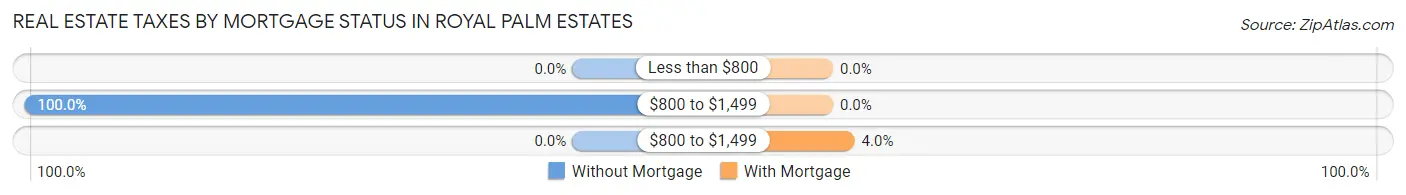
| Property Taxes | Without Mortgage | With Mortgage |
| Less than $800 | 0 (0.0%) | 0 (0.0%) |
| $800 to $1,499 | 19 (100.0%) | 0 (0.0%) |
| $800 to $1,499 | 0 (0.0%) | 9 (4.0%) |
| Total | 19 (100.0%) | 228 (100.0%) |
Health & Disability in Royal Palm Estates
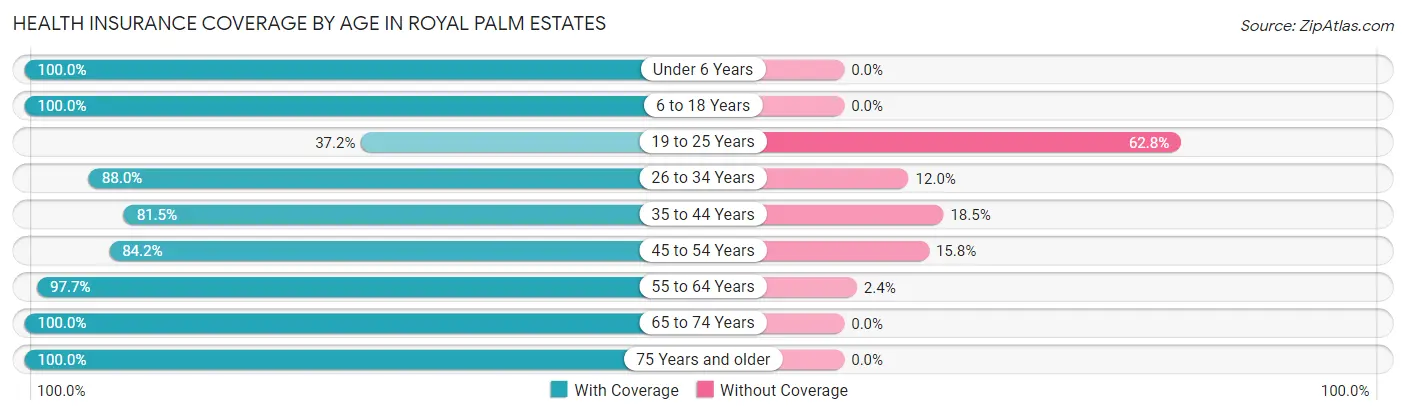
Health Insurance Coverage by Age in Royal Palm Estates
| Age Bracket | With Coverage | Without Coverage |
| Under 6 Years | 69 (100.0%) | 0 (0.0%) |
| 6 to 18 Years | 404 (100.0%) | 0 (0.0%) |
| 19 to 25 Years | 99 (37.2%) | 167 (62.8%) |
| 26 to 34 Years | 88 (88.0%) | 12 (12.0%) |
| 35 to 44 Years | 282 (81.5%) | 64 (18.5%) |
| 45 to 54 Years | 160 (84.2%) | 30 (15.8%) |
| 55 to 64 Years | 249 (97.7%) | 6 (2.4%) |
| 65 to 74 Years | 86 (100.0%) | 0 (0.0%) |
| 75 Years and older | 43 (100.0%) | 0 (0.0%) |
| Total | 1,480 (84.1%) | 279 (15.9%) |
Health Insurance Coverage by Citizenship Status in Royal Palm Estates
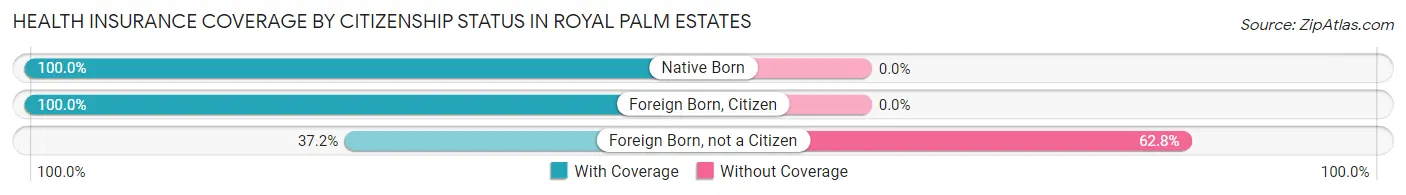
| Citizenship Status | With Coverage | Without Coverage |
| Native Born | 69 (100.0%) | 0 (0.0%) |
| Foreign Born, Citizen | 404 (100.0%) | 0 (0.0%) |
| Foreign Born, not a Citizen | 99 (37.2%) | 167 (62.8%) |
Health Insurance Coverage by Household Income in Royal Palm Estates
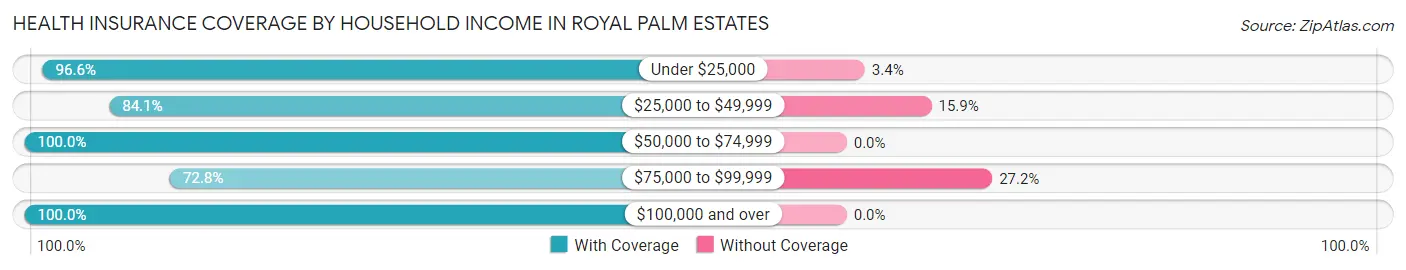
| Household Income | With Coverage | Without Coverage |
| Under $25,000 | 399 (96.6%) | 14 (3.4%) |
| $25,000 to $49,999 | 339 (84.1%) | 64 (15.9%) |
| $50,000 to $74,999 | 66 (100.0%) | 0 (0.0%) |
| $75,000 to $99,999 | 537 (72.8%) | 201 (27.2%) |
| $100,000 and over | 128 (100.0%) | 0 (0.0%) |
Public vs Private Health Insurance Coverage by Age in Royal Palm Estates
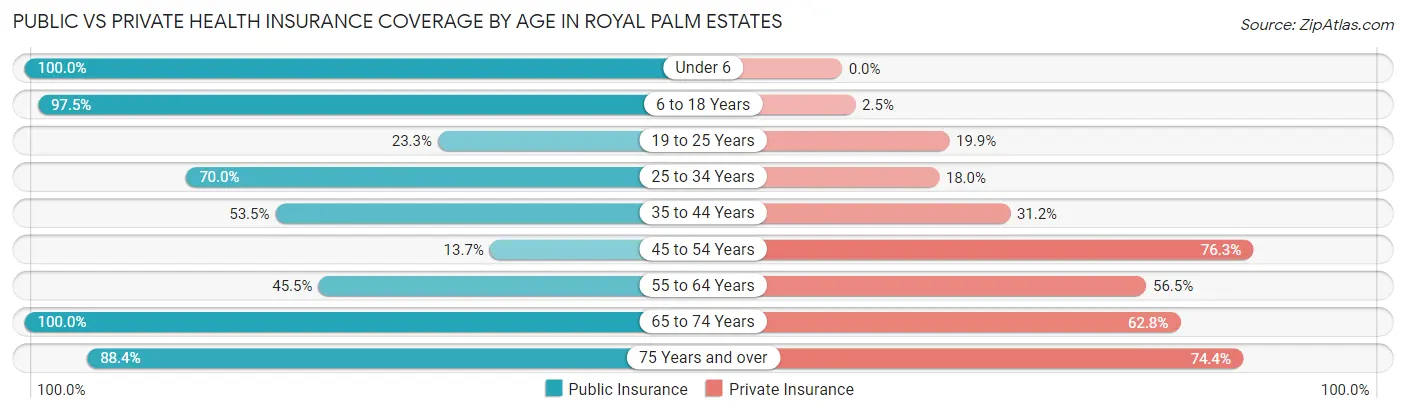
| Age Bracket | Public Insurance | Private Insurance |
| Under 6 | 69 (100.0%) | 0 (0.0%) |
| 6 to 18 Years | 394 (97.5%) | 10 (2.5%) |
| 19 to 25 Years | 62 (23.3%) | 53 (19.9%) |
| 25 to 34 Years | 70 (70.0%) | 18 (18.0%) |
| 35 to 44 Years | 185 (53.5%) | 108 (31.2%) |
| 45 to 54 Years | 26 (13.7%) | 145 (76.3%) |
| 55 to 64 Years | 116 (45.5%) | 144 (56.5%) |
| 65 to 74 Years | 86 (100.0%) | 54 (62.8%) |
| 75 Years and over | 38 (88.4%) | 32 (74.4%) |
| Total | 1,046 (59.5%) | 564 (32.1%) |
Disability Status by Sex by Age in Royal Palm Estates
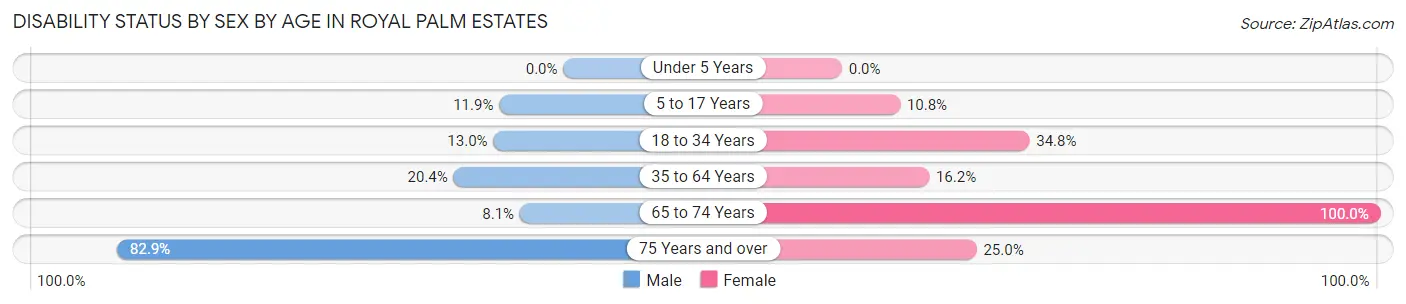
| Age Bracket | Male | Female |
| Under 5 Years | 0 (0.0%) | 0 (0.0%) |
| 5 to 17 Years | 15 (11.9%) | 30 (10.8%) |
| 18 to 34 Years | 27 (13.0%) | 55 (34.8%) |
| 35 to 64 Years | 78 (20.4%) | 66 (16.2%) |
| 65 to 74 Years | 5 (8.1%) | 24 (100.0%) |
| 75 Years and over | 29 (82.9%) | 2 (25.0%) |
Disability Class by Sex by Age in Royal Palm Estates
Disability Class: Hearing Difficulty
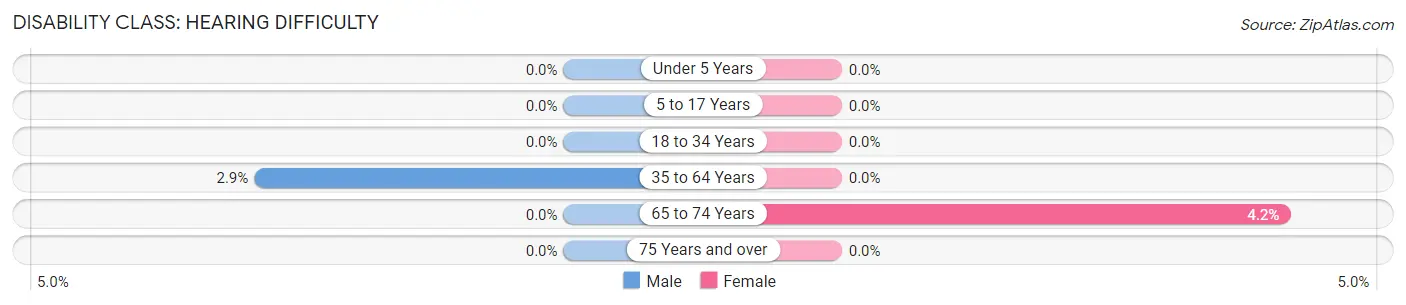
| Age Bracket | Male | Female |
| Under 5 Years | 0 (0.0%) | 0 (0.0%) |
| 5 to 17 Years | 0 (0.0%) | 0 (0.0%) |
| 18 to 34 Years | 0 (0.0%) | 0 (0.0%) |
| 35 to 64 Years | 11 (2.9%) | 0 (0.0%) |
| 65 to 74 Years | 0 (0.0%) | 1 (4.2%) |
| 75 Years and over | 0 (0.0%) | 0 (0.0%) |
Disability Class: Vision Difficulty
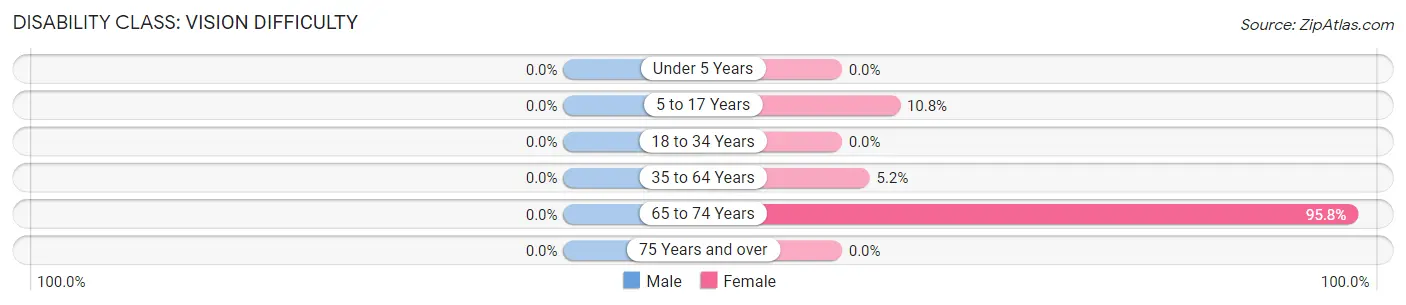
| Age Bracket | Male | Female |
| Under 5 Years | 0 (0.0%) | 0 (0.0%) |
| 5 to 17 Years | 0 (0.0%) | 30 (10.8%) |
| 18 to 34 Years | 0 (0.0%) | 0 (0.0%) |
| 35 to 64 Years | 0 (0.0%) | 21 (5.1%) |
| 65 to 74 Years | 0 (0.0%) | 23 (95.8%) |
| 75 Years and over | 0 (0.0%) | 0 (0.0%) |
Disability Class: Cognitive Difficulty
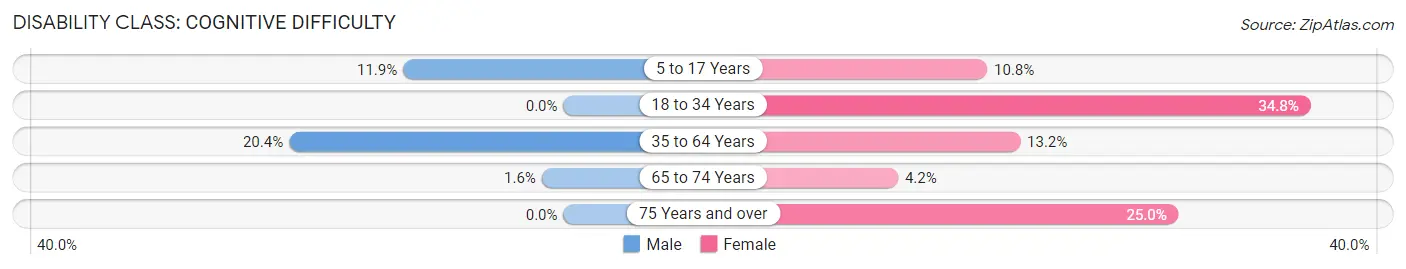
| Age Bracket | Male | Female |
| 5 to 17 Years | 15 (11.9%) | 30 (10.8%) |
| 18 to 34 Years | 0 (0.0%) | 55 (34.8%) |
| 35 to 64 Years | 78 (20.4%) | 54 (13.2%) |
| 65 to 74 Years | 1 (1.6%) | 1 (4.2%) |
| 75 Years and over | 0 (0.0%) | 2 (25.0%) |
Disability Class: Ambulatory Difficulty
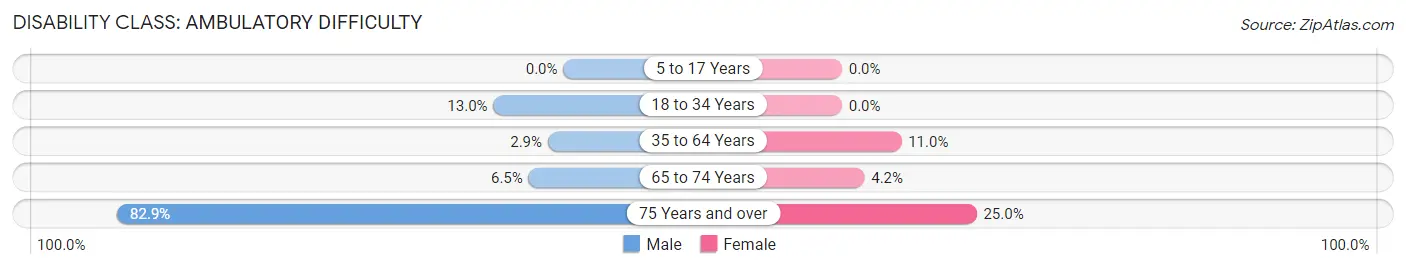
| Age Bracket | Male | Female |
| 5 to 17 Years | 0 (0.0%) | 0 (0.0%) |
| 18 to 34 Years | 27 (13.0%) | 0 (0.0%) |
| 35 to 64 Years | 11 (2.9%) | 45 (11.0%) |
| 65 to 74 Years | 4 (6.5%) | 1 (4.2%) |
| 75 Years and over | 29 (82.9%) | 2 (25.0%) |
Disability Class: Self-Care Difficulty
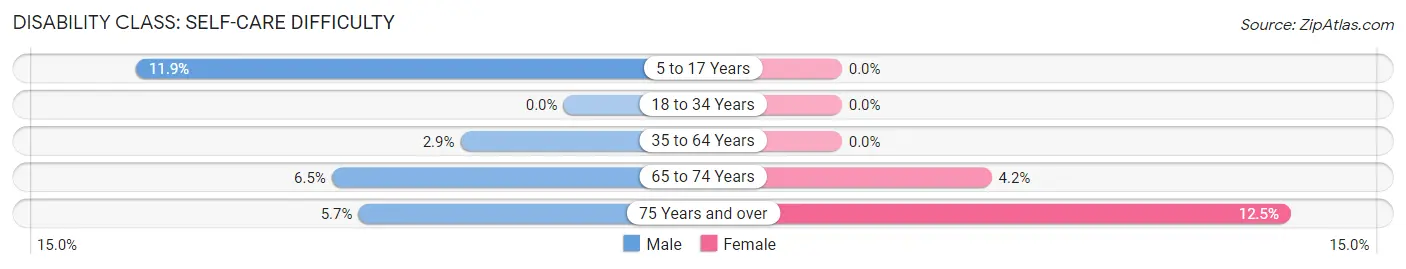
| Age Bracket | Male | Female |
| 5 to 17 Years | 15 (11.9%) | 0 (0.0%) |
| 18 to 34 Years | 0 (0.0%) | 0 (0.0%) |
| 35 to 64 Years | 11 (2.9%) | 0 (0.0%) |
| 65 to 74 Years | 4 (6.5%) | 1 (4.2%) |
| 75 Years and over | 2 (5.7%) | 1 (12.5%) |
Technology Access in Royal Palm Estates
Computing Device Access in Royal Palm Estates
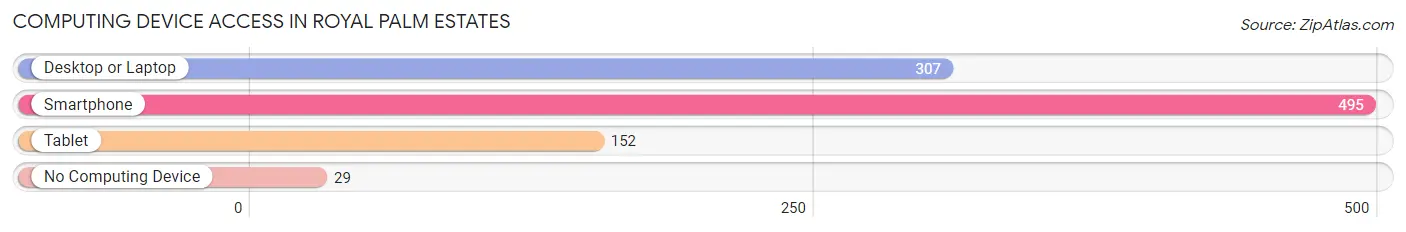
| Device Type | # Households | % Households |
| Desktop or Laptop | 307 | 58.6% |
| Smartphone | 495 | 94.5% |
| Tablet | 152 | 29.0% |
| No Computing Device | 29 | 5.5% |
| Total | 524 | 100.0% |
Internet Access in Royal Palm Estates
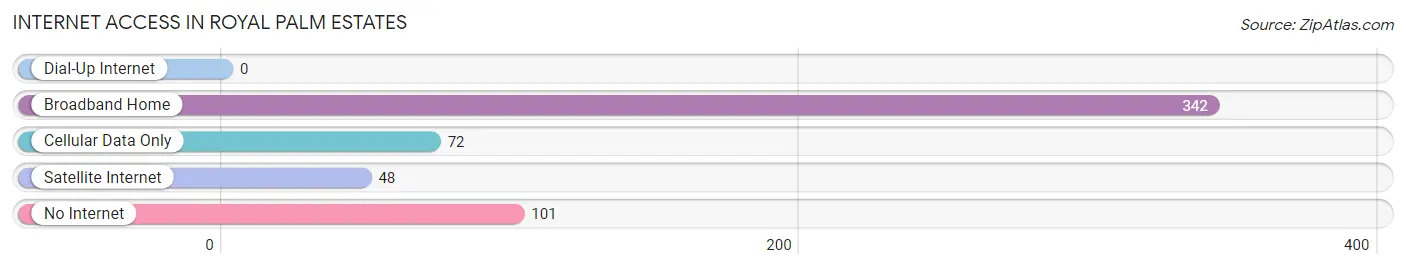
| Internet Type | # Households | % Households |
| Dial-Up Internet | 0 | 0.0% |
| Broadband Home | 342 | 65.3% |
| Cellular Data Only | 72 | 13.7% |
| Satellite Internet | 48 | 9.2% |
| No Internet | 101 | 19.3% |
| Total | 524 | 100.0% |
Royal Palm Estates Summary
Palm Beach County, Florida is home to the unincorporated community of Royal Palm Estates. Located in the southeastern corner of the county, Royal Palm Estates is a small, rural community with a population of just over 1,000 people. The community is situated on the edge of the Everglades and is surrounded by a variety of natural habitats, including wetlands, pine flatwoods, and cypress swamps.
History
The area that is now Royal Palm Estates was originally inhabited by the Tequesta Indians, who lived in the area for thousands of years before the arrival of Europeans. The first Europeans to settle in the area were Spanish explorers, who arrived in the late 1500s. The area was later settled by the Seminole Indians, who were forced to relocate to the area after being driven out of their original homelands in Georgia and Alabama.
In the late 1800s, the area was developed as a farming community, with the first settlers arriving in the early 1900s. The area was originally known as “Royal Palm Farms” and was home to a variety of crops, including tomatoes, beans, and citrus fruits. The area was also home to a number of dairy farms, which provided milk and other dairy products to the local population.
In the 1950s, the area began to experience rapid growth as more people moved to the area. The population of Royal Palm Estates grew from just over 500 people in 1950 to over 1,000 people by the year 2000.
Geography
Royal Palm Estates is located in the southeastern corner of Palm Beach County, Florida. The community is situated on the edge of the Everglades and is surrounded by a variety of natural habitats, including wetlands, pine flatwoods, and cypress swamps. The area is also home to a number of lakes, including Lake Okeechobee, Lake Ida, and Lake Osborne.
The climate in Royal Palm Estates is subtropical, with hot, humid summers and mild, dry winters. The average temperature in the summer months is around 90 degrees Fahrenheit, while the average temperature in the winter months is around 70 degrees Fahrenheit.
Economy
The economy of Royal Palm Estates is largely based on agriculture and tourism. The area is home to a number of farms, which produce a variety of crops, including tomatoes, beans, and citrus fruits. The area is also home to a number of dairy farms, which provide milk and other dairy products to the local population.
In addition to agriculture, the area is also home to a number of tourist attractions, including the Everglades National Park, the John D. MacArthur Beach State Park, and the Loxahatchee National Wildlife Refuge. The area is also home to a number of golf courses, which attract visitors from all over the world.
Demographics
As of the 2010 census, the population of Royal Palm Estates was 1,072. The racial makeup of the community was 94.3% White, 1.7% African American, 0.3% Native American, 0.7% Asian, 0.1% Pacific Islander, and 2.9% from other races. The median household income in the area was $45,938, and the median home value was $179,000.
Conclusion
Royal Palm Estates is a small, rural community located in the southeastern corner of Palm Beach County, Florida. The area is home to a variety of natural habitats, including wetlands, pine flatwoods, and cypress swamps. The economy of the area is largely based on agriculture and tourism, and the area is home to a number of tourist attractions, including the Everglades National Park, the John D. MacArthur Beach State Park, and the Loxahatchee National Wildlife Refuge. The population of Royal Palm Estates is just over 1,000 people, and the median household income is $45,938.
Common Questions
What is Per Capita Income in Royal Palm Estates?
Per Capita income in Royal Palm Estates is $18,485.
What is the Median Family Income in Royal Palm Estates?
Median Family Income in Royal Palm Estates is $33,864.
What is the Median Household income in Royal Palm Estates?
Median Household Income in Royal Palm Estates is $47,982.
What is Income or Wage Gap in Royal Palm Estates?
Income or Wage Gap in Royal Palm Estates is 25.6%.
Women in Royal Palm Estates earn 74.4 cents for every dollar earned by a man.
What is Inequality or Gini Index in Royal Palm Estates?
Inequality or Gini Index in Royal Palm Estates is 0.41.
What is the Total Population of Royal Palm Estates?
Total Population of Royal Palm Estates is 1,759.
What is the Total Male Population of Royal Palm Estates?
Total Male Population of Royal Palm Estates is 814.
What is the Total Female Population of Royal Palm Estates?
Total Female Population of Royal Palm Estates is 945.
What is the Ratio of Males per 100 Females in Royal Palm Estates?
There are 86.14 Males per 100 Females in Royal Palm Estates.
What is the Ratio of Females per 100 Males in Royal Palm Estates?
There are 116.09 Females per 100 Males in Royal Palm Estates.
What is the Median Population Age in Royal Palm Estates?
Median Population Age in Royal Palm Estates is 35.7 Years.
What is the Average Family Size in Royal Palm Estates
Average Family Size in Royal Palm Estates is 3.9 People.
What is the Average Household Size in Royal Palm Estates
Average Household Size in Royal Palm Estates is 3.3 People.
How Large is the Labor Force in Royal Palm Estates?
There are 816 People in the Labor Forcein in Royal Palm Estates.
What is the Percentage of People in the Labor Force in Royal Palm Estates?
59.3% of People are in the Labor Force in Royal Palm Estates.
What is the Unemployment Rate in Royal Palm Estates?
Unemployment Rate in Royal Palm Estates is 7.1%.