South Paris, ME Map & Demographics
South Paris Map
South Paris Overview
$24,727
PER CAPITA INCOME
$49,861
AVG FAMILY INCOME
$42,321
AVG HOUSEHOLD INCOME
27.9%
WAGE / INCOME GAP [ % ]
72.1¢/ $1
WAGE / INCOME GAP [ $ ]
0.43
INEQUALITY / GINI INDEX
2,208
TOTAL POPULATION
1,049
MALE POPULATION
1,159
FEMALE POPULATION
90.51
MALES / 100 FEMALES
110.49
FEMALES / 100 MALES
39.5
MEDIAN AGE
2.9
AVG FAMILY SIZE
2.1
AVG HOUSEHOLD SIZE
971
LABOR FORCE [ PEOPLE ]
60.0%
PERCENT IN LABOR FORCE
2.8%
UNEMPLOYMENT RATE
South Paris Zip Codes
South Paris Area Codes
Income in South Paris
Income Overview in South Paris
Per Capita Income in South Paris is $24,727, while median incomes of families and households are $49,861 and $42,321 respectively.
| Characteristic | Number | Measure |
| Per Capita Income | 2,208 | $24,727 |
| Median Family Income | 483 | $49,861 |
| Mean Family Income | 483 | $64,552 |
| Median Household Income | 986 | $42,321 |
| Mean Household Income | 986 | $53,133 |
| Income Deficit | 483 | $0 |
| Wage / Income Gap (%) | 2,208 | 27.88% |
| Wage / Income Gap ($) | 2,208 | 72.12¢ per $1 |
| Gini / Inequality Index | 2,208 | 0.43 |
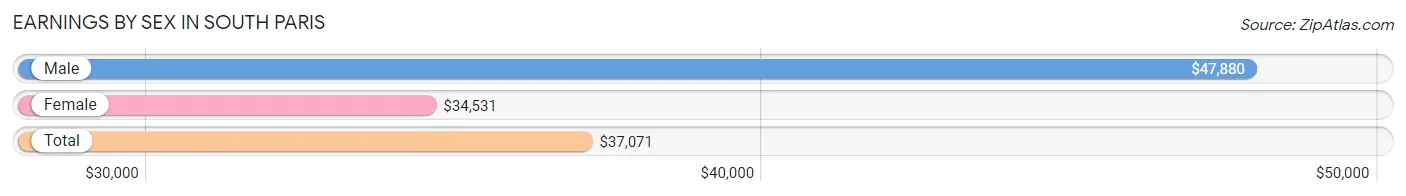
Earnings by Sex in South Paris
Average Earnings in South Paris are $37,071, $47,880 for men and $34,531 for women, a difference of 27.9%.
| Sex | Number | Average Earnings |
| Male | 499 (51.1%) | $47,880 |
| Female | 477 (48.9%) | $34,531 |
| Total | 976 (100.0%) | $37,071 |
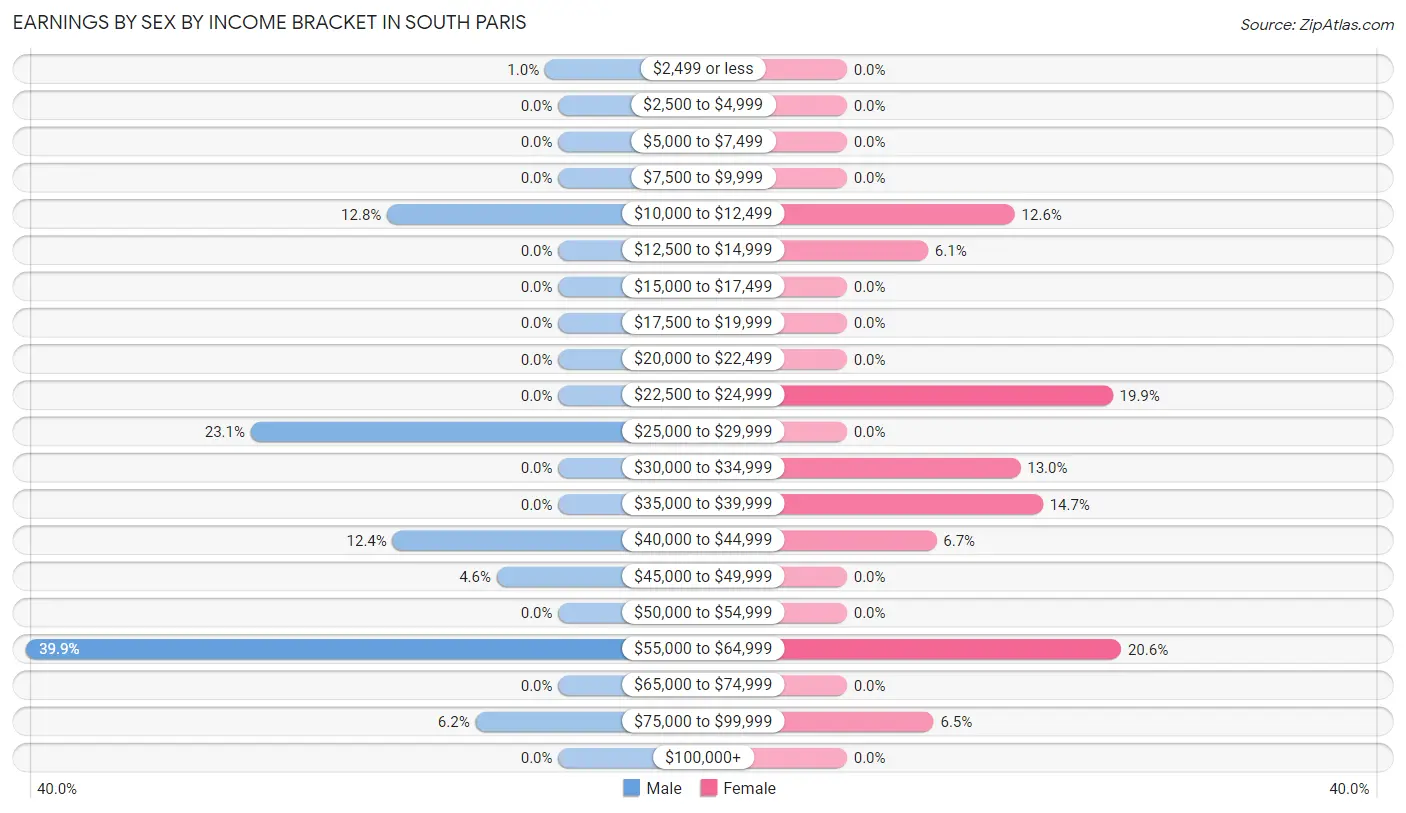
Earnings by Sex by Income Bracket in South Paris
The most common earnings brackets in South Paris are $55,000 to $64,999 for men (199 | 39.9%) and $55,000 to $64,999 for women (98 | 20.5%).
| Income | Male | Female |
| $2,499 or less | 5 (1.0%) | 0 (0.0%) |
| $2,500 to $4,999 | 0 (0.0%) | 0 (0.0%) |
| $5,000 to $7,499 | 0 (0.0%) | 0 (0.0%) |
| $7,500 to $9,999 | 0 (0.0%) | 0 (0.0%) |
| $10,000 to $12,499 | 64 (12.8%) | 60 (12.6%) |
| $12,500 to $14,999 | 0 (0.0%) | 29 (6.1%) |
| $15,000 to $17,499 | 0 (0.0%) | 0 (0.0%) |
| $17,500 to $19,999 | 0 (0.0%) | 0 (0.0%) |
| $20,000 to $22,499 | 0 (0.0%) | 0 (0.0%) |
| $22,500 to $24,999 | 0 (0.0%) | 95 (19.9%) |
| $25,000 to $29,999 | 115 (23.1%) | 0 (0.0%) |
| $30,000 to $34,999 | 0 (0.0%) | 62 (13.0%) |
| $35,000 to $39,999 | 0 (0.0%) | 70 (14.7%) |
| $40,000 to $44,999 | 62 (12.4%) | 32 (6.7%) |
| $45,000 to $49,999 | 23 (4.6%) | 0 (0.0%) |
| $50,000 to $54,999 | 0 (0.0%) | 0 (0.0%) |
| $55,000 to $64,999 | 199 (39.9%) | 98 (20.5%) |
| $65,000 to $74,999 | 0 (0.0%) | 0 (0.0%) |
| $75,000 to $99,999 | 31 (6.2%) | 31 (6.5%) |
| $100,000+ | 0 (0.0%) | 0 (0.0%) |
| Total | 499 (100.0%) | 477 (100.0%) |
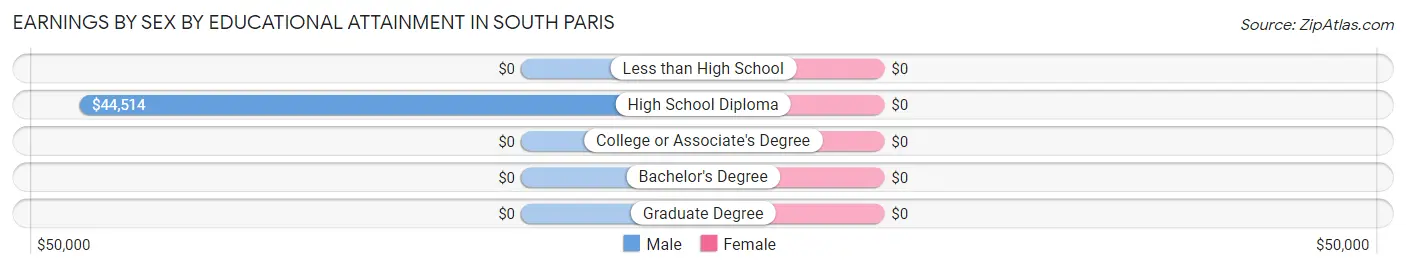
Earnings by Sex by Educational Attainment in South Paris
| Educational Attainment | Male Income | Female Income |
| Less than High School | - | - |
| High School Diploma | $44,514 | $0 |
| College or Associate's Degree | - | - |
| Bachelor's Degree | - | - |
| Graduate Degree | - | - |
| Total | $47,880 | $36,946 |
Family Income in South Paris
Family Income Brackets in South Paris
According to the South Paris family income data, there are 98 families falling into the $100,000 to $149,999 income range, which is the most common income bracket and makes up 20.3% of all families.
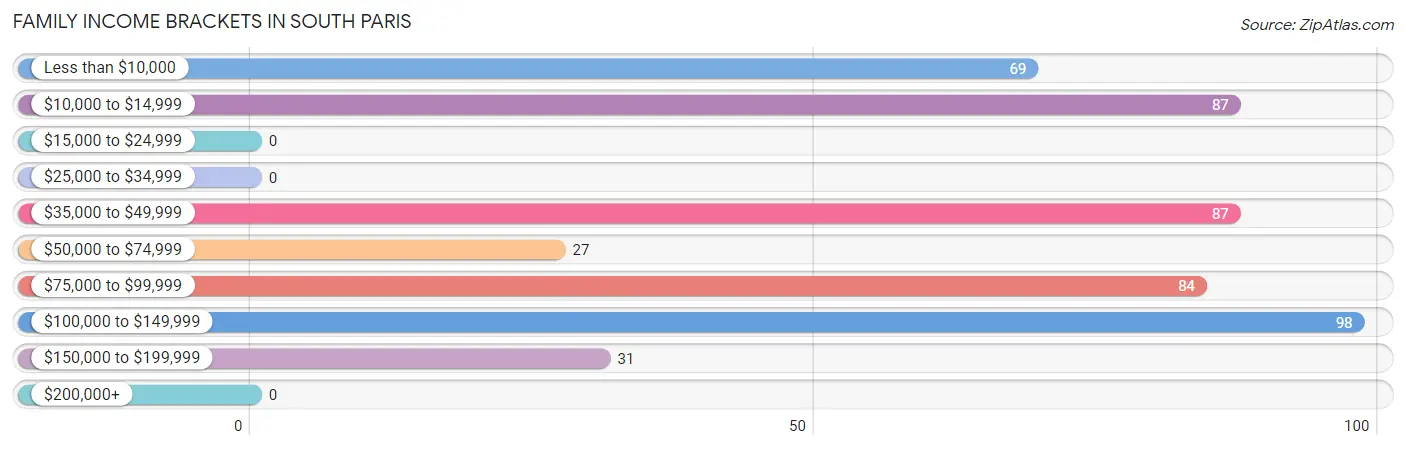
| Income Bracket | # Families | % Families |
| Less than $10,000 | 69 | 14.3% |
| $10,000 to $14,999 | 87 | 18.0% |
| $15,000 to $24,999 | 0 | 0.0% |
| $25,000 to $34,999 | 0 | 0.0% |
| $35,000 to $49,999 | 87 | 18.0% |
| $50,000 to $74,999 | 27 | 5.6% |
| $75,000 to $99,999 | 84 | 17.4% |
| $100,000 to $149,999 | 98 | 20.3% |
| $150,000 to $199,999 | 31 | 6.4% |
| $200,000+ | 0 | 0.0% |
Family Income by Famaliy Size in South Paris
2-person families (206 | 42.6%) account for the highest median family income in South Paris with $87,935 per family, while 2-person families (206 | 42.6%) have the highest median income of $43,968 per family member.
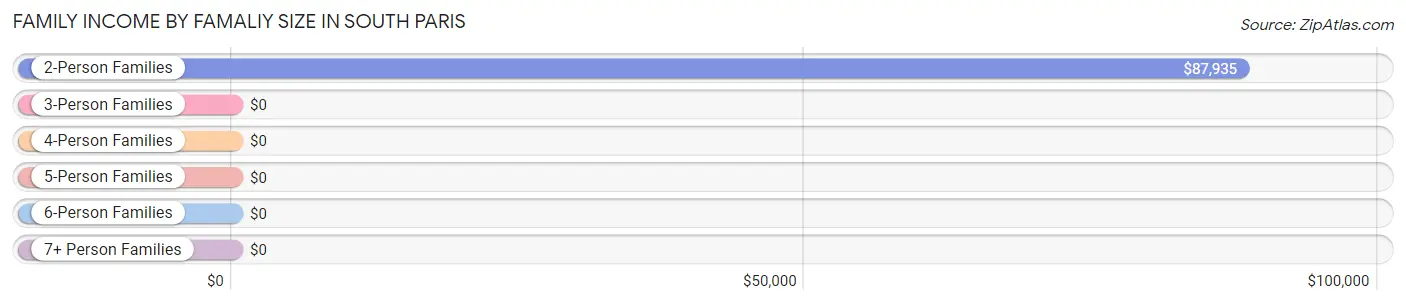
| Income Bracket | # Families | Median Income |
| 2-Person Families | 206 (42.6%) | $87,935 |
| 3-Person Families | 212 (43.9%) | $0 |
| 4-Person Families | 65 (13.5%) | $0 |
| 5-Person Families | 0 (0.0%) | $0 |
| 6-Person Families | 0 (0.0%) | $0 |
| 7+ Person Families | 0 (0.0%) | $0 |
| Total | 483 (100.0%) | $49,861 |
Family Income by Number of Earners in South Paris
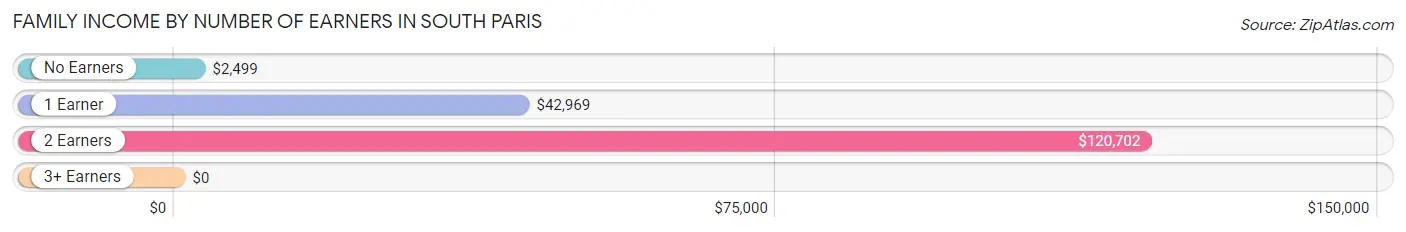
| Number of Earners | # Families | Median Income |
| No Earners | 115 (23.8%) | $2,499 |
| 1 Earner | 196 (40.6%) | $42,969 |
| 2 Earners | 141 (29.2%) | $120,702 |
| 3+ Earners | 31 (6.4%) | $0 |
| Total | 483 (100.0%) | $49,861 |
Household Income in South Paris
Household Income Brackets in South Paris
With 220 households falling in the category, the $15,000 to $24,999 income range is the most frequent in South Paris, accounting for 22.3% of all households.
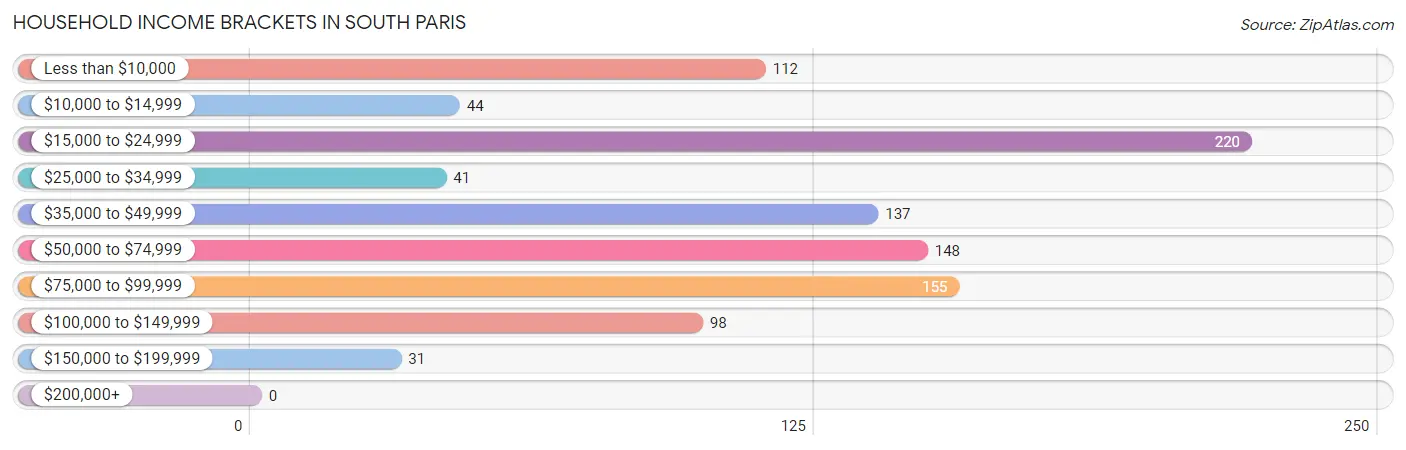
| Income Bracket | # Households | % Households |
| Less than $10,000 | 112 | 11.4% |
| $10,000 to $14,999 | 44 | 4.5% |
| $15,000 to $24,999 | 220 | 22.3% |
| $25,000 to $34,999 | 41 | 4.2% |
| $35,000 to $49,999 | 137 | 13.9% |
| $50,000 to $74,999 | 148 | 15.0% |
| $75,000 to $99,999 | 155 | 15.7% |
| $100,000 to $149,999 | 98 | 9.9% |
| $150,000 to $199,999 | 31 | 3.1% |
| $200,000+ | 0 | 0.0% |
Household Income by Householder Age in South Paris
The median household income in South Paris is $42,321, with the highest median household income of $65,750 found in the 45 to 64 years age bracket for the primary householder. A total of 265 households (26.9%) fall into this category. Meanwhile, the 15 to 24 years age bracket for the primary householder has the lowest median household income of $0, with 95 households (9.6%) in this group.
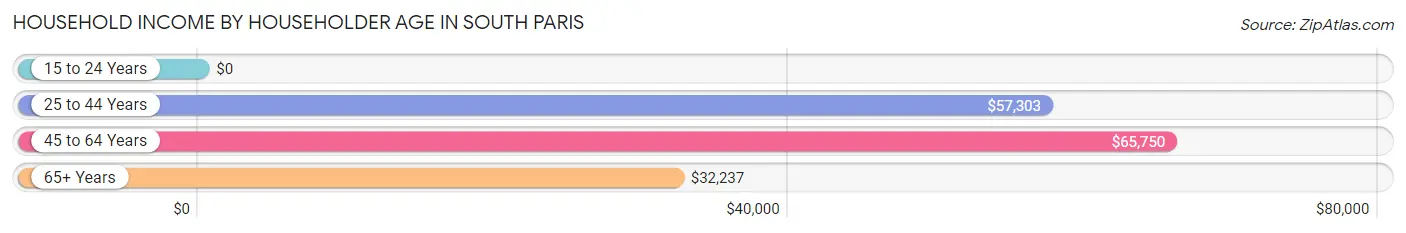
| Income Bracket | # Households | Median Income |
| 15 to 24 Years | 95 (9.6%) | $0 |
| 25 to 44 Years | 262 (26.6%) | $57,303 |
| 45 to 64 Years | 265 (26.9%) | $65,750 |
| 65+ Years | 364 (36.9%) | $32,237 |
| Total | 986 (100.0%) | $42,321 |
Poverty in South Paris
Income Below Poverty by Sex and Age in South Paris
With 28.6% poverty level for males and 32.9% for females among the residents of South Paris, under 5 year old males and under 5 year old females are the most vulnerable to poverty, with 87 males (100.0%) and 73 females (100.0%) in their respective age groups living below the poverty level.
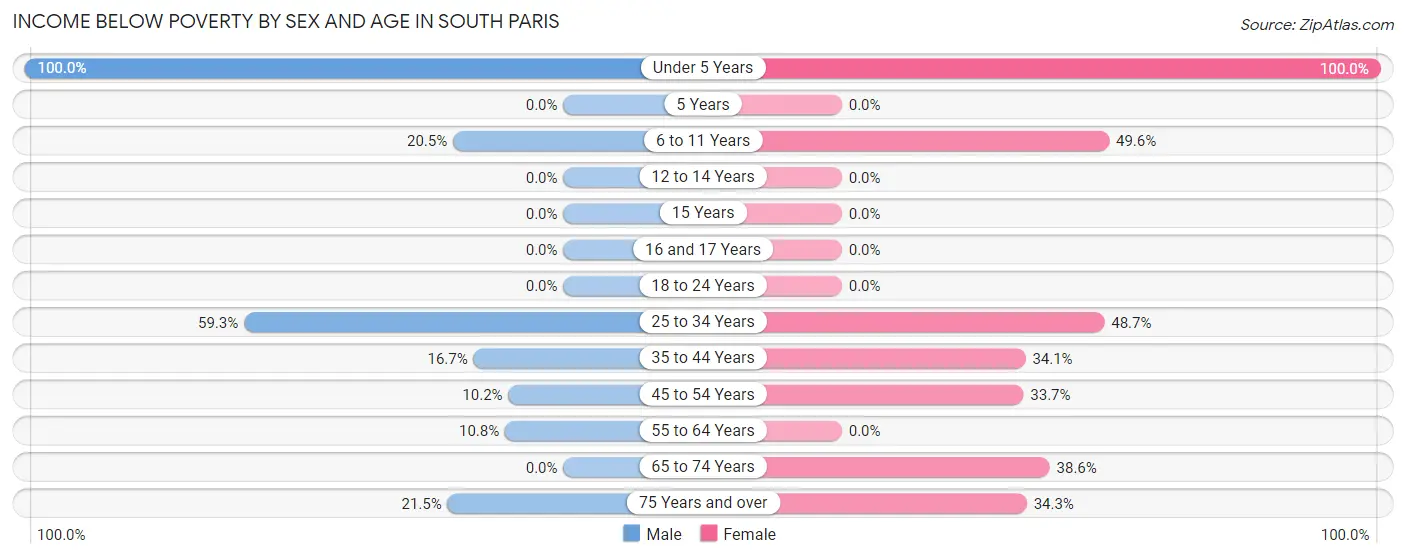
| Age Bracket | Male | Female |
| Under 5 Years | 87 (100.0%) | 73 (100.0%) |
| 5 Years | 0 (0.0%) | 0 (0.0%) |
| 6 to 11 Years | 35 (20.5%) | 64 (49.6%) |
| 12 to 14 Years | 0 (0.0%) | 0 (0.0%) |
| 15 Years | 0 (0.0%) | 0 (0.0%) |
| 16 and 17 Years | 0 (0.0%) | 0 (0.0%) |
| 18 to 24 Years | 0 (0.0%) | 0 (0.0%) |
| 25 to 34 Years | 64 (59.3%) | 38 (48.7%) |
| 35 to 44 Years | 26 (16.7%) | 60 (34.1%) |
| 45 to 54 Years | 5 (10.2%) | 31 (33.7%) |
| 55 to 64 Years | 21 (10.8%) | 0 (0.0%) |
| 65 to 74 Years | 0 (0.0%) | 27 (38.6%) |
| 75 Years and over | 23 (21.5%) | 81 (34.3%) |
| Total | 261 (28.6%) | 374 (32.9%) |
Income Above Poverty by Sex and Age in South Paris
According to the poverty statistics in South Paris, males aged 65 to 74 years and females aged 12 to 14 years are the age groups that are most secure financially, with 100.0% of males and 100.0% of females in these age groups living above the poverty line.
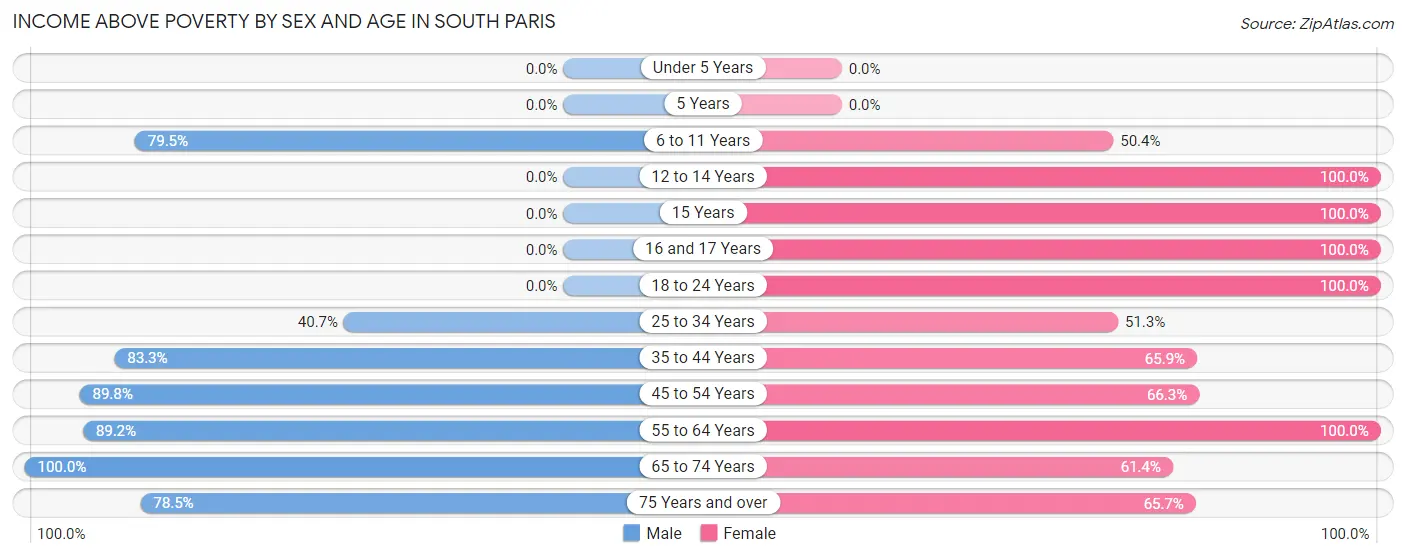
| Age Bracket | Male | Female |
| Under 5 Years | 0 (0.0%) | 0 (0.0%) |
| 5 Years | 0 (0.0%) | 0 (0.0%) |
| 6 to 11 Years | 136 (79.5%) | 65 (50.4%) |
| 12 to 14 Years | 0 (0.0%) | 29 (100.0%) |
| 15 Years | 0 (0.0%) | 26 (100.0%) |
| 16 and 17 Years | 0 (0.0%) | 29 (100.0%) |
| 18 to 24 Years | 0 (0.0%) | 95 (100.0%) |
| 25 to 34 Years | 44 (40.7%) | 40 (51.3%) |
| 35 to 44 Years | 130 (83.3%) | 116 (65.9%) |
| 45 to 54 Years | 44 (89.8%) | 61 (66.3%) |
| 55 to 64 Years | 173 (89.2%) | 104 (100.0%) |
| 65 to 74 Years | 39 (100.0%) | 43 (61.4%) |
| 75 Years and over | 84 (78.5%) | 155 (65.7%) |
| Total | 650 (71.4%) | 763 (67.1%) |
Income Below Poverty Among Married-Couple Families in South Paris
The poverty statistics for married-couple families in South Paris show that 18.3% or 54 of the total 295 families live below the poverty line. Families with no children have the highest poverty rate of 30.2%, comprising of 54 families. On the other hand, families with 1 or 2 children have the lowest poverty rate of 0.0%, which includes 0 families.
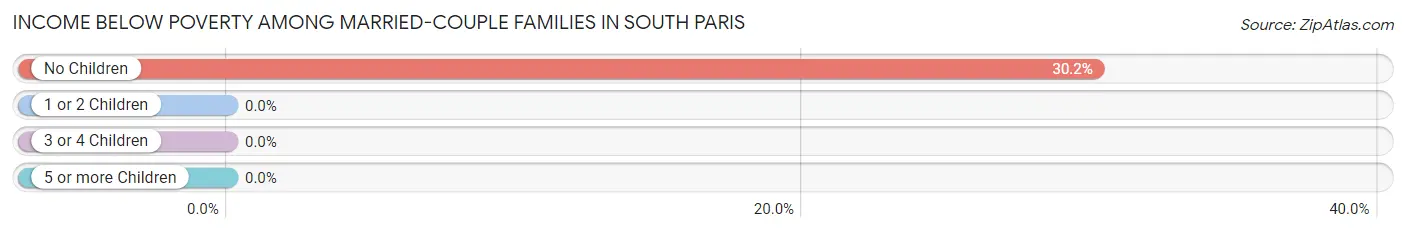
| Children | Above Poverty | Below Poverty |
| No Children | 125 (69.8%) | 54 (30.2%) |
| 1 or 2 Children | 116 (100.0%) | 0 (0.0%) |
| 3 or 4 Children | 0 (0.0%) | 0 (0.0%) |
| 5 or more Children | 0 (0.0%) | 0 (0.0%) |
| Total | 241 (81.7%) | 54 (18.3%) |
Income Below Poverty Among Single-Parent Households in South Paris
According to the poverty data in South Paris, 100.0% or 64 single-father households and 30.6% or 38 single-mother households are living below the poverty line. Among single-father households, those with 1 or 2 children have the highest poverty rate, with 64 households (100.0%) experiencing poverty. Likewise, among single-mother households, those with 3 or 4 children have the highest poverty rate, with 38 households (58.5%) falling below the poverty line.
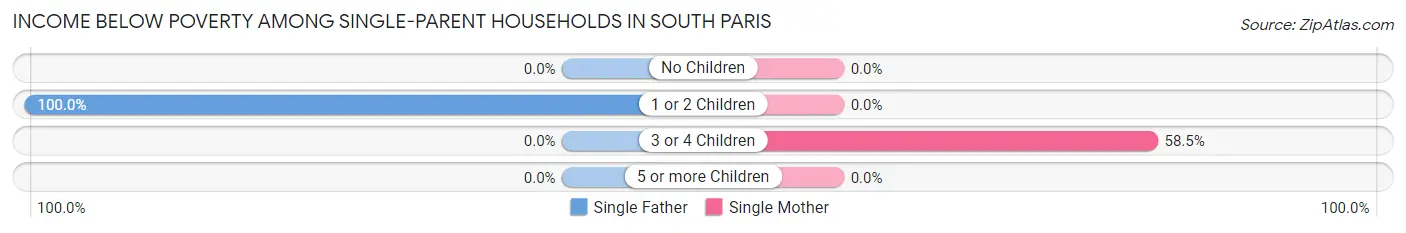
| Children | Single Father | Single Mother |
| No Children | 0 (0.0%) | 0 (0.0%) |
| 1 or 2 Children | 64 (100.0%) | 0 (0.0%) |
| 3 or 4 Children | 0 (0.0%) | 38 (58.5%) |
| 5 or more Children | 0 (0.0%) | 0 (0.0%) |
| Total | 64 (100.0%) | 38 (30.6%) |
Income Below Poverty Among Married-Couple vs Single-Parent Households in South Paris
The poverty data for South Paris shows that 54 of the married-couple family households (18.3%) and 102 of the single-parent households (54.3%) are living below the poverty level. Within the married-couple family households, those with no children have the highest poverty rate, with 54 households (30.2%) falling below the poverty line. Among the single-parent households, those with 1 or 2 children have the highest poverty rate, with 64 household (66.7%) living below poverty.
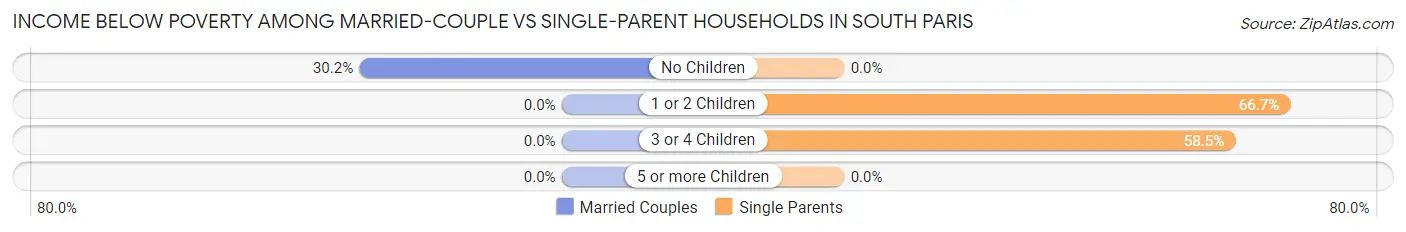
| Children | Married-Couple Families | Single-Parent Households |
| No Children | 54 (30.2%) | 0 (0.0%) |
| 1 or 2 Children | 0 (0.0%) | 64 (66.7%) |
| 3 or 4 Children | 0 (0.0%) | 38 (58.5%) |
| 5 or more Children | 0 (0.0%) | 0 (0.0%) |
| Total | 54 (18.3%) | 102 (54.3%) |
Race in South Paris
The most populous races in South Paris are White / Caucasian (2,208 | 100.0%), and Hispanic or Latino (63 | 2.9%).
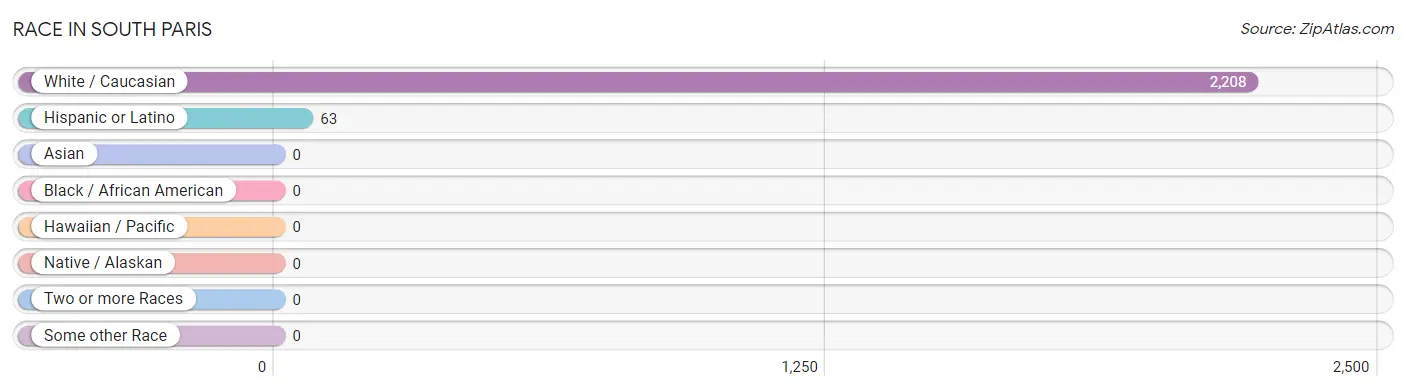
| Race | # Population | % Population |
| Asian | 0 | 0.0% |
| Black / African American | 0 | 0.0% |
| Hawaiian / Pacific | 0 | 0.0% |
| Hispanic or Latino | 63 | 2.9% |
| Native / Alaskan | 0 | 0.0% |
| White / Caucasian | 2,208 | 100.0% |
| Two or more Races | 0 | 0.0% |
| Some other Race | 0 | 0.0% |
| Total | 2,208 | 100.0% |
Ancestry in South Paris
The most populous ancestries reported in South Paris are English (553 | 25.1%), French (475 | 21.5%), Irish (397 | 18.0%), Scottish (168 | 7.6%), and American (141 | 6.4%), together accounting for 78.5% of all South Paris residents.
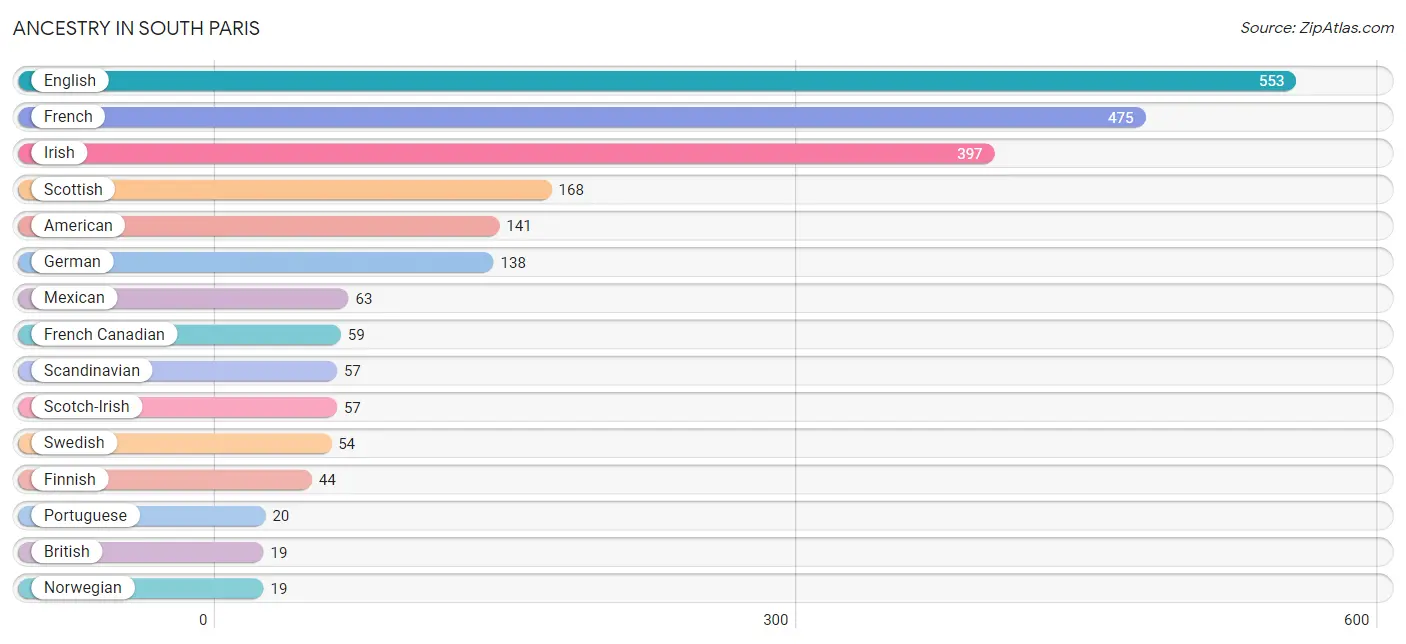
| Ancestry | # Population | % Population |
| American | 141 | 6.4% |
| British | 19 | 0.9% |
| Dutch | 11 | 0.5% |
| English | 553 | 25.1% |
| Finnish | 44 | 2.0% |
| French | 475 | 21.5% |
| French Canadian | 59 | 2.7% |
| German | 138 | 6.2% |
| Irish | 397 | 18.0% |
| Mexican | 63 | 2.9% |
| Norwegian | 19 | 0.9% |
| Portuguese | 20 | 0.9% |
| Scandinavian | 57 | 2.6% |
| Scotch-Irish | 57 | 2.6% |
| Scottish | 168 | 7.6% |
| Swedish | 54 | 2.5% | View All 16 Rows |
Immigrants in South Paris

| Immigration Origin | # Population | % Population | View All 0 Rows |
Sex and Age in South Paris
Sex and Age in South Paris
The most populous age groups in South Paris are 55 to 59 Years (194 | 18.5%) for men and 75 to 79 Years (143 | 12.3%) for women.
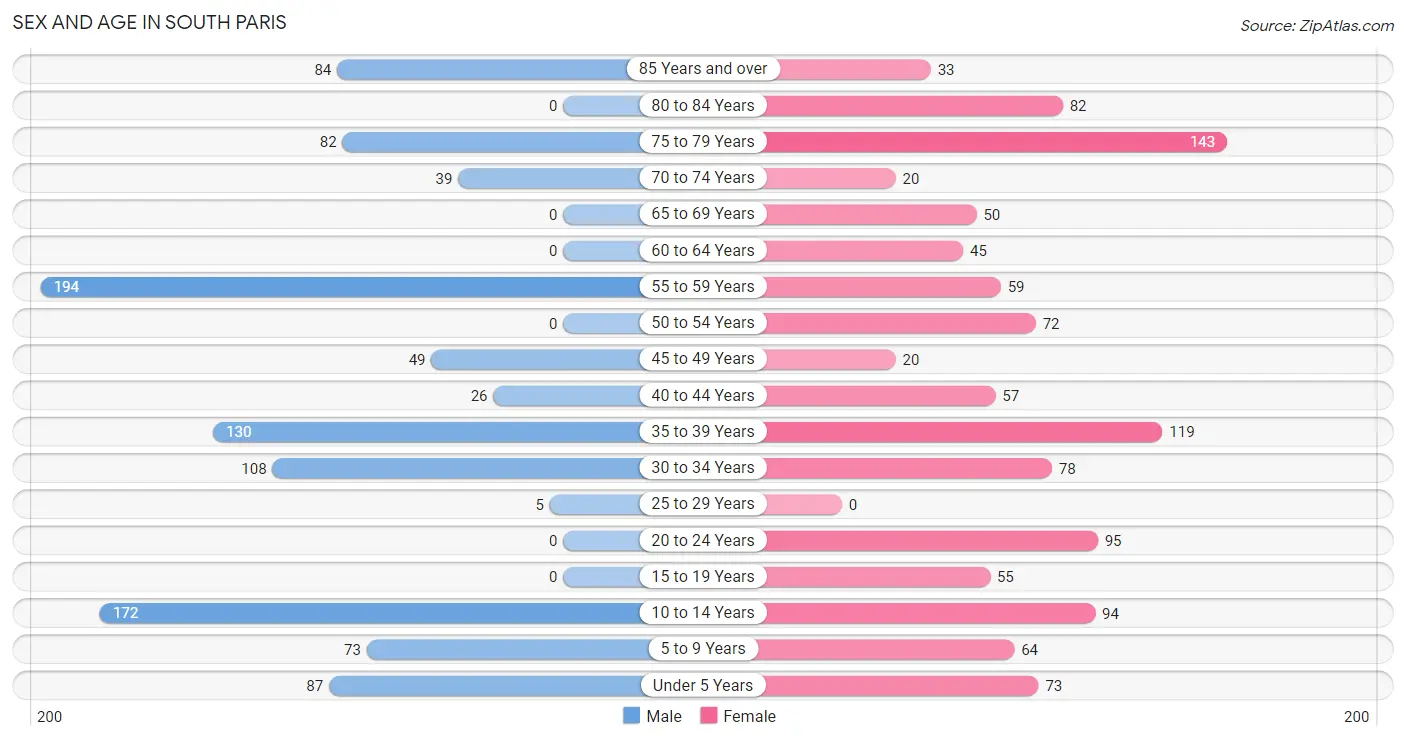
| Age Bracket | Male | Female |
| Under 5 Years | 87 (8.3%) | 73 (6.3%) |
| 5 to 9 Years | 73 (7.0%) | 64 (5.5%) |
| 10 to 14 Years | 172 (16.4%) | 94 (8.1%) |
| 15 to 19 Years | 0 (0.0%) | 55 (4.8%) |
| 20 to 24 Years | 0 (0.0%) | 95 (8.2%) |
| 25 to 29 Years | 5 (0.5%) | 0 (0.0%) |
| 30 to 34 Years | 108 (10.3%) | 78 (6.7%) |
| 35 to 39 Years | 130 (12.4%) | 119 (10.3%) |
| 40 to 44 Years | 26 (2.5%) | 57 (4.9%) |
| 45 to 49 Years | 49 (4.7%) | 20 (1.7%) |
| 50 to 54 Years | 0 (0.0%) | 72 (6.2%) |
| 55 to 59 Years | 194 (18.5%) | 59 (5.1%) |
| 60 to 64 Years | 0 (0.0%) | 45 (3.9%) |
| 65 to 69 Years | 0 (0.0%) | 50 (4.3%) |
| 70 to 74 Years | 39 (3.7%) | 20 (1.7%) |
| 75 to 79 Years | 82 (7.8%) | 143 (12.3%) |
| 80 to 84 Years | 0 (0.0%) | 82 (7.1%) |
| 85 Years and over | 84 (8.0%) | 33 (2.9%) |
| Total | 1,049 (100.0%) | 1,159 (100.0%) |
Families and Households in South Paris
Median Family Size in South Paris
The median family size in South Paris is 2.85 persons per family, with single female/mother families (124 | 25.7%) accounting for the largest median family size of 3.61 persons per family. On the other hand, married-couple families (295 | 61.1%) represent the smallest median family size with 2.39 persons per family.
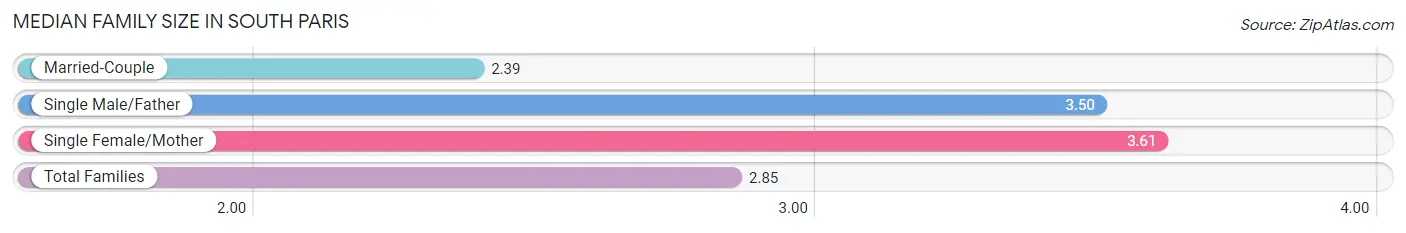
| Family Type | # Families | Family Size |
| Married-Couple | 295 (61.1%) | 2.39 |
| Single Male/Father | 64 (13.3%) | 3.50 |
| Single Female/Mother | 124 (25.7%) | 3.61 |
| Total Families | 483 (100.0%) | 2.85 |
Median Household Size in South Paris
The median household size in South Paris is 2.15 persons per household, with single male/father households (64 | 6.5%) accounting for the largest median household size of 5.59 persons per household. non-family households (503 | 51.0%) represent the smallest median household size with 1.08 persons per household.
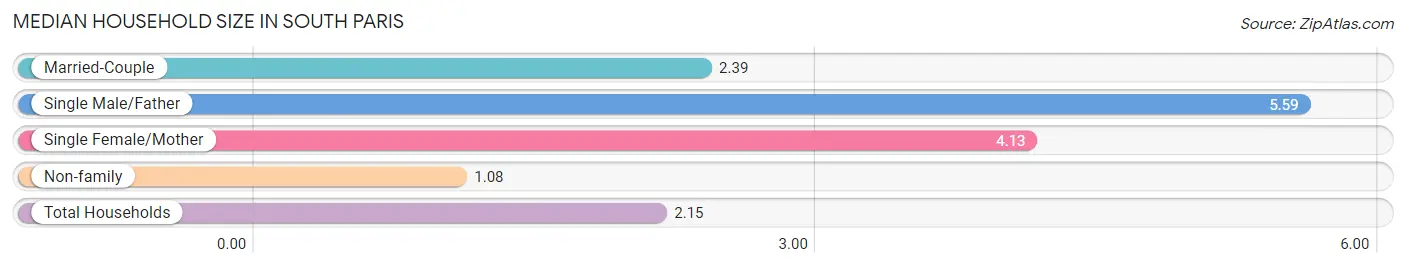
| Household Type | # Households | Household Size |
| Married-Couple | 295 (29.9%) | 2.39 |
| Single Male/Father | 64 (6.5%) | 5.59 |
| Single Female/Mother | 124 (12.6%) | 4.13 |
| Non-family | 503 (51.0%) | 1.08 |
| Total Households | 986 (100.0%) | 2.15 |
Household Size by Marriage Status in South Paris
Out of a total of 986 households in South Paris, 483 (49.0%) are family households, while 503 (51.0%) are nonfamily households. The most numerous type of family households are 2-person households, comprising 206, and the most common type of nonfamily households are 1-person households, comprising 459.
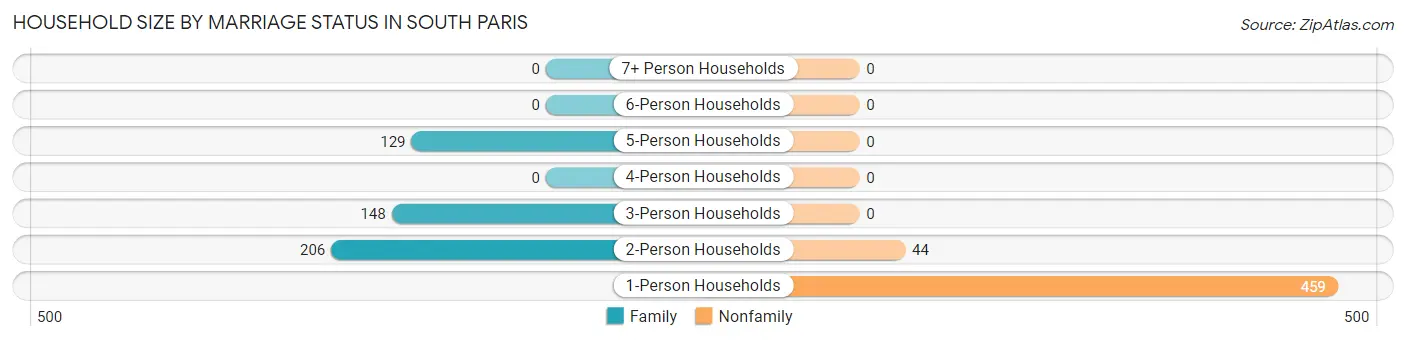
| Household Size | Family Households | Nonfamily Households |
| 1-Person Households | - | 459 (46.6%) |
| 2-Person Households | 206 (20.9%) | 44 (4.5%) |
| 3-Person Households | 148 (15.0%) | 0 (0.0%) |
| 4-Person Households | 0 (0.0%) | 0 (0.0%) |
| 5-Person Households | 129 (13.1%) | 0 (0.0%) |
| 6-Person Households | 0 (0.0%) | 0 (0.0%) |
| 7+ Person Households | 0 (0.0%) | 0 (0.0%) |
| Total | 483 (49.0%) | 503 (51.0%) |
Female Fertility in South Paris
Fertility by Age in South Paris
Average fertility rate in South Paris is 132.0 births per 1,000 women. Women in the age bracket of 35 to 50 years have the highest fertility rate with 264.0 births per 1,000 women. Women in the age bracket of 35 to 50 years acount for 100.0% of all women with births.
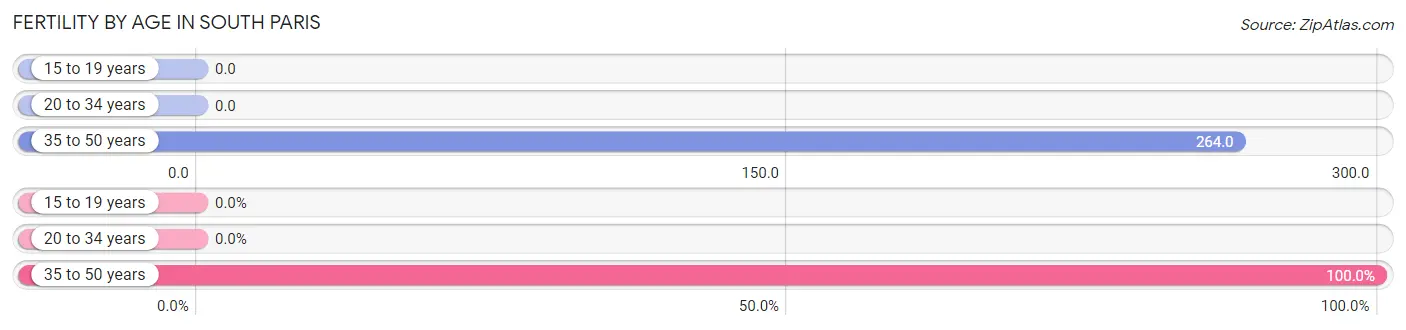
| Age Bracket | Women with Births | Births / 1,000 Women |
| 15 to 19 years | 0 (0.0%) | 0.0 |
| 20 to 34 years | 0 (0.0%) | 0.0 |
| 35 to 50 years | 60 (100.0%) | 264.0 |
| Total | 60 (100.0%) | 132.0 |
Fertility by Age by Marriage Status in South Paris
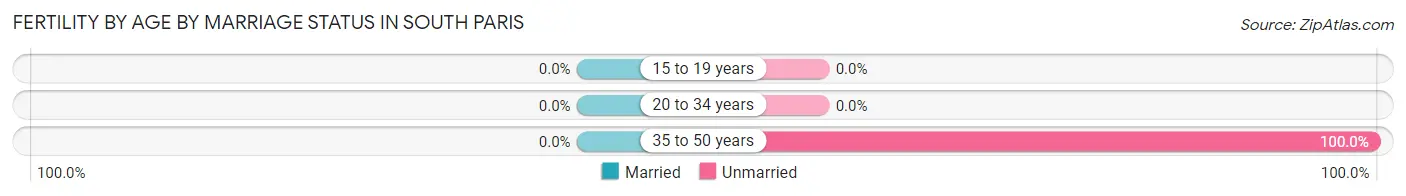
| Age Bracket | Married | Unmarried |
| 15 to 19 years | 0 (0.0%) | 0 (0.0%) |
| 20 to 34 years | 0 (0.0%) | 0 (0.0%) |
| 35 to 50 years | 0 (0.0%) | 60 (100.0%) |
| Total | 0 (0.0%) | 60 (100.0%) |
Fertility by Education in South Paris
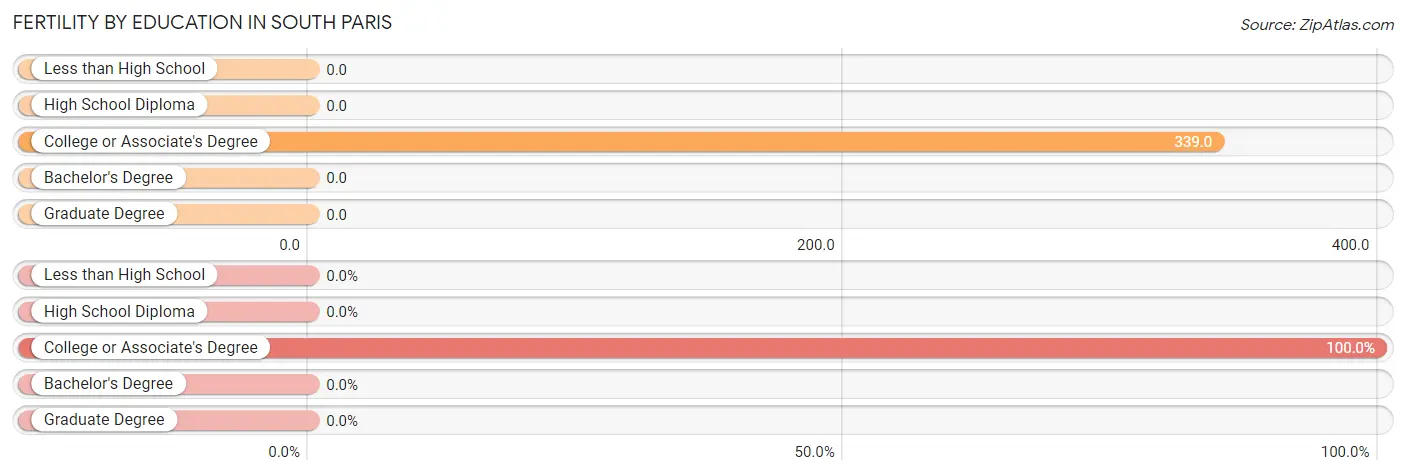
| Educational Attainment | Women with Births | Births / 1,000 Women |
| Less than High School | 0 (0.0%) | 0.0 |
| High School Diploma | 0 (0.0%) | 0.0 |
| College or Associate's Degree | 60 (100.0%) | 339.0 |
| Bachelor's Degree | 0 (0.0%) | 0.0 |
| Graduate Degree | 0 (0.0%) | 0.0 |
| Total | 60 (100.0%) | 132.0 |
Fertility by Education by Marriage Status in South Paris
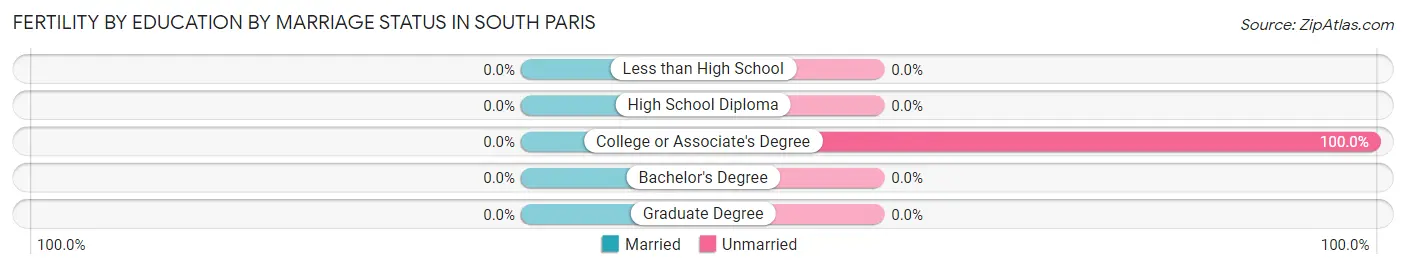
| Educational Attainment | Married | Unmarried |
| Less than High School | 0 (0.0%) | 0 (0.0%) |
| High School Diploma | 0 (0.0%) | 0 (0.0%) |
| College or Associate's Degree | 0 (0.0%) | 60 (100.0%) |
| Bachelor's Degree | 0 (0.0%) | 0 (0.0%) |
| Graduate Degree | 0 (0.0%) | 0 (0.0%) |
| Total | 0 (0.0%) | 60 (100.0%) |
Employment Characteristics in South Paris
Employment by Class of Employer in South Paris
Among the 944 employed individuals in South Paris, private company employees (600 | 63.6%), not-for-profit organizations (176 | 18.6%), and local government employees (138 | 14.6%) make up the most common classes of employment.
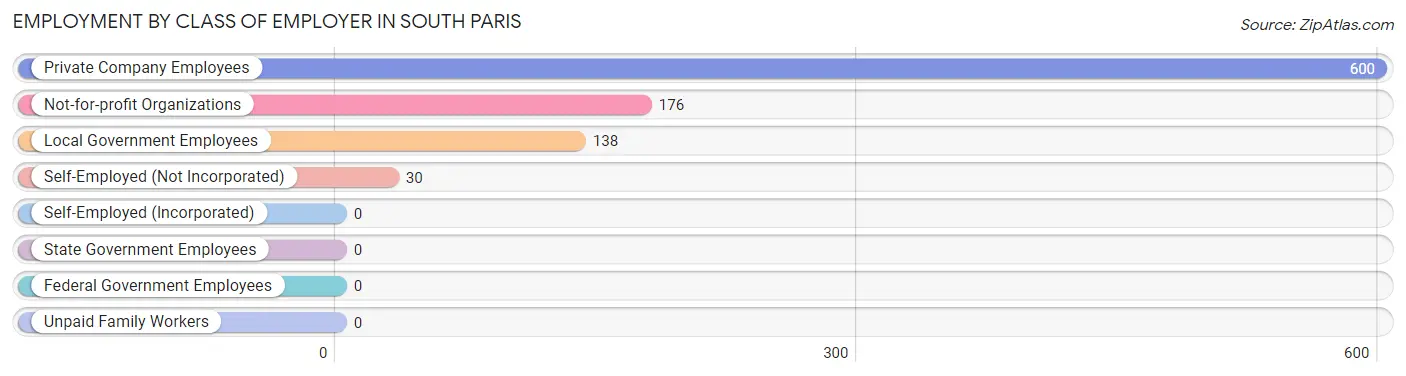
| Employer Class | # Employees | % Employees |
| Private Company Employees | 600 | 63.6% |
| Self-Employed (Incorporated) | 0 | 0.0% |
| Self-Employed (Not Incorporated) | 30 | 3.2% |
| Not-for-profit Organizations | 176 | 18.6% |
| Local Government Employees | 138 | 14.6% |
| State Government Employees | 0 | 0.0% |
| Federal Government Employees | 0 | 0.0% |
| Unpaid Family Workers | 0 | 0.0% |
| Total | 944 | 100.0% |
Employment Status by Age in South Paris
According to the labor force statistics for South Paris, out of the total population over 16 years of age (1,619), 60.0% or 971 individuals are in the labor force, with 2.8% or 27 of them unemployed. The age group with the highest labor force participation rate is 16 to 19 years, with 100.0% or 29 individuals in the labor force. Within the labor force, the 55 to 59 years age range has the highest percentage of unemployed individuals, with 13.2% or 27 of them being unemployed.
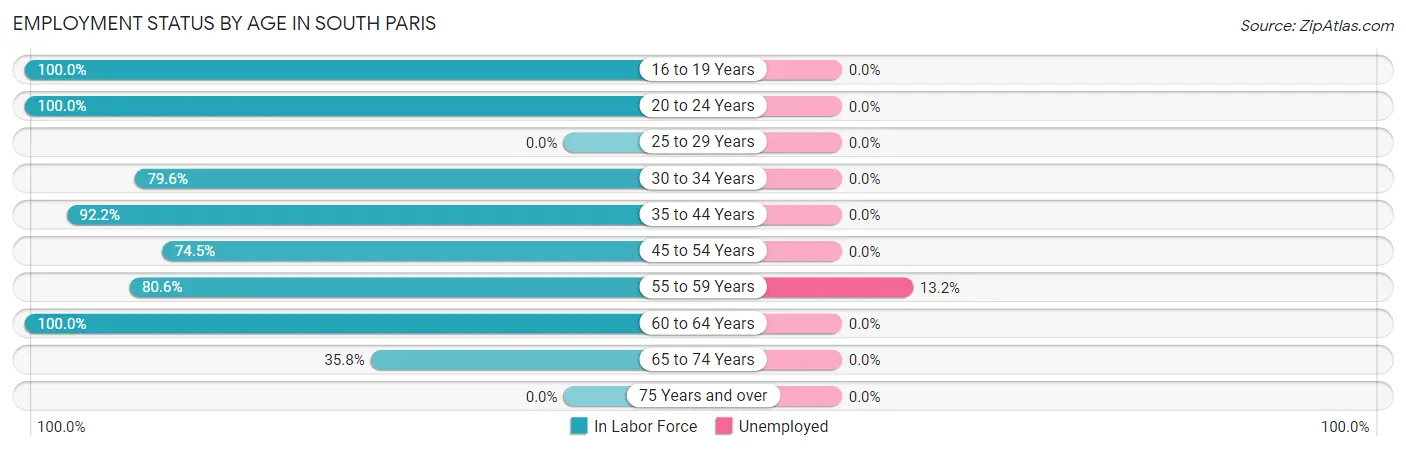
| Age Bracket | In Labor Force | Unemployed |
| 16 to 19 Years | 29 (100.0%) | 0 (0.0%) |
| 20 to 24 Years | 95 (100.0%) | 0 (0.0%) |
| 25 to 29 Years | 0 (0.0%) | 0 (0.0%) |
| 30 to 34 Years | 148 (79.6%) | 0 (0.0%) |
| 35 to 44 Years | 306 (92.2%) | 0 (0.0%) |
| 45 to 54 Years | 105 (74.5%) | 0 (0.0%) |
| 55 to 59 Years | 204 (80.6%) | 27 (13.2%) |
| 60 to 64 Years | 45 (100.0%) | 0 (0.0%) |
| 65 to 74 Years | 39 (35.8%) | 0 (0.0%) |
| 75 Years and over | 0 (0.0%) | 0 (0.0%) |
| Total | 971 (60.0%) | 27 (2.8%) |
Employment Status by Educational Attainment in South Paris
According to labor force statistics for South Paris, 84.0% of individuals (808) out of the total population between 25 and 64 years of age (962) are in the labor force, with 3.3% or 27 of them being unemployed. The group with the highest labor force participation rate are those with the educational attainment of college / associate degree, with 93.3% or 392 individuals in the labor force. Within the labor force, individuals with high school diploma education have the highest percentage of unemployment, with 10.0% or 27 of them being unemployed.
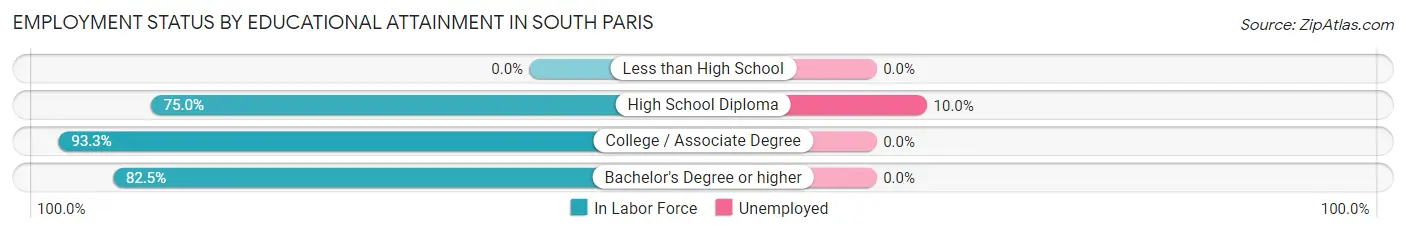
| Educational Attainment | In Labor Force | Unemployed |
| Less than High School | 0 (0.0%) | 0 (0.0%) |
| High School Diploma | 270 (75.0%) | 36 (10.0%) |
| College / Associate Degree | 392 (93.3%) | 0 (0.0%) |
| Bachelor's Degree or higher | 146 (82.5%) | 0 (0.0%) |
| Total | 808 (84.0%) | 32 (3.3%) |
Employment Occupations by Sex in South Paris
Management, Business, Science and Arts Occupations
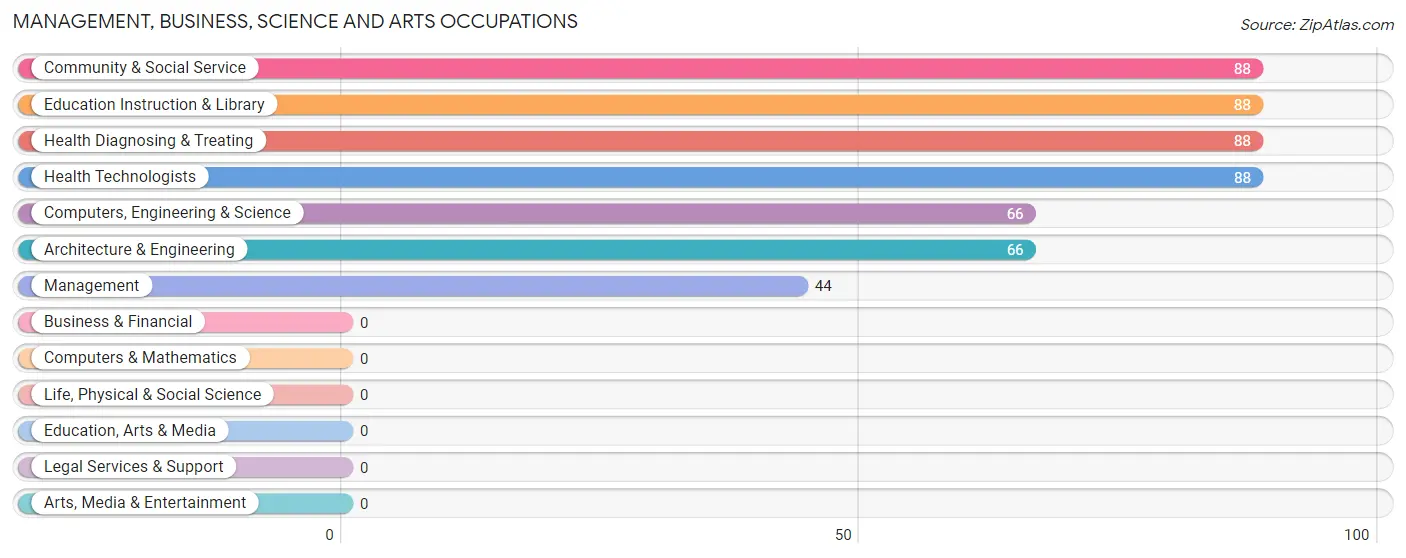
The most common Management, Business, Science and Arts occupations in South Paris are Community & Social Service (88 | 9.3%), Education Instruction & Library (88 | 9.3%), Health Diagnosing & Treating (88 | 9.3%), Health Technologists (88 | 9.3%), and Computers, Engineering & Science (66 | 7.0%).
Management, Business, Science and Arts Occupations by Sex
Within the Management, Business, Science and Arts occupations in South Paris, the most male-oriented occupations are Management (100.0%), Computers, Engineering & Science (100.0%), and Architecture & Engineering (100.0%), while the most female-oriented occupations are Community & Social Service (71.6%), Education Instruction & Library (71.6%), and Health Diagnosing & Treating (64.8%).
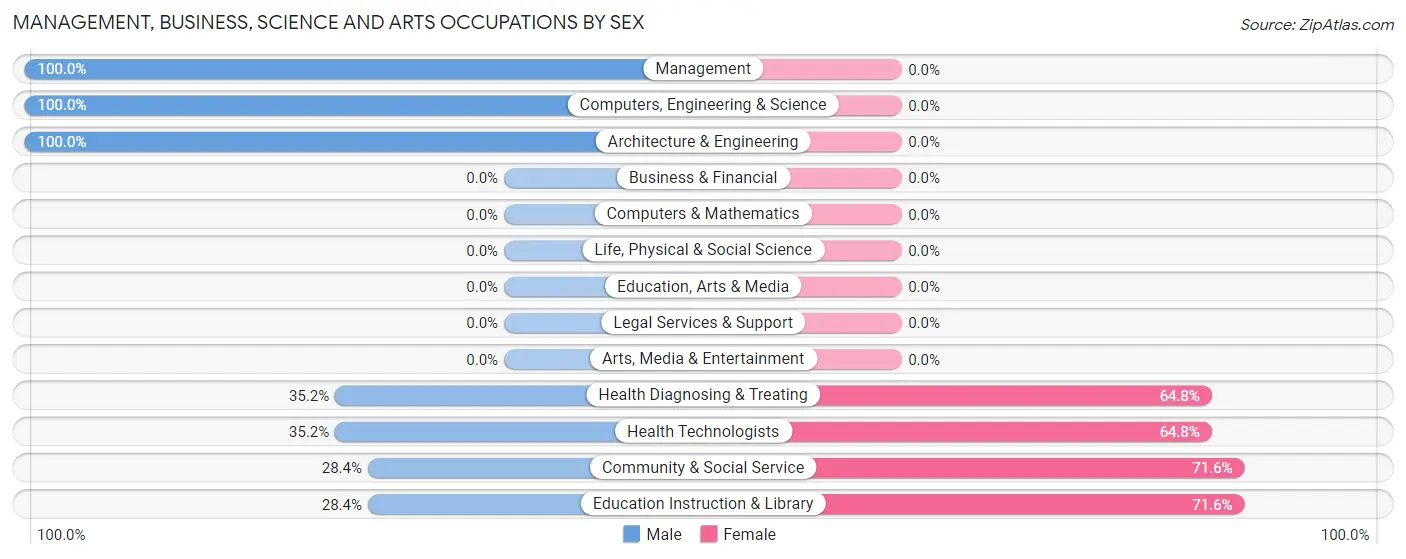
| Occupation | Male | Female |
| Management | 44 (100.0%) | 0 (0.0%) |
| Business & Financial | 0 (0.0%) | 0 (0.0%) |
| Computers, Engineering & Science | 66 (100.0%) | 0 (0.0%) |
| Computers & Mathematics | 0 (0.0%) | 0 (0.0%) |
| Architecture & Engineering | 66 (100.0%) | 0 (0.0%) |
| Life, Physical & Social Science | 0 (0.0%) | 0 (0.0%) |
| Community & Social Service | 25 (28.4%) | 63 (71.6%) |
| Education, Arts & Media | 0 (0.0%) | 0 (0.0%) |
| Legal Services & Support | 0 (0.0%) | 0 (0.0%) |
| Education Instruction & Library | 25 (28.4%) | 63 (71.6%) |
| Arts, Media & Entertainment | 0 (0.0%) | 0 (0.0%) |
| Health Diagnosing & Treating | 31 (35.2%) | 57 (64.8%) |
| Health Technologists | 31 (35.2%) | 57 (64.8%) |
| Total (Category) | 166 (58.0%) | 120 (42.0%) |
| Total (Overall) | 467 (49.5%) | 477 (50.5%) |
Services Occupations
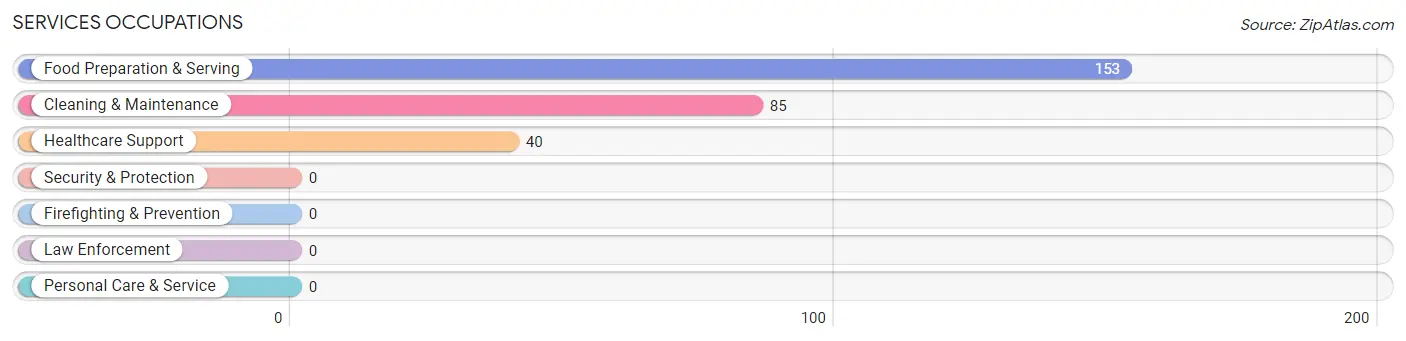
The most common Services occupations in South Paris are Food Preparation & Serving (153 | 16.2%), Cleaning & Maintenance (85 | 9.0%), and Healthcare Support (40 | 4.2%).
Services Occupations by Sex
Within the Services occupations in South Paris, the most male-oriented occupations are Cleaning & Maintenance (47.1%), and Food Preparation & Serving (41.8%), while the most female-oriented occupations are Healthcare Support (100.0%), Food Preparation & Serving (58.2%), and Cleaning & Maintenance (52.9%).
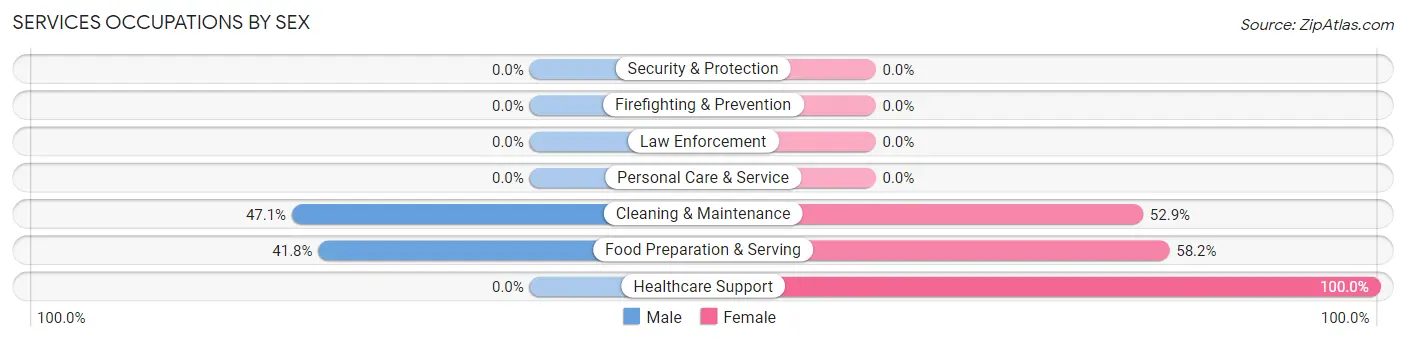
| Occupation | Male | Female |
| Healthcare Support | 0 (0.0%) | 40 (100.0%) |
| Security & Protection | 0 (0.0%) | 0 (0.0%) |
| Firefighting & Prevention | 0 (0.0%) | 0 (0.0%) |
| Law Enforcement | 0 (0.0%) | 0 (0.0%) |
| Food Preparation & Serving | 64 (41.8%) | 89 (58.2%) |
| Cleaning & Maintenance | 40 (47.1%) | 45 (52.9%) |
| Personal Care & Service | 0 (0.0%) | 0 (0.0%) |
| Total (Category) | 104 (37.4%) | 174 (62.6%) |
| Total (Overall) | 467 (49.5%) | 477 (50.5%) |
Sales and Office Occupations
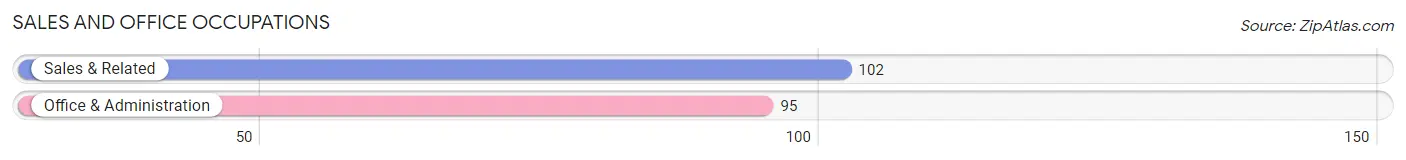
The most common Sales and Office occupations in South Paris are Sales & Related (102 | 10.8%), and Office & Administration (95 | 10.1%).
Sales and Office Occupations by Sex
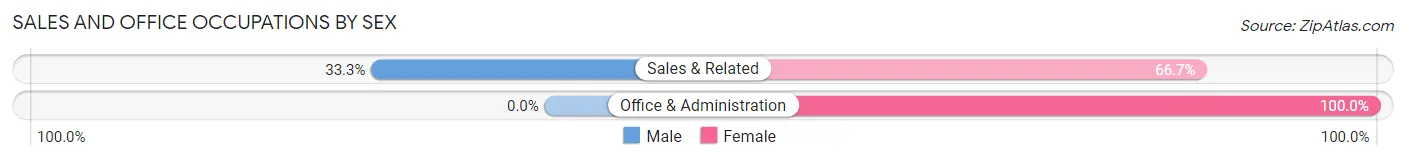
| Occupation | Male | Female |
| Sales & Related | 34 (33.3%) | 68 (66.7%) |
| Office & Administration | 0 (0.0%) | 95 (100.0%) |
| Total (Category) | 34 (17.3%) | 163 (82.7%) |
| Total (Overall) | 467 (49.5%) | 477 (50.5%) |
Natural Resources, Construction and Maintenance Occupations
The most common Natural Resources, Construction and Maintenance occupations in South Paris are , and Construction & Extraction (53 | 5.6%).
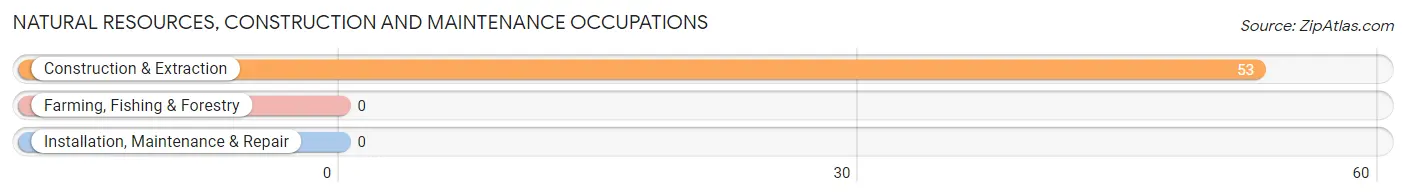
Natural Resources, Construction and Maintenance Occupations by Sex
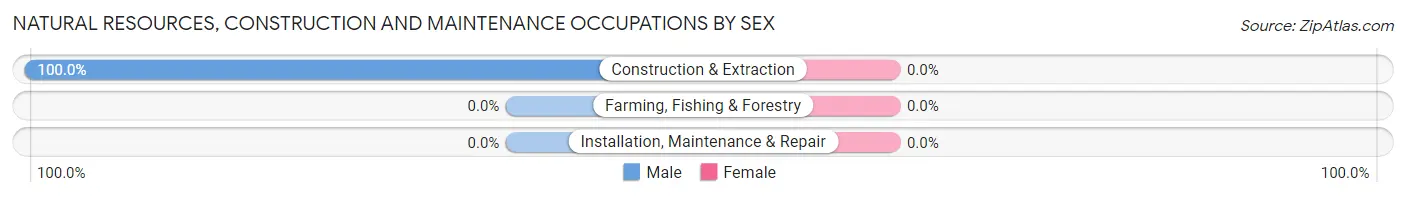
| Occupation | Male | Female |
| Farming, Fishing & Forestry | 0 (0.0%) | 0 (0.0%) |
| Construction & Extraction | 53 (100.0%) | 0 (0.0%) |
| Installation, Maintenance & Repair | 0 (0.0%) | 0 (0.0%) |
| Total (Category) | 53 (100.0%) | 0 (0.0%) |
| Total (Overall) | 467 (49.5%) | 477 (50.5%) |
Production, Transportation and Moving Occupations
The most common Production, Transportation and Moving occupations in South Paris are Production (76 | 8.1%), Material Moving (34 | 3.6%), and Transportation (20 | 2.1%).
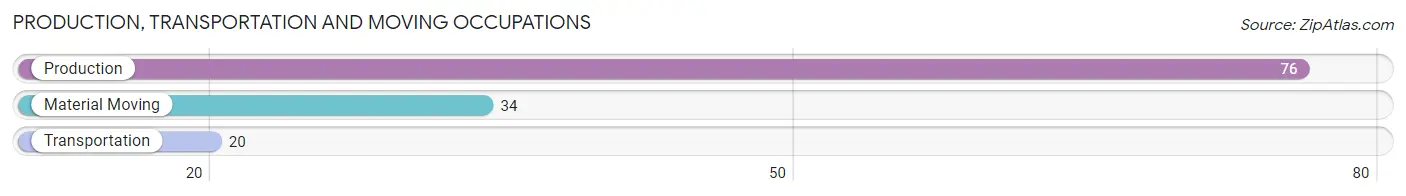
Production, Transportation and Moving Occupations by Sex
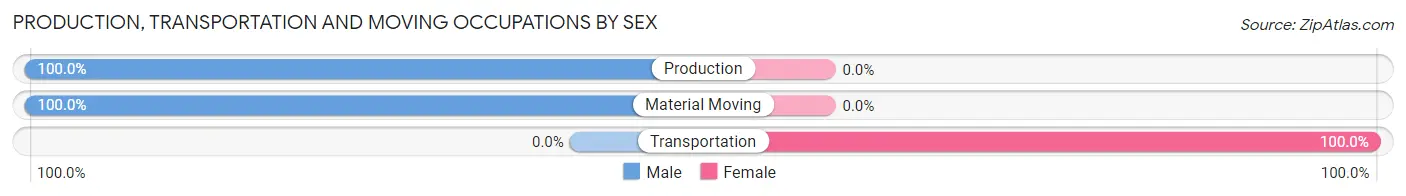
| Occupation | Male | Female |
| Production | 76 (100.0%) | 0 (0.0%) |
| Transportation | 0 (0.0%) | 20 (100.0%) |
| Material Moving | 34 (100.0%) | 0 (0.0%) |
| Total (Category) | 110 (84.6%) | 20 (15.4%) |
| Total (Overall) | 467 (49.5%) | 477 (50.5%) |
Employment Industries by Sex in South Paris
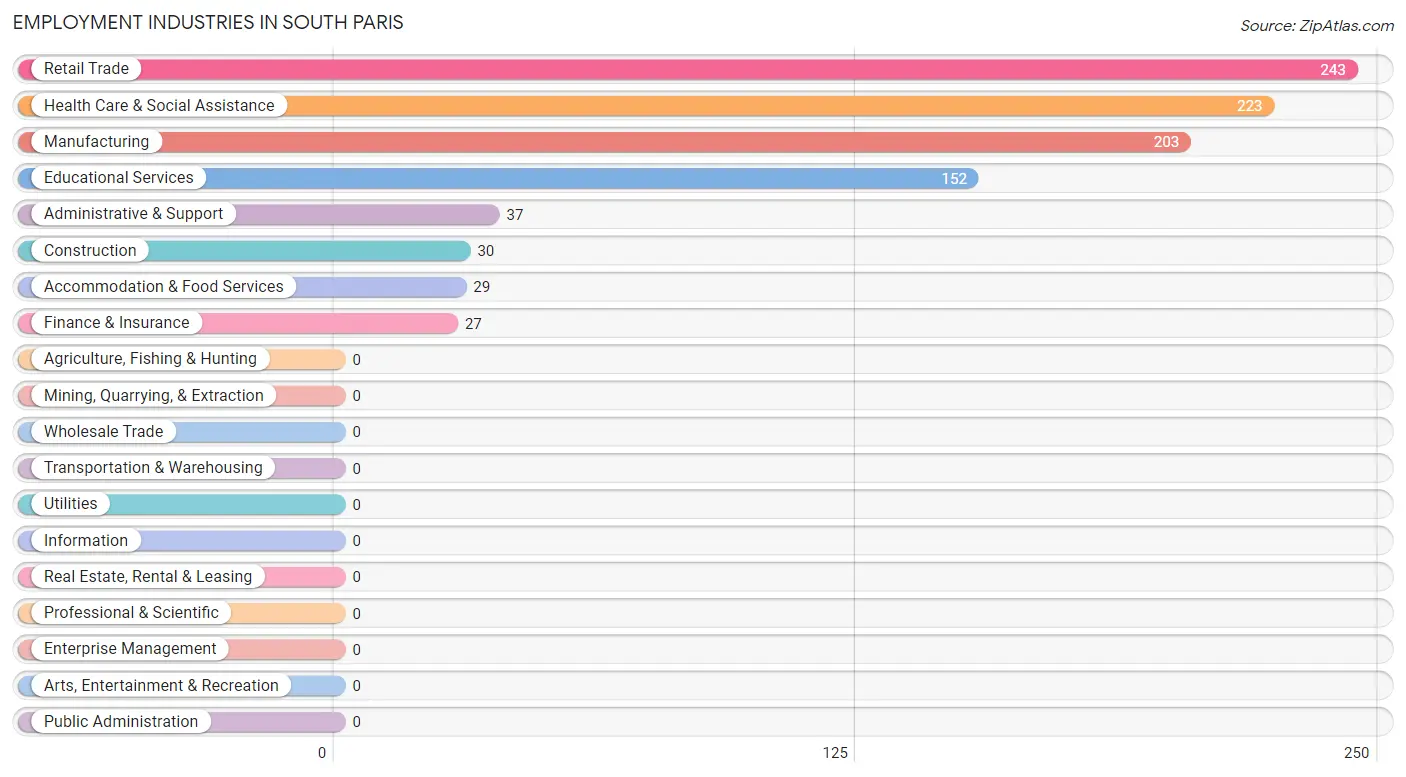
Employment Industries in South Paris
The major employment industries in South Paris include Retail Trade (243 | 25.7%), Health Care & Social Assistance (223 | 23.6%), Manufacturing (203 | 21.5%), Educational Services (152 | 16.1%), and Administrative & Support (37 | 3.9%).
Employment Industries by Sex in South Paris
The South Paris industries that see more men than women are Construction (100.0%), Administrative & Support (100.0%), and Manufacturing (89.2%), whereas the industries that tend to have a higher number of women are Finance & Insurance (100.0%), Accommodation & Food Services (100.0%), and Health Care & Social Assistance (86.1%).
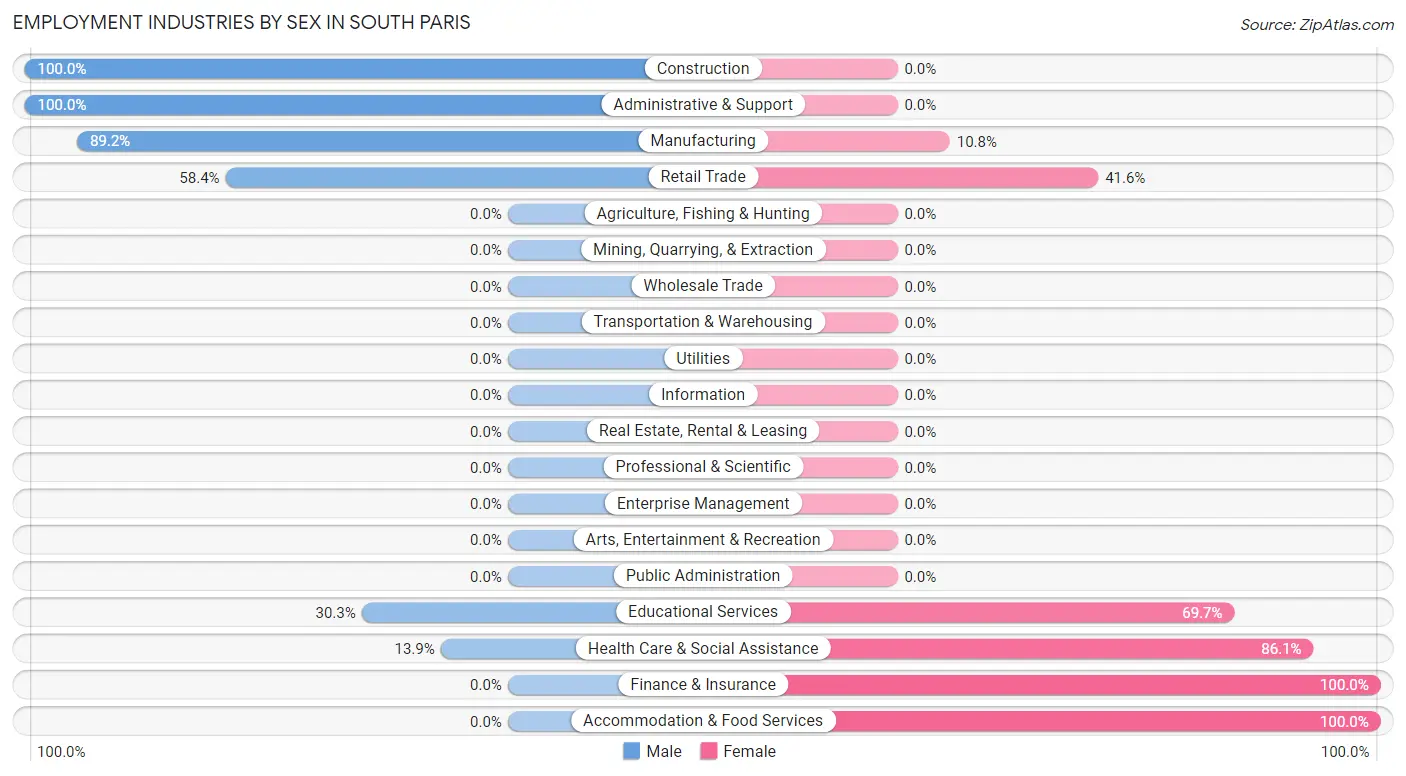
| Industry | Male | Female |
| Agriculture, Fishing & Hunting | 0 (0.0%) | 0 (0.0%) |
| Mining, Quarrying, & Extraction | 0 (0.0%) | 0 (0.0%) |
| Construction | 30 (100.0%) | 0 (0.0%) |
| Manufacturing | 181 (89.2%) | 22 (10.8%) |
| Wholesale Trade | 0 (0.0%) | 0 (0.0%) |
| Retail Trade | 142 (58.4%) | 101 (41.6%) |
| Transportation & Warehousing | 0 (0.0%) | 0 (0.0%) |
| Utilities | 0 (0.0%) | 0 (0.0%) |
| Information | 0 (0.0%) | 0 (0.0%) |
| Finance & Insurance | 0 (0.0%) | 27 (100.0%) |
| Real Estate, Rental & Leasing | 0 (0.0%) | 0 (0.0%) |
| Professional & Scientific | 0 (0.0%) | 0 (0.0%) |
| Enterprise Management | 0 (0.0%) | 0 (0.0%) |
| Administrative & Support | 37 (100.0%) | 0 (0.0%) |
| Educational Services | 46 (30.3%) | 106 (69.7%) |
| Health Care & Social Assistance | 31 (13.9%) | 192 (86.1%) |
| Arts, Entertainment & Recreation | 0 (0.0%) | 0 (0.0%) |
| Accommodation & Food Services | 0 (0.0%) | 29 (100.0%) |
| Public Administration | 0 (0.0%) | 0 (0.0%) |
| Total | 467 (49.5%) | 477 (50.5%) |
Education in South Paris
School Enrollment in South Paris
The most common levels of schooling among the 545 students in South Paris are elementary school (236 | 43.3%), middle school (193 | 35.4%), and nursery / preschool (87 | 16.0%).
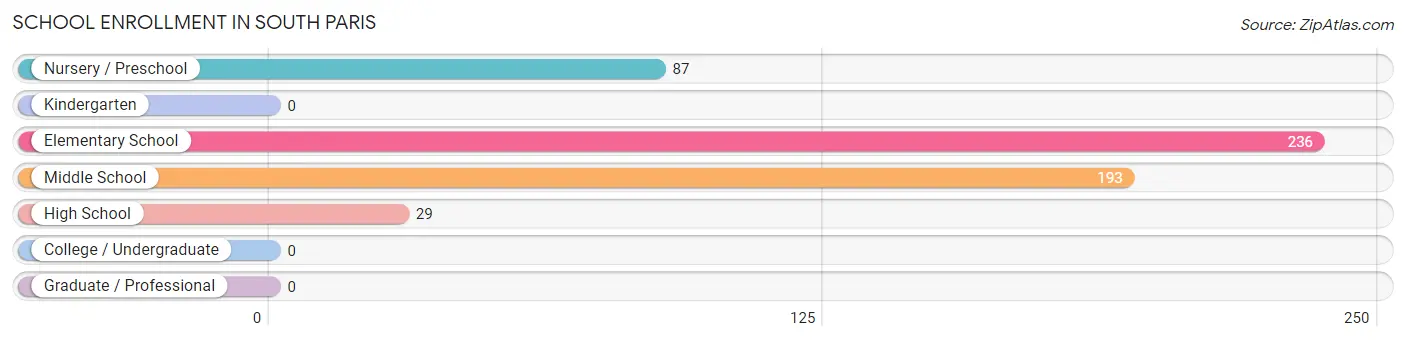
| School Level | # Students | % Students |
| Nursery / Preschool | 87 | 16.0% |
| Kindergarten | 0 | 0.0% |
| Elementary School | 236 | 43.3% |
| Middle School | 193 | 35.4% |
| High School | 29 | 5.3% |
| College / Undergraduate | 0 | 0.0% |
| Graduate / Professional | 0 | 0.0% |
| Total | 545 | 100.0% |
School Enrollment by Age by Funding Source in South Paris
Out of a total of 545 students who are enrolled in schools in South Paris, 61 (11.2%) attend a private institution, while the remaining 484 (88.8%) are enrolled in public schools. The age group of 15 to 17 year olds has the highest likelihood of being enrolled in private schools, with 26 (47.3% in the age bracket) enrolled. Conversely, the age group of 3 to 4 year olds has the lowest likelihood of being enrolled in a private school, with 87 (100.0% in the age bracket) attending a public institution.
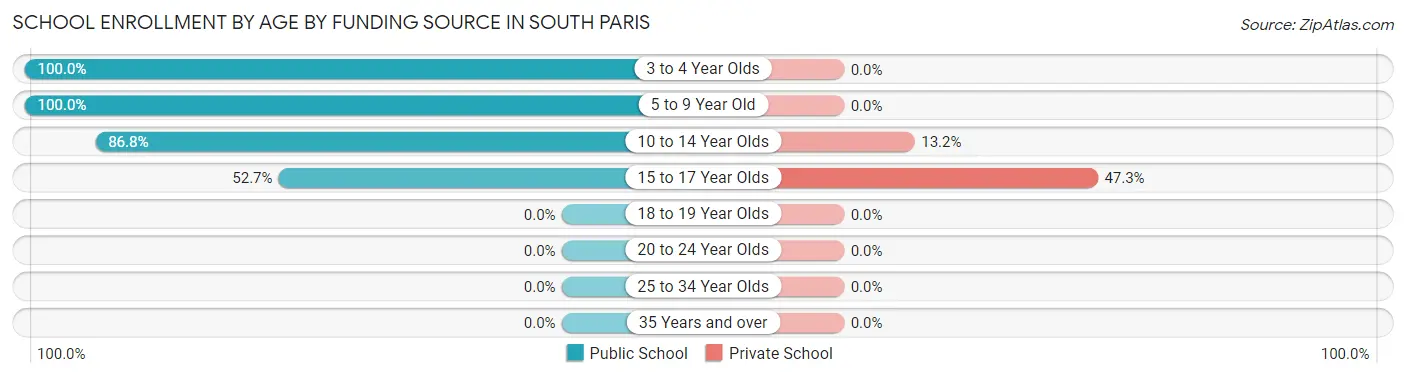
| Age Bracket | Public School | Private School |
| 3 to 4 Year Olds | 87 (100.0%) | 0 (0.0%) |
| 5 to 9 Year Old | 137 (100.0%) | 0 (0.0%) |
| 10 to 14 Year Olds | 231 (86.8%) | 35 (13.2%) |
| 15 to 17 Year Olds | 29 (52.7%) | 26 (47.3%) |
| 18 to 19 Year Olds | 0 (0.0%) | 0 (0.0%) |
| 20 to 24 Year Olds | 0 (0.0%) | 0 (0.0%) |
| 25 to 34 Year Olds | 0 (0.0%) | 0 (0.0%) |
| 35 Years and over | 0 (0.0%) | 0 (0.0%) |
| Total | 484 (88.8%) | 61 (11.2%) |
Educational Attainment by Field of Study in South Paris
Science & technology (56 | 21.1%), physical & health sciences (52 | 19.6%), social sciences (36 | 13.6%), liberal arts & history (32 | 12.1%), and bio, nature & agricultural (31 | 11.7%) are the most common fields of study among 265 individuals in South Paris who have obtained a bachelor's degree or higher.
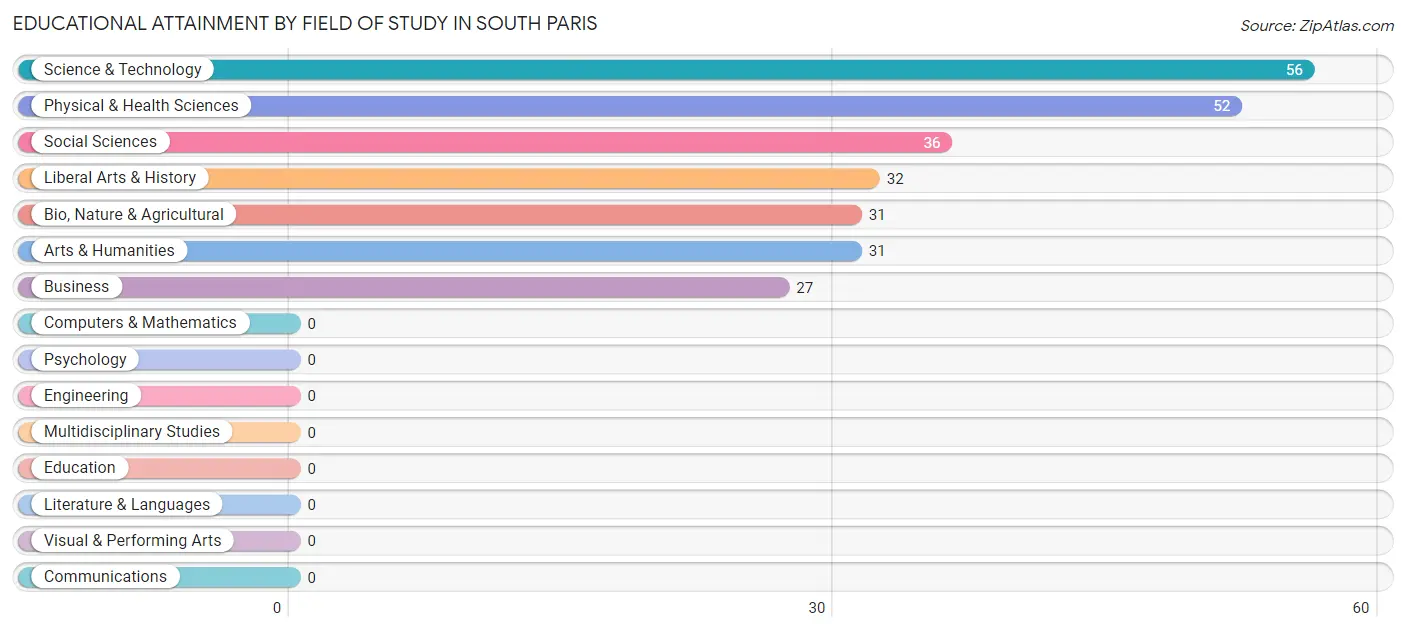
| Field of Study | # Graduates | % Graduates |
| Computers & Mathematics | 0 | 0.0% |
| Bio, Nature & Agricultural | 31 | 11.7% |
| Physical & Health Sciences | 52 | 19.6% |
| Psychology | 0 | 0.0% |
| Social Sciences | 36 | 13.6% |
| Engineering | 0 | 0.0% |
| Multidisciplinary Studies | 0 | 0.0% |
| Science & Technology | 56 | 21.1% |
| Business | 27 | 10.2% |
| Education | 0 | 0.0% |
| Literature & Languages | 0 | 0.0% |
| Liberal Arts & History | 32 | 12.1% |
| Visual & Performing Arts | 0 | 0.0% |
| Communications | 0 | 0.0% |
| Arts & Humanities | 31 | 11.7% |
| Total | 265 | 100.0% |
Transportation & Commute in South Paris
Vehicle Availability by Sex in South Paris
The most prevalent vehicle ownership categories in South Paris are males with 3 vehicles (205, accounting for 43.9%) and females with 3 vehicles (225, making up 43.0%).
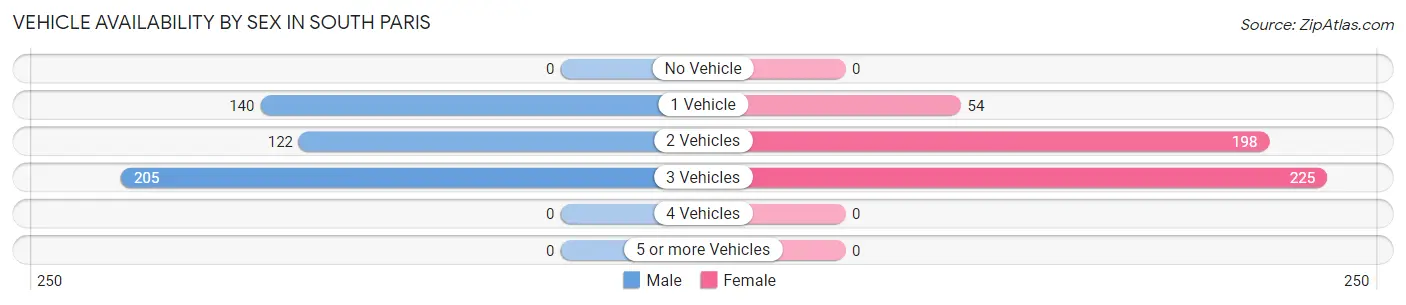
| Vehicles Available | Male | Female |
| No Vehicle | 0 (0.0%) | 0 (0.0%) |
| 1 Vehicle | 140 (30.0%) | 54 (11.3%) |
| 2 Vehicles | 122 (26.1%) | 198 (41.5%) |
| 3 Vehicles | 205 (43.9%) | 225 (47.2%) |
| 4 Vehicles | 0 (0.0%) | 0 (0.0%) |
| 5 or more Vehicles | 0 (0.0%) | 0 (0.0%) |
| Total | 467 (100.0%) | 477 (100.0%) |
Commute Time in South Paris
The most frequently occuring commute durations in South Paris are 5 to 9 minutes (349 commuters, 40.4%), 30 to 34 minutes (205 commuters, 23.7%), and 20 to 24 minutes (190 commuters, 22.0%).
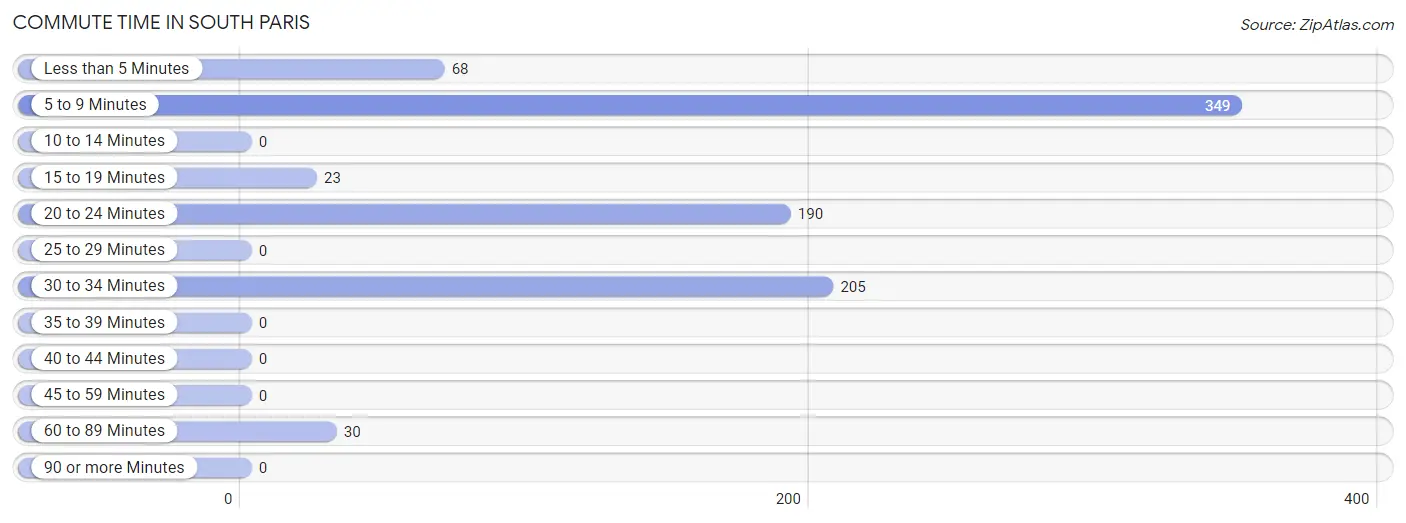
| Commute Time | # Commuters | % Commuters |
| Less than 5 Minutes | 68 | 7.9% |
| 5 to 9 Minutes | 349 | 40.4% |
| 10 to 14 Minutes | 0 | 0.0% |
| 15 to 19 Minutes | 23 | 2.7% |
| 20 to 24 Minutes | 190 | 22.0% |
| 25 to 29 Minutes | 0 | 0.0% |
| 30 to 34 Minutes | 205 | 23.7% |
| 35 to 39 Minutes | 0 | 0.0% |
| 40 to 44 Minutes | 0 | 0.0% |
| 45 to 59 Minutes | 0 | 0.0% |
| 60 to 89 Minutes | 30 | 3.5% |
| 90 or more Minutes | 0 | 0.0% |
Commute Time by Sex in South Paris
The most common commute times in South Paris are 5 to 9 minutes (177 commuters, 37.9%) for males and 5 to 9 minutes (172 commuters, 43.2%) for females.
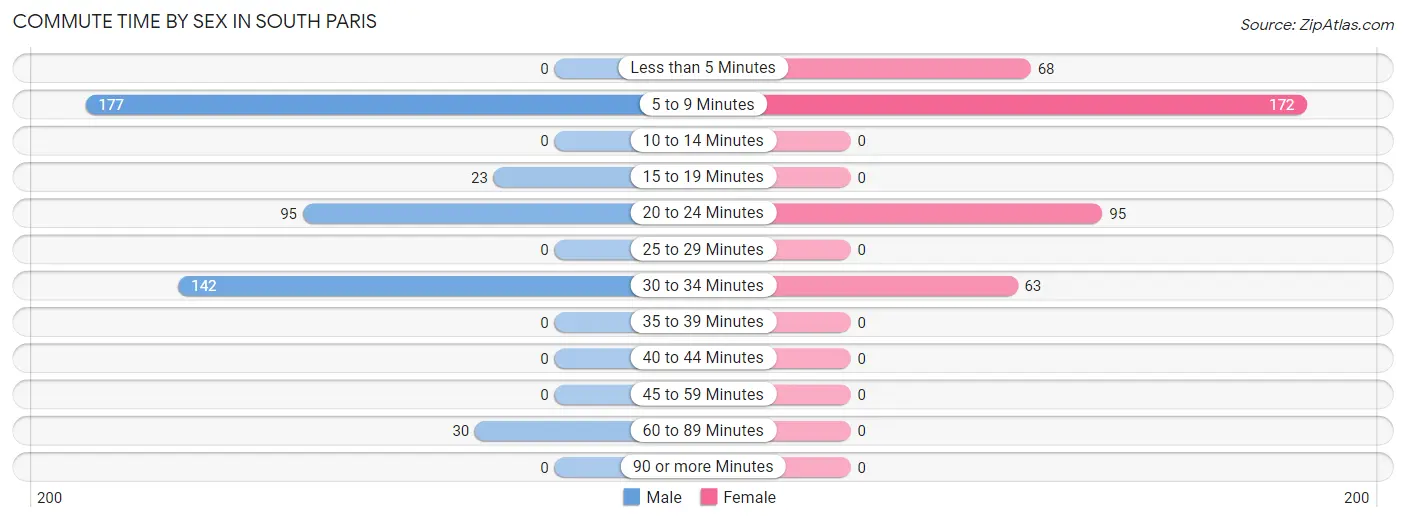
| Commute Time | Male | Female |
| Less than 5 Minutes | 0 (0.0%) | 68 (17.1%) |
| 5 to 9 Minutes | 177 (37.9%) | 172 (43.2%) |
| 10 to 14 Minutes | 0 (0.0%) | 0 (0.0%) |
| 15 to 19 Minutes | 23 (4.9%) | 0 (0.0%) |
| 20 to 24 Minutes | 95 (20.3%) | 95 (23.9%) |
| 25 to 29 Minutes | 0 (0.0%) | 0 (0.0%) |
| 30 to 34 Minutes | 142 (30.4%) | 63 (15.8%) |
| 35 to 39 Minutes | 0 (0.0%) | 0 (0.0%) |
| 40 to 44 Minutes | 0 (0.0%) | 0 (0.0%) |
| 45 to 59 Minutes | 0 (0.0%) | 0 (0.0%) |
| 60 to 89 Minutes | 30 (6.4%) | 0 (0.0%) |
| 90 or more Minutes | 0 (0.0%) | 0 (0.0%) |
Time of Departure to Work by Sex in South Paris
The most frequent times of departure to work in South Paris are 4:00 PM to 11:59 PM (143, 30.6%) for males and 7:30 AM to 7:59 AM (154, 38.7%) for females.
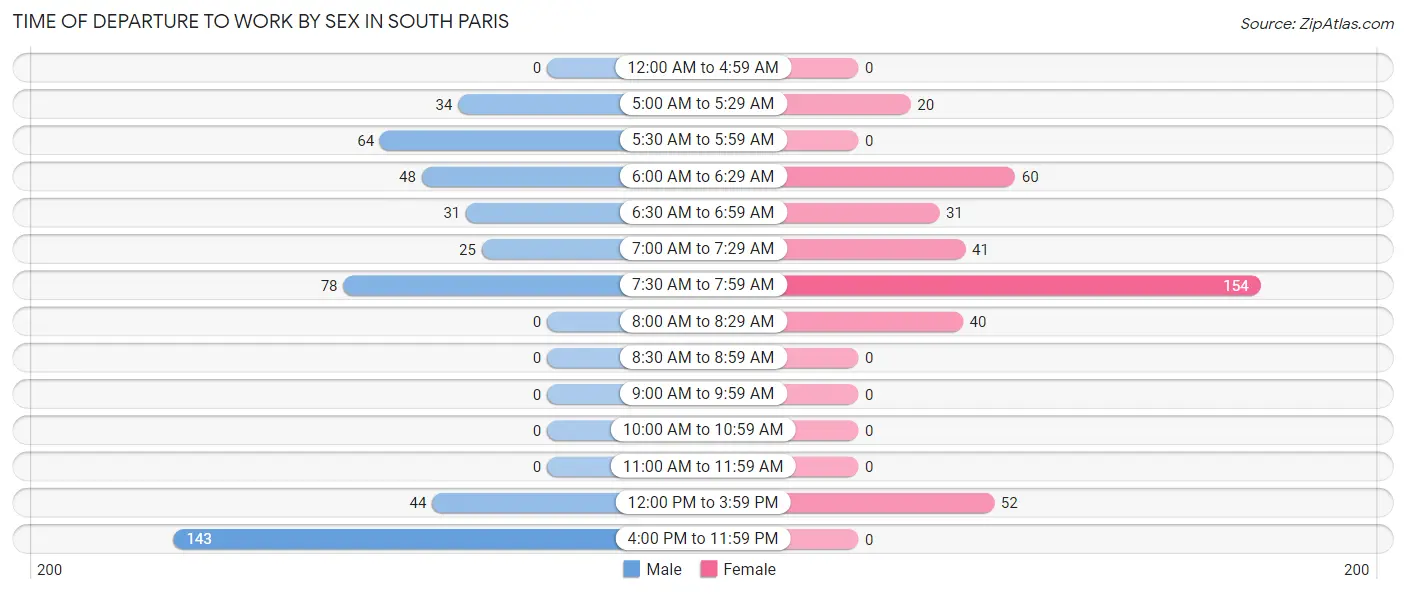
| Time of Departure | Male | Female |
| 12:00 AM to 4:59 AM | 0 (0.0%) | 0 (0.0%) |
| 5:00 AM to 5:29 AM | 34 (7.3%) | 20 (5.0%) |
| 5:30 AM to 5:59 AM | 64 (13.7%) | 0 (0.0%) |
| 6:00 AM to 6:29 AM | 48 (10.3%) | 60 (15.1%) |
| 6:30 AM to 6:59 AM | 31 (6.6%) | 31 (7.8%) |
| 7:00 AM to 7:29 AM | 25 (5.3%) | 41 (10.3%) |
| 7:30 AM to 7:59 AM | 78 (16.7%) | 154 (38.7%) |
| 8:00 AM to 8:29 AM | 0 (0.0%) | 40 (10.1%) |
| 8:30 AM to 8:59 AM | 0 (0.0%) | 0 (0.0%) |
| 9:00 AM to 9:59 AM | 0 (0.0%) | 0 (0.0%) |
| 10:00 AM to 10:59 AM | 0 (0.0%) | 0 (0.0%) |
| 11:00 AM to 11:59 AM | 0 (0.0%) | 0 (0.0%) |
| 12:00 PM to 3:59 PM | 44 (9.4%) | 52 (13.1%) |
| 4:00 PM to 11:59 PM | 143 (30.6%) | 0 (0.0%) |
| Total | 467 (100.0%) | 398 (100.0%) |
Housing Occupancy in South Paris
Occupancy by Ownership in South Paris
Of the total 986 dwellings in South Paris, owner-occupied units account for 566 (57.4%), while renter-occupied units make up 420 (42.6%).
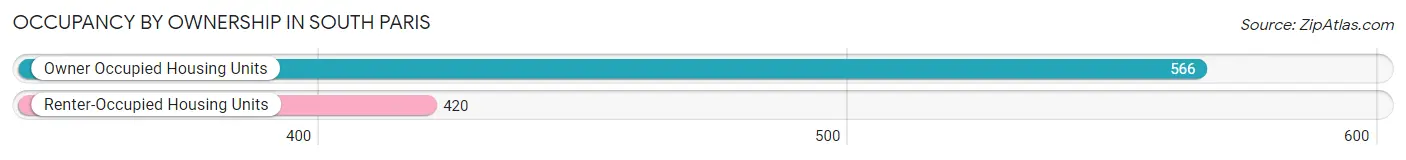
| Occupancy | # Housing Units | % Housing Units |
| Owner Occupied Housing Units | 566 | 57.4% |
| Renter-Occupied Housing Units | 420 | 42.6% |
| Total Occupied Housing Units | 986 | 100.0% |
Occupancy by Household Size in South Paris
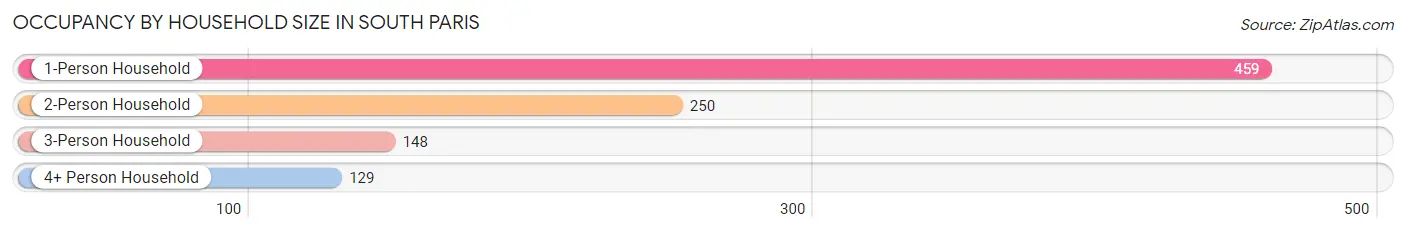
| Household Size | # Housing Units | % Housing Units |
| 1-Person Household | 459 | 46.6% |
| 2-Person Household | 250 | 25.4% |
| 3-Person Household | 148 | 15.0% |
| 4+ Person Household | 129 | 13.1% |
| Total Housing Units | 986 | 100.0% |
Occupancy by Ownership by Household Size in South Paris
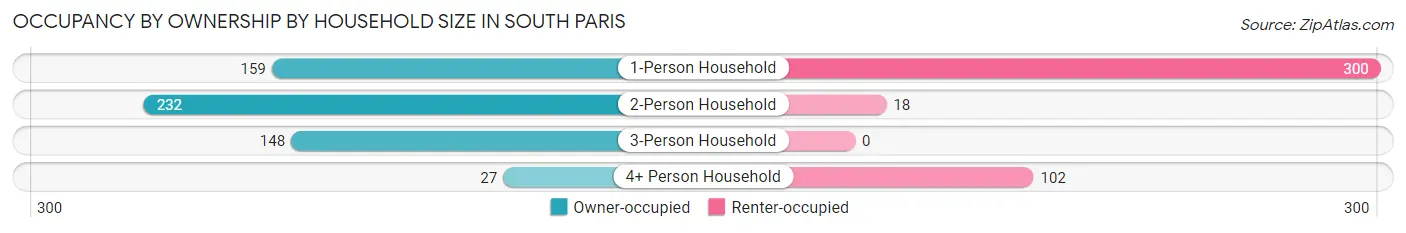
| Household Size | Owner-occupied | Renter-occupied |
| 1-Person Household | 159 (34.6%) | 300 (65.4%) |
| 2-Person Household | 232 (92.8%) | 18 (7.2%) |
| 3-Person Household | 148 (100.0%) | 0 (0.0%) |
| 4+ Person Household | 27 (20.9%) | 102 (79.1%) |
| Total Housing Units | 566 (57.4%) | 420 (42.6%) |
Occupancy by Educational Attainment in South Paris
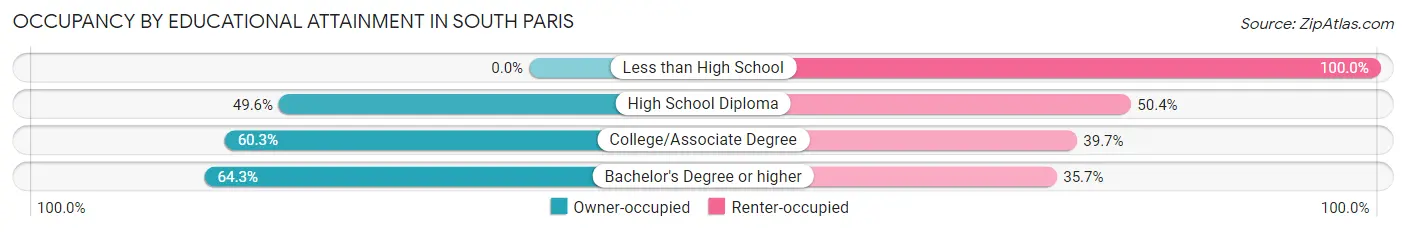
| Household Size | Owner-occupied | Renter-occupied |
| Less than High School | 0 (0.0%) | 22 (100.0%) |
| High School Diploma | 120 (49.6%) | 122 (50.4%) |
| College/Associate Degree | 275 (60.3%) | 181 (39.7%) |
| Bachelor's Degree or higher | 171 (64.3%) | 95 (35.7%) |
Occupancy by Age of Householder in South Paris
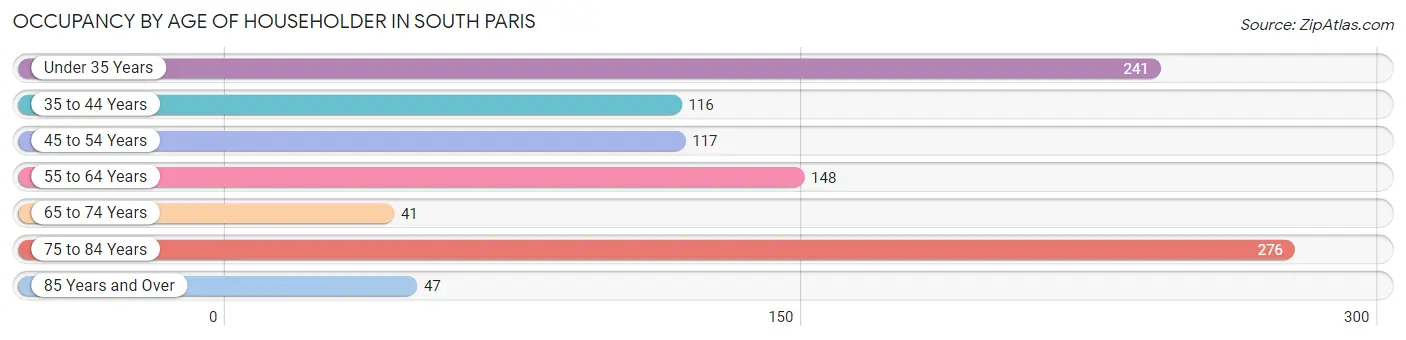
| Age Bracket | # Households | % Households |
| Under 35 Years | 241 | 24.4% |
| 35 to 44 Years | 116 | 11.8% |
| 45 to 54 Years | 117 | 11.9% |
| 55 to 64 Years | 148 | 15.0% |
| 65 to 74 Years | 41 | 4.2% |
| 75 to 84 Years | 276 | 28.0% |
| 85 Years and Over | 47 | 4.8% |
| Total | 986 | 100.0% |
Housing Finances in South Paris
Median Income by Occupancy in South Paris
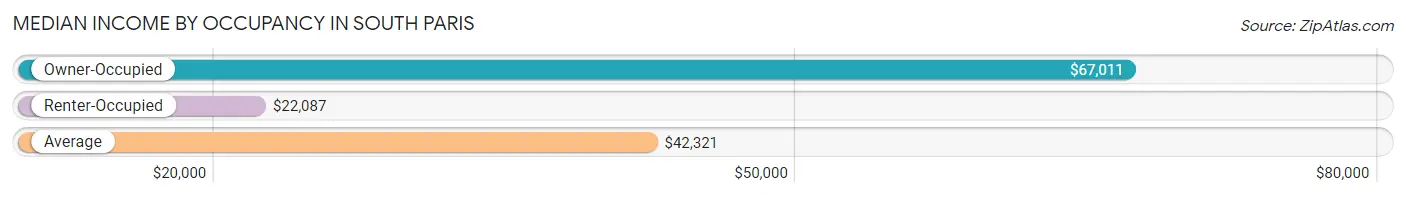
| Occupancy Type | # Households | Median Income |
| Owner-Occupied | 566 (57.4%) | $67,011 |
| Renter-Occupied | 420 (42.6%) | $22,087 |
| Average | 986 (100.0%) | $42,321 |
Occupancy by Householder Income Bracket in South Paris
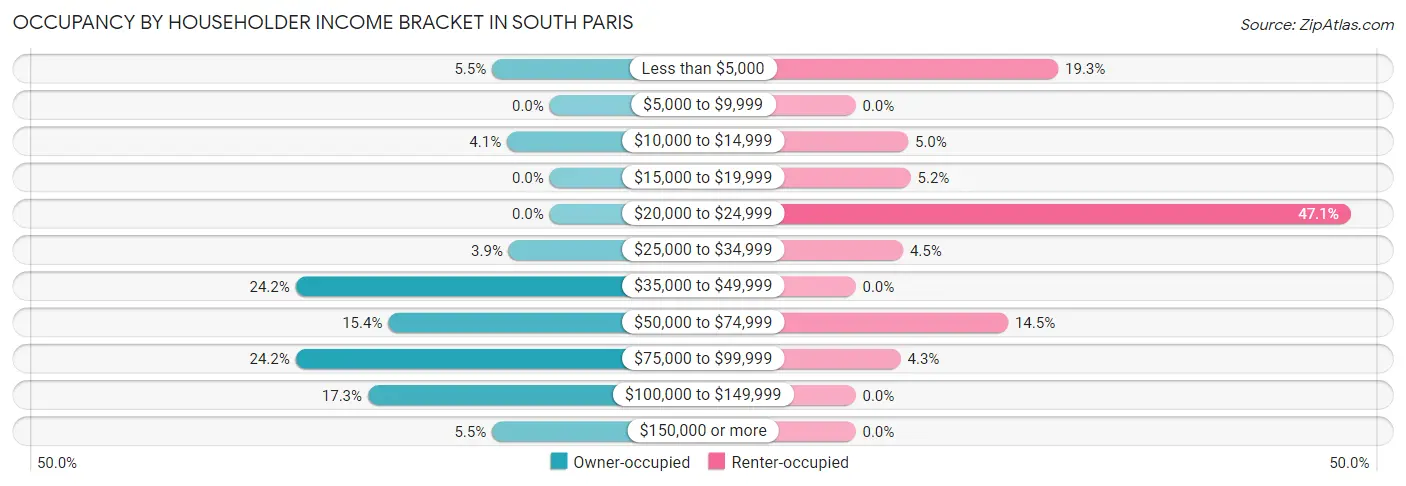
| Income Bracket | Owner-occupied | Renter-occupied |
| Less than $5,000 | 31 (5.5%) | 81 (19.3%) |
| $5,000 to $9,999 | 0 (0.0%) | 0 (0.0%) |
| $10,000 to $14,999 | 23 (4.1%) | 21 (5.0%) |
| $15,000 to $19,999 | 0 (0.0%) | 22 (5.2%) |
| $20,000 to $24,999 | 0 (0.0%) | 198 (47.1%) |
| $25,000 to $34,999 | 22 (3.9%) | 19 (4.5%) |
| $35,000 to $49,999 | 137 (24.2%) | 0 (0.0%) |
| $50,000 to $74,999 | 87 (15.4%) | 61 (14.5%) |
| $75,000 to $99,999 | 137 (24.2%) | 18 (4.3%) |
| $100,000 to $149,999 | 98 (17.3%) | 0 (0.0%) |
| $150,000 or more | 31 (5.5%) | 0 (0.0%) |
| Total | 566 (100.0%) | 420 (100.0%) |
Monthly Housing Cost Tiers in South Paris
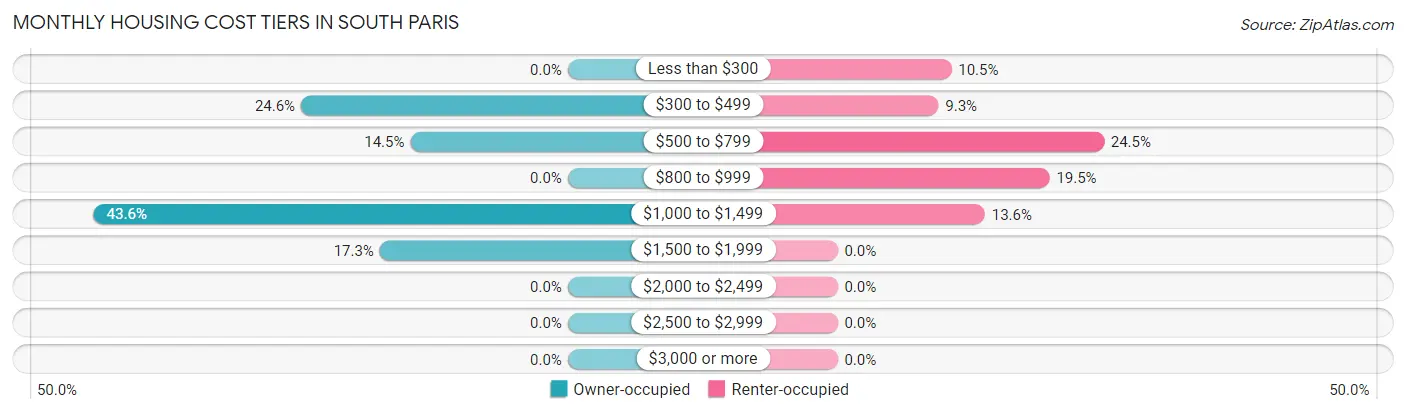
| Monthly Cost | Owner-occupied | Renter-occupied |
| Less than $300 | 0 (0.0%) | 44 (10.5%) |
| $300 to $499 | 139 (24.6%) | 39 (9.3%) |
| $500 to $799 | 82 (14.5%) | 103 (24.5%) |
| $800 to $999 | 0 (0.0%) | 82 (19.5%) |
| $1,000 to $1,499 | 247 (43.6%) | 57 (13.6%) |
| $1,500 to $1,999 | 98 (17.3%) | 0 (0.0%) |
| $2,000 to $2,499 | 0 (0.0%) | 0 (0.0%) |
| $2,500 to $2,999 | 0 (0.0%) | 0 (0.0%) |
| $3,000 or more | 0 (0.0%) | 0 (0.0%) |
| Total | 566 (100.0%) | 420 (100.0%) |
Physical Housing Characteristics in South Paris
Housing Structures in South Paris
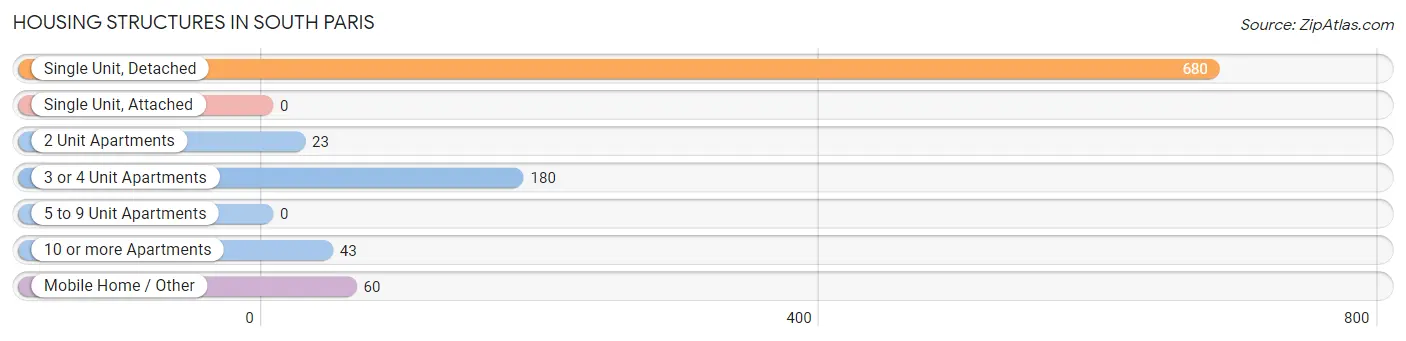
| Structure Type | # Housing Units | % Housing Units |
| Single Unit, Detached | 680 | 69.0% |
| Single Unit, Attached | 0 | 0.0% |
| 2 Unit Apartments | 23 | 2.3% |
| 3 or 4 Unit Apartments | 180 | 18.3% |
| 5 to 9 Unit Apartments | 0 | 0.0% |
| 10 or more Apartments | 43 | 4.4% |
| Mobile Home / Other | 60 | 6.1% |
| Total | 986 | 100.0% |
Housing Structures by Occupancy in South Paris
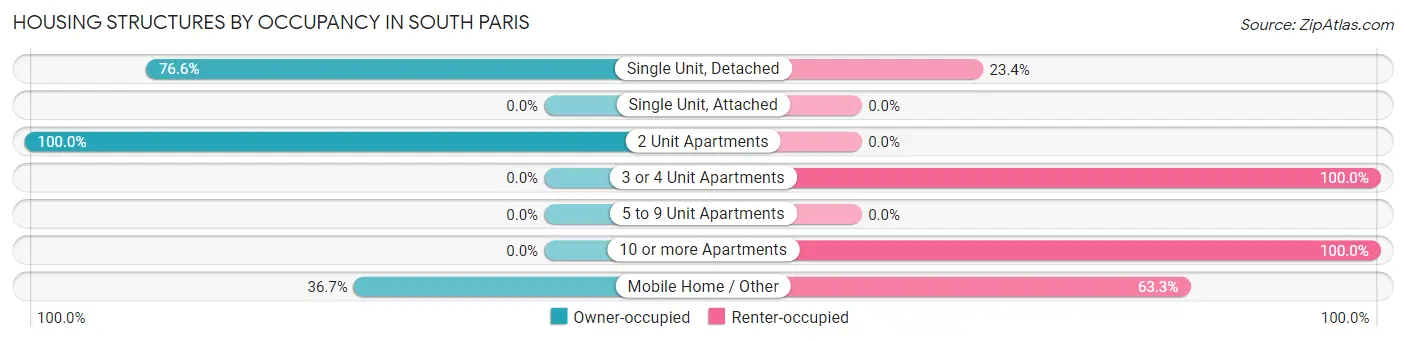
| Structure Type | Owner-occupied | Renter-occupied |
| Single Unit, Detached | 521 (76.6%) | 159 (23.4%) |
| Single Unit, Attached | 0 (0.0%) | 0 (0.0%) |
| 2 Unit Apartments | 23 (100.0%) | 0 (0.0%) |
| 3 or 4 Unit Apartments | 0 (0.0%) | 180 (100.0%) |
| 5 to 9 Unit Apartments | 0 (0.0%) | 0 (0.0%) |
| 10 or more Apartments | 0 (0.0%) | 43 (100.0%) |
| Mobile Home / Other | 22 (36.7%) | 38 (63.3%) |
| Total | 566 (57.4%) | 420 (42.6%) |
Housing Structures by Number of Rooms in South Paris
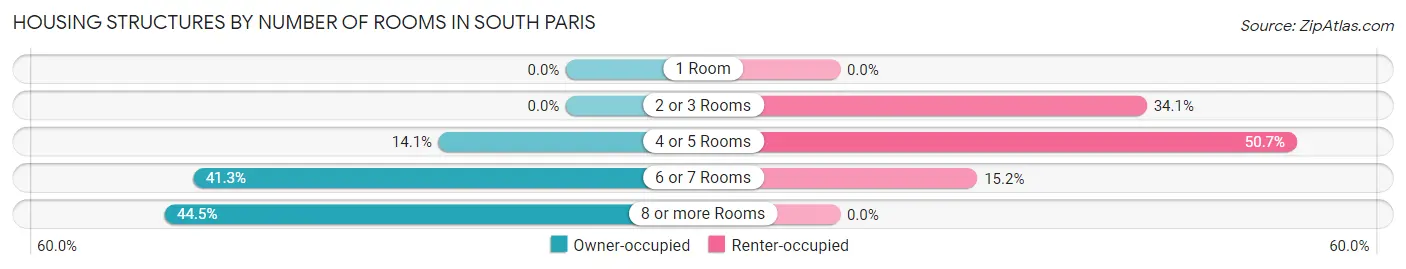
| Number of Rooms | Owner-occupied | Renter-occupied |
| 1 Room | 0 (0.0%) | 0 (0.0%) |
| 2 or 3 Rooms | 0 (0.0%) | 143 (34.1%) |
| 4 or 5 Rooms | 80 (14.1%) | 213 (50.7%) |
| 6 or 7 Rooms | 234 (41.3%) | 64 (15.2%) |
| 8 or more Rooms | 252 (44.5%) | 0 (0.0%) |
| Total | 566 (100.0%) | 420 (100.0%) |
Housing Structure by Heating Type in South Paris
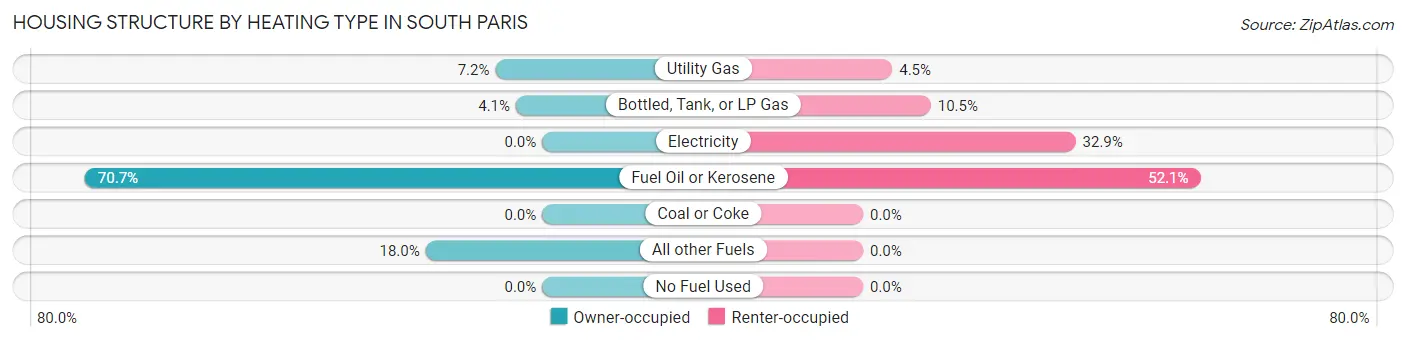
| Heating Type | Owner-occupied | Renter-occupied |
| Utility Gas | 41 (7.2%) | 19 (4.5%) |
| Bottled, Tank, or LP Gas | 23 (4.1%) | 44 (10.5%) |
| Electricity | 0 (0.0%) | 138 (32.9%) |
| Fuel Oil or Kerosene | 400 (70.7%) | 219 (52.1%) |
| Coal or Coke | 0 (0.0%) | 0 (0.0%) |
| All other Fuels | 102 (18.0%) | 0 (0.0%) |
| No Fuel Used | 0 (0.0%) | 0 (0.0%) |
| Total | 566 (100.0%) | 420 (100.0%) |
Household Vehicle Usage in South Paris
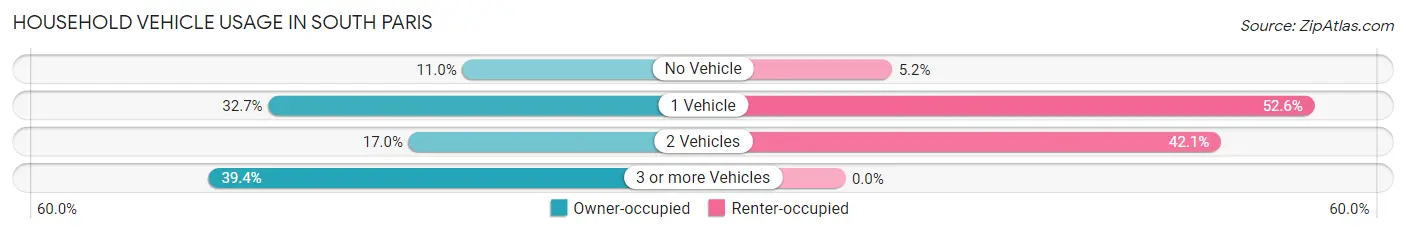
| Vehicles per Household | Owner-occupied | Renter-occupied |
| No Vehicle | 62 (11.0%) | 22 (5.2%) |
| 1 Vehicle | 185 (32.7%) | 221 (52.6%) |
| 2 Vehicles | 96 (17.0%) | 177 (42.1%) |
| 3 or more Vehicles | 223 (39.4%) | 0 (0.0%) |
| Total | 566 (100.0%) | 420 (100.0%) |
Real Estate & Mortgages in South Paris
Real Estate and Mortgage Overview in South Paris
| Characteristic | Without Mortgage | With Mortgage |
| Housing Units | 221 | 345 |
| Median Property Value | $146,000 | $173,700 |
| Median Household Income | $47,639 | $31 |
| Monthly Housing Costs | $443 | $0 |
| Real Estate Taxes | $1,879 | $0 |
Property Value by Mortgage Status in South Paris
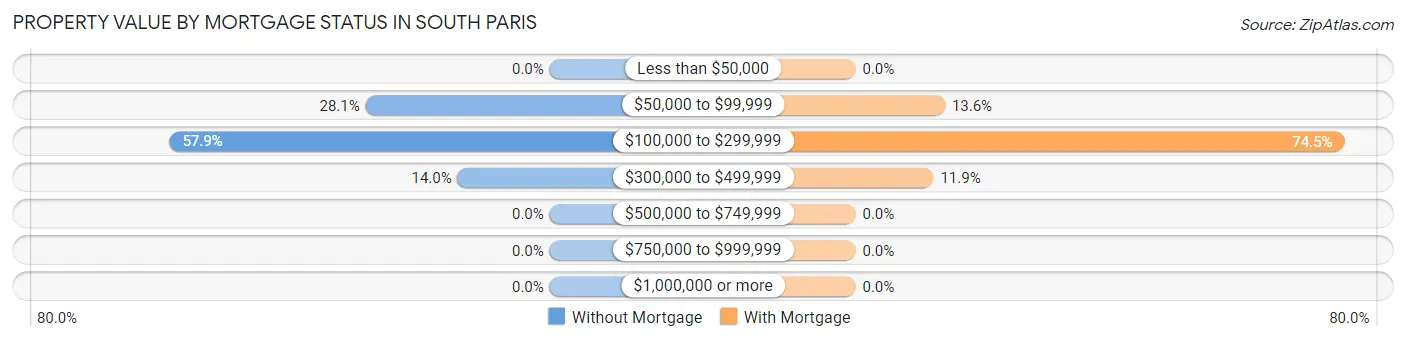
| Property Value | Without Mortgage | With Mortgage |
| Less than $50,000 | 0 (0.0%) | 0 (0.0%) |
| $50,000 to $99,999 | 62 (28.1%) | 47 (13.6%) |
| $100,000 to $299,999 | 128 (57.9%) | 257 (74.5%) |
| $300,000 to $499,999 | 31 (14.0%) | 41 (11.9%) |
| $500,000 to $749,999 | 0 (0.0%) | 0 (0.0%) |
| $750,000 to $999,999 | 0 (0.0%) | 0 (0.0%) |
| $1,000,000 or more | 0 (0.0%) | 0 (0.0%) |
| Total | 221 (100.0%) | 345 (100.0%) |
Household Income by Mortgage Status in South Paris
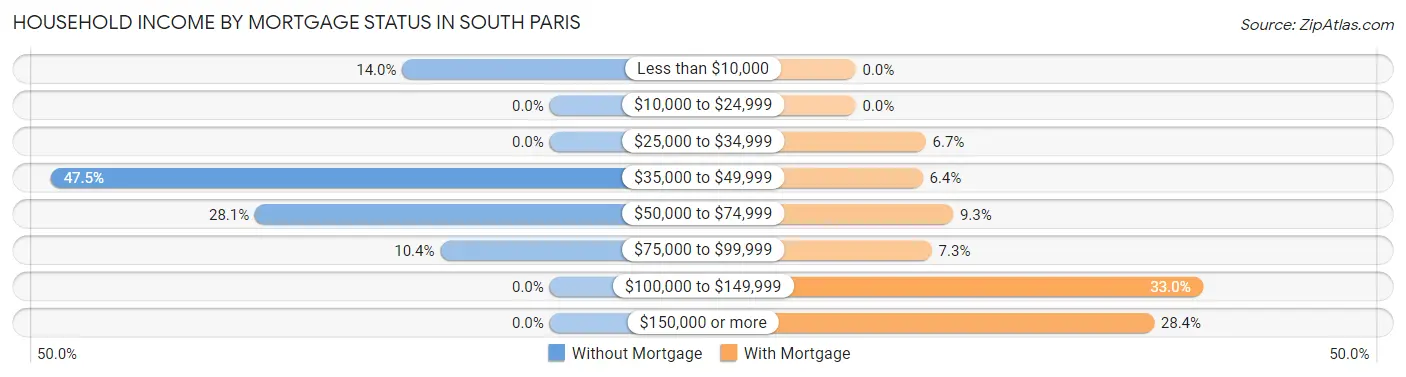
| Household Income | Without Mortgage | With Mortgage |
| Less than $10,000 | 31 (14.0%) | 0 (0.0%) |
| $10,000 to $24,999 | 0 (0.0%) | 0 (0.0%) |
| $25,000 to $34,999 | 0 (0.0%) | 23 (6.7%) |
| $35,000 to $49,999 | 105 (47.5%) | 22 (6.4%) |
| $50,000 to $74,999 | 62 (28.1%) | 32 (9.3%) |
| $75,000 to $99,999 | 23 (10.4%) | 25 (7.2%) |
| $100,000 to $149,999 | 0 (0.0%) | 114 (33.0%) |
| $150,000 or more | 0 (0.0%) | 98 (28.4%) |
| Total | 221 (100.0%) | 345 (100.0%) |
Property Value to Household Income Ratio in South Paris
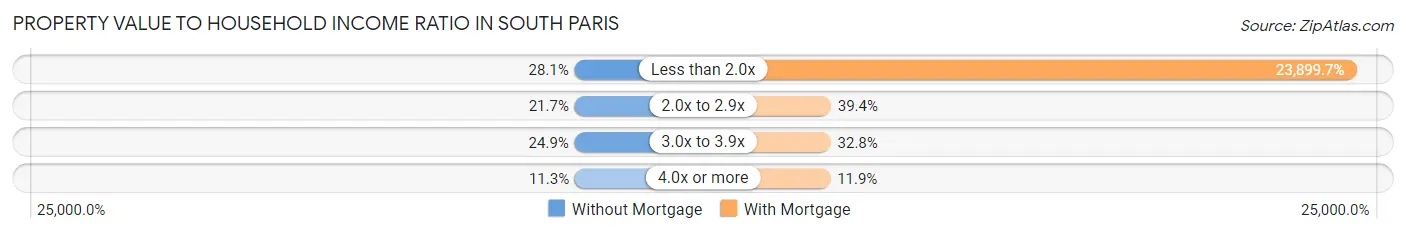
| Value-to-Income Ratio | Without Mortgage | With Mortgage |
| Less than 2.0x | 62 (28.1%) | 82,454 (23,899.7%) |
| 2.0x to 2.9x | 48 (21.7%) | 136 (39.4%) |
| 3.0x to 3.9x | 55 (24.9%) | 113 (32.8%) |
| 4.0x or more | 25 (11.3%) | 41 (11.9%) |
| Total | 221 (100.0%) | 345 (100.0%) |
Real Estate Taxes by Mortgage Status in South Paris
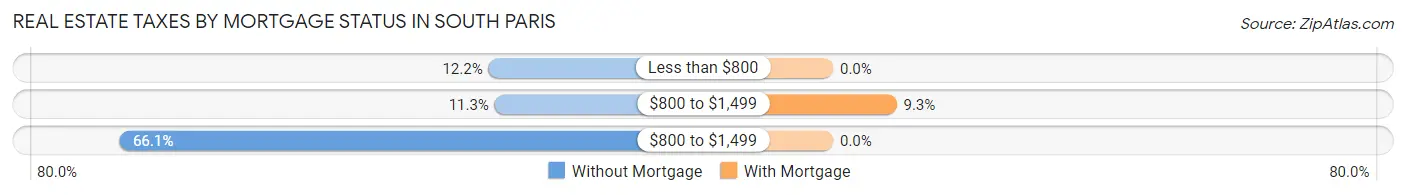
| Property Taxes | Without Mortgage | With Mortgage |
| Less than $800 | 27 (12.2%) | 0 (0.0%) |
| $800 to $1,499 | 25 (11.3%) | 32 (9.3%) |
| $800 to $1,499 | 146 (66.1%) | 0 (0.0%) |
| Total | 221 (100.0%) | 345 (100.0%) |
Health & Disability in South Paris
Health Insurance Coverage by Age in South Paris
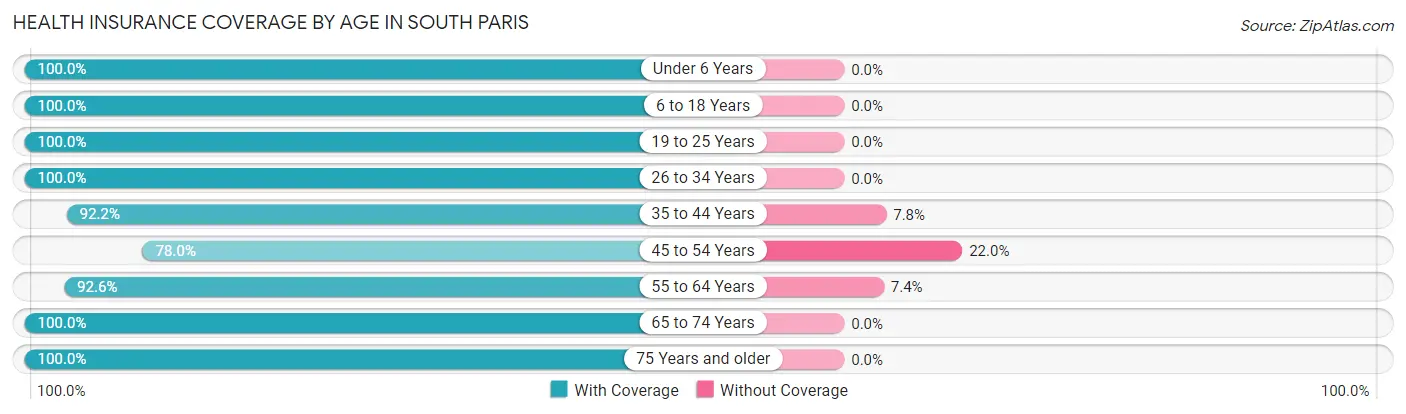
| Age Bracket | With Coverage | Without Coverage |
| Under 6 Years | 160 (100.0%) | 0 (0.0%) |
| 6 to 18 Years | 458 (100.0%) | 0 (0.0%) |
| 19 to 25 Years | 95 (100.0%) | 0 (0.0%) |
| 26 to 34 Years | 186 (100.0%) | 0 (0.0%) |
| 35 to 44 Years | 306 (92.2%) | 26 (7.8%) |
| 45 to 54 Years | 110 (78.0%) | 31 (22.0%) |
| 55 to 64 Years | 276 (92.6%) | 22 (7.4%) |
| 65 to 74 Years | 109 (100.0%) | 0 (0.0%) |
| 75 Years and older | 343 (100.0%) | 0 (0.0%) |
| Total | 2,043 (96.3%) | 79 (3.7%) |
Health Insurance Coverage by Citizenship Status in South Paris
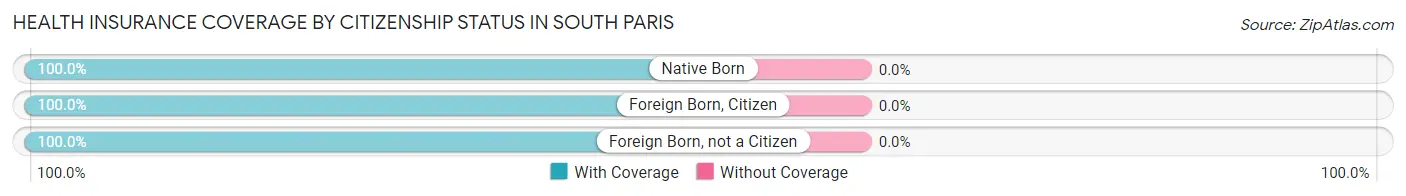
| Citizenship Status | With Coverage | Without Coverage |
| Native Born | 160 (100.0%) | 0 (0.0%) |
| Foreign Born, Citizen | 458 (100.0%) | 0 (0.0%) |
| Foreign Born, not a Citizen | 95 (100.0%) | 0 (0.0%) |
Health Insurance Coverage by Household Income in South Paris
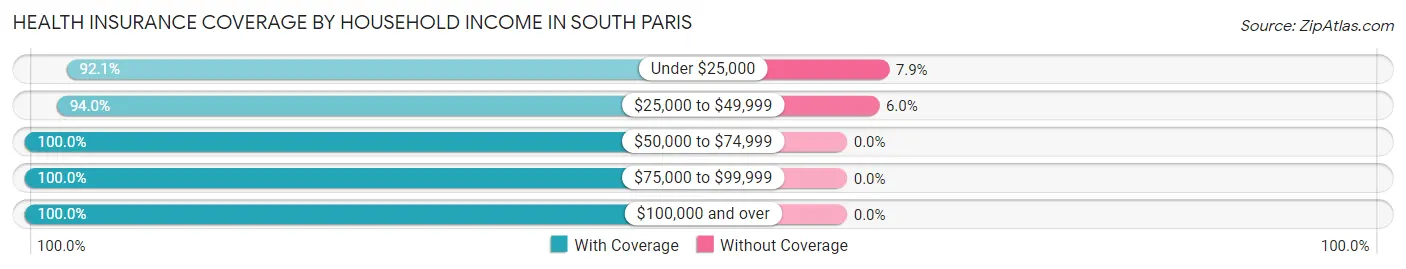
| Household Income | With Coverage | Without Coverage |
| Under $25,000 | 666 (92.1%) | 57 (7.9%) |
| $25,000 to $49,999 | 343 (94.0%) | 22 (6.0%) |
| $50,000 to $74,999 | 281 (100.0%) | 0 (0.0%) |
| $75,000 to $99,999 | 396 (100.0%) | 0 (0.0%) |
| $100,000 and over | 352 (100.0%) | 0 (0.0%) |
Public vs Private Health Insurance Coverage by Age in South Paris
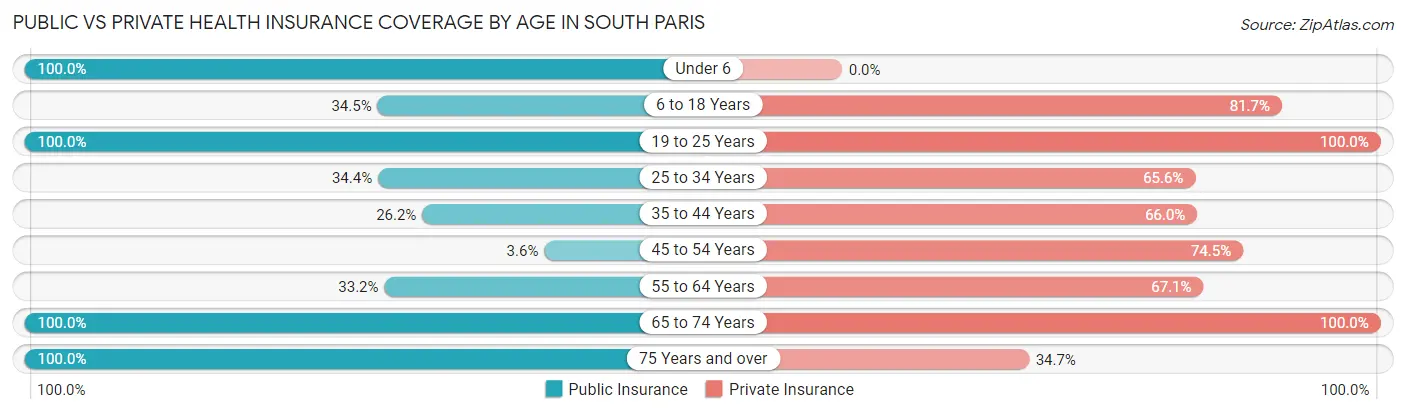
| Age Bracket | Public Insurance | Private Insurance |
| Under 6 | 160 (100.0%) | 0 (0.0%) |
| 6 to 18 Years | 158 (34.5%) | 374 (81.7%) |
| 19 to 25 Years | 95 (100.0%) | 95 (100.0%) |
| 25 to 34 Years | 64 (34.4%) | 122 (65.6%) |
| 35 to 44 Years | 87 (26.2%) | 219 (66.0%) |
| 45 to 54 Years | 5 (3.5%) | 105 (74.5%) |
| 55 to 64 Years | 99 (33.2%) | 200 (67.1%) |
| 65 to 74 Years | 109 (100.0%) | 109 (100.0%) |
| 75 Years and over | 343 (100.0%) | 119 (34.7%) |
| Total | 1,120 (52.8%) | 1,343 (63.3%) |
Disability Status by Sex by Age in South Paris
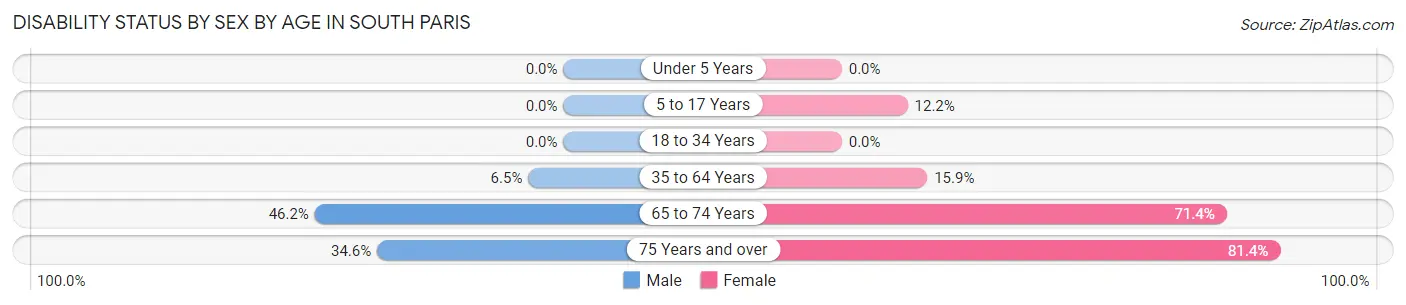
| Age Bracket | Male | Female |
| Under 5 Years | 0 (0.0%) | 0 (0.0%) |
| 5 to 17 Years | 0 (0.0%) | 26 (12.2%) |
| 18 to 34 Years | 0 (0.0%) | 0 (0.0%) |
| 35 to 64 Years | 26 (6.5%) | 59 (15.9%) |
| 65 to 74 Years | 18 (46.2%) | 50 (71.4%) |
| 75 Years and over | 37 (34.6%) | 192 (81.4%) |
Disability Class by Sex by Age in South Paris
Disability Class: Hearing Difficulty
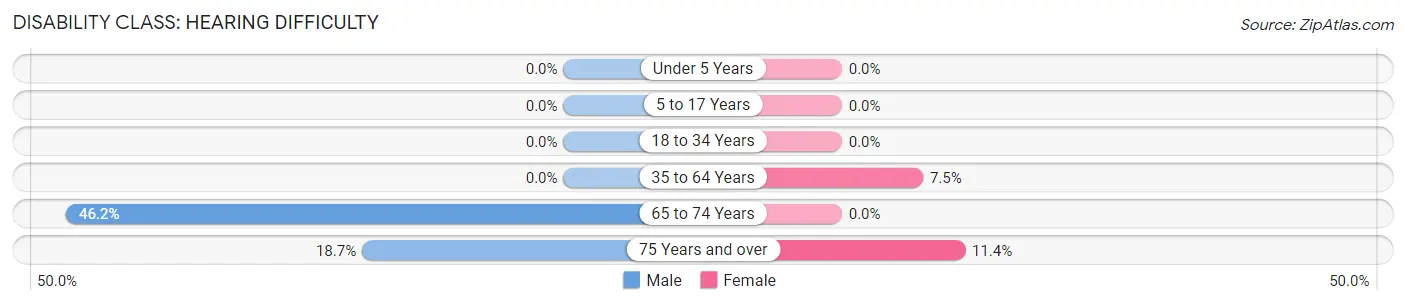
| Age Bracket | Male | Female |
| Under 5 Years | 0 (0.0%) | 0 (0.0%) |
| 5 to 17 Years | 0 (0.0%) | 0 (0.0%) |
| 18 to 34 Years | 0 (0.0%) | 0 (0.0%) |
| 35 to 64 Years | 0 (0.0%) | 28 (7.5%) |
| 65 to 74 Years | 18 (46.2%) | 0 (0.0%) |
| 75 Years and over | 20 (18.7%) | 27 (11.4%) |
Disability Class: Vision Difficulty
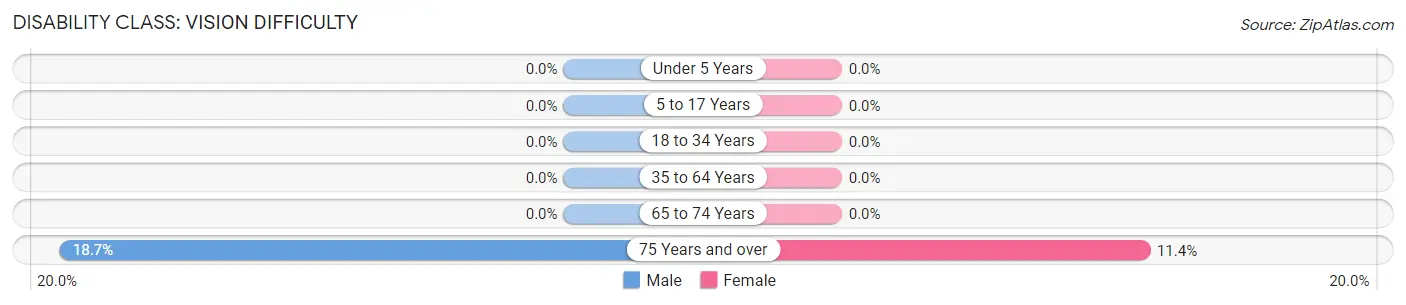
| Age Bracket | Male | Female |
| Under 5 Years | 0 (0.0%) | 0 (0.0%) |
| 5 to 17 Years | 0 (0.0%) | 0 (0.0%) |
| 18 to 34 Years | 0 (0.0%) | 0 (0.0%) |
| 35 to 64 Years | 0 (0.0%) | 0 (0.0%) |
| 65 to 74 Years | 0 (0.0%) | 0 (0.0%) |
| 75 Years and over | 20 (18.7%) | 27 (11.4%) |
Disability Class: Cognitive Difficulty
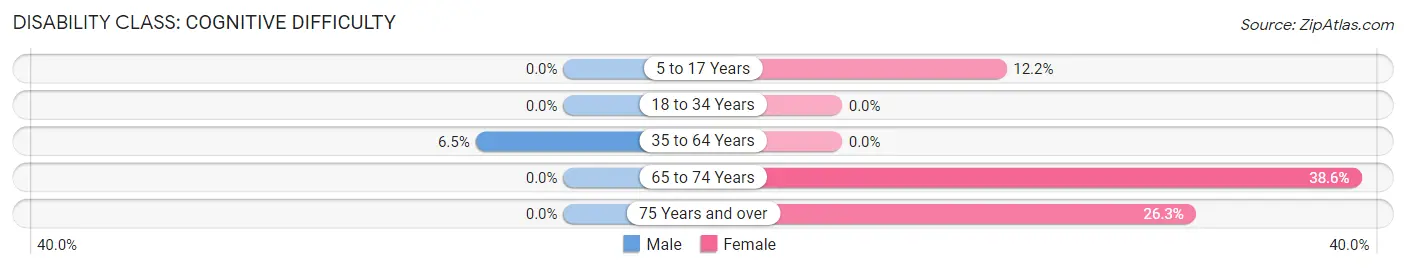
| Age Bracket | Male | Female |
| 5 to 17 Years | 0 (0.0%) | 26 (12.2%) |
| 18 to 34 Years | 0 (0.0%) | 0 (0.0%) |
| 35 to 64 Years | 26 (6.5%) | 0 (0.0%) |
| 65 to 74 Years | 0 (0.0%) | 27 (38.6%) |
| 75 Years and over | 0 (0.0%) | 62 (26.3%) |
Disability Class: Ambulatory Difficulty
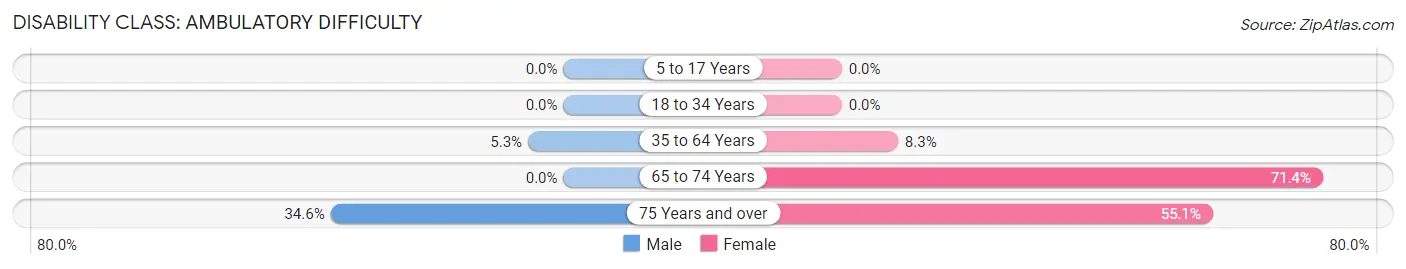
| Age Bracket | Male | Female |
| 5 to 17 Years | 0 (0.0%) | 0 (0.0%) |
| 18 to 34 Years | 0 (0.0%) | 0 (0.0%) |
| 35 to 64 Years | 21 (5.3%) | 31 (8.3%) |
| 65 to 74 Years | 0 (0.0%) | 50 (71.4%) |
| 75 Years and over | 37 (34.6%) | 130 (55.1%) |
Disability Class: Self-Care Difficulty
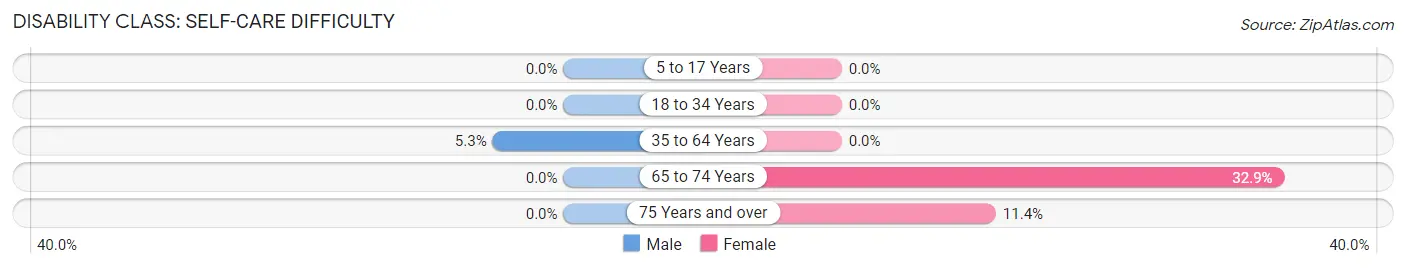
| Age Bracket | Male | Female |
| 5 to 17 Years | 0 (0.0%) | 0 (0.0%) |
| 18 to 34 Years | 0 (0.0%) | 0 (0.0%) |
| 35 to 64 Years | 21 (5.3%) | 0 (0.0%) |
| 65 to 74 Years | 0 (0.0%) | 23 (32.9%) |
| 75 Years and over | 0 (0.0%) | 27 (11.4%) |
Technology Access in South Paris
Computing Device Access in South Paris
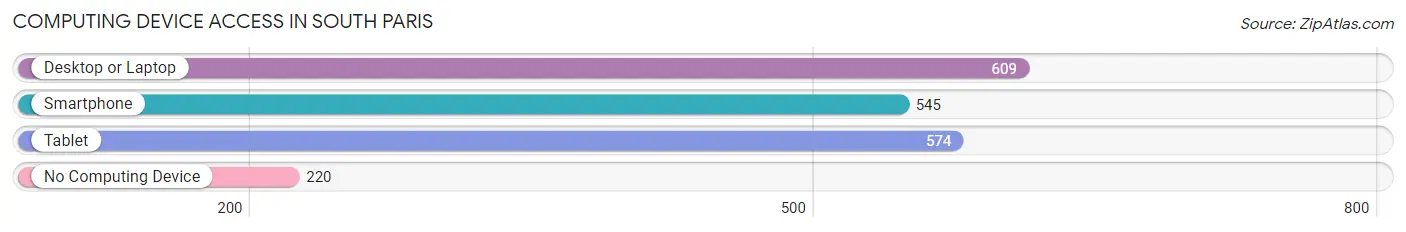
| Device Type | # Households | % Households |
| Desktop or Laptop | 609 | 61.8% |
| Smartphone | 545 | 55.3% |
| Tablet | 574 | 58.2% |
| No Computing Device | 220 | 22.3% |
| Total | 986 | 100.0% |
Internet Access in South Paris
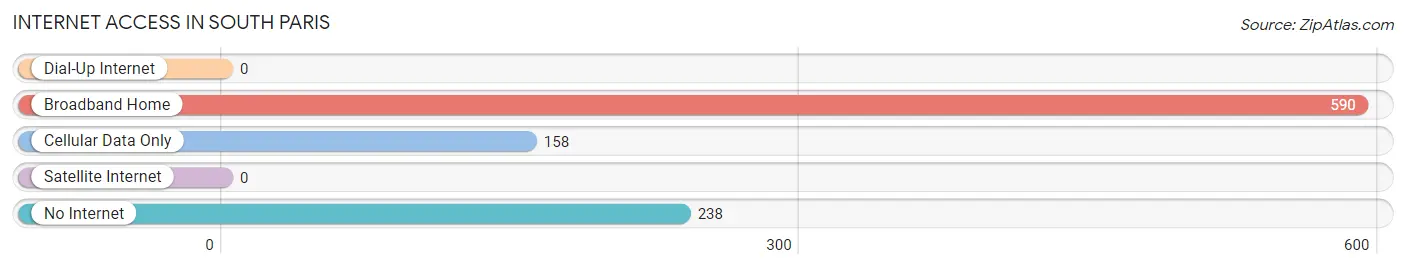
| Internet Type | # Households | % Households |
| Dial-Up Internet | 0 | 0.0% |
| Broadband Home | 590 | 59.8% |
| Cellular Data Only | 158 | 16.0% |
| Satellite Internet | 0 | 0.0% |
| No Internet | 238 | 24.1% |
| Total | 986 | 100.0% |
South Paris Summary
Paris, Maine is a town located in Oxford County, Maine, United States. The population was 2,719 at the 2010 census. It is part of the Lewiston-Auburn, Maine metropolitan statistical area.
History
The area that is now South Paris was first settled in 1779 by a group of settlers from Massachusetts. The town was originally known as New Pennacook Plantation, and was incorporated as Paris in 1793. The name was changed to South Paris in 1824 to avoid confusion with the city of Paris, Maine.
The town was an important center of industry in the 19th century, with several mills located along the Little Androscoggin River. The most important of these was the Oxford Paper Company, which was founded in 1872 and operated until the early 2000s.
Geography
South Paris is located at (44.1745, -70.5347). According to the United States Census Bureau, the town has a total area of 11.2 square miles (29.0 km2), of which 10.9 square miles (28.2 km2) is land and 0.3 square miles (0.8 km2) is water.
Economy
South Paris is a small town with a limited economy. The town is home to several small businesses, including a few restaurants, a grocery store, and a few retail stores. The Oxford Paper Company, which was founded in 1872, was the town's largest employer until it closed in the early 2000s.
Demographics
As of the census of 2010, there were 2,719 people, 1,093 households, and 690 families residing in the town. The population density was 248.3 people per square mile (95.7/km2). There were 1,183 housing units at an average density of 108.3 per square mile (41.9/km2). The racial makeup of the town was 97.2% White, 0.4% African American, 0.3% Native American, 0.4% Asian, 0.1% Pacific Islander, 0.3% from other races, and 1.3% from two or more races. Hispanic or Latino of any race were 1.2% of the population.
There were 1,093 households, out of which 30.2% had children under the age of 18 living with them, 46.2% were married couples living together, 13.2% had a female householder with no husband present, and 35.2% were non-families. 28.7% of all households were made up of individuals, and 12.2% had someone living alone who was 65 years of age or older. The average household size was 2.45 and the average family size was 2.97.
In the town, the population was spread out, with 24.7% under the age of 18, 8.2% from 18 to 24, 25.7% from 25 to 44, 25.2% from 45 to 64, and 16.2% who were 65 years of age or older. The median age was 38 years. For every 100 females, there were 91.2 males. For every 100 females age 18 and over, there were 87.2 males.
The median income for a household in the town was $33,958, and the median income for a family was $41,964. Males had a median income of $31,964 versus $25,000 for females. The per capita income for the town was $17,845. About 10.2% of families and 13.2% of the population were below the poverty line, including 17.2% of those under age 18 and 8.2% of those age 65 or over.
Common Questions
What is Per Capita Income in South Paris?
Per Capita income in South Paris is $24,727.
What is the Median Family Income in South Paris?
Median Family Income in South Paris is $49,861.
What is the Median Household income in South Paris?
Median Household Income in South Paris is $42,321.
What is Income or Wage Gap in South Paris?
Income or Wage Gap in South Paris is 27.9%.
Women in South Paris earn 72.1 cents for every dollar earned by a man.
What is Inequality or Gini Index in South Paris?
Inequality or Gini Index in South Paris is 0.43.
What is the Total Population of South Paris?
Total Population of South Paris is 2,208.
What is the Total Male Population of South Paris?
Total Male Population of South Paris is 1,049.
What is the Total Female Population of South Paris?
Total Female Population of South Paris is 1,159.
What is the Ratio of Males per 100 Females in South Paris?
There are 90.51 Males per 100 Females in South Paris.
What is the Ratio of Females per 100 Males in South Paris?
There are 110.49 Females per 100 Males in South Paris.
What is the Median Population Age in South Paris?
Median Population Age in South Paris is 39.5 Years.
What is the Average Family Size in South Paris
Average Family Size in South Paris is 2.9 People.
What is the Average Household Size in South Paris
Average Household Size in South Paris is 2.1 People.
How Large is the Labor Force in South Paris?
There are 971 People in the Labor Forcein in South Paris.
What is the Percentage of People in the Labor Force in South Paris?
60.0% of People are in the Labor Force in South Paris.
What is the Unemployment Rate in South Paris?
Unemployment Rate in South Paris is 2.8%.