Van Horn, TX Map & Demographics
Van Horn Map
Van Horn Overview
$30,113
PER CAPITA INCOME
$56,250
AVG FAMILY INCOME
$37,391
AVG HOUSEHOLD INCOME
42.5%
WAGE / INCOME GAP [ % ]
57.5¢/ $1
WAGE / INCOME GAP [ $ ]
0.42
INEQUALITY / GINI INDEX
2,075
TOTAL POPULATION
1,307
MALE POPULATION
768
FEMALE POPULATION
170.18
MALES / 100 FEMALES
58.76
FEMALES / 100 MALES
47.1
MEDIAN AGE
4.9
AVG FAMILY SIZE
3.6
AVG HOUSEHOLD SIZE
1,020
LABOR FORCE [ PEOPLE ]
57.9%
PERCENT IN LABOR FORCE
10.2%
UNEMPLOYMENT RATE
Van Horn Zip Codes
Van Horn Area Codes
Income in Van Horn
Income Overview in Van Horn
Per Capita Income in Van Horn is $30,113, while median incomes of families and households are $56,250 and $37,391 respectively.
| Characteristic | Number | Measure |
| Per Capita Income | 2,075 | $30,113 |
| Median Family Income | 307 | $56,250 |
| Mean Family Income | 307 | $56,304 |
| Median Household Income | 568 | $37,391 |
| Mean Household Income | 568 | $51,183 |
| Income Deficit | 307 | $0 |
| Wage / Income Gap (%) | 2,075 | 42.46% |
| Wage / Income Gap ($) | 2,075 | 57.54¢ per $1 |
| Gini / Inequality Index | 2,075 | 0.42 |
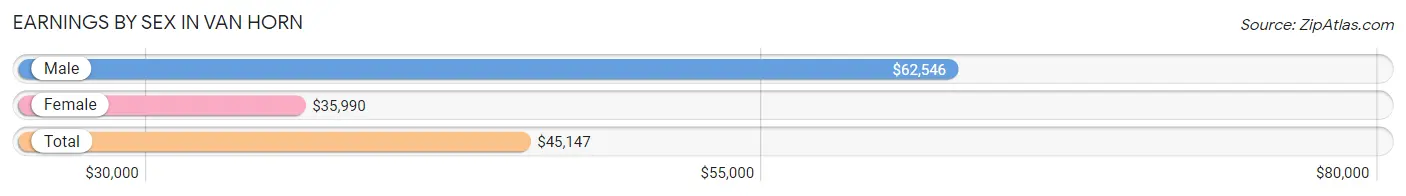
Earnings by Sex in Van Horn
Average Earnings in Van Horn are $45,147, $62,546 for men and $35,990 for women, a difference of 42.5%.
| Sex | Number | Average Earnings |
| Male | 678 (64.6%) | $62,546 |
| Female | 372 (35.4%) | $35,990 |
| Total | 1,050 (100.0%) | $45,147 |
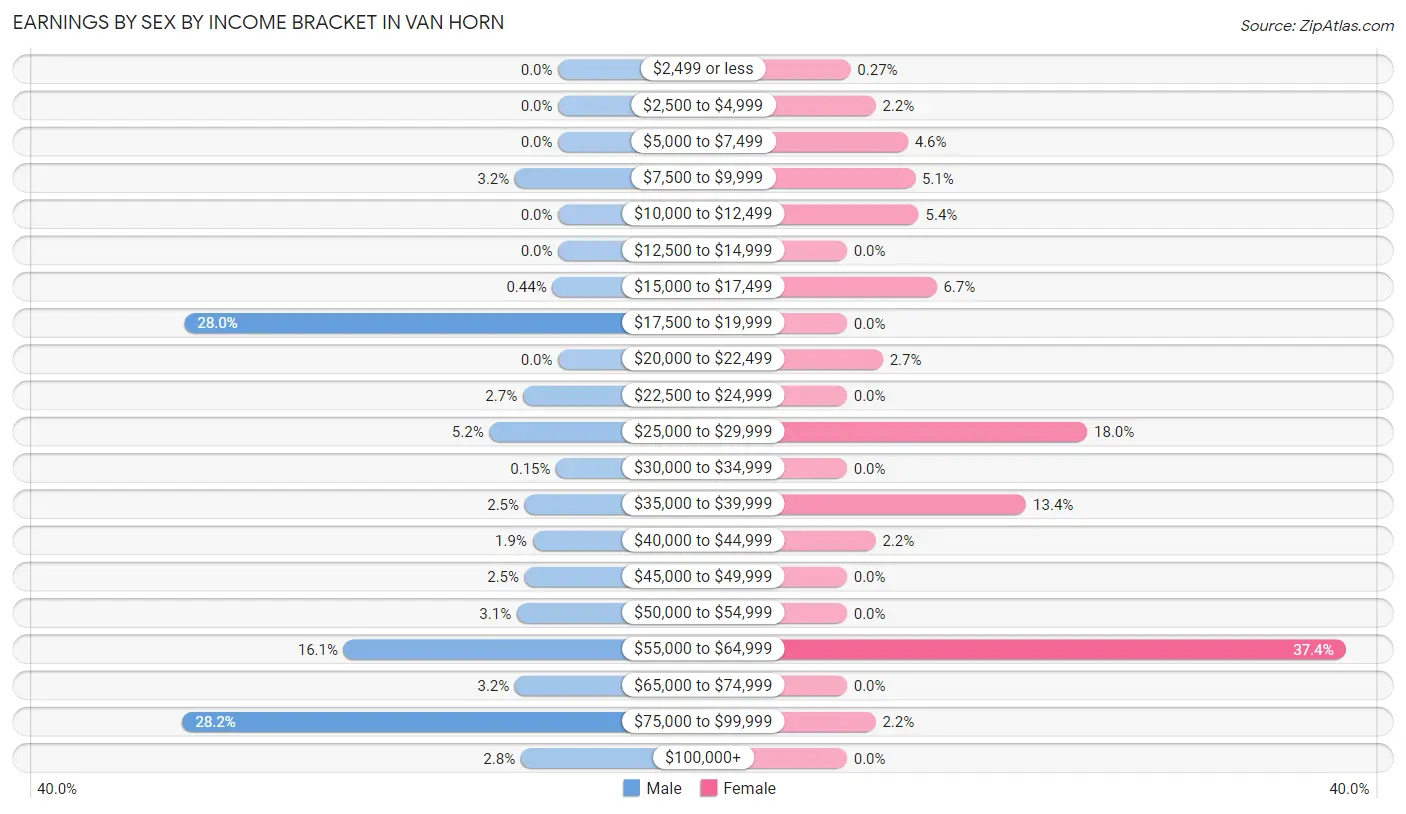
Earnings by Sex by Income Bracket in Van Horn
The most common earnings brackets in Van Horn are $75,000 to $99,999 for men (191 | 28.2%) and $55,000 to $64,999 for women (139 | 37.4%).
| Income | Male | Female |
| $2,499 or less | 0 (0.0%) | 1 (0.3%) |
| $2,500 to $4,999 | 0 (0.0%) | 8 (2.1%) |
| $5,000 to $7,499 | 0 (0.0%) | 17 (4.6%) |
| $7,500 to $9,999 | 22 (3.2%) | 19 (5.1%) |
| $10,000 to $12,499 | 0 (0.0%) | 20 (5.4%) |
| $12,500 to $14,999 | 0 (0.0%) | 0 (0.0%) |
| $15,000 to $17,499 | 3 (0.4%) | 25 (6.7%) |
| $17,500 to $19,999 | 190 (28.0%) | 0 (0.0%) |
| $20,000 to $22,499 | 0 (0.0%) | 10 (2.7%) |
| $22,500 to $24,999 | 18 (2.6%) | 0 (0.0%) |
| $25,000 to $29,999 | 35 (5.2%) | 67 (18.0%) |
| $30,000 to $34,999 | 1 (0.2%) | 0 (0.0%) |
| $35,000 to $39,999 | 17 (2.5%) | 50 (13.4%) |
| $40,000 to $44,999 | 13 (1.9%) | 8 (2.1%) |
| $45,000 to $49,999 | 17 (2.5%) | 0 (0.0%) |
| $50,000 to $54,999 | 21 (3.1%) | 0 (0.0%) |
| $55,000 to $64,999 | 109 (16.1%) | 139 (37.4%) |
| $65,000 to $74,999 | 22 (3.2%) | 0 (0.0%) |
| $75,000 to $99,999 | 191 (28.2%) | 8 (2.1%) |
| $100,000+ | 19 (2.8%) | 0 (0.0%) |
| Total | 678 (100.0%) | 372 (100.0%) |
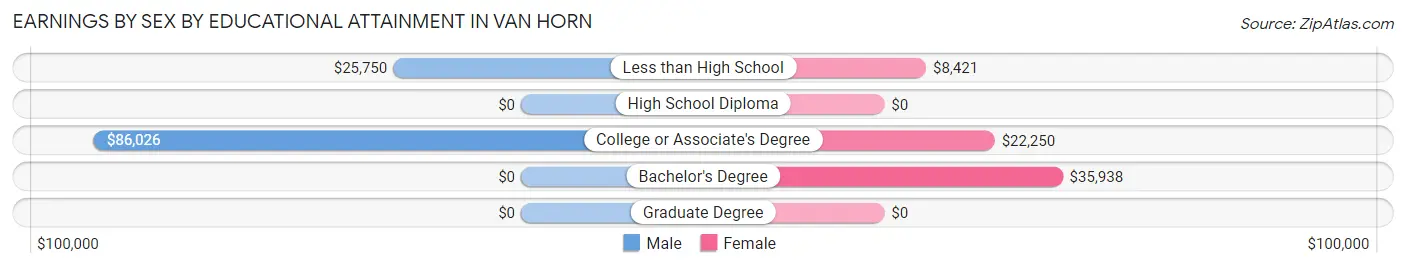
Earnings by Sex by Educational Attainment in Van Horn
| Educational Attainment | Male Income | Female Income |
| Less than High School | $25,750 | $8,421 |
| High School Diploma | - | - |
| College or Associate's Degree | $86,026 | $22,250 |
| Bachelor's Degree | - | - |
| Graduate Degree | - | - |
| Total | $63,670 | $0 |
Family Income in Van Horn
Family Income Brackets in Van Horn
According to the Van Horn family income data, there are 111 families falling into the $50,000 to $74,999 income range, which is the most common income bracket and makes up 36.2% of all families.
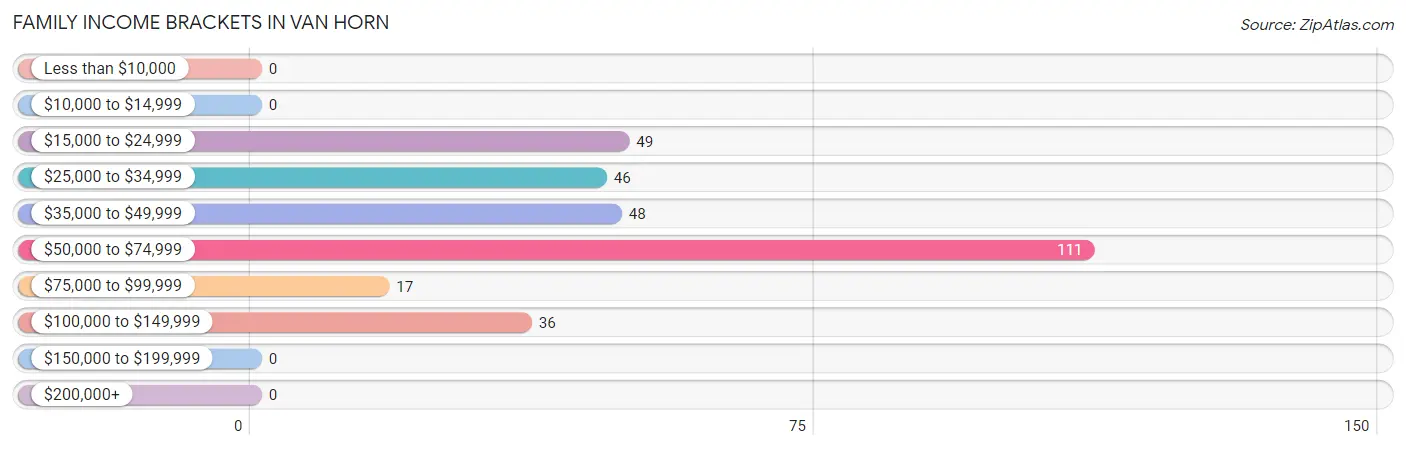
| Income Bracket | # Families | % Families |
| Less than $10,000 | 0 | 0.0% |
| $10,000 to $14,999 | 0 | 0.0% |
| $15,000 to $24,999 | 49 | 16.0% |
| $25,000 to $34,999 | 46 | 15.0% |
| $35,000 to $49,999 | 48 | 15.6% |
| $50,000 to $74,999 | 111 | 36.2% |
| $75,000 to $99,999 | 17 | 5.5% |
| $100,000 to $149,999 | 36 | 11.7% |
| $150,000 to $199,999 | 0 | 0.0% |
| $200,000+ | 0 | 0.0% |
Family Income by Famaliy Size in Van Horn
3-person families (34 | 11.1%) account for the highest median family income in Van Horn with $65,909 per family, while 2-person families (218 | 71.0%) have the highest median income of $23,158 per family member.
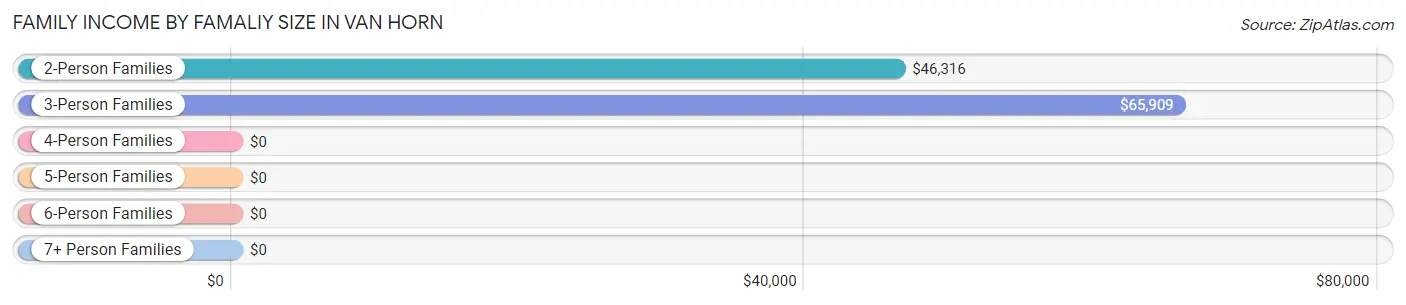
| Income Bracket | # Families | Median Income |
| 2-Person Families | 218 (71.0%) | $46,316 |
| 3-Person Families | 34 (11.1%) | $65,909 |
| 4-Person Families | 33 (10.7%) | $0 |
| 5-Person Families | 0 (0.0%) | $0 |
| 6-Person Families | 22 (7.2%) | $0 |
| 7+ Person Families | 0 (0.0%) | $0 |
| Total | 307 (100.0%) | $56,250 |
Family Income by Number of Earners in Van Horn
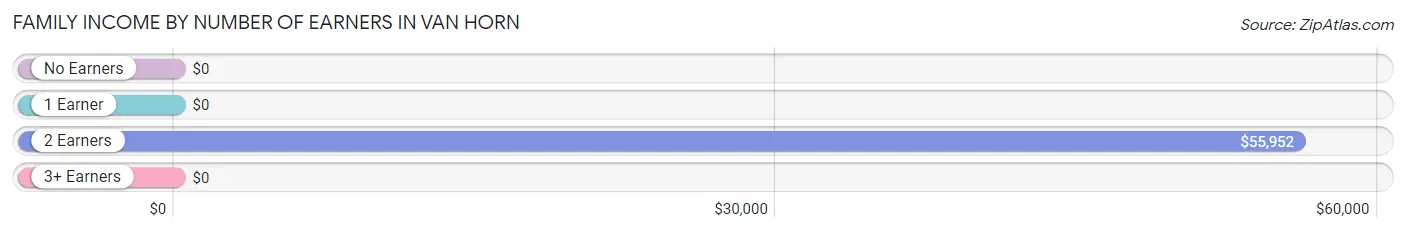
| Number of Earners | # Families | Median Income |
| No Earners | 85 (27.7%) | $0 |
| 1 Earner | 108 (35.2%) | $0 |
| 2 Earners | 82 (26.7%) | $55,952 |
| 3+ Earners | 32 (10.4%) | $0 |
| Total | 307 (100.0%) | $56,250 |
Household Income in Van Horn
Household Income Brackets in Van Horn
With 124 households falling in the category, the $50,000 to $74,999 income range is the most frequent in Van Horn, accounting for 21.8% of all households.
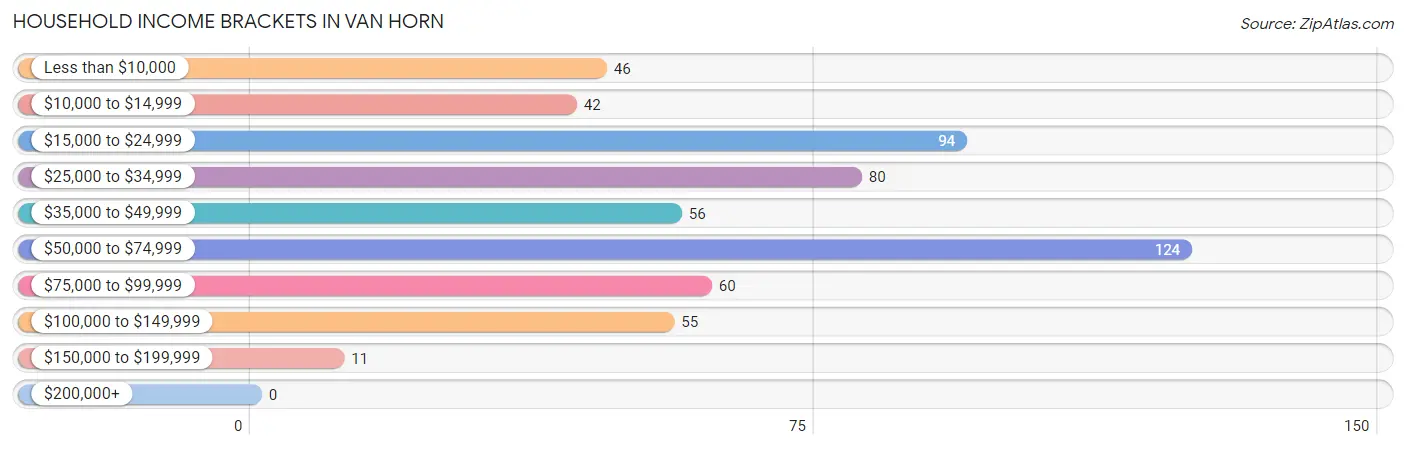
| Income Bracket | # Households | % Households |
| Less than $10,000 | 46 | 8.1% |
| $10,000 to $14,999 | 42 | 7.4% |
| $15,000 to $24,999 | 94 | 16.5% |
| $25,000 to $34,999 | 80 | 14.1% |
| $35,000 to $49,999 | 56 | 9.9% |
| $50,000 to $74,999 | 124 | 21.8% |
| $75,000 to $99,999 | 60 | 10.6% |
| $100,000 to $149,999 | 55 | 9.7% |
| $150,000 to $199,999 | 11 | 1.9% |
| $200,000+ | 0 | 0.0% |
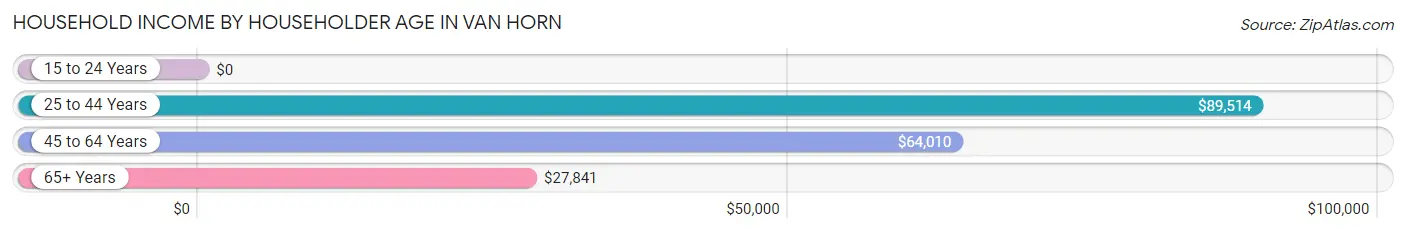
Household Income by Householder Age in Van Horn
The median household income in Van Horn is $37,391, with the highest median household income of $89,514 found in the 25 to 44 years age bracket for the primary householder. A total of 95 households (16.7%) fall into this category. Meanwhile, the 15 to 24 years age bracket for the primary householder has the lowest median household income of $0, with 3 households (0.5%) in this group.
| Income Bracket | # Households | Median Income |
| 15 to 24 Years | 3 (0.5%) | $0 |
| 25 to 44 Years | 95 (16.7%) | $89,514 |
| 45 to 64 Years | 137 (24.1%) | $64,010 |
| 65+ Years | 333 (58.6%) | $27,841 |
| Total | 568 (100.0%) | $37,391 |
Poverty in Van Horn
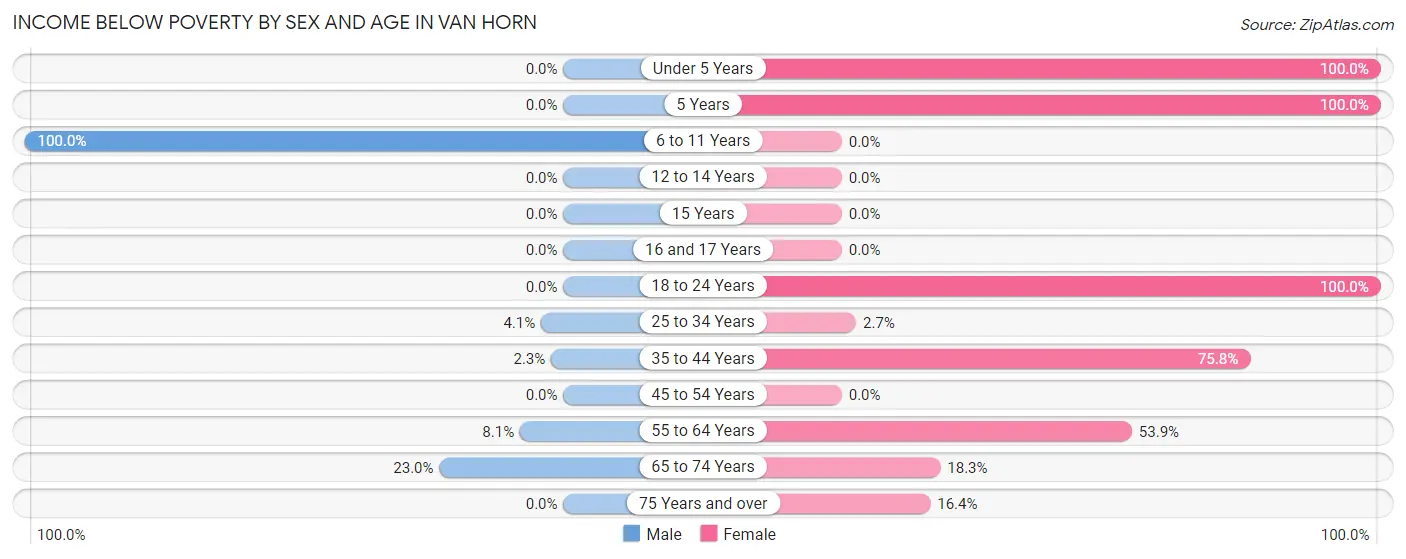
Income Below Poverty by Sex and Age in Van Horn
With 15.8% poverty level for males and 27.4% for females among the residents of Van Horn, 6 to 11 year old males and under 5 year old females are the most vulnerable to poverty, with 154 males (100.0%) and 33 females (100.0%) in their respective age groups living below the poverty level.
| Age Bracket | Male | Female |
| Under 5 Years | 0 (0.0%) | 33 (100.0%) |
| 5 Years | 0 (0.0%) | 34 (100.0%) |
| 6 to 11 Years | 154 (100.0%) | 0 (0.0%) |
| 12 to 14 Years | 0 (0.0%) | 0 (0.0%) |
| 15 Years | 0 (0.0%) | 0 (0.0%) |
| 16 and 17 Years | 0 (0.0%) | 0 (0.0%) |
| 18 to 24 Years | 0 (0.0%) | 54 (100.0%) |
| 25 to 34 Years | 7 (4.1%) | 3 (2.6%) |
| 35 to 44 Years | 4 (2.3%) | 25 (75.8%) |
| 45 to 54 Years | 0 (0.0%) | 0 (0.0%) |
| 55 to 64 Years | 7 (8.1%) | 35 (53.8%) |
| 65 to 74 Years | 32 (23.0%) | 15 (18.3%) |
| 75 Years and over | 0 (0.0%) | 11 (16.4%) |
| Total | 204 (15.8%) | 210 (27.4%) |
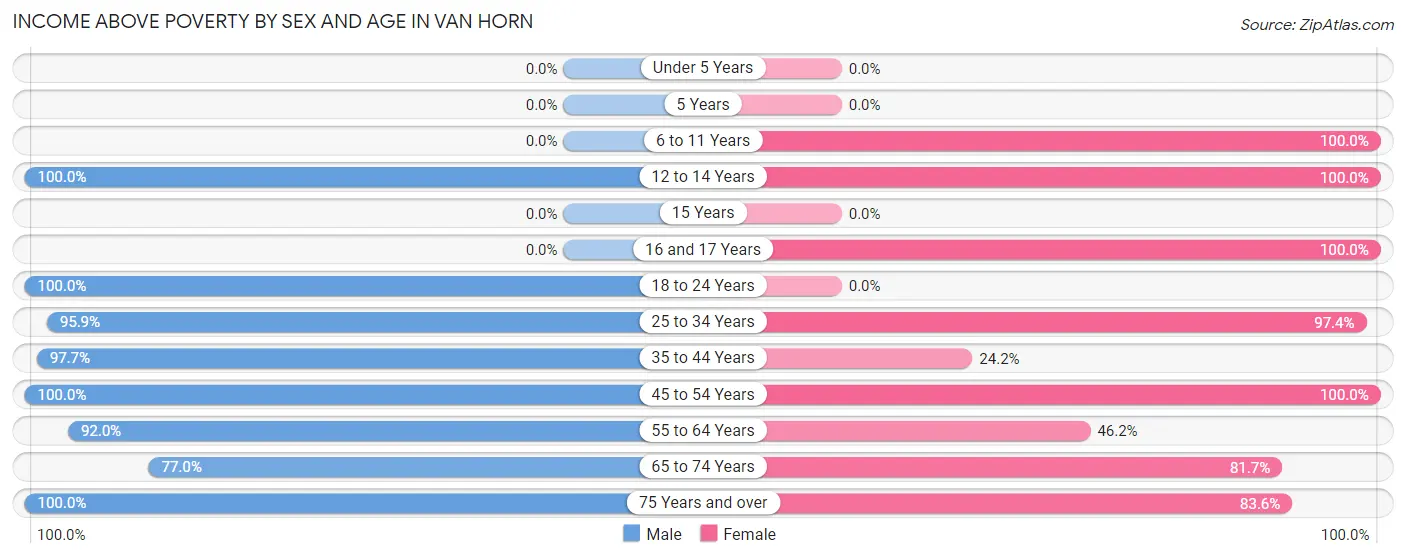
Income Above Poverty by Sex and Age in Van Horn
According to the poverty statistics in Van Horn, males aged 12 to 14 years and females aged 6 to 11 years are the age groups that are most secure financially, with 100.0% of males and 100.0% of females in these age groups living above the poverty line.
| Age Bracket | Male | Female |
| Under 5 Years | 0 (0.0%) | 0 (0.0%) |
| 5 Years | 0 (0.0%) | 0 (0.0%) |
| 6 to 11 Years | 0 (0.0%) | 43 (100.0%) |
| 12 to 14 Years | 35 (100.0%) | 14 (100.0%) |
| 15 Years | 0 (0.0%) | 0 (0.0%) |
| 16 and 17 Years | 0 (0.0%) | 19 (100.0%) |
| 18 to 24 Years | 98 (100.0%) | 0 (0.0%) |
| 25 to 34 Years | 162 (95.9%) | 110 (97.4%) |
| 35 to 44 Years | 172 (97.7%) | 8 (24.2%) |
| 45 to 54 Years | 338 (100.0%) | 209 (100.0%) |
| 55 to 64 Years | 80 (91.9%) | 30 (46.2%) |
| 65 to 74 Years | 107 (77.0%) | 67 (81.7%) |
| 75 Years and over | 98 (100.0%) | 56 (83.6%) |
| Total | 1,090 (84.2%) | 556 (72.6%) |
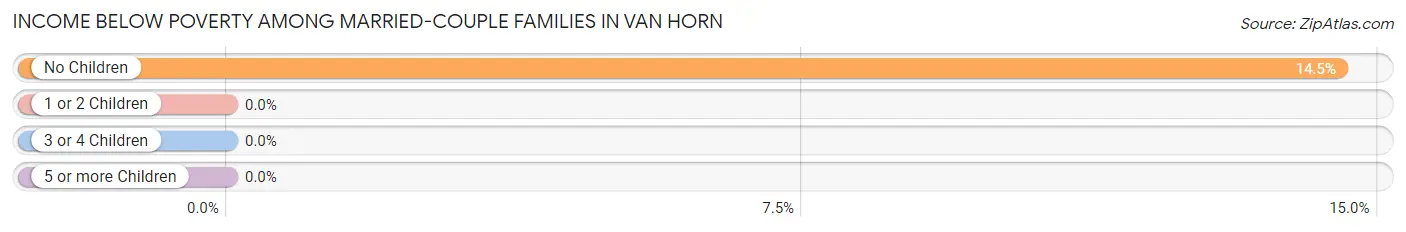
Income Below Poverty Among Married-Couple Families in Van Horn
The poverty statistics for married-couple families in Van Horn show that 11.2% or 20 of the total 179 families live below the poverty line. Families with no children have the highest poverty rate of 14.5%, comprising of 20 families. On the other hand, families with 1 or 2 children have the lowest poverty rate of 0.0%, which includes 0 families.
| Children | Above Poverty | Below Poverty |
| No Children | 118 (85.5%) | 20 (14.5%) |
| 1 or 2 Children | 19 (100.0%) | 0 (0.0%) |
| 3 or 4 Children | 22 (100.0%) | 0 (0.0%) |
| 5 or more Children | 0 (0.0%) | 0 (0.0%) |
| Total | 159 (88.8%) | 20 (11.2%) |
Income Below Poverty Among Single-Parent Households in Van Horn
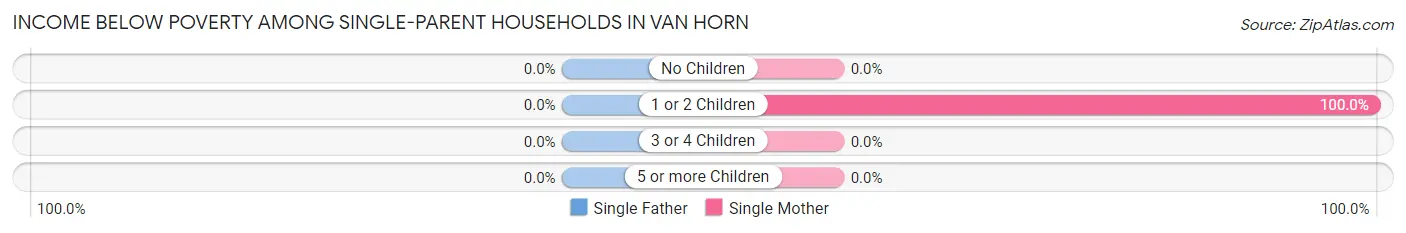
| Children | Single Father | Single Mother |
| No Children | 0 (0.0%) | 0 (0.0%) |
| 1 or 2 Children | 0 (0.0%) | 28 (100.0%) |
| 3 or 4 Children | 0 (0.0%) | 0 (0.0%) |
| 5 or more Children | 0 (0.0%) | 0 (0.0%) |
| Total | 0 (0.0%) | 28 (52.8%) |
Income Below Poverty Among Married-Couple vs Single-Parent Households in Van Horn
The poverty data for Van Horn shows that 20 of the married-couple family households (11.2%) and 28 of the single-parent households (21.9%) are living below the poverty level. Within the married-couple family households, those with no children have the highest poverty rate, with 20 households (14.5%) falling below the poverty line. Among the single-parent households, those with 1 or 2 children have the highest poverty rate, with 28 household (100.0%) living below poverty.
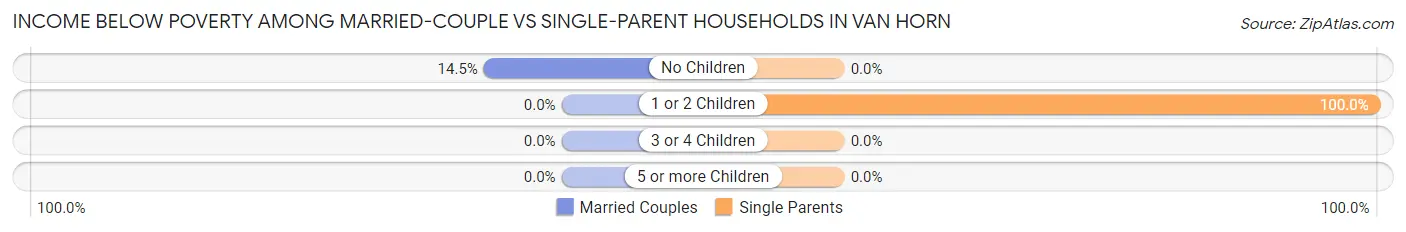
| Children | Married-Couple Families | Single-Parent Households |
| No Children | 20 (14.5%) | 0 (0.0%) |
| 1 or 2 Children | 0 (0.0%) | 28 (100.0%) |
| 3 or 4 Children | 0 (0.0%) | 0 (0.0%) |
| 5 or more Children | 0 (0.0%) | 0 (0.0%) |
| Total | 20 (11.2%) | 28 (21.9%) |
Race in Van Horn
The most populous races in Van Horn are Hispanic or Latino (1,689 | 81.4%), White / Caucasian (905 | 43.6%), and Two or more Races (777 | 37.4%).
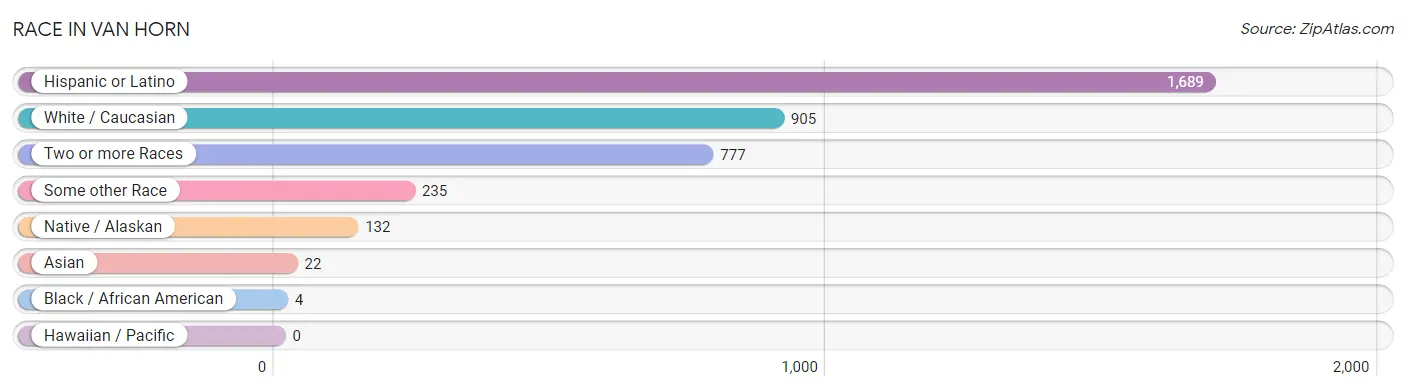
| Race | # Population | % Population |
| Asian | 22 | 1.1% |
| Black / African American | 4 | 0.2% |
| Hawaiian / Pacific | 0 | 0.0% |
| Hispanic or Latino | 1,689 | 81.4% |
| Native / Alaskan | 132 | 6.4% |
| White / Caucasian | 905 | 43.6% |
| Two or more Races | 777 | 37.4% |
| Some other Race | 235 | 11.3% |
| Total | 2,075 | 100.0% |
Ancestry in Van Horn
The most populous ancestries reported in Van Horn are Mexican (1,654 | 79.7%), German (113 | 5.4%), Navajo (109 | 5.2%), Irish (75 | 3.6%), and American (47 | 2.3%), together accounting for 96.3% of all Van Horn residents.
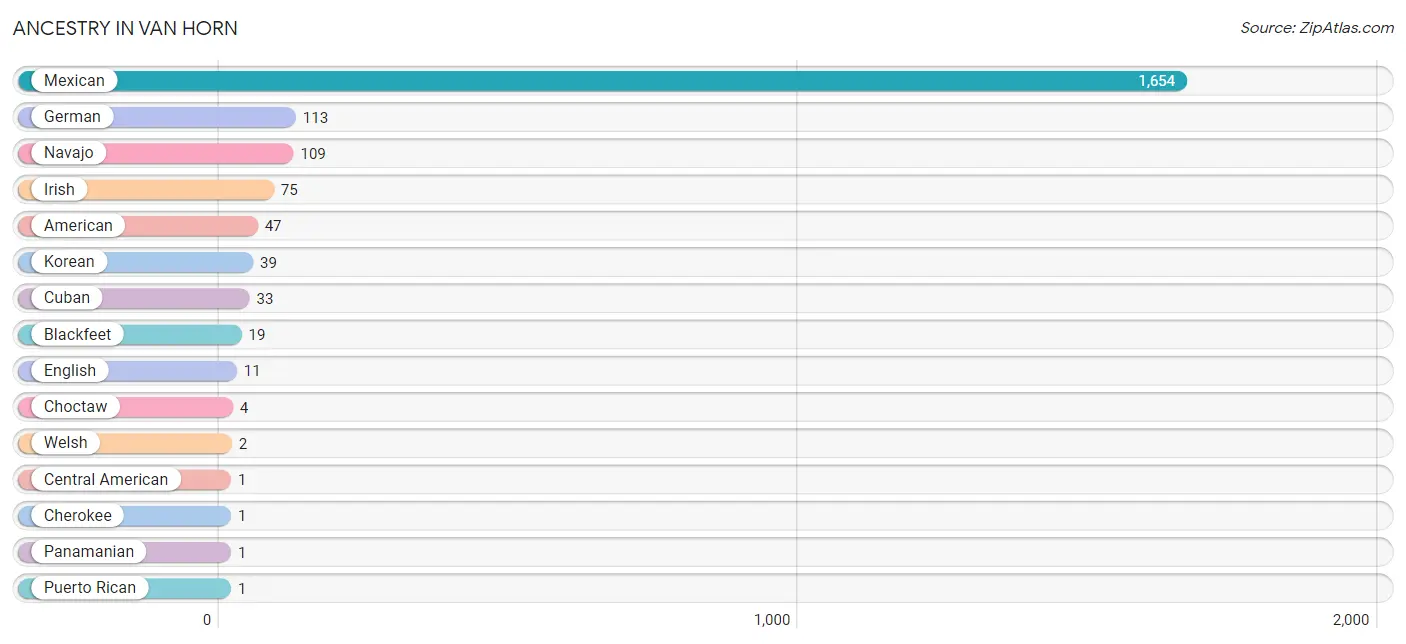
| Ancestry | # Population | % Population |
| American | 47 | 2.3% |
| Blackfeet | 19 | 0.9% |
| Central American | 1 | 0.1% |
| Cherokee | 1 | 0.1% |
| Choctaw | 4 | 0.2% |
| Cuban | 33 | 1.6% |
| English | 11 | 0.5% |
| German | 113 | 5.4% |
| Irish | 75 | 3.6% |
| Korean | 39 | 1.9% |
| Mexican | 1,654 | 79.7% |
| Navajo | 109 | 5.2% |
| Panamanian | 1 | 0.1% |
| Puerto Rican | 1 | 0.1% |
| Welsh | 2 | 0.1% | View All 15 Rows |
Immigrants in Van Horn
The most numerous immigrant groups reported in Van Horn came from Central America (164 | 7.9%), Latin America (164 | 7.9%), Mexico (164 | 7.9%), Asia (8 | 0.4%), and Philippines (8 | 0.4%), together accounting for 24.5% of all Van Horn residents.
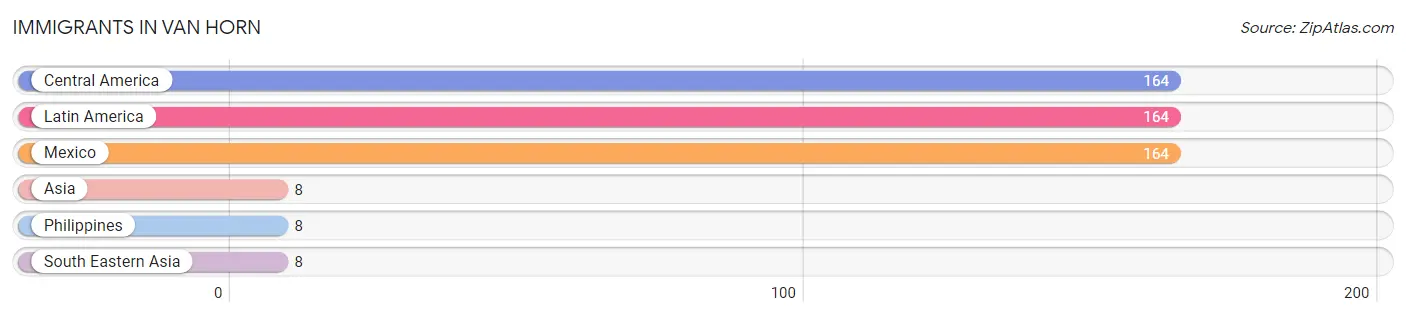
| Immigration Origin | # Population | % Population |
| Asia | 8 | 0.4% |
| Central America | 164 | 7.9% |
| Latin America | 164 | 7.9% |
| Mexico | 164 | 7.9% |
| Philippines | 8 | 0.4% |
| South Eastern Asia | 8 | 0.4% | View All 6 Rows |
Sex and Age in Van Horn
Sex and Age in Van Horn
The most populous age groups in Van Horn are 45 to 49 Years (172 | 13.2%) for men and 45 to 49 Years (201 | 26.2%) for women.
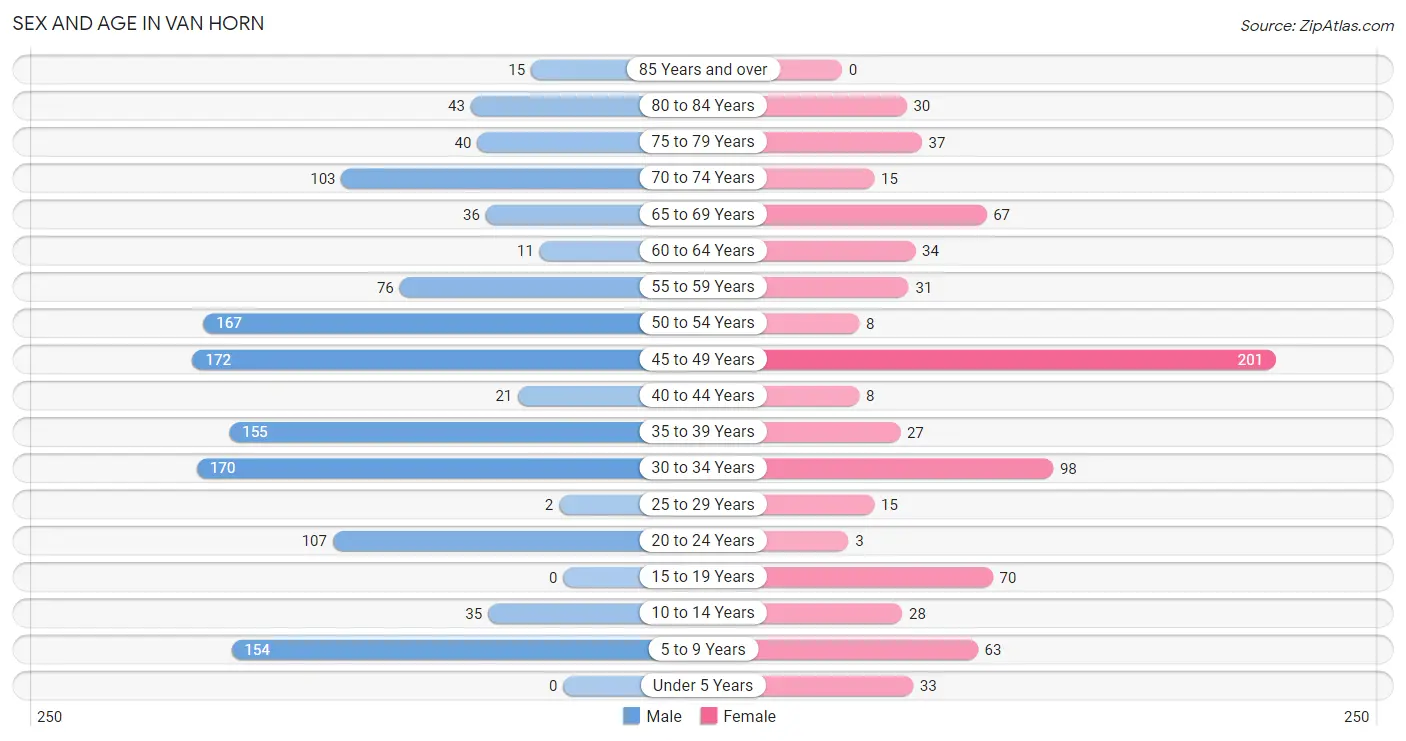
| Age Bracket | Male | Female |
| Under 5 Years | 0 (0.0%) | 33 (4.3%) |
| 5 to 9 Years | 154 (11.8%) | 63 (8.2%) |
| 10 to 14 Years | 35 (2.7%) | 28 (3.6%) |
| 15 to 19 Years | 0 (0.0%) | 70 (9.1%) |
| 20 to 24 Years | 107 (8.2%) | 3 (0.4%) |
| 25 to 29 Years | 2 (0.2%) | 15 (1.9%) |
| 30 to 34 Years | 170 (13.0%) | 98 (12.8%) |
| 35 to 39 Years | 155 (11.9%) | 27 (3.5%) |
| 40 to 44 Years | 21 (1.6%) | 8 (1.0%) |
| 45 to 49 Years | 172 (13.2%) | 201 (26.2%) |
| 50 to 54 Years | 167 (12.8%) | 8 (1.0%) |
| 55 to 59 Years | 76 (5.8%) | 31 (4.0%) |
| 60 to 64 Years | 11 (0.8%) | 34 (4.4%) |
| 65 to 69 Years | 36 (2.8%) | 67 (8.7%) |
| 70 to 74 Years | 103 (7.9%) | 15 (1.9%) |
| 75 to 79 Years | 40 (3.1%) | 37 (4.8%) |
| 80 to 84 Years | 43 (3.3%) | 30 (3.9%) |
| 85 Years and over | 15 (1.1%) | 0 (0.0%) |
| Total | 1,307 (100.0%) | 768 (100.0%) |
Families and Households in Van Horn
Median Family Size in Van Horn
The median family size in Van Horn is 4.89 persons per family, with single female/mother families (53 | 17.3%) accounting for the largest median family size of 11.45 persons per family. On the other hand, married-couple families (179 | 58.3%) represent the smallest median family size with 2.91 persons per family.
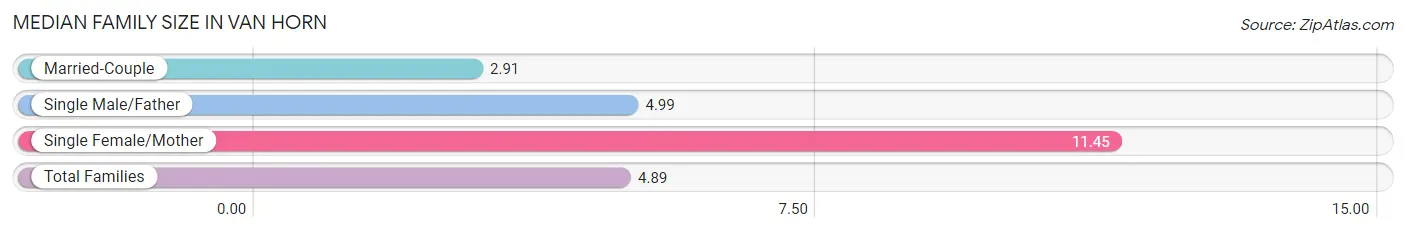
| Family Type | # Families | Family Size |
| Married-Couple | 179 (58.3%) | 2.91 |
| Single Male/Father | 75 (24.4%) | 4.99 |
| Single Female/Mother | 53 (17.3%) | 11.45 |
| Total Families | 307 (100.0%) | 4.89 |
Median Household Size in Van Horn
The median household size in Van Horn is 3.58 persons per household, with single female/mother households (53 | 9.3%) accounting for the largest median household size of 13.51 persons per household. non-family households (261 | 46.0%) represent the smallest median household size with 1.62 persons per household.
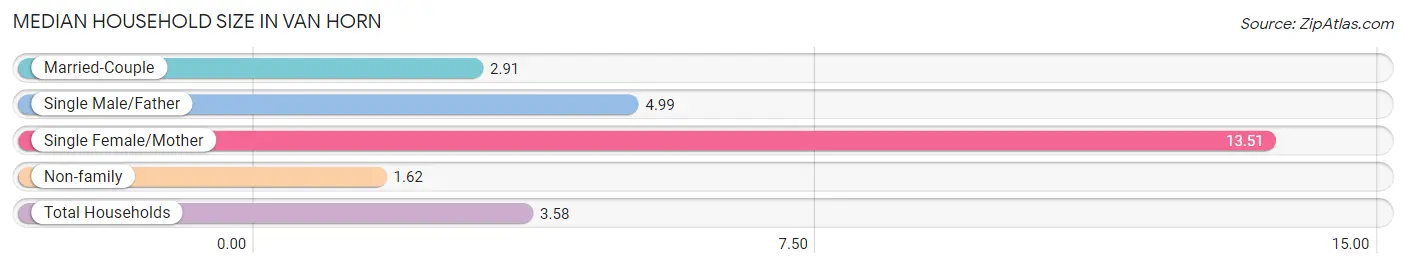
| Household Type | # Households | Household Size |
| Married-Couple | 179 (31.5%) | 2.91 |
| Single Male/Father | 75 (13.2%) | 4.99 |
| Single Female/Mother | 53 (9.3%) | 13.51 |
| Non-family | 261 (46.0%) | 1.62 |
| Total Households | 568 (100.0%) | 3.58 |
Household Size by Marriage Status in Van Horn
Out of a total of 568 households in Van Horn, 307 (54.0%) are family households, while 261 (46.0%) are nonfamily households. The most numerous type of family households are 2-person households, comprising 218, and the most common type of nonfamily households are 1-person households, comprising 250.
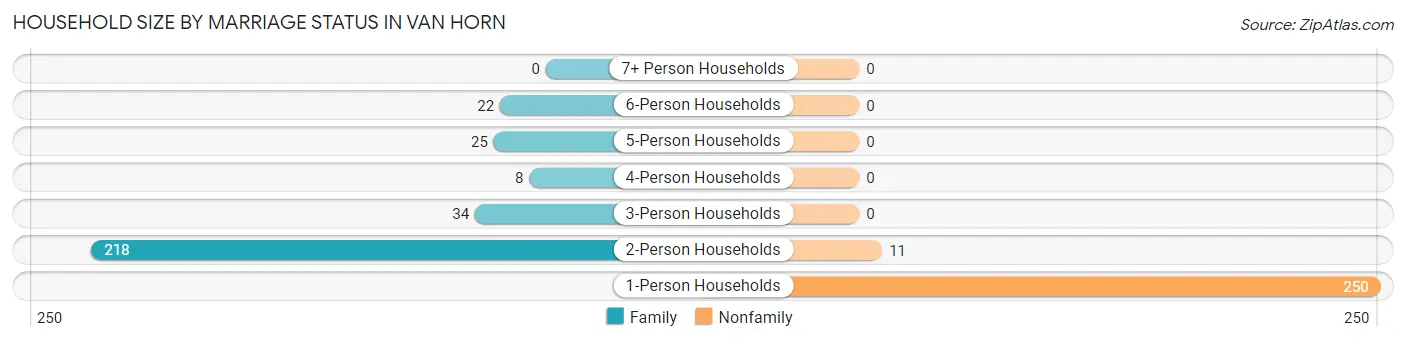
| Household Size | Family Households | Nonfamily Households |
| 1-Person Households | - | 250 (44.0%) |
| 2-Person Households | 218 (38.4%) | 11 (1.9%) |
| 3-Person Households | 34 (6.0%) | 0 (0.0%) |
| 4-Person Households | 8 (1.4%) | 0 (0.0%) |
| 5-Person Households | 25 (4.4%) | 0 (0.0%) |
| 6-Person Households | 22 (3.9%) | 0 (0.0%) |
| 7+ Person Households | 0 (0.0%) | 0 (0.0%) |
| Total | 307 (54.0%) | 261 (46.0%) |
Female Fertility in Van Horn
Fertility by Age in Van Horn
| Age Bracket | Women with Births | Births / 1,000 Women |
| 15 to 19 years | 0 (0.0%) | 0.0 |
| 20 to 34 years | 0 (0.0%) | 0.0 |
| 35 to 50 years | 0 (0.0%) | 0.0 |
| Total | 0 (0.0%) | 0.0 |
Fertility by Age by Marriage Status in Van Horn
| Age Bracket | Married | Unmarried |
| 15 to 19 years | 0 (0.0%) | 0 (0.0%) |
| 20 to 34 years | 0 (0.0%) | 0 (0.0%) |
| 35 to 50 years | 0 (0.0%) | 0 (0.0%) |
| Total | 0 (0.0%) | 0 (0.0%) |
Fertility by Education in Van Horn
| Educational Attainment | Women with Births | Births / 1,000 Women |
| Less than High School | 0 (0.0%) | 0.0 |
| High School Diploma | 0 (0.0%) | 0.0 |
| College or Associate's Degree | 0 (0.0%) | 0.0 |
| Bachelor's Degree | 0 (0.0%) | 0.0 |
| Graduate Degree | 0 (0.0%) | 0.0 |
| Total | 0 (0.0%) | 0.0 |
Fertility by Education by Marriage Status in Van Horn
| Educational Attainment | Married | Unmarried |
| Less than High School | 0 (0.0%) | 0 (0.0%) |
| High School Diploma | 0 (0.0%) | 0 (0.0%) |
| College or Associate's Degree | 0 (0.0%) | 0 (0.0%) |
| Bachelor's Degree | 0 (0.0%) | 0 (0.0%) |
| Graduate Degree | 0 (0.0%) | 0 (0.0%) |
| Total | 0 (0.0%) | 0 (0.0%) |
Employment Characteristics in Van Horn
Employment by Class of Employer in Van Horn
Among the 898 employed individuals in Van Horn, private company employees (444 | 49.4%), self-employed (not incorporated) (204 | 22.7%), and local government employees (149 | 16.6%) make up the most common classes of employment.
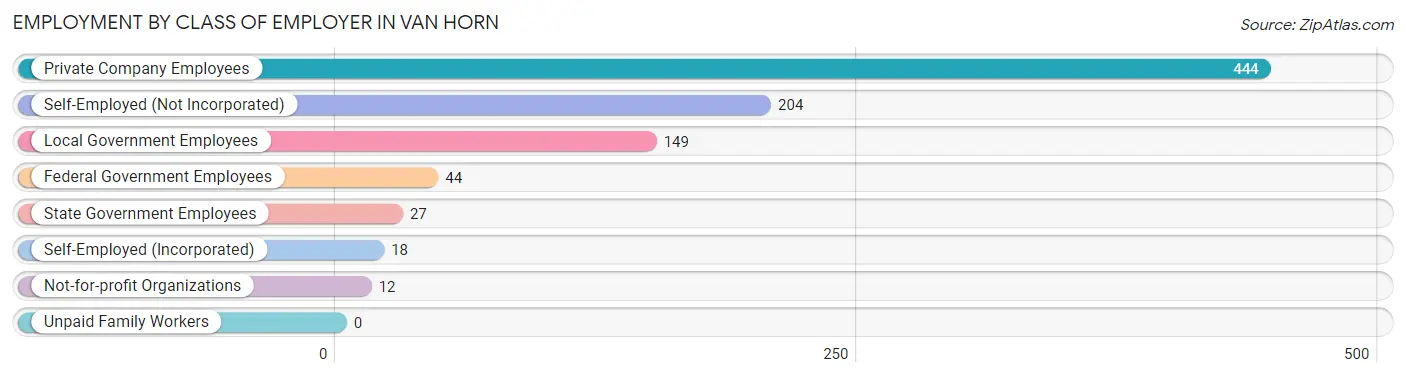
| Employer Class | # Employees | % Employees |
| Private Company Employees | 444 | 49.4% |
| Self-Employed (Incorporated) | 18 | 2.0% |
| Self-Employed (Not Incorporated) | 204 | 22.7% |
| Not-for-profit Organizations | 12 | 1.3% |
| Local Government Employees | 149 | 16.6% |
| State Government Employees | 27 | 3.0% |
| Federal Government Employees | 44 | 4.9% |
| Unpaid Family Workers | 0 | 0.0% |
| Total | 898 | 100.0% |
Employment Status by Age in Van Horn
According to the labor force statistics for Van Horn, out of the total population over 16 years of age (1,762), 57.9% or 1,020 individuals are in the labor force, with 10.2% or 104 of them unemployed. The age group with the highest labor force participation rate is 20 to 24 years, with 91.8% or 101 individuals in the labor force. Within the labor force, the 20 to 24 years age range has the highest percentage of unemployed individuals, with 97.0% or 98 of them being unemployed.
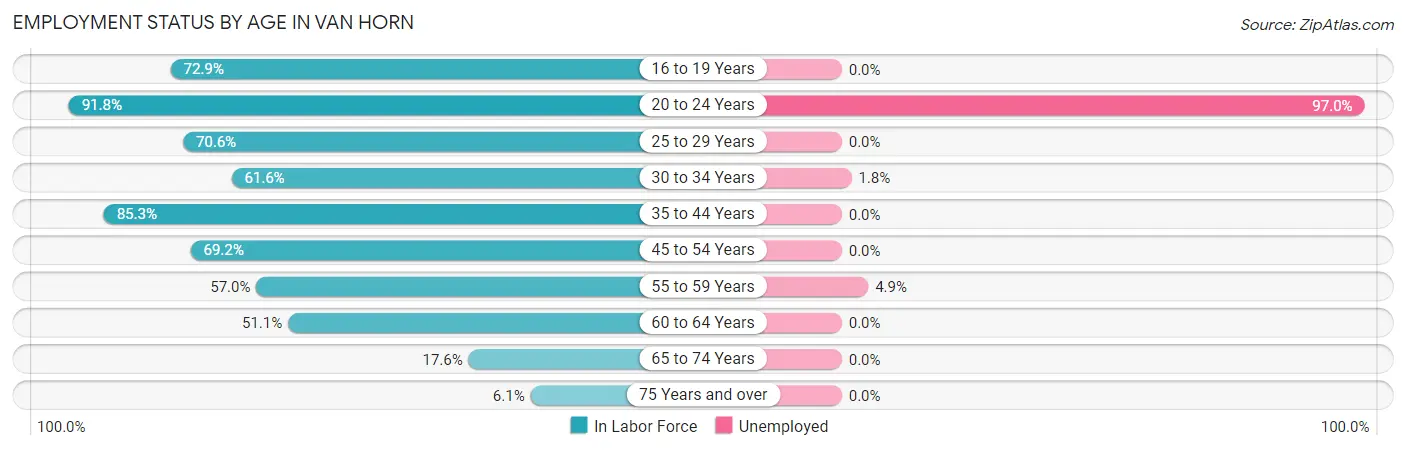
| Age Bracket | In Labor Force | Unemployed |
| 16 to 19 Years | 51 (72.9%) | 0 (0.0%) |
| 20 to 24 Years | 101 (91.8%) | 98 (97.0%) |
| 25 to 29 Years | 12 (70.6%) | 0 (0.0%) |
| 30 to 34 Years | 165 (61.6%) | 3 (1.8%) |
| 35 to 44 Years | 180 (85.3%) | 0 (0.0%) |
| 45 to 54 Years | 379 (69.2%) | 0 (0.0%) |
| 55 to 59 Years | 61 (57.0%) | 3 (4.9%) |
| 60 to 64 Years | 23 (51.1%) | 0 (0.0%) |
| 65 to 74 Years | 39 (17.6%) | 0 (0.0%) |
| 75 Years and over | 10 (6.1%) | 0 (0.0%) |
| Total | 1,020 (57.9%) | 104 (10.2%) |
Employment Status by Educational Attainment in Van Horn
According to labor force statistics for Van Horn, 68.6% of individuals (820) out of the total population between 25 and 64 years of age (1,196) are in the labor force, with 0.7% or 6 of them being unemployed. The group with the highest labor force participation rate are those with the educational attainment of college / associate degree, with 99.5% or 211 individuals in the labor force. Within the labor force, individuals with less than high school education have the highest percentage of unemployment, with 4.3% or 3 of them being unemployed.
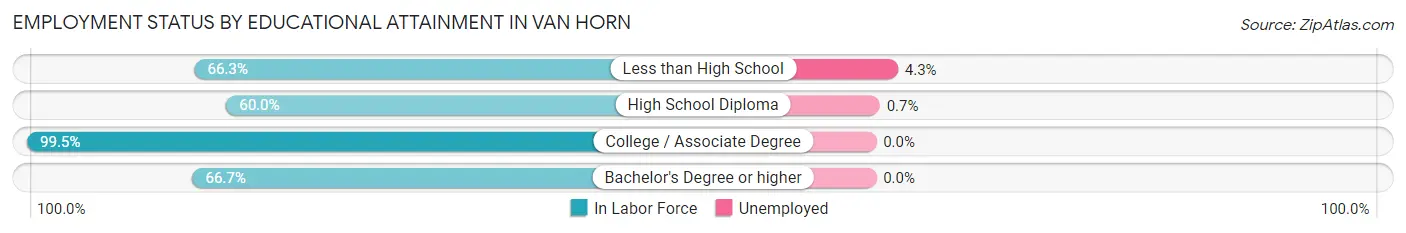
| Educational Attainment | In Labor Force | Unemployed |
| Less than High School | 69 (66.3%) | 4 (4.3%) |
| High School Diploma | 422 (60.0%) | 5 (0.7%) |
| College / Associate Degree | 211 (99.5%) | 0 (0.0%) |
| Bachelor's Degree or higher | 118 (66.7%) | 0 (0.0%) |
| Total | 820 (68.6%) | 8 (0.7%) |
Employment Occupations by Sex in Van Horn
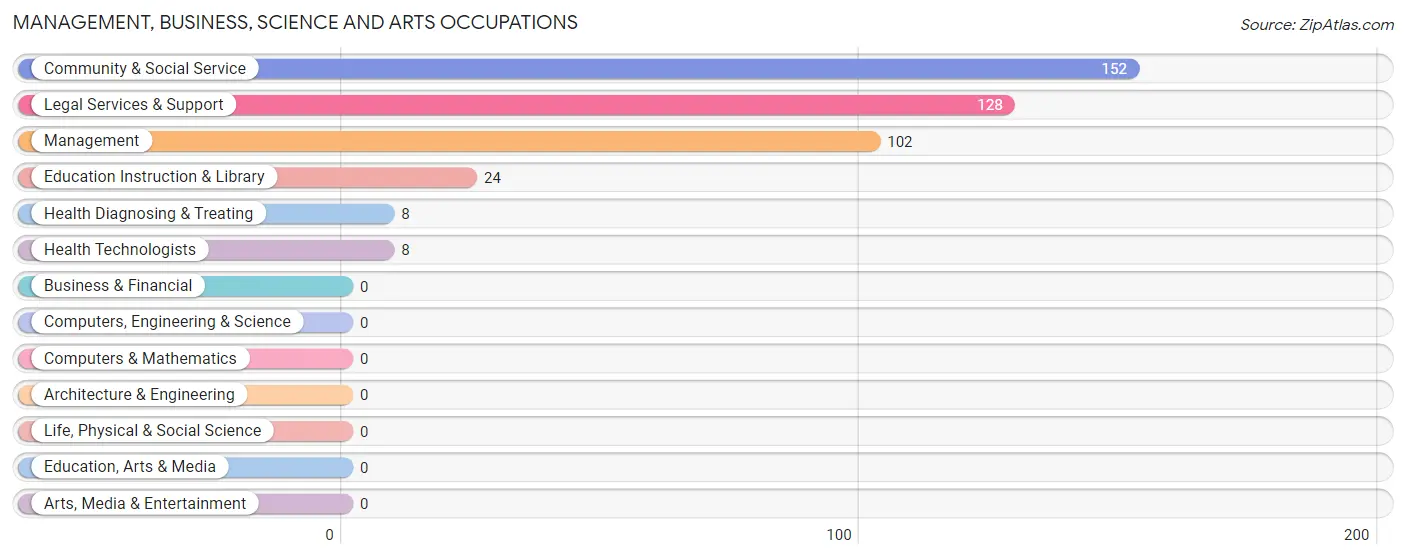
Management, Business, Science and Arts Occupations
The most common Management, Business, Science and Arts occupations in Van Horn are Community & Social Service (152 | 16.6%), Legal Services & Support (128 | 14.0%), Management (102 | 11.1%), Education Instruction & Library (24 | 2.6%), and Health Diagnosing & Treating (8 | 0.9%).
Management, Business, Science and Arts Occupations by Sex
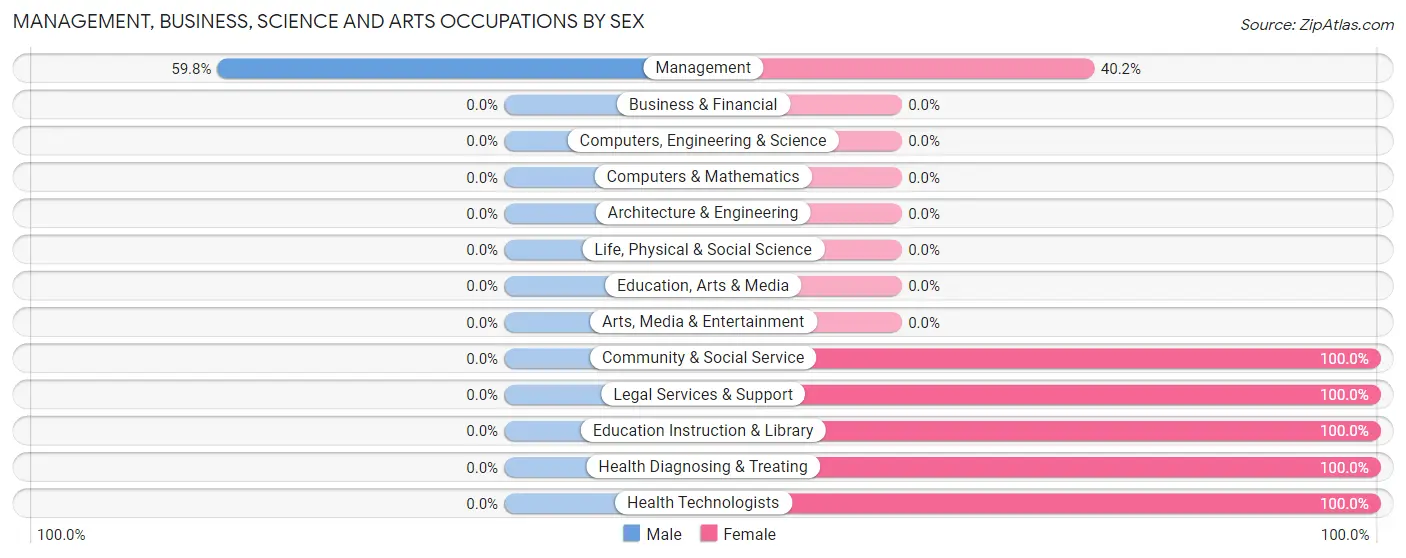
| Occupation | Male | Female |
| Management | 61 (59.8%) | 41 (40.2%) |
| Business & Financial | 0 (0.0%) | 0 (0.0%) |
| Computers, Engineering & Science | 0 (0.0%) | 0 (0.0%) |
| Computers & Mathematics | 0 (0.0%) | 0 (0.0%) |
| Architecture & Engineering | 0 (0.0%) | 0 (0.0%) |
| Life, Physical & Social Science | 0 (0.0%) | 0 (0.0%) |
| Community & Social Service | 0 (0.0%) | 152 (100.0%) |
| Education, Arts & Media | 0 (0.0%) | 0 (0.0%) |
| Legal Services & Support | 0 (0.0%) | 128 (100.0%) |
| Education Instruction & Library | 0 (0.0%) | 24 (100.0%) |
| Arts, Media & Entertainment | 0 (0.0%) | 0 (0.0%) |
| Health Diagnosing & Treating | 0 (0.0%) | 8 (100.0%) |
| Health Technologists | 0 (0.0%) | 8 (100.0%) |
| Total (Category) | 61 (23.3%) | 201 (76.7%) |
| Total (Overall) | 576 (62.8%) | 341 (37.2%) |
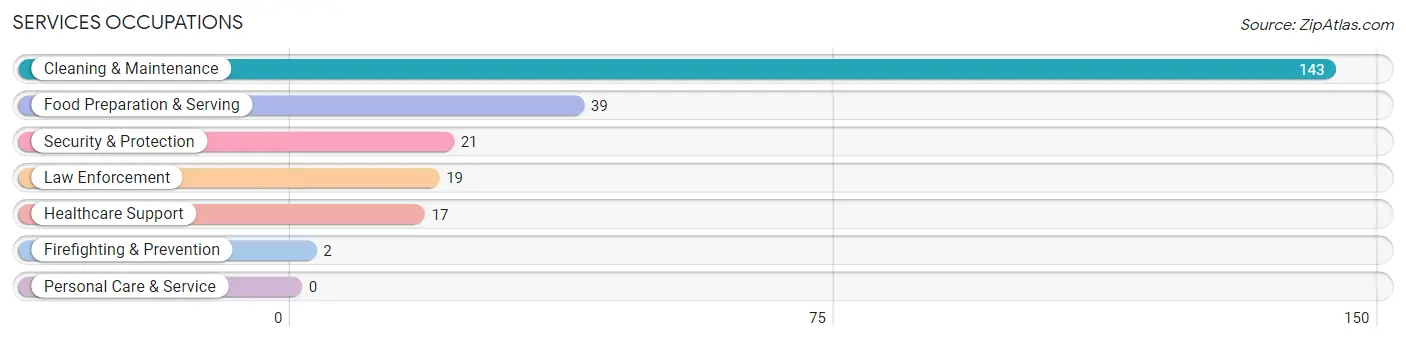
Services Occupations
The most common Services occupations in Van Horn are Cleaning & Maintenance (143 | 15.6%), Food Preparation & Serving (39 | 4.3%), Security & Protection (21 | 2.3%), Law Enforcement (19 | 2.1%), and Healthcare Support (17 | 1.8%).
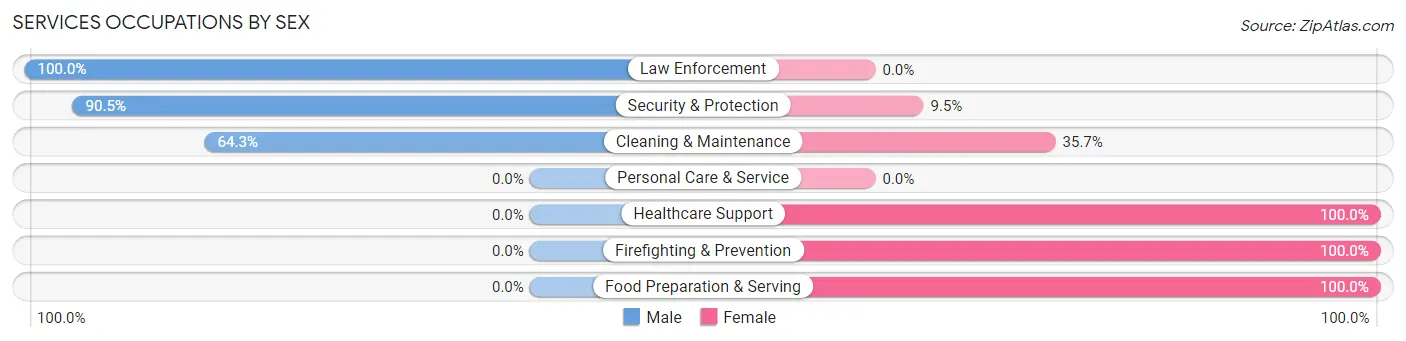
Services Occupations by Sex
Within the Services occupations in Van Horn, the most male-oriented occupations are Law Enforcement (100.0%), Security & Protection (90.5%), and Cleaning & Maintenance (64.3%), while the most female-oriented occupations are Healthcare Support (100.0%), Firefighting & Prevention (100.0%), and Food Preparation & Serving (100.0%).
| Occupation | Male | Female |
| Healthcare Support | 0 (0.0%) | 17 (100.0%) |
| Security & Protection | 19 (90.5%) | 2 (9.5%) |
| Firefighting & Prevention | 0 (0.0%) | 2 (100.0%) |
| Law Enforcement | 19 (100.0%) | 0 (0.0%) |
| Food Preparation & Serving | 0 (0.0%) | 39 (100.0%) |
| Cleaning & Maintenance | 92 (64.3%) | 51 (35.7%) |
| Personal Care & Service | 0 (0.0%) | 0 (0.0%) |
| Total (Category) | 111 (50.4%) | 109 (49.5%) |
| Total (Overall) | 576 (62.8%) | 341 (37.2%) |
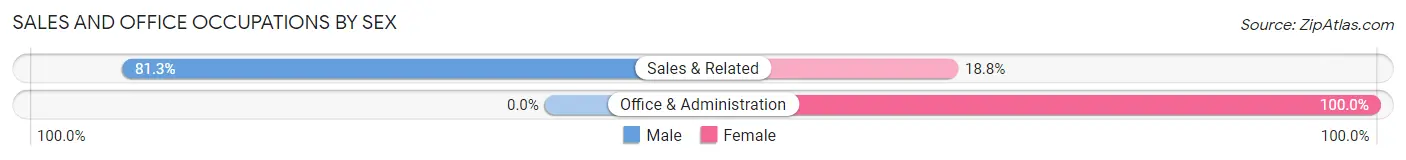
Sales and Office Occupations
The most common Sales and Office occupations in Van Horn are Office & Administration (20 | 2.2%), and Sales & Related (16 | 1.7%).
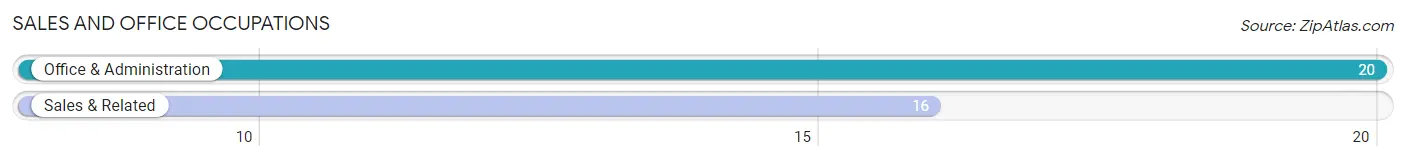
Sales and Office Occupations by Sex
| Occupation | Male | Female |
| Sales & Related | 13 (81.2%) | 3 (18.8%) |
| Office & Administration | 0 (0.0%) | 20 (100.0%) |
| Total (Category) | 13 (36.1%) | 23 (63.9%) |
| Total (Overall) | 576 (62.8%) | 341 (37.2%) |
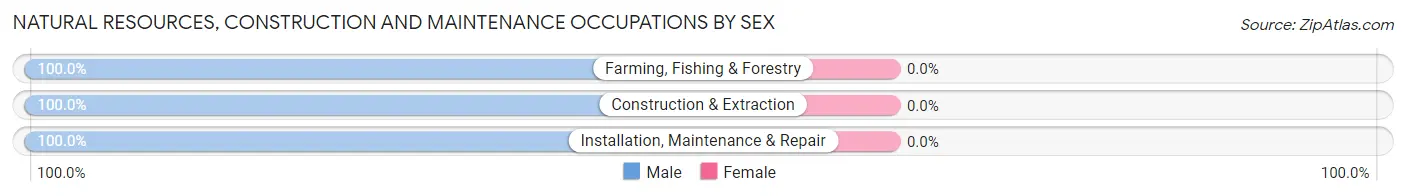
Natural Resources, Construction and Maintenance Occupations
The most common Natural Resources, Construction and Maintenance occupations in Van Horn are Installation, Maintenance & Repair (189 | 20.6%), Farming, Fishing & Forestry (44 | 4.8%), and Construction & Extraction (17 | 1.8%).
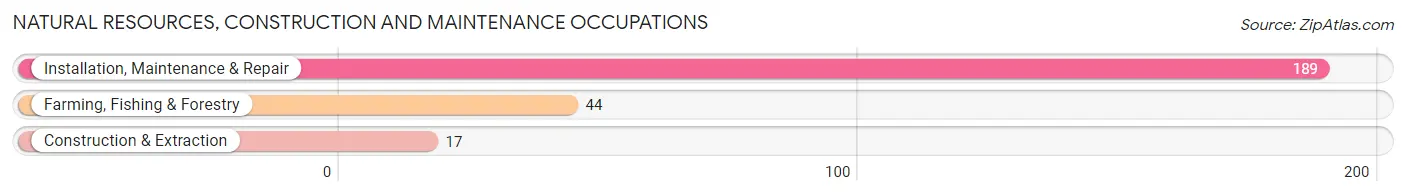
Natural Resources, Construction and Maintenance Occupations by Sex
| Occupation | Male | Female |
| Farming, Fishing & Forestry | 44 (100.0%) | 0 (0.0%) |
| Construction & Extraction | 17 (100.0%) | 0 (0.0%) |
| Installation, Maintenance & Repair | 189 (100.0%) | 0 (0.0%) |
| Total (Category) | 250 (100.0%) | 0 (0.0%) |
| Total (Overall) | 576 (62.8%) | 341 (37.2%) |
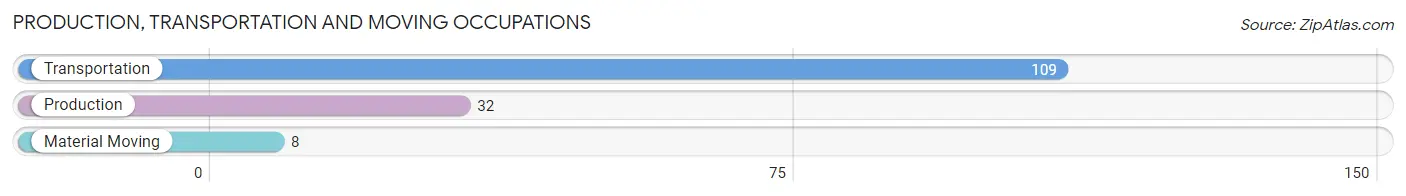
Production, Transportation and Moving Occupations
The most common Production, Transportation and Moving occupations in Van Horn are Transportation (109 | 11.9%), Production (32 | 3.5%), and Material Moving (8 | 0.9%).
Production, Transportation and Moving Occupations by Sex
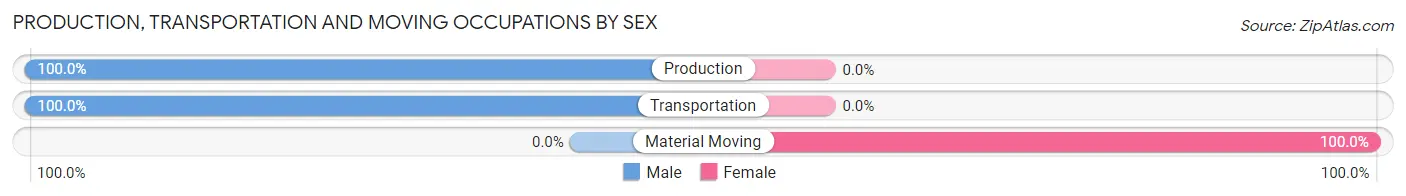
| Occupation | Male | Female |
| Production | 32 (100.0%) | 0 (0.0%) |
| Transportation | 109 (100.0%) | 0 (0.0%) |
| Material Moving | 0 (0.0%) | 8 (100.0%) |
| Total (Category) | 141 (94.6%) | 8 (5.4%) |
| Total (Overall) | 576 (62.8%) | 341 (37.2%) |
Employment Industries by Sex in Van Horn
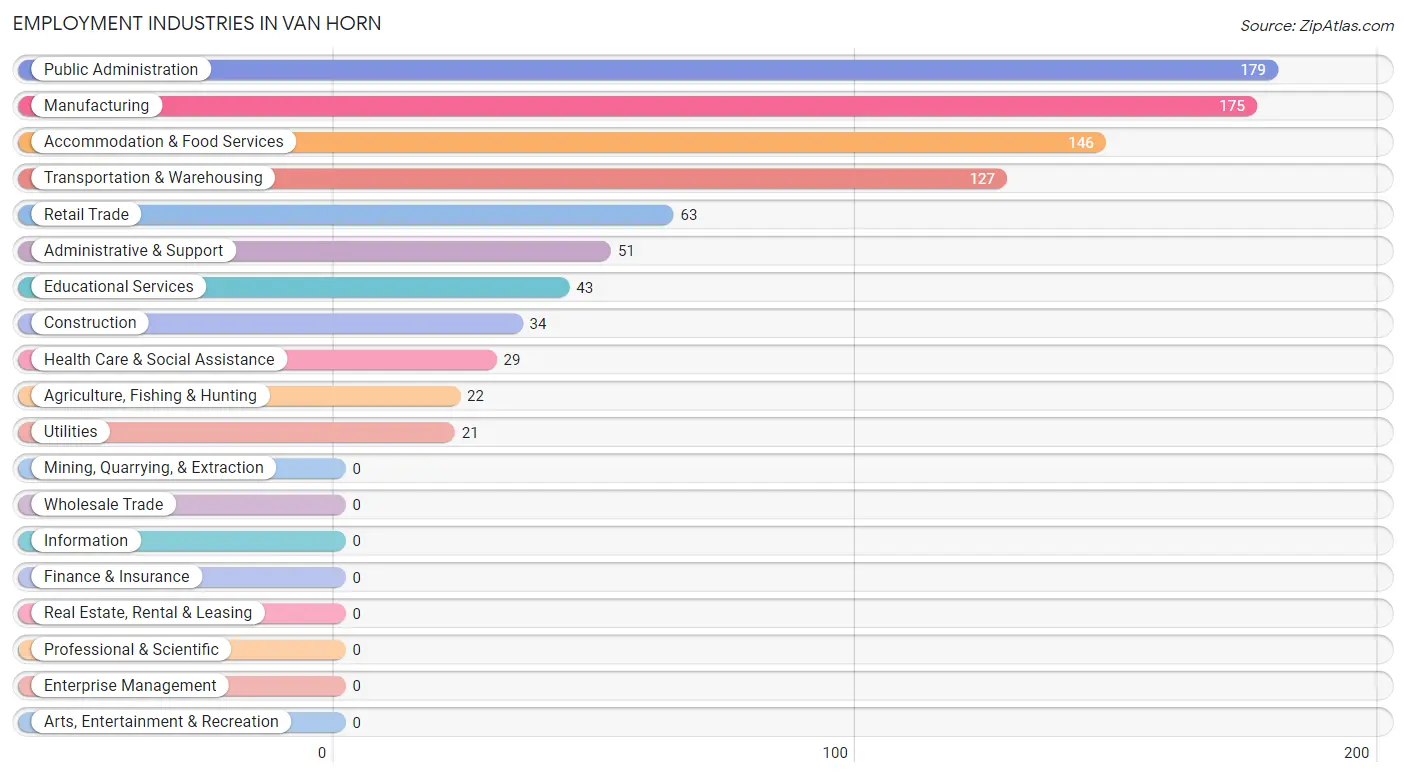
Employment Industries in Van Horn
The major employment industries in Van Horn include Public Administration (179 | 19.5%), Manufacturing (175 | 19.1%), Accommodation & Food Services (146 | 15.9%), Transportation & Warehousing (127 | 13.9%), and Retail Trade (63 | 6.9%).
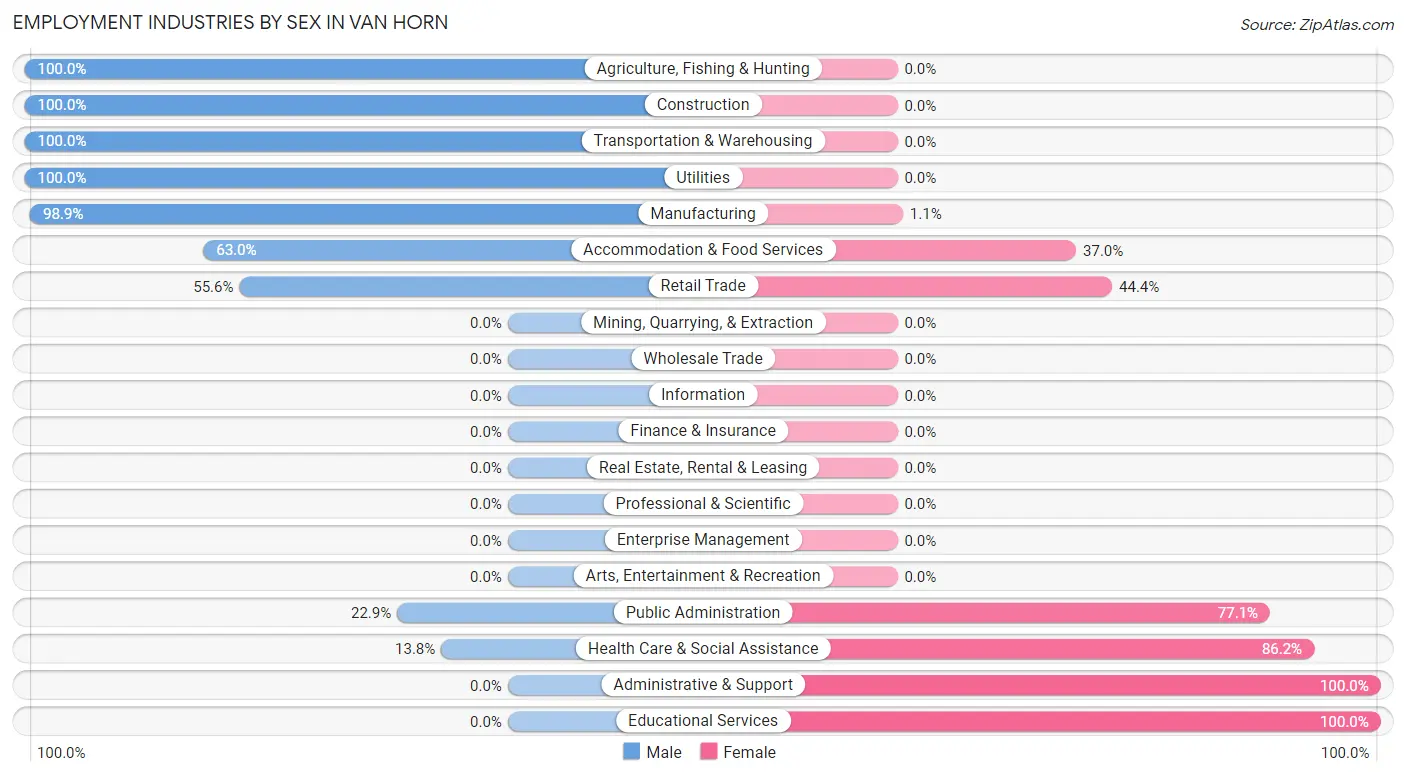
Employment Industries by Sex in Van Horn
The Van Horn industries that see more men than women are Agriculture, Fishing & Hunting (100.0%), Construction (100.0%), and Transportation & Warehousing (100.0%), whereas the industries that tend to have a higher number of women are Administrative & Support (100.0%), Educational Services (100.0%), and Health Care & Social Assistance (86.2%).
| Industry | Male | Female |
| Agriculture, Fishing & Hunting | 22 (100.0%) | 0 (0.0%) |
| Mining, Quarrying, & Extraction | 0 (0.0%) | 0 (0.0%) |
| Construction | 34 (100.0%) | 0 (0.0%) |
| Manufacturing | 173 (98.9%) | 2 (1.1%) |
| Wholesale Trade | 0 (0.0%) | 0 (0.0%) |
| Retail Trade | 35 (55.6%) | 28 (44.4%) |
| Transportation & Warehousing | 127 (100.0%) | 0 (0.0%) |
| Utilities | 21 (100.0%) | 0 (0.0%) |
| Information | 0 (0.0%) | 0 (0.0%) |
| Finance & Insurance | 0 (0.0%) | 0 (0.0%) |
| Real Estate, Rental & Leasing | 0 (0.0%) | 0 (0.0%) |
| Professional & Scientific | 0 (0.0%) | 0 (0.0%) |
| Enterprise Management | 0 (0.0%) | 0 (0.0%) |
| Administrative & Support | 0 (0.0%) | 51 (100.0%) |
| Educational Services | 0 (0.0%) | 43 (100.0%) |
| Health Care & Social Assistance | 4 (13.8%) | 25 (86.2%) |
| Arts, Entertainment & Recreation | 0 (0.0%) | 0 (0.0%) |
| Accommodation & Food Services | 92 (63.0%) | 54 (37.0%) |
| Public Administration | 41 (22.9%) | 138 (77.1%) |
| Total | 576 (62.8%) | 341 (37.2%) |
Education in Van Horn
School Enrollment in Van Horn
The most common levels of schooling among the 111 students in Van Horn are middle school (63 | 56.8%), elementary school (29 | 26.1%), and high school (19 | 17.1%).
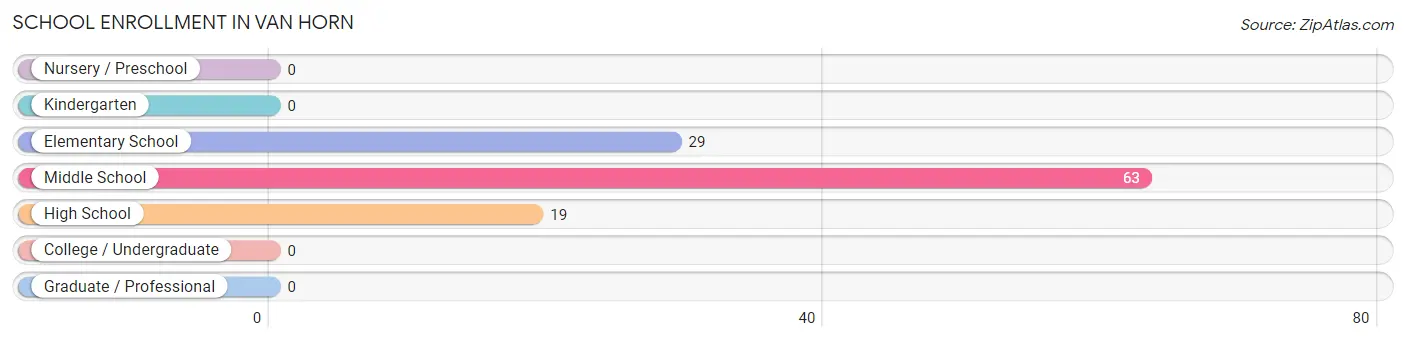
| School Level | # Students | % Students |
| Nursery / Preschool | 0 | 0.0% |
| Kindergarten | 0 | 0.0% |
| Elementary School | 29 | 26.1% |
| Middle School | 63 | 56.8% |
| High School | 19 | 17.1% |
| College / Undergraduate | 0 | 0.0% |
| Graduate / Professional | 0 | 0.0% |
| Total | 111 | 100.0% |
School Enrollment by Age by Funding Source in Van Horn
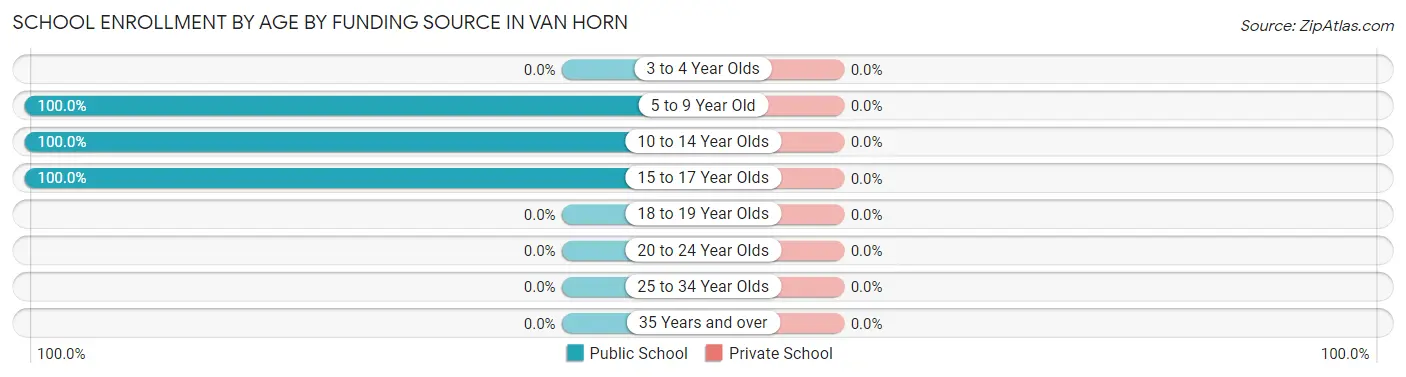
| Age Bracket | Public School | Private School |
| 3 to 4 Year Olds | 0 (0.0%) | 0 (0.0%) |
| 5 to 9 Year Old | 29 (100.0%) | 0 (0.0%) |
| 10 to 14 Year Olds | 63 (100.0%) | 0 (0.0%) |
| 15 to 17 Year Olds | 19 (100.0%) | 0 (0.0%) |
| 18 to 19 Year Olds | 0 (0.0%) | 0 (0.0%) |
| 20 to 24 Year Olds | 0 (0.0%) | 0 (0.0%) |
| 25 to 34 Year Olds | 0 (0.0%) | 0 (0.0%) |
| 35 Years and over | 0 (0.0%) | 0 (0.0%) |
| Total | 111 (100.0%) | 0 (0.0%) |
Educational Attainment by Field of Study in Van Horn
Business (60 | 33.9%), psychology (46 | 26.0%), bio, nature & agricultural (32 | 18.1%), education (18 | 10.2%), and computers & mathematics (11 | 6.2%) are the most common fields of study among 177 individuals in Van Horn who have obtained a bachelor's degree or higher.
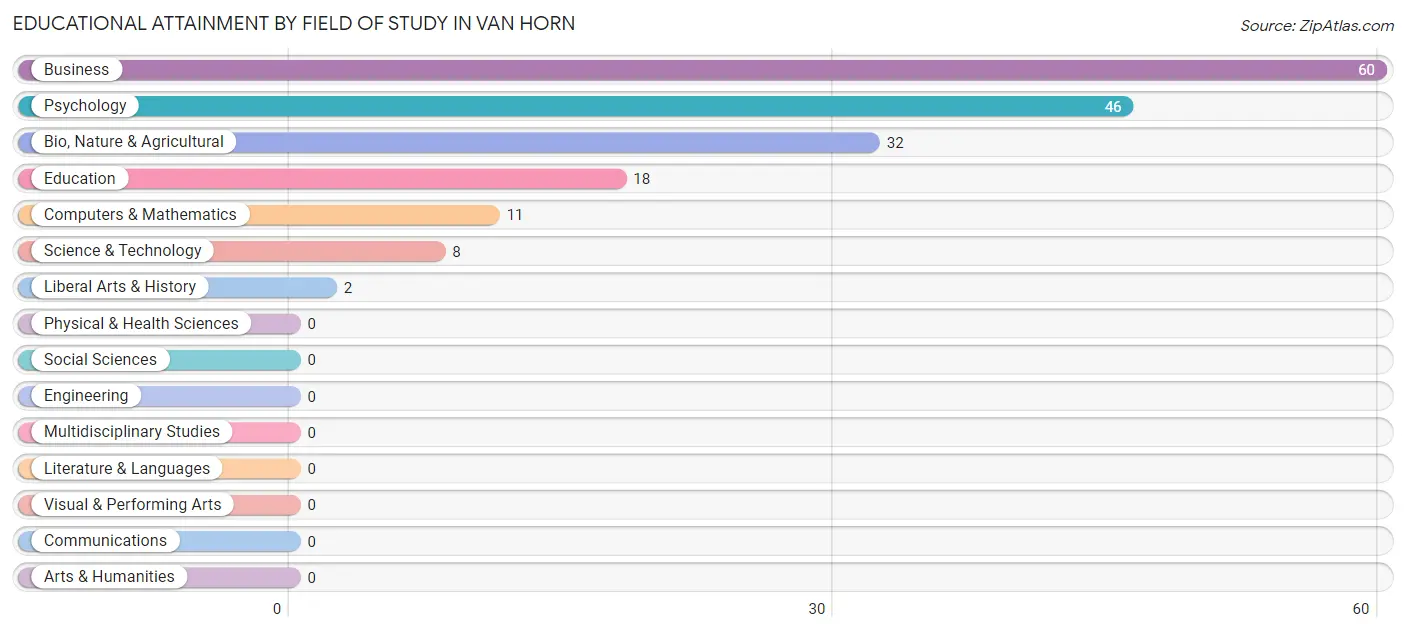
| Field of Study | # Graduates | % Graduates |
| Computers & Mathematics | 11 | 6.2% |
| Bio, Nature & Agricultural | 32 | 18.1% |
| Physical & Health Sciences | 0 | 0.0% |
| Psychology | 46 | 26.0% |
| Social Sciences | 0 | 0.0% |
| Engineering | 0 | 0.0% |
| Multidisciplinary Studies | 0 | 0.0% |
| Science & Technology | 8 | 4.5% |
| Business | 60 | 33.9% |
| Education | 18 | 10.2% |
| Literature & Languages | 0 | 0.0% |
| Liberal Arts & History | 2 | 1.1% |
| Visual & Performing Arts | 0 | 0.0% |
| Communications | 0 | 0.0% |
| Arts & Humanities | 0 | 0.0% |
| Total | 177 | 100.0% |
Transportation & Commute in Van Horn
Vehicle Availability by Sex in Van Horn
The most prevalent vehicle ownership categories in Van Horn are males with 2 vehicles (277, accounting for 48.4%) and females with 2 vehicles (262, making up 86.0%).
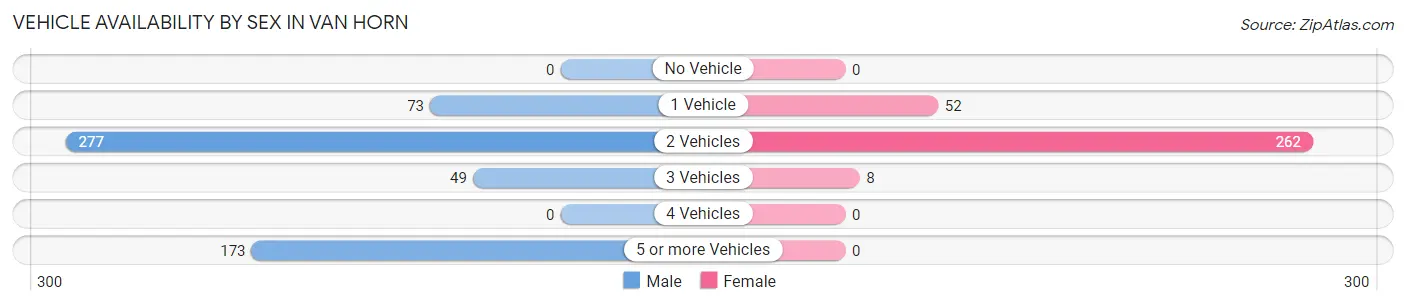
| Vehicles Available | Male | Female |
| No Vehicle | 0 (0.0%) | 0 (0.0%) |
| 1 Vehicle | 73 (12.8%) | 52 (16.2%) |
| 2 Vehicles | 277 (48.4%) | 262 (81.4%) |
| 3 Vehicles | 49 (8.6%) | 8 (2.5%) |
| 4 Vehicles | 0 (0.0%) | 0 (0.0%) |
| 5 or more Vehicles | 173 (30.2%) | 0 (0.0%) |
| Total | 572 (100.0%) | 322 (100.0%) |
Commute Time in Van Horn
The most frequently occuring commute durations in Van Horn are less than 5 minutes (301 commuters, 33.9%), 30 to 34 minutes (206 commuters, 23.2%), and 5 to 9 minutes (161 commuters, 18.1%).
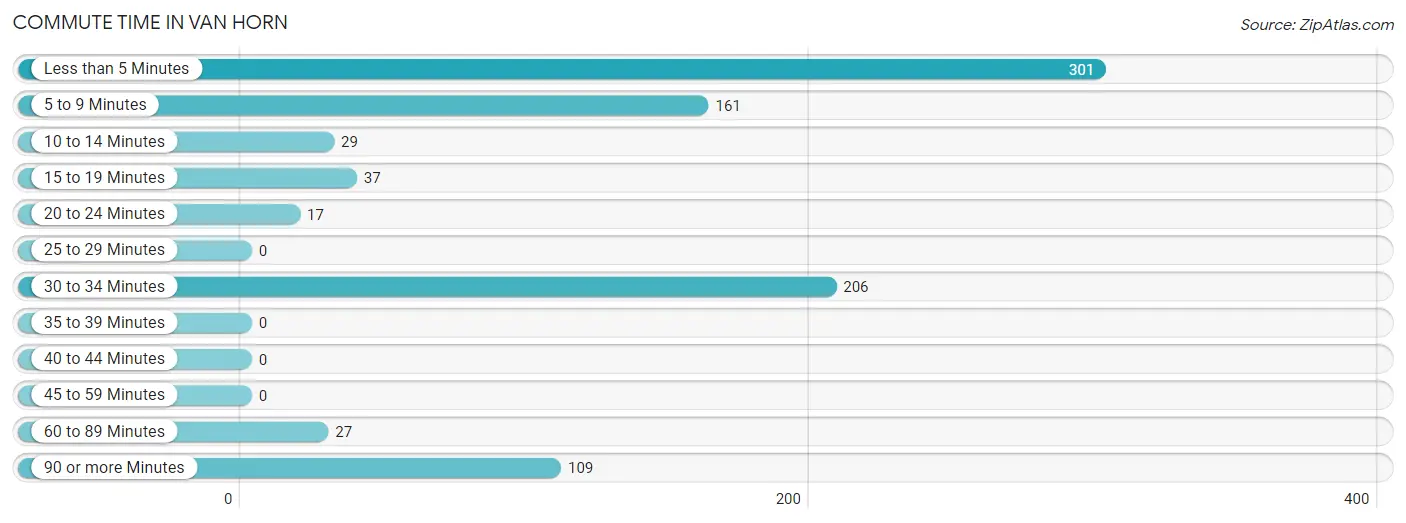
| Commute Time | # Commuters | % Commuters |
| Less than 5 Minutes | 301 | 33.9% |
| 5 to 9 Minutes | 161 | 18.1% |
| 10 to 14 Minutes | 29 | 3.3% |
| 15 to 19 Minutes | 37 | 4.2% |
| 20 to 24 Minutes | 17 | 1.9% |
| 25 to 29 Minutes | 0 | 0.0% |
| 30 to 34 Minutes | 206 | 23.2% |
| 35 to 39 Minutes | 0 | 0.0% |
| 40 to 44 Minutes | 0 | 0.0% |
| 45 to 59 Minutes | 0 | 0.0% |
| 60 to 89 Minutes | 27 | 3.0% |
| 90 or more Minutes | 109 | 12.3% |
Commute Time by Sex in Van Horn
The most common commute times in Van Horn are 30 to 34 minutes (204 commuters, 35.7%) for males and less than 5 minutes (238 commuters, 75.6%) for females.
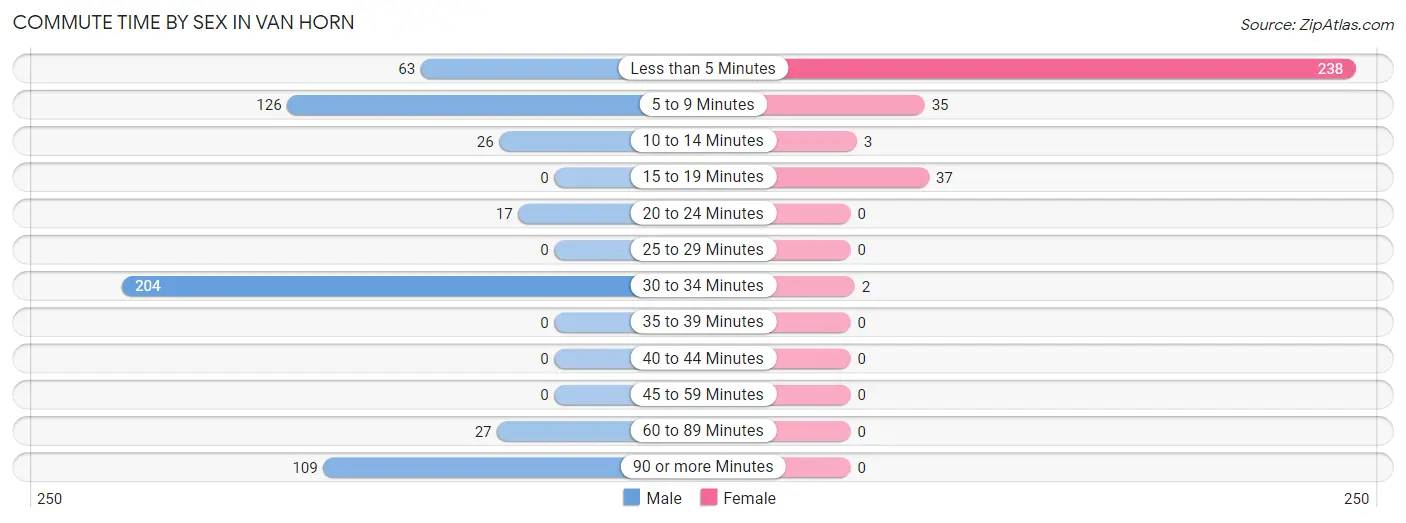
| Commute Time | Male | Female |
| Less than 5 Minutes | 63 (11.0%) | 238 (75.6%) |
| 5 to 9 Minutes | 126 (22.0%) | 35 (11.1%) |
| 10 to 14 Minutes | 26 (4.5%) | 3 (0.9%) |
| 15 to 19 Minutes | 0 (0.0%) | 37 (11.7%) |
| 20 to 24 Minutes | 17 (3.0%) | 0 (0.0%) |
| 25 to 29 Minutes | 0 (0.0%) | 0 (0.0%) |
| 30 to 34 Minutes | 204 (35.7%) | 2 (0.6%) |
| 35 to 39 Minutes | 0 (0.0%) | 0 (0.0%) |
| 40 to 44 Minutes | 0 (0.0%) | 0 (0.0%) |
| 45 to 59 Minutes | 0 (0.0%) | 0 (0.0%) |
| 60 to 89 Minutes | 27 (4.7%) | 0 (0.0%) |
| 90 or more Minutes | 109 (19.1%) | 0 (0.0%) |
Time of Departure to Work by Sex in Van Horn
The most frequent times of departure to work in Van Horn are 12:00 PM to 3:59 PM (199, 34.8%) for males and 7:30 AM to 7:59 AM (128, 40.6%) for females.
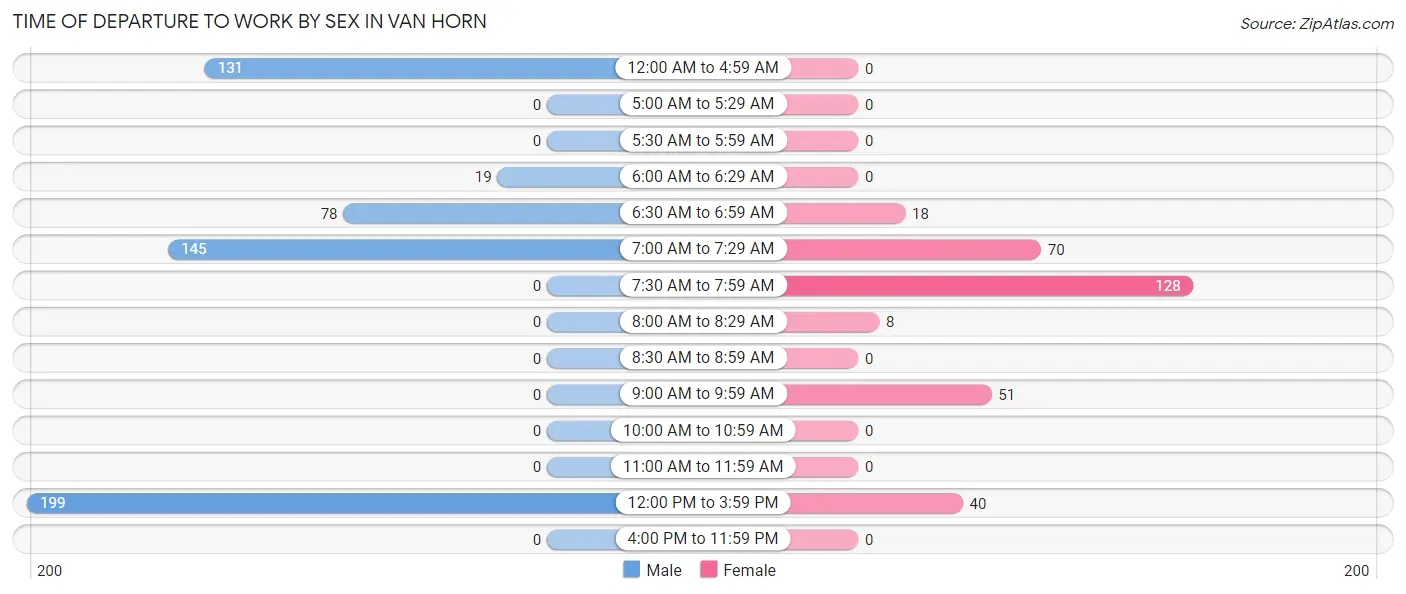
| Time of Departure | Male | Female |
| 12:00 AM to 4:59 AM | 131 (22.9%) | 0 (0.0%) |
| 5:00 AM to 5:29 AM | 0 (0.0%) | 0 (0.0%) |
| 5:30 AM to 5:59 AM | 0 (0.0%) | 0 (0.0%) |
| 6:00 AM to 6:29 AM | 19 (3.3%) | 0 (0.0%) |
| 6:30 AM to 6:59 AM | 78 (13.6%) | 18 (5.7%) |
| 7:00 AM to 7:29 AM | 145 (25.4%) | 70 (22.2%) |
| 7:30 AM to 7:59 AM | 0 (0.0%) | 128 (40.6%) |
| 8:00 AM to 8:29 AM | 0 (0.0%) | 8 (2.5%) |
| 8:30 AM to 8:59 AM | 0 (0.0%) | 0 (0.0%) |
| 9:00 AM to 9:59 AM | 0 (0.0%) | 51 (16.2%) |
| 10:00 AM to 10:59 AM | 0 (0.0%) | 0 (0.0%) |
| 11:00 AM to 11:59 AM | 0 (0.0%) | 0 (0.0%) |
| 12:00 PM to 3:59 PM | 199 (34.8%) | 40 (12.7%) |
| 4:00 PM to 11:59 PM | 0 (0.0%) | 0 (0.0%) |
| Total | 572 (100.0%) | 315 (100.0%) |
Housing Occupancy in Van Horn
Occupancy by Ownership in Van Horn
Of the total 568 dwellings in Van Horn, owner-occupied units account for 416 (73.2%), while renter-occupied units make up 152 (26.8%).
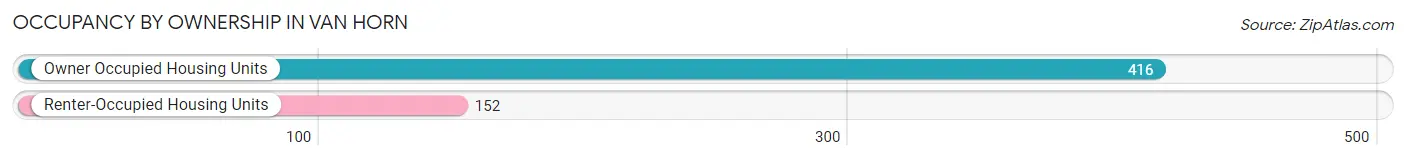
| Occupancy | # Housing Units | % Housing Units |
| Owner Occupied Housing Units | 416 | 73.2% |
| Renter-Occupied Housing Units | 152 | 26.8% |
| Total Occupied Housing Units | 568 | 100.0% |
Occupancy by Household Size in Van Horn
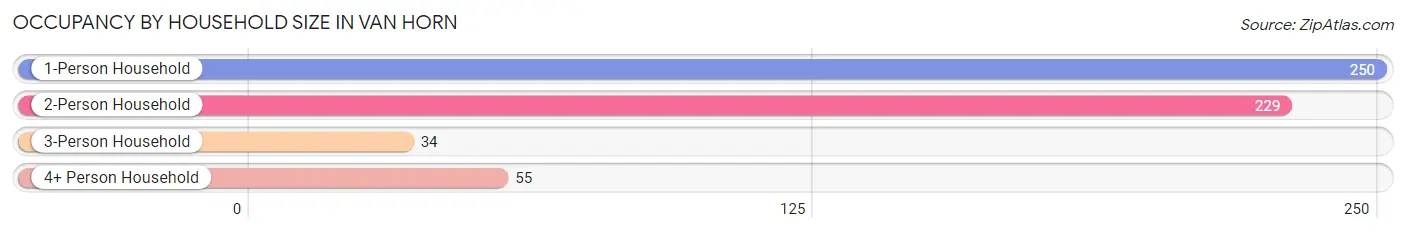
| Household Size | # Housing Units | % Housing Units |
| 1-Person Household | 250 | 44.0% |
| 2-Person Household | 229 | 40.3% |
| 3-Person Household | 34 | 6.0% |
| 4+ Person Household | 55 | 9.7% |
| Total Housing Units | 568 | 100.0% |
Occupancy by Ownership by Household Size in Van Horn
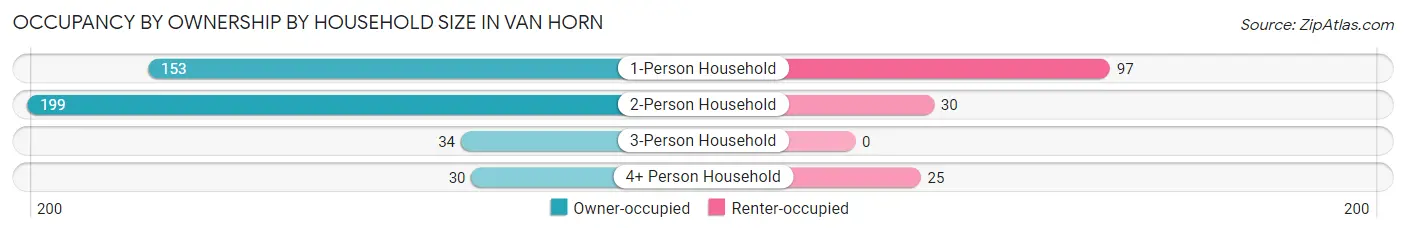
| Household Size | Owner-occupied | Renter-occupied |
| 1-Person Household | 153 (61.2%) | 97 (38.8%) |
| 2-Person Household | 199 (86.9%) | 30 (13.1%) |
| 3-Person Household | 34 (100.0%) | 0 (0.0%) |
| 4+ Person Household | 30 (54.5%) | 25 (45.5%) |
| Total Housing Units | 416 (73.2%) | 152 (26.8%) |
Occupancy by Educational Attainment in Van Horn
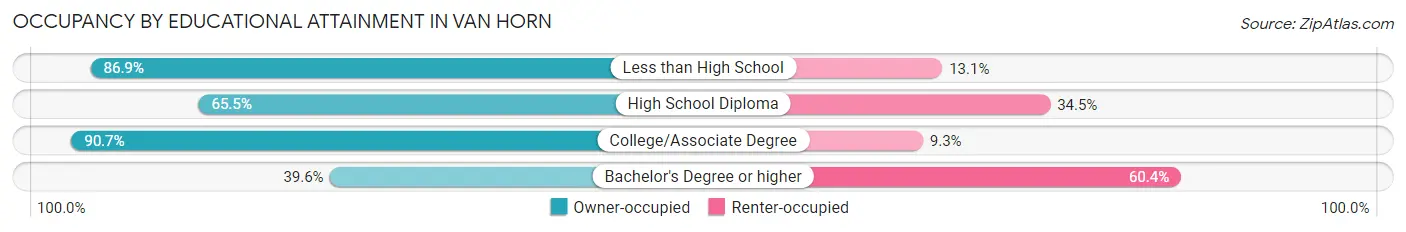
| Household Size | Owner-occupied | Renter-occupied |
| Less than High School | 219 (86.9%) | 33 (13.1%) |
| High School Diploma | 112 (65.5%) | 59 (34.5%) |
| College/Associate Degree | 49 (90.7%) | 5 (9.3%) |
| Bachelor's Degree or higher | 36 (39.6%) | 55 (60.4%) |
Occupancy by Age of Householder in Van Horn
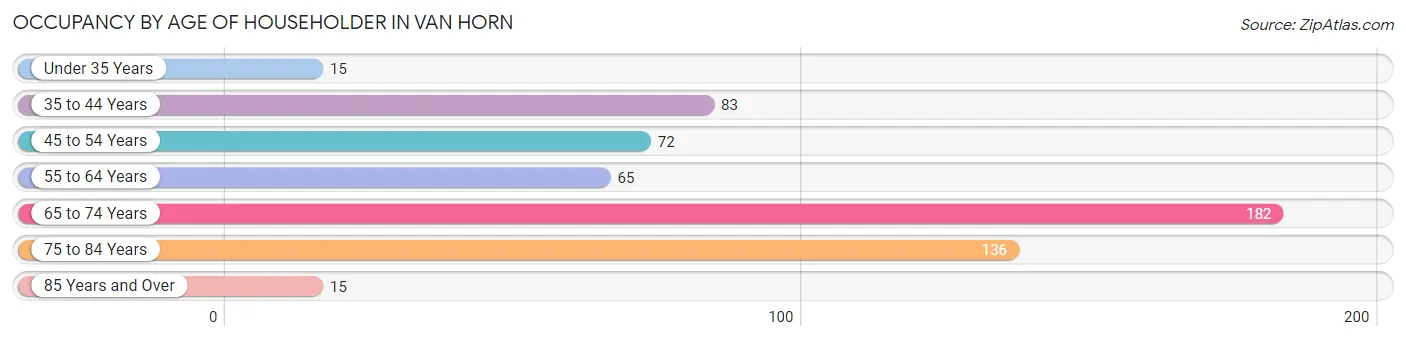
| Age Bracket | # Households | % Households |
| Under 35 Years | 15 | 2.6% |
| 35 to 44 Years | 83 | 14.6% |
| 45 to 54 Years | 72 | 12.7% |
| 55 to 64 Years | 65 | 11.4% |
| 65 to 74 Years | 182 | 32.0% |
| 75 to 84 Years | 136 | 23.9% |
| 85 Years and Over | 15 | 2.6% |
| Total | 568 | 100.0% |
Housing Finances in Van Horn
Median Income by Occupancy in Van Horn
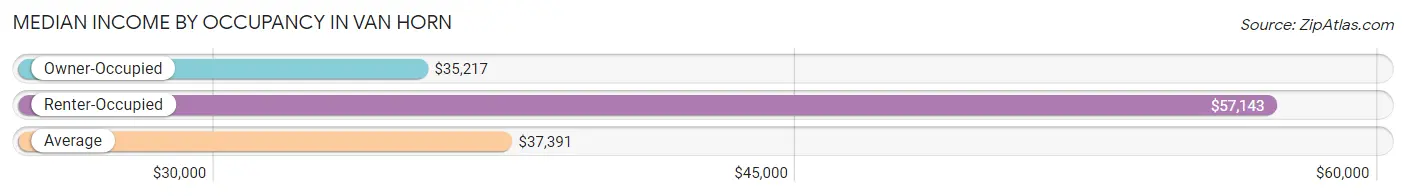
| Occupancy Type | # Households | Median Income |
| Owner-Occupied | 416 (73.2%) | $35,217 |
| Renter-Occupied | 152 (26.8%) | $57,143 |
| Average | 568 (100.0%) | $37,391 |
Occupancy by Householder Income Bracket in Van Horn
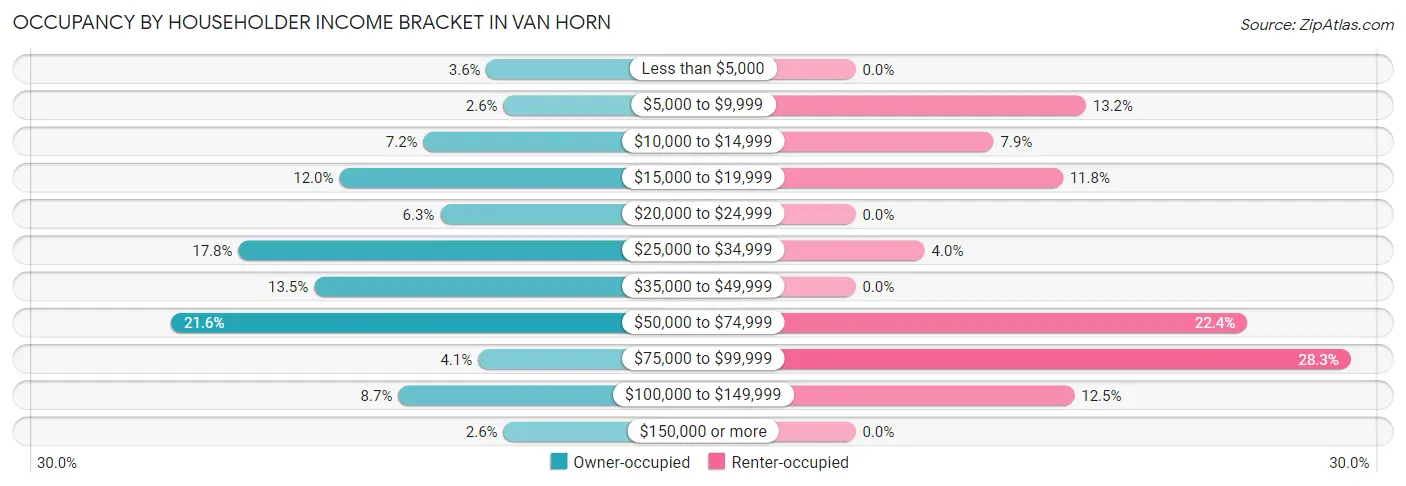
| Income Bracket | Owner-occupied | Renter-occupied |
| Less than $5,000 | 15 (3.6%) | 0 (0.0%) |
| $5,000 to $9,999 | 11 (2.6%) | 20 (13.2%) |
| $10,000 to $14,999 | 30 (7.2%) | 12 (7.9%) |
| $15,000 to $19,999 | 50 (12.0%) | 18 (11.8%) |
| $20,000 to $24,999 | 26 (6.2%) | 0 (0.0%) |
| $25,000 to $34,999 | 74 (17.8%) | 6 (4.0%) |
| $35,000 to $49,999 | 56 (13.5%) | 0 (0.0%) |
| $50,000 to $74,999 | 90 (21.6%) | 34 (22.4%) |
| $75,000 to $99,999 | 17 (4.1%) | 43 (28.3%) |
| $100,000 to $149,999 | 36 (8.6%) | 19 (12.5%) |
| $150,000 or more | 11 (2.6%) | 0 (0.0%) |
| Total | 416 (100.0%) | 152 (100.0%) |
Monthly Housing Cost Tiers in Van Horn
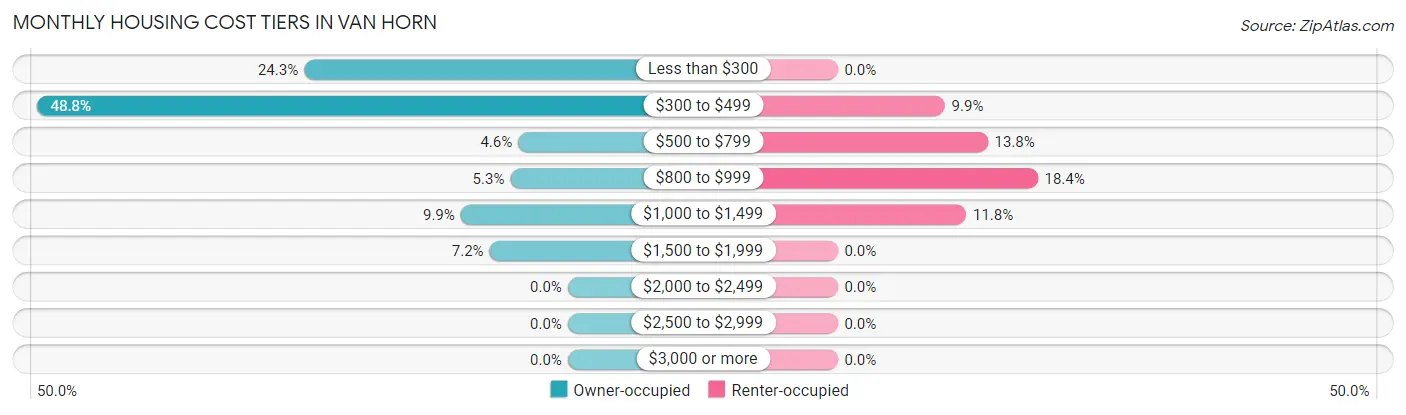
| Monthly Cost | Owner-occupied | Renter-occupied |
| Less than $300 | 101 (24.3%) | 0 (0.0%) |
| $300 to $499 | 203 (48.8%) | 15 (9.9%) |
| $500 to $799 | 19 (4.6%) | 21 (13.8%) |
| $800 to $999 | 22 (5.3%) | 28 (18.4%) |
| $1,000 to $1,499 | 41 (9.9%) | 18 (11.8%) |
| $1,500 to $1,999 | 30 (7.2%) | 0 (0.0%) |
| $2,000 to $2,499 | 0 (0.0%) | 0 (0.0%) |
| $2,500 to $2,999 | 0 (0.0%) | 0 (0.0%) |
| $3,000 or more | 0 (0.0%) | 0 (0.0%) |
| Total | 416 (100.0%) | 152 (100.0%) |
Physical Housing Characteristics in Van Horn
Housing Structures in Van Horn
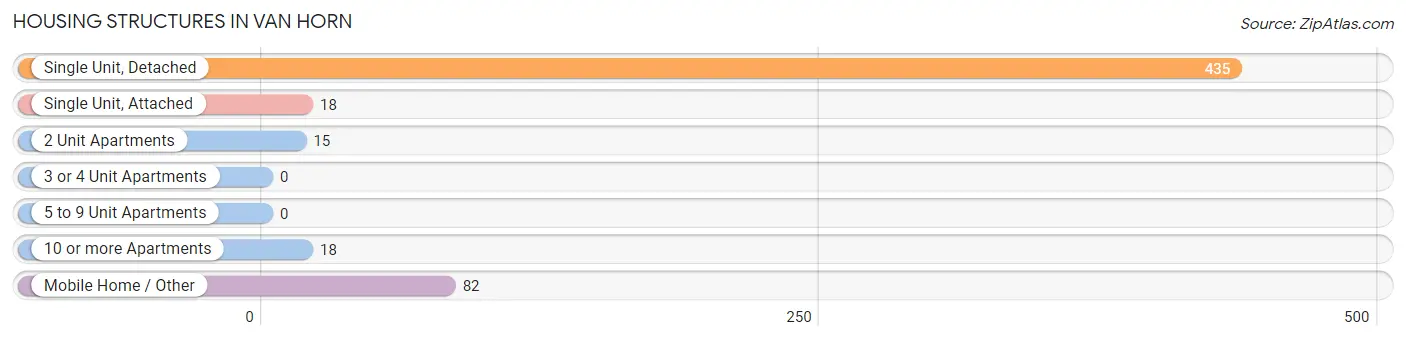
| Structure Type | # Housing Units | % Housing Units |
| Single Unit, Detached | 435 | 76.6% |
| Single Unit, Attached | 18 | 3.2% |
| 2 Unit Apartments | 15 | 2.6% |
| 3 or 4 Unit Apartments | 0 | 0.0% |
| 5 to 9 Unit Apartments | 0 | 0.0% |
| 10 or more Apartments | 18 | 3.2% |
| Mobile Home / Other | 82 | 14.4% |
| Total | 568 | 100.0% |
Housing Structures by Occupancy in Van Horn
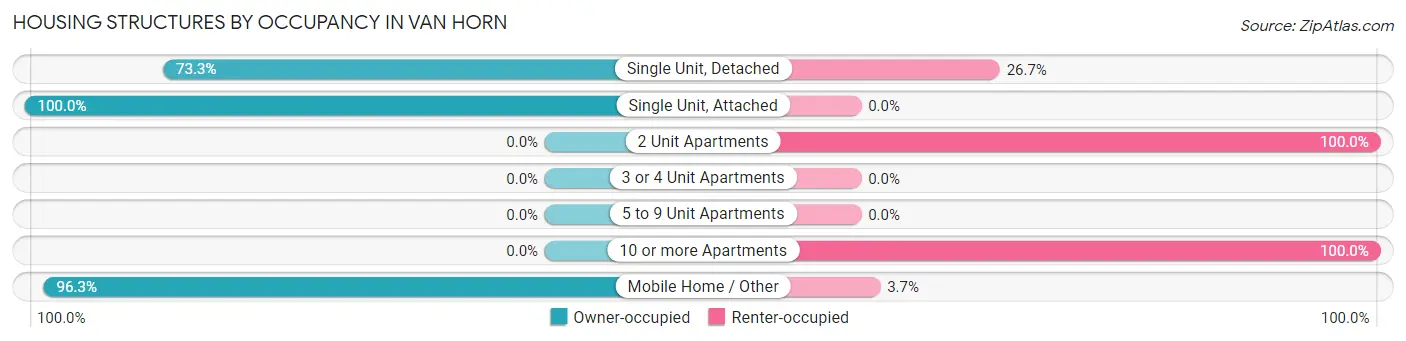
| Structure Type | Owner-occupied | Renter-occupied |
| Single Unit, Detached | 319 (73.3%) | 116 (26.7%) |
| Single Unit, Attached | 18 (100.0%) | 0 (0.0%) |
| 2 Unit Apartments | 0 (0.0%) | 15 (100.0%) |
| 3 or 4 Unit Apartments | 0 (0.0%) | 0 (0.0%) |
| 5 to 9 Unit Apartments | 0 (0.0%) | 0 (0.0%) |
| 10 or more Apartments | 0 (0.0%) | 18 (100.0%) |
| Mobile Home / Other | 79 (96.3%) | 3 (3.7%) |
| Total | 416 (73.2%) | 152 (26.8%) |
Housing Structures by Number of Rooms in Van Horn
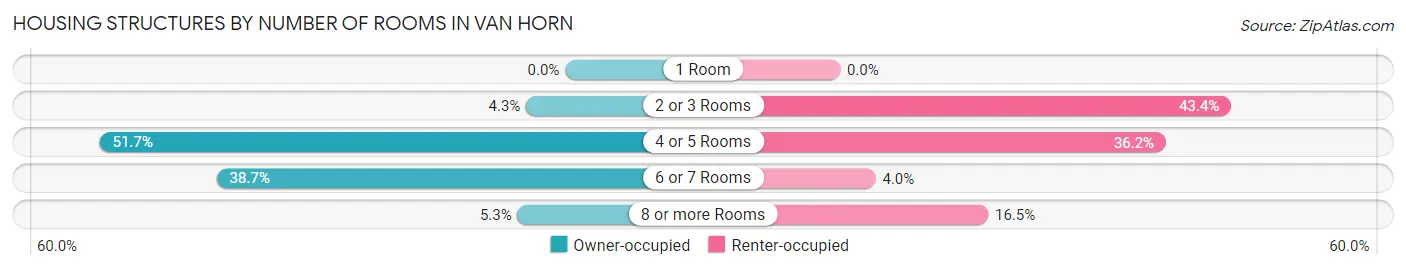
| Number of Rooms | Owner-occupied | Renter-occupied |
| 1 Room | 0 (0.0%) | 0 (0.0%) |
| 2 or 3 Rooms | 18 (4.3%) | 66 (43.4%) |
| 4 or 5 Rooms | 215 (51.7%) | 55 (36.2%) |
| 6 or 7 Rooms | 161 (38.7%) | 6 (4.0%) |
| 8 or more Rooms | 22 (5.3%) | 25 (16.5%) |
| Total | 416 (100.0%) | 152 (100.0%) |
Housing Structure by Heating Type in Van Horn
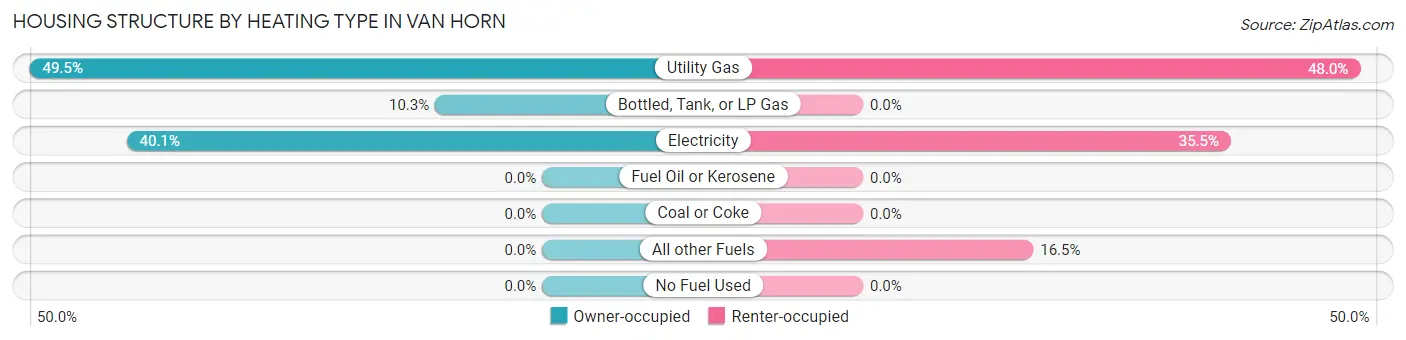
| Heating Type | Owner-occupied | Renter-occupied |
| Utility Gas | 206 (49.5%) | 73 (48.0%) |
| Bottled, Tank, or LP Gas | 43 (10.3%) | 0 (0.0%) |
| Electricity | 167 (40.1%) | 54 (35.5%) |
| Fuel Oil or Kerosene | 0 (0.0%) | 0 (0.0%) |
| Coal or Coke | 0 (0.0%) | 0 (0.0%) |
| All other Fuels | 0 (0.0%) | 25 (16.5%) |
| No Fuel Used | 0 (0.0%) | 0 (0.0%) |
| Total | 416 (100.0%) | 152 (100.0%) |
Household Vehicle Usage in Van Horn
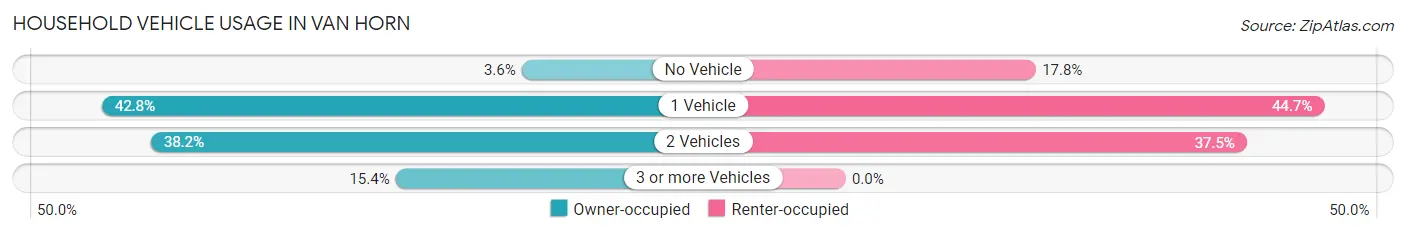
| Vehicles per Household | Owner-occupied | Renter-occupied |
| No Vehicle | 15 (3.6%) | 27 (17.8%) |
| 1 Vehicle | 178 (42.8%) | 68 (44.7%) |
| 2 Vehicles | 159 (38.2%) | 57 (37.5%) |
| 3 or more Vehicles | 64 (15.4%) | 0 (0.0%) |
| Total | 416 (100.0%) | 152 (100.0%) |
Real Estate & Mortgages in Van Horn
Real Estate and Mortgage Overview in Van Horn
| Characteristic | Without Mortgage | With Mortgage |
| Housing Units | 315 | 101 |
| Median Property Value | $79,400 | $117,800 |
| Median Household Income | $28,581 | $11 |
| Monthly Housing Costs | $356 | $0 |
| Real Estate Taxes | $756 | $11 |
Property Value by Mortgage Status in Van Horn
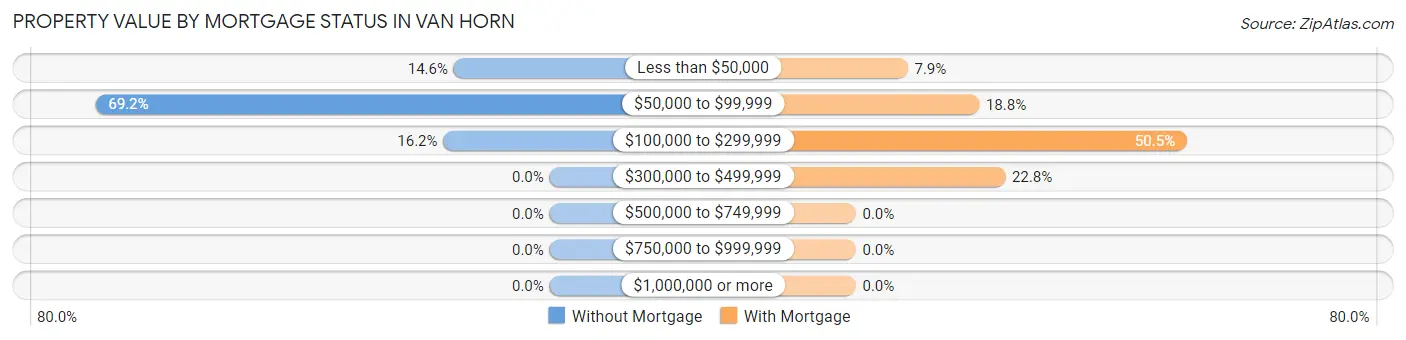
| Property Value | Without Mortgage | With Mortgage |
| Less than $50,000 | 46 (14.6%) | 8 (7.9%) |
| $50,000 to $99,999 | 218 (69.2%) | 19 (18.8%) |
| $100,000 to $299,999 | 51 (16.2%) | 51 (50.5%) |
| $300,000 to $499,999 | 0 (0.0%) | 23 (22.8%) |
| $500,000 to $749,999 | 0 (0.0%) | 0 (0.0%) |
| $750,000 to $999,999 | 0 (0.0%) | 0 (0.0%) |
| $1,000,000 or more | 0 (0.0%) | 0 (0.0%) |
| Total | 315 (100.0%) | 101 (100.0%) |
Household Income by Mortgage Status in Van Horn
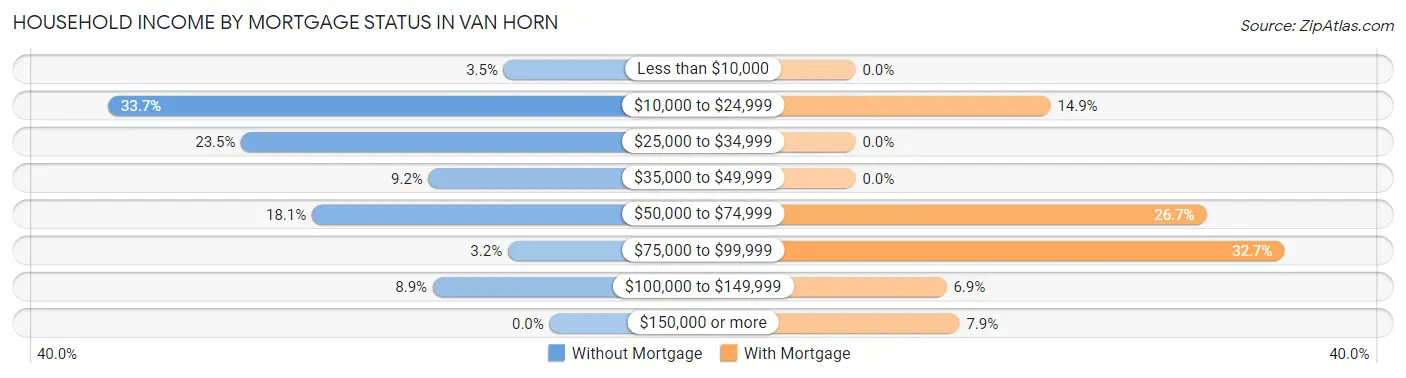
| Household Income | Without Mortgage | With Mortgage |
| Less than $10,000 | 11 (3.5%) | 0 (0.0%) |
| $10,000 to $24,999 | 106 (33.7%) | 15 (14.8%) |
| $25,000 to $34,999 | 74 (23.5%) | 0 (0.0%) |
| $35,000 to $49,999 | 29 (9.2%) | 0 (0.0%) |
| $50,000 to $74,999 | 57 (18.1%) | 27 (26.7%) |
| $75,000 to $99,999 | 10 (3.2%) | 33 (32.7%) |
| $100,000 to $149,999 | 28 (8.9%) | 7 (6.9%) |
| $150,000 or more | 0 (0.0%) | 8 (7.9%) |
| Total | 315 (100.0%) | 101 (100.0%) |
Property Value to Household Income Ratio in Van Horn
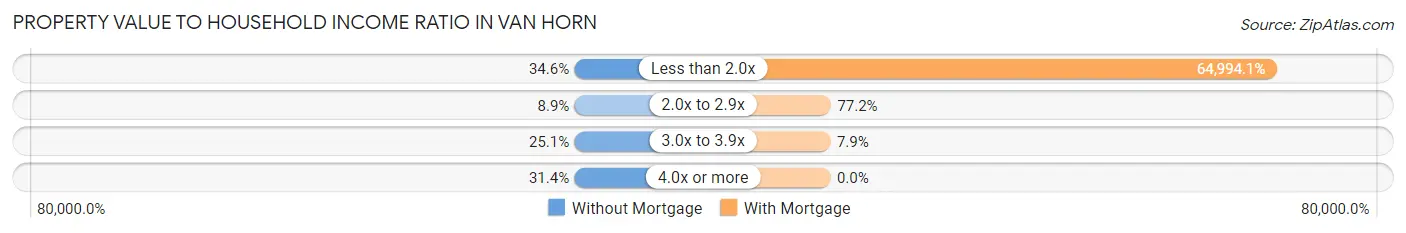
| Value-to-Income Ratio | Without Mortgage | With Mortgage |
| Less than 2.0x | 109 (34.6%) | 65,644 (64,994.1%) |
| 2.0x to 2.9x | 28 (8.9%) | 78 (77.2%) |
| 3.0x to 3.9x | 79 (25.1%) | 8 (7.9%) |
| 4.0x or more | 99 (31.4%) | 0 (0.0%) |
| Total | 315 (100.0%) | 101 (100.0%) |
Real Estate Taxes by Mortgage Status in Van Horn
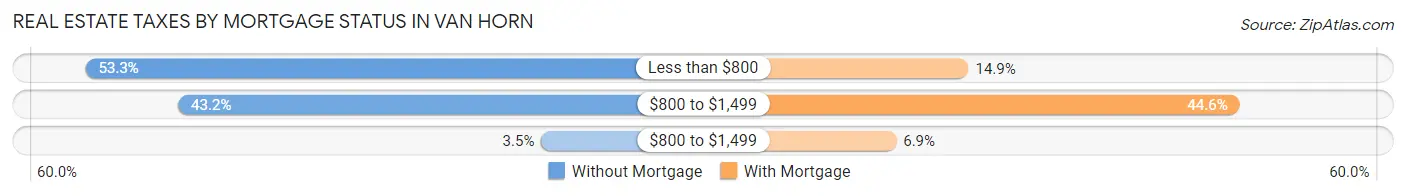
| Property Taxes | Without Mortgage | With Mortgage |
| Less than $800 | 168 (53.3%) | 15 (14.8%) |
| $800 to $1,499 | 136 (43.2%) | 45 (44.6%) |
| $800 to $1,499 | 11 (3.5%) | 7 (6.9%) |
| Total | 315 (100.0%) | 101 (100.0%) |
Health & Disability in Van Horn
Health Insurance Coverage by Age in Van Horn
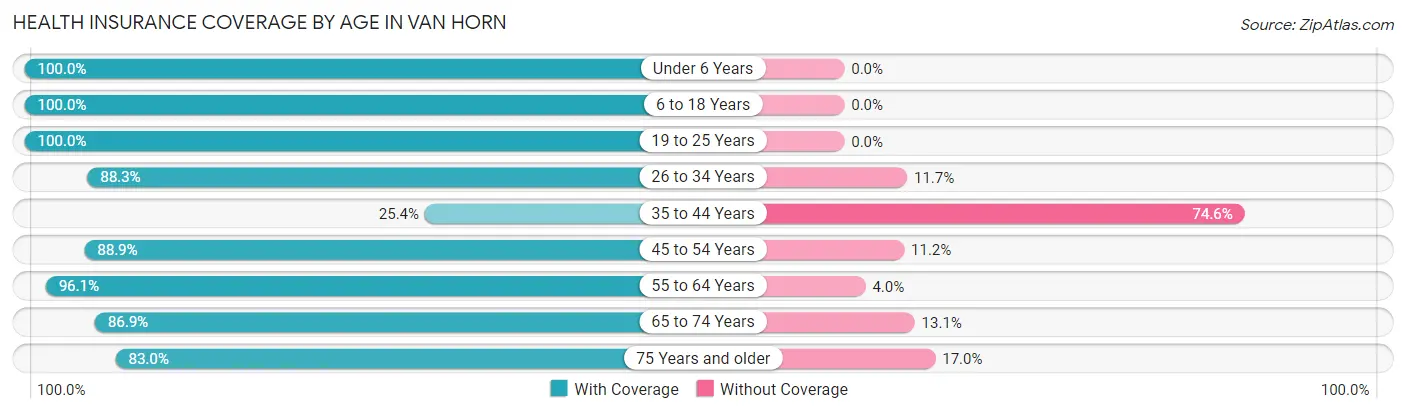
| Age Bracket | With Coverage | Without Coverage |
| Under 6 Years | 67 (100.0%) | 0 (0.0%) |
| 6 to 18 Years | 265 (100.0%) | 0 (0.0%) |
| 19 to 25 Years | 152 (100.0%) | 0 (0.0%) |
| 26 to 34 Years | 249 (88.3%) | 33 (11.7%) |
| 35 to 44 Years | 53 (25.4%) | 156 (74.6%) |
| 45 to 54 Years | 486 (88.8%) | 61 (11.2%) |
| 55 to 64 Years | 146 (96.1%) | 6 (4.0%) |
| 65 to 74 Years | 192 (86.9%) | 29 (13.1%) |
| 75 Years and older | 137 (83.0%) | 28 (17.0%) |
| Total | 1,747 (84.8%) | 313 (15.2%) |
Health Insurance Coverage by Citizenship Status in Van Horn
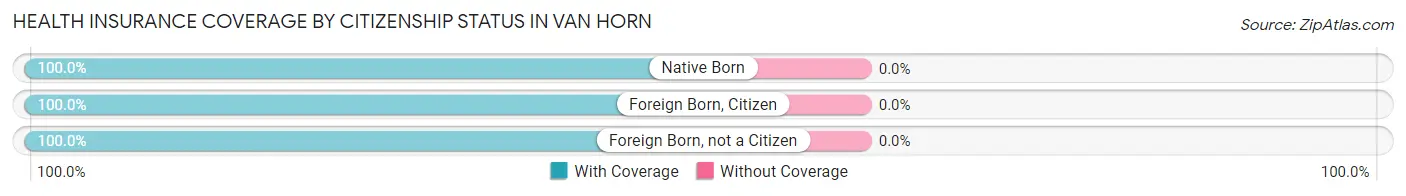
| Citizenship Status | With Coverage | Without Coverage |
| Native Born | 67 (100.0%) | 0 (0.0%) |
| Foreign Born, Citizen | 265 (100.0%) | 0 (0.0%) |
| Foreign Born, not a Citizen | 152 (100.0%) | 0 (0.0%) |
Health Insurance Coverage by Household Income in Van Horn
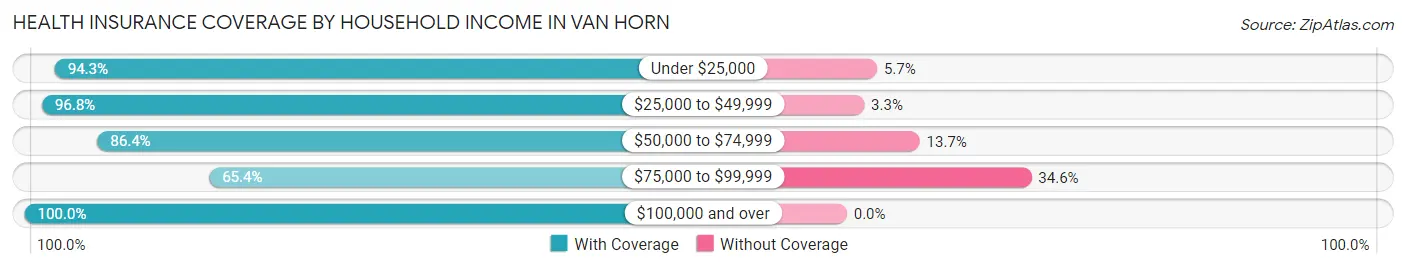
| Household Income | With Coverage | Without Coverage |
| Under $25,000 | 250 (94.3%) | 15 (5.7%) |
| $25,000 to $49,999 | 417 (96.8%) | 14 (3.3%) |
| $50,000 to $74,999 | 424 (86.4%) | 67 (13.7%) |
| $75,000 to $99,999 | 365 (65.4%) | 193 (34.6%) |
| $100,000 and over | 289 (100.0%) | 0 (0.0%) |
Public vs Private Health Insurance Coverage by Age in Van Horn
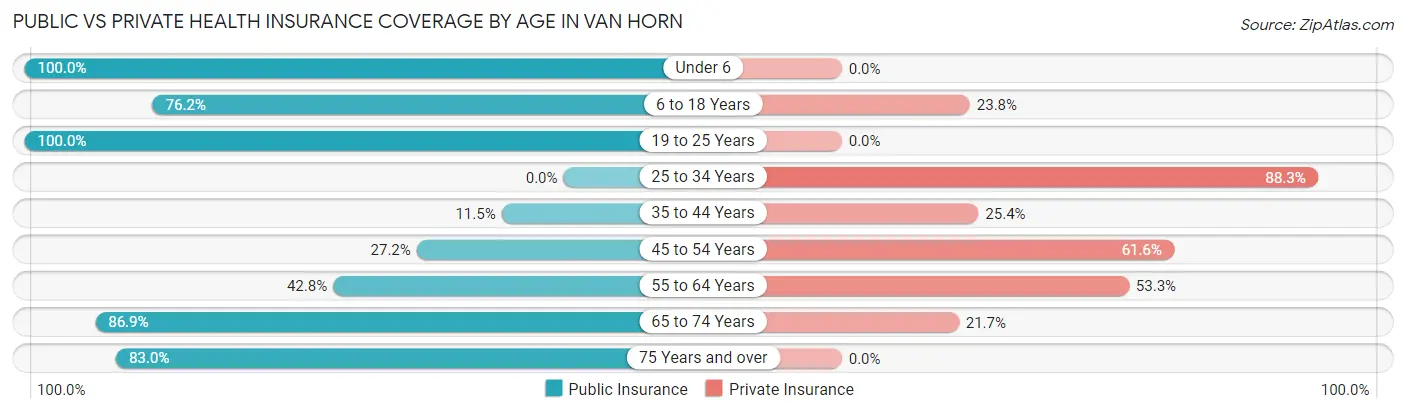
| Age Bracket | Public Insurance | Private Insurance |
| Under 6 | 67 (100.0%) | 0 (0.0%) |
| 6 to 18 Years | 202 (76.2%) | 63 (23.8%) |
| 19 to 25 Years | 152 (100.0%) | 0 (0.0%) |
| 25 to 34 Years | 0 (0.0%) | 249 (88.3%) |
| 35 to 44 Years | 24 (11.5%) | 53 (25.4%) |
| 45 to 54 Years | 149 (27.2%) | 337 (61.6%) |
| 55 to 64 Years | 65 (42.8%) | 81 (53.3%) |
| 65 to 74 Years | 192 (86.9%) | 48 (21.7%) |
| 75 Years and over | 137 (83.0%) | 0 (0.0%) |
| Total | 988 (48.0%) | 831 (40.3%) |
Disability Status by Sex by Age in Van Horn

| Age Bracket | Male | Female |
| Under 5 Years | 0 (0.0%) | 0 (0.0%) |
| 5 to 17 Years | 0 (0.0%) | 0 (0.0%) |
| 18 to 34 Years | 3 (1.1%) | 21 (12.6%) |
| 35 to 64 Years | 234 (38.9%) | 8 (2.6%) |
| 65 to 74 Years | 79 (56.8%) | 15 (18.3%) |
| 75 Years and over | 98 (100.0%) | 18 (26.9%) |
Disability Class by Sex by Age in Van Horn
Disability Class: Hearing Difficulty
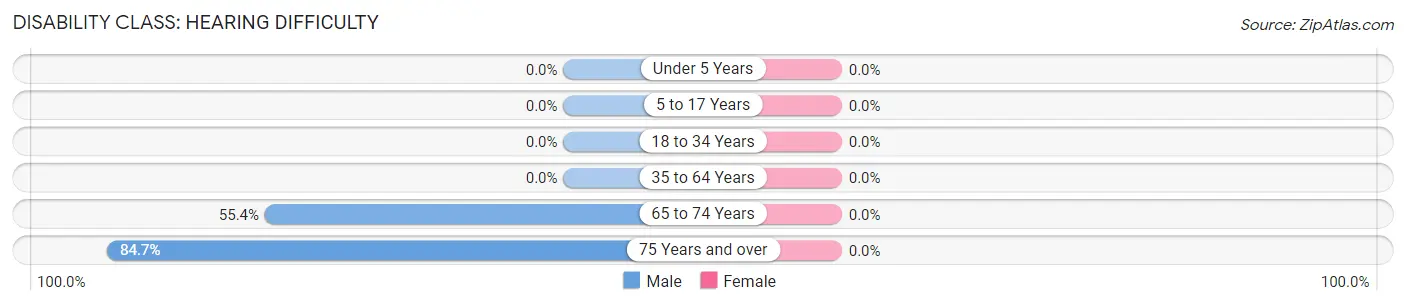
| Age Bracket | Male | Female |
| Under 5 Years | 0 (0.0%) | 0 (0.0%) |
| 5 to 17 Years | 0 (0.0%) | 0 (0.0%) |
| 18 to 34 Years | 0 (0.0%) | 0 (0.0%) |
| 35 to 64 Years | 0 (0.0%) | 0 (0.0%) |
| 65 to 74 Years | 77 (55.4%) | 0 (0.0%) |
| 75 Years and over | 83 (84.7%) | 0 (0.0%) |
Disability Class: Vision Difficulty
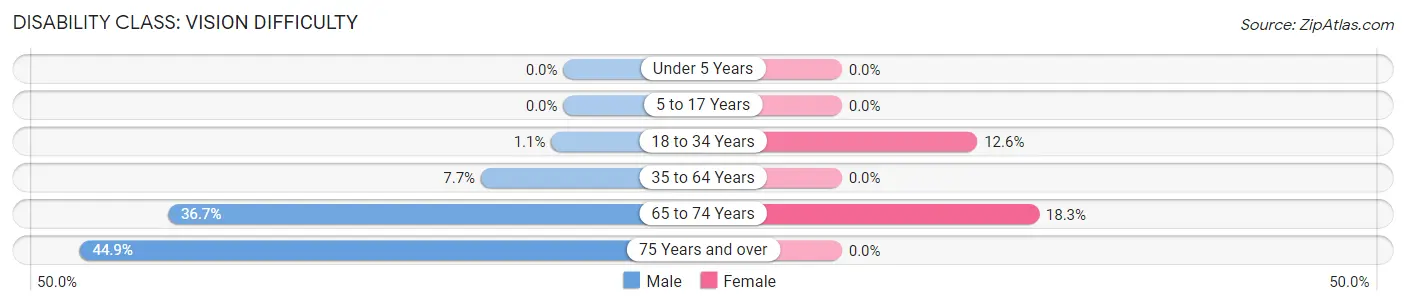
| Age Bracket | Male | Female |
| Under 5 Years | 0 (0.0%) | 0 (0.0%) |
| 5 to 17 Years | 0 (0.0%) | 0 (0.0%) |
| 18 to 34 Years | 3 (1.1%) | 21 (12.6%) |
| 35 to 64 Years | 46 (7.6%) | 0 (0.0%) |
| 65 to 74 Years | 51 (36.7%) | 15 (18.3%) |
| 75 Years and over | 44 (44.9%) | 0 (0.0%) |
Disability Class: Cognitive Difficulty
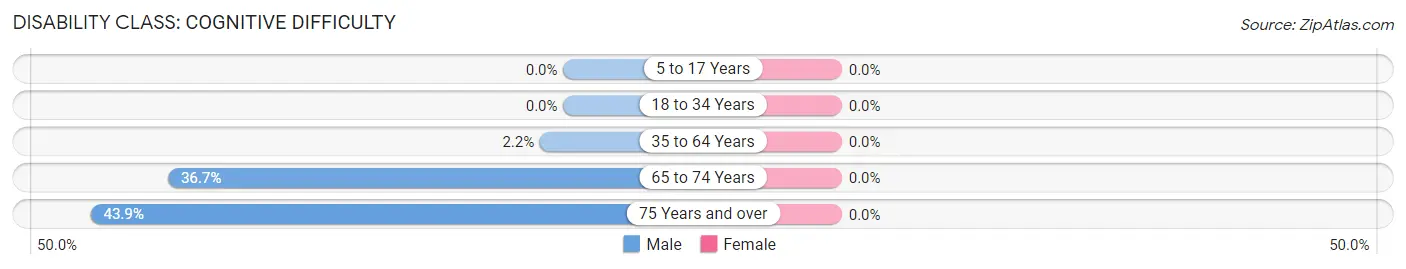
| Age Bracket | Male | Female |
| 5 to 17 Years | 0 (0.0%) | 0 (0.0%) |
| 18 to 34 Years | 0 (0.0%) | 0 (0.0%) |
| 35 to 64 Years | 13 (2.2%) | 0 (0.0%) |
| 65 to 74 Years | 51 (36.7%) | 0 (0.0%) |
| 75 Years and over | 43 (43.9%) | 0 (0.0%) |
Disability Class: Ambulatory Difficulty
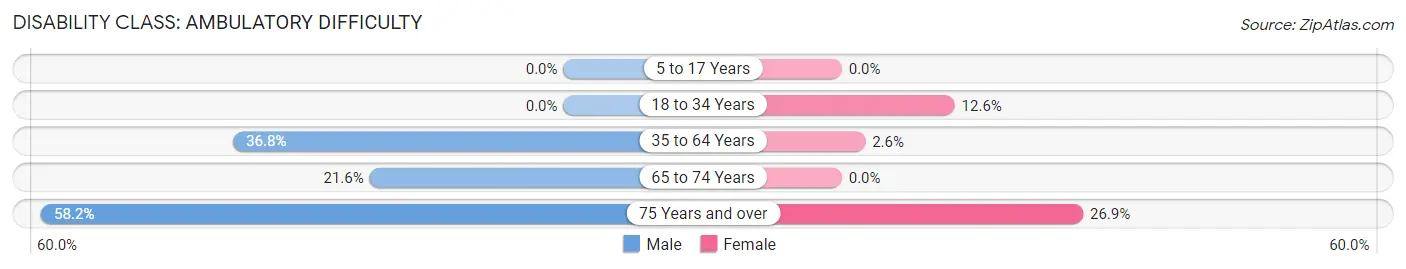
| Age Bracket | Male | Female |
| 5 to 17 Years | 0 (0.0%) | 0 (0.0%) |
| 18 to 34 Years | 0 (0.0%) | 21 (12.6%) |
| 35 to 64 Years | 221 (36.8%) | 8 (2.6%) |
| 65 to 74 Years | 30 (21.6%) | 0 (0.0%) |
| 75 Years and over | 57 (58.2%) | 18 (26.9%) |
Disability Class: Self-Care Difficulty
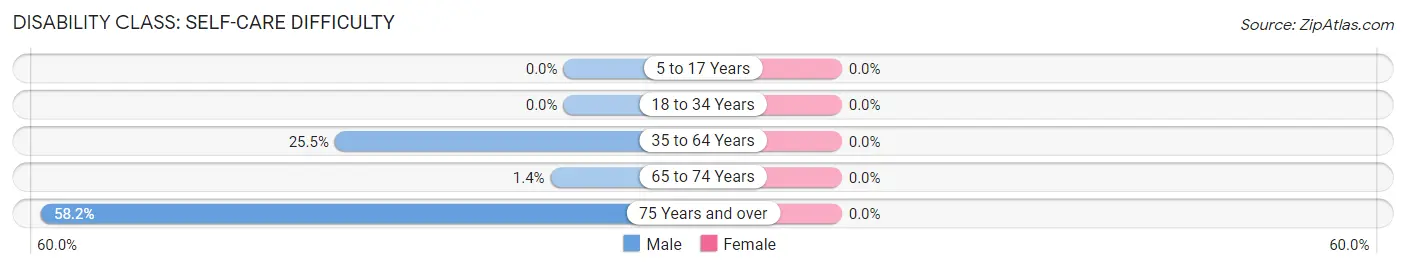
| Age Bracket | Male | Female |
| 5 to 17 Years | 0 (0.0%) | 0 (0.0%) |
| 18 to 34 Years | 0 (0.0%) | 0 (0.0%) |
| 35 to 64 Years | 153 (25.5%) | 0 (0.0%) |
| 65 to 74 Years | 2 (1.4%) | 0 (0.0%) |
| 75 Years and over | 57 (58.2%) | 0 (0.0%) |
Technology Access in Van Horn
Computing Device Access in Van Horn
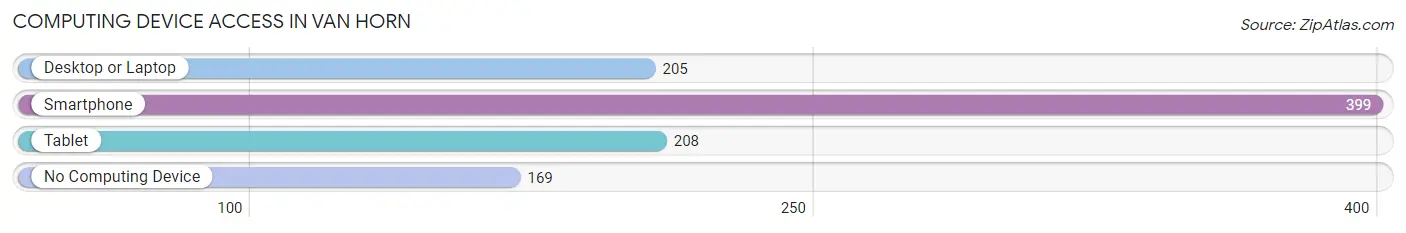
| Device Type | # Households | % Households |
| Desktop or Laptop | 205 | 36.1% |
| Smartphone | 399 | 70.3% |
| Tablet | 208 | 36.6% |
| No Computing Device | 169 | 29.7% |
| Total | 568 | 100.0% |
Internet Access in Van Horn
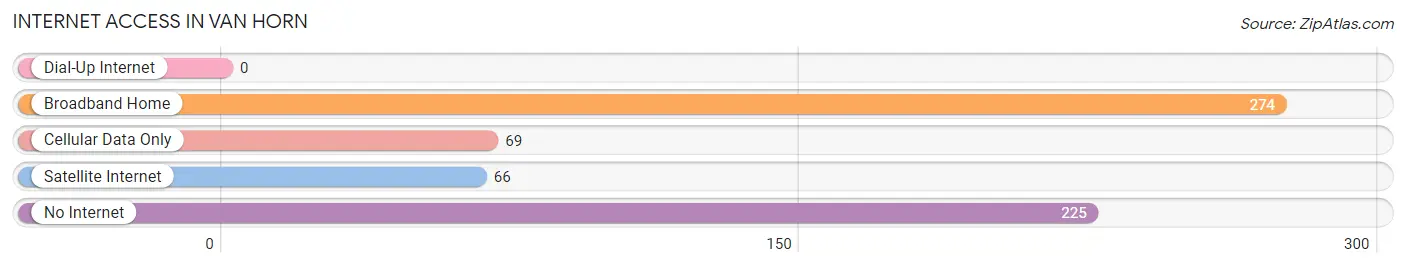
| Internet Type | # Households | % Households |
| Dial-Up Internet | 0 | 0.0% |
| Broadband Home | 274 | 48.2% |
| Cellular Data Only | 69 | 12.1% |
| Satellite Internet | 66 | 11.6% |
| No Internet | 225 | 39.6% |
| Total | 568 | 100.0% |
Van Horn Summary
Van Horn is a small town located in the western part of Texas, in the county of Culberson. It is situated on the edge of the Chihuahuan Desert, and is the county seat of Culberson County. The town has a population of 2,435 people, according to the 2010 census.
History
Van Horn was founded in 1883 by the Texas and Pacific Railway. The town was named after the railroad's chief engineer, John Van Horn. The town was originally a stop on the railroad, and was used as a supply point for the surrounding area. The town grew quickly, and by the early 1900s, it had become a major trading center for the region.
In the early 1900s, Van Horn was a major cattle shipping point, and the town was home to several large ranches. The town was also home to a number of businesses, including a hotel, a bank, a newspaper, and a movie theater.
In the 1950s, the town began to decline as the railroad industry began to decline. The town was also affected by the Great Depression, and many of the businesses in the town closed.
In the late 1970s, the town began to experience a resurgence, as the oil and gas industry began to boom in the area. The town was also home to a number of military bases, which provided jobs and economic stability to the area.
Geography
Van Horn is located in the western part of Texas, in the county of Culberson. It is situated on the edge of the Chihuahuan Desert, and is the county seat of Culberson County. The town is located at an elevation of 3,845 feet, and is surrounded by the Davis Mountains to the west, the Guadalupe Mountains to the east, and the Chisos Mountains to the south.
The town is located on Interstate 10, and is approximately 100 miles east of El Paso, Texas. The town is also located near the Rio Grande, which forms the border between the United States and Mexico.
Economy
The economy of Van Horn is largely based on the oil and gas industry. The town is home to several oil and gas companies, and is a major hub for the industry in the region. The town is also home to a number of military bases, which provide jobs and economic stability to the area.
The town is also home to a number of businesses, including restaurants, hotels, and retail stores. The town is also home to a number of tourist attractions, including the Van Horn Museum, the Van Horn Historic District, and the Van Horn State Park.
Demographics
According to the 2010 census, the population of Van Horn was 2,435 people. The town has a population that is predominantly white, with a small Hispanic population. The median household income in the town is $37,917, and the median age is 37.7 years.
Conclusion
Van Horn is a small town located in the western part of Texas, in the county of Culberson. The town has a population of 2,435 people, according to the 2010 census. The town is largely based on the oil and gas industry, and is home to several military bases. The town is also home to a number of businesses, including restaurants, hotels, and retail stores. The town has a predominantly white population, with a small Hispanic population. The median household income in the town is $37,917, and the median age is 37.7 years.
Common Questions
What is Per Capita Income in Van Horn?
Per Capita income in Van Horn is $30,113.
What is the Median Family Income in Van Horn?
Median Family Income in Van Horn is $56,250.
What is the Median Household income in Van Horn?
Median Household Income in Van Horn is $37,391.
What is Income or Wage Gap in Van Horn?
Income or Wage Gap in Van Horn is 42.5%.
Women in Van Horn earn 57.5 cents for every dollar earned by a man.
What is Inequality or Gini Index in Van Horn?
Inequality or Gini Index in Van Horn is 0.42.
What is the Total Population of Van Horn?
Total Population of Van Horn is 2,075.
What is the Total Male Population of Van Horn?
Total Male Population of Van Horn is 1,307.
What is the Total Female Population of Van Horn?
Total Female Population of Van Horn is 768.
What is the Ratio of Males per 100 Females in Van Horn?
There are 170.18 Males per 100 Females in Van Horn.
What is the Ratio of Females per 100 Males in Van Horn?
There are 58.76 Females per 100 Males in Van Horn.
What is the Median Population Age in Van Horn?
Median Population Age in Van Horn is 47.1 Years.
What is the Average Family Size in Van Horn
Average Family Size in Van Horn is 4.9 People.
What is the Average Household Size in Van Horn
Average Household Size in Van Horn is 3.6 People.
How Large is the Labor Force in Van Horn?
There are 1,020 People in the Labor Forcein in Van Horn.
What is the Percentage of People in the Labor Force in Van Horn?
57.9% of People are in the Labor Force in Van Horn.
What is the Unemployment Rate in Van Horn?
Unemployment Rate in Van Horn is 10.2%.