Comunas, PR Map & Demographics
Comunas Map
Comunas Overview
$10,289
PER CAPITA INCOME
$23,889
AVG FAMILY INCOME
$26,053
AVG HOUSEHOLD INCOME
21.6%
WAGE / INCOME GAP [ % ]
78.4¢/ $1
WAGE / INCOME GAP [ $ ]
0.40
INEQUALITY / GINI INDEX
3,005
TOTAL POPULATION
1,513
MALE POPULATION
1,492
FEMALE POPULATION
101.41
MALES / 100 FEMALES
98.61
FEMALES / 100 MALES
43.4
MEDIAN AGE
3.2
AVG FAMILY SIZE
2.9
AVG HOUSEHOLD SIZE
1,057
LABOR FORCE [ PEOPLE ]
38.5%
PERCENT IN LABOR FORCE
14.4%
UNEMPLOYMENT RATE
Income in Comunas
Income Overview in Comunas
Per Capita Income in Comunas is $10,289, while median incomes of families and households are $23,889 and $26,053 respectively.
| Characteristic | Number | Measure |
| Per Capita Income | 3,005 | $10,289 |
| Median Family Income | 804 | $23,889 |
| Mean Family Income | 804 | $28,027 |
| Median Household Income | 1,042 | $26,053 |
| Mean Household Income | 1,042 | $26,858 |
| Income Deficit | 804 | $0 |
| Wage / Income Gap (%) | 3,005 | 21.61% |
| Wage / Income Gap ($) | 3,005 | 78.39¢ per $1 |
| Gini / Inequality Index | 3,005 | 0.40 |
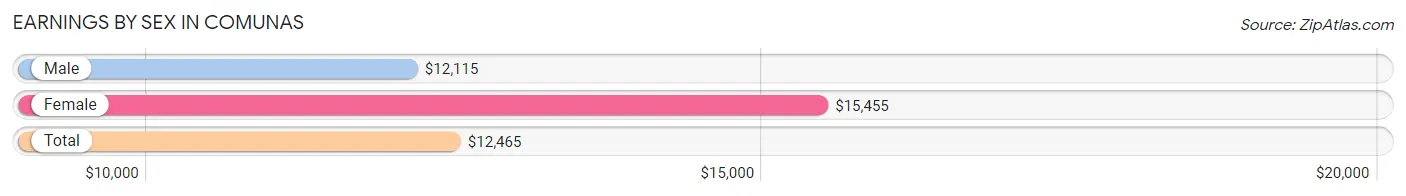
Earnings by Sex in Comunas
Average Earnings in Comunas are $12,465, $12,115 for men and $15,455 for women, a difference of 21.6%.
| Sex | Number | Average Earnings |
| Male | 578 (53.7%) | $12,115 |
| Female | 498 (46.3%) | $15,455 |
| Total | 1,076 (100.0%) | $12,465 |
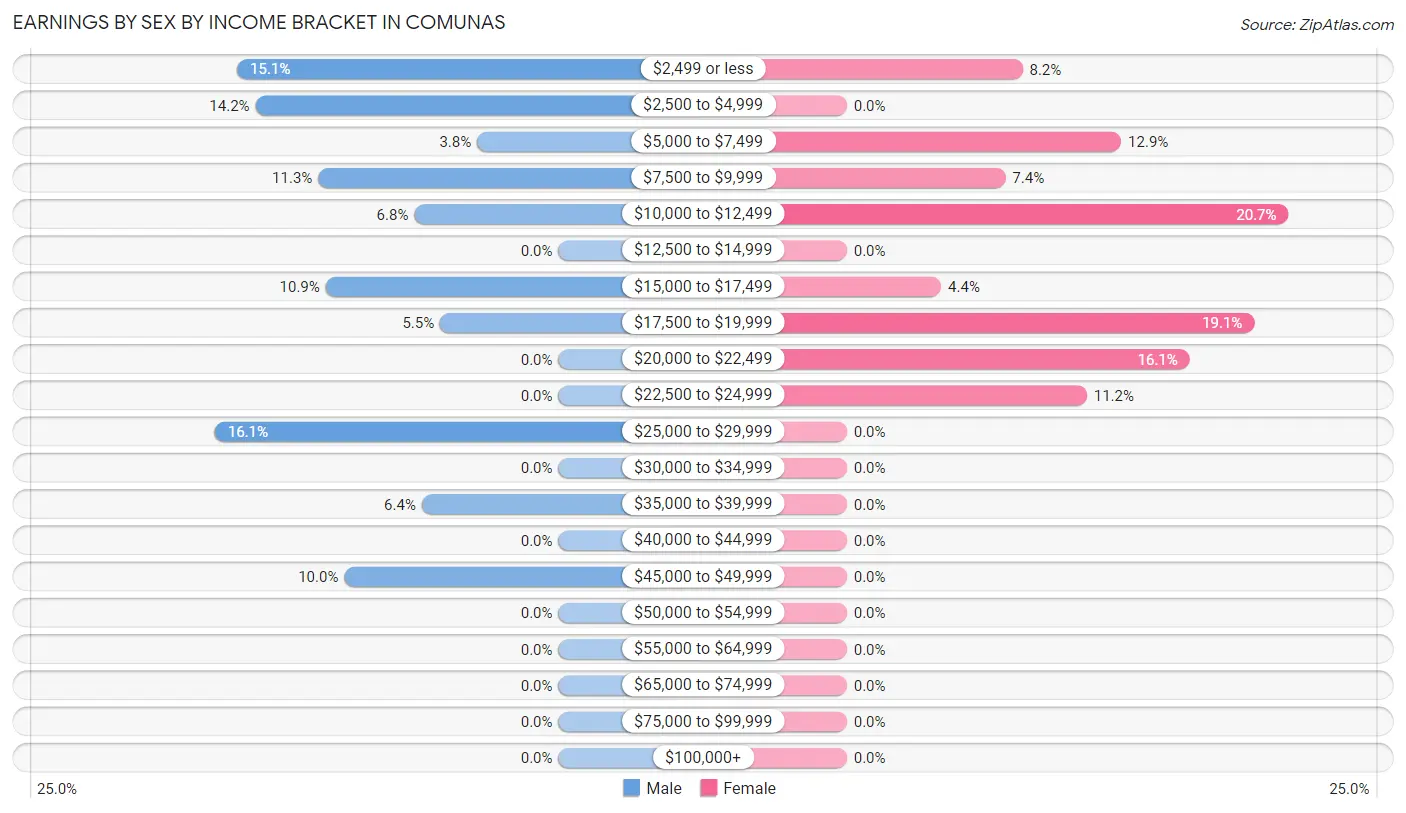
Earnings by Sex by Income Bracket in Comunas
The most common earnings brackets in Comunas are $25,000 to $29,999 for men (93 | 16.1%) and $10,000 to $12,499 for women (103 | 20.7%).
| Income | Male | Female |
| $2,499 or less | 87 (15.0%) | 41 (8.2%) |
| $2,500 to $4,999 | 82 (14.2%) | 0 (0.0%) |
| $5,000 to $7,499 | 22 (3.8%) | 64 (12.9%) |
| $7,500 to $9,999 | 65 (11.3%) | 37 (7.4%) |
| $10,000 to $12,499 | 39 (6.8%) | 103 (20.7%) |
| $12,500 to $14,999 | 0 (0.0%) | 0 (0.0%) |
| $15,000 to $17,499 | 63 (10.9%) | 22 (4.4%) |
| $17,500 to $19,999 | 32 (5.5%) | 95 (19.1%) |
| $20,000 to $22,499 | 0 (0.0%) | 80 (16.1%) |
| $22,500 to $24,999 | 0 (0.0%) | 56 (11.2%) |
| $25,000 to $29,999 | 93 (16.1%) | 0 (0.0%) |
| $30,000 to $34,999 | 0 (0.0%) | 0 (0.0%) |
| $35,000 to $39,999 | 37 (6.4%) | 0 (0.0%) |
| $40,000 to $44,999 | 0 (0.0%) | 0 (0.0%) |
| $45,000 to $49,999 | 58 (10.0%) | 0 (0.0%) |
| $50,000 to $54,999 | 0 (0.0%) | 0 (0.0%) |
| $55,000 to $64,999 | 0 (0.0%) | 0 (0.0%) |
| $65,000 to $74,999 | 0 (0.0%) | 0 (0.0%) |
| $75,000 to $99,999 | 0 (0.0%) | 0 (0.0%) |
| $100,000+ | 0 (0.0%) | 0 (0.0%) |
| Total | 578 (100.0%) | 498 (100.0%) |
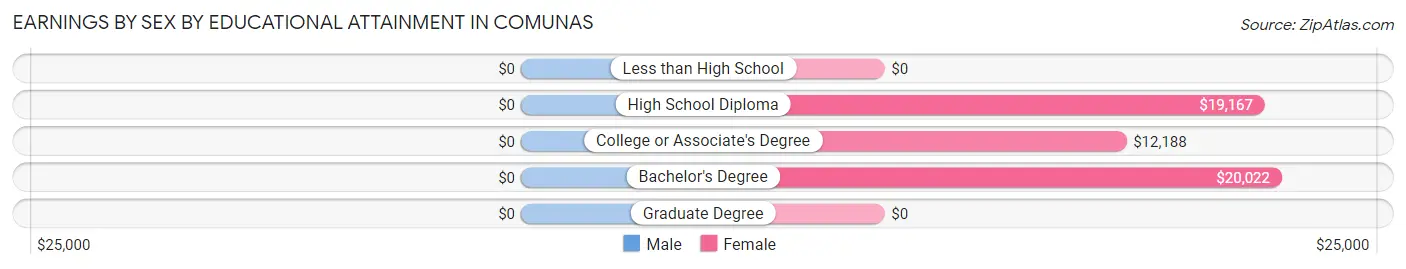
Earnings by Sex by Educational Attainment in Comunas
| Educational Attainment | Male Income | Female Income |
| Less than High School | - | - |
| High School Diploma | - | - |
| College or Associate's Degree | - | - |
| Bachelor's Degree | - | - |
| Graduate Degree | - | - |
| Total | $25,309 | $18,250 |
Family Income in Comunas
Family Income Brackets in Comunas
According to the Comunas family income data, there are 192 families falling into the $15,000 to $24,999 income range, which is the most common income bracket and makes up 23.9% of all families.
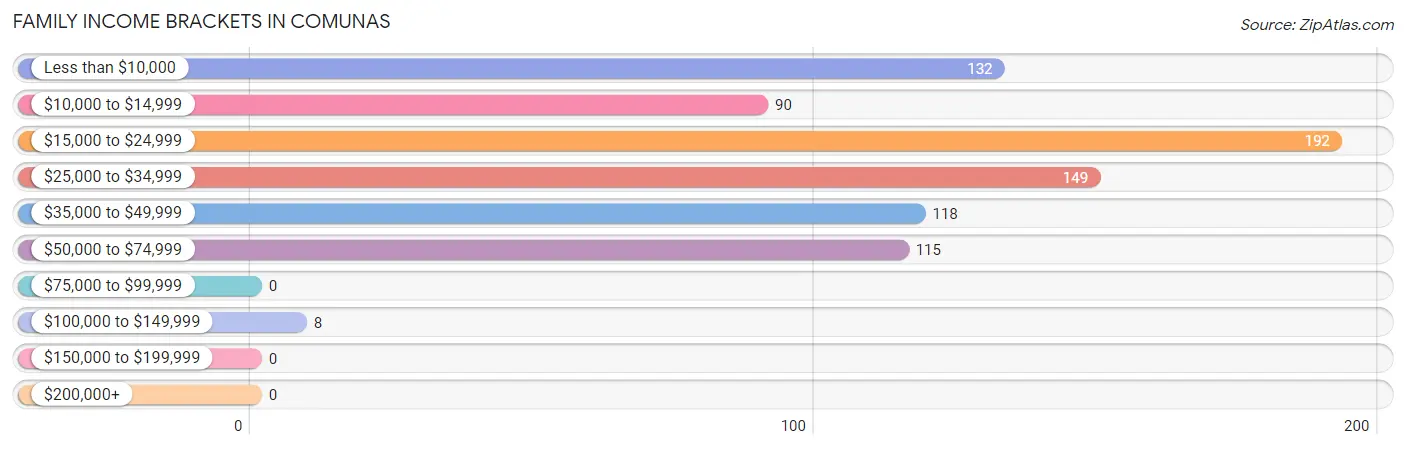
| Income Bracket | # Families | % Families |
| Less than $10,000 | 132 | 16.4% |
| $10,000 to $14,999 | 90 | 11.2% |
| $15,000 to $24,999 | 192 | 23.9% |
| $25,000 to $34,999 | 149 | 18.5% |
| $35,000 to $49,999 | 118 | 14.7% |
| $50,000 to $74,999 | 115 | 14.3% |
| $75,000 to $99,999 | 0 | 0.0% |
| $100,000 to $149,999 | 8 | 1.0% |
| $150,000 to $199,999 | 0 | 0.0% |
| $200,000+ | 0 | 0.0% |
Family Income by Famaliy Size in Comunas
4-person families (165 | 20.5%) account for the highest median family income in Comunas with $30,994 per family, while 2-person families (292 | 36.3%) have the highest median income of $9,606 per family member.
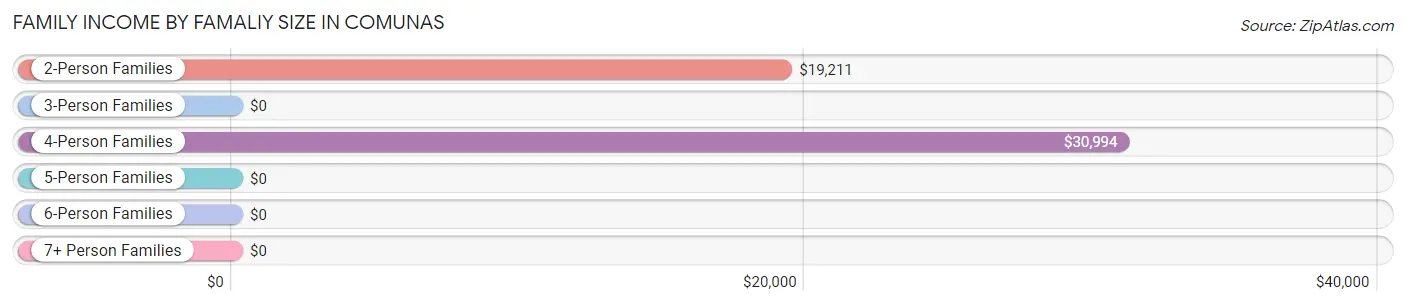
| Income Bracket | # Families | Median Income |
| 2-Person Families | 292 (36.3%) | $19,211 |
| 3-Person Families | 325 (40.4%) | $0 |
| 4-Person Families | 165 (20.5%) | $30,994 |
| 5-Person Families | 22 (2.7%) | $0 |
| 6-Person Families | 0 (0.0%) | $0 |
| 7+ Person Families | 0 (0.0%) | $0 |
| Total | 804 (100.0%) | $23,889 |
Family Income by Number of Earners in Comunas
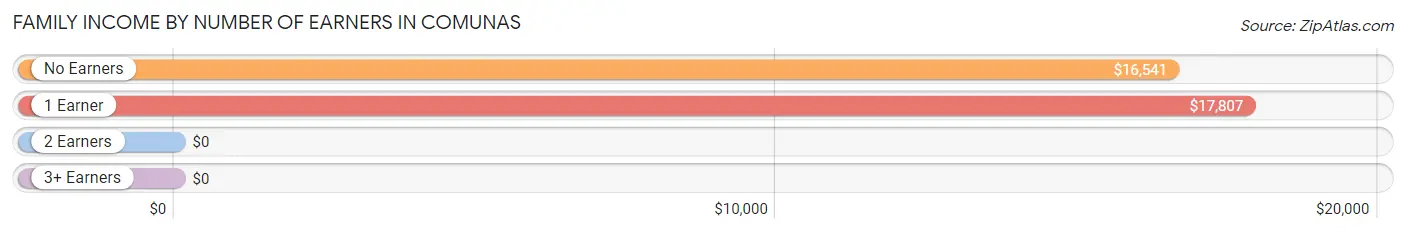
| Number of Earners | # Families | Median Income |
| No Earners | 267 (33.2%) | $16,541 |
| 1 Earner | 314 (39.1%) | $17,807 |
| 2 Earners | 164 (20.4%) | $0 |
| 3+ Earners | 59 (7.3%) | $0 |
| Total | 804 (100.0%) | $23,889 |
Household Income in Comunas
Household Income Brackets in Comunas
With 231 households falling in the category, the $25,000 to $34,999 income range is the most frequent in Comunas, accounting for 22.2% of all households.
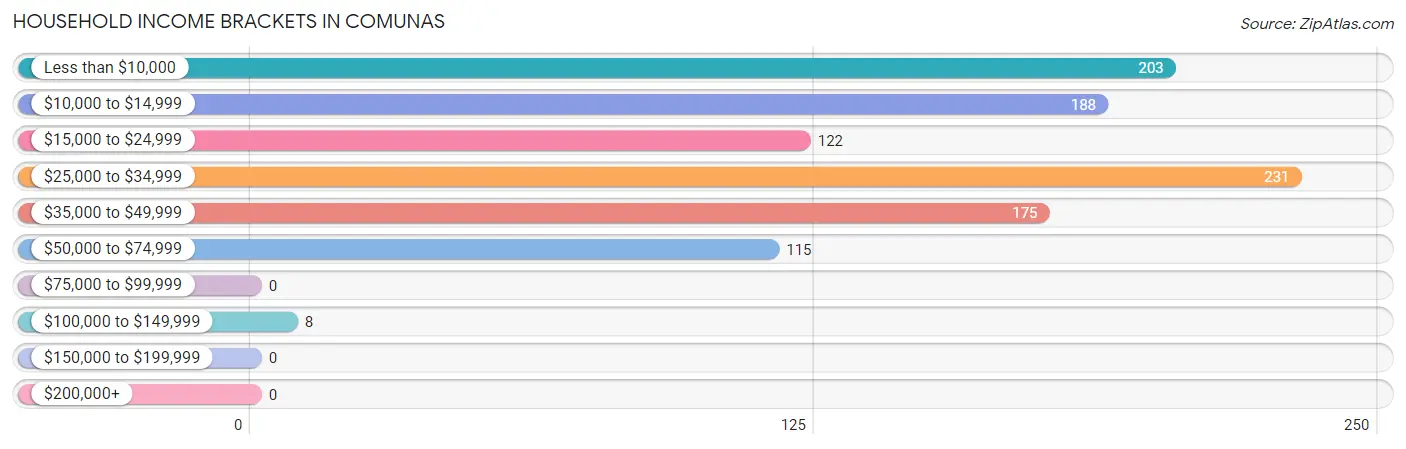
| Income Bracket | # Households | % Households |
| Less than $10,000 | 203 | 19.5% |
| $10,000 to $14,999 | 188 | 18.0% |
| $15,000 to $24,999 | 122 | 11.7% |
| $25,000 to $34,999 | 231 | 22.2% |
| $35,000 to $49,999 | 175 | 16.8% |
| $50,000 to $74,999 | 115 | 11.0% |
| $75,000 to $99,999 | 0 | 0.0% |
| $100,000 to $149,999 | 8 | 0.8% |
| $150,000 to $199,999 | 0 | 0.0% |
| $200,000+ | 0 | 0.0% |
Household Income by Householder Age in Comunas
The median household income in Comunas is $26,053, with the highest median household income of $30,962 found in the 45 to 64 years age bracket for the primary householder. A total of 400 households (38.4%) fall into this category.
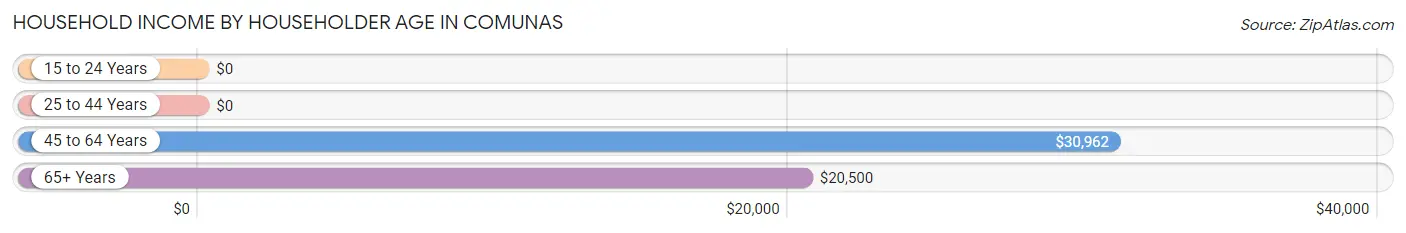
| Income Bracket | # Households | Median Income |
| 15 to 24 Years | 0 (0.0%) | $0 |
| 25 to 44 Years | 212 (20.3%) | $0 |
| 45 to 64 Years | 400 (38.4%) | $30,962 |
| 65+ Years | 430 (41.3%) | $20,500 |
| Total | 1,042 (100.0%) | $26,053 |
Poverty in Comunas
Income Below Poverty by Sex and Age in Comunas
With 51.3% poverty level for males and 61.5% for females among the residents of Comunas, 35 to 44 year old males and under 5 year old females are the most vulnerable to poverty, with 187 males (100.0%) and 24 females (100.0%) in their respective age groups living below the poverty level.
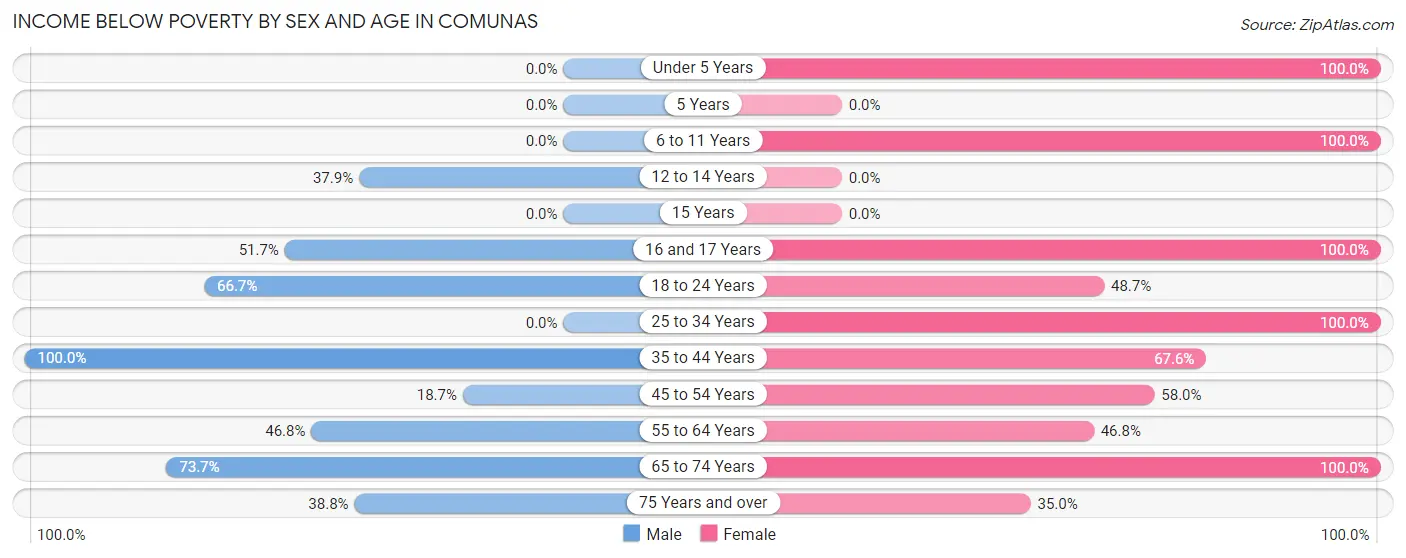
| Age Bracket | Male | Female |
| Under 5 Years | 0 (0.0%) | 24 (100.0%) |
| 5 Years | 0 (0.0%) | 0 (0.0%) |
| 6 to 11 Years | 0 (0.0%) | 119 (100.0%) |
| 12 to 14 Years | 44 (37.9%) | 0 (0.0%) |
| 15 Years | 0 (0.0%) | 0 (0.0%) |
| 16 and 17 Years | 30 (51.7%) | 63 (100.0%) |
| 18 to 24 Years | 240 (66.7%) | 110 (48.7%) |
| 25 to 34 Years | 0 (0.0%) | 57 (100.0%) |
| 35 to 44 Years | 187 (100.0%) | 117 (67.6%) |
| 45 to 54 Years | 39 (18.7%) | 141 (58.0%) |
| 55 to 64 Years | 73 (46.8%) | 130 (46.8%) |
| 65 to 74 Years | 126 (73.7%) | 75 (100.0%) |
| 75 Years and over | 38 (38.8%) | 82 (35.0%) |
| Total | 777 (51.3%) | 918 (61.5%) |
Income Above Poverty by Sex and Age in Comunas
According to the poverty statistics in Comunas, males aged 25 to 34 years and females aged 75 years and over are the age groups that are most secure financially, with 100.0% of males and 65.0% of females in these age groups living above the poverty line.
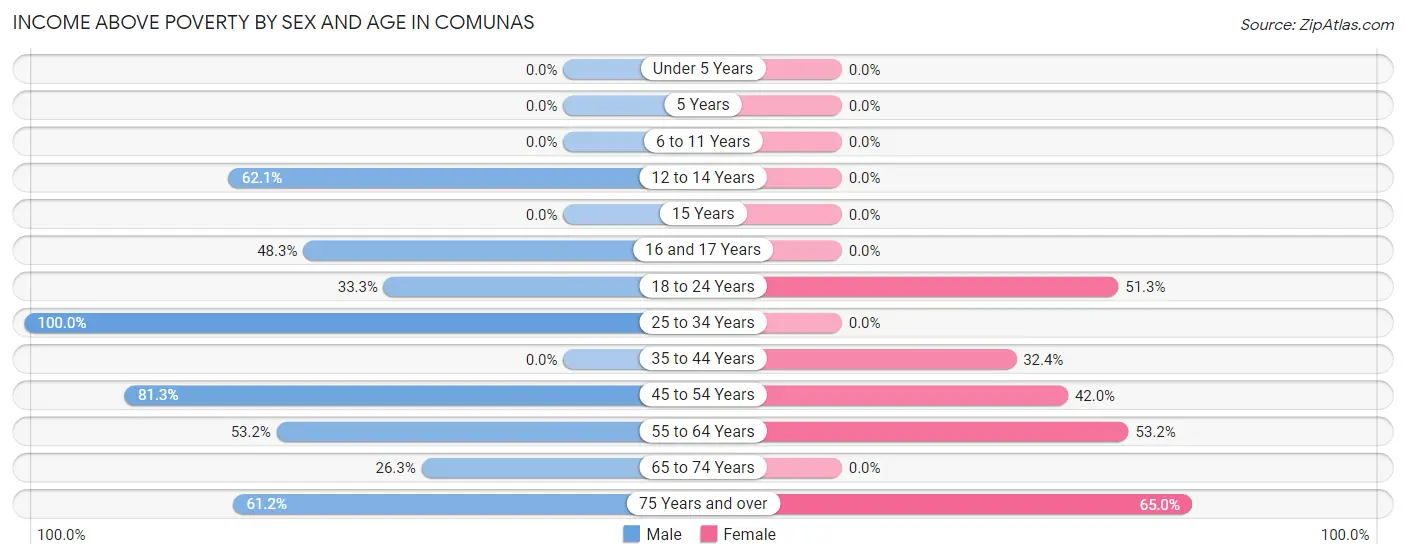
| Age Bracket | Male | Female |
| Under 5 Years | 0 (0.0%) | 0 (0.0%) |
| 5 Years | 0 (0.0%) | 0 (0.0%) |
| 6 to 11 Years | 0 (0.0%) | 0 (0.0%) |
| 12 to 14 Years | 72 (62.1%) | 0 (0.0%) |
| 15 Years | 0 (0.0%) | 0 (0.0%) |
| 16 and 17 Years | 28 (48.3%) | 0 (0.0%) |
| 18 to 24 Years | 120 (33.3%) | 116 (51.3%) |
| 25 to 34 Years | 158 (100.0%) | 0 (0.0%) |
| 35 to 44 Years | 0 (0.0%) | 56 (32.4%) |
| 45 to 54 Years | 170 (81.3%) | 102 (42.0%) |
| 55 to 64 Years | 83 (53.2%) | 148 (53.2%) |
| 65 to 74 Years | 45 (26.3%) | 0 (0.0%) |
| 75 Years and over | 60 (61.2%) | 152 (65.0%) |
| Total | 736 (48.6%) | 574 (38.5%) |
Income Below Poverty Among Married-Couple Families in Comunas
The poverty statistics for married-couple families in Comunas show that 50.0% or 197 of the total 394 families live below the poverty line. Families with no children have the highest poverty rate of 57.3%, comprising of 137 families. On the other hand, families with 1 or 2 children have the lowest poverty rate of 38.7%, which includes 60 families.
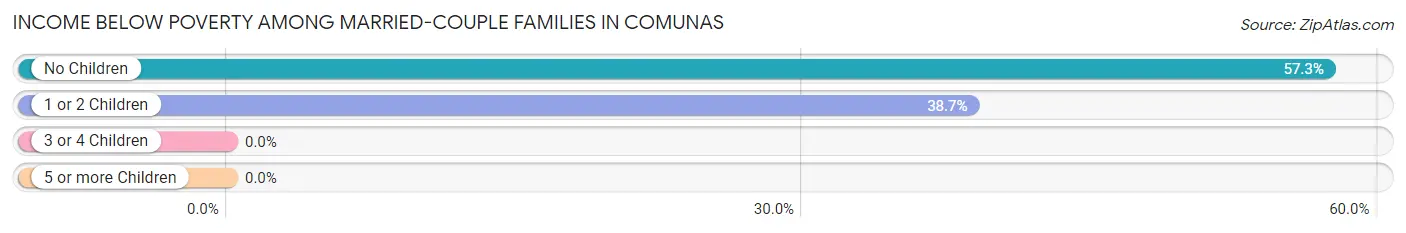
| Children | Above Poverty | Below Poverty |
| No Children | 102 (42.7%) | 137 (57.3%) |
| 1 or 2 Children | 95 (61.3%) | 60 (38.7%) |
| 3 or 4 Children | 0 (0.0%) | 0 (0.0%) |
| 5 or more Children | 0 (0.0%) | 0 (0.0%) |
| Total | 197 (50.0%) | 197 (50.0%) |
Income Below Poverty Among Single-Parent Households in Comunas
According to the poverty data in Comunas, 100.0% or 37 single-father households and 61.4% or 229 single-mother households are living below the poverty line. Among single-father households, those with 1 or 2 children have the highest poverty rate, with 37 households (100.0%) experiencing poverty. Likewise, among single-mother households, those with 1 or 2 children have the highest poverty rate, with 149 households (100.0%) falling below the poverty line.
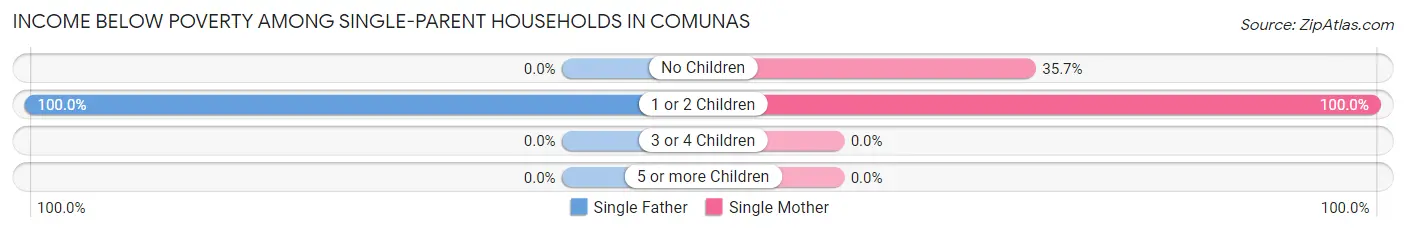
| Children | Single Father | Single Mother |
| No Children | 0 (0.0%) | 80 (35.7%) |
| 1 or 2 Children | 37 (100.0%) | 149 (100.0%) |
| 3 or 4 Children | 0 (0.0%) | 0 (0.0%) |
| 5 or more Children | 0 (0.0%) | 0 (0.0%) |
| Total | 37 (100.0%) | 229 (61.4%) |
Income Below Poverty Among Married-Couple vs Single-Parent Households in Comunas
The poverty data for Comunas shows that 197 of the married-couple family households (50.0%) and 266 of the single-parent households (64.9%) are living below the poverty level. Within the married-couple family households, those with no children have the highest poverty rate, with 137 households (57.3%) falling below the poverty line. Among the single-parent households, those with 1 or 2 children have the highest poverty rate, with 186 household (100.0%) living below poverty.
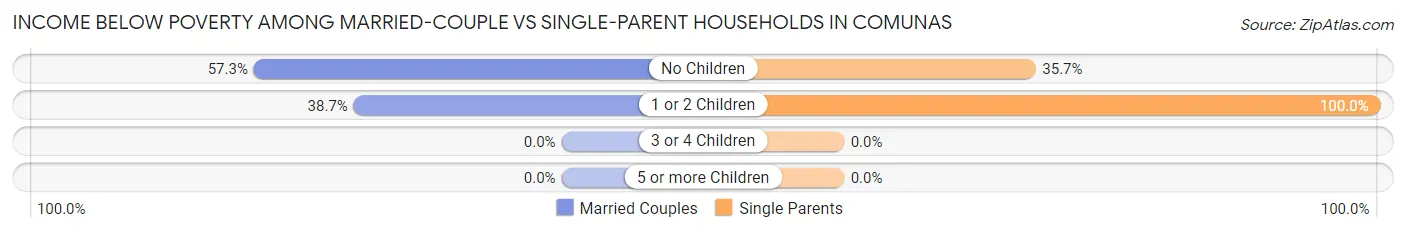
| Children | Married-Couple Families | Single-Parent Households |
| No Children | 137 (57.3%) | 80 (35.7%) |
| 1 or 2 Children | 60 (38.7%) | 186 (100.0%) |
| 3 or 4 Children | 0 (0.0%) | 0 (0.0%) |
| 5 or more Children | 0 (0.0%) | 0 (0.0%) |
| Total | 197 (50.0%) | 266 (64.9%) |
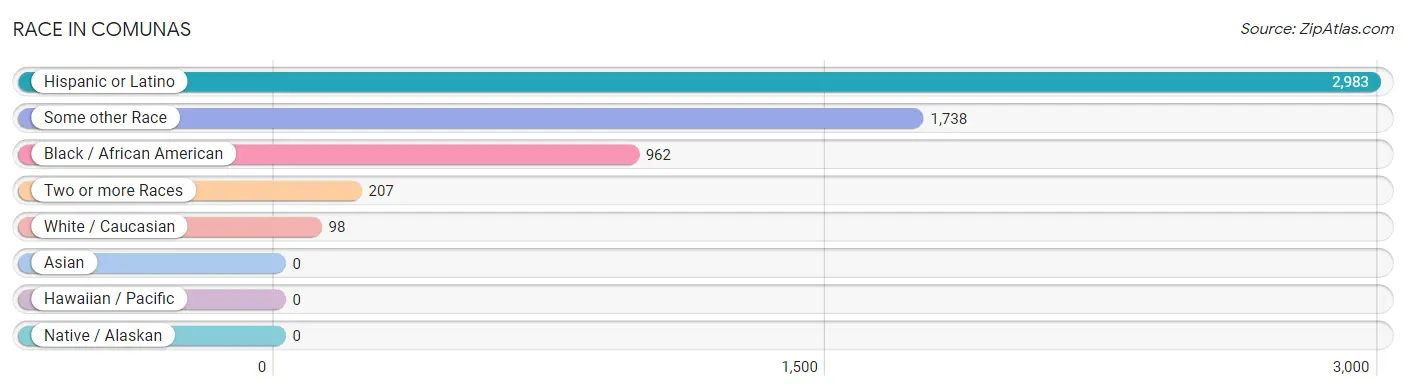
Race in Comunas
The most populous races in Comunas are Hispanic or Latino (2,983 | 99.3%), Some other Race (1,738 | 57.8%), and Black / African American (962 | 32.0%).
| Race | # Population | % Population |
| Asian | 0 | 0.0% |
| Black / African American | 962 | 32.0% |
| Hawaiian / Pacific | 0 | 0.0% |
| Hispanic or Latino | 2,983 | 99.3% |
| Native / Alaskan | 0 | 0.0% |
| White / Caucasian | 98 | 3.3% |
| Two or more Races | 207 | 6.9% |
| Some other Race | 1,738 | 57.8% |
| Total | 3,005 | 100.0% |
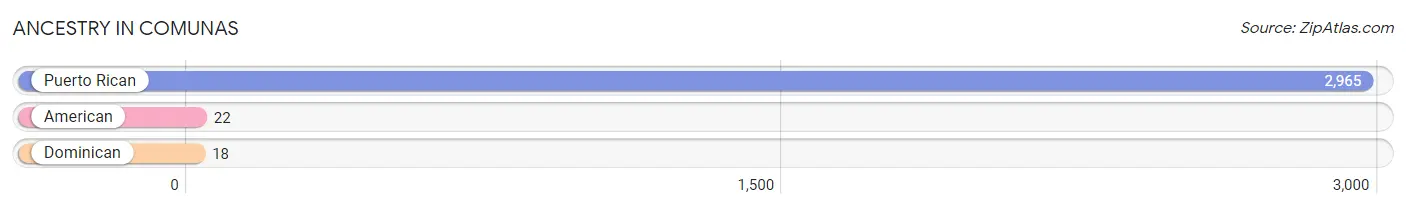
Ancestry in Comunas
The most populous ancestries reported in Comunas are Puerto Rican (2,965 | 98.7%), American (22 | 0.7%), and Dominican (18 | 0.6%), together accounting for 100.0% of all Comunas residents.
| Ancestry | # Population | % Population |
| American | 22 | 0.7% |
| Dominican | 18 | 0.6% |
| Puerto Rican | 2,965 | 98.7% | View All 3 Rows |
Immigrants in Comunas

| Immigration Origin | # Population | % Population | View All 0 Rows |
Sex and Age in Comunas
Sex and Age in Comunas
The most populous age groups in Comunas are 20 to 24 Years (258 | 17.1%) for men and 45 to 49 Years (197 | 13.2%) for women.
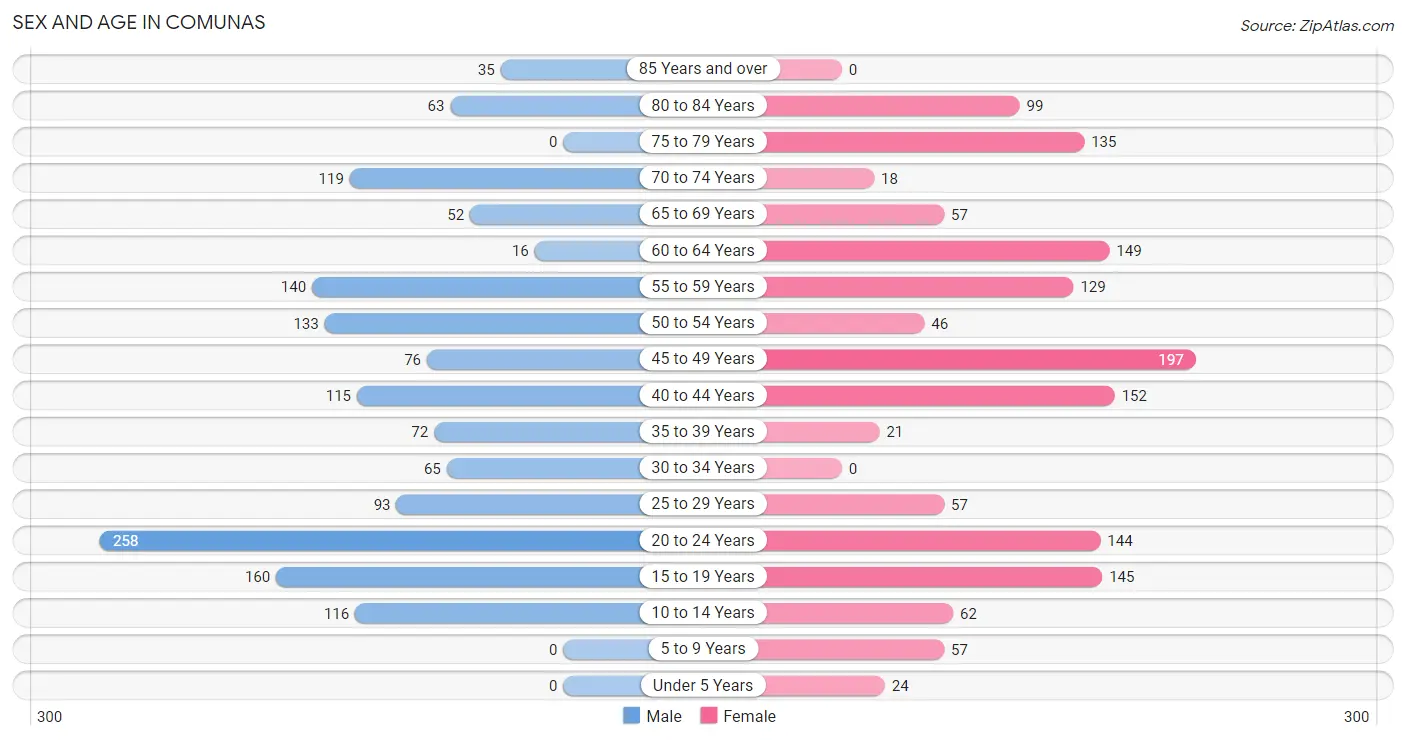
| Age Bracket | Male | Female |
| Under 5 Years | 0 (0.0%) | 24 (1.6%) |
| 5 to 9 Years | 0 (0.0%) | 57 (3.8%) |
| 10 to 14 Years | 116 (7.7%) | 62 (4.2%) |
| 15 to 19 Years | 160 (10.6%) | 145 (9.7%) |
| 20 to 24 Years | 258 (17.1%) | 144 (9.7%) |
| 25 to 29 Years | 93 (6.1%) | 57 (3.8%) |
| 30 to 34 Years | 65 (4.3%) | 0 (0.0%) |
| 35 to 39 Years | 72 (4.8%) | 21 (1.4%) |
| 40 to 44 Years | 115 (7.6%) | 152 (10.2%) |
| 45 to 49 Years | 76 (5.0%) | 197 (13.2%) |
| 50 to 54 Years | 133 (8.8%) | 46 (3.1%) |
| 55 to 59 Years | 140 (9.2%) | 129 (8.6%) |
| 60 to 64 Years | 16 (1.1%) | 149 (10.0%) |
| 65 to 69 Years | 52 (3.4%) | 57 (3.8%) |
| 70 to 74 Years | 119 (7.9%) | 18 (1.2%) |
| 75 to 79 Years | 0 (0.0%) | 135 (9.0%) |
| 80 to 84 Years | 63 (4.2%) | 99 (6.6%) |
| 85 Years and over | 35 (2.3%) | 0 (0.0%) |
| Total | 1,513 (100.0%) | 1,492 (100.0%) |
Families and Households in Comunas
Median Family Size in Comunas
The median family size in Comunas is 3.19 persons per family, with married-couple families (394 | 49.0%) accounting for the largest median family size of 3.31 persons per family. On the other hand, single female/mother families (373 | 46.4%) represent the smallest median family size with 3.06 persons per family.
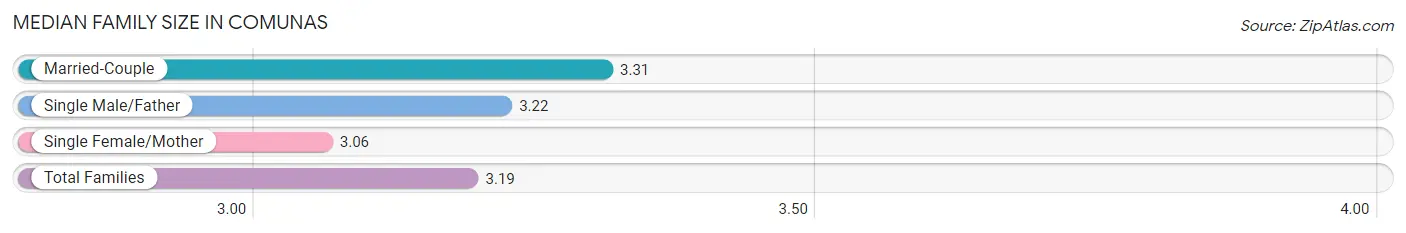
| Family Type | # Families | Family Size |
| Married-Couple | 394 (49.0%) | 3.31 |
| Single Male/Father | 37 (4.6%) | 3.22 |
| Single Female/Mother | 373 (46.4%) | 3.06 |
| Total Families | 804 (100.0%) | 3.19 |
Median Household Size in Comunas
The median household size in Comunas is 2.88 persons per household, with single male/father households (37 | 3.5%) accounting for the largest median household size of 4.14 persons per household. non-family households (238 | 22.8%) represent the smallest median household size with 1.17 persons per household.
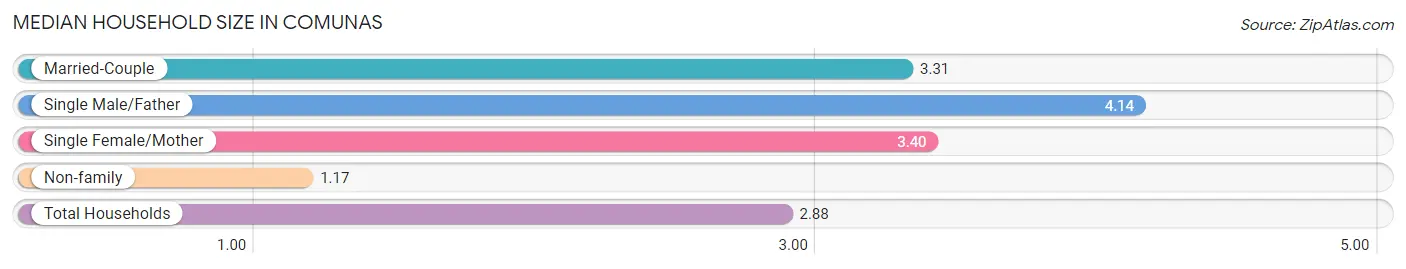
| Household Type | # Households | Household Size |
| Married-Couple | 394 (37.8%) | 3.31 |
| Single Male/Father | 37 (3.5%) | 4.14 |
| Single Female/Mother | 373 (35.8%) | 3.40 |
| Non-family | 238 (22.8%) | 1.17 |
| Total Households | 1,042 (100.0%) | 2.88 |
Household Size by Marriage Status in Comunas
Out of a total of 1,042 households in Comunas, 804 (77.2%) are family households, while 238 (22.8%) are nonfamily households. The most numerous type of family households are 3-person households, comprising 310, and the most common type of nonfamily households are 1-person households, comprising 213.
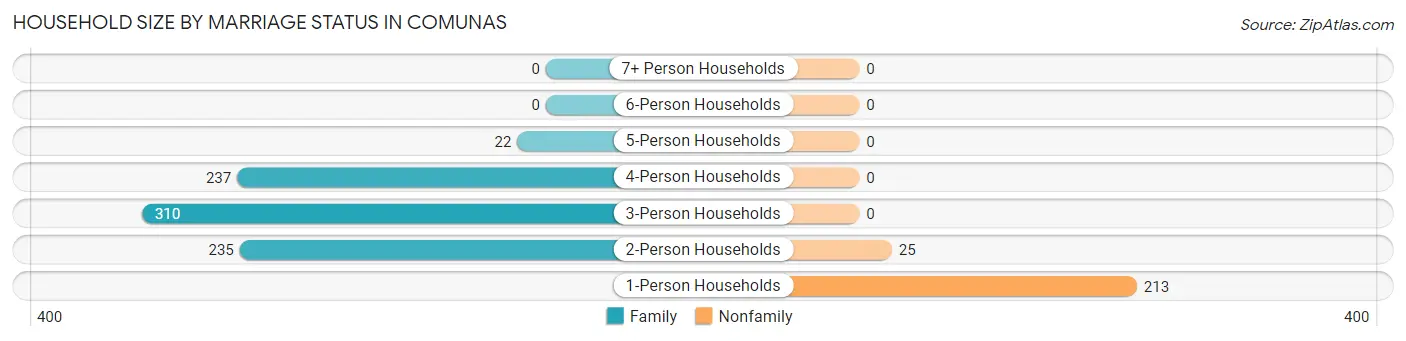
| Household Size | Family Households | Nonfamily Households |
| 1-Person Households | - | 213 (20.4%) |
| 2-Person Households | 235 (22.6%) | 25 (2.4%) |
| 3-Person Households | 310 (29.7%) | 0 (0.0%) |
| 4-Person Households | 237 (22.7%) | 0 (0.0%) |
| 5-Person Households | 22 (2.1%) | 0 (0.0%) |
| 6-Person Households | 0 (0.0%) | 0 (0.0%) |
| 7+ Person Households | 0 (0.0%) | 0 (0.0%) |
| Total | 804 (77.2%) | 238 (22.8%) |
Female Fertility in Comunas
Fertility by Age in Comunas
| Age Bracket | Women with Births | Births / 1,000 Women |
| 15 to 19 years | 0 (0.0%) | 0.0 |
| 20 to 34 years | 0 (0.0%) | 0.0 |
| 35 to 50 years | 0 (0.0%) | 0.0 |
| Total | 0 (0.0%) | 0.0 |
Fertility by Age by Marriage Status in Comunas
| Age Bracket | Married | Unmarried |
| 15 to 19 years | 0 (0.0%) | 0 (0.0%) |
| 20 to 34 years | 0 (0.0%) | 0 (0.0%) |
| 35 to 50 years | 0 (0.0%) | 0 (0.0%) |
| Total | 0 (0.0%) | 0 (0.0%) |
Fertility by Education in Comunas
| Educational Attainment | Women with Births | Births / 1,000 Women |
| Less than High School | 0 (0.0%) | 0.0 |
| High School Diploma | 0 (0.0%) | 0.0 |
| College or Associate's Degree | 0 (0.0%) | 0.0 |
| Bachelor's Degree | 0 (0.0%) | 0.0 |
| Graduate Degree | 0 (0.0%) | 0.0 |
| Total | 0 (0.0%) | 0.0 |
Fertility by Education by Marriage Status in Comunas
| Educational Attainment | Married | Unmarried |
| Less than High School | 0 (0.0%) | 0 (0.0%) |
| High School Diploma | 0 (0.0%) | 0 (0.0%) |
| College or Associate's Degree | 0 (0.0%) | 0 (0.0%) |
| Bachelor's Degree | 0 (0.0%) | 0 (0.0%) |
| Graduate Degree | 0 (0.0%) | 0 (0.0%) |
| Total | 0 (0.0%) | 0 (0.0%) |
Employment Characteristics in Comunas
Employment by Class of Employer in Comunas
Among the 904 employed individuals in Comunas, private company employees (655 | 72.5%), state government employees (95 | 10.5%), and self-employed (not incorporated) (93 | 10.3%) make up the most common classes of employment.
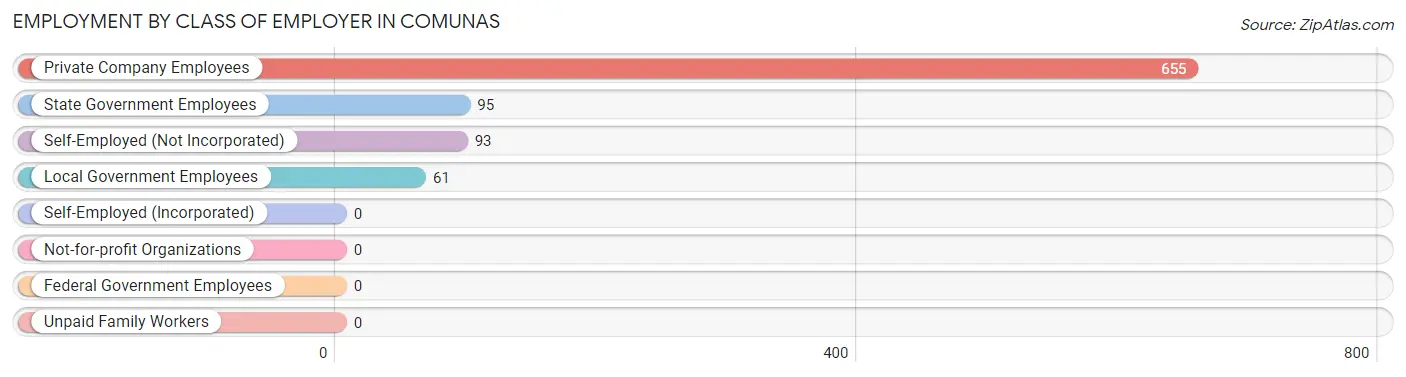
| Employer Class | # Employees | % Employees |
| Private Company Employees | 655 | 72.5% |
| Self-Employed (Incorporated) | 0 | 0.0% |
| Self-Employed (Not Incorporated) | 93 | 10.3% |
| Not-for-profit Organizations | 0 | 0.0% |
| Local Government Employees | 61 | 6.8% |
| State Government Employees | 95 | 10.5% |
| Federal Government Employees | 0 | 0.0% |
| Unpaid Family Workers | 0 | 0.0% |
| Total | 904 | 100.0% |
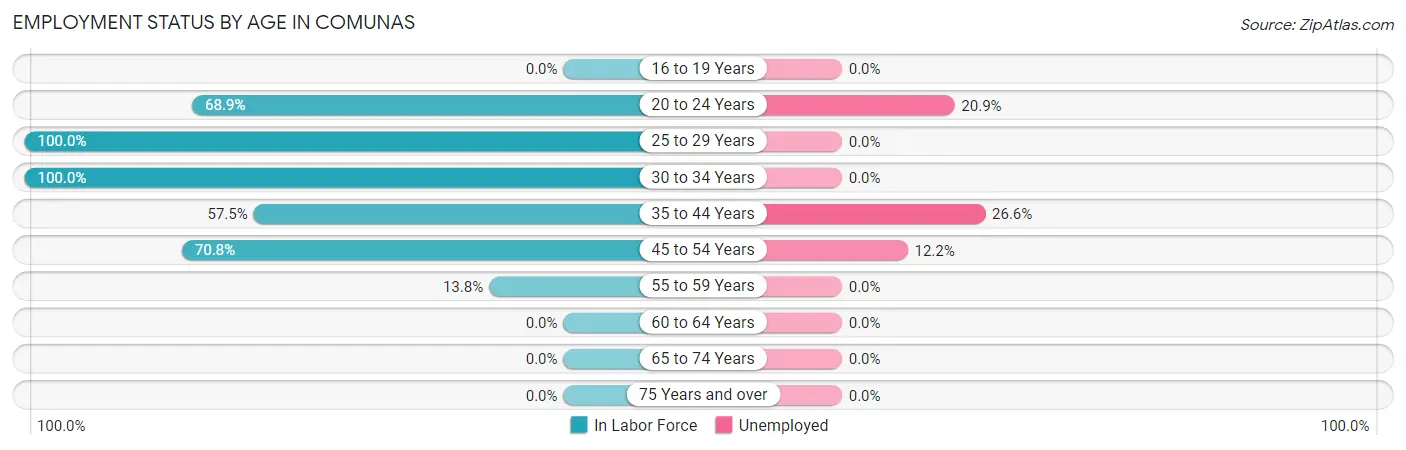
Employment Status by Age in Comunas
According to the labor force statistics for Comunas, out of the total population over 16 years of age (2,746), 38.5% or 1,057 individuals are in the labor force, with 14.4% or 152 of them unemployed. The age group with the highest labor force participation rate is 25 to 29 years, with 100.0% or 150 individuals in the labor force. Within the labor force, the 35 to 44 years age range has the highest percentage of unemployed individuals, with 26.6% or 55 of them being unemployed.
| Age Bracket | In Labor Force | Unemployed |
| 16 to 19 Years | 0 (0.0%) | 0 (0.0%) |
| 20 to 24 Years | 277 (68.9%) | 58 (20.9%) |
| 25 to 29 Years | 150 (100.0%) | 0 (0.0%) |
| 30 to 34 Years | 65 (100.0%) | 0 (0.0%) |
| 35 to 44 Years | 207 (57.5%) | 55 (26.6%) |
| 45 to 54 Years | 320 (70.8%) | 39 (12.2%) |
| 55 to 59 Years | 37 (13.8%) | 0 (0.0%) |
| 60 to 64 Years | 0 (0.0%) | 0 (0.0%) |
| 65 to 74 Years | 0 (0.0%) | 0 (0.0%) |
| 75 Years and over | 0 (0.0%) | 0 (0.0%) |
| Total | 1,057 (38.5%) | 152 (14.4%) |
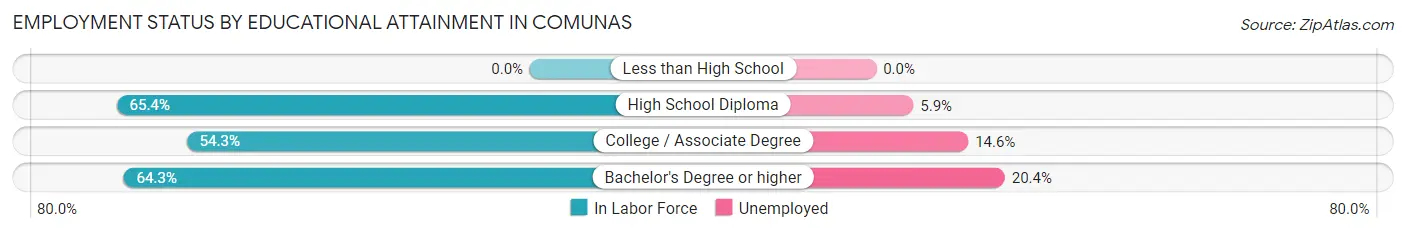
Employment Status by Educational Attainment in Comunas
According to labor force statistics for Comunas, 53.3% of individuals (779) out of the total population between 25 and 64 years of age (1,461) are in the labor force, with 12.1% or 94 of them being unemployed. The group with the highest labor force participation rate are those with the educational attainment of high school diploma, with 65.4% or 355 individuals in the labor force. Within the labor force, individuals with bachelor's degree or higher education have the highest percentage of unemployment, with 20.4% or 39 of them being unemployed.
| Educational Attainment | In Labor Force | Unemployed |
| Less than High School | 0 (0.0%) | 0 (0.0%) |
| High School Diploma | 355 (65.4%) | 32 (5.9%) |
| College / Associate Degree | 233 (54.3%) | 63 (14.6%) |
| Bachelor's Degree or higher | 191 (64.3%) | 61 (20.4%) |
| Total | 779 (53.3%) | 177 (12.1%) |
Employment Occupations by Sex in Comunas
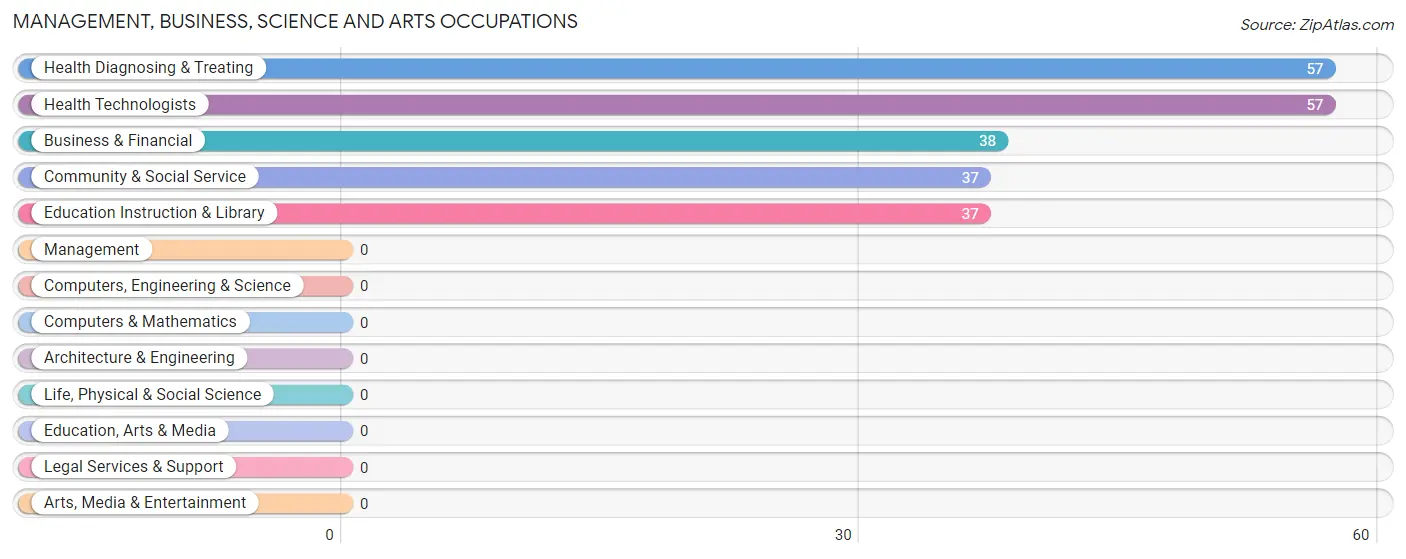
Management, Business, Science and Arts Occupations
The most common Management, Business, Science and Arts occupations in Comunas are Health Diagnosing & Treating (57 | 6.3%), Health Technologists (57 | 6.3%), Business & Financial (38 | 4.2%), Community & Social Service (37 | 4.1%), and Education Instruction & Library (37 | 4.1%).
Management, Business, Science and Arts Occupations by Sex
Within the Management, Business, Science and Arts occupations in Comunas, the most male-oriented occupations are Community & Social Service (100.0%), and Education Instruction & Library (100.0%), while the most female-oriented occupations are Business & Financial (100.0%), Health Diagnosing & Treating (100.0%), and Health Technologists (100.0%).
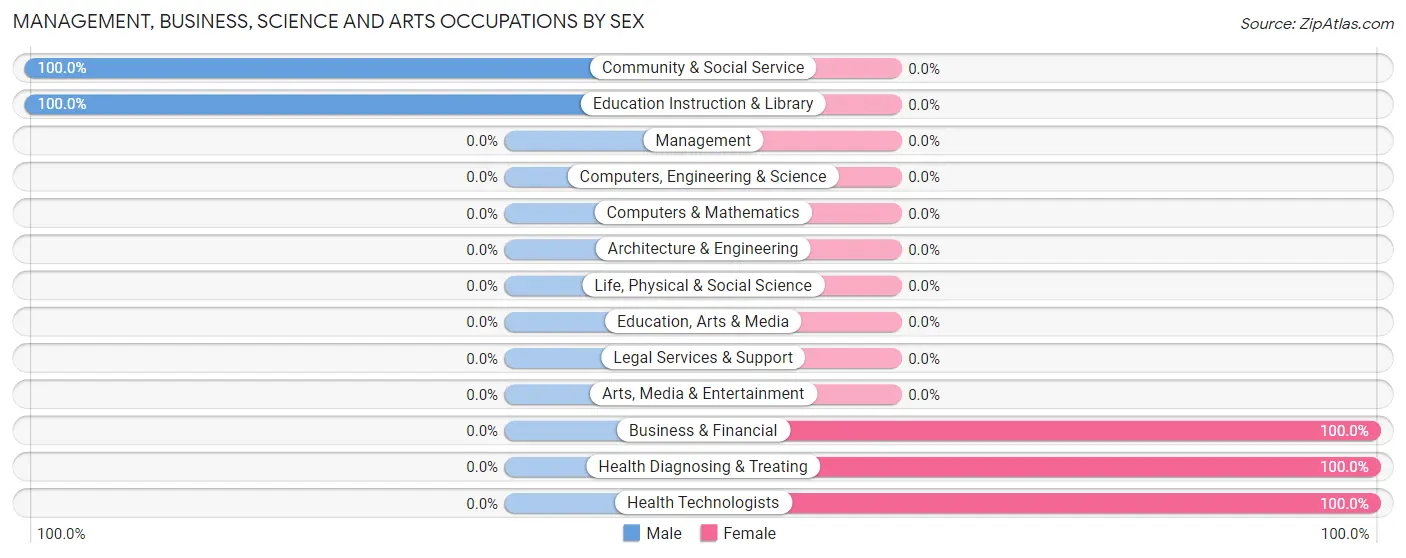
| Occupation | Male | Female |
| Management | 0 (0.0%) | 0 (0.0%) |
| Business & Financial | 0 (0.0%) | 38 (100.0%) |
| Computers, Engineering & Science | 0 (0.0%) | 0 (0.0%) |
| Computers & Mathematics | 0 (0.0%) | 0 (0.0%) |
| Architecture & Engineering | 0 (0.0%) | 0 (0.0%) |
| Life, Physical & Social Science | 0 (0.0%) | 0 (0.0%) |
| Community & Social Service | 37 (100.0%) | 0 (0.0%) |
| Education, Arts & Media | 0 (0.0%) | 0 (0.0%) |
| Legal Services & Support | 0 (0.0%) | 0 (0.0%) |
| Education Instruction & Library | 37 (100.0%) | 0 (0.0%) |
| Arts, Media & Entertainment | 0 (0.0%) | 0 (0.0%) |
| Health Diagnosing & Treating | 0 (0.0%) | 57 (100.0%) |
| Health Technologists | 0 (0.0%) | 57 (100.0%) |
| Total (Category) | 37 (28.0%) | 95 (72.0%) |
| Total (Overall) | 481 (53.2%) | 423 (46.8%) |
Services Occupations
The most common Services occupations in Comunas are Food Preparation & Serving (116 | 12.8%), Personal Care & Service (56 | 6.2%), and Healthcare Support (37 | 4.1%).
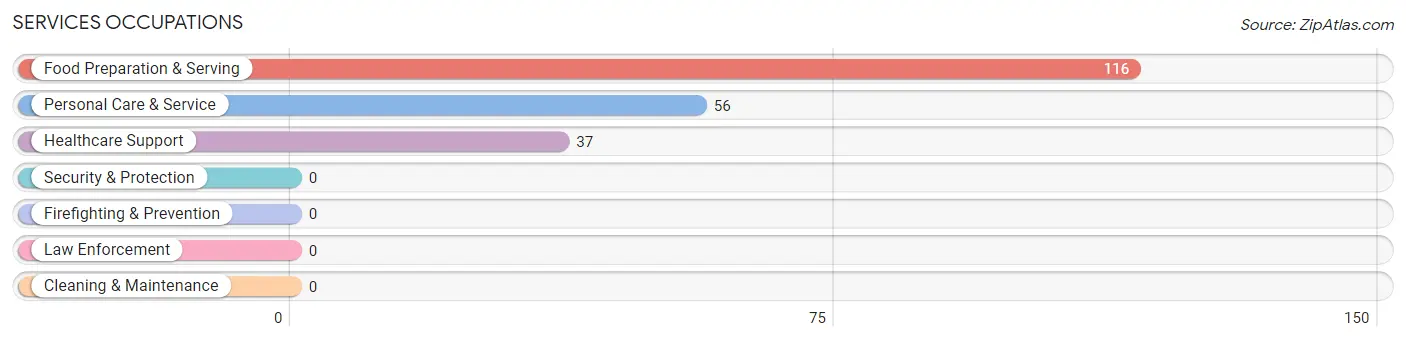
Services Occupations by Sex
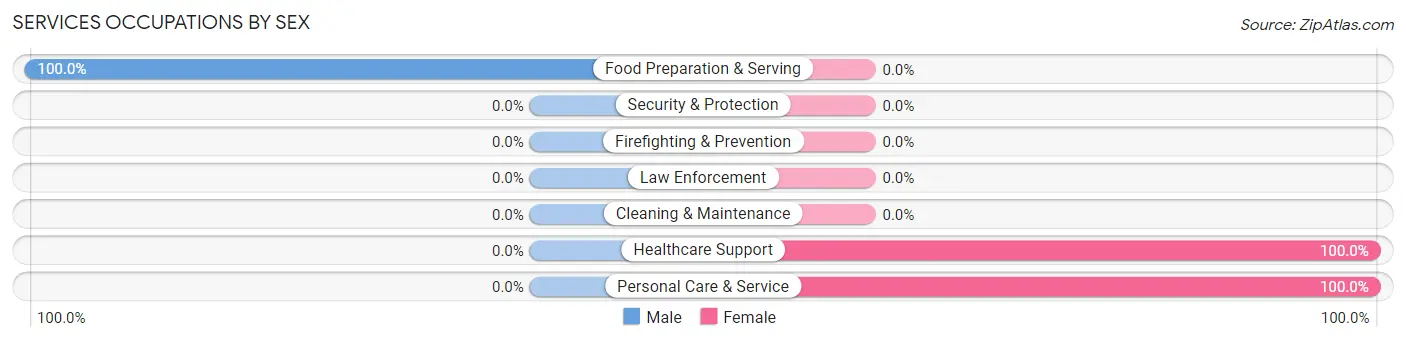
| Occupation | Male | Female |
| Healthcare Support | 0 (0.0%) | 37 (100.0%) |
| Security & Protection | 0 (0.0%) | 0 (0.0%) |
| Firefighting & Prevention | 0 (0.0%) | 0 (0.0%) |
| Law Enforcement | 0 (0.0%) | 0 (0.0%) |
| Food Preparation & Serving | 116 (100.0%) | 0 (0.0%) |
| Cleaning & Maintenance | 0 (0.0%) | 0 (0.0%) |
| Personal Care & Service | 0 (0.0%) | 56 (100.0%) |
| Total (Category) | 116 (55.5%) | 93 (44.5%) |
| Total (Overall) | 481 (53.2%) | 423 (46.8%) |
Sales and Office Occupations
The most common Sales and Office occupations in Comunas are Office & Administration (126 | 13.9%), and Sales & Related (94 | 10.4%).
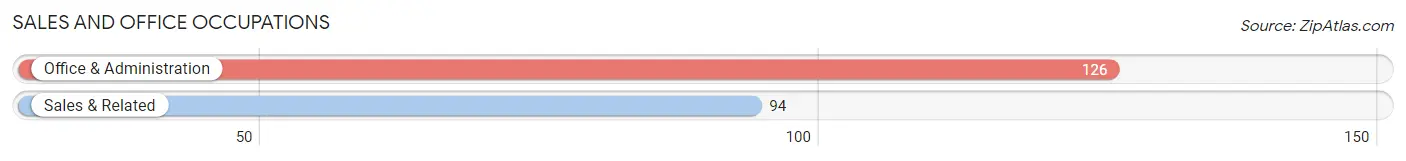
Sales and Office Occupations by Sex

| Occupation | Male | Female |
| Sales & Related | 42 (44.7%) | 52 (55.3%) |
| Office & Administration | 22 (17.5%) | 104 (82.5%) |
| Total (Category) | 64 (29.1%) | 156 (70.9%) |
| Total (Overall) | 481 (53.2%) | 423 (46.8%) |
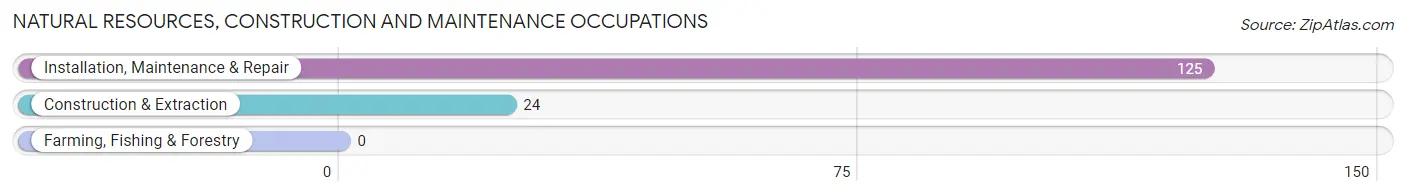
Natural Resources, Construction and Maintenance Occupations
The most common Natural Resources, Construction and Maintenance occupations in Comunas are Installation, Maintenance & Repair (125 | 13.8%), and Construction & Extraction (24 | 2.6%).
Natural Resources, Construction and Maintenance Occupations by Sex

| Occupation | Male | Female |
| Farming, Fishing & Forestry | 0 (0.0%) | 0 (0.0%) |
| Construction & Extraction | 24 (100.0%) | 0 (0.0%) |
| Installation, Maintenance & Repair | 125 (100.0%) | 0 (0.0%) |
| Total (Category) | 149 (100.0%) | 0 (0.0%) |
| Total (Overall) | 481 (53.2%) | 423 (46.8%) |
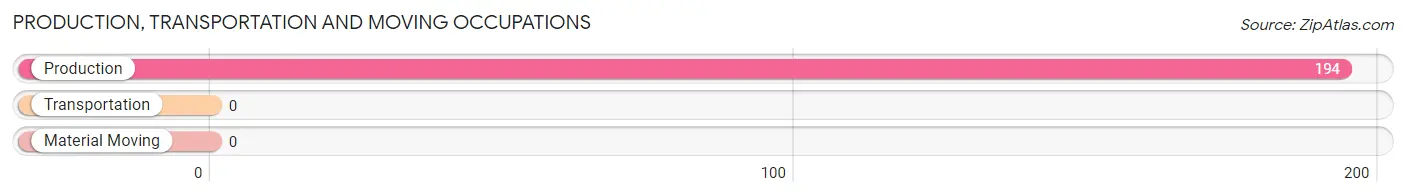
Production, Transportation and Moving Occupations
The most common Production, Transportation and Moving occupations in Comunas are , and Production (194 | 21.5%).
Production, Transportation and Moving Occupations by Sex
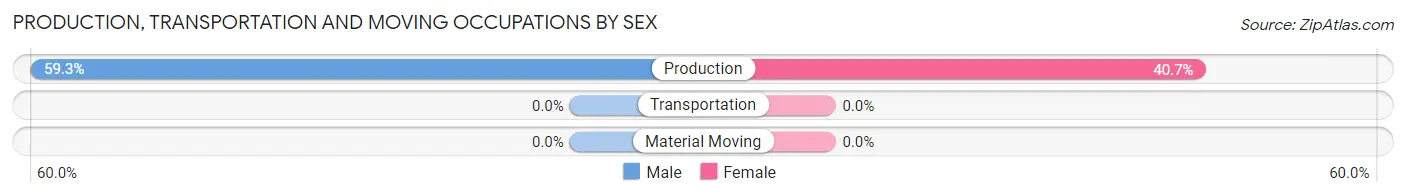
| Occupation | Male | Female |
| Production | 115 (59.3%) | 79 (40.7%) |
| Transportation | 0 (0.0%) | 0 (0.0%) |
| Material Moving | 0 (0.0%) | 0 (0.0%) |
| Total (Category) | 115 (59.3%) | 79 (40.7%) |
| Total (Overall) | 481 (53.2%) | 423 (46.8%) |
Employment Industries by Sex in Comunas
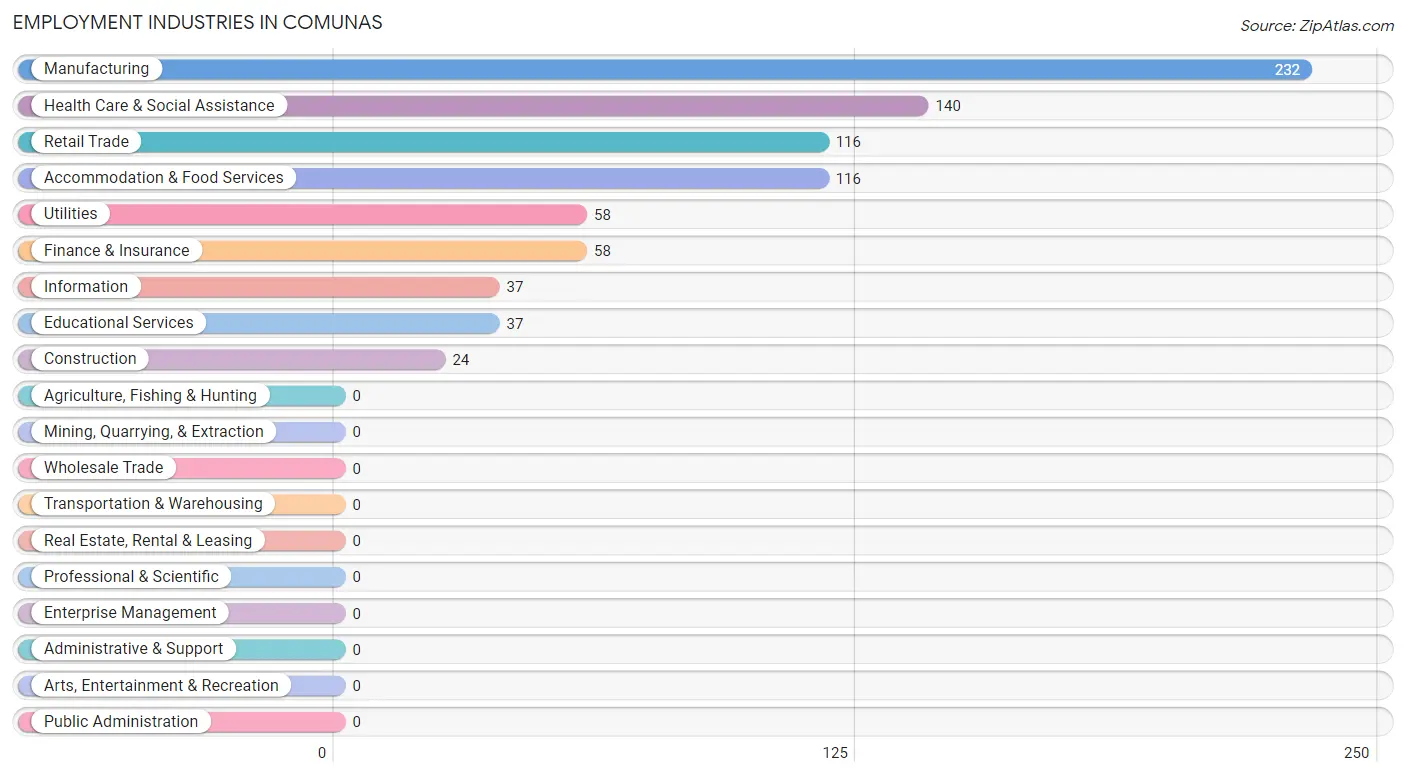
Employment Industries in Comunas
The major employment industries in Comunas include Manufacturing (232 | 25.7%), Health Care & Social Assistance (140 | 15.5%), Retail Trade (116 | 12.8%), Accommodation & Food Services (116 | 12.8%), and Utilities (58 | 6.4%).
Employment Industries by Sex in Comunas
The Comunas industries that see more men than women are Construction (100.0%), Utilities (100.0%), and Information (100.0%), whereas the industries that tend to have a higher number of women are Finance & Insurance (100.0%), Health Care & Social Assistance (100.0%), and Manufacturing (50.4%).
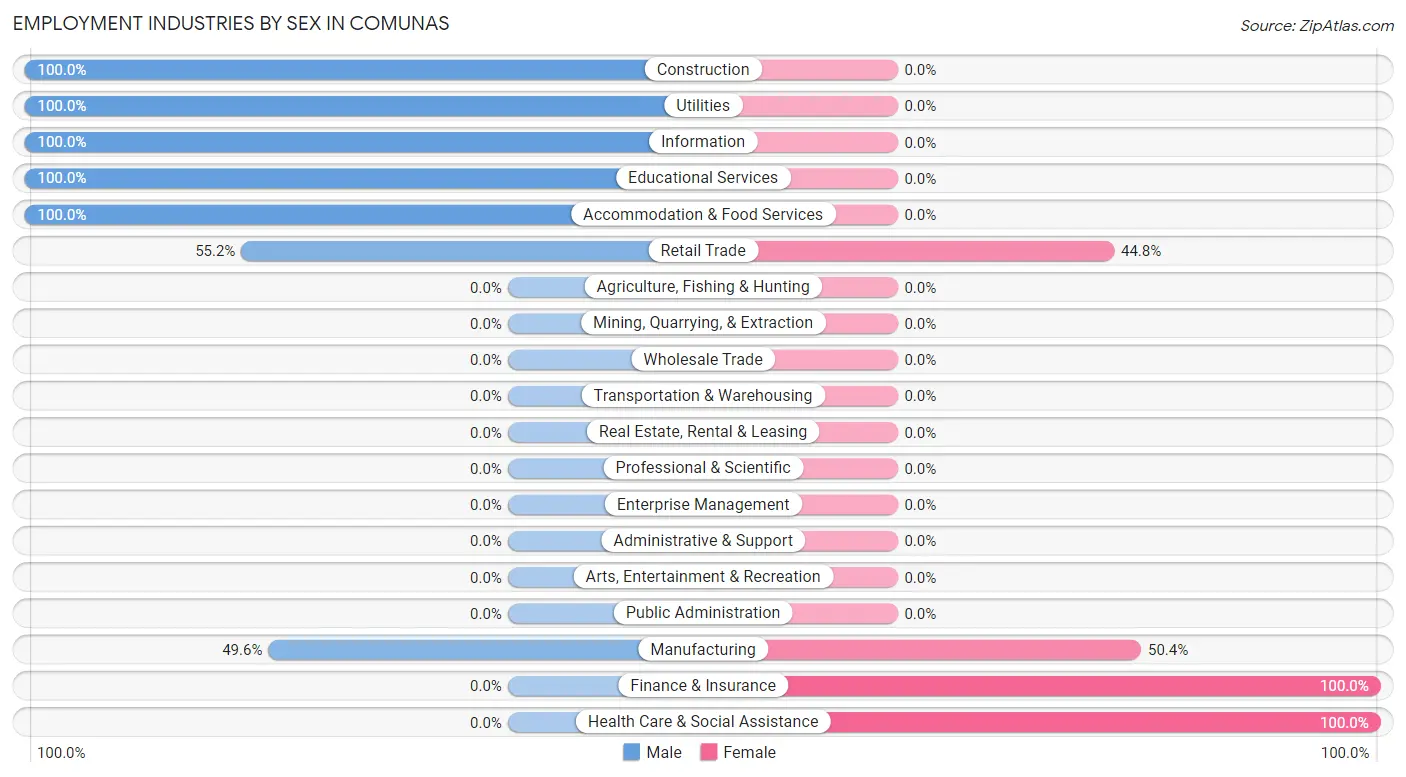
| Industry | Male | Female |
| Agriculture, Fishing & Hunting | 0 (0.0%) | 0 (0.0%) |
| Mining, Quarrying, & Extraction | 0 (0.0%) | 0 (0.0%) |
| Construction | 24 (100.0%) | 0 (0.0%) |
| Manufacturing | 115 (49.6%) | 117 (50.4%) |
| Wholesale Trade | 0 (0.0%) | 0 (0.0%) |
| Retail Trade | 64 (55.2%) | 52 (44.8%) |
| Transportation & Warehousing | 0 (0.0%) | 0 (0.0%) |
| Utilities | 58 (100.0%) | 0 (0.0%) |
| Information | 37 (100.0%) | 0 (0.0%) |
| Finance & Insurance | 0 (0.0%) | 58 (100.0%) |
| Real Estate, Rental & Leasing | 0 (0.0%) | 0 (0.0%) |
| Professional & Scientific | 0 (0.0%) | 0 (0.0%) |
| Enterprise Management | 0 (0.0%) | 0 (0.0%) |
| Administrative & Support | 0 (0.0%) | 0 (0.0%) |
| Educational Services | 37 (100.0%) | 0 (0.0%) |
| Health Care & Social Assistance | 0 (0.0%) | 140 (100.0%) |
| Arts, Entertainment & Recreation | 0 (0.0%) | 0 (0.0%) |
| Accommodation & Food Services | 116 (100.0%) | 0 (0.0%) |
| Public Administration | 0 (0.0%) | 0 (0.0%) |
| Total | 481 (53.2%) | 423 (46.8%) |
Education in Comunas
School Enrollment in Comunas
The most common levels of schooling among the 717 students in Comunas are college / undergraduate (274 | 38.2%), high school (185 | 25.8%), and middle school (178 | 24.8%).
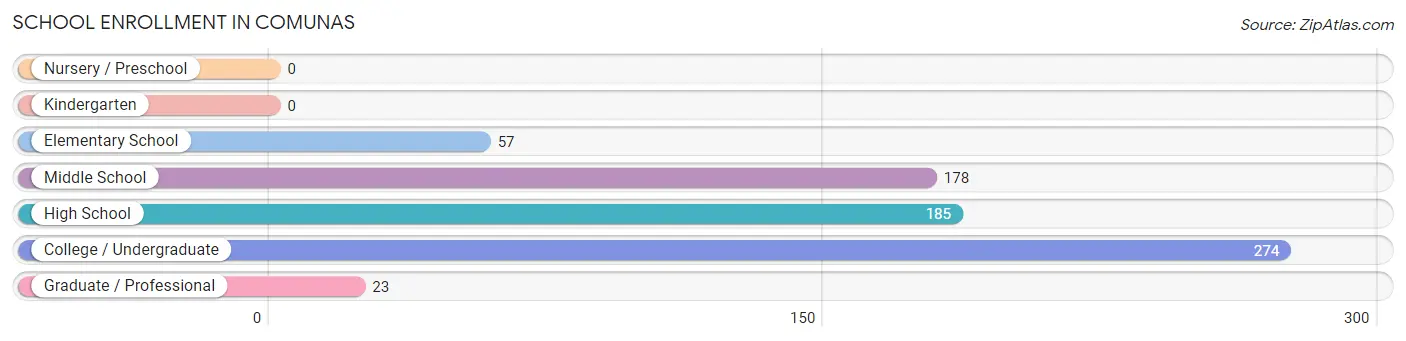
| School Level | # Students | % Students |
| Nursery / Preschool | 0 | 0.0% |
| Kindergarten | 0 | 0.0% |
| Elementary School | 57 | 8.0% |
| Middle School | 178 | 24.8% |
| High School | 185 | 25.8% |
| College / Undergraduate | 274 | 38.2% |
| Graduate / Professional | 23 | 3.2% |
| Total | 717 | 100.0% |
School Enrollment by Age by Funding Source in Comunas
Out of a total of 717 students who are enrolled in schools in Comunas, 364 (50.8%) attend a private institution, while the remaining 353 (49.2%) are enrolled in public schools. The age group of 25 to 34 year olds has the highest likelihood of being enrolled in private schools, with 57 (100.0% in the age bracket) enrolled. Conversely, the age group of 5 to 9 year old has the lowest likelihood of being enrolled in a private school, with 57 (100.0% in the age bracket) attending a public institution.
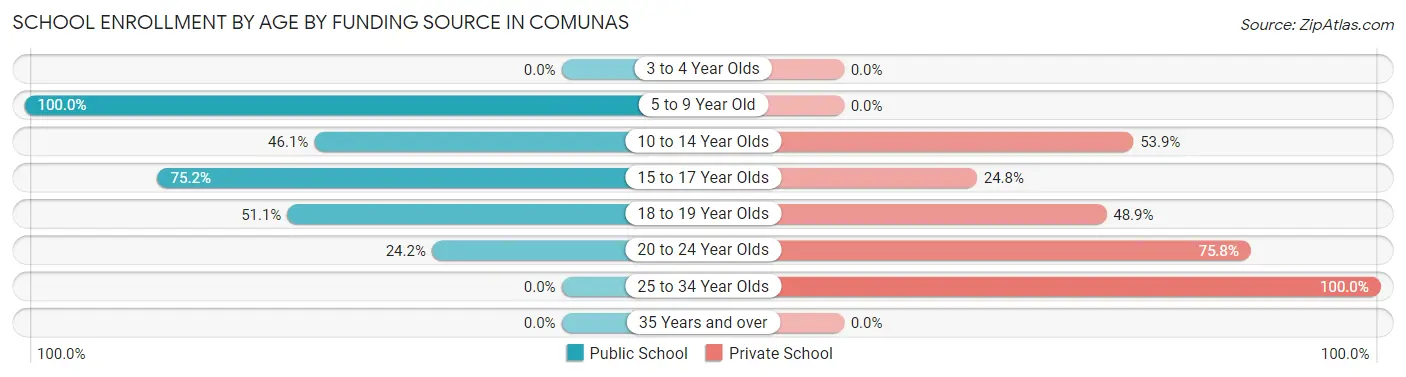
| Age Bracket | Public School | Private School |
| 3 to 4 Year Olds | 0 (0.0%) | 0 (0.0%) |
| 5 to 9 Year Old | 57 (100.0%) | 0 (0.0%) |
| 10 to 14 Year Olds | 82 (46.1%) | 96 (53.9%) |
| 15 to 17 Year Olds | 91 (75.2%) | 30 (24.8%) |
| 18 to 19 Year Olds | 94 (51.1%) | 90 (48.9%) |
| 20 to 24 Year Olds | 29 (24.2%) | 91 (75.8%) |
| 25 to 34 Year Olds | 0 (0.0%) | 57 (100.0%) |
| 35 Years and over | 0 (0.0%) | 0 (0.0%) |
| Total | 353 (49.2%) | 364 (50.8%) |
Educational Attainment by Field of Study in Comunas
Education (185 | 53.8%), science & technology (121 | 35.2%), and business (38 | 11.1%) are the most common fields of study among 344 individuals in Comunas who have obtained a bachelor's degree or higher.
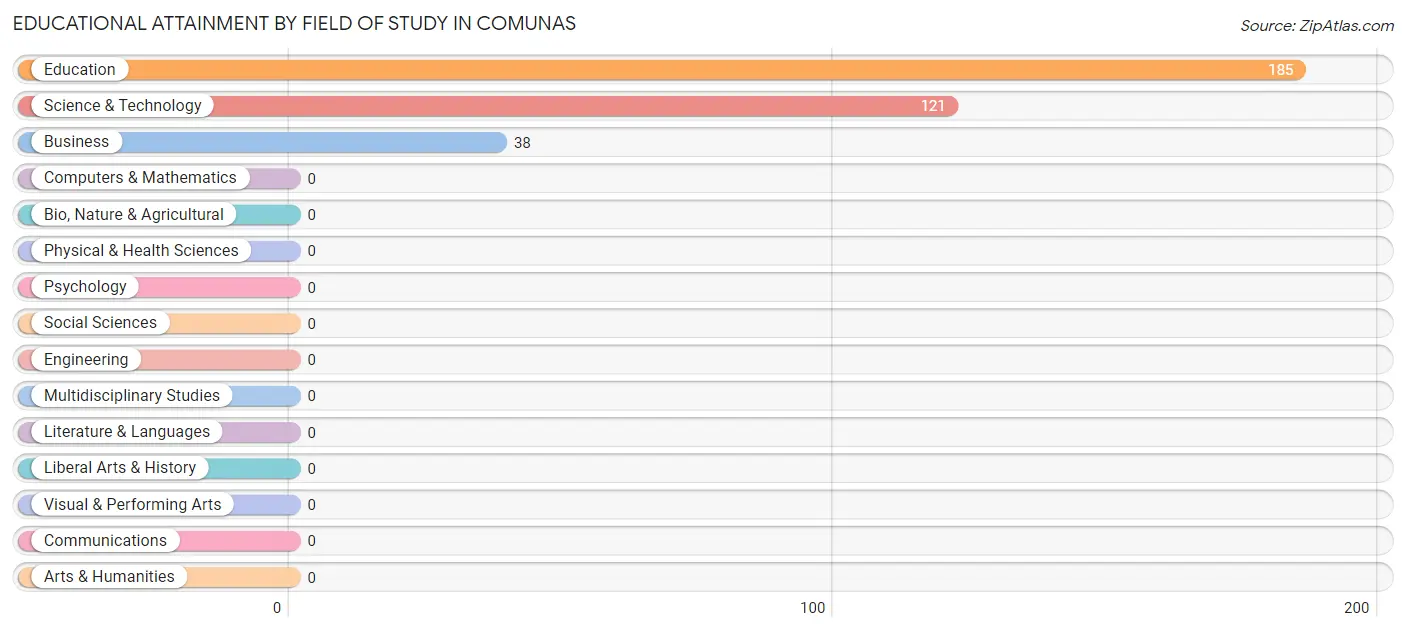
| Field of Study | # Graduates | % Graduates |
| Computers & Mathematics | 0 | 0.0% |
| Bio, Nature & Agricultural | 0 | 0.0% |
| Physical & Health Sciences | 0 | 0.0% |
| Psychology | 0 | 0.0% |
| Social Sciences | 0 | 0.0% |
| Engineering | 0 | 0.0% |
| Multidisciplinary Studies | 0 | 0.0% |
| Science & Technology | 121 | 35.2% |
| Business | 38 | 11.1% |
| Education | 185 | 53.8% |
| Literature & Languages | 0 | 0.0% |
| Liberal Arts & History | 0 | 0.0% |
| Visual & Performing Arts | 0 | 0.0% |
| Communications | 0 | 0.0% |
| Arts & Humanities | 0 | 0.0% |
| Total | 344 | 100.0% |
Transportation & Commute in Comunas
Vehicle Availability by Sex in Comunas
The most prevalent vehicle ownership categories in Comunas are males with 3 vehicles (207, accounting for 43.0%) and females with 3 vehicles (178, making up 48.9%).
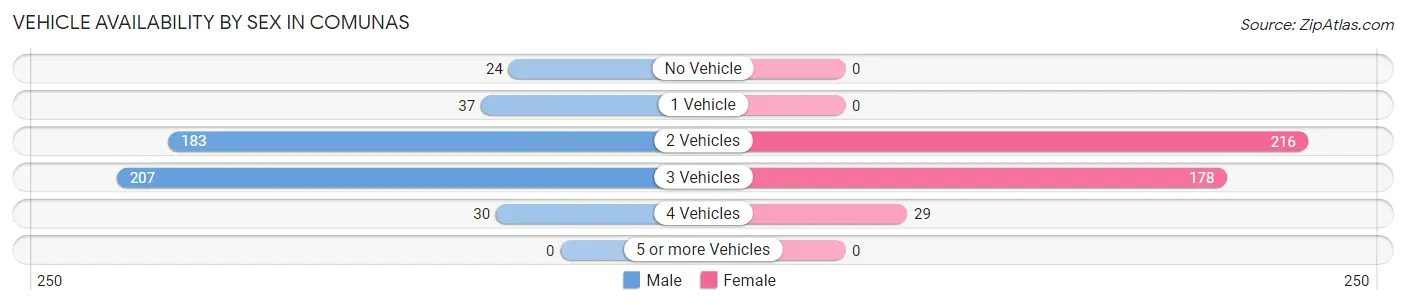
| Vehicles Available | Male | Female |
| No Vehicle | 24 (5.0%) | 0 (0.0%) |
| 1 Vehicle | 37 (7.7%) | 0 (0.0%) |
| 2 Vehicles | 183 (38.1%) | 216 (51.1%) |
| 3 Vehicles | 207 (43.0%) | 178 (42.1%) |
| 4 Vehicles | 30 (6.2%) | 29 (6.9%) |
| 5 or more Vehicles | 0 (0.0%) | 0 (0.0%) |
| Total | 481 (100.0%) | 423 (100.0%) |
Commute Time in Comunas
The most frequently occuring commute durations in Comunas are 10 to 14 minutes (197 commuters, 21.8%), 20 to 24 minutes (163 commuters, 18.0%), and 15 to 19 minutes (150 commuters, 16.6%).
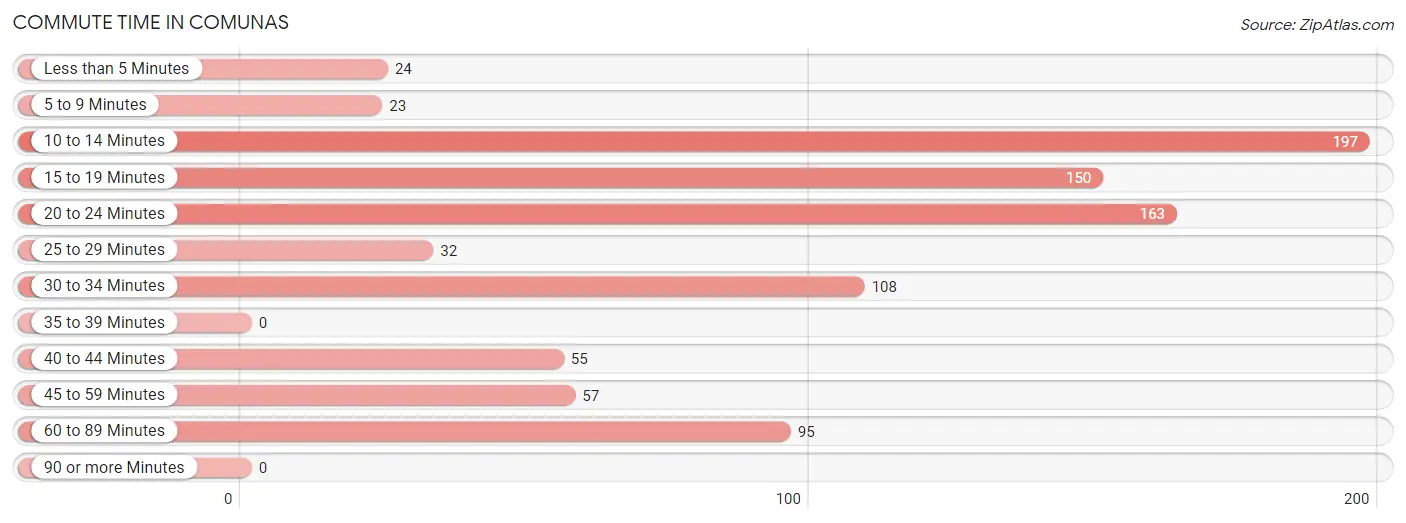
| Commute Time | # Commuters | % Commuters |
| Less than 5 Minutes | 24 | 2.6% |
| 5 to 9 Minutes | 23 | 2.5% |
| 10 to 14 Minutes | 197 | 21.8% |
| 15 to 19 Minutes | 150 | 16.6% |
| 20 to 24 Minutes | 163 | 18.0% |
| 25 to 29 Minutes | 32 | 3.5% |
| 30 to 34 Minutes | 108 | 11.9% |
| 35 to 39 Minutes | 0 | 0.0% |
| 40 to 44 Minutes | 55 | 6.1% |
| 45 to 59 Minutes | 57 | 6.3% |
| 60 to 89 Minutes | 95 | 10.5% |
| 90 or more Minutes | 0 | 0.0% |
Commute Time by Sex in Comunas
The most common commute times in Comunas are 60 to 89 minutes (95 commuters, 19.8%) for males and 20 to 24 minutes (113 commuters, 26.7%) for females.
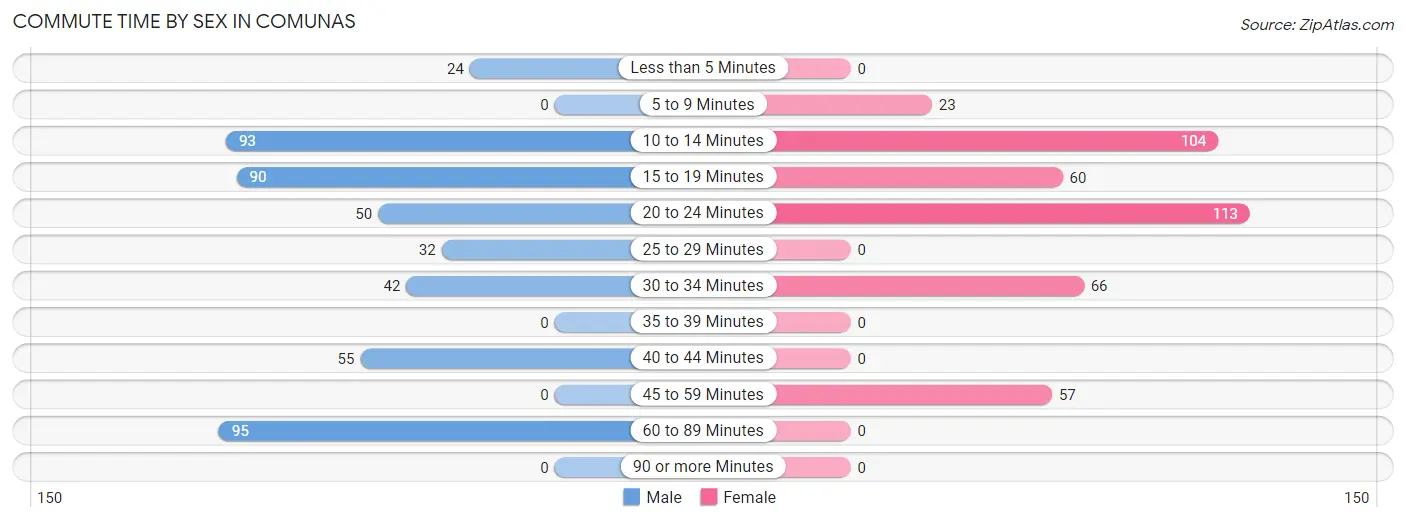
| Commute Time | Male | Female |
| Less than 5 Minutes | 24 (5.0%) | 0 (0.0%) |
| 5 to 9 Minutes | 0 (0.0%) | 23 (5.4%) |
| 10 to 14 Minutes | 93 (19.3%) | 104 (24.6%) |
| 15 to 19 Minutes | 90 (18.7%) | 60 (14.2%) |
| 20 to 24 Minutes | 50 (10.4%) | 113 (26.7%) |
| 25 to 29 Minutes | 32 (6.7%) | 0 (0.0%) |
| 30 to 34 Minutes | 42 (8.7%) | 66 (15.6%) |
| 35 to 39 Minutes | 0 (0.0%) | 0 (0.0%) |
| 40 to 44 Minutes | 55 (11.4%) | 0 (0.0%) |
| 45 to 59 Minutes | 0 (0.0%) | 57 (13.5%) |
| 60 to 89 Minutes | 95 (19.8%) | 0 (0.0%) |
| 90 or more Minutes | 0 (0.0%) | 0 (0.0%) |
Time of Departure to Work by Sex in Comunas
The most frequent times of departure to work in Comunas are 5:30 AM to 5:59 AM (93, 19.3%) for males and 7:00 AM to 7:29 AM (114, 27.0%) for females.
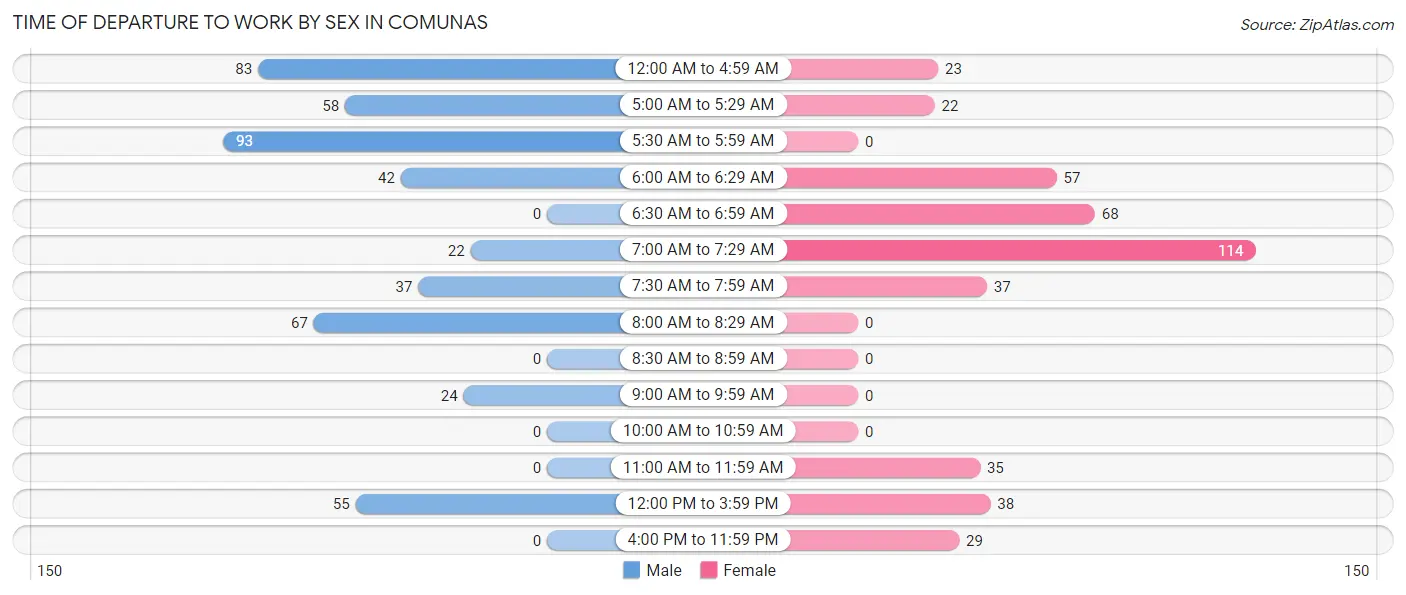
| Time of Departure | Male | Female |
| 12:00 AM to 4:59 AM | 83 (17.3%) | 23 (5.4%) |
| 5:00 AM to 5:29 AM | 58 (12.1%) | 22 (5.2%) |
| 5:30 AM to 5:59 AM | 93 (19.3%) | 0 (0.0%) |
| 6:00 AM to 6:29 AM | 42 (8.7%) | 57 (13.5%) |
| 6:30 AM to 6:59 AM | 0 (0.0%) | 68 (16.1%) |
| 7:00 AM to 7:29 AM | 22 (4.6%) | 114 (27.0%) |
| 7:30 AM to 7:59 AM | 37 (7.7%) | 37 (8.7%) |
| 8:00 AM to 8:29 AM | 67 (13.9%) | 0 (0.0%) |
| 8:30 AM to 8:59 AM | 0 (0.0%) | 0 (0.0%) |
| 9:00 AM to 9:59 AM | 24 (5.0%) | 0 (0.0%) |
| 10:00 AM to 10:59 AM | 0 (0.0%) | 0 (0.0%) |
| 11:00 AM to 11:59 AM | 0 (0.0%) | 35 (8.3%) |
| 12:00 PM to 3:59 PM | 55 (11.4%) | 38 (9.0%) |
| 4:00 PM to 11:59 PM | 0 (0.0%) | 29 (6.9%) |
| Total | 481 (100.0%) | 423 (100.0%) |
Housing Occupancy in Comunas
Occupancy by Ownership in Comunas
Of the total 1,042 dwellings in Comunas, owner-occupied units account for 713 (68.4%), while renter-occupied units make up 329 (31.6%).
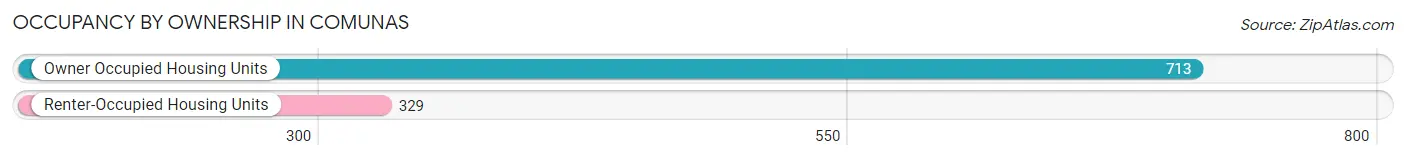
| Occupancy | # Housing Units | % Housing Units |
| Owner Occupied Housing Units | 713 | 68.4% |
| Renter-Occupied Housing Units | 329 | 31.6% |
| Total Occupied Housing Units | 1,042 | 100.0% |
Occupancy by Household Size in Comunas
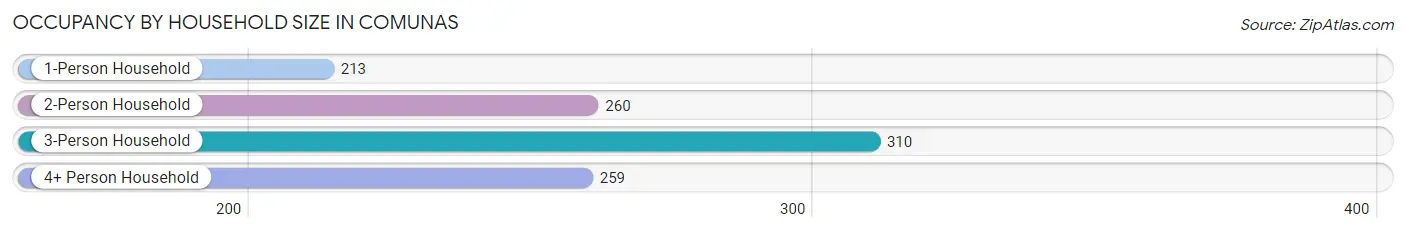
| Household Size | # Housing Units | % Housing Units |
| 1-Person Household | 213 | 20.4% |
| 2-Person Household | 260 | 24.9% |
| 3-Person Household | 310 | 29.7% |
| 4+ Person Household | 259 | 24.9% |
| Total Housing Units | 1,042 | 100.0% |
Occupancy by Ownership by Household Size in Comunas
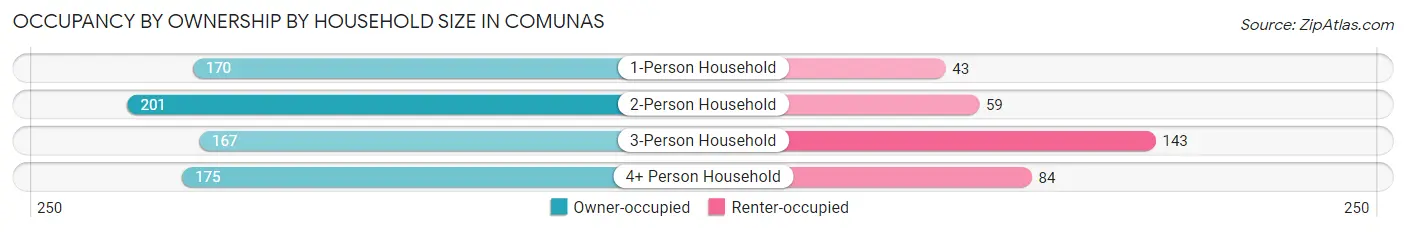
| Household Size | Owner-occupied | Renter-occupied |
| 1-Person Household | 170 (79.8%) | 43 (20.2%) |
| 2-Person Household | 201 (77.3%) | 59 (22.7%) |
| 3-Person Household | 167 (53.9%) | 143 (46.1%) |
| 4+ Person Household | 175 (67.6%) | 84 (32.4%) |
| Total Housing Units | 713 (68.4%) | 329 (31.6%) |
Occupancy by Educational Attainment in Comunas
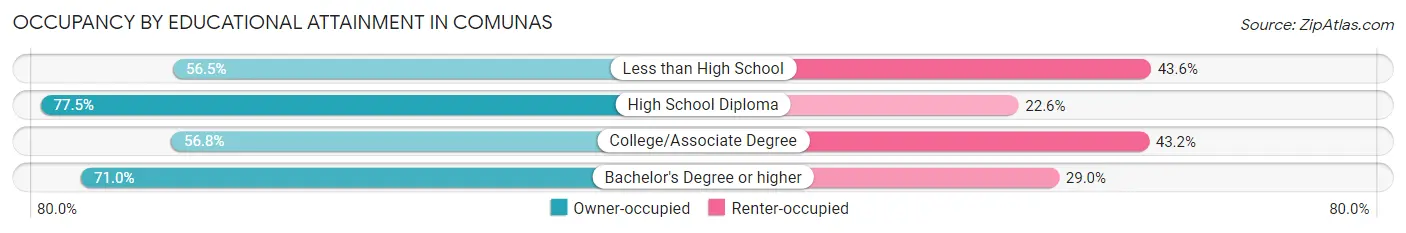
| Household Size | Owner-occupied | Renter-occupied |
| Less than High School | 140 (56.5%) | 108 (43.5%) |
| High School Diploma | 364 (77.4%) | 106 (22.6%) |
| College/Associate Degree | 84 (56.8%) | 64 (43.2%) |
| Bachelor's Degree or higher | 125 (71.0%) | 51 (29.0%) |
Occupancy by Age of Householder in Comunas
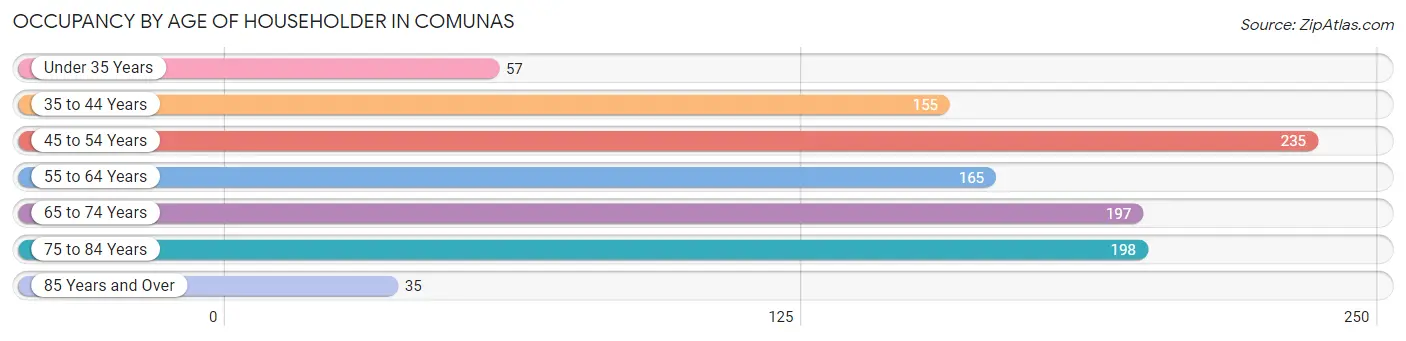
| Age Bracket | # Households | % Households |
| Under 35 Years | 57 | 5.5% |
| 35 to 44 Years | 155 | 14.9% |
| 45 to 54 Years | 235 | 22.6% |
| 55 to 64 Years | 165 | 15.8% |
| 65 to 74 Years | 197 | 18.9% |
| 75 to 84 Years | 198 | 19.0% |
| 85 Years and Over | 35 | 3.4% |
| Total | 1,042 | 100.0% |
Housing Finances in Comunas
Median Income by Occupancy in Comunas
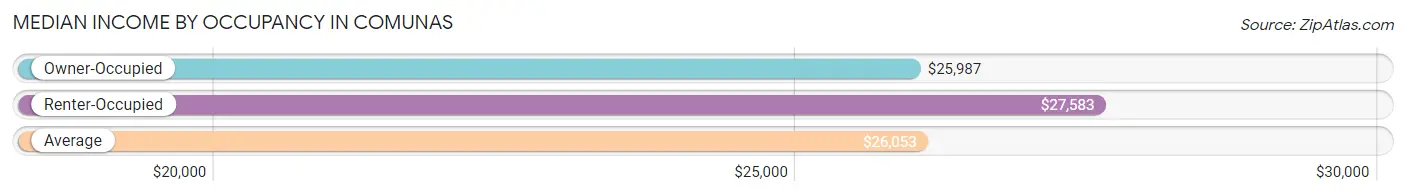
| Occupancy Type | # Households | Median Income |
| Owner-Occupied | 713 (68.4%) | $25,987 |
| Renter-Occupied | 329 (31.6%) | $27,583 |
| Average | 1,042 (100.0%) | $26,053 |
Occupancy by Householder Income Bracket in Comunas
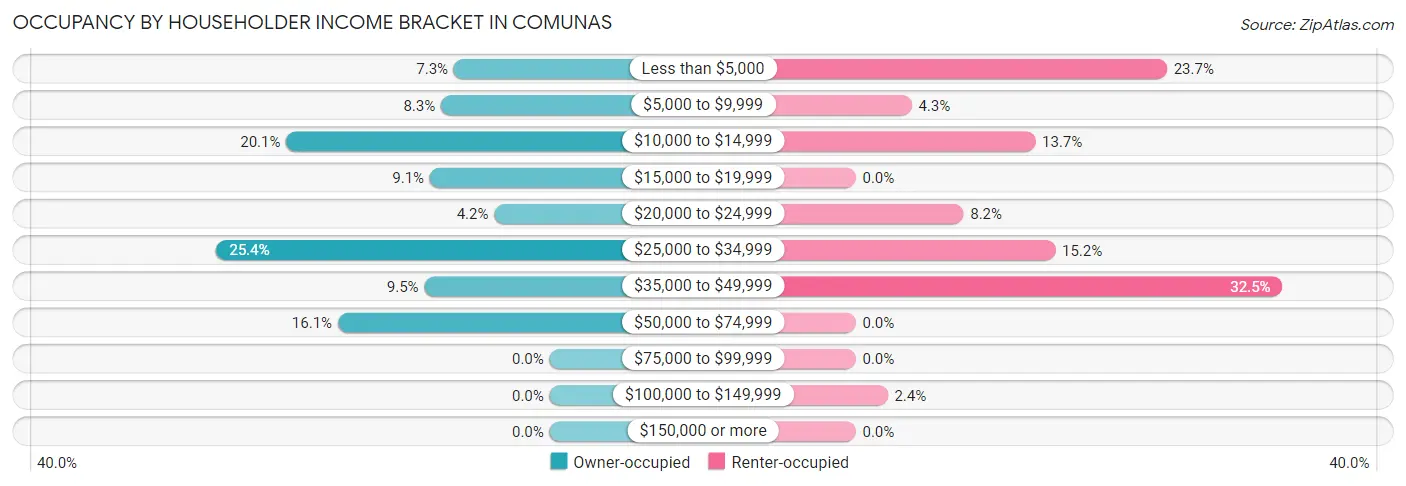
| Income Bracket | Owner-occupied | Renter-occupied |
| Less than $5,000 | 52 (7.3%) | 78 (23.7%) |
| $5,000 to $9,999 | 59 (8.3%) | 14 (4.3%) |
| $10,000 to $14,999 | 143 (20.1%) | 45 (13.7%) |
| $15,000 to $19,999 | 65 (9.1%) | 0 (0.0%) |
| $20,000 to $24,999 | 30 (4.2%) | 27 (8.2%) |
| $25,000 to $34,999 | 181 (25.4%) | 50 (15.2%) |
| $35,000 to $49,999 | 68 (9.5%) | 107 (32.5%) |
| $50,000 to $74,999 | 115 (16.1%) | 0 (0.0%) |
| $75,000 to $99,999 | 0 (0.0%) | 0 (0.0%) |
| $100,000 to $149,999 | 0 (0.0%) | 8 (2.4%) |
| $150,000 or more | 0 (0.0%) | 0 (0.0%) |
| Total | 713 (100.0%) | 329 (100.0%) |
Monthly Housing Cost Tiers in Comunas
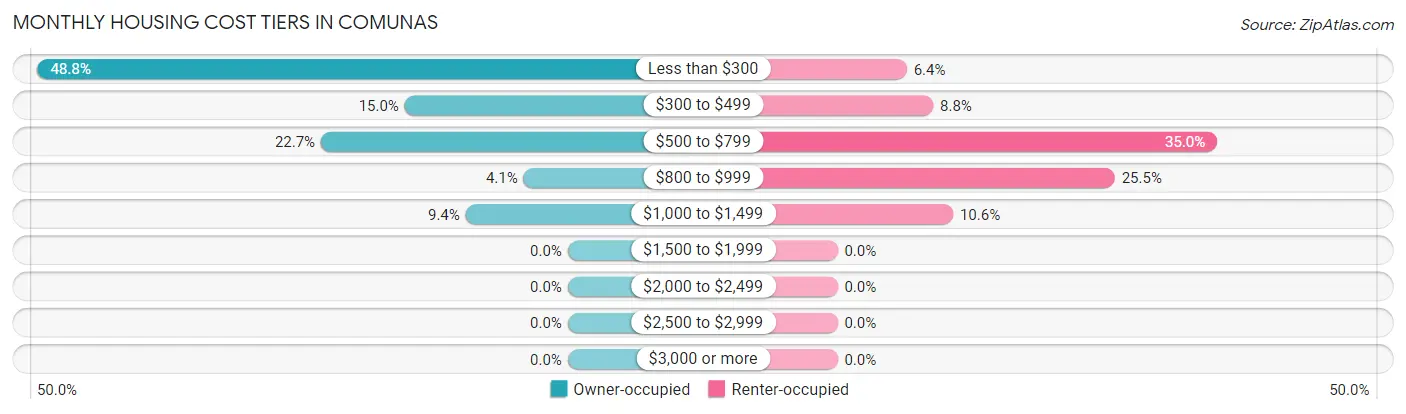
| Monthly Cost | Owner-occupied | Renter-occupied |
| Less than $300 | 348 (48.8%) | 21 (6.4%) |
| $300 to $499 | 107 (15.0%) | 29 (8.8%) |
| $500 to $799 | 162 (22.7%) | 115 (34.9%) |
| $800 to $999 | 29 (4.1%) | 84 (25.5%) |
| $1,000 to $1,499 | 67 (9.4%) | 35 (10.6%) |
| $1,500 to $1,999 | 0 (0.0%) | 0 (0.0%) |
| $2,000 to $2,499 | 0 (0.0%) | 0 (0.0%) |
| $2,500 to $2,999 | 0 (0.0%) | 0 (0.0%) |
| $3,000 or more | 0 (0.0%) | 0 (0.0%) |
| Total | 713 (100.0%) | 329 (100.0%) |
Physical Housing Characteristics in Comunas
Housing Structures in Comunas
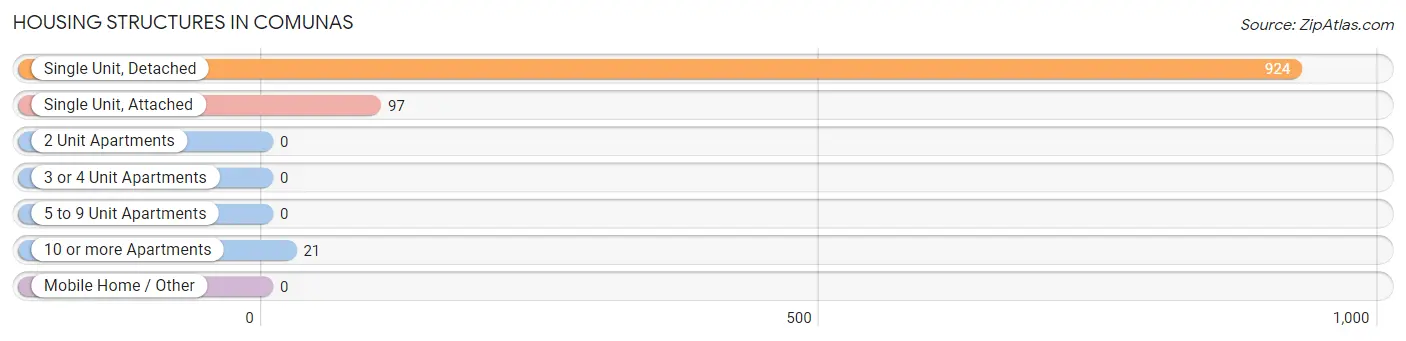
| Structure Type | # Housing Units | % Housing Units |
| Single Unit, Detached | 924 | 88.7% |
| Single Unit, Attached | 97 | 9.3% |
| 2 Unit Apartments | 0 | 0.0% |
| 3 or 4 Unit Apartments | 0 | 0.0% |
| 5 to 9 Unit Apartments | 0 | 0.0% |
| 10 or more Apartments | 21 | 2.0% |
| Mobile Home / Other | 0 | 0.0% |
| Total | 1,042 | 100.0% |
Housing Structures by Occupancy in Comunas
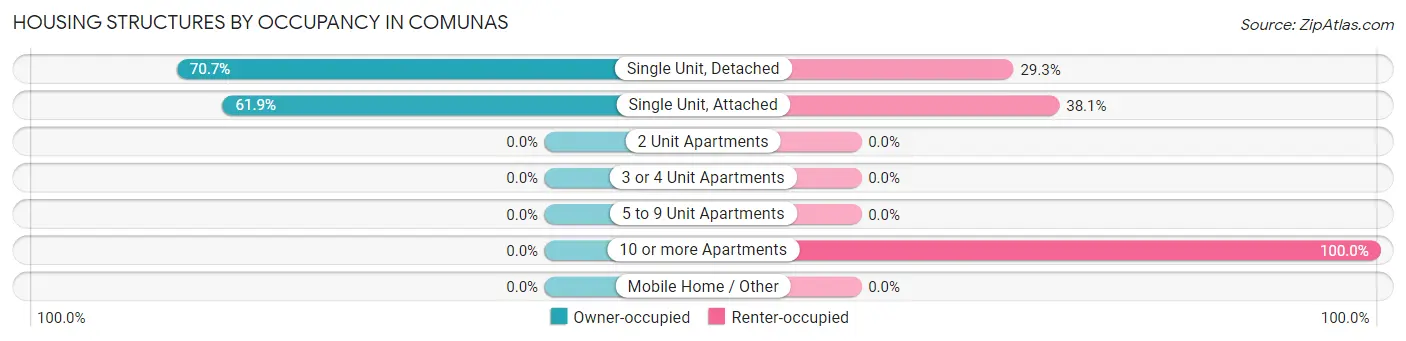
| Structure Type | Owner-occupied | Renter-occupied |
| Single Unit, Detached | 653 (70.7%) | 271 (29.3%) |
| Single Unit, Attached | 60 (61.9%) | 37 (38.1%) |
| 2 Unit Apartments | 0 (0.0%) | 0 (0.0%) |
| 3 or 4 Unit Apartments | 0 (0.0%) | 0 (0.0%) |
| 5 to 9 Unit Apartments | 0 (0.0%) | 0 (0.0%) |
| 10 or more Apartments | 0 (0.0%) | 21 (100.0%) |
| Mobile Home / Other | 0 (0.0%) | 0 (0.0%) |
| Total | 713 (68.4%) | 329 (31.6%) |
Housing Structures by Number of Rooms in Comunas
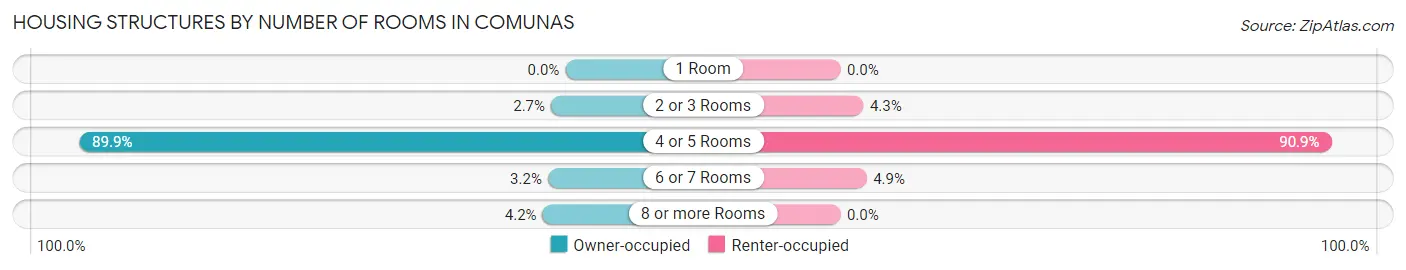
| Number of Rooms | Owner-occupied | Renter-occupied |
| 1 Room | 0 (0.0%) | 0 (0.0%) |
| 2 or 3 Rooms | 19 (2.7%) | 14 (4.3%) |
| 4 or 5 Rooms | 641 (89.9%) | 299 (90.9%) |
| 6 or 7 Rooms | 23 (3.2%) | 16 (4.9%) |
| 8 or more Rooms | 30 (4.2%) | 0 (0.0%) |
| Total | 713 (100.0%) | 329 (100.0%) |
Housing Structure by Heating Type in Comunas
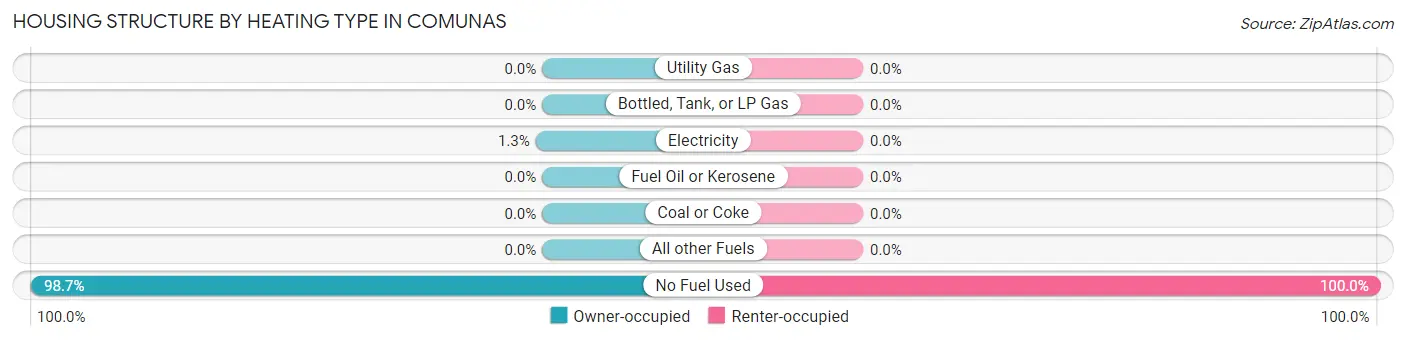
| Heating Type | Owner-occupied | Renter-occupied |
| Utility Gas | 0 (0.0%) | 0 (0.0%) |
| Bottled, Tank, or LP Gas | 0 (0.0%) | 0 (0.0%) |
| Electricity | 9 (1.3%) | 0 (0.0%) |
| Fuel Oil or Kerosene | 0 (0.0%) | 0 (0.0%) |
| Coal or Coke | 0 (0.0%) | 0 (0.0%) |
| All other Fuels | 0 (0.0%) | 0 (0.0%) |
| No Fuel Used | 704 (98.7%) | 329 (100.0%) |
| Total | 713 (100.0%) | 329 (100.0%) |
Household Vehicle Usage in Comunas
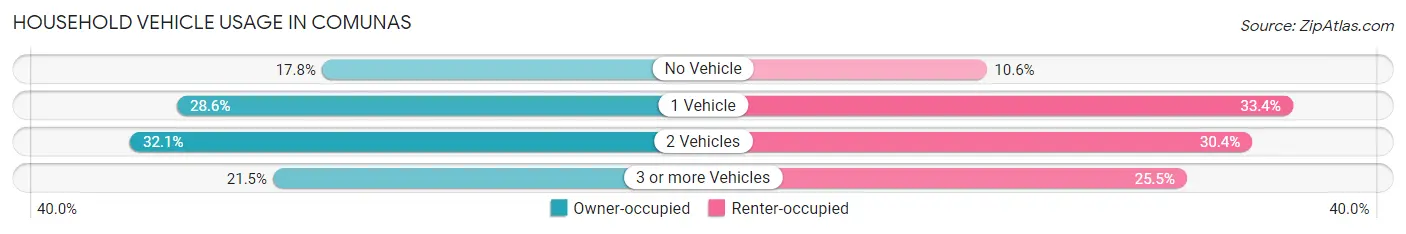
| Vehicles per Household | Owner-occupied | Renter-occupied |
| No Vehicle | 127 (17.8%) | 35 (10.6%) |
| 1 Vehicle | 204 (28.6%) | 110 (33.4%) |
| 2 Vehicles | 229 (32.1%) | 100 (30.4%) |
| 3 or more Vehicles | 153 (21.5%) | 84 (25.5%) |
| Total | 713 (100.0%) | 329 (100.0%) |
Real Estate & Mortgages in Comunas
Real Estate and Mortgage Overview in Comunas
| Characteristic | Without Mortgage | With Mortgage |
| Housing Units | 419 | 294 |
| Median Property Value | $98,400 | $97,800 |
| Median Household Income | $21,208 | $0 |
| Monthly Housing Costs | $141 | $0 |
| Real Estate Taxes | - | - |
Property Value by Mortgage Status in Comunas
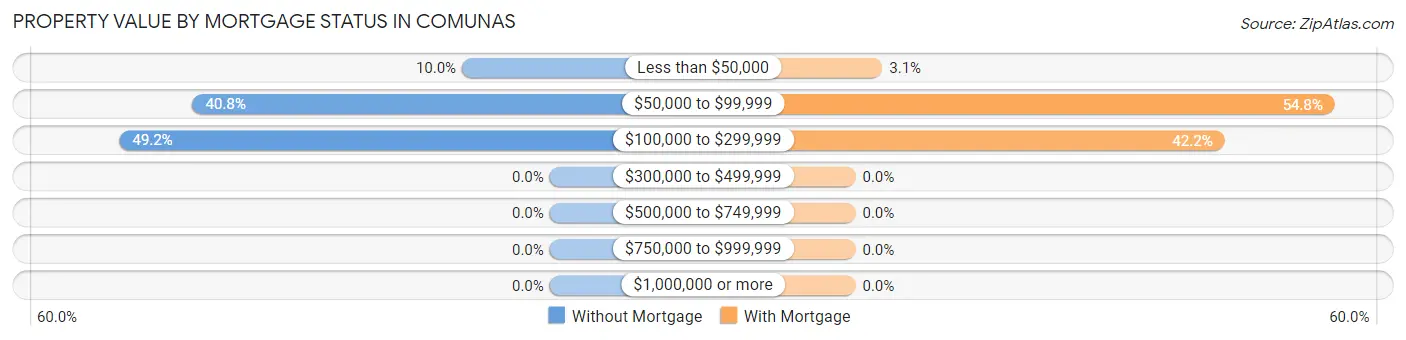
| Property Value | Without Mortgage | With Mortgage |
| Less than $50,000 | 42 (10.0%) | 9 (3.1%) |
| $50,000 to $99,999 | 171 (40.8%) | 161 (54.8%) |
| $100,000 to $299,999 | 206 (49.2%) | 124 (42.2%) |
| $300,000 to $499,999 | 0 (0.0%) | 0 (0.0%) |
| $500,000 to $749,999 | 0 (0.0%) | 0 (0.0%) |
| $750,000 to $999,999 | 0 (0.0%) | 0 (0.0%) |
| $1,000,000 or more | 0 (0.0%) | 0 (0.0%) |
| Total | 419 (100.0%) | 294 (100.0%) |
Household Income by Mortgage Status in Comunas
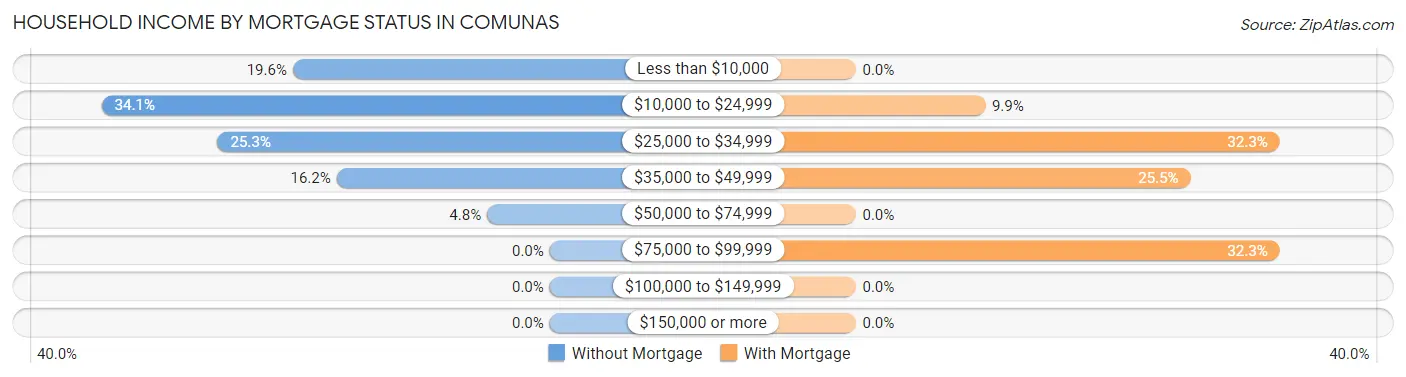
| Household Income | Without Mortgage | With Mortgage |
| Less than $10,000 | 82 (19.6%) | 0 (0.0%) |
| $10,000 to $24,999 | 143 (34.1%) | 29 (9.9%) |
| $25,000 to $34,999 | 106 (25.3%) | 95 (32.3%) |
| $35,000 to $49,999 | 68 (16.2%) | 75 (25.5%) |
| $50,000 to $74,999 | 20 (4.8%) | 0 (0.0%) |
| $75,000 to $99,999 | 0 (0.0%) | 95 (32.3%) |
| $100,000 to $149,999 | 0 (0.0%) | 0 (0.0%) |
| $150,000 or more | 0 (0.0%) | 0 (0.0%) |
| Total | 419 (100.0%) | 294 (100.0%) |
Property Value to Household Income Ratio in Comunas
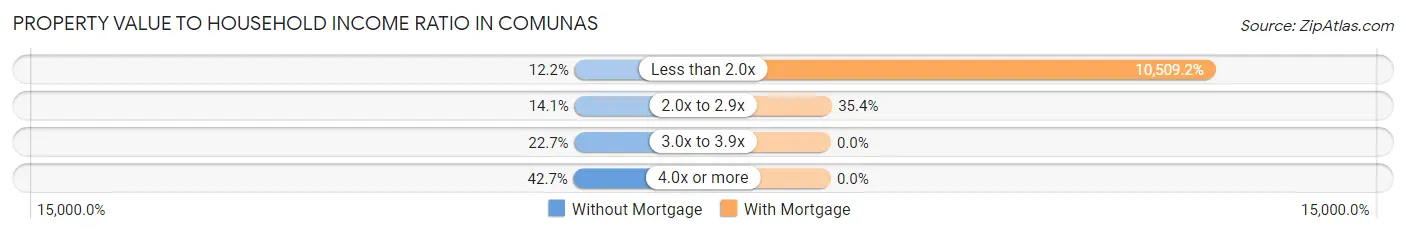
| Value-to-Income Ratio | Without Mortgage | With Mortgage |
| Less than 2.0x | 51 (12.2%) | 30,897 (10,509.2%) |
| 2.0x to 2.9x | 59 (14.1%) | 104 (35.4%) |
| 3.0x to 3.9x | 95 (22.7%) | 0 (0.0%) |
| 4.0x or more | 179 (42.7%) | 0 (0.0%) |
| Total | 419 (100.0%) | 294 (100.0%) |
Real Estate Taxes by Mortgage Status in Comunas
| Property Taxes | Without Mortgage | With Mortgage |
| Less than $800 | 0 (0.0%) | 0 (0.0%) |
| $800 to $1,499 | 0 (0.0%) | 0 (0.0%) |
| $800 to $1,499 | 0 (0.0%) | 0 (0.0%) |
| Total | 419 (100.0%) | 294 (100.0%) |
Health & Disability in Comunas
Health Insurance Coverage by Age in Comunas
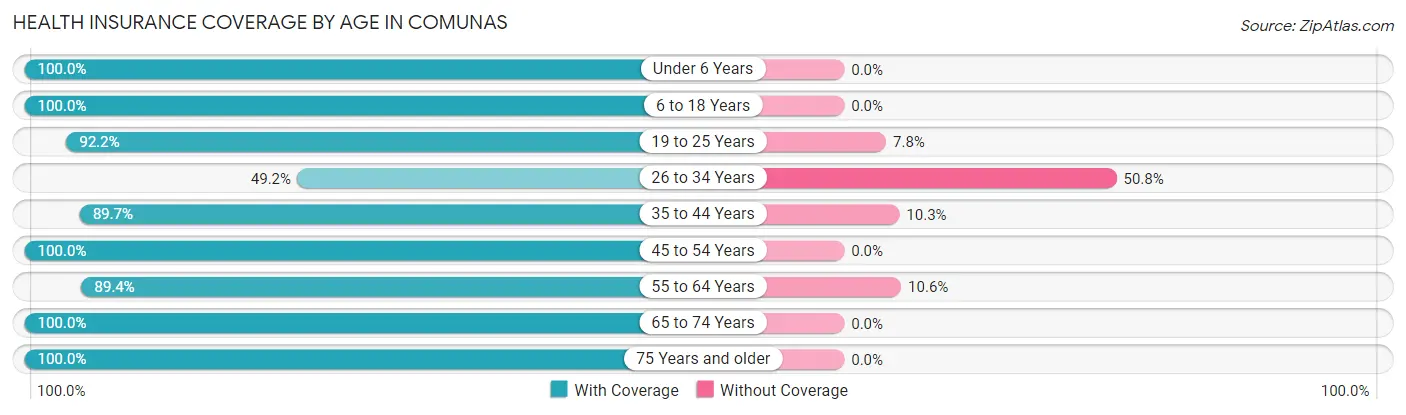
| Age Bracket | With Coverage | Without Coverage |
| Under 6 Years | 24 (100.0%) | 0 (0.0%) |
| 6 to 18 Years | 450 (100.0%) | 0 (0.0%) |
| 19 to 25 Years | 592 (92.2%) | 50 (7.8%) |
| 26 to 34 Years | 32 (49.2%) | 33 (50.8%) |
| 35 to 44 Years | 323 (89.7%) | 37 (10.3%) |
| 45 to 54 Years | 452 (100.0%) | 0 (0.0%) |
| 55 to 64 Years | 388 (89.4%) | 46 (10.6%) |
| 65 to 74 Years | 246 (100.0%) | 0 (0.0%) |
| 75 Years and older | 332 (100.0%) | 0 (0.0%) |
| Total | 2,839 (94.5%) | 166 (5.5%) |
Health Insurance Coverage by Citizenship Status in Comunas

| Citizenship Status | With Coverage | Without Coverage |
| Native Born | 24 (100.0%) | 0 (0.0%) |
| Foreign Born, Citizen | 450 (100.0%) | 0 (0.0%) |
| Foreign Born, not a Citizen | 592 (92.2%) | 50 (7.8%) |
Health Insurance Coverage by Household Income in Comunas
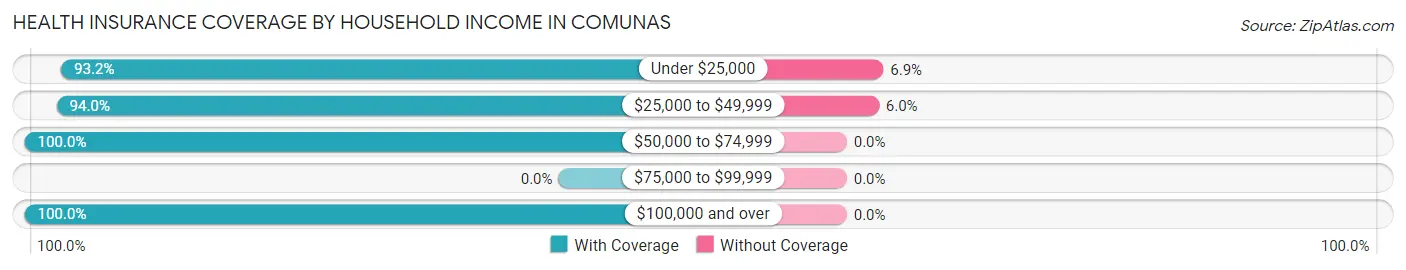
| Household Income | With Coverage | Without Coverage |
| Under $25,000 | 1,128 (93.1%) | 83 (6.9%) |
| $25,000 to $49,999 | 1,300 (94.0%) | 83 (6.0%) |
| $50,000 to $74,999 | 384 (100.0%) | 0 (0.0%) |
| $75,000 to $99,999 | 0 (0.0%) | 0 (0.0%) |
| $100,000 and over | 27 (100.0%) | 0 (0.0%) |
Public vs Private Health Insurance Coverage by Age in Comunas
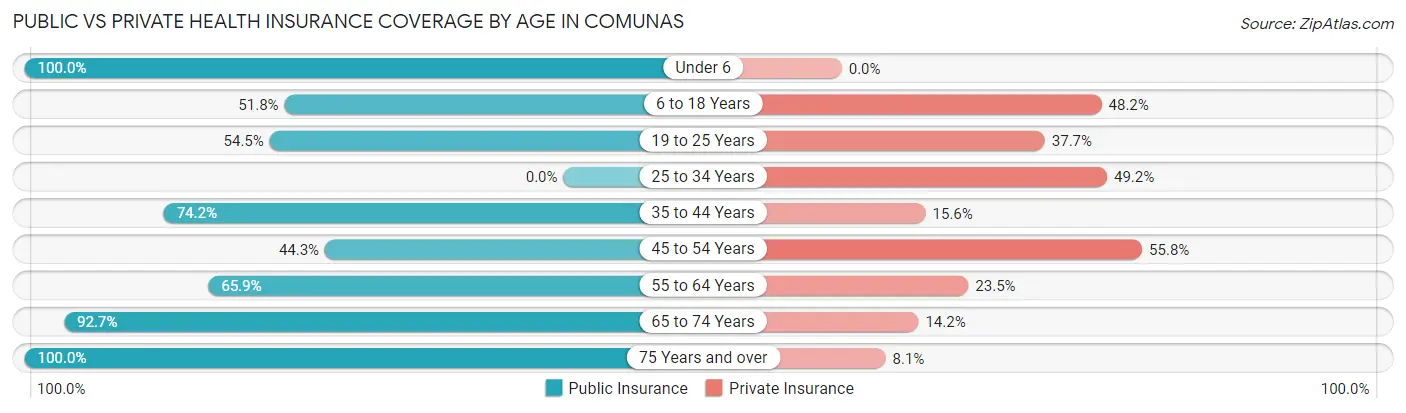
| Age Bracket | Public Insurance | Private Insurance |
| Under 6 | 24 (100.0%) | 0 (0.0%) |
| 6 to 18 Years | 233 (51.8%) | 217 (48.2%) |
| 19 to 25 Years | 350 (54.5%) | 242 (37.7%) |
| 25 to 34 Years | 0 (0.0%) | 32 (49.2%) |
| 35 to 44 Years | 267 (74.2%) | 56 (15.6%) |
| 45 to 54 Years | 200 (44.3%) | 252 (55.7%) |
| 55 to 64 Years | 286 (65.9%) | 102 (23.5%) |
| 65 to 74 Years | 228 (92.7%) | 35 (14.2%) |
| 75 Years and over | 332 (100.0%) | 27 (8.1%) |
| Total | 1,920 (63.9%) | 963 (32.1%) |
Disability Status by Sex by Age in Comunas
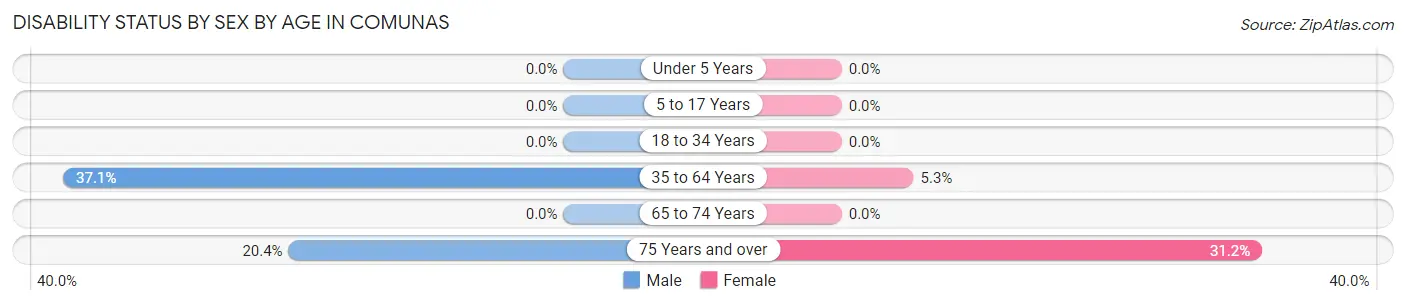
| Age Bracket | Male | Female |
| Under 5 Years | 0 (0.0%) | 0 (0.0%) |
| 5 to 17 Years | 0 (0.0%) | 0 (0.0%) |
| 18 to 34 Years | 0 (0.0%) | 0 (0.0%) |
| 35 to 64 Years | 205 (37.1%) | 37 (5.3%) |
| 65 to 74 Years | 0 (0.0%) | 0 (0.0%) |
| 75 Years and over | 20 (20.4%) | 73 (31.2%) |
Disability Class by Sex by Age in Comunas
Disability Class: Hearing Difficulty
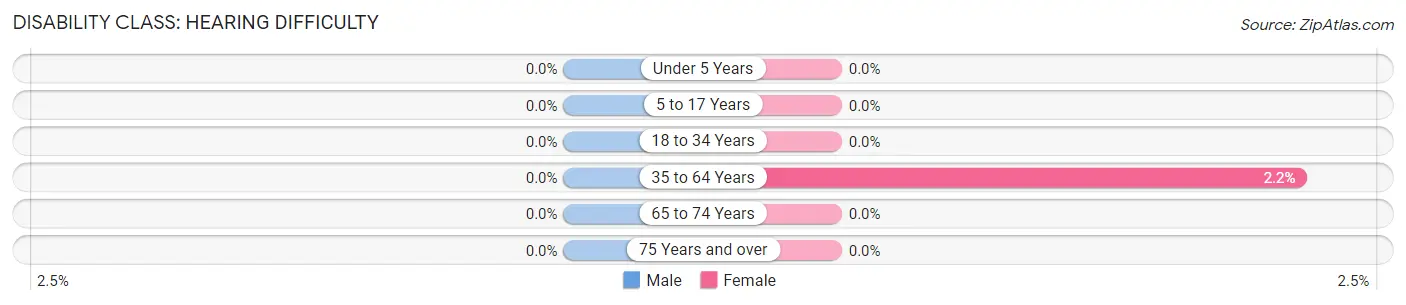
| Age Bracket | Male | Female |
| Under 5 Years | 0 (0.0%) | 0 (0.0%) |
| 5 to 17 Years | 0 (0.0%) | 0 (0.0%) |
| 18 to 34 Years | 0 (0.0%) | 0 (0.0%) |
| 35 to 64 Years | 0 (0.0%) | 15 (2.2%) |
| 65 to 74 Years | 0 (0.0%) | 0 (0.0%) |
| 75 Years and over | 0 (0.0%) | 0 (0.0%) |
Disability Class: Vision Difficulty
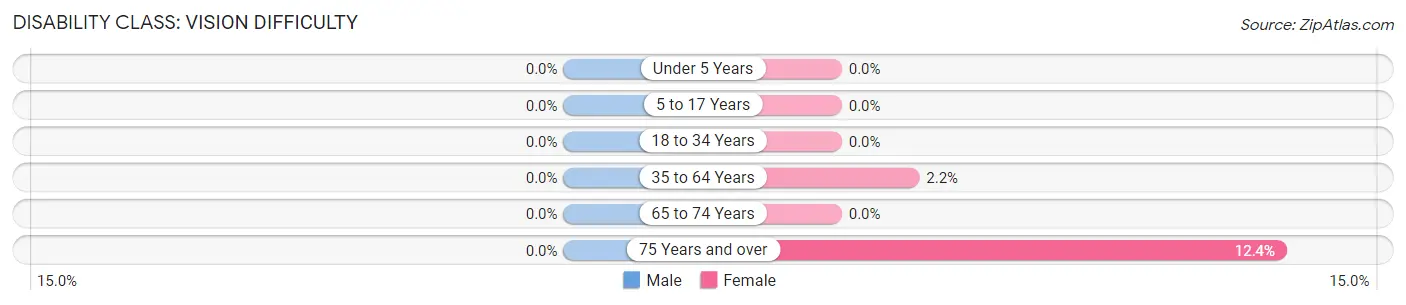
| Age Bracket | Male | Female |
| Under 5 Years | 0 (0.0%) | 0 (0.0%) |
| 5 to 17 Years | 0 (0.0%) | 0 (0.0%) |
| 18 to 34 Years | 0 (0.0%) | 0 (0.0%) |
| 35 to 64 Years | 0 (0.0%) | 15 (2.2%) |
| 65 to 74 Years | 0 (0.0%) | 0 (0.0%) |
| 75 Years and over | 0 (0.0%) | 29 (12.4%) |
Disability Class: Cognitive Difficulty
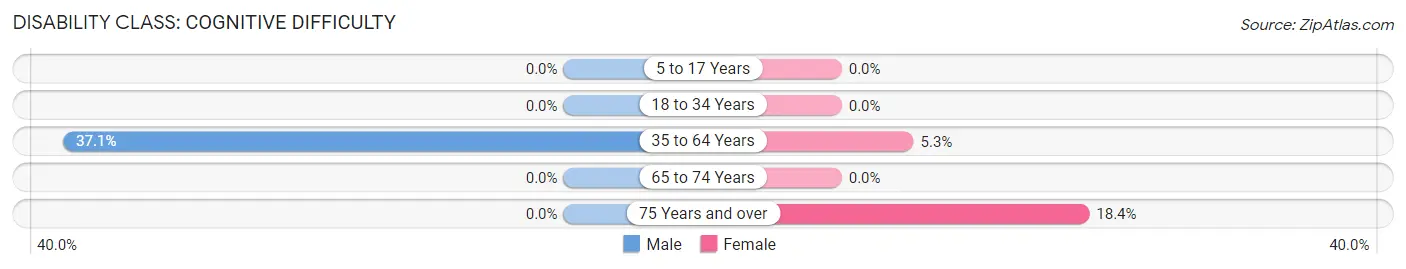
| Age Bracket | Male | Female |
| 5 to 17 Years | 0 (0.0%) | 0 (0.0%) |
| 18 to 34 Years | 0 (0.0%) | 0 (0.0%) |
| 35 to 64 Years | 205 (37.1%) | 37 (5.3%) |
| 65 to 74 Years | 0 (0.0%) | 0 (0.0%) |
| 75 Years and over | 0 (0.0%) | 43 (18.4%) |
Disability Class: Ambulatory Difficulty
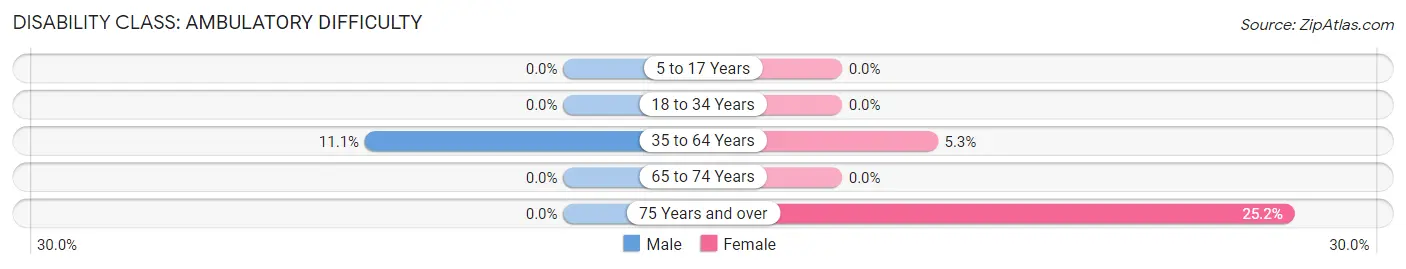
| Age Bracket | Male | Female |
| 5 to 17 Years | 0 (0.0%) | 0 (0.0%) |
| 18 to 34 Years | 0 (0.0%) | 0 (0.0%) |
| 35 to 64 Years | 61 (11.1%) | 37 (5.3%) |
| 65 to 74 Years | 0 (0.0%) | 0 (0.0%) |
| 75 Years and over | 0 (0.0%) | 59 (25.2%) |
Disability Class: Self-Care Difficulty
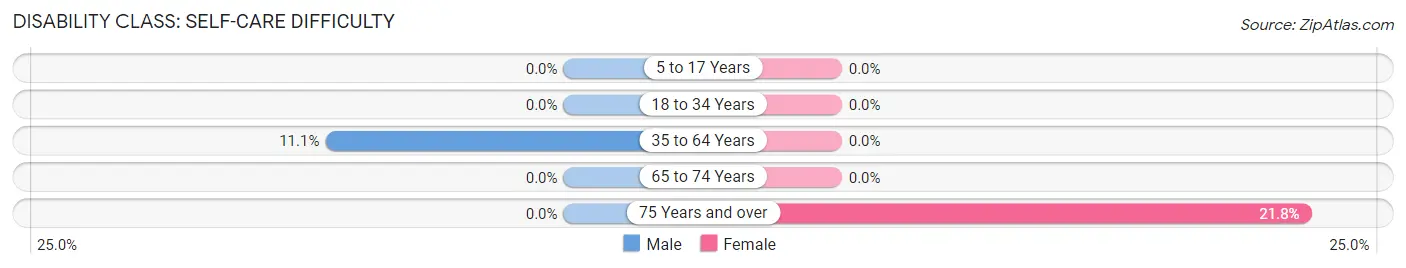
| Age Bracket | Male | Female |
| 5 to 17 Years | 0 (0.0%) | 0 (0.0%) |
| 18 to 34 Years | 0 (0.0%) | 0 (0.0%) |
| 35 to 64 Years | 61 (11.1%) | 0 (0.0%) |
| 65 to 74 Years | 0 (0.0%) | 0 (0.0%) |
| 75 Years and over | 0 (0.0%) | 51 (21.8%) |
Technology Access in Comunas
Computing Device Access in Comunas
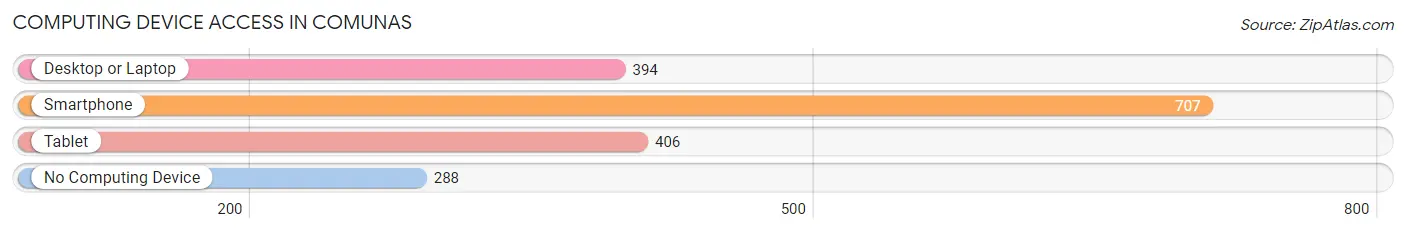
| Device Type | # Households | % Households |
| Desktop or Laptop | 394 | 37.8% |
| Smartphone | 707 | 67.8% |
| Tablet | 406 | 39.0% |
| No Computing Device | 288 | 27.6% |
| Total | 1,042 | 100.0% |
Internet Access in Comunas
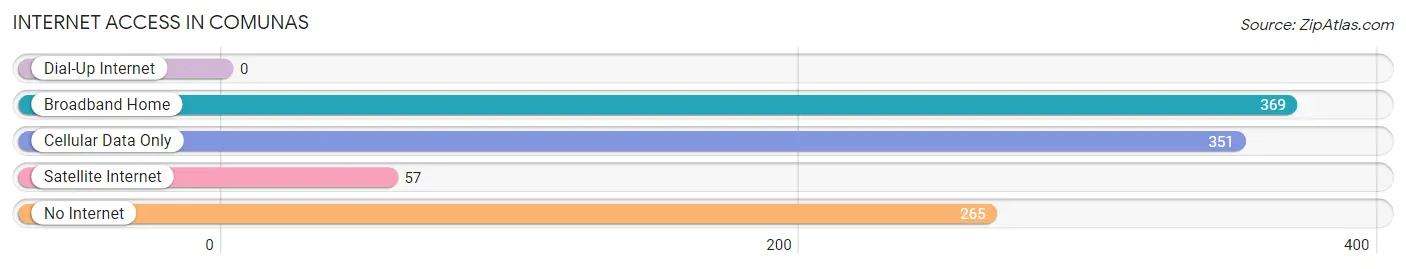
| Internet Type | # Households | % Households |
| Dial-Up Internet | 0 | 0.0% |
| Broadband Home | 369 | 35.4% |
| Cellular Data Only | 351 | 33.7% |
| Satellite Internet | 57 | 5.5% |
| No Internet | 265 | 25.4% |
| Total | 1,042 | 100.0% |
Comunas Summary
Comunas are a type of administrative division in the Republic of Paraguay. They are similar to municipalities in other countries, but are distinct in that they are not necessarily based on population size. Comunas are the smallest administrative divisions in Paraguay, and are typically composed of several villages or towns.
History
The concept of comunas was first introduced in Paraguay in the late 19th century, during the presidency of Bernardino Caballero. Caballero sought to create a more efficient system of local government, and the comunas were part of his plan. The comunas were intended to be a more decentralized form of government, with each comuna having its own local government and autonomy.
The comunas were officially established in 1887, and by the early 20th century there were over 200 comunas in Paraguay. The comunas were initially based on geographic boundaries, but over time they began to be based more on population size. By the mid-20th century, the number of comunas had grown to over 500.
Geography
Comunas are located throughout the Republic of Paraguay, and are typically composed of several villages or towns. The comunas are typically located in rural areas, and are often located in remote areas of the country. The comunas are typically located in the eastern and western parts of the country, with the majority of comunas located in the eastern part of the country.
Economy
The economy of the comunas is largely based on agriculture, with many comunas relying on subsistence farming. The comunas are also home to a variety of small businesses, such as restaurants, shops, and other services. The comunas are also home to a variety of industries, such as timber, mining, and manufacturing.
Demographics
The population of the comunas is largely rural, with most of the population living in small villages or towns. The population of the comunas is largely composed of mestizos, or people of mixed European and indigenous descent. The population of the comunas is largely Roman Catholic, and the majority of the population speaks Spanish as their primary language.
Conclusion
Comunas are an important part of the Republic of Paraguay, and are an integral part of the country’s history, geography, economy, and demographics. The comunas are typically composed of several villages or towns, and are largely rural in nature. The economy of the comunas is largely based on agriculture, with many comunas relying on subsistence farming. The population of the comunas is largely mestizo, and the majority of the population speaks Spanish as their primary language.
Common Questions
What is Per Capita Income in Comunas?
Per Capita income in Comunas is $10,289.
What is the Median Family Income in Comunas?
Median Family Income in Comunas is $23,889.
What is the Median Household income in Comunas?
Median Household Income in Comunas is $26,053.
What is Income or Wage Gap in Comunas?
Income or Wage Gap in Comunas is 21.6%.
Women in Comunas earn 78.4 cents for every dollar earned by a man.
What is Inequality or Gini Index in Comunas?
Inequality or Gini Index in Comunas is 0.40.
What is the Total Population of Comunas?
Total Population of Comunas is 3,005.
What is the Total Male Population of Comunas?
Total Male Population of Comunas is 1,513.
What is the Total Female Population of Comunas?
Total Female Population of Comunas is 1,492.
What is the Ratio of Males per 100 Females in Comunas?
There are 101.41 Males per 100 Females in Comunas.
What is the Ratio of Females per 100 Males in Comunas?
There are 98.61 Females per 100 Males in Comunas.
What is the Median Population Age in Comunas?
Median Population Age in Comunas is 43.4 Years.
What is the Average Family Size in Comunas
Average Family Size in Comunas is 3.2 People.
What is the Average Household Size in Comunas
Average Household Size in Comunas is 2.9 People.
How Large is the Labor Force in Comunas?
There are 1,057 People in the Labor Forcein in Comunas.
What is the Percentage of People in the Labor Force in Comunas?
38.5% of People are in the Labor Force in Comunas.
What is the Unemployment Rate in Comunas?
Unemployment Rate in Comunas is 14.4%.