Spring Valley, AZ Map & Demographics
Spring Valley Map
Spring Valley Overview
$27,254
PER CAPITA INCOME
$81,250
AVG FAMILY INCOME
$41,429
AVG HOUSEHOLD INCOME
0.54
INEQUALITY / GINI INDEX
1,514
TOTAL POPULATION
743
MALE POPULATION
771
FEMALE POPULATION
96.37
MALES / 100 FEMALES
103.77
FEMALES / 100 MALES
53.7
MEDIAN AGE
3.4
AVG FAMILY SIZE
2.6
AVG HOUSEHOLD SIZE
461
LABOR FORCE [ PEOPLE ]
35.1%
PERCENT IN LABOR FORCE
2.2%
UNEMPLOYMENT RATE
Spring Valley Area Codes
Income in Spring Valley
Income Overview in Spring Valley
Per Capita Income in Spring Valley is $27,254, while median incomes of families and households are $81,250 and $41,429 respectively.
| Characteristic | Number | Measure |
| Per Capita Income | 1,514 | $27,254 |
| Median Family Income | 337 | $81,250 |
| Mean Family Income | 337 | $104,245 |
| Median Household Income | 592 | $41,429 |
| Mean Household Income | 592 | $67,630 |
| Income Deficit | 337 | $0 |
| Wage / Income Gap (%) | 1,514 | 0.00% |
| Wage / Income Gap ($) | 1,514 | 100.00¢ per $1 |
| Gini / Inequality Index | 1,514 | 0.54 |
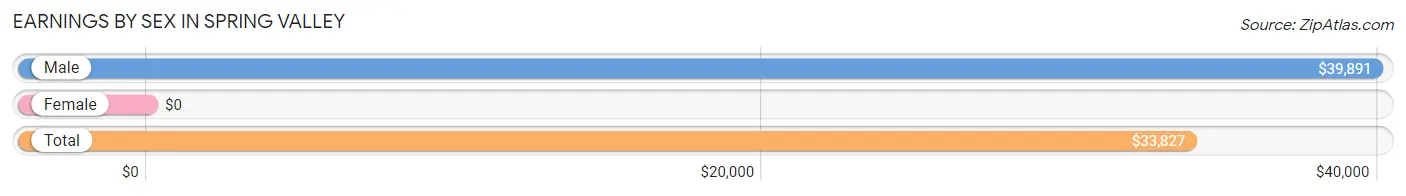
Earnings by Sex in Spring Valley
| Sex | Number | Average Earnings |
| Male | 296 (48.8%) | $39,891 |
| Female | 310 (51.2%) | $0 |
| Total | 606 (100.0%) | $33,827 |
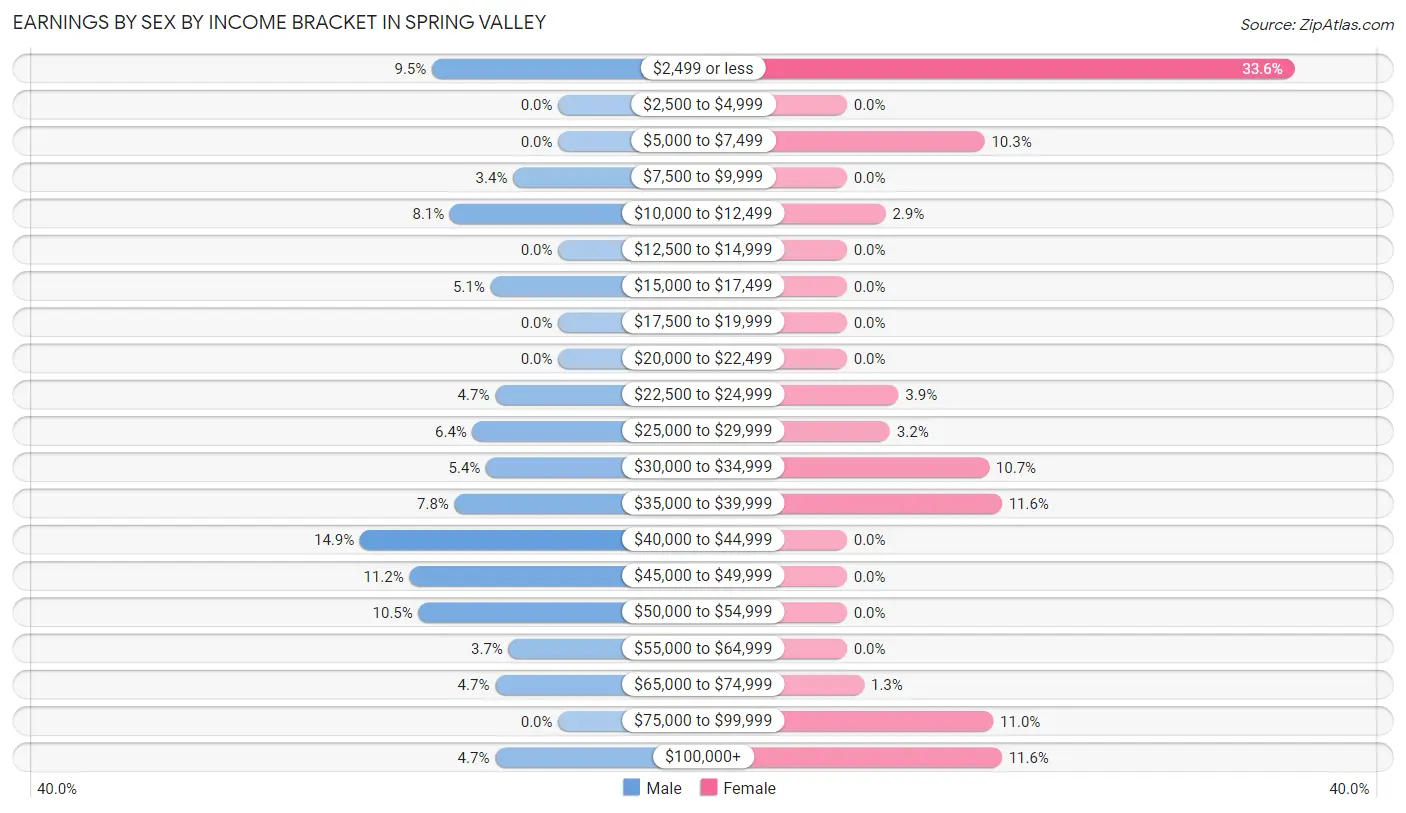
Earnings by Sex by Income Bracket in Spring Valley
The most common earnings brackets in Spring Valley are $40,000 to $44,999 for men (44 | 14.9%) and $2,499 or less for women (104 | 33.6%).
| Income | Male | Female |
| $2,499 or less | 28 (9.5%) | 104 (33.6%) |
| $2,500 to $4,999 | 0 (0.0%) | 0 (0.0%) |
| $5,000 to $7,499 | 0 (0.0%) | 32 (10.3%) |
| $7,500 to $9,999 | 10 (3.4%) | 0 (0.0%) |
| $10,000 to $12,499 | 24 (8.1%) | 9 (2.9%) |
| $12,500 to $14,999 | 0 (0.0%) | 0 (0.0%) |
| $15,000 to $17,499 | 15 (5.1%) | 0 (0.0%) |
| $17,500 to $19,999 | 0 (0.0%) | 0 (0.0%) |
| $20,000 to $22,499 | 0 (0.0%) | 0 (0.0%) |
| $22,500 to $24,999 | 14 (4.7%) | 12 (3.9%) |
| $25,000 to $29,999 | 19 (6.4%) | 10 (3.2%) |
| $30,000 to $34,999 | 16 (5.4%) | 33 (10.6%) |
| $35,000 to $39,999 | 23 (7.8%) | 36 (11.6%) |
| $40,000 to $44,999 | 44 (14.9%) | 0 (0.0%) |
| $45,000 to $49,999 | 33 (11.2%) | 0 (0.0%) |
| $50,000 to $54,999 | 31 (10.5%) | 0 (0.0%) |
| $55,000 to $64,999 | 11 (3.7%) | 0 (0.0%) |
| $65,000 to $74,999 | 14 (4.7%) | 4 (1.3%) |
| $75,000 to $99,999 | 0 (0.0%) | 34 (11.0%) |
| $100,000+ | 14 (4.7%) | 36 (11.6%) |
| Total | 296 (100.0%) | 310 (100.0%) |
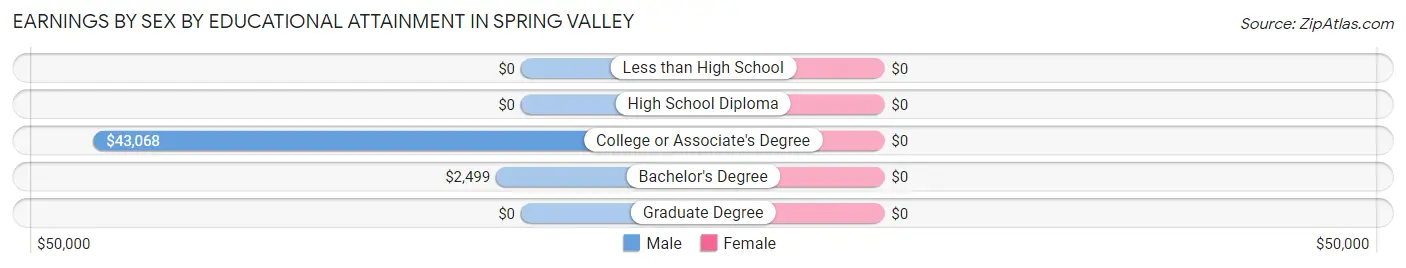
Earnings by Sex by Educational Attainment in Spring Valley
| Educational Attainment | Male Income | Female Income |
| Less than High School | - | - |
| High School Diploma | - | - |
| College or Associate's Degree | $43,068 | $0 |
| Bachelor's Degree | $2,499 | $0 |
| Graduate Degree | - | - |
| Total | $42,813 | $34,091 |
Family Income in Spring Valley
Family Income Brackets in Spring Valley
According to the Spring Valley family income data, there are 68 families falling into the $150,000 to $199,999 income range, which is the most common income bracket and makes up 20.2% of all families.
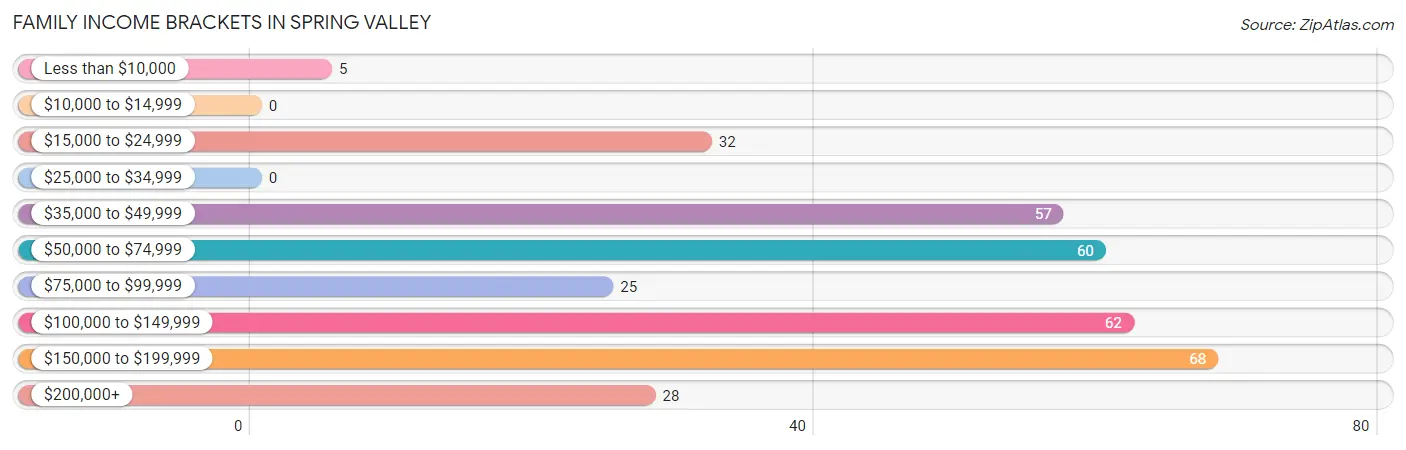
| Income Bracket | # Families | % Families |
| Less than $10,000 | 5 | 1.5% |
| $10,000 to $14,999 | 0 | 0.0% |
| $15,000 to $24,999 | 32 | 9.5% |
| $25,000 to $34,999 | 0 | 0.0% |
| $35,000 to $49,999 | 57 | 16.9% |
| $50,000 to $74,999 | 60 | 17.8% |
| $75,000 to $99,999 | 25 | 7.4% |
| $100,000 to $149,999 | 62 | 18.4% |
| $150,000 to $199,999 | 68 | 20.2% |
| $200,000+ | 28 | 8.3% |
Family Income by Famaliy Size in Spring Valley
3-person families (78 | 23.2%) account for the highest median family income in Spring Valley with $155,972 per family, while 3-person families (78 | 23.2%) have the highest median income of $51,991 per family member.
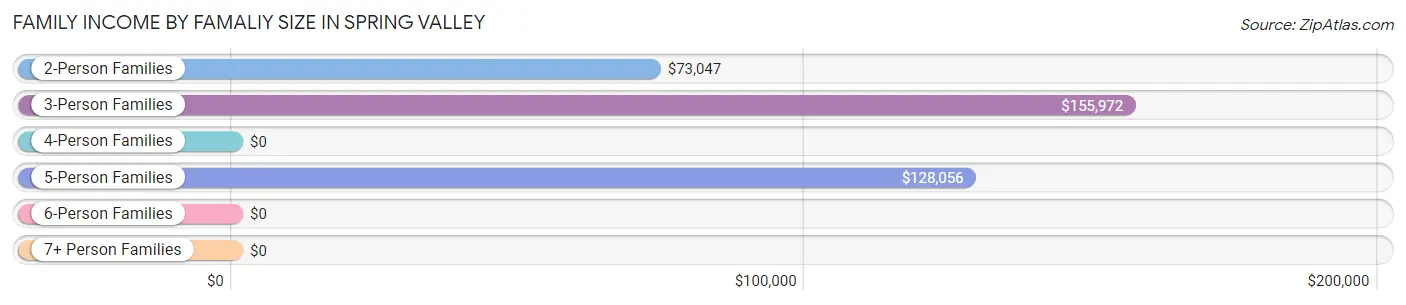
| Income Bracket | # Families | Median Income |
| 2-Person Families | 185 (54.9%) | $73,047 |
| 3-Person Families | 78 (23.2%) | $155,972 |
| 4-Person Families | 0 (0.0%) | $0 |
| 5-Person Families | 60 (17.8%) | $128,056 |
| 6-Person Families | 14 (4.2%) | $0 |
| 7+ Person Families | 0 (0.0%) | $0 |
| Total | 337 (100.0%) | $81,250 |
Family Income by Number of Earners in Spring Valley
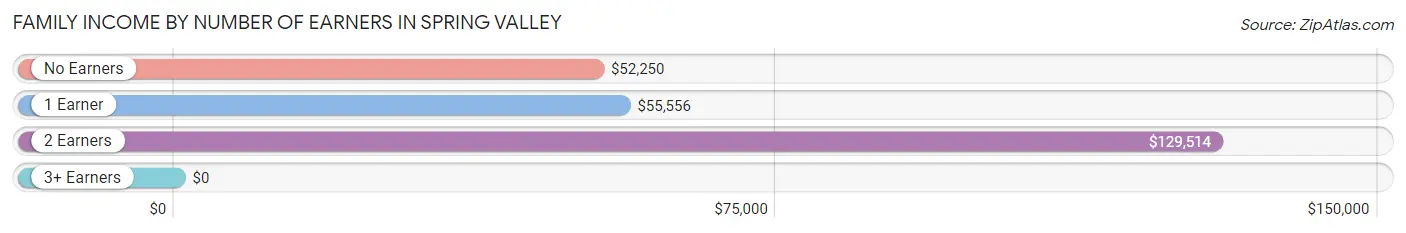
| Number of Earners | # Families | Median Income |
| No Earners | 62 (18.4%) | $52,250 |
| 1 Earner | 138 (40.9%) | $55,556 |
| 2 Earners | 103 (30.6%) | $129,514 |
| 3+ Earners | 34 (10.1%) | $0 |
| Total | 337 (100.0%) | $81,250 |
Household Income in Spring Valley
Household Income Brackets in Spring Valley
With 109 households falling in the category, the $15,000 to $24,999 income range is the most frequent in Spring Valley, accounting for 18.4% of all households. In contrast, only 25 households (4.2%) fall into the $75,000 to $99,999 income bracket, making it the least populous group.
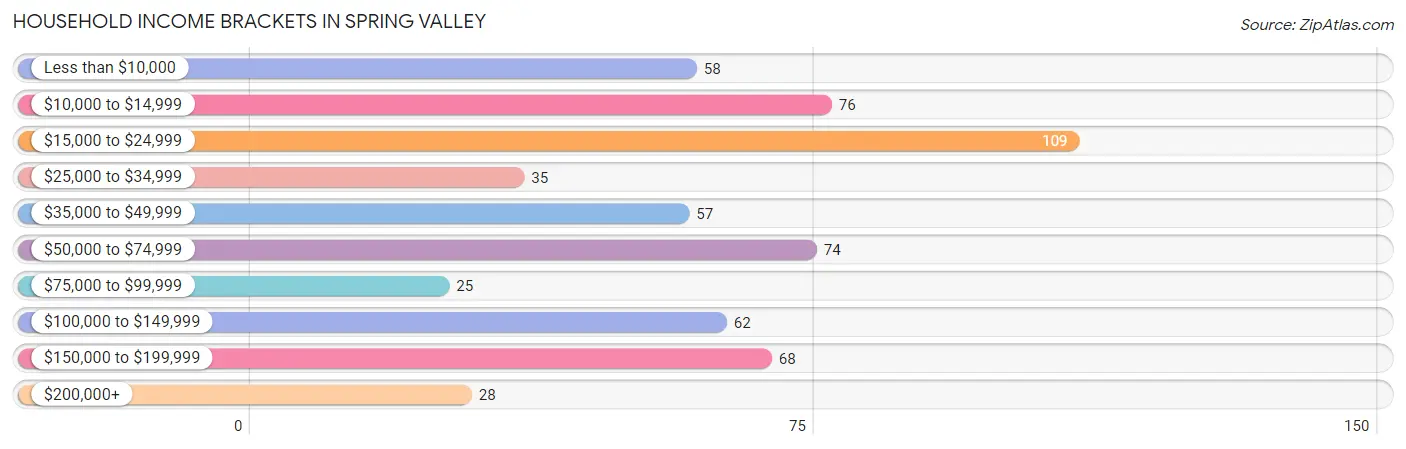
| Income Bracket | # Households | % Households |
| Less than $10,000 | 58 | 9.8% |
| $10,000 to $14,999 | 76 | 12.8% |
| $15,000 to $24,999 | 109 | 18.4% |
| $25,000 to $34,999 | 35 | 5.9% |
| $35,000 to $49,999 | 57 | 9.6% |
| $50,000 to $74,999 | 74 | 12.5% |
| $75,000 to $99,999 | 25 | 4.2% |
| $100,000 to $149,999 | 62 | 10.5% |
| $150,000 to $199,999 | 68 | 11.5% |
| $200,000+ | 28 | 4.7% |
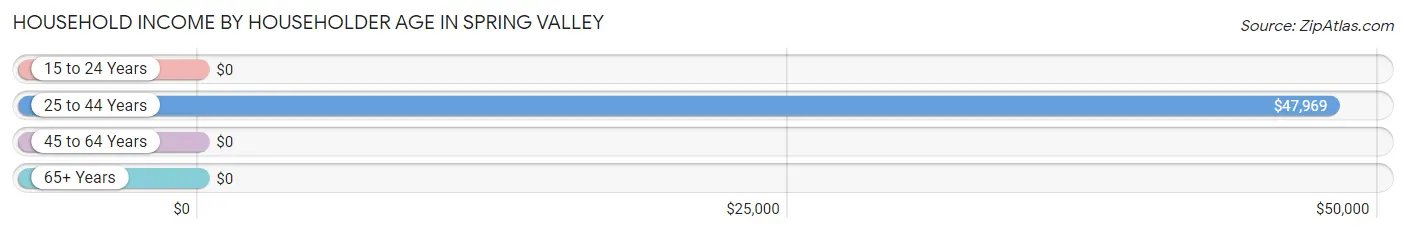
Household Income by Householder Age in Spring Valley
The median household income in Spring Valley is $41,429, with the highest median household income of $47,969 found in the 25 to 44 years age bracket for the primary householder. A total of 34 households (5.7%) fall into this category. Meanwhile, the 15 to 24 years age bracket for the primary householder has the lowest median household income of $0, with 18 households (3.0%) in this group.
| Income Bracket | # Households | Median Income |
| 15 to 24 Years | 18 (3.0%) | $0 |
| 25 to 44 Years | 34 (5.7%) | $47,969 |
| 45 to 64 Years | 229 (38.7%) | $0 |
| 65+ Years | 311 (52.5%) | $0 |
| Total | 592 (100.0%) | $41,429 |
Poverty in Spring Valley
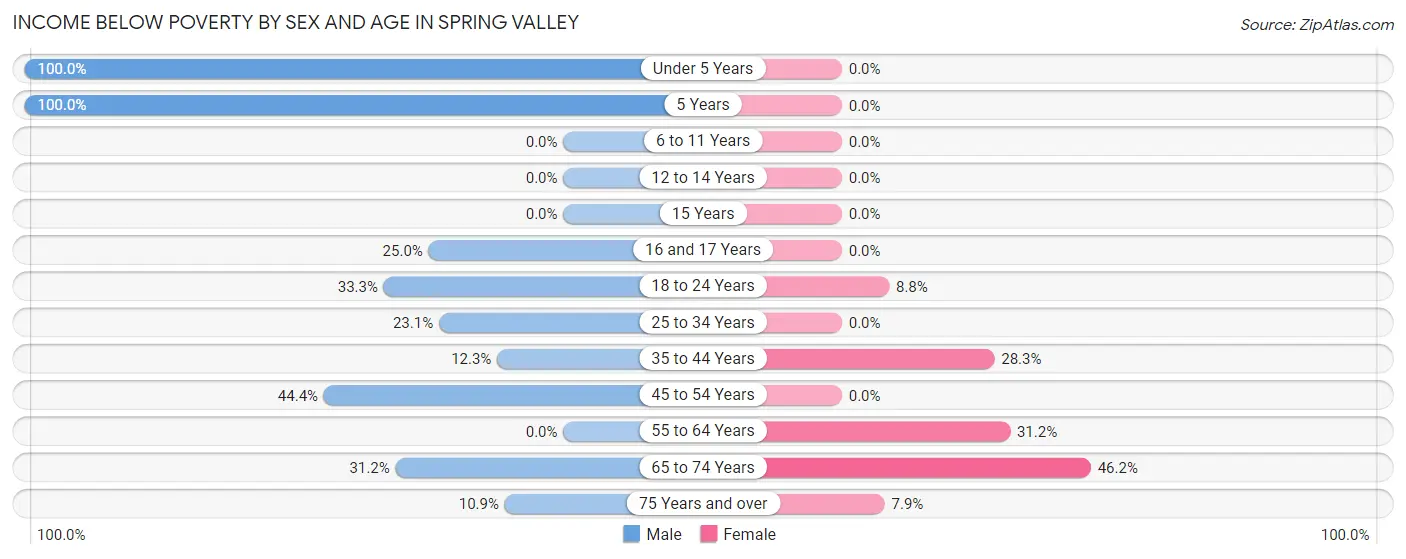
Income Below Poverty by Sex and Age in Spring Valley
With 25.2% poverty level for males and 21.7% for females among the residents of Spring Valley, under 5 year old males and 65 to 74 year old females are the most vulnerable to poverty, with 35 males (100.0%) and 67 females (46.2%) in their respective age groups living below the poverty level.
| Age Bracket | Male | Female |
| Under 5 Years | 35 (100.0%) | 0 (0.0%) |
| 5 Years | 10 (100.0%) | 0 (0.0%) |
| 6 to 11 Years | 0 (0.0%) | 0 (0.0%) |
| 12 to 14 Years | 0 (0.0%) | 0 (0.0%) |
| 15 Years | 0 (0.0%) | 0 (0.0%) |
| 16 and 17 Years | 7 (25.0%) | 0 (0.0%) |
| 18 to 24 Years | 17 (33.3%) | 10 (8.8%) |
| 25 to 34 Years | 9 (23.1%) | 0 (0.0%) |
| 35 to 44 Years | 14 (12.3%) | 15 (28.3%) |
| 45 to 54 Years | 28 (44.4%) | 0 (0.0%) |
| 55 to 64 Years | 0 (0.0%) | 64 (31.2%) |
| 65 to 74 Years | 62 (31.2%) | 67 (46.2%) |
| 75 Years and over | 5 (10.9%) | 5 (7.9%) |
| Total | 187 (25.2%) | 161 (21.7%) |
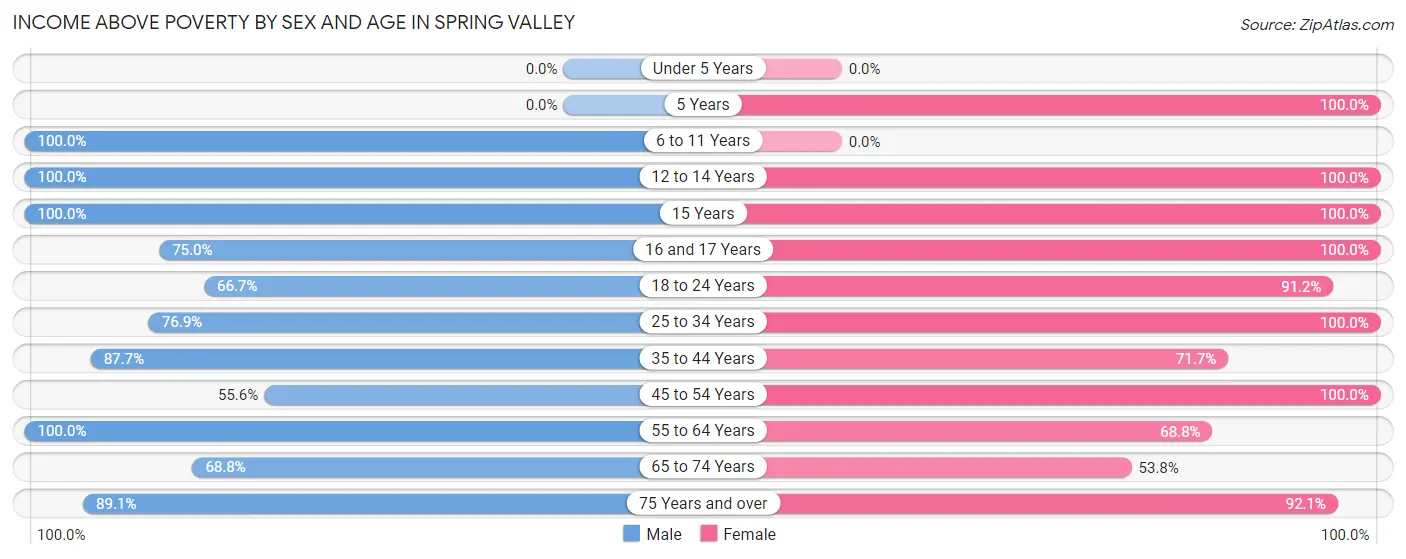
Income Above Poverty by Sex and Age in Spring Valley
According to the poverty statistics in Spring Valley, males aged 6 to 11 years and females aged 5 years are the age groups that are most secure financially, with 100.0% of males and 100.0% of females in these age groups living above the poverty line.
| Age Bracket | Male | Female |
| Under 5 Years | 0 (0.0%) | 0 (0.0%) |
| 5 Years | 0 (0.0%) | 17 (100.0%) |
| 6 to 11 Years | 17 (100.0%) | 0 (0.0%) |
| 12 to 14 Years | 43 (100.0%) | 19 (100.0%) |
| 15 Years | 21 (100.0%) | 12 (100.0%) |
| 16 and 17 Years | 21 (75.0%) | 53 (100.0%) |
| 18 to 24 Years | 34 (66.7%) | 104 (91.2%) |
| 25 to 34 Years | 30 (76.9%) | 23 (100.0%) |
| 35 to 44 Years | 100 (87.7%) | 38 (71.7%) |
| 45 to 54 Years | 35 (55.6%) | 39 (100.0%) |
| 55 to 64 Years | 77 (100.0%) | 141 (68.8%) |
| 65 to 74 Years | 137 (68.8%) | 78 (53.8%) |
| 75 Years and over | 41 (89.1%) | 58 (92.1%) |
| Total | 556 (74.8%) | 582 (78.3%) |
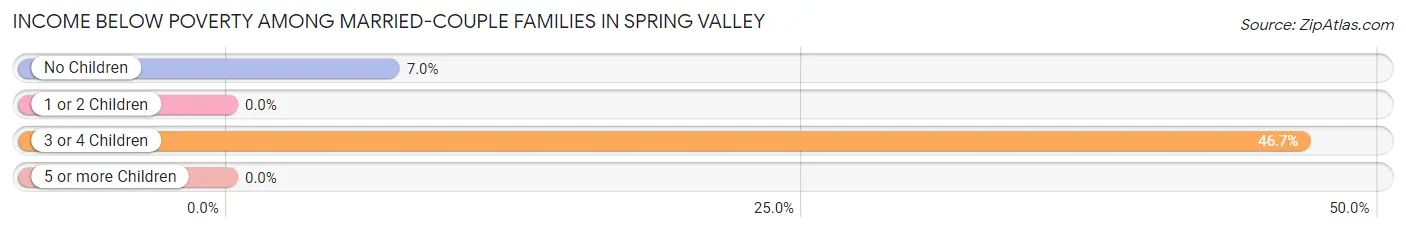
Income Below Poverty Among Married-Couple Families in Spring Valley
The poverty statistics for married-couple families in Spring Valley show that 11.2% or 29 of the total 259 families live below the poverty line. Families with 3 or 4 children have the highest poverty rate of 46.7%, comprising of 14 families. On the other hand, families with 1 or 2 children have the lowest poverty rate of 0.0%, which includes 0 families.
| Children | Above Poverty | Below Poverty |
| No Children | 198 (93.0%) | 15 (7.0%) |
| 1 or 2 Children | 16 (100.0%) | 0 (0.0%) |
| 3 or 4 Children | 16 (53.3%) | 14 (46.7%) |
| 5 or more Children | 0 (0.0%) | 0 (0.0%) |
| Total | 230 (88.8%) | 29 (11.2%) |
Income Below Poverty Among Single-Parent Households in Spring Valley
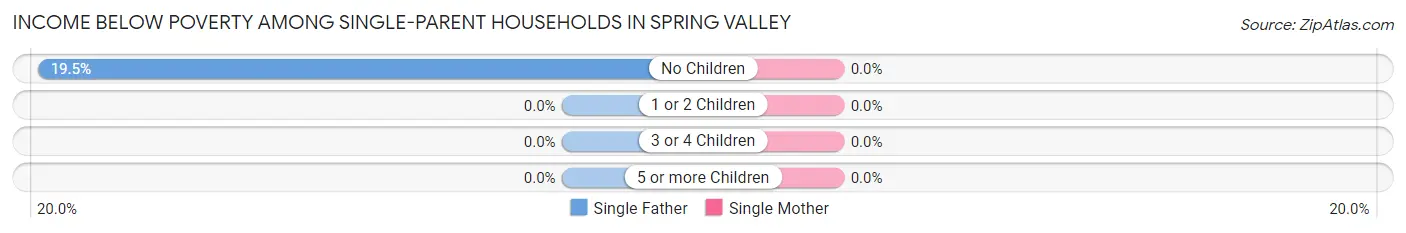
| Children | Single Father | Single Mother |
| No Children | 8 (19.5%) | 0 (0.0%) |
| 1 or 2 Children | 0 (0.0%) | 0 (0.0%) |
| 3 or 4 Children | 0 (0.0%) | 0 (0.0%) |
| 5 or more Children | 0 (0.0%) | 0 (0.0%) |
| Total | 8 (19.5%) | 0 (0.0%) |
Income Below Poverty Among Married-Couple vs Single-Parent Households in Spring Valley
The poverty data for Spring Valley shows that 29 of the married-couple family households (11.2%) and 8 of the single-parent households (10.3%) are living below the poverty level. Within the married-couple family households, those with 3 or 4 children have the highest poverty rate, with 14 households (46.7%) falling below the poverty line. Among the single-parent households, those with no children have the highest poverty rate, with 8 household (19.5%) living below poverty.
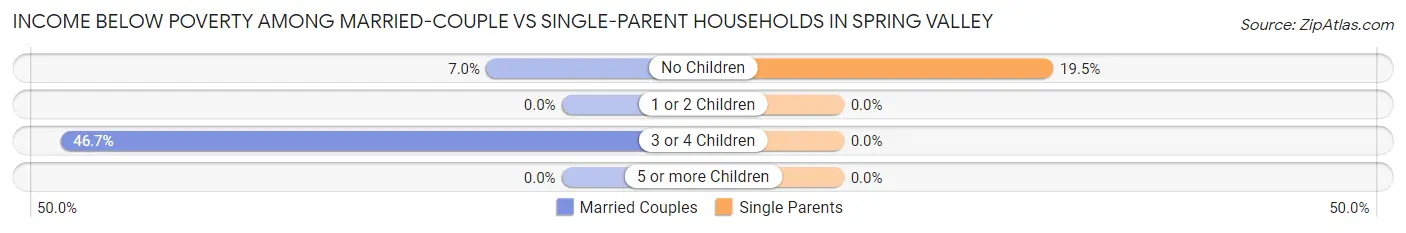
| Children | Married-Couple Families | Single-Parent Households |
| No Children | 15 (7.0%) | 8 (19.5%) |
| 1 or 2 Children | 0 (0.0%) | 0 (0.0%) |
| 3 or 4 Children | 14 (46.7%) | 0 (0.0%) |
| 5 or more Children | 0 (0.0%) | 0 (0.0%) |
| Total | 29 (11.2%) | 8 (10.3%) |
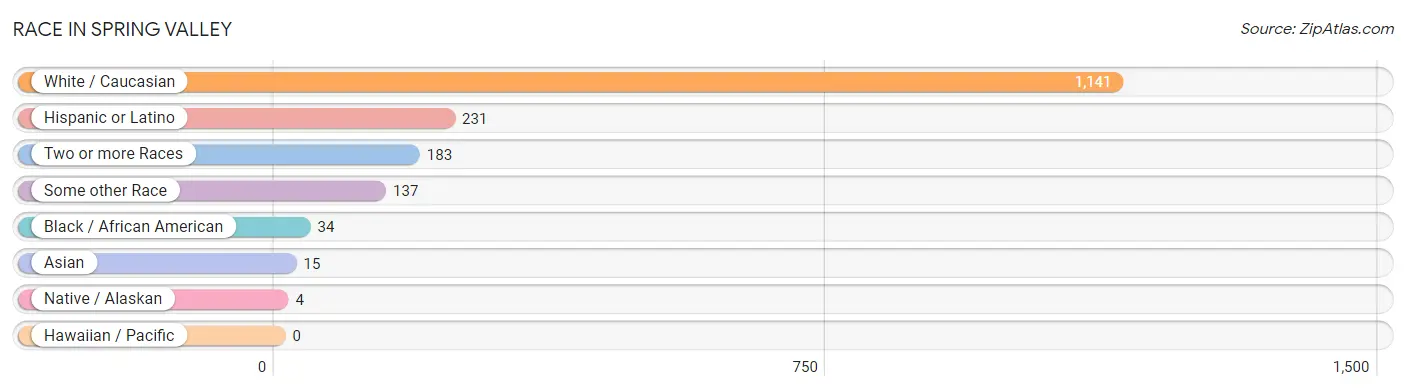
Race in Spring Valley
The most populous races in Spring Valley are White / Caucasian (1,141 | 75.4%), Hispanic or Latino (231 | 15.3%), and Two or more Races (183 | 12.1%).
| Race | # Population | % Population |
| Asian | 15 | 1.0% |
| Black / African American | 34 | 2.2% |
| Hawaiian / Pacific | 0 | 0.0% |
| Hispanic or Latino | 231 | 15.3% |
| Native / Alaskan | 4 | 0.3% |
| White / Caucasian | 1,141 | 75.4% |
| Two or more Races | 183 | 12.1% |
| Some other Race | 137 | 9.0% |
| Total | 1,514 | 100.0% |
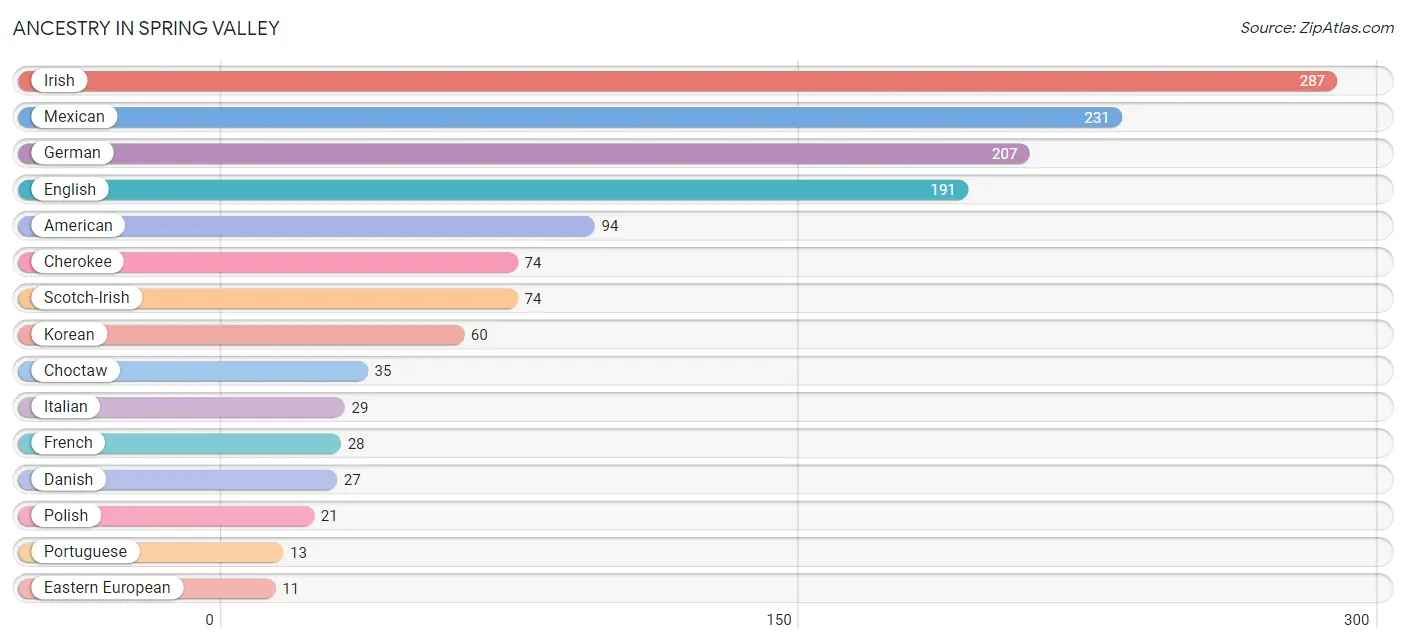
Ancestry in Spring Valley
The most populous ancestries reported in Spring Valley are Irish (287 | 19.0%), Mexican (231 | 15.3%), German (207 | 13.7%), English (191 | 12.6%), and American (94 | 6.2%), together accounting for 66.7% of all Spring Valley residents.
| Ancestry | # Population | % Population |
| American | 94 | 6.2% |
| Apache | 4 | 0.3% |
| Canadian | 10 | 0.7% |
| Cherokee | 74 | 4.9% |
| Choctaw | 35 | 2.3% |
| Danish | 27 | 1.8% |
| Eastern European | 11 | 0.7% |
| English | 191 | 12.6% |
| French | 28 | 1.8% |
| French Canadian | 7 | 0.5% |
| German | 207 | 13.7% |
| Hungarian | 6 | 0.4% |
| Irish | 287 | 19.0% |
| Italian | 29 | 1.9% |
| Korean | 60 | 4.0% |
| Mexican | 231 | 15.3% |
| Polish | 21 | 1.4% |
| Portuguese | 13 | 0.9% |
| Scotch-Irish | 74 | 4.9% |
| Scottish | 8 | 0.5% |
| Swedish | 11 | 0.7% | View All 21 Rows |
Immigrants in Spring Valley
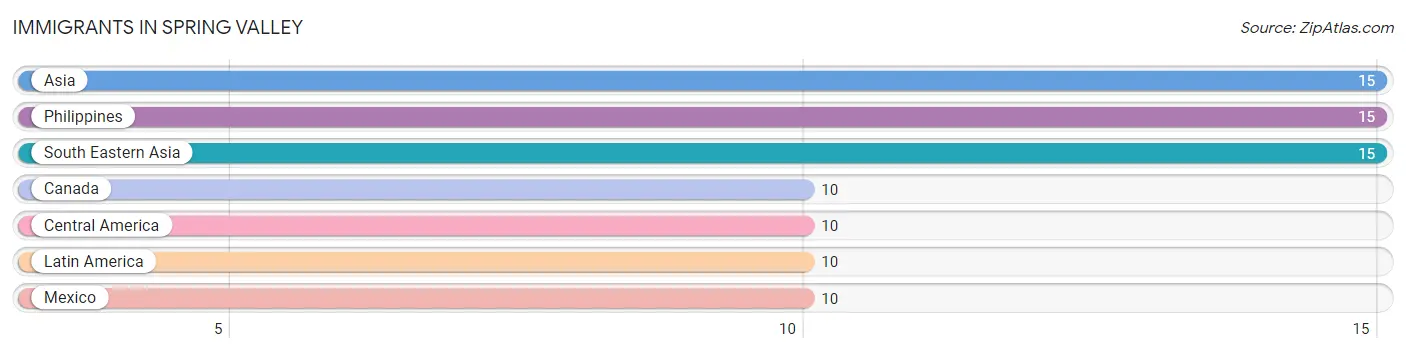
The most numerous immigrant groups reported in Spring Valley came from Asia (15 | 1.0%), Philippines (15 | 1.0%), South Eastern Asia (15 | 1.0%), Canada (10 | 0.7%), and Central America (10 | 0.7%), together accounting for 4.3% of all Spring Valley residents.
| Immigration Origin | # Population | % Population |
| Asia | 15 | 1.0% |
| Canada | 10 | 0.7% |
| Central America | 10 | 0.7% |
| Latin America | 10 | 0.7% |
| Mexico | 10 | 0.7% |
| Philippines | 15 | 1.0% |
| South Eastern Asia | 15 | 1.0% | View All 7 Rows |
Sex and Age in Spring Valley
Sex and Age in Spring Valley
The most populous age groups in Spring Valley are 65 to 69 Years (157 | 21.1%) for men and 15 to 19 Years (150 | 19.5%) for women.
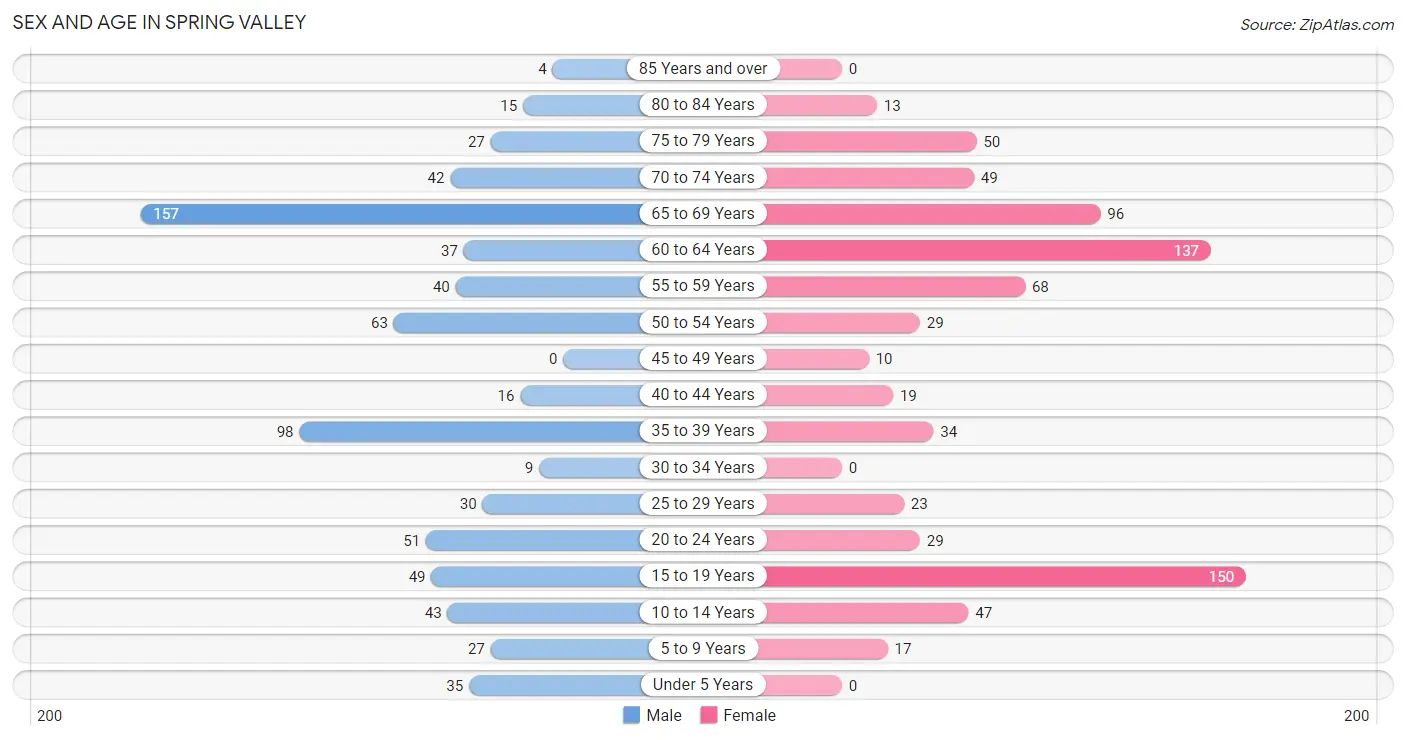
| Age Bracket | Male | Female |
| Under 5 Years | 35 (4.7%) | 0 (0.0%) |
| 5 to 9 Years | 27 (3.6%) | 17 (2.2%) |
| 10 to 14 Years | 43 (5.8%) | 47 (6.1%) |
| 15 to 19 Years | 49 (6.6%) | 150 (19.5%) |
| 20 to 24 Years | 51 (6.9%) | 29 (3.8%) |
| 25 to 29 Years | 30 (4.0%) | 23 (3.0%) |
| 30 to 34 Years | 9 (1.2%) | 0 (0.0%) |
| 35 to 39 Years | 98 (13.2%) | 34 (4.4%) |
| 40 to 44 Years | 16 (2.1%) | 19 (2.5%) |
| 45 to 49 Years | 0 (0.0%) | 10 (1.3%) |
| 50 to 54 Years | 63 (8.5%) | 29 (3.8%) |
| 55 to 59 Years | 40 (5.4%) | 68 (8.8%) |
| 60 to 64 Years | 37 (5.0%) | 137 (17.8%) |
| 65 to 69 Years | 157 (21.1%) | 96 (12.4%) |
| 70 to 74 Years | 42 (5.7%) | 49 (6.4%) |
| 75 to 79 Years | 27 (3.6%) | 50 (6.5%) |
| 80 to 84 Years | 15 (2.0%) | 13 (1.7%) |
| 85 Years and over | 4 (0.5%) | 0 (0.0%) |
| Total | 743 (100.0%) | 771 (100.0%) |
Families and Households in Spring Valley
Median Family Size in Spring Valley
The median family size in Spring Valley is 3.39 persons per family, with single female/mother families (37 | 11.0%) accounting for the largest median family size of 6.57 persons per family. On the other hand, single male/father families (41 | 12.2%) represent the smallest median family size with 2.59 persons per family.
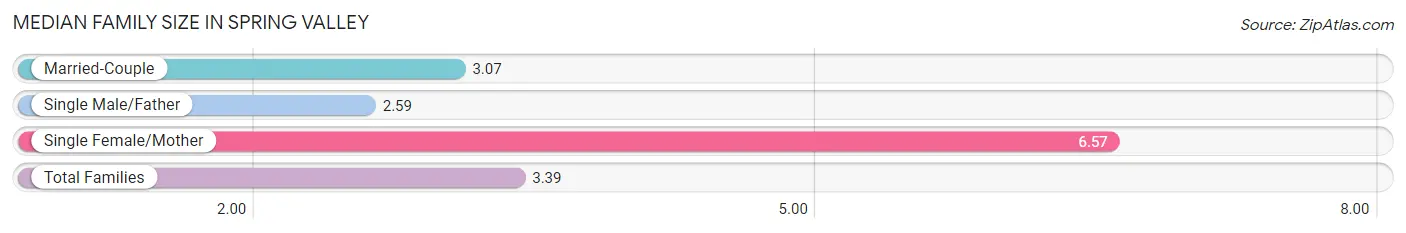
| Family Type | # Families | Family Size |
| Married-Couple | 259 (76.8%) | 3.07 |
| Single Male/Father | 41 (12.2%) | 2.59 |
| Single Female/Mother | 37 (11.0%) | 6.57 |
| Total Families | 337 (100.0%) | 3.39 |
Median Household Size in Spring Valley
The median household size in Spring Valley is 2.56 persons per household, with single female/mother households (37 | 6.2%) accounting for the largest median household size of 7.32 persons per household. non-family households (255 | 43.1%) represent the smallest median household size with 1.16 persons per household.
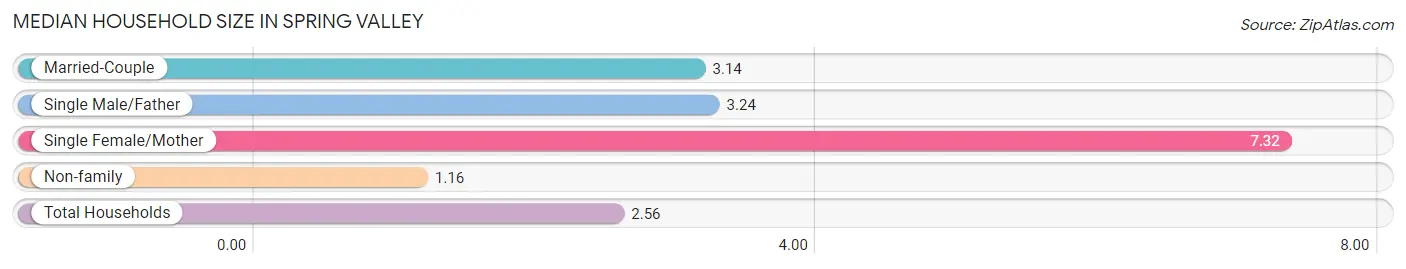
| Household Type | # Households | Household Size |
| Married-Couple | 259 (43.8%) | 3.14 |
| Single Male/Father | 41 (6.9%) | 3.24 |
| Single Female/Mother | 37 (6.2%) | 7.32 |
| Non-family | 255 (43.1%) | 1.16 |
| Total Households | 592 (100.0%) | 2.56 |
Household Size by Marriage Status in Spring Valley
Out of a total of 592 households in Spring Valley, 337 (56.9%) are family households, while 255 (43.1%) are nonfamily households. The most numerous type of family households are 2-person households, comprising 185, and the most common type of nonfamily households are 1-person households, comprising 213.
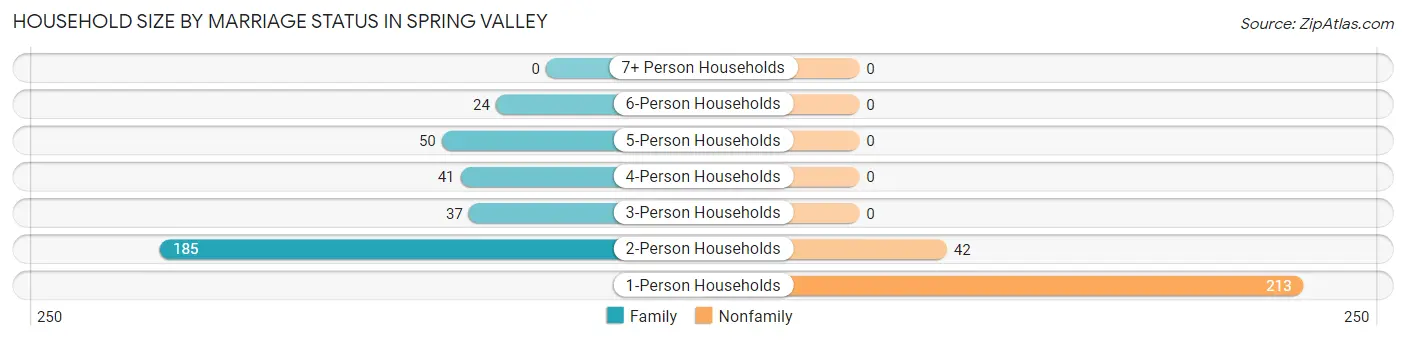
| Household Size | Family Households | Nonfamily Households |
| 1-Person Households | - | 213 (36.0%) |
| 2-Person Households | 185 (31.2%) | 42 (7.1%) |
| 3-Person Households | 37 (6.2%) | 0 (0.0%) |
| 4-Person Households | 41 (6.9%) | 0 (0.0%) |
| 5-Person Households | 50 (8.5%) | 0 (0.0%) |
| 6-Person Households | 24 (4.1%) | 0 (0.0%) |
| 7+ Person Households | 0 (0.0%) | 0 (0.0%) |
| Total | 337 (56.9%) | 255 (43.1%) |
Female Fertility in Spring Valley
Fertility by Age in Spring Valley
| Age Bracket | Women with Births | Births / 1,000 Women |
| 15 to 19 years | 0 (0.0%) | 0.0 |
| 20 to 34 years | 0 (0.0%) | 0.0 |
| 35 to 50 years | 0 (0.0%) | 0.0 |
| Total | 0 (0.0%) | 0.0 |
Fertility by Age by Marriage Status in Spring Valley
| Age Bracket | Married | Unmarried |
| 15 to 19 years | 0 (0.0%) | 0 (0.0%) |
| 20 to 34 years | 0 (0.0%) | 0 (0.0%) |
| 35 to 50 years | 0 (0.0%) | 0 (0.0%) |
| Total | 0 (0.0%) | 0 (0.0%) |
Fertility by Education in Spring Valley
| Educational Attainment | Women with Births | Births / 1,000 Women |
| Less than High School | 0 (0.0%) | 0.0 |
| High School Diploma | 0 (0.0%) | 0.0 |
| College or Associate's Degree | 0 (0.0%) | 0.0 |
| Bachelor's Degree | 0 (0.0%) | 0.0 |
| Graduate Degree | 0 (0.0%) | 0.0 |
| Total | 0 (0.0%) | 0.0 |
Fertility by Education by Marriage Status in Spring Valley
| Educational Attainment | Married | Unmarried |
| Less than High School | 0 (0.0%) | 0 (0.0%) |
| High School Diploma | 0 (0.0%) | 0 (0.0%) |
| College or Associate's Degree | 0 (0.0%) | 0 (0.0%) |
| Bachelor's Degree | 0 (0.0%) | 0 (0.0%) |
| Graduate Degree | 0 (0.0%) | 0 (0.0%) |
| Total | 0 (0.0%) | 0 (0.0%) |
Employment Characteristics in Spring Valley
Employment by Class of Employer in Spring Valley
Among the 451 employed individuals in Spring Valley, private company employees (215 | 47.7%), self-employed (not incorporated) (71 | 15.7%), and local government employees (71 | 15.7%) make up the most common classes of employment.
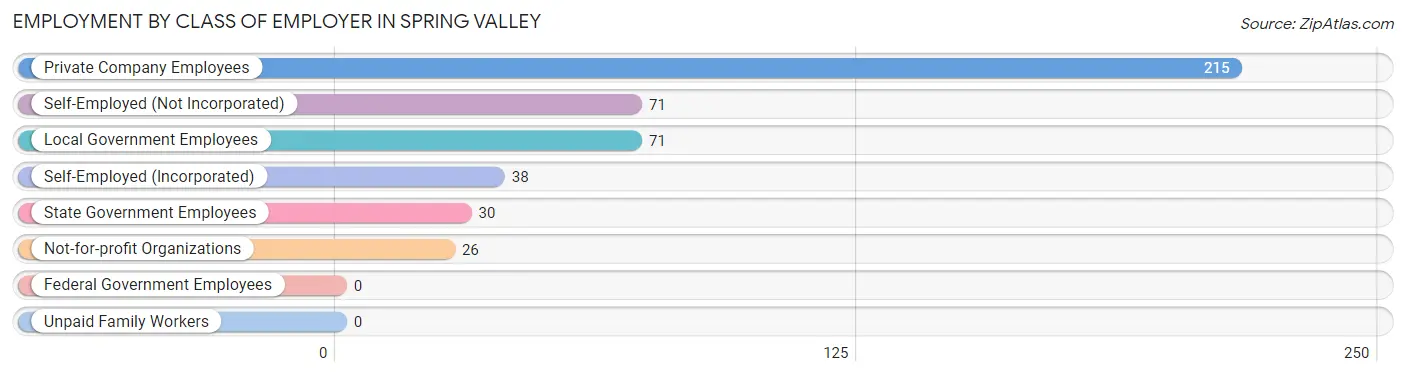
| Employer Class | # Employees | % Employees |
| Private Company Employees | 215 | 47.7% |
| Self-Employed (Incorporated) | 38 | 8.4% |
| Self-Employed (Not Incorporated) | 71 | 15.7% |
| Not-for-profit Organizations | 26 | 5.8% |
| Local Government Employees | 71 | 15.7% |
| State Government Employees | 30 | 6.7% |
| Federal Government Employees | 0 | 0.0% |
| Unpaid Family Workers | 0 | 0.0% |
| Total | 451 | 100.0% |
Employment Status by Age in Spring Valley
According to the labor force statistics for Spring Valley, out of the total population over 16 years of age (1,312), 35.1% or 461 individuals are in the labor force, with 2.2% or 10 of them unemployed. The age group with the highest labor force participation rate is 20 to 24 years, with 100.0% or 80 individuals in the labor force. Within the labor force, the 20 to 24 years age range has the highest percentage of unemployed individuals, with 12.5% or 10 of them being unemployed.
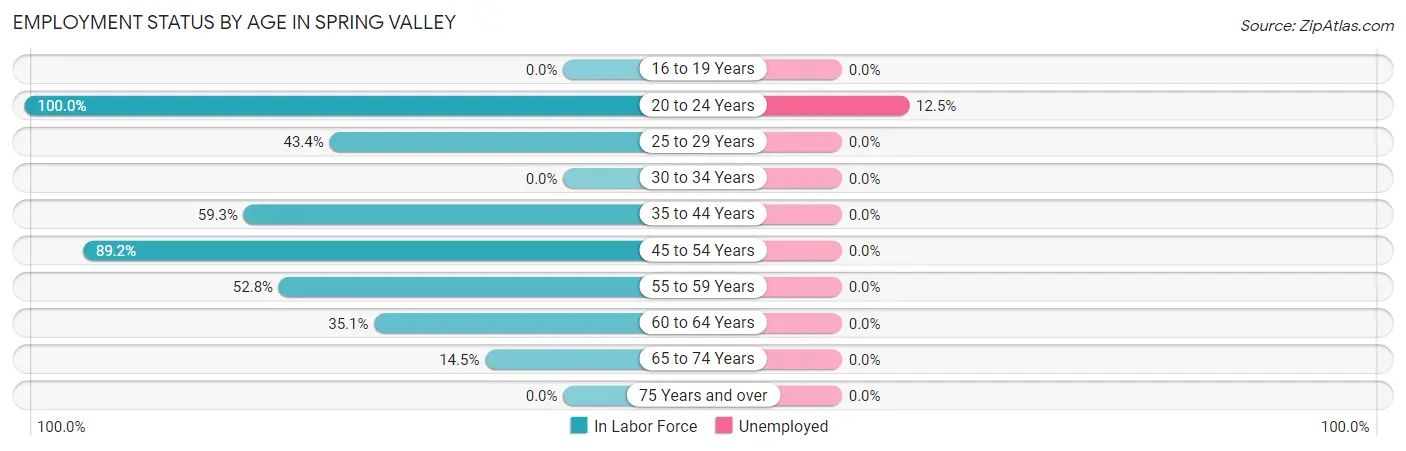
| Age Bracket | In Labor Force | Unemployed |
| 16 to 19 Years | 0 (0.0%) | 0 (0.0%) |
| 20 to 24 Years | 80 (100.0%) | 10 (12.5%) |
| 25 to 29 Years | 23 (43.4%) | 0 (0.0%) |
| 30 to 34 Years | 0 (0.0%) | 0 (0.0%) |
| 35 to 44 Years | 99 (59.3%) | 0 (0.0%) |
| 45 to 54 Years | 91 (89.2%) | 0 (0.0%) |
| 55 to 59 Years | 57 (52.8%) | 0 (0.0%) |
| 60 to 64 Years | 61 (35.1%) | 0 (0.0%) |
| 65 to 74 Years | 50 (14.5%) | 0 (0.0%) |
| 75 Years and over | 0 (0.0%) | 0 (0.0%) |
| Total | 461 (35.1%) | 10 (2.2%) |
Employment Status by Educational Attainment in Spring Valley
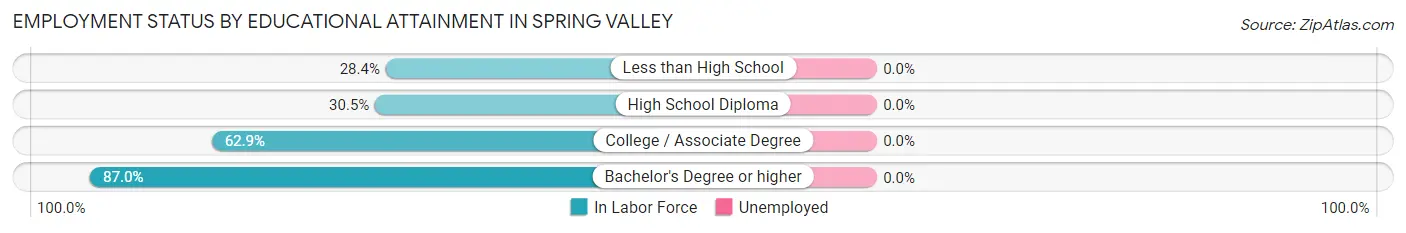
| Educational Attainment | In Labor Force | Unemployed |
| Less than High School | 21 (28.4%) | 0 (0.0%) |
| High School Diploma | 57 (30.5%) | 0 (0.0%) |
| College / Associate Degree | 139 (62.9%) | 0 (0.0%) |
| Bachelor's Degree or higher | 114 (87.0%) | 0 (0.0%) |
| Total | 331 (54.0%) | 0 (0.0%) |
Employment Occupations by Sex in Spring Valley
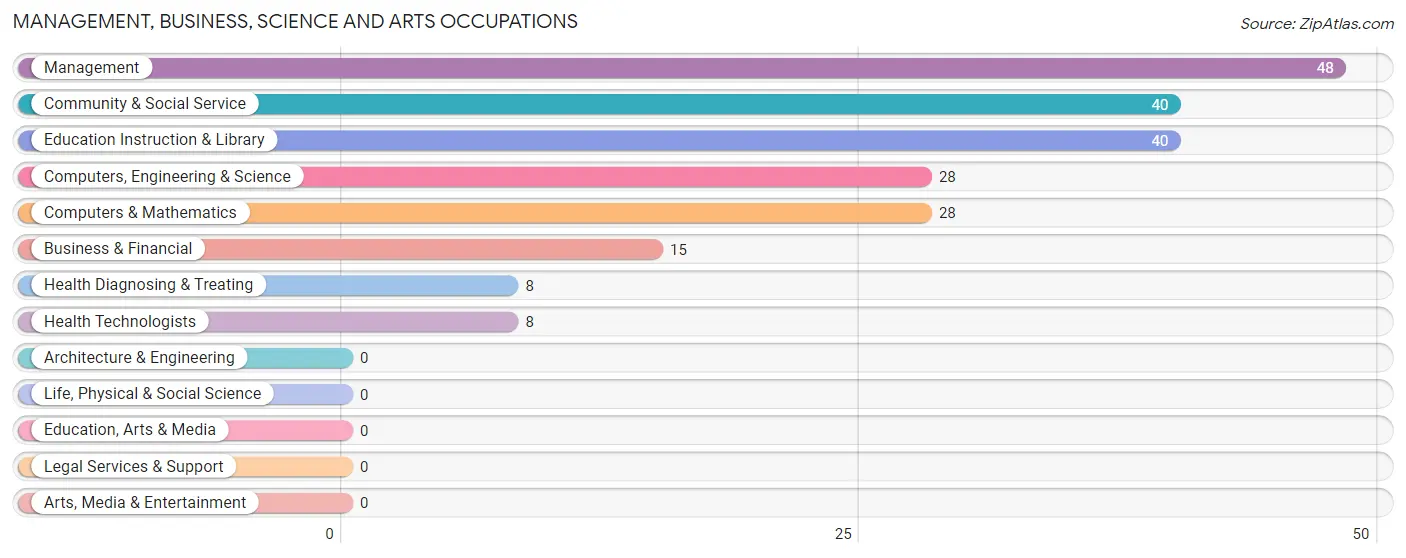
Management, Business, Science and Arts Occupations
The most common Management, Business, Science and Arts occupations in Spring Valley are Management (48 | 10.6%), Community & Social Service (40 | 8.9%), Education Instruction & Library (40 | 8.9%), Computers, Engineering & Science (28 | 6.2%), and Computers & Mathematics (28 | 6.2%).
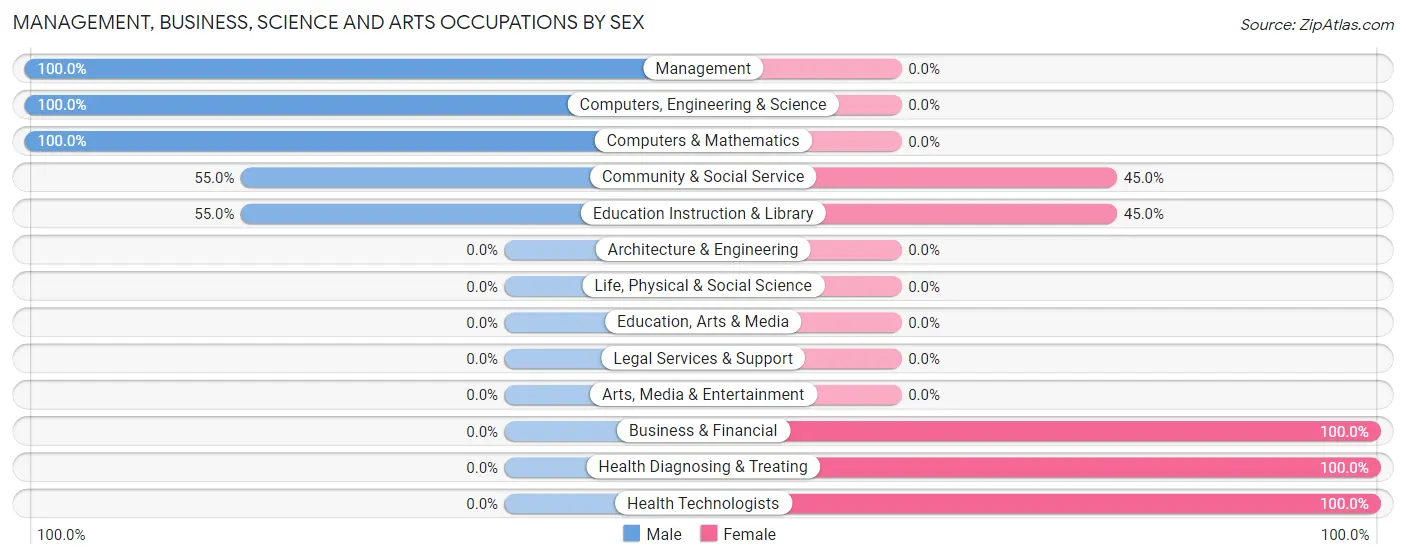
Management, Business, Science and Arts Occupations by Sex
Within the Management, Business, Science and Arts occupations in Spring Valley, the most male-oriented occupations are Management (100.0%), Computers, Engineering & Science (100.0%), and Computers & Mathematics (100.0%), while the most female-oriented occupations are Business & Financial (100.0%), Health Diagnosing & Treating (100.0%), and Health Technologists (100.0%).
| Occupation | Male | Female |
| Management | 48 (100.0%) | 0 (0.0%) |
| Business & Financial | 0 (0.0%) | 15 (100.0%) |
| Computers, Engineering & Science | 28 (100.0%) | 0 (0.0%) |
| Computers & Mathematics | 28 (100.0%) | 0 (0.0%) |
| Architecture & Engineering | 0 (0.0%) | 0 (0.0%) |
| Life, Physical & Social Science | 0 (0.0%) | 0 (0.0%) |
| Community & Social Service | 22 (55.0%) | 18 (45.0%) |
| Education, Arts & Media | 0 (0.0%) | 0 (0.0%) |
| Legal Services & Support | 0 (0.0%) | 0 (0.0%) |
| Education Instruction & Library | 22 (55.0%) | 18 (45.0%) |
| Arts, Media & Entertainment | 0 (0.0%) | 0 (0.0%) |
| Health Diagnosing & Treating | 0 (0.0%) | 8 (100.0%) |
| Health Technologists | 0 (0.0%) | 8 (100.0%) |
| Total (Category) | 98 (70.5%) | 41 (29.5%) |
| Total (Overall) | 287 (63.6%) | 164 (36.4%) |
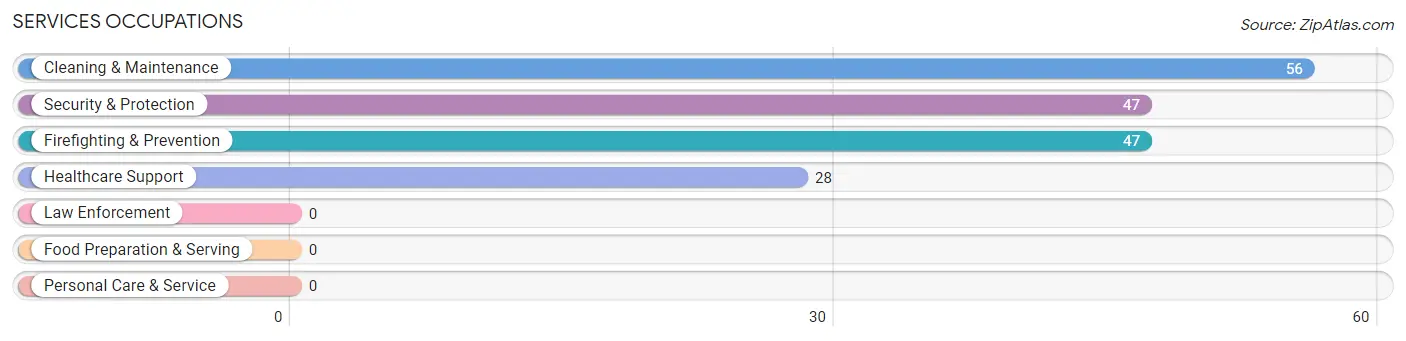
Services Occupations
The most common Services occupations in Spring Valley are Cleaning & Maintenance (56 | 12.4%), Security & Protection (47 | 10.4%), Firefighting & Prevention (47 | 10.4%), and Healthcare Support (28 | 6.2%).
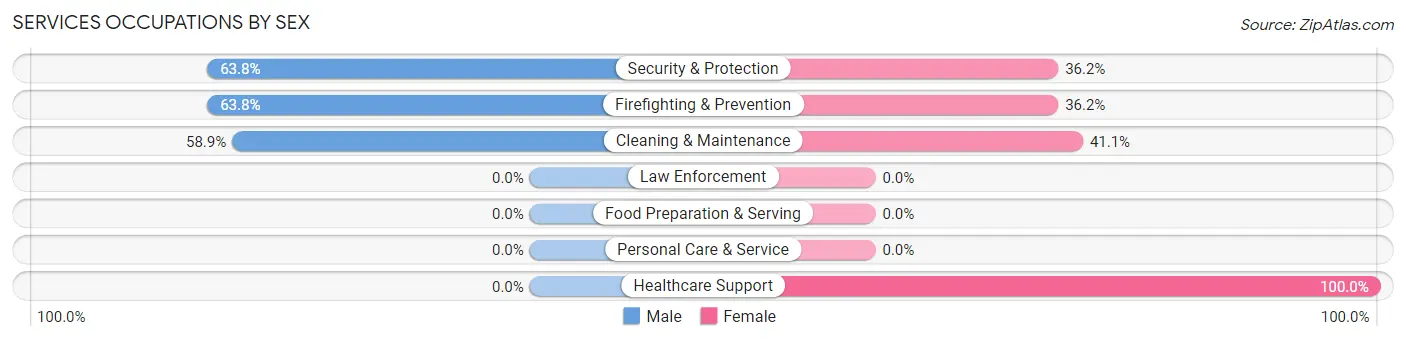
Services Occupations by Sex
Within the Services occupations in Spring Valley, the most male-oriented occupations are Security & Protection (63.8%), Firefighting & Prevention (63.8%), and Cleaning & Maintenance (58.9%), while the most female-oriented occupations are Healthcare Support (100.0%), Cleaning & Maintenance (41.1%), and Security & Protection (36.2%).
| Occupation | Male | Female |
| Healthcare Support | 0 (0.0%) | 28 (100.0%) |
| Security & Protection | 30 (63.8%) | 17 (36.2%) |
| Firefighting & Prevention | 30 (63.8%) | 17 (36.2%) |
| Law Enforcement | 0 (0.0%) | 0 (0.0%) |
| Food Preparation & Serving | 0 (0.0%) | 0 (0.0%) |
| Cleaning & Maintenance | 33 (58.9%) | 23 (41.1%) |
| Personal Care & Service | 0 (0.0%) | 0 (0.0%) |
| Total (Category) | 63 (48.1%) | 68 (51.9%) |
| Total (Overall) | 287 (63.6%) | 164 (36.4%) |
Sales and Office Occupations
The most common Sales and Office occupations in Spring Valley are Office & Administration (49 | 10.9%), and Sales & Related (23 | 5.1%).
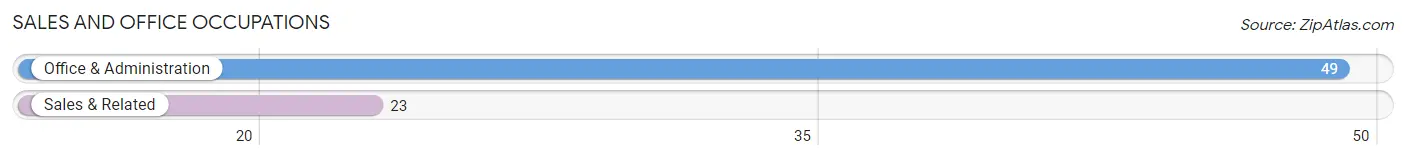
Sales and Office Occupations by Sex
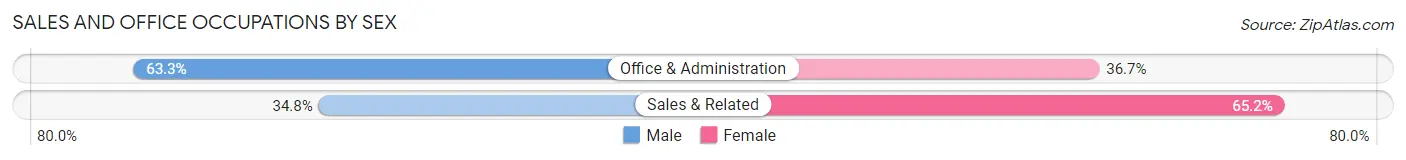
| Occupation | Male | Female |
| Sales & Related | 8 (34.8%) | 15 (65.2%) |
| Office & Administration | 31 (63.3%) | 18 (36.7%) |
| Total (Category) | 39 (54.2%) | 33 (45.8%) |
| Total (Overall) | 287 (63.6%) | 164 (36.4%) |
Natural Resources, Construction and Maintenance Occupations
The most common Natural Resources, Construction and Maintenance occupations in Spring Valley are , and Installation, Maintenance & Repair (19 | 4.2%).
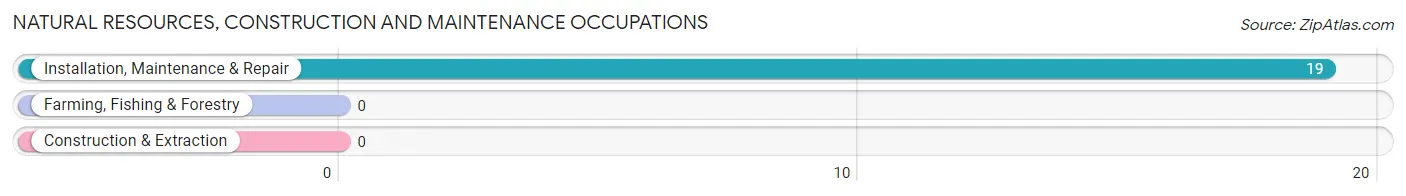
Natural Resources, Construction and Maintenance Occupations by Sex
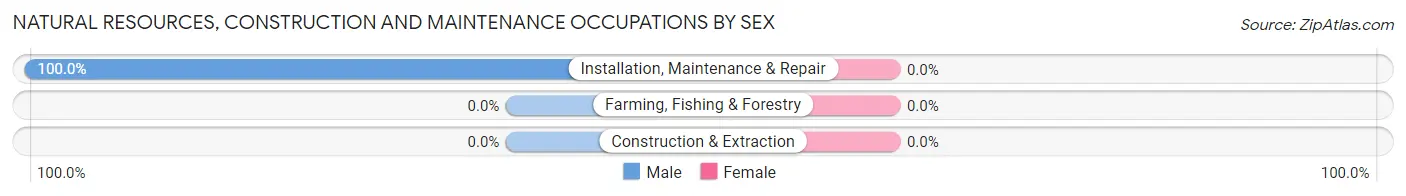
| Occupation | Male | Female |
| Farming, Fishing & Forestry | 0 (0.0%) | 0 (0.0%) |
| Construction & Extraction | 0 (0.0%) | 0 (0.0%) |
| Installation, Maintenance & Repair | 19 (100.0%) | 0 (0.0%) |
| Total (Category) | 19 (100.0%) | 0 (0.0%) |
| Total (Overall) | 287 (63.6%) | 164 (36.4%) |
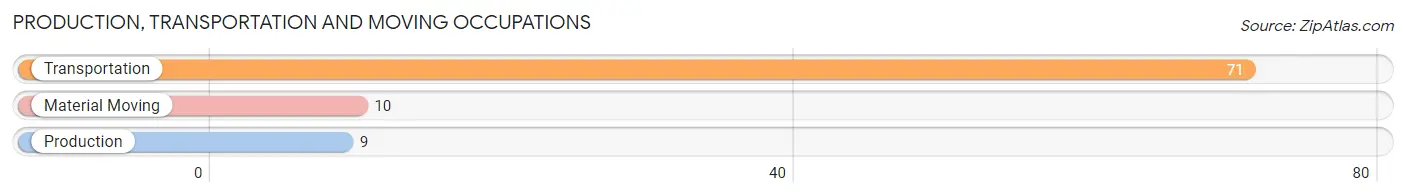
Production, Transportation and Moving Occupations
The most common Production, Transportation and Moving occupations in Spring Valley are Transportation (71 | 15.7%), Material Moving (10 | 2.2%), and Production (9 | 2.0%).
Production, Transportation and Moving Occupations by Sex
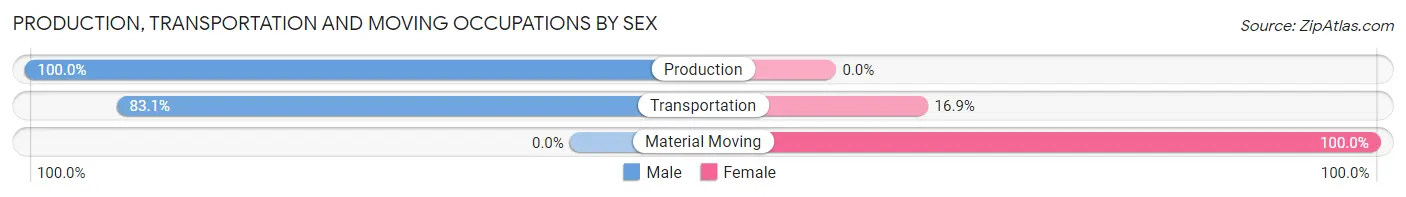
| Occupation | Male | Female |
| Production | 9 (100.0%) | 0 (0.0%) |
| Transportation | 59 (83.1%) | 12 (16.9%) |
| Material Moving | 0 (0.0%) | 10 (100.0%) |
| Total (Category) | 68 (75.6%) | 22 (24.4%) |
| Total (Overall) | 287 (63.6%) | 164 (36.4%) |
Employment Industries by Sex in Spring Valley
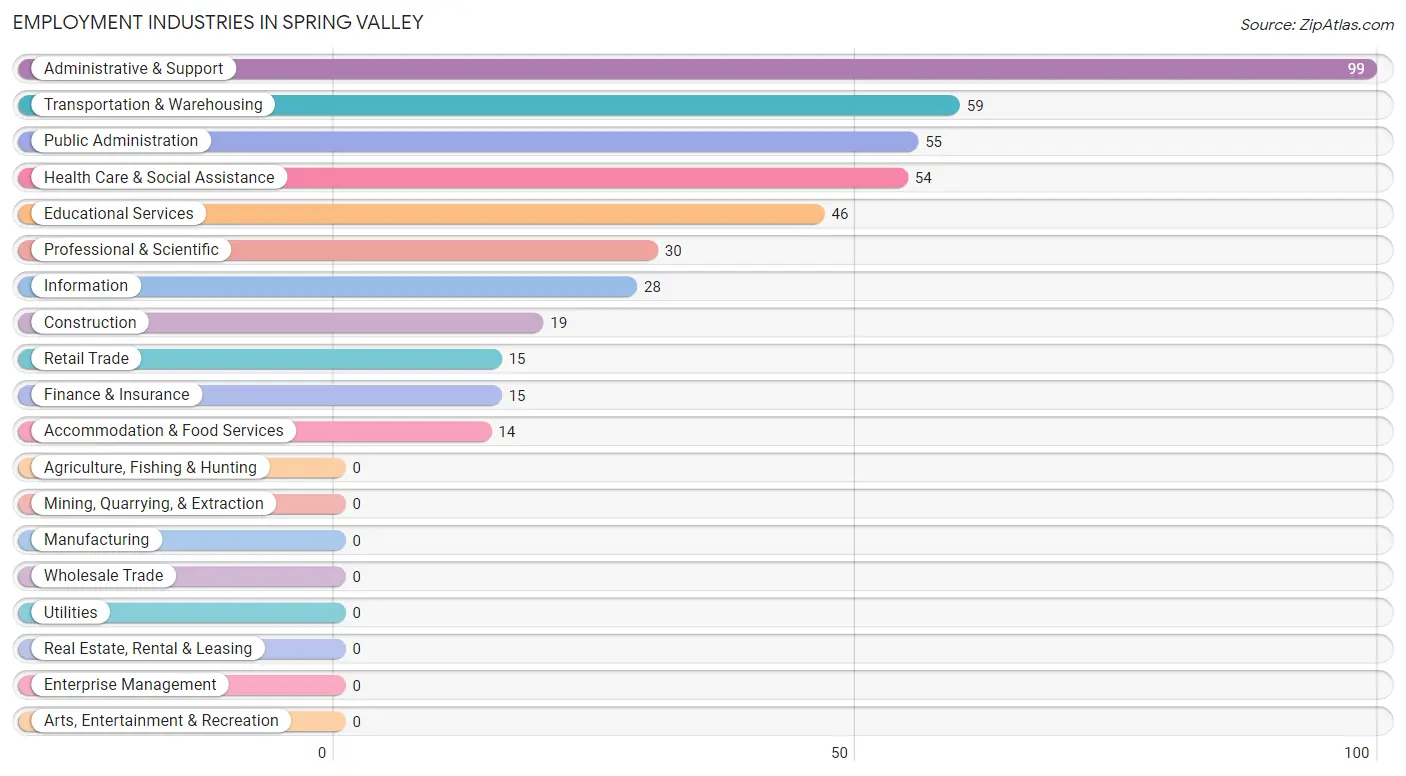
Employment Industries in Spring Valley
The major employment industries in Spring Valley include Administrative & Support (99 | 22.0%), Transportation & Warehousing (59 | 13.1%), Public Administration (55 | 12.2%), Health Care & Social Assistance (54 | 12.0%), and Educational Services (46 | 10.2%).
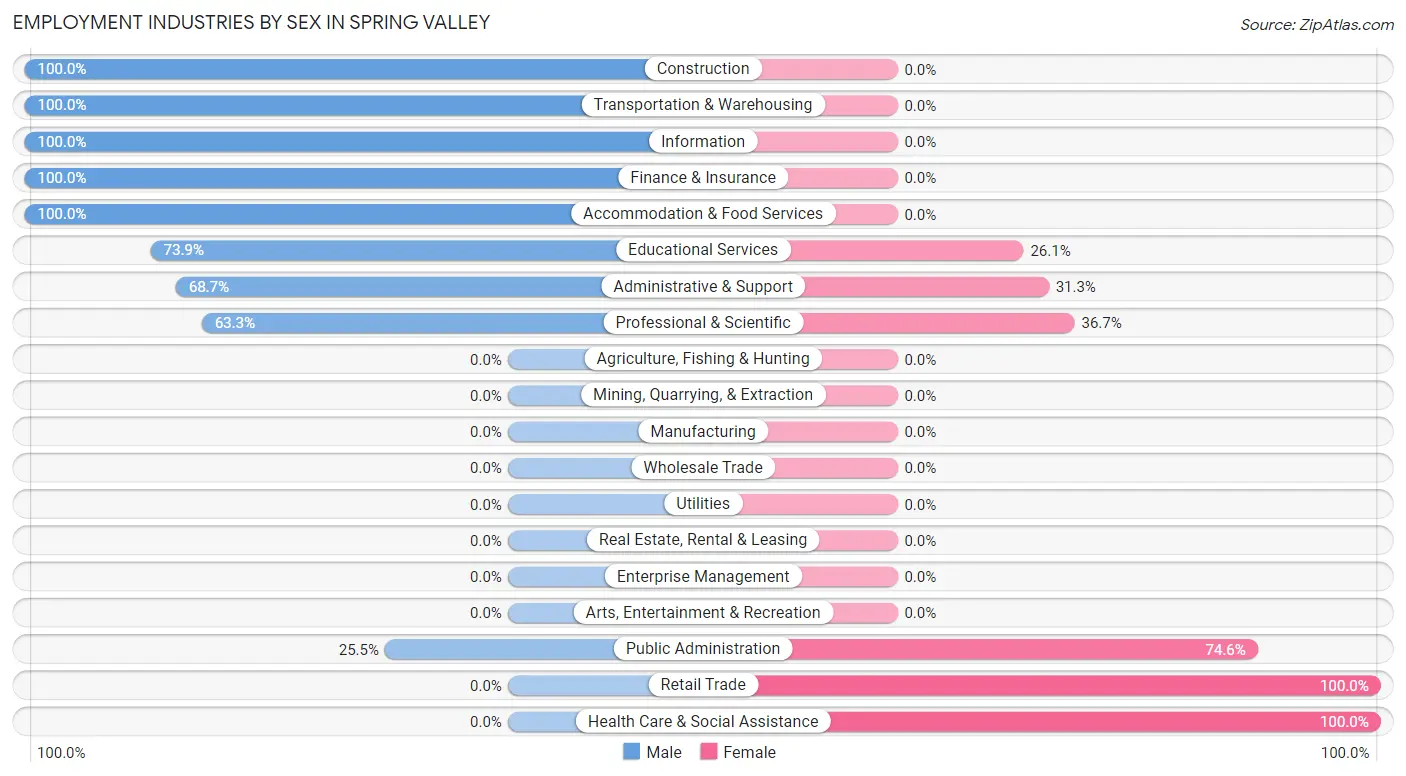
Employment Industries by Sex in Spring Valley
The Spring Valley industries that see more men than women are Construction (100.0%), Transportation & Warehousing (100.0%), and Information (100.0%), whereas the industries that tend to have a higher number of women are Retail Trade (100.0%), Health Care & Social Assistance (100.0%), and Public Administration (74.6%).
| Industry | Male | Female |
| Agriculture, Fishing & Hunting | 0 (0.0%) | 0 (0.0%) |
| Mining, Quarrying, & Extraction | 0 (0.0%) | 0 (0.0%) |
| Construction | 19 (100.0%) | 0 (0.0%) |
| Manufacturing | 0 (0.0%) | 0 (0.0%) |
| Wholesale Trade | 0 (0.0%) | 0 (0.0%) |
| Retail Trade | 0 (0.0%) | 15 (100.0%) |
| Transportation & Warehousing | 59 (100.0%) | 0 (0.0%) |
| Utilities | 0 (0.0%) | 0 (0.0%) |
| Information | 28 (100.0%) | 0 (0.0%) |
| Finance & Insurance | 15 (100.0%) | 0 (0.0%) |
| Real Estate, Rental & Leasing | 0 (0.0%) | 0 (0.0%) |
| Professional & Scientific | 19 (63.3%) | 11 (36.7%) |
| Enterprise Management | 0 (0.0%) | 0 (0.0%) |
| Administrative & Support | 68 (68.7%) | 31 (31.3%) |
| Educational Services | 34 (73.9%) | 12 (26.1%) |
| Health Care & Social Assistance | 0 (0.0%) | 54 (100.0%) |
| Arts, Entertainment & Recreation | 0 (0.0%) | 0 (0.0%) |
| Accommodation & Food Services | 14 (100.0%) | 0 (0.0%) |
| Public Administration | 14 (25.5%) | 41 (74.6%) |
| Total | 287 (63.6%) | 164 (36.4%) |
Education in Spring Valley
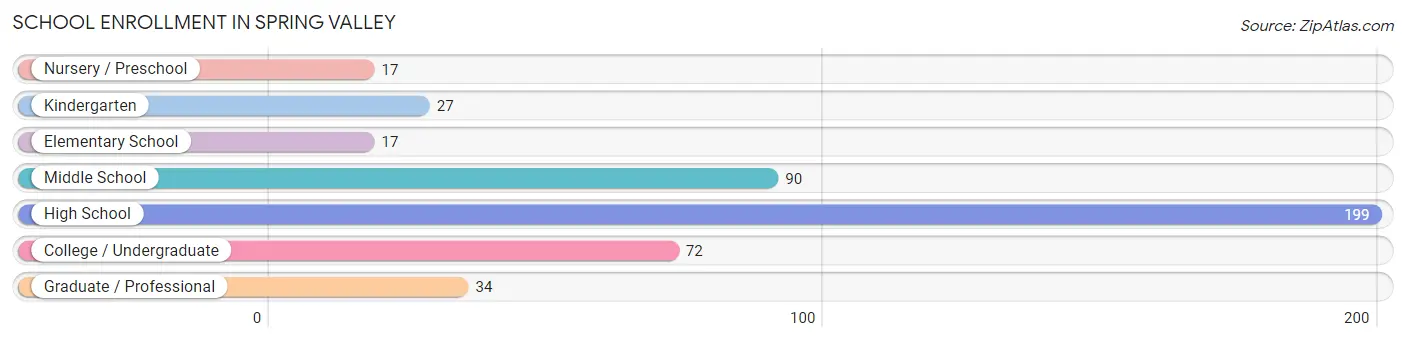
School Enrollment in Spring Valley
The most common levels of schooling among the 456 students in Spring Valley are high school (199 | 43.6%), middle school (90 | 19.7%), and college / undergraduate (72 | 15.8%).
| School Level | # Students | % Students |
| Nursery / Preschool | 17 | 3.7% |
| Kindergarten | 27 | 5.9% |
| Elementary School | 17 | 3.7% |
| Middle School | 90 | 19.7% |
| High School | 199 | 43.6% |
| College / Undergraduate | 72 | 15.8% |
| Graduate / Professional | 34 | 7.5% |
| Total | 456 | 100.0% |
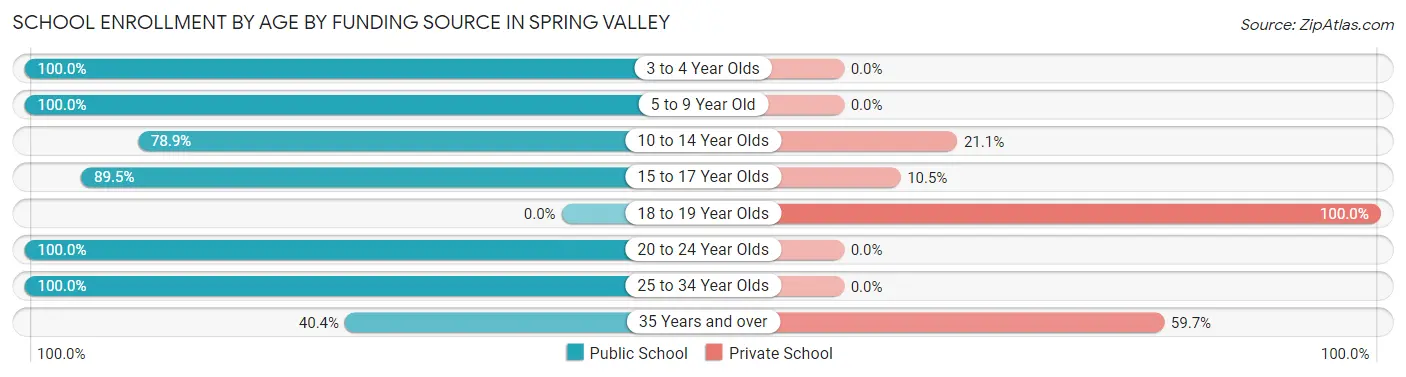
School Enrollment by Age by Funding Source in Spring Valley
Out of a total of 456 students who are enrolled in schools in Spring Valley, 150 (32.9%) attend a private institution, while the remaining 306 (67.1%) are enrolled in public schools. The age group of 18 to 19 year olds has the highest likelihood of being enrolled in private schools, with 85 (100.0% in the age bracket) enrolled. Conversely, the age group of 3 to 4 year olds has the lowest likelihood of being enrolled in a private school, with 17 (100.0% in the age bracket) attending a public institution.
| Age Bracket | Public School | Private School |
| 3 to 4 Year Olds | 17 (100.0%) | 0 (0.0%) |
| 5 to 9 Year Old | 44 (100.0%) | 0 (0.0%) |
| 10 to 14 Year Olds | 71 (78.9%) | 19 (21.1%) |
| 15 to 17 Year Olds | 102 (89.5%) | 12 (10.5%) |
| 18 to 19 Year Olds | 0 (0.0%) | 85 (100.0%) |
| 20 to 24 Year Olds | 19 (100.0%) | 0 (0.0%) |
| 25 to 34 Year Olds | 30 (100.0%) | 0 (0.0%) |
| 35 Years and over | 23 (40.4%) | 34 (59.7%) |
| Total | 306 (67.1%) | 150 (32.9%) |
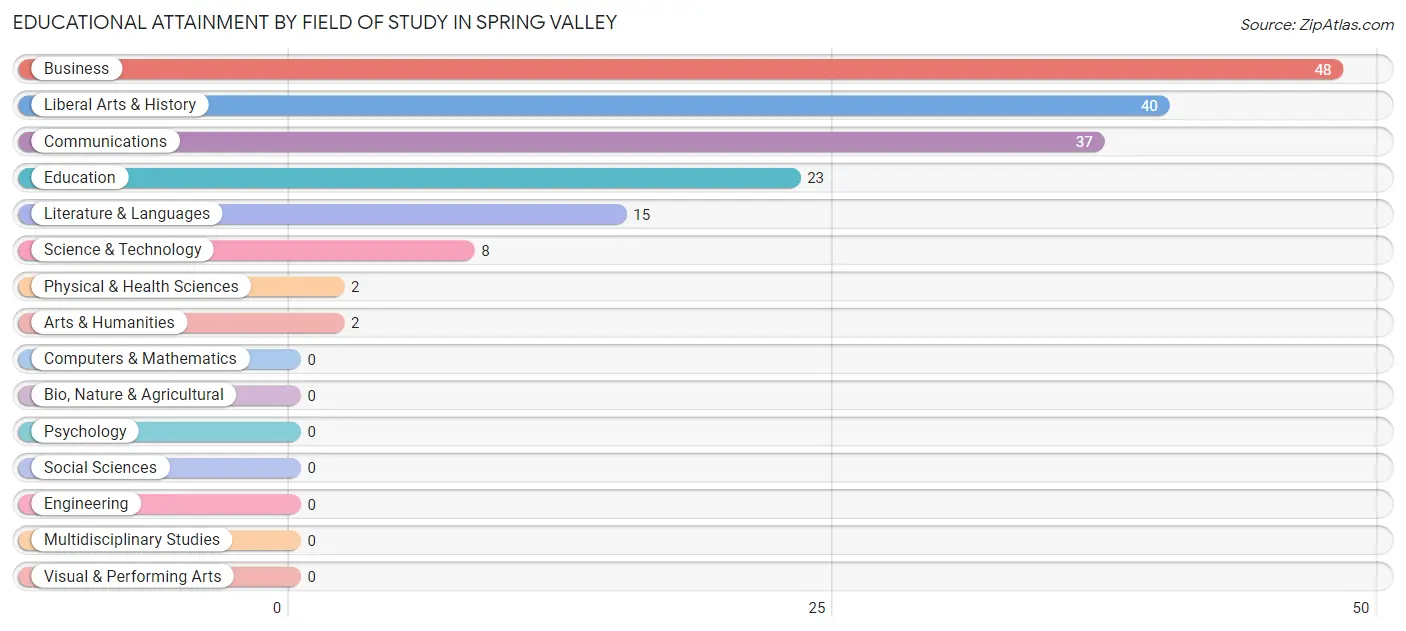
Educational Attainment by Field of Study in Spring Valley
Business (48 | 27.4%), liberal arts & history (40 | 22.9%), communications (37 | 21.1%), education (23 | 13.1%), and literature & languages (15 | 8.6%) are the most common fields of study among 175 individuals in Spring Valley who have obtained a bachelor's degree or higher.
| Field of Study | # Graduates | % Graduates |
| Computers & Mathematics | 0 | 0.0% |
| Bio, Nature & Agricultural | 0 | 0.0% |
| Physical & Health Sciences | 2 | 1.1% |
| Psychology | 0 | 0.0% |
| Social Sciences | 0 | 0.0% |
| Engineering | 0 | 0.0% |
| Multidisciplinary Studies | 0 | 0.0% |
| Science & Technology | 8 | 4.6% |
| Business | 48 | 27.4% |
| Education | 23 | 13.1% |
| Literature & Languages | 15 | 8.6% |
| Liberal Arts & History | 40 | 22.9% |
| Visual & Performing Arts | 0 | 0.0% |
| Communications | 37 | 21.1% |
| Arts & Humanities | 2 | 1.1% |
| Total | 175 | 100.0% |
Transportation & Commute in Spring Valley
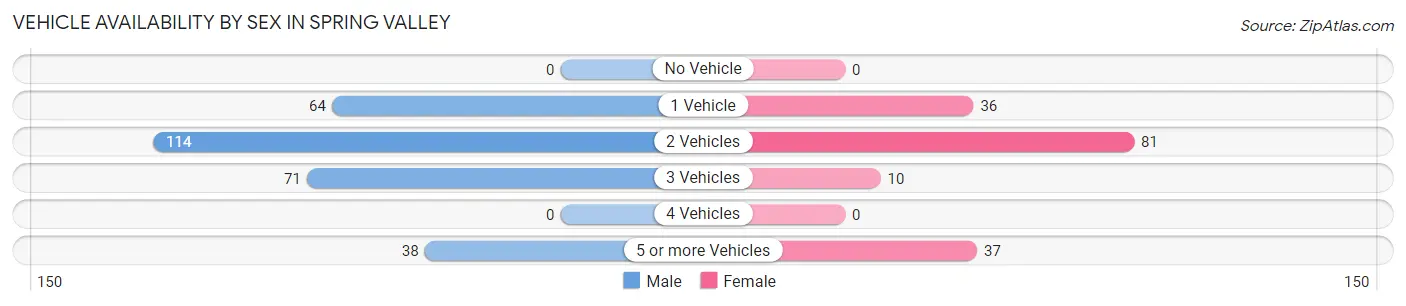
Vehicle Availability by Sex in Spring Valley
The most prevalent vehicle ownership categories in Spring Valley are males with 2 vehicles (114, accounting for 39.7%) and females with 2 vehicles (81, making up 69.5%).
| Vehicles Available | Male | Female |
| No Vehicle | 0 (0.0%) | 0 (0.0%) |
| 1 Vehicle | 64 (22.3%) | 36 (22.0%) |
| 2 Vehicles | 114 (39.7%) | 81 (49.4%) |
| 3 Vehicles | 71 (24.7%) | 10 (6.1%) |
| 4 Vehicles | 0 (0.0%) | 0 (0.0%) |
| 5 or more Vehicles | 38 (13.2%) | 37 (22.6%) |
| Total | 287 (100.0%) | 164 (100.0%) |
Commute Time in Spring Valley
The most frequently occuring commute durations in Spring Valley are 60 to 89 minutes (109 commuters, 25.8%), 5 to 9 minutes (52 commuters, 12.3%), and 10 to 14 minutes (51 commuters, 12.1%).
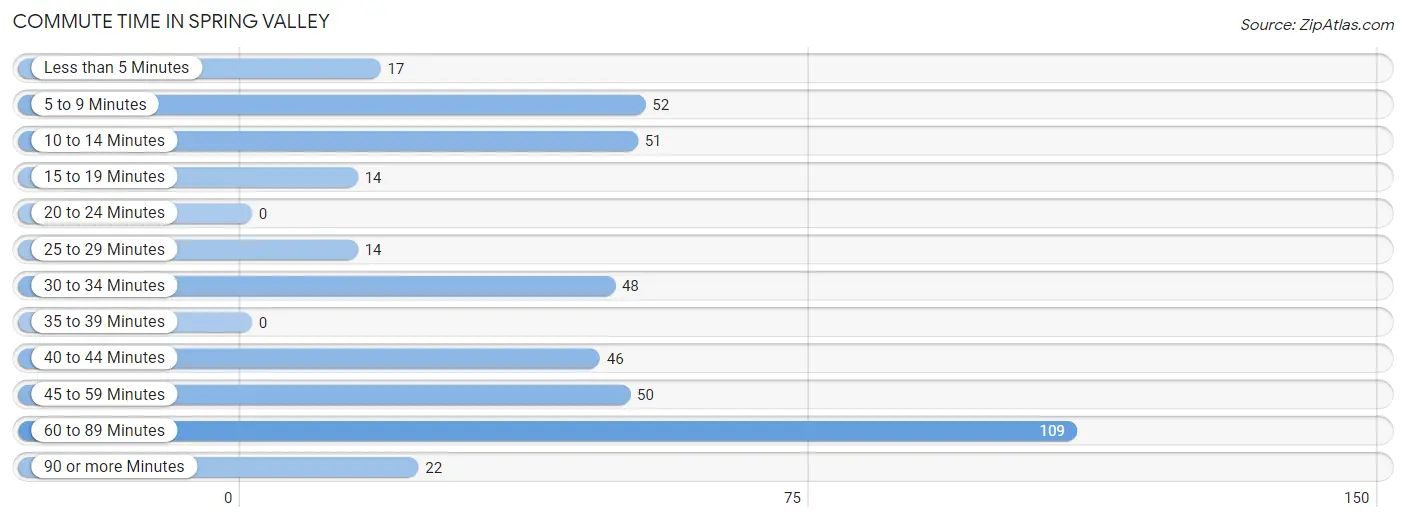
| Commute Time | # Commuters | % Commuters |
| Less than 5 Minutes | 17 | 4.0% |
| 5 to 9 Minutes | 52 | 12.3% |
| 10 to 14 Minutes | 51 | 12.1% |
| 15 to 19 Minutes | 14 | 3.3% |
| 20 to 24 Minutes | 0 | 0.0% |
| 25 to 29 Minutes | 14 | 3.3% |
| 30 to 34 Minutes | 48 | 11.4% |
| 35 to 39 Minutes | 0 | 0.0% |
| 40 to 44 Minutes | 46 | 10.9% |
| 45 to 59 Minutes | 50 | 11.8% |
| 60 to 89 Minutes | 109 | 25.8% |
| 90 or more Minutes | 22 | 5.2% |
Commute Time by Sex in Spring Valley
The most common commute times in Spring Valley are 60 to 89 minutes (80 commuters, 30.9%) for males and 45 to 59 minutes (50 commuters, 30.5%) for females.
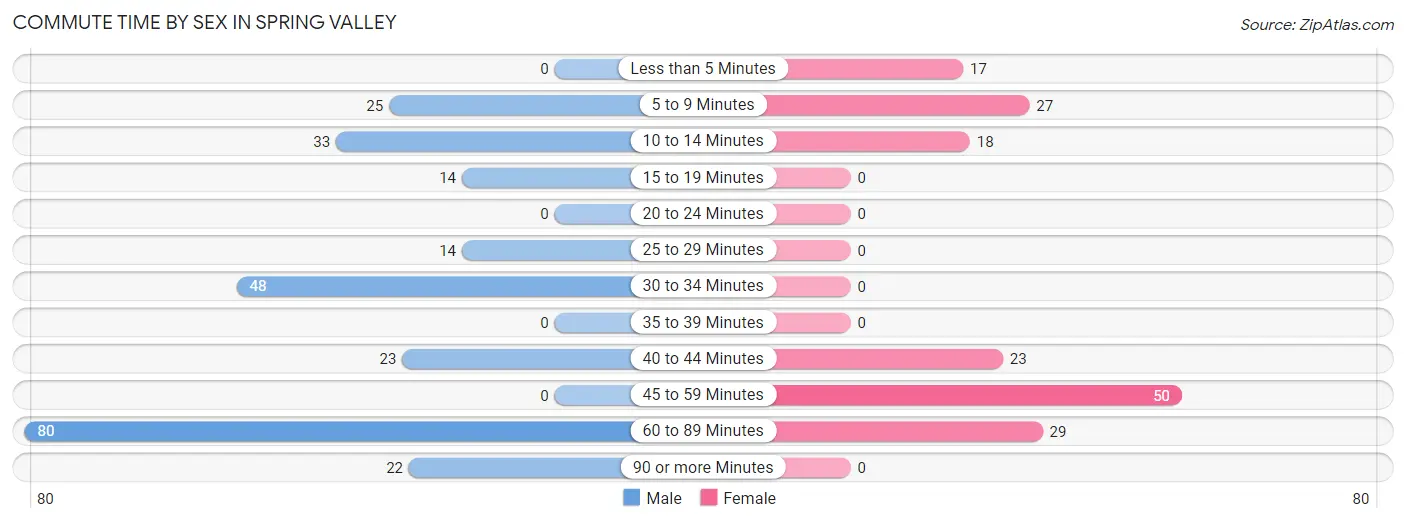
| Commute Time | Male | Female |
| Less than 5 Minutes | 0 (0.0%) | 17 (10.4%) |
| 5 to 9 Minutes | 25 (9.7%) | 27 (16.5%) |
| 10 to 14 Minutes | 33 (12.7%) | 18 (11.0%) |
| 15 to 19 Minutes | 14 (5.4%) | 0 (0.0%) |
| 20 to 24 Minutes | 0 (0.0%) | 0 (0.0%) |
| 25 to 29 Minutes | 14 (5.4%) | 0 (0.0%) |
| 30 to 34 Minutes | 48 (18.5%) | 0 (0.0%) |
| 35 to 39 Minutes | 0 (0.0%) | 0 (0.0%) |
| 40 to 44 Minutes | 23 (8.9%) | 23 (14.0%) |
| 45 to 59 Minutes | 0 (0.0%) | 50 (30.5%) |
| 60 to 89 Minutes | 80 (30.9%) | 29 (17.7%) |
| 90 or more Minutes | 22 (8.5%) | 0 (0.0%) |
Time of Departure to Work by Sex in Spring Valley
The most frequent times of departure to work in Spring Valley are 8:00 AM to 8:29 AM (45, 17.4%) for males and 7:00 AM to 7:29 AM (52, 31.7%) for females.
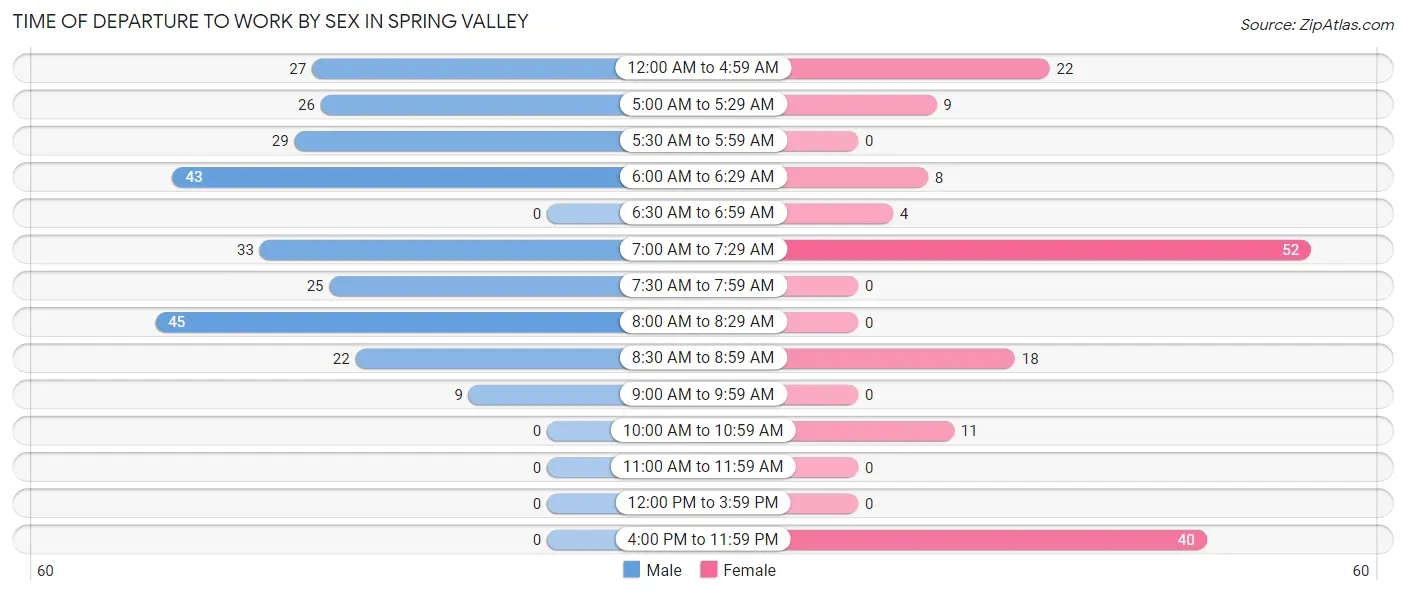
| Time of Departure | Male | Female |
| 12:00 AM to 4:59 AM | 27 (10.4%) | 22 (13.4%) |
| 5:00 AM to 5:29 AM | 26 (10.0%) | 9 (5.5%) |
| 5:30 AM to 5:59 AM | 29 (11.2%) | 0 (0.0%) |
| 6:00 AM to 6:29 AM | 43 (16.6%) | 8 (4.9%) |
| 6:30 AM to 6:59 AM | 0 (0.0%) | 4 (2.4%) |
| 7:00 AM to 7:29 AM | 33 (12.7%) | 52 (31.7%) |
| 7:30 AM to 7:59 AM | 25 (9.7%) | 0 (0.0%) |
| 8:00 AM to 8:29 AM | 45 (17.4%) | 0 (0.0%) |
| 8:30 AM to 8:59 AM | 22 (8.5%) | 18 (11.0%) |
| 9:00 AM to 9:59 AM | 9 (3.5%) | 0 (0.0%) |
| 10:00 AM to 10:59 AM | 0 (0.0%) | 11 (6.7%) |
| 11:00 AM to 11:59 AM | 0 (0.0%) | 0 (0.0%) |
| 12:00 PM to 3:59 PM | 0 (0.0%) | 0 (0.0%) |
| 4:00 PM to 11:59 PM | 0 (0.0%) | 40 (24.4%) |
| Total | 259 (100.0%) | 164 (100.0%) |
Housing Occupancy in Spring Valley
Occupancy by Ownership in Spring Valley
Of the total 592 dwellings in Spring Valley, owner-occupied units account for 451 (76.2%), while renter-occupied units make up 141 (23.8%).
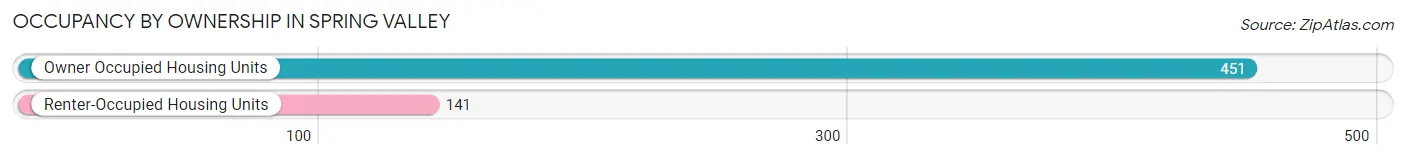
| Occupancy | # Housing Units | % Housing Units |
| Owner Occupied Housing Units | 451 | 76.2% |
| Renter-Occupied Housing Units | 141 | 23.8% |
| Total Occupied Housing Units | 592 | 100.0% |
Occupancy by Household Size in Spring Valley
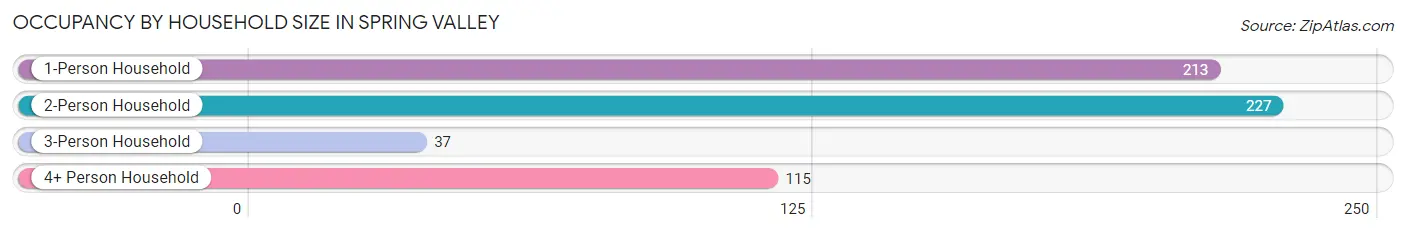
| Household Size | # Housing Units | % Housing Units |
| 1-Person Household | 213 | 36.0% |
| 2-Person Household | 227 | 38.3% |
| 3-Person Household | 37 | 6.2% |
| 4+ Person Household | 115 | 19.4% |
| Total Housing Units | 592 | 100.0% |
Occupancy by Ownership by Household Size in Spring Valley
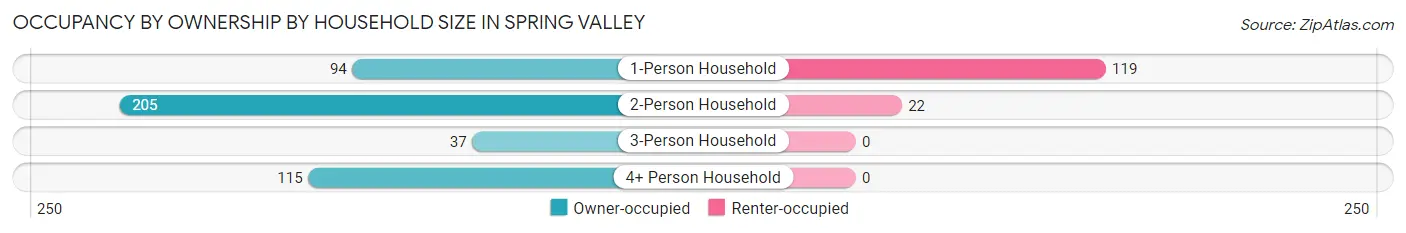
| Household Size | Owner-occupied | Renter-occupied |
| 1-Person Household | 94 (44.1%) | 119 (55.9%) |
| 2-Person Household | 205 (90.3%) | 22 (9.7%) |
| 3-Person Household | 37 (100.0%) | 0 (0.0%) |
| 4+ Person Household | 115 (100.0%) | 0 (0.0%) |
| Total Housing Units | 451 (76.2%) | 141 (23.8%) |
Occupancy by Educational Attainment in Spring Valley
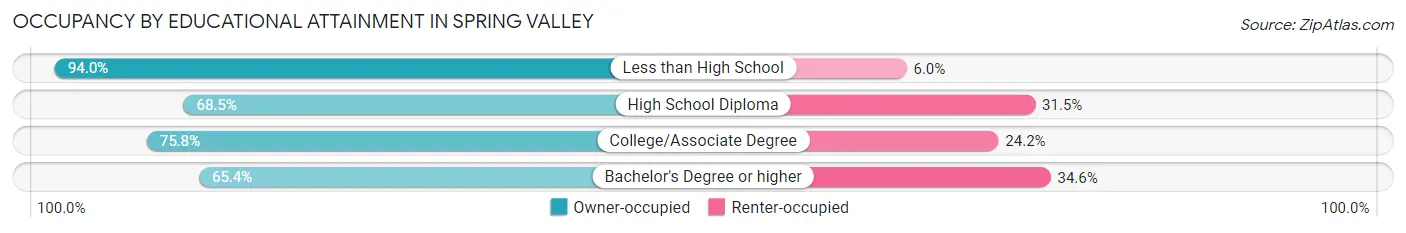
| Household Size | Owner-occupied | Renter-occupied |
| Less than High School | 125 (94.0%) | 8 (6.0%) |
| High School Diploma | 126 (68.5%) | 58 (31.5%) |
| College/Associate Degree | 147 (75.8%) | 47 (24.2%) |
| Bachelor's Degree or higher | 53 (65.4%) | 28 (34.6%) |
Occupancy by Age of Householder in Spring Valley
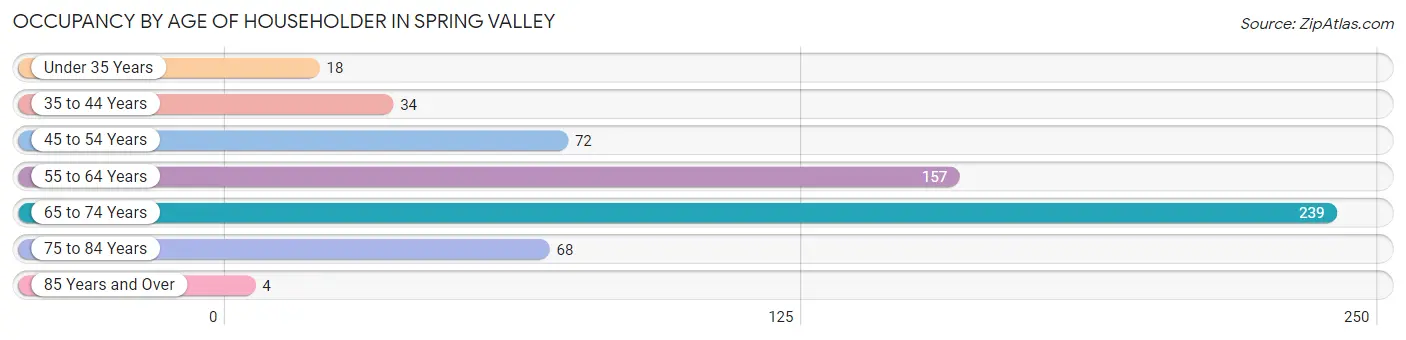
| Age Bracket | # Households | % Households |
| Under 35 Years | 18 | 3.0% |
| 35 to 44 Years | 34 | 5.7% |
| 45 to 54 Years | 72 | 12.2% |
| 55 to 64 Years | 157 | 26.5% |
| 65 to 74 Years | 239 | 40.4% |
| 75 to 84 Years | 68 | 11.5% |
| 85 Years and Over | 4 | 0.7% |
| Total | 592 | 100.0% |
Housing Finances in Spring Valley
Median Income by Occupancy in Spring Valley
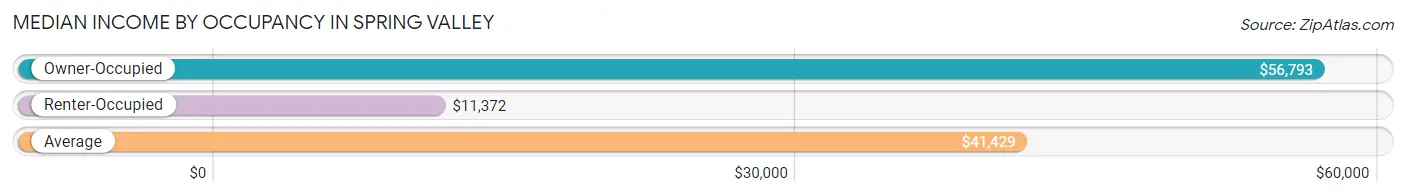
| Occupancy Type | # Households | Median Income |
| Owner-Occupied | 451 (76.2%) | $56,793 |
| Renter-Occupied | 141 (23.8%) | $11,372 |
| Average | 592 (100.0%) | $41,429 |
Occupancy by Householder Income Bracket in Spring Valley
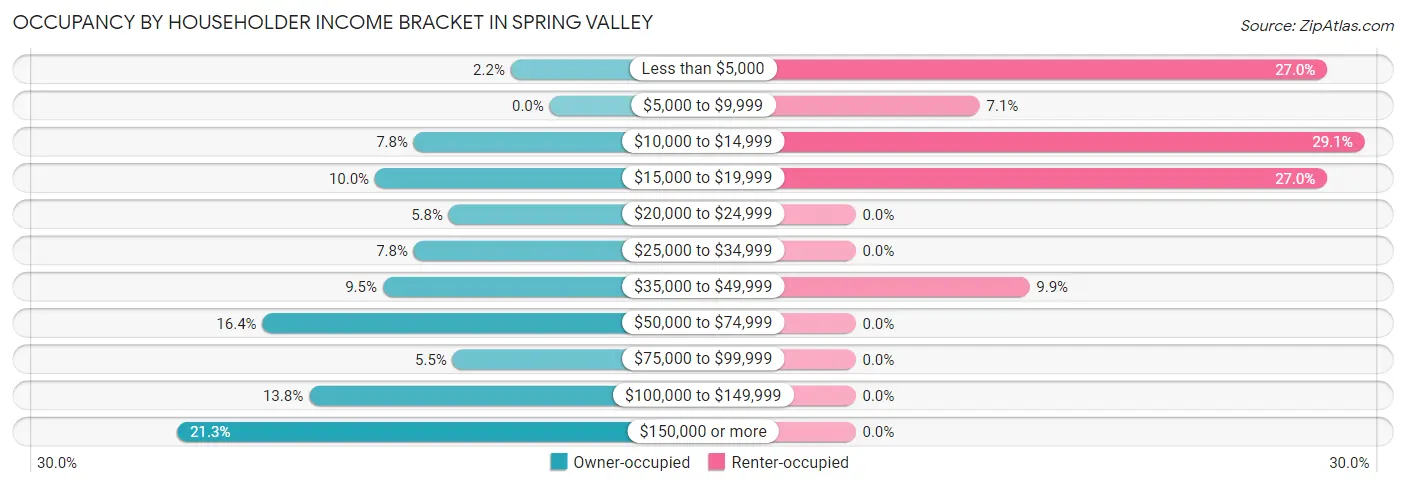
| Income Bracket | Owner-occupied | Renter-occupied |
| Less than $5,000 | 10 (2.2%) | 38 (27.0%) |
| $5,000 to $9,999 | 0 (0.0%) | 10 (7.1%) |
| $10,000 to $14,999 | 35 (7.8%) | 41 (29.1%) |
| $15,000 to $19,999 | 45 (10.0%) | 38 (27.0%) |
| $20,000 to $24,999 | 26 (5.8%) | 0 (0.0%) |
| $25,000 to $34,999 | 35 (7.8%) | 0 (0.0%) |
| $35,000 to $49,999 | 43 (9.5%) | 14 (9.9%) |
| $50,000 to $74,999 | 74 (16.4%) | 0 (0.0%) |
| $75,000 to $99,999 | 25 (5.5%) | 0 (0.0%) |
| $100,000 to $149,999 | 62 (13.8%) | 0 (0.0%) |
| $150,000 or more | 96 (21.3%) | 0 (0.0%) |
| Total | 451 (100.0%) | 141 (100.0%) |
Monthly Housing Cost Tiers in Spring Valley
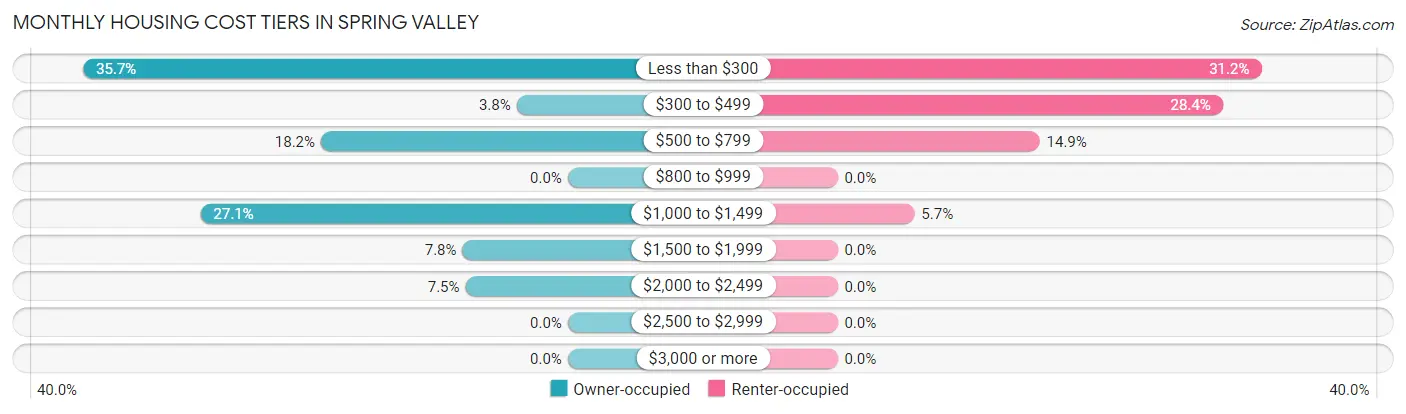
| Monthly Cost | Owner-occupied | Renter-occupied |
| Less than $300 | 161 (35.7%) | 44 (31.2%) |
| $300 to $499 | 17 (3.8%) | 40 (28.4%) |
| $500 to $799 | 82 (18.2%) | 21 (14.9%) |
| $800 to $999 | 0 (0.0%) | 0 (0.0%) |
| $1,000 to $1,499 | 122 (27.1%) | 8 (5.7%) |
| $1,500 to $1,999 | 35 (7.8%) | 0 (0.0%) |
| $2,000 to $2,499 | 34 (7.5%) | 0 (0.0%) |
| $2,500 to $2,999 | 0 (0.0%) | 0 (0.0%) |
| $3,000 or more | 0 (0.0%) | 0 (0.0%) |
| Total | 451 (100.0%) | 141 (100.0%) |
Physical Housing Characteristics in Spring Valley
Housing Structures in Spring Valley
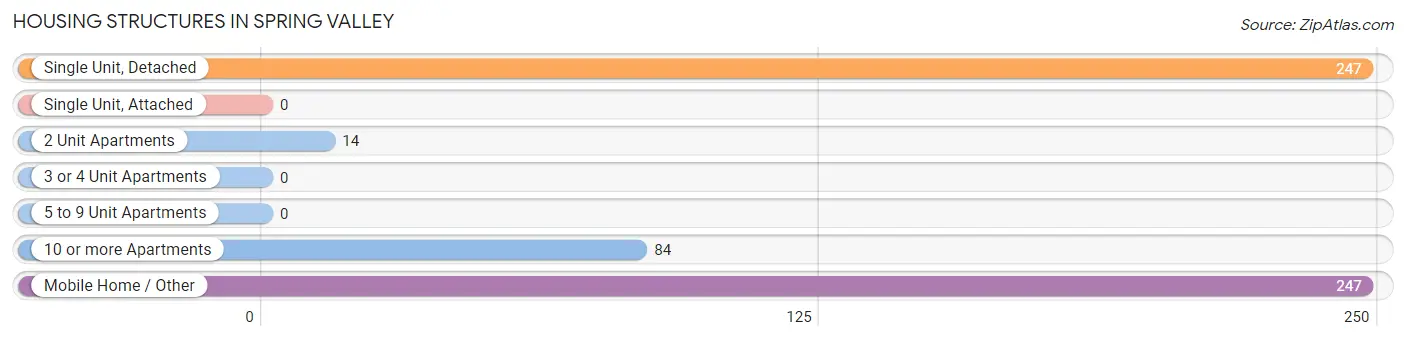
| Structure Type | # Housing Units | % Housing Units |
| Single Unit, Detached | 247 | 41.7% |
| Single Unit, Attached | 0 | 0.0% |
| 2 Unit Apartments | 14 | 2.4% |
| 3 or 4 Unit Apartments | 0 | 0.0% |
| 5 to 9 Unit Apartments | 0 | 0.0% |
| 10 or more Apartments | 84 | 14.2% |
| Mobile Home / Other | 247 | 41.7% |
| Total | 592 | 100.0% |
Housing Structures by Occupancy in Spring Valley
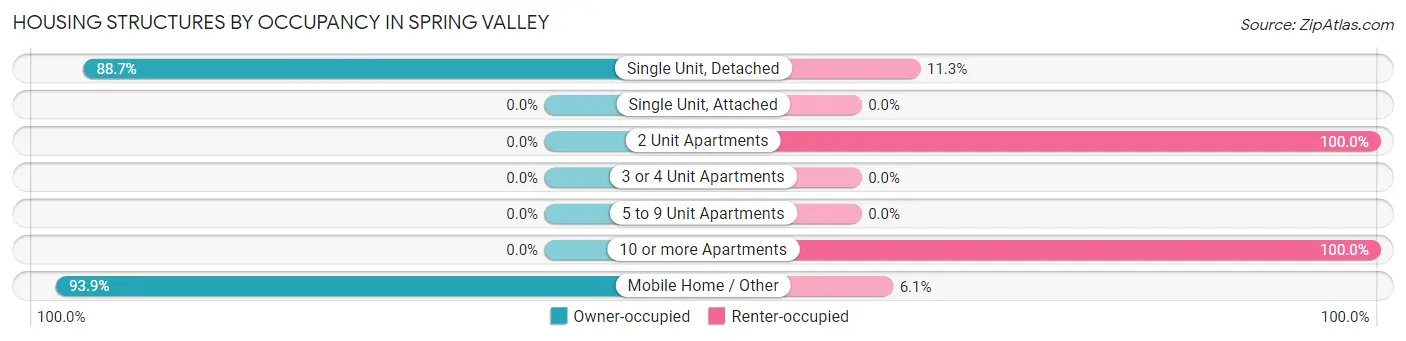
| Structure Type | Owner-occupied | Renter-occupied |
| Single Unit, Detached | 219 (88.7%) | 28 (11.3%) |
| Single Unit, Attached | 0 (0.0%) | 0 (0.0%) |
| 2 Unit Apartments | 0 (0.0%) | 14 (100.0%) |
| 3 or 4 Unit Apartments | 0 (0.0%) | 0 (0.0%) |
| 5 to 9 Unit Apartments | 0 (0.0%) | 0 (0.0%) |
| 10 or more Apartments | 0 (0.0%) | 84 (100.0%) |
| Mobile Home / Other | 232 (93.9%) | 15 (6.1%) |
| Total | 451 (76.2%) | 141 (23.8%) |
Housing Structures by Number of Rooms in Spring Valley
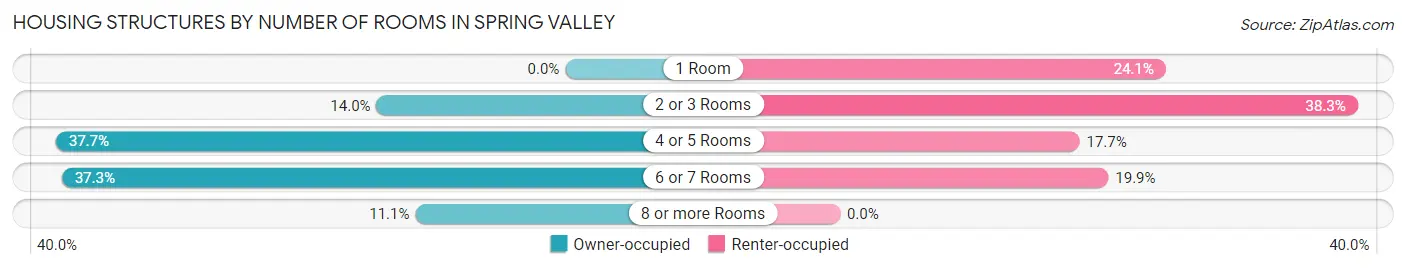
| Number of Rooms | Owner-occupied | Renter-occupied |
| 1 Room | 0 (0.0%) | 34 (24.1%) |
| 2 or 3 Rooms | 63 (14.0%) | 54 (38.3%) |
| 4 or 5 Rooms | 170 (37.7%) | 25 (17.7%) |
| 6 or 7 Rooms | 168 (37.2%) | 28 (19.9%) |
| 8 or more Rooms | 50 (11.1%) | 0 (0.0%) |
| Total | 451 (100.0%) | 141 (100.0%) |
Housing Structure by Heating Type in Spring Valley
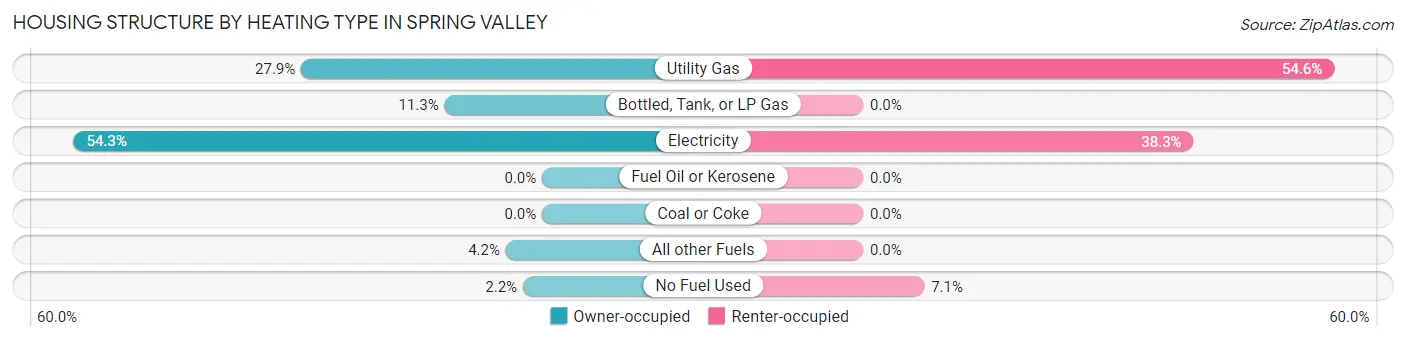
| Heating Type | Owner-occupied | Renter-occupied |
| Utility Gas | 126 (27.9%) | 77 (54.6%) |
| Bottled, Tank, or LP Gas | 51 (11.3%) | 0 (0.0%) |
| Electricity | 245 (54.3%) | 54 (38.3%) |
| Fuel Oil or Kerosene | 0 (0.0%) | 0 (0.0%) |
| Coal or Coke | 0 (0.0%) | 0 (0.0%) |
| All other Fuels | 19 (4.2%) | 0 (0.0%) |
| No Fuel Used | 10 (2.2%) | 10 (7.1%) |
| Total | 451 (100.0%) | 141 (100.0%) |
Household Vehicle Usage in Spring Valley
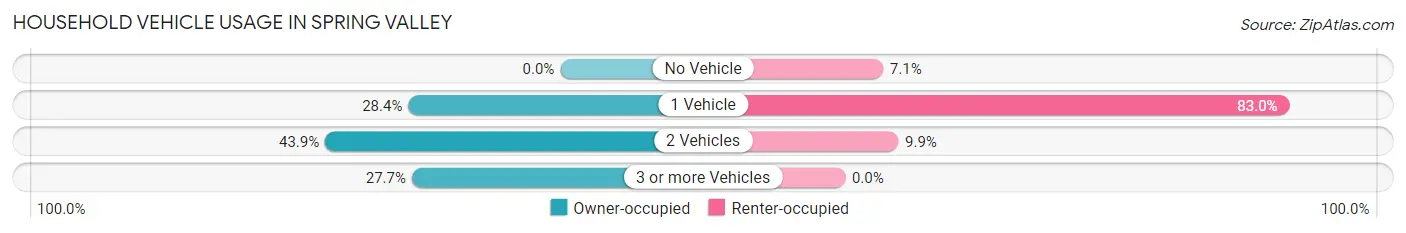
| Vehicles per Household | Owner-occupied | Renter-occupied |
| No Vehicle | 0 (0.0%) | 10 (7.1%) |
| 1 Vehicle | 128 (28.4%) | 117 (83.0%) |
| 2 Vehicles | 198 (43.9%) | 14 (9.9%) |
| 3 or more Vehicles | 125 (27.7%) | 0 (0.0%) |
| Total | 451 (100.0%) | 141 (100.0%) |
Real Estate & Mortgages in Spring Valley
Real Estate and Mortgage Overview in Spring Valley
| Characteristic | Without Mortgage | With Mortgage |
| Housing Units | 182 | 269 |
| Median Property Value | $99,300 | $182,000 |
| Median Household Income | $33,167 | $68 |
| Monthly Housing Costs | $225 | $0 |
| Real Estate Taxes | $275 | $14 |
Property Value by Mortgage Status in Spring Valley
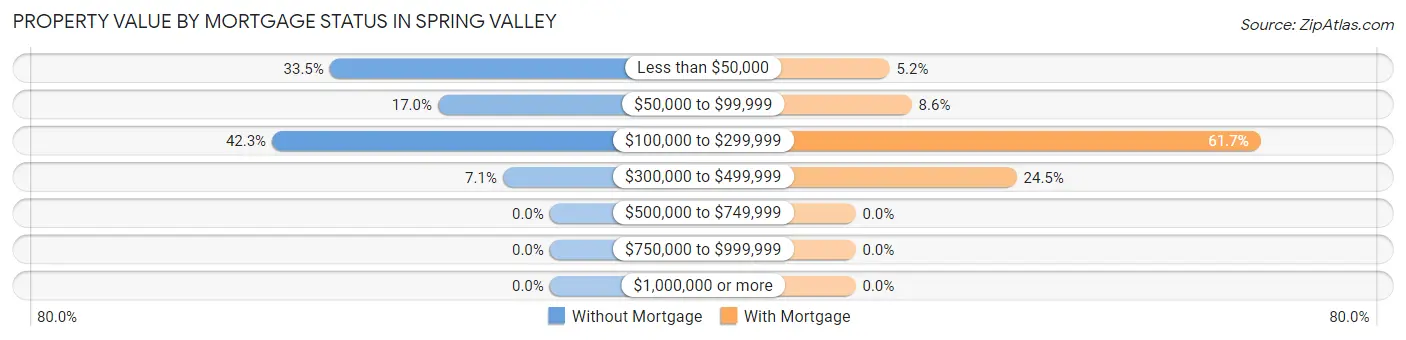
| Property Value | Without Mortgage | With Mortgage |
| Less than $50,000 | 61 (33.5%) | 14 (5.2%) |
| $50,000 to $99,999 | 31 (17.0%) | 23 (8.6%) |
| $100,000 to $299,999 | 77 (42.3%) | 166 (61.7%) |
| $300,000 to $499,999 | 13 (7.1%) | 66 (24.5%) |
| $500,000 to $749,999 | 0 (0.0%) | 0 (0.0%) |
| $750,000 to $999,999 | 0 (0.0%) | 0 (0.0%) |
| $1,000,000 or more | 0 (0.0%) | 0 (0.0%) |
| Total | 182 (100.0%) | 269 (100.0%) |
Household Income by Mortgage Status in Spring Valley
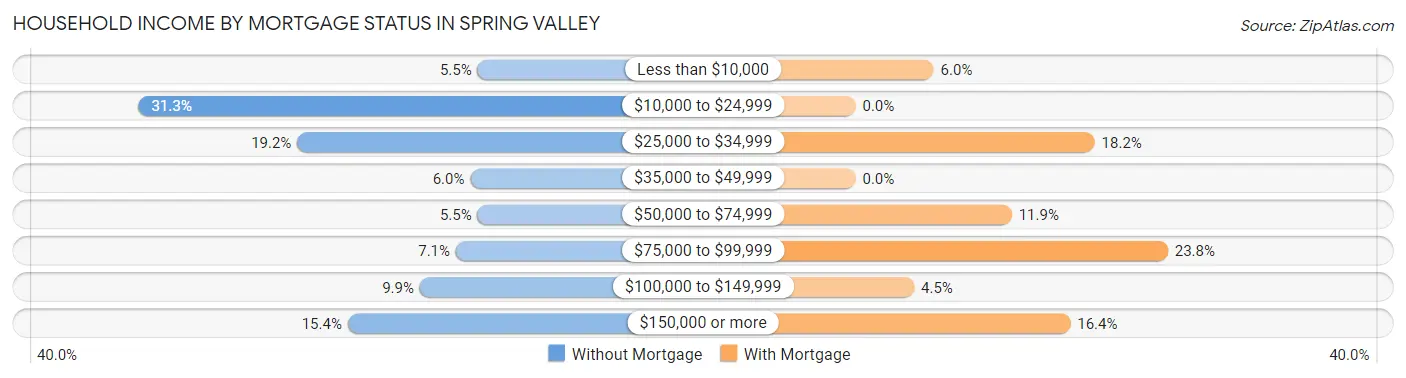
| Household Income | Without Mortgage | With Mortgage |
| Less than $10,000 | 10 (5.5%) | 16 (5.9%) |
| $10,000 to $24,999 | 57 (31.3%) | 0 (0.0%) |
| $25,000 to $34,999 | 35 (19.2%) | 49 (18.2%) |
| $35,000 to $49,999 | 11 (6.0%) | 0 (0.0%) |
| $50,000 to $74,999 | 10 (5.5%) | 32 (11.9%) |
| $75,000 to $99,999 | 13 (7.1%) | 64 (23.8%) |
| $100,000 to $149,999 | 18 (9.9%) | 12 (4.5%) |
| $150,000 or more | 28 (15.4%) | 44 (16.4%) |
| Total | 182 (100.0%) | 269 (100.0%) |
Property Value to Household Income Ratio in Spring Valley
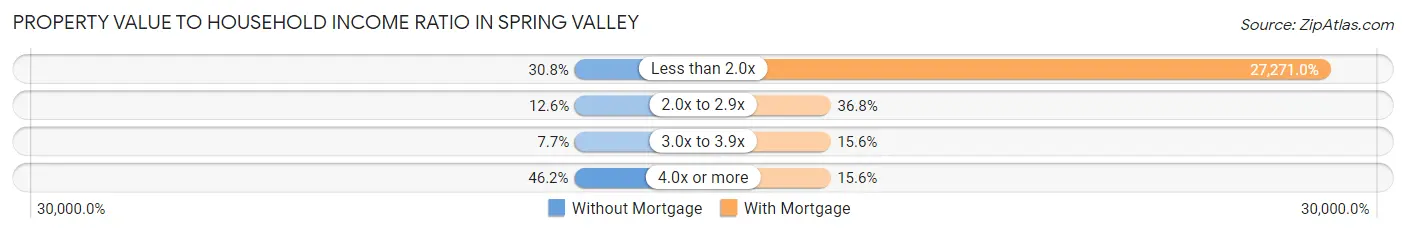
| Value-to-Income Ratio | Without Mortgage | With Mortgage |
| Less than 2.0x | 56 (30.8%) | 73,359 (27,271.0%) |
| 2.0x to 2.9x | 23 (12.6%) | 99 (36.8%) |
| 3.0x to 3.9x | 14 (7.7%) | 42 (15.6%) |
| 4.0x or more | 84 (46.2%) | 42 (15.6%) |
| Total | 182 (100.0%) | 269 (100.0%) |
Real Estate Taxes by Mortgage Status in Spring Valley
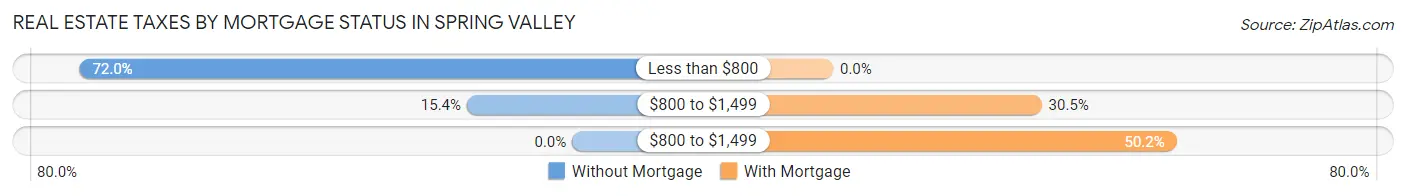
| Property Taxes | Without Mortgage | With Mortgage |
| Less than $800 | 131 (72.0%) | 0 (0.0%) |
| $800 to $1,499 | 28 (15.4%) | 82 (30.5%) |
| $800 to $1,499 | 0 (0.0%) | 135 (50.2%) |
| Total | 182 (100.0%) | 269 (100.0%) |
Health & Disability in Spring Valley
Health Insurance Coverage by Age in Spring Valley
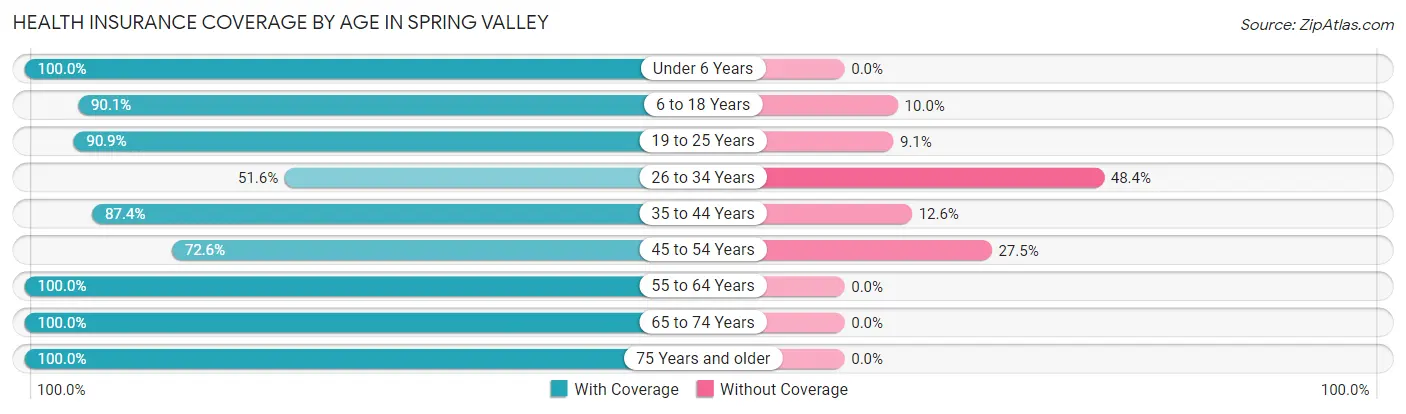
| Age Bracket | With Coverage | Without Coverage |
| Under 6 Years | 62 (100.0%) | 0 (0.0%) |
| 6 to 18 Years | 199 (90.0%) | 22 (10.0%) |
| 19 to 25 Years | 150 (90.9%) | 15 (9.1%) |
| 26 to 34 Years | 32 (51.6%) | 30 (48.4%) |
| 35 to 44 Years | 146 (87.4%) | 21 (12.6%) |
| 45 to 54 Years | 74 (72.6%) | 28 (27.5%) |
| 55 to 64 Years | 282 (100.0%) | 0 (0.0%) |
| 65 to 74 Years | 344 (100.0%) | 0 (0.0%) |
| 75 Years and older | 109 (100.0%) | 0 (0.0%) |
| Total | 1,398 (92.3%) | 116 (7.7%) |
Health Insurance Coverage by Citizenship Status in Spring Valley
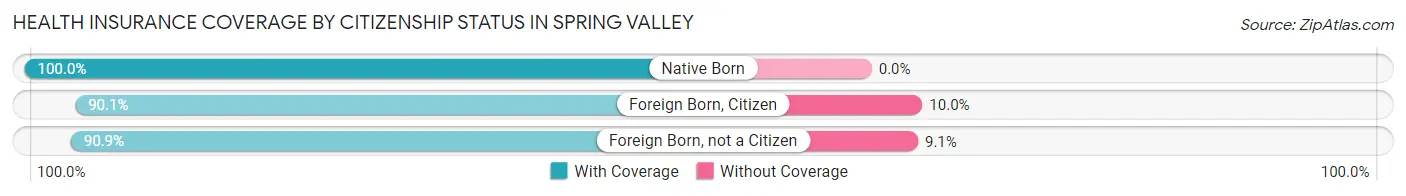
| Citizenship Status | With Coverage | Without Coverage |
| Native Born | 62 (100.0%) | 0 (0.0%) |
| Foreign Born, Citizen | 199 (90.0%) | 22 (10.0%) |
| Foreign Born, not a Citizen | 150 (90.9%) | 15 (9.1%) |
Health Insurance Coverage by Household Income in Spring Valley
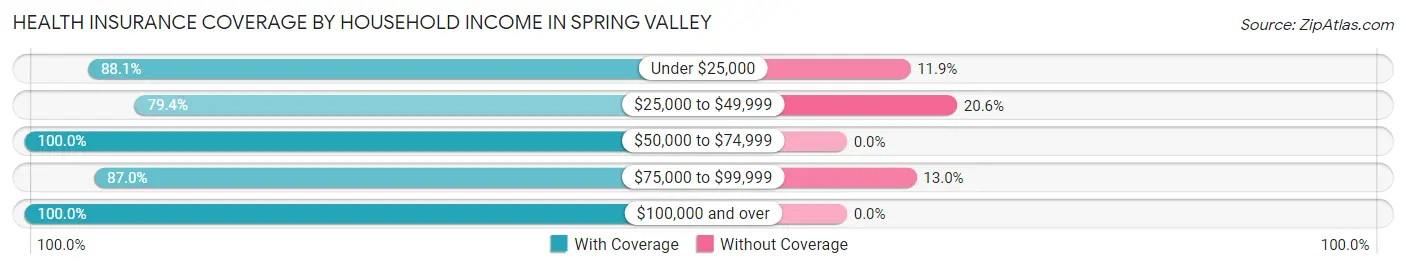
| Household Income | With Coverage | Without Coverage |
| Under $25,000 | 319 (88.1%) | 43 (11.9%) |
| $25,000 to $49,999 | 258 (79.4%) | 67 (20.6%) |
| $50,000 to $74,999 | 164 (100.0%) | 0 (0.0%) |
| $75,000 to $99,999 | 40 (87.0%) | 6 (13.0%) |
| $100,000 and over | 617 (100.0%) | 0 (0.0%) |
Public vs Private Health Insurance Coverage by Age in Spring Valley
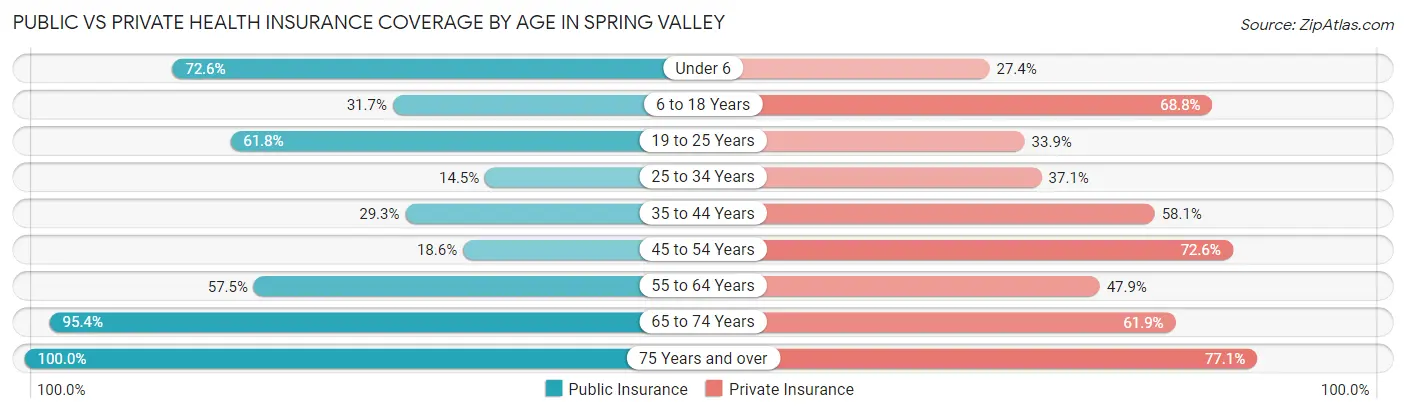
| Age Bracket | Public Insurance | Private Insurance |
| Under 6 | 45 (72.6%) | 17 (27.4%) |
| 6 to 18 Years | 70 (31.7%) | 152 (68.8%) |
| 19 to 25 Years | 102 (61.8%) | 56 (33.9%) |
| 25 to 34 Years | 9 (14.5%) | 23 (37.1%) |
| 35 to 44 Years | 49 (29.3%) | 97 (58.1%) |
| 45 to 54 Years | 19 (18.6%) | 74 (72.6%) |
| 55 to 64 Years | 162 (57.5%) | 135 (47.9%) |
| 65 to 74 Years | 328 (95.4%) | 213 (61.9%) |
| 75 Years and over | 109 (100.0%) | 84 (77.1%) |
| Total | 893 (59.0%) | 851 (56.2%) |
Disability Status by Sex by Age in Spring Valley
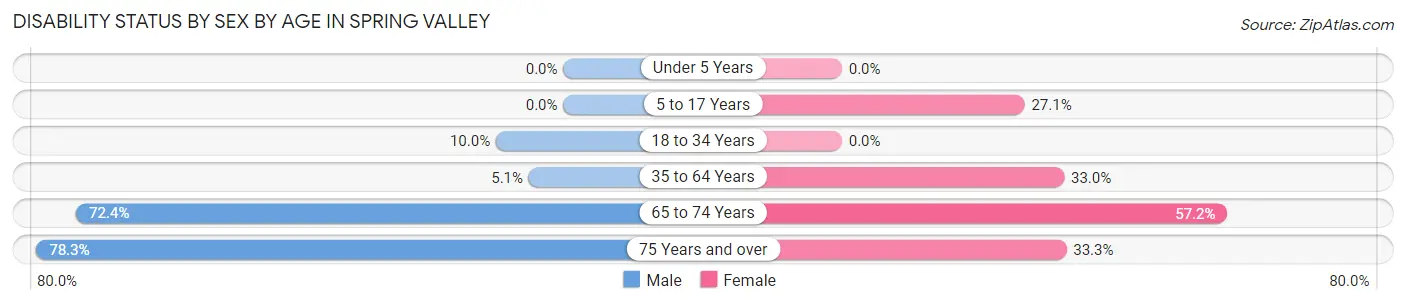
| Age Bracket | Male | Female |
| Under 5 Years | 0 (0.0%) | 0 (0.0%) |
| 5 to 17 Years | 0 (0.0%) | 35 (27.1%) |
| 18 to 34 Years | 9 (10.0%) | 0 (0.0%) |
| 35 to 64 Years | 13 (5.1%) | 98 (33.0%) |
| 65 to 74 Years | 144 (72.4%) | 83 (57.2%) |
| 75 Years and over | 36 (78.3%) | 21 (33.3%) |
Disability Class by Sex by Age in Spring Valley
Disability Class: Hearing Difficulty
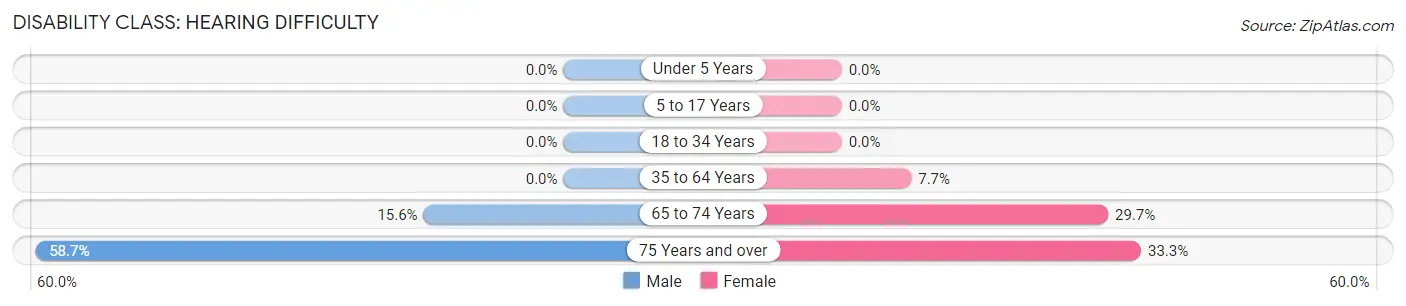
| Age Bracket | Male | Female |
| Under 5 Years | 0 (0.0%) | 0 (0.0%) |
| 5 to 17 Years | 0 (0.0%) | 0 (0.0%) |
| 18 to 34 Years | 0 (0.0%) | 0 (0.0%) |
| 35 to 64 Years | 0 (0.0%) | 23 (7.7%) |
| 65 to 74 Years | 31 (15.6%) | 43 (29.7%) |
| 75 Years and over | 27 (58.7%) | 21 (33.3%) |
Disability Class: Vision Difficulty
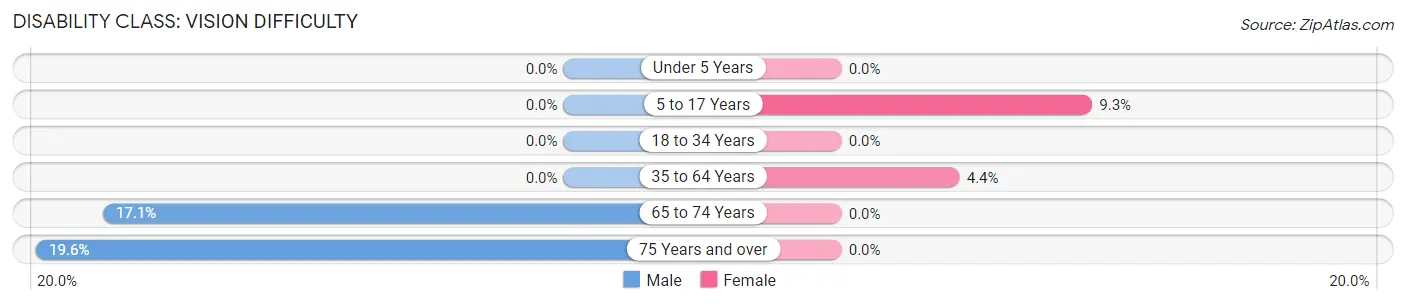
| Age Bracket | Male | Female |
| Under 5 Years | 0 (0.0%) | 0 (0.0%) |
| 5 to 17 Years | 0 (0.0%) | 12 (9.3%) |
| 18 to 34 Years | 0 (0.0%) | 0 (0.0%) |
| 35 to 64 Years | 0 (0.0%) | 13 (4.4%) |
| 65 to 74 Years | 34 (17.1%) | 0 (0.0%) |
| 75 Years and over | 9 (19.6%) | 0 (0.0%) |
Disability Class: Cognitive Difficulty
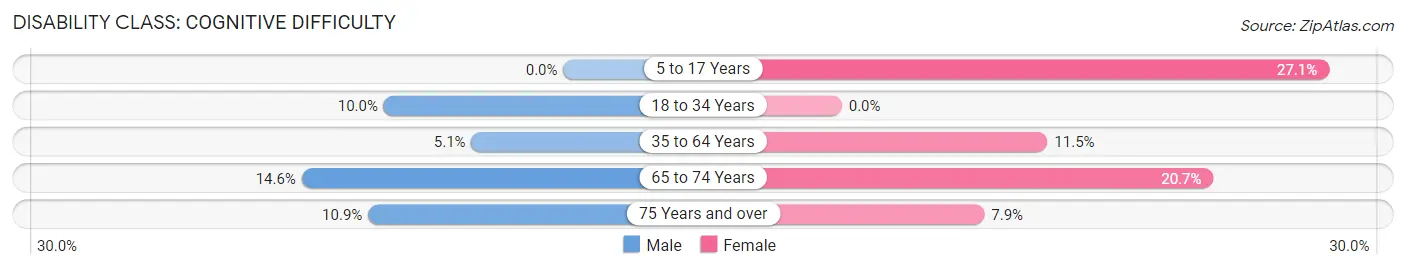
| Age Bracket | Male | Female |
| 5 to 17 Years | 0 (0.0%) | 35 (27.1%) |
| 18 to 34 Years | 9 (10.0%) | 0 (0.0%) |
| 35 to 64 Years | 13 (5.1%) | 34 (11.5%) |
| 65 to 74 Years | 29 (14.6%) | 30 (20.7%) |
| 75 Years and over | 5 (10.9%) | 5 (7.9%) |
Disability Class: Ambulatory Difficulty
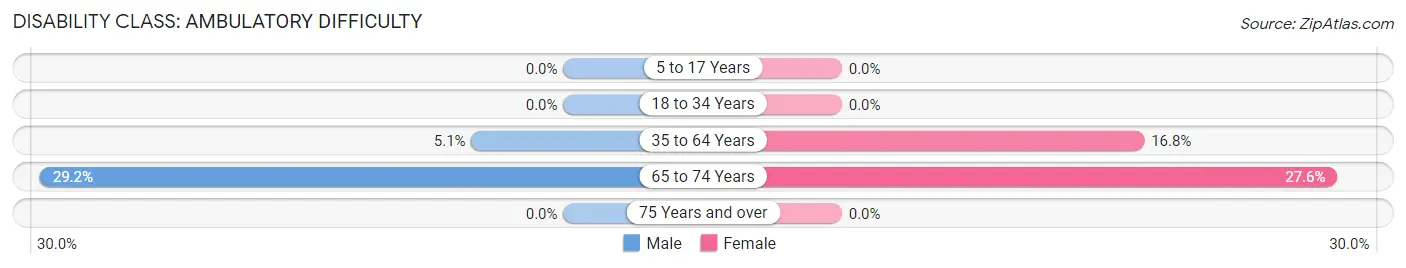
| Age Bracket | Male | Female |
| 5 to 17 Years | 0 (0.0%) | 0 (0.0%) |
| 18 to 34 Years | 0 (0.0%) | 0 (0.0%) |
| 35 to 64 Years | 13 (5.1%) | 50 (16.8%) |
| 65 to 74 Years | 58 (29.1%) | 40 (27.6%) |
| 75 Years and over | 0 (0.0%) | 0 (0.0%) |
Disability Class: Self-Care Difficulty
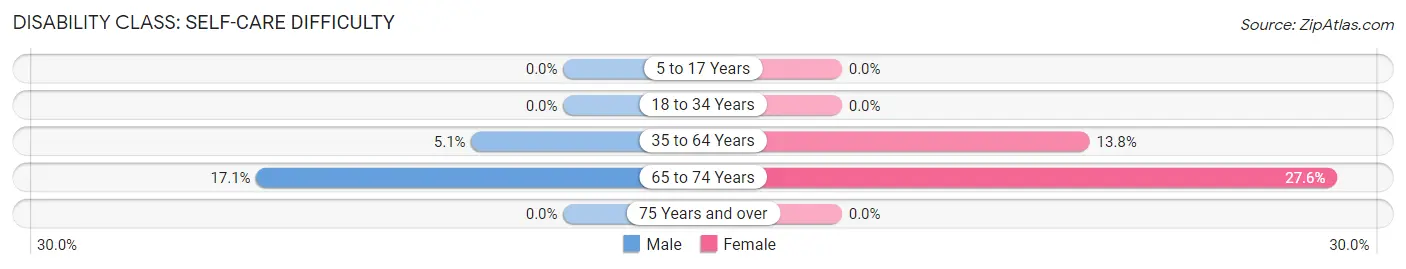
| Age Bracket | Male | Female |
| 5 to 17 Years | 0 (0.0%) | 0 (0.0%) |
| 18 to 34 Years | 0 (0.0%) | 0 (0.0%) |
| 35 to 64 Years | 13 (5.1%) | 41 (13.8%) |
| 65 to 74 Years | 34 (17.1%) | 40 (27.6%) |
| 75 Years and over | 0 (0.0%) | 0 (0.0%) |
Technology Access in Spring Valley
Computing Device Access in Spring Valley
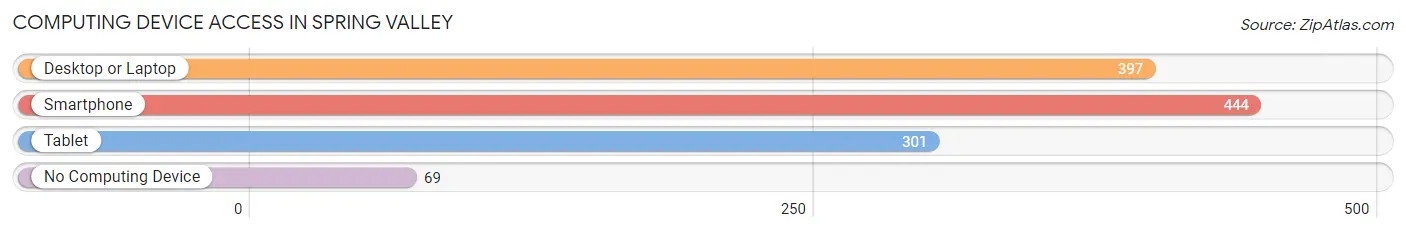
| Device Type | # Households | % Households |
| Desktop or Laptop | 397 | 67.1% |
| Smartphone | 444 | 75.0% |
| Tablet | 301 | 50.8% |
| No Computing Device | 69 | 11.7% |
| Total | 592 | 100.0% |
Internet Access in Spring Valley
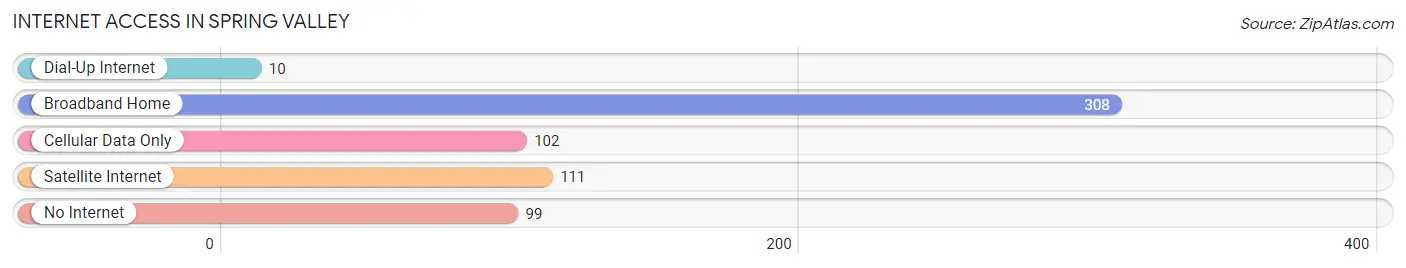
| Internet Type | # Households | % Households |
| Dial-Up Internet | 10 | 1.7% |
| Broadband Home | 308 | 52.0% |
| Cellular Data Only | 102 | 17.2% |
| Satellite Internet | 111 | 18.8% |
| No Internet | 99 | 16.7% |
| Total | 592 | 100.0% |
Spring Valley Summary
History
The area now known as Spring Valley, Arizona was first inhabited by the Hohokam people, who lived in the area from 300 BC to 1450 AD. The Hohokam were a semi-nomadic people who lived in small villages and farmed the land. They were known for their irrigation systems, which were used to water their crops.
The area was later inhabited by the Pima and Tohono O’odham tribes, who lived in the area until the late 19th century. In 1857, the United States Army established Fort Crittenden in the area, which was used to protect settlers from Apache raids.
In the early 20th century, the area was settled by ranchers and farmers, who established small towns and communities. The town of Spring Valley was established in 1912, and the area was incorporated as a town in 1921.
Geography
Spring Valley is located in the Sonoran Desert of Arizona, about 40 miles south of Phoenix. The town is situated in the foothills of the Santa Catalina Mountains, and is surrounded by desert and mountain terrain. The town is located at an elevation of 2,000 feet, and has a hot desert climate with hot summers and mild winters.
The town covers an area of 8.3 square miles, and has a population of approximately 1,500 people. The town is served by two major highways, State Route 77 and State Route 79.
Economy
The economy of Spring Valley is largely based on agriculture and tourism. The town is home to several farms and ranches, which produce a variety of crops, including cotton, alfalfa, and hay. The town is also home to several tourist attractions, including the Arizona-Sonora Desert Museum, the Saguaro National Park, and the Kitt Peak National Observatory.
The town is also home to several businesses, including restaurants, retail stores, and a variety of service-based businesses.
Demographics
As of the 2010 census, the population of Spring Valley was 1,500 people. The racial makeup of the town was 94.7% White, 0.7% African American, 0.7% Native American, 0.7% Asian, 0.7% from other races, and 2.7% from two or more races. Hispanic or Latino of any race were 4.7% of the population.
The median income for a household in the town was $37,500, and the median income for a family was $41,250. The per capita income for the town was $17,500. About 11.3% of families and 14.7% of the population were below the poverty line, including 18.3% of those under age 18 and none of those age 65 or over.
Common Questions
What is Per Capita Income in Spring Valley?
Per Capita income in Spring Valley is $27,254.
What is the Median Family Income in Spring Valley?
Median Family Income in Spring Valley is $81,250.
What is the Median Household income in Spring Valley?
Median Household Income in Spring Valley is $41,429.
What is Inequality or Gini Index in Spring Valley?
Inequality or Gini Index in Spring Valley is 0.54.
What is the Total Population of Spring Valley?
Total Population of Spring Valley is 1,514.
What is the Total Male Population of Spring Valley?
Total Male Population of Spring Valley is 743.
What is the Total Female Population of Spring Valley?
Total Female Population of Spring Valley is 771.
What is the Ratio of Males per 100 Females in Spring Valley?
There are 96.37 Males per 100 Females in Spring Valley.
What is the Ratio of Females per 100 Males in Spring Valley?
There are 103.77 Females per 100 Males in Spring Valley.
What is the Median Population Age in Spring Valley?
Median Population Age in Spring Valley is 53.7 Years.
What is the Average Family Size in Spring Valley
Average Family Size in Spring Valley is 3.4 People.
What is the Average Household Size in Spring Valley
Average Household Size in Spring Valley is 2.6 People.
How Large is the Labor Force in Spring Valley?
There are 461 People in the Labor Forcein in Spring Valley.
What is the Percentage of People in the Labor Force in Spring Valley?
35.1% of People are in the Labor Force in Spring Valley.
What is the Unemployment Rate in Spring Valley?
Unemployment Rate in Spring Valley is 2.2%.