La Alianza, PR Map & Demographics
La Alianza Map
La Alianza Overview
$10,522
PER CAPITA INCOME
$14,828
AVG FAMILY INCOME
$12,679
AVG HOUSEHOLD INCOME
38.9%
WAGE / INCOME GAP [ % ]
61.1¢/ $1
WAGE / INCOME GAP [ $ ]
$12,108
FAMILY INCOME DEFICIT
0.65
INEQUALITY / GINI INDEX
1,732
TOTAL POPULATION
946
MALE POPULATION
786
FEMALE POPULATION
120.36
MALES / 100 FEMALES
83.09
FEMALES / 100 MALES
50.4
MEDIAN AGE
3.3
AVG FAMILY SIZE
2.7
AVG HOUSEHOLD SIZE
353
LABOR FORCE [ PEOPLE ]
24.1%
PERCENT IN LABOR FORCE
24.6%
UNEMPLOYMENT RATE
Income in La Alianza
Income Overview in La Alianza
Per Capita Income in La Alianza is $10,522, while median incomes of families and households are $14,828 and $12,679 respectively.
| Characteristic | Number | Measure |
| Per Capita Income | 1,732 | $10,522 |
| Median Family Income | 440 | $14,828 |
| Mean Family Income | 440 | $33,189 |
| Median Household Income | 650 | $12,679 |
| Mean Household Income | 650 | $26,557 |
| Income Deficit | 440 | $12,108 |
| Wage / Income Gap (%) | 1,732 | 38.94% |
| Wage / Income Gap ($) | 1,732 | 61.06¢ per $1 |
| Gini / Inequality Index | 1,732 | 0.65 |
Earnings by Sex in La Alianza
Average Earnings in La Alianza are $21,111, $17,300 for men and $28,333 for women, a difference of 38.9%.
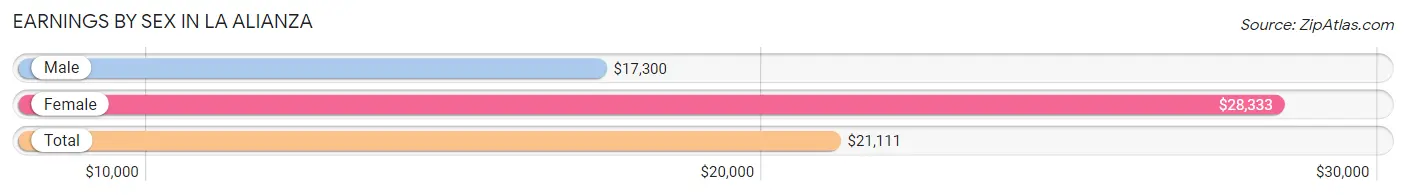
| Sex | Number | Average Earnings |
| Male | 194 (72.9%) | $17,300 |
| Female | 72 (27.1%) | $28,333 |
| Total | 266 (100.0%) | $21,111 |
Earnings by Sex by Income Bracket in La Alianza
The most common earnings brackets in La Alianza are $10,000 to $12,499 for men (31 | 16.0%) and $25,000 to $29,999 for women (27 | 37.5%).
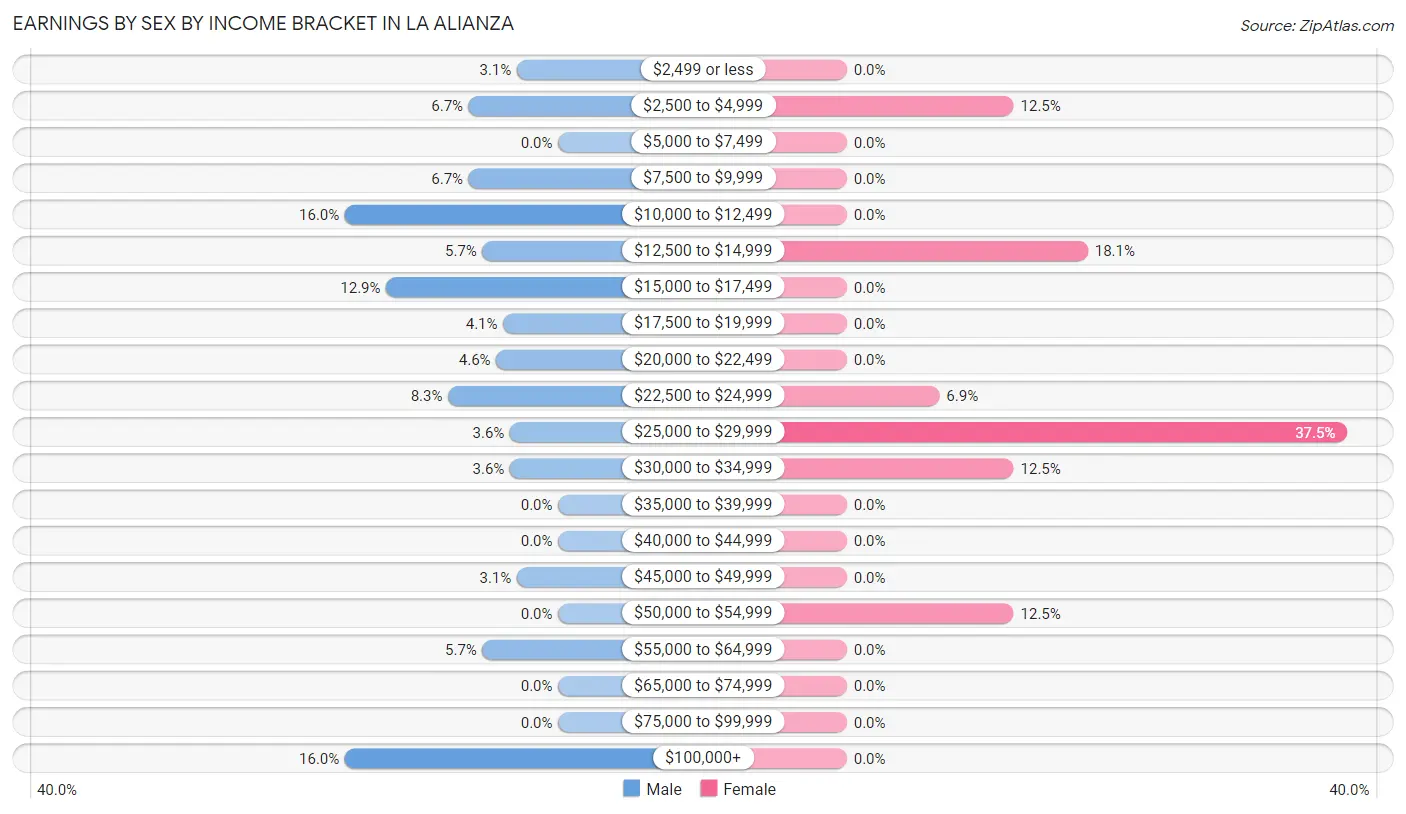
| Income | Male | Female |
| $2,499 or less | 6 (3.1%) | 0 (0.0%) |
| $2,500 to $4,999 | 13 (6.7%) | 9 (12.5%) |
| $5,000 to $7,499 | 0 (0.0%) | 0 (0.0%) |
| $7,500 to $9,999 | 13 (6.7%) | 0 (0.0%) |
| $10,000 to $12,499 | 31 (16.0%) | 0 (0.0%) |
| $12,500 to $14,999 | 11 (5.7%) | 13 (18.1%) |
| $15,000 to $17,499 | 25 (12.9%) | 0 (0.0%) |
| $17,500 to $19,999 | 8 (4.1%) | 0 (0.0%) |
| $20,000 to $22,499 | 9 (4.6%) | 0 (0.0%) |
| $22,500 to $24,999 | 16 (8.3%) | 5 (6.9%) |
| $25,000 to $29,999 | 7 (3.6%) | 27 (37.5%) |
| $30,000 to $34,999 | 7 (3.6%) | 9 (12.5%) |
| $35,000 to $39,999 | 0 (0.0%) | 0 (0.0%) |
| $40,000 to $44,999 | 0 (0.0%) | 0 (0.0%) |
| $45,000 to $49,999 | 6 (3.1%) | 0 (0.0%) |
| $50,000 to $54,999 | 0 (0.0%) | 9 (12.5%) |
| $55,000 to $64,999 | 11 (5.7%) | 0 (0.0%) |
| $65,000 to $74,999 | 0 (0.0%) | 0 (0.0%) |
| $75,000 to $99,999 | 0 (0.0%) | 0 (0.0%) |
| $100,000+ | 31 (16.0%) | 0 (0.0%) |
| Total | 194 (100.0%) | 72 (100.0%) |
Earnings by Sex by Educational Attainment in La Alianza
Average earnings in La Alianza are $21,528 for men and $27,625 for women, a difference of 22.1%. Men with an educational attainment of bachelor's degree enjoy the highest average annual earnings of $180,966, while those with high school diploma education earn the least with $12,262. Women with an educational attainment of bachelor's degree earn the most with the average annual earnings of $27,625, while those with bachelor's degree education have the smallest earnings of $27,625.
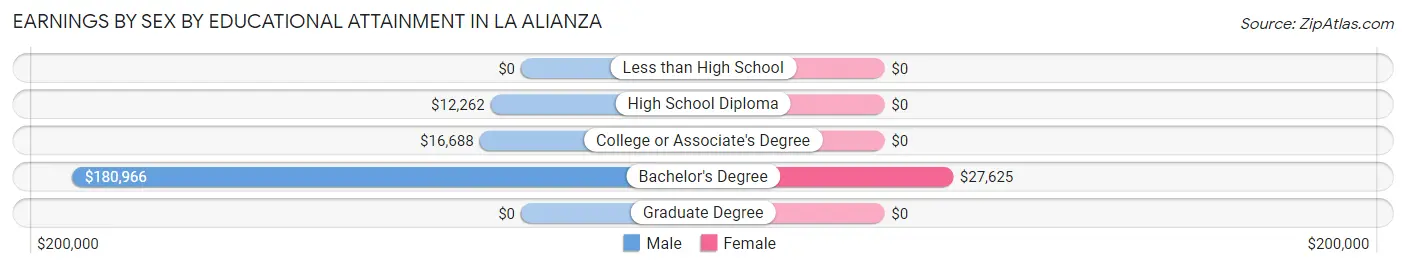
| Educational Attainment | Male Income | Female Income |
| Less than High School | - | - |
| High School Diploma | $12,262 | $0 |
| College or Associate's Degree | $16,688 | $0 |
| Bachelor's Degree | $180,966 | $27,625 |
| Graduate Degree | - | - |
| Total | $21,528 | $27,625 |
Family Income in La Alianza
Family Income Brackets in La Alianza
According to the La Alianza family income data, there are 146 families falling into the less than $10,000 income range, which is the most common income bracket and makes up 33.2% of all families.
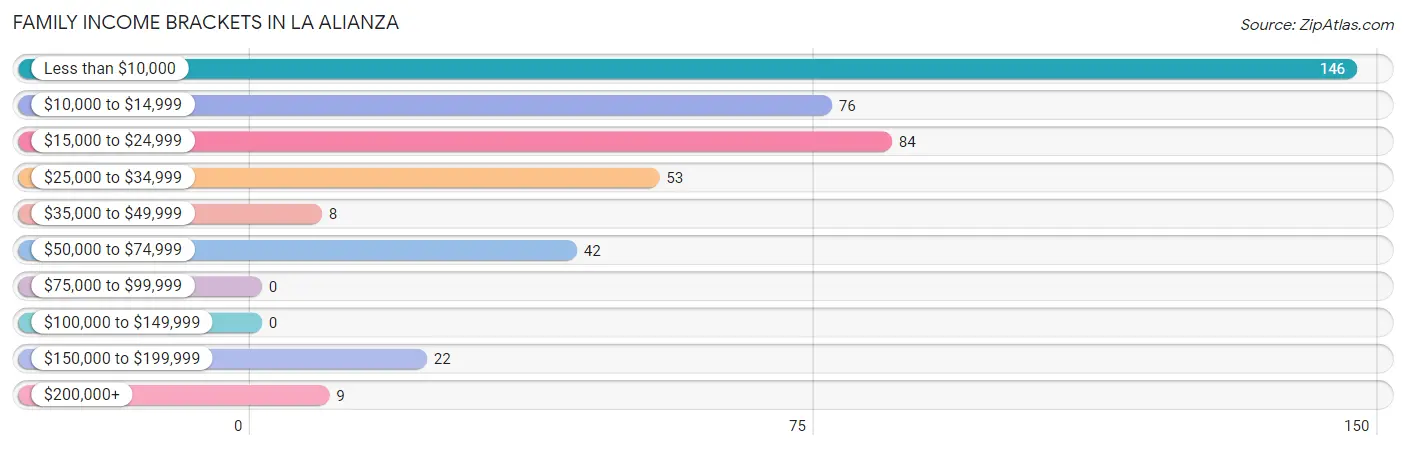
| Income Bracket | # Families | % Families |
| Less than $10,000 | 146 | 33.2% |
| $10,000 to $14,999 | 76 | 17.3% |
| $15,000 to $24,999 | 84 | 19.1% |
| $25,000 to $34,999 | 53 | 12.0% |
| $35,000 to $49,999 | 8 | 1.8% |
| $50,000 to $74,999 | 42 | 9.5% |
| $75,000 to $99,999 | 0 | 0.0% |
| $100,000 to $149,999 | 0 | 0.0% |
| $150,000 to $199,999 | 22 | 5.0% |
| $200,000+ | 9 | 2.0% |
Family Income by Famaliy Size in La Alianza
2-person families (242 | 55.0%) account for the highest median family income in La Alianza with $14,688 per family, while 2-person families (242 | 55.0%) have the highest median income of $7,344 per family member.
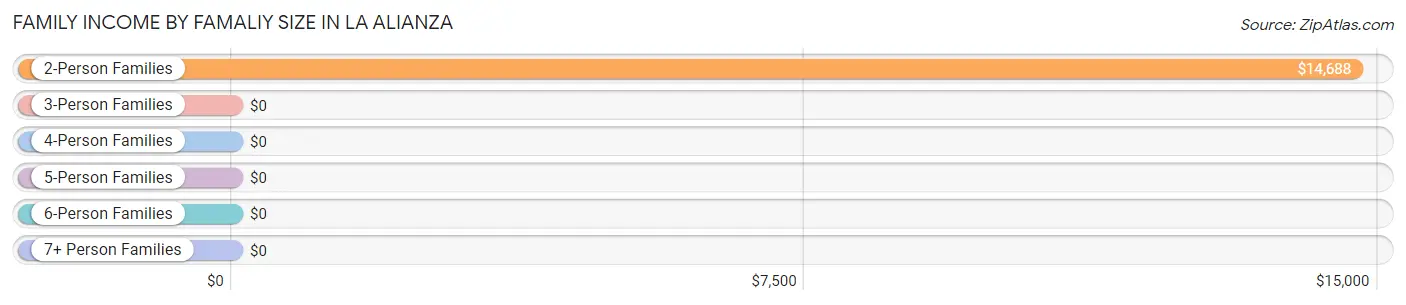
| Income Bracket | # Families | Median Income |
| 2-Person Families | 242 (55.0%) | $14,688 |
| 3-Person Families | 112 (25.5%) | $0 |
| 4-Person Families | 68 (15.4%) | $0 |
| 5-Person Families | 18 (4.1%) | $0 |
| 6-Person Families | 0 (0.0%) | $0 |
| 7+ Person Families | 0 (0.0%) | $0 |
| Total | 440 (100.0%) | $14,828 |
Family Income by Number of Earners in La Alianza
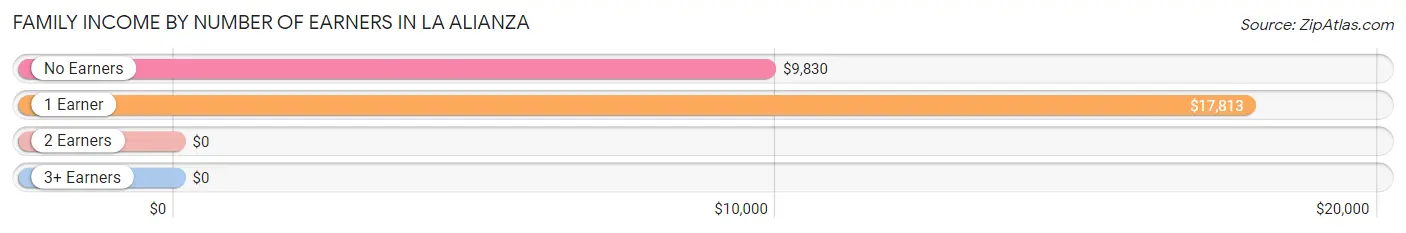
| Number of Earners | # Families | Median Income |
| No Earners | 261 (59.3%) | $9,830 |
| 1 Earner | 150 (34.1%) | $17,813 |
| 2 Earners | 29 (6.6%) | $0 |
| 3+ Earners | 0 (0.0%) | $0 |
| Total | 440 (100.0%) | $14,828 |
Household Income in La Alianza
Household Income Brackets in La Alianza
With 253 households falling in the category, the less than $10,000 income range is the most frequent in La Alianza, accounting for 38.9% of all households.
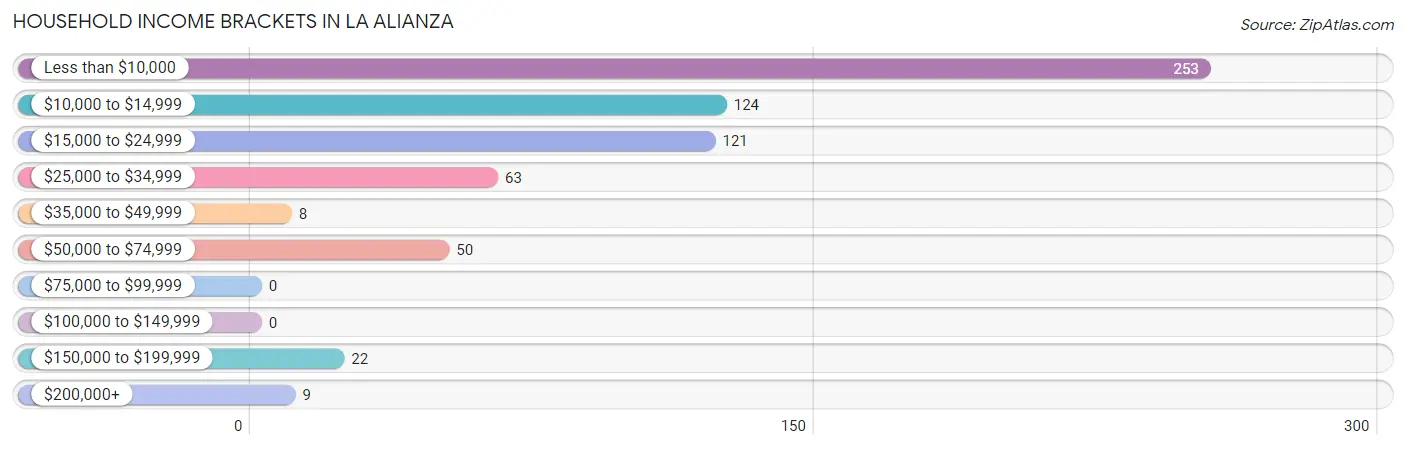
| Income Bracket | # Households | % Households |
| Less than $10,000 | 253 | 38.9% |
| $10,000 to $14,999 | 124 | 19.1% |
| $15,000 to $24,999 | 121 | 18.6% |
| $25,000 to $34,999 | 63 | 9.7% |
| $35,000 to $49,999 | 8 | 1.2% |
| $50,000 to $74,999 | 50 | 7.7% |
| $75,000 to $99,999 | 0 | 0.0% |
| $100,000 to $149,999 | 0 | 0.0% |
| $150,000 to $199,999 | 22 | 3.4% |
| $200,000+ | 9 | 1.4% |
Household Income by Householder Age in La Alianza
The median household income in La Alianza is $12,679, with the highest median household income of $16,313 found in the 25 to 44 years age bracket for the primary householder. A total of 75 households (11.5%) fall into this category. Meanwhile, the 15 to 24 years age bracket for the primary householder has the lowest median household income of $0, with 5 households (0.8%) in this group.
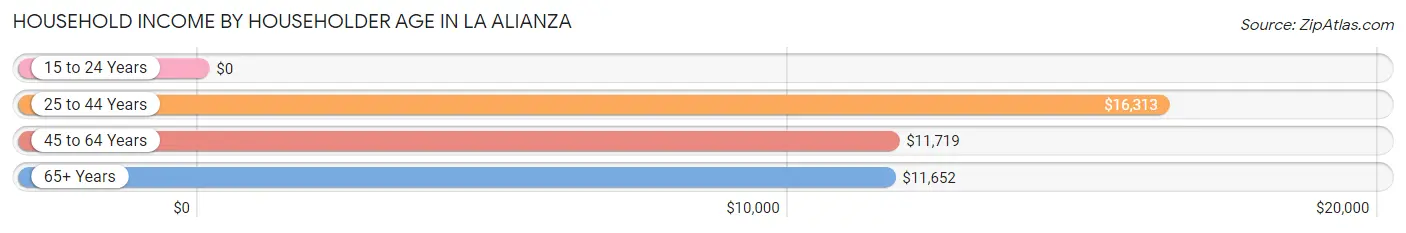
| Income Bracket | # Households | Median Income |
| 15 to 24 Years | 5 (0.8%) | $0 |
| 25 to 44 Years | 75 (11.5%) | $16,313 |
| 45 to 64 Years | 305 (46.9%) | $11,719 |
| 65+ Years | 265 (40.8%) | $11,652 |
| Total | 650 (100.0%) | $12,679 |
Poverty in La Alianza
Income Below Poverty by Sex and Age in La Alianza
With 69.9% poverty level for males and 65.1% for females among the residents of La Alianza, under 5 year old males and under 5 year old females are the most vulnerable to poverty, with 60 males (100.0%) and 13 females (100.0%) in their respective age groups living below the poverty level.
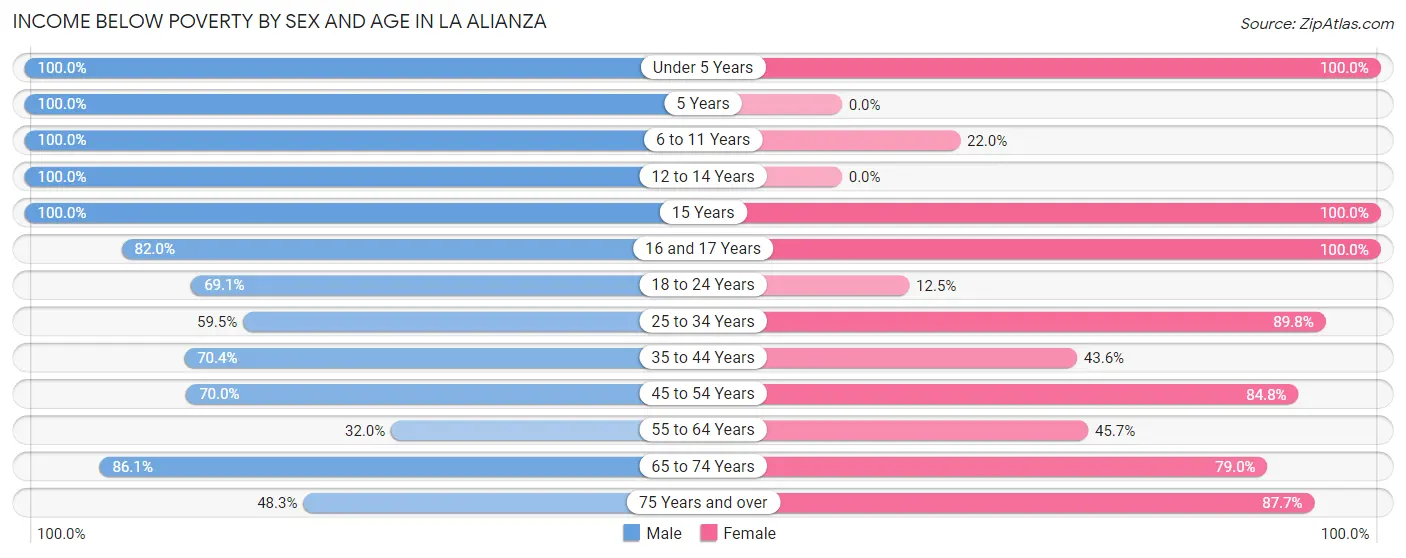
| Age Bracket | Male | Female |
| Under 5 Years | 60 (100.0%) | 13 (100.0%) |
| 5 Years | 22 (100.0%) | 0 (0.0%) |
| 6 to 11 Years | 62 (100.0%) | 9 (22.0%) |
| 12 to 14 Years | 16 (100.0%) | 0 (0.0%) |
| 15 Years | 11 (100.0%) | 31 (100.0%) |
| 16 and 17 Years | 41 (82.0%) | 25 (100.0%) |
| 18 to 24 Years | 67 (69.1%) | 7 (12.5%) |
| 25 to 34 Years | 44 (59.5%) | 79 (89.8%) |
| 35 to 44 Years | 38 (70.4%) | 24 (43.6%) |
| 45 to 54 Years | 126 (70.0%) | 50 (84.8%) |
| 55 to 64 Years | 47 (32.0%) | 80 (45.7%) |
| 65 to 74 Years | 99 (86.1%) | 94 (79.0%) |
| 75 Years and over | 28 (48.3%) | 100 (87.7%) |
| Total | 661 (69.9%) | 512 (65.1%) |
Income Above Poverty by Sex and Age in La Alianza
According to the poverty statistics in La Alianza, males aged 55 to 64 years and females aged 12 to 14 years are the age groups that are most secure financially, with 68.0% of males and 100.0% of females in these age groups living above the poverty line.
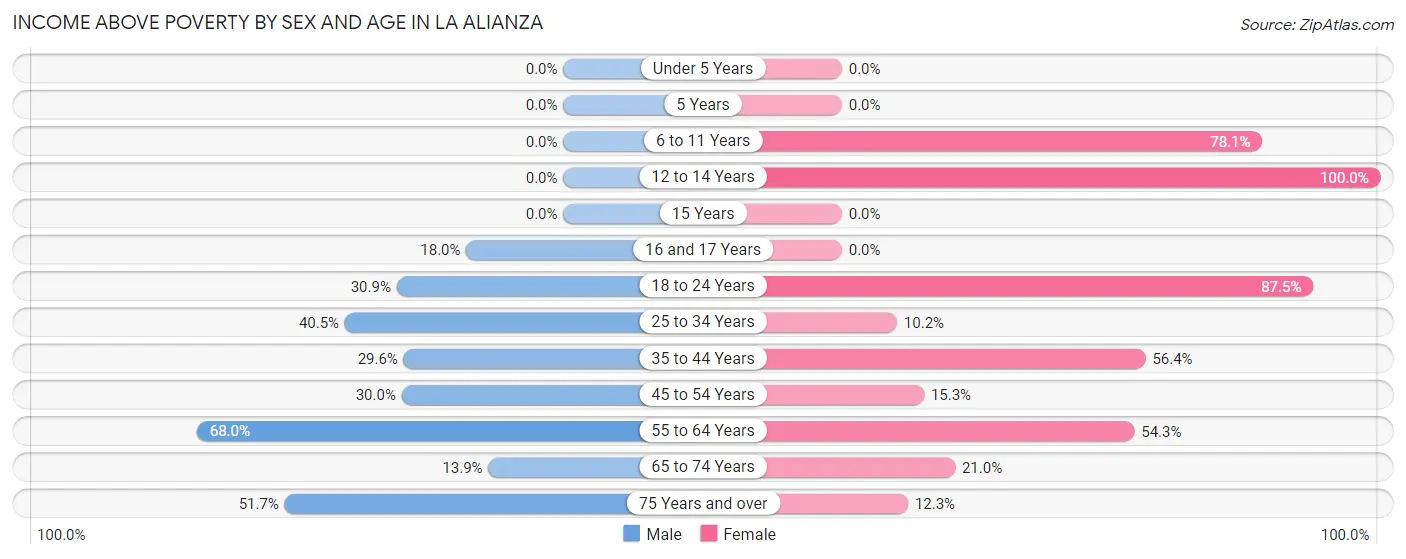
| Age Bracket | Male | Female |
| Under 5 Years | 0 (0.0%) | 0 (0.0%) |
| 5 Years | 0 (0.0%) | 0 (0.0%) |
| 6 to 11 Years | 0 (0.0%) | 32 (78.0%) |
| 12 to 14 Years | 0 (0.0%) | 10 (100.0%) |
| 15 Years | 0 (0.0%) | 0 (0.0%) |
| 16 and 17 Years | 9 (18.0%) | 0 (0.0%) |
| 18 to 24 Years | 30 (30.9%) | 49 (87.5%) |
| 25 to 34 Years | 30 (40.5%) | 9 (10.2%) |
| 35 to 44 Years | 16 (29.6%) | 31 (56.4%) |
| 45 to 54 Years | 54 (30.0%) | 9 (15.2%) |
| 55 to 64 Years | 100 (68.0%) | 95 (54.3%) |
| 65 to 74 Years | 16 (13.9%) | 25 (21.0%) |
| 75 Years and over | 30 (51.7%) | 14 (12.3%) |
| Total | 285 (30.1%) | 274 (34.9%) |
Income Below Poverty Among Married-Couple Families in La Alianza
The poverty statistics for married-couple families in La Alianza show that 44.9% or 114 of the total 254 families live below the poverty line. Families with 3 or 4 children have the highest poverty rate of 100.0%, comprising of 10 families. On the other hand, families with no children have the lowest poverty rate of 40.5%, which includes 83 families.
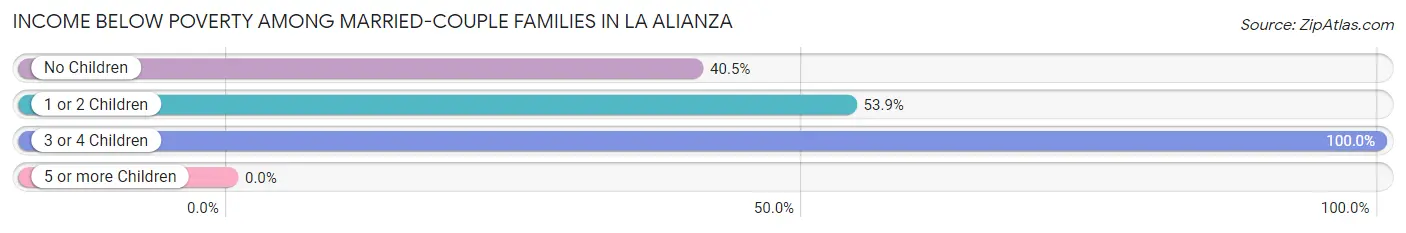
| Children | Above Poverty | Below Poverty |
| No Children | 122 (59.5%) | 83 (40.5%) |
| 1 or 2 Children | 18 (46.2%) | 21 (53.8%) |
| 3 or 4 Children | 0 (0.0%) | 10 (100.0%) |
| 5 or more Children | 0 (0.0%) | 0 (0.0%) |
| Total | 140 (55.1%) | 114 (44.9%) |
Income Below Poverty Among Single-Parent Households in La Alianza
According to the poverty data in La Alianza, 68.3% or 41 single-father households and 100.0% or 126 single-mother households are living below the poverty line. Among single-father households, those with 3 or 4 children have the highest poverty rate, with 13 households (100.0%) experiencing poverty. Likewise, among single-mother households, those with no children have the highest poverty rate, with 72 households (100.0%) falling below the poverty line.
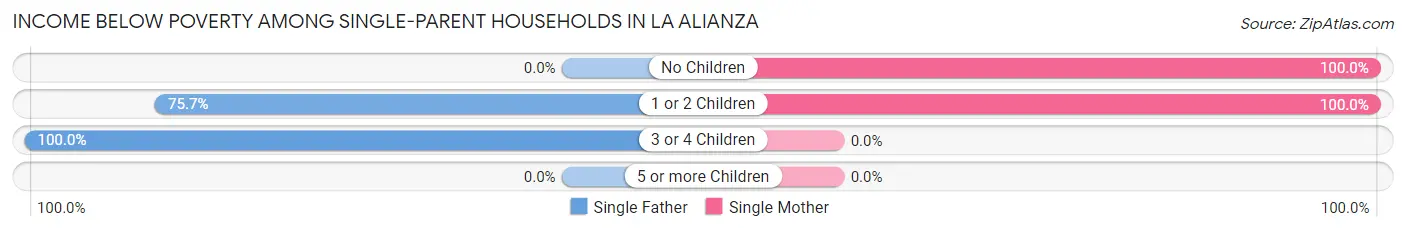
| Children | Single Father | Single Mother |
| No Children | 0 (0.0%) | 72 (100.0%) |
| 1 or 2 Children | 28 (75.7%) | 54 (100.0%) |
| 3 or 4 Children | 13 (100.0%) | 0 (0.0%) |
| 5 or more Children | 0 (0.0%) | 0 (0.0%) |
| Total | 41 (68.3%) | 126 (100.0%) |
Income Below Poverty Among Married-Couple vs Single-Parent Households in La Alianza
The poverty data for La Alianza shows that 114 of the married-couple family households (44.9%) and 167 of the single-parent households (89.8%) are living below the poverty level. Within the married-couple family households, those with 3 or 4 children have the highest poverty rate, with 10 households (100.0%) falling below the poverty line. Among the single-parent households, those with 3 or 4 children have the highest poverty rate, with 13 household (100.0%) living below poverty.
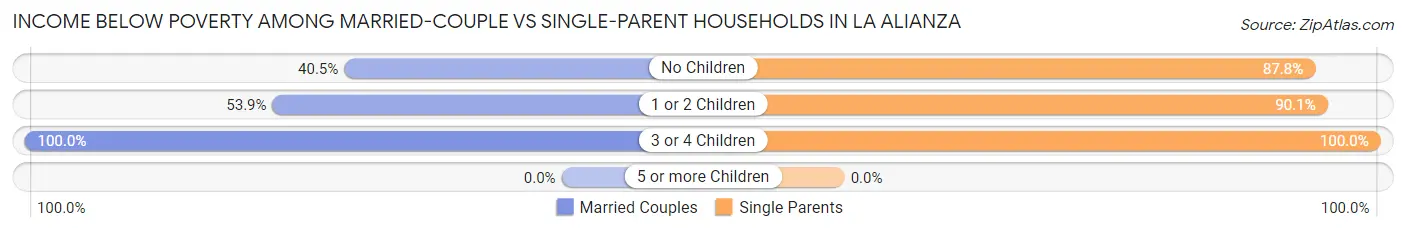
| Children | Married-Couple Families | Single-Parent Households |
| No Children | 83 (40.5%) | 72 (87.8%) |
| 1 or 2 Children | 21 (53.8%) | 82 (90.1%) |
| 3 or 4 Children | 10 (100.0%) | 13 (100.0%) |
| 5 or more Children | 0 (0.0%) | 0 (0.0%) |
| Total | 114 (44.9%) | 167 (89.8%) |
Race in La Alianza
The most populous races in La Alianza are Hispanic or Latino (1,732 | 100.0%), Some other Race (1,437 | 83.0%), and White / Caucasian (173 | 10.0%).
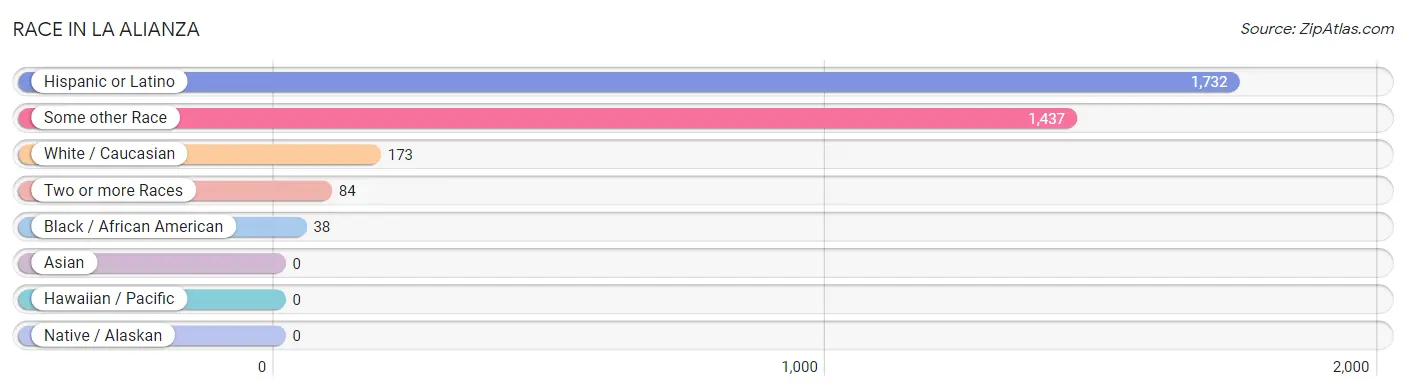
| Race | # Population | % Population |
| Asian | 0 | 0.0% |
| Black / African American | 38 | 2.2% |
| Hawaiian / Pacific | 0 | 0.0% |
| Hispanic or Latino | 1,732 | 100.0% |
| Native / Alaskan | 0 | 0.0% |
| White / Caucasian | 173 | 10.0% |
| Two or more Races | 84 | 4.9% |
| Some other Race | 1,437 | 83.0% |
| Total | 1,732 | 100.0% |
Ancestry in La Alianza
The most populous ancestries reported in La Alianza are , and Puerto Rican (1,732 | 100.0%), together accounting for 100.0% of all La Alianza residents.

| Ancestry | # Population | % Population |
| Puerto Rican | 1,732 | 100.0% | View All 1 Rows |
Immigrants in La Alianza

| Immigration Origin | # Population | % Population | View All 0 Rows |
Sex and Age in La Alianza
Sex and Age in La Alianza
The most populous age groups in La Alianza are 50 to 54 Years (142 | 15.0%) for men and 60 to 64 Years (102 | 13.0%) for women.
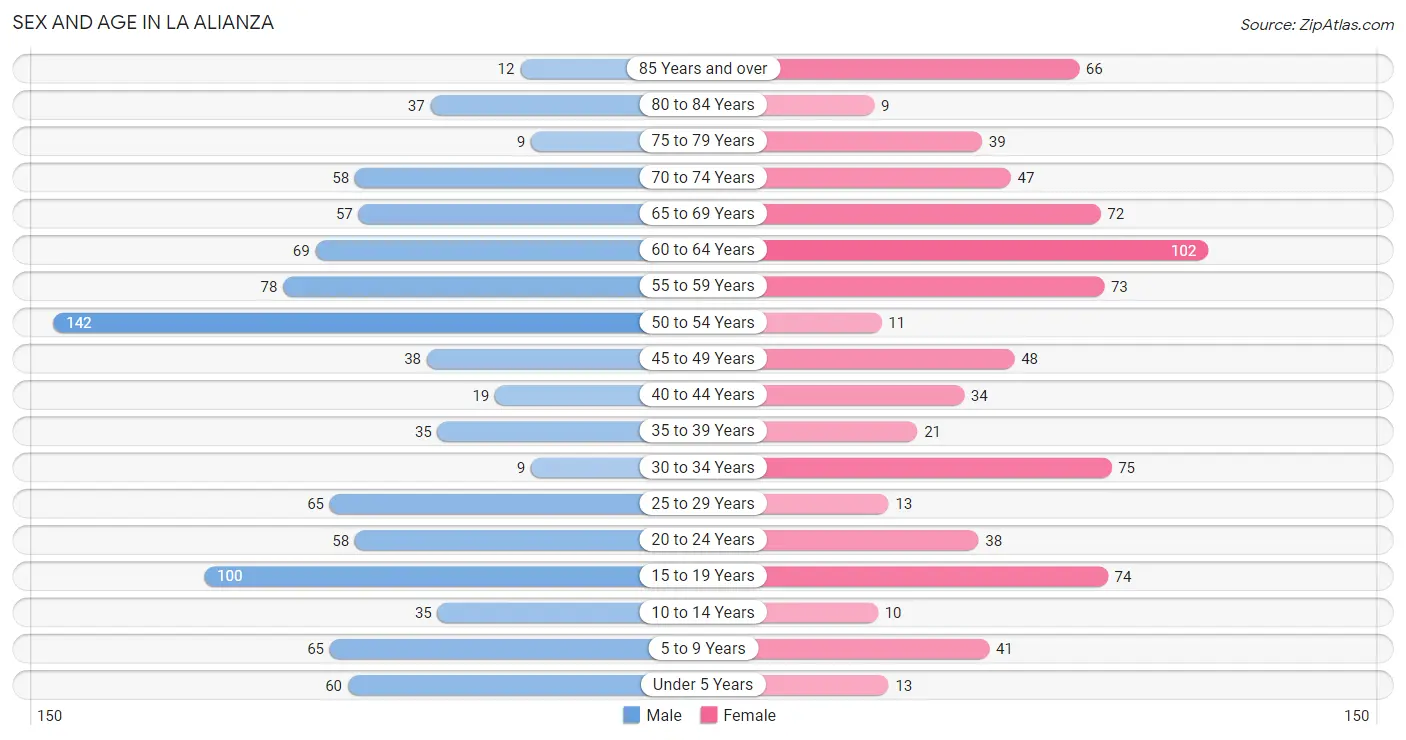
| Age Bracket | Male | Female |
| Under 5 Years | 60 (6.3%) | 13 (1.7%) |
| 5 to 9 Years | 65 (6.9%) | 41 (5.2%) |
| 10 to 14 Years | 35 (3.7%) | 10 (1.3%) |
| 15 to 19 Years | 100 (10.6%) | 74 (9.4%) |
| 20 to 24 Years | 58 (6.1%) | 38 (4.8%) |
| 25 to 29 Years | 65 (6.9%) | 13 (1.7%) |
| 30 to 34 Years | 9 (0.9%) | 75 (9.5%) |
| 35 to 39 Years | 35 (3.7%) | 21 (2.7%) |
| 40 to 44 Years | 19 (2.0%) | 34 (4.3%) |
| 45 to 49 Years | 38 (4.0%) | 48 (6.1%) |
| 50 to 54 Years | 142 (15.0%) | 11 (1.4%) |
| 55 to 59 Years | 78 (8.3%) | 73 (9.3%) |
| 60 to 64 Years | 69 (7.3%) | 102 (13.0%) |
| 65 to 69 Years | 57 (6.0%) | 72 (9.2%) |
| 70 to 74 Years | 58 (6.1%) | 47 (6.0%) |
| 75 to 79 Years | 9 (0.9%) | 39 (5.0%) |
| 80 to 84 Years | 37 (3.9%) | 9 (1.1%) |
| 85 Years and over | 12 (1.3%) | 66 (8.4%) |
| Total | 946 (100.0%) | 786 (100.0%) |
Families and Households in La Alianza
Median Family Size in La Alianza
The median family size in La Alianza is 3.28 persons per family, with single female/mother families (126 | 28.6%) accounting for the largest median family size of 3.64 persons per family. On the other hand, married-couple families (254 | 57.7%) represent the smallest median family size with 3.06 persons per family.
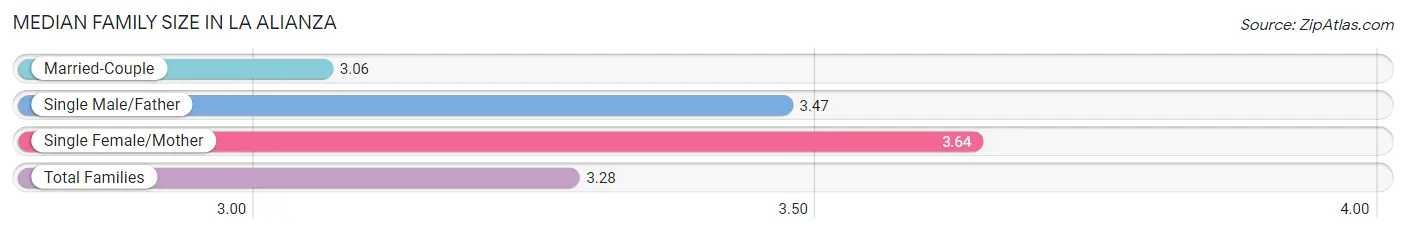
| Family Type | # Families | Family Size |
| Married-Couple | 254 (57.7%) | 3.06 |
| Single Male/Father | 60 (13.6%) | 3.47 |
| Single Female/Mother | 126 (28.6%) | 3.64 |
| Total Families | 440 (100.0%) | 3.28 |
Median Household Size in La Alianza
The median household size in La Alianza is 2.66 persons per household, with single male/father households (60 | 9.2%) accounting for the largest median household size of 4 persons per household. non-family households (210 | 32.3%) represent the smallest median household size with 1.04 persons per household.
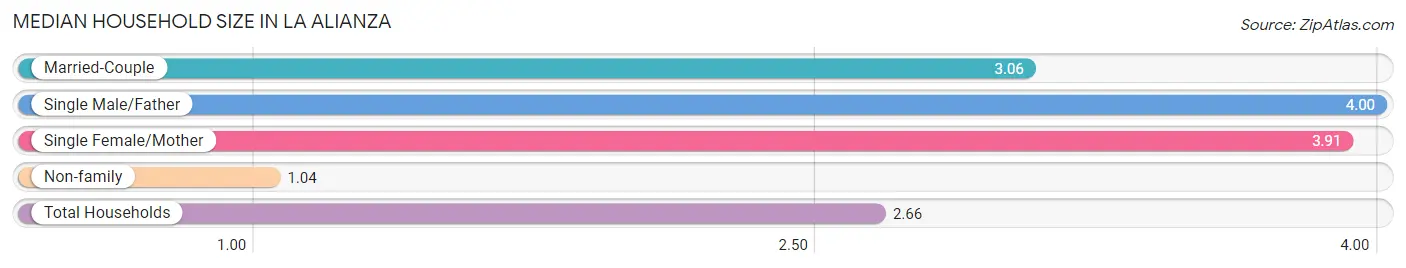
| Household Type | # Households | Household Size |
| Married-Couple | 254 (39.1%) | 3.06 |
| Single Male/Father | 60 (9.2%) | 4.00 |
| Single Female/Mother | 126 (19.4%) | 3.91 |
| Non-family | 210 (32.3%) | 1.04 |
| Total Households | 650 (100.0%) | 2.66 |
Household Size by Marriage Status in La Alianza
Out of a total of 650 households in La Alianza, 440 (67.7%) are family households, while 210 (32.3%) are nonfamily households. The most numerous type of family households are 2-person households, comprising 233, and the most common type of nonfamily households are 1-person households, comprising 200.
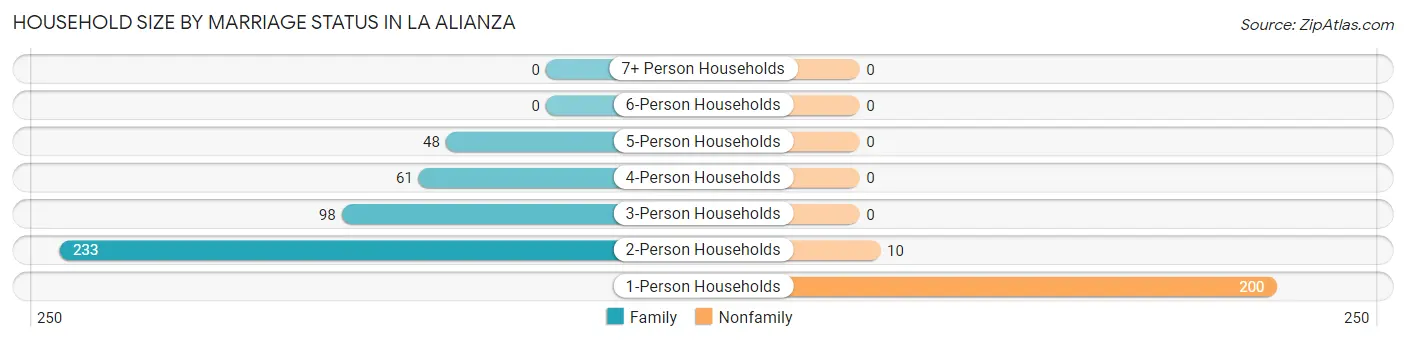
| Household Size | Family Households | Nonfamily Households |
| 1-Person Households | - | 200 (30.8%) |
| 2-Person Households | 233 (35.8%) | 10 (1.5%) |
| 3-Person Households | 98 (15.1%) | 0 (0.0%) |
| 4-Person Households | 61 (9.4%) | 0 (0.0%) |
| 5-Person Households | 48 (7.4%) | 0 (0.0%) |
| 6-Person Households | 0 (0.0%) | 0 (0.0%) |
| 7+ Person Households | 0 (0.0%) | 0 (0.0%) |
| Total | 440 (67.7%) | 210 (32.3%) |
Female Fertility in La Alianza
Fertility by Age in La Alianza
Average fertility rate in La Alianza is 43.0 births per 1,000 women. Women in the age bracket of 20 to 34 years have the highest fertility rate with 103.0 births per 1,000 women. Women in the age bracket of 20 to 34 years acount for 100.0% of all women with births.
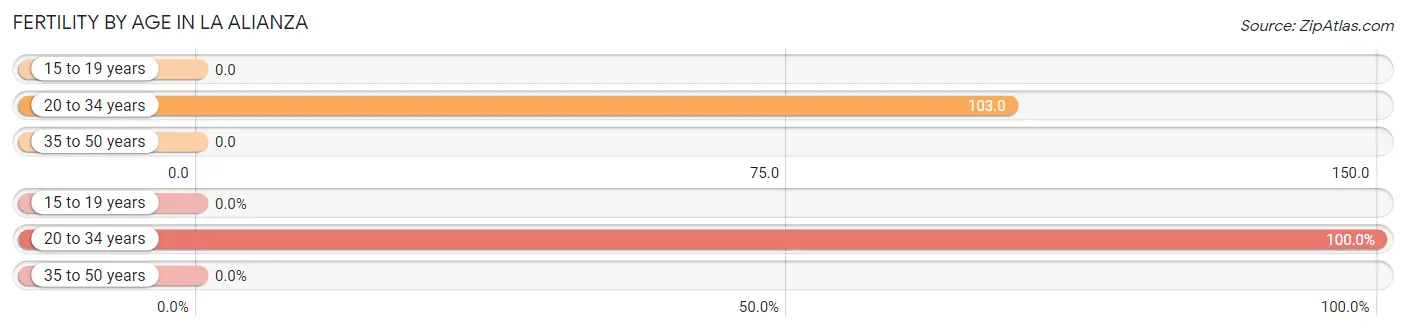
| Age Bracket | Women with Births | Births / 1,000 Women |
| 15 to 19 years | 0 (0.0%) | 0.0 |
| 20 to 34 years | 13 (100.0%) | 103.0 |
| 35 to 50 years | 0 (0.0%) | 0.0 |
| Total | 13 (100.0%) | 43.0 |
Fertility by Age by Marriage Status in La Alianza
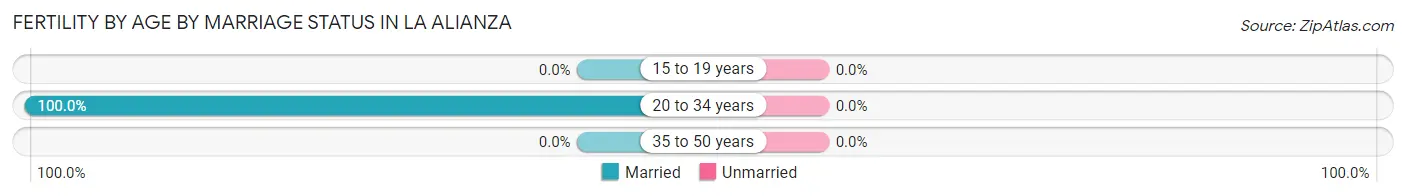
| Age Bracket | Married | Unmarried |
| 15 to 19 years | 0 (0.0%) | 0 (0.0%) |
| 20 to 34 years | 13 (100.0%) | 0 (0.0%) |
| 35 to 50 years | 0 (0.0%) | 0 (0.0%) |
| Total | 13 (100.0%) | 0 (0.0%) |
Fertility by Education in La Alianza
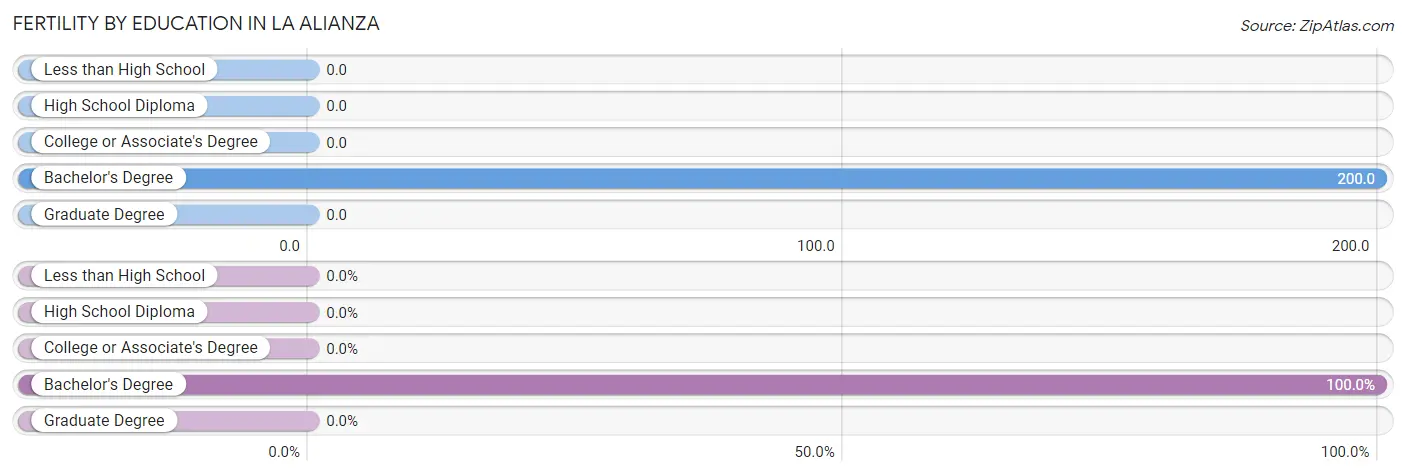
| Educational Attainment | Women with Births | Births / 1,000 Women |
| Less than High School | 0 (0.0%) | 0.0 |
| High School Diploma | 0 (0.0%) | 0.0 |
| College or Associate's Degree | 0 (0.0%) | 0.0 |
| Bachelor's Degree | 13 (100.0%) | 200.0 |
| Graduate Degree | 0 (0.0%) | 0.0 |
| Total | 13 (100.0%) | 43.0 |
Fertility by Education by Marriage Status in La Alianza
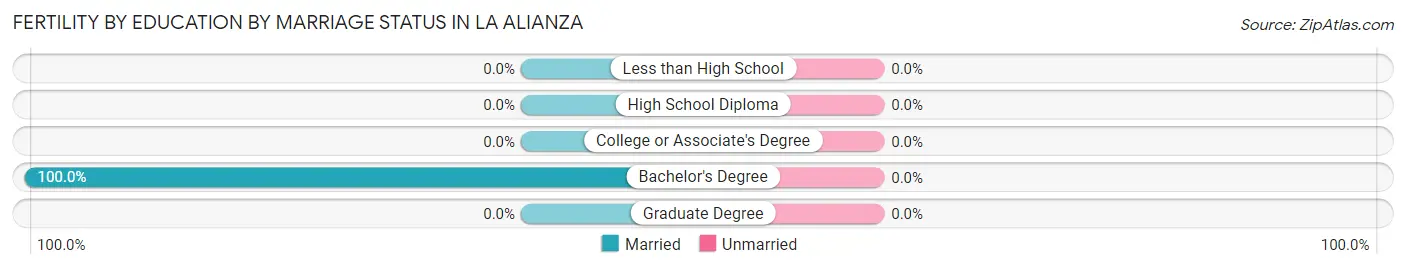
| Educational Attainment | Married | Unmarried |
| Less than High School | 0 (0.0%) | 0 (0.0%) |
| High School Diploma | 0 (0.0%) | 0 (0.0%) |
| College or Associate's Degree | 0 (0.0%) | 0 (0.0%) |
| Bachelor's Degree | 13 (100.0%) | 0 (0.0%) |
| Graduate Degree | 0 (0.0%) | 0 (0.0%) |
| Total | 13 (100.0%) | 0 (0.0%) |
Employment Characteristics in La Alianza
Employment by Class of Employer in La Alianza
Among the 266 employed individuals in La Alianza, private company employees (186 | 69.9%), state government employees (31 | 11.7%), and self-employed (incorporated) (22 | 8.3%) make up the most common classes of employment.
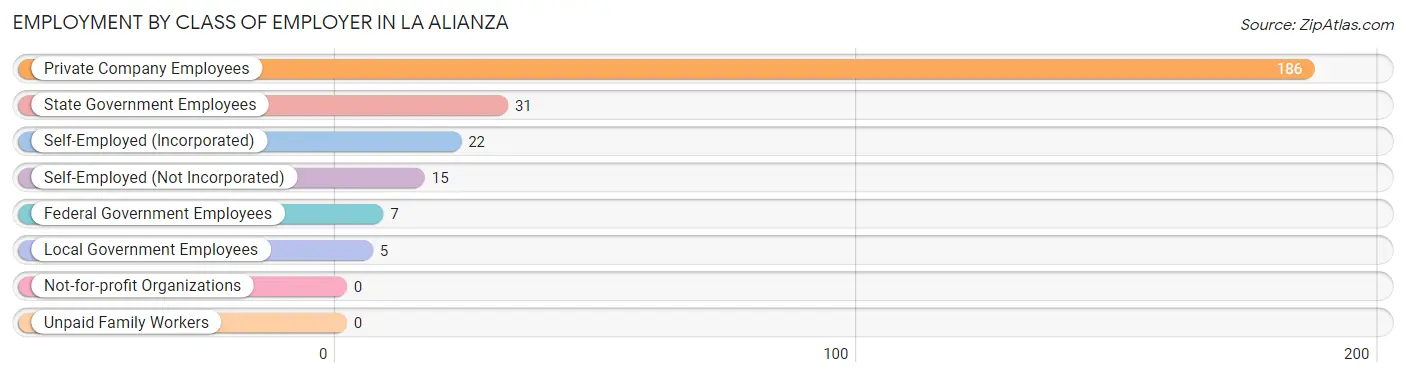
| Employer Class | # Employees | % Employees |
| Private Company Employees | 186 | 69.9% |
| Self-Employed (Incorporated) | 22 | 8.3% |
| Self-Employed (Not Incorporated) | 15 | 5.6% |
| Not-for-profit Organizations | 0 | 0.0% |
| Local Government Employees | 5 | 1.9% |
| State Government Employees | 31 | 11.7% |
| Federal Government Employees | 7 | 2.6% |
| Unpaid Family Workers | 0 | 0.0% |
| Total | 266 | 100.0% |
Employment Status by Age in La Alianza
According to the labor force statistics for La Alianza, out of the total population over 16 years of age (1,466), 24.1% or 353 individuals are in the labor force, with 24.6% or 87 of them unemployed. The age group with the highest labor force participation rate is 25 to 29 years, with 73.1% or 57 individuals in the labor force. Within the labor force, the 35 to 44 years age range has the highest percentage of unemployed individuals, with 39.6% or 19 of them being unemployed.
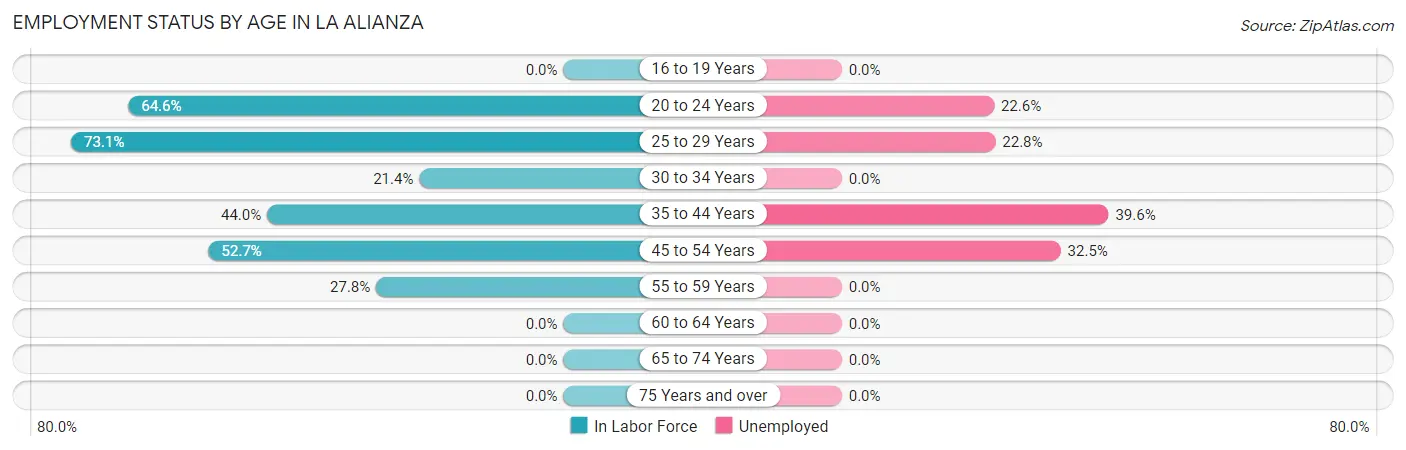
| Age Bracket | In Labor Force | Unemployed |
| 16 to 19 Years | 0 (0.0%) | 0 (0.0%) |
| 20 to 24 Years | 62 (64.6%) | 14 (22.6%) |
| 25 to 29 Years | 57 (73.1%) | 13 (22.8%) |
| 30 to 34 Years | 18 (21.4%) | 0 (0.0%) |
| 35 to 44 Years | 48 (44.0%) | 19 (39.6%) |
| 45 to 54 Years | 126 (52.7%) | 41 (32.5%) |
| 55 to 59 Years | 42 (27.8%) | 0 (0.0%) |
| 60 to 64 Years | 0 (0.0%) | 0 (0.0%) |
| 65 to 74 Years | 0 (0.0%) | 0 (0.0%) |
| 75 Years and over | 0 (0.0%) | 0 (0.0%) |
| Total | 353 (24.1%) | 87 (24.6%) |
Employment Status by Educational Attainment in La Alianza
According to labor force statistics for La Alianza, 35.0% of individuals (291) out of the total population between 25 and 64 years of age (832) are in the labor force, with 25.1% or 73 of them being unemployed. The group with the highest labor force participation rate are those with the educational attainment of bachelor's degree or higher, with 70.9% or 100 individuals in the labor force. Within the labor force, individuals with high school diploma education have the highest percentage of unemployment, with 59.3% or 73 of them being unemployed.
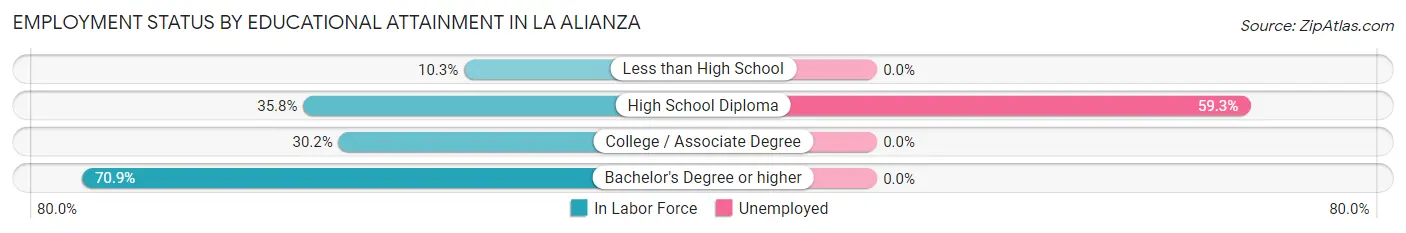
| Educational Attainment | In Labor Force | Unemployed |
| Less than High School | 19 (10.3%) | 0 (0.0%) |
| High School Diploma | 123 (35.8%) | 204 (59.3%) |
| College / Associate Degree | 49 (30.2%) | 0 (0.0%) |
| Bachelor's Degree or higher | 100 (70.9%) | 0 (0.0%) |
| Total | 291 (35.0%) | 209 (25.1%) |
Employment Occupations by Sex in La Alianza
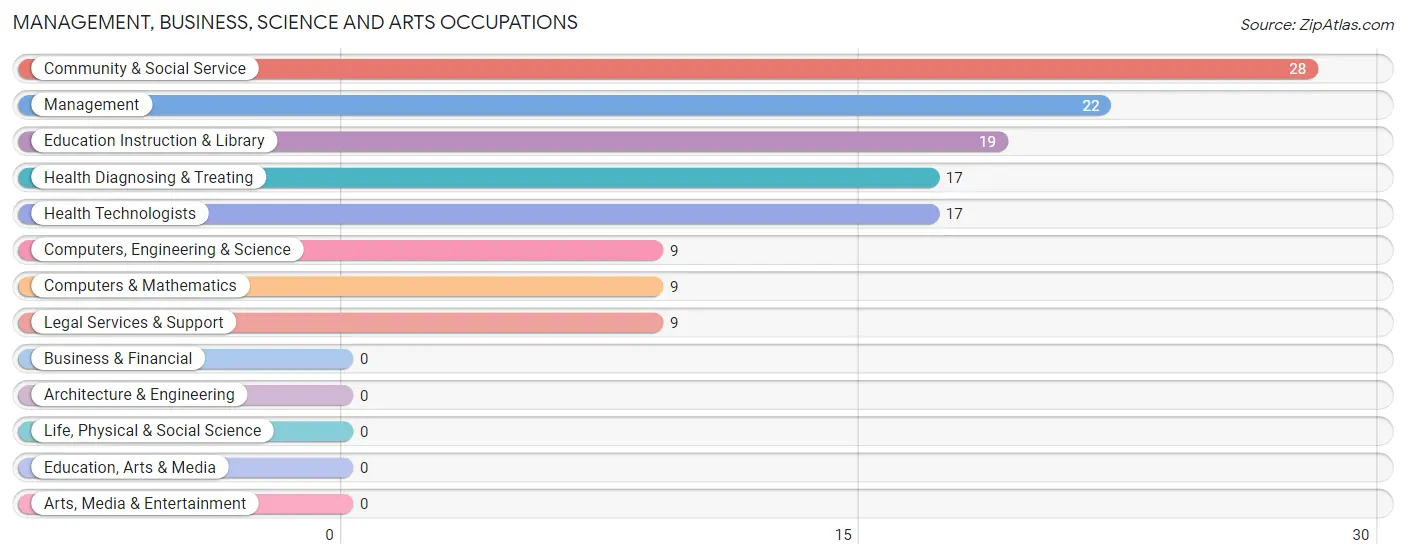
Management, Business, Science and Arts Occupations
The most common Management, Business, Science and Arts occupations in La Alianza are Community & Social Service (28 | 10.5%), Management (22 | 8.3%), Education Instruction & Library (19 | 7.1%), Health Diagnosing & Treating (17 | 6.4%), and Health Technologists (17 | 6.4%).
Management, Business, Science and Arts Occupations by Sex
Within the Management, Business, Science and Arts occupations in La Alianza, the most male-oriented occupations are Management (100.0%), Legal Services & Support (100.0%), and Community & Social Service (32.1%), while the most female-oriented occupations are Computers, Engineering & Science (100.0%), Computers & Mathematics (100.0%), and Education Instruction & Library (100.0%).
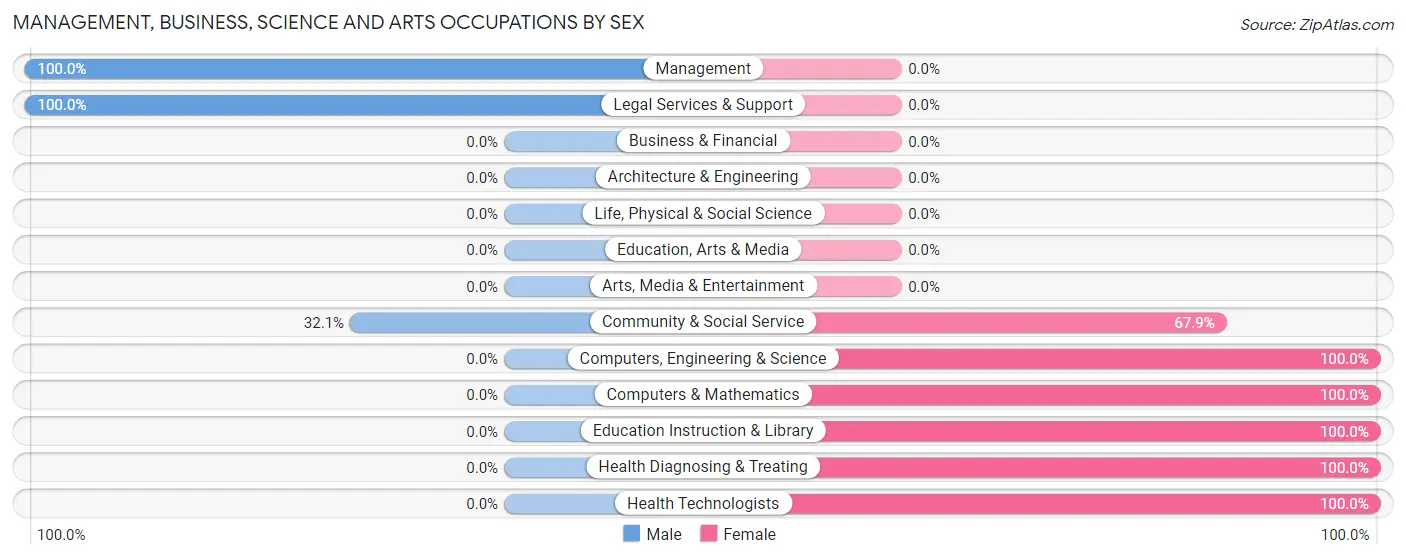
| Occupation | Male | Female |
| Management | 22 (100.0%) | 0 (0.0%) |
| Business & Financial | 0 (0.0%) | 0 (0.0%) |
| Computers, Engineering & Science | 0 (0.0%) | 9 (100.0%) |
| Computers & Mathematics | 0 (0.0%) | 9 (100.0%) |
| Architecture & Engineering | 0 (0.0%) | 0 (0.0%) |
| Life, Physical & Social Science | 0 (0.0%) | 0 (0.0%) |
| Community & Social Service | 9 (32.1%) | 19 (67.9%) |
| Education, Arts & Media | 0 (0.0%) | 0 (0.0%) |
| Legal Services & Support | 9 (100.0%) | 0 (0.0%) |
| Education Instruction & Library | 0 (0.0%) | 19 (100.0%) |
| Arts, Media & Entertainment | 0 (0.0%) | 0 (0.0%) |
| Health Diagnosing & Treating | 0 (0.0%) | 17 (100.0%) |
| Health Technologists | 0 (0.0%) | 17 (100.0%) |
| Total (Category) | 31 (40.8%) | 45 (59.2%) |
| Total (Overall) | 194 (72.9%) | 72 (27.1%) |
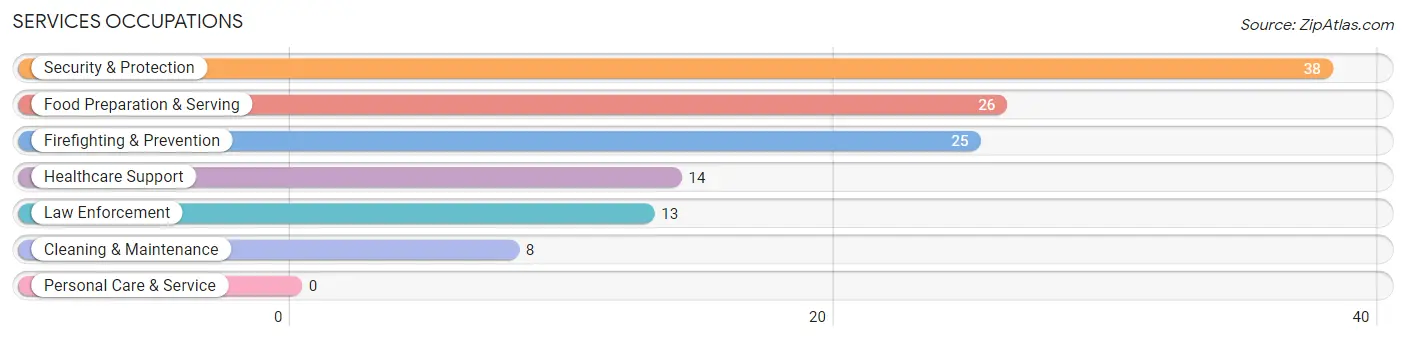
Services Occupations
The most common Services occupations in La Alianza are Security & Protection (38 | 14.3%), Food Preparation & Serving (26 | 9.8%), Firefighting & Prevention (25 | 9.4%), Healthcare Support (14 | 5.3%), and Law Enforcement (13 | 4.9%).
Services Occupations by Sex
Within the Services occupations in La Alianza, the most male-oriented occupations are Security & Protection (100.0%), Firefighting & Prevention (100.0%), and Law Enforcement (100.0%), while the most female-oriented occupations are Healthcare Support (64.3%), and Food Preparation & Serving (50.0%).
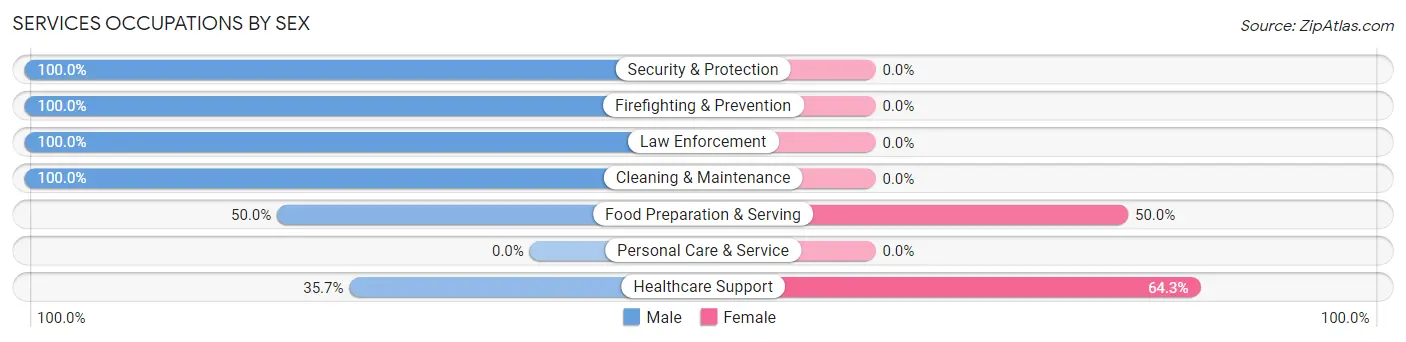
| Occupation | Male | Female |
| Healthcare Support | 5 (35.7%) | 9 (64.3%) |
| Security & Protection | 38 (100.0%) | 0 (0.0%) |
| Firefighting & Prevention | 25 (100.0%) | 0 (0.0%) |
| Law Enforcement | 13 (100.0%) | 0 (0.0%) |
| Food Preparation & Serving | 13 (50.0%) | 13 (50.0%) |
| Cleaning & Maintenance | 8 (100.0%) | 0 (0.0%) |
| Personal Care & Service | 0 (0.0%) | 0 (0.0%) |
| Total (Category) | 64 (74.4%) | 22 (25.6%) |
| Total (Overall) | 194 (72.9%) | 72 (27.1%) |
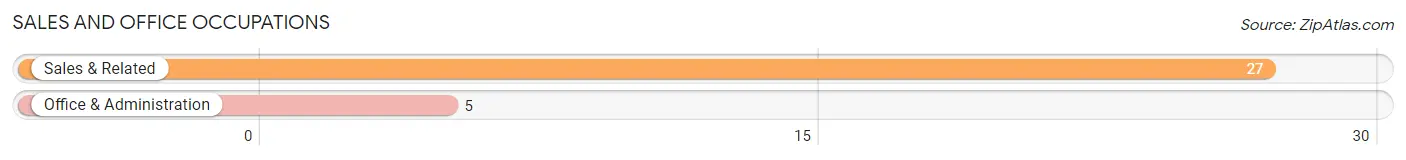
Sales and Office Occupations
The most common Sales and Office occupations in La Alianza are Sales & Related (27 | 10.2%), and Office & Administration (5 | 1.9%).
Sales and Office Occupations by Sex
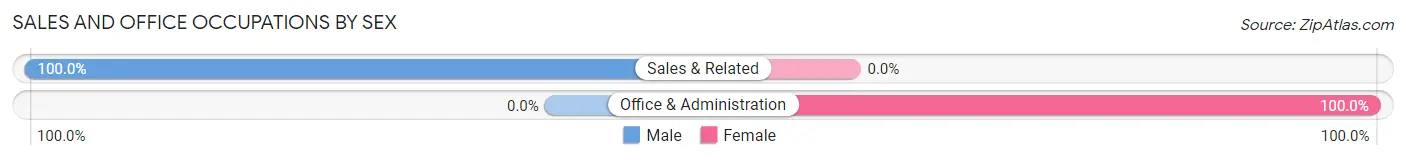
| Occupation | Male | Female |
| Sales & Related | 27 (100.0%) | 0 (0.0%) |
| Office & Administration | 0 (0.0%) | 5 (100.0%) |
| Total (Category) | 27 (84.4%) | 5 (15.6%) |
| Total (Overall) | 194 (72.9%) | 72 (27.1%) |
Natural Resources, Construction and Maintenance Occupations
The most common Natural Resources, Construction and Maintenance occupations in La Alianza are Installation, Maintenance & Repair (13 | 4.9%), Farming, Fishing & Forestry (10 | 3.8%), and Construction & Extraction (6 | 2.3%).
Natural Resources, Construction and Maintenance Occupations by Sex
| Occupation | Male | Female |
| Farming, Fishing & Forestry | 10 (100.0%) | 0 (0.0%) |
| Construction & Extraction | 6 (100.0%) | 0 (0.0%) |
| Installation, Maintenance & Repair | 13 (100.0%) | 0 (0.0%) |
| Total (Category) | 29 (100.0%) | 0 (0.0%) |
| Total (Overall) | 194 (72.9%) | 72 (27.1%) |
Production, Transportation and Moving Occupations
The most common Production, Transportation and Moving occupations in La Alianza are Transportation (35 | 13.2%), and Production (8 | 3.0%).
Production, Transportation and Moving Occupations by Sex
| Occupation | Male | Female |
| Production | 8 (100.0%) | 0 (0.0%) |
| Transportation | 35 (100.0%) | 0 (0.0%) |
| Material Moving | 0 (0.0%) | 0 (0.0%) |
| Total (Category) | 43 (100.0%) | 0 (0.0%) |
| Total (Overall) | 194 (72.9%) | 72 (27.1%) |
Employment Industries by Sex in La Alianza
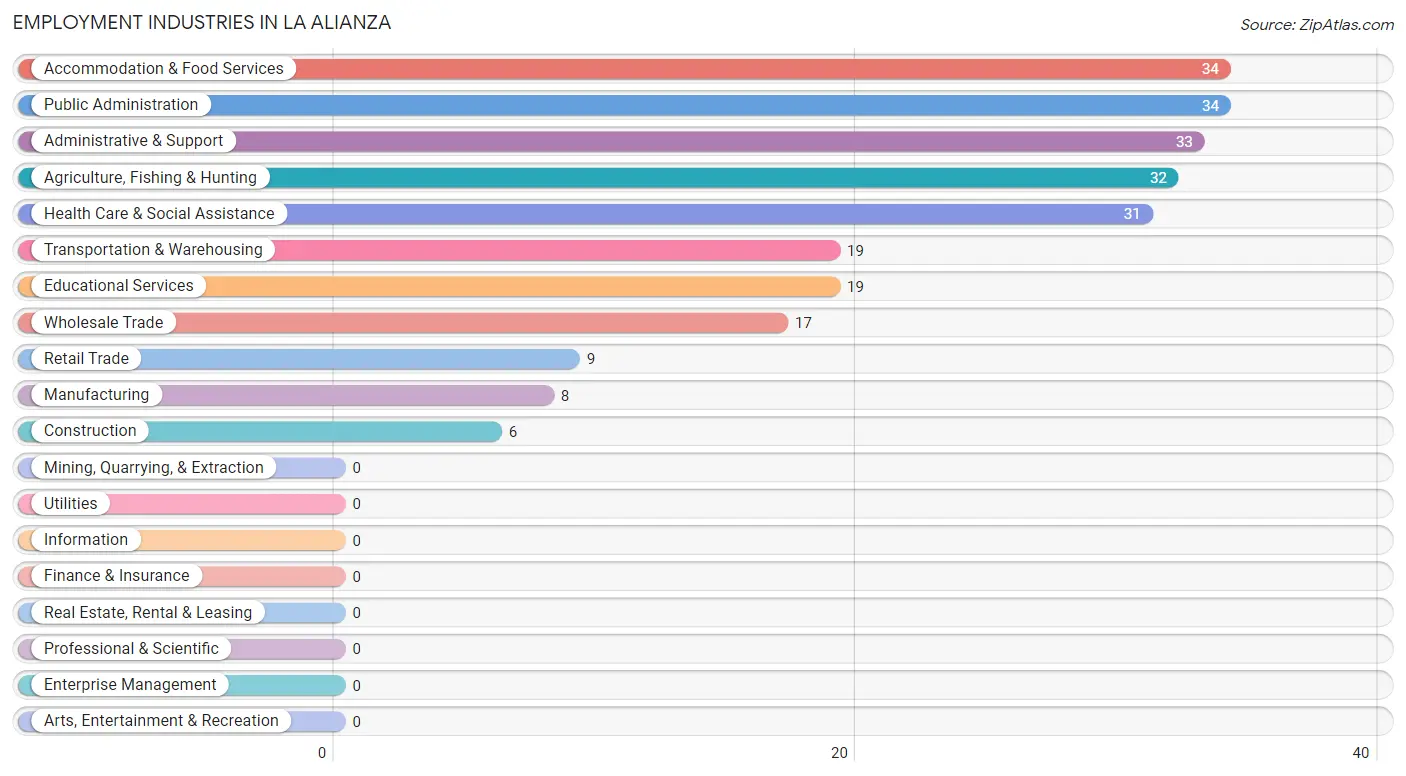
Employment Industries in La Alianza
The major employment industries in La Alianza include Accommodation & Food Services (34 | 12.8%), Public Administration (34 | 12.8%), Administrative & Support (33 | 12.4%), Agriculture, Fishing & Hunting (32 | 12.0%), and Health Care & Social Assistance (31 | 11.7%).
Employment Industries by Sex in La Alianza
The La Alianza industries that see more men than women are Agriculture, Fishing & Hunting (100.0%), Construction (100.0%), and Manufacturing (100.0%), whereas the industries that tend to have a higher number of women are Educational Services (100.0%), Health Care & Social Assistance (83.9%), and Accommodation & Food Services (38.2%).
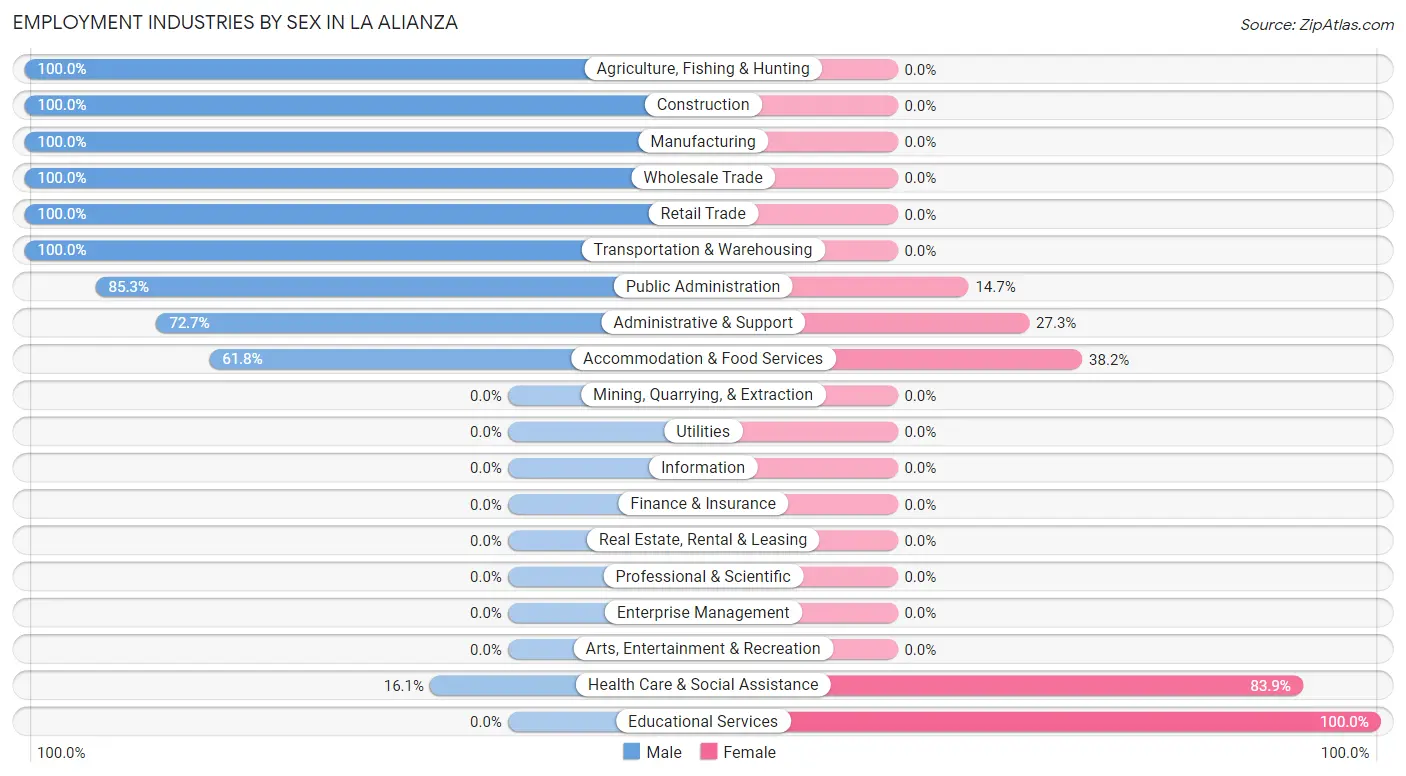
| Industry | Male | Female |
| Agriculture, Fishing & Hunting | 32 (100.0%) | 0 (0.0%) |
| Mining, Quarrying, & Extraction | 0 (0.0%) | 0 (0.0%) |
| Construction | 6 (100.0%) | 0 (0.0%) |
| Manufacturing | 8 (100.0%) | 0 (0.0%) |
| Wholesale Trade | 17 (100.0%) | 0 (0.0%) |
| Retail Trade | 9 (100.0%) | 0 (0.0%) |
| Transportation & Warehousing | 19 (100.0%) | 0 (0.0%) |
| Utilities | 0 (0.0%) | 0 (0.0%) |
| Information | 0 (0.0%) | 0 (0.0%) |
| Finance & Insurance | 0 (0.0%) | 0 (0.0%) |
| Real Estate, Rental & Leasing | 0 (0.0%) | 0 (0.0%) |
| Professional & Scientific | 0 (0.0%) | 0 (0.0%) |
| Enterprise Management | 0 (0.0%) | 0 (0.0%) |
| Administrative & Support | 24 (72.7%) | 9 (27.3%) |
| Educational Services | 0 (0.0%) | 19 (100.0%) |
| Health Care & Social Assistance | 5 (16.1%) | 26 (83.9%) |
| Arts, Entertainment & Recreation | 0 (0.0%) | 0 (0.0%) |
| Accommodation & Food Services | 21 (61.8%) | 13 (38.2%) |
| Public Administration | 29 (85.3%) | 5 (14.7%) |
| Total | 194 (72.9%) | 72 (27.1%) |
Education in La Alianza
School Enrollment in La Alianza
The most common levels of schooling among the 376 students in La Alianza are college / undergraduate (108 | 28.7%), high school (93 | 24.7%), and elementary school (61 | 16.2%).
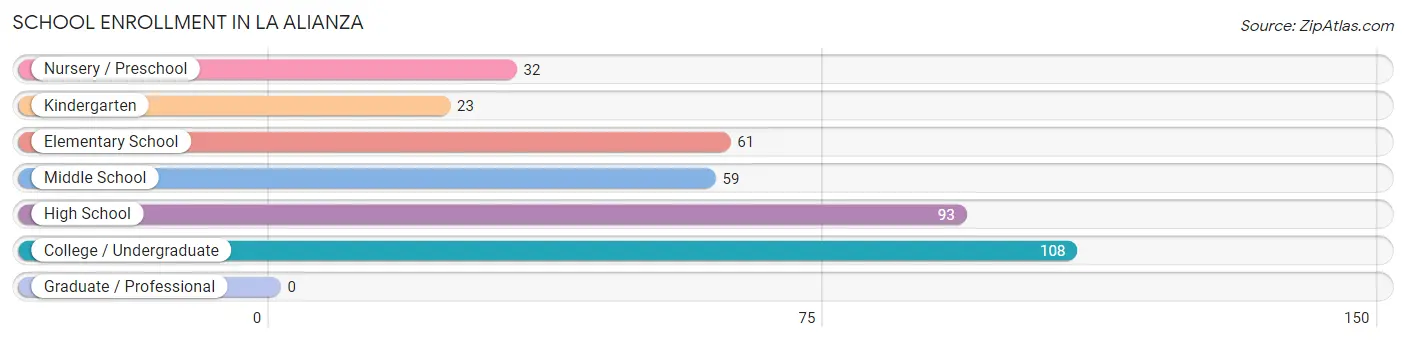
| School Level | # Students | % Students |
| Nursery / Preschool | 32 | 8.5% |
| Kindergarten | 23 | 6.1% |
| Elementary School | 61 | 16.2% |
| Middle School | 59 | 15.7% |
| High School | 93 | 24.7% |
| College / Undergraduate | 108 | 28.7% |
| Graduate / Professional | 0 | 0.0% |
| Total | 376 | 100.0% |
School Enrollment by Age by Funding Source in La Alianza
Out of a total of 376 students who are enrolled in schools in La Alianza, 100 (26.6%) attend a private institution, while the remaining 276 (73.4%) are enrolled in public schools. The age group of 25 to 34 year olds has the highest likelihood of being enrolled in private schools, with 21 (100.0% in the age bracket) enrolled. Conversely, the age group of 3 to 4 year olds has the lowest likelihood of being enrolled in a private school, with 10 (100.0% in the age bracket) attending a public institution.
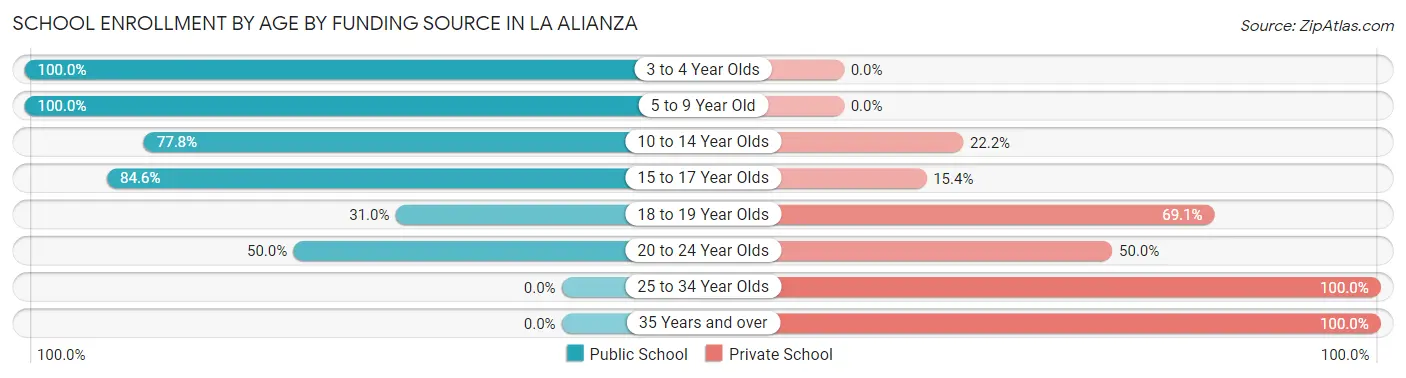
| Age Bracket | Public School | Private School |
| 3 to 4 Year Olds | 10 (100.0%) | 0 (0.0%) |
| 5 to 9 Year Old | 106 (100.0%) | 0 (0.0%) |
| 10 to 14 Year Olds | 35 (77.8%) | 10 (22.2%) |
| 15 to 17 Year Olds | 99 (84.6%) | 18 (15.4%) |
| 18 to 19 Year Olds | 13 (30.9%) | 29 (69.1%) |
| 20 to 24 Year Olds | 13 (50.0%) | 13 (50.0%) |
| 25 to 34 Year Olds | 0 (0.0%) | 21 (100.0%) |
| 35 Years and over | 0 (0.0%) | 9 (100.0%) |
| Total | 276 (73.4%) | 100 (26.6%) |
Educational Attainment by Field of Study in La Alianza
Education (34 | 21.8%), arts & humanities (34 | 21.8%), business (28 | 17.9%), physical & health sciences (22 | 14.1%), and science & technology (13 | 8.3%) are the most common fields of study among 156 individuals in La Alianza who have obtained a bachelor's degree or higher.
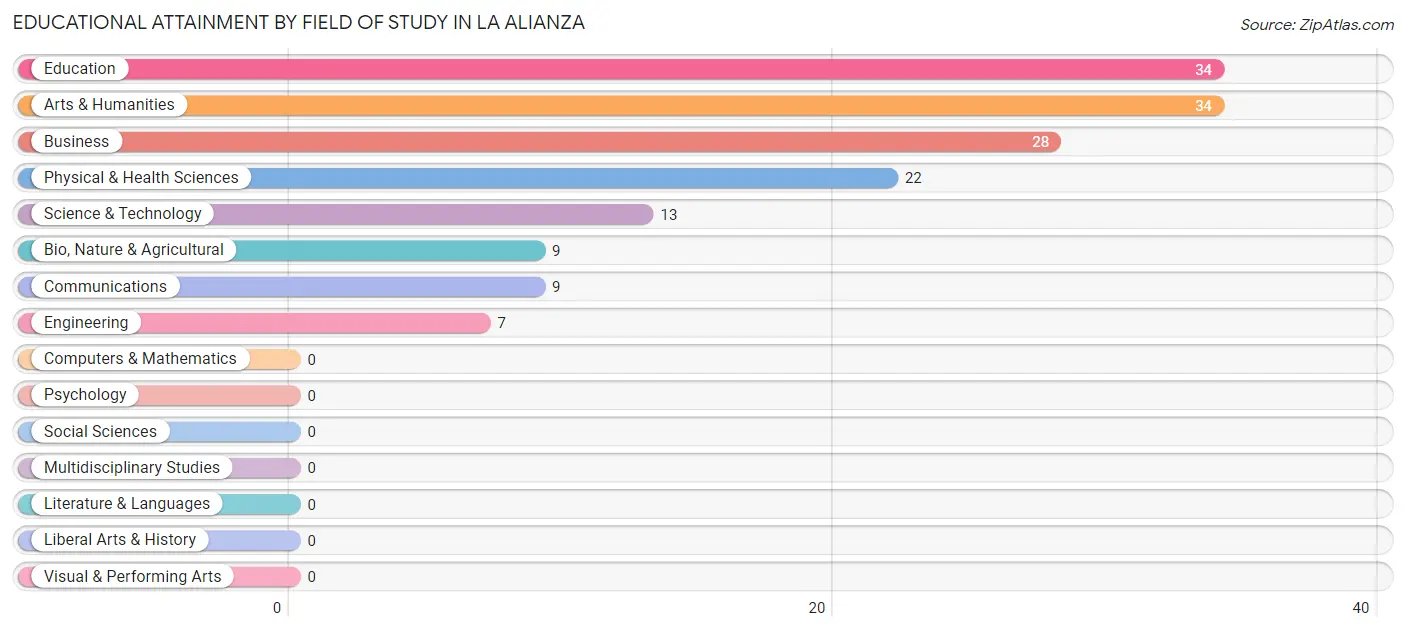
| Field of Study | # Graduates | % Graduates |
| Computers & Mathematics | 0 | 0.0% |
| Bio, Nature & Agricultural | 9 | 5.8% |
| Physical & Health Sciences | 22 | 14.1% |
| Psychology | 0 | 0.0% |
| Social Sciences | 0 | 0.0% |
| Engineering | 7 | 4.5% |
| Multidisciplinary Studies | 0 | 0.0% |
| Science & Technology | 13 | 8.3% |
| Business | 28 | 17.9% |
| Education | 34 | 21.8% |
| Literature & Languages | 0 | 0.0% |
| Liberal Arts & History | 0 | 0.0% |
| Visual & Performing Arts | 0 | 0.0% |
| Communications | 9 | 5.8% |
| Arts & Humanities | 34 | 21.8% |
| Total | 156 | 100.0% |
Transportation & Commute in La Alianza
Vehicle Availability by Sex in La Alianza
The most prevalent vehicle ownership categories in La Alianza are males with 1 vehicle (90, accounting for 46.4%) and females with 1 vehicle (39, making up 125.0%).
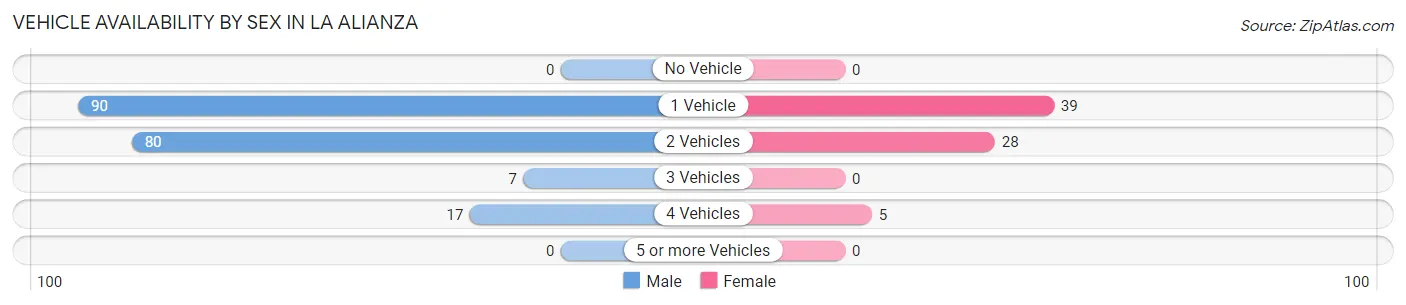
| Vehicles Available | Male | Female |
| No Vehicle | 0 (0.0%) | 0 (0.0%) |
| 1 Vehicle | 90 (46.4%) | 39 (54.2%) |
| 2 Vehicles | 80 (41.2%) | 28 (38.9%) |
| 3 Vehicles | 7 (3.6%) | 0 (0.0%) |
| 4 Vehicles | 17 (8.8%) | 5 (6.9%) |
| 5 or more Vehicles | 0 (0.0%) | 0 (0.0%) |
| Total | 194 (100.0%) | 72 (100.0%) |
Commute Time in La Alianza
The most frequently occuring commute durations in La Alianza are 10 to 14 minutes (62 commuters, 24.1%), 30 to 34 minutes (46 commuters, 17.9%), and 20 to 24 minutes (32 commuters, 12.4%).
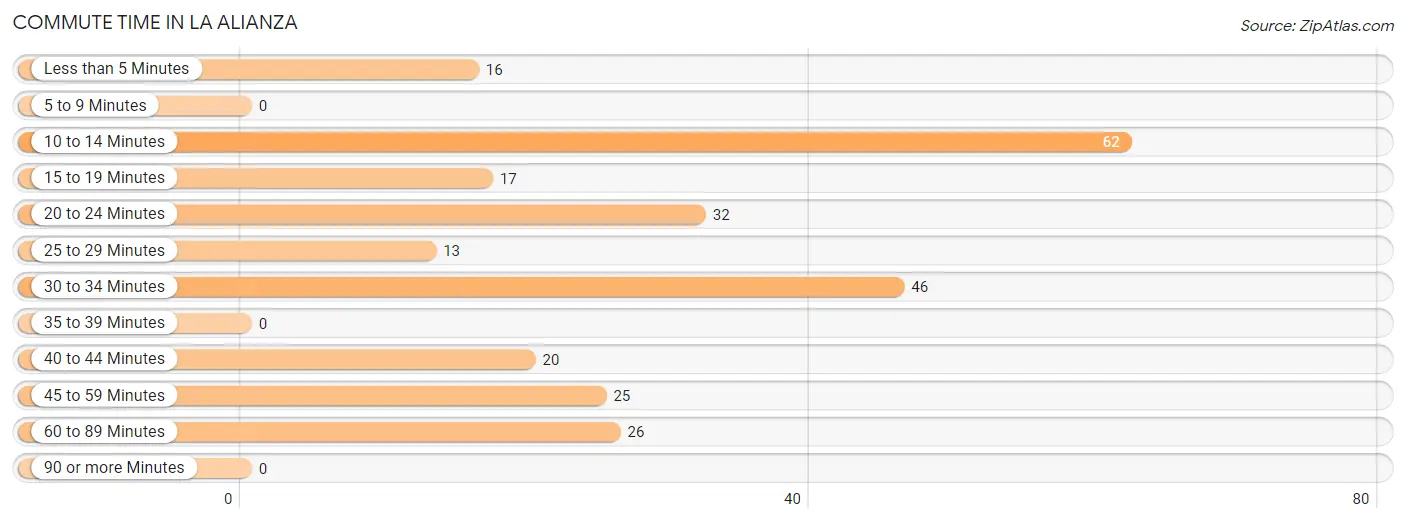
| Commute Time | # Commuters | % Commuters |
| Less than 5 Minutes | 16 | 6.2% |
| 5 to 9 Minutes | 0 | 0.0% |
| 10 to 14 Minutes | 62 | 24.1% |
| 15 to 19 Minutes | 17 | 6.6% |
| 20 to 24 Minutes | 32 | 12.4% |
| 25 to 29 Minutes | 13 | 5.1% |
| 30 to 34 Minutes | 46 | 17.9% |
| 35 to 39 Minutes | 0 | 0.0% |
| 40 to 44 Minutes | 20 | 7.8% |
| 45 to 59 Minutes | 25 | 9.7% |
| 60 to 89 Minutes | 26 | 10.1% |
| 90 or more Minutes | 0 | 0.0% |
Commute Time by Sex in La Alianza
The most common commute times in La Alianza are 10 to 14 minutes (45 commuters, 24.3%) for males and 10 to 14 minutes (17 commuters, 23.6%) for females.
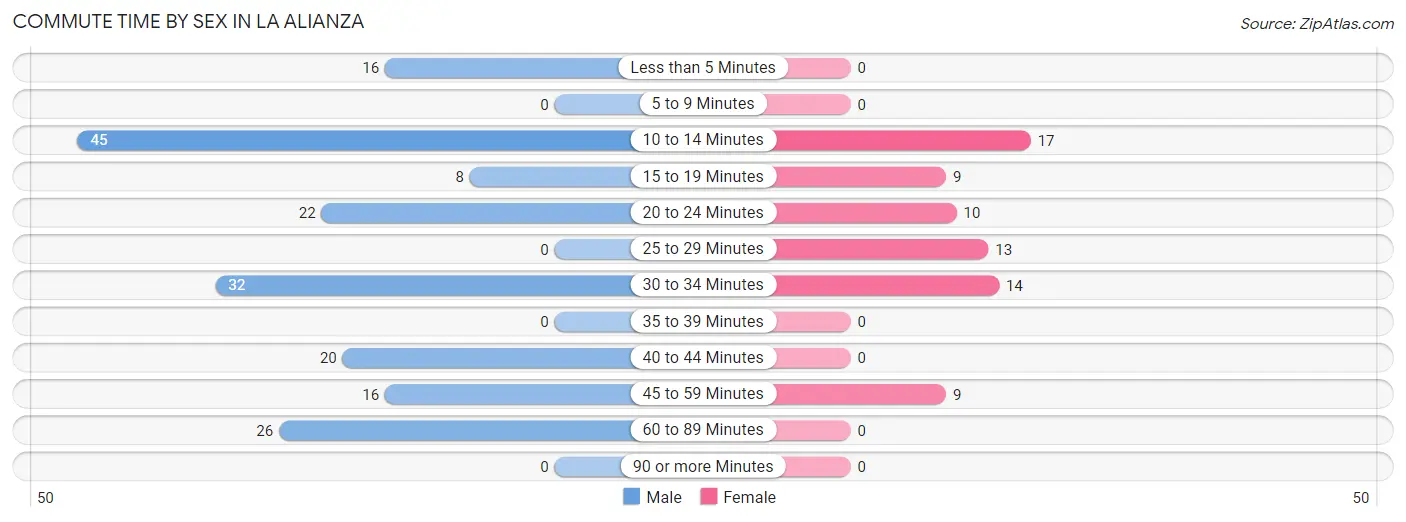
| Commute Time | Male | Female |
| Less than 5 Minutes | 16 (8.6%) | 0 (0.0%) |
| 5 to 9 Minutes | 0 (0.0%) | 0 (0.0%) |
| 10 to 14 Minutes | 45 (24.3%) | 17 (23.6%) |
| 15 to 19 Minutes | 8 (4.3%) | 9 (12.5%) |
| 20 to 24 Minutes | 22 (11.9%) | 10 (13.9%) |
| 25 to 29 Minutes | 0 (0.0%) | 13 (18.1%) |
| 30 to 34 Minutes | 32 (17.3%) | 14 (19.4%) |
| 35 to 39 Minutes | 0 (0.0%) | 0 (0.0%) |
| 40 to 44 Minutes | 20 (10.8%) | 0 (0.0%) |
| 45 to 59 Minutes | 16 (8.6%) | 9 (12.5%) |
| 60 to 89 Minutes | 26 (14.1%) | 0 (0.0%) |
| 90 or more Minutes | 0 (0.0%) | 0 (0.0%) |
Time of Departure to Work by Sex in La Alianza
The most frequent times of departure to work in La Alianza are 6:30 AM to 6:59 AM (66, 35.7%) for males and 7:00 AM to 7:29 AM (22, 30.6%) for females.
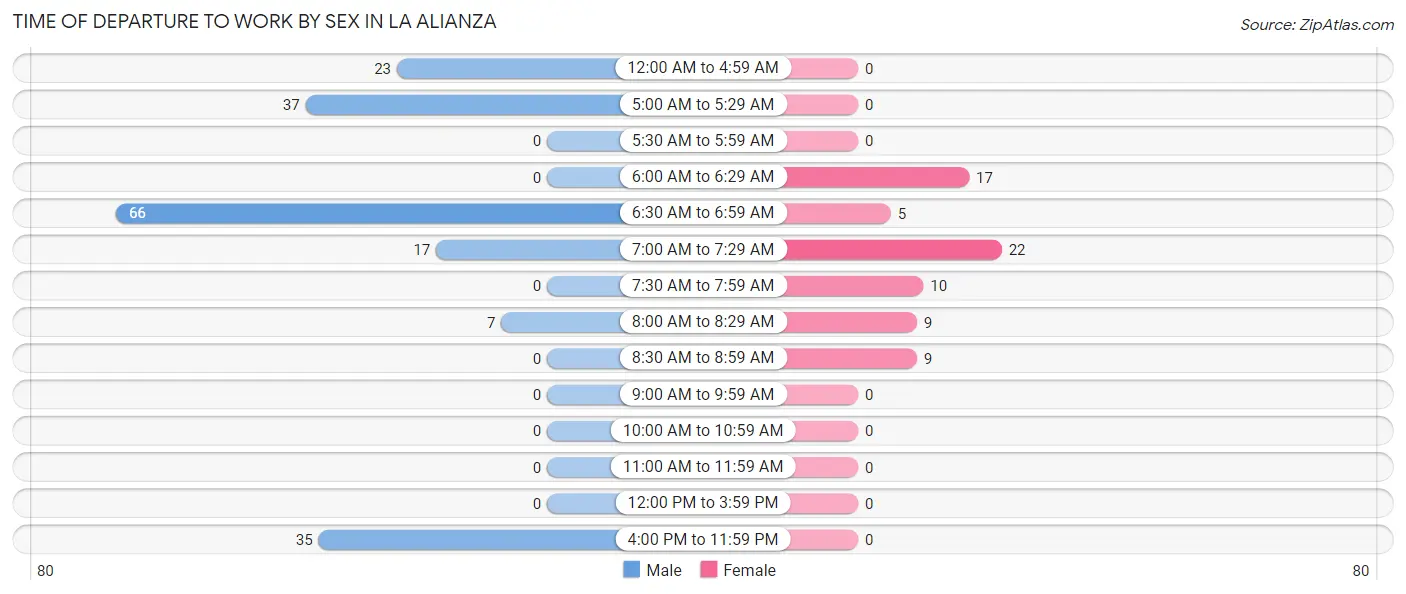
| Time of Departure | Male | Female |
| 12:00 AM to 4:59 AM | 23 (12.4%) | 0 (0.0%) |
| 5:00 AM to 5:29 AM | 37 (20.0%) | 0 (0.0%) |
| 5:30 AM to 5:59 AM | 0 (0.0%) | 0 (0.0%) |
| 6:00 AM to 6:29 AM | 0 (0.0%) | 17 (23.6%) |
| 6:30 AM to 6:59 AM | 66 (35.7%) | 5 (6.9%) |
| 7:00 AM to 7:29 AM | 17 (9.2%) | 22 (30.6%) |
| 7:30 AM to 7:59 AM | 0 (0.0%) | 10 (13.9%) |
| 8:00 AM to 8:29 AM | 7 (3.8%) | 9 (12.5%) |
| 8:30 AM to 8:59 AM | 0 (0.0%) | 9 (12.5%) |
| 9:00 AM to 9:59 AM | 0 (0.0%) | 0 (0.0%) |
| 10:00 AM to 10:59 AM | 0 (0.0%) | 0 (0.0%) |
| 11:00 AM to 11:59 AM | 0 (0.0%) | 0 (0.0%) |
| 12:00 PM to 3:59 PM | 0 (0.0%) | 0 (0.0%) |
| 4:00 PM to 11:59 PM | 35 (18.9%) | 0 (0.0%) |
| Total | 185 (100.0%) | 72 (100.0%) |
Housing Occupancy in La Alianza
Occupancy by Ownership in La Alianza
Of the total 650 dwellings in La Alianza, owner-occupied units account for 334 (51.4%), while renter-occupied units make up 316 (48.6%).
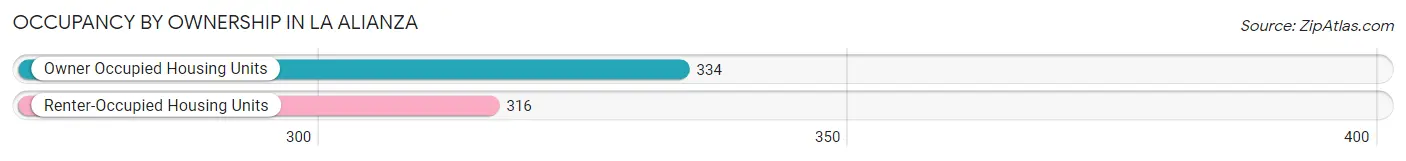
| Occupancy | # Housing Units | % Housing Units |
| Owner Occupied Housing Units | 334 | 51.4% |
| Renter-Occupied Housing Units | 316 | 48.6% |
| Total Occupied Housing Units | 650 | 100.0% |
Occupancy by Household Size in La Alianza
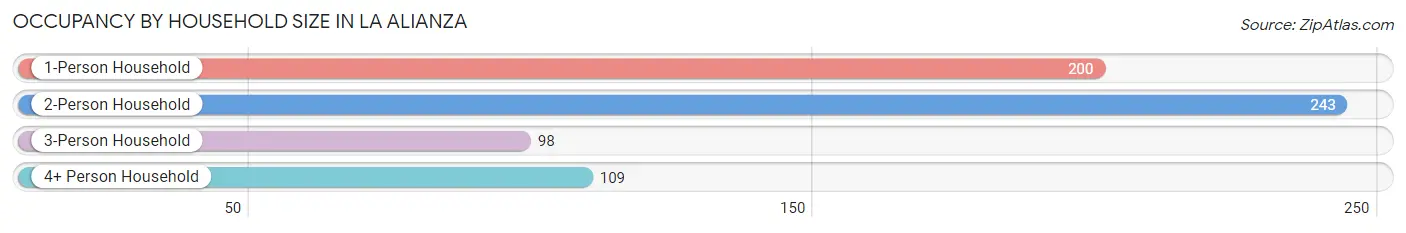
| Household Size | # Housing Units | % Housing Units |
| 1-Person Household | 200 | 30.8% |
| 2-Person Household | 243 | 37.4% |
| 3-Person Household | 98 | 15.1% |
| 4+ Person Household | 109 | 16.8% |
| Total Housing Units | 650 | 100.0% |
Occupancy by Ownership by Household Size in La Alianza
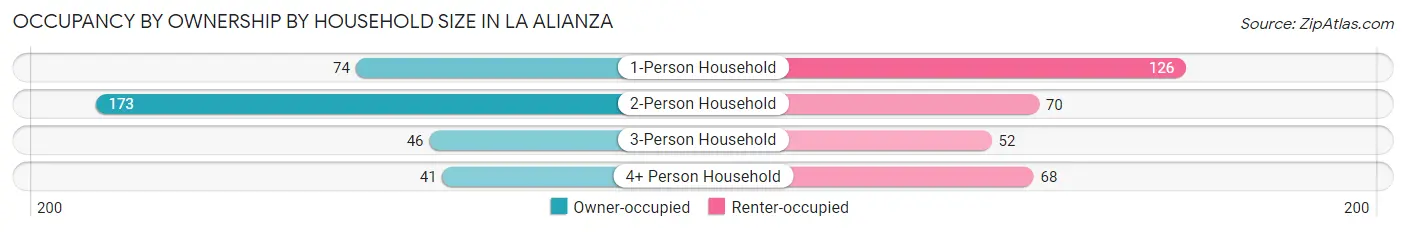
| Household Size | Owner-occupied | Renter-occupied |
| 1-Person Household | 74 (37.0%) | 126 (63.0%) |
| 2-Person Household | 173 (71.2%) | 70 (28.8%) |
| 3-Person Household | 46 (46.9%) | 52 (53.1%) |
| 4+ Person Household | 41 (37.6%) | 68 (62.4%) |
| Total Housing Units | 334 (51.4%) | 316 (48.6%) |
Occupancy by Educational Attainment in La Alianza
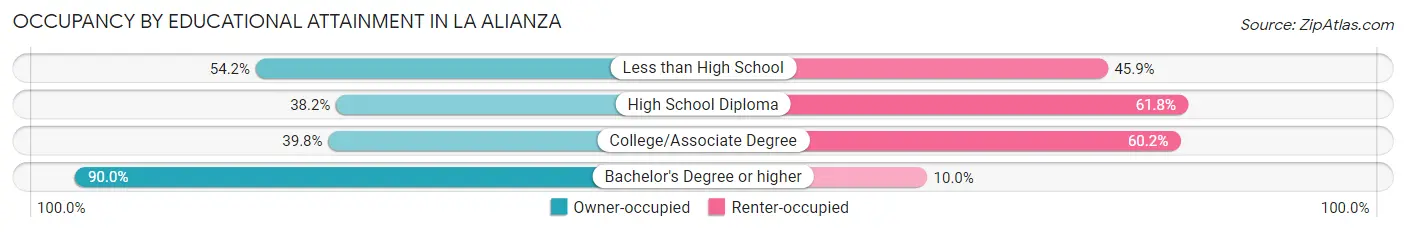
| Household Size | Owner-occupied | Renter-occupied |
| Less than High School | 163 (54.1%) | 138 (45.9%) |
| High School Diploma | 73 (38.2%) | 118 (61.8%) |
| College/Associate Degree | 35 (39.8%) | 53 (60.2%) |
| Bachelor's Degree or higher | 63 (90.0%) | 7 (10.0%) |
Occupancy by Age of Householder in La Alianza
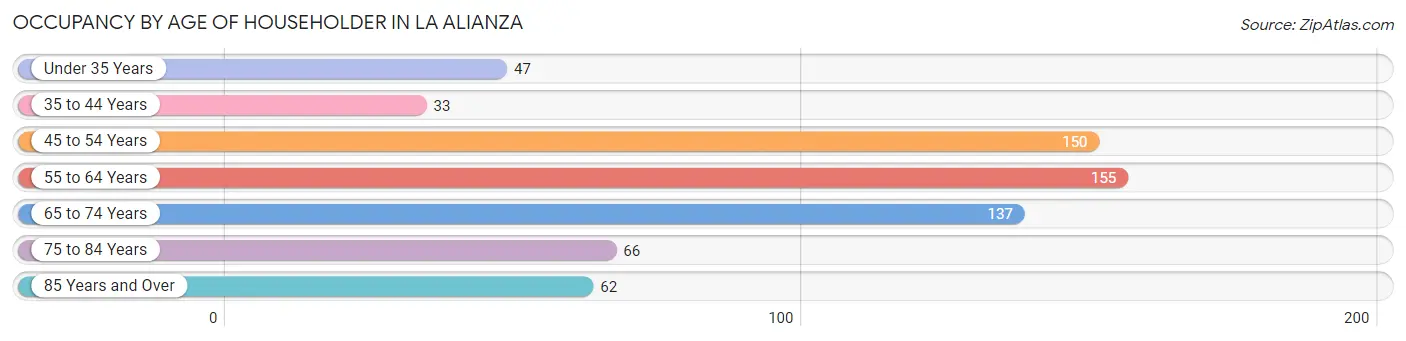
| Age Bracket | # Households | % Households |
| Under 35 Years | 47 | 7.2% |
| 35 to 44 Years | 33 | 5.1% |
| 45 to 54 Years | 150 | 23.1% |
| 55 to 64 Years | 155 | 23.8% |
| 65 to 74 Years | 137 | 21.1% |
| 75 to 84 Years | 66 | 10.2% |
| 85 Years and Over | 62 | 9.5% |
| Total | 650 | 100.0% |
Housing Finances in La Alianza
Median Income by Occupancy in La Alianza
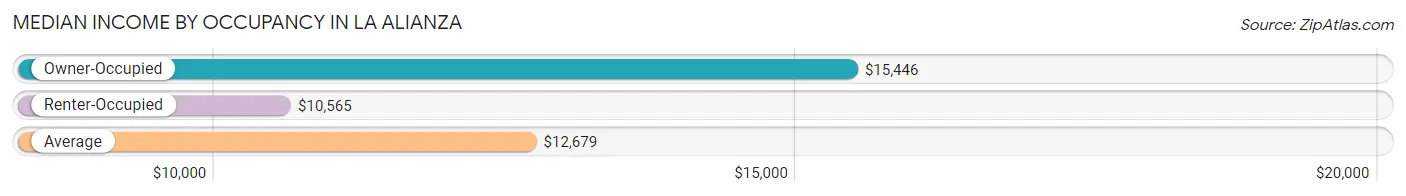
| Occupancy Type | # Households | Median Income |
| Owner-Occupied | 334 (51.4%) | $15,446 |
| Renter-Occupied | 316 (48.6%) | $10,565 |
| Average | 650 (100.0%) | $12,679 |
Occupancy by Householder Income Bracket in La Alianza
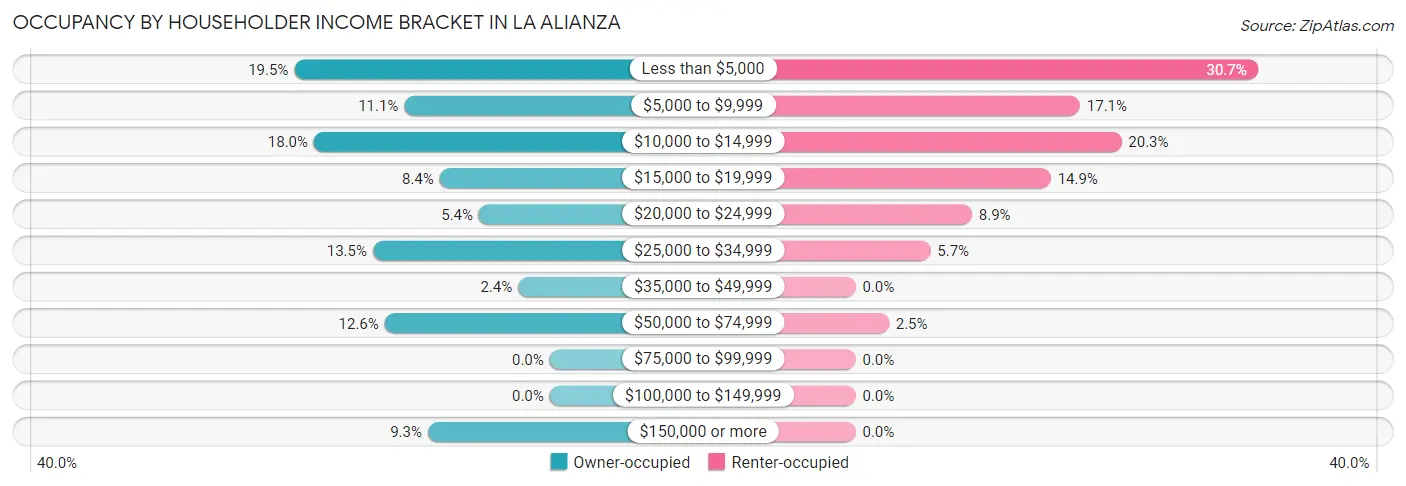
| Income Bracket | Owner-occupied | Renter-occupied |
| Less than $5,000 | 65 (19.5%) | 97 (30.7%) |
| $5,000 to $9,999 | 37 (11.1%) | 54 (17.1%) |
| $10,000 to $14,999 | 60 (18.0%) | 64 (20.3%) |
| $15,000 to $19,999 | 28 (8.4%) | 47 (14.9%) |
| $20,000 to $24,999 | 18 (5.4%) | 28 (8.9%) |
| $25,000 to $34,999 | 45 (13.5%) | 18 (5.7%) |
| $35,000 to $49,999 | 8 (2.4%) | 0 (0.0%) |
| $50,000 to $74,999 | 42 (12.6%) | 8 (2.5%) |
| $75,000 to $99,999 | 0 (0.0%) | 0 (0.0%) |
| $100,000 to $149,999 | 0 (0.0%) | 0 (0.0%) |
| $150,000 or more | 31 (9.3%) | 0 (0.0%) |
| Total | 334 (100.0%) | 316 (100.0%) |
Monthly Housing Cost Tiers in La Alianza
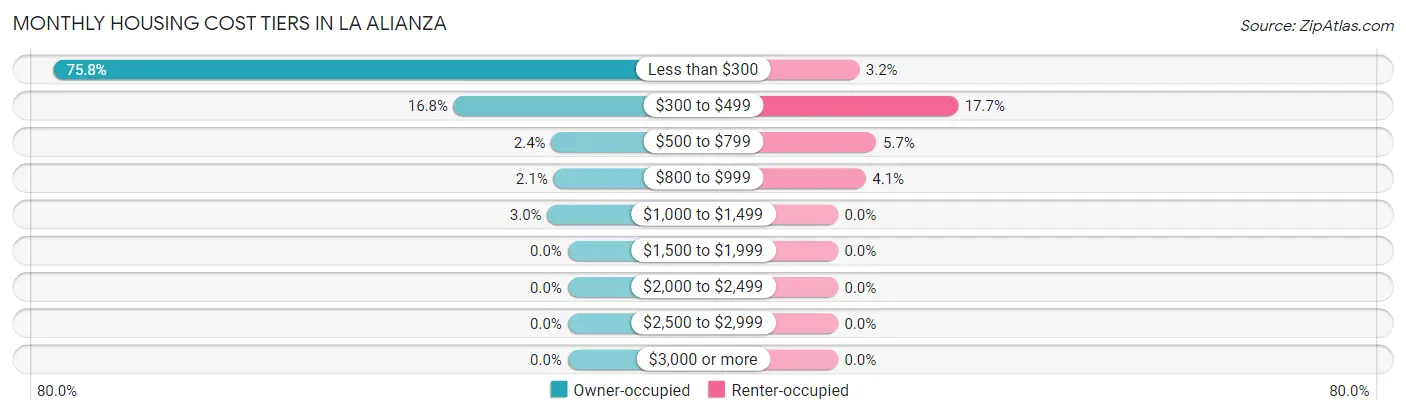
| Monthly Cost | Owner-occupied | Renter-occupied |
| Less than $300 | 253 (75.7%) | 10 (3.2%) |
| $300 to $499 | 56 (16.8%) | 56 (17.7%) |
| $500 to $799 | 8 (2.4%) | 18 (5.7%) |
| $800 to $999 | 7 (2.1%) | 13 (4.1%) |
| $1,000 to $1,499 | 10 (3.0%) | 0 (0.0%) |
| $1,500 to $1,999 | 0 (0.0%) | 0 (0.0%) |
| $2,000 to $2,499 | 0 (0.0%) | 0 (0.0%) |
| $2,500 to $2,999 | 0 (0.0%) | 0 (0.0%) |
| $3,000 or more | 0 (0.0%) | 0 (0.0%) |
| Total | 334 (100.0%) | 316 (100.0%) |
Physical Housing Characteristics in La Alianza
Housing Structures in La Alianza
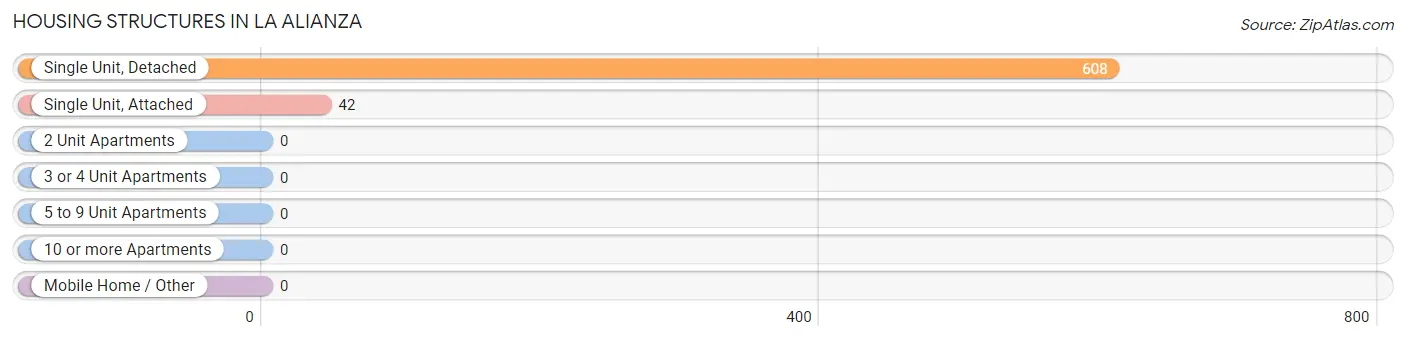
| Structure Type | # Housing Units | % Housing Units |
| Single Unit, Detached | 608 | 93.5% |
| Single Unit, Attached | 42 | 6.5% |
| 2 Unit Apartments | 0 | 0.0% |
| 3 or 4 Unit Apartments | 0 | 0.0% |
| 5 to 9 Unit Apartments | 0 | 0.0% |
| 10 or more Apartments | 0 | 0.0% |
| Mobile Home / Other | 0 | 0.0% |
| Total | 650 | 100.0% |
Housing Structures by Occupancy in La Alianza
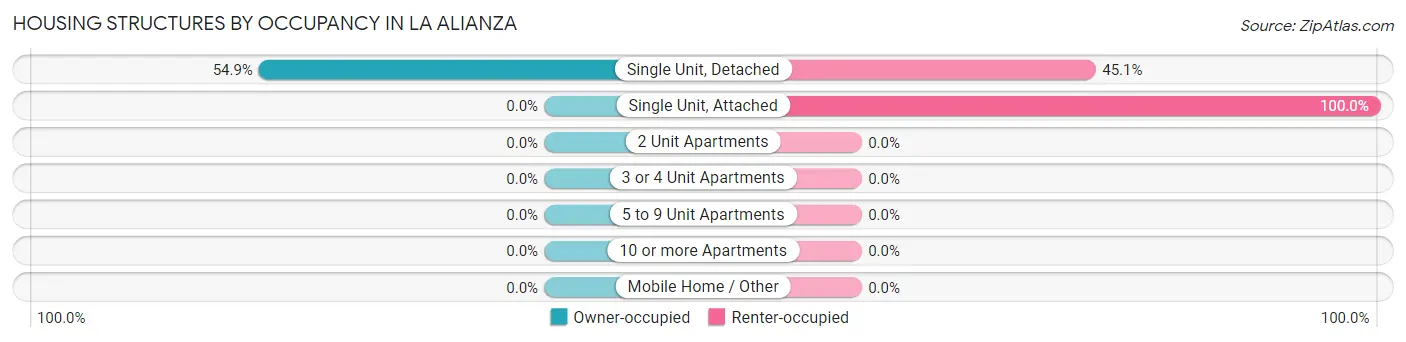
| Structure Type | Owner-occupied | Renter-occupied |
| Single Unit, Detached | 334 (54.9%) | 274 (45.1%) |
| Single Unit, Attached | 0 (0.0%) | 42 (100.0%) |
| 2 Unit Apartments | 0 (0.0%) | 0 (0.0%) |
| 3 or 4 Unit Apartments | 0 (0.0%) | 0 (0.0%) |
| 5 to 9 Unit Apartments | 0 (0.0%) | 0 (0.0%) |
| 10 or more Apartments | 0 (0.0%) | 0 (0.0%) |
| Mobile Home / Other | 0 (0.0%) | 0 (0.0%) |
| Total | 334 (51.4%) | 316 (48.6%) |
Housing Structures by Number of Rooms in La Alianza
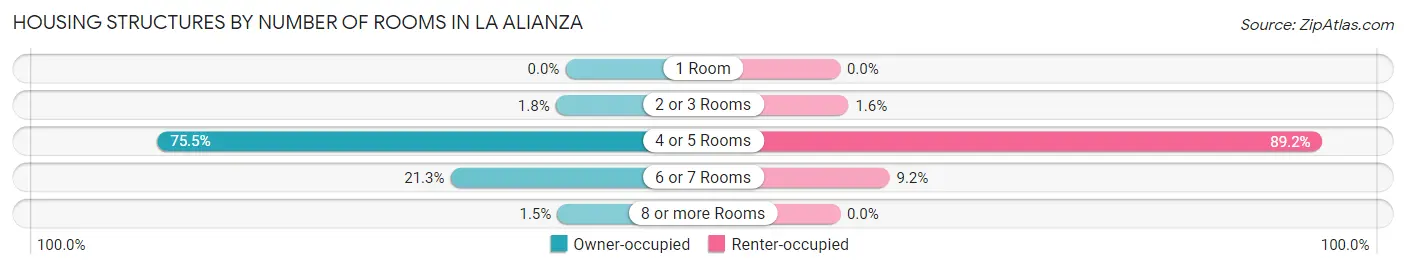
| Number of Rooms | Owner-occupied | Renter-occupied |
| 1 Room | 0 (0.0%) | 0 (0.0%) |
| 2 or 3 Rooms | 6 (1.8%) | 5 (1.6%) |
| 4 or 5 Rooms | 252 (75.4%) | 282 (89.2%) |
| 6 or 7 Rooms | 71 (21.3%) | 29 (9.2%) |
| 8 or more Rooms | 5 (1.5%) | 0 (0.0%) |
| Total | 334 (100.0%) | 316 (100.0%) |
Housing Structure by Heating Type in La Alianza
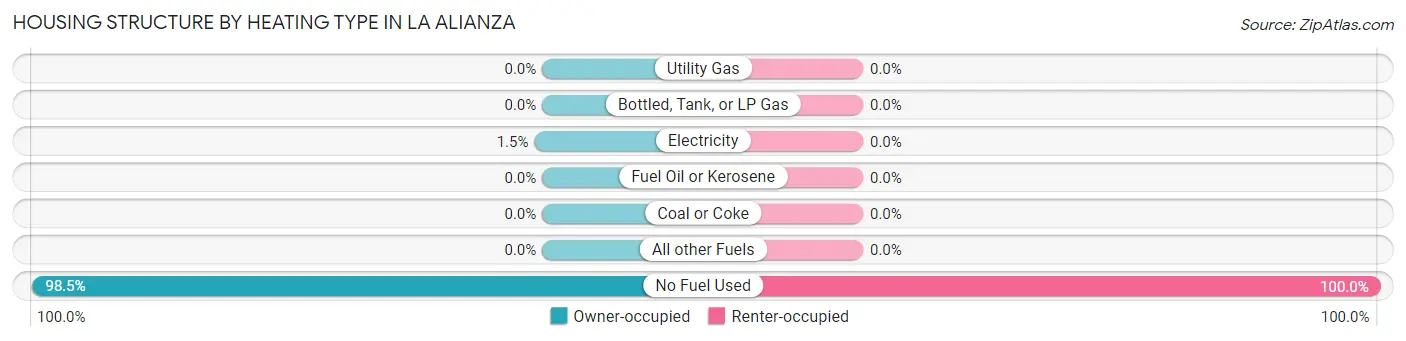
| Heating Type | Owner-occupied | Renter-occupied |
| Utility Gas | 0 (0.0%) | 0 (0.0%) |
| Bottled, Tank, or LP Gas | 0 (0.0%) | 0 (0.0%) |
| Electricity | 5 (1.5%) | 0 (0.0%) |
| Fuel Oil or Kerosene | 0 (0.0%) | 0 (0.0%) |
| Coal or Coke | 0 (0.0%) | 0 (0.0%) |
| All other Fuels | 0 (0.0%) | 0 (0.0%) |
| No Fuel Used | 329 (98.5%) | 316 (100.0%) |
| Total | 334 (100.0%) | 316 (100.0%) |
Household Vehicle Usage in La Alianza
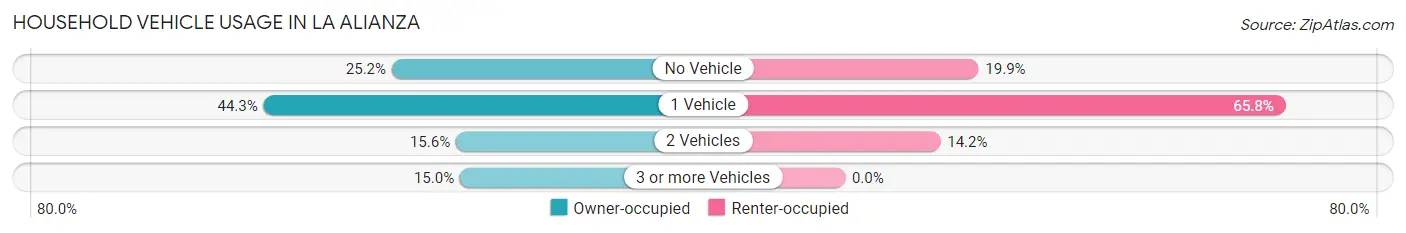
| Vehicles per Household | Owner-occupied | Renter-occupied |
| No Vehicle | 84 (25.2%) | 63 (19.9%) |
| 1 Vehicle | 148 (44.3%) | 208 (65.8%) |
| 2 Vehicles | 52 (15.6%) | 45 (14.2%) |
| 3 or more Vehicles | 50 (15.0%) | 0 (0.0%) |
| Total | 334 (100.0%) | 316 (100.0%) |
Real Estate & Mortgages in La Alianza
Real Estate and Mortgage Overview in La Alianza
| Characteristic | Without Mortgage | With Mortgage |
| Housing Units | 309 | 25 |
| Median Property Value | $76,100 | $116,100 |
| Median Household Income | $14,185 | $0 |
| Monthly Housing Costs | $185 | $0 |
| Real Estate Taxes | - | - |
Property Value by Mortgage Status in La Alianza
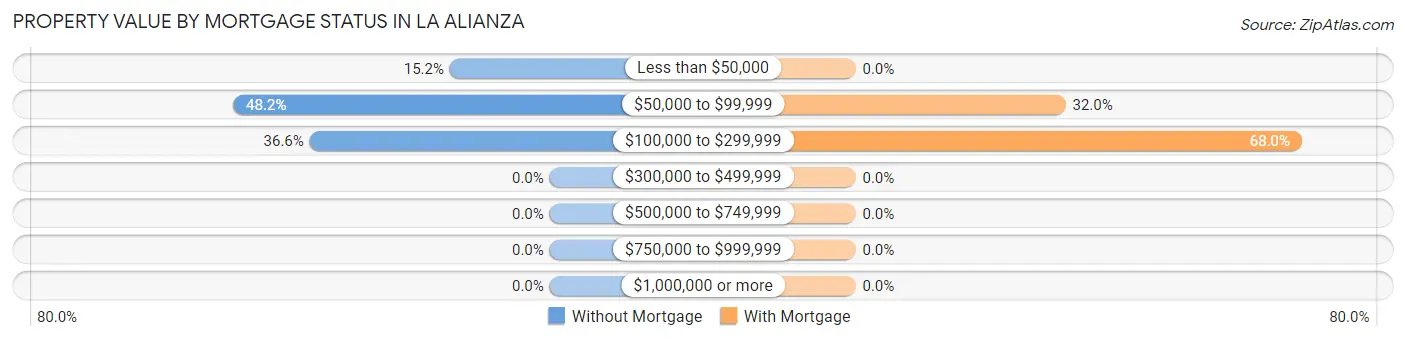
| Property Value | Without Mortgage | With Mortgage |
| Less than $50,000 | 47 (15.2%) | 0 (0.0%) |
| $50,000 to $99,999 | 149 (48.2%) | 8 (32.0%) |
| $100,000 to $299,999 | 113 (36.6%) | 17 (68.0%) |
| $300,000 to $499,999 | 0 (0.0%) | 0 (0.0%) |
| $500,000 to $749,999 | 0 (0.0%) | 0 (0.0%) |
| $750,000 to $999,999 | 0 (0.0%) | 0 (0.0%) |
| $1,000,000 or more | 0 (0.0%) | 0 (0.0%) |
| Total | 309 (100.0%) | 25 (100.0%) |
Household Income by Mortgage Status in La Alianza
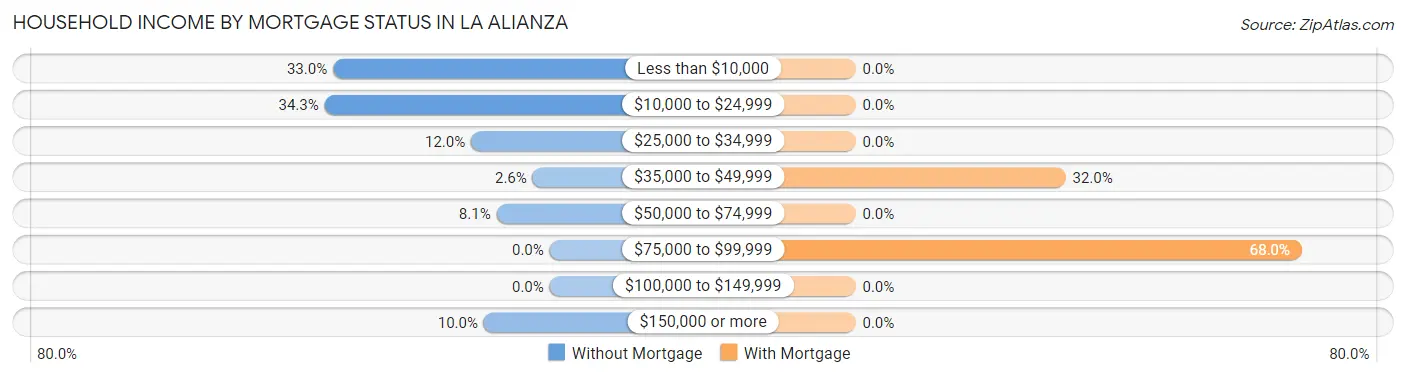
| Household Income | Without Mortgage | With Mortgage |
| Less than $10,000 | 102 (33.0%) | 0 (0.0%) |
| $10,000 to $24,999 | 106 (34.3%) | 0 (0.0%) |
| $25,000 to $34,999 | 37 (12.0%) | 0 (0.0%) |
| $35,000 to $49,999 | 8 (2.6%) | 8 (32.0%) |
| $50,000 to $74,999 | 25 (8.1%) | 0 (0.0%) |
| $75,000 to $99,999 | 0 (0.0%) | 17 (68.0%) |
| $100,000 to $149,999 | 0 (0.0%) | 0 (0.0%) |
| $150,000 or more | 31 (10.0%) | 0 (0.0%) |
| Total | 309 (100.0%) | 25 (100.0%) |
Property Value to Household Income Ratio in La Alianza
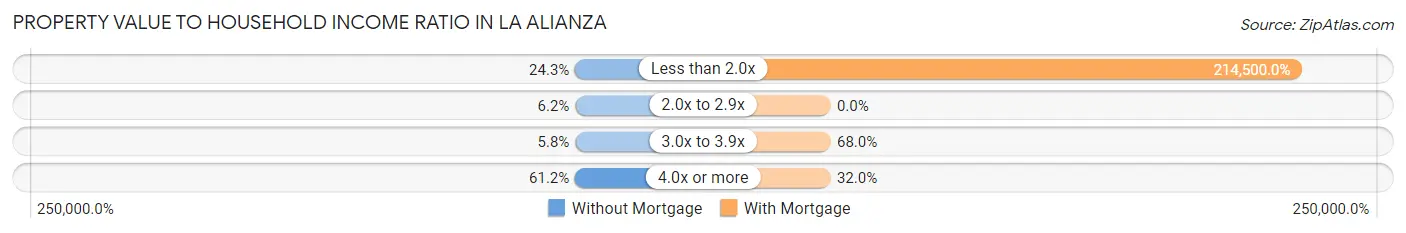
| Value-to-Income Ratio | Without Mortgage | With Mortgage |
| Less than 2.0x | 75 (24.3%) | 53,625 (214,500.0%) |
| 2.0x to 2.9x | 19 (6.1%) | 0 (0.0%) |
| 3.0x to 3.9x | 18 (5.8%) | 17 (68.0%) |
| 4.0x or more | 189 (61.2%) | 8 (32.0%) |
| Total | 309 (100.0%) | 25 (100.0%) |
Real Estate Taxes by Mortgage Status in La Alianza
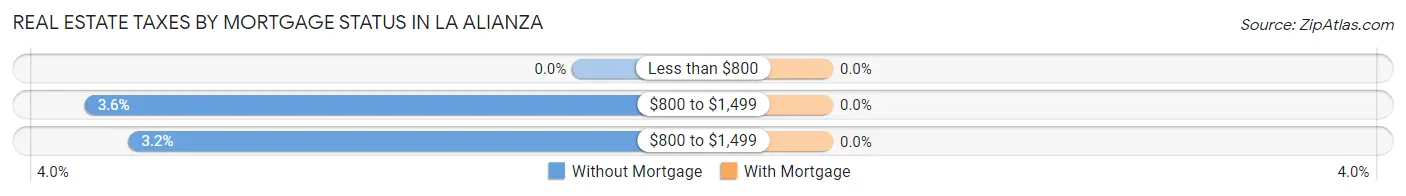
| Property Taxes | Without Mortgage | With Mortgage |
| Less than $800 | 0 (0.0%) | 0 (0.0%) |
| $800 to $1,499 | 11 (3.6%) | 0 (0.0%) |
| $800 to $1,499 | 10 (3.2%) | 0 (0.0%) |
| Total | 309 (100.0%) | 25 (100.0%) |
Health & Disability in La Alianza
Health Insurance Coverage by Age in La Alianza
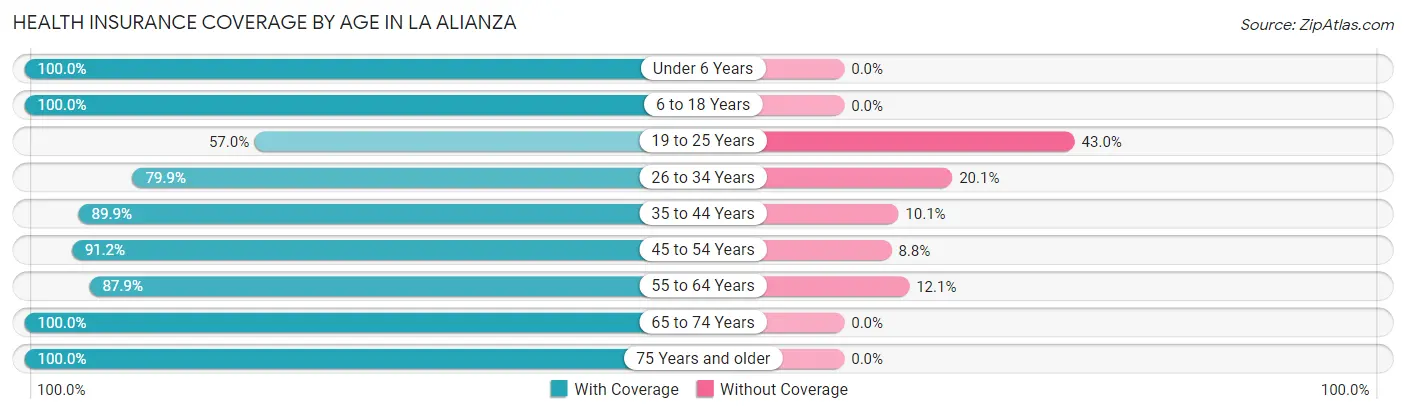
| Age Bracket | With Coverage | Without Coverage |
| Under 6 Years | 95 (100.0%) | 0 (0.0%) |
| 6 to 18 Years | 270 (100.0%) | 0 (0.0%) |
| 19 to 25 Years | 81 (57.0%) | 61 (43.0%) |
| 26 to 34 Years | 119 (79.9%) | 30 (20.1%) |
| 35 to 44 Years | 98 (89.9%) | 11 (10.1%) |
| 45 to 54 Years | 218 (91.2%) | 21 (8.8%) |
| 55 to 64 Years | 283 (87.9%) | 39 (12.1%) |
| 65 to 74 Years | 234 (100.0%) | 0 (0.0%) |
| 75 Years and older | 172 (100.0%) | 0 (0.0%) |
| Total | 1,570 (90.6%) | 162 (9.3%) |
Health Insurance Coverage by Citizenship Status in La Alianza
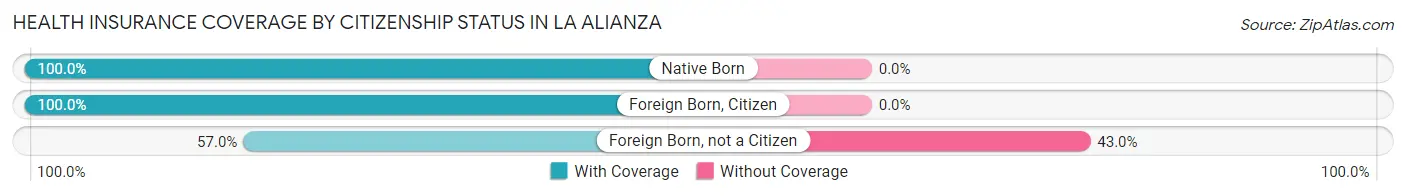
| Citizenship Status | With Coverage | Without Coverage |
| Native Born | 95 (100.0%) | 0 (0.0%) |
| Foreign Born, Citizen | 270 (100.0%) | 0 (0.0%) |
| Foreign Born, not a Citizen | 81 (57.0%) | 61 (43.0%) |
Health Insurance Coverage by Household Income in La Alianza
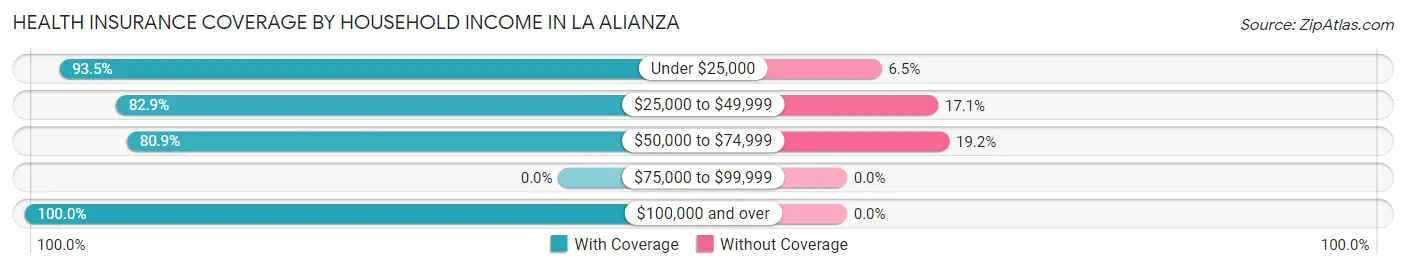
| Household Income | With Coverage | Without Coverage |
| Under $25,000 | 1,123 (93.5%) | 78 (6.5%) |
| $25,000 to $49,999 | 233 (82.9%) | 48 (17.1%) |
| $50,000 to $74,999 | 152 (80.8%) | 36 (19.2%) |
| $75,000 to $99,999 | 0 (0.0%) | 0 (0.0%) |
| $100,000 and over | 59 (100.0%) | 0 (0.0%) |
Public vs Private Health Insurance Coverage by Age in La Alianza
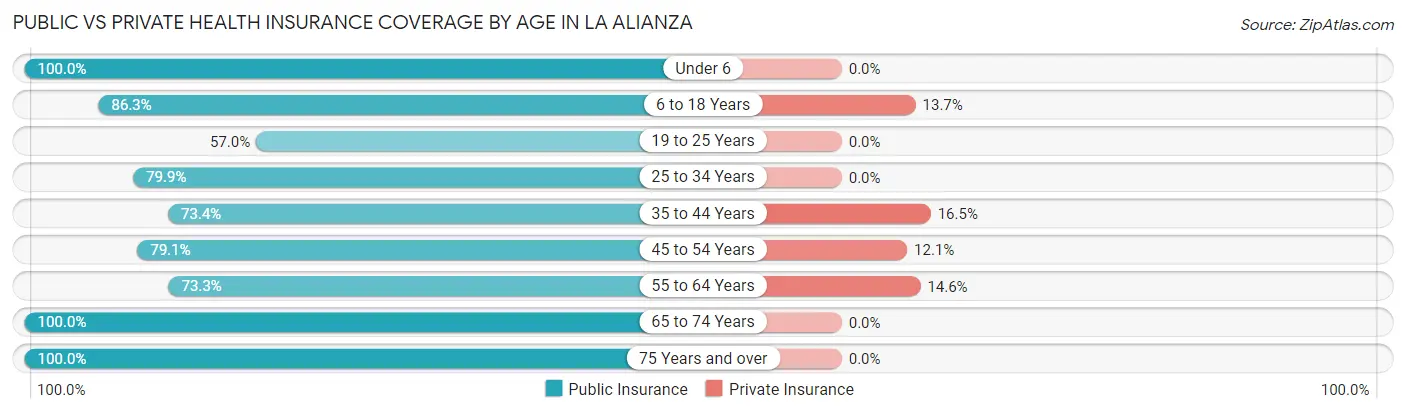
| Age Bracket | Public Insurance | Private Insurance |
| Under 6 | 95 (100.0%) | 0 (0.0%) |
| 6 to 18 Years | 233 (86.3%) | 37 (13.7%) |
| 19 to 25 Years | 81 (57.0%) | 0 (0.0%) |
| 25 to 34 Years | 119 (79.9%) | 0 (0.0%) |
| 35 to 44 Years | 80 (73.4%) | 18 (16.5%) |
| 45 to 54 Years | 189 (79.1%) | 29 (12.1%) |
| 55 to 64 Years | 236 (73.3%) | 47 (14.6%) |
| 65 to 74 Years | 234 (100.0%) | 0 (0.0%) |
| 75 Years and over | 172 (100.0%) | 0 (0.0%) |
| Total | 1,439 (83.1%) | 131 (7.6%) |
Disability Status by Sex by Age in La Alianza
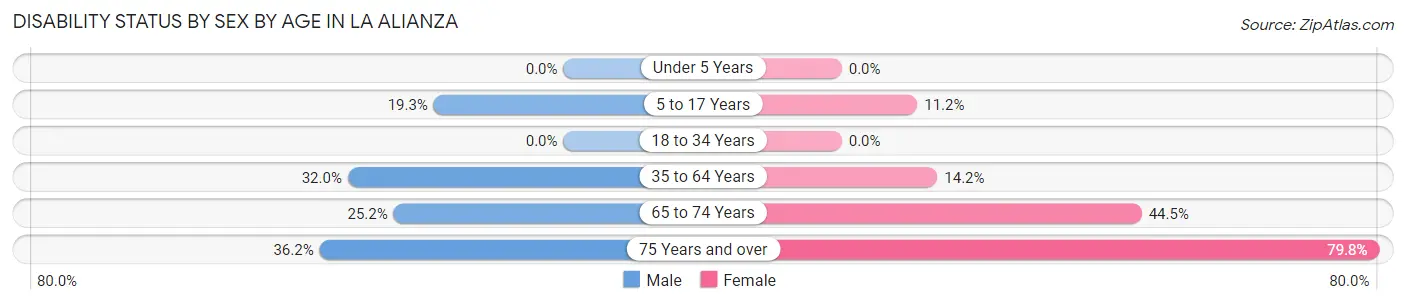
| Age Bracket | Male | Female |
| Under 5 Years | 0 (0.0%) | 0 (0.0%) |
| 5 to 17 Years | 31 (19.3%) | 12 (11.2%) |
| 18 to 34 Years | 0 (0.0%) | 0 (0.0%) |
| 35 to 64 Years | 122 (32.0%) | 41 (14.2%) |
| 65 to 74 Years | 29 (25.2%) | 53 (44.5%) |
| 75 Years and over | 21 (36.2%) | 91 (79.8%) |
Disability Class by Sex by Age in La Alianza
Disability Class: Hearing Difficulty
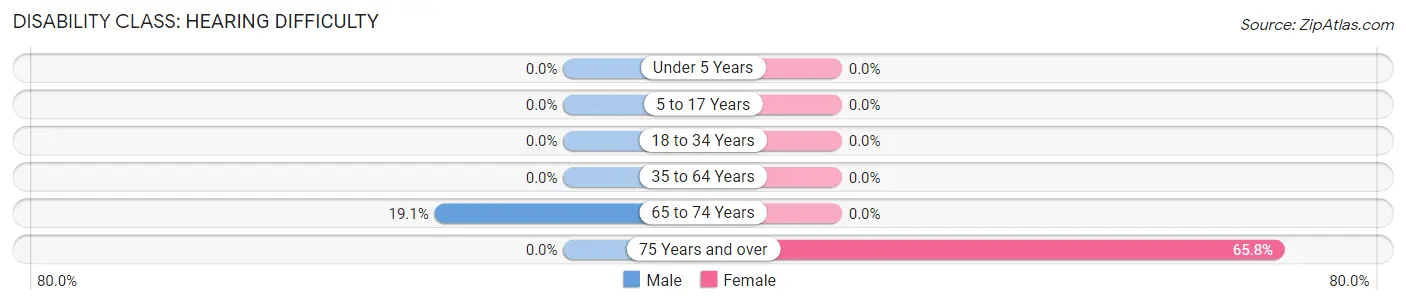
| Age Bracket | Male | Female |
| Under 5 Years | 0 (0.0%) | 0 (0.0%) |
| 5 to 17 Years | 0 (0.0%) | 0 (0.0%) |
| 18 to 34 Years | 0 (0.0%) | 0 (0.0%) |
| 35 to 64 Years | 0 (0.0%) | 0 (0.0%) |
| 65 to 74 Years | 22 (19.1%) | 0 (0.0%) |
| 75 Years and over | 0 (0.0%) | 75 (65.8%) |
Disability Class: Vision Difficulty
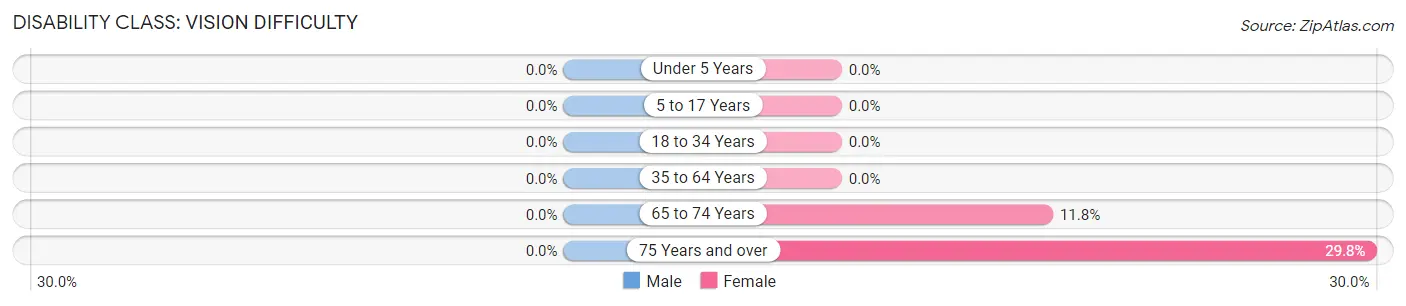
| Age Bracket | Male | Female |
| Under 5 Years | 0 (0.0%) | 0 (0.0%) |
| 5 to 17 Years | 0 (0.0%) | 0 (0.0%) |
| 18 to 34 Years | 0 (0.0%) | 0 (0.0%) |
| 35 to 64 Years | 0 (0.0%) | 0 (0.0%) |
| 65 to 74 Years | 0 (0.0%) | 14 (11.8%) |
| 75 Years and over | 0 (0.0%) | 34 (29.8%) |
Disability Class: Cognitive Difficulty
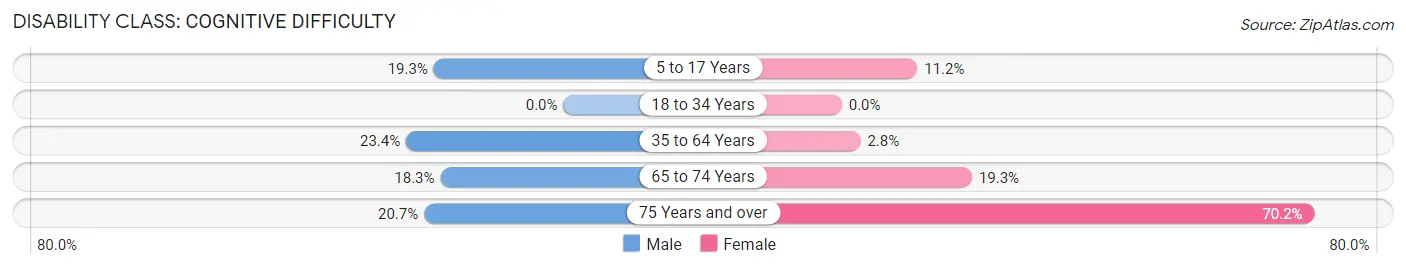
| Age Bracket | Male | Female |
| 5 to 17 Years | 31 (19.3%) | 12 (11.2%) |
| 18 to 34 Years | 0 (0.0%) | 0 (0.0%) |
| 35 to 64 Years | 89 (23.4%) | 8 (2.8%) |
| 65 to 74 Years | 21 (18.3%) | 23 (19.3%) |
| 75 Years and over | 12 (20.7%) | 80 (70.2%) |
Disability Class: Ambulatory Difficulty
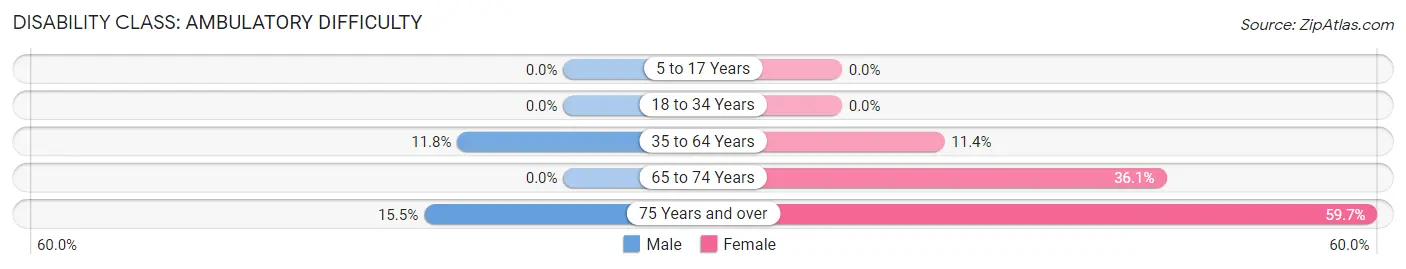
| Age Bracket | Male | Female |
| 5 to 17 Years | 0 (0.0%) | 0 (0.0%) |
| 18 to 34 Years | 0 (0.0%) | 0 (0.0%) |
| 35 to 64 Years | 45 (11.8%) | 33 (11.4%) |
| 65 to 74 Years | 0 (0.0%) | 43 (36.1%) |
| 75 Years and over | 9 (15.5%) | 68 (59.7%) |
Disability Class: Self-Care Difficulty
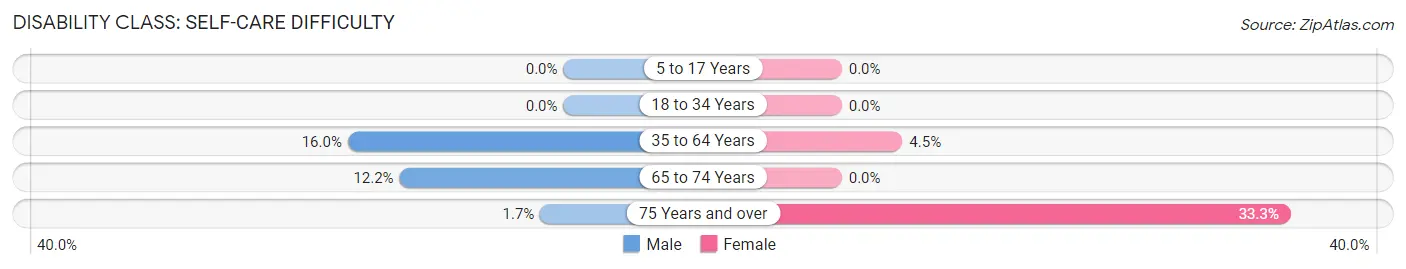
| Age Bracket | Male | Female |
| 5 to 17 Years | 0 (0.0%) | 0 (0.0%) |
| 18 to 34 Years | 0 (0.0%) | 0 (0.0%) |
| 35 to 64 Years | 61 (16.0%) | 13 (4.5%) |
| 65 to 74 Years | 14 (12.2%) | 0 (0.0%) |
| 75 Years and over | 1 (1.7%) | 38 (33.3%) |
Technology Access in La Alianza
Computing Device Access in La Alianza
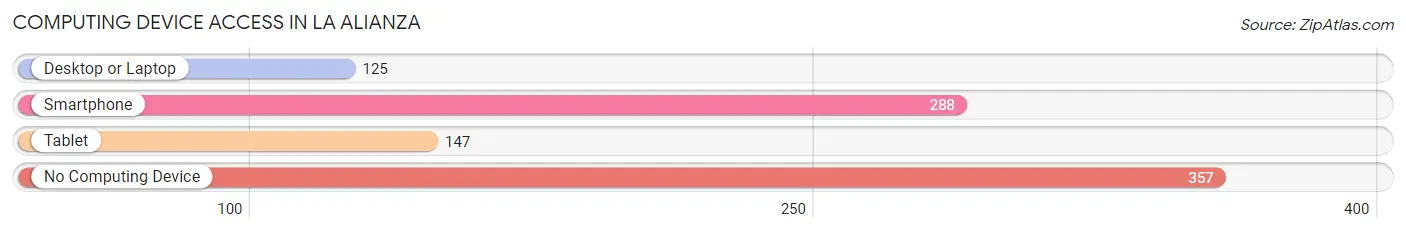
| Device Type | # Households | % Households |
| Desktop or Laptop | 125 | 19.2% |
| Smartphone | 288 | 44.3% |
| Tablet | 147 | 22.6% |
| No Computing Device | 357 | 54.9% |
| Total | 650 | 100.0% |
Internet Access in La Alianza
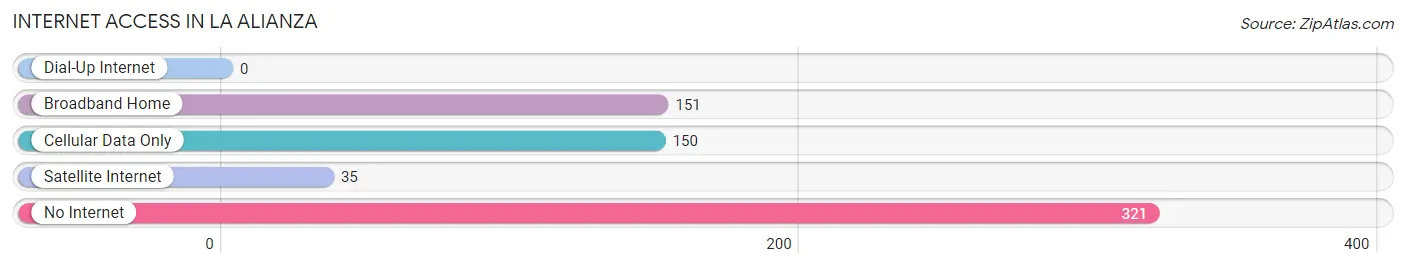
| Internet Type | # Households | % Households |
| Dial-Up Internet | 0 | 0.0% |
| Broadband Home | 151 | 23.2% |
| Cellular Data Only | 150 | 23.1% |
| Satellite Internet | 35 | 5.4% |
| No Internet | 321 | 49.4% |
| Total | 650 | 100.0% |
La Alianza Summary
The Alianza is a municipality located in the northern region of Puerto Rico, in the northern coast of the island. It is part of the Arecibo metropolitan area and is bordered by the municipalities of Arecibo, Florida, and Barceloneta. The Alianza is a small municipality with a population of approximately 8,000 people, according to the 2010 census.
Geography
The Alianza is located in the northern region of Puerto Rico, in the northern coast of the island. It is part of the Arecibo metropolitan area and is bordered by the municipalities of Arecibo, Florida, and Barceloneta. The municipality is located in the northern part of the island, and is situated between the municipalities of Arecibo and Barceloneta. The municipality is located in the northern part of the island, and is situated between the municipalities of Arecibo and Barceloneta. The municipality is located in the northern part of the island, and is situated between the municipalities of Arecibo and Barceloneta. The municipality is located in the northern part of the island, and is situated between the municipalities of Arecibo and Barceloneta. The municipality is located in the northern part of the island, and is situated between the municipalities of Arecibo and Barceloneta. The municipality is located in the northern part of the island, and is situated between the municipalities of Arecibo and Barceloneta. The municipality is located in the northern part of the island, and is situated between the municipalities of Arecibo and Barceloneta. The municipality is located in the northern part of the island, and is situated between the municipalities of Arecibo and Barceloneta. The municipality is located in the northern part of the island, and is situated between the municipalities of Arecibo and Barceloneta. The municipality is located in the northern part of the island, and is situated between the municipalities of Arecibo and Barceloneta.
The municipality is located in the northern part of the island, and is situated between the municipalities of Arecibo and Barceloneta. The municipality is located in the northern part of the island, and is situated between the municipalities of Arecibo and Barceloneta. The municipality is located in the northern part of the island, and is situated between the municipalities of Arecibo and Barceloneta. The municipality is located in the northern part of the island, and is situated between the municipalities of Arecibo and Barceloneta. The municipality is located in the northern part of the island, and is situated between the municipalities of Arecibo and Barceloneta. The municipality is located in the northern part of the island, and is situated between the municipalities of Arecibo and Barceloneta. The municipality is located in the northern part of the island, and is situated between the municipalities of Arecibo and Barceloneta. The municipality is located in the northern part of the island, and is situated between the municipalities of Arecibo and Barceloneta.
The municipality is located in the northern part of the island, and is situated between the municipalities of Arecibo and Barceloneta. The municipality is located in the northern part of the island, and is situated between the municipalities of Arecibo and Barceloneta. The municipality is located in the northern part of the island, and is situated between the municipalities of Arecibo and Barceloneta. The municipality is located in the northern part of the island, and is situated between the municipalities of Arecibo and Barceloneta. The municipality is located in the northern part of the island, and is situated between the municipalities of Arecibo and Barceloneta. The municipality is located in the northern part of the island, and is situated between the municipalities of Arecibo and Barceloneta. The municipality is located in the northern part of the island, and is situated between the municipalities of Arecibo and Barceloneta.
The municipality is located in the northern part of the island, and is situated between the municipalities of Arecibo and Barceloneta. The municipality is located in the northern part of the island, and is situated between the municipalities of Arecibo and Barceloneta. The municipality is located in the northern part of the island, and is situated between the municipalities of Arecibo and Barceloneta. The municipality is located in the northern part of the island, and is situated between the municipalities of Arecibo and Barceloneta. The municipality is located in the northern part of the island, and is situated between the municipalities of Arecibo and Barceloneta. The municipality is located in the northern part of the island, and is situated between the municipalities of Arecibo and Barceloneta. The municipality is located in the northern part of the island, and is situated between the municipalities of Arecibo and Barceloneta.
History
The Alianza was founded in 1845 by a group of settlers from the nearby municipality of Arecibo. The settlers were looking for a place to settle and cultivate the land, and they chose the area of the Alianza because of its fertile soil and abundant water sources. The settlers named the area "Alianza" because of the strong bond of friendship and solidarity that they had formed among themselves.
The Alianza was officially incorporated as a municipality in 1848, and it has since grown to become one of the most important municipalities in the northern region of Puerto Rico. The municipality has a rich history and culture, and it is home to many important historical sites, such as the ruins of the old Spanish fort of San Felipe del Morro.
Economy
The economy of the Alianza is mainly based on agriculture and tourism. The municipality is home to many farms and agricultural businesses, and it is also a popular tourist destination. The municipality is home to many beaches, such as Playa de la Alianza, which is a popular spot for swimming and sunbathing. The municipality also has a number of restaurants, bars, and other tourist attractions.
The municipality is also home to a number of industrial businesses, such as the Puerto Rican Cement Company, which produces cement for construction projects. The municipality is also home to a number of manufacturing businesses, such as the Puerto Rican Textile Company, which produces clothing and other textiles.
Demographics
According to the 2010 census, the population of the Alianza was 8,000 people. The majority of the population is of Puerto Rican descent, with a small percentage of people of other ethnic backgrounds. The majority of the population is Roman Catholic, and the municipality is home to a number of churches. The municipality is also home to a number of schools, including the University of Puerto Rico at Arecibo.
Conclusion
The Alianza is a small municipality located in the northern region of Puerto Rico, in the northern coast of the island. It is part of the Arecibo metropolitan area and is bordered by the municipalities of Arecibo, Florida, and Barceloneta. The Alianza has a rich history and culture, and it is home to many important historical sites. The economy of the Alianza is mainly based on agriculture and tourism, and the municipality is home to many farms and agricultural businesses, as well as a number of industrial businesses and manufacturing businesses. The population of the Alianza is 8,000 people, and the majority of the population is of Puerto Rican descent. The municipality is also home to a number of churches and schools, including the University of Puerto Rico at Arecibo.
Common Questions
What is Per Capita Income in La Alianza?
Per Capita income in La Alianza is $10,522.
What is the Median Family Income in La Alianza?
Median Family Income in La Alianza is $14,828.
What is the Median Household income in La Alianza?
Median Household Income in La Alianza is $12,679.
What is Income or Wage Gap in La Alianza?
Income or Wage Gap in La Alianza is 38.9%.
Women in La Alianza earn 61.1 cents for every dollar earned by a man.
What is Family Income Deficit in La Alianza?
Family Income Deficit in La Alianza is $12,108.
Families that are below poverty line in La Alianza earn $12,108 less on average than the poverty threshold level.
What is Inequality or Gini Index in La Alianza?
Inequality or Gini Index in La Alianza is 0.65.
What is the Total Population of La Alianza?
Total Population of La Alianza is 1,732.
What is the Total Male Population of La Alianza?
Total Male Population of La Alianza is 946.
What is the Total Female Population of La Alianza?
Total Female Population of La Alianza is 786.
What is the Ratio of Males per 100 Females in La Alianza?
There are 120.36 Males per 100 Females in La Alianza.
What is the Ratio of Females per 100 Males in La Alianza?
There are 83.09 Females per 100 Males in La Alianza.
What is the Median Population Age in La Alianza?
Median Population Age in La Alianza is 50.4 Years.
What is the Average Family Size in La Alianza
Average Family Size in La Alianza is 3.3 People.
What is the Average Household Size in La Alianza
Average Household Size in La Alianza is 2.7 People.
How Large is the Labor Force in La Alianza?
There are 353 People in the Labor Forcein in La Alianza.
What is the Percentage of People in the Labor Force in La Alianza?
24.1% of People are in the Labor Force in La Alianza.
What is the Unemployment Rate in La Alianza?
Unemployment Rate in La Alianza is 24.6%.