Elephant Butte, NM Map & Demographics
Elephant Butte Map
Elephant Butte Overview
$38,085
PER CAPITA INCOME
$74,450
AVG FAMILY INCOME
$52,641
AVG HOUSEHOLD INCOME
22.3%
WAGE / INCOME GAP [ % ]
77.7¢/ $1
WAGE / INCOME GAP [ $ ]
0.41
INEQUALITY / GINI INDEX
1,573
TOTAL POPULATION
810
MALE POPULATION
763
FEMALE POPULATION
106.16
MALES / 100 FEMALES
94.20
FEMALES / 100 MALES
67.2
MEDIAN AGE
2.2
AVG FAMILY SIZE
1.7
AVG HOUSEHOLD SIZE
445
LABOR FORCE [ PEOPLE ]
29.4%
PERCENT IN LABOR FORCE
2.7%
UNEMPLOYMENT RATE
Elephant Butte Zip Codes
Elephant Butte Area Codes
Income in Elephant Butte
Income Overview in Elephant Butte
Per Capita Income in Elephant Butte is $38,085, while median incomes of families and households are $74,450 and $52,641 respectively.
| Characteristic | Number | Measure |
| Per Capita Income | 1,573 | $38,085 |
| Median Family Income | 423 | $74,450 |
| Mean Family Income | 423 | $93,411 |
| Median Household Income | 942 | $52,641 |
| Mean Household Income | 942 | $63,164 |
| Income Deficit | 423 | $0 |
| Wage / Income Gap (%) | 1,573 | 22.34% |
| Wage / Income Gap ($) | 1,573 | 77.66¢ per $1 |
| Gini / Inequality Index | 1,573 | 0.41 |
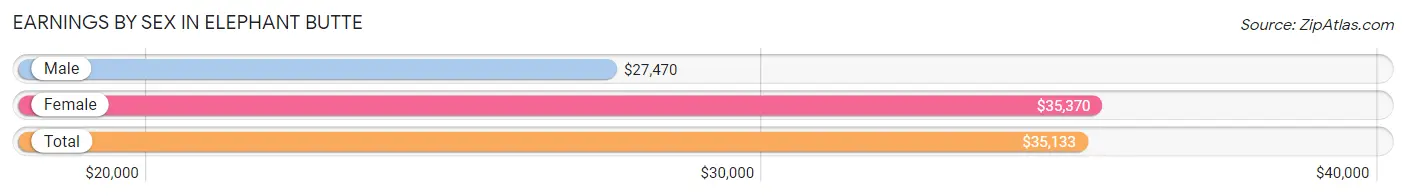
Earnings by Sex in Elephant Butte
Average Earnings in Elephant Butte are $35,133, $27,470 for men and $35,370 for women, a difference of 22.3%.
| Sex | Number | Average Earnings |
| Male | 231 (51.9%) | $27,470 |
| Female | 214 (48.1%) | $35,370 |
| Total | 445 (100.0%) | $35,133 |
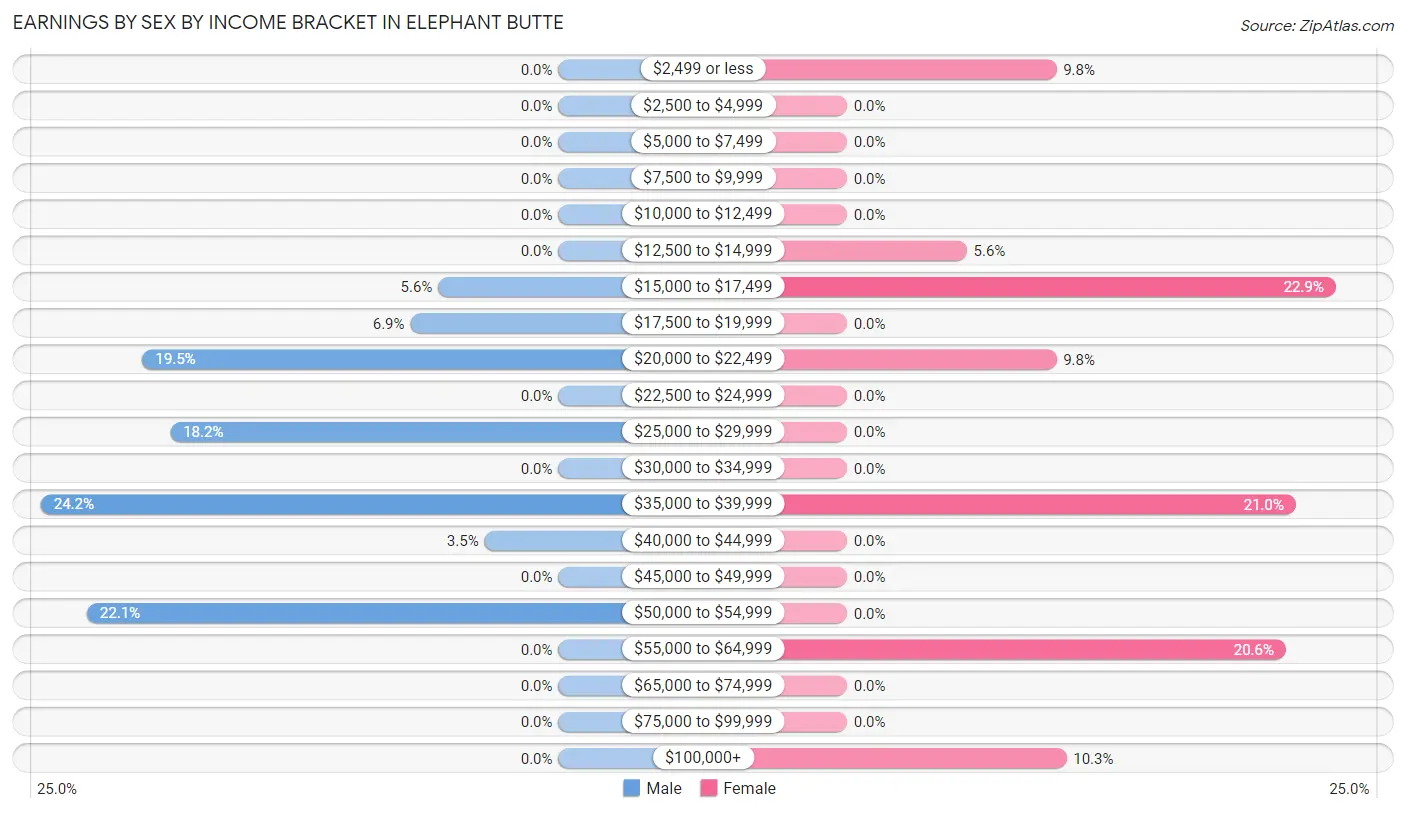
Earnings by Sex by Income Bracket in Elephant Butte
The most common earnings brackets in Elephant Butte are $35,000 to $39,999 for men (56 | 24.2%) and $15,000 to $17,499 for women (49 | 22.9%).
| Income | Male | Female |
| $2,499 or less | 0 (0.0%) | 21 (9.8%) |
| $2,500 to $4,999 | 0 (0.0%) | 0 (0.0%) |
| $5,000 to $7,499 | 0 (0.0%) | 0 (0.0%) |
| $7,500 to $9,999 | 0 (0.0%) | 0 (0.0%) |
| $10,000 to $12,499 | 0 (0.0%) | 0 (0.0%) |
| $12,500 to $14,999 | 0 (0.0%) | 12 (5.6%) |
| $15,000 to $17,499 | 13 (5.6%) | 49 (22.9%) |
| $17,500 to $19,999 | 16 (6.9%) | 0 (0.0%) |
| $20,000 to $22,499 | 45 (19.5%) | 21 (9.8%) |
| $22,500 to $24,999 | 0 (0.0%) | 0 (0.0%) |
| $25,000 to $29,999 | 42 (18.2%) | 0 (0.0%) |
| $30,000 to $34,999 | 0 (0.0%) | 0 (0.0%) |
| $35,000 to $39,999 | 56 (24.2%) | 45 (21.0%) |
| $40,000 to $44,999 | 8 (3.5%) | 0 (0.0%) |
| $45,000 to $49,999 | 0 (0.0%) | 0 (0.0%) |
| $50,000 to $54,999 | 51 (22.1%) | 0 (0.0%) |
| $55,000 to $64,999 | 0 (0.0%) | 44 (20.6%) |
| $65,000 to $74,999 | 0 (0.0%) | 0 (0.0%) |
| $75,000 to $99,999 | 0 (0.0%) | 0 (0.0%) |
| $100,000+ | 0 (0.0%) | 22 (10.3%) |
| Total | 231 (100.0%) | 214 (100.0%) |
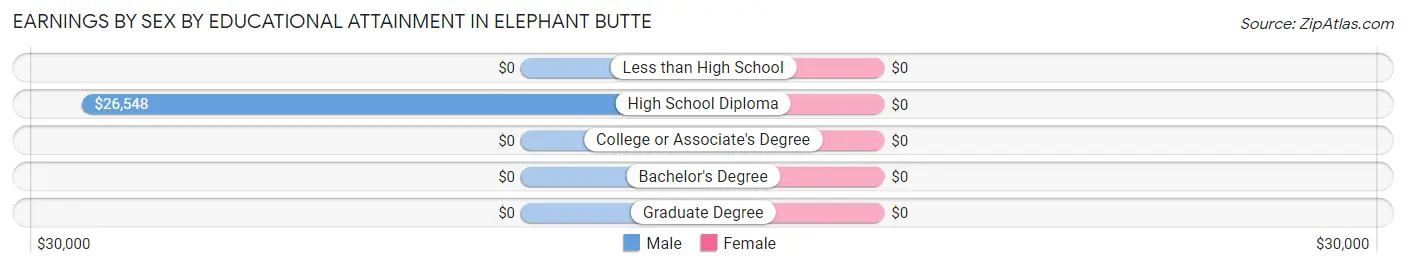
Earnings by Sex by Educational Attainment in Elephant Butte
| Educational Attainment | Male Income | Female Income |
| Less than High School | - | - |
| High School Diploma | $26,548 | $0 |
| College or Associate's Degree | - | - |
| Bachelor's Degree | - | - |
| Graduate Degree | - | - |
| Total | $27,470 | $35,370 |
Family Income in Elephant Butte
Family Income Brackets in Elephant Butte
According to the Elephant Butte family income data, there are 168 families falling into the $50,000 to $74,999 income range, which is the most common income bracket and makes up 39.7% of all families.
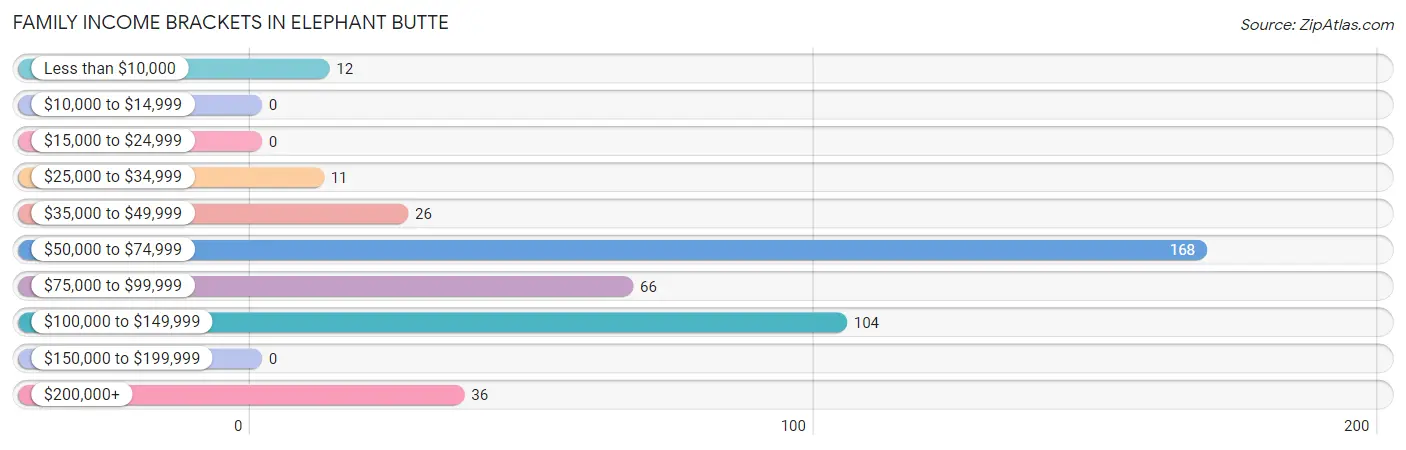
| Income Bracket | # Families | % Families |
| Less than $10,000 | 12 | 2.8% |
| $10,000 to $14,999 | 0 | 0.0% |
| $15,000 to $24,999 | 0 | 0.0% |
| $25,000 to $34,999 | 11 | 2.6% |
| $35,000 to $49,999 | 26 | 6.1% |
| $50,000 to $74,999 | 168 | 39.7% |
| $75,000 to $99,999 | 66 | 15.6% |
| $100,000 to $149,999 | 104 | 24.6% |
| $150,000 to $199,999 | 0 | 0.0% |
| $200,000+ | 36 | 8.5% |
Family Income by Famaliy Size in Elephant Butte
2-person families (382 | 90.3%) account for the highest median family income in Elephant Butte with $75,259 per family, while 2-person families (382 | 90.3%) have the highest median income of $37,630 per family member.
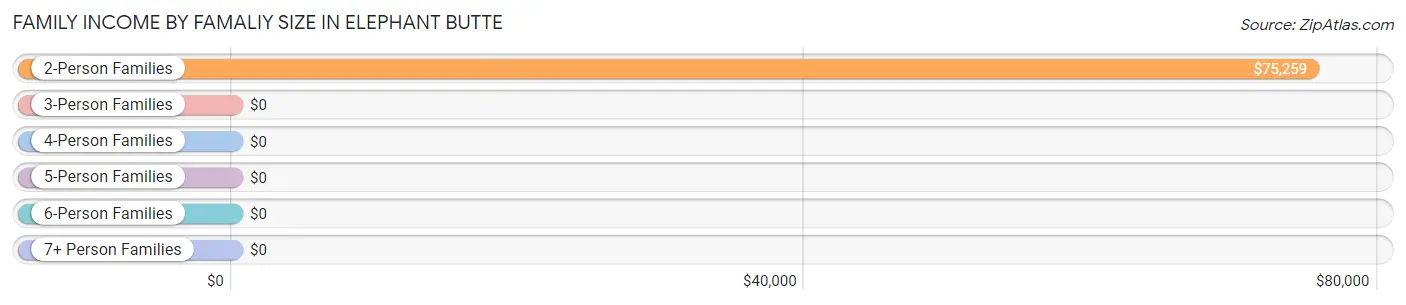
| Income Bracket | # Families | Median Income |
| 2-Person Families | 382 (90.3%) | $75,259 |
| 3-Person Families | 29 (6.9%) | $0 |
| 4-Person Families | 12 (2.8%) | $0 |
| 5-Person Families | 0 (0.0%) | $0 |
| 6-Person Families | 0 (0.0%) | $0 |
| 7+ Person Families | 0 (0.0%) | $0 |
| Total | 423 (100.0%) | $74,450 |
Family Income by Number of Earners in Elephant Butte
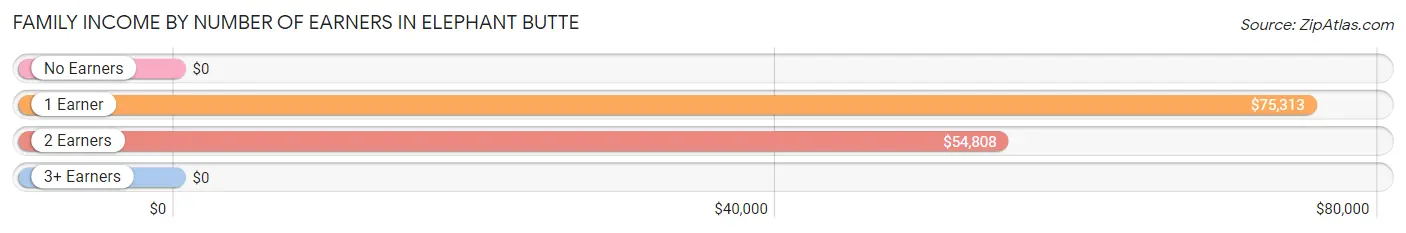
| Number of Earners | # Families | Median Income |
| No Earners | 264 (62.4%) | $0 |
| 1 Earner | 75 (17.7%) | $75,313 |
| 2 Earners | 72 (17.0%) | $54,808 |
| 3+ Earners | 12 (2.8%) | $0 |
| Total | 423 (100.0%) | $74,450 |
Household Income in Elephant Butte
Household Income Brackets in Elephant Butte
With 259 households falling in the category, the $25,000 to $34,999 income range is the most frequent in Elephant Butte, accounting for 27.5% of all households. In contrast, only 12 households (1.3%) fall into the less than $10,000 income bracket, making it the least populous group.
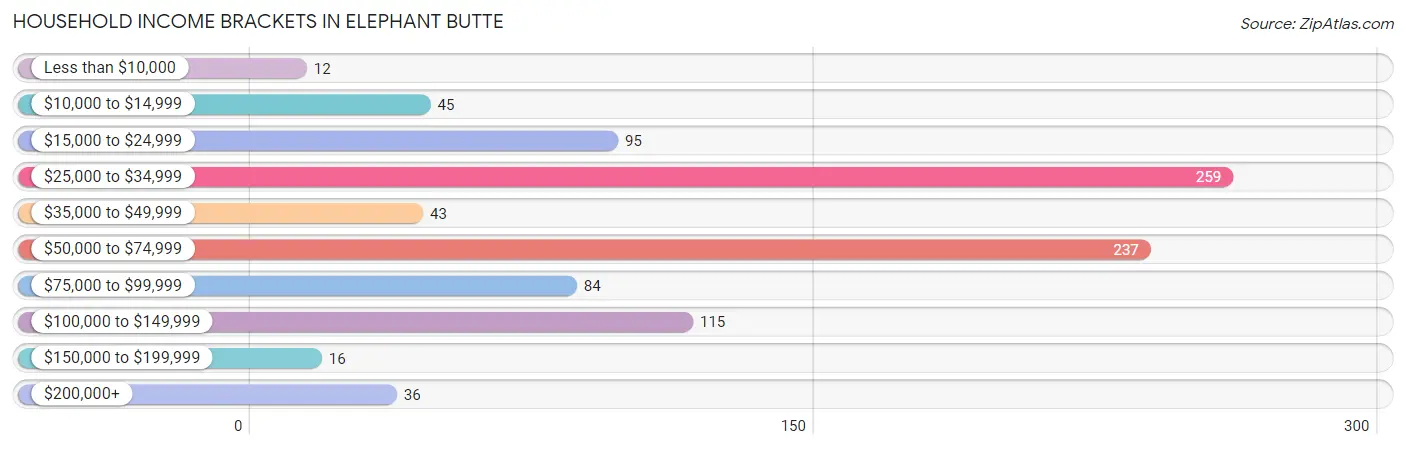
| Income Bracket | # Households | % Households |
| Less than $10,000 | 12 | 1.3% |
| $10,000 to $14,999 | 45 | 4.8% |
| $15,000 to $24,999 | 95 | 10.1% |
| $25,000 to $34,999 | 259 | 27.5% |
| $35,000 to $49,999 | 43 | 4.6% |
| $50,000 to $74,999 | 237 | 25.2% |
| $75,000 to $99,999 | 84 | 8.9% |
| $100,000 to $149,999 | 115 | 12.2% |
| $150,000 to $199,999 | 16 | 1.7% |
| $200,000+ | 36 | 3.8% |
Household Income by Householder Age in Elephant Butte
The median household income in Elephant Butte is $52,641, with the highest median household income of $54,199 found in the 45 to 64 years age bracket for the primary householder. A total of 133 households (14.1%) fall into this category.
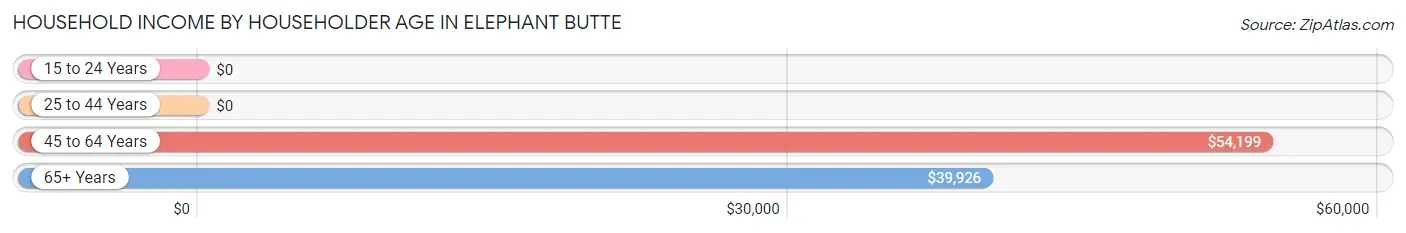
| Income Bracket | # Households | Median Income |
| 15 to 24 Years | 0 (0.0%) | $0 |
| 25 to 44 Years | 72 (7.6%) | $0 |
| 45 to 64 Years | 133 (14.1%) | $54,199 |
| 65+ Years | 737 (78.2%) | $39,926 |
| Total | 942 (100.0%) | $52,641 |
Poverty in Elephant Butte
Income Below Poverty by Sex and Age in Elephant Butte
With 4.7% poverty level for males and 19.0% for females among the residents of Elephant Butte, under 5 year old males and 25 to 34 year old females are the most vulnerable to poverty, with 19 males (100.0%) and 44 females (34.9%) in their respective age groups living below the poverty level.
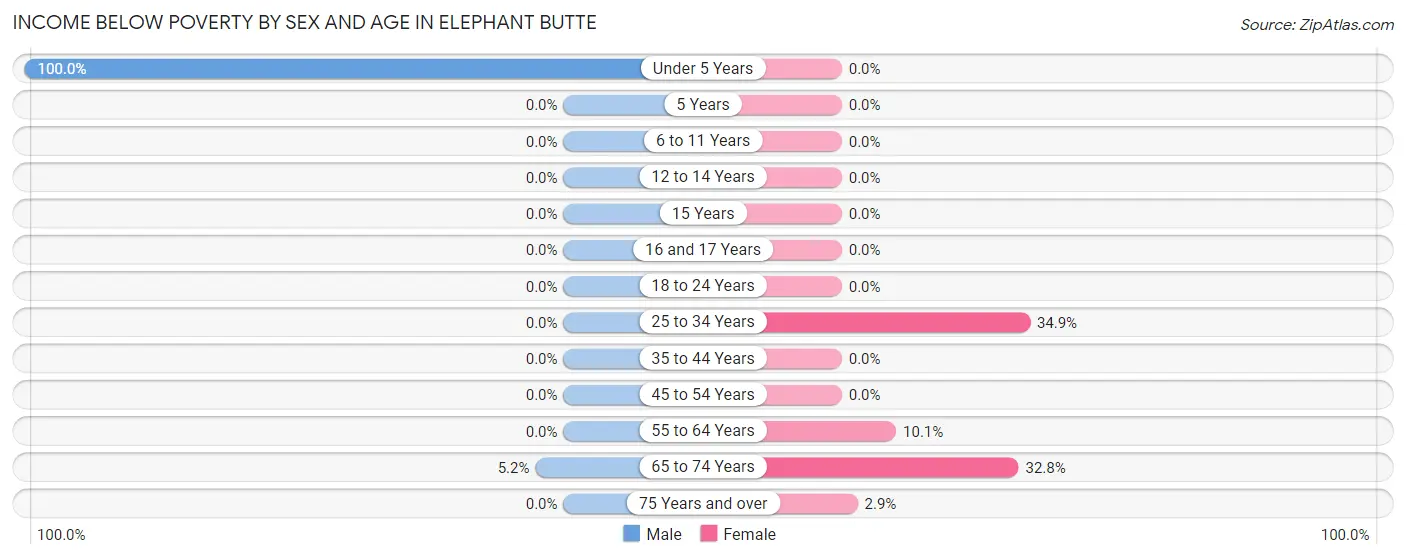
| Age Bracket | Male | Female |
| Under 5 Years | 19 (100.0%) | 0 (0.0%) |
| 5 Years | 0 (0.0%) | 0 (0.0%) |
| 6 to 11 Years | 0 (0.0%) | 0 (0.0%) |
| 12 to 14 Years | 0 (0.0%) | 0 (0.0%) |
| 15 Years | 0 (0.0%) | 0 (0.0%) |
| 16 and 17 Years | 0 (0.0%) | 0 (0.0%) |
| 18 to 24 Years | 0 (0.0%) | 0 (0.0%) |
| 25 to 34 Years | 0 (0.0%) | 44 (34.9%) |
| 35 to 44 Years | 0 (0.0%) | 0 (0.0%) |
| 45 to 54 Years | 0 (0.0%) | 0 (0.0%) |
| 55 to 64 Years | 0 (0.0%) | 12 (10.1%) |
| 65 to 74 Years | 19 (5.2%) | 83 (32.8%) |
| 75 Years and over | 0 (0.0%) | 6 (2.9%) |
| Total | 38 (4.7%) | 145 (19.0%) |
Income Above Poverty by Sex and Age in Elephant Butte
According to the poverty statistics in Elephant Butte, males aged 6 to 11 years and females aged 5 years are the age groups that are most secure financially, with 100.0% of males and 100.0% of females in these age groups living above the poverty line.
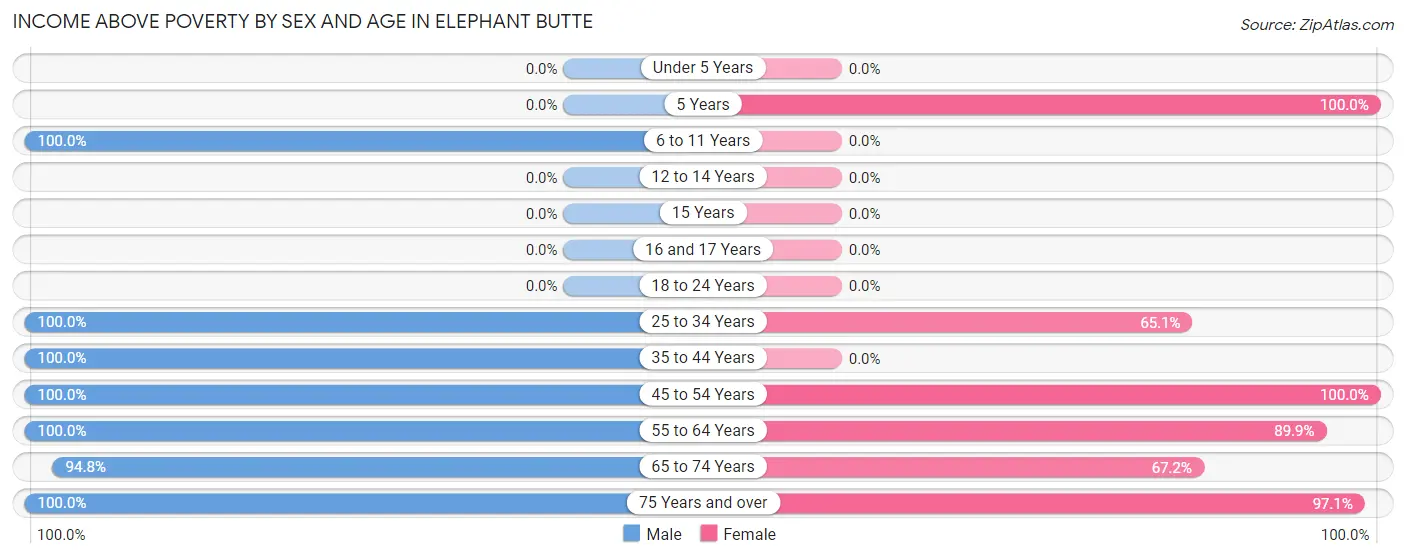
| Age Bracket | Male | Female |
| Under 5 Years | 0 (0.0%) | 0 (0.0%) |
| 5 Years | 0 (0.0%) | 22 (100.0%) |
| 6 to 11 Years | 18 (100.0%) | 0 (0.0%) |
| 12 to 14 Years | 0 (0.0%) | 0 (0.0%) |
| 15 Years | 0 (0.0%) | 0 (0.0%) |
| 16 and 17 Years | 0 (0.0%) | 0 (0.0%) |
| 18 to 24 Years | 0 (0.0%) | 0 (0.0%) |
| 25 to 34 Years | 138 (100.0%) | 82 (65.1%) |
| 35 to 44 Years | 16 (100.0%) | 0 (0.0%) |
| 45 to 54 Years | 8 (100.0%) | 39 (100.0%) |
| 55 to 64 Years | 106 (100.0%) | 107 (89.9%) |
| 65 to 74 Years | 346 (94.8%) | 170 (67.2%) |
| 75 Years and over | 140 (100.0%) | 198 (97.1%) |
| Total | 772 (95.3%) | 618 (81.0%) |
Income Below Poverty Among Married-Couple Families in Elephant Butte
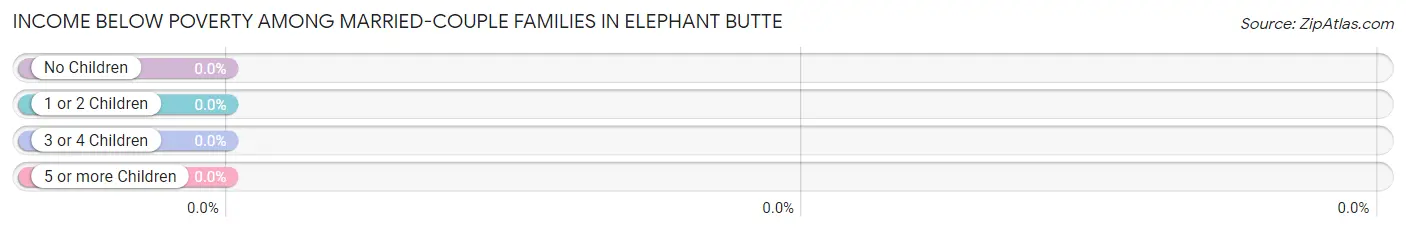
| Children | Above Poverty | Below Poverty |
| No Children | 367 (100.0%) | 0 (0.0%) |
| 1 or 2 Children | 17 (100.0%) | 0 (0.0%) |
| 3 or 4 Children | 0 (0.0%) | 0 (0.0%) |
| 5 or more Children | 0 (0.0%) | 0 (0.0%) |
| Total | 384 (100.0%) | 0 (0.0%) |
Income Below Poverty Among Single-Parent Households in Elephant Butte
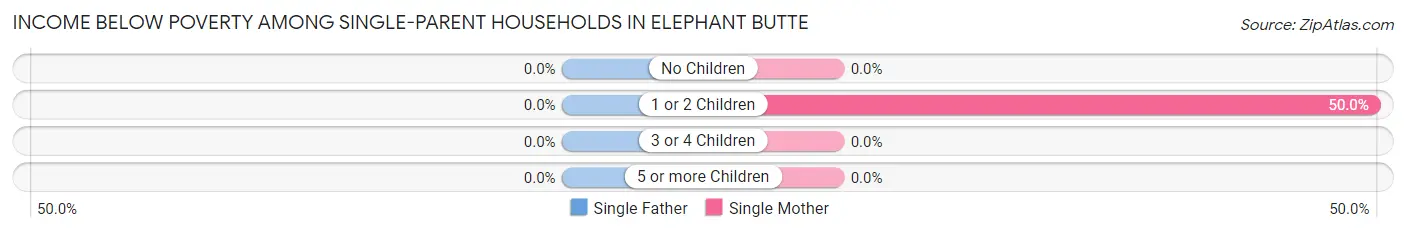
| Children | Single Father | Single Mother |
| No Children | 0 (0.0%) | 0 (0.0%) |
| 1 or 2 Children | 0 (0.0%) | 12 (50.0%) |
| 3 or 4 Children | 0 (0.0%) | 0 (0.0%) |
| 5 or more Children | 0 (0.0%) | 0 (0.0%) |
| Total | 0 (0.0%) | 12 (50.0%) |
Income Below Poverty Among Married-Couple vs Single-Parent Households in Elephant Butte
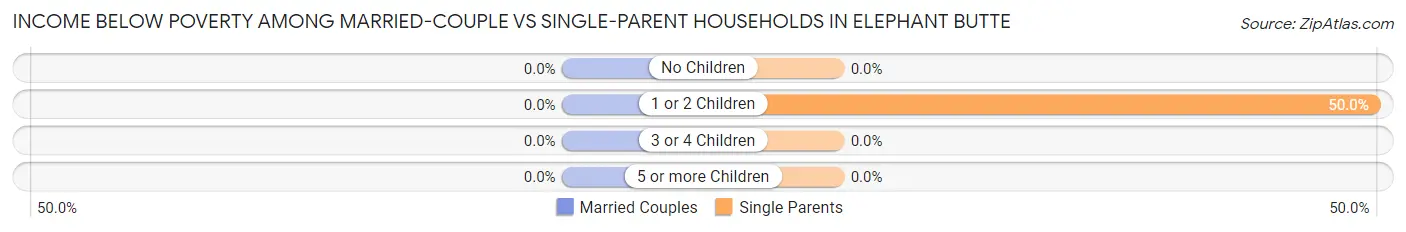
| Children | Married-Couple Families | Single-Parent Households |
| No Children | 0 (0.0%) | 0 (0.0%) |
| 1 or 2 Children | 0 (0.0%) | 12 (50.0%) |
| 3 or 4 Children | 0 (0.0%) | 0 (0.0%) |
| 5 or more Children | 0 (0.0%) | 0 (0.0%) |
| Total | 0 (0.0%) | 12 (30.8%) |
Race in Elephant Butte
The most populous races in Elephant Butte are White / Caucasian (1,395 | 88.7%), Hispanic or Latino (287 | 18.2%), and Two or more Races (178 | 11.3%).
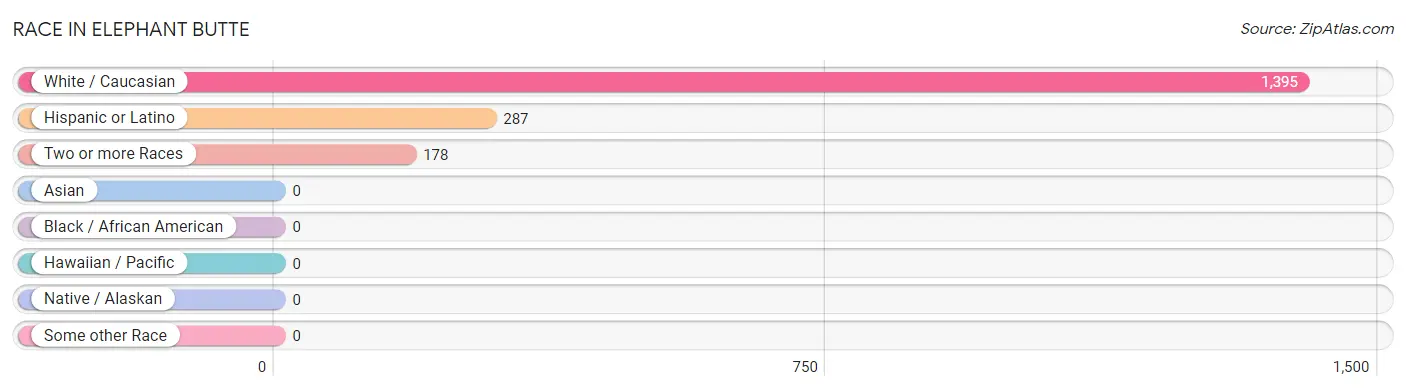
| Race | # Population | % Population |
| Asian | 0 | 0.0% |
| Black / African American | 0 | 0.0% |
| Hawaiian / Pacific | 0 | 0.0% |
| Hispanic or Latino | 287 | 18.2% |
| Native / Alaskan | 0 | 0.0% |
| White / Caucasian | 1,395 | 88.7% |
| Two or more Races | 178 | 11.3% |
| Some other Race | 0 | 0.0% |
| Total | 1,573 | 100.0% |
Ancestry in Elephant Butte
The most populous ancestries reported in Elephant Butte are German (242 | 15.4%), American (182 | 11.6%), English (114 | 7.2%), Irish (87 | 5.5%), and Mexican (86 | 5.5%), together accounting for 45.2% of all Elephant Butte residents.
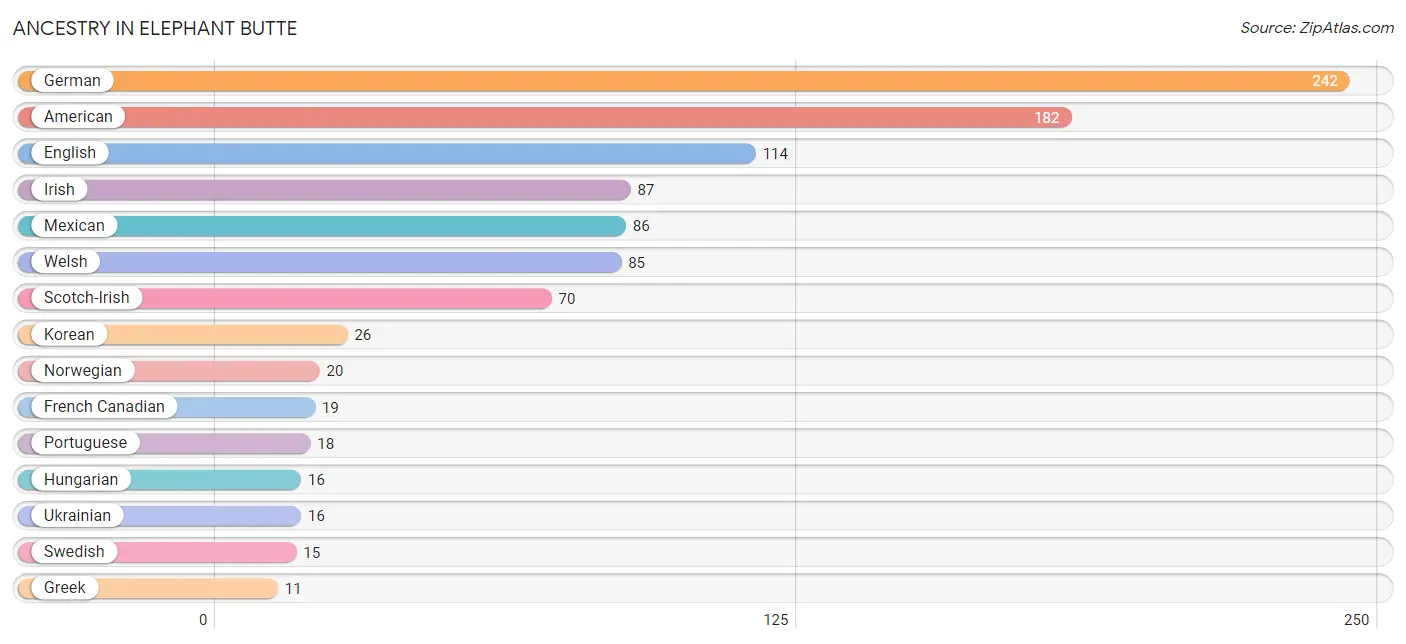
| Ancestry | # Population | % Population |
| American | 182 | 11.6% |
| Dutch | 8 | 0.5% |
| English | 114 | 7.2% |
| European | 7 | 0.4% |
| French Canadian | 19 | 1.2% |
| German | 242 | 15.4% |
| Greek | 11 | 0.7% |
| Hungarian | 16 | 1.0% |
| Irish | 87 | 5.5% |
| Korean | 26 | 1.7% |
| Mexican | 86 | 5.5% |
| Norwegian | 20 | 1.3% |
| Portuguese | 18 | 1.1% |
| Scotch-Irish | 70 | 4.4% |
| Swedish | 15 | 0.9% |
| Ukrainian | 16 | 1.0% |
| Welsh | 85 | 5.4% | View All 17 Rows |
Immigrants in Elephant Butte
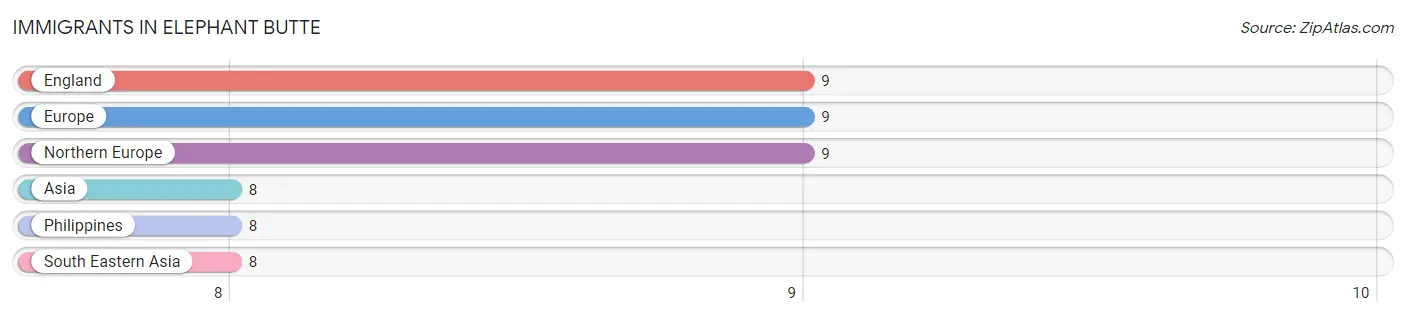
The most numerous immigrant groups reported in Elephant Butte came from England (9 | 0.6%), Europe (9 | 0.6%), Northern Europe (9 | 0.6%), Asia (8 | 0.5%), and Philippines (8 | 0.5%), together accounting for 2.7% of all Elephant Butte residents.
| Immigration Origin | # Population | % Population |
| Asia | 8 | 0.5% |
| England | 9 | 0.6% |
| Europe | 9 | 0.6% |
| Northern Europe | 9 | 0.6% |
| Philippines | 8 | 0.5% |
| South Eastern Asia | 8 | 0.5% | View All 6 Rows |
Sex and Age in Elephant Butte
Sex and Age in Elephant Butte
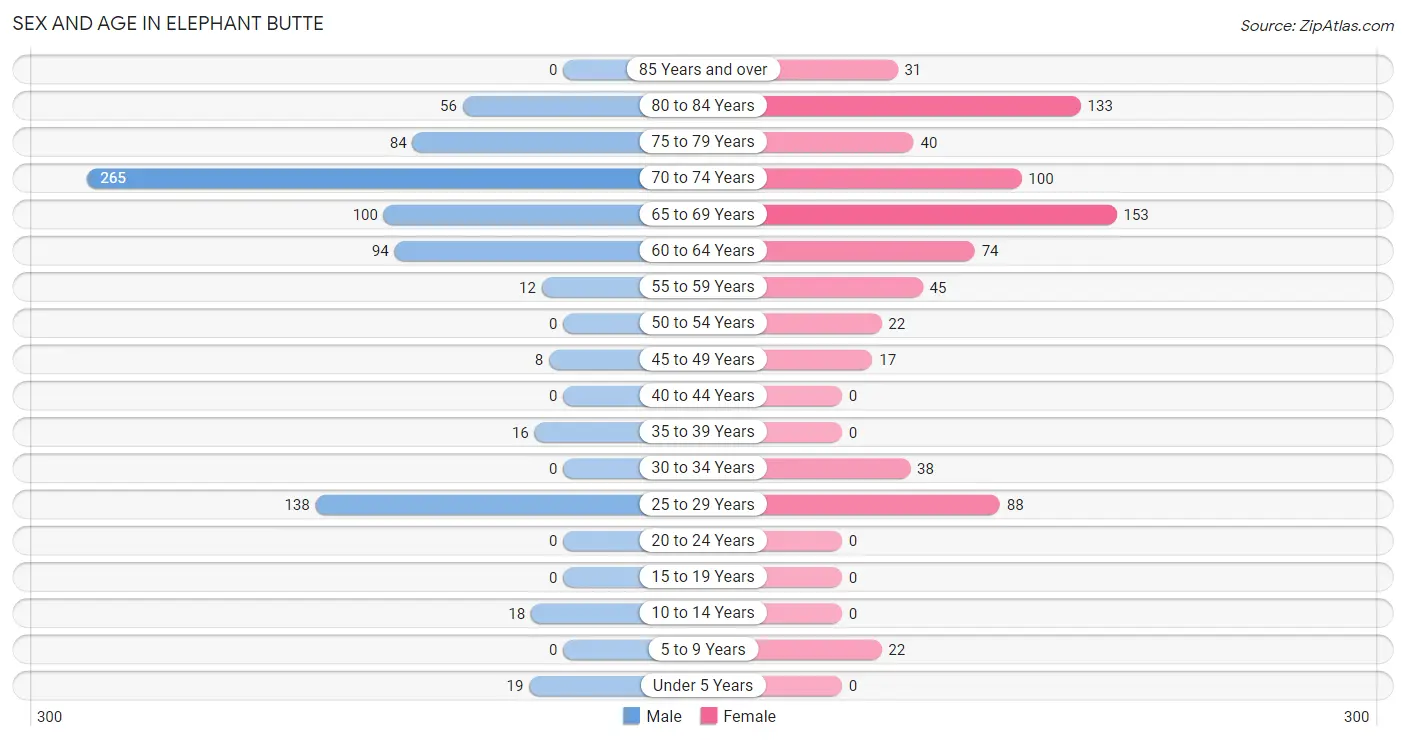
The most populous age groups in Elephant Butte are 70 to 74 Years (265 | 32.7%) for men and 65 to 69 Years (153 | 20.1%) for women.
| Age Bracket | Male | Female |
| Under 5 Years | 19 (2.4%) | 0 (0.0%) |
| 5 to 9 Years | 0 (0.0%) | 22 (2.9%) |
| 10 to 14 Years | 18 (2.2%) | 0 (0.0%) |
| 15 to 19 Years | 0 (0.0%) | 0 (0.0%) |
| 20 to 24 Years | 0 (0.0%) | 0 (0.0%) |
| 25 to 29 Years | 138 (17.0%) | 88 (11.5%) |
| 30 to 34 Years | 0 (0.0%) | 38 (5.0%) |
| 35 to 39 Years | 16 (2.0%) | 0 (0.0%) |
| 40 to 44 Years | 0 (0.0%) | 0 (0.0%) |
| 45 to 49 Years | 8 (1.0%) | 17 (2.2%) |
| 50 to 54 Years | 0 (0.0%) | 22 (2.9%) |
| 55 to 59 Years | 12 (1.5%) | 45 (5.9%) |
| 60 to 64 Years | 94 (11.6%) | 74 (9.7%) |
| 65 to 69 Years | 100 (12.3%) | 153 (20.1%) |
| 70 to 74 Years | 265 (32.7%) | 100 (13.1%) |
| 75 to 79 Years | 84 (10.4%) | 40 (5.2%) |
| 80 to 84 Years | 56 (6.9%) | 133 (17.4%) |
| 85 Years and over | 0 (0.0%) | 31 (4.1%) |
| Total | 810 (100.0%) | 763 (100.0%) |
Families and Households in Elephant Butte
Median Family Size in Elephant Butte
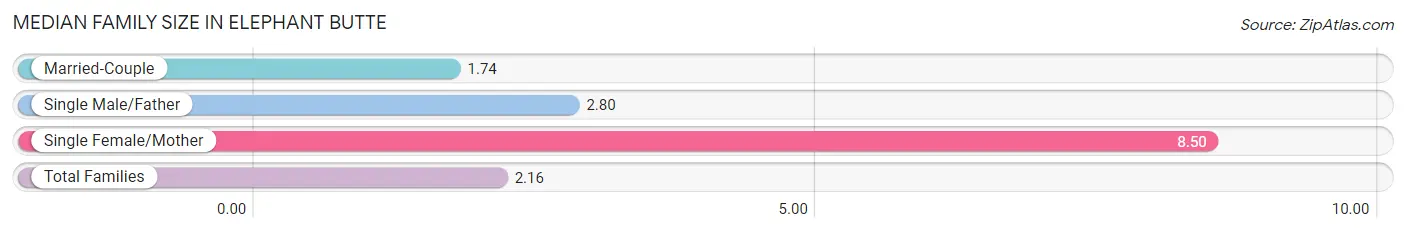
The median family size in Elephant Butte is 2.16 persons per family, with single female/mother families (24 | 5.7%) accounting for the largest median family size of 8.5 persons per family. On the other hand, married-couple families (384 | 90.8%) represent the smallest median family size with 1.74 persons per family.
| Family Type | # Families | Family Size |
| Married-Couple | 384 (90.8%) | 1.74 |
| Single Male/Father | 15 (3.5%) | 2.80 |
| Single Female/Mother | 24 (5.7%) | 8.50 |
| Total Families | 423 (100.0%) | 2.16 |
Median Household Size in Elephant Butte
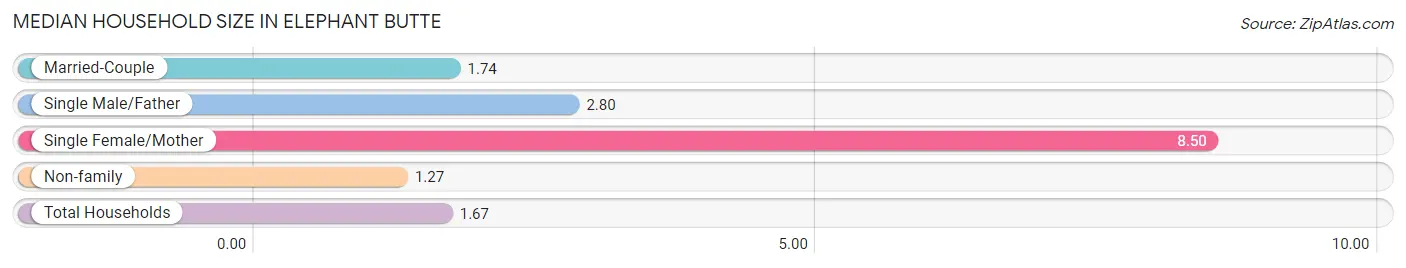
The median household size in Elephant Butte is 1.67 persons per household, with single female/mother households (24 | 2.5%) accounting for the largest median household size of 8.5 persons per household. non-family households (519 | 55.1%) represent the smallest median household size with 1.27 persons per household.
| Household Type | # Households | Household Size |
| Married-Couple | 384 (40.8%) | 1.74 |
| Single Male/Father | 15 (1.6%) | 2.80 |
| Single Female/Mother | 24 (2.5%) | 8.50 |
| Non-family | 519 (55.1%) | 1.27 |
| Total Households | 942 (100.0%) | 1.67 |
Household Size by Marriage Status in Elephant Butte
Out of a total of 942 households in Elephant Butte, 423 (44.9%) are family households, while 519 (55.1%) are nonfamily households. The most numerous type of family households are 2-person households, comprising 382, and the most common type of nonfamily households are 1-person households, comprising 445.
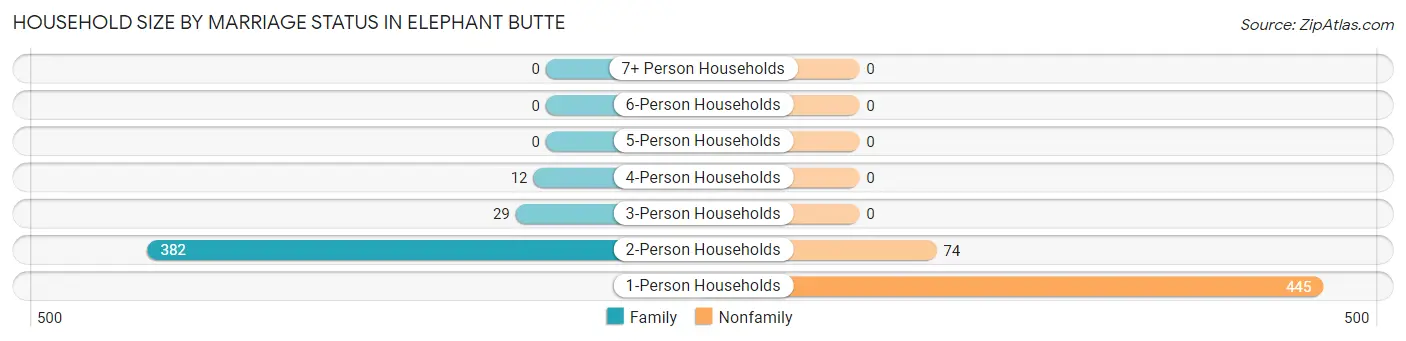
| Household Size | Family Households | Nonfamily Households |
| 1-Person Households | - | 445 (47.2%) |
| 2-Person Households | 382 (40.6%) | 74 (7.9%) |
| 3-Person Households | 29 (3.1%) | 0 (0.0%) |
| 4-Person Households | 12 (1.3%) | 0 (0.0%) |
| 5-Person Households | 0 (0.0%) | 0 (0.0%) |
| 6-Person Households | 0 (0.0%) | 0 (0.0%) |
| 7+ Person Households | 0 (0.0%) | 0 (0.0%) |
| Total | 423 (44.9%) | 519 (55.1%) |
Female Fertility in Elephant Butte
Fertility by Age in Elephant Butte
| Age Bracket | Women with Births | Births / 1,000 Women |
| 15 to 19 years | 0 (0.0%) | 0.0 |
| 20 to 34 years | 0 (0.0%) | 0.0 |
| 35 to 50 years | 0 (0.0%) | 0.0 |
| Total | 0 (0.0%) | 0.0 |
Fertility by Age by Marriage Status in Elephant Butte
| Age Bracket | Married | Unmarried |
| 15 to 19 years | 0 (0.0%) | 0 (0.0%) |
| 20 to 34 years | 0 (0.0%) | 0 (0.0%) |
| 35 to 50 years | 0 (0.0%) | 0 (0.0%) |
| Total | 0 (0.0%) | 0 (0.0%) |
Fertility by Education in Elephant Butte
| Educational Attainment | Women with Births | Births / 1,000 Women |
| Less than High School | 0 (0.0%) | 0.0 |
| High School Diploma | 0 (0.0%) | 0.0 |
| College or Associate's Degree | 0 (0.0%) | 0.0 |
| Bachelor's Degree | 0 (0.0%) | 0.0 |
| Graduate Degree | 0 (0.0%) | 0.0 |
| Total | 0 (0.0%) | 0.0 |
Fertility by Education by Marriage Status in Elephant Butte
| Educational Attainment | Married | Unmarried |
| Less than High School | 0 (0.0%) | 0 (0.0%) |
| High School Diploma | 0 (0.0%) | 0 (0.0%) |
| College or Associate's Degree | 0 (0.0%) | 0 (0.0%) |
| Bachelor's Degree | 0 (0.0%) | 0 (0.0%) |
| Graduate Degree | 0 (0.0%) | 0 (0.0%) |
| Total | 0 (0.0%) | 0 (0.0%) |
Employment Characteristics in Elephant Butte
Employment by Class of Employer in Elephant Butte
Among the 433 employed individuals in Elephant Butte, private company employees (249 | 57.5%), local government employees (100 | 23.1%), and self-employed (not incorporated) (53 | 12.2%) make up the most common classes of employment.
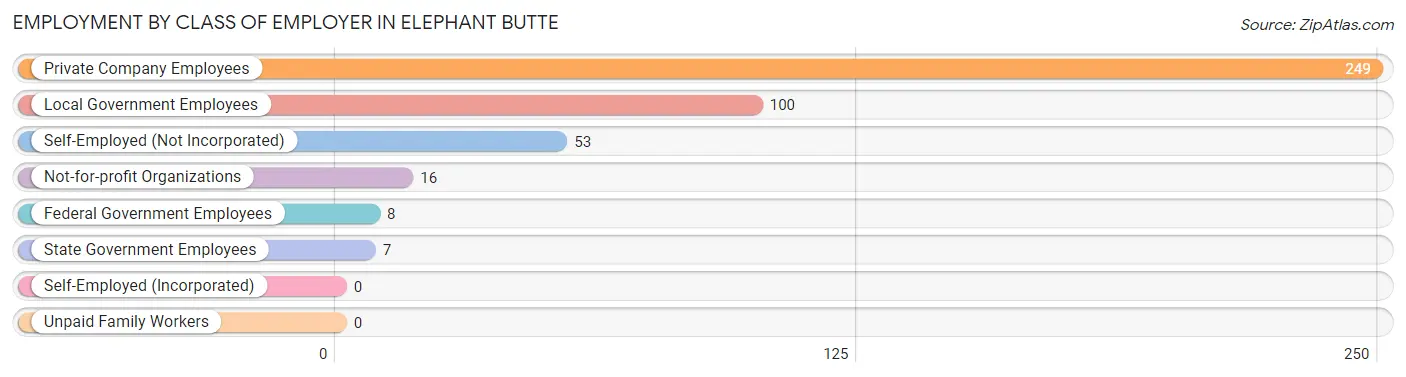
| Employer Class | # Employees | % Employees |
| Private Company Employees | 249 | 57.5% |
| Self-Employed (Incorporated) | 0 | 0.0% |
| Self-Employed (Not Incorporated) | 53 | 12.2% |
| Not-for-profit Organizations | 16 | 3.7% |
| Local Government Employees | 100 | 23.1% |
| State Government Employees | 7 | 1.6% |
| Federal Government Employees | 8 | 1.8% |
| Unpaid Family Workers | 0 | 0.0% |
| Total | 433 | 100.0% |
Employment Status by Age in Elephant Butte
According to the labor force statistics for Elephant Butte, out of the total population over 16 years of age (1,514), 29.4% or 445 individuals are in the labor force, with 2.7% or 12 of them unemployed. The age group with the highest labor force participation rate is 30 to 34 years, with 100.0% or 38 individuals in the labor force. Within the labor force, the 55 to 59 years age range has the highest percentage of unemployed individuals, with 52.2% or 12 of them being unemployed.
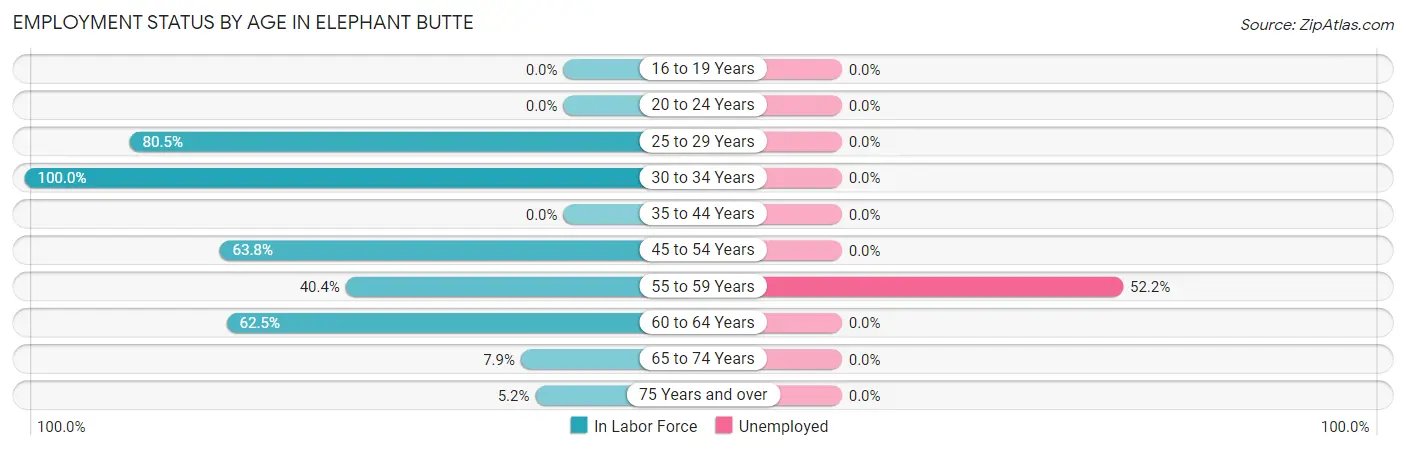
| Age Bracket | In Labor Force | Unemployed |
| 16 to 19 Years | 0 (0.0%) | 0 (0.0%) |
| 20 to 24 Years | 0 (0.0%) | 0 (0.0%) |
| 25 to 29 Years | 182 (80.5%) | 0 (0.0%) |
| 30 to 34 Years | 38 (100.0%) | 0 (0.0%) |
| 35 to 44 Years | 0 (0.0%) | 0 (0.0%) |
| 45 to 54 Years | 30 (63.8%) | 0 (0.0%) |
| 55 to 59 Years | 23 (40.4%) | 12 (52.2%) |
| 60 to 64 Years | 105 (62.5%) | 0 (0.0%) |
| 65 to 74 Years | 49 (7.9%) | 0 (0.0%) |
| 75 Years and over | 18 (5.2%) | 0 (0.0%) |
| Total | 445 (29.4%) | 12 (2.7%) |
Employment Status by Educational Attainment in Elephant Butte
According to labor force statistics for Elephant Butte, 68.5% of individuals (378) out of the total population between 25 and 64 years of age (552) are in the labor force, with 3.2% or 12 of them being unemployed. The group with the highest labor force participation rate are those with the educational attainment of high school diploma, with 92.3% or 181 individuals in the labor force. Within the labor force, individuals with bachelor's degree or higher education have the highest percentage of unemployment, with 11.0% or 12 of them being unemployed.
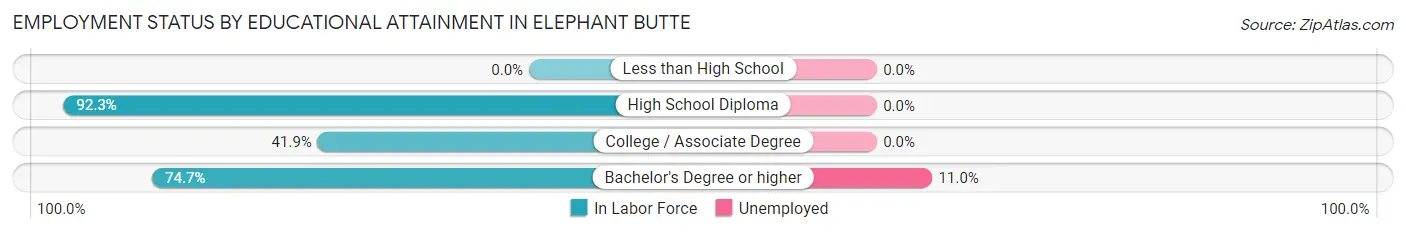
| Educational Attainment | In Labor Force | Unemployed |
| Less than High School | 0 (0.0%) | 0 (0.0%) |
| High School Diploma | 181 (92.3%) | 0 (0.0%) |
| College / Associate Degree | 88 (41.9%) | 0 (0.0%) |
| Bachelor's Degree or higher | 109 (74.7%) | 16 (11.0%) |
| Total | 378 (68.5%) | 18 (3.2%) |
Employment Occupations by Sex in Elephant Butte
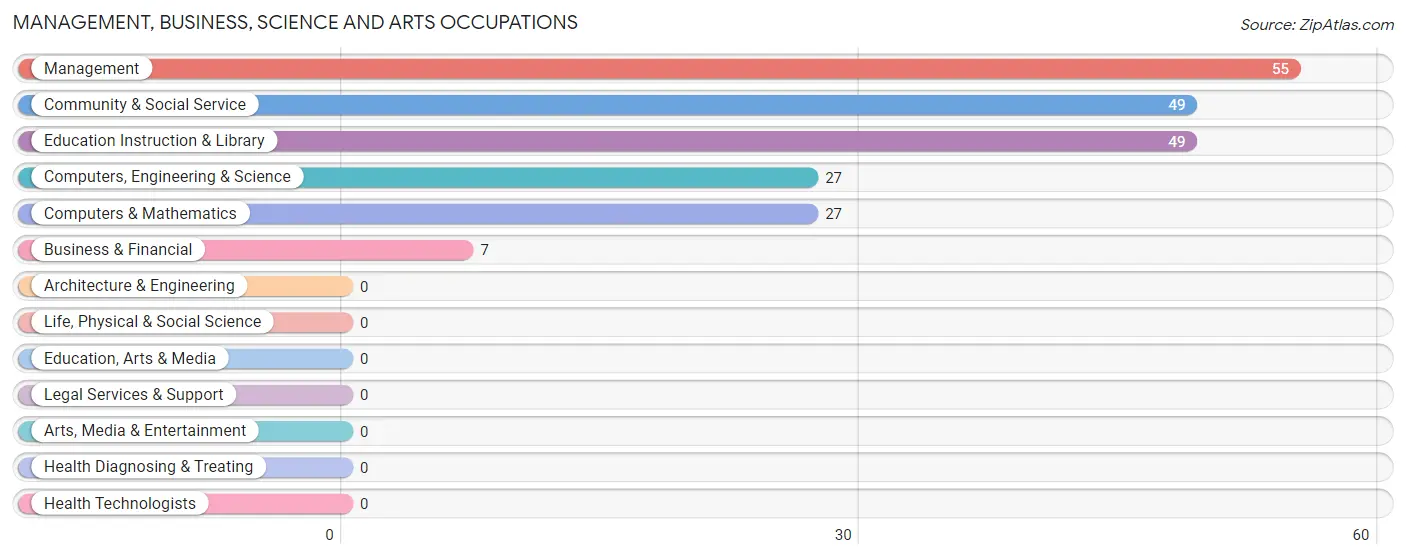
Management, Business, Science and Arts Occupations
The most common Management, Business, Science and Arts occupations in Elephant Butte are Management (55 | 12.7%), Community & Social Service (49 | 11.3%), Education Instruction & Library (49 | 11.3%), Computers, Engineering & Science (27 | 6.2%), and Computers & Mathematics (27 | 6.2%).
Management, Business, Science and Arts Occupations by Sex
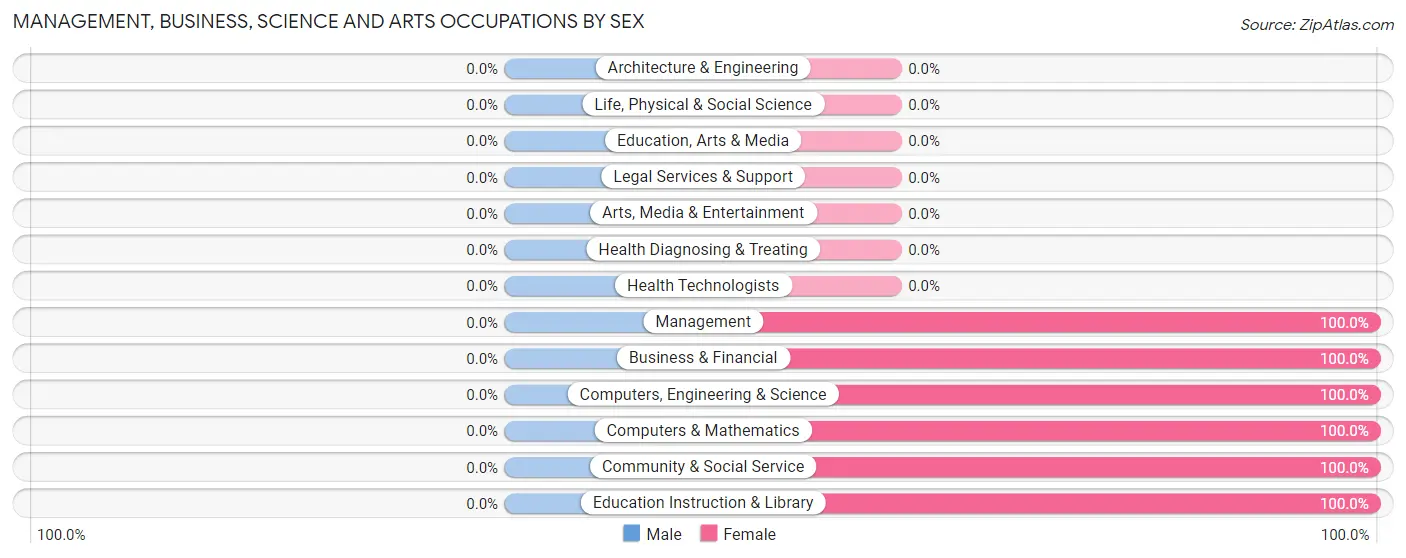
| Occupation | Male | Female |
| Management | 0 (0.0%) | 55 (100.0%) |
| Business & Financial | 0 (0.0%) | 7 (100.0%) |
| Computers, Engineering & Science | 0 (0.0%) | 27 (100.0%) |
| Computers & Mathematics | 0 (0.0%) | 27 (100.0%) |
| Architecture & Engineering | 0 (0.0%) | 0 (0.0%) |
| Life, Physical & Social Science | 0 (0.0%) | 0 (0.0%) |
| Community & Social Service | 0 (0.0%) | 49 (100.0%) |
| Education, Arts & Media | 0 (0.0%) | 0 (0.0%) |
| Legal Services & Support | 0 (0.0%) | 0 (0.0%) |
| Education Instruction & Library | 0 (0.0%) | 49 (100.0%) |
| Arts, Media & Entertainment | 0 (0.0%) | 0 (0.0%) |
| Health Diagnosing & Treating | 0 (0.0%) | 0 (0.0%) |
| Health Technologists | 0 (0.0%) | 0 (0.0%) |
| Total (Category) | 0 (0.0%) | 138 (100.0%) |
| Total (Overall) | 231 (53.3%) | 202 (46.7%) |
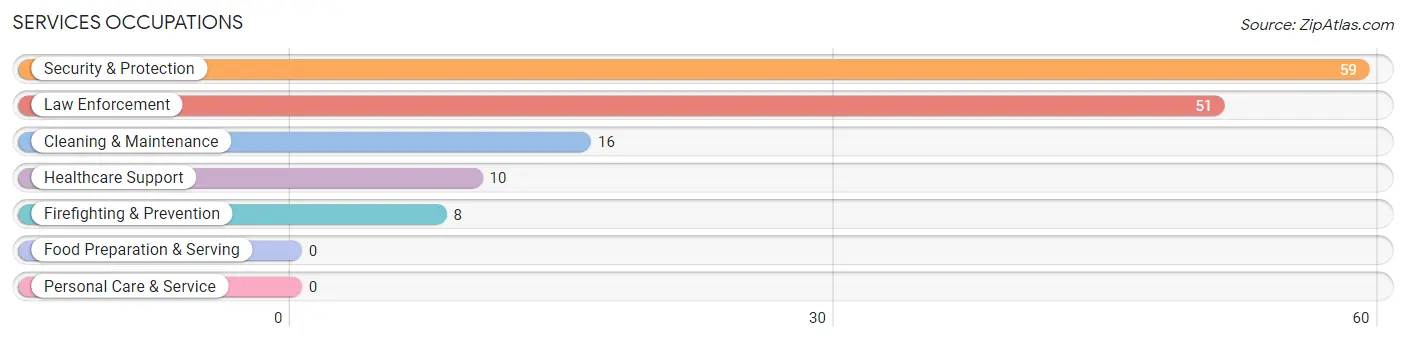
Services Occupations
The most common Services occupations in Elephant Butte are Security & Protection (59 | 13.6%), Law Enforcement (51 | 11.8%), Cleaning & Maintenance (16 | 3.7%), Healthcare Support (10 | 2.3%), and Firefighting & Prevention (8 | 1.8%).
Services Occupations by Sex
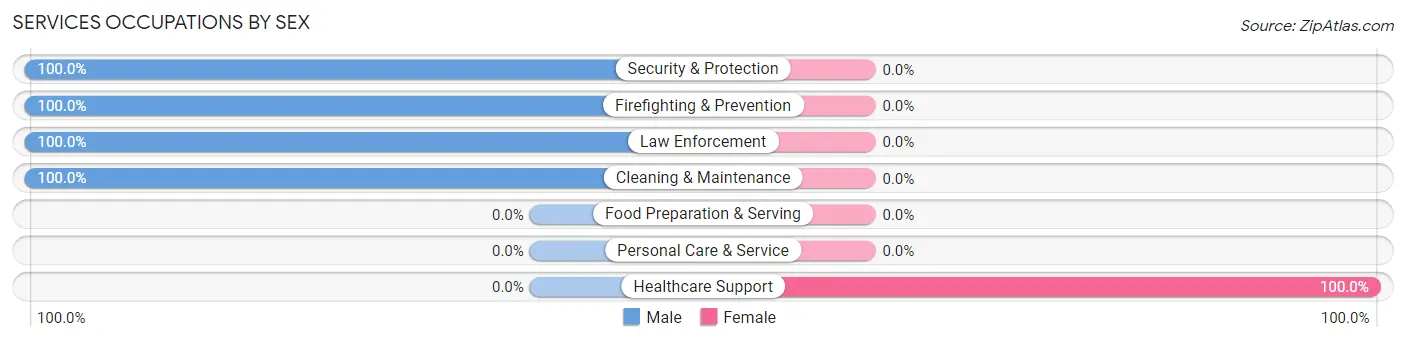
| Occupation | Male | Female |
| Healthcare Support | 0 (0.0%) | 10 (100.0%) |
| Security & Protection | 59 (100.0%) | 0 (0.0%) |
| Firefighting & Prevention | 8 (100.0%) | 0 (0.0%) |
| Law Enforcement | 51 (100.0%) | 0 (0.0%) |
| Food Preparation & Serving | 0 (0.0%) | 0 (0.0%) |
| Cleaning & Maintenance | 16 (100.0%) | 0 (0.0%) |
| Personal Care & Service | 0 (0.0%) | 0 (0.0%) |
| Total (Category) | 75 (88.2%) | 10 (11.8%) |
| Total (Overall) | 231 (53.3%) | 202 (46.7%) |
Sales and Office Occupations
The most common Sales and Office occupations in Elephant Butte are Sales & Related (78 | 18.0%), and Office & Administration (21 | 4.9%).
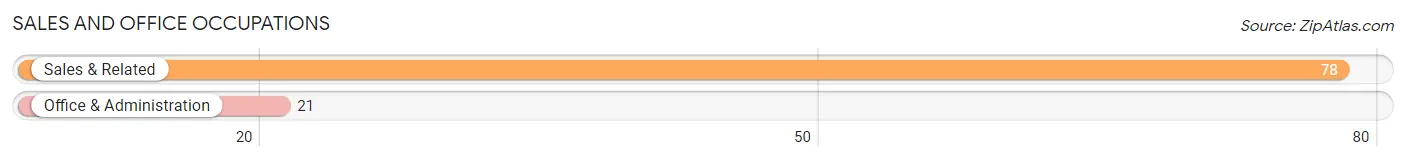
Sales and Office Occupations by Sex
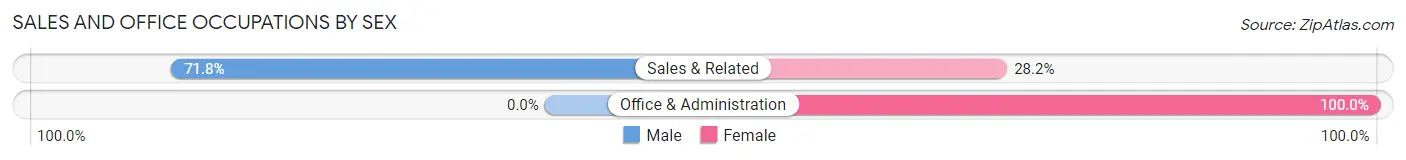
| Occupation | Male | Female |
| Sales & Related | 56 (71.8%) | 22 (28.2%) |
| Office & Administration | 0 (0.0%) | 21 (100.0%) |
| Total (Category) | 56 (56.6%) | 43 (43.4%) |
| Total (Overall) | 231 (53.3%) | 202 (46.7%) |
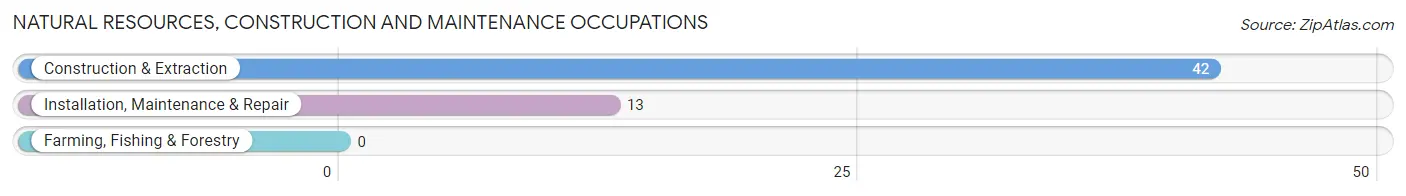
Natural Resources, Construction and Maintenance Occupations
The most common Natural Resources, Construction and Maintenance occupations in Elephant Butte are Construction & Extraction (42 | 9.7%), and Installation, Maintenance & Repair (13 | 3.0%).
Natural Resources, Construction and Maintenance Occupations by Sex
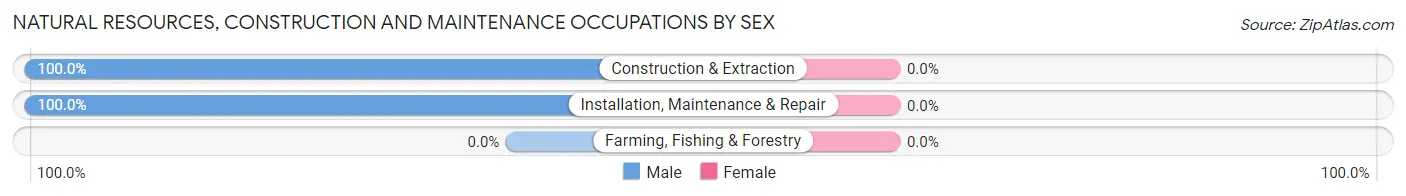
| Occupation | Male | Female |
| Farming, Fishing & Forestry | 0 (0.0%) | 0 (0.0%) |
| Construction & Extraction | 42 (100.0%) | 0 (0.0%) |
| Installation, Maintenance & Repair | 13 (100.0%) | 0 (0.0%) |
| Total (Category) | 55 (100.0%) | 0 (0.0%) |
| Total (Overall) | 231 (53.3%) | 202 (46.7%) |
Production, Transportation and Moving Occupations
The most common Production, Transportation and Moving occupations in Elephant Butte are , and Material Moving (56 | 12.9%).
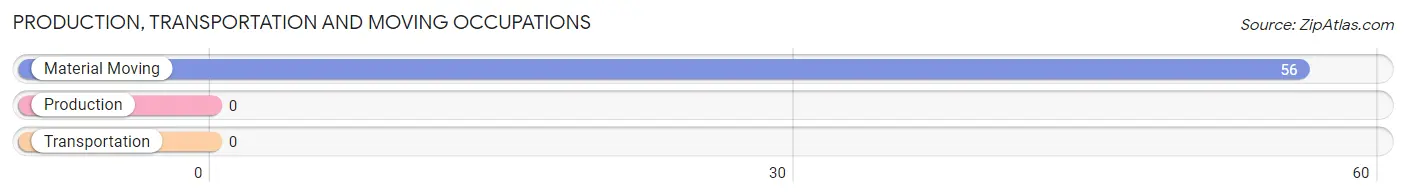
Production, Transportation and Moving Occupations by Sex
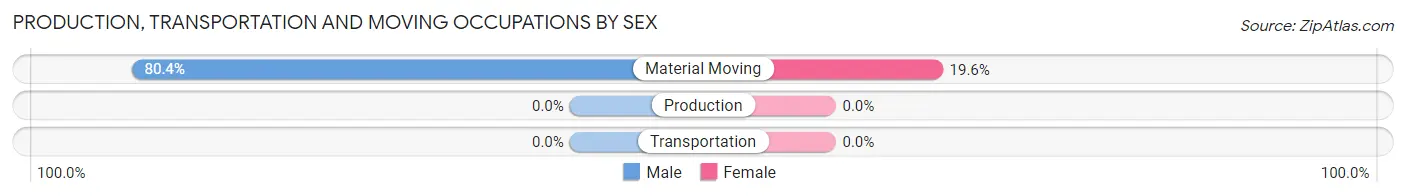
| Occupation | Male | Female |
| Production | 0 (0.0%) | 0 (0.0%) |
| Transportation | 0 (0.0%) | 0 (0.0%) |
| Material Moving | 45 (80.4%) | 11 (19.6%) |
| Total (Category) | 45 (80.4%) | 11 (19.6%) |
| Total (Overall) | 231 (53.3%) | 202 (46.7%) |
Employment Industries by Sex in Elephant Butte
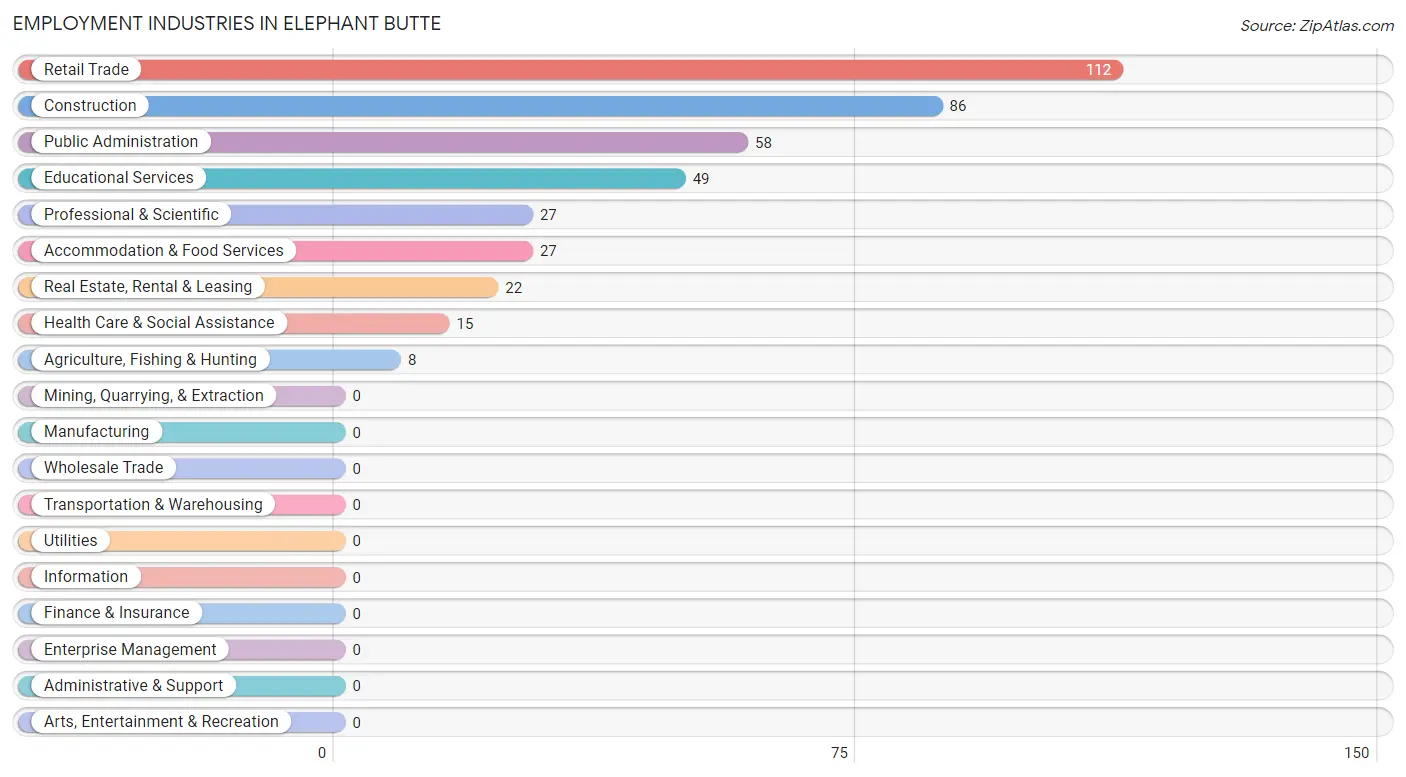
Employment Industries in Elephant Butte
The major employment industries in Elephant Butte include Retail Trade (112 | 25.9%), Construction (86 | 19.9%), Public Administration (58 | 13.4%), Educational Services (49 | 11.3%), and Professional & Scientific (27 | 6.2%).
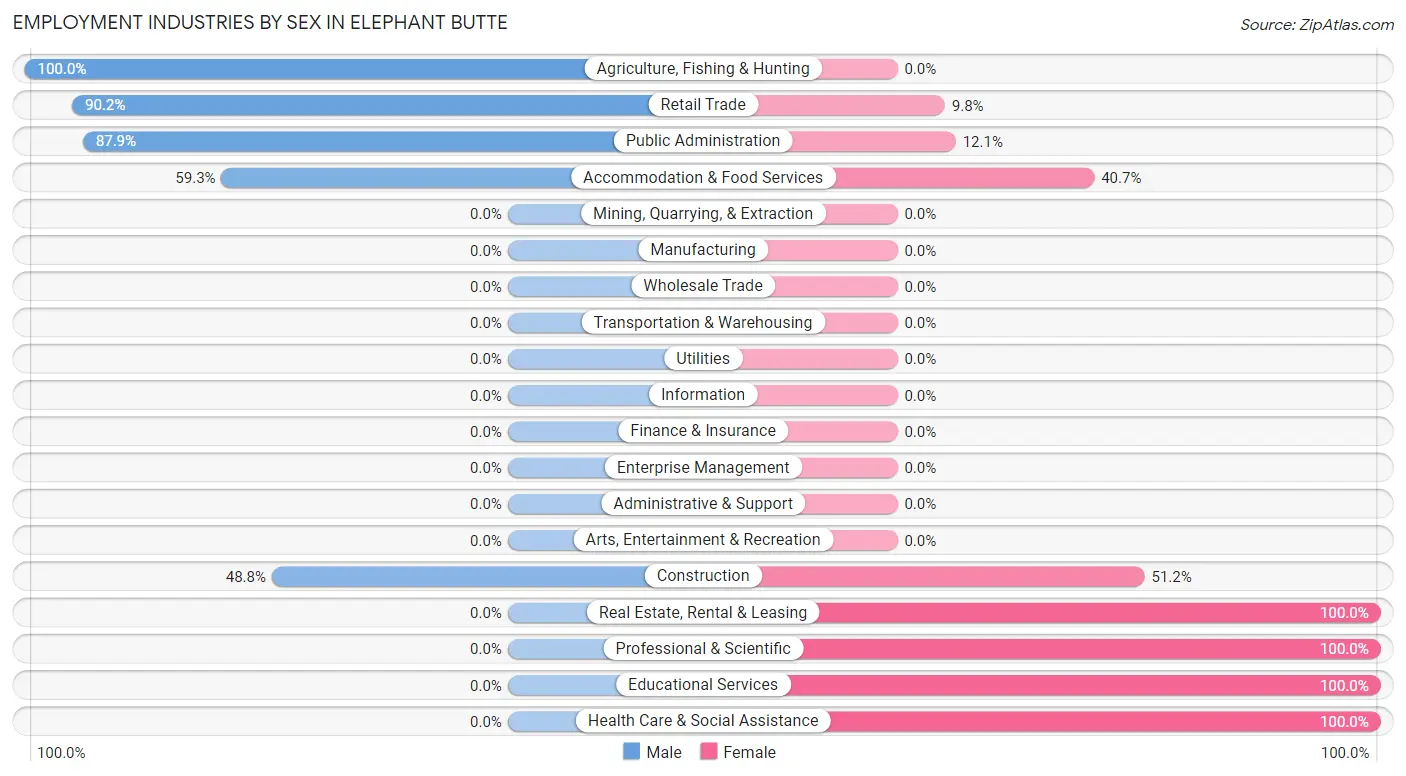
Employment Industries by Sex in Elephant Butte
The Elephant Butte industries that see more men than women are Agriculture, Fishing & Hunting (100.0%), Retail Trade (90.2%), and Public Administration (87.9%), whereas the industries that tend to have a higher number of women are Real Estate, Rental & Leasing (100.0%), Professional & Scientific (100.0%), and Educational Services (100.0%).
| Industry | Male | Female |
| Agriculture, Fishing & Hunting | 8 (100.0%) | 0 (0.0%) |
| Mining, Quarrying, & Extraction | 0 (0.0%) | 0 (0.0%) |
| Construction | 42 (48.8%) | 44 (51.2%) |
| Manufacturing | 0 (0.0%) | 0 (0.0%) |
| Wholesale Trade | 0 (0.0%) | 0 (0.0%) |
| Retail Trade | 101 (90.2%) | 11 (9.8%) |
| Transportation & Warehousing | 0 (0.0%) | 0 (0.0%) |
| Utilities | 0 (0.0%) | 0 (0.0%) |
| Information | 0 (0.0%) | 0 (0.0%) |
| Finance & Insurance | 0 (0.0%) | 0 (0.0%) |
| Real Estate, Rental & Leasing | 0 (0.0%) | 22 (100.0%) |
| Professional & Scientific | 0 (0.0%) | 27 (100.0%) |
| Enterprise Management | 0 (0.0%) | 0 (0.0%) |
| Administrative & Support | 0 (0.0%) | 0 (0.0%) |
| Educational Services | 0 (0.0%) | 49 (100.0%) |
| Health Care & Social Assistance | 0 (0.0%) | 15 (100.0%) |
| Arts, Entertainment & Recreation | 0 (0.0%) | 0 (0.0%) |
| Accommodation & Food Services | 16 (59.3%) | 11 (40.7%) |
| Public Administration | 51 (87.9%) | 7 (12.1%) |
| Total | 231 (53.3%) | 202 (46.7%) |
Education in Elephant Butte
School Enrollment in Elephant Butte
The most common levels of schooling among the 99 students in Elephant Butte are college / undergraduate (44 | 44.4%), kindergarten (22 | 22.2%), and elementary school (18 | 18.2%).
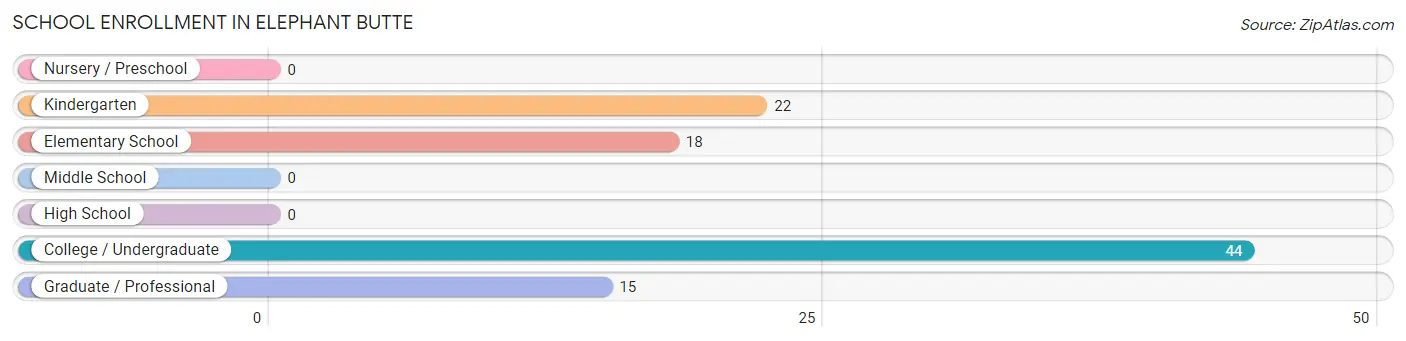
| School Level | # Students | % Students |
| Nursery / Preschool | 0 | 0.0% |
| Kindergarten | 22 | 22.2% |
| Elementary School | 18 | 18.2% |
| Middle School | 0 | 0.0% |
| High School | 0 | 0.0% |
| College / Undergraduate | 44 | 44.4% |
| Graduate / Professional | 15 | 15.1% |
| Total | 99 | 100.0% |
School Enrollment by Age by Funding Source in Elephant Butte
Out of a total of 99 students who are enrolled in schools in Elephant Butte, 33 (33.3%) attend a private institution, while the remaining 66 (66.7%) are enrolled in public schools. The age group of 10 to 14 year olds has the highest likelihood of being enrolled in private schools, with 18 (100.0% in the age bracket) enrolled. Conversely, the age group of 5 to 9 year old has the lowest likelihood of being enrolled in a private school, with 22 (100.0% in the age bracket) attending a public institution.
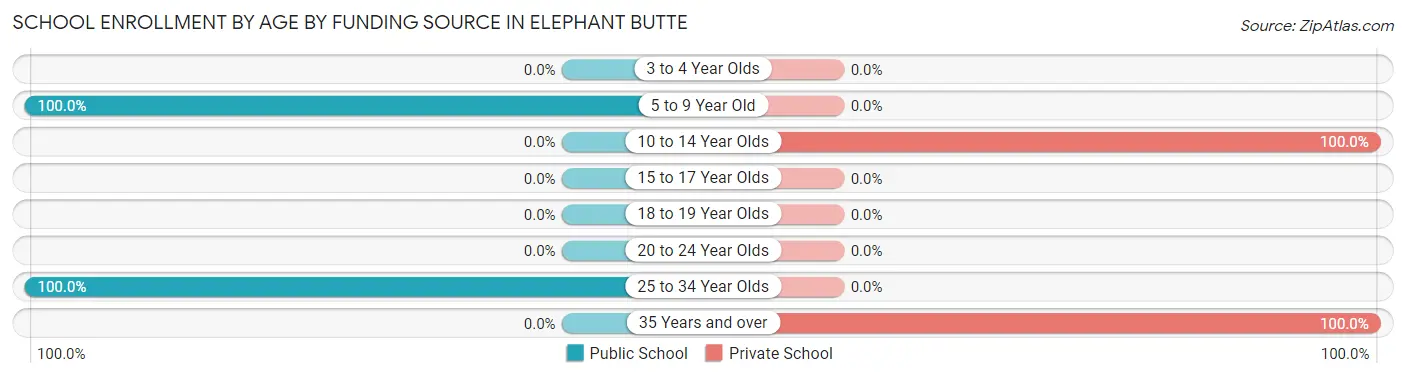
| Age Bracket | Public School | Private School |
| 3 to 4 Year Olds | 0 (0.0%) | 0 (0.0%) |
| 5 to 9 Year Old | 22 (100.0%) | 0 (0.0%) |
| 10 to 14 Year Olds | 0 (0.0%) | 18 (100.0%) |
| 15 to 17 Year Olds | 0 (0.0%) | 0 (0.0%) |
| 18 to 19 Year Olds | 0 (0.0%) | 0 (0.0%) |
| 20 to 24 Year Olds | 0 (0.0%) | 0 (0.0%) |
| 25 to 34 Year Olds | 44 (100.0%) | 0 (0.0%) |
| 35 Years and over | 0 (0.0%) | 15 (100.0%) |
| Total | 66 (66.7%) | 33 (33.3%) |
Educational Attainment by Field of Study in Elephant Butte
Education (109 | 36.6%), engineering (99 | 33.2%), business (30 | 10.1%), computers & mathematics (27 | 9.1%), and physical & health sciences (14 | 4.7%) are the most common fields of study among 298 individuals in Elephant Butte who have obtained a bachelor's degree or higher.
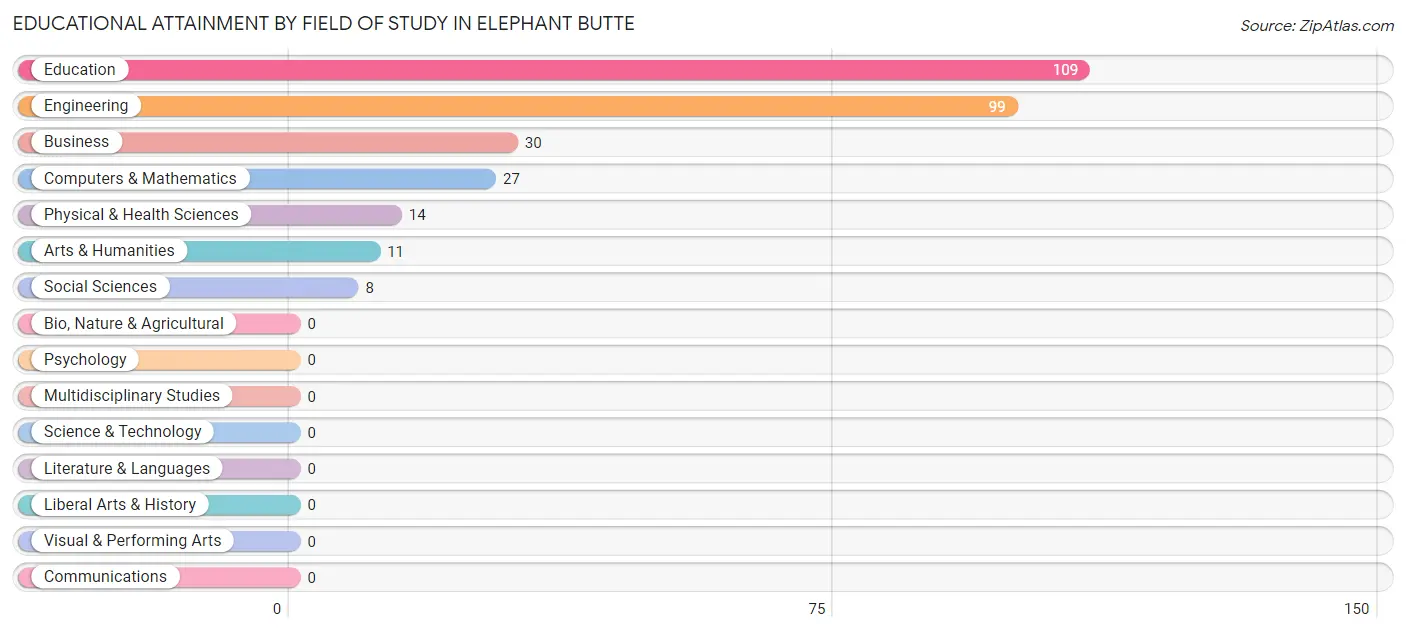
| Field of Study | # Graduates | % Graduates |
| Computers & Mathematics | 27 | 9.1% |
| Bio, Nature & Agricultural | 0 | 0.0% |
| Physical & Health Sciences | 14 | 4.7% |
| Psychology | 0 | 0.0% |
| Social Sciences | 8 | 2.7% |
| Engineering | 99 | 33.2% |
| Multidisciplinary Studies | 0 | 0.0% |
| Science & Technology | 0 | 0.0% |
| Business | 30 | 10.1% |
| Education | 109 | 36.6% |
| Literature & Languages | 0 | 0.0% |
| Liberal Arts & History | 0 | 0.0% |
| Visual & Performing Arts | 0 | 0.0% |
| Communications | 0 | 0.0% |
| Arts & Humanities | 11 | 3.7% |
| Total | 298 | 100.0% |
Transportation & Commute in Elephant Butte
Vehicle Availability by Sex in Elephant Butte
The most prevalent vehicle ownership categories in Elephant Butte are males with 3 vehicles (120, accounting for 51.9%) and females with 3 vehicles (125, making up 59.4%).
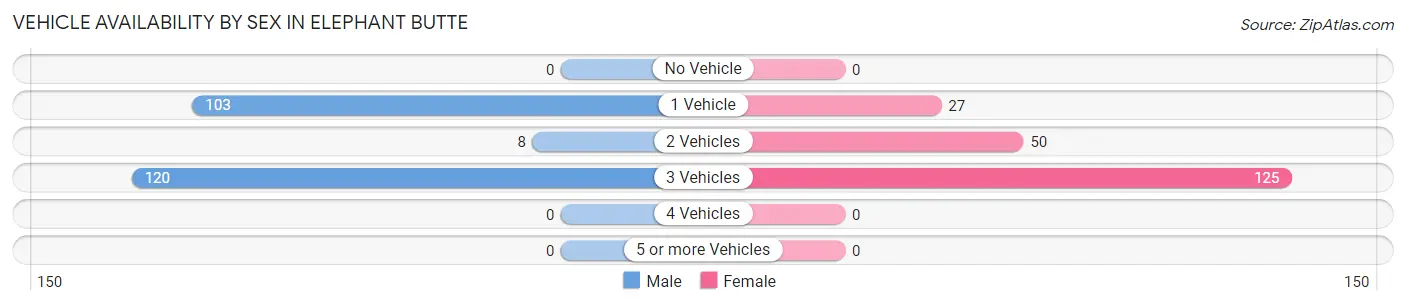
| Vehicles Available | Male | Female |
| No Vehicle | 0 (0.0%) | 0 (0.0%) |
| 1 Vehicle | 103 (44.6%) | 27 (13.4%) |
| 2 Vehicles | 8 (3.5%) | 50 (24.7%) |
| 3 Vehicles | 120 (51.9%) | 125 (61.9%) |
| 4 Vehicles | 0 (0.0%) | 0 (0.0%) |
| 5 or more Vehicles | 0 (0.0%) | 0 (0.0%) |
| Total | 231 (100.0%) | 202 (100.0%) |
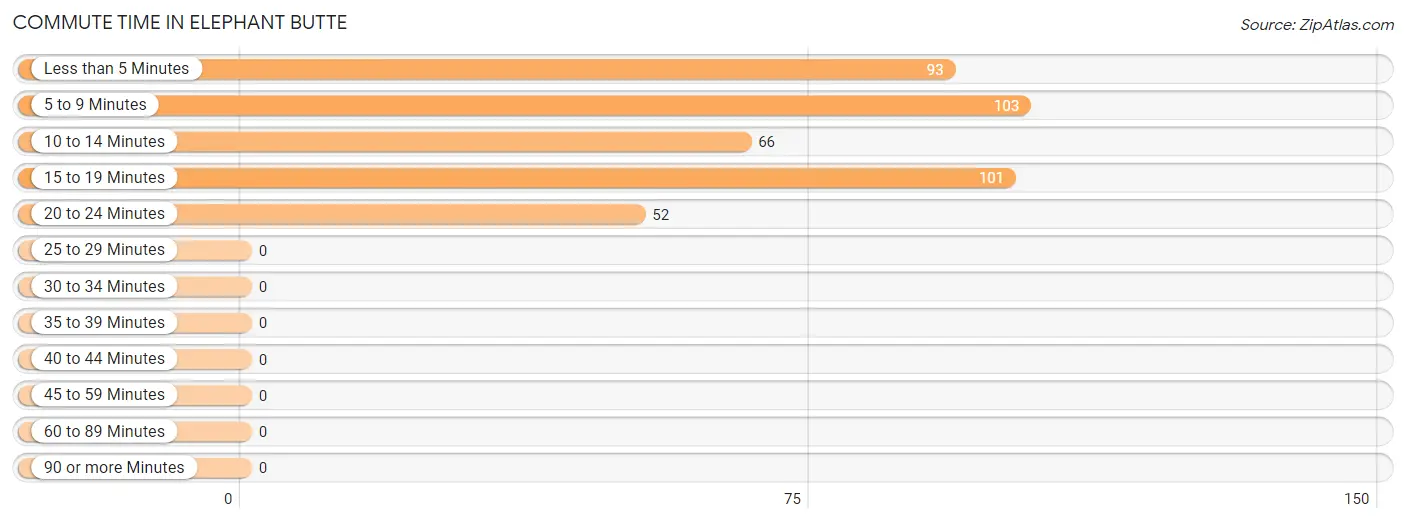
Commute Time in Elephant Butte
The most frequently occuring commute durations in Elephant Butte are 5 to 9 minutes (103 commuters, 24.8%), 15 to 19 minutes (101 commuters, 24.3%), and less than 5 minutes (93 commuters, 22.4%).
| Commute Time | # Commuters | % Commuters |
| Less than 5 Minutes | 93 | 22.4% |
| 5 to 9 Minutes | 103 | 24.8% |
| 10 to 14 Minutes | 66 | 15.9% |
| 15 to 19 Minutes | 101 | 24.3% |
| 20 to 24 Minutes | 52 | 12.5% |
| 25 to 29 Minutes | 0 | 0.0% |
| 30 to 34 Minutes | 0 | 0.0% |
| 35 to 39 Minutes | 0 | 0.0% |
| 40 to 44 Minutes | 0 | 0.0% |
| 45 to 59 Minutes | 0 | 0.0% |
| 60 to 89 Minutes | 0 | 0.0% |
| 90 or more Minutes | 0 | 0.0% |
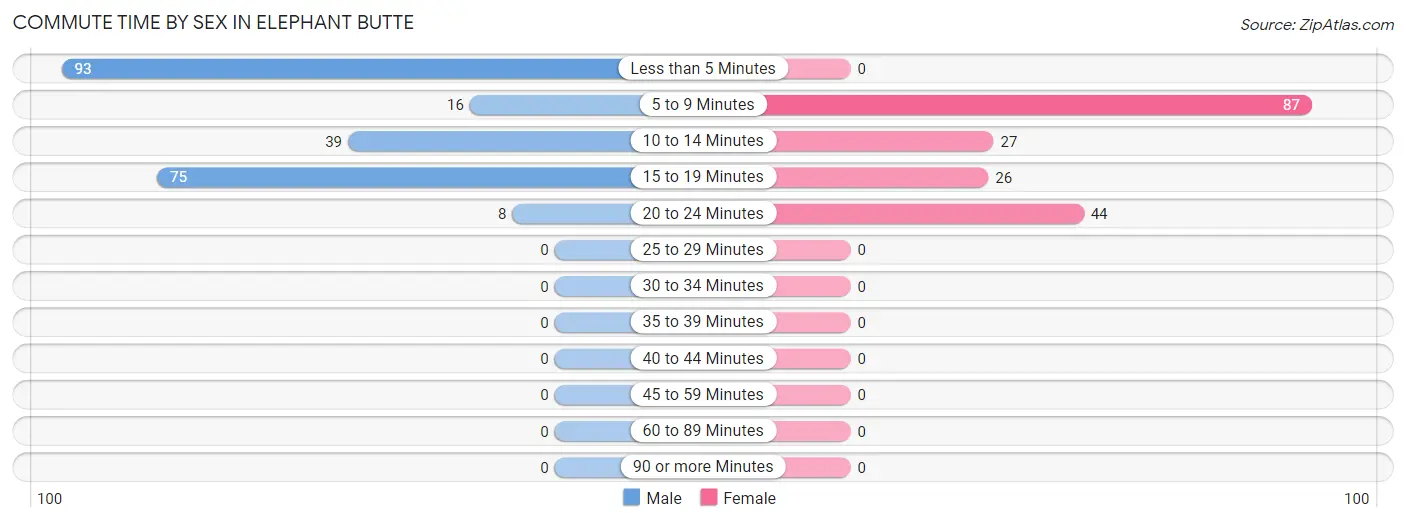
Commute Time by Sex in Elephant Butte
The most common commute times in Elephant Butte are less than 5 minutes (93 commuters, 40.3%) for males and 5 to 9 minutes (87 commuters, 47.3%) for females.
| Commute Time | Male | Female |
| Less than 5 Minutes | 93 (40.3%) | 0 (0.0%) |
| 5 to 9 Minutes | 16 (6.9%) | 87 (47.3%) |
| 10 to 14 Minutes | 39 (16.9%) | 27 (14.7%) |
| 15 to 19 Minutes | 75 (32.5%) | 26 (14.1%) |
| 20 to 24 Minutes | 8 (3.5%) | 44 (23.9%) |
| 25 to 29 Minutes | 0 (0.0%) | 0 (0.0%) |
| 30 to 34 Minutes | 0 (0.0%) | 0 (0.0%) |
| 35 to 39 Minutes | 0 (0.0%) | 0 (0.0%) |
| 40 to 44 Minutes | 0 (0.0%) | 0 (0.0%) |
| 45 to 59 Minutes | 0 (0.0%) | 0 (0.0%) |
| 60 to 89 Minutes | 0 (0.0%) | 0 (0.0%) |
| 90 or more Minutes | 0 (0.0%) | 0 (0.0%) |
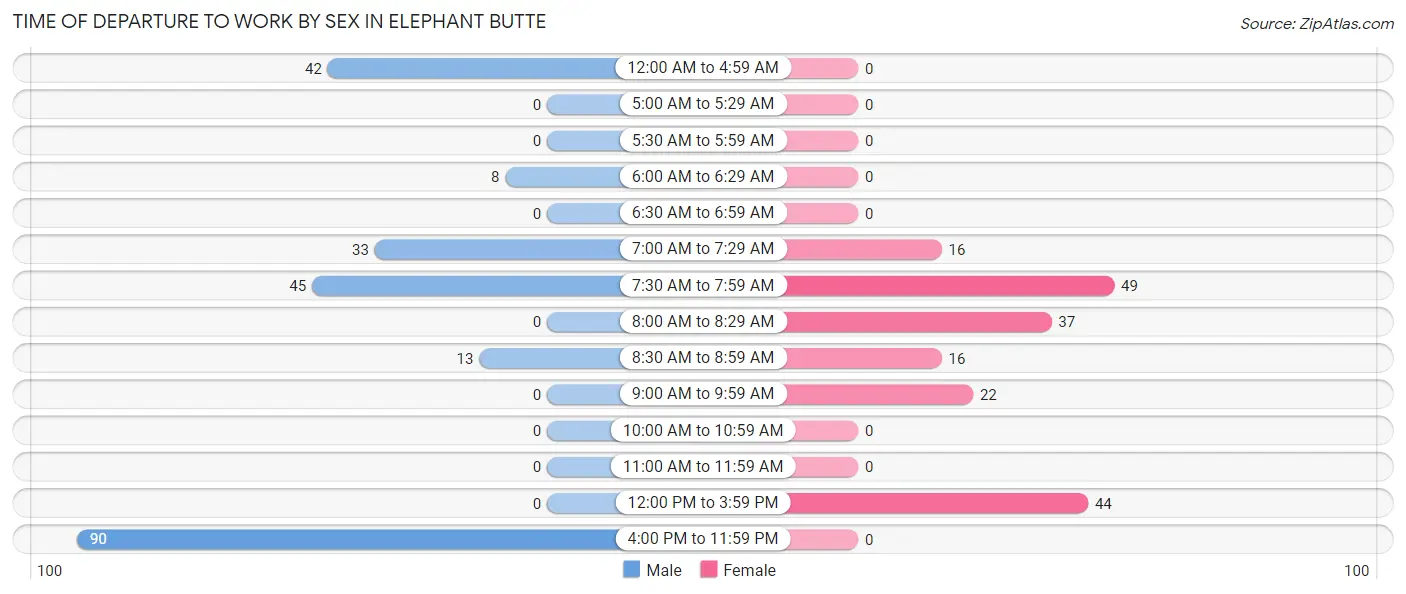
Time of Departure to Work by Sex in Elephant Butte
The most frequent times of departure to work in Elephant Butte are 4:00 PM to 11:59 PM (90, 39.0%) for males and 7:30 AM to 7:59 AM (49, 26.6%) for females.
| Time of Departure | Male | Female |
| 12:00 AM to 4:59 AM | 42 (18.2%) | 0 (0.0%) |
| 5:00 AM to 5:29 AM | 0 (0.0%) | 0 (0.0%) |
| 5:30 AM to 5:59 AM | 0 (0.0%) | 0 (0.0%) |
| 6:00 AM to 6:29 AM | 8 (3.5%) | 0 (0.0%) |
| 6:30 AM to 6:59 AM | 0 (0.0%) | 0 (0.0%) |
| 7:00 AM to 7:29 AM | 33 (14.3%) | 16 (8.7%) |
| 7:30 AM to 7:59 AM | 45 (19.5%) | 49 (26.6%) |
| 8:00 AM to 8:29 AM | 0 (0.0%) | 37 (20.1%) |
| 8:30 AM to 8:59 AM | 13 (5.6%) | 16 (8.7%) |
| 9:00 AM to 9:59 AM | 0 (0.0%) | 22 (12.0%) |
| 10:00 AM to 10:59 AM | 0 (0.0%) | 0 (0.0%) |
| 11:00 AM to 11:59 AM | 0 (0.0%) | 0 (0.0%) |
| 12:00 PM to 3:59 PM | 0 (0.0%) | 44 (23.9%) |
| 4:00 PM to 11:59 PM | 90 (39.0%) | 0 (0.0%) |
| Total | 231 (100.0%) | 184 (100.0%) |
Housing Occupancy in Elephant Butte
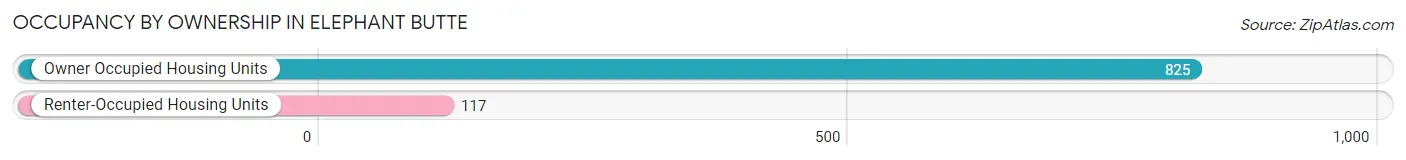
Occupancy by Ownership in Elephant Butte
Of the total 942 dwellings in Elephant Butte, owner-occupied units account for 825 (87.6%), while renter-occupied units make up 117 (12.4%).
| Occupancy | # Housing Units | % Housing Units |
| Owner Occupied Housing Units | 825 | 87.6% |
| Renter-Occupied Housing Units | 117 | 12.4% |
| Total Occupied Housing Units | 942 | 100.0% |
Occupancy by Household Size in Elephant Butte
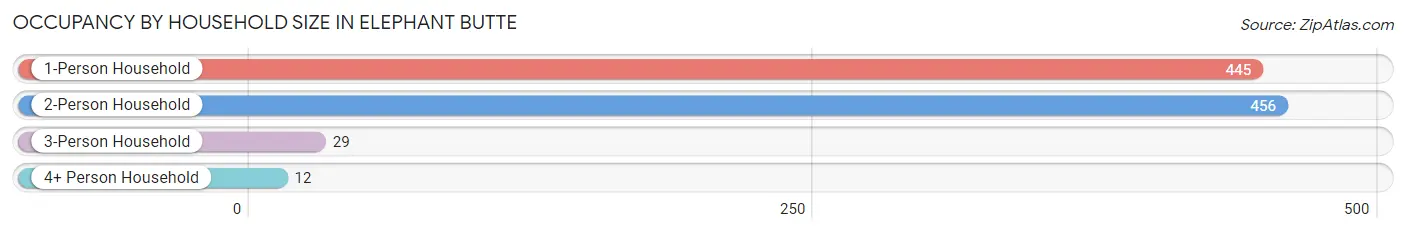
| Household Size | # Housing Units | % Housing Units |
| 1-Person Household | 445 | 47.2% |
| 2-Person Household | 456 | 48.4% |
| 3-Person Household | 29 | 3.1% |
| 4+ Person Household | 12 | 1.3% |
| Total Housing Units | 942 | 100.0% |
Occupancy by Ownership by Household Size in Elephant Butte
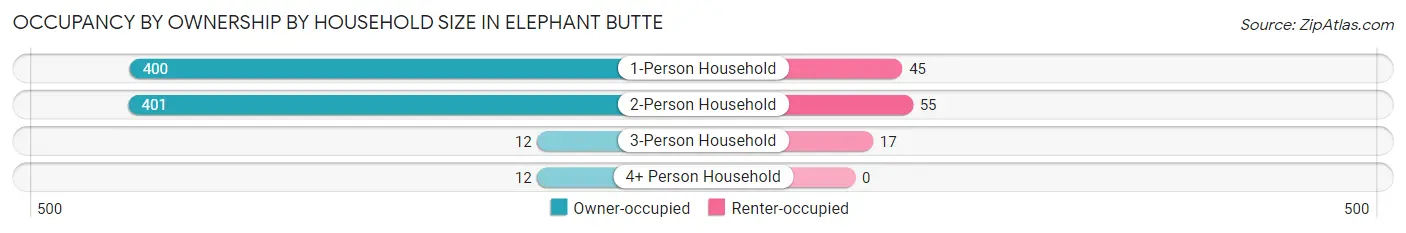
| Household Size | Owner-occupied | Renter-occupied |
| 1-Person Household | 400 (89.9%) | 45 (10.1%) |
| 2-Person Household | 401 (87.9%) | 55 (12.1%) |
| 3-Person Household | 12 (41.4%) | 17 (58.6%) |
| 4+ Person Household | 12 (100.0%) | 0 (0.0%) |
| Total Housing Units | 825 (87.6%) | 117 (12.4%) |
Occupancy by Educational Attainment in Elephant Butte
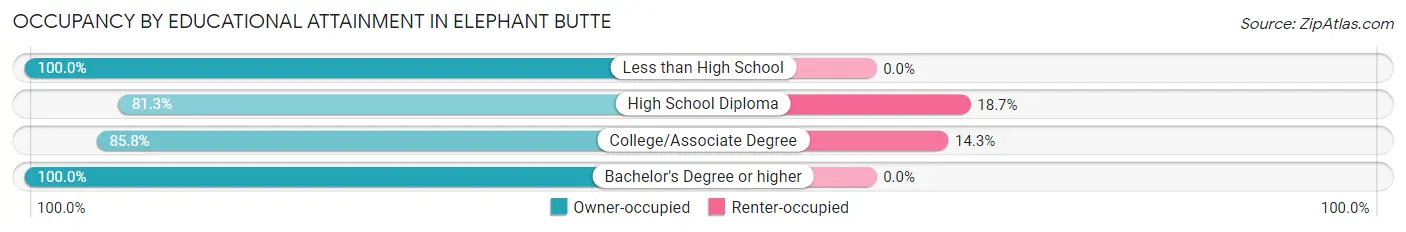
| Household Size | Owner-occupied | Renter-occupied |
| Less than High School | 47 (100.0%) | 0 (0.0%) |
| High School Diploma | 244 (81.3%) | 56 (18.7%) |
| College/Associate Degree | 367 (85.8%) | 61 (14.2%) |
| Bachelor's Degree or higher | 167 (100.0%) | 0 (0.0%) |
Occupancy by Age of Householder in Elephant Butte
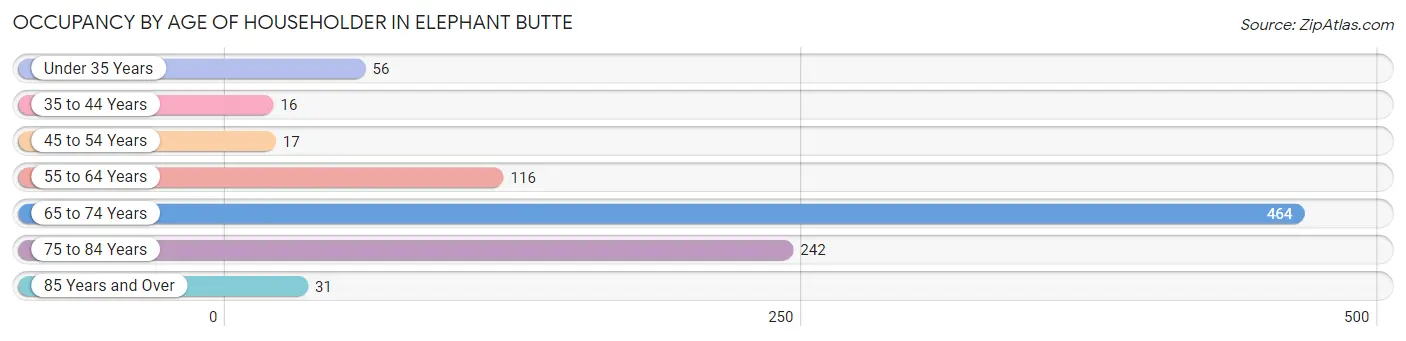
| Age Bracket | # Households | % Households |
| Under 35 Years | 56 | 5.9% |
| 35 to 44 Years | 16 | 1.7% |
| 45 to 54 Years | 17 | 1.8% |
| 55 to 64 Years | 116 | 12.3% |
| 65 to 74 Years | 464 | 49.3% |
| 75 to 84 Years | 242 | 25.7% |
| 85 Years and Over | 31 | 3.3% |
| Total | 942 | 100.0% |
Housing Finances in Elephant Butte
Median Income by Occupancy in Elephant Butte
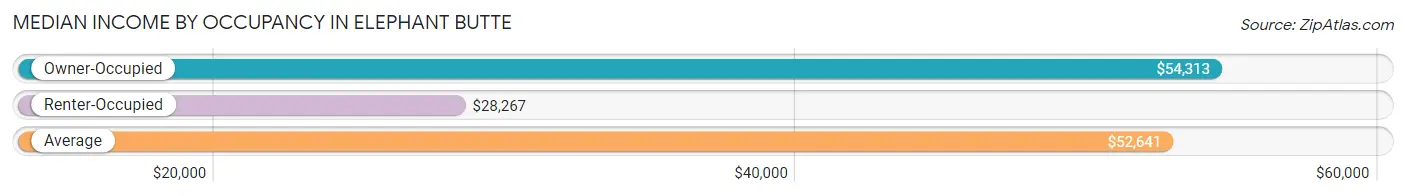
| Occupancy Type | # Households | Median Income |
| Owner-Occupied | 825 (87.6%) | $54,313 |
| Renter-Occupied | 117 (12.4%) | $28,267 |
| Average | 942 (100.0%) | $52,641 |
Occupancy by Householder Income Bracket in Elephant Butte
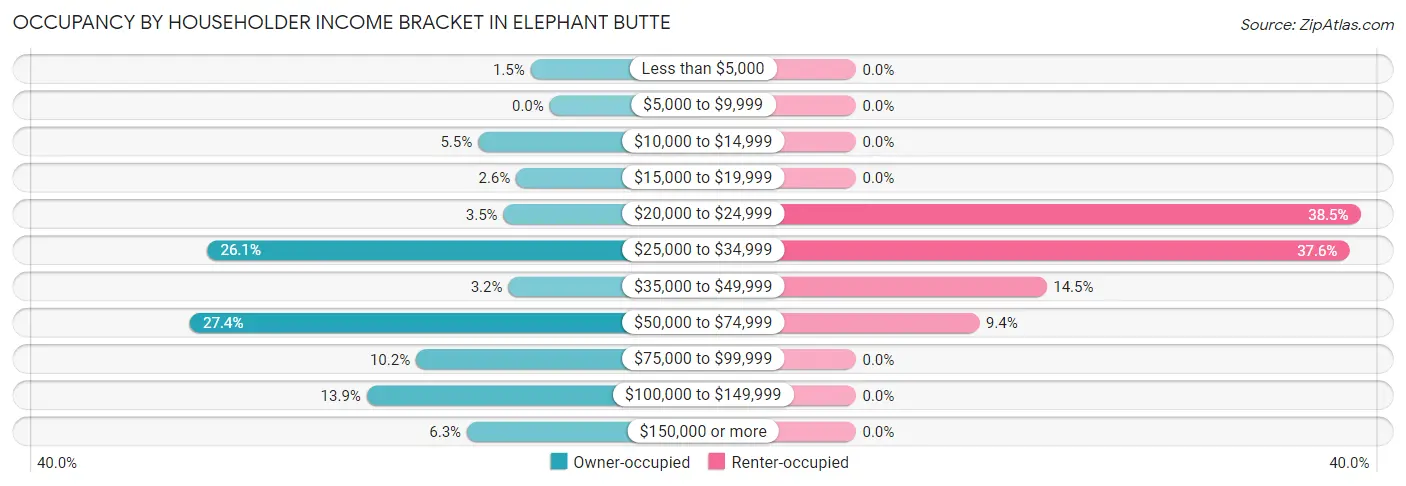
| Income Bracket | Owner-occupied | Renter-occupied |
| Less than $5,000 | 12 (1.5%) | 0 (0.0%) |
| $5,000 to $9,999 | 0 (0.0%) | 0 (0.0%) |
| $10,000 to $14,999 | 45 (5.4%) | 0 (0.0%) |
| $15,000 to $19,999 | 21 (2.5%) | 0 (0.0%) |
| $20,000 to $24,999 | 29 (3.5%) | 45 (38.5%) |
| $25,000 to $34,999 | 215 (26.1%) | 44 (37.6%) |
| $35,000 to $49,999 | 26 (3.2%) | 17 (14.5%) |
| $50,000 to $74,999 | 226 (27.4%) | 11 (9.4%) |
| $75,000 to $99,999 | 84 (10.2%) | 0 (0.0%) |
| $100,000 to $149,999 | 115 (13.9%) | 0 (0.0%) |
| $150,000 or more | 52 (6.3%) | 0 (0.0%) |
| Total | 825 (100.0%) | 117 (100.0%) |
Monthly Housing Cost Tiers in Elephant Butte
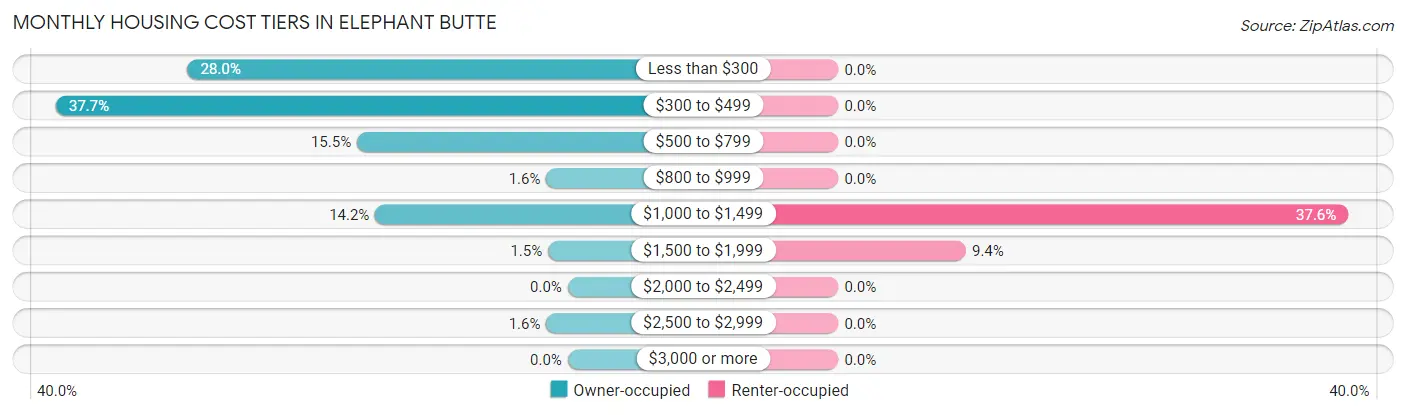
| Monthly Cost | Owner-occupied | Renter-occupied |
| Less than $300 | 231 (28.0%) | 0 (0.0%) |
| $300 to $499 | 311 (37.7%) | 0 (0.0%) |
| $500 to $799 | 128 (15.5%) | 0 (0.0%) |
| $800 to $999 | 13 (1.6%) | 0 (0.0%) |
| $1,000 to $1,499 | 117 (14.2%) | 44 (37.6%) |
| $1,500 to $1,999 | 12 (1.5%) | 11 (9.4%) |
| $2,000 to $2,499 | 0 (0.0%) | 0 (0.0%) |
| $2,500 to $2,999 | 13 (1.6%) | 0 (0.0%) |
| $3,000 or more | 0 (0.0%) | 0 (0.0%) |
| Total | 825 (100.0%) | 117 (100.0%) |
Physical Housing Characteristics in Elephant Butte
Housing Structures in Elephant Butte
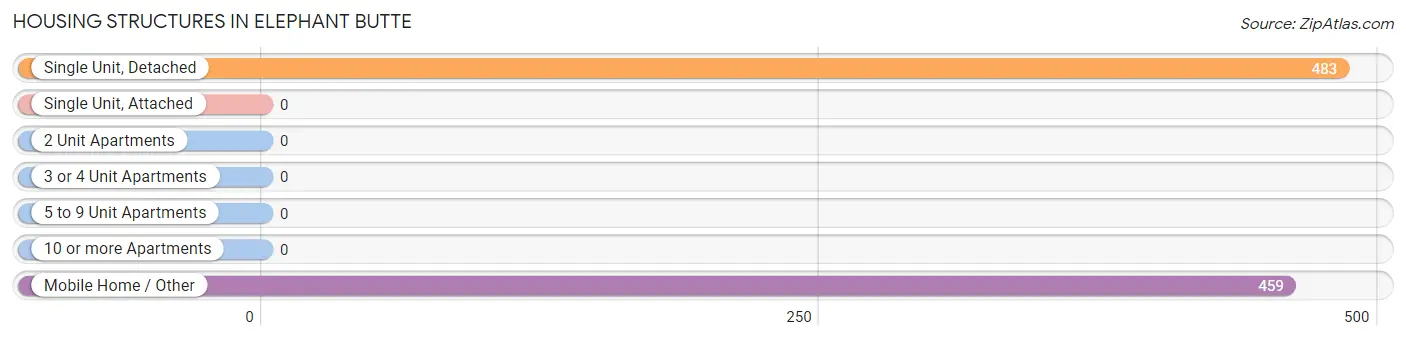
| Structure Type | # Housing Units | % Housing Units |
| Single Unit, Detached | 483 | 51.3% |
| Single Unit, Attached | 0 | 0.0% |
| 2 Unit Apartments | 0 | 0.0% |
| 3 or 4 Unit Apartments | 0 | 0.0% |
| 5 to 9 Unit Apartments | 0 | 0.0% |
| 10 or more Apartments | 0 | 0.0% |
| Mobile Home / Other | 459 | 48.7% |
| Total | 942 | 100.0% |
Housing Structures by Occupancy in Elephant Butte
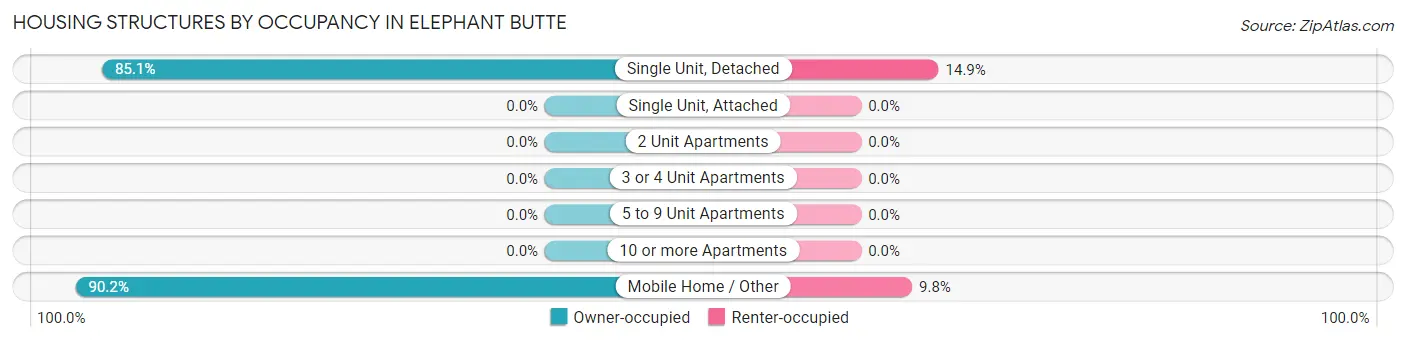
| Structure Type | Owner-occupied | Renter-occupied |
| Single Unit, Detached | 411 (85.1%) | 72 (14.9%) |
| Single Unit, Attached | 0 (0.0%) | 0 (0.0%) |
| 2 Unit Apartments | 0 (0.0%) | 0 (0.0%) |
| 3 or 4 Unit Apartments | 0 (0.0%) | 0 (0.0%) |
| 5 to 9 Unit Apartments | 0 (0.0%) | 0 (0.0%) |
| 10 or more Apartments | 0 (0.0%) | 0 (0.0%) |
| Mobile Home / Other | 414 (90.2%) | 45 (9.8%) |
| Total | 825 (87.6%) | 117 (12.4%) |
Housing Structures by Number of Rooms in Elephant Butte
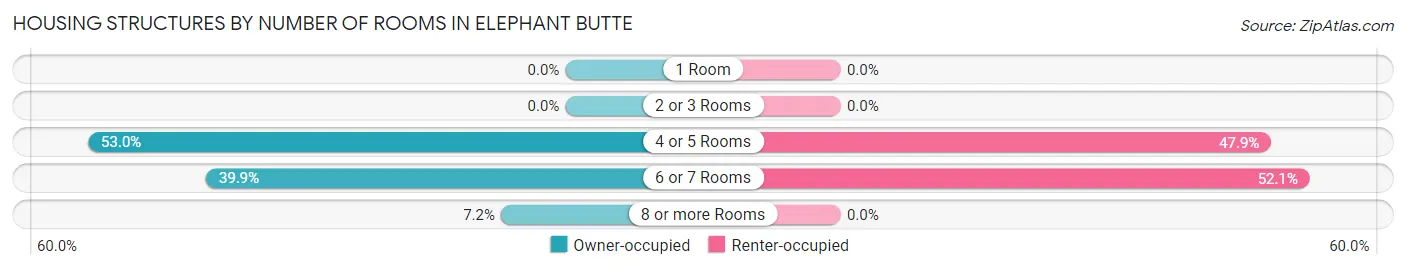
| Number of Rooms | Owner-occupied | Renter-occupied |
| 1 Room | 0 (0.0%) | 0 (0.0%) |
| 2 or 3 Rooms | 0 (0.0%) | 0 (0.0%) |
| 4 or 5 Rooms | 437 (53.0%) | 56 (47.9%) |
| 6 or 7 Rooms | 329 (39.9%) | 61 (52.1%) |
| 8 or more Rooms | 59 (7.1%) | 0 (0.0%) |
| Total | 825 (100.0%) | 117 (100.0%) |
Housing Structure by Heating Type in Elephant Butte
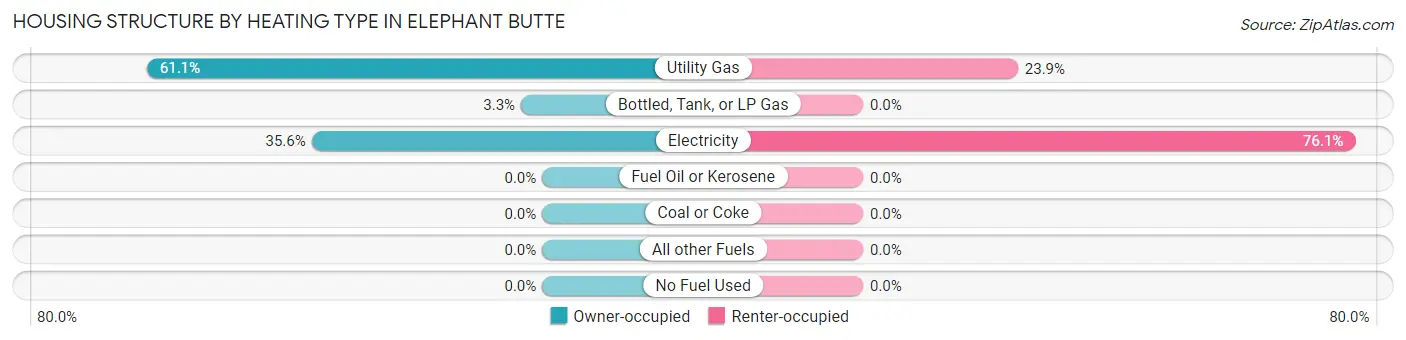
| Heating Type | Owner-occupied | Renter-occupied |
| Utility Gas | 504 (61.1%) | 28 (23.9%) |
| Bottled, Tank, or LP Gas | 27 (3.3%) | 0 (0.0%) |
| Electricity | 294 (35.6%) | 89 (76.1%) |
| Fuel Oil or Kerosene | 0 (0.0%) | 0 (0.0%) |
| Coal or Coke | 0 (0.0%) | 0 (0.0%) |
| All other Fuels | 0 (0.0%) | 0 (0.0%) |
| No Fuel Used | 0 (0.0%) | 0 (0.0%) |
| Total | 825 (100.0%) | 117 (100.0%) |
Household Vehicle Usage in Elephant Butte
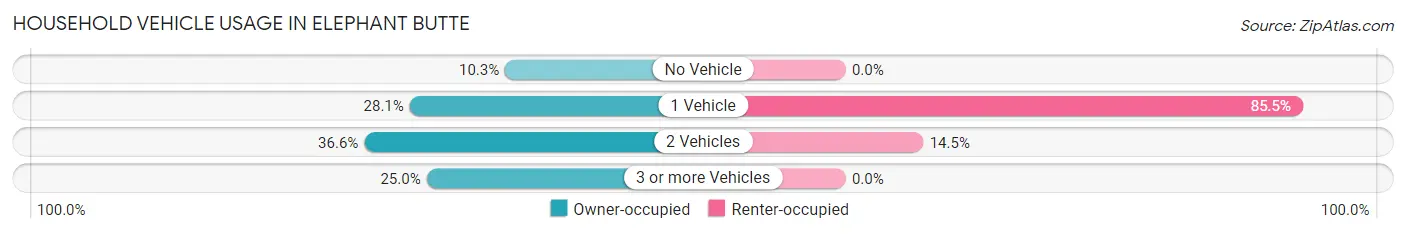
| Vehicles per Household | Owner-occupied | Renter-occupied |
| No Vehicle | 85 (10.3%) | 0 (0.0%) |
| 1 Vehicle | 232 (28.1%) | 100 (85.5%) |
| 2 Vehicles | 302 (36.6%) | 17 (14.5%) |
| 3 or more Vehicles | 206 (25.0%) | 0 (0.0%) |
| Total | 825 (100.0%) | 117 (100.0%) |
Real Estate & Mortgages in Elephant Butte
Real Estate and Mortgage Overview in Elephant Butte
| Characteristic | Without Mortgage | With Mortgage |
| Housing Units | 637 | 188 |
| Median Property Value | $149,200 | $330,800 |
| Median Household Income | $52,799 | $12 |
| Monthly Housing Costs | $369 | $0 |
| Real Estate Taxes | $859 | $0 |
Property Value by Mortgage Status in Elephant Butte
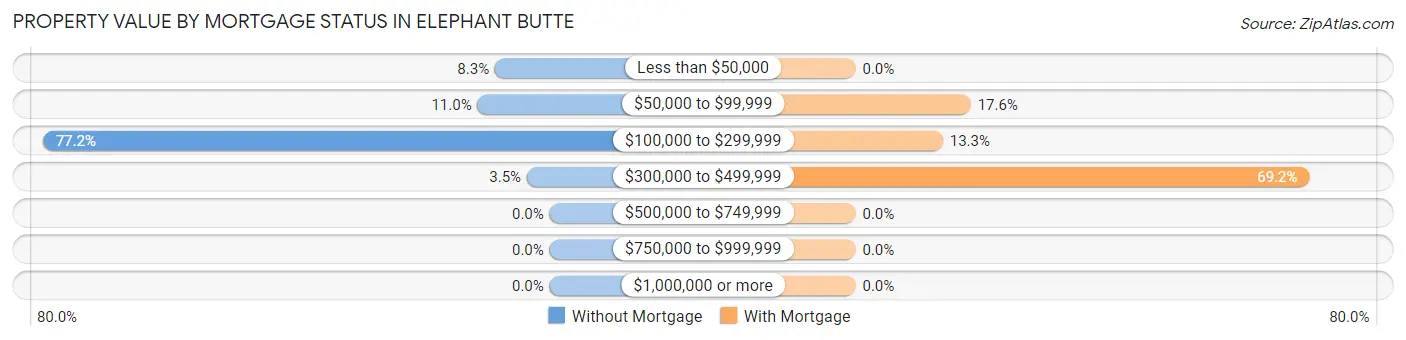
| Property Value | Without Mortgage | With Mortgage |
| Less than $50,000 | 53 (8.3%) | 0 (0.0%) |
| $50,000 to $99,999 | 70 (11.0%) | 33 (17.5%) |
| $100,000 to $299,999 | 492 (77.2%) | 25 (13.3%) |
| $300,000 to $499,999 | 22 (3.5%) | 130 (69.2%) |
| $500,000 to $749,999 | 0 (0.0%) | 0 (0.0%) |
| $750,000 to $999,999 | 0 (0.0%) | 0 (0.0%) |
| $1,000,000 or more | 0 (0.0%) | 0 (0.0%) |
| Total | 637 (100.0%) | 188 (100.0%) |
Household Income by Mortgage Status in Elephant Butte
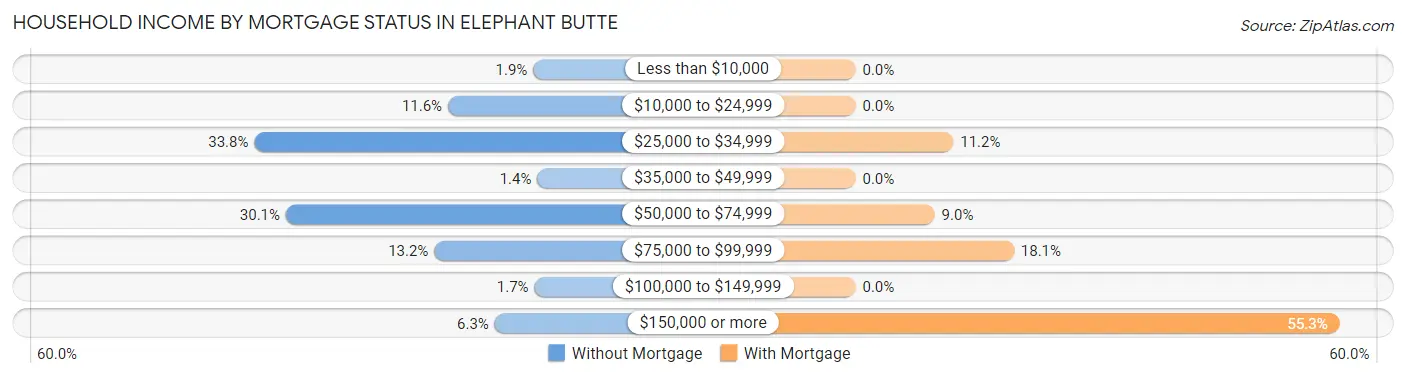
| Household Income | Without Mortgage | With Mortgage |
| Less than $10,000 | 12 (1.9%) | 0 (0.0%) |
| $10,000 to $24,999 | 74 (11.6%) | 0 (0.0%) |
| $25,000 to $34,999 | 215 (33.8%) | 21 (11.2%) |
| $35,000 to $49,999 | 9 (1.4%) | 0 (0.0%) |
| $50,000 to $74,999 | 192 (30.1%) | 17 (9.0%) |
| $75,000 to $99,999 | 84 (13.2%) | 34 (18.1%) |
| $100,000 to $149,999 | 11 (1.7%) | 0 (0.0%) |
| $150,000 or more | 40 (6.3%) | 104 (55.3%) |
| Total | 637 (100.0%) | 188 (100.0%) |
Property Value to Household Income Ratio in Elephant Butte
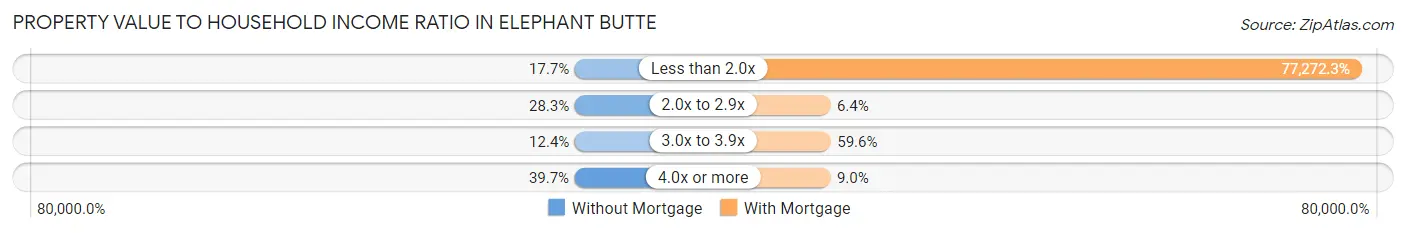
| Value-to-Income Ratio | Without Mortgage | With Mortgage |
| Less than 2.0x | 113 (17.7%) | 145,272 (77,272.3%) |
| 2.0x to 2.9x | 180 (28.3%) | 12 (6.4%) |
| 3.0x to 3.9x | 79 (12.4%) | 112 (59.6%) |
| 4.0x or more | 253 (39.7%) | 17 (9.0%) |
| Total | 637 (100.0%) | 188 (100.0%) |
Real Estate Taxes by Mortgage Status in Elephant Butte
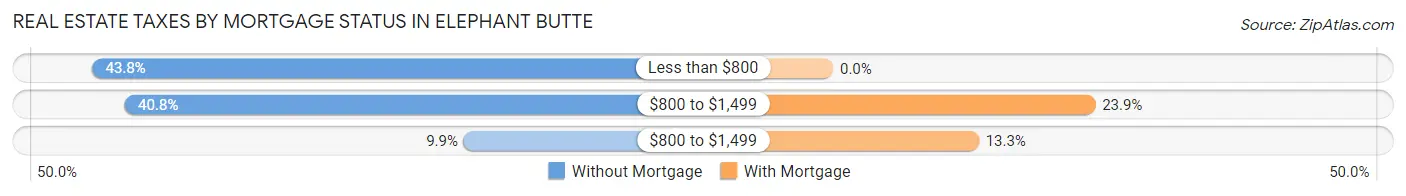
| Property Taxes | Without Mortgage | With Mortgage |
| Less than $800 | 279 (43.8%) | 0 (0.0%) |
| $800 to $1,499 | 260 (40.8%) | 45 (23.9%) |
| $800 to $1,499 | 63 (9.9%) | 25 (13.3%) |
| Total | 637 (100.0%) | 188 (100.0%) |
Health & Disability in Elephant Butte
Health Insurance Coverage by Age in Elephant Butte
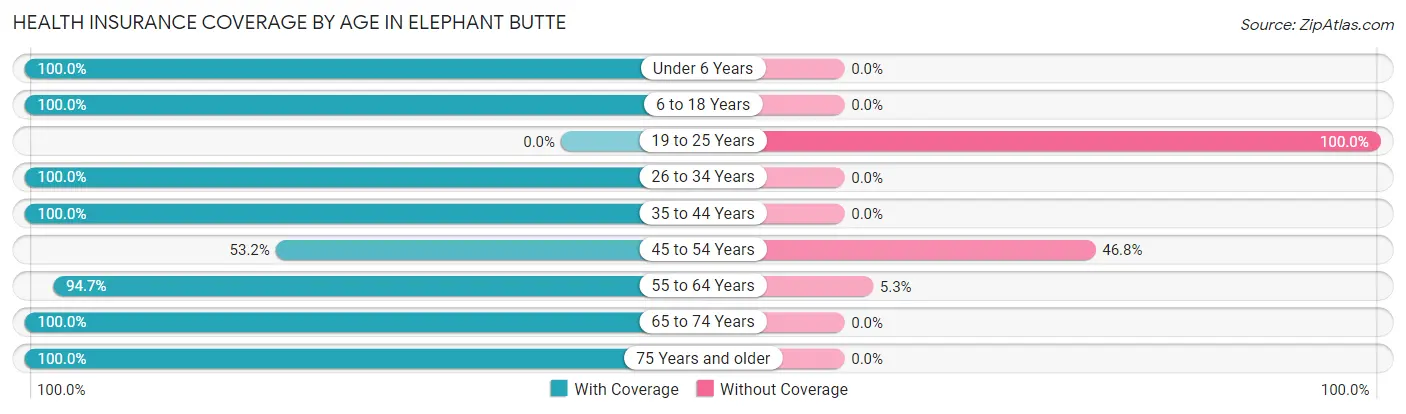
| Age Bracket | With Coverage | Without Coverage |
| Under 6 Years | 41 (100.0%) | 0 (0.0%) |
| 6 to 18 Years | 18 (100.0%) | 0 (0.0%) |
| 19 to 25 Years | 0 (0.0%) | 45 (100.0%) |
| 26 to 34 Years | 219 (100.0%) | 0 (0.0%) |
| 35 to 44 Years | 16 (100.0%) | 0 (0.0%) |
| 45 to 54 Years | 25 (53.2%) | 22 (46.8%) |
| 55 to 64 Years | 213 (94.7%) | 12 (5.3%) |
| 65 to 74 Years | 618 (100.0%) | 0 (0.0%) |
| 75 Years and older | 344 (100.0%) | 0 (0.0%) |
| Total | 1,494 (95.0%) | 79 (5.0%) |
Health Insurance Coverage by Citizenship Status in Elephant Butte
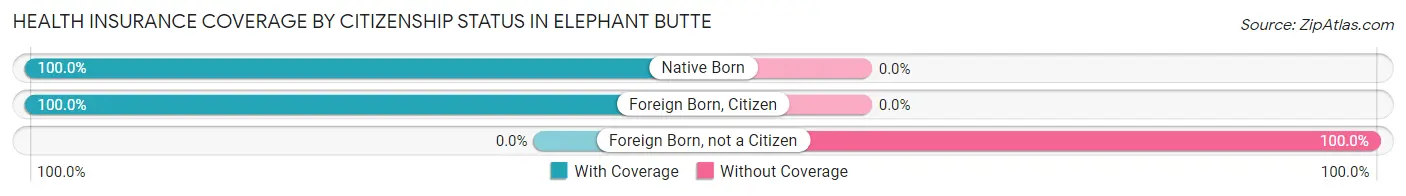
| Citizenship Status | With Coverage | Without Coverage |
| Native Born | 41 (100.0%) | 0 (0.0%) |
| Foreign Born, Citizen | 18 (100.0%) | 0 (0.0%) |
| Foreign Born, not a Citizen | 0 (0.0%) | 45 (100.0%) |
Health Insurance Coverage by Household Income in Elephant Butte
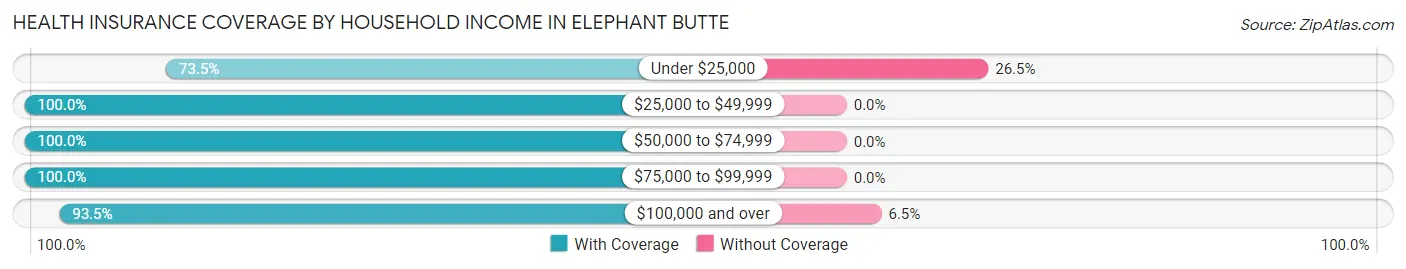
| Household Income | With Coverage | Without Coverage |
| Under $25,000 | 158 (73.5%) | 57 (26.5%) |
| $25,000 to $49,999 | 438 (100.0%) | 0 (0.0%) |
| $50,000 to $74,999 | 436 (100.0%) | 0 (0.0%) |
| $75,000 to $99,999 | 146 (100.0%) | 0 (0.0%) |
| $100,000 and over | 316 (93.5%) | 22 (6.5%) |
Public vs Private Health Insurance Coverage by Age in Elephant Butte
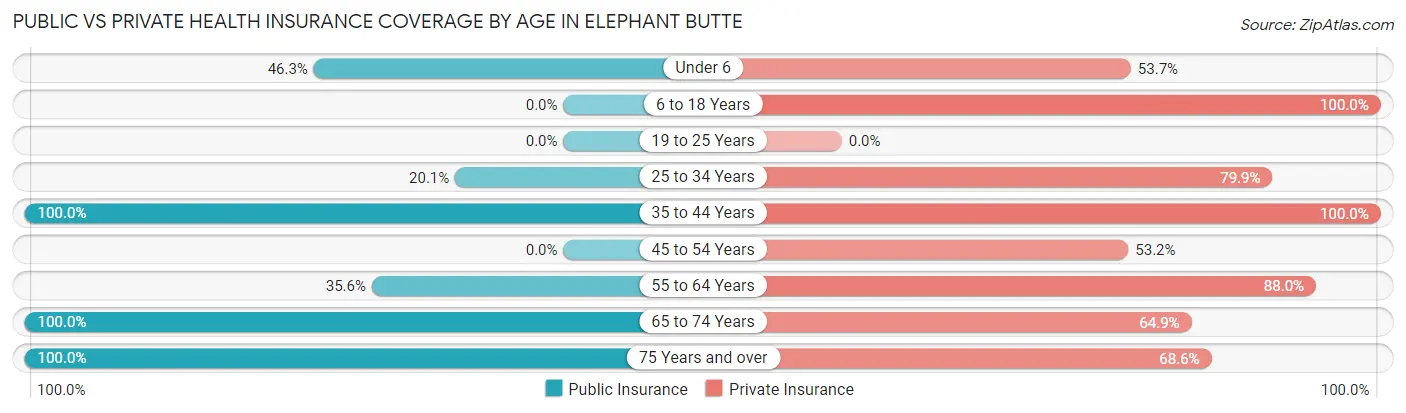
| Age Bracket | Public Insurance | Private Insurance |
| Under 6 | 19 (46.3%) | 22 (53.7%) |
| 6 to 18 Years | 0 (0.0%) | 18 (100.0%) |
| 19 to 25 Years | 0 (0.0%) | 0 (0.0%) |
| 25 to 34 Years | 44 (20.1%) | 175 (79.9%) |
| 35 to 44 Years | 16 (100.0%) | 16 (100.0%) |
| 45 to 54 Years | 0 (0.0%) | 25 (53.2%) |
| 55 to 64 Years | 80 (35.6%) | 198 (88.0%) |
| 65 to 74 Years | 618 (100.0%) | 401 (64.9%) |
| 75 Years and over | 344 (100.0%) | 236 (68.6%) |
| Total | 1,121 (71.3%) | 1,091 (69.4%) |
Disability Status by Sex by Age in Elephant Butte
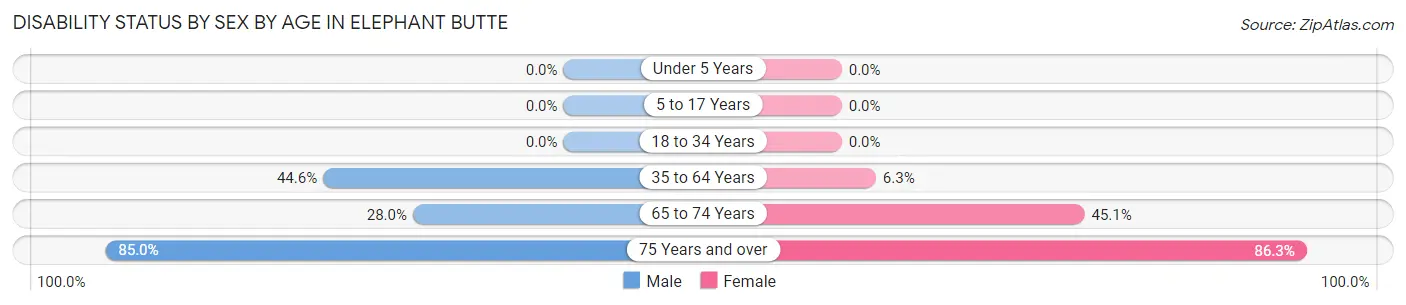
| Age Bracket | Male | Female |
| Under 5 Years | 0 (0.0%) | 0 (0.0%) |
| 5 to 17 Years | 0 (0.0%) | 0 (0.0%) |
| 18 to 34 Years | 0 (0.0%) | 0 (0.0%) |
| 35 to 64 Years | 58 (44.6%) | 10 (6.3%) |
| 65 to 74 Years | 102 (28.0%) | 114 (45.1%) |
| 75 Years and over | 119 (85.0%) | 176 (86.3%) |
Disability Class by Sex by Age in Elephant Butte
Disability Class: Hearing Difficulty
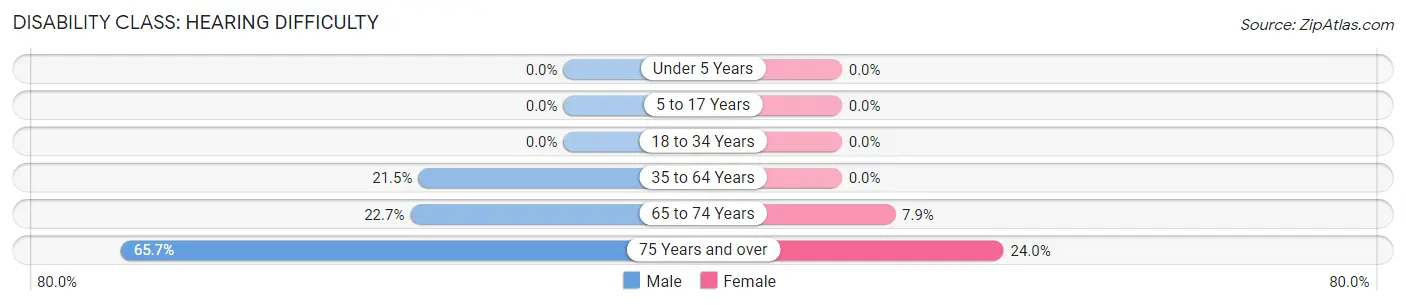
| Age Bracket | Male | Female |
| Under 5 Years | 0 (0.0%) | 0 (0.0%) |
| 5 to 17 Years | 0 (0.0%) | 0 (0.0%) |
| 18 to 34 Years | 0 (0.0%) | 0 (0.0%) |
| 35 to 64 Years | 28 (21.5%) | 0 (0.0%) |
| 65 to 74 Years | 83 (22.7%) | 20 (7.9%) |
| 75 Years and over | 92 (65.7%) | 49 (24.0%) |
Disability Class: Vision Difficulty
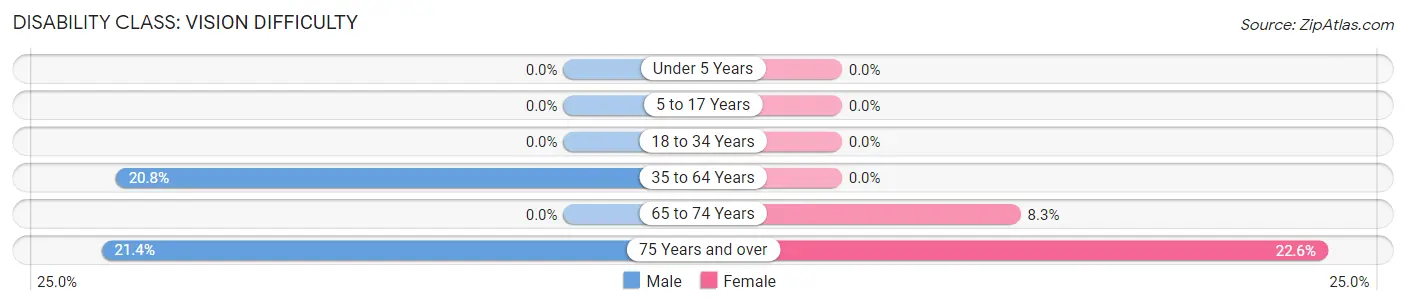
| Age Bracket | Male | Female |
| Under 5 Years | 0 (0.0%) | 0 (0.0%) |
| 5 to 17 Years | 0 (0.0%) | 0 (0.0%) |
| 18 to 34 Years | 0 (0.0%) | 0 (0.0%) |
| 35 to 64 Years | 27 (20.8%) | 0 (0.0%) |
| 65 to 74 Years | 0 (0.0%) | 21 (8.3%) |
| 75 Years and over | 30 (21.4%) | 46 (22.6%) |
Disability Class: Cognitive Difficulty
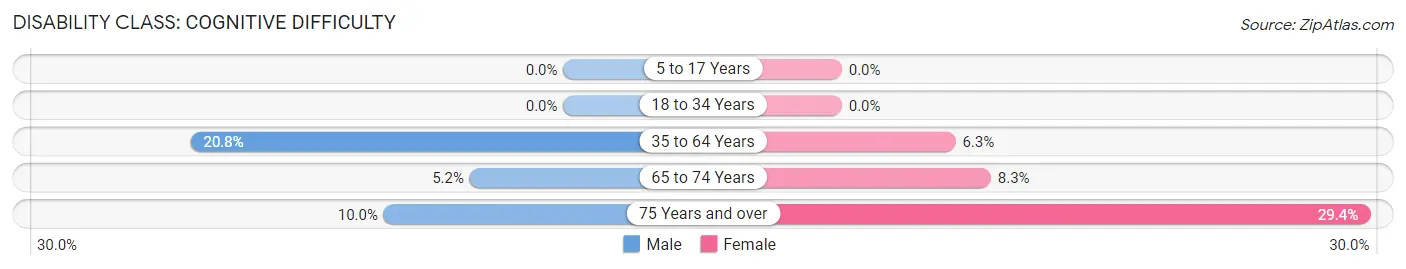
| Age Bracket | Male | Female |
| 5 to 17 Years | 0 (0.0%) | 0 (0.0%) |
| 18 to 34 Years | 0 (0.0%) | 0 (0.0%) |
| 35 to 64 Years | 27 (20.8%) | 10 (6.3%) |
| 65 to 74 Years | 19 (5.2%) | 21 (8.3%) |
| 75 Years and over | 14 (10.0%) | 60 (29.4%) |
Disability Class: Ambulatory Difficulty
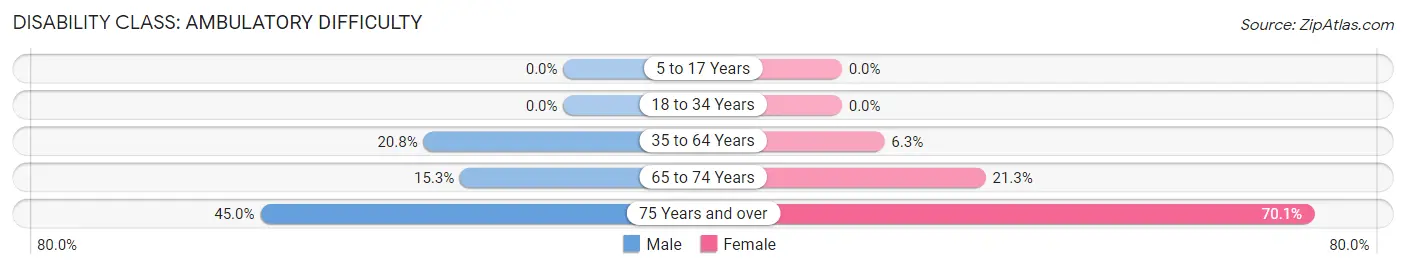
| Age Bracket | Male | Female |
| 5 to 17 Years | 0 (0.0%) | 0 (0.0%) |
| 18 to 34 Years | 0 (0.0%) | 0 (0.0%) |
| 35 to 64 Years | 27 (20.8%) | 10 (6.3%) |
| 65 to 74 Years | 56 (15.3%) | 54 (21.3%) |
| 75 Years and over | 63 (45.0%) | 143 (70.1%) |
Disability Class: Self-Care Difficulty
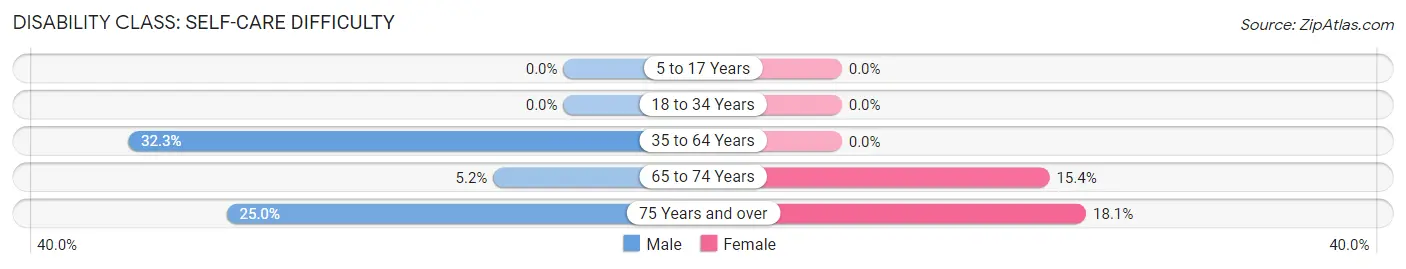
| Age Bracket | Male | Female |
| 5 to 17 Years | 0 (0.0%) | 0 (0.0%) |
| 18 to 34 Years | 0 (0.0%) | 0 (0.0%) |
| 35 to 64 Years | 42 (32.3%) | 0 (0.0%) |
| 65 to 74 Years | 19 (5.2%) | 39 (15.4%) |
| 75 Years and over | 35 (25.0%) | 37 (18.1%) |
Technology Access in Elephant Butte
Computing Device Access in Elephant Butte
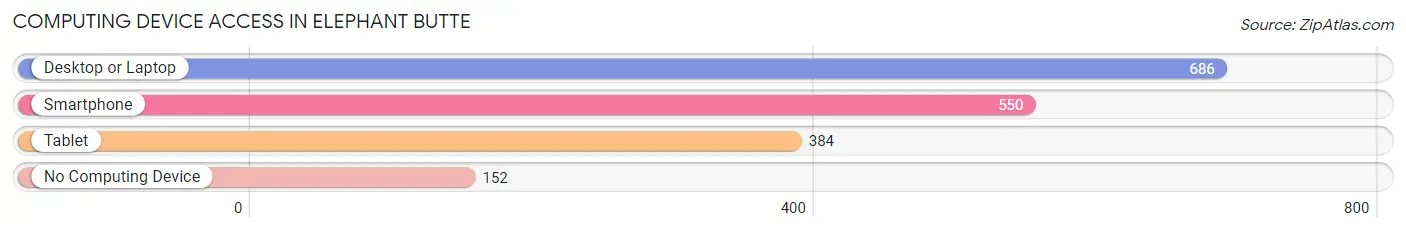
| Device Type | # Households | % Households |
| Desktop or Laptop | 686 | 72.8% |
| Smartphone | 550 | 58.4% |
| Tablet | 384 | 40.8% |
| No Computing Device | 152 | 16.1% |
| Total | 942 | 100.0% |
Internet Access in Elephant Butte
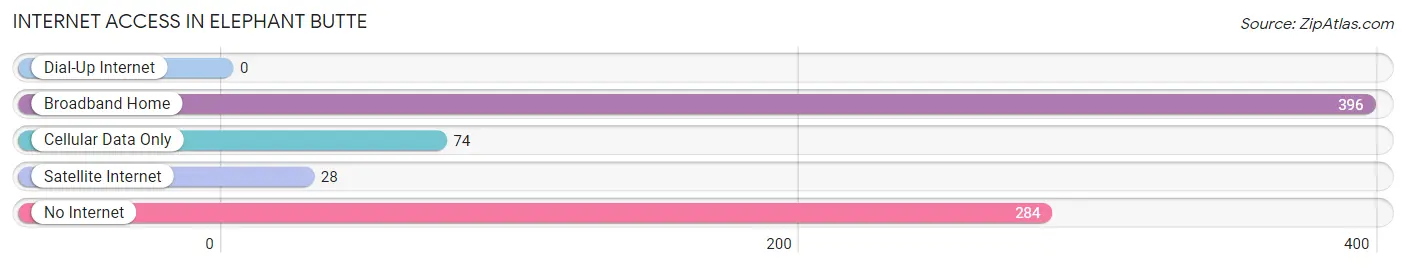
| Internet Type | # Households | % Households |
| Dial-Up Internet | 0 | 0.0% |
| Broadband Home | 396 | 42.0% |
| Cellular Data Only | 74 | 7.9% |
| Satellite Internet | 28 | 3.0% |
| No Internet | 284 | 30.1% |
| Total | 942 | 100.0% |
Elephant Butte Summary
Elephant Butte is a small town located in Sierra County, New Mexico. It is situated on the banks of Elephant Butte Lake, the largest reservoir in the state. The town was founded in 1916 and has a population of approximately 1,500 people.
Geography
Elephant Butte is located in the Chihuahuan Desert, at an elevation of 4,000 feet. The town is situated on the banks of Elephant Butte Lake, which is the largest reservoir in the state. The lake was created in 1916 when the Elephant Butte Dam was built on the Rio Grande River. The lake is a popular destination for fishing, boating, and other recreational activities. The town is surrounded by the Sierra de las Uvas Mountains, which provide a stunning backdrop.
History
Elephant Butte was founded in 1916 when the Elephant Butte Dam was built on the Rio Grande River. The dam was built to provide irrigation water for the surrounding area. The town was named after the nearby Elephant Butte Lake, which was created by the dam. The town quickly grew and became a popular destination for tourists and outdoor enthusiasts.
In the 1950s, the town began to decline as the population moved away to larger cities. However, in the late 1970s, the town began to experience a resurgence as people began to move back to the area. The town has since become a popular destination for tourists and outdoor enthusiasts.
Economy
The economy of Elephant Butte is largely based on tourism. The town is a popular destination for fishing, boating, and other recreational activities. The town also has a number of restaurants, bars, and shops that cater to tourists. The town is also home to a number of small businesses, including a grocery store, a hardware store, and a gas station.
Demographics
As of the 2010 census, the population of Elephant Butte was 1,521. The racial makeup of the town was 94.3% White, 0.7% African American, 0.3% Native American, 0.2% Asian, 0.1% Pacific Islander, 2.3% from other races, and 2.3% from two or more races. Hispanic or Latino of any race were 8.3% of the population.
The median income for a household in Elephant Butte was $30,938, and the median income for a family was $35,625. The per capita income for the town was $17,845. About 16.2% of families and 19.2% of the population were below the poverty line, including 25.2% of those under age 18 and 10.2% of those age 65 or over.
Conclusion
Elephant Butte is a small town located in Sierra County, New Mexico. It is situated on the banks of Elephant Butte Lake, the largest reservoir in the state. The town was founded in 1916 and has a population of approximately 1,500 people. The economy of Elephant Butte is largely based on tourism, with a number of restaurants, bars, and shops catering to tourists. The town also has a number of small businesses, including a grocery store, a hardware store, and a gas station. The racial makeup of the town is 94.3% White, 0.7% African American, 0.3% Native American, 0.2% Asian, 0.1% Pacific Islander, 2.3% from other races, and 2.3% from two or more races. The median income for a household in Elephant Butte was $30,938, and the median income for a family was $35,625. The per capita income for the town was $17,845.
Common Questions
What is Per Capita Income in Elephant Butte?
Per Capita income in Elephant Butte is $38,085.
What is the Median Family Income in Elephant Butte?
Median Family Income in Elephant Butte is $74,450.
What is the Median Household income in Elephant Butte?
Median Household Income in Elephant Butte is $52,641.
What is Income or Wage Gap in Elephant Butte?
Income or Wage Gap in Elephant Butte is 22.3%.
Women in Elephant Butte earn 77.7 cents for every dollar earned by a man.
What is Inequality or Gini Index in Elephant Butte?
Inequality or Gini Index in Elephant Butte is 0.41.
What is the Total Population of Elephant Butte?
Total Population of Elephant Butte is 1,573.
What is the Total Male Population of Elephant Butte?
Total Male Population of Elephant Butte is 810.
What is the Total Female Population of Elephant Butte?
Total Female Population of Elephant Butte is 763.
What is the Ratio of Males per 100 Females in Elephant Butte?
There are 106.16 Males per 100 Females in Elephant Butte.
What is the Ratio of Females per 100 Males in Elephant Butte?
There are 94.20 Females per 100 Males in Elephant Butte.
What is the Median Population Age in Elephant Butte?
Median Population Age in Elephant Butte is 67.2 Years.
What is the Average Family Size in Elephant Butte
Average Family Size in Elephant Butte is 2.2 People.
What is the Average Household Size in Elephant Butte
Average Household Size in Elephant Butte is 1.7 People.
How Large is the Labor Force in Elephant Butte?
There are 445 People in the Labor Forcein in Elephant Butte.
What is the Percentage of People in the Labor Force in Elephant Butte?
29.4% of People are in the Labor Force in Elephant Butte.
What is the Unemployment Rate in Elephant Butte?
Unemployment Rate in Elephant Butte is 2.7%.