Santa Barbara, PR Map & Demographics
Santa Barbara Overview
$10,792
PER CAPITA INCOME
$16,768
AVG FAMILY INCOME
$15,109
AVG HOUSEHOLD INCOME
17.7%
WAGE / INCOME GAP [ % ]
82.3¢/ $1
WAGE / INCOME GAP [ $ ]
0.52
INEQUALITY / GINI INDEX
4,368
TOTAL POPULATION
1,851
MALE POPULATION
2,517
FEMALE POPULATION
73.54
MALES / 100 FEMALES
135.98
FEMALES / 100 MALES
34.3
MEDIAN AGE
3.9
AVG FAMILY SIZE
3.2
AVG HOUSEHOLD SIZE
1,978
LABOR FORCE [ PEOPLE ]
56.0%
PERCENT IN LABOR FORCE
19.3%
UNEMPLOYMENT RATE
Income in Santa Barbara
Income Overview in Santa Barbara
Per Capita Income in Santa Barbara is $10,792, while median incomes of families and households are $16,768 and $15,109 respectively.
| Characteristic | Number | Measure |
| Per Capita Income | 4,368 | $10,792 |
| Median Family Income | 896 | $16,768 |
| Mean Family Income | 896 | $30,276 |
| Median Household Income | 1,353 | $15,109 |
| Mean Household Income | 1,353 | $27,444 |
| Income Deficit | 896 | $0 |
| Wage / Income Gap (%) | 4,368 | 17.71% |
| Wage / Income Gap ($) | 4,368 | 82.29¢ per $1 |
| Gini / Inequality Index | 4,368 | 0.52 |
Earnings by Sex in Santa Barbara
Average Earnings in Santa Barbara are $21,759, $24,048 for men and $19,790 for women, a difference of 17.7%.
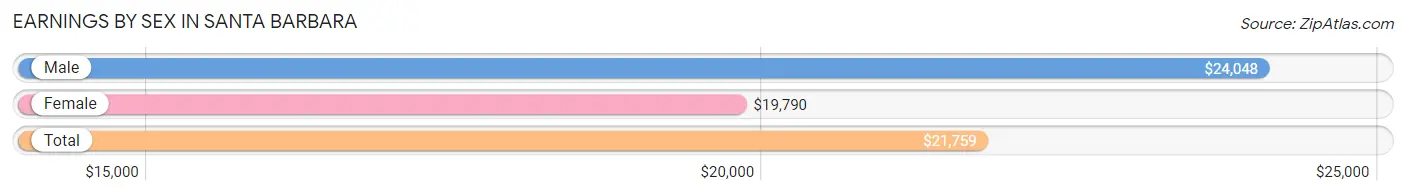
| Sex | Number | Average Earnings |
| Male | 693 (42.0%) | $24,048 |
| Female | 955 (58.0%) | $19,790 |
| Total | 1,648 (100.0%) | $21,759 |
Earnings by Sex by Income Bracket in Santa Barbara
The most common earnings brackets in Santa Barbara are $25,000 to $29,999 for men (191 | 27.6%) and $25,000 to $29,999 for women (245 | 25.7%).
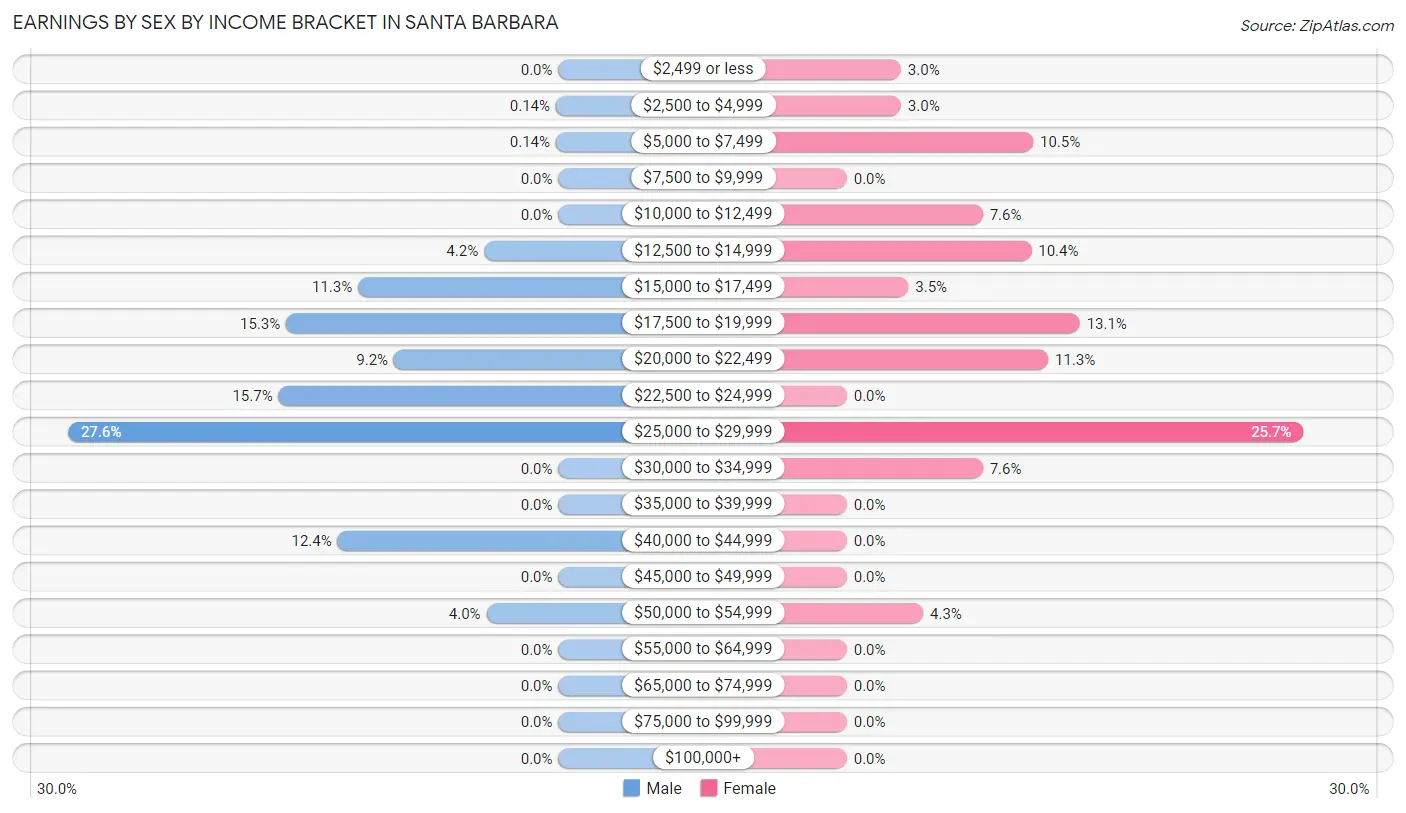
| Income | Male | Female |
| $2,499 or less | 0 (0.0%) | 29 (3.0%) |
| $2,500 to $4,999 | 1 (0.1%) | 29 (3.0%) |
| $5,000 to $7,499 | 1 (0.1%) | 100 (10.5%) |
| $7,500 to $9,999 | 0 (0.0%) | 0 (0.0%) |
| $10,000 to $12,499 | 0 (0.0%) | 73 (7.6%) |
| $12,500 to $14,999 | 29 (4.2%) | 99 (10.4%) |
| $15,000 to $17,499 | 78 (11.3%) | 33 (3.5%) |
| $17,500 to $19,999 | 106 (15.3%) | 125 (13.1%) |
| $20,000 to $22,499 | 64 (9.2%) | 108 (11.3%) |
| $22,500 to $24,999 | 109 (15.7%) | 0 (0.0%) |
| $25,000 to $29,999 | 191 (27.6%) | 245 (25.7%) |
| $30,000 to $34,999 | 0 (0.0%) | 73 (7.6%) |
| $35,000 to $39,999 | 0 (0.0%) | 0 (0.0%) |
| $40,000 to $44,999 | 86 (12.4%) | 0 (0.0%) |
| $45,000 to $49,999 | 0 (0.0%) | 0 (0.0%) |
| $50,000 to $54,999 | 28 (4.0%) | 41 (4.3%) |
| $55,000 to $64,999 | 0 (0.0%) | 0 (0.0%) |
| $65,000 to $74,999 | 0 (0.0%) | 0 (0.0%) |
| $75,000 to $99,999 | 0 (0.0%) | 0 (0.0%) |
| $100,000+ | 0 (0.0%) | 0 (0.0%) |
| Total | 693 (100.0%) | 955 (100.0%) |
Earnings by Sex by Educational Attainment in Santa Barbara
Average earnings in Santa Barbara are $23,349 for men and $19,420 for women, a difference of 16.8%. Men with an educational attainment of bachelor's degree enjoy the highest average annual earnings of $27,963, while those with less than high school education earn the least with $17,946. Women with an educational attainment of bachelor's degree earn the most with the average annual earnings of $26,032, while those with college or associate's degree education have the smallest earnings of $17,235.
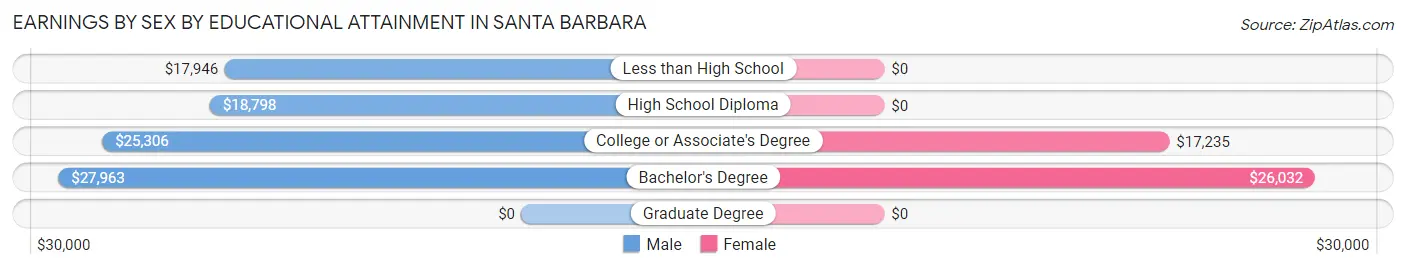
| Educational Attainment | Male Income | Female Income |
| Less than High School | $17,946 | $0 |
| High School Diploma | $18,798 | $0 |
| College or Associate's Degree | $25,306 | $17,235 |
| Bachelor's Degree | $27,963 | $26,032 |
| Graduate Degree | - | - |
| Total | $23,349 | $19,420 |
Family Income in Santa Barbara
Family Income Brackets in Santa Barbara
According to the Santa Barbara family income data, there are 201 families falling into the $15,000 to $24,999 income range, which is the most common income bracket and makes up 22.4% of all families.
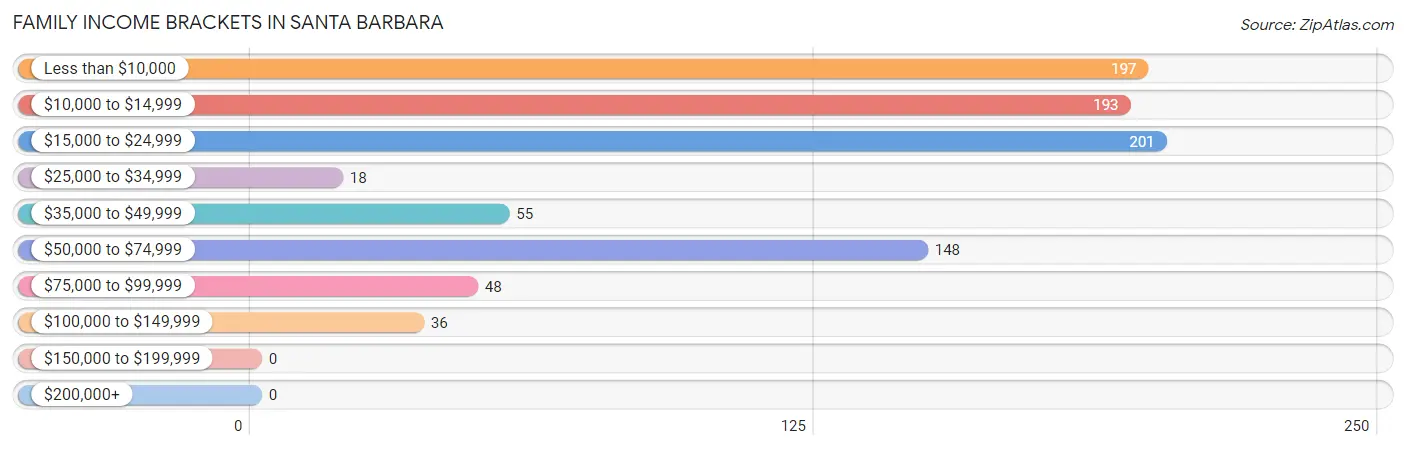
| Income Bracket | # Families | % Families |
| Less than $10,000 | 197 | 22.0% |
| $10,000 to $14,999 | 193 | 21.5% |
| $15,000 to $24,999 | 201 | 22.4% |
| $25,000 to $34,999 | 18 | 2.0% |
| $35,000 to $49,999 | 55 | 6.1% |
| $50,000 to $74,999 | 148 | 16.5% |
| $75,000 to $99,999 | 48 | 5.4% |
| $100,000 to $149,999 | 36 | 4.0% |
| $150,000 to $199,999 | 0 | 0.0% |
| $200,000+ | 0 | 0.0% |
Family Income by Famaliy Size in Santa Barbara
5-person families (93 | 10.4%) account for the highest median family income in Santa Barbara with $90,208 per family, while 5-person families (93 | 10.4%) have the highest median income of $18,042 per family member.
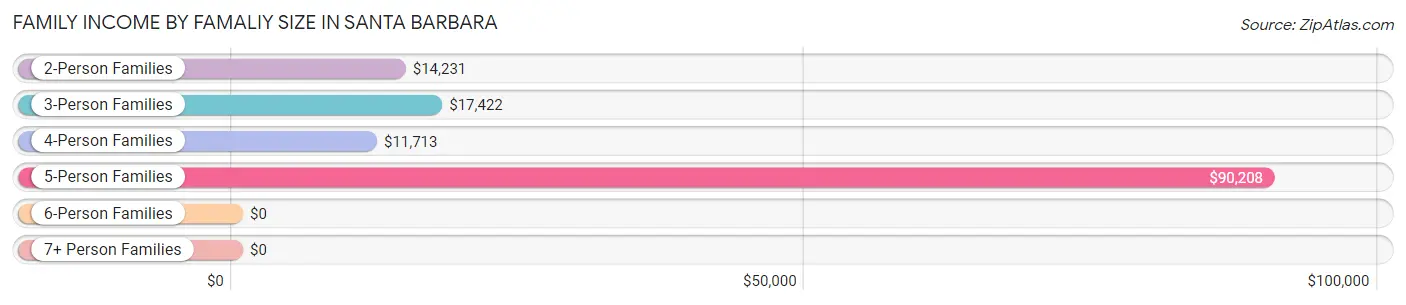
| Income Bracket | # Families | Median Income |
| 2-Person Families | 370 (41.3%) | $14,231 |
| 3-Person Families | 193 (21.5%) | $17,422 |
| 4-Person Families | 204 (22.8%) | $11,713 |
| 5-Person Families | 93 (10.4%) | $90,208 |
| 6-Person Families | 0 (0.0%) | $0 |
| 7+ Person Families | 36 (4.0%) | $0 |
| Total | 896 (100.0%) | $16,768 |
Family Income by Number of Earners in Santa Barbara
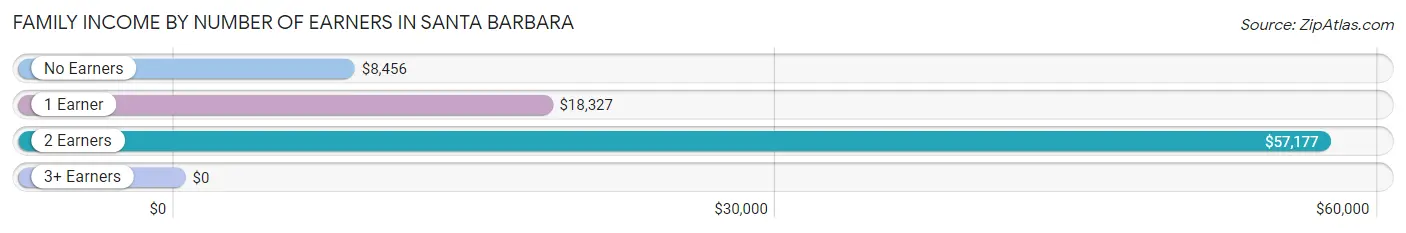
| Number of Earners | # Families | Median Income |
| No Earners | 315 (35.2%) | $8,456 |
| 1 Earner | 373 (41.6%) | $18,327 |
| 2 Earners | 142 (15.9%) | $57,177 |
| 3+ Earners | 66 (7.4%) | $0 |
| Total | 896 (100.0%) | $16,768 |
Household Income in Santa Barbara
Household Income Brackets in Santa Barbara
With 353 households falling in the category, the $10,000 to $14,999 income range is the most frequent in Santa Barbara, accounting for 26.1% of all households.
| Income Bracket | # Households | % Households |
| Less than $10,000 | 321 | 23.7% |
| $10,000 to $14,999 | 353 | 26.1% |
| $15,000 to $24,999 | 234 | 17.3% |
| $25,000 to $34,999 | 74 | 5.5% |
| $35,000 to $49,999 | 139 | 10.3% |
| $50,000 to $74,999 | 107 | 7.9% |
| $75,000 to $99,999 | 89 | 6.6% |
| $100,000 to $149,999 | 37 | 2.7% |
| $150,000 to $199,999 | 0 | 0.0% |
| $200,000+ | 0 | 0.0% |
Household Income by Householder Age in Santa Barbara
The median household income in Santa Barbara is $15,109, with the highest median household income of $12,356 found in the 65+ years age bracket for the primary householder. A total of 573 households (42.3%) fall into this category. Meanwhile, the 15 to 24 years age bracket for the primary householder has the lowest median household income of $0, with 52 households (3.8%) in this group.
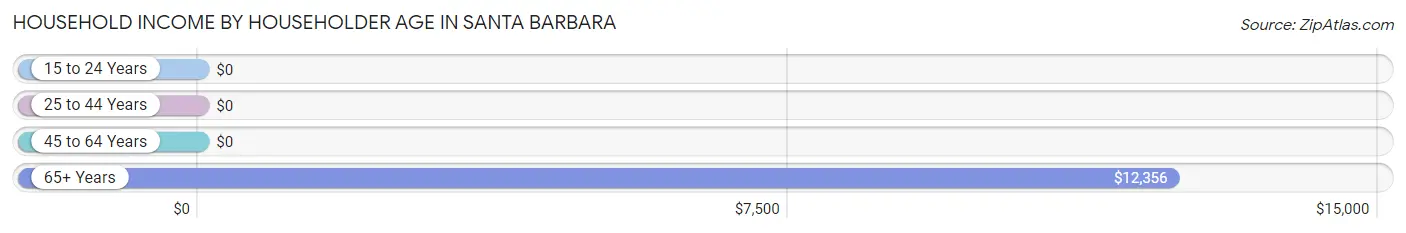
| Income Bracket | # Households | Median Income |
| 15 to 24 Years | 52 (3.8%) | $0 |
| 25 to 44 Years | 397 (29.3%) | $0 |
| 45 to 64 Years | 331 (24.5%) | $0 |
| 65+ Years | 573 (42.3%) | $12,356 |
| Total | 1,353 (100.0%) | $15,109 |
Poverty in Santa Barbara
Income Below Poverty by Sex and Age in Santa Barbara
With 44.8% poverty level for males and 62.3% for females among the residents of Santa Barbara, under 5 year old males and under 5 year old females are the most vulnerable to poverty, with 142 males (100.0%) and 37 females (100.0%) in their respective age groups living below the poverty level.
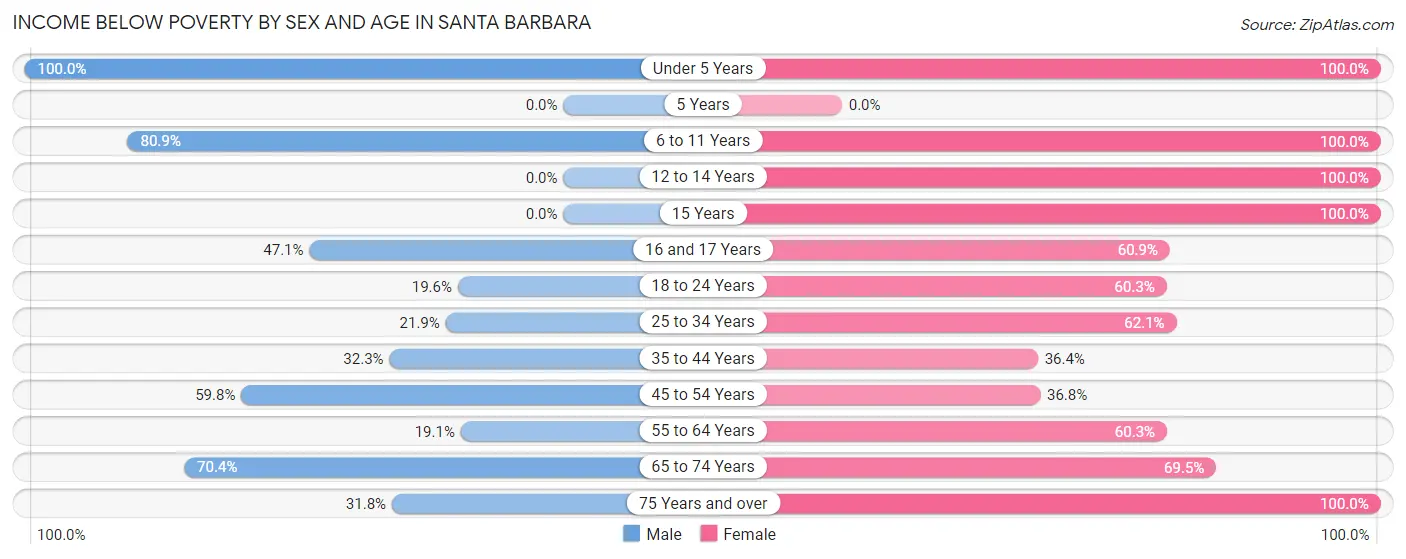
| Age Bracket | Male | Female |
| Under 5 Years | 142 (100.0%) | 37 (100.0%) |
| 5 Years | 0 (0.0%) | 0 (0.0%) |
| 6 to 11 Years | 165 (80.9%) | 194 (100.0%) |
| 12 to 14 Years | 0 (0.0%) | 129 (100.0%) |
| 15 Years | 0 (0.0%) | 38 (100.0%) |
| 16 and 17 Years | 33 (47.1%) | 84 (60.9%) |
| 18 to 24 Years | 38 (19.6%) | 126 (60.3%) |
| 25 to 34 Years | 92 (21.8%) | 231 (62.1%) |
| 35 to 44 Years | 31 (32.3%) | 120 (36.4%) |
| 45 to 54 Years | 113 (59.8%) | 152 (36.8%) |
| 55 to 64 Years | 28 (19.1%) | 143 (60.3%) |
| 65 to 74 Years | 126 (70.4%) | 239 (69.5%) |
| 75 Years and over | 35 (31.8%) | 75 (100.0%) |
| Total | 803 (44.8%) | 1,568 (62.3%) |
Income Above Poverty by Sex and Age in Santa Barbara
According to the poverty statistics in Santa Barbara, males aged 12 to 14 years and females aged 35 to 44 years are the age groups that are most secure financially, with 100.0% of males and 63.6% of females in these age groups living above the poverty line.
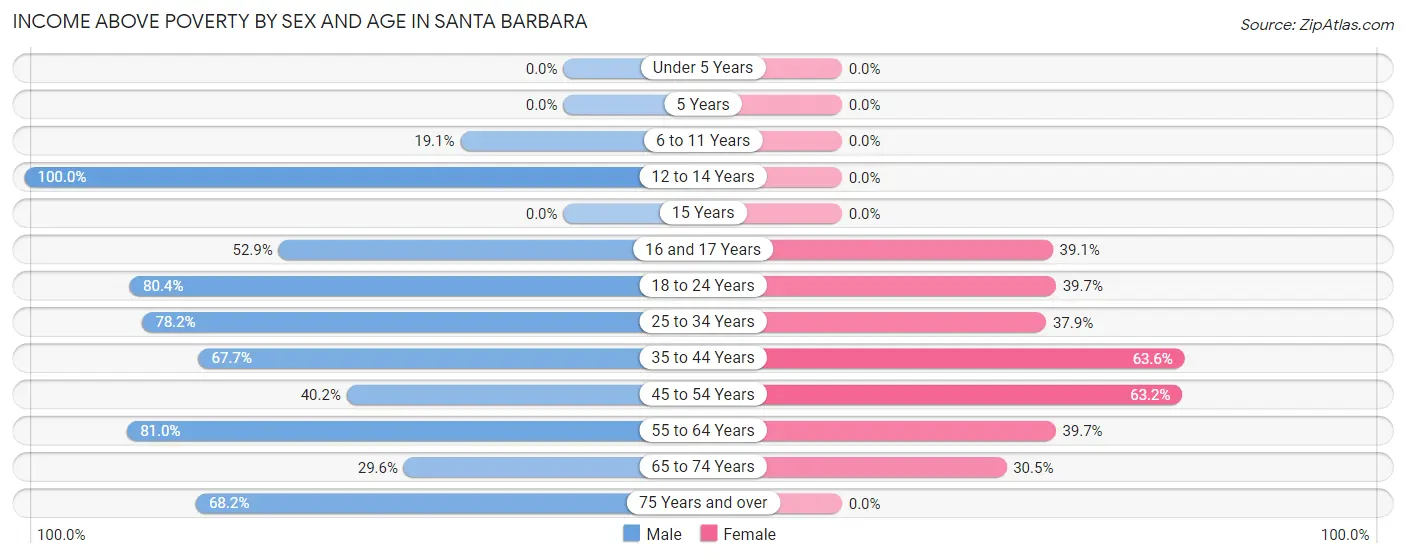
| Age Bracket | Male | Female |
| Under 5 Years | 0 (0.0%) | 0 (0.0%) |
| 5 Years | 0 (0.0%) | 0 (0.0%) |
| 6 to 11 Years | 39 (19.1%) | 0 (0.0%) |
| 12 to 14 Years | 39 (100.0%) | 0 (0.0%) |
| 15 Years | 0 (0.0%) | 0 (0.0%) |
| 16 and 17 Years | 37 (52.9%) | 54 (39.1%) |
| 18 to 24 Years | 156 (80.4%) | 83 (39.7%) |
| 25 to 34 Years | 329 (78.1%) | 141 (37.9%) |
| 35 to 44 Years | 65 (67.7%) | 210 (63.6%) |
| 45 to 54 Years | 76 (40.2%) | 261 (63.2%) |
| 55 to 64 Years | 119 (80.9%) | 94 (39.7%) |
| 65 to 74 Years | 53 (29.6%) | 105 (30.5%) |
| 75 Years and over | 75 (68.2%) | 0 (0.0%) |
| Total | 988 (55.2%) | 948 (37.7%) |
Income Below Poverty Among Married-Couple Families in Santa Barbara
The poverty statistics for married-couple families in Santa Barbara show that 20.6% or 51 of the total 248 families live below the poverty line. Families with no children have the highest poverty rate of 23.4%, comprising of 51 families. On the other hand, families with 1 or 2 children have the lowest poverty rate of 0.0%, which includes 0 families.
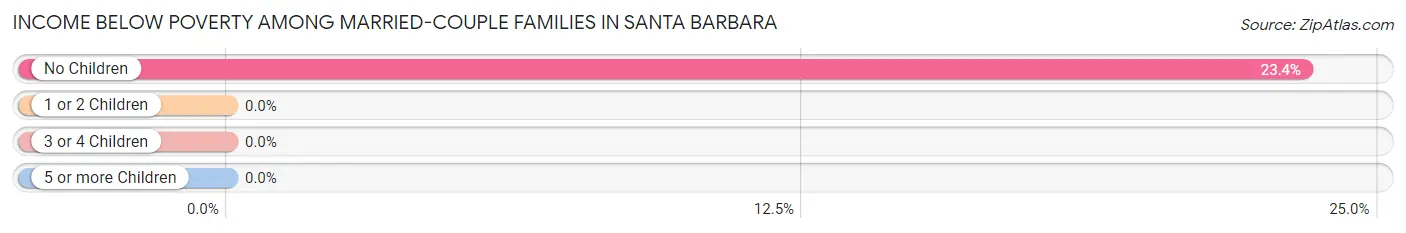
| Children | Above Poverty | Below Poverty |
| No Children | 167 (76.6%) | 51 (23.4%) |
| 1 or 2 Children | 30 (100.0%) | 0 (0.0%) |
| 3 or 4 Children | 0 (0.0%) | 0 (0.0%) |
| 5 or more Children | 0 (0.0%) | 0 (0.0%) |
| Total | 197 (79.4%) | 51 (20.6%) |
Income Below Poverty Among Single-Parent Households in Santa Barbara
According to the poverty data in Santa Barbara, 67.6% or 96 single-father households and 83.0% or 420 single-mother households are living below the poverty line. Among single-father households, those with 1 or 2 children have the highest poverty rate, with 79 households (100.0%) experiencing poverty. Likewise, among single-mother households, those with no children have the highest poverty rate, with 128 households (100.0%) falling below the poverty line.
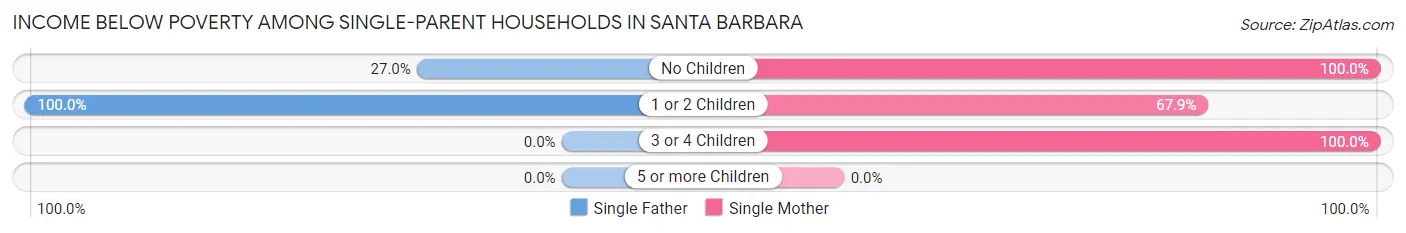
| Children | Single Father | Single Mother |
| No Children | 17 (27.0%) | 128 (100.0%) |
| 1 or 2 Children | 79 (100.0%) | 182 (67.9%) |
| 3 or 4 Children | 0 (0.0%) | 110 (100.0%) |
| 5 or more Children | 0 (0.0%) | 0 (0.0%) |
| Total | 96 (67.6%) | 420 (83.0%) |
Income Below Poverty Among Married-Couple vs Single-Parent Households in Santa Barbara
The poverty data for Santa Barbara shows that 51 of the married-couple family households (20.6%) and 516 of the single-parent households (79.6%) are living below the poverty level. Within the married-couple family households, those with no children have the highest poverty rate, with 51 households (23.4%) falling below the poverty line. Among the single-parent households, those with 3 or 4 children have the highest poverty rate, with 110 household (100.0%) living below poverty.
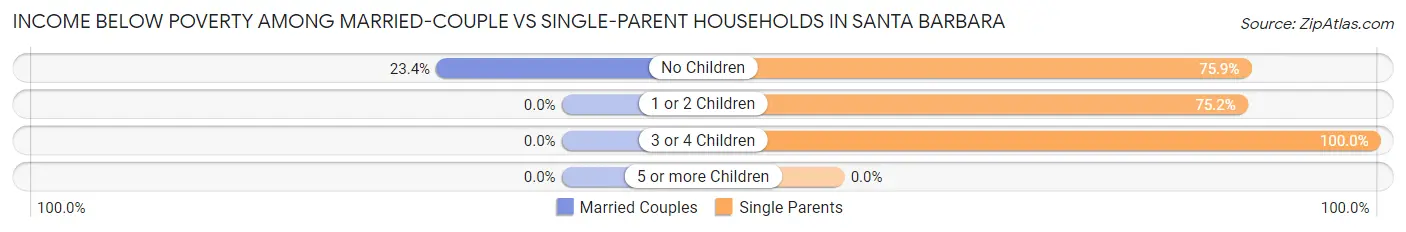
| Children | Married-Couple Families | Single-Parent Households |
| No Children | 51 (23.4%) | 145 (75.9%) |
| 1 or 2 Children | 0 (0.0%) | 261 (75.2%) |
| 3 or 4 Children | 0 (0.0%) | 110 (100.0%) |
| 5 or more Children | 0 (0.0%) | 0 (0.0%) |
| Total | 51 (20.6%) | 516 (79.6%) |
Race in Santa Barbara
The most populous races in Santa Barbara are Hispanic or Latino (4,368 | 100.0%), Some other Race (1,961 | 44.9%), and Black / African American (910 | 20.8%).
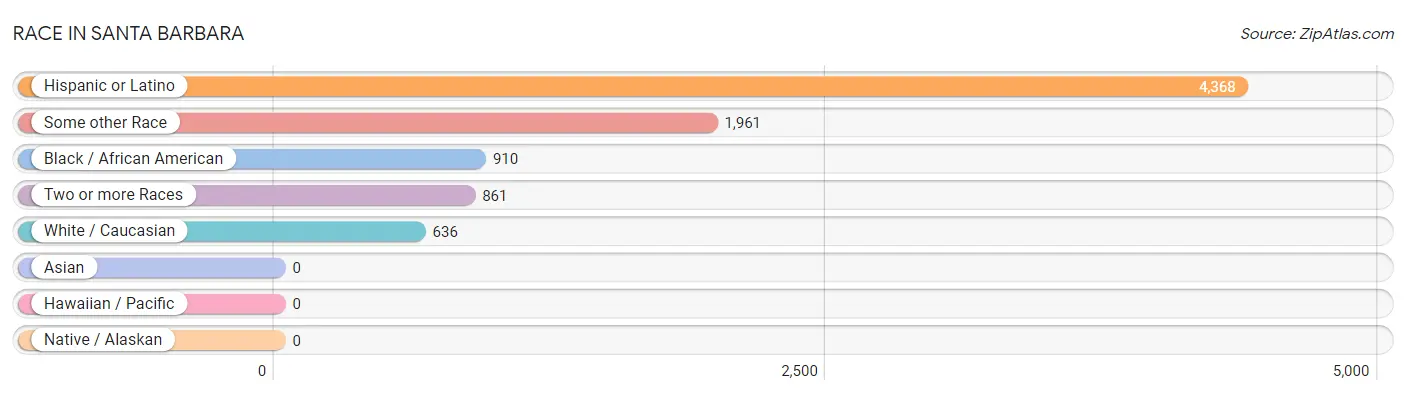
| Race | # Population | % Population |
| Asian | 0 | 0.0% |
| Black / African American | 910 | 20.8% |
| Hawaiian / Pacific | 0 | 0.0% |
| Hispanic or Latino | 4,368 | 100.0% |
| Native / Alaskan | 0 | 0.0% |
| White / Caucasian | 636 | 14.6% |
| Two or more Races | 861 | 19.7% |
| Some other Race | 1,961 | 44.9% |
| Total | 4,368 | 100.0% |
Ancestry in Santa Barbara
The most populous ancestries reported in Santa Barbara are Puerto Rican (4,309 | 98.7%), and Dominican (59 | 1.3%), together accounting for 100.0% of all Santa Barbara residents.
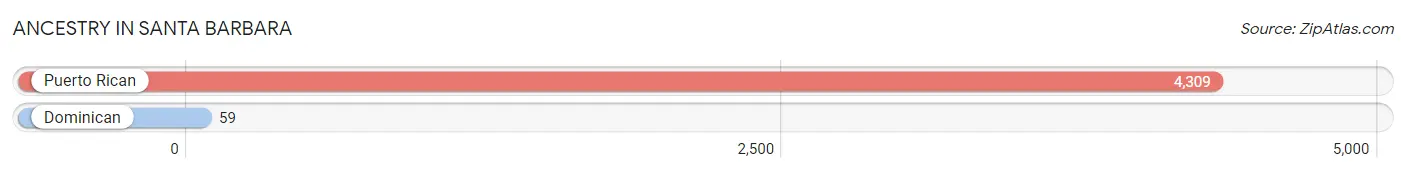
| Ancestry | # Population | % Population |
| Dominican | 59 | 1.3% |
| Puerto Rican | 4,309 | 98.7% | View All 2 Rows |
Immigrants in Santa Barbara

| Immigration Origin | # Population | % Population | View All 0 Rows |
Sex and Age in Santa Barbara
Sex and Age in Santa Barbara
The most populous age groups in Santa Barbara are 25 to 29 Years (305 | 16.5%) for men and 50 to 54 Years (284 | 11.3%) for women.
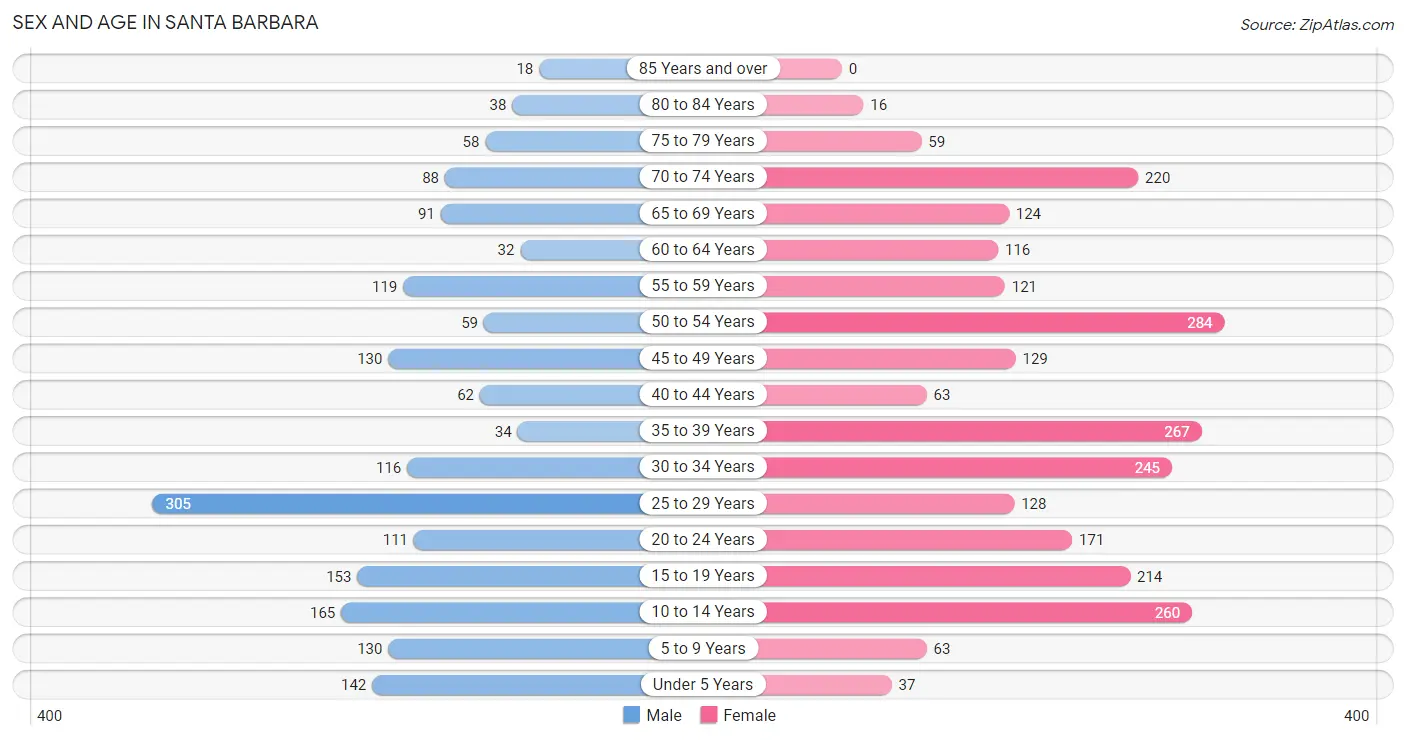
| Age Bracket | Male | Female |
| Under 5 Years | 142 (7.7%) | 37 (1.5%) |
| 5 to 9 Years | 130 (7.0%) | 63 (2.5%) |
| 10 to 14 Years | 165 (8.9%) | 260 (10.3%) |
| 15 to 19 Years | 153 (8.3%) | 214 (8.5%) |
| 20 to 24 Years | 111 (6.0%) | 171 (6.8%) |
| 25 to 29 Years | 305 (16.5%) | 128 (5.1%) |
| 30 to 34 Years | 116 (6.3%) | 245 (9.7%) |
| 35 to 39 Years | 34 (1.8%) | 267 (10.6%) |
| 40 to 44 Years | 62 (3.4%) | 63 (2.5%) |
| 45 to 49 Years | 130 (7.0%) | 129 (5.1%) |
| 50 to 54 Years | 59 (3.2%) | 284 (11.3%) |
| 55 to 59 Years | 119 (6.4%) | 121 (4.8%) |
| 60 to 64 Years | 32 (1.7%) | 116 (4.6%) |
| 65 to 69 Years | 91 (4.9%) | 124 (4.9%) |
| 70 to 74 Years | 88 (4.8%) | 220 (8.7%) |
| 75 to 79 Years | 58 (3.1%) | 59 (2.3%) |
| 80 to 84 Years | 38 (2.1%) | 16 (0.6%) |
| 85 Years and over | 18 (1.0%) | 0 (0.0%) |
| Total | 1,851 (100.0%) | 2,517 (100.0%) |
Families and Households in Santa Barbara
Median Family Size in Santa Barbara
The median family size in Santa Barbara is 3.92 persons per family, with married-couple families (248 | 27.7%) accounting for the largest median family size of 4.7 persons per family. On the other hand, single male/father families (142 | 15.9%) represent the smallest median family size with 3.17 persons per family.
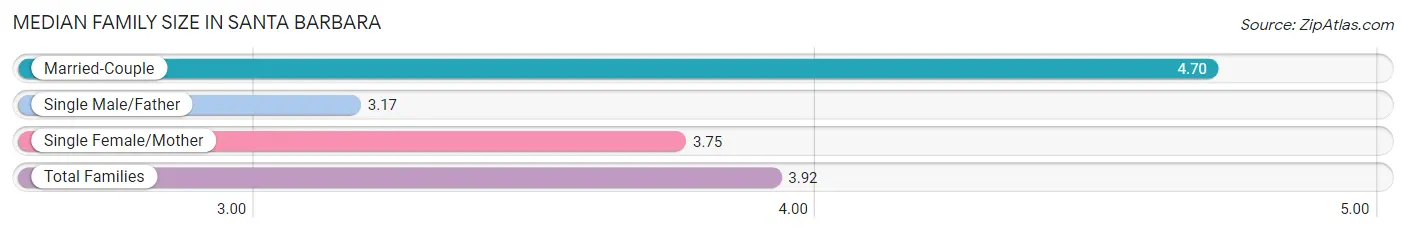
| Family Type | # Families | Family Size |
| Married-Couple | 248 (27.7%) | 4.70 |
| Single Male/Father | 142 (15.9%) | 3.17 |
| Single Female/Mother | 506 (56.5%) | 3.75 |
| Total Families | 896 (100.0%) | 3.92 |
Median Household Size in Santa Barbara
The median household size in Santa Barbara is 3.21 persons per household, with married-couple households (248 | 18.3%) accounting for the largest median household size of 4.7 persons per household. non-family households (457 | 33.8%) represent the smallest median household size with 1.26 persons per household.
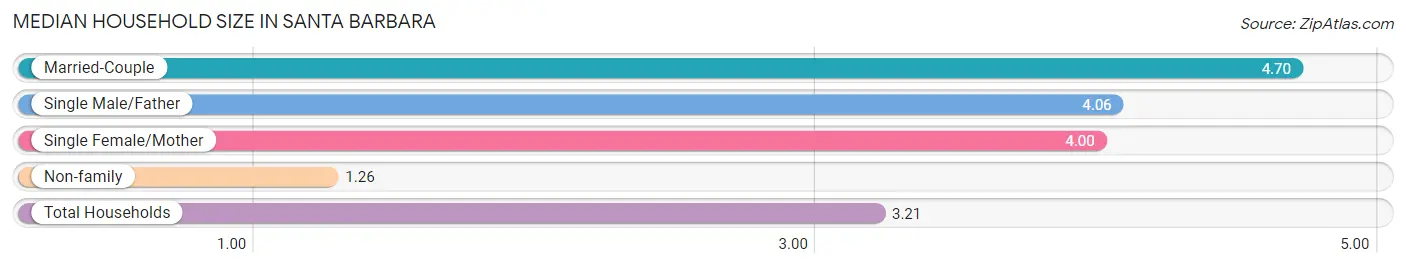
| Household Type | # Households | Household Size |
| Married-Couple | 248 (18.3%) | 4.70 |
| Single Male/Father | 142 (10.5%) | 4.06 |
| Single Female/Mother | 506 (37.4%) | 4.00 |
| Non-family | 457 (33.8%) | 1.26 |
| Total Households | 1,353 (100.0%) | 3.21 |
Household Size by Marriage Status in Santa Barbara
Out of a total of 1,353 households in Santa Barbara, 896 (66.2%) are family households, while 457 (33.8%) are nonfamily households. The most numerous type of family households are 3-person households, comprising 257, and the most common type of nonfamily households are 1-person households, comprising 317.
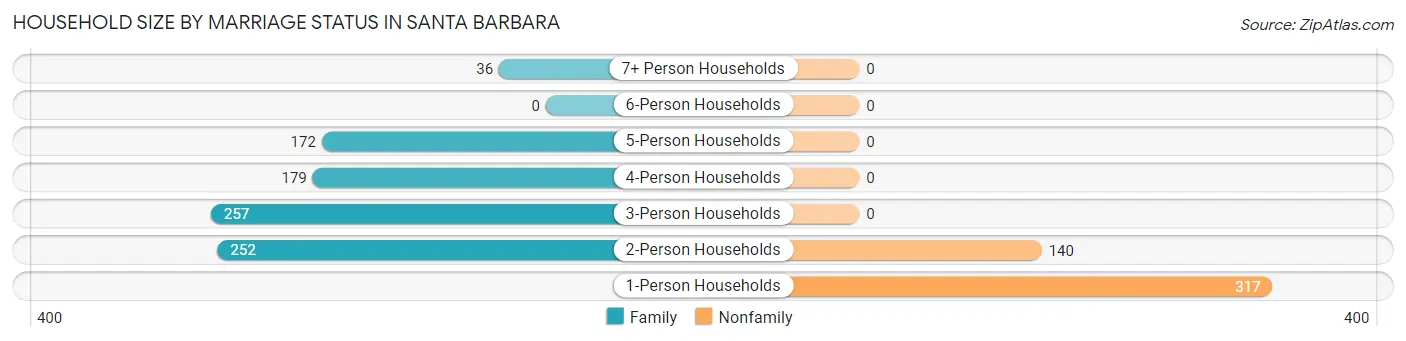
| Household Size | Family Households | Nonfamily Households |
| 1-Person Households | - | 317 (23.4%) |
| 2-Person Households | 252 (18.6%) | 140 (10.3%) |
| 3-Person Households | 257 (19.0%) | 0 (0.0%) |
| 4-Person Households | 179 (13.2%) | 0 (0.0%) |
| 5-Person Households | 172 (12.7%) | 0 (0.0%) |
| 6-Person Households | 0 (0.0%) | 0 (0.0%) |
| 7+ Person Households | 36 (2.7%) | 0 (0.0%) |
| Total | 896 (66.2%) | 457 (33.8%) |
Female Fertility in Santa Barbara
Fertility by Age in Santa Barbara
Average fertility rate in Santa Barbara is 29.0 births per 1,000 women. Women in the age bracket of 20 to 34 years have the highest fertility rate with 64.0 births per 1,000 women. Women in the age bracket of 20 to 34 years acount for 100.0% of all women with births.
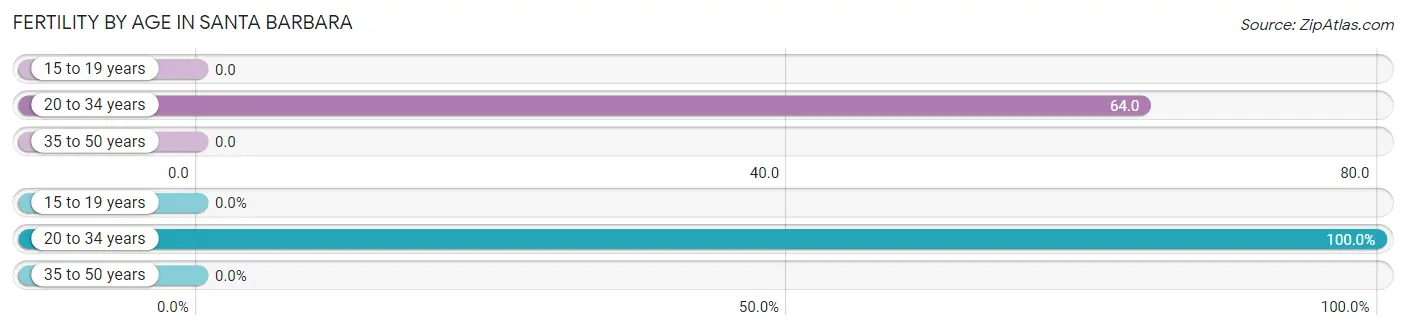
| Age Bracket | Women with Births | Births / 1,000 Women |
| 15 to 19 years | 0 (0.0%) | 0.0 |
| 20 to 34 years | 35 (100.0%) | 64.0 |
| 35 to 50 years | 0 (0.0%) | 0.0 |
| Total | 35 (100.0%) | 29.0 |
Fertility by Age by Marriage Status in Santa Barbara
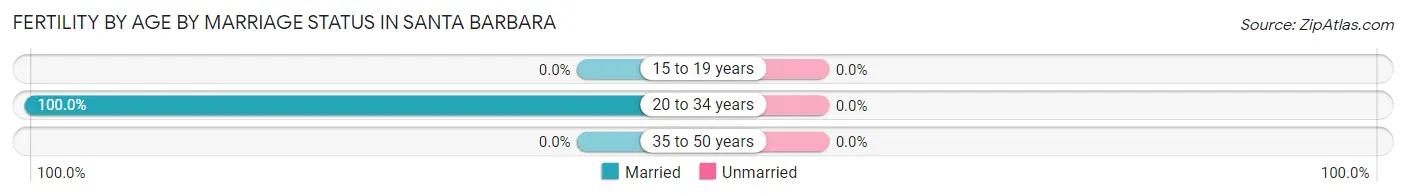
| Age Bracket | Married | Unmarried |
| 15 to 19 years | 0 (0.0%) | 0 (0.0%) |
| 20 to 34 years | 35 (100.0%) | 0 (0.0%) |
| 35 to 50 years | 0 (0.0%) | 0 (0.0%) |
| Total | 35 (100.0%) | 0 (0.0%) |
Fertility by Education in Santa Barbara
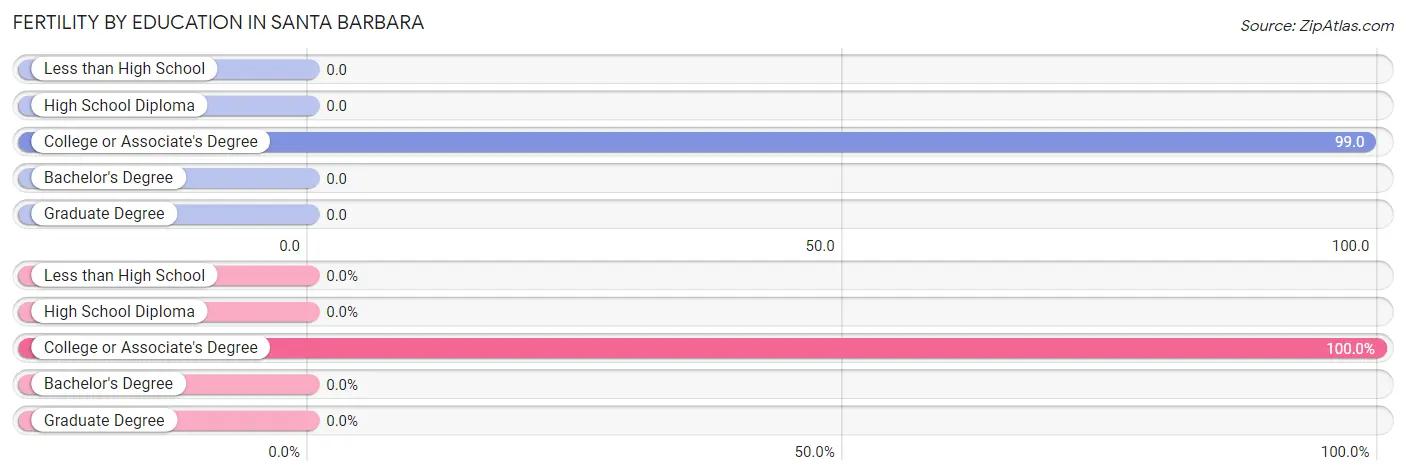
| Educational Attainment | Women with Births | Births / 1,000 Women |
| Less than High School | 0 (0.0%) | 0.0 |
| High School Diploma | 0 (0.0%) | 0.0 |
| College or Associate's Degree | 35 (100.0%) | 99.0 |
| Bachelor's Degree | 0 (0.0%) | 0.0 |
| Graduate Degree | 0 (0.0%) | 0.0 |
| Total | 35 (100.0%) | 29.0 |
Fertility by Education by Marriage Status in Santa Barbara
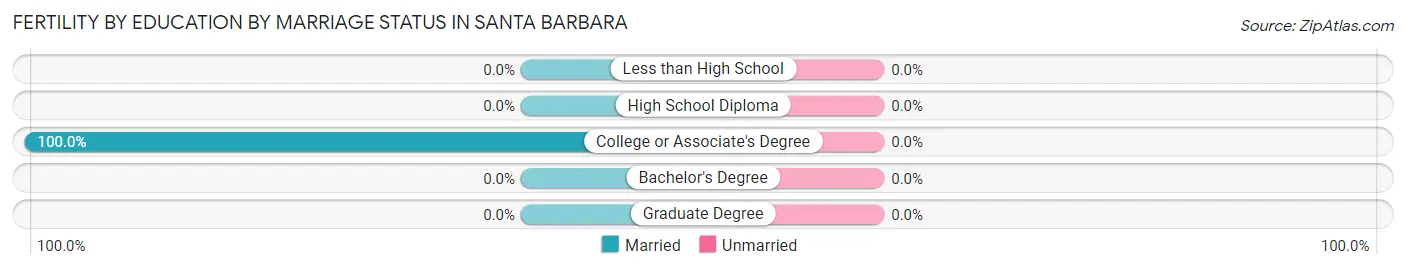
| Educational Attainment | Married | Unmarried |
| Less than High School | 0 (0.0%) | 0 (0.0%) |
| High School Diploma | 0 (0.0%) | 0 (0.0%) |
| College or Associate's Degree | 35 (100.0%) | 0 (0.0%) |
| Bachelor's Degree | 0 (0.0%) | 0 (0.0%) |
| Graduate Degree | 0 (0.0%) | 0 (0.0%) |
| Total | 35 (100.0%) | 0 (0.0%) |
Employment Characteristics in Santa Barbara
Employment by Class of Employer in Santa Barbara
Among the 1,597 employed individuals in Santa Barbara, private company employees (1,403 | 87.8%), self-employed (not incorporated) (99 | 6.2%), and state government employees (63 | 3.9%) make up the most common classes of employment.
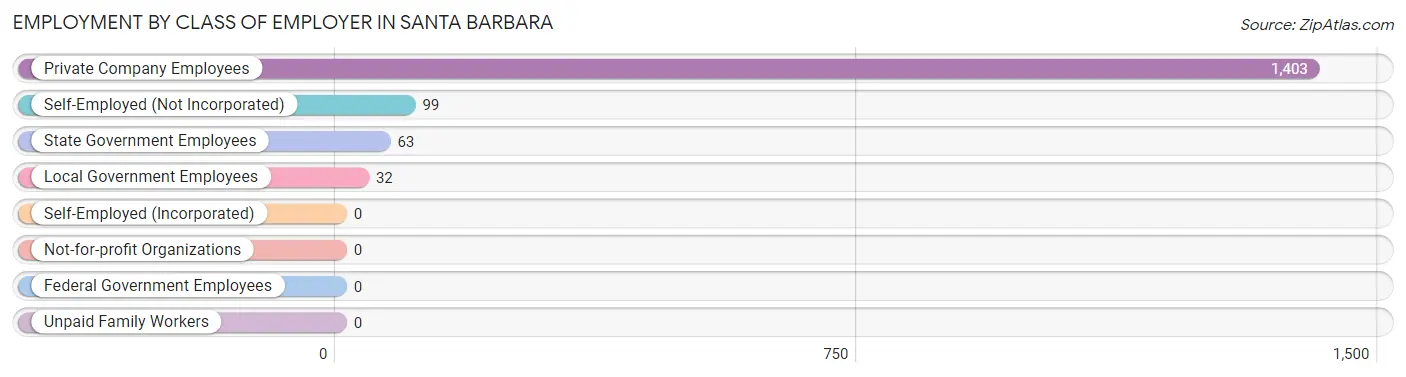
| Employer Class | # Employees | % Employees |
| Private Company Employees | 1,403 | 87.8% |
| Self-Employed (Incorporated) | 0 | 0.0% |
| Self-Employed (Not Incorporated) | 99 | 6.2% |
| Not-for-profit Organizations | 0 | 0.0% |
| Local Government Employees | 32 | 2.0% |
| State Government Employees | 63 | 3.9% |
| Federal Government Employees | 0 | 0.0% |
| Unpaid Family Workers | 0 | 0.0% |
| Total | 1,597 | 100.0% |
Employment Status by Age in Santa Barbara
According to the labor force statistics for Santa Barbara, out of the total population over 16 years of age (3,533), 56.0% or 1,978 individuals are in the labor force, with 19.3% or 382 of them unemployed. The age group with the highest labor force participation rate is 20 to 24 years, with 100.0% or 282 individuals in the labor force. Within the labor force, the 16 to 19 years age range has the highest percentage of unemployed individuals, with 100.0% or 39 of them being unemployed.
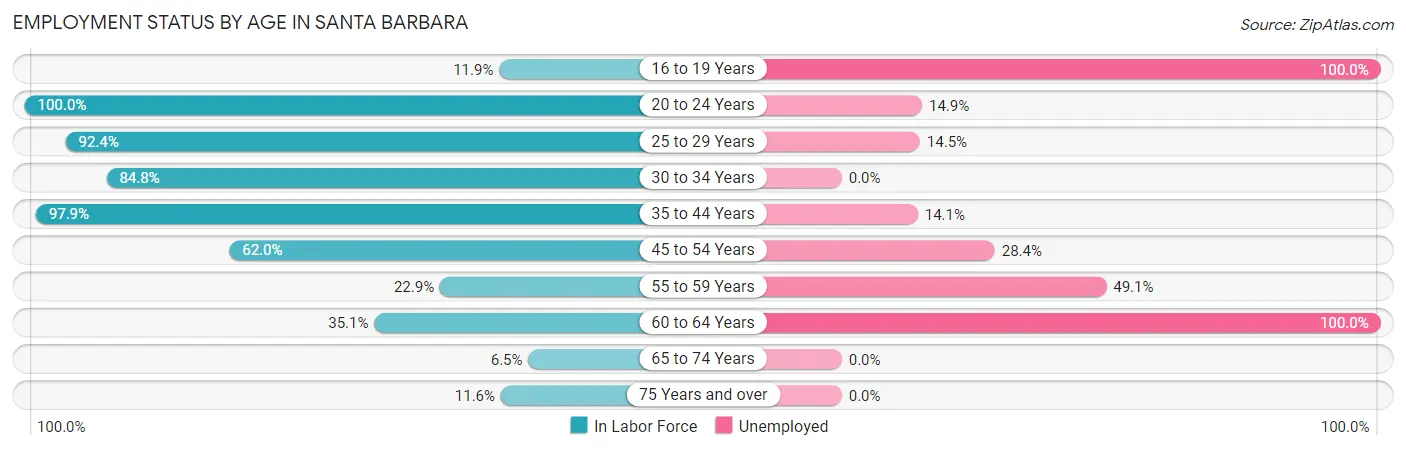
| Age Bracket | In Labor Force | Unemployed |
| 16 to 19 Years | 39 (11.9%) | 39 (100.0%) |
| 20 to 24 Years | 282 (100.0%) | 42 (14.9%) |
| 25 to 29 Years | 400 (92.4%) | 58 (14.5%) |
| 30 to 34 Years | 306 (84.8%) | 0 (0.0%) |
| 35 to 44 Years | 417 (97.9%) | 59 (14.1%) |
| 45 to 54 Years | 373 (62.0%) | 106 (28.4%) |
| 55 to 59 Years | 55 (22.9%) | 27 (49.1%) |
| 60 to 64 Years | 52 (35.1%) | 52 (100.0%) |
| 65 to 74 Years | 34 (6.5%) | 0 (0.0%) |
| 75 Years and over | 22 (11.6%) | 0 (0.0%) |
| Total | 1,978 (56.0%) | 382 (19.3%) |
Employment Status by Educational Attainment in Santa Barbara
According to labor force statistics for Santa Barbara, 72.5% of individuals (1,602) out of the total population between 25 and 64 years of age (2,210) are in the labor force, with 18.8% or 301 of them being unemployed. The group with the highest labor force participation rate are those with the educational attainment of bachelor's degree or higher, with 87.0% or 367 individuals in the labor force. Within the labor force, individuals with less than high school education have the highest percentage of unemployment, with 47.7% or 84 of them being unemployed.
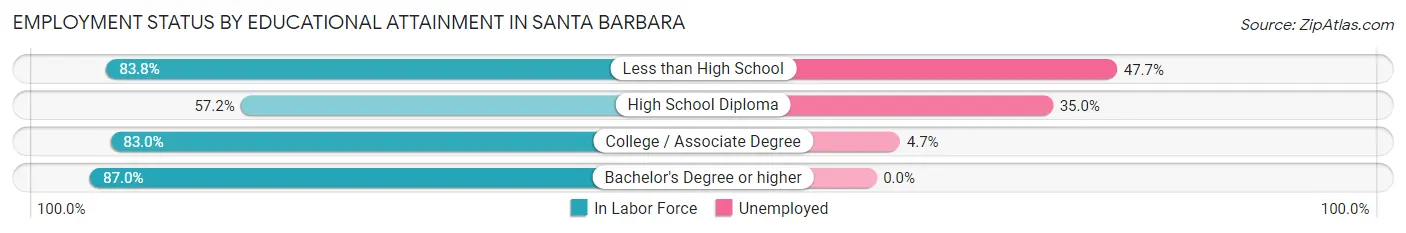
| Educational Attainment | In Labor Force | Unemployed |
| Less than High School | 176 (83.8%) | 100 (47.7%) |
| High School Diploma | 554 (57.2%) | 339 (35.0%) |
| College / Associate Degree | 506 (83.0%) | 29 (4.7%) |
| Bachelor's Degree or higher | 367 (87.0%) | 0 (0.0%) |
| Total | 1,602 (72.5%) | 415 (18.8%) |
Employment Occupations by Sex in Santa Barbara
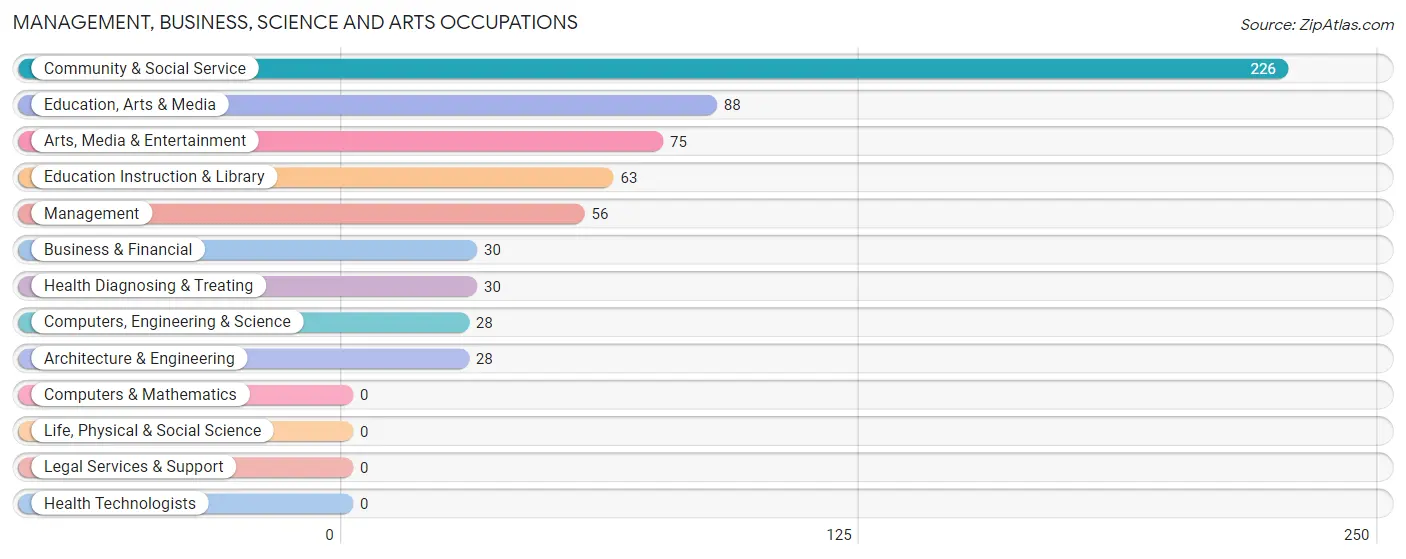
Management, Business, Science and Arts Occupations
The most common Management, Business, Science and Arts occupations in Santa Barbara are Community & Social Service (226 | 14.1%), Education, Arts & Media (88 | 5.5%), Arts, Media & Entertainment (75 | 4.7%), Education Instruction & Library (63 | 3.9%), and Management (56 | 3.5%).
Management, Business, Science and Arts Occupations by Sex
Within the Management, Business, Science and Arts occupations in Santa Barbara, the most male-oriented occupations are Business & Financial (100.0%), Computers, Engineering & Science (100.0%), and Architecture & Engineering (100.0%), while the most female-oriented occupations are Management (100.0%), Education, Arts & Media (100.0%), and Education Instruction & Library (100.0%).
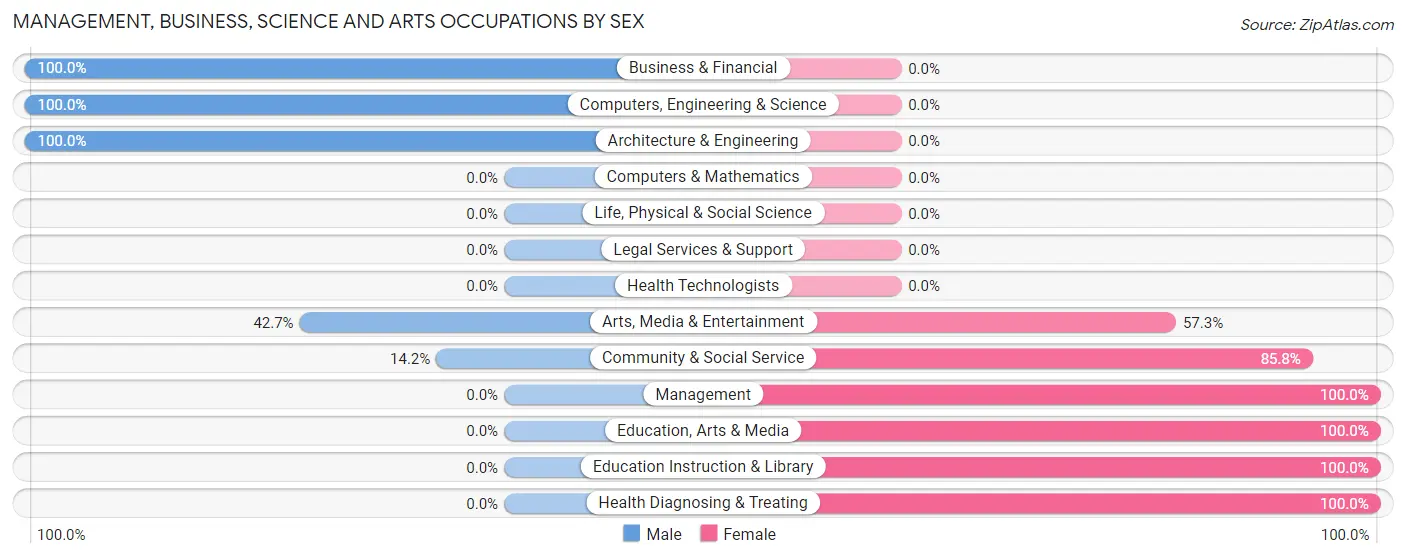
| Occupation | Male | Female |
| Management | 0 (0.0%) | 56 (100.0%) |
| Business & Financial | 30 (100.0%) | 0 (0.0%) |
| Computers, Engineering & Science | 28 (100.0%) | 0 (0.0%) |
| Computers & Mathematics | 0 (0.0%) | 0 (0.0%) |
| Architecture & Engineering | 28 (100.0%) | 0 (0.0%) |
| Life, Physical & Social Science | 0 (0.0%) | 0 (0.0%) |
| Community & Social Service | 32 (14.2%) | 194 (85.8%) |
| Education, Arts & Media | 0 (0.0%) | 88 (100.0%) |
| Legal Services & Support | 0 (0.0%) | 0 (0.0%) |
| Education Instruction & Library | 0 (0.0%) | 63 (100.0%) |
| Arts, Media & Entertainment | 32 (42.7%) | 43 (57.3%) |
| Health Diagnosing & Treating | 0 (0.0%) | 30 (100.0%) |
| Health Technologists | 0 (0.0%) | 0 (0.0%) |
| Total (Category) | 90 (24.3%) | 280 (75.7%) |
| Total (Overall) | 692 (43.3%) | 905 (56.7%) |
Services Occupations
The most common Services occupations in Santa Barbara are Security & Protection (216 | 13.5%), Firefighting & Prevention (216 | 13.5%), Cleaning & Maintenance (192 | 12.0%), Food Preparation & Serving (83 | 5.2%), and Healthcare Support (56 | 3.5%).
Services Occupations by Sex
Within the Services occupations in Santa Barbara, the most male-oriented occupations are Security & Protection (87.5%), Firefighting & Prevention (87.5%), and Food Preparation & Serving (41.0%), while the most female-oriented occupations are Healthcare Support (100.0%), Cleaning & Maintenance (68.8%), and Food Preparation & Serving (59.0%).
| Occupation | Male | Female |
| Healthcare Support | 0 (0.0%) | 56 (100.0%) |
| Security & Protection | 189 (87.5%) | 27 (12.5%) |
| Firefighting & Prevention | 189 (87.5%) | 27 (12.5%) |
| Law Enforcement | 0 (0.0%) | 0 (0.0%) |
| Food Preparation & Serving | 34 (41.0%) | 49 (59.0%) |
| Cleaning & Maintenance | 60 (31.2%) | 132 (68.8%) |
| Personal Care & Service | 0 (0.0%) | 0 (0.0%) |
| Total (Category) | 283 (51.7%) | 264 (48.3%) |
| Total (Overall) | 692 (43.3%) | 905 (56.7%) |
Sales and Office Occupations
The most common Sales and Office occupations in Santa Barbara are Sales & Related (217 | 13.6%), and Office & Administration (124 | 7.8%).
Sales and Office Occupations by Sex
| Occupation | Male | Female |
| Sales & Related | 44 (20.3%) | 173 (79.7%) |
| Office & Administration | 0 (0.0%) | 124 (100.0%) |
| Total (Category) | 44 (12.9%) | 297 (87.1%) |
| Total (Overall) | 692 (43.3%) | 905 (56.7%) |
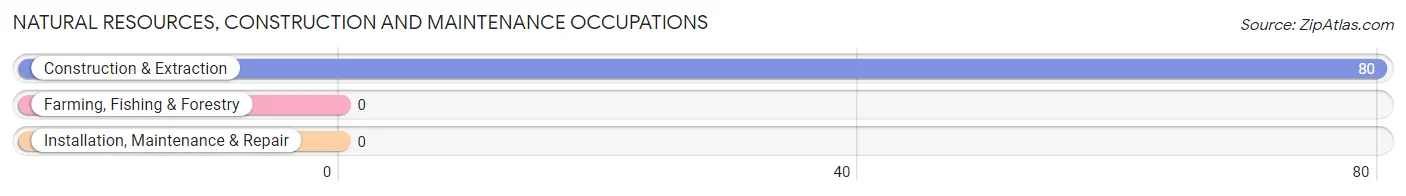
Natural Resources, Construction and Maintenance Occupations
The most common Natural Resources, Construction and Maintenance occupations in Santa Barbara are , and Construction & Extraction (80 | 5.0%).
Natural Resources, Construction and Maintenance Occupations by Sex
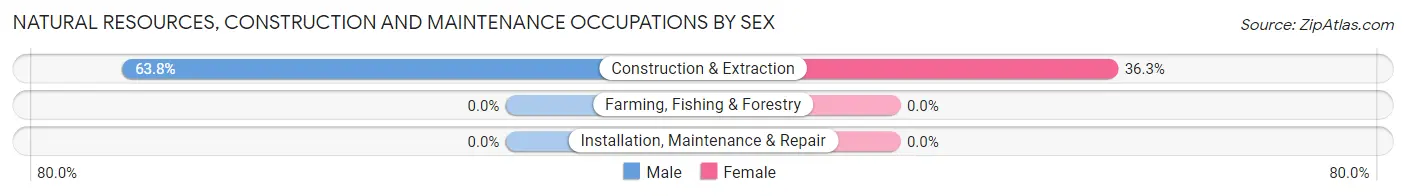
| Occupation | Male | Female |
| Farming, Fishing & Forestry | 0 (0.0%) | 0 (0.0%) |
| Construction & Extraction | 51 (63.7%) | 29 (36.2%) |
| Installation, Maintenance & Repair | 0 (0.0%) | 0 (0.0%) |
| Total (Category) | 51 (63.7%) | 29 (36.2%) |
| Total (Overall) | 692 (43.3%) | 905 (56.7%) |
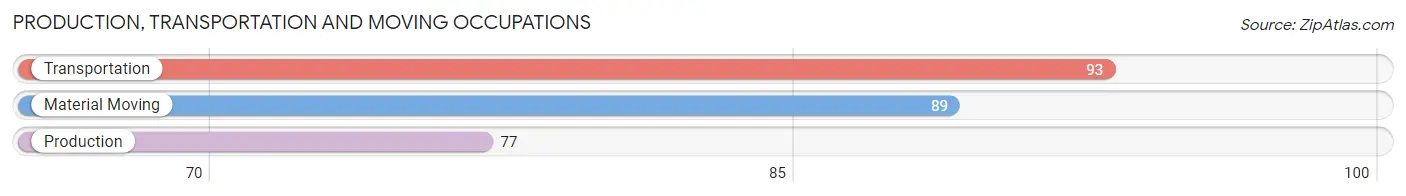
Production, Transportation and Moving Occupations
The most common Production, Transportation and Moving occupations in Santa Barbara are Transportation (93 | 5.8%), Material Moving (89 | 5.6%), and Production (77 | 4.8%).
Production, Transportation and Moving Occupations by Sex
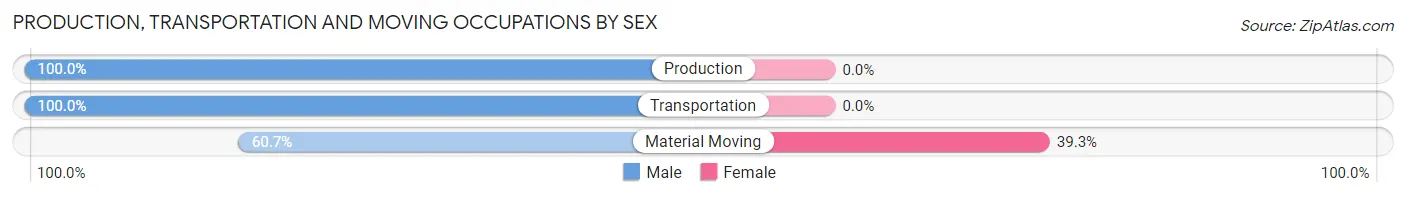
| Occupation | Male | Female |
| Production | 77 (100.0%) | 0 (0.0%) |
| Transportation | 93 (100.0%) | 0 (0.0%) |
| Material Moving | 54 (60.7%) | 35 (39.3%) |
| Total (Category) | 224 (86.5%) | 35 (13.5%) |
| Total (Overall) | 692 (43.3%) | 905 (56.7%) |
Employment Industries by Sex in Santa Barbara
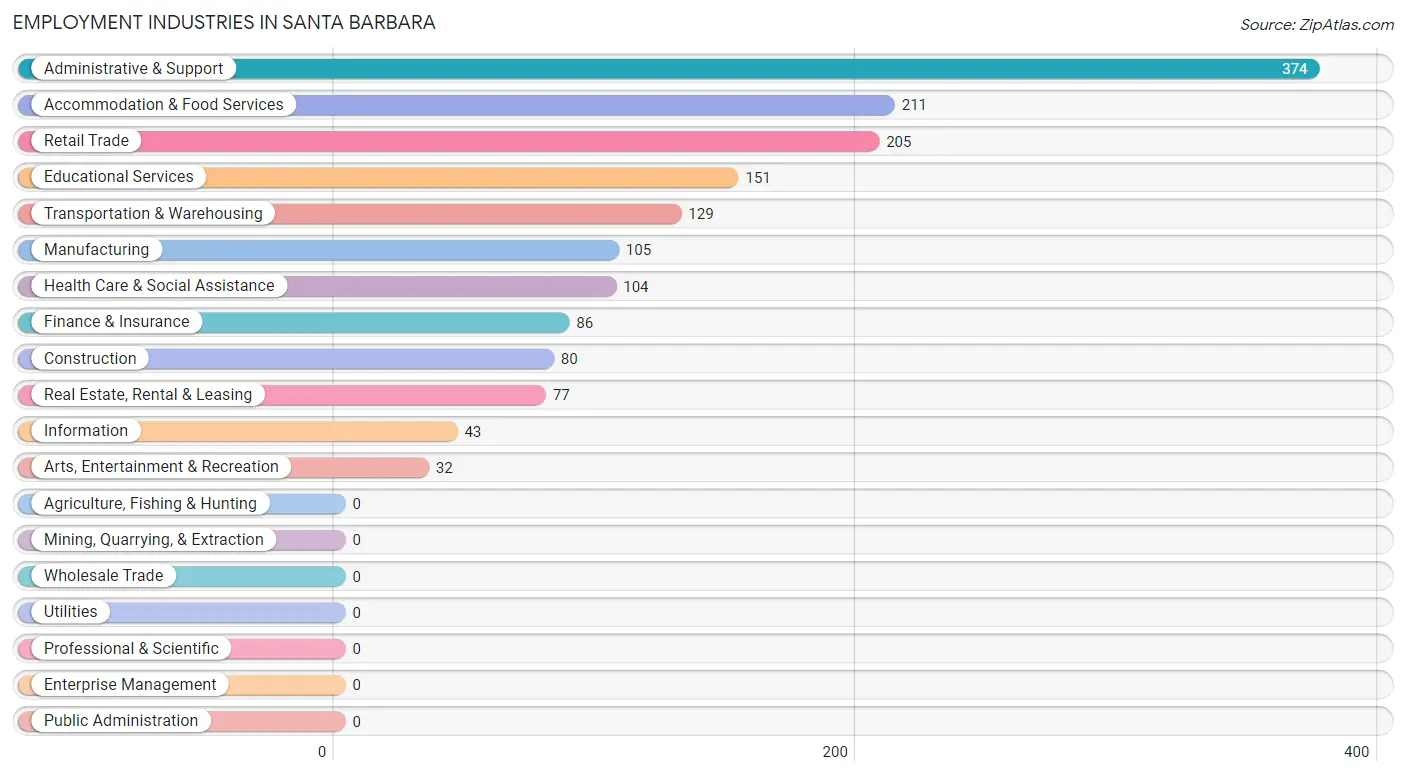
Employment Industries in Santa Barbara
The major employment industries in Santa Barbara include Administrative & Support (374 | 23.4%), Accommodation & Food Services (211 | 13.2%), Retail Trade (205 | 12.8%), Educational Services (151 | 9.5%), and Transportation & Warehousing (129 | 8.1%).
Employment Industries by Sex in Santa Barbara
The Santa Barbara industries that see more men than women are Manufacturing (100.0%), Arts, Entertainment & Recreation (100.0%), and Transportation & Warehousing (72.1%), whereas the industries that tend to have a higher number of women are Information (100.0%), Educational Services (100.0%), and Health Care & Social Assistance (99.0%).
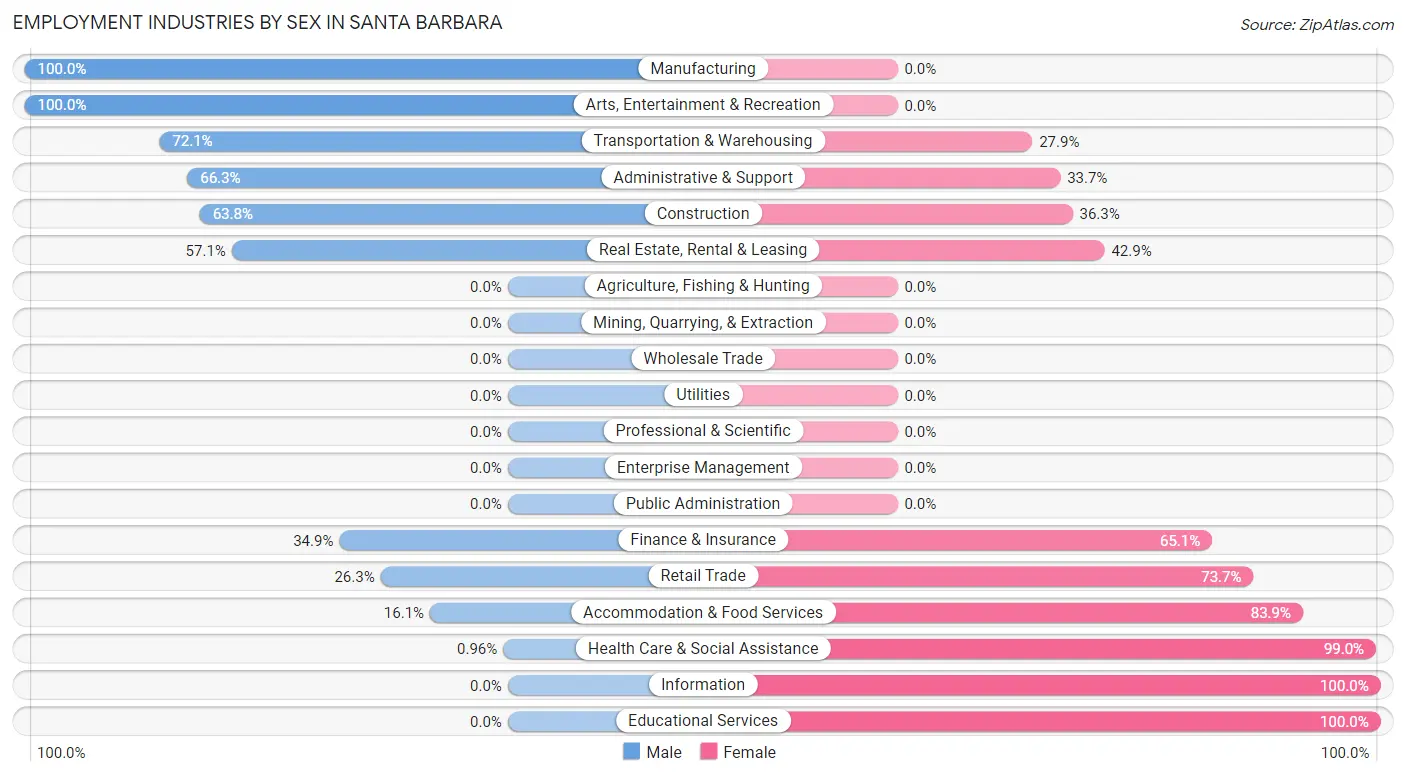
| Industry | Male | Female |
| Agriculture, Fishing & Hunting | 0 (0.0%) | 0 (0.0%) |
| Mining, Quarrying, & Extraction | 0 (0.0%) | 0 (0.0%) |
| Construction | 51 (63.7%) | 29 (36.2%) |
| Manufacturing | 105 (100.0%) | 0 (0.0%) |
| Wholesale Trade | 0 (0.0%) | 0 (0.0%) |
| Retail Trade | 54 (26.3%) | 151 (73.7%) |
| Transportation & Warehousing | 93 (72.1%) | 36 (27.9%) |
| Utilities | 0 (0.0%) | 0 (0.0%) |
| Information | 0 (0.0%) | 43 (100.0%) |
| Finance & Insurance | 30 (34.9%) | 56 (65.1%) |
| Real Estate, Rental & Leasing | 44 (57.1%) | 33 (42.9%) |
| Professional & Scientific | 0 (0.0%) | 0 (0.0%) |
| Enterprise Management | 0 (0.0%) | 0 (0.0%) |
| Administrative & Support | 248 (66.3%) | 126 (33.7%) |
| Educational Services | 0 (0.0%) | 151 (100.0%) |
| Health Care & Social Assistance | 1 (1.0%) | 103 (99.0%) |
| Arts, Entertainment & Recreation | 32 (100.0%) | 0 (0.0%) |
| Accommodation & Food Services | 34 (16.1%) | 177 (83.9%) |
| Public Administration | 0 (0.0%) | 0 (0.0%) |
| Total | 692 (43.3%) | 905 (56.7%) |
Education in Santa Barbara
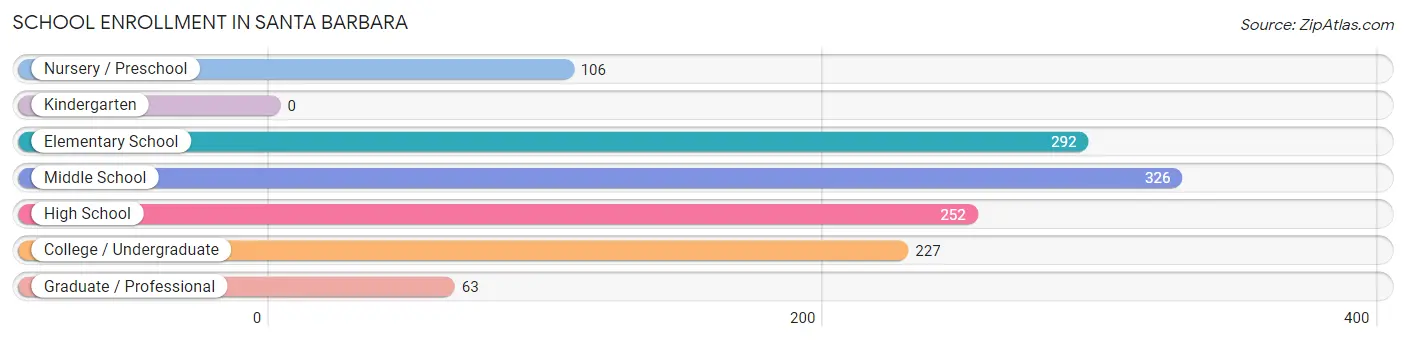
School Enrollment in Santa Barbara
The most common levels of schooling among the 1,266 students in Santa Barbara are middle school (326 | 25.8%), elementary school (292 | 23.1%), and high school (252 | 19.9%).
| School Level | # Students | % Students |
| Nursery / Preschool | 106 | 8.4% |
| Kindergarten | 0 | 0.0% |
| Elementary School | 292 | 23.1% |
| Middle School | 326 | 25.8% |
| High School | 252 | 19.9% |
| College / Undergraduate | 227 | 17.9% |
| Graduate / Professional | 63 | 5.0% |
| Total | 1,266 | 100.0% |
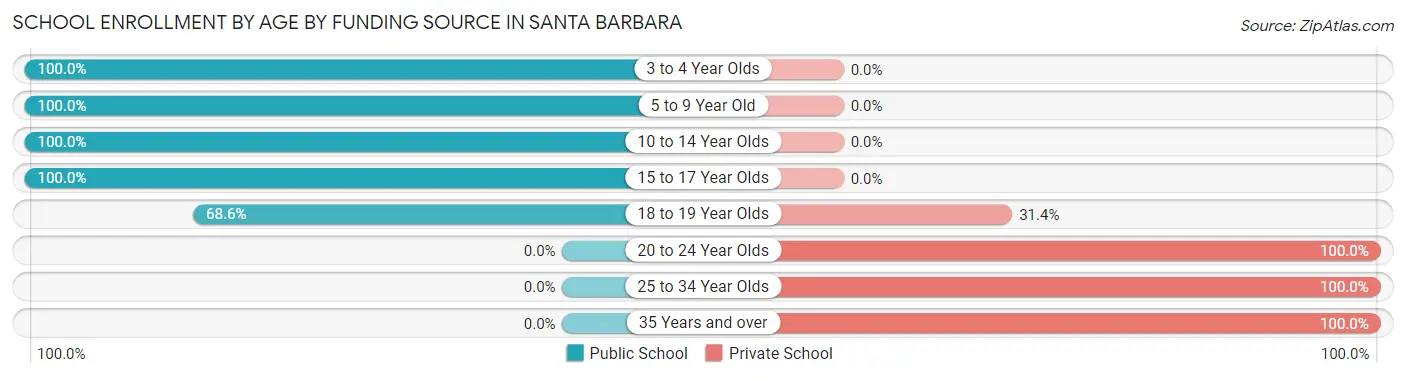
School Enrollment by Age by Funding Source in Santa Barbara
Out of a total of 1,266 students who are enrolled in schools in Santa Barbara, 252 (19.9%) attend a private institution, while the remaining 1,014 (80.1%) are enrolled in public schools. The age group of 20 to 24 year olds has the highest likelihood of being enrolled in private schools, with 27 (100.0% in the age bracket) enrolled. Conversely, the age group of 3 to 4 year olds has the lowest likelihood of being enrolled in a private school, with 106 (100.0% in the age bracket) attending a public institution.
| Age Bracket | Public School | Private School |
| 3 to 4 Year Olds | 106 (100.0%) | 0 (0.0%) |
| 5 to 9 Year Old | 193 (100.0%) | 0 (0.0%) |
| 10 to 14 Year Olds | 425 (100.0%) | 0 (0.0%) |
| 15 to 17 Year Olds | 207 (100.0%) | 0 (0.0%) |
| 18 to 19 Year Olds | 83 (68.6%) | 38 (31.4%) |
| 20 to 24 Year Olds | 0 (0.0%) | 27 (100.0%) |
| 25 to 34 Year Olds | 0 (0.0%) | 94 (100.0%) |
| 35 Years and over | 0 (0.0%) | 93 (100.0%) |
| Total | 1,014 (80.1%) | 252 (19.9%) |
Educational Attainment by Field of Study in Santa Barbara
Education (212 | 46.5%), business (65 | 14.2%), psychology (54 | 11.8%), communications (43 | 9.4%), and engineering (28 | 6.1%) are the most common fields of study among 456 individuals in Santa Barbara who have obtained a bachelor's degree or higher.
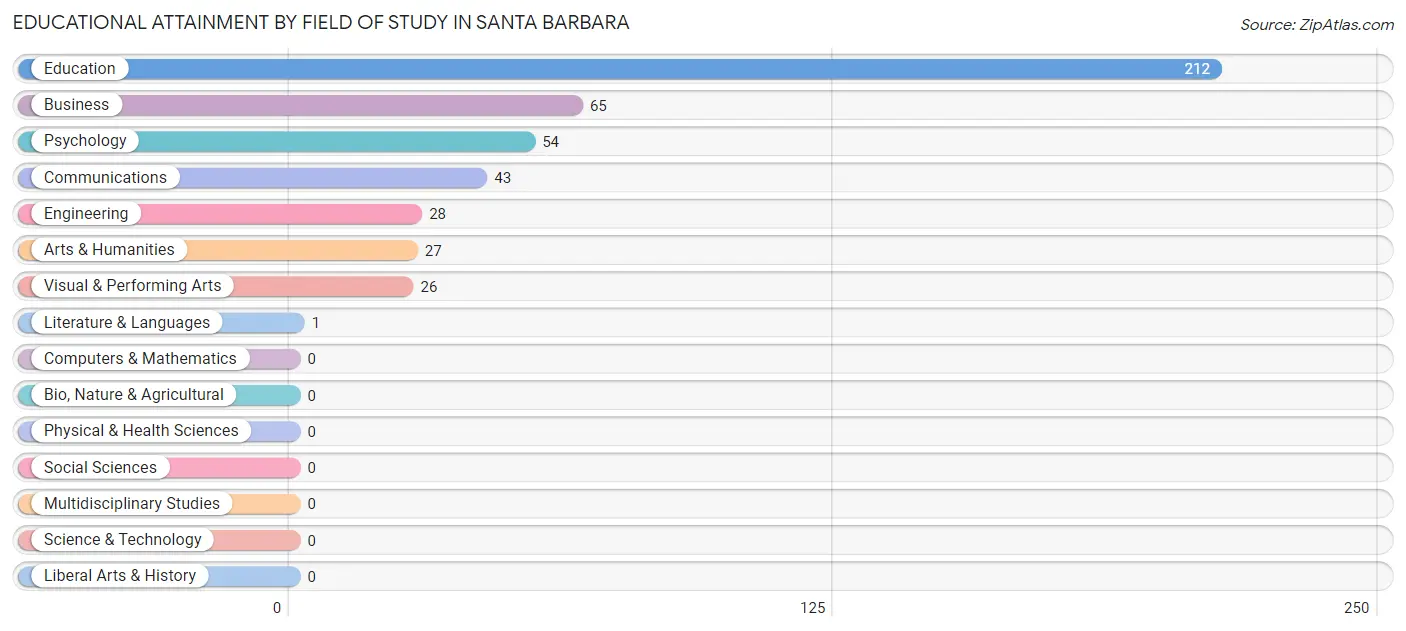
| Field of Study | # Graduates | % Graduates |
| Computers & Mathematics | 0 | 0.0% |
| Bio, Nature & Agricultural | 0 | 0.0% |
| Physical & Health Sciences | 0 | 0.0% |
| Psychology | 54 | 11.8% |
| Social Sciences | 0 | 0.0% |
| Engineering | 28 | 6.1% |
| Multidisciplinary Studies | 0 | 0.0% |
| Science & Technology | 0 | 0.0% |
| Business | 65 | 14.2% |
| Education | 212 | 46.5% |
| Literature & Languages | 1 | 0.2% |
| Liberal Arts & History | 0 | 0.0% |
| Visual & Performing Arts | 26 | 5.7% |
| Communications | 43 | 9.4% |
| Arts & Humanities | 27 | 5.9% |
| Total | 456 | 100.0% |
Transportation & Commute in Santa Barbara
Vehicle Availability by Sex in Santa Barbara
The most prevalent vehicle ownership categories in Santa Barbara are males with 3 vehicles (271, accounting for 39.2%) and females with 3 vehicles (310, making up 29.9%).
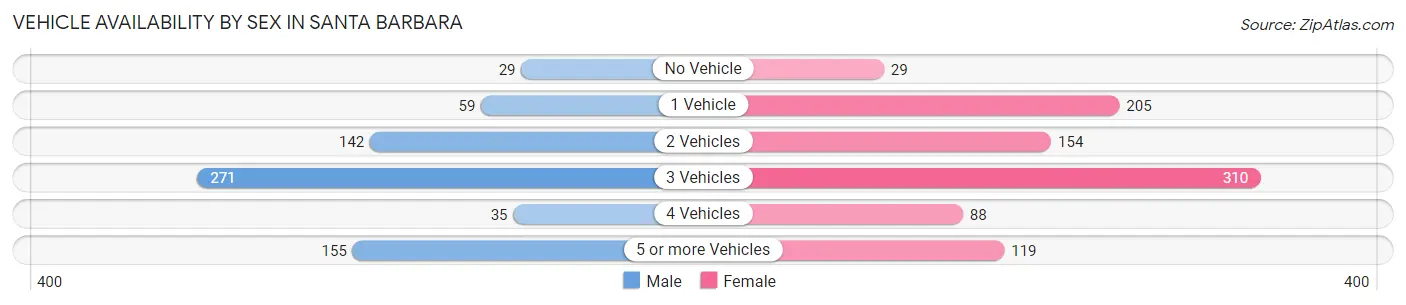
| Vehicles Available | Male | Female |
| No Vehicle | 29 (4.2%) | 29 (3.2%) |
| 1 Vehicle | 59 (8.5%) | 205 (22.7%) |
| 2 Vehicles | 142 (20.5%) | 154 (17.0%) |
| 3 Vehicles | 271 (39.2%) | 310 (34.3%) |
| 4 Vehicles | 35 (5.1%) | 88 (9.7%) |
| 5 or more Vehicles | 155 (22.4%) | 119 (13.2%) |
| Total | 691 (100.0%) | 905 (100.0%) |
Commute Time in Santa Barbara
The most frequently occuring commute durations in Santa Barbara are 30 to 34 minutes (443 commuters, 28.3%), 40 to 44 minutes (226 commuters, 14.4%), and 60 to 89 minutes (208 commuters, 13.3%).
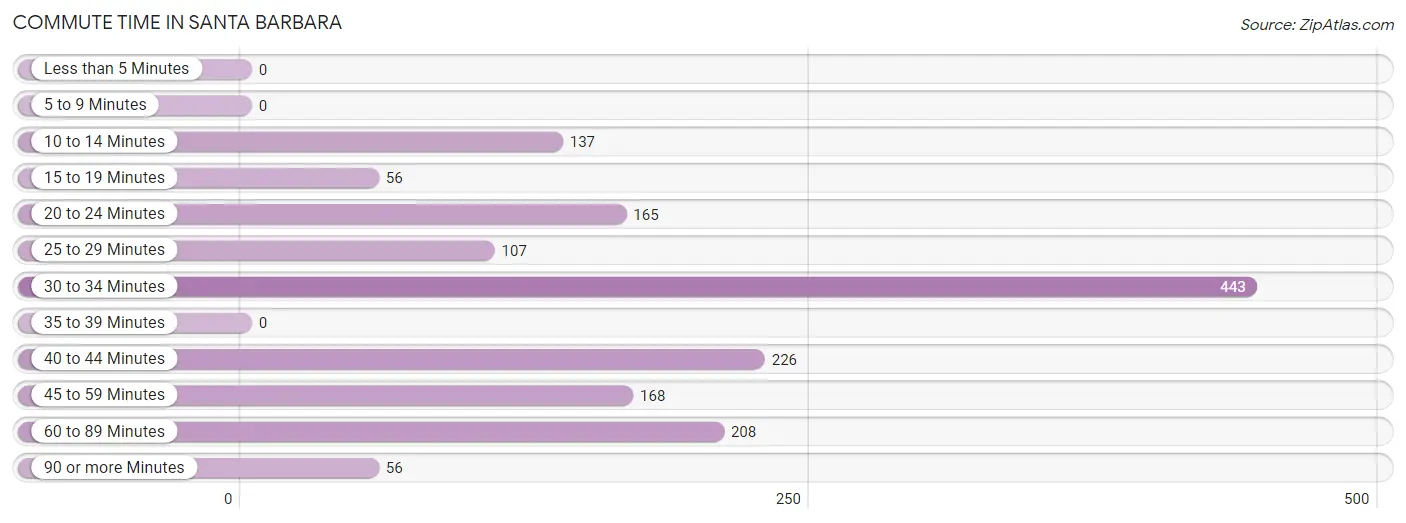
| Commute Time | # Commuters | % Commuters |
| Less than 5 Minutes | 0 | 0.0% |
| 5 to 9 Minutes | 0 | 0.0% |
| 10 to 14 Minutes | 137 | 8.7% |
| 15 to 19 Minutes | 56 | 3.6% |
| 20 to 24 Minutes | 165 | 10.5% |
| 25 to 29 Minutes | 107 | 6.8% |
| 30 to 34 Minutes | 443 | 28.3% |
| 35 to 39 Minutes | 0 | 0.0% |
| 40 to 44 Minutes | 226 | 14.4% |
| 45 to 59 Minutes | 168 | 10.7% |
| 60 to 89 Minutes | 208 | 13.3% |
| 90 or more Minutes | 56 | 3.6% |
Commute Time by Sex in Santa Barbara
The most common commute times in Santa Barbara are 30 to 34 minutes (275 commuters, 41.6%) for males and 30 to 34 minutes (168 commuters, 18.6%) for females.
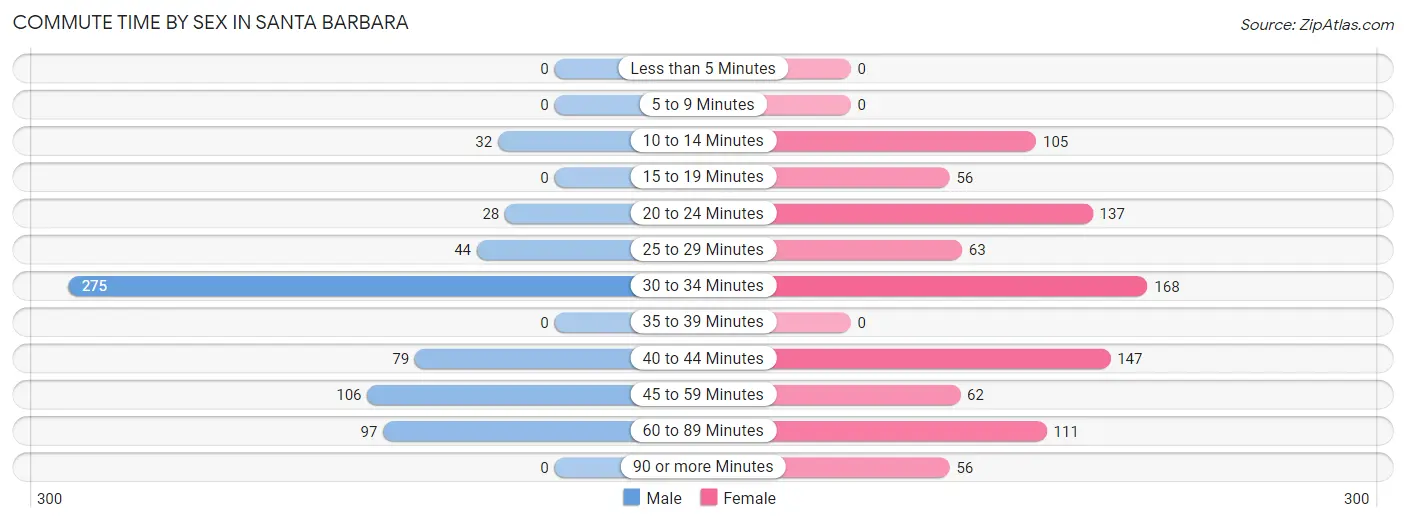
| Commute Time | Male | Female |
| Less than 5 Minutes | 0 (0.0%) | 0 (0.0%) |
| 5 to 9 Minutes | 0 (0.0%) | 0 (0.0%) |
| 10 to 14 Minutes | 32 (4.8%) | 105 (11.6%) |
| 15 to 19 Minutes | 0 (0.0%) | 56 (6.2%) |
| 20 to 24 Minutes | 28 (4.2%) | 137 (15.1%) |
| 25 to 29 Minutes | 44 (6.7%) | 63 (7.0%) |
| 30 to 34 Minutes | 275 (41.6%) | 168 (18.6%) |
| 35 to 39 Minutes | 0 (0.0%) | 0 (0.0%) |
| 40 to 44 Minutes | 79 (11.9%) | 147 (16.2%) |
| 45 to 59 Minutes | 106 (16.0%) | 62 (6.9%) |
| 60 to 89 Minutes | 97 (14.7%) | 111 (12.3%) |
| 90 or more Minutes | 0 (0.0%) | 56 (6.2%) |
Time of Departure to Work by Sex in Santa Barbara
The most frequent times of departure to work in Santa Barbara are 12:00 PM to 3:59 PM (143, 21.6%) for males and 6:30 AM to 6:59 AM (130, 14.4%) for females.
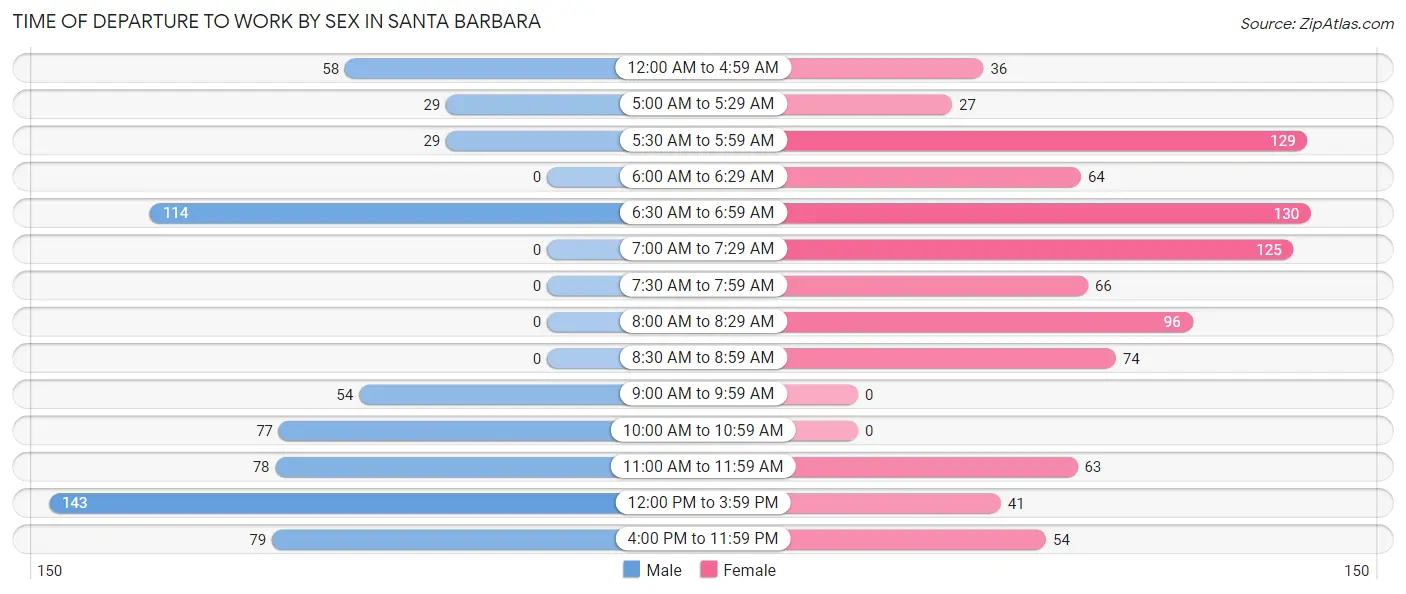
| Time of Departure | Male | Female |
| 12:00 AM to 4:59 AM | 58 (8.8%) | 36 (4.0%) |
| 5:00 AM to 5:29 AM | 29 (4.4%) | 27 (3.0%) |
| 5:30 AM to 5:59 AM | 29 (4.4%) | 129 (14.2%) |
| 6:00 AM to 6:29 AM | 0 (0.0%) | 64 (7.1%) |
| 6:30 AM to 6:59 AM | 114 (17.2%) | 130 (14.4%) |
| 7:00 AM to 7:29 AM | 0 (0.0%) | 125 (13.8%) |
| 7:30 AM to 7:59 AM | 0 (0.0%) | 66 (7.3%) |
| 8:00 AM to 8:29 AM | 0 (0.0%) | 96 (10.6%) |
| 8:30 AM to 8:59 AM | 0 (0.0%) | 74 (8.2%) |
| 9:00 AM to 9:59 AM | 54 (8.2%) | 0 (0.0%) |
| 10:00 AM to 10:59 AM | 77 (11.7%) | 0 (0.0%) |
| 11:00 AM to 11:59 AM | 78 (11.8%) | 63 (7.0%) |
| 12:00 PM to 3:59 PM | 143 (21.6%) | 41 (4.5%) |
| 4:00 PM to 11:59 PM | 79 (11.9%) | 54 (6.0%) |
| Total | 661 (100.0%) | 905 (100.0%) |
Housing Occupancy in Santa Barbara
Occupancy by Ownership in Santa Barbara
Of the total 1,353 dwellings in Santa Barbara, owner-occupied units account for 797 (58.9%), while renter-occupied units make up 556 (41.1%).
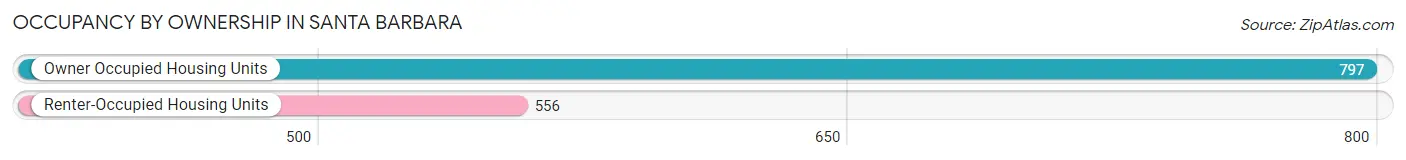
| Occupancy | # Housing Units | % Housing Units |
| Owner Occupied Housing Units | 797 | 58.9% |
| Renter-Occupied Housing Units | 556 | 41.1% |
| Total Occupied Housing Units | 1,353 | 100.0% |
Occupancy by Household Size in Santa Barbara
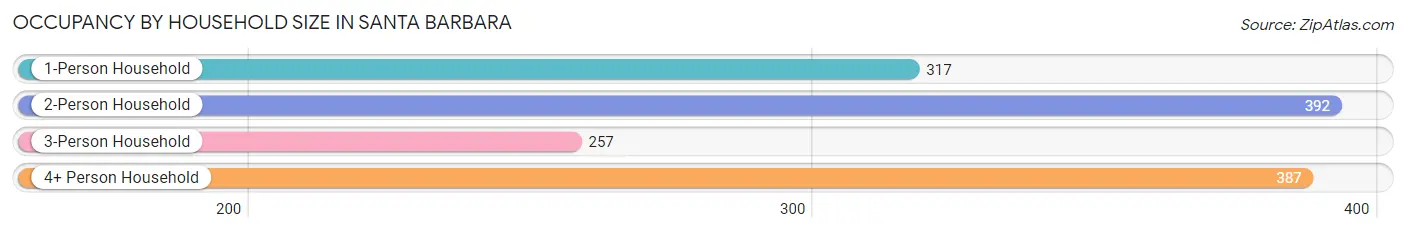
| Household Size | # Housing Units | % Housing Units |
| 1-Person Household | 317 | 23.4% |
| 2-Person Household | 392 | 29.0% |
| 3-Person Household | 257 | 19.0% |
| 4+ Person Household | 387 | 28.6% |
| Total Housing Units | 1,353 | 100.0% |
Occupancy by Ownership by Household Size in Santa Barbara
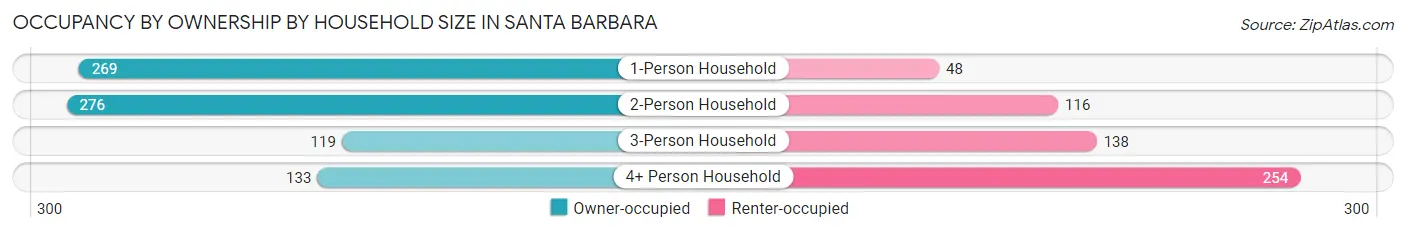
| Household Size | Owner-occupied | Renter-occupied |
| 1-Person Household | 269 (84.9%) | 48 (15.1%) |
| 2-Person Household | 276 (70.4%) | 116 (29.6%) |
| 3-Person Household | 119 (46.3%) | 138 (53.7%) |
| 4+ Person Household | 133 (34.4%) | 254 (65.6%) |
| Total Housing Units | 797 (58.9%) | 556 (41.1%) |
Occupancy by Educational Attainment in Santa Barbara
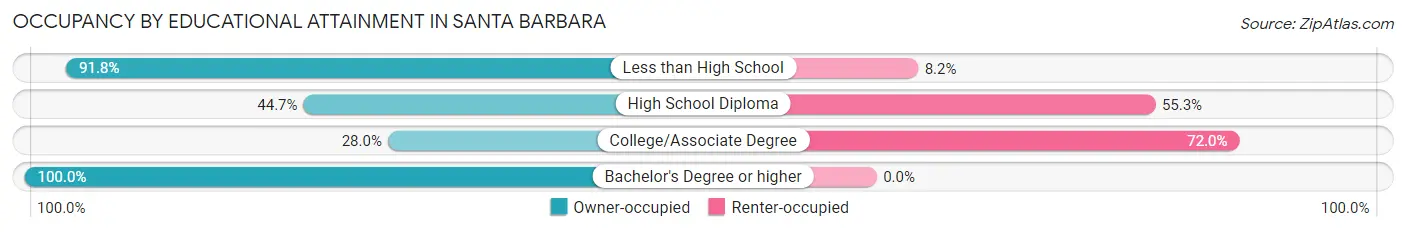
| Household Size | Owner-occupied | Renter-occupied |
| Less than High School | 368 (91.8%) | 33 (8.2%) |
| High School Diploma | 263 (44.7%) | 325 (55.3%) |
| College/Associate Degree | 77 (28.0%) | 198 (72.0%) |
| Bachelor's Degree or higher | 89 (100.0%) | 0 (0.0%) |
Occupancy by Age of Householder in Santa Barbara
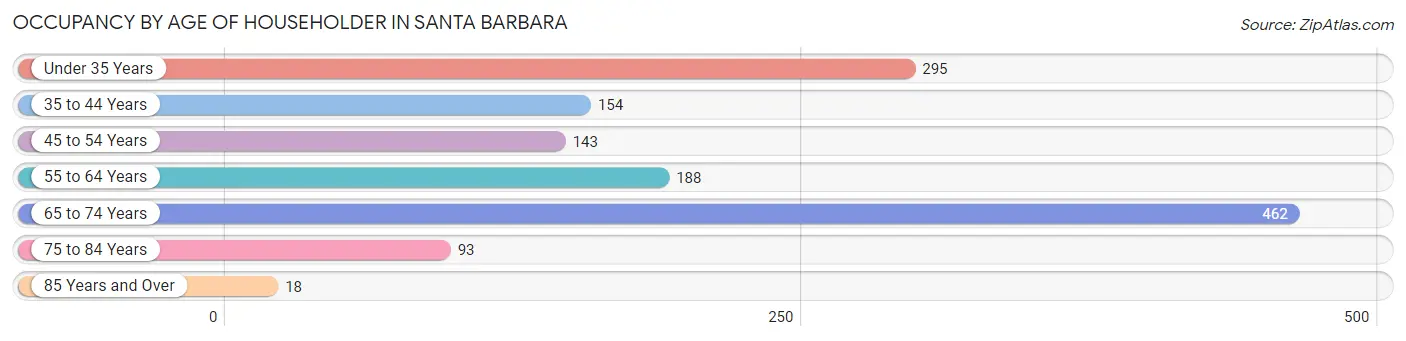
| Age Bracket | # Households | % Households |
| Under 35 Years | 295 | 21.8% |
| 35 to 44 Years | 154 | 11.4% |
| 45 to 54 Years | 143 | 10.6% |
| 55 to 64 Years | 188 | 13.9% |
| 65 to 74 Years | 462 | 34.2% |
| 75 to 84 Years | 93 | 6.9% |
| 85 Years and Over | 18 | 1.3% |
| Total | 1,353 | 100.0% |
Housing Finances in Santa Barbara
Median Income by Occupancy in Santa Barbara
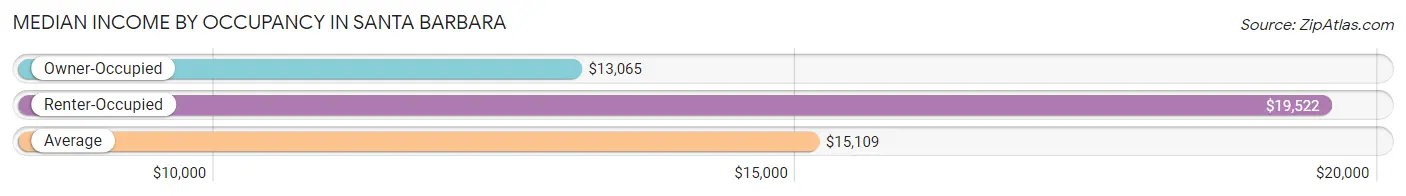
| Occupancy Type | # Households | Median Income |
| Owner-Occupied | 797 (58.9%) | $13,065 |
| Renter-Occupied | 556 (41.1%) | $19,522 |
| Average | 1,353 (100.0%) | $15,109 |
Occupancy by Householder Income Bracket in Santa Barbara
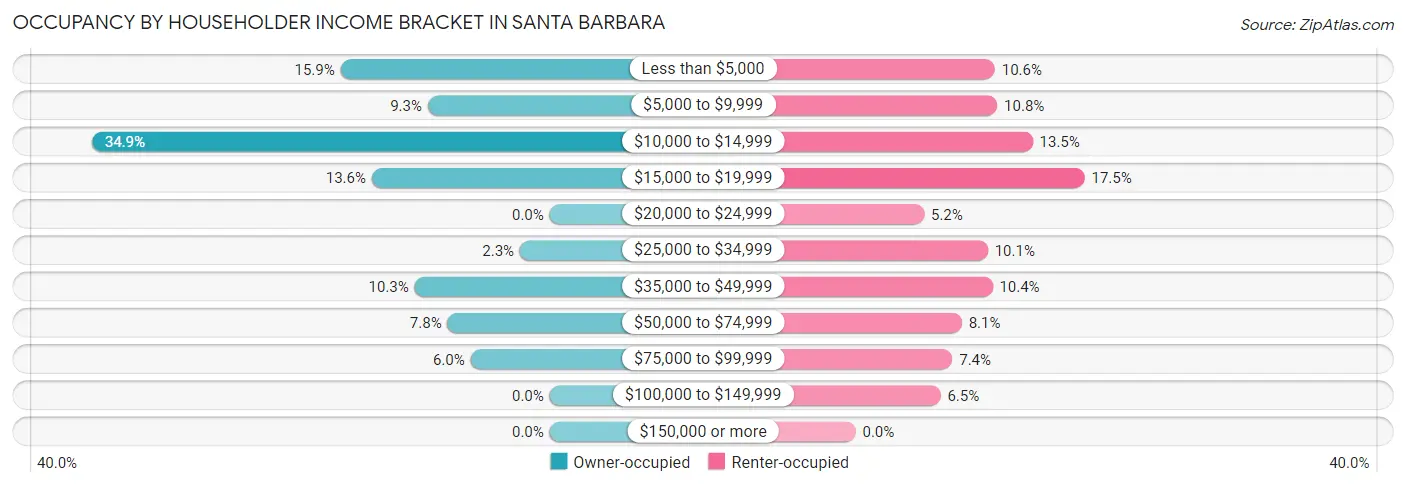
| Income Bracket | Owner-occupied | Renter-occupied |
| Less than $5,000 | 127 (15.9%) | 59 (10.6%) |
| $5,000 to $9,999 | 74 (9.3%) | 60 (10.8%) |
| $10,000 to $14,999 | 278 (34.9%) | 75 (13.5%) |
| $15,000 to $19,999 | 108 (13.6%) | 97 (17.4%) |
| $20,000 to $24,999 | 0 (0.0%) | 29 (5.2%) |
| $25,000 to $34,999 | 18 (2.3%) | 56 (10.1%) |
| $35,000 to $49,999 | 82 (10.3%) | 58 (10.4%) |
| $50,000 to $74,999 | 62 (7.8%) | 45 (8.1%) |
| $75,000 to $99,999 | 48 (6.0%) | 41 (7.4%) |
| $100,000 to $149,999 | 0 (0.0%) | 36 (6.5%) |
| $150,000 or more | 0 (0.0%) | 0 (0.0%) |
| Total | 797 (100.0%) | 556 (100.0%) |
Monthly Housing Cost Tiers in Santa Barbara
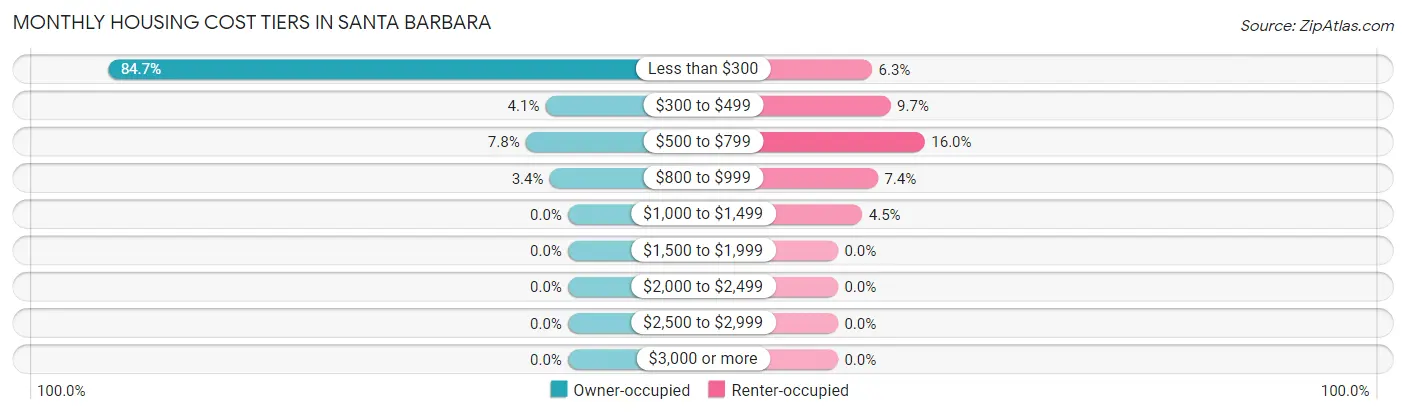
| Monthly Cost | Owner-occupied | Renter-occupied |
| Less than $300 | 675 (84.7%) | 35 (6.3%) |
| $300 to $499 | 33 (4.1%) | 54 (9.7%) |
| $500 to $799 | 62 (7.8%) | 89 (16.0%) |
| $800 to $999 | 27 (3.4%) | 41 (7.4%) |
| $1,000 to $1,499 | 0 (0.0%) | 25 (4.5%) |
| $1,500 to $1,999 | 0 (0.0%) | 0 (0.0%) |
| $2,000 to $2,499 | 0 (0.0%) | 0 (0.0%) |
| $2,500 to $2,999 | 0 (0.0%) | 0 (0.0%) |
| $3,000 or more | 0 (0.0%) | 0 (0.0%) |
| Total | 797 (100.0%) | 556 (100.0%) |
Physical Housing Characteristics in Santa Barbara
Housing Structures in Santa Barbara
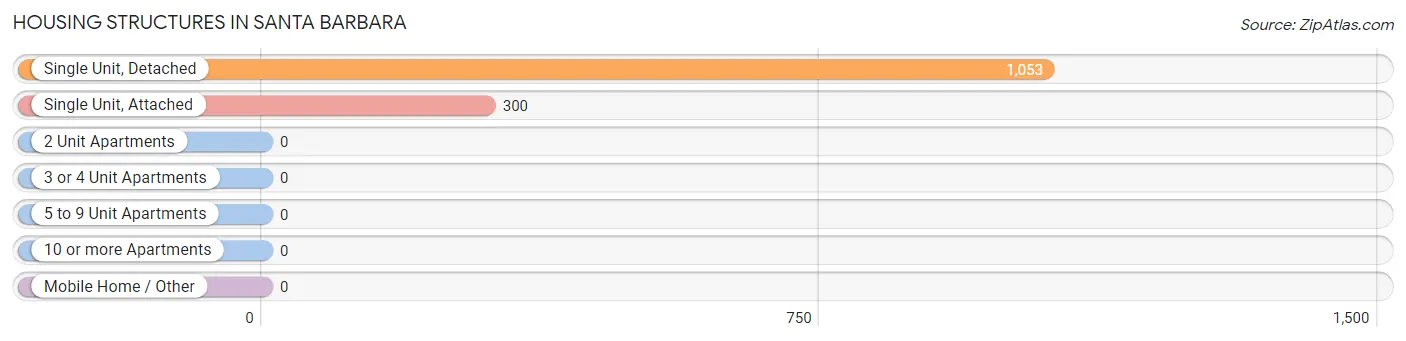
| Structure Type | # Housing Units | % Housing Units |
| Single Unit, Detached | 1,053 | 77.8% |
| Single Unit, Attached | 300 | 22.2% |
| 2 Unit Apartments | 0 | 0.0% |
| 3 or 4 Unit Apartments | 0 | 0.0% |
| 5 to 9 Unit Apartments | 0 | 0.0% |
| 10 or more Apartments | 0 | 0.0% |
| Mobile Home / Other | 0 | 0.0% |
| Total | 1,353 | 100.0% |
Housing Structures by Occupancy in Santa Barbara
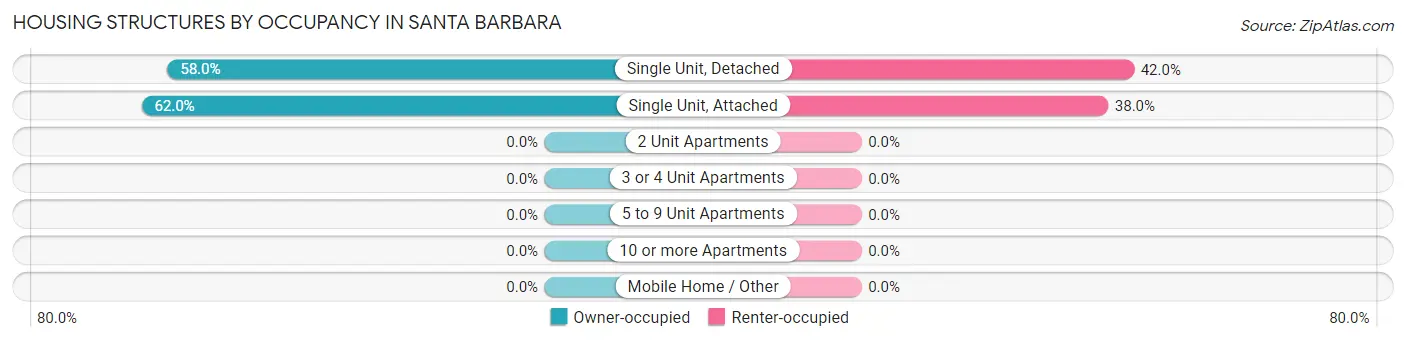
| Structure Type | Owner-occupied | Renter-occupied |
| Single Unit, Detached | 611 (58.0%) | 442 (42.0%) |
| Single Unit, Attached | 186 (62.0%) | 114 (38.0%) |
| 2 Unit Apartments | 0 (0.0%) | 0 (0.0%) |
| 3 or 4 Unit Apartments | 0 (0.0%) | 0 (0.0%) |
| 5 to 9 Unit Apartments | 0 (0.0%) | 0 (0.0%) |
| 10 or more Apartments | 0 (0.0%) | 0 (0.0%) |
| Mobile Home / Other | 0 (0.0%) | 0 (0.0%) |
| Total | 797 (58.9%) | 556 (41.1%) |
Housing Structures by Number of Rooms in Santa Barbara
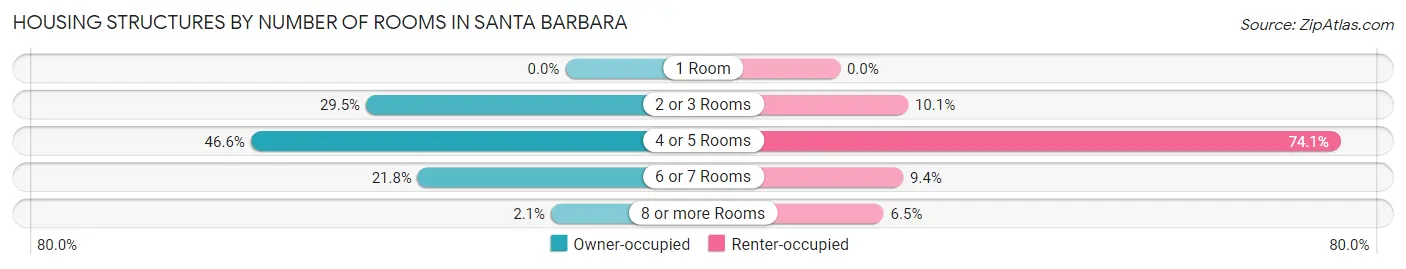
| Number of Rooms | Owner-occupied | Renter-occupied |
| 1 Room | 0 (0.0%) | 0 (0.0%) |
| 2 or 3 Rooms | 235 (29.5%) | 56 (10.1%) |
| 4 or 5 Rooms | 371 (46.6%) | 412 (74.1%) |
| 6 or 7 Rooms | 174 (21.8%) | 52 (9.3%) |
| 8 or more Rooms | 17 (2.1%) | 36 (6.5%) |
| Total | 797 (100.0%) | 556 (100.0%) |
Housing Structure by Heating Type in Santa Barbara
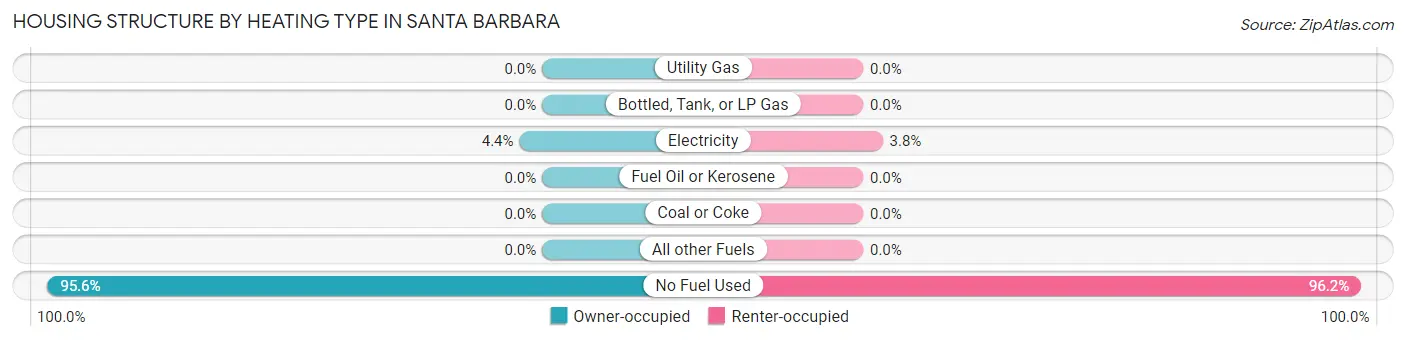
| Heating Type | Owner-occupied | Renter-occupied |
| Utility Gas | 0 (0.0%) | 0 (0.0%) |
| Bottled, Tank, or LP Gas | 0 (0.0%) | 0 (0.0%) |
| Electricity | 35 (4.4%) | 21 (3.8%) |
| Fuel Oil or Kerosene | 0 (0.0%) | 0 (0.0%) |
| Coal or Coke | 0 (0.0%) | 0 (0.0%) |
| All other Fuels | 0 (0.0%) | 0 (0.0%) |
| No Fuel Used | 762 (95.6%) | 535 (96.2%) |
| Total | 797 (100.0%) | 556 (100.0%) |
Household Vehicle Usage in Santa Barbara
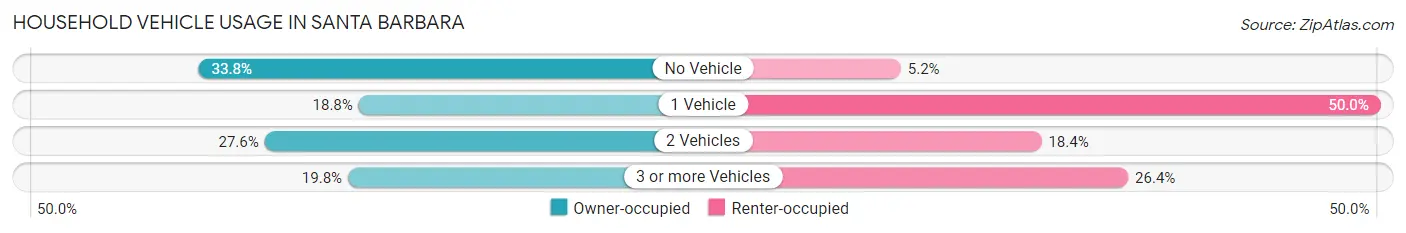
| Vehicles per Household | Owner-occupied | Renter-occupied |
| No Vehicle | 269 (33.8%) | 29 (5.2%) |
| 1 Vehicle | 150 (18.8%) | 278 (50.0%) |
| 2 Vehicles | 220 (27.6%) | 102 (18.3%) |
| 3 or more Vehicles | 158 (19.8%) | 147 (26.4%) |
| Total | 797 (100.0%) | 556 (100.0%) |
Real Estate & Mortgages in Santa Barbara
Real Estate and Mortgage Overview in Santa Barbara
| Characteristic | Without Mortgage | With Mortgage |
| Housing Units | 708 | 89 |
| Median Property Value | $100,900 | $82,500 |
| Median Household Income | $12,198 | $0 |
| Monthly Housing Costs | $132 | $0 |
| Real Estate Taxes | - | - |
Property Value by Mortgage Status in Santa Barbara
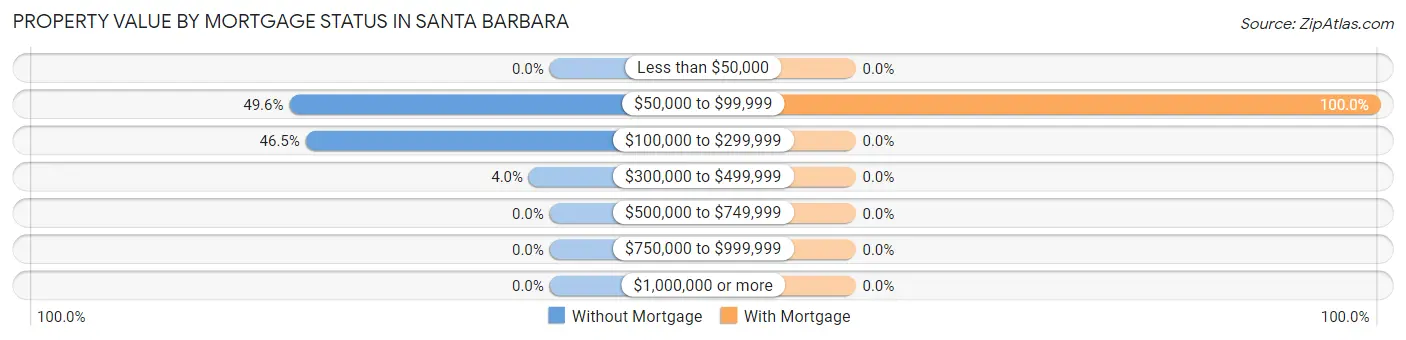
| Property Value | Without Mortgage | With Mortgage |
| Less than $50,000 | 0 (0.0%) | 0 (0.0%) |
| $50,000 to $99,999 | 351 (49.6%) | 89 (100.0%) |
| $100,000 to $299,999 | 329 (46.5%) | 0 (0.0%) |
| $300,000 to $499,999 | 28 (4.0%) | 0 (0.0%) |
| $500,000 to $749,999 | 0 (0.0%) | 0 (0.0%) |
| $750,000 to $999,999 | 0 (0.0%) | 0 (0.0%) |
| $1,000,000 or more | 0 (0.0%) | 0 (0.0%) |
| Total | 708 (100.0%) | 89 (100.0%) |
Household Income by Mortgage Status in Santa Barbara
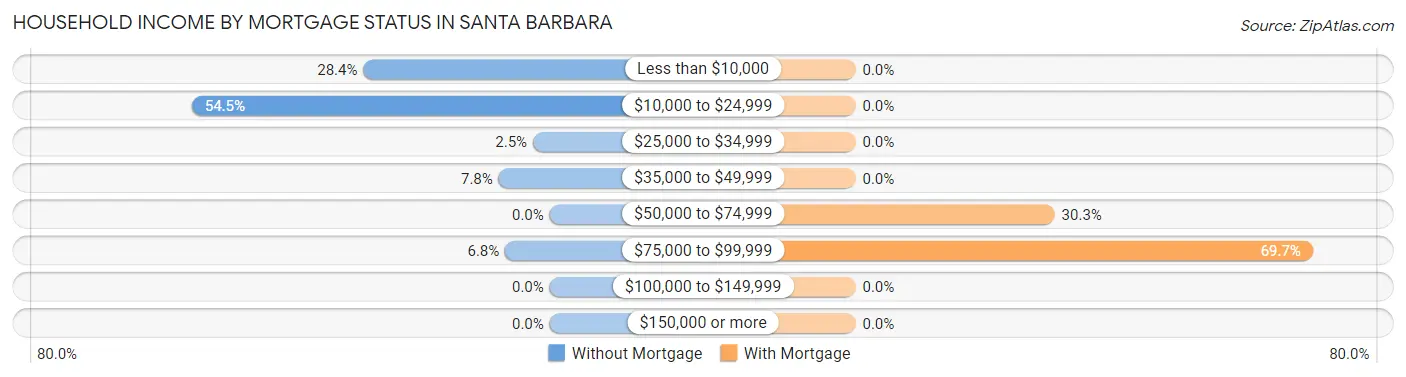
| Household Income | Without Mortgage | With Mortgage |
| Less than $10,000 | 201 (28.4%) | 0 (0.0%) |
| $10,000 to $24,999 | 386 (54.5%) | 0 (0.0%) |
| $25,000 to $34,999 | 18 (2.5%) | 0 (0.0%) |
| $35,000 to $49,999 | 55 (7.8%) | 0 (0.0%) |
| $50,000 to $74,999 | 0 (0.0%) | 27 (30.3%) |
| $75,000 to $99,999 | 48 (6.8%) | 62 (69.7%) |
| $100,000 to $149,999 | 0 (0.0%) | 0 (0.0%) |
| $150,000 or more | 0 (0.0%) | 0 (0.0%) |
| Total | 708 (100.0%) | 89 (100.0%) |
Property Value to Household Income Ratio in Santa Barbara
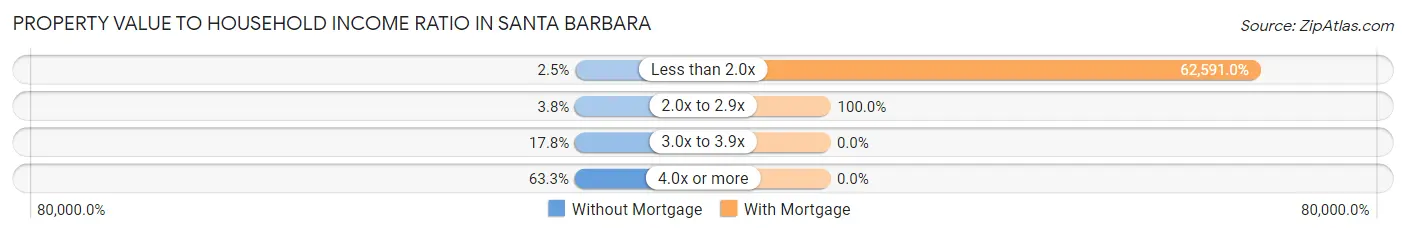
| Value-to-Income Ratio | Without Mortgage | With Mortgage |
| Less than 2.0x | 18 (2.5%) | 55,706 (62,591.0%) |
| 2.0x to 2.9x | 27 (3.8%) | 89 (100.0%) |
| 3.0x to 3.9x | 126 (17.8%) | 0 (0.0%) |
| 4.0x or more | 448 (63.3%) | 0 (0.0%) |
| Total | 708 (100.0%) | 89 (100.0%) |
Real Estate Taxes by Mortgage Status in Santa Barbara
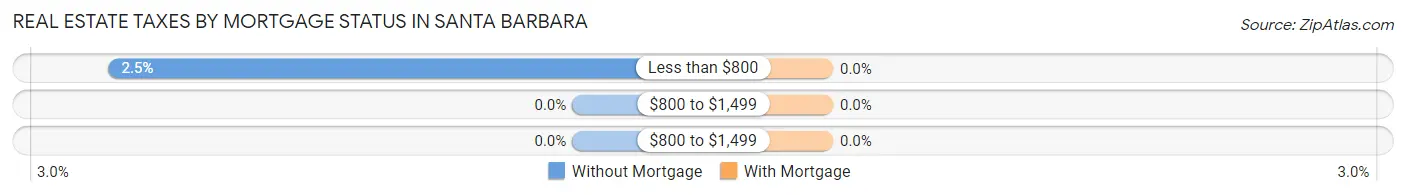
| Property Taxes | Without Mortgage | With Mortgage |
| Less than $800 | 18 (2.5%) | 0 (0.0%) |
| $800 to $1,499 | 0 (0.0%) | 0 (0.0%) |
| $800 to $1,499 | 0 (0.0%) | 0 (0.0%) |
| Total | 708 (100.0%) | 89 (100.0%) |
Health & Disability in Santa Barbara
Health Insurance Coverage by Age in Santa Barbara
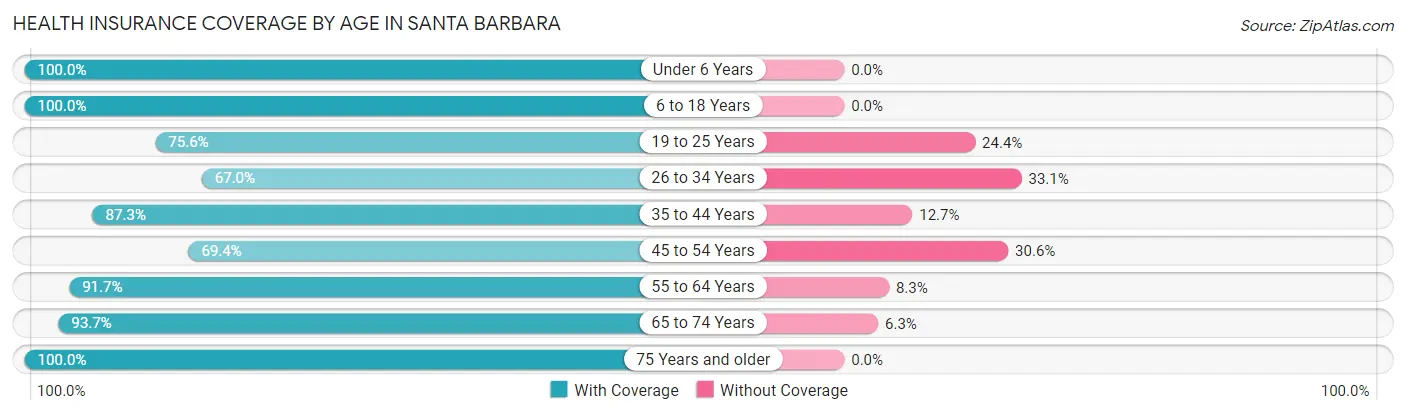
| Age Bracket | With Coverage | Without Coverage |
| Under 6 Years | 179 (100.0%) | 0 (0.0%) |
| 6 to 18 Years | 909 (100.0%) | 0 (0.0%) |
| 19 to 25 Years | 344 (75.6%) | 111 (24.4%) |
| 26 to 34 Years | 466 (66.9%) | 230 (33.1%) |
| 35 to 44 Years | 372 (87.3%) | 54 (12.7%) |
| 45 to 54 Years | 418 (69.4%) | 184 (30.6%) |
| 55 to 64 Years | 352 (91.7%) | 32 (8.3%) |
| 65 to 74 Years | 490 (93.7%) | 33 (6.3%) |
| 75 Years and older | 185 (100.0%) | 0 (0.0%) |
| Total | 3,715 (85.2%) | 644 (14.8%) |
Health Insurance Coverage by Citizenship Status in Santa Barbara
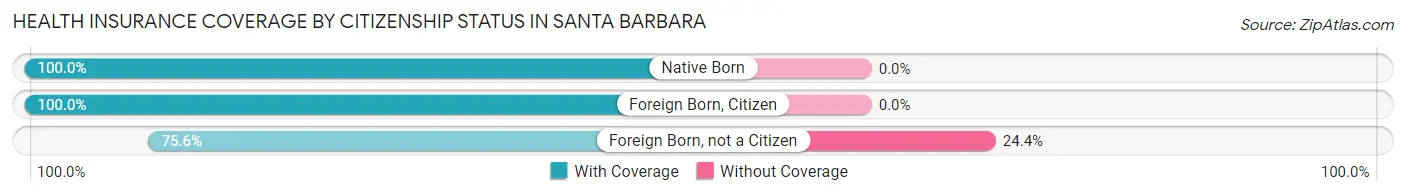
| Citizenship Status | With Coverage | Without Coverage |
| Native Born | 179 (100.0%) | 0 (0.0%) |
| Foreign Born, Citizen | 909 (100.0%) | 0 (0.0%) |
| Foreign Born, not a Citizen | 344 (75.6%) | 111 (24.4%) |
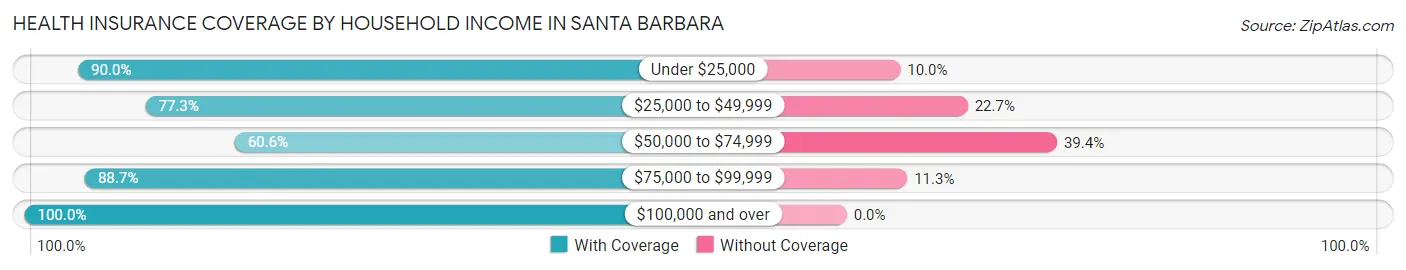
Health Insurance Coverage by Household Income in Santa Barbara
| Household Income | With Coverage | Without Coverage |
| Under $25,000 | 2,045 (90.0%) | 228 (10.0%) |
| $25,000 to $49,999 | 495 (77.3%) | 145 (22.7%) |
| $50,000 to $74,999 | 331 (60.6%) | 215 (39.4%) |
| $75,000 to $99,999 | 423 (88.7%) | 54 (11.3%) |
| $100,000 and over | 406 (100.0%) | 0 (0.0%) |
Public vs Private Health Insurance Coverage by Age in Santa Barbara
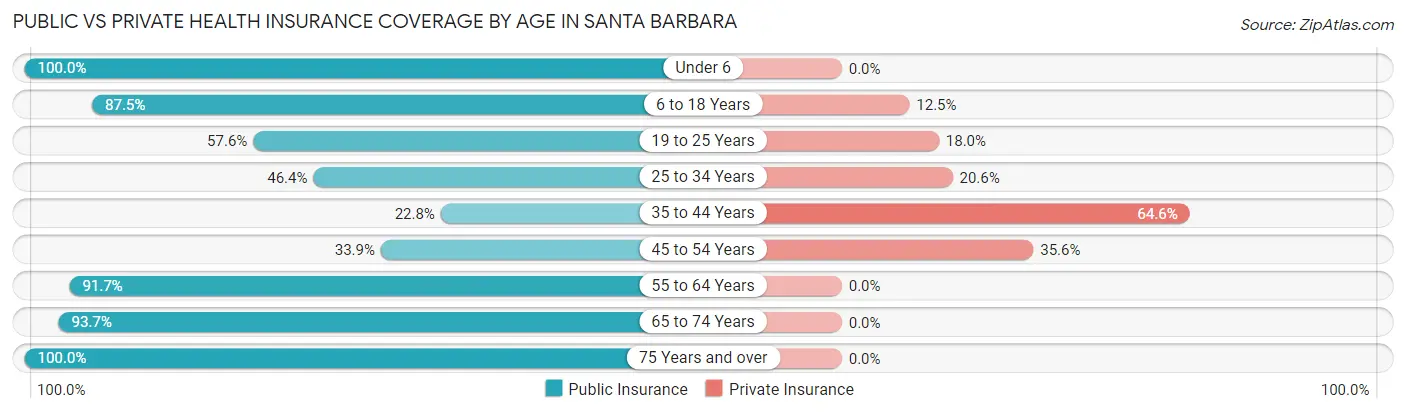
| Age Bracket | Public Insurance | Private Insurance |
| Under 6 | 179 (100.0%) | 0 (0.0%) |
| 6 to 18 Years | 795 (87.5%) | 114 (12.5%) |
| 19 to 25 Years | 262 (57.6%) | 82 (18.0%) |
| 25 to 34 Years | 323 (46.4%) | 143 (20.5%) |
| 35 to 44 Years | 97 (22.8%) | 275 (64.5%) |
| 45 to 54 Years | 204 (33.9%) | 214 (35.5%) |
| 55 to 64 Years | 352 (91.7%) | 0 (0.0%) |
| 65 to 74 Years | 490 (93.7%) | 0 (0.0%) |
| 75 Years and over | 185 (100.0%) | 0 (0.0%) |
| Total | 2,887 (66.2%) | 828 (19.0%) |
Disability Status by Sex by Age in Santa Barbara
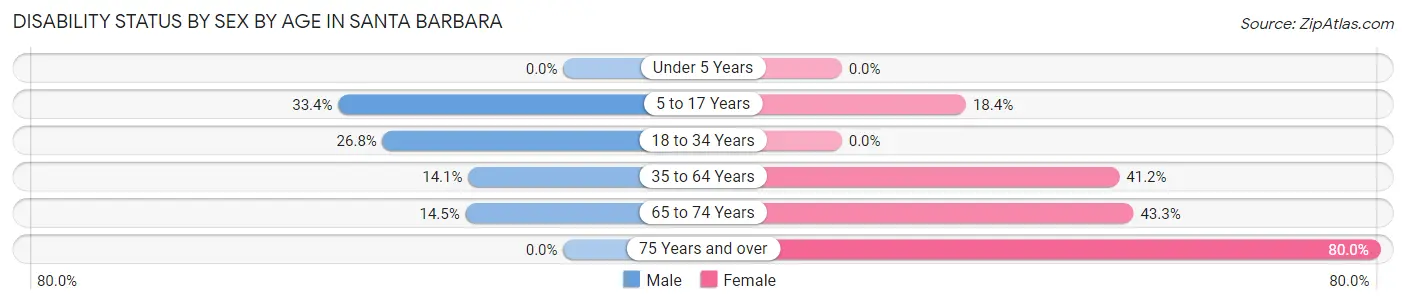
| Age Bracket | Male | Female |
| Under 5 Years | 0 (0.0%) | 0 (0.0%) |
| 5 to 17 Years | 122 (33.4%) | 92 (18.4%) |
| 18 to 34 Years | 165 (26.8%) | 0 (0.0%) |
| 35 to 64 Years | 61 (14.1%) | 404 (41.2%) |
| 65 to 74 Years | 26 (14.5%) | 149 (43.3%) |
| 75 Years and over | 0 (0.0%) | 60 (80.0%) |
Disability Class by Sex by Age in Santa Barbara
Disability Class: Hearing Difficulty
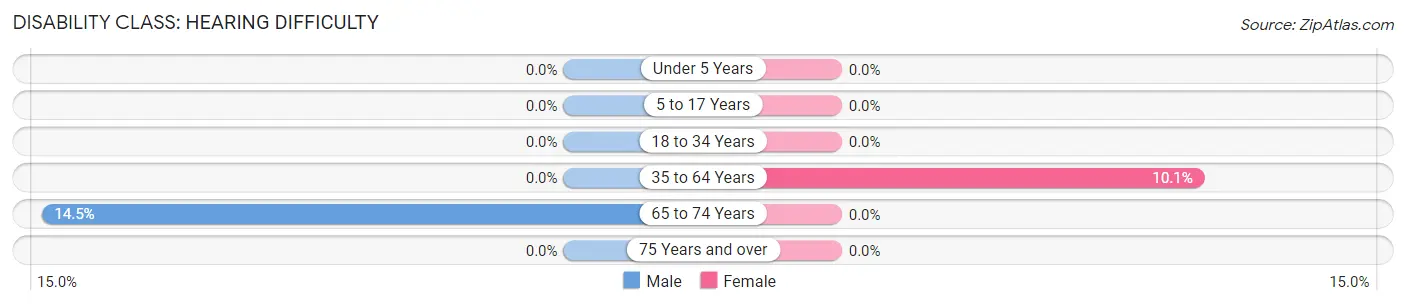
| Age Bracket | Male | Female |
| Under 5 Years | 0 (0.0%) | 0 (0.0%) |
| 5 to 17 Years | 0 (0.0%) | 0 (0.0%) |
| 18 to 34 Years | 0 (0.0%) | 0 (0.0%) |
| 35 to 64 Years | 0 (0.0%) | 99 (10.1%) |
| 65 to 74 Years | 26 (14.5%) | 0 (0.0%) |
| 75 Years and over | 0 (0.0%) | 0 (0.0%) |
Disability Class: Vision Difficulty
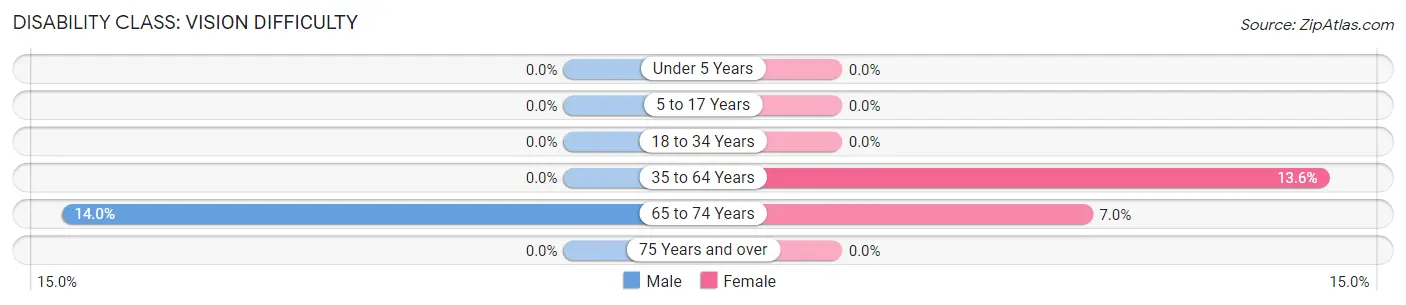
| Age Bracket | Male | Female |
| Under 5 Years | 0 (0.0%) | 0 (0.0%) |
| 5 to 17 Years | 0 (0.0%) | 0 (0.0%) |
| 18 to 34 Years | 0 (0.0%) | 0 (0.0%) |
| 35 to 64 Years | 0 (0.0%) | 133 (13.6%) |
| 65 to 74 Years | 25 (14.0%) | 24 (7.0%) |
| 75 Years and over | 0 (0.0%) | 0 (0.0%) |
Disability Class: Cognitive Difficulty
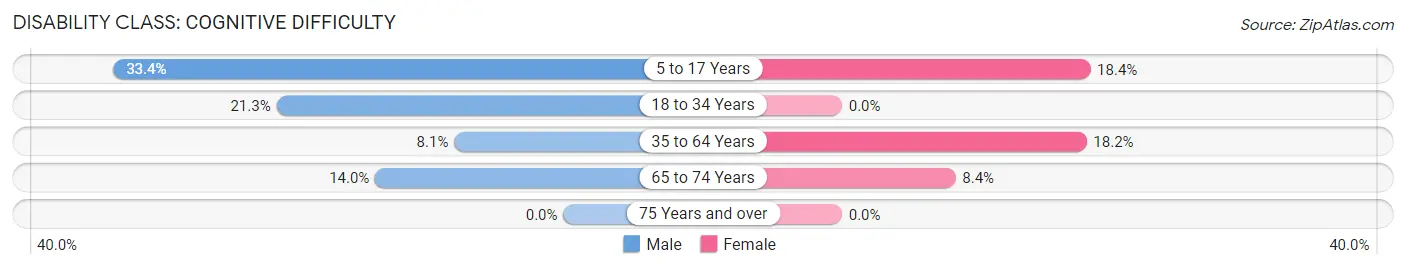
| Age Bracket | Male | Female |
| 5 to 17 Years | 122 (33.4%) | 92 (18.4%) |
| 18 to 34 Years | 131 (21.3%) | 0 (0.0%) |
| 35 to 64 Years | 35 (8.1%) | 178 (18.2%) |
| 65 to 74 Years | 25 (14.0%) | 29 (8.4%) |
| 75 Years and over | 0 (0.0%) | 0 (0.0%) |
Disability Class: Ambulatory Difficulty
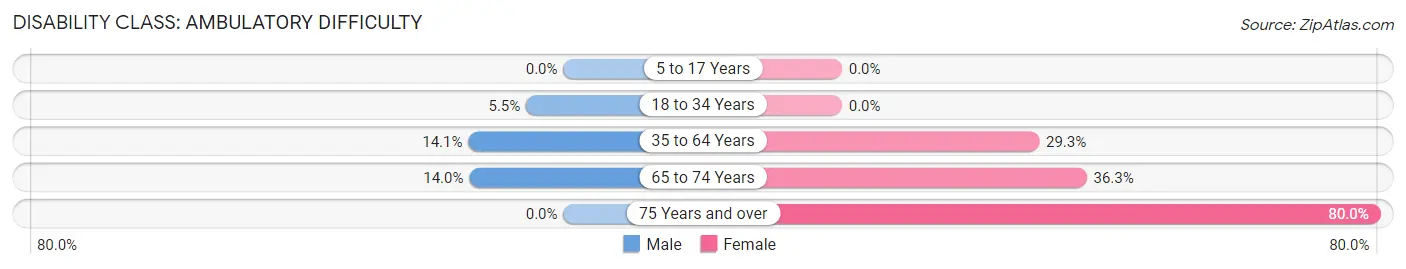
| Age Bracket | Male | Female |
| 5 to 17 Years | 0 (0.0%) | 0 (0.0%) |
| 18 to 34 Years | 34 (5.5%) | 0 (0.0%) |
| 35 to 64 Years | 61 (14.1%) | 287 (29.3%) |
| 65 to 74 Years | 25 (14.0%) | 125 (36.3%) |
| 75 Years and over | 0 (0.0%) | 60 (80.0%) |
Disability Class: Self-Care Difficulty
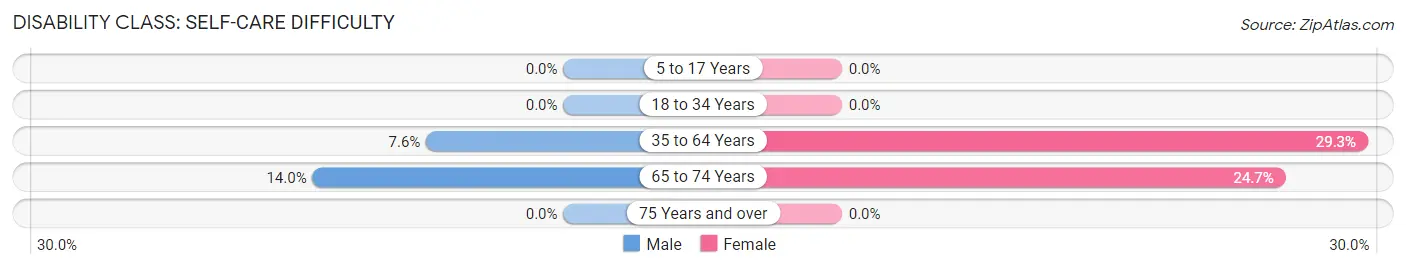
| Age Bracket | Male | Female |
| 5 to 17 Years | 0 (0.0%) | 0 (0.0%) |
| 18 to 34 Years | 0 (0.0%) | 0 (0.0%) |
| 35 to 64 Years | 33 (7.6%) | 287 (29.3%) |
| 65 to 74 Years | 25 (14.0%) | 85 (24.7%) |
| 75 Years and over | 0 (0.0%) | 0 (0.0%) |
Technology Access in Santa Barbara
Computing Device Access in Santa Barbara
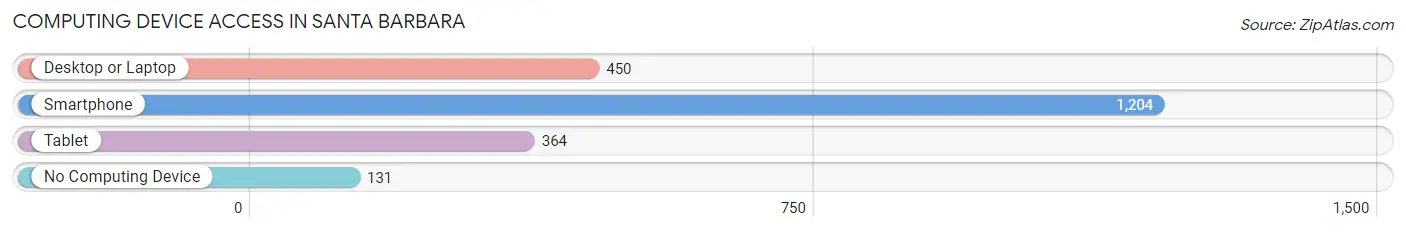
| Device Type | # Households | % Households |
| Desktop or Laptop | 450 | 33.3% |
| Smartphone | 1,204 | 89.0% |
| Tablet | 364 | 26.9% |
| No Computing Device | 131 | 9.7% |
| Total | 1,353 | 100.0% |
Internet Access in Santa Barbara
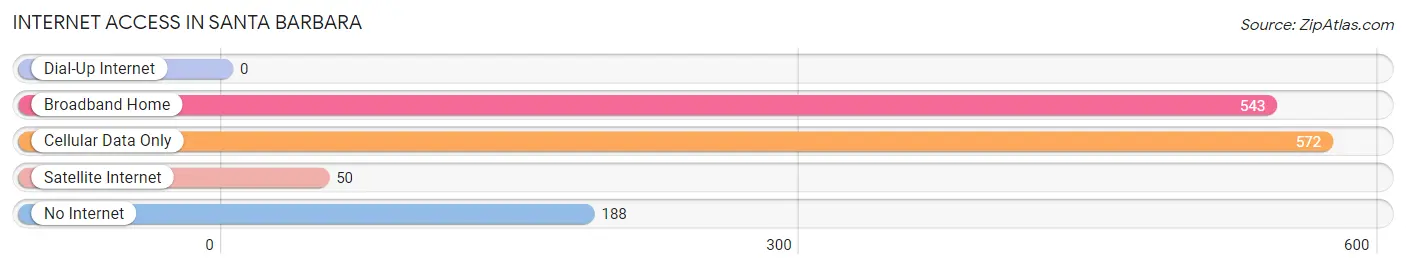
| Internet Type | # Households | % Households |
| Dial-Up Internet | 0 | 0.0% |
| Broadband Home | 543 | 40.1% |
| Cellular Data Only | 572 | 42.3% |
| Satellite Internet | 50 | 3.7% |
| No Internet | 188 | 13.9% |
| Total | 1,353 | 100.0% |
Santa Barbara Summary
Santa Barbara is a municipality located in the northern coast of Puerto Rico, in the northern region of the island, bordering the Atlantic Ocean, north of San Sebastián, east of Las Marías, and west of Moca. It is part of the San Juan-Caguas-Guaynabo Metropolitan Statistical Area.
History
The area of Santa Barbara was originally inhabited by the Taíno Indians, who called the area “Yucayo”. The first Spanish settlers arrived in the area in the early 16th century, and the area was officially founded in 1733. The town was named after Saint Barbara, the patron saint of artillerymen.
In the 19th century, the town was a major producer of coffee, and the economy was largely based on agriculture. The town was also known for its production of sugar cane, tobacco, and other crops.
In the 20th century, the economy shifted to manufacturing, and the town became a major center for the production of textiles, clothing, and other goods.
Geography
Santa Barbara is located in the northern coast of Puerto Rico, in the northern region of the island. It is bordered by the Atlantic Ocean to the north, San Sebastián to the south, Las Marías to the east, and Moca to the west.
The town has a total area of 11.2 square miles, and is located at an elevation of 1,000 feet above sea level. The terrain is mostly flat, with some hills in the northern part of the town.
The climate is tropical, with temperatures ranging from the mid-70s to the mid-80s. The average annual rainfall is around 50 inches.
Economy
The economy of Santa Barbara is largely based on manufacturing and services. The town is home to several factories that produce textiles, clothing, and other goods.
The town also has a thriving tourism industry with several hotels and resorts located in the area
Demographics
As of the 2010 census, Santa Barbara had a population of 24,845. The population is mostly of Puerto Rican descent, with a small percentage of other ethnicities.
The median household income in the town is $20,845, and the median age is 37. The unemployment rate is 8.3%.
The town has a high rate of poverty, with 28.3% of the population living below the poverty line. The town also has a high rate of crime, with a violent crime rate of 8.3 per 1,000 residents.
Common Questions
What is Per Capita Income in Santa Barbara?
Per Capita income in Santa Barbara is $10,792.
What is the Median Family Income in Santa Barbara?
Median Family Income in Santa Barbara is $16,768.
What is the Median Household income in Santa Barbara?
Median Household Income in Santa Barbara is $15,109.
What is Income or Wage Gap in Santa Barbara?
Income or Wage Gap in Santa Barbara is 17.7%.
Women in Santa Barbara earn 82.3 cents for every dollar earned by a man.
What is Inequality or Gini Index in Santa Barbara?
Inequality or Gini Index in Santa Barbara is 0.52.
What is the Total Population of Santa Barbara?
Total Population of Santa Barbara is 4,368.
What is the Total Male Population of Santa Barbara?
Total Male Population of Santa Barbara is 1,851.
What is the Total Female Population of Santa Barbara?
Total Female Population of Santa Barbara is 2,517.
What is the Ratio of Males per 100 Females in Santa Barbara?
There are 73.54 Males per 100 Females in Santa Barbara.
What is the Ratio of Females per 100 Males in Santa Barbara?
There are 135.98 Females per 100 Males in Santa Barbara.
What is the Median Population Age in Santa Barbara?
Median Population Age in Santa Barbara is 34.3 Years.
What is the Average Family Size in Santa Barbara
Average Family Size in Santa Barbara is 3.9 People.
What is the Average Household Size in Santa Barbara
Average Household Size in Santa Barbara is 3.2 People.
How Large is the Labor Force in Santa Barbara?
There are 1,978 People in the Labor Forcein in Santa Barbara.
What is the Percentage of People in the Labor Force in Santa Barbara?
56.0% of People are in the Labor Force in Santa Barbara.
What is the Unemployment Rate in Santa Barbara?
Unemployment Rate in Santa Barbara is 19.3%.