Guayabal, PR Map & Demographics
Guayabal Map
Guayabal Overview
$9,140
PER CAPITA INCOME
$22,326
AVG FAMILY INCOME
$20,243
AVG HOUSEHOLD INCOME
0.46
INEQUALITY / GINI INDEX
1,492
TOTAL POPULATION
787
MALE POPULATION
705
FEMALE POPULATION
111.63
MALES / 100 FEMALES
89.58
FEMALES / 100 MALES
52.9
MEDIAN AGE
3.1
AVG FAMILY SIZE
2.6
AVG HOUSEHOLD SIZE
417
LABOR FORCE [ PEOPLE ]
32.1%
PERCENT IN LABOR FORCE
28.3%
UNEMPLOYMENT RATE
Income in Guayabal
Income Overview in Guayabal
Per Capita Income in Guayabal is $9,140, while median incomes of families and households are $22,326 and $20,243 respectively.
| Characteristic | Number | Measure |
| Per Capita Income | 1,492 | $9,140 |
| Median Family Income | 393 | $22,326 |
| Mean Family Income | 393 | $25,702 |
| Median Household Income | 569 | $20,243 |
| Mean Household Income | 569 | $21,334 |
| Income Deficit | 393 | $0 |
| Wage / Income Gap (%) | 1,492 | 0.00% |
| Wage / Income Gap ($) | 1,492 | 100.00¢ per $1 |
| Gini / Inequality Index | 1,492 | 0.46 |
Earnings by Sex in Guayabal
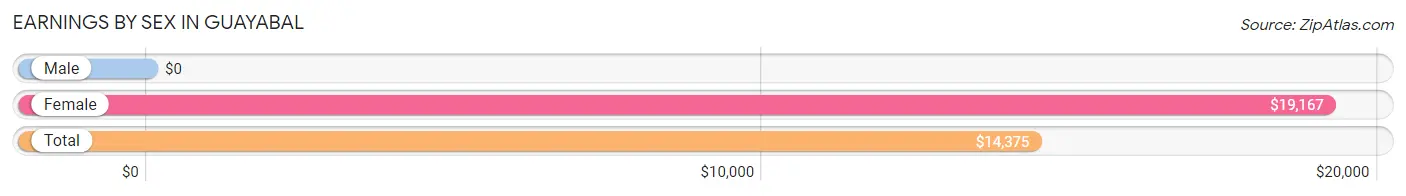
| Sex | Number | Average Earnings |
| Male | 252 (74.1%) | $0 |
| Female | 88 (25.9%) | $19,167 |
| Total | 340 (100.0%) | $14,375 |
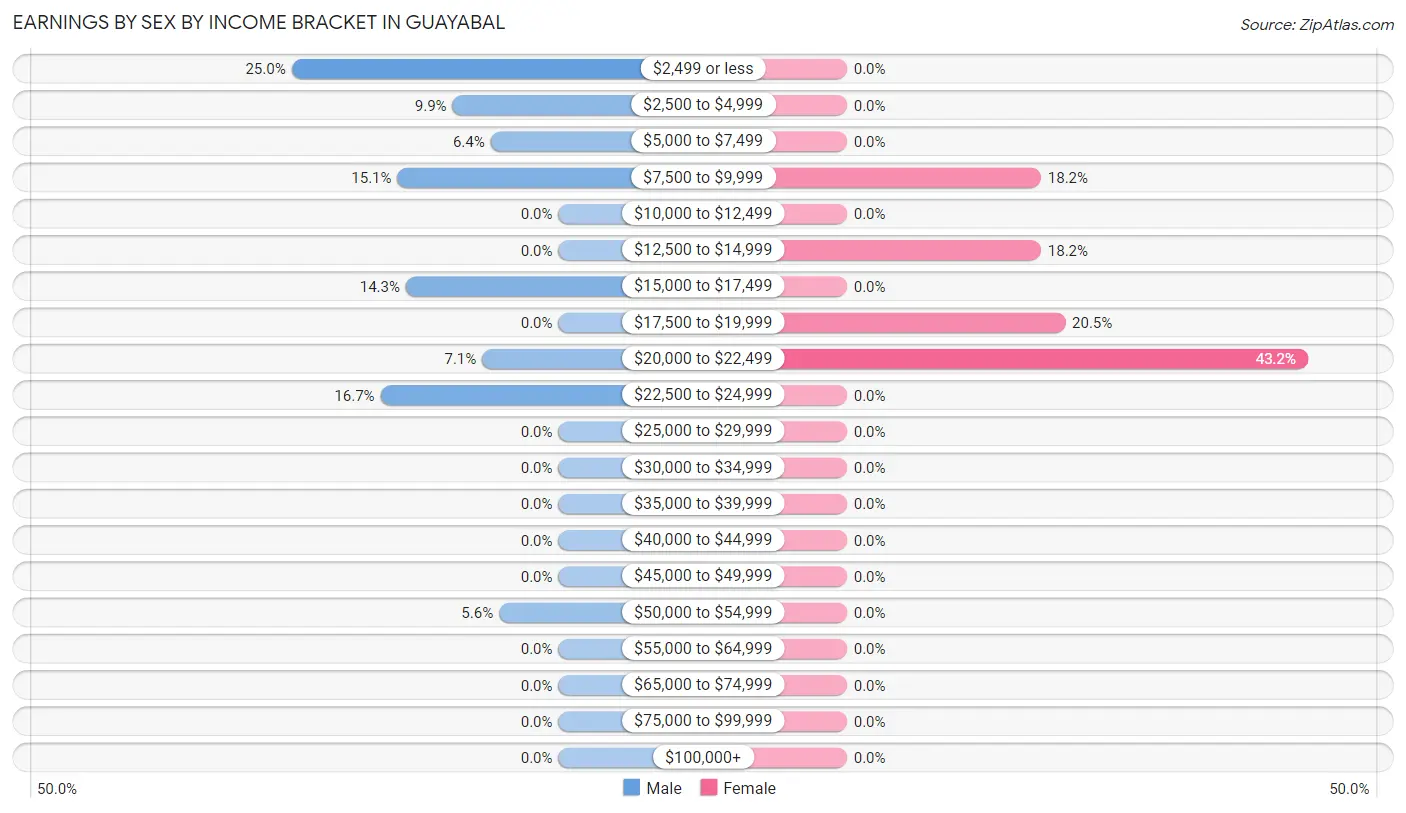
Earnings by Sex by Income Bracket in Guayabal
The most common earnings brackets in Guayabal are $2,499 or less for men (63 | 25.0%) and $20,000 to $22,499 for women (38 | 43.2%).
| Income | Male | Female |
| $2,499 or less | 63 (25.0%) | 0 (0.0%) |
| $2,500 to $4,999 | 25 (9.9%) | 0 (0.0%) |
| $5,000 to $7,499 | 16 (6.4%) | 0 (0.0%) |
| $7,500 to $9,999 | 38 (15.1%) | 16 (18.2%) |
| $10,000 to $12,499 | 0 (0.0%) | 0 (0.0%) |
| $12,500 to $14,999 | 0 (0.0%) | 16 (18.2%) |
| $15,000 to $17,499 | 36 (14.3%) | 0 (0.0%) |
| $17,500 to $19,999 | 0 (0.0%) | 18 (20.4%) |
| $20,000 to $22,499 | 18 (7.1%) | 38 (43.2%) |
| $22,500 to $24,999 | 42 (16.7%) | 0 (0.0%) |
| $25,000 to $29,999 | 0 (0.0%) | 0 (0.0%) |
| $30,000 to $34,999 | 0 (0.0%) | 0 (0.0%) |
| $35,000 to $39,999 | 0 (0.0%) | 0 (0.0%) |
| $40,000 to $44,999 | 0 (0.0%) | 0 (0.0%) |
| $45,000 to $49,999 | 0 (0.0%) | 0 (0.0%) |
| $50,000 to $54,999 | 14 (5.6%) | 0 (0.0%) |
| $55,000 to $64,999 | 0 (0.0%) | 0 (0.0%) |
| $65,000 to $74,999 | 0 (0.0%) | 0 (0.0%) |
| $75,000 to $99,999 | 0 (0.0%) | 0 (0.0%) |
| $100,000+ | 0 (0.0%) | 0 (0.0%) |
| Total | 252 (100.0%) | 88 (100.0%) |
Earnings by Sex by Educational Attainment in Guayabal
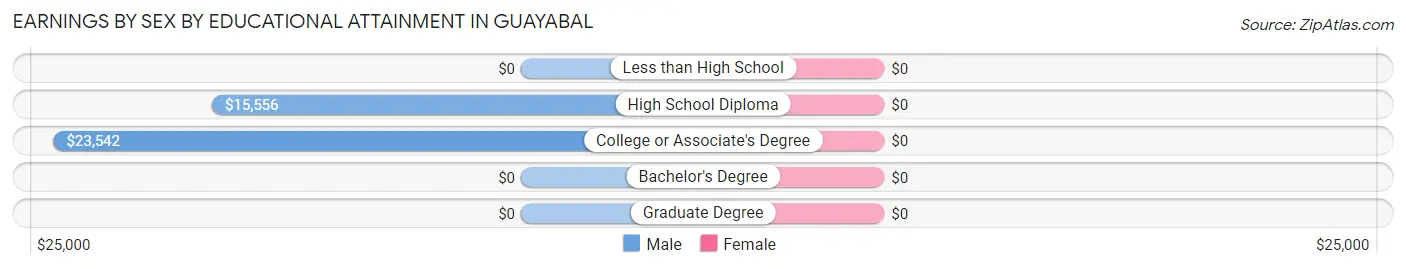
| Educational Attainment | Male Income | Female Income |
| Less than High School | - | - |
| High School Diploma | $15,556 | $0 |
| College or Associate's Degree | $23,542 | $0 |
| Bachelor's Degree | - | - |
| Graduate Degree | - | - |
| Total | - | - |
Family Income in Guayabal
Family Income Brackets in Guayabal
According to the Guayabal family income data, there are 166 families falling into the $15,000 to $24,999 income range, which is the most common income bracket and makes up 42.2% of all families.
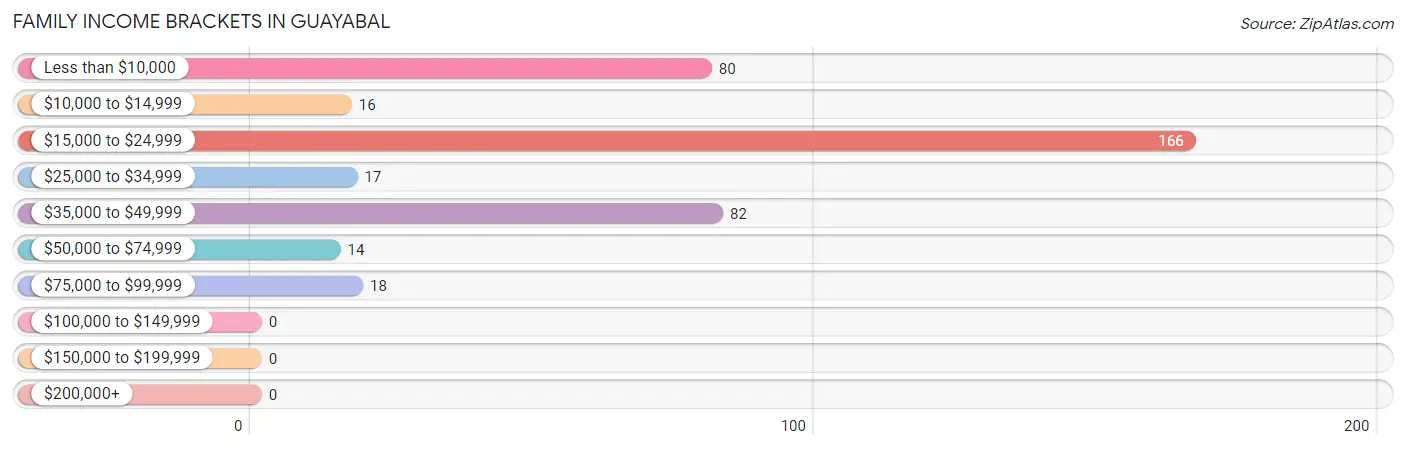
| Income Bracket | # Families | % Families |
| Less than $10,000 | 80 | 20.4% |
| $10,000 to $14,999 | 16 | 4.1% |
| $15,000 to $24,999 | 166 | 42.2% |
| $25,000 to $34,999 | 17 | 4.3% |
| $35,000 to $49,999 | 82 | 20.9% |
| $50,000 to $74,999 | 14 | 3.6% |
| $75,000 to $99,999 | 18 | 4.6% |
| $100,000 to $149,999 | 0 | 0.0% |
| $150,000 to $199,999 | 0 | 0.0% |
| $200,000+ | 0 | 0.0% |
Family Income by Famaliy Size in Guayabal
2-person families (207 | 52.7%) account for the highest median family income in Guayabal with $21,424 per family, while 2-person families (207 | 52.7%) have the highest median income of $10,712 per family member.
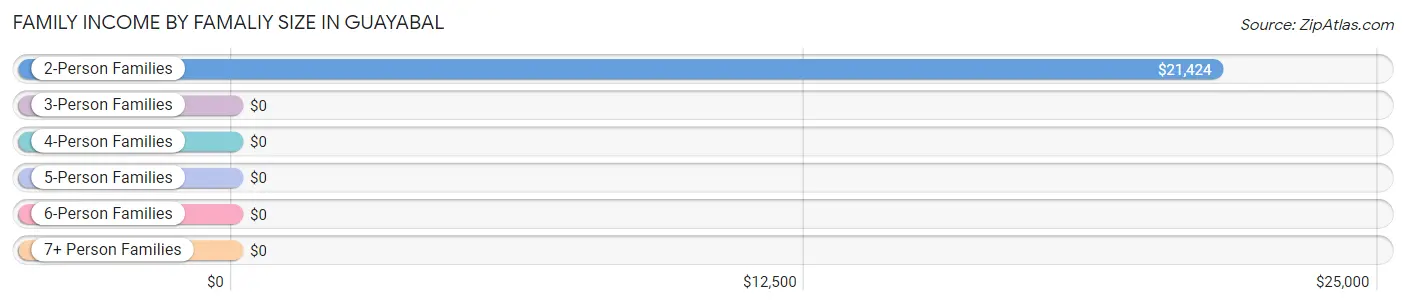
| Income Bracket | # Families | Median Income |
| 2-Person Families | 207 (52.7%) | $21,424 |
| 3-Person Families | 92 (23.4%) | $0 |
| 4-Person Families | 94 (23.9%) | $0 |
| 5-Person Families | 0 (0.0%) | $0 |
| 6-Person Families | 0 (0.0%) | $0 |
| 7+ Person Families | 0 (0.0%) | $0 |
| Total | 393 (100.0%) | $22,326 |
Family Income by Number of Earners in Guayabal
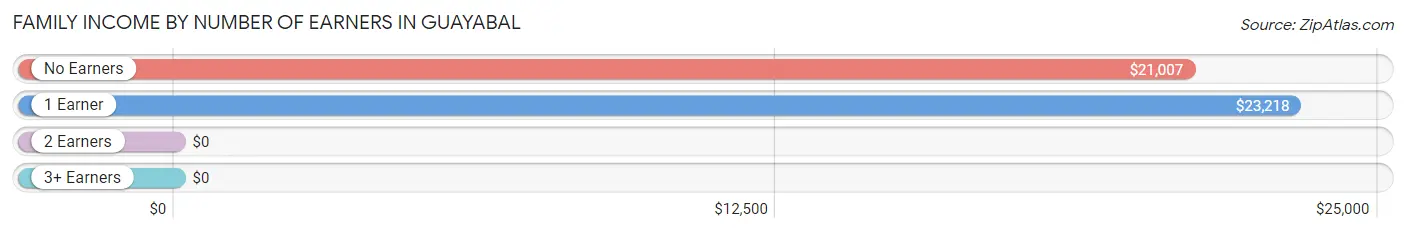
| Number of Earners | # Families | Median Income |
| No Earners | 205 (52.2%) | $21,007 |
| 1 Earner | 139 (35.4%) | $23,218 |
| 2 Earners | 49 (12.5%) | $0 |
| 3+ Earners | 0 (0.0%) | $0 |
| Total | 393 (100.0%) | $22,326 |
Household Income in Guayabal
Household Income Brackets in Guayabal
With 206 households falling in the category, the $15,000 to $24,999 income range is the most frequent in Guayabal, accounting for 36.2% of all households.
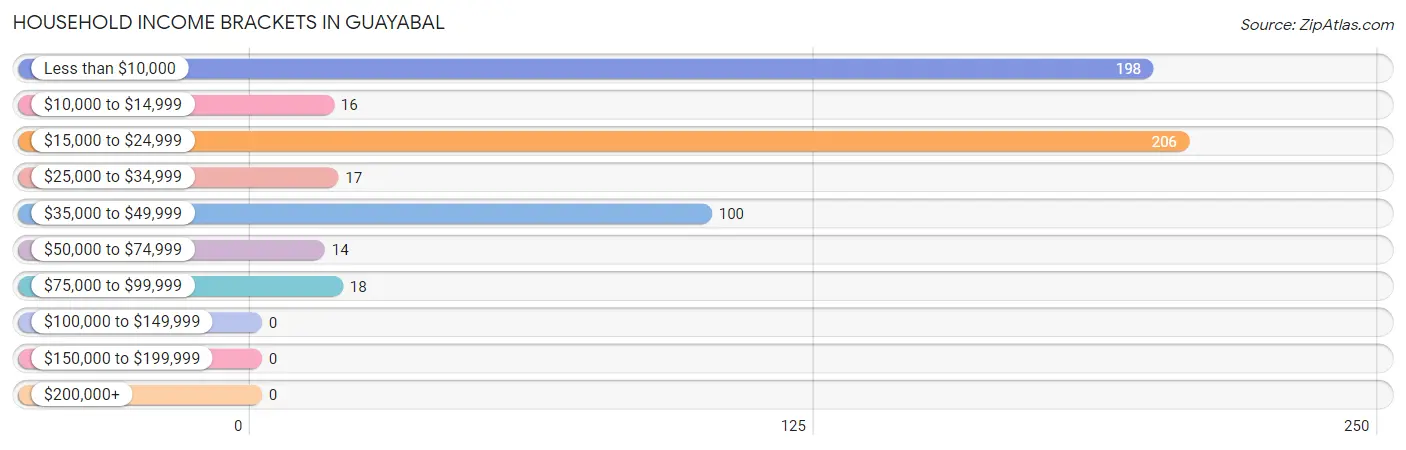
| Income Bracket | # Households | % Households |
| Less than $10,000 | 198 | 34.8% |
| $10,000 to $14,999 | 16 | 2.8% |
| $15,000 to $24,999 | 206 | 36.2% |
| $25,000 to $34,999 | 17 | 3.0% |
| $35,000 to $49,999 | 100 | 17.6% |
| $50,000 to $74,999 | 14 | 2.5% |
| $75,000 to $99,999 | 18 | 3.2% |
| $100,000 to $149,999 | 0 | 0.0% |
| $150,000 to $199,999 | 0 | 0.0% |
| $200,000+ | 0 | 0.0% |
Household Income by Householder Age in Guayabal
The median household income in Guayabal is $20,243, with the highest median household income of $20,938 found in the 45 to 64 years age bracket for the primary householder. A total of 253 households (44.5%) fall into this category.
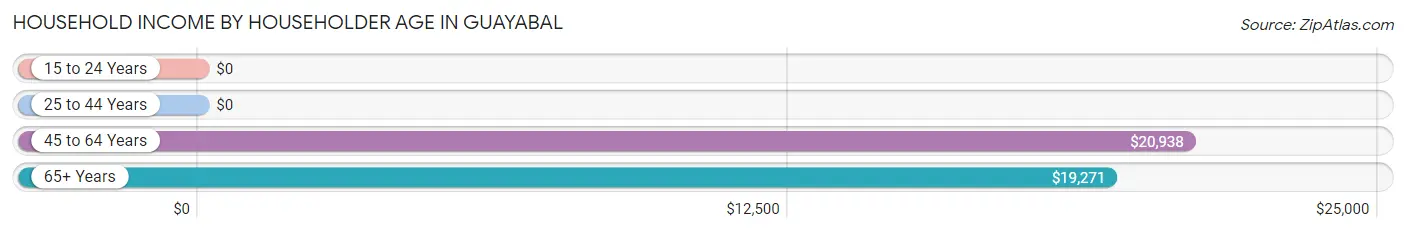
| Income Bracket | # Households | Median Income |
| 15 to 24 Years | 0 (0.0%) | $0 |
| 25 to 44 Years | 90 (15.8%) | $0 |
| 45 to 64 Years | 253 (44.5%) | $20,938 |
| 65+ Years | 226 (39.7%) | $19,271 |
| Total | 569 (100.0%) | $20,243 |
Poverty in Guayabal
Income Below Poverty by Sex and Age in Guayabal
With 48.0% poverty level for males and 50.1% for females among the residents of Guayabal, 12 to 14 year old males and under 5 year old females are the most vulnerable to poverty, with 26 males (100.0%) and 25 females (100.0%) in their respective age groups living below the poverty level.
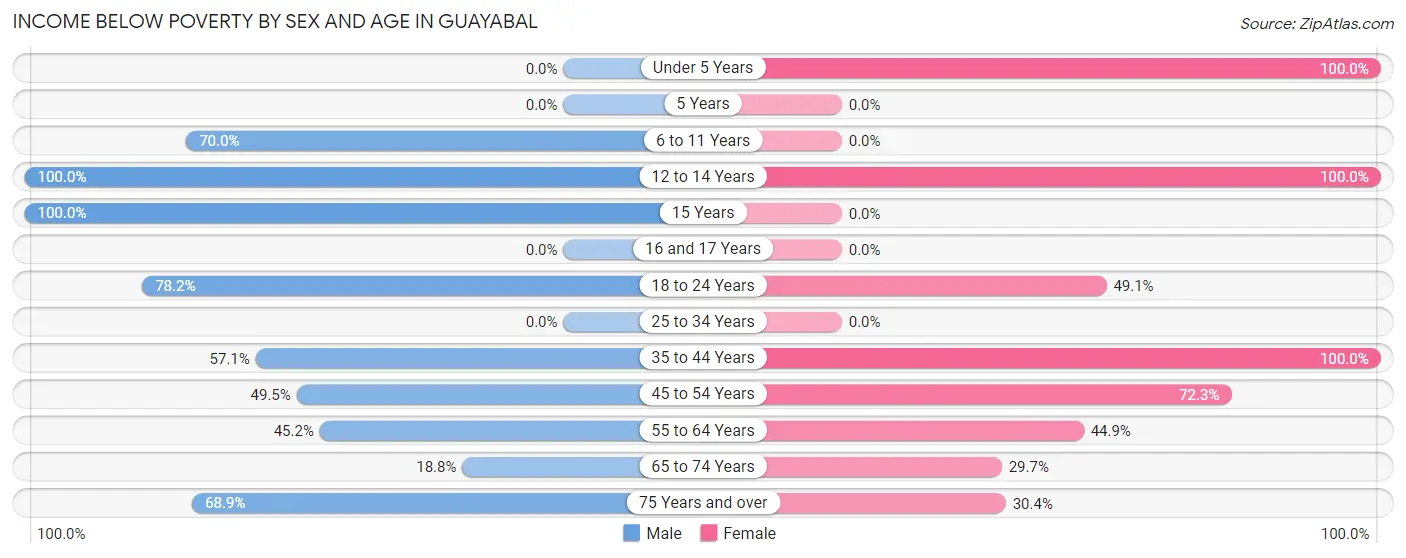
| Age Bracket | Male | Female |
| Under 5 Years | 0 (0.0%) | 25 (100.0%) |
| 5 Years | 0 (0.0%) | 0 (0.0%) |
| 6 to 11 Years | 49 (70.0%) | 0 (0.0%) |
| 12 to 14 Years | 26 (100.0%) | 51 (100.0%) |
| 15 Years | 21 (100.0%) | 0 (0.0%) |
| 16 and 17 Years | 0 (0.0%) | 0 (0.0%) |
| 18 to 24 Years | 68 (78.2%) | 28 (49.1%) |
| 25 to 34 Years | 0 (0.0%) | 0 (0.0%) |
| 35 to 44 Years | 24 (57.1%) | 48 (100.0%) |
| 45 to 54 Years | 51 (49.5%) | 73 (72.3%) |
| 55 to 64 Years | 52 (45.2%) | 88 (44.9%) |
| 65 to 74 Years | 36 (18.8%) | 19 (29.7%) |
| 75 Years and over | 51 (68.9%) | 21 (30.4%) |
| Total | 378 (48.0%) | 353 (50.1%) |
Income Above Poverty by Sex and Age in Guayabal
According to the poverty statistics in Guayabal, males aged 16 and 17 years and females aged 16 and 17 years are the age groups that are most secure financially, with 100.0% of males and 100.0% of females in these age groups living above the poverty line.
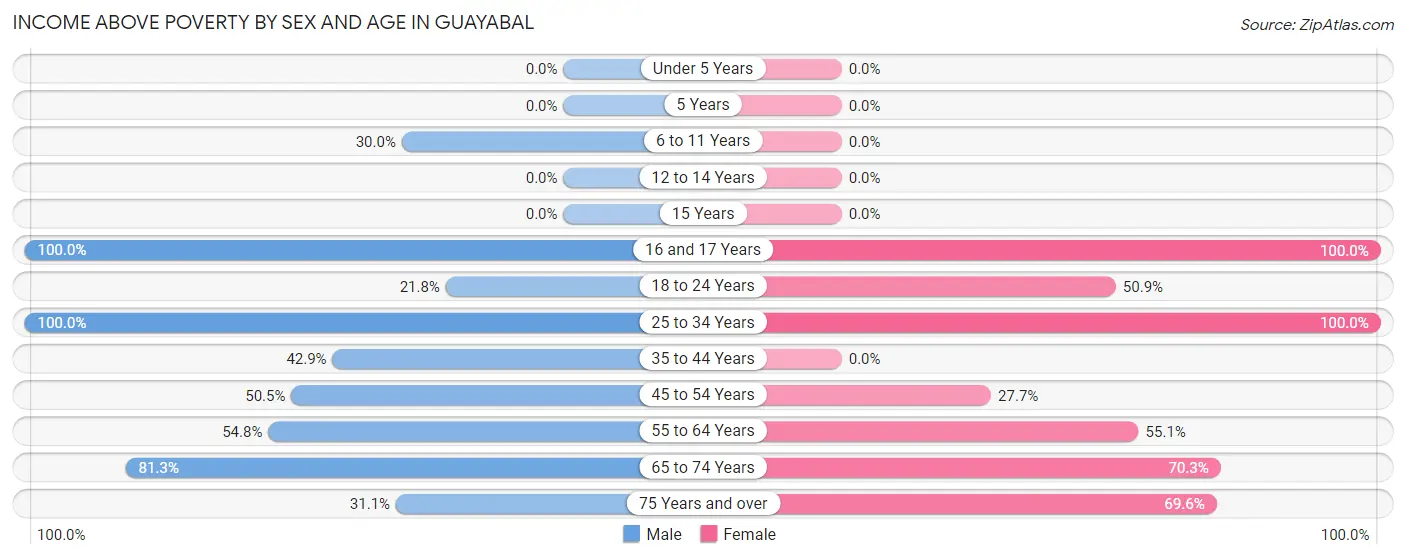
| Age Bracket | Male | Female |
| Under 5 Years | 0 (0.0%) | 0 (0.0%) |
| 5 Years | 0 (0.0%) | 0 (0.0%) |
| 6 to 11 Years | 21 (30.0%) | 0 (0.0%) |
| 12 to 14 Years | 0 (0.0%) | 0 (0.0%) |
| 15 Years | 0 (0.0%) | 0 (0.0%) |
| 16 and 17 Years | 16 (100.0%) | 76 (100.0%) |
| 18 to 24 Years | 19 (21.8%) | 29 (50.9%) |
| 25 to 34 Years | 41 (100.0%) | 18 (100.0%) |
| 35 to 44 Years | 18 (42.9%) | 0 (0.0%) |
| 45 to 54 Years | 52 (50.5%) | 28 (27.7%) |
| 55 to 64 Years | 63 (54.8%) | 108 (55.1%) |
| 65 to 74 Years | 156 (81.2%) | 45 (70.3%) |
| 75 Years and over | 23 (31.1%) | 48 (69.6%) |
| Total | 409 (52.0%) | 352 (49.9%) |
Income Below Poverty Among Married-Couple Families in Guayabal
The poverty statistics for married-couple families in Guayabal show that 39.7% or 102 of the total 257 families live below the poverty line. Families with 1 or 2 children have the highest poverty rate of 55.4%, comprising of 62 families. On the other hand, families with no children have the lowest poverty rate of 27.6%, which includes 40 families.
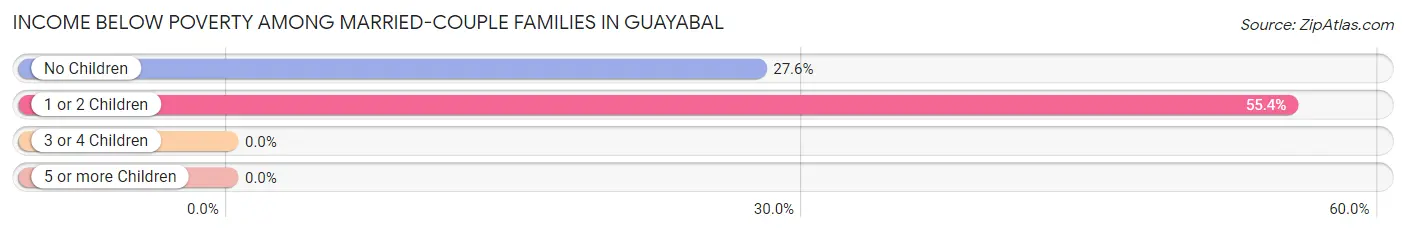
| Children | Above Poverty | Below Poverty |
| No Children | 105 (72.4%) | 40 (27.6%) |
| 1 or 2 Children | 50 (44.6%) | 62 (55.4%) |
| 3 or 4 Children | 0 (0.0%) | 0 (0.0%) |
| 5 or more Children | 0 (0.0%) | 0 (0.0%) |
| Total | 155 (60.3%) | 102 (39.7%) |
Income Below Poverty Among Single-Parent Households in Guayabal
According to the poverty data in Guayabal, 35.2% or 19 single-father households and 51.2% or 42 single-mother households are living below the poverty line. Among single-father households, those with no children have the highest poverty rate, with 19 households (51.3%) experiencing poverty. Likewise, among single-mother households, those with 1 or 2 children have the highest poverty rate, with 42 households (100.0%) falling below the poverty line.
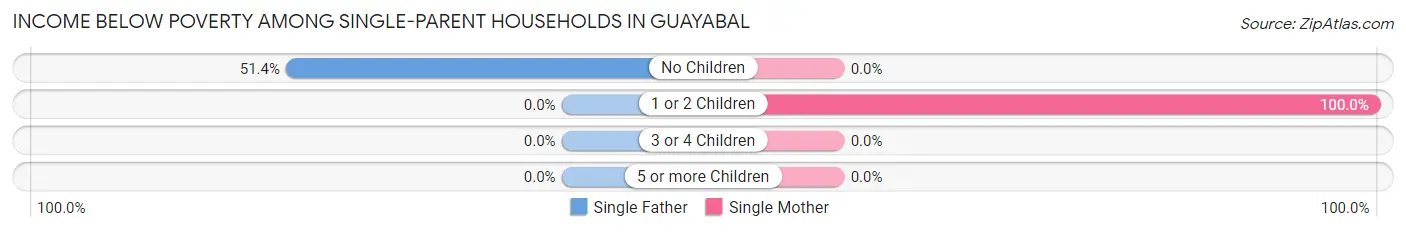
| Children | Single Father | Single Mother |
| No Children | 19 (51.3%) | 0 (0.0%) |
| 1 or 2 Children | 0 (0.0%) | 42 (100.0%) |
| 3 or 4 Children | 0 (0.0%) | 0 (0.0%) |
| 5 or more Children | 0 (0.0%) | 0 (0.0%) |
| Total | 19 (35.2%) | 42 (51.2%) |
Income Below Poverty Among Married-Couple vs Single-Parent Households in Guayabal
The poverty data for Guayabal shows that 102 of the married-couple family households (39.7%) and 61 of the single-parent households (44.9%) are living below the poverty level. Within the married-couple family households, those with 1 or 2 children have the highest poverty rate, with 62 households (55.4%) falling below the poverty line. Among the single-parent households, those with 1 or 2 children have the highest poverty rate, with 42 household (71.2%) living below poverty.
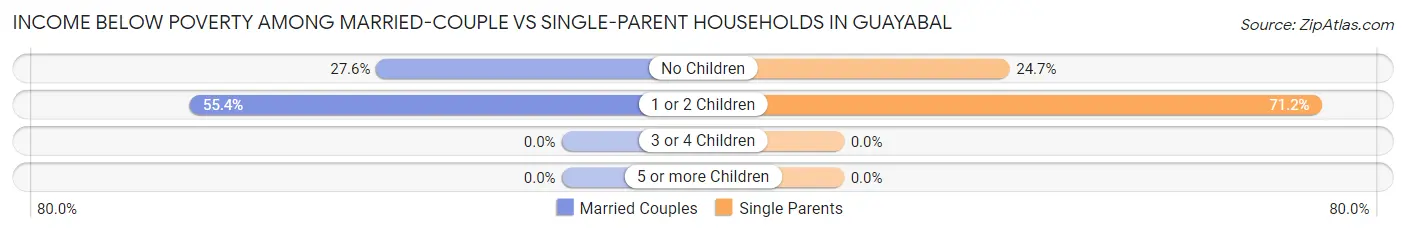
| Children | Married-Couple Families | Single-Parent Households |
| No Children | 40 (27.6%) | 19 (24.7%) |
| 1 or 2 Children | 62 (55.4%) | 42 (71.2%) |
| 3 or 4 Children | 0 (0.0%) | 0 (0.0%) |
| 5 or more Children | 0 (0.0%) | 0 (0.0%) |
| Total | 102 (39.7%) | 61 (44.9%) |
Race in Guayabal
The most populous races in Guayabal are Hispanic or Latino (1,456 | 97.6%), Two or more Races (1,028 | 68.9%), and White / Caucasian (366 | 24.5%).
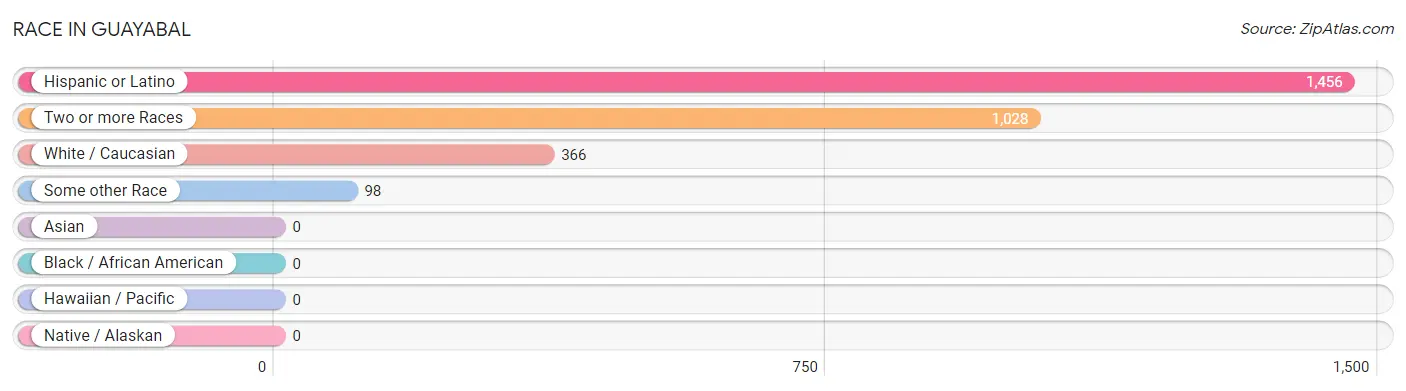
| Race | # Population | % Population |
| Asian | 0 | 0.0% |
| Black / African American | 0 | 0.0% |
| Hawaiian / Pacific | 0 | 0.0% |
| Hispanic or Latino | 1,456 | 97.6% |
| Native / Alaskan | 0 | 0.0% |
| White / Caucasian | 366 | 24.5% |
| Two or more Races | 1,028 | 68.9% |
| Some other Race | 98 | 6.6% |
| Total | 1,492 | 100.0% |
Ancestry in Guayabal
The most populous ancestries reported in Guayabal are Puerto Rican (1,456 | 97.6%), and Central American Indian (17 | 1.1%), together accounting for 98.7% of all Guayabal residents.
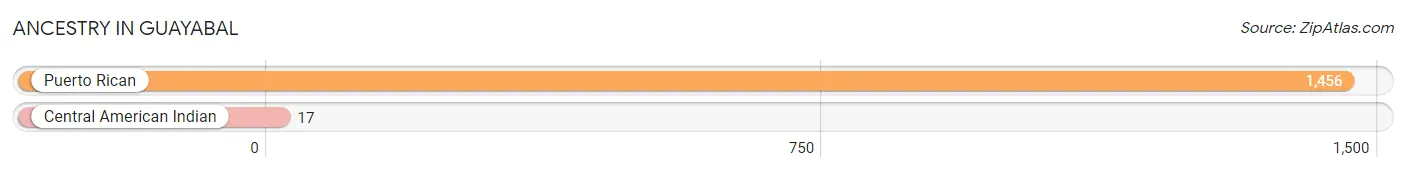
| Ancestry | # Population | % Population |
| Central American Indian | 17 | 1.1% |
| Puerto Rican | 1,456 | 97.6% | View All 2 Rows |
Immigrants in Guayabal

| Immigration Origin | # Population | % Population | View All 0 Rows |
Sex and Age in Guayabal
Sex and Age in Guayabal
The most populous age groups in Guayabal are 65 to 69 Years (117 | 14.9%) for men and 55 to 59 Years (156 | 22.1%) for women.
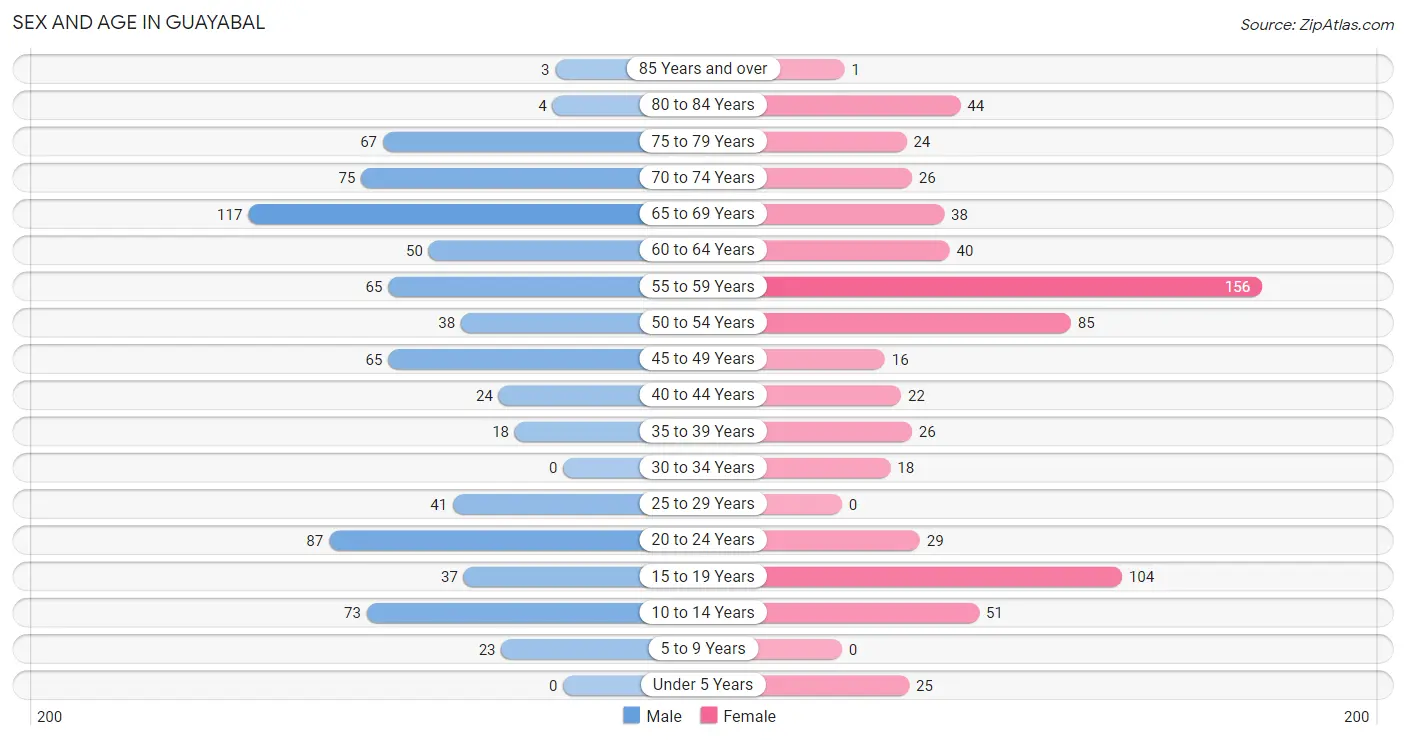
| Age Bracket | Male | Female |
| Under 5 Years | 0 (0.0%) | 25 (3.5%) |
| 5 to 9 Years | 23 (2.9%) | 0 (0.0%) |
| 10 to 14 Years | 73 (9.3%) | 51 (7.2%) |
| 15 to 19 Years | 37 (4.7%) | 104 (14.7%) |
| 20 to 24 Years | 87 (11.1%) | 29 (4.1%) |
| 25 to 29 Years | 41 (5.2%) | 0 (0.0%) |
| 30 to 34 Years | 0 (0.0%) | 18 (2.5%) |
| 35 to 39 Years | 18 (2.3%) | 26 (3.7%) |
| 40 to 44 Years | 24 (3.0%) | 22 (3.1%) |
| 45 to 49 Years | 65 (8.3%) | 16 (2.3%) |
| 50 to 54 Years | 38 (4.8%) | 85 (12.1%) |
| 55 to 59 Years | 65 (8.3%) | 156 (22.1%) |
| 60 to 64 Years | 50 (6.4%) | 40 (5.7%) |
| 65 to 69 Years | 117 (14.9%) | 38 (5.4%) |
| 70 to 74 Years | 75 (9.5%) | 26 (3.7%) |
| 75 to 79 Years | 67 (8.5%) | 24 (3.4%) |
| 80 to 84 Years | 4 (0.5%) | 44 (6.2%) |
| 85 Years and over | 3 (0.4%) | 1 (0.1%) |
| Total | 787 (100.0%) | 705 (100.0%) |
Families and Households in Guayabal
Median Family Size in Guayabal
The median family size in Guayabal is 3.09 persons per family, with single female/mother families (82 | 20.9%) accounting for the largest median family size of 3.56 persons per family. On the other hand, married-couple families (257 | 65.4%) represent the smallest median family size with 2.91 persons per family.
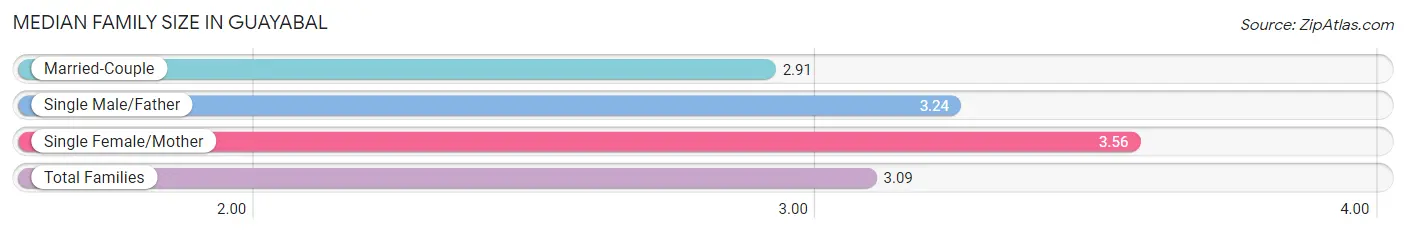
| Family Type | # Families | Family Size |
| Married-Couple | 257 (65.4%) | 2.91 |
| Single Male/Father | 54 (13.7%) | 3.24 |
| Single Female/Mother | 82 (20.9%) | 3.56 |
| Total Families | 393 (100.0%) | 3.09 |
Median Household Size in Guayabal
The median household size in Guayabal is 2.59 persons per household, with single male/father households (54 | 9.5%) accounting for the largest median household size of 3.67 persons per household. non-family households (176 | 30.9%) represent the smallest median household size with 1.34 persons per household.
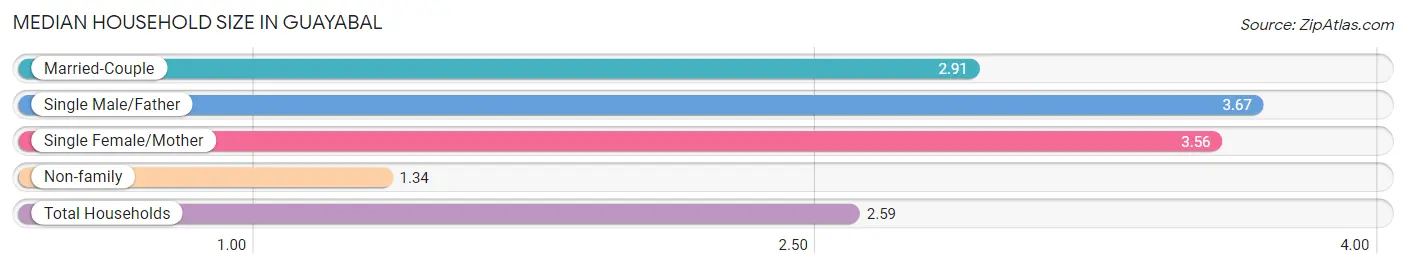
| Household Type | # Households | Household Size |
| Married-Couple | 257 (45.2%) | 2.91 |
| Single Male/Father | 54 (9.5%) | 3.67 |
| Single Female/Mother | 82 (14.4%) | 3.56 |
| Non-family | 176 (30.9%) | 1.34 |
| Total Households | 569 (100.0%) | 2.59 |
Household Size by Marriage Status in Guayabal
Out of a total of 569 households in Guayabal, 393 (69.1%) are family households, while 176 (30.9%) are nonfamily households. The most numerous type of family households are 2-person households, comprising 188, and the most common type of nonfamily households are 1-person households, comprising 119.
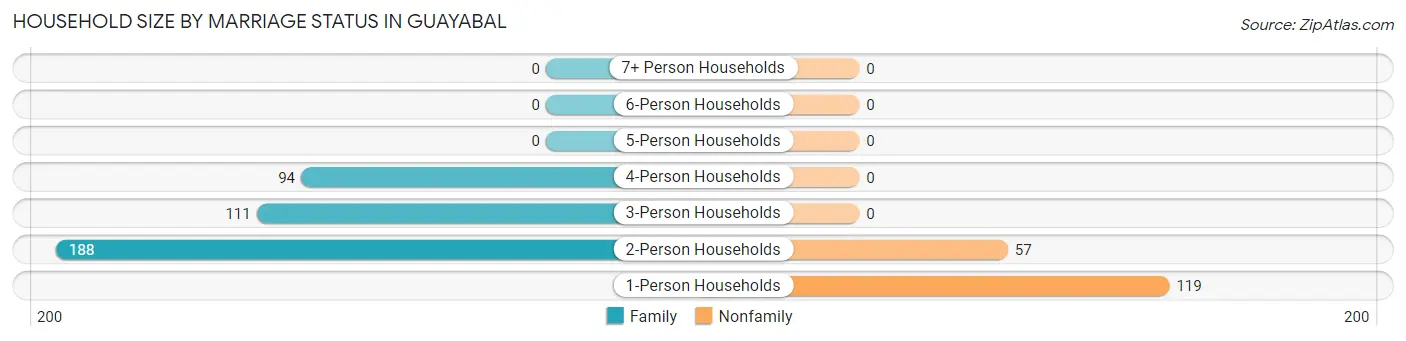
| Household Size | Family Households | Nonfamily Households |
| 1-Person Households | - | 119 (20.9%) |
| 2-Person Households | 188 (33.0%) | 57 (10.0%) |
| 3-Person Households | 111 (19.5%) | 0 (0.0%) |
| 4-Person Households | 94 (16.5%) | 0 (0.0%) |
| 5-Person Households | 0 (0.0%) | 0 (0.0%) |
| 6-Person Households | 0 (0.0%) | 0 (0.0%) |
| 7+ Person Households | 0 (0.0%) | 0 (0.0%) |
| Total | 393 (69.1%) | 176 (30.9%) |
Female Fertility in Guayabal
Fertility by Age in Guayabal
| Age Bracket | Women with Births | Births / 1,000 Women |
| 15 to 19 years | 0 (0.0%) | 0.0 |
| 20 to 34 years | 0 (0.0%) | 0.0 |
| 35 to 50 years | 0 (0.0%) | 0.0 |
| Total | 0 (0.0%) | 0.0 |
Fertility by Age by Marriage Status in Guayabal
| Age Bracket | Married | Unmarried |
| 15 to 19 years | 0 (0.0%) | 0 (0.0%) |
| 20 to 34 years | 0 (0.0%) | 0 (0.0%) |
| 35 to 50 years | 0 (0.0%) | 0 (0.0%) |
| Total | 0 (0.0%) | 0 (0.0%) |
Fertility by Education in Guayabal
| Educational Attainment | Women with Births | Births / 1,000 Women |
| Less than High School | 0 (0.0%) | 0.0 |
| High School Diploma | 0 (0.0%) | 0.0 |
| College or Associate's Degree | 0 (0.0%) | 0.0 |
| Bachelor's Degree | 0 (0.0%) | 0.0 |
| Graduate Degree | 0 (0.0%) | 0.0 |
| Total | 0 (0.0%) | 0.0 |
Fertility by Education by Marriage Status in Guayabal
| Educational Attainment | Married | Unmarried |
| Less than High School | 0 (0.0%) | 0 (0.0%) |
| High School Diploma | 0 (0.0%) | 0 (0.0%) |
| College or Associate's Degree | 0 (0.0%) | 0 (0.0%) |
| Bachelor's Degree | 0 (0.0%) | 0 (0.0%) |
| Graduate Degree | 0 (0.0%) | 0 (0.0%) |
| Total | 0 (0.0%) | 0 (0.0%) |
Employment Characteristics in Guayabal
Employment by Class of Employer in Guayabal
Among the 299 employed individuals in Guayabal, private company employees (170 | 56.9%), self-employed (not incorporated) (57 | 19.1%), and state government employees (50 | 16.7%) make up the most common classes of employment.
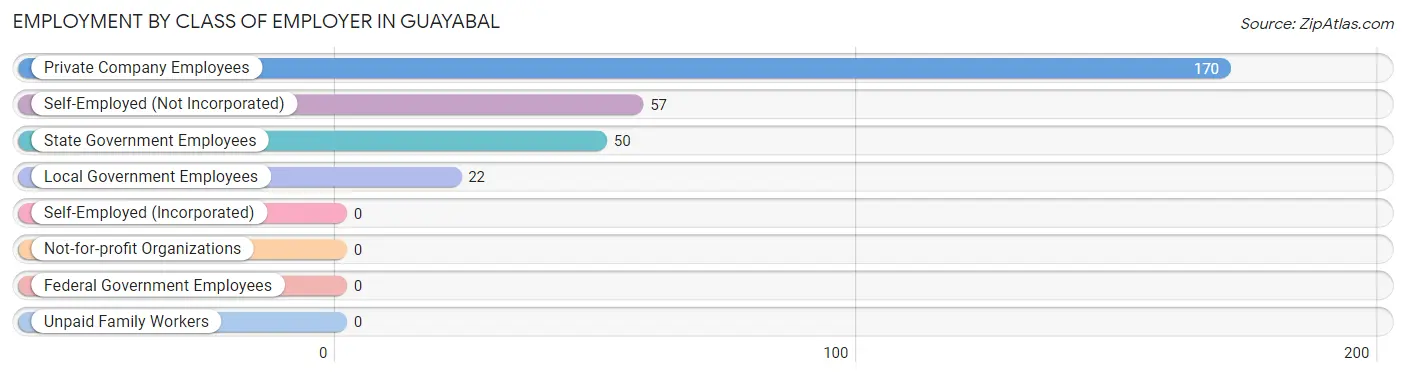
| Employer Class | # Employees | % Employees |
| Private Company Employees | 170 | 56.9% |
| Self-Employed (Incorporated) | 0 | 0.0% |
| Self-Employed (Not Incorporated) | 57 | 19.1% |
| Not-for-profit Organizations | 0 | 0.0% |
| Local Government Employees | 22 | 7.4% |
| State Government Employees | 50 | 16.7% |
| Federal Government Employees | 0 | 0.0% |
| Unpaid Family Workers | 0 | 0.0% |
| Total | 299 | 100.0% |
Employment Status by Age in Guayabal
According to the labor force statistics for Guayabal, out of the total population over 16 years of age (1,299), 32.1% or 417 individuals are in the labor force, with 28.3% or 118 of them unemployed. The age group with the highest labor force participation rate is 25 to 29 years, with 100.0% or 41 individuals in the labor force. Within the labor force, the 25 to 29 years age range has the highest percentage of unemployed individuals, with 100.0% or 41 of them being unemployed.
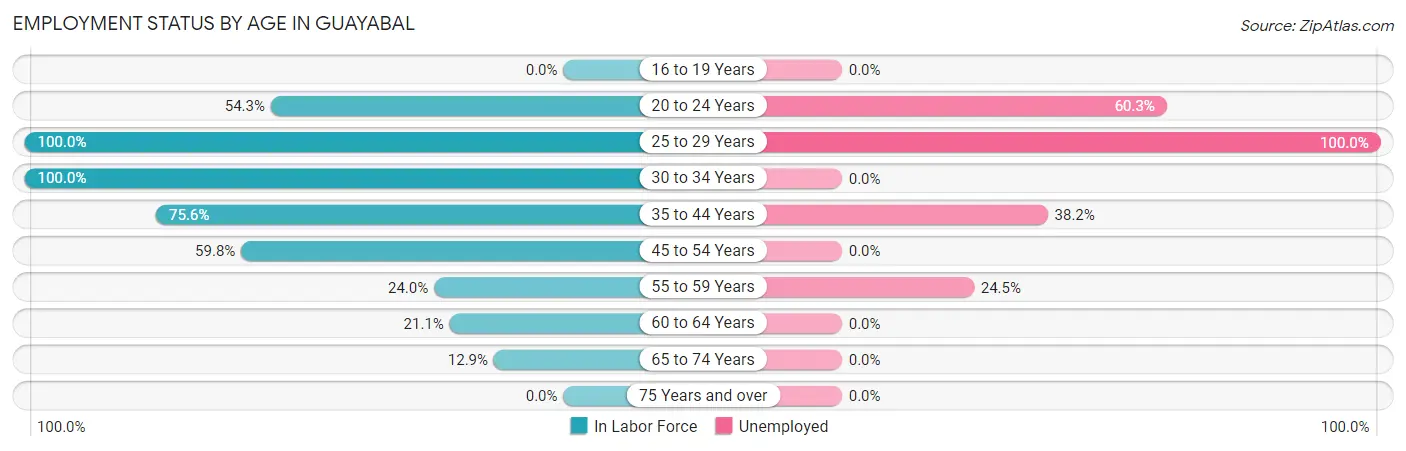
| Age Bracket | In Labor Force | Unemployed |
| 16 to 19 Years | 0 (0.0%) | 0 (0.0%) |
| 20 to 24 Years | 63 (54.3%) | 38 (60.3%) |
| 25 to 29 Years | 41 (100.0%) | 41 (100.0%) |
| 30 to 34 Years | 18 (100.0%) | 0 (0.0%) |
| 35 to 44 Years | 68 (75.6%) | 26 (38.2%) |
| 45 to 54 Years | 122 (59.8%) | 0 (0.0%) |
| 55 to 59 Years | 53 (24.0%) | 13 (24.5%) |
| 60 to 64 Years | 19 (21.1%) | 0 (0.0%) |
| 65 to 74 Years | 33 (12.9%) | 0 (0.0%) |
| 75 Years and over | 0 (0.0%) | 0 (0.0%) |
| Total | 417 (32.1%) | 118 (28.3%) |
Employment Status by Educational Attainment in Guayabal
According to labor force statistics for Guayabal, 48.3% of individuals (321) out of the total population between 25 and 64 years of age (664) are in the labor force, with 24.9% or 80 of them being unemployed. The group with the highest labor force participation rate are those with the educational attainment of less than high school, with 61.4% or 51 individuals in the labor force. Within the labor force, individuals with bachelor's degree or higher education have the highest percentage of unemployment, with 50.6% or 41 of them being unemployed.
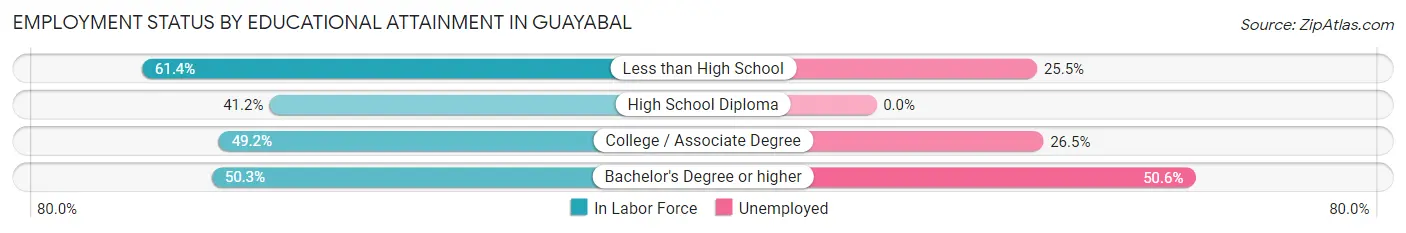
| Educational Attainment | In Labor Force | Unemployed |
| Less than High School | 51 (61.4%) | 21 (25.5%) |
| High School Diploma | 91 (41.2%) | 0 (0.0%) |
| College / Associate Degree | 98 (49.2%) | 53 (26.5%) |
| Bachelor's Degree or higher | 81 (50.3%) | 81 (50.6%) |
| Total | 321 (48.3%) | 165 (24.9%) |
Employment Occupations by Sex in Guayabal
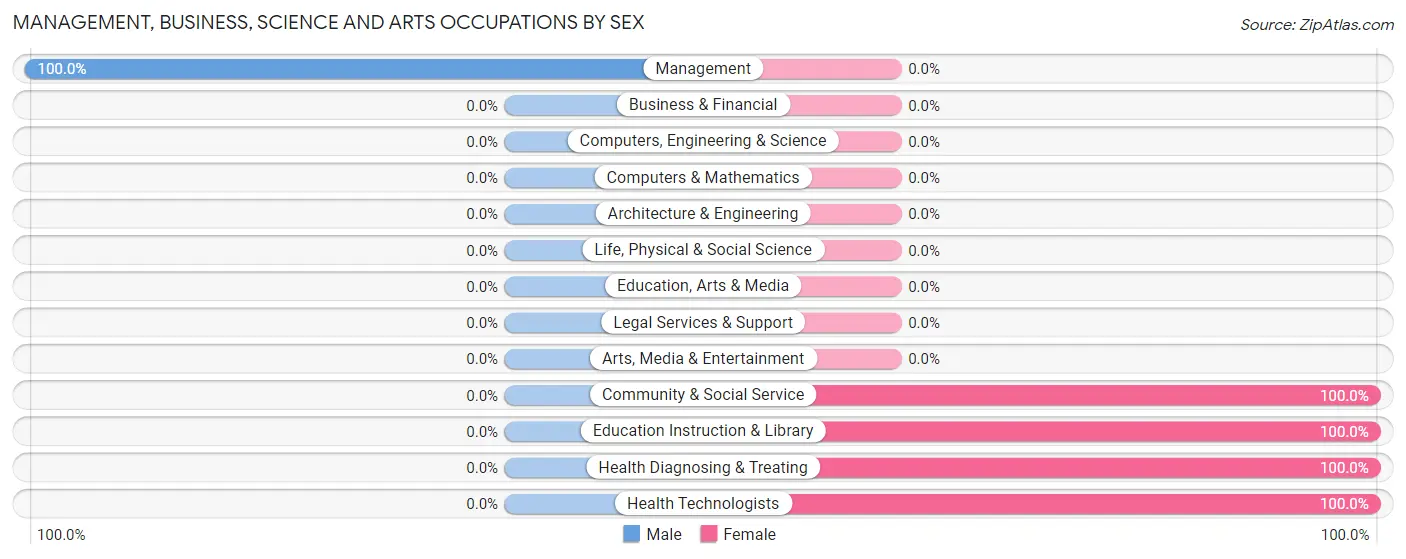
Management, Business, Science and Arts Occupations
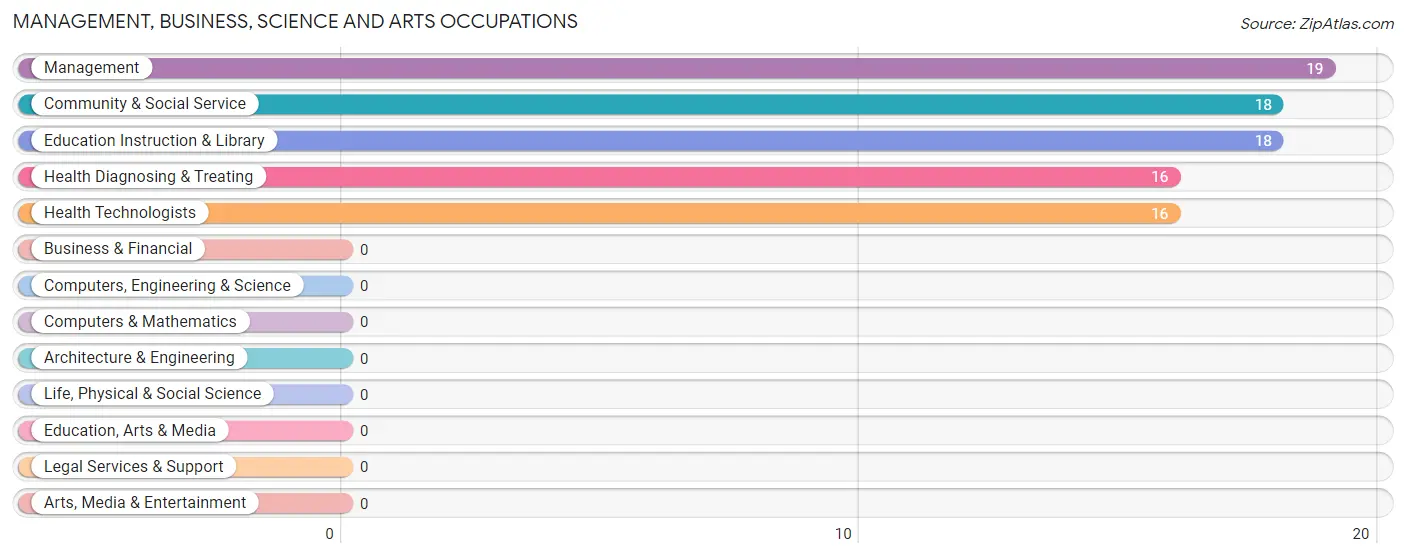
The most common Management, Business, Science and Arts occupations in Guayabal are Management (19 | 6.4%), Community & Social Service (18 | 6.0%), Education Instruction & Library (18 | 6.0%), Health Diagnosing & Treating (16 | 5.3%), and Health Technologists (16 | 5.3%).
Management, Business, Science and Arts Occupations by Sex
| Occupation | Male | Female |
| Management | 19 (100.0%) | 0 (0.0%) |
| Business & Financial | 0 (0.0%) | 0 (0.0%) |
| Computers, Engineering & Science | 0 (0.0%) | 0 (0.0%) |
| Computers & Mathematics | 0 (0.0%) | 0 (0.0%) |
| Architecture & Engineering | 0 (0.0%) | 0 (0.0%) |
| Life, Physical & Social Science | 0 (0.0%) | 0 (0.0%) |
| Community & Social Service | 0 (0.0%) | 18 (100.0%) |
| Education, Arts & Media | 0 (0.0%) | 0 (0.0%) |
| Legal Services & Support | 0 (0.0%) | 0 (0.0%) |
| Education Instruction & Library | 0 (0.0%) | 18 (100.0%) |
| Arts, Media & Entertainment | 0 (0.0%) | 0 (0.0%) |
| Health Diagnosing & Treating | 0 (0.0%) | 16 (100.0%) |
| Health Technologists | 0 (0.0%) | 16 (100.0%) |
| Total (Category) | 19 (35.8%) | 34 (64.1%) |
| Total (Overall) | 211 (70.6%) | 88 (29.4%) |
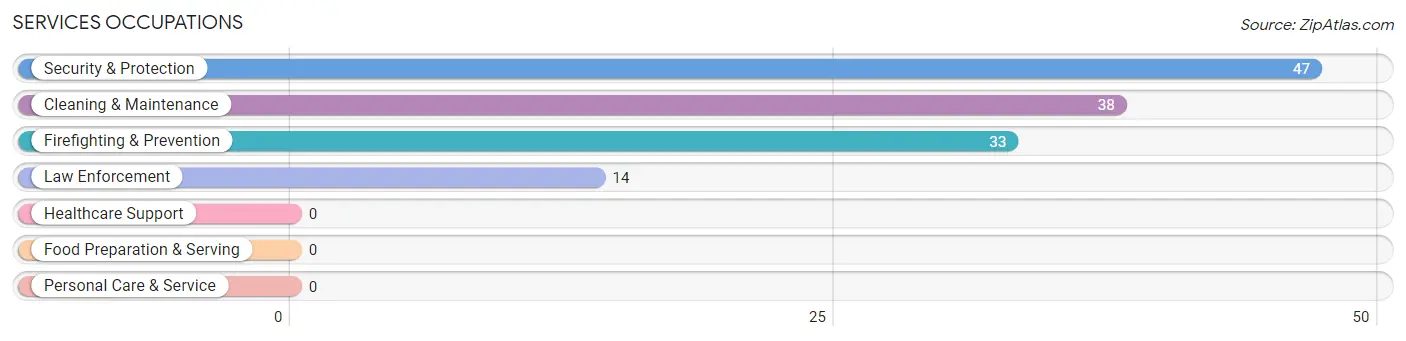
Services Occupations
The most common Services occupations in Guayabal are Security & Protection (47 | 15.7%), Cleaning & Maintenance (38 | 12.7%), Firefighting & Prevention (33 | 11.0%), and Law Enforcement (14 | 4.7%).
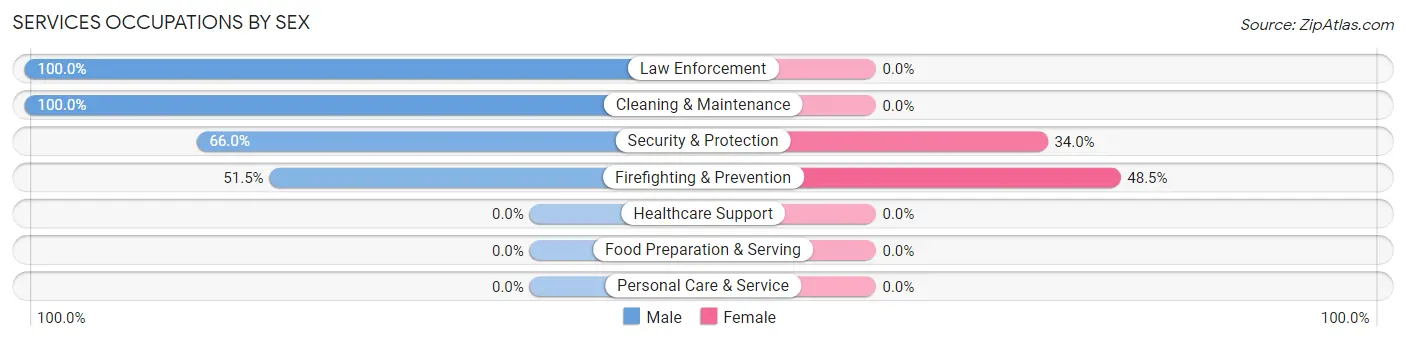
Services Occupations by Sex
Within the Services occupations in Guayabal, the most male-oriented occupations are Law Enforcement (100.0%), Cleaning & Maintenance (100.0%), and Security & Protection (66.0%), while the most female-oriented occupations are Firefighting & Prevention (48.5%), and Security & Protection (34.0%).
| Occupation | Male | Female |
| Healthcare Support | 0 (0.0%) | 0 (0.0%) |
| Security & Protection | 31 (66.0%) | 16 (34.0%) |
| Firefighting & Prevention | 17 (51.5%) | 16 (48.5%) |
| Law Enforcement | 14 (100.0%) | 0 (0.0%) |
| Food Preparation & Serving | 0 (0.0%) | 0 (0.0%) |
| Cleaning & Maintenance | 38 (100.0%) | 0 (0.0%) |
| Personal Care & Service | 0 (0.0%) | 0 (0.0%) |
| Total (Category) | 69 (81.2%) | 16 (18.8%) |
| Total (Overall) | 211 (70.6%) | 88 (29.4%) |
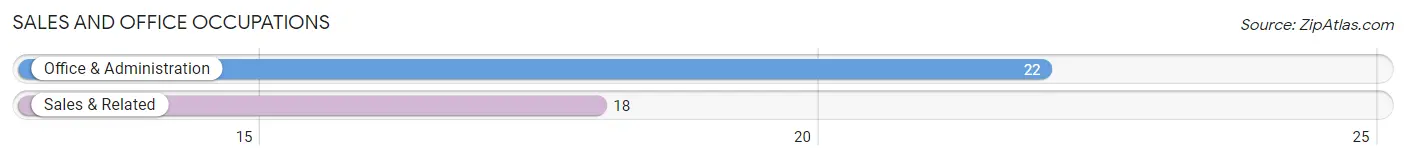
Sales and Office Occupations
The most common Sales and Office occupations in Guayabal are Office & Administration (22 | 7.4%), and Sales & Related (18 | 6.0%).
Sales and Office Occupations by Sex
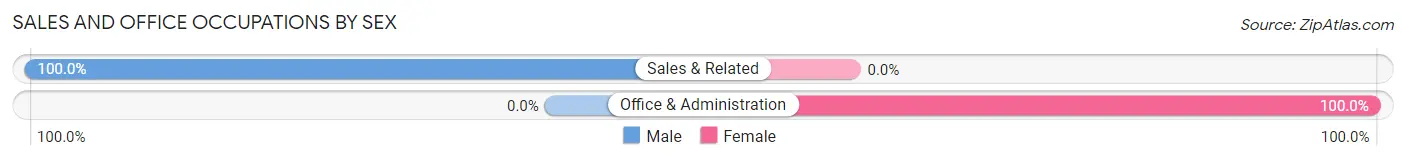
| Occupation | Male | Female |
| Sales & Related | 18 (100.0%) | 0 (0.0%) |
| Office & Administration | 0 (0.0%) | 22 (100.0%) |
| Total (Category) | 18 (45.0%) | 22 (55.0%) |
| Total (Overall) | 211 (70.6%) | 88 (29.4%) |
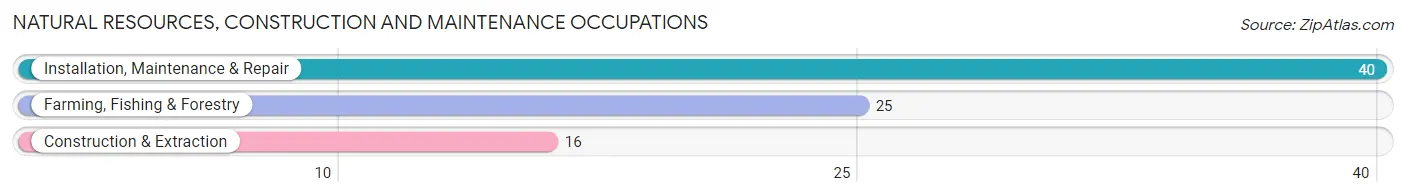
Natural Resources, Construction and Maintenance Occupations
The most common Natural Resources, Construction and Maintenance occupations in Guayabal are Installation, Maintenance & Repair (40 | 13.4%), Farming, Fishing & Forestry (25 | 8.4%), and Construction & Extraction (16 | 5.3%).
Natural Resources, Construction and Maintenance Occupations by Sex
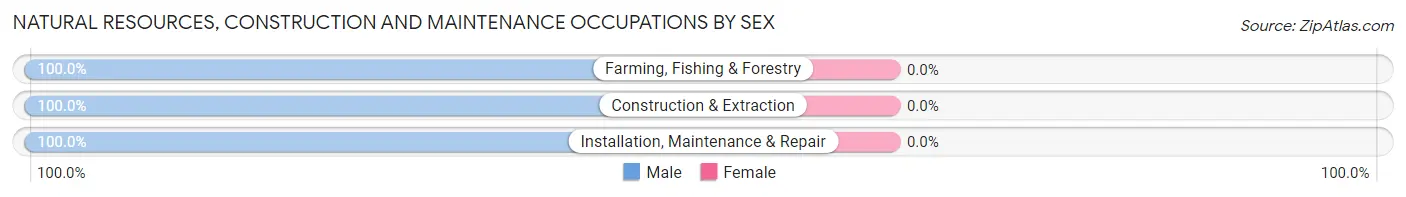
| Occupation | Male | Female |
| Farming, Fishing & Forestry | 25 (100.0%) | 0 (0.0%) |
| Construction & Extraction | 16 (100.0%) | 0 (0.0%) |
| Installation, Maintenance & Repair | 40 (100.0%) | 0 (0.0%) |
| Total (Category) | 81 (100.0%) | 0 (0.0%) |
| Total (Overall) | 211 (70.6%) | 88 (29.4%) |
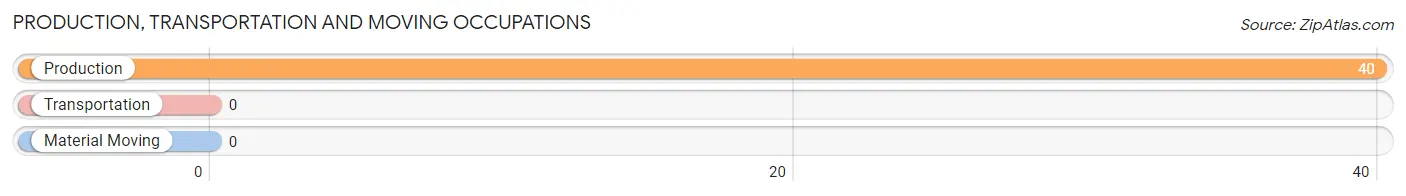
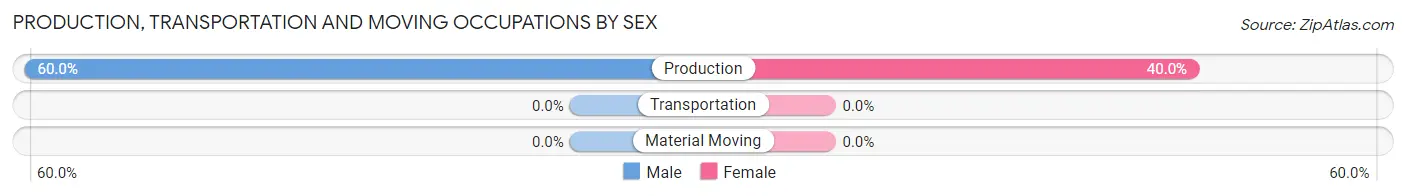
Production, Transportation and Moving Occupations
The most common Production, Transportation and Moving occupations in Guayabal are , and Production (40 | 13.4%).
Production, Transportation and Moving Occupations by Sex
| Occupation | Male | Female |
| Production | 24 (60.0%) | 16 (40.0%) |
| Transportation | 0 (0.0%) | 0 (0.0%) |
| Material Moving | 0 (0.0%) | 0 (0.0%) |
| Total (Category) | 24 (60.0%) | 16 (40.0%) |
| Total (Overall) | 211 (70.6%) | 88 (29.4%) |
Employment Industries by Sex in Guayabal
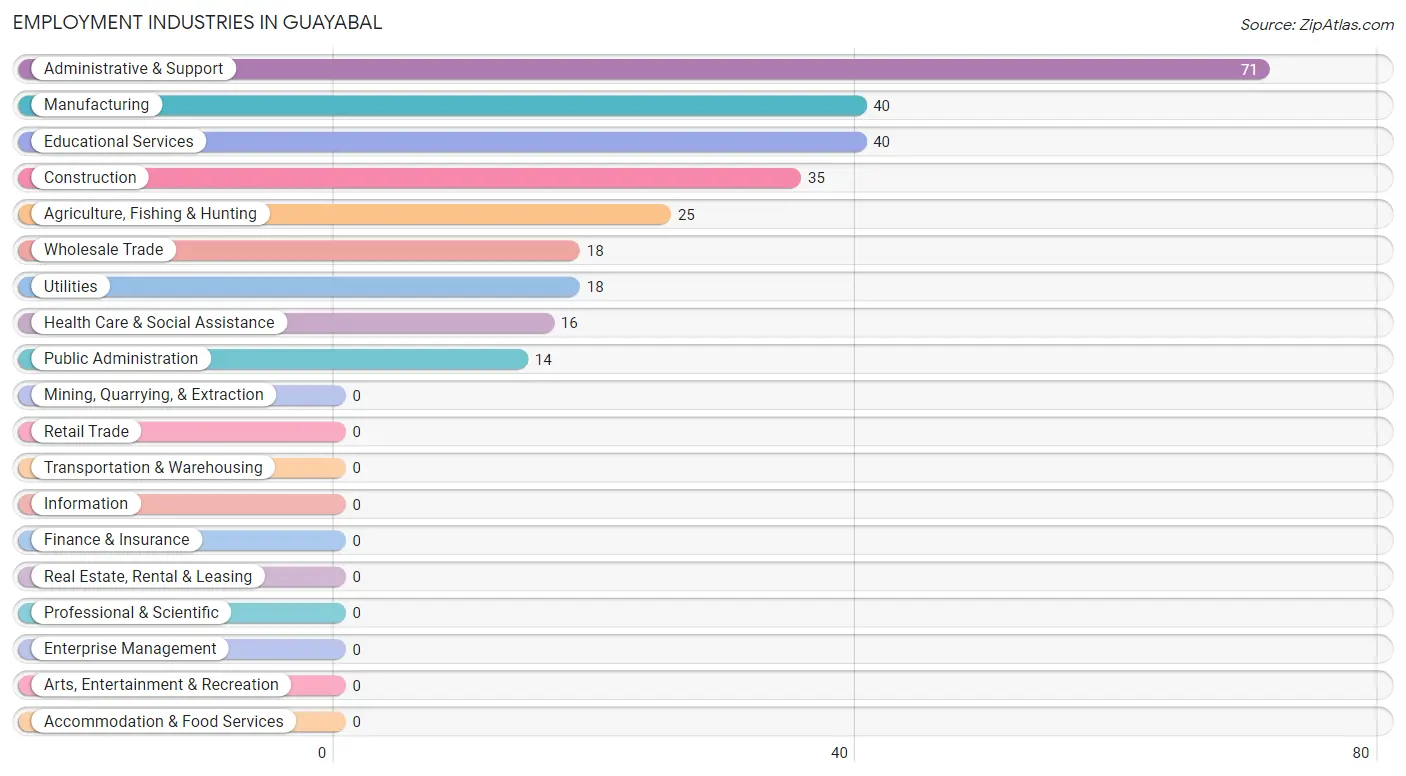
Employment Industries in Guayabal
The major employment industries in Guayabal include Administrative & Support (71 | 23.7%), Manufacturing (40 | 13.4%), Educational Services (40 | 13.4%), Construction (35 | 11.7%), and Agriculture, Fishing & Hunting (25 | 8.4%).
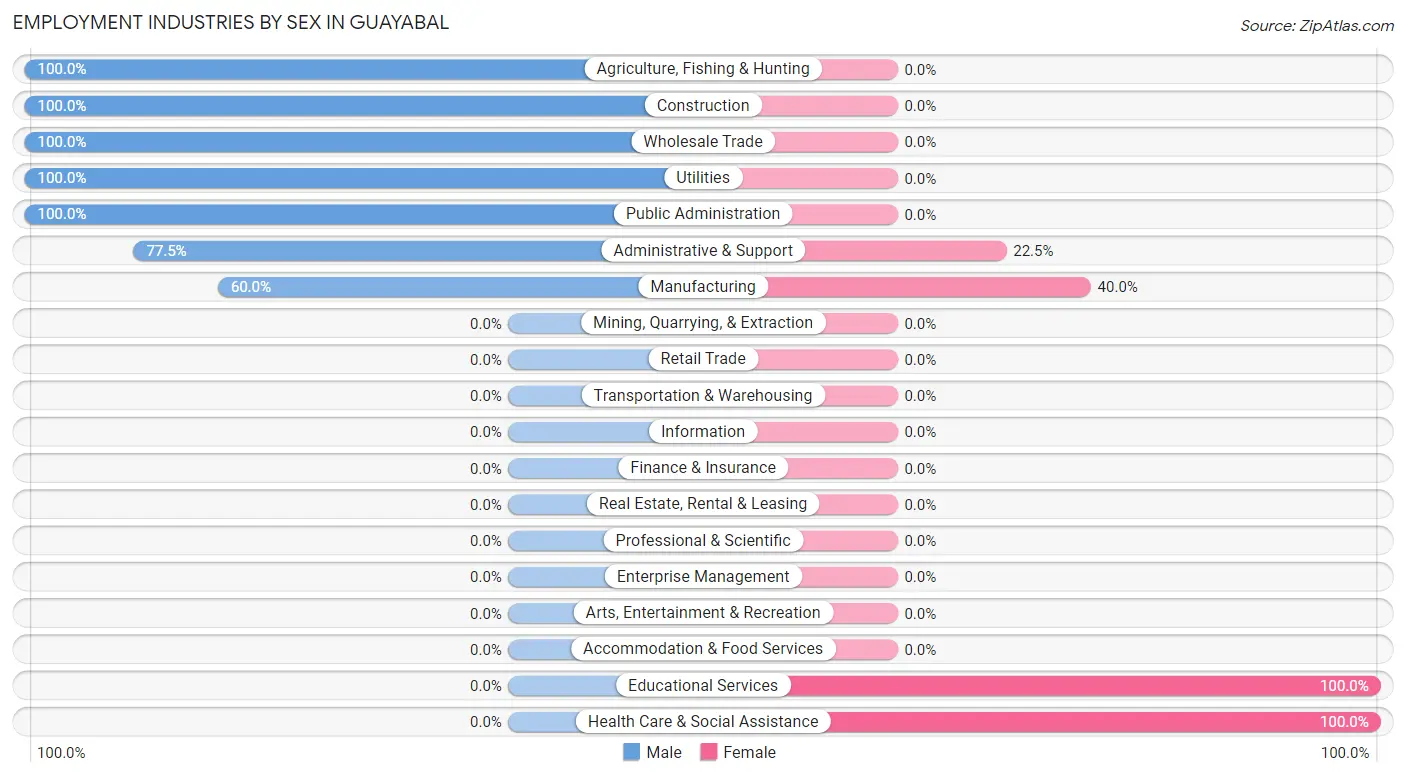
Employment Industries by Sex in Guayabal
The Guayabal industries that see more men than women are Agriculture, Fishing & Hunting (100.0%), Construction (100.0%), and Wholesale Trade (100.0%), whereas the industries that tend to have a higher number of women are Educational Services (100.0%), Health Care & Social Assistance (100.0%), and Manufacturing (40.0%).
| Industry | Male | Female |
| Agriculture, Fishing & Hunting | 25 (100.0%) | 0 (0.0%) |
| Mining, Quarrying, & Extraction | 0 (0.0%) | 0 (0.0%) |
| Construction | 35 (100.0%) | 0 (0.0%) |
| Manufacturing | 24 (60.0%) | 16 (40.0%) |
| Wholesale Trade | 18 (100.0%) | 0 (0.0%) |
| Retail Trade | 0 (0.0%) | 0 (0.0%) |
| Transportation & Warehousing | 0 (0.0%) | 0 (0.0%) |
| Utilities | 18 (100.0%) | 0 (0.0%) |
| Information | 0 (0.0%) | 0 (0.0%) |
| Finance & Insurance | 0 (0.0%) | 0 (0.0%) |
| Real Estate, Rental & Leasing | 0 (0.0%) | 0 (0.0%) |
| Professional & Scientific | 0 (0.0%) | 0 (0.0%) |
| Enterprise Management | 0 (0.0%) | 0 (0.0%) |
| Administrative & Support | 55 (77.5%) | 16 (22.5%) |
| Educational Services | 0 (0.0%) | 40 (100.0%) |
| Health Care & Social Assistance | 0 (0.0%) | 16 (100.0%) |
| Arts, Entertainment & Recreation | 0 (0.0%) | 0 (0.0%) |
| Accommodation & Food Services | 0 (0.0%) | 0 (0.0%) |
| Public Administration | 14 (100.0%) | 0 (0.0%) |
| Total | 211 (70.6%) | 88 (29.4%) |
Education in Guayabal
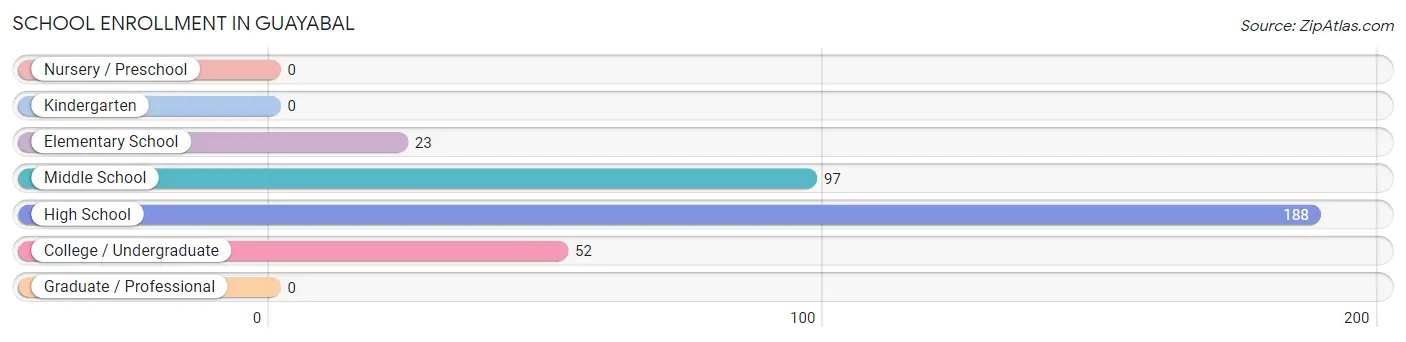
School Enrollment in Guayabal
The most common levels of schooling among the 360 students in Guayabal are high school (188 | 52.2%), middle school (97 | 26.9%), and college / undergraduate (52 | 14.4%).
| School Level | # Students | % Students |
| Nursery / Preschool | 0 | 0.0% |
| Kindergarten | 0 | 0.0% |
| Elementary School | 23 | 6.4% |
| Middle School | 97 | 26.9% |
| High School | 188 | 52.2% |
| College / Undergraduate | 52 | 14.4% |
| Graduate / Professional | 0 | 0.0% |
| Total | 360 | 100.0% |
School Enrollment by Age by Funding Source in Guayabal
Out of a total of 360 students who are enrolled in schools in Guayabal, 97 (26.9%) attend a private institution, while the remaining 263 (73.1%) are enrolled in public schools. The age group of 18 to 19 year olds has the highest likelihood of being enrolled in private schools, with 28 (100.0% in the age bracket) enrolled. Conversely, the age group of 5 to 9 year old has the lowest likelihood of being enrolled in a private school, with 23 (100.0% in the age bracket) attending a public institution.
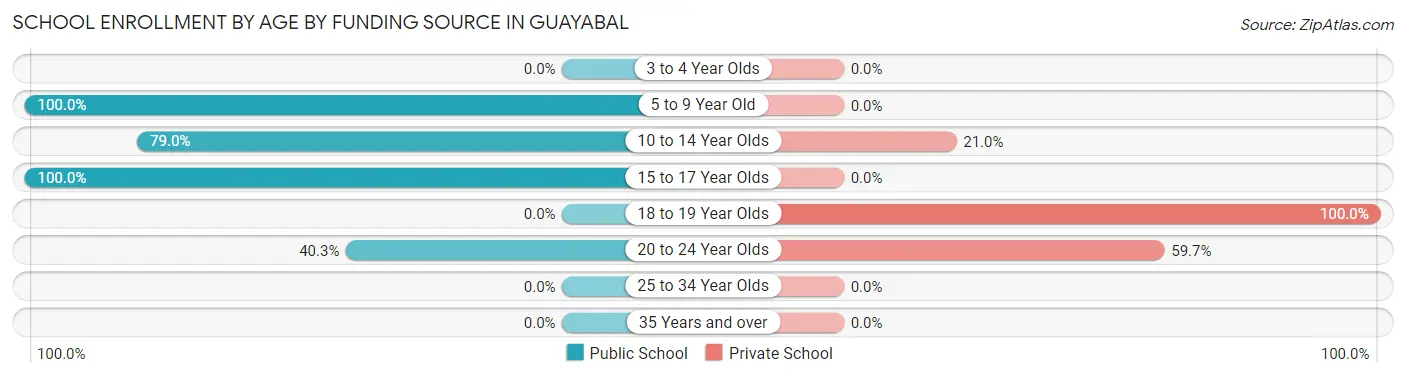
| Age Bracket | Public School | Private School |
| 3 to 4 Year Olds | 0 (0.0%) | 0 (0.0%) |
| 5 to 9 Year Old | 23 (100.0%) | 0 (0.0%) |
| 10 to 14 Year Olds | 98 (79.0%) | 26 (21.0%) |
| 15 to 17 Year Olds | 113 (100.0%) | 0 (0.0%) |
| 18 to 19 Year Olds | 0 (0.0%) | 28 (100.0%) |
| 20 to 24 Year Olds | 29 (40.3%) | 43 (59.7%) |
| 25 to 34 Year Olds | 0 (0.0%) | 0 (0.0%) |
| 35 Years and over | 0 (0.0%) | 0 (0.0%) |
| Total | 263 (73.1%) | 97 (26.9%) |
Educational Attainment by Field of Study in Guayabal
Education (69 | 35.6%), business (61 | 31.4%), psychology (41 | 21.1%), and science & technology (23 | 11.9%) are the most common fields of study among 194 individuals in Guayabal who have obtained a bachelor's degree or higher.
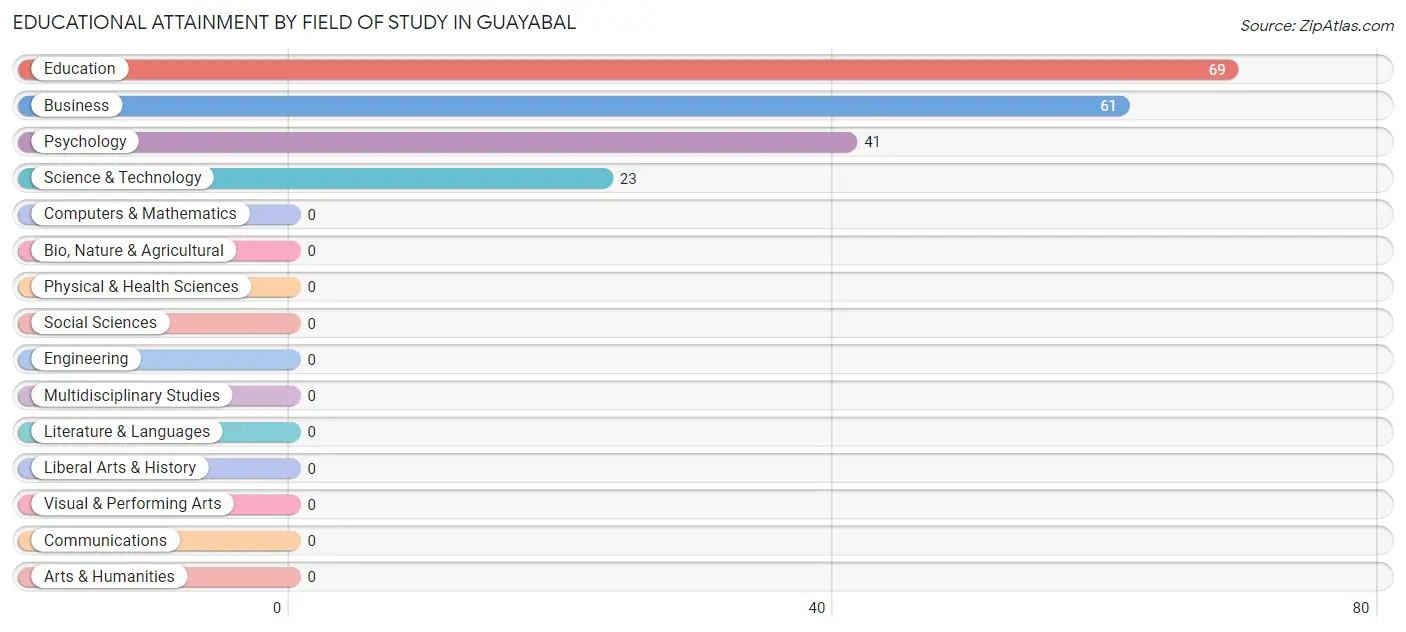
| Field of Study | # Graduates | % Graduates |
| Computers & Mathematics | 0 | 0.0% |
| Bio, Nature & Agricultural | 0 | 0.0% |
| Physical & Health Sciences | 0 | 0.0% |
| Psychology | 41 | 21.1% |
| Social Sciences | 0 | 0.0% |
| Engineering | 0 | 0.0% |
| Multidisciplinary Studies | 0 | 0.0% |
| Science & Technology | 23 | 11.9% |
| Business | 61 | 31.4% |
| Education | 69 | 35.6% |
| Literature & Languages | 0 | 0.0% |
| Liberal Arts & History | 0 | 0.0% |
| Visual & Performing Arts | 0 | 0.0% |
| Communications | 0 | 0.0% |
| Arts & Humanities | 0 | 0.0% |
| Total | 194 | 100.0% |
Transportation & Commute in Guayabal
Vehicle Availability by Sex in Guayabal
The most prevalent vehicle ownership categories in Guayabal are males with 2 vehicles (97, accounting for 46.0%) and females with 2 vehicles (56, making up 110.2%).
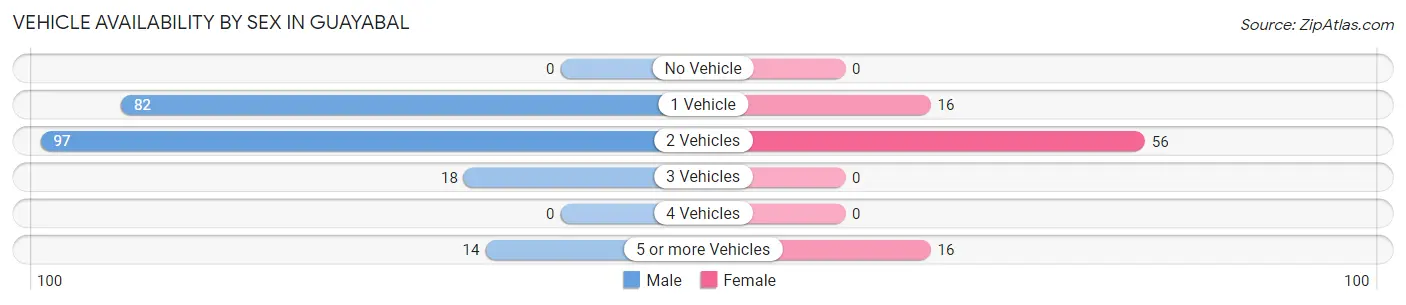
| Vehicles Available | Male | Female |
| No Vehicle | 0 (0.0%) | 0 (0.0%) |
| 1 Vehicle | 82 (38.9%) | 16 (18.2%) |
| 2 Vehicles | 97 (46.0%) | 56 (63.6%) |
| 3 Vehicles | 18 (8.5%) | 0 (0.0%) |
| 4 Vehicles | 0 (0.0%) | 0 (0.0%) |
| 5 or more Vehicles | 14 (6.6%) | 16 (18.2%) |
| Total | 211 (100.0%) | 88 (100.0%) |
Commute Time in Guayabal
The most frequently occuring commute durations in Guayabal are 15 to 19 minutes (136 commuters, 49.1%), 30 to 34 minutes (50 commuters, 18.0%), and 10 to 14 minutes (42 commuters, 15.2%).
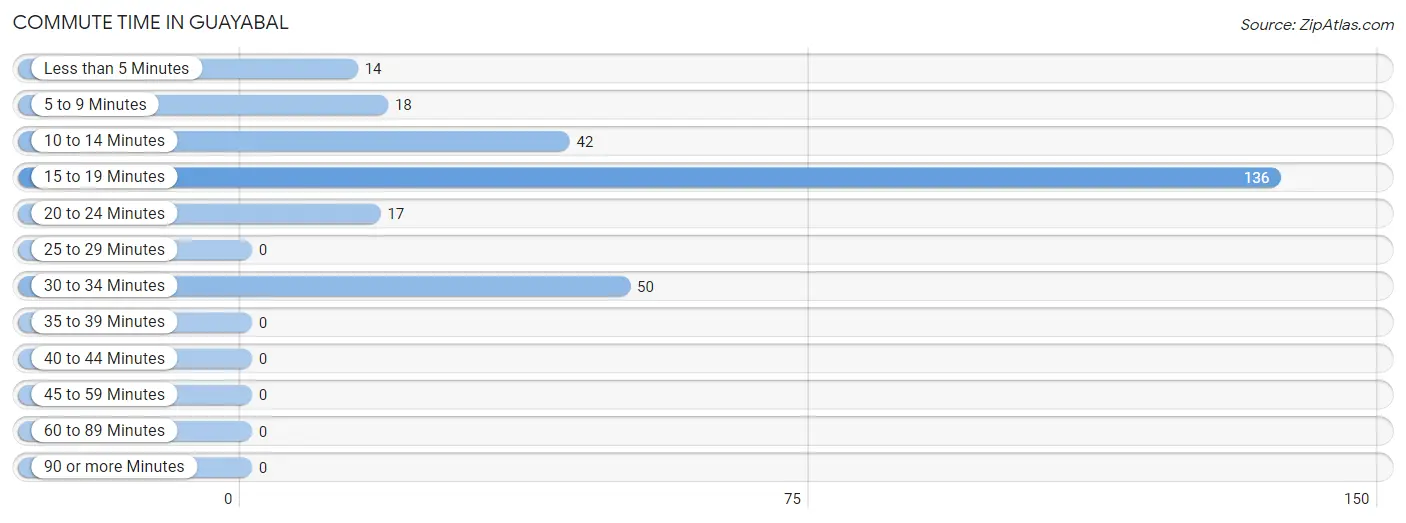
| Commute Time | # Commuters | % Commuters |
| Less than 5 Minutes | 14 | 5.1% |
| 5 to 9 Minutes | 18 | 6.5% |
| 10 to 14 Minutes | 42 | 15.2% |
| 15 to 19 Minutes | 136 | 49.1% |
| 20 to 24 Minutes | 17 | 6.1% |
| 25 to 29 Minutes | 0 | 0.0% |
| 30 to 34 Minutes | 50 | 18.0% |
| 35 to 39 Minutes | 0 | 0.0% |
| 40 to 44 Minutes | 0 | 0.0% |
| 45 to 59 Minutes | 0 | 0.0% |
| 60 to 89 Minutes | 0 | 0.0% |
| 90 or more Minutes | 0 | 0.0% |
Commute Time by Sex in Guayabal
The most common commute times in Guayabal are 15 to 19 minutes (98 commuters, 51.8%) for males and 30 to 34 minutes (50 commuters, 56.8%) for females.
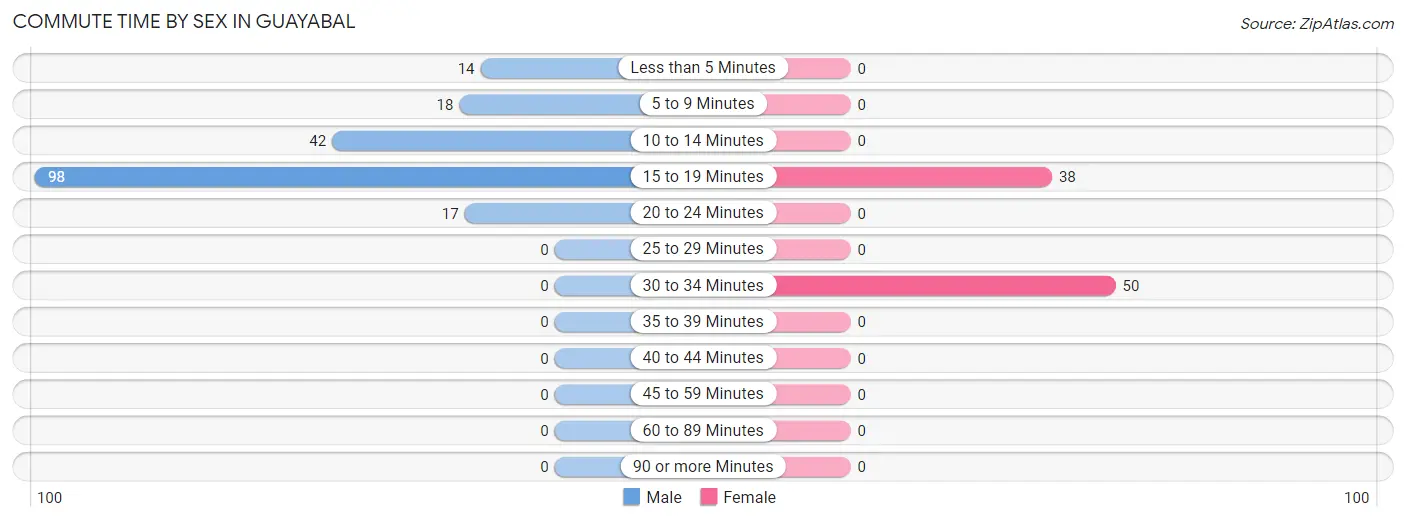
| Commute Time | Male | Female |
| Less than 5 Minutes | 14 (7.4%) | 0 (0.0%) |
| 5 to 9 Minutes | 18 (9.5%) | 0 (0.0%) |
| 10 to 14 Minutes | 42 (22.2%) | 0 (0.0%) |
| 15 to 19 Minutes | 98 (51.8%) | 38 (43.2%) |
| 20 to 24 Minutes | 17 (9.0%) | 0 (0.0%) |
| 25 to 29 Minutes | 0 (0.0%) | 0 (0.0%) |
| 30 to 34 Minutes | 0 (0.0%) | 50 (56.8%) |
| 35 to 39 Minutes | 0 (0.0%) | 0 (0.0%) |
| 40 to 44 Minutes | 0 (0.0%) | 0 (0.0%) |
| 45 to 59 Minutes | 0 (0.0%) | 0 (0.0%) |
| 60 to 89 Minutes | 0 (0.0%) | 0 (0.0%) |
| 90 or more Minutes | 0 (0.0%) | 0 (0.0%) |
Time of Departure to Work by Sex in Guayabal
The most frequent times of departure to work in Guayabal are 7:00 AM to 7:29 AM (72, 38.1%) for males and 7:30 AM to 7:59 AM (56, 63.6%) for females.
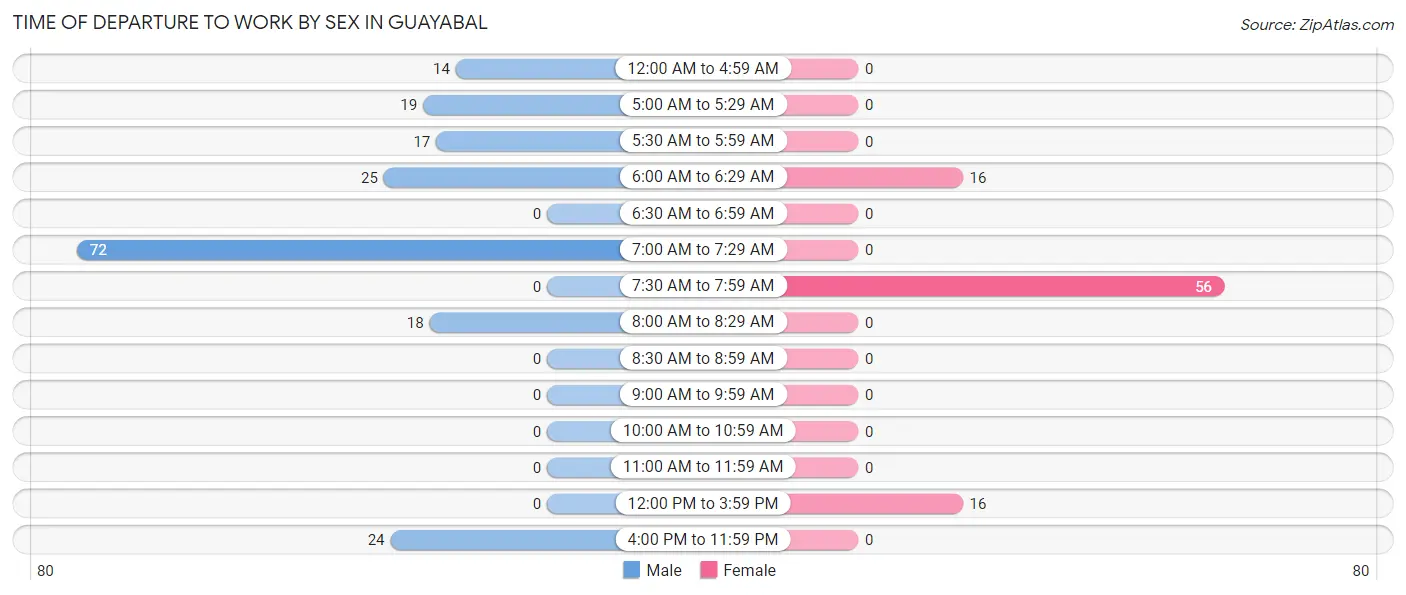
| Time of Departure | Male | Female |
| 12:00 AM to 4:59 AM | 14 (7.4%) | 0 (0.0%) |
| 5:00 AM to 5:29 AM | 19 (10.1%) | 0 (0.0%) |
| 5:30 AM to 5:59 AM | 17 (9.0%) | 0 (0.0%) |
| 6:00 AM to 6:29 AM | 25 (13.2%) | 16 (18.2%) |
| 6:30 AM to 6:59 AM | 0 (0.0%) | 0 (0.0%) |
| 7:00 AM to 7:29 AM | 72 (38.1%) | 0 (0.0%) |
| 7:30 AM to 7:59 AM | 0 (0.0%) | 56 (63.6%) |
| 8:00 AM to 8:29 AM | 18 (9.5%) | 0 (0.0%) |
| 8:30 AM to 8:59 AM | 0 (0.0%) | 0 (0.0%) |
| 9:00 AM to 9:59 AM | 0 (0.0%) | 0 (0.0%) |
| 10:00 AM to 10:59 AM | 0 (0.0%) | 0 (0.0%) |
| 11:00 AM to 11:59 AM | 0 (0.0%) | 0 (0.0%) |
| 12:00 PM to 3:59 PM | 0 (0.0%) | 16 (18.2%) |
| 4:00 PM to 11:59 PM | 24 (12.7%) | 0 (0.0%) |
| Total | 189 (100.0%) | 88 (100.0%) |
Housing Occupancy in Guayabal
Occupancy by Ownership in Guayabal
Of the total 569 dwellings in Guayabal, owner-occupied units account for 481 (84.5%), while renter-occupied units make up 88 (15.5%).
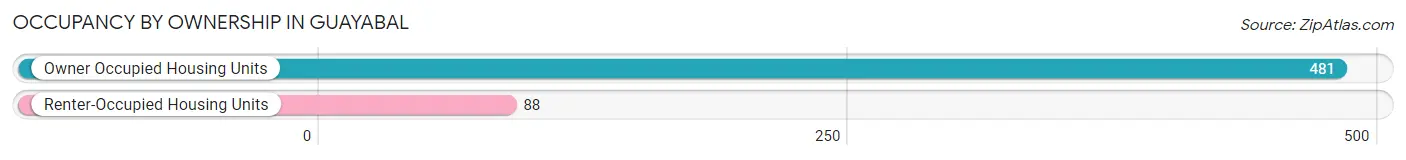
| Occupancy | # Housing Units | % Housing Units |
| Owner Occupied Housing Units | 481 | 84.5% |
| Renter-Occupied Housing Units | 88 | 15.5% |
| Total Occupied Housing Units | 569 | 100.0% |
Occupancy by Household Size in Guayabal
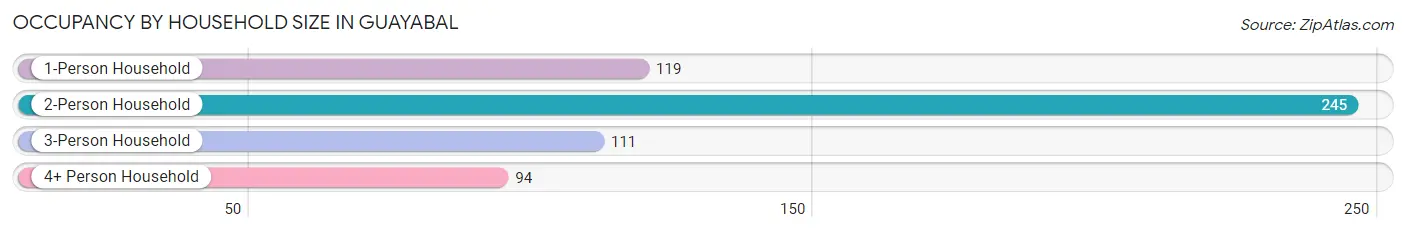
| Household Size | # Housing Units | % Housing Units |
| 1-Person Household | 119 | 20.9% |
| 2-Person Household | 245 | 43.1% |
| 3-Person Household | 111 | 19.5% |
| 4+ Person Household | 94 | 16.5% |
| Total Housing Units | 569 | 100.0% |
Occupancy by Ownership by Household Size in Guayabal
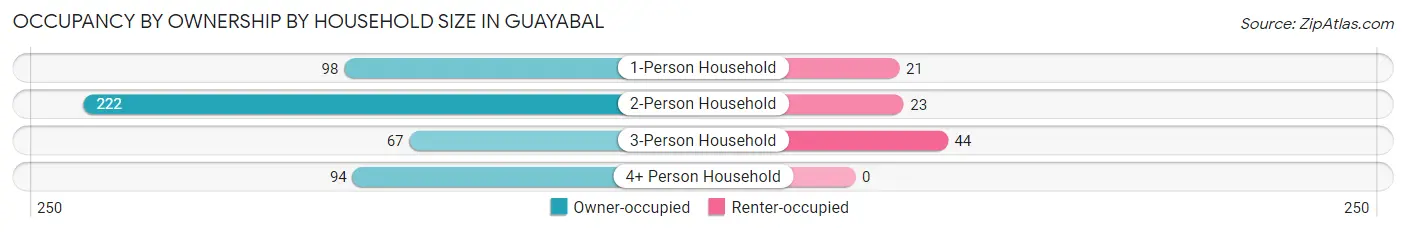
| Household Size | Owner-occupied | Renter-occupied |
| 1-Person Household | 98 (82.4%) | 21 (17.6%) |
| 2-Person Household | 222 (90.6%) | 23 (9.4%) |
| 3-Person Household | 67 (60.4%) | 44 (39.6%) |
| 4+ Person Household | 94 (100.0%) | 0 (0.0%) |
| Total Housing Units | 481 (84.5%) | 88 (15.5%) |
Occupancy by Educational Attainment in Guayabal
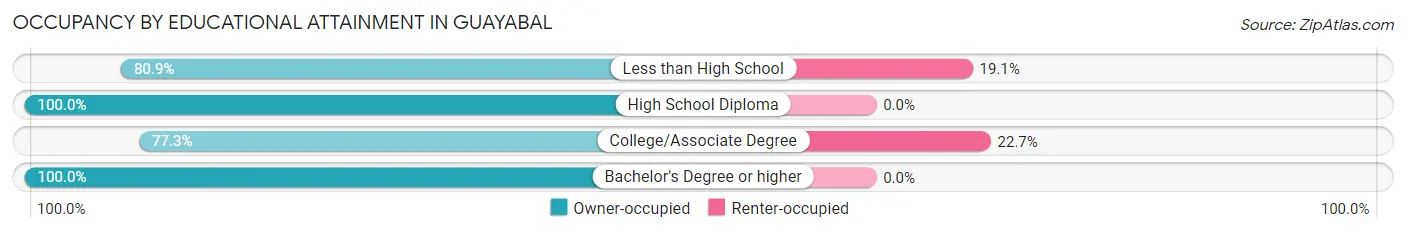
| Household Size | Owner-occupied | Renter-occupied |
| Less than High School | 165 (80.9%) | 39 (19.1%) |
| High School Diploma | 114 (100.0%) | 0 (0.0%) |
| College/Associate Degree | 167 (77.3%) | 49 (22.7%) |
| Bachelor's Degree or higher | 35 (100.0%) | 0 (0.0%) |
Occupancy by Age of Householder in Guayabal
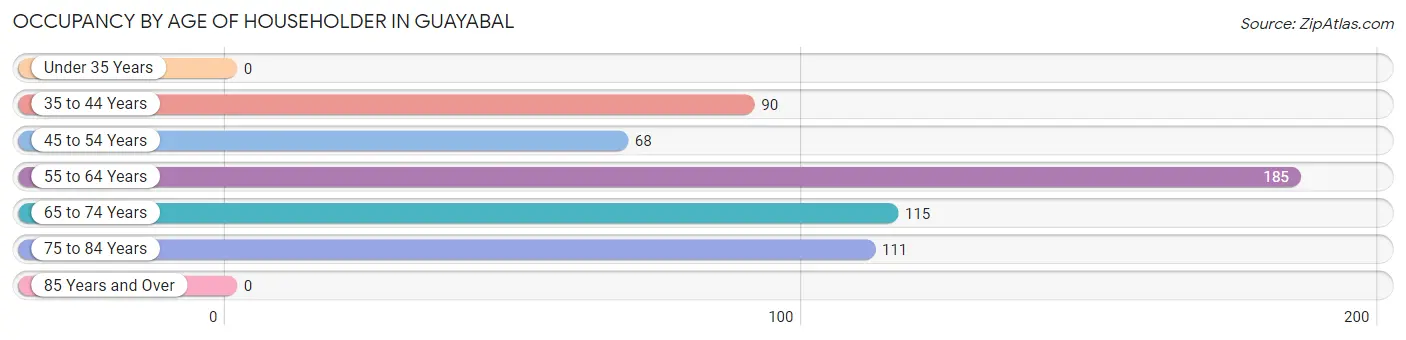
| Age Bracket | # Households | % Households |
| Under 35 Years | 0 | 0.0% |
| 35 to 44 Years | 90 | 15.8% |
| 45 to 54 Years | 68 | 11.9% |
| 55 to 64 Years | 185 | 32.5% |
| 65 to 74 Years | 115 | 20.2% |
| 75 to 84 Years | 111 | 19.5% |
| 85 Years and Over | 0 | 0.0% |
| Total | 569 | 100.0% |
Housing Finances in Guayabal
Median Income by Occupancy in Guayabal
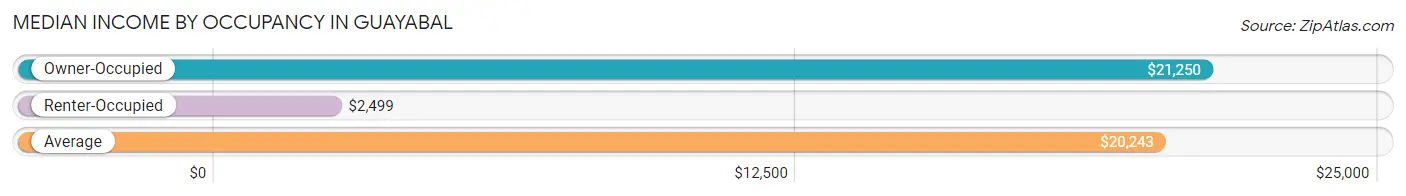
| Occupancy Type | # Households | Median Income |
| Owner-Occupied | 481 (84.5%) | $21,250 |
| Renter-Occupied | 88 (15.5%) | $2,499 |
| Average | 569 (100.0%) | $20,243 |
Occupancy by Householder Income Bracket in Guayabal
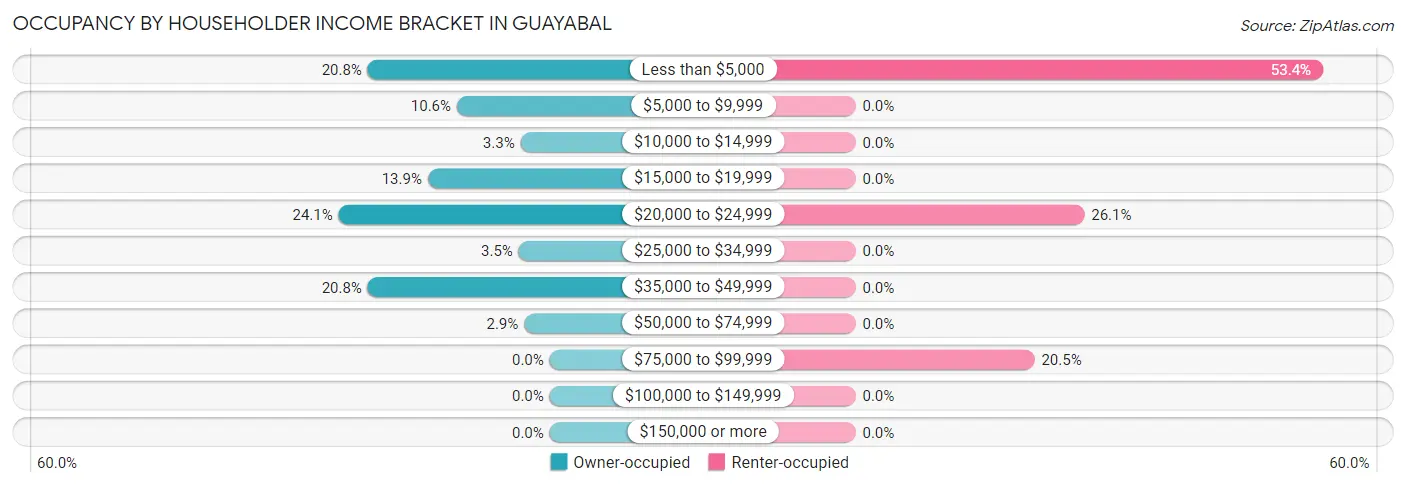
| Income Bracket | Owner-occupied | Renter-occupied |
| Less than $5,000 | 100 (20.8%) | 47 (53.4%) |
| $5,000 to $9,999 | 51 (10.6%) | 0 (0.0%) |
| $10,000 to $14,999 | 16 (3.3%) | 0 (0.0%) |
| $15,000 to $19,999 | 67 (13.9%) | 0 (0.0%) |
| $20,000 to $24,999 | 116 (24.1%) | 23 (26.1%) |
| $25,000 to $34,999 | 17 (3.5%) | 0 (0.0%) |
| $35,000 to $49,999 | 100 (20.8%) | 0 (0.0%) |
| $50,000 to $74,999 | 14 (2.9%) | 0 (0.0%) |
| $75,000 to $99,999 | 0 (0.0%) | 18 (20.4%) |
| $100,000 to $149,999 | 0 (0.0%) | 0 (0.0%) |
| $150,000 or more | 0 (0.0%) | 0 (0.0%) |
| Total | 481 (100.0%) | 88 (100.0%) |
Monthly Housing Cost Tiers in Guayabal
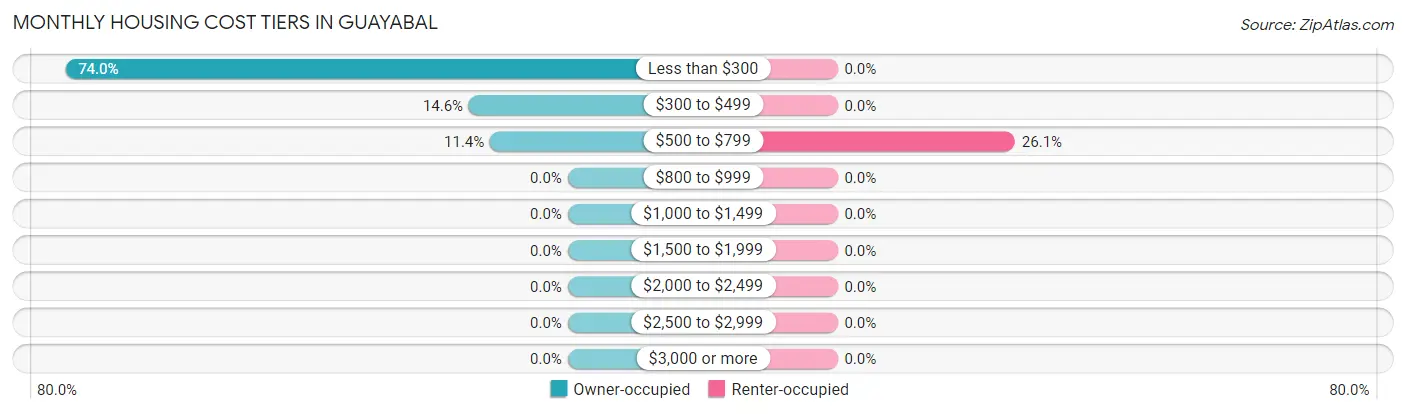
| Monthly Cost | Owner-occupied | Renter-occupied |
| Less than $300 | 356 (74.0%) | 0 (0.0%) |
| $300 to $499 | 70 (14.5%) | 0 (0.0%) |
| $500 to $799 | 55 (11.4%) | 23 (26.1%) |
| $800 to $999 | 0 (0.0%) | 0 (0.0%) |
| $1,000 to $1,499 | 0 (0.0%) | 0 (0.0%) |
| $1,500 to $1,999 | 0 (0.0%) | 0 (0.0%) |
| $2,000 to $2,499 | 0 (0.0%) | 0 (0.0%) |
| $2,500 to $2,999 | 0 (0.0%) | 0 (0.0%) |
| $3,000 or more | 0 (0.0%) | 0 (0.0%) |
| Total | 481 (100.0%) | 88 (100.0%) |
Physical Housing Characteristics in Guayabal
Housing Structures in Guayabal
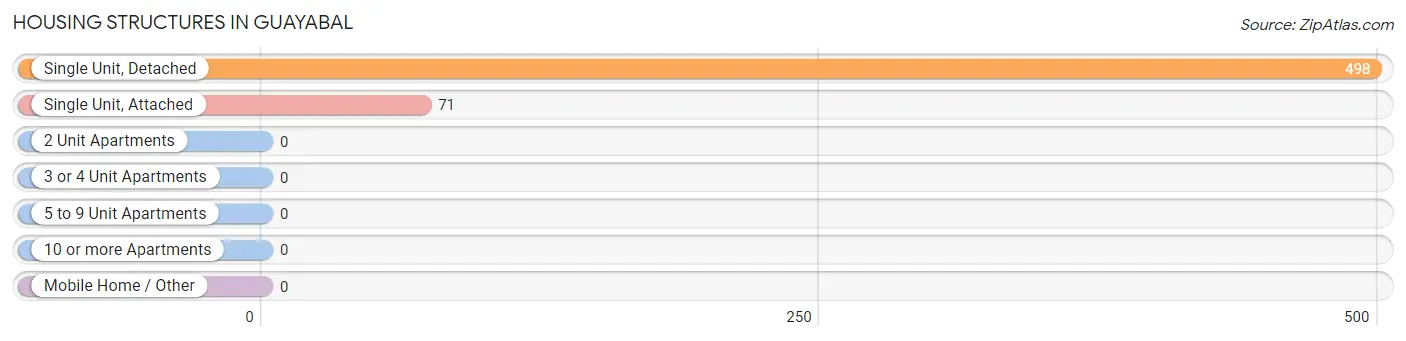
| Structure Type | # Housing Units | % Housing Units |
| Single Unit, Detached | 498 | 87.5% |
| Single Unit, Attached | 71 | 12.5% |
| 2 Unit Apartments | 0 | 0.0% |
| 3 or 4 Unit Apartments | 0 | 0.0% |
| 5 to 9 Unit Apartments | 0 | 0.0% |
| 10 or more Apartments | 0 | 0.0% |
| Mobile Home / Other | 0 | 0.0% |
| Total | 569 | 100.0% |
Housing Structures by Occupancy in Guayabal
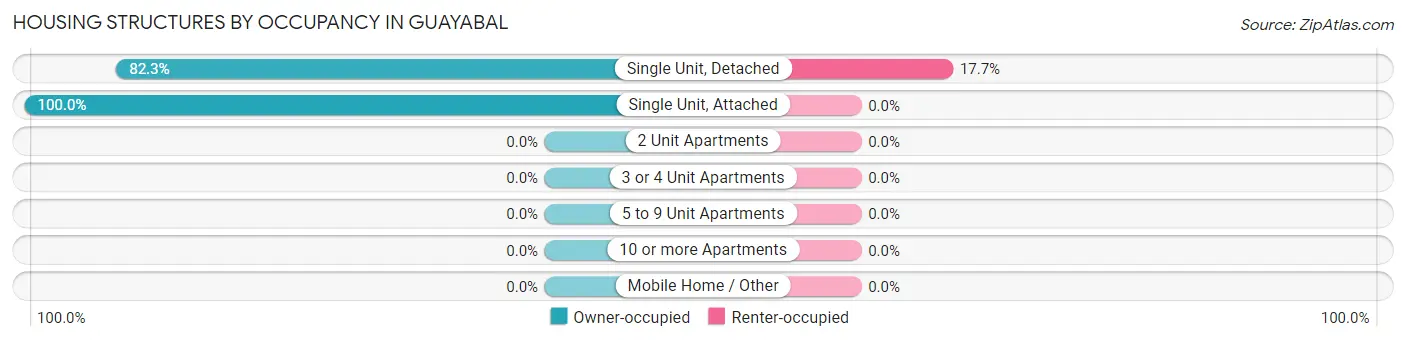
| Structure Type | Owner-occupied | Renter-occupied |
| Single Unit, Detached | 410 (82.3%) | 88 (17.7%) |
| Single Unit, Attached | 71 (100.0%) | 0 (0.0%) |
| 2 Unit Apartments | 0 (0.0%) | 0 (0.0%) |
| 3 or 4 Unit Apartments | 0 (0.0%) | 0 (0.0%) |
| 5 to 9 Unit Apartments | 0 (0.0%) | 0 (0.0%) |
| 10 or more Apartments | 0 (0.0%) | 0 (0.0%) |
| Mobile Home / Other | 0 (0.0%) | 0 (0.0%) |
| Total | 481 (84.5%) | 88 (15.5%) |
Housing Structures by Number of Rooms in Guayabal
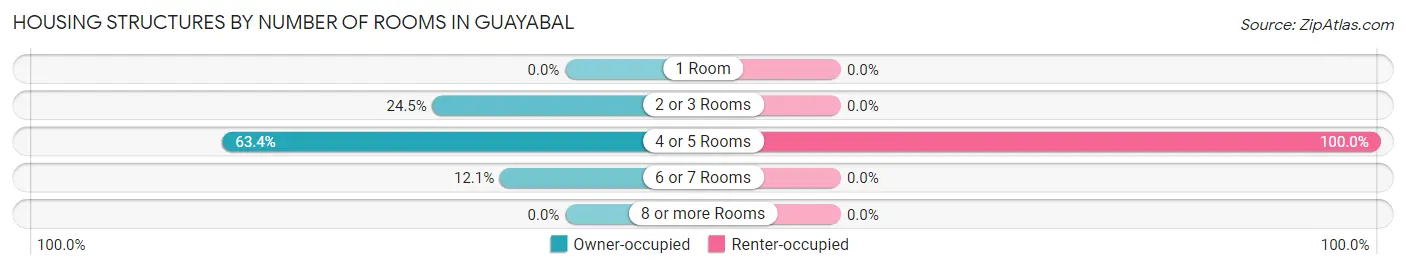
| Number of Rooms | Owner-occupied | Renter-occupied |
| 1 Room | 0 (0.0%) | 0 (0.0%) |
| 2 or 3 Rooms | 118 (24.5%) | 0 (0.0%) |
| 4 or 5 Rooms | 305 (63.4%) | 88 (100.0%) |
| 6 or 7 Rooms | 58 (12.1%) | 0 (0.0%) |
| 8 or more Rooms | 0 (0.0%) | 0 (0.0%) |
| Total | 481 (100.0%) | 88 (100.0%) |
Housing Structure by Heating Type in Guayabal
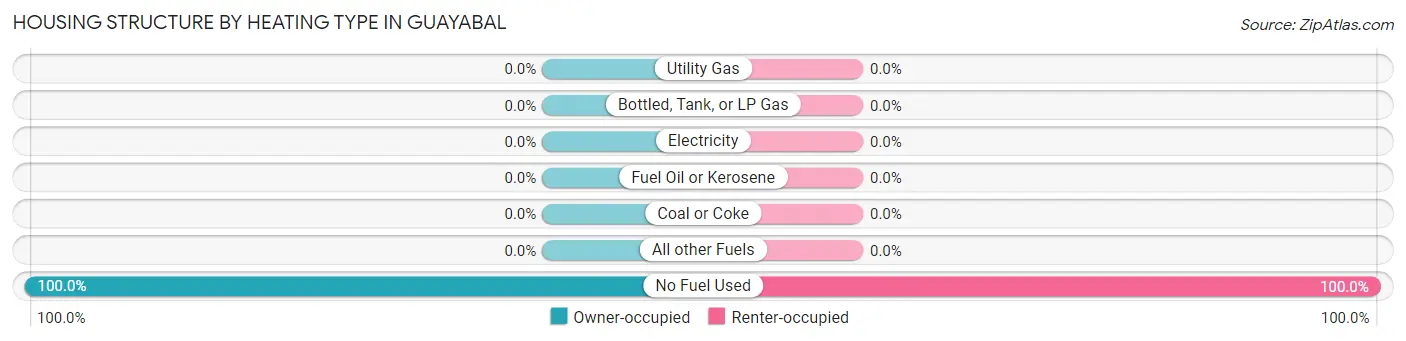
| Heating Type | Owner-occupied | Renter-occupied |
| Utility Gas | 0 (0.0%) | 0 (0.0%) |
| Bottled, Tank, or LP Gas | 0 (0.0%) | 0 (0.0%) |
| Electricity | 0 (0.0%) | 0 (0.0%) |
| Fuel Oil or Kerosene | 0 (0.0%) | 0 (0.0%) |
| Coal or Coke | 0 (0.0%) | 0 (0.0%) |
| All other Fuels | 0 (0.0%) | 0 (0.0%) |
| No Fuel Used | 481 (100.0%) | 88 (100.0%) |
| Total | 481 (100.0%) | 88 (100.0%) |
Household Vehicle Usage in Guayabal
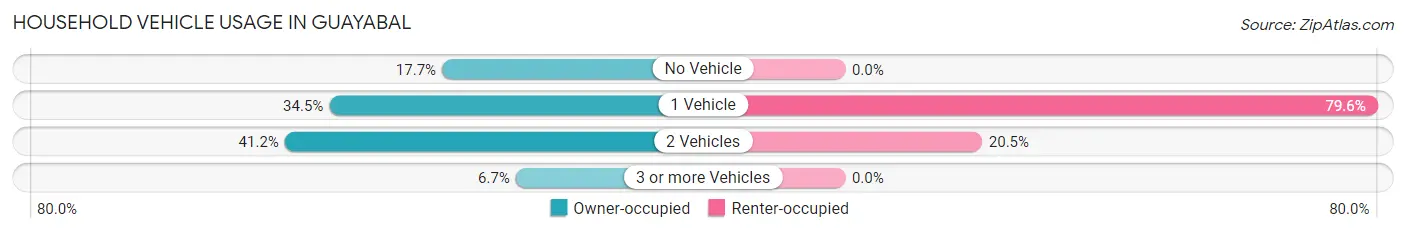
| Vehicles per Household | Owner-occupied | Renter-occupied |
| No Vehicle | 85 (17.7%) | 0 (0.0%) |
| 1 Vehicle | 166 (34.5%) | 70 (79.5%) |
| 2 Vehicles | 198 (41.2%) | 18 (20.4%) |
| 3 or more Vehicles | 32 (6.7%) | 0 (0.0%) |
| Total | 481 (100.0%) | 88 (100.0%) |
Real Estate & Mortgages in Guayabal
Real Estate and Mortgage Overview in Guayabal
| Characteristic | Without Mortgage | With Mortgage |
| Housing Units | 426 | 55 |
| Median Property Value | $76,700 | $129,000 |
| Median Household Income | $18,779 | $0 |
| Monthly Housing Costs | $198 | $0 |
| Real Estate Taxes | - | - |
Property Value by Mortgage Status in Guayabal
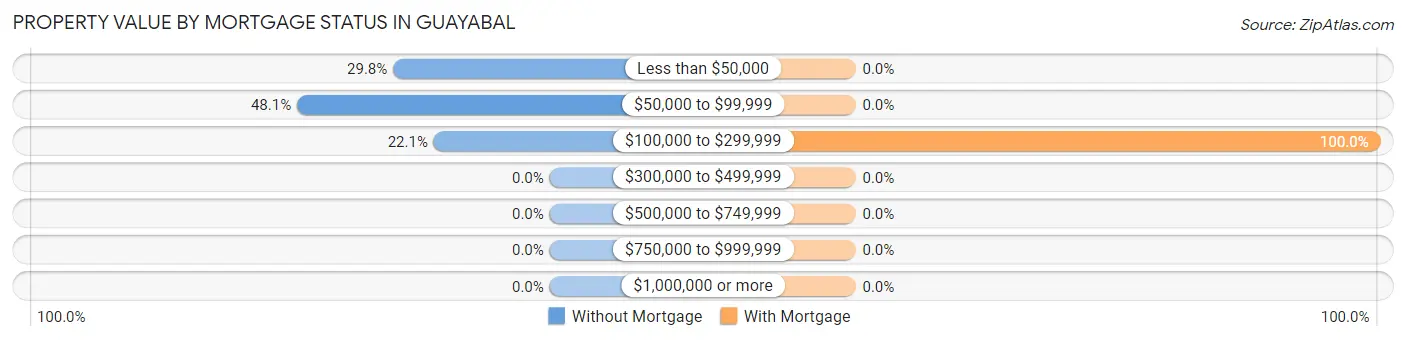
| Property Value | Without Mortgage | With Mortgage |
| Less than $50,000 | 127 (29.8%) | 0 (0.0%) |
| $50,000 to $99,999 | 205 (48.1%) | 0 (0.0%) |
| $100,000 to $299,999 | 94 (22.1%) | 55 (100.0%) |
| $300,000 to $499,999 | 0 (0.0%) | 0 (0.0%) |
| $500,000 to $749,999 | 0 (0.0%) | 0 (0.0%) |
| $750,000 to $999,999 | 0 (0.0%) | 0 (0.0%) |
| $1,000,000 or more | 0 (0.0%) | 0 (0.0%) |
| Total | 426 (100.0%) | 55 (100.0%) |
Household Income by Mortgage Status in Guayabal
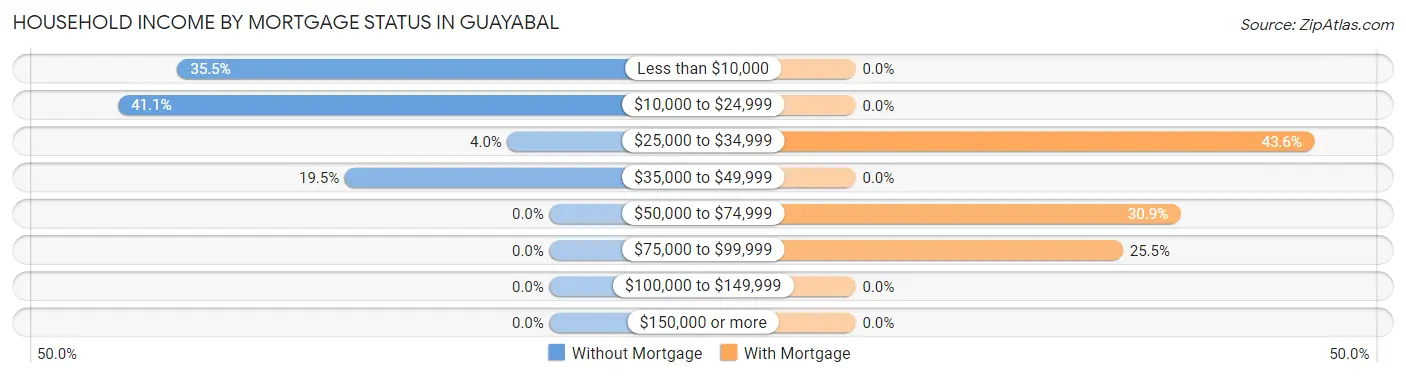
| Household Income | Without Mortgage | With Mortgage |
| Less than $10,000 | 151 (35.4%) | 0 (0.0%) |
| $10,000 to $24,999 | 175 (41.1%) | 0 (0.0%) |
| $25,000 to $34,999 | 17 (4.0%) | 24 (43.6%) |
| $35,000 to $49,999 | 83 (19.5%) | 0 (0.0%) |
| $50,000 to $74,999 | 0 (0.0%) | 17 (30.9%) |
| $75,000 to $99,999 | 0 (0.0%) | 14 (25.5%) |
| $100,000 to $149,999 | 0 (0.0%) | 0 (0.0%) |
| $150,000 or more | 0 (0.0%) | 0 (0.0%) |
| Total | 426 (100.0%) | 55 (100.0%) |
Property Value to Household Income Ratio in Guayabal
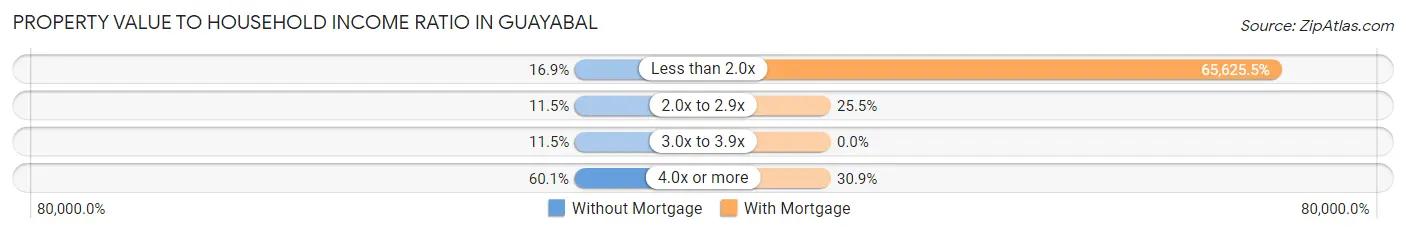
| Value-to-Income Ratio | Without Mortgage | With Mortgage |
| Less than 2.0x | 72 (16.9%) | 36,094 (65,625.5%) |
| 2.0x to 2.9x | 49 (11.5%) | 14 (25.5%) |
| 3.0x to 3.9x | 49 (11.5%) | 0 (0.0%) |
| 4.0x or more | 256 (60.1%) | 17 (30.9%) |
| Total | 426 (100.0%) | 55 (100.0%) |
Real Estate Taxes by Mortgage Status in Guayabal
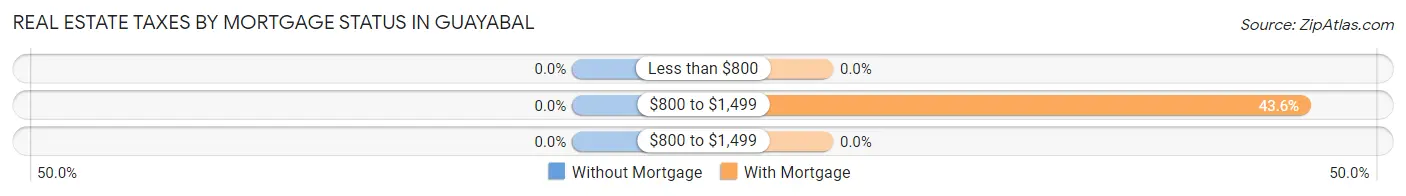
| Property Taxes | Without Mortgage | With Mortgage |
| Less than $800 | 0 (0.0%) | 0 (0.0%) |
| $800 to $1,499 | 0 (0.0%) | 24 (43.6%) |
| $800 to $1,499 | 0 (0.0%) | 0 (0.0%) |
| Total | 426 (100.0%) | 55 (100.0%) |
Health & Disability in Guayabal
Health Insurance Coverage by Age in Guayabal
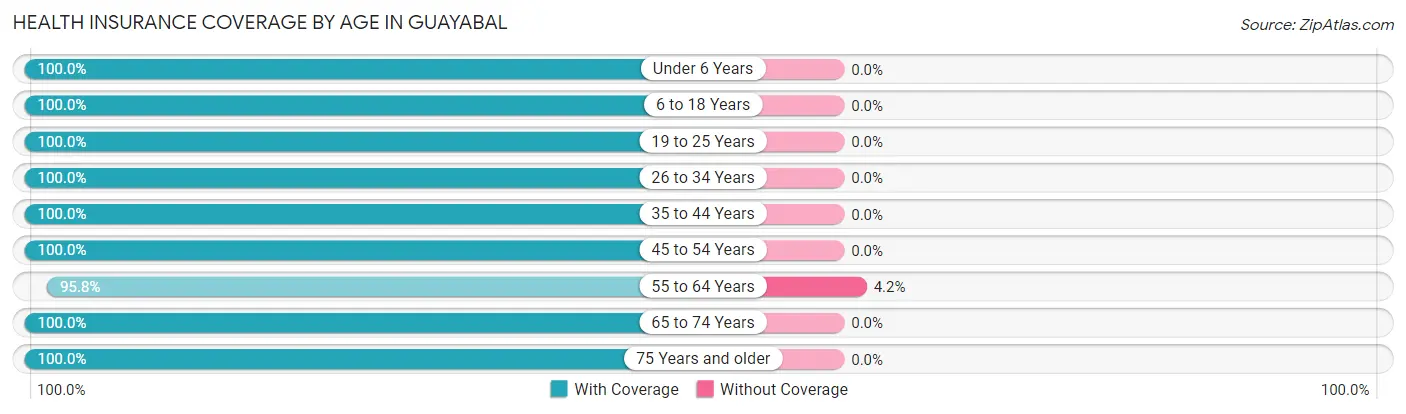
| Age Bracket | With Coverage | Without Coverage |
| Under 6 Years | 25 (100.0%) | 0 (0.0%) |
| 6 to 18 Years | 260 (100.0%) | 0 (0.0%) |
| 19 to 25 Years | 144 (100.0%) | 0 (0.0%) |
| 26 to 34 Years | 59 (100.0%) | 0 (0.0%) |
| 35 to 44 Years | 90 (100.0%) | 0 (0.0%) |
| 45 to 54 Years | 204 (100.0%) | 0 (0.0%) |
| 55 to 64 Years | 298 (95.8%) | 13 (4.2%) |
| 65 to 74 Years | 256 (100.0%) | 0 (0.0%) |
| 75 Years and older | 143 (100.0%) | 0 (0.0%) |
| Total | 1,479 (99.1%) | 13 (0.9%) |
Health Insurance Coverage by Citizenship Status in Guayabal
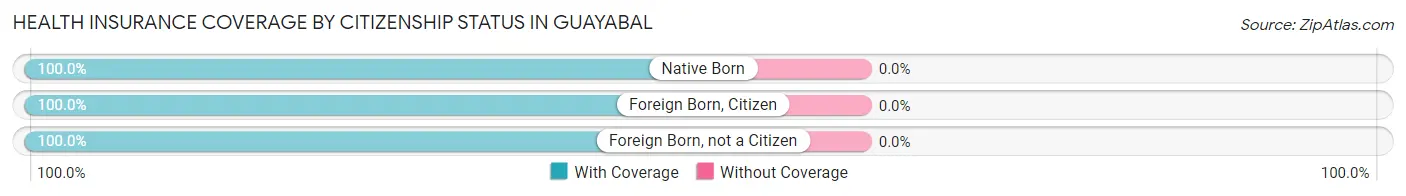
| Citizenship Status | With Coverage | Without Coverage |
| Native Born | 25 (100.0%) | 0 (0.0%) |
| Foreign Born, Citizen | 260 (100.0%) | 0 (0.0%) |
| Foreign Born, not a Citizen | 144 (100.0%) | 0 (0.0%) |
Health Insurance Coverage by Household Income in Guayabal
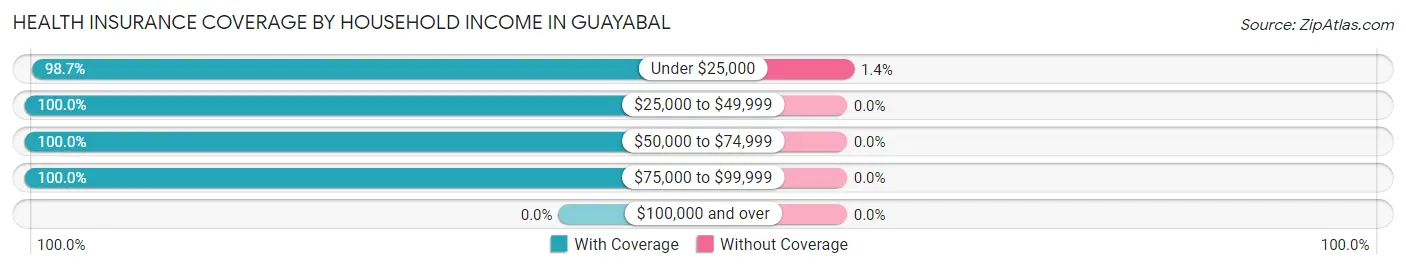
| Household Income | With Coverage | Without Coverage |
| Under $25,000 | 953 (98.7%) | 13 (1.3%) |
| $25,000 to $49,999 | 350 (100.0%) | 0 (0.0%) |
| $50,000 to $74,999 | 67 (100.0%) | 0 (0.0%) |
| $75,000 to $99,999 | 90 (100.0%) | 0 (0.0%) |
| $100,000 and over | 0 (0.0%) | 0 (0.0%) |
Public vs Private Health Insurance Coverage by Age in Guayabal
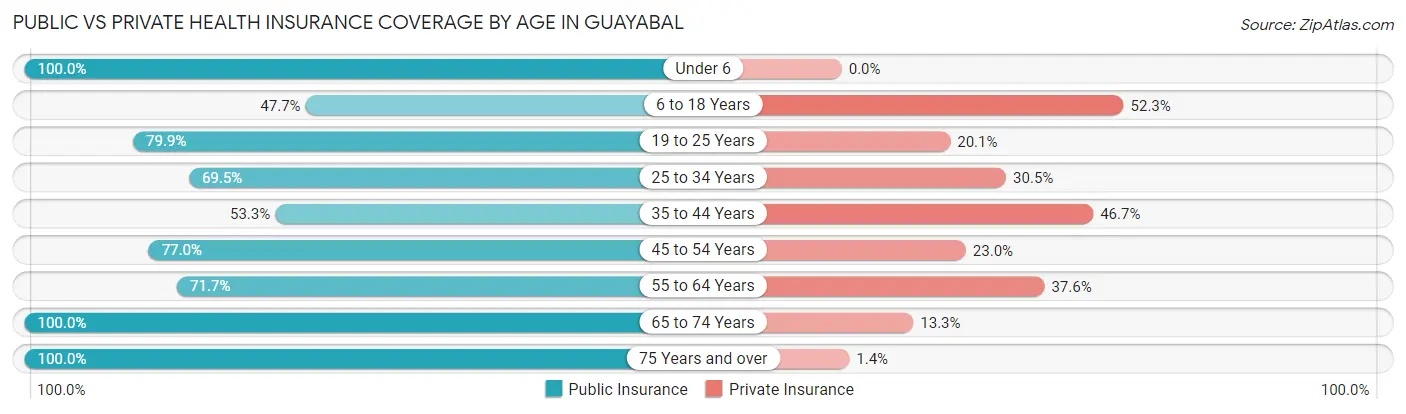
| Age Bracket | Public Insurance | Private Insurance |
| Under 6 | 25 (100.0%) | 0 (0.0%) |
| 6 to 18 Years | 124 (47.7%) | 136 (52.3%) |
| 19 to 25 Years | 115 (79.9%) | 29 (20.1%) |
| 25 to 34 Years | 41 (69.5%) | 18 (30.5%) |
| 35 to 44 Years | 48 (53.3%) | 42 (46.7%) |
| 45 to 54 Years | 157 (77.0%) | 47 (23.0%) |
| 55 to 64 Years | 223 (71.7%) | 117 (37.6%) |
| 65 to 74 Years | 256 (100.0%) | 34 (13.3%) |
| 75 Years and over | 143 (100.0%) | 2 (1.4%) |
| Total | 1,132 (75.9%) | 425 (28.5%) |
Disability Status by Sex by Age in Guayabal
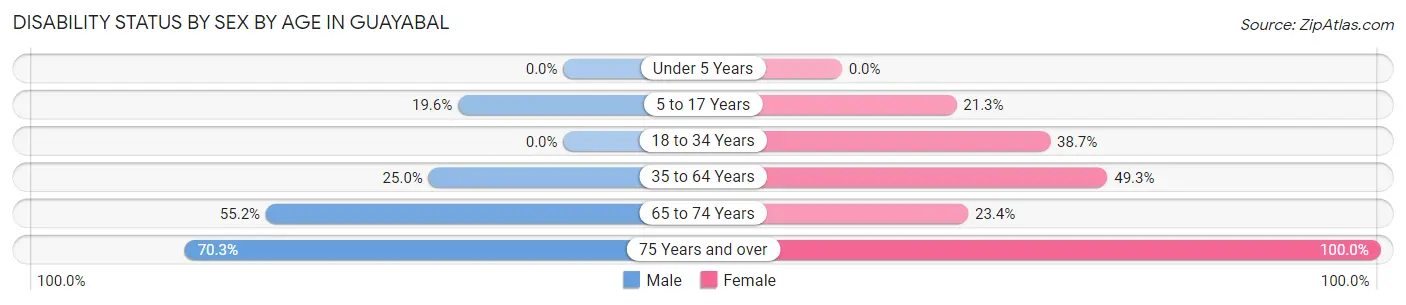
| Age Bracket | Male | Female |
| Under 5 Years | 0 (0.0%) | 0 (0.0%) |
| 5 to 17 Years | 26 (19.6%) | 27 (21.3%) |
| 18 to 34 Years | 0 (0.0%) | 29 (38.7%) |
| 35 to 64 Years | 65 (25.0%) | 170 (49.3%) |
| 65 to 74 Years | 106 (55.2%) | 15 (23.4%) |
| 75 Years and over | 52 (70.3%) | 69 (100.0%) |
Disability Class by Sex by Age in Guayabal
Disability Class: Hearing Difficulty
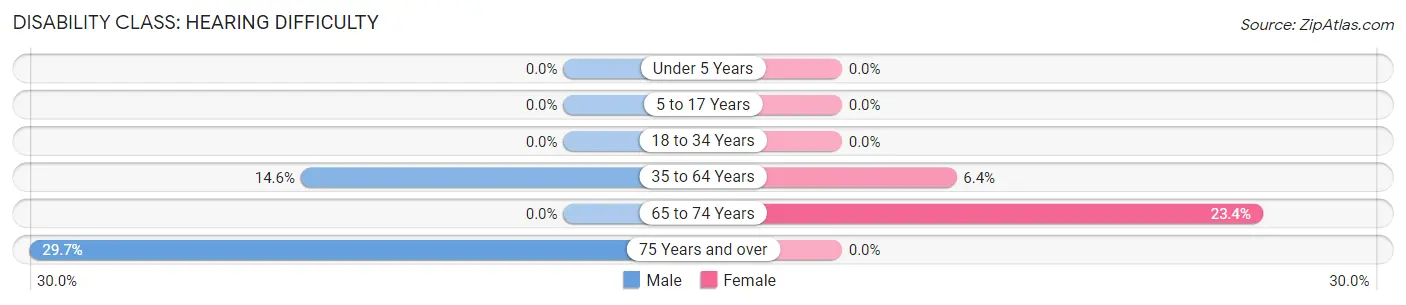
| Age Bracket | Male | Female |
| Under 5 Years | 0 (0.0%) | 0 (0.0%) |
| 5 to 17 Years | 0 (0.0%) | 0 (0.0%) |
| 18 to 34 Years | 0 (0.0%) | 0 (0.0%) |
| 35 to 64 Years | 38 (14.6%) | 22 (6.4%) |
| 65 to 74 Years | 0 (0.0%) | 15 (23.4%) |
| 75 Years and over | 22 (29.7%) | 0 (0.0%) |
Disability Class: Vision Difficulty
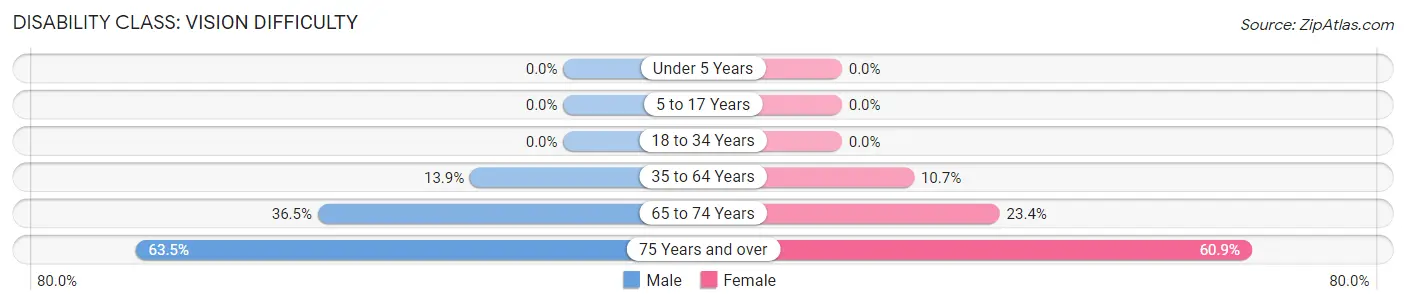
| Age Bracket | Male | Female |
| Under 5 Years | 0 (0.0%) | 0 (0.0%) |
| 5 to 17 Years | 0 (0.0%) | 0 (0.0%) |
| 18 to 34 Years | 0 (0.0%) | 0 (0.0%) |
| 35 to 64 Years | 36 (13.9%) | 37 (10.7%) |
| 65 to 74 Years | 70 (36.5%) | 15 (23.4%) |
| 75 Years and over | 47 (63.5%) | 42 (60.9%) |
Disability Class: Cognitive Difficulty
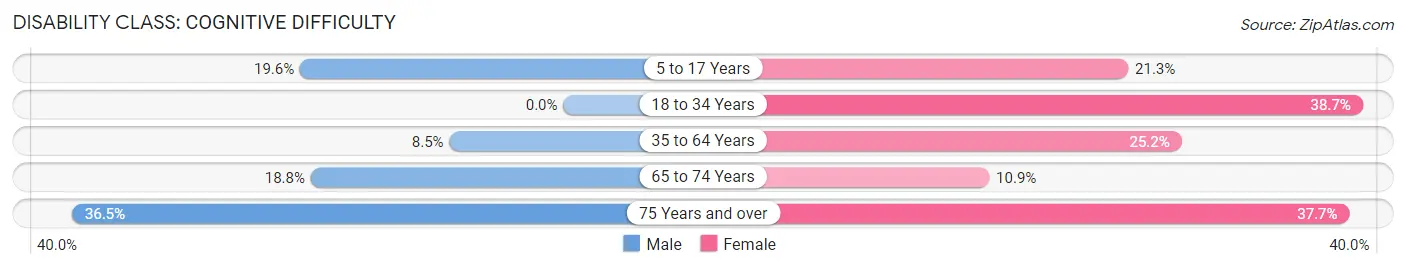
| Age Bracket | Male | Female |
| 5 to 17 Years | 26 (19.6%) | 27 (21.3%) |
| 18 to 34 Years | 0 (0.0%) | 29 (38.7%) |
| 35 to 64 Years | 22 (8.5%) | 87 (25.2%) |
| 65 to 74 Years | 36 (18.8%) | 7 (10.9%) |
| 75 Years and over | 27 (36.5%) | 26 (37.7%) |
Disability Class: Ambulatory Difficulty
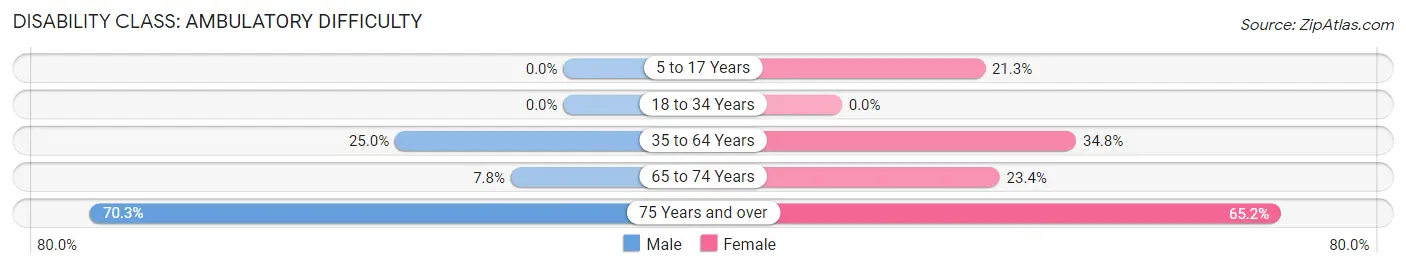
| Age Bracket | Male | Female |
| 5 to 17 Years | 0 (0.0%) | 27 (21.3%) |
| 18 to 34 Years | 0 (0.0%) | 0 (0.0%) |
| 35 to 64 Years | 65 (25.0%) | 120 (34.8%) |
| 65 to 74 Years | 15 (7.8%) | 15 (23.4%) |
| 75 Years and over | 52 (70.3%) | 45 (65.2%) |
Disability Class: Self-Care Difficulty
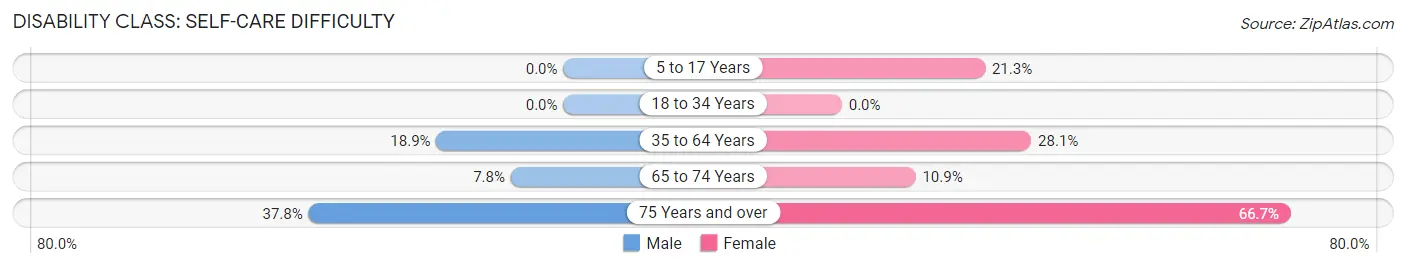
| Age Bracket | Male | Female |
| 5 to 17 Years | 0 (0.0%) | 27 (21.3%) |
| 18 to 34 Years | 0 (0.0%) | 0 (0.0%) |
| 35 to 64 Years | 49 (18.9%) | 97 (28.1%) |
| 65 to 74 Years | 15 (7.8%) | 7 (10.9%) |
| 75 Years and over | 28 (37.8%) | 46 (66.7%) |
Technology Access in Guayabal
Computing Device Access in Guayabal
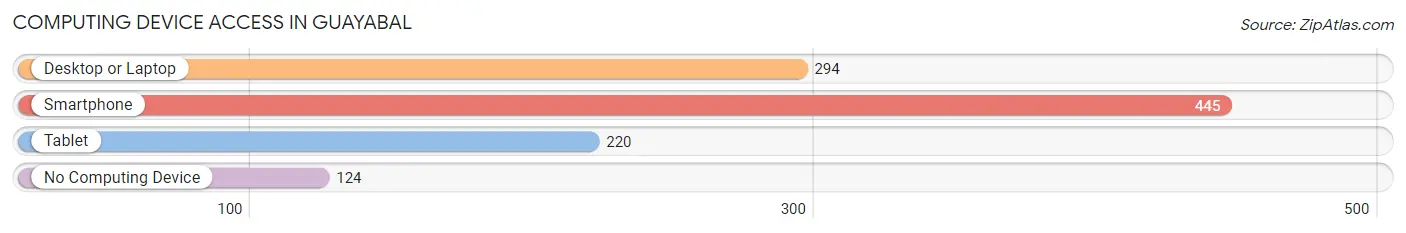
| Device Type | # Households | % Households |
| Desktop or Laptop | 294 | 51.7% |
| Smartphone | 445 | 78.2% |
| Tablet | 220 | 38.7% |
| No Computing Device | 124 | 21.8% |
| Total | 569 | 100.0% |
Internet Access in Guayabal
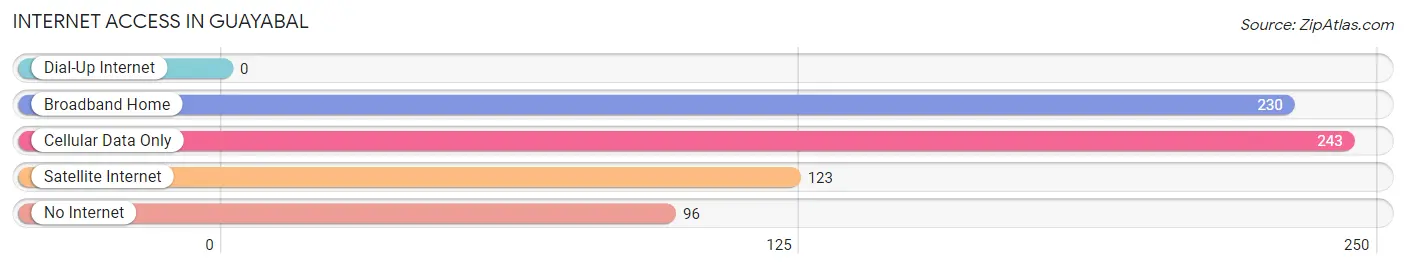
| Internet Type | # Households | % Households |
| Dial-Up Internet | 0 | 0.0% |
| Broadband Home | 230 | 40.4% |
| Cellular Data Only | 243 | 42.7% |
| Satellite Internet | 123 | 21.6% |
| No Internet | 96 | 16.9% |
| Total | 569 | 100.0% |
Guayabal Summary
Guayabal is a municipality located in the central region of Puerto Rico, in the Cordillera Central mountain range. It is part of the San Juan-Caguas-Guaynabo Metropolitan Statistical Area. As of the 2010 census, the population of Guayabal was 8,845.
Geography
Guayabal is located in the central region of Puerto Rico, in the Cordillera Central mountain range. It is bordered by the municipalities of Cidra to the north, Cayey to the east, San Lorenzo to the south, and Caguas to the west. The municipality has a total area of 11.9 square miles, of which 11.7 square miles is land and 0.2 square miles is water.
The terrain of Guayabal is mostly mountainous, with elevations ranging from 1,000 to 2,000 feet above sea level. The highest point in the municipality is Cerro La Punta, at 2,000 feet. The municipality is home to several rivers, including the Río Grande de Loíza, Río Caguitas, and Río Cidra.
History
The area that is now Guayabal was originally inhabited by the Taíno people. The first European settlers arrived in the area in the early 16th century, and the municipality was officially founded in 1824.
In the 19th century, the economy of Guayabal was largely based on agriculture, with coffee and sugarcane being the main crops. In the early 20th century, the economy shifted to manufacturing, with the establishment of several factories in the municipality.
Economy
The economy of Guayabal is largely based on manufacturing and agriculture. The municipality is home to several factories, including a pharmaceutical plant, a plastics factory, and a food processing plant. Agriculture is also an important part of the economy, with coffee, sugarcane, and fruits being the main crops.
Demographics
As of the 2010 census, the population of Guayabal was 8,845, with a population density of 745.3 people per square mile. The racial makeup of the municipality was 79.3% White, 15.2% Black or African American, 0.7% Native American, 0.3% Asian, 0.1% Pacific Islander, and 4.4% from other races. The median household income was $14,945, and the median family income was $17,945.
The population of Guayabal is largely Roman Catholic, with 95.3% of the population identifying as such. Other religious affiliations include Protestantism (2.3%), Jehovah's Witnesses (1.2%), and other religions (1.2%). The municipality has a literacy rate of 94.3%.
Conclusion
Guayabal is a municipality located in the central region of Puerto Rico, in the Cordillera Central mountain range. It is part of the San Juan-Caguas-Guaynabo Metropolitan Statistical Area. As of the 2010 census, the population of Guayabal was 8,845. The economy of Guayabal is largely based on manufacturing and agriculture, with coffee, sugarcane, and fruits being the main crops. The population of Guayabal is largely Roman Catholic, with 95.3% of the population identifying as such. The municipality has a literacy rate of 94.3%.
Common Questions
What is Per Capita Income in Guayabal?
Per Capita income in Guayabal is $9,140.
What is the Median Family Income in Guayabal?
Median Family Income in Guayabal is $22,326.
What is the Median Household income in Guayabal?
Median Household Income in Guayabal is $20,243.
What is Inequality or Gini Index in Guayabal?
Inequality or Gini Index in Guayabal is 0.46.
What is the Total Population of Guayabal?
Total Population of Guayabal is 1,492.
What is the Total Male Population of Guayabal?
Total Male Population of Guayabal is 787.
What is the Total Female Population of Guayabal?
Total Female Population of Guayabal is 705.
What is the Ratio of Males per 100 Females in Guayabal?
There are 111.63 Males per 100 Females in Guayabal.
What is the Ratio of Females per 100 Males in Guayabal?
There are 89.58 Females per 100 Males in Guayabal.
What is the Median Population Age in Guayabal?
Median Population Age in Guayabal is 52.9 Years.
What is the Average Family Size in Guayabal
Average Family Size in Guayabal is 3.1 People.
What is the Average Household Size in Guayabal
Average Household Size in Guayabal is 2.6 People.
How Large is the Labor Force in Guayabal?
There are 417 People in the Labor Forcein in Guayabal.
What is the Percentage of People in the Labor Force in Guayabal?
32.1% of People are in the Labor Force in Guayabal.
What is the Unemployment Rate in Guayabal?
Unemployment Rate in Guayabal is 28.3%.