Ceiba, PR Map & Demographics
Ceiba Map
Ceiba Overview
$13,282
PER CAPITA INCOME
$23,784
AVG FAMILY INCOME
$22,118
AVG HOUSEHOLD INCOME
6.6%
WAGE / INCOME GAP [ % ]
93.4¢/ $1
WAGE / INCOME GAP [ $ ]
0.53
INEQUALITY / GINI INDEX
2,652
TOTAL POPULATION
1,309
MALE POPULATION
1,343
FEMALE POPULATION
97.47
MALES / 100 FEMALES
102.60
FEMALES / 100 MALES
48.5
MEDIAN AGE
3.4
AVG FAMILY SIZE
2.9
AVG HOUSEHOLD SIZE
982
LABOR FORCE [ PEOPLE ]
45.2%
PERCENT IN LABOR FORCE
28.8%
UNEMPLOYMENT RATE
Ceiba Zip Codes
Ceiba Area Codes
Income in Ceiba
Income Overview in Ceiba
Per Capita Income in Ceiba is $13,282, while median incomes of families and households are $23,784 and $22,118 respectively.
| Characteristic | Number | Measure |
| Per Capita Income | 2,652 | $13,282 |
| Median Family Income | 686 | $23,784 |
| Mean Family Income | 686 | $40,966 |
| Median Household Income | 901 | $22,118 |
| Mean Household Income | 901 | $35,917 |
| Income Deficit | 686 | $0 |
| Wage / Income Gap (%) | 2,652 | 6.60% |
| Wage / Income Gap ($) | 2,652 | 93.40¢ per $1 |
| Gini / Inequality Index | 2,652 | 0.53 |
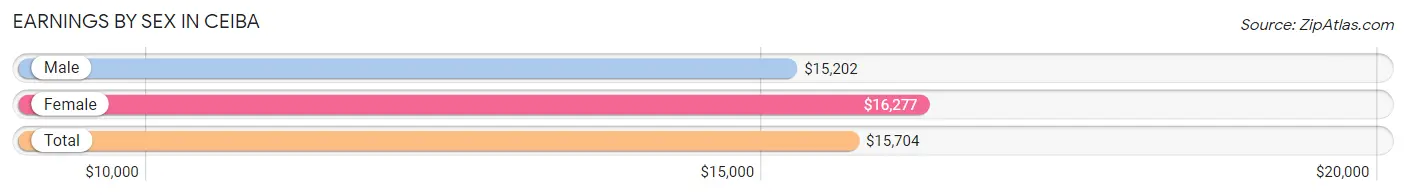
Earnings by Sex in Ceiba
Average Earnings in Ceiba are $15,704, $15,202 for men and $16,277 for women, a difference of 6.6%.
| Sex | Number | Average Earnings |
| Male | 287 (41.0%) | $15,202 |
| Female | 413 (59.0%) | $16,277 |
| Total | 700 (100.0%) | $15,704 |
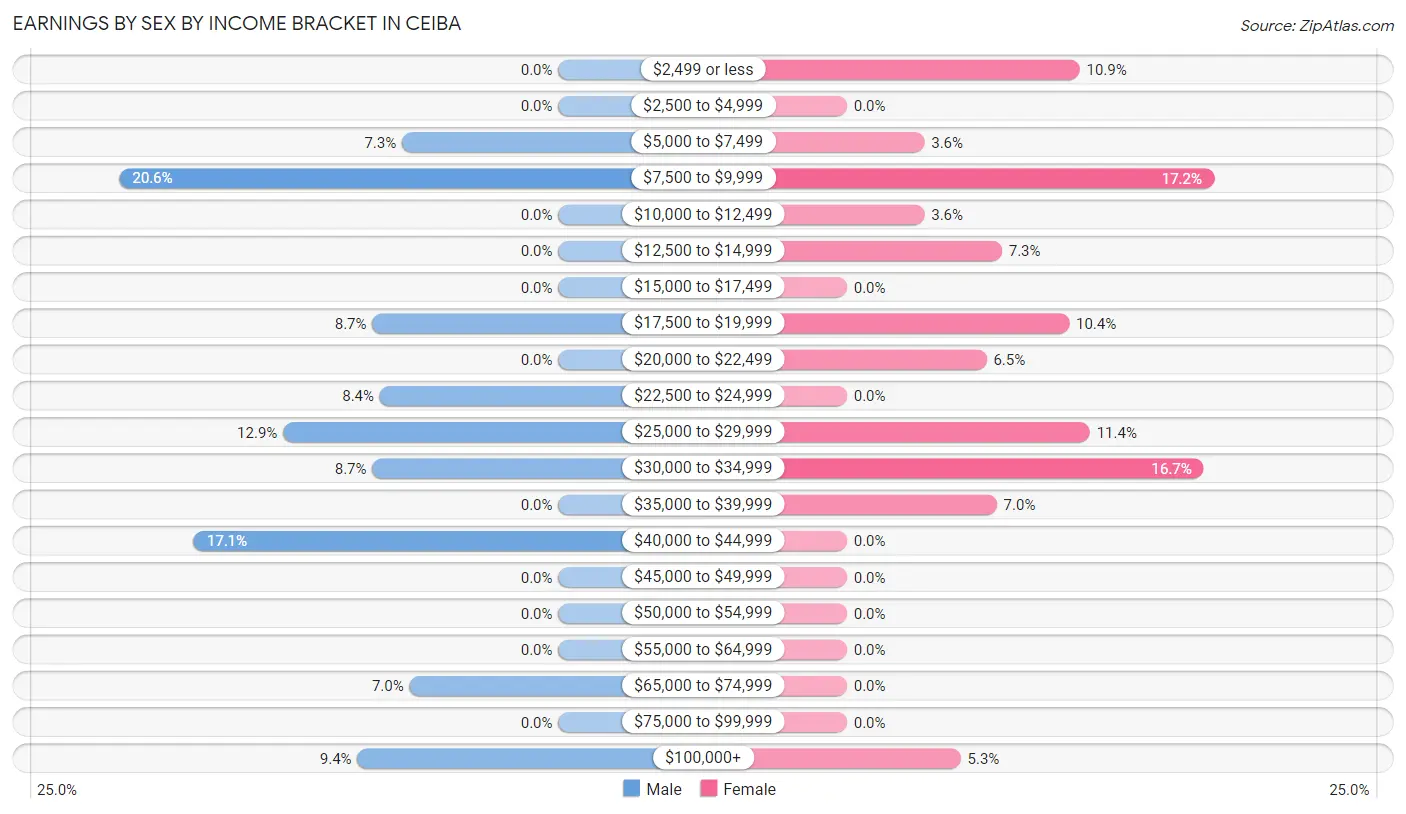
Earnings by Sex by Income Bracket in Ceiba
The most common earnings brackets in Ceiba are $7,500 to $9,999 for men (59 | 20.6%) and $7,500 to $9,999 for women (71 | 17.2%).
| Income | Male | Female |
| $2,499 or less | 0 (0.0%) | 45 (10.9%) |
| $2,500 to $4,999 | 0 (0.0%) | 0 (0.0%) |
| $5,000 to $7,499 | 21 (7.3%) | 15 (3.6%) |
| $7,500 to $9,999 | 59 (20.6%) | 71 (17.2%) |
| $10,000 to $12,499 | 0 (0.0%) | 15 (3.6%) |
| $12,500 to $14,999 | 0 (0.0%) | 30 (7.3%) |
| $15,000 to $17,499 | 0 (0.0%) | 0 (0.0%) |
| $17,500 to $19,999 | 25 (8.7%) | 43 (10.4%) |
| $20,000 to $22,499 | 0 (0.0%) | 27 (6.5%) |
| $22,500 to $24,999 | 24 (8.4%) | 0 (0.0%) |
| $25,000 to $29,999 | 37 (12.9%) | 47 (11.4%) |
| $30,000 to $34,999 | 25 (8.7%) | 69 (16.7%) |
| $35,000 to $39,999 | 0 (0.0%) | 29 (7.0%) |
| $40,000 to $44,999 | 49 (17.1%) | 0 (0.0%) |
| $45,000 to $49,999 | 0 (0.0%) | 0 (0.0%) |
| $50,000 to $54,999 | 0 (0.0%) | 0 (0.0%) |
| $55,000 to $64,999 | 0 (0.0%) | 0 (0.0%) |
| $65,000 to $74,999 | 20 (7.0%) | 0 (0.0%) |
| $75,000 to $99,999 | 0 (0.0%) | 0 (0.0%) |
| $100,000+ | 27 (9.4%) | 22 (5.3%) |
| Total | 287 (100.0%) | 413 (100.0%) |
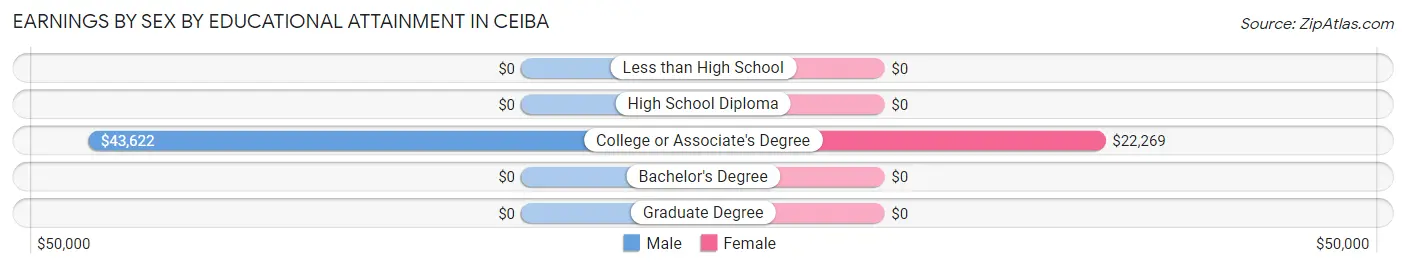
Earnings by Sex by Educational Attainment in Ceiba
Average earnings in Ceiba are $30,650 for men and $20,231 for women, a difference of 34.0%. Men with an educational attainment of college or associate's degree enjoy the highest average annual earnings of $43,622, while those with college or associate's degree education earn the least with $43,622. Women with an educational attainment of college or associate's degree earn the most with the average annual earnings of $22,269, while those with college or associate's degree education have the smallest earnings of $22,269.
| Educational Attainment | Male Income | Female Income |
| Less than High School | - | - |
| High School Diploma | - | - |
| College or Associate's Degree | $43,622 | $22,269 |
| Bachelor's Degree | - | - |
| Graduate Degree | - | - |
| Total | $30,650 | $20,231 |
Family Income in Ceiba
Family Income Brackets in Ceiba
According to the Ceiba family income data, there are 190 families falling into the $15,000 to $24,999 income range, which is the most common income bracket and makes up 27.7% of all families.
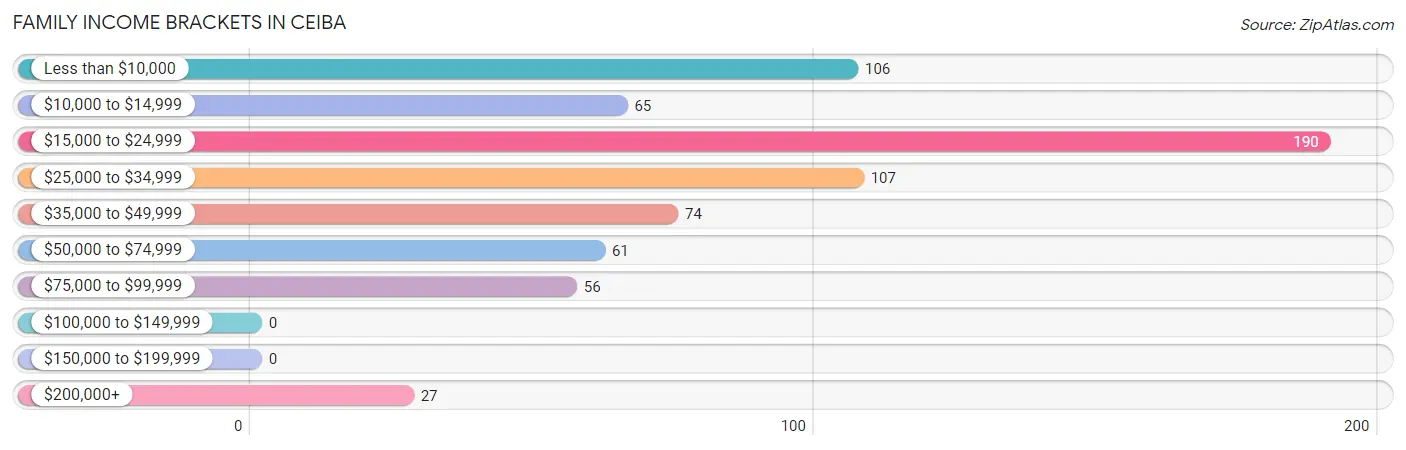
| Income Bracket | # Families | % Families |
| Less than $10,000 | 106 | 15.5% |
| $10,000 to $14,999 | 65 | 9.5% |
| $15,000 to $24,999 | 190 | 27.7% |
| $25,000 to $34,999 | 107 | 15.6% |
| $35,000 to $49,999 | 74 | 10.8% |
| $50,000 to $74,999 | 61 | 8.9% |
| $75,000 to $99,999 | 56 | 8.2% |
| $100,000 to $149,999 | 0 | 0.0% |
| $150,000 to $199,999 | 0 | 0.0% |
| $200,000+ | 27 | 3.9% |
Family Income by Famaliy Size in Ceiba
4-person families (122 | 17.8%) account for the highest median family income in Ceiba with $41,667 per family, while 2-person families (293 | 42.7%) have the highest median income of $11,849 per family member.
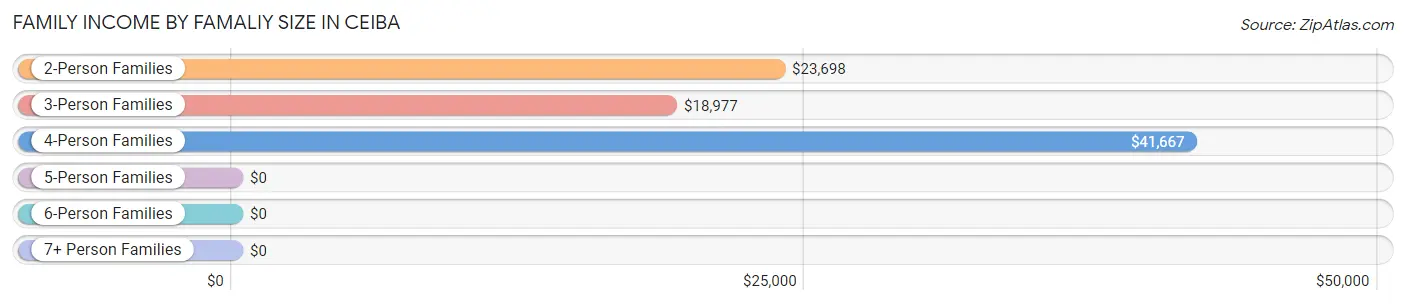
| Income Bracket | # Families | Median Income |
| 2-Person Families | 293 (42.7%) | $23,698 |
| 3-Person Families | 177 (25.8%) | $18,977 |
| 4-Person Families | 122 (17.8%) | $41,667 |
| 5-Person Families | 56 (8.2%) | $0 |
| 6-Person Families | 38 (5.5%) | $0 |
| 7+ Person Families | 0 (0.0%) | $0 |
| Total | 686 (100.0%) | $23,784 |
Family Income by Number of Earners in Ceiba
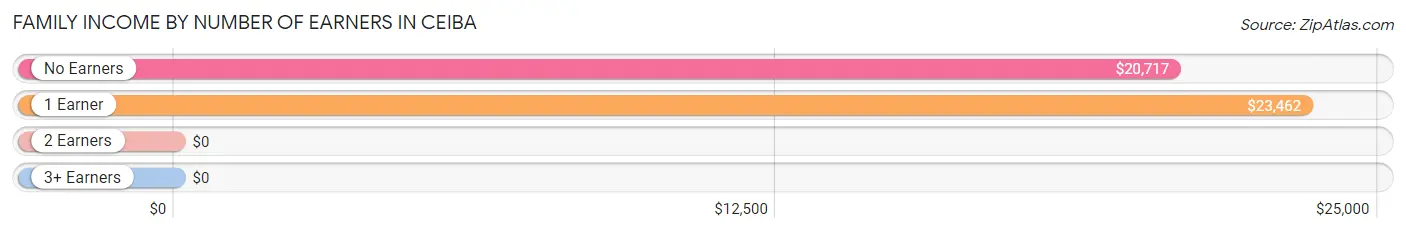
| Number of Earners | # Families | Median Income |
| No Earners | 351 (51.2%) | $20,717 |
| 1 Earner | 210 (30.6%) | $23,462 |
| 2 Earners | 70 (10.2%) | $0 |
| 3+ Earners | 55 (8.0%) | $0 |
| Total | 686 (100.0%) | $23,784 |
Household Income in Ceiba
Household Income Brackets in Ceiba
With 261 households falling in the category, the $15,000 to $24,999 income range is the most frequent in Ceiba, accounting for 29.0% of all households.
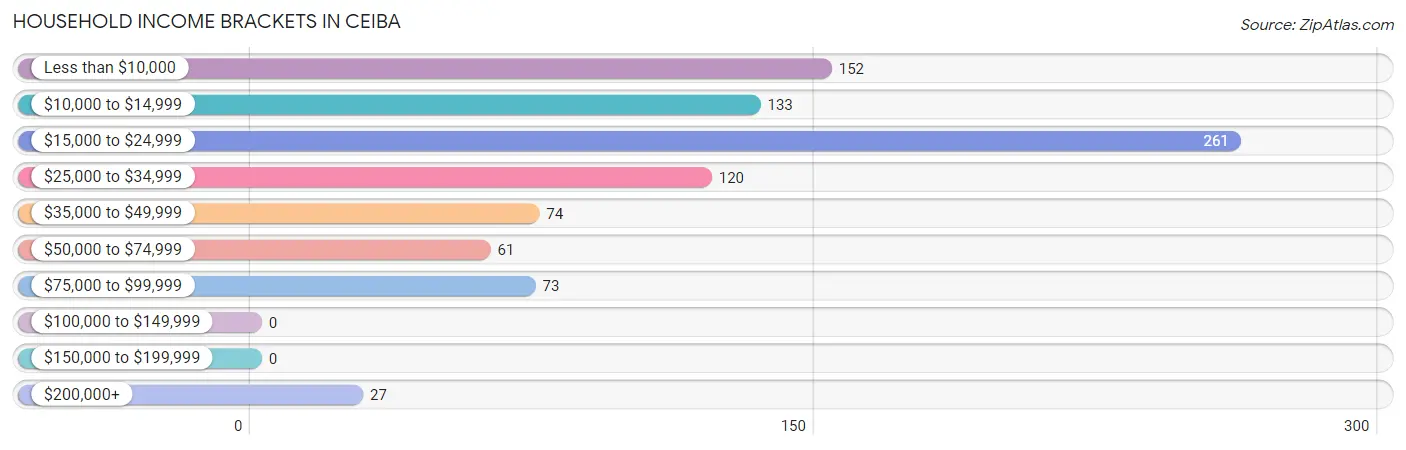
| Income Bracket | # Households | % Households |
| Less than $10,000 | 152 | 16.9% |
| $10,000 to $14,999 | 133 | 14.8% |
| $15,000 to $24,999 | 261 | 29.0% |
| $25,000 to $34,999 | 120 | 13.3% |
| $35,000 to $49,999 | 74 | 8.2% |
| $50,000 to $74,999 | 61 | 6.8% |
| $75,000 to $99,999 | 73 | 8.1% |
| $100,000 to $149,999 | 0 | 0.0% |
| $150,000 to $199,999 | 0 | 0.0% |
| $200,000+ | 27 | 3.0% |
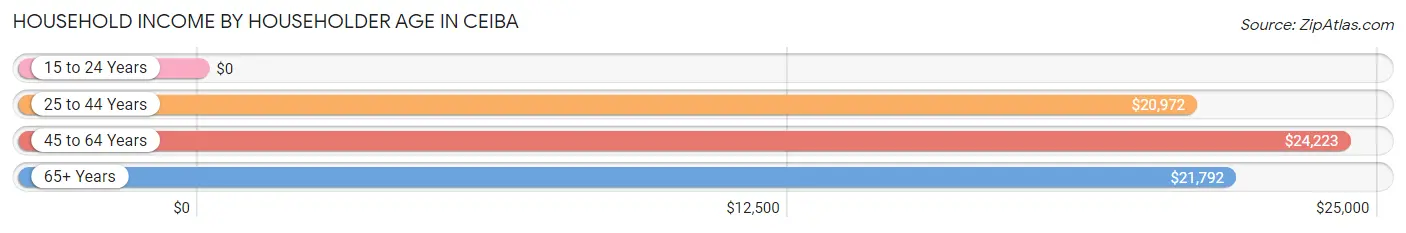
Household Income by Householder Age in Ceiba
The median household income in Ceiba is $22,118, with the highest median household income of $24,223 found in the 45 to 64 years age bracket for the primary householder. A total of 347 households (38.5%) fall into this category. Meanwhile, the 15 to 24 years age bracket for the primary householder has the lowest median household income of $0, with 30 households (3.3%) in this group.
| Income Bracket | # Households | Median Income |
| 15 to 24 Years | 30 (3.3%) | $0 |
| 25 to 44 Years | 199 (22.1%) | $20,972 |
| 45 to 64 Years | 347 (38.5%) | $24,223 |
| 65+ Years | 325 (36.1%) | $21,792 |
| Total | 901 (100.0%) | $22,118 |
Poverty in Ceiba
Income Below Poverty by Sex and Age in Ceiba
With 55.1% poverty level for males and 47.0% for females among the residents of Ceiba, under 5 year old males and under 5 year old females are the most vulnerable to poverty, with 90 males (100.0%) and 32 females (100.0%) in their respective age groups living below the poverty level.
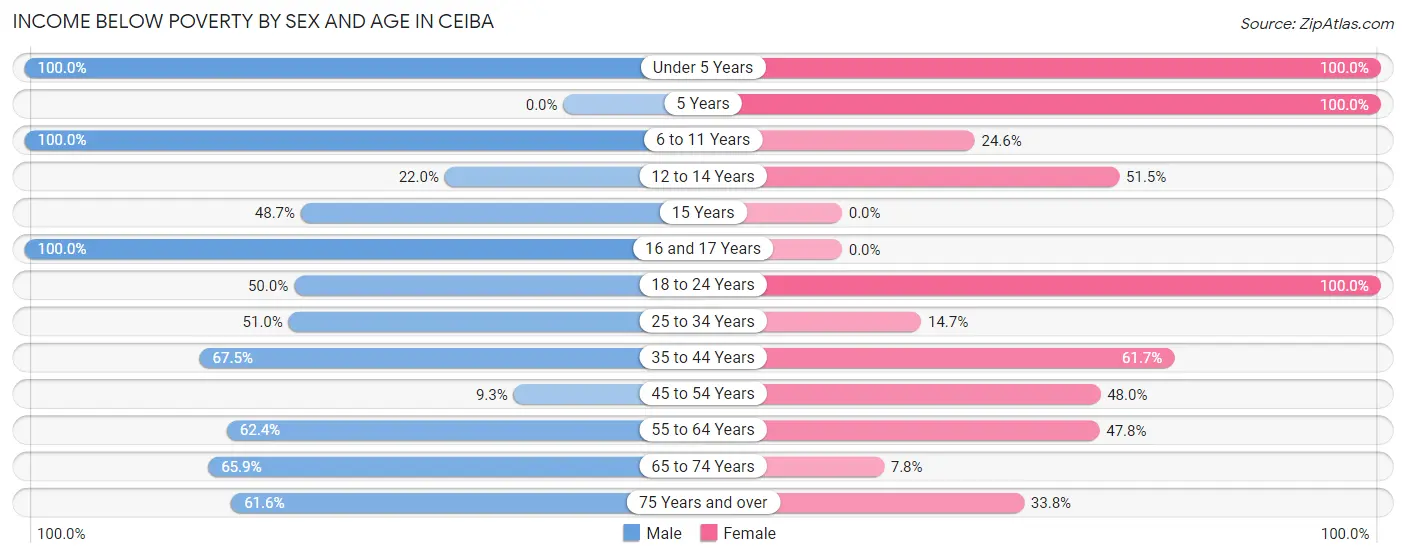
| Age Bracket | Male | Female |
| Under 5 Years | 90 (100.0%) | 32 (100.0%) |
| 5 Years | 0 (0.0%) | 15 (100.0%) |
| 6 to 11 Years | 57 (100.0%) | 17 (24.6%) |
| 12 to 14 Years | 24 (22.0%) | 35 (51.5%) |
| 15 Years | 19 (48.7%) | 0 (0.0%) |
| 16 and 17 Years | 25 (100.0%) | 0 (0.0%) |
| 18 to 24 Years | 58 (50.0%) | 130 (100.0%) |
| 25 to 34 Years | 51 (51.0%) | 15 (14.7%) |
| 35 to 44 Years | 27 (67.5%) | 111 (61.7%) |
| 45 to 54 Years | 16 (9.2%) | 118 (48.0%) |
| 55 to 64 Years | 138 (62.4%) | 98 (47.8%) |
| 65 to 74 Years | 116 (65.9%) | 12 (7.8%) |
| 75 Years and over | 98 (61.6%) | 48 (33.8%) |
| Total | 719 (55.1%) | 631 (47.0%) |
Income Above Poverty by Sex and Age in Ceiba
According to the poverty statistics in Ceiba, males aged 45 to 54 years and females aged 65 to 74 years are the age groups that are most secure financially, with 90.7% of males and 92.2% of females in these age groups living above the poverty line.
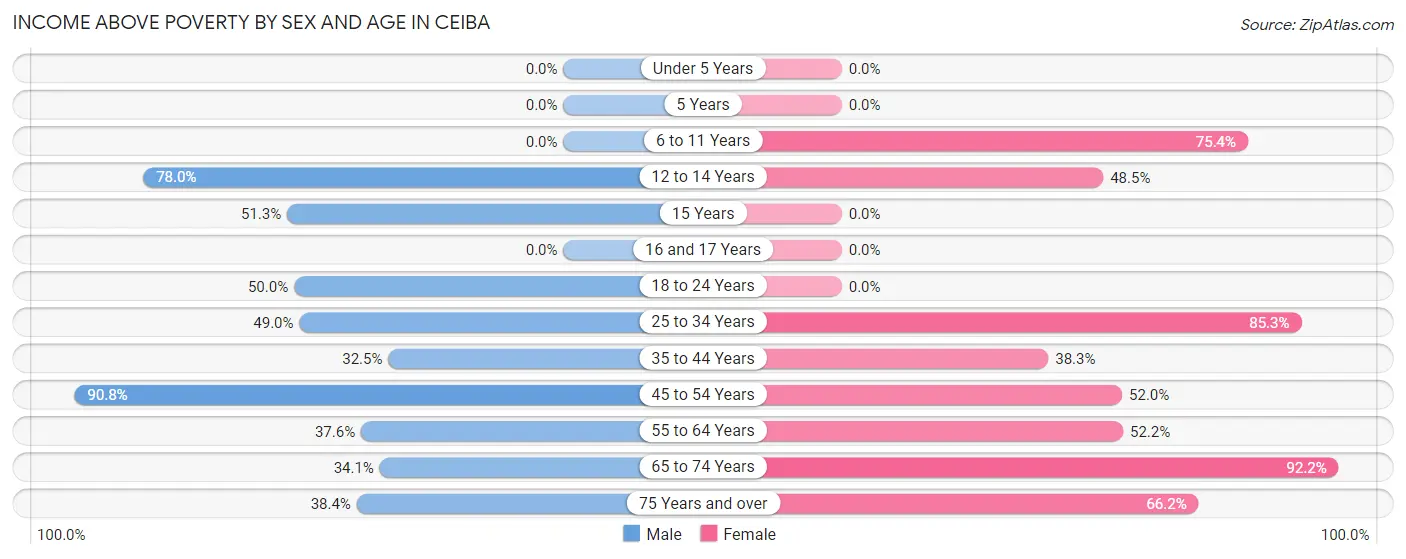
| Age Bracket | Male | Female |
| Under 5 Years | 0 (0.0%) | 0 (0.0%) |
| 5 Years | 0 (0.0%) | 0 (0.0%) |
| 6 to 11 Years | 0 (0.0%) | 52 (75.4%) |
| 12 to 14 Years | 85 (78.0%) | 33 (48.5%) |
| 15 Years | 20 (51.3%) | 0 (0.0%) |
| 16 and 17 Years | 0 (0.0%) | 0 (0.0%) |
| 18 to 24 Years | 58 (50.0%) | 0 (0.0%) |
| 25 to 34 Years | 49 (49.0%) | 87 (85.3%) |
| 35 to 44 Years | 13 (32.5%) | 69 (38.3%) |
| 45 to 54 Years | 157 (90.7%) | 128 (52.0%) |
| 55 to 64 Years | 83 (37.6%) | 107 (52.2%) |
| 65 to 74 Years | 60 (34.1%) | 142 (92.2%) |
| 75 Years and over | 61 (38.4%) | 94 (66.2%) |
| Total | 586 (44.9%) | 712 (53.0%) |
Income Below Poverty Among Married-Couple Families in Ceiba
The poverty statistics for married-couple families in Ceiba show that 36.2% or 142 of the total 392 families live below the poverty line. Families with 3 or 4 children have the highest poverty rate of 100.0%, comprising of 38 families. On the other hand, families with no children have the lowest poverty rate of 21.3%, which includes 60 families.
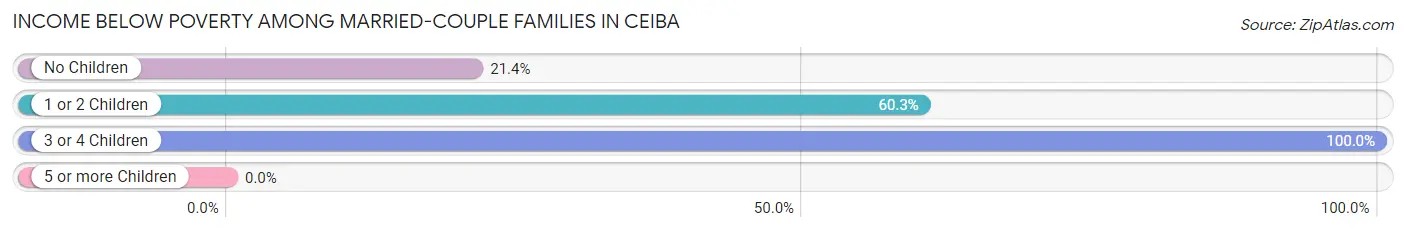
| Children | Above Poverty | Below Poverty |
| No Children | 221 (78.6%) | 60 (21.3%) |
| 1 or 2 Children | 29 (39.7%) | 44 (60.3%) |
| 3 or 4 Children | 0 (0.0%) | 38 (100.0%) |
| 5 or more Children | 0 (0.0%) | 0 (0.0%) |
| Total | 250 (63.8%) | 142 (36.2%) |
Income Below Poverty Among Single-Parent Households in Ceiba
According to the poverty data in Ceiba, 100.0% or 35 single-father households and 50.2% or 130 single-mother households are living below the poverty line. Among single-father households, those with no children have the highest poverty rate, with 35 households (100.0%) experiencing poverty. Likewise, among single-mother households, those with 1 or 2 children have the highest poverty rate, with 117 households (59.7%) falling below the poverty line.
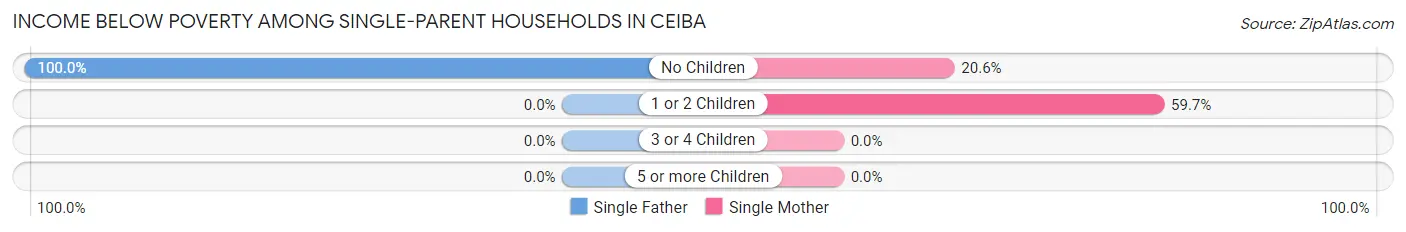
| Children | Single Father | Single Mother |
| No Children | 35 (100.0%) | 13 (20.6%) |
| 1 or 2 Children | 0 (0.0%) | 117 (59.7%) |
| 3 or 4 Children | 0 (0.0%) | 0 (0.0%) |
| 5 or more Children | 0 (0.0%) | 0 (0.0%) |
| Total | 35 (100.0%) | 130 (50.2%) |
Income Below Poverty Among Married-Couple vs Single-Parent Households in Ceiba
The poverty data for Ceiba shows that 142 of the married-couple family households (36.2%) and 165 of the single-parent households (56.1%) are living below the poverty level. Within the married-couple family households, those with 3 or 4 children have the highest poverty rate, with 38 households (100.0%) falling below the poverty line. Among the single-parent households, those with 1 or 2 children have the highest poverty rate, with 117 household (59.7%) living below poverty.
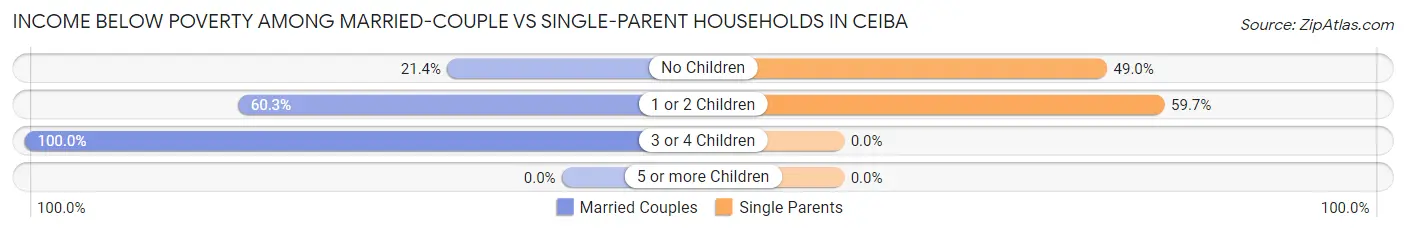
| Children | Married-Couple Families | Single-Parent Households |
| No Children | 60 (21.3%) | 48 (49.0%) |
| 1 or 2 Children | 44 (60.3%) | 117 (59.7%) |
| 3 or 4 Children | 38 (100.0%) | 0 (0.0%) |
| 5 or more Children | 0 (0.0%) | 0 (0.0%) |
| Total | 142 (36.2%) | 165 (56.1%) |
Race in Ceiba
The most populous races in Ceiba are Hispanic or Latino (2,652 | 100.0%), White / Caucasian (1,252 | 47.2%), and Two or more Races (1,026 | 38.7%).
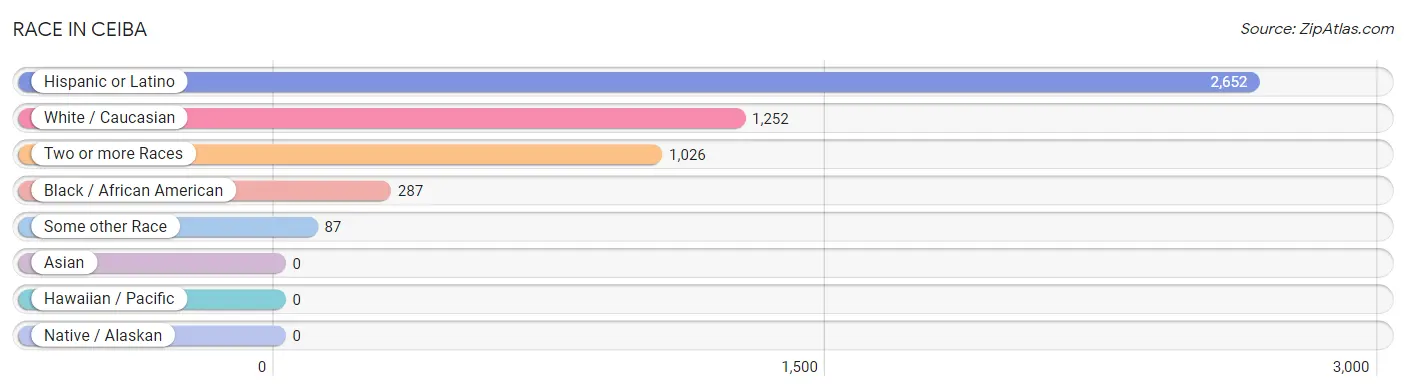
| Race | # Population | % Population |
| Asian | 0 | 0.0% |
| Black / African American | 287 | 10.8% |
| Hawaiian / Pacific | 0 | 0.0% |
| Hispanic or Latino | 2,652 | 100.0% |
| Native / Alaskan | 0 | 0.0% |
| White / Caucasian | 1,252 | 47.2% |
| Two or more Races | 1,026 | 38.7% |
| Some other Race | 87 | 3.3% |
| Total | 2,652 | 100.0% |
Ancestry in Ceiba
The most populous ancestries reported in Ceiba are , and Puerto Rican (2,652 | 100.0%), together accounting for 100.0% of all Ceiba residents.

| Ancestry | # Population | % Population |
| Puerto Rican | 2,652 | 100.0% | View All 1 Rows |
Immigrants in Ceiba

| Immigration Origin | # Population | % Population | View All 0 Rows |
Sex and Age in Ceiba
Sex and Age in Ceiba
The most populous age groups in Ceiba are 75 to 79 Years (122 | 9.3%) for men and 55 to 59 Years (147 | 11.0%) for women.
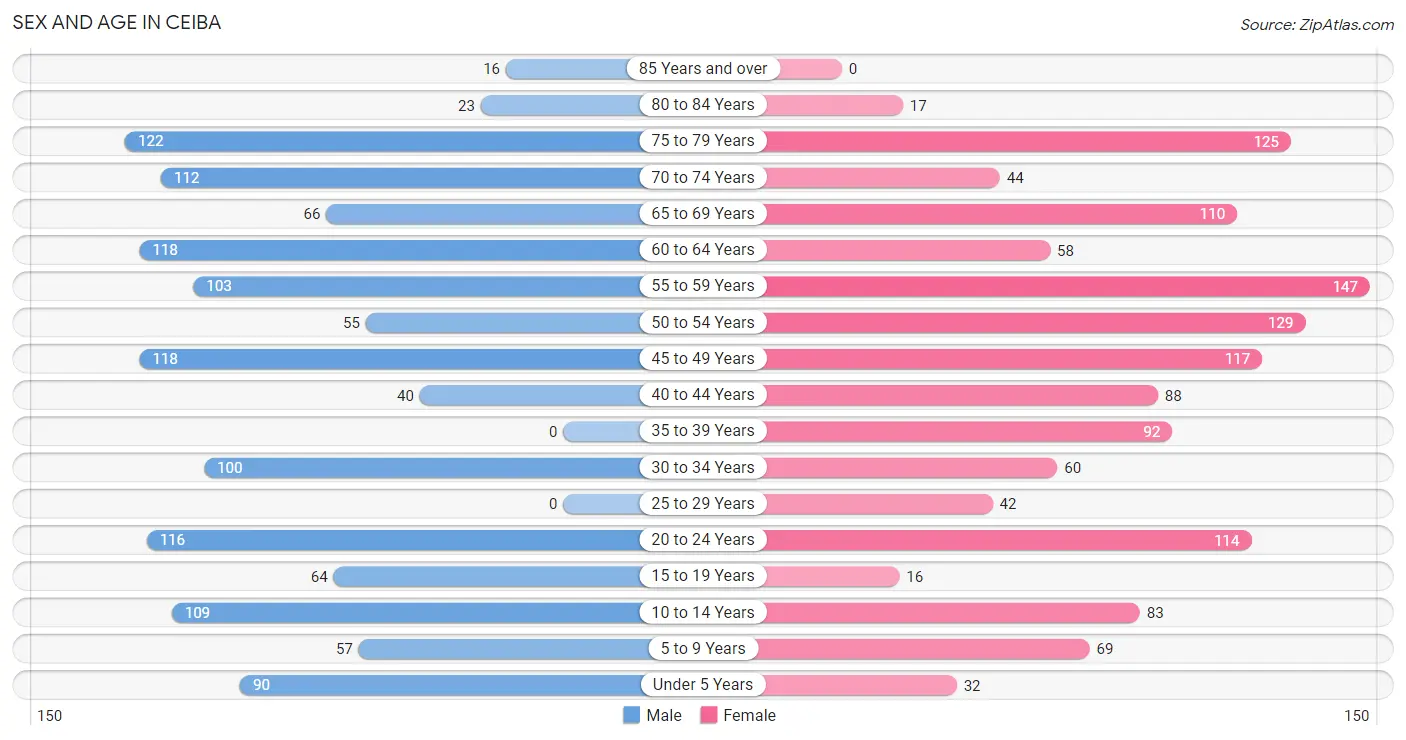
| Age Bracket | Male | Female |
| Under 5 Years | 90 (6.9%) | 32 (2.4%) |
| 5 to 9 Years | 57 (4.3%) | 69 (5.1%) |
| 10 to 14 Years | 109 (8.3%) | 83 (6.2%) |
| 15 to 19 Years | 64 (4.9%) | 16 (1.2%) |
| 20 to 24 Years | 116 (8.9%) | 114 (8.5%) |
| 25 to 29 Years | 0 (0.0%) | 42 (3.1%) |
| 30 to 34 Years | 100 (7.6%) | 60 (4.5%) |
| 35 to 39 Years | 0 (0.0%) | 92 (6.9%) |
| 40 to 44 Years | 40 (3.1%) | 88 (6.6%) |
| 45 to 49 Years | 118 (9.0%) | 117 (8.7%) |
| 50 to 54 Years | 55 (4.2%) | 129 (9.6%) |
| 55 to 59 Years | 103 (7.9%) | 147 (11.0%) |
| 60 to 64 Years | 118 (9.0%) | 58 (4.3%) |
| 65 to 69 Years | 66 (5.0%) | 110 (8.2%) |
| 70 to 74 Years | 112 (8.6%) | 44 (3.3%) |
| 75 to 79 Years | 122 (9.3%) | 125 (9.3%) |
| 80 to 84 Years | 23 (1.8%) | 17 (1.3%) |
| 85 Years and over | 16 (1.2%) | 0 (0.0%) |
| Total | 1,309 (100.0%) | 1,343 (100.0%) |
Families and Households in Ceiba
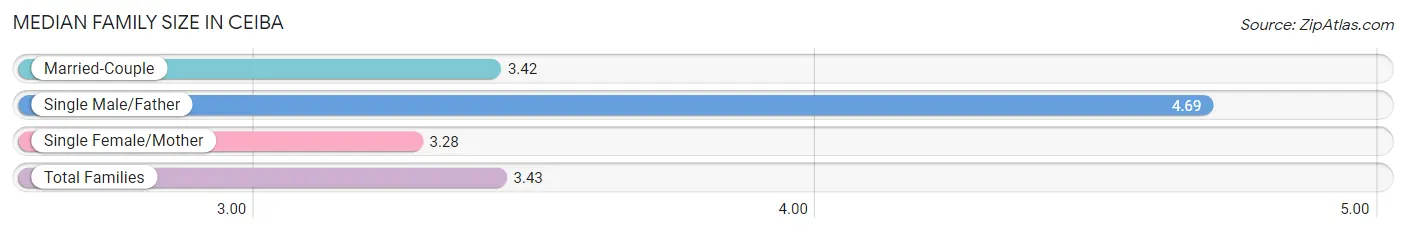
Median Family Size in Ceiba
The median family size in Ceiba is 3.43 persons per family, with single male/father families (35 | 5.1%) accounting for the largest median family size of 4.69 persons per family. On the other hand, single female/mother families (259 | 37.8%) represent the smallest median family size with 3.28 persons per family.
| Family Type | # Families | Family Size |
| Married-Couple | 392 (57.1%) | 3.42 |
| Single Male/Father | 35 (5.1%) | 4.69 |
| Single Female/Mother | 259 (37.8%) | 3.28 |
| Total Families | 686 (100.0%) | 3.43 |
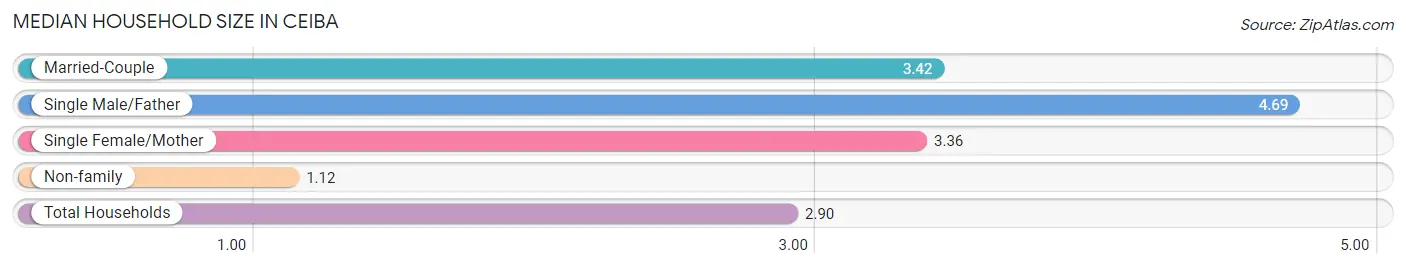
Median Household Size in Ceiba
The median household size in Ceiba is 2.90 persons per household, with single male/father households (35 | 3.9%) accounting for the largest median household size of 4.69 persons per household. non-family households (215 | 23.9%) represent the smallest median household size with 1.12 persons per household.
| Household Type | # Households | Household Size |
| Married-Couple | 392 (43.5%) | 3.42 |
| Single Male/Father | 35 (3.9%) | 4.69 |
| Single Female/Mother | 259 (28.7%) | 3.36 |
| Non-family | 215 (23.9%) | 1.12 |
| Total Households | 901 (100.0%) | 2.90 |
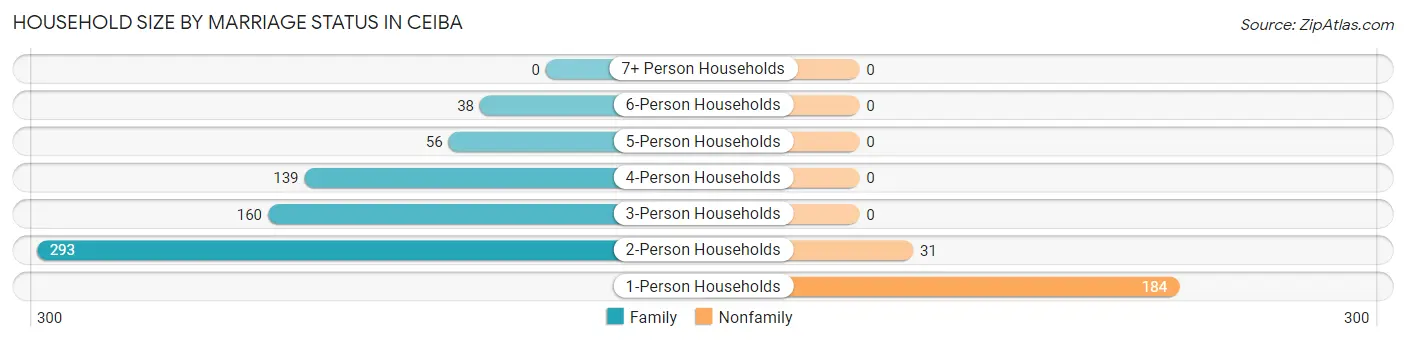
Household Size by Marriage Status in Ceiba
Out of a total of 901 households in Ceiba, 686 (76.1%) are family households, while 215 (23.9%) are nonfamily households. The most numerous type of family households are 2-person households, comprising 293, and the most common type of nonfamily households are 1-person households, comprising 184.
| Household Size | Family Households | Nonfamily Households |
| 1-Person Households | - | 184 (20.4%) |
| 2-Person Households | 293 (32.5%) | 31 (3.4%) |
| 3-Person Households | 160 (17.8%) | 0 (0.0%) |
| 4-Person Households | 139 (15.4%) | 0 (0.0%) |
| 5-Person Households | 56 (6.2%) | 0 (0.0%) |
| 6-Person Households | 38 (4.2%) | 0 (0.0%) |
| 7+ Person Households | 0 (0.0%) | 0 (0.0%) |
| Total | 686 (76.1%) | 215 (23.9%) |
Female Fertility in Ceiba
Fertility by Age in Ceiba
| Age Bracket | Women with Births | Births / 1,000 Women |
| 15 to 19 years | 0 (0.0%) | 0.0 |
| 20 to 34 years | 0 (0.0%) | 0.0 |
| 35 to 50 years | 0 (0.0%) | 0.0 |
| Total | 0 (0.0%) | 0.0 |
Fertility by Age by Marriage Status in Ceiba
| Age Bracket | Married | Unmarried |
| 15 to 19 years | 0 (0.0%) | 0 (0.0%) |
| 20 to 34 years | 0 (0.0%) | 0 (0.0%) |
| 35 to 50 years | 0 (0.0%) | 0 (0.0%) |
| Total | 0 (0.0%) | 0 (0.0%) |
Fertility by Education in Ceiba
| Educational Attainment | Women with Births | Births / 1,000 Women |
| Less than High School | 0 (0.0%) | 0.0 |
| High School Diploma | 0 (0.0%) | 0.0 |
| College or Associate's Degree | 0 (0.0%) | 0.0 |
| Bachelor's Degree | 0 (0.0%) | 0.0 |
| Graduate Degree | 0 (0.0%) | 0.0 |
| Total | 0 (0.0%) | 0.0 |
Fertility by Education by Marriage Status in Ceiba
| Educational Attainment | Married | Unmarried |
| Less than High School | 0 (0.0%) | 0 (0.0%) |
| High School Diploma | 0 (0.0%) | 0 (0.0%) |
| College or Associate's Degree | 0 (0.0%) | 0 (0.0%) |
| Bachelor's Degree | 0 (0.0%) | 0 (0.0%) |
| Graduate Degree | 0 (0.0%) | 0 (0.0%) |
| Total | 0 (0.0%) | 0 (0.0%) |
Employment Characteristics in Ceiba
Employment by Class of Employer in Ceiba
Among the 700 employed individuals in Ceiba, private company employees (493 | 70.4%), state government employees (61 | 8.7%), and not-for-profit organizations (52 | 7.4%) make up the most common classes of employment.
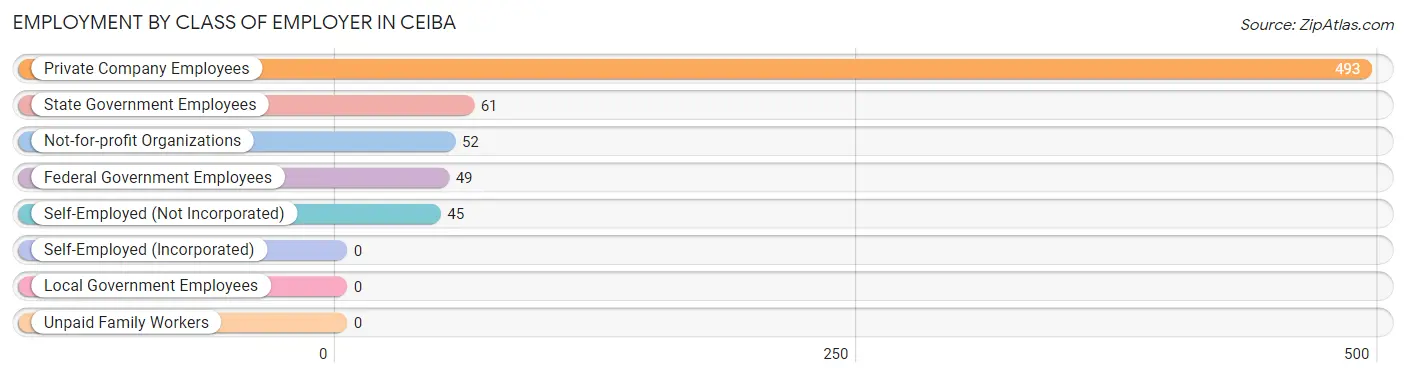
| Employer Class | # Employees | % Employees |
| Private Company Employees | 493 | 70.4% |
| Self-Employed (Incorporated) | 0 | 0.0% |
| Self-Employed (Not Incorporated) | 45 | 6.4% |
| Not-for-profit Organizations | 52 | 7.4% |
| Local Government Employees | 0 | 0.0% |
| State Government Employees | 61 | 8.7% |
| Federal Government Employees | 49 | 7.0% |
| Unpaid Family Workers | 0 | 0.0% |
| Total | 700 | 100.0% |
Employment Status by Age in Ceiba
According to the labor force statistics for Ceiba, out of the total population over 16 years of age (2,173), 45.2% or 982 individuals are in the labor force, with 28.8% or 283 of them unemployed. The age group with the highest labor force participation rate is 25 to 29 years, with 100.0% or 42 individuals in the labor force. Within the labor force, the 16 to 19 years age range has the highest percentage of unemployed individuals, with 100.0% or 25 of them being unemployed.
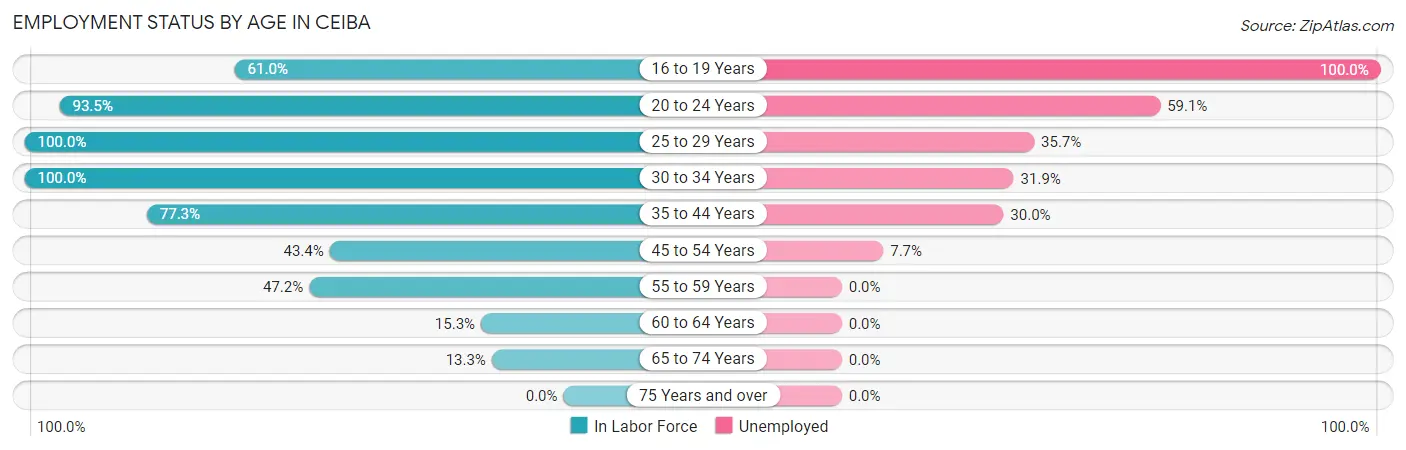
| Age Bracket | In Labor Force | Unemployed |
| 16 to 19 Years | 25 (61.0%) | 25 (100.0%) |
| 20 to 24 Years | 215 (93.5%) | 127 (59.1%) |
| 25 to 29 Years | 42 (100.0%) | 15 (35.7%) |
| 30 to 34 Years | 160 (100.0%) | 51 (31.9%) |
| 35 to 44 Years | 170 (77.3%) | 51 (30.0%) |
| 45 to 54 Years | 182 (43.4%) | 14 (7.7%) |
| 55 to 59 Years | 118 (47.2%) | 0 (0.0%) |
| 60 to 64 Years | 27 (15.3%) | 0 (0.0%) |
| 65 to 74 Years | 44 (13.3%) | 0 (0.0%) |
| 75 Years and over | 0 (0.0%) | 0 (0.0%) |
| Total | 982 (45.2%) | 283 (28.8%) |
Employment Status by Educational Attainment in Ceiba
According to labor force statistics for Ceiba, 55.2% of individuals (699) out of the total population between 25 and 64 years of age (1,267) are in the labor force, with 18.7% or 131 of them being unemployed. The group with the highest labor force participation rate are those with the educational attainment of bachelor's degree or higher, with 66.7% or 110 individuals in the labor force. Within the labor force, individuals with less than high school education have the highest percentage of unemployment, with 44.3% or 51 of them being unemployed.
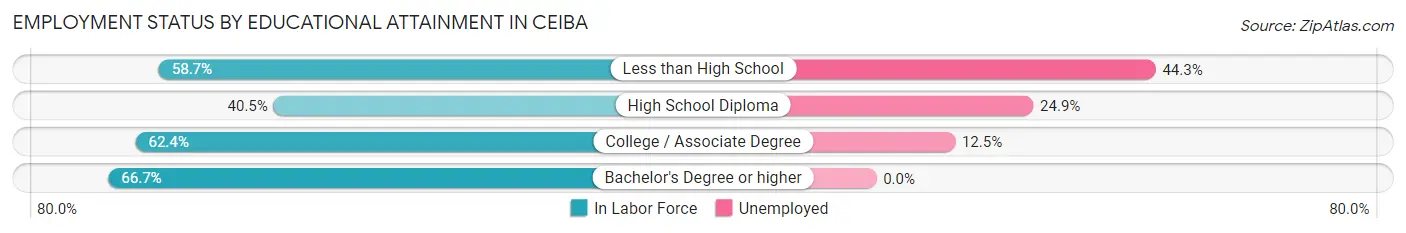
| Educational Attainment | In Labor Force | Unemployed |
| Less than High School | 115 (58.7%) | 87 (44.3%) |
| High School Diploma | 169 (40.5%) | 104 (24.9%) |
| College / Associate Degree | 305 (62.4%) | 61 (12.5%) |
| Bachelor's Degree or higher | 110 (66.7%) | 0 (0.0%) |
| Total | 699 (55.2%) | 237 (18.7%) |
Employment Occupations by Sex in Ceiba
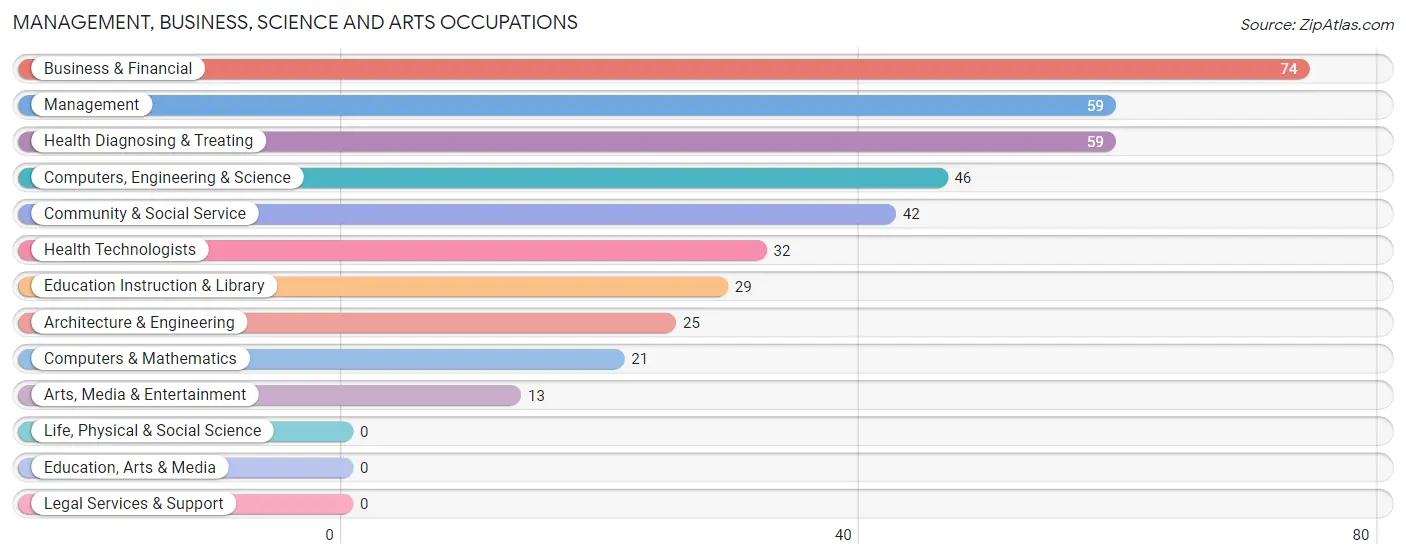
Management, Business, Science and Arts Occupations
The most common Management, Business, Science and Arts occupations in Ceiba are Business & Financial (74 | 10.6%), Management (59 | 8.4%), Health Diagnosing & Treating (59 | 8.4%), Computers, Engineering & Science (46 | 6.6%), and Community & Social Service (42 | 6.0%).
Management, Business, Science and Arts Occupations by Sex
Within the Management, Business, Science and Arts occupations in Ceiba, the most male-oriented occupations are Computers, Engineering & Science (100.0%), Computers & Mathematics (100.0%), and Architecture & Engineering (100.0%), while the most female-oriented occupations are Management (100.0%), Community & Social Service (100.0%), and Education Instruction & Library (100.0%).
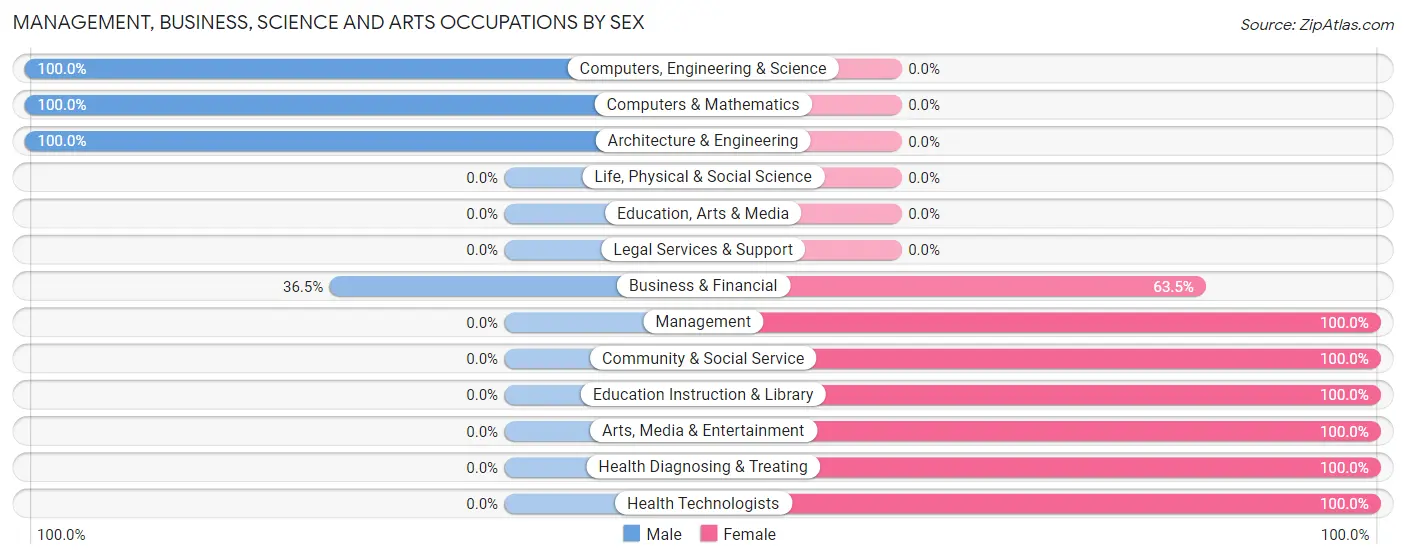
| Occupation | Male | Female |
| Management | 0 (0.0%) | 59 (100.0%) |
| Business & Financial | 27 (36.5%) | 47 (63.5%) |
| Computers, Engineering & Science | 46 (100.0%) | 0 (0.0%) |
| Computers & Mathematics | 21 (100.0%) | 0 (0.0%) |
| Architecture & Engineering | 25 (100.0%) | 0 (0.0%) |
| Life, Physical & Social Science | 0 (0.0%) | 0 (0.0%) |
| Community & Social Service | 0 (0.0%) | 42 (100.0%) |
| Education, Arts & Media | 0 (0.0%) | 0 (0.0%) |
| Legal Services & Support | 0 (0.0%) | 0 (0.0%) |
| Education Instruction & Library | 0 (0.0%) | 29 (100.0%) |
| Arts, Media & Entertainment | 0 (0.0%) | 13 (100.0%) |
| Health Diagnosing & Treating | 0 (0.0%) | 59 (100.0%) |
| Health Technologists | 0 (0.0%) | 32 (100.0%) |
| Total (Category) | 73 (26.1%) | 207 (73.9%) |
| Total (Overall) | 287 (41.0%) | 413 (59.0%) |
Services Occupations
The most common Services occupations in Ceiba are Cleaning & Maintenance (94 | 13.4%), Food Preparation & Serving (71 | 10.1%), and Personal Care & Service (70 | 10.0%).
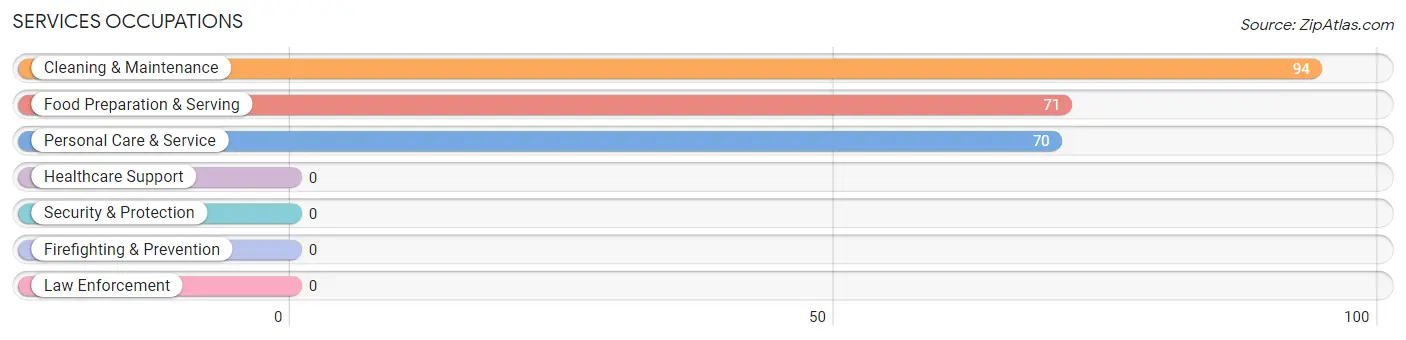
Services Occupations by Sex
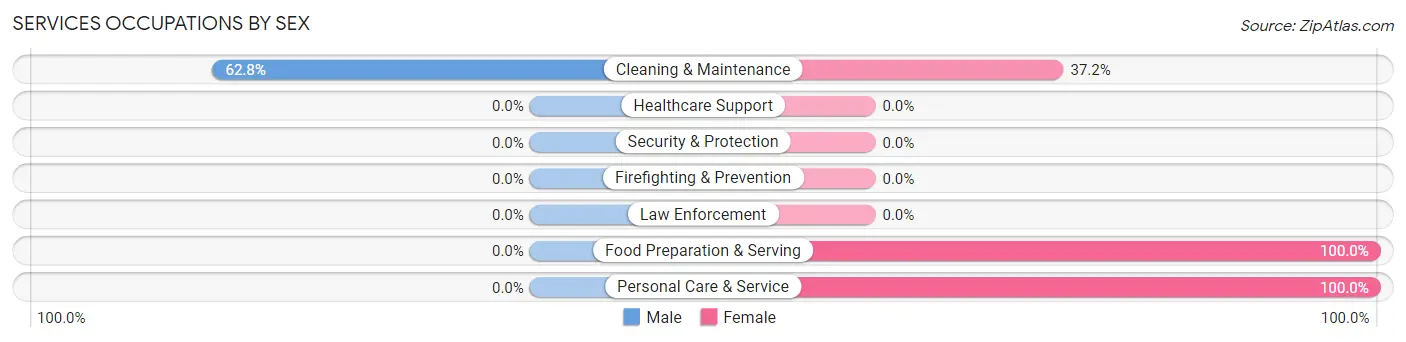
| Occupation | Male | Female |
| Healthcare Support | 0 (0.0%) | 0 (0.0%) |
| Security & Protection | 0 (0.0%) | 0 (0.0%) |
| Firefighting & Prevention | 0 (0.0%) | 0 (0.0%) |
| Law Enforcement | 0 (0.0%) | 0 (0.0%) |
| Food Preparation & Serving | 0 (0.0%) | 71 (100.0%) |
| Cleaning & Maintenance | 59 (62.8%) | 35 (37.2%) |
| Personal Care & Service | 0 (0.0%) | 70 (100.0%) |
| Total (Category) | 59 (25.1%) | 176 (74.9%) |
| Total (Overall) | 287 (41.0%) | 413 (59.0%) |
Sales and Office Occupations
The most common Sales and Office occupations in Ceiba are , and Office & Administration (30 | 4.3%).
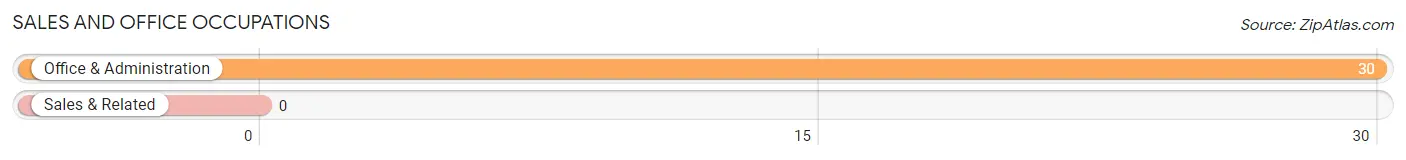
Sales and Office Occupations by Sex
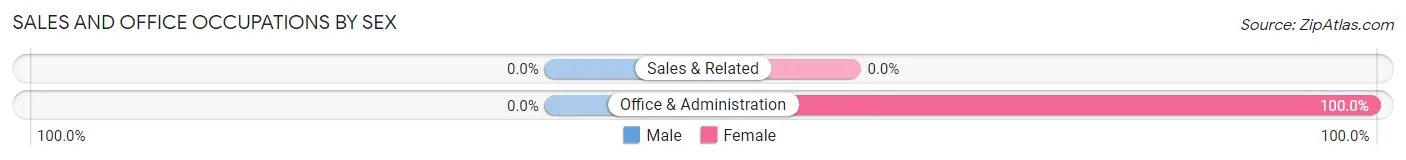
| Occupation | Male | Female |
| Sales & Related | 0 (0.0%) | 0 (0.0%) |
| Office & Administration | 0 (0.0%) | 30 (100.0%) |
| Total (Category) | 0 (0.0%) | 30 (100.0%) |
| Total (Overall) | 287 (41.0%) | 413 (59.0%) |
Natural Resources, Construction and Maintenance Occupations
The most common Natural Resources, Construction and Maintenance occupations in Ceiba are Installation, Maintenance & Repair (49 | 7.0%), and Construction & Extraction (24 | 3.4%).
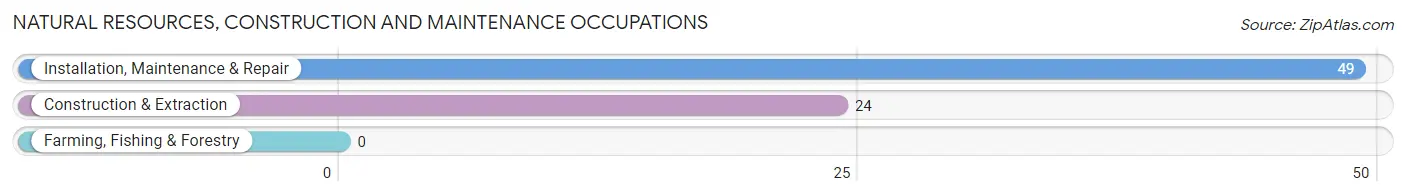
Natural Resources, Construction and Maintenance Occupations by Sex
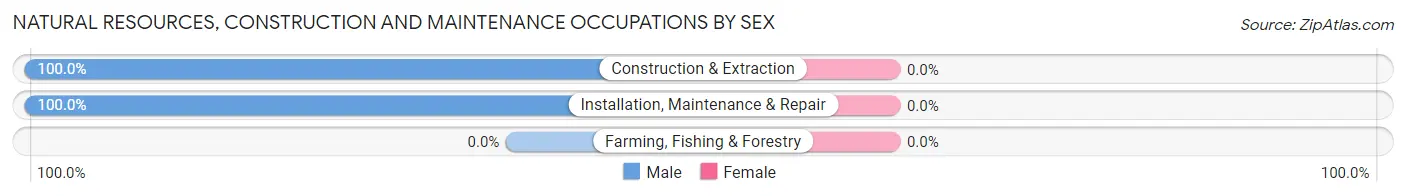
| Occupation | Male | Female |
| Farming, Fishing & Forestry | 0 (0.0%) | 0 (0.0%) |
| Construction & Extraction | 24 (100.0%) | 0 (0.0%) |
| Installation, Maintenance & Repair | 49 (100.0%) | 0 (0.0%) |
| Total (Category) | 73 (100.0%) | 0 (0.0%) |
| Total (Overall) | 287 (41.0%) | 413 (59.0%) |
Production, Transportation and Moving Occupations
The most common Production, Transportation and Moving occupations in Ceiba are Material Moving (62 | 8.9%), and Transportation (20 | 2.9%).
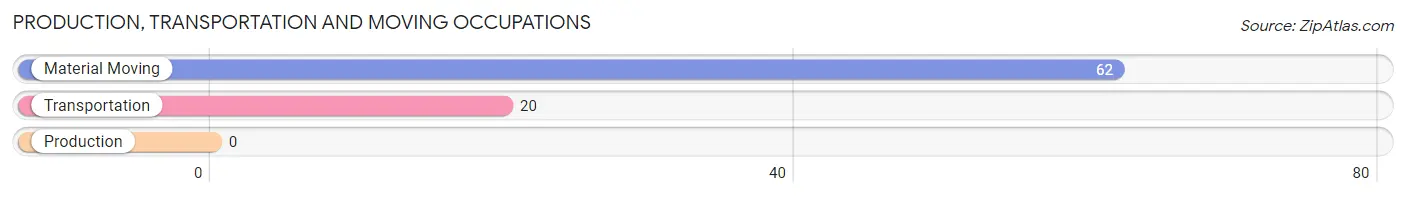
Production, Transportation and Moving Occupations by Sex
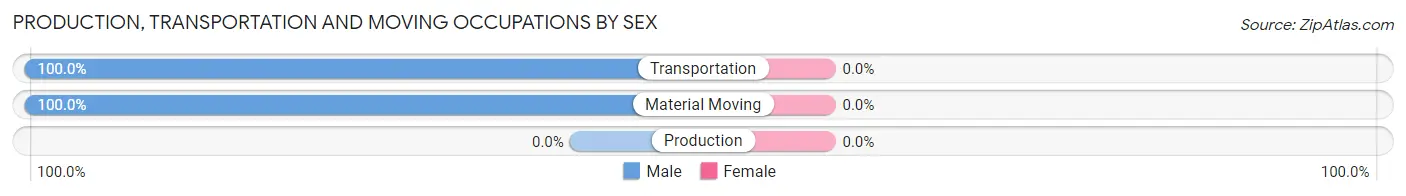
| Occupation | Male | Female |
| Production | 0 (0.0%) | 0 (0.0%) |
| Transportation | 20 (100.0%) | 0 (0.0%) |
| Material Moving | 62 (100.0%) | 0 (0.0%) |
| Total (Category) | 82 (100.0%) | 0 (0.0%) |
| Total (Overall) | 287 (41.0%) | 413 (59.0%) |
Employment Industries by Sex in Ceiba
Employment Industries in Ceiba
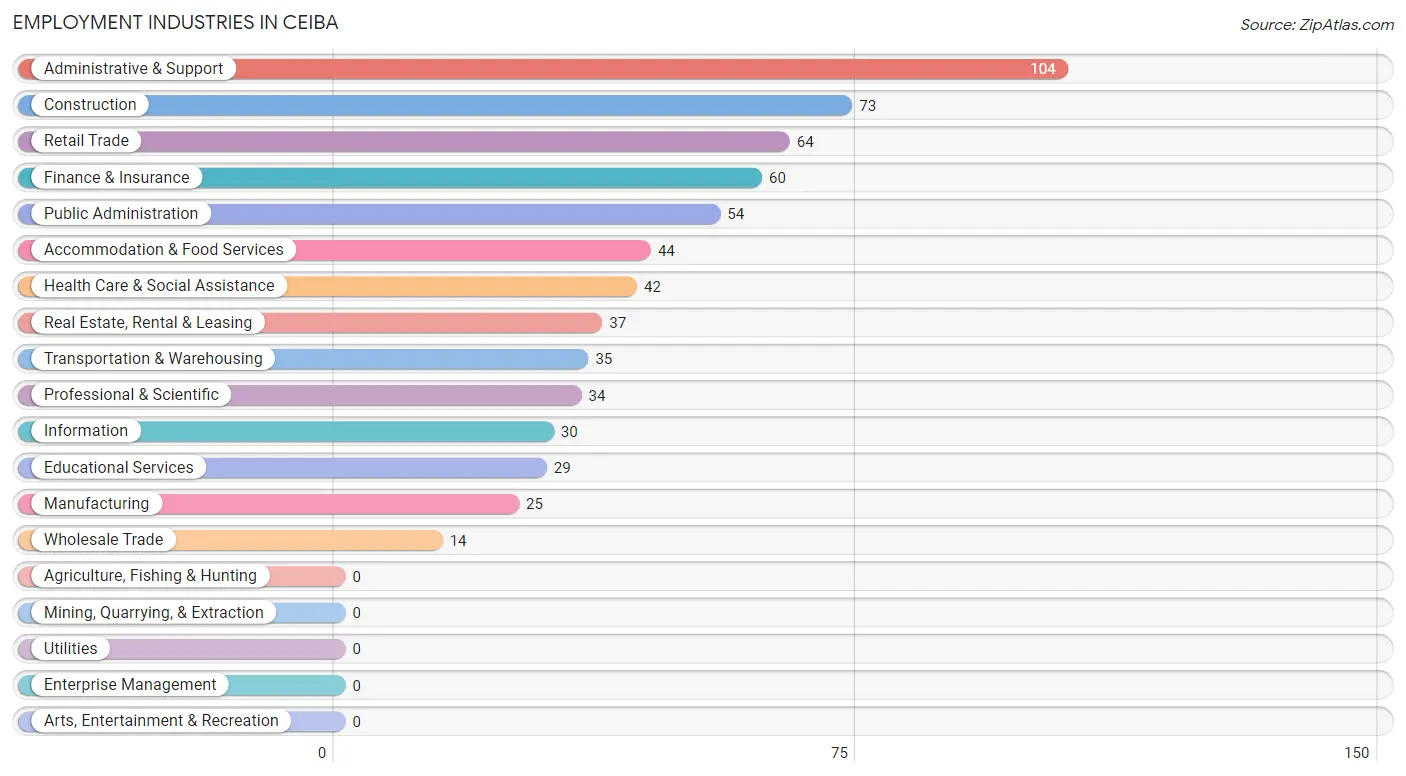
The major employment industries in Ceiba include Administrative & Support (104 | 14.9%), Construction (73 | 10.4%), Retail Trade (64 | 9.1%), Finance & Insurance (60 | 8.6%), and Public Administration (54 | 7.7%).
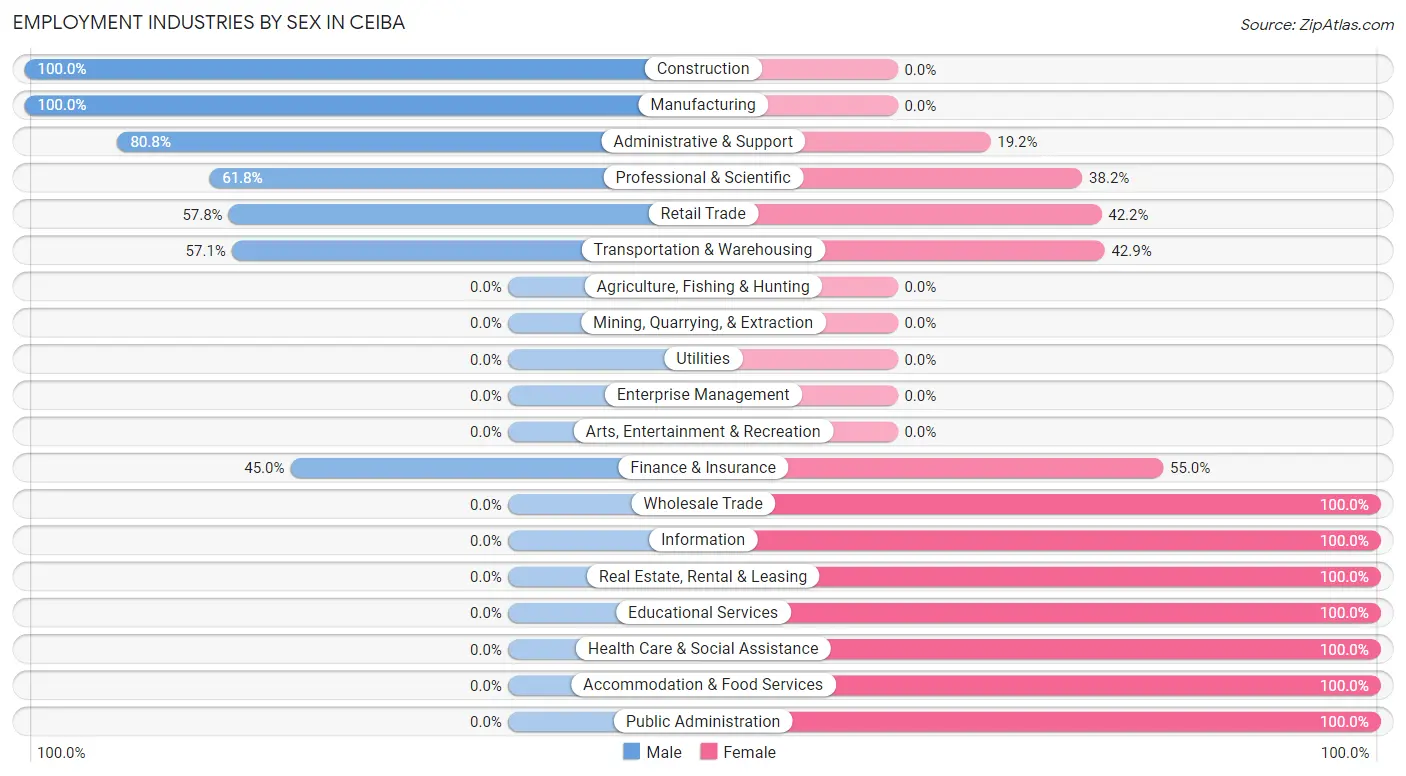
Employment Industries by Sex in Ceiba
The Ceiba industries that see more men than women are Construction (100.0%), Manufacturing (100.0%), and Administrative & Support (80.8%), whereas the industries that tend to have a higher number of women are Wholesale Trade (100.0%), Information (100.0%), and Real Estate, Rental & Leasing (100.0%).
| Industry | Male | Female |
| Agriculture, Fishing & Hunting | 0 (0.0%) | 0 (0.0%) |
| Mining, Quarrying, & Extraction | 0 (0.0%) | 0 (0.0%) |
| Construction | 73 (100.0%) | 0 (0.0%) |
| Manufacturing | 25 (100.0%) | 0 (0.0%) |
| Wholesale Trade | 0 (0.0%) | 14 (100.0%) |
| Retail Trade | 37 (57.8%) | 27 (42.2%) |
| Transportation & Warehousing | 20 (57.1%) | 15 (42.9%) |
| Utilities | 0 (0.0%) | 0 (0.0%) |
| Information | 0 (0.0%) | 30 (100.0%) |
| Finance & Insurance | 27 (45.0%) | 33 (55.0%) |
| Real Estate, Rental & Leasing | 0 (0.0%) | 37 (100.0%) |
| Professional & Scientific | 21 (61.8%) | 13 (38.2%) |
| Enterprise Management | 0 (0.0%) | 0 (0.0%) |
| Administrative & Support | 84 (80.8%) | 20 (19.2%) |
| Educational Services | 0 (0.0%) | 29 (100.0%) |
| Health Care & Social Assistance | 0 (0.0%) | 42 (100.0%) |
| Arts, Entertainment & Recreation | 0 (0.0%) | 0 (0.0%) |
| Accommodation & Food Services | 0 (0.0%) | 44 (100.0%) |
| Public Administration | 0 (0.0%) | 54 (100.0%) |
| Total | 287 (41.0%) | 413 (59.0%) |
Education in Ceiba
School Enrollment in Ceiba
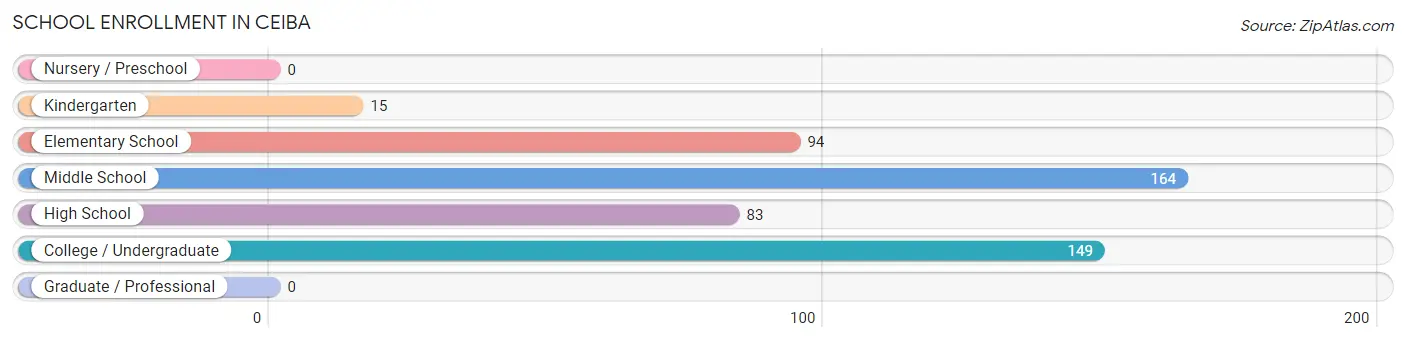
The most common levels of schooling among the 505 students in Ceiba are middle school (164 | 32.5%), college / undergraduate (149 | 29.5%), and elementary school (94 | 18.6%).
| School Level | # Students | % Students |
| Nursery / Preschool | 0 | 0.0% |
| Kindergarten | 15 | 3.0% |
| Elementary School | 94 | 18.6% |
| Middle School | 164 | 32.5% |
| High School | 83 | 16.4% |
| College / Undergraduate | 149 | 29.5% |
| Graduate / Professional | 0 | 0.0% |
| Total | 505 | 100.0% |
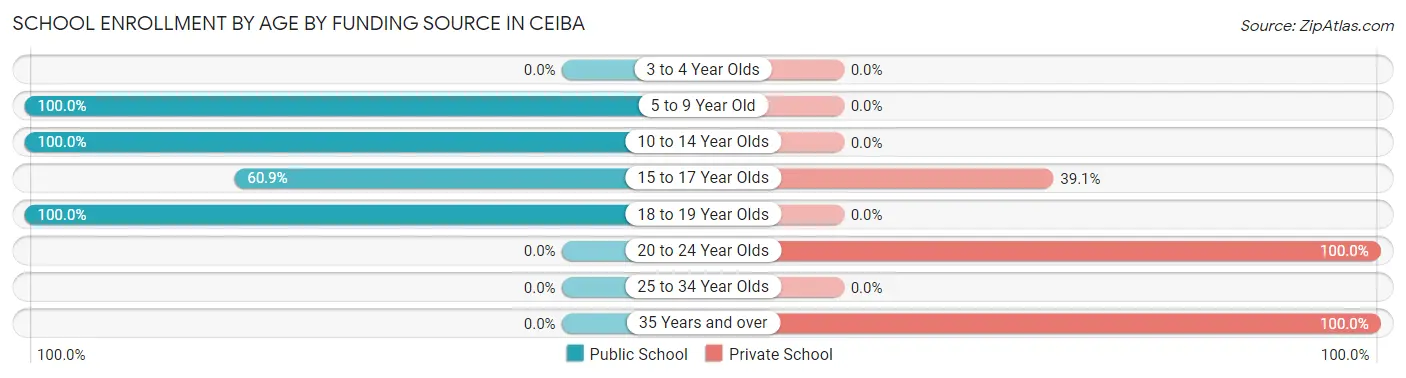
School Enrollment by Age by Funding Source in Ceiba
Out of a total of 505 students who are enrolled in schools in Ceiba, 149 (29.5%) attend a private institution, while the remaining 356 (70.5%) are enrolled in public schools. The age group of 20 to 24 year olds has the highest likelihood of being enrolled in private schools, with 100 (100.0% in the age bracket) enrolled. Conversely, the age group of 5 to 9 year old has the lowest likelihood of being enrolled in a private school, with 109 (100.0% in the age bracket) attending a public institution.
| Age Bracket | Public School | Private School |
| 3 to 4 Year Olds | 0 (0.0%) | 0 (0.0%) |
| 5 to 9 Year Old | 109 (100.0%) | 0 (0.0%) |
| 10 to 14 Year Olds | 192 (100.0%) | 0 (0.0%) |
| 15 to 17 Year Olds | 39 (60.9%) | 25 (39.1%) |
| 18 to 19 Year Olds | 16 (100.0%) | 0 (0.0%) |
| 20 to 24 Year Olds | 0 (0.0%) | 100 (100.0%) |
| 25 to 34 Year Olds | 0 (0.0%) | 0 (0.0%) |
| 35 Years and over | 0 (0.0%) | 24 (100.0%) |
| Total | 356 (70.5%) | 149 (29.5%) |
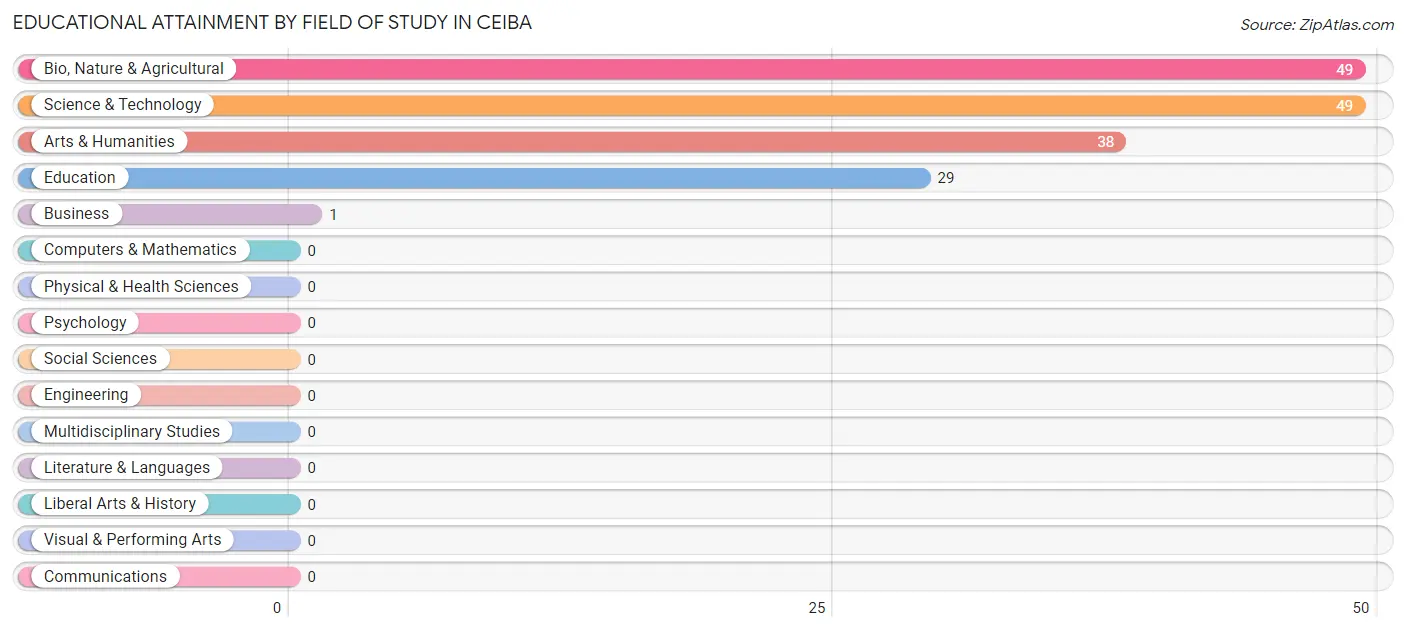
Educational Attainment by Field of Study in Ceiba
Bio, nature & agricultural (49 | 29.5%), science & technology (49 | 29.5%), arts & humanities (38 | 22.9%), education (29 | 17.5%), and business (1 | 0.6%) are the most common fields of study among 166 individuals in Ceiba who have obtained a bachelor's degree or higher.
| Field of Study | # Graduates | % Graduates |
| Computers & Mathematics | 0 | 0.0% |
| Bio, Nature & Agricultural | 49 | 29.5% |
| Physical & Health Sciences | 0 | 0.0% |
| Psychology | 0 | 0.0% |
| Social Sciences | 0 | 0.0% |
| Engineering | 0 | 0.0% |
| Multidisciplinary Studies | 0 | 0.0% |
| Science & Technology | 49 | 29.5% |
| Business | 1 | 0.6% |
| Education | 29 | 17.5% |
| Literature & Languages | 0 | 0.0% |
| Liberal Arts & History | 0 | 0.0% |
| Visual & Performing Arts | 0 | 0.0% |
| Communications | 0 | 0.0% |
| Arts & Humanities | 38 | 22.9% |
| Total | 166 | 100.0% |
Transportation & Commute in Ceiba
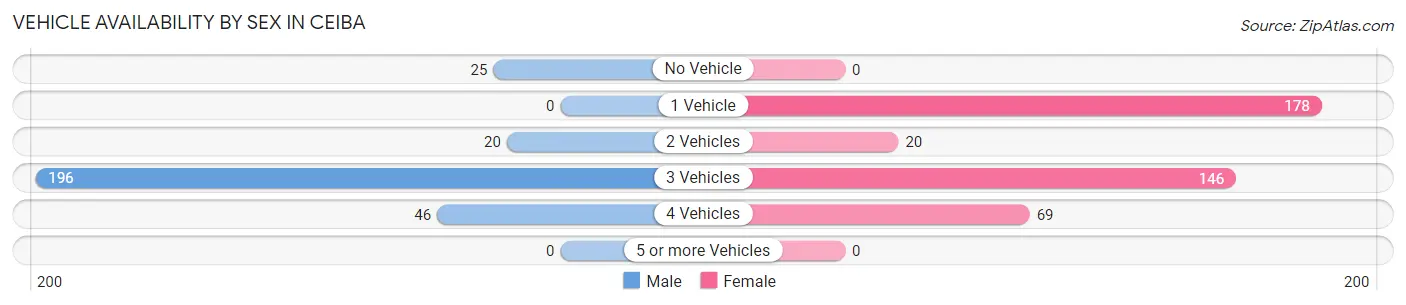
Vehicle Availability by Sex in Ceiba
The most prevalent vehicle ownership categories in Ceiba are males with 3 vehicles (196, accounting for 68.3%) and females with 3 vehicles (146, making up 47.5%).
| Vehicles Available | Male | Female |
| No Vehicle | 25 (8.7%) | 0 (0.0%) |
| 1 Vehicle | 0 (0.0%) | 178 (43.1%) |
| 2 Vehicles | 20 (7.0%) | 20 (4.8%) |
| 3 Vehicles | 196 (68.3%) | 146 (35.3%) |
| 4 Vehicles | 46 (16.0%) | 69 (16.7%) |
| 5 or more Vehicles | 0 (0.0%) | 0 (0.0%) |
| Total | 287 (100.0%) | 413 (100.0%) |
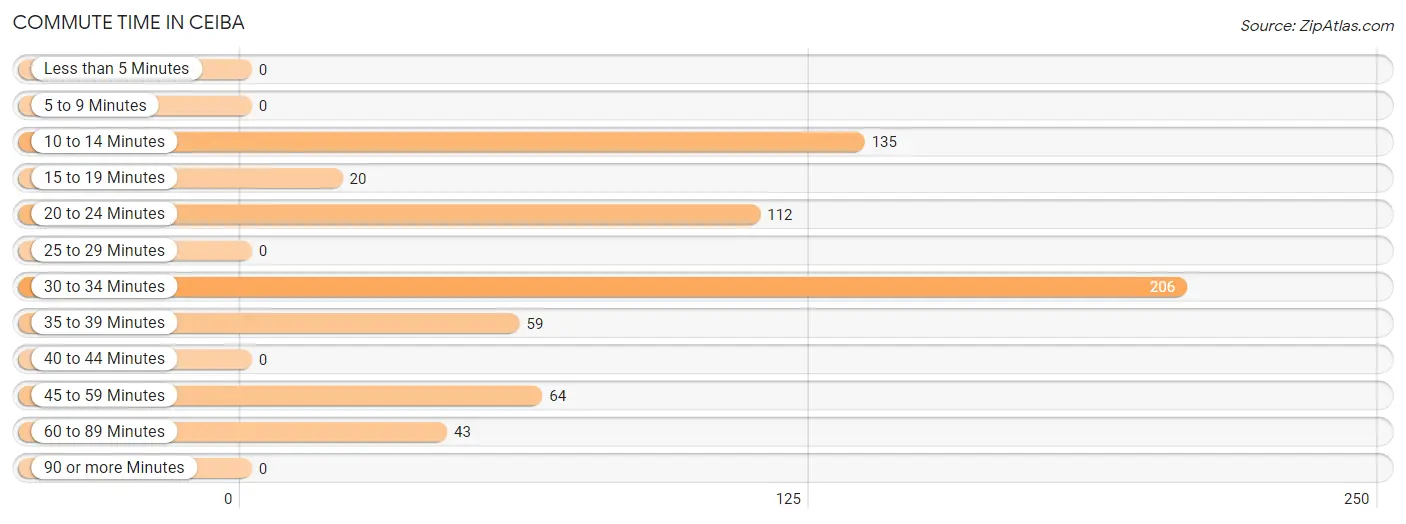
Commute Time in Ceiba
The most frequently occuring commute durations in Ceiba are 30 to 34 minutes (206 commuters, 32.2%), 10 to 14 minutes (135 commuters, 21.1%), and 20 to 24 minutes (112 commuters, 17.5%).
| Commute Time | # Commuters | % Commuters |
| Less than 5 Minutes | 0 | 0.0% |
| 5 to 9 Minutes | 0 | 0.0% |
| 10 to 14 Minutes | 135 | 21.1% |
| 15 to 19 Minutes | 20 | 3.1% |
| 20 to 24 Minutes | 112 | 17.5% |
| 25 to 29 Minutes | 0 | 0.0% |
| 30 to 34 Minutes | 206 | 32.2% |
| 35 to 39 Minutes | 59 | 9.2% |
| 40 to 44 Minutes | 0 | 0.0% |
| 45 to 59 Minutes | 64 | 10.0% |
| 60 to 89 Minutes | 43 | 6.7% |
| 90 or more Minutes | 0 | 0.0% |
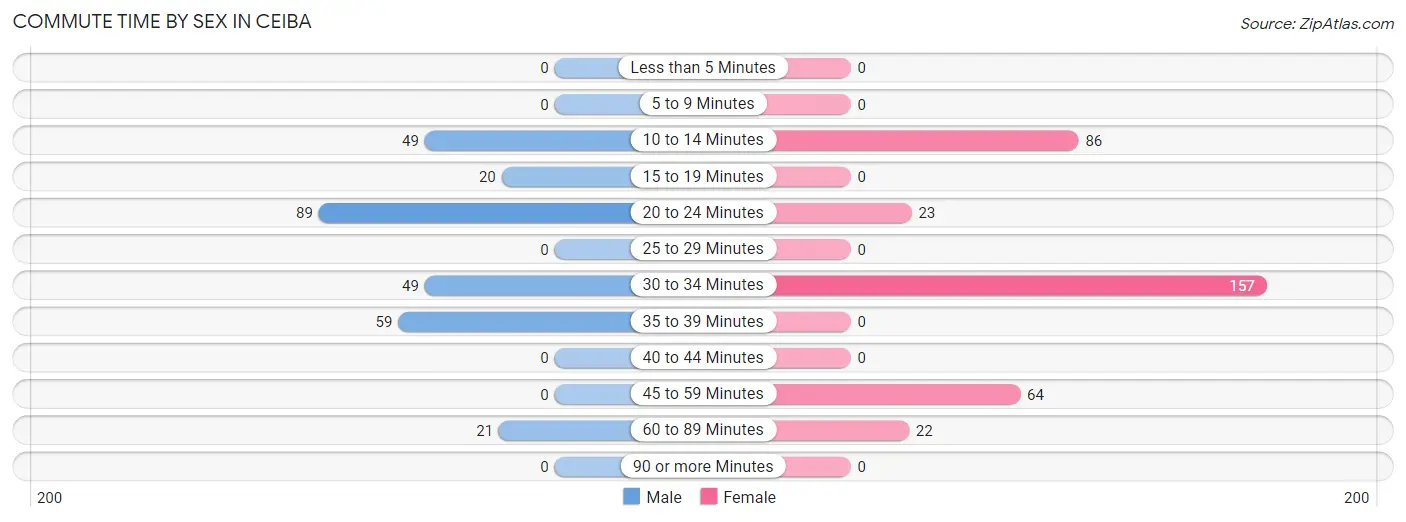
Commute Time by Sex in Ceiba
The most common commute times in Ceiba are 20 to 24 minutes (89 commuters, 31.0%) for males and 30 to 34 minutes (157 commuters, 44.6%) for females.
| Commute Time | Male | Female |
| Less than 5 Minutes | 0 (0.0%) | 0 (0.0%) |
| 5 to 9 Minutes | 0 (0.0%) | 0 (0.0%) |
| 10 to 14 Minutes | 49 (17.1%) | 86 (24.4%) |
| 15 to 19 Minutes | 20 (7.0%) | 0 (0.0%) |
| 20 to 24 Minutes | 89 (31.0%) | 23 (6.5%) |
| 25 to 29 Minutes | 0 (0.0%) | 0 (0.0%) |
| 30 to 34 Minutes | 49 (17.1%) | 157 (44.6%) |
| 35 to 39 Minutes | 59 (20.6%) | 0 (0.0%) |
| 40 to 44 Minutes | 0 (0.0%) | 0 (0.0%) |
| 45 to 59 Minutes | 0 (0.0%) | 64 (18.2%) |
| 60 to 89 Minutes | 21 (7.3%) | 22 (6.2%) |
| 90 or more Minutes | 0 (0.0%) | 0 (0.0%) |
Time of Departure to Work by Sex in Ceiba
The most frequent times of departure to work in Ceiba are 8:00 AM to 8:29 AM (110, 38.3%) for males and 6:00 AM to 6:29 AM (146, 41.5%) for females.
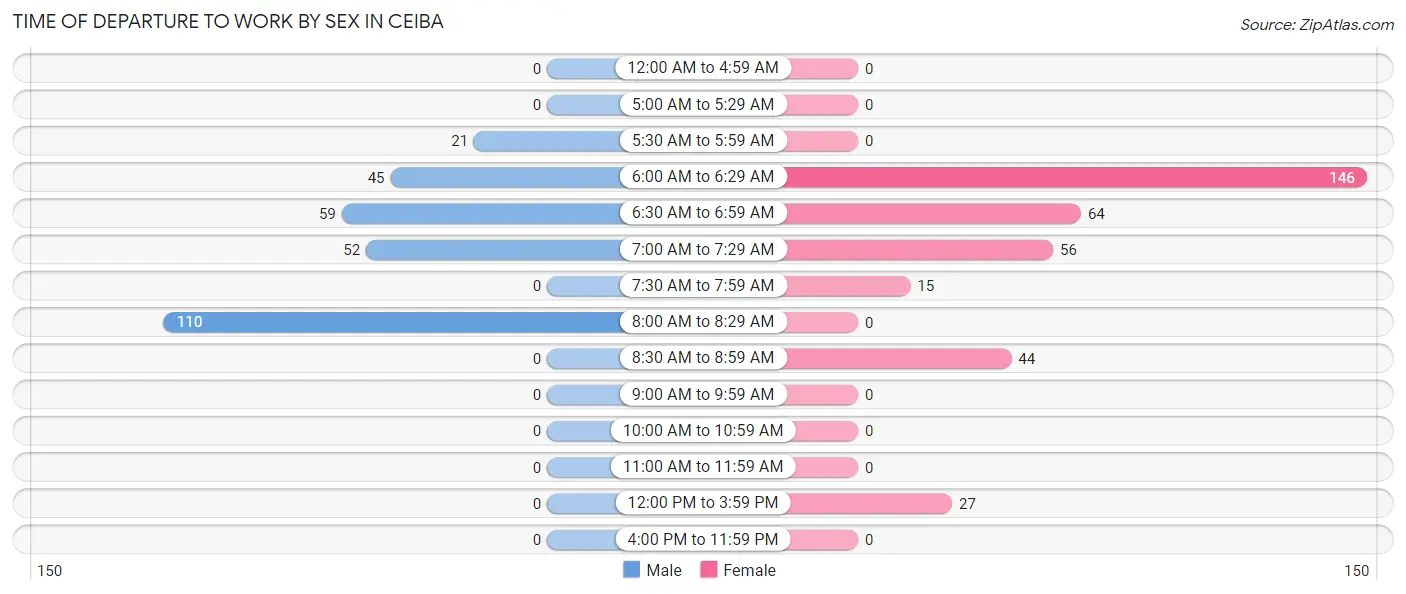
| Time of Departure | Male | Female |
| 12:00 AM to 4:59 AM | 0 (0.0%) | 0 (0.0%) |
| 5:00 AM to 5:29 AM | 0 (0.0%) | 0 (0.0%) |
| 5:30 AM to 5:59 AM | 21 (7.3%) | 0 (0.0%) |
| 6:00 AM to 6:29 AM | 45 (15.7%) | 146 (41.5%) |
| 6:30 AM to 6:59 AM | 59 (20.6%) | 64 (18.2%) |
| 7:00 AM to 7:29 AM | 52 (18.1%) | 56 (15.9%) |
| 7:30 AM to 7:59 AM | 0 (0.0%) | 15 (4.3%) |
| 8:00 AM to 8:29 AM | 110 (38.3%) | 0 (0.0%) |
| 8:30 AM to 8:59 AM | 0 (0.0%) | 44 (12.5%) |
| 9:00 AM to 9:59 AM | 0 (0.0%) | 0 (0.0%) |
| 10:00 AM to 10:59 AM | 0 (0.0%) | 0 (0.0%) |
| 11:00 AM to 11:59 AM | 0 (0.0%) | 0 (0.0%) |
| 12:00 PM to 3:59 PM | 0 (0.0%) | 27 (7.7%) |
| 4:00 PM to 11:59 PM | 0 (0.0%) | 0 (0.0%) |
| Total | 287 (100.0%) | 352 (100.0%) |
Housing Occupancy in Ceiba
Occupancy by Ownership in Ceiba
Of the total 1,950 dwellings in Ceiba, owner-occupied units account for 1,327 (68.0%), while renter-occupied units make up 623 (32.0%).
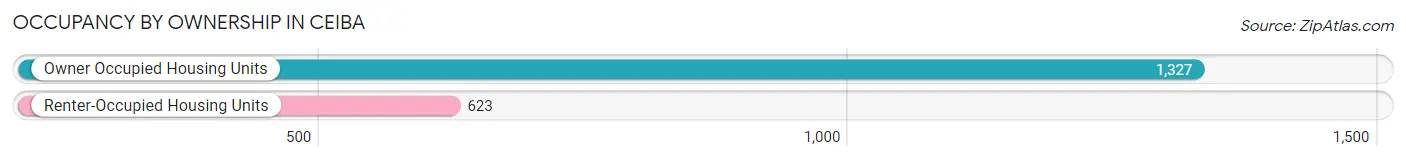
| Occupancy | # Housing Units | % Housing Units |
| Owner Occupied Housing Units | 1,327 | 68.0% |
| Renter-Occupied Housing Units | 623 | 32.0% |
| Total Occupied Housing Units | 1,950 | 100.0% |
Occupancy by Household Size in Ceiba
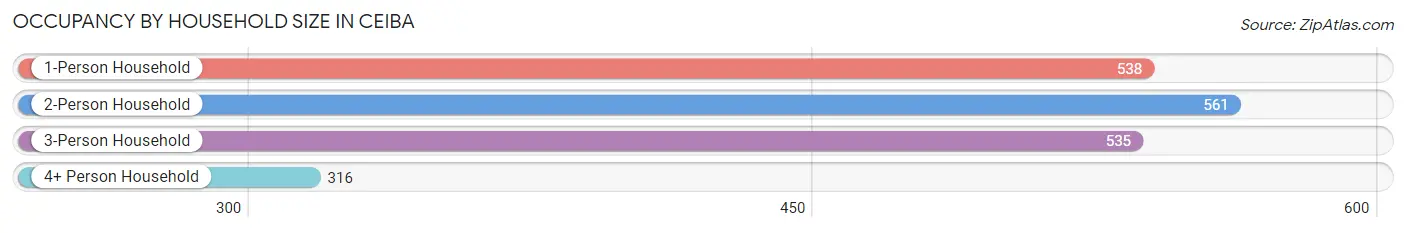
| Household Size | # Housing Units | % Housing Units |
| 1-Person Household | 538 | 27.6% |
| 2-Person Household | 561 | 28.8% |
| 3-Person Household | 535 | 27.4% |
| 4+ Person Household | 316 | 16.2% |
| Total Housing Units | 1,950 | 100.0% |
Occupancy by Ownership by Household Size in Ceiba
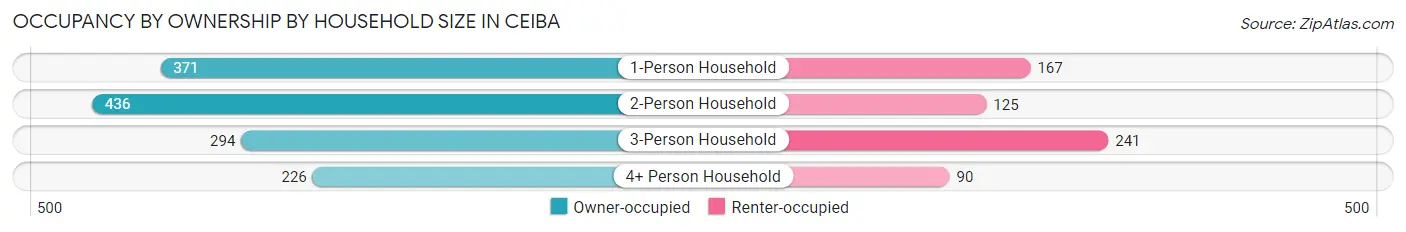
| Household Size | Owner-occupied | Renter-occupied |
| 1-Person Household | 371 (69.0%) | 167 (31.0%) |
| 2-Person Household | 436 (77.7%) | 125 (22.3%) |
| 3-Person Household | 294 (54.9%) | 241 (45.1%) |
| 4+ Person Household | 226 (71.5%) | 90 (28.5%) |
| Total Housing Units | 1,327 (68.0%) | 623 (32.0%) |
Occupancy by Educational Attainment in Ceiba
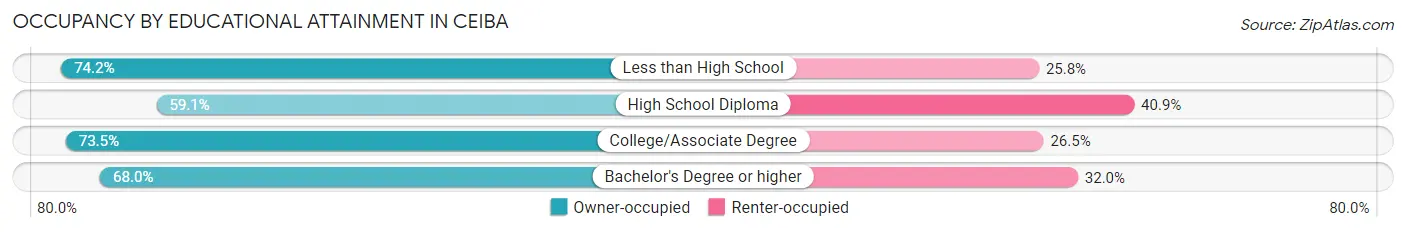
| Household Size | Owner-occupied | Renter-occupied |
| Less than High School | 273 (74.2%) | 95 (25.8%) |
| High School Diploma | 361 (59.1%) | 250 (40.9%) |
| College/Associate Degree | 440 (73.5%) | 159 (26.5%) |
| Bachelor's Degree or higher | 253 (68.0%) | 119 (32.0%) |
Occupancy by Age of Householder in Ceiba
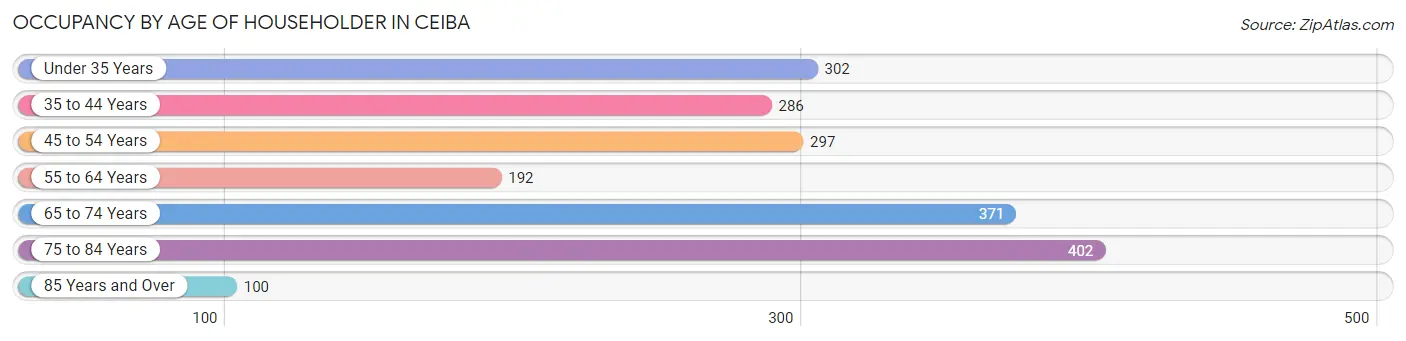
| Age Bracket | # Households | % Households |
| Under 35 Years | 302 | 15.5% |
| 35 to 44 Years | 286 | 14.7% |
| 45 to 54 Years | 297 | 15.2% |
| 55 to 64 Years | 192 | 9.9% |
| 65 to 74 Years | 371 | 19.0% |
| 75 to 84 Years | 402 | 20.6% |
| 85 Years and Over | 100 | 5.1% |
| Total | 1,950 | 100.0% |
Housing Finances in Ceiba
Median Income by Occupancy in Ceiba
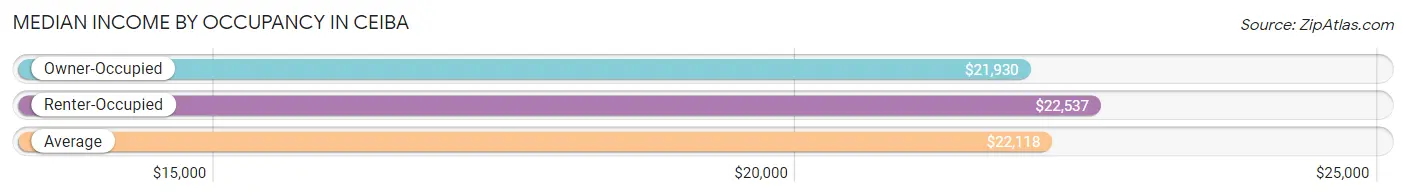
| Occupancy Type | # Households | Median Income |
| Owner-Occupied | 593 (65.8%) | $21,930 |
| Renter-Occupied | 308 (34.2%) | $22,537 |
| Average | 901 (100.0%) | $22,118 |
Occupancy by Householder Income Bracket in Ceiba
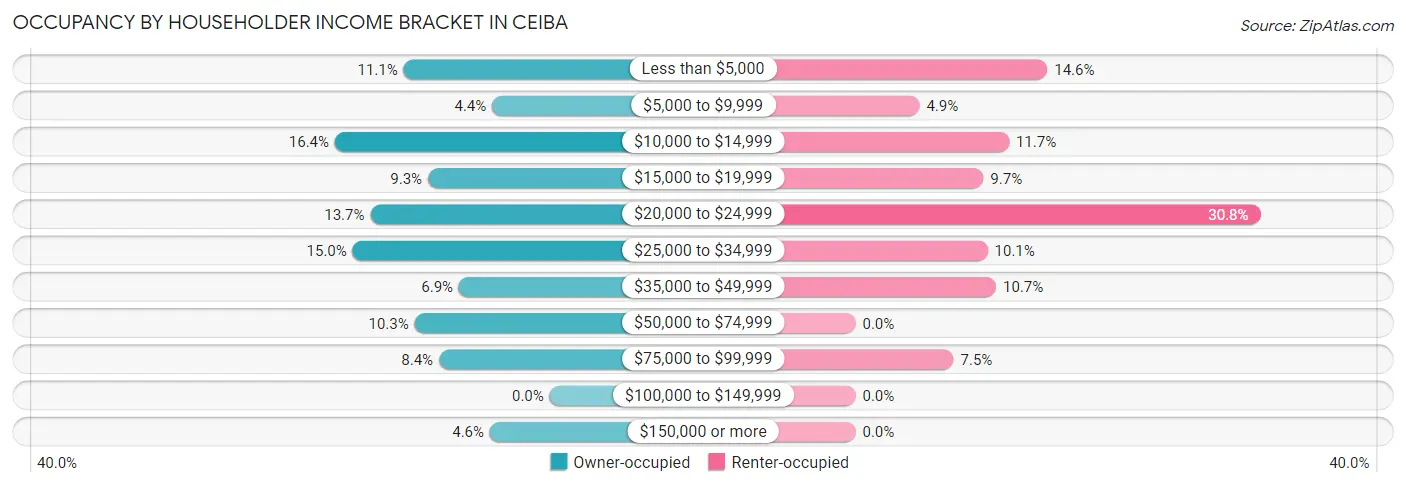
| Income Bracket | Owner-occupied | Renter-occupied |
| Less than $5,000 | 66 (11.1%) | 45 (14.6%) |
| $5,000 to $9,999 | 26 (4.4%) | 15 (4.9%) |
| $10,000 to $14,999 | 97 (16.4%) | 36 (11.7%) |
| $15,000 to $19,999 | 55 (9.3%) | 30 (9.7%) |
| $20,000 to $24,999 | 81 (13.7%) | 95 (30.8%) |
| $25,000 to $34,999 | 89 (15.0%) | 31 (10.1%) |
| $35,000 to $49,999 | 41 (6.9%) | 33 (10.7%) |
| $50,000 to $74,999 | 61 (10.3%) | 0 (0.0%) |
| $75,000 to $99,999 | 50 (8.4%) | 23 (7.5%) |
| $100,000 to $149,999 | 0 (0.0%) | 0 (0.0%) |
| $150,000 or more | 27 (4.5%) | 0 (0.0%) |
| Total | 593 (100.0%) | 308 (100.0%) |
Monthly Housing Cost Tiers in Ceiba
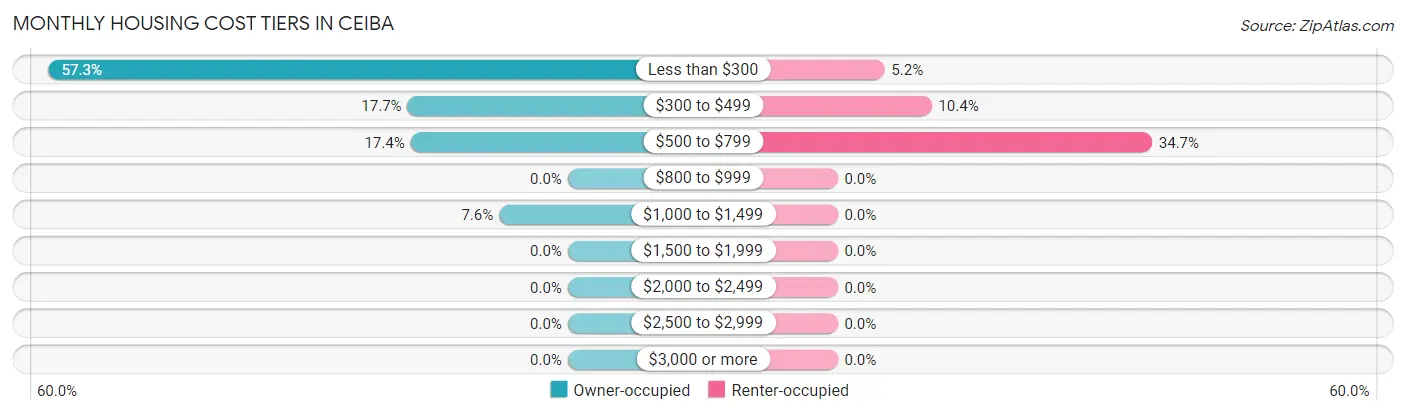
| Monthly Cost | Owner-occupied | Renter-occupied |
| Less than $300 | 340 (57.3%) | 16 (5.2%) |
| $300 to $499 | 105 (17.7%) | 32 (10.4%) |
| $500 to $799 | 103 (17.4%) | 107 (34.7%) |
| $800 to $999 | 0 (0.0%) | 0 (0.0%) |
| $1,000 to $1,499 | 45 (7.6%) | 0 (0.0%) |
| $1,500 to $1,999 | 0 (0.0%) | 0 (0.0%) |
| $2,000 to $2,499 | 0 (0.0%) | 0 (0.0%) |
| $2,500 to $2,999 | 0 (0.0%) | 0 (0.0%) |
| $3,000 or more | 0 (0.0%) | 0 (0.0%) |
| Total | 593 (100.0%) | 308 (100.0%) |
Physical Housing Characteristics in Ceiba
Housing Structures in Ceiba
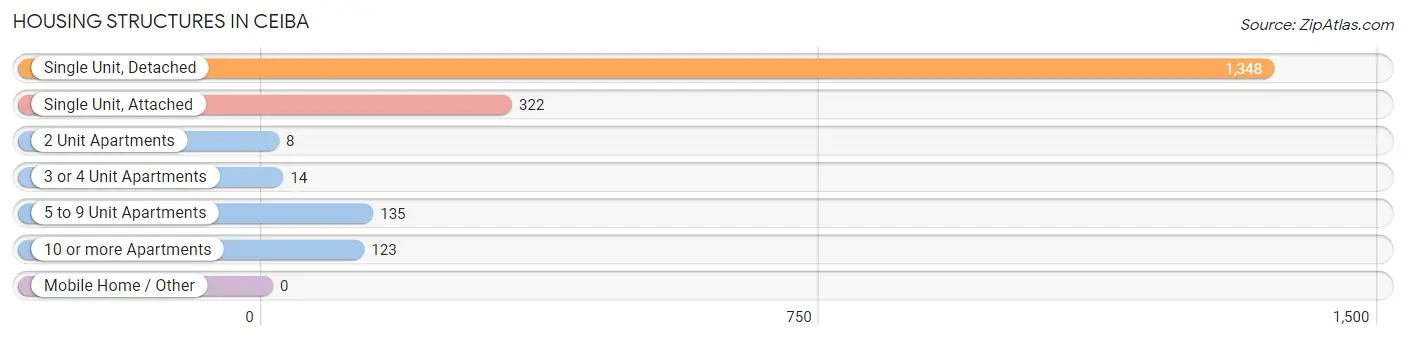
| Structure Type | # Housing Units | % Housing Units |
| Single Unit, Detached | 1,348 | 69.1% |
| Single Unit, Attached | 322 | 16.5% |
| 2 Unit Apartments | 8 | 0.4% |
| 3 or 4 Unit Apartments | 14 | 0.7% |
| 5 to 9 Unit Apartments | 135 | 6.9% |
| 10 or more Apartments | 123 | 6.3% |
| Mobile Home / Other | 0 | 0.0% |
| Total | 1,950 | 100.0% |
Housing Structures by Occupancy in Ceiba
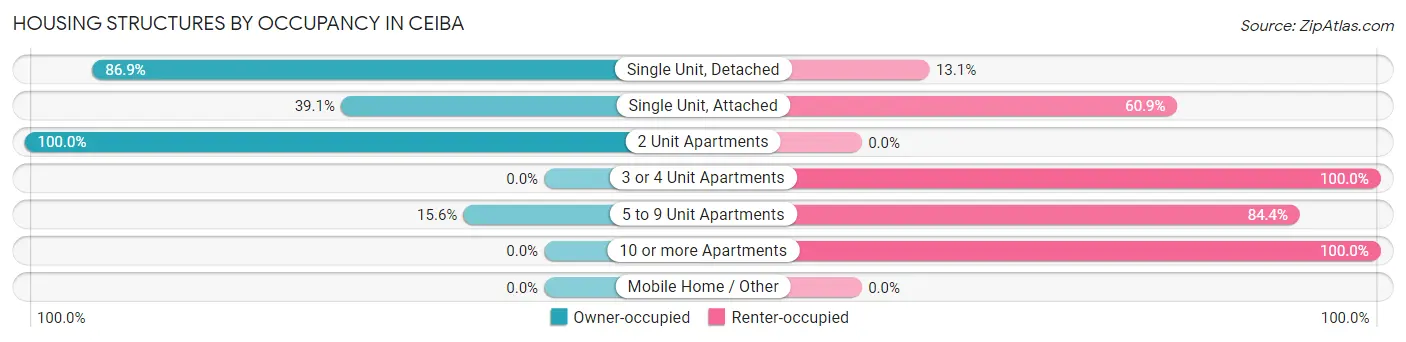
| Structure Type | Owner-occupied | Renter-occupied |
| Single Unit, Detached | 1,172 (86.9%) | 176 (13.1%) |
| Single Unit, Attached | 126 (39.1%) | 196 (60.9%) |
| 2 Unit Apartments | 8 (100.0%) | 0 (0.0%) |
| 3 or 4 Unit Apartments | 0 (0.0%) | 14 (100.0%) |
| 5 to 9 Unit Apartments | 21 (15.6%) | 114 (84.4%) |
| 10 or more Apartments | 0 (0.0%) | 123 (100.0%) |
| Mobile Home / Other | 0 (0.0%) | 0 (0.0%) |
| Total | 1,327 (68.0%) | 623 (32.0%) |
Housing Structures by Number of Rooms in Ceiba
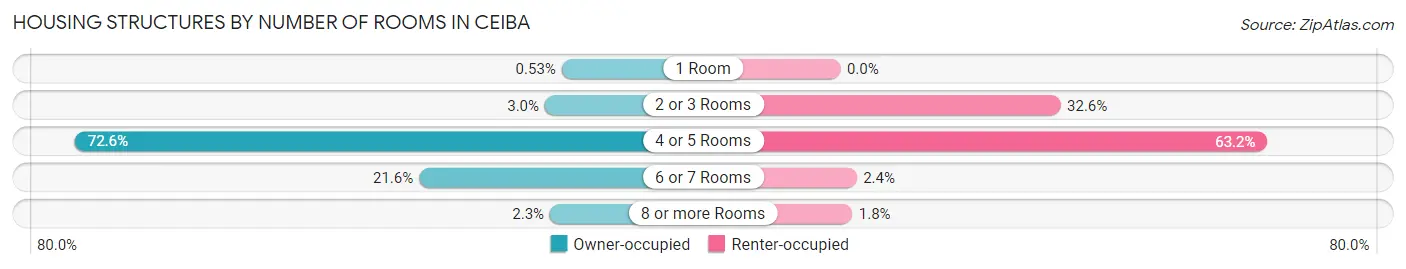
| Number of Rooms | Owner-occupied | Renter-occupied |
| 1 Room | 7 (0.5%) | 0 (0.0%) |
| 2 or 3 Rooms | 40 (3.0%) | 203 (32.6%) |
| 4 or 5 Rooms | 963 (72.6%) | 394 (63.2%) |
| 6 or 7 Rooms | 287 (21.6%) | 15 (2.4%) |
| 8 or more Rooms | 30 (2.3%) | 11 (1.8%) |
| Total | 1,327 (100.0%) | 623 (100.0%) |
Housing Structure by Heating Type in Ceiba
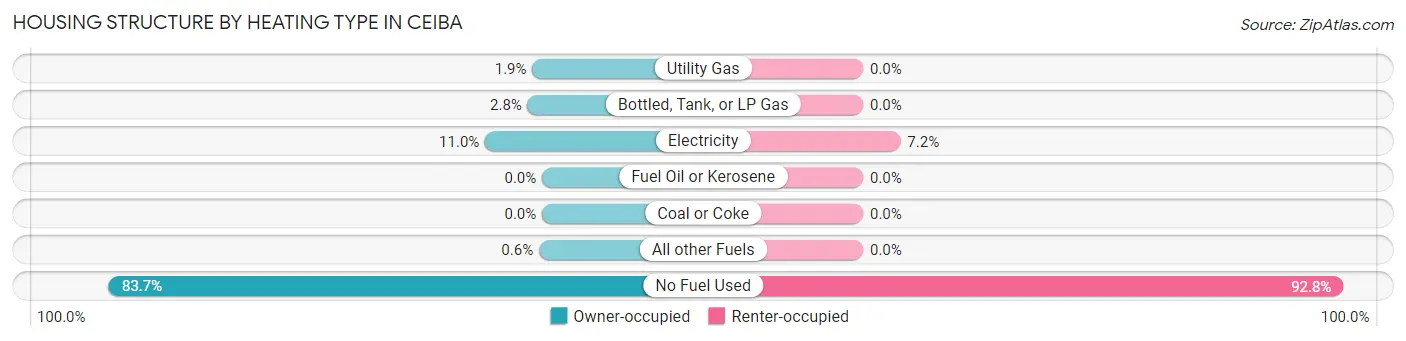
| Heating Type | Owner-occupied | Renter-occupied |
| Utility Gas | 25 (1.9%) | 0 (0.0%) |
| Bottled, Tank, or LP Gas | 37 (2.8%) | 0 (0.0%) |
| Electricity | 146 (11.0%) | 45 (7.2%) |
| Fuel Oil or Kerosene | 0 (0.0%) | 0 (0.0%) |
| Coal or Coke | 0 (0.0%) | 0 (0.0%) |
| All other Fuels | 8 (0.6%) | 0 (0.0%) |
| No Fuel Used | 1,111 (83.7%) | 578 (92.8%) |
| Total | 1,327 (100.0%) | 623 (100.0%) |
Household Vehicle Usage in Ceiba
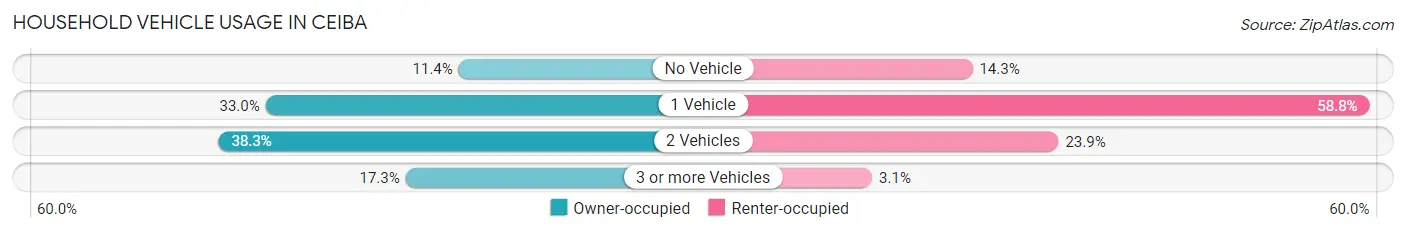
| Vehicles per Household | Owner-occupied | Renter-occupied |
| No Vehicle | 151 (11.4%) | 89 (14.3%) |
| 1 Vehicle | 438 (33.0%) | 366 (58.8%) |
| 2 Vehicles | 508 (38.3%) | 149 (23.9%) |
| 3 or more Vehicles | 230 (17.3%) | 19 (3.0%) |
| Total | 1,327 (100.0%) | 623 (100.0%) |
Real Estate & Mortgages in Ceiba
Real Estate and Mortgage Overview in Ceiba
| Characteristic | Without Mortgage | With Mortgage |
| Housing Units | 715 | 119 |
| Median Property Value | $107,400 | $123,600 |
| Median Household Income | $19,728 | $0 |
| Monthly Housing Costs | $171 | $0 |
| Real Estate Taxes | $744 | $119 |
Property Value by Mortgage Status in Ceiba
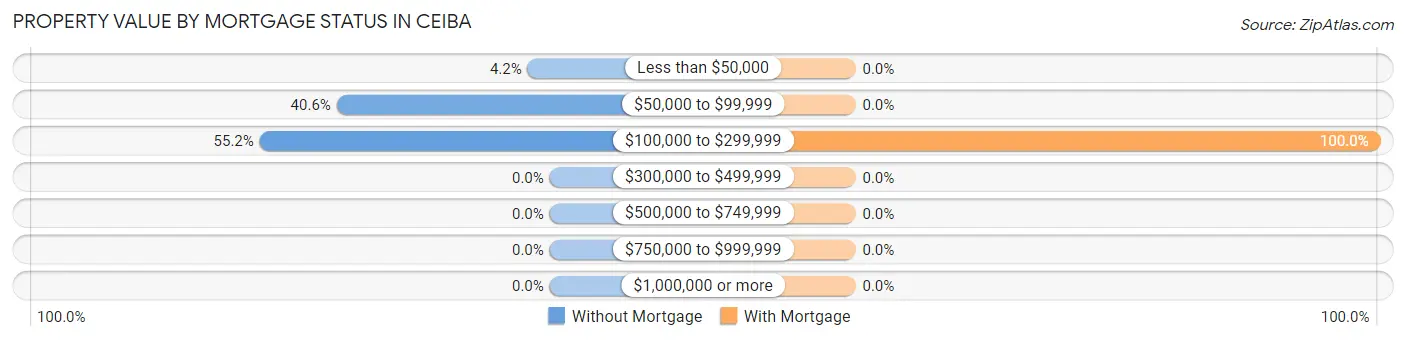
| Property Value | Without Mortgage | With Mortgage |
| Less than $50,000 | 30 (4.2%) | 0 (0.0%) |
| $50,000 to $99,999 | 290 (40.6%) | 0 (0.0%) |
| $100,000 to $299,999 | 395 (55.2%) | 119 (100.0%) |
| $300,000 to $499,999 | 0 (0.0%) | 0 (0.0%) |
| $500,000 to $749,999 | 0 (0.0%) | 0 (0.0%) |
| $750,000 to $999,999 | 0 (0.0%) | 0 (0.0%) |
| $1,000,000 or more | 0 (0.0%) | 0 (0.0%) |
| Total | 715 (100.0%) | 119 (100.0%) |
Household Income by Mortgage Status in Ceiba
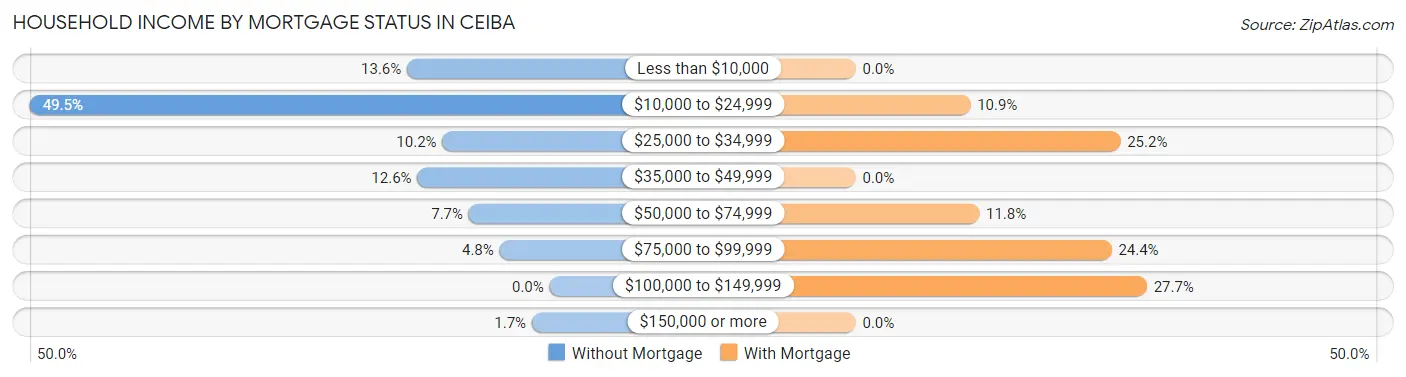
| Household Income | Without Mortgage | With Mortgage |
| Less than $10,000 | 97 (13.6%) | 0 (0.0%) |
| $10,000 to $24,999 | 354 (49.5%) | 13 (10.9%) |
| $25,000 to $34,999 | 73 (10.2%) | 30 (25.2%) |
| $35,000 to $49,999 | 90 (12.6%) | 0 (0.0%) |
| $50,000 to $74,999 | 55 (7.7%) | 14 (11.8%) |
| $75,000 to $99,999 | 34 (4.8%) | 29 (24.4%) |
| $100,000 to $149,999 | 0 (0.0%) | 33 (27.7%) |
| $150,000 or more | 12 (1.7%) | 0 (0.0%) |
| Total | 715 (100.0%) | 119 (100.0%) |
Property Value to Household Income Ratio in Ceiba
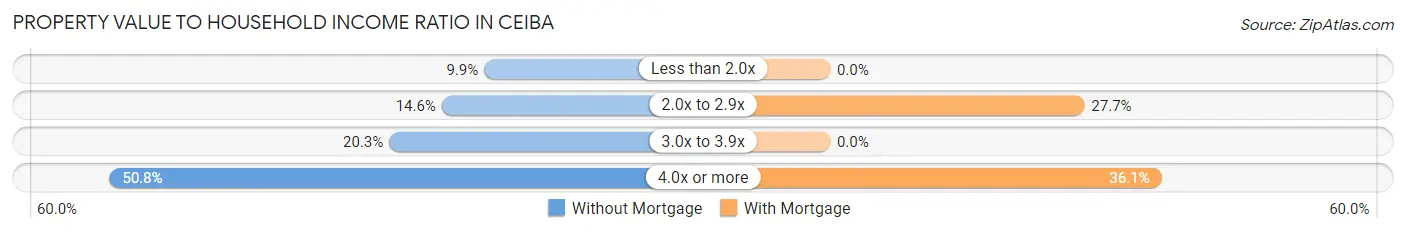
| Value-to-Income Ratio | Without Mortgage | With Mortgage |
| Less than 2.0x | 71 (9.9%) | 0 (0.0%) |
| 2.0x to 2.9x | 104 (14.5%) | 33 (27.7%) |
| 3.0x to 3.9x | 145 (20.3%) | 0 (0.0%) |
| 4.0x or more | 363 (50.8%) | 43 (36.1%) |
| Total | 715 (100.0%) | 119 (100.0%) |
Real Estate Taxes by Mortgage Status in Ceiba
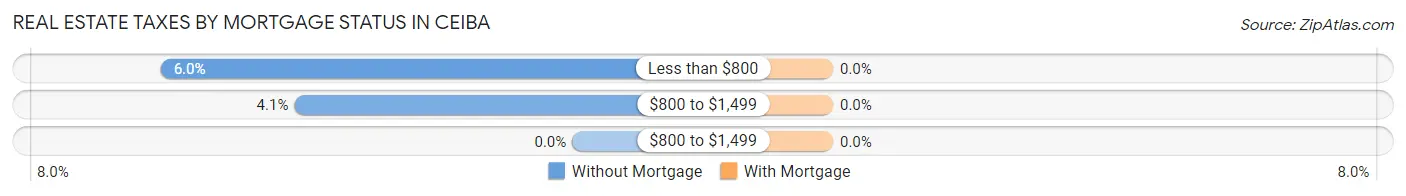
| Property Taxes | Without Mortgage | With Mortgage |
| Less than $800 | 43 (6.0%) | 0 (0.0%) |
| $800 to $1,499 | 29 (4.1%) | 0 (0.0%) |
| $800 to $1,499 | 0 (0.0%) | 0 (0.0%) |
| Total | 715 (100.0%) | 119 (100.0%) |
Health & Disability in Ceiba
Health Insurance Coverage by Age in Ceiba
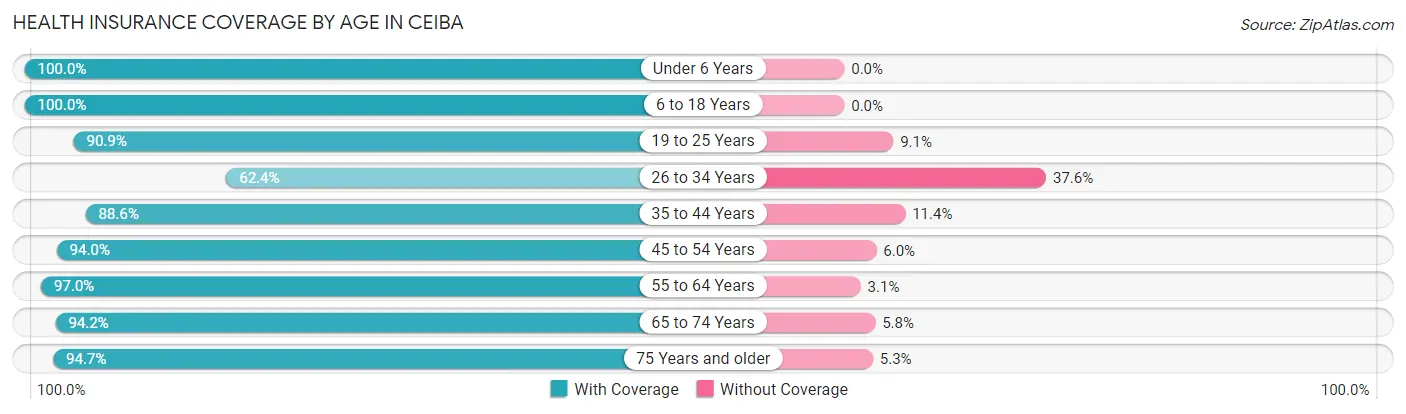
| Age Bracket | With Coverage | Without Coverage |
| Under 6 Years | 137 (100.0%) | 0 (0.0%) |
| 6 to 18 Years | 383 (100.0%) | 0 (0.0%) |
| 19 to 25 Years | 209 (90.9%) | 21 (9.1%) |
| 26 to 34 Years | 126 (62.4%) | 76 (37.6%) |
| 35 to 44 Years | 195 (88.6%) | 25 (11.4%) |
| 45 to 54 Years | 394 (94.0%) | 25 (6.0%) |
| 55 to 64 Years | 413 (97.0%) | 13 (3.0%) |
| 65 to 74 Years | 311 (94.2%) | 19 (5.8%) |
| 75 Years and older | 285 (94.7%) | 16 (5.3%) |
| Total | 2,453 (92.6%) | 195 (7.4%) |
Health Insurance Coverage by Citizenship Status in Ceiba
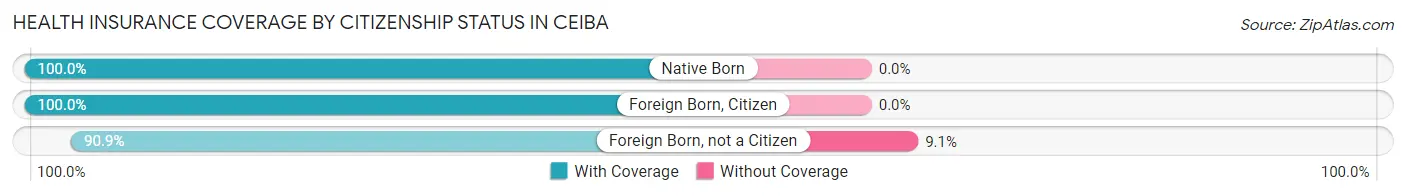
| Citizenship Status | With Coverage | Without Coverage |
| Native Born | 137 (100.0%) | 0 (0.0%) |
| Foreign Born, Citizen | 383 (100.0%) | 0 (0.0%) |
| Foreign Born, not a Citizen | 209 (90.9%) | 21 (9.1%) |
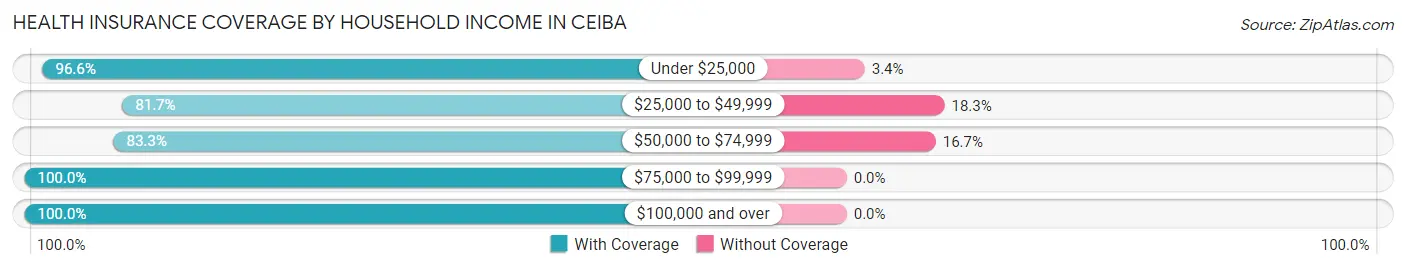
Health Insurance Coverage by Household Income in Ceiba
| Household Income | With Coverage | Without Coverage |
| Under $25,000 | 1,377 (96.6%) | 48 (3.4%) |
| $25,000 to $49,999 | 437 (81.7%) | 98 (18.3%) |
| $50,000 to $74,999 | 245 (83.3%) | 49 (16.7%) |
| $75,000 to $99,999 | 313 (100.0%) | 0 (0.0%) |
| $100,000 and over | 49 (100.0%) | 0 (0.0%) |
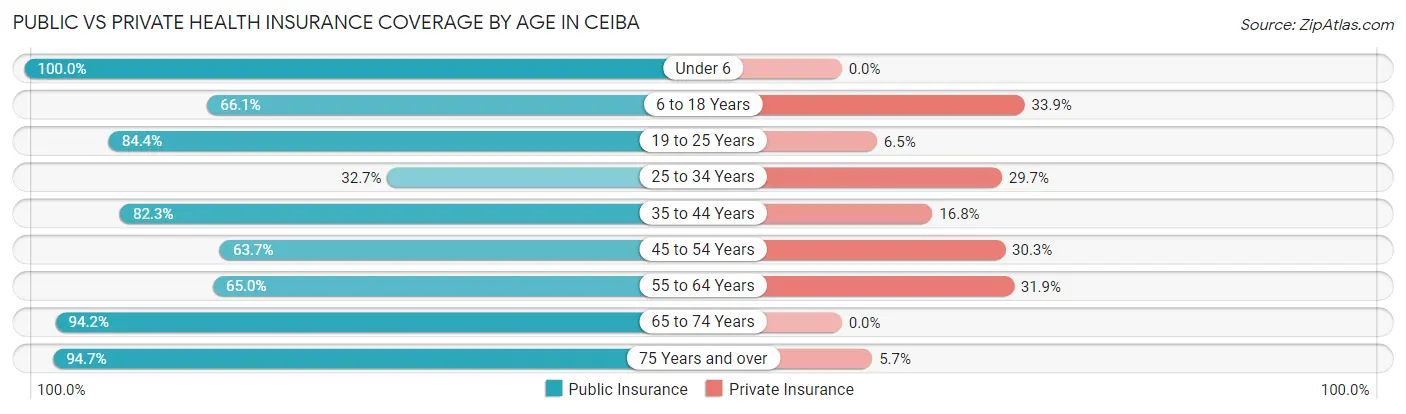
Public vs Private Health Insurance Coverage by Age in Ceiba
| Age Bracket | Public Insurance | Private Insurance |
| Under 6 | 137 (100.0%) | 0 (0.0%) |
| 6 to 18 Years | 253 (66.1%) | 130 (33.9%) |
| 19 to 25 Years | 194 (84.4%) | 15 (6.5%) |
| 25 to 34 Years | 66 (32.7%) | 60 (29.7%) |
| 35 to 44 Years | 181 (82.3%) | 37 (16.8%) |
| 45 to 54 Years | 267 (63.7%) | 127 (30.3%) |
| 55 to 64 Years | 277 (65.0%) | 136 (31.9%) |
| 65 to 74 Years | 311 (94.2%) | 0 (0.0%) |
| 75 Years and over | 285 (94.7%) | 17 (5.7%) |
| Total | 1,971 (74.4%) | 522 (19.7%) |
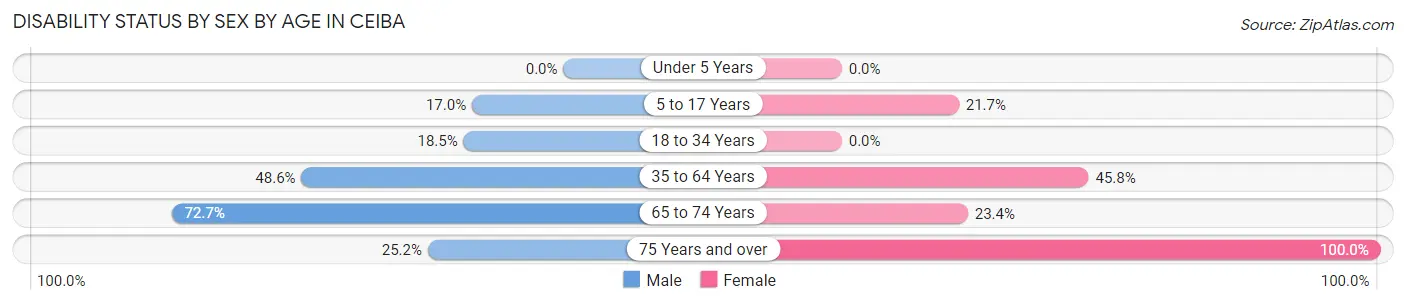
Disability Status by Sex by Age in Ceiba
| Age Bracket | Male | Female |
| Under 5 Years | 0 (0.0%) | 0 (0.0%) |
| 5 to 17 Years | 39 (17.0%) | 33 (21.7%) |
| 18 to 34 Years | 40 (18.5%) | 0 (0.0%) |
| 35 to 64 Years | 211 (48.6%) | 289 (45.8%) |
| 65 to 74 Years | 128 (72.7%) | 36 (23.4%) |
| 75 Years and over | 40 (25.2%) | 142 (100.0%) |
Disability Class by Sex by Age in Ceiba
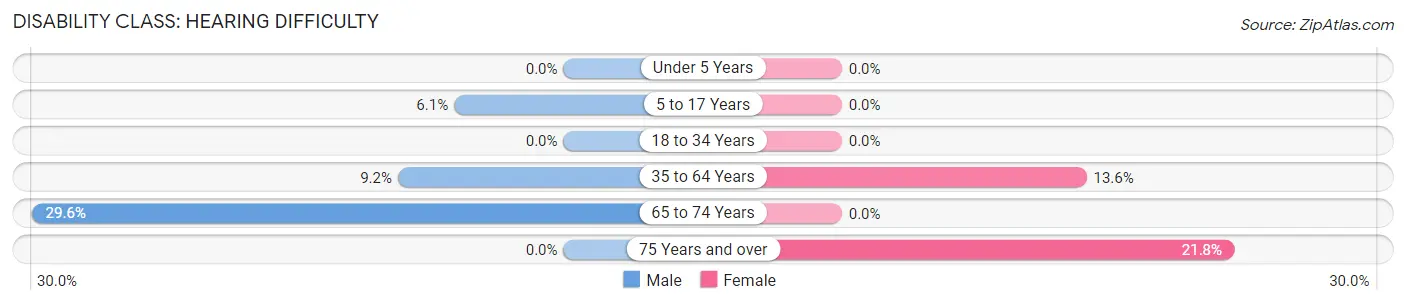
Disability Class: Hearing Difficulty
| Age Bracket | Male | Female |
| Under 5 Years | 0 (0.0%) | 0 (0.0%) |
| 5 to 17 Years | 14 (6.1%) | 0 (0.0%) |
| 18 to 34 Years | 0 (0.0%) | 0 (0.0%) |
| 35 to 64 Years | 40 (9.2%) | 86 (13.6%) |
| 65 to 74 Years | 52 (29.5%) | 0 (0.0%) |
| 75 Years and over | 0 (0.0%) | 31 (21.8%) |
Disability Class: Vision Difficulty
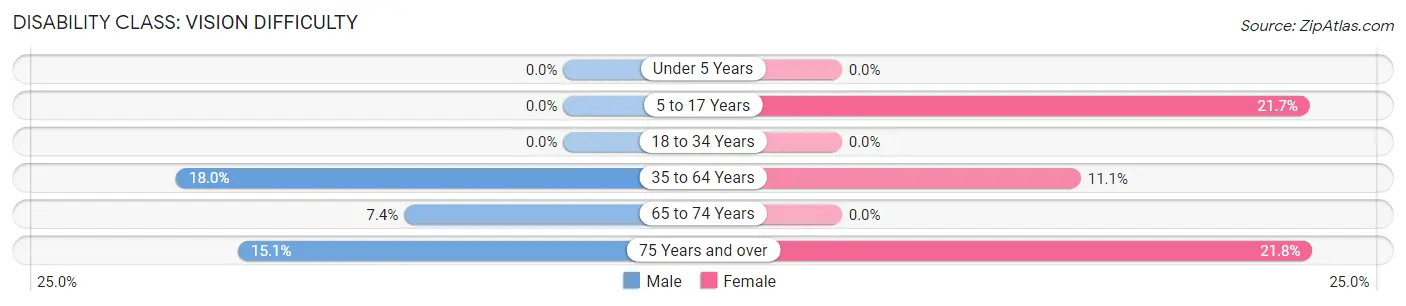
| Age Bracket | Male | Female |
| Under 5 Years | 0 (0.0%) | 0 (0.0%) |
| 5 to 17 Years | 0 (0.0%) | 33 (21.7%) |
| 18 to 34 Years | 0 (0.0%) | 0 (0.0%) |
| 35 to 64 Years | 78 (18.0%) | 70 (11.1%) |
| 65 to 74 Years | 13 (7.4%) | 0 (0.0%) |
| 75 Years and over | 24 (15.1%) | 31 (21.8%) |
Disability Class: Cognitive Difficulty
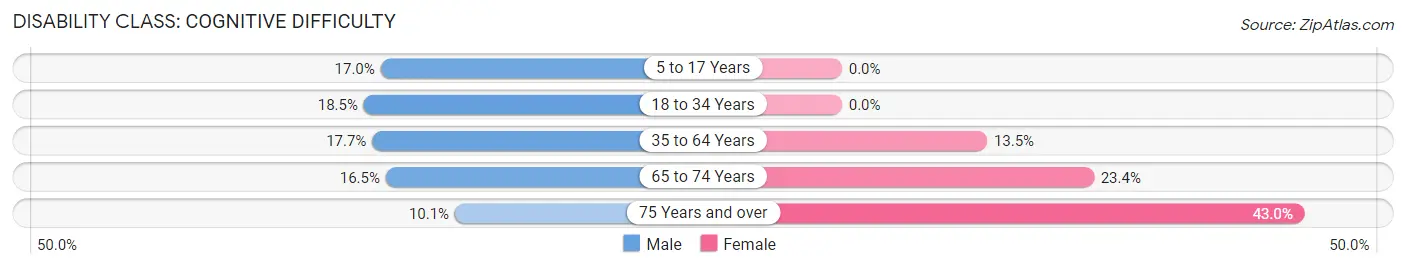
| Age Bracket | Male | Female |
| 5 to 17 Years | 39 (17.0%) | 0 (0.0%) |
| 18 to 34 Years | 40 (18.5%) | 0 (0.0%) |
| 35 to 64 Years | 77 (17.7%) | 85 (13.5%) |
| 65 to 74 Years | 29 (16.5%) | 36 (23.4%) |
| 75 Years and over | 16 (10.1%) | 61 (43.0%) |
Disability Class: Ambulatory Difficulty
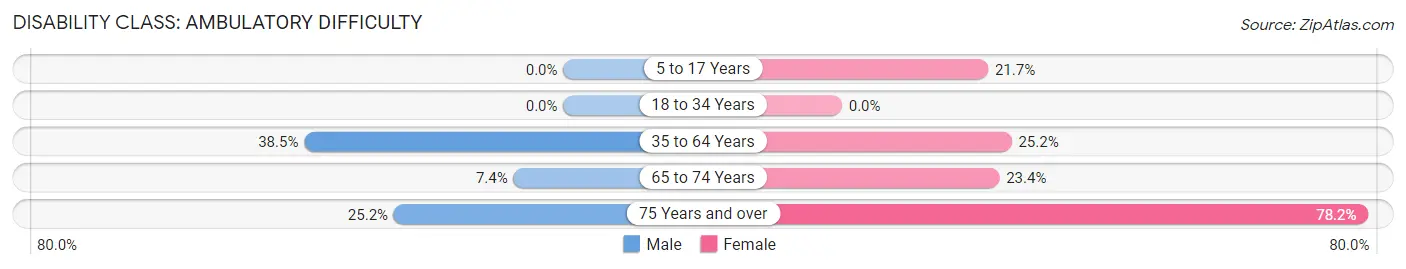
| Age Bracket | Male | Female |
| 5 to 17 Years | 0 (0.0%) | 33 (21.7%) |
| 18 to 34 Years | 0 (0.0%) | 0 (0.0%) |
| 35 to 64 Years | 167 (38.5%) | 159 (25.2%) |
| 65 to 74 Years | 13 (7.4%) | 36 (23.4%) |
| 75 Years and over | 40 (25.2%) | 111 (78.2%) |
Disability Class: Self-Care Difficulty
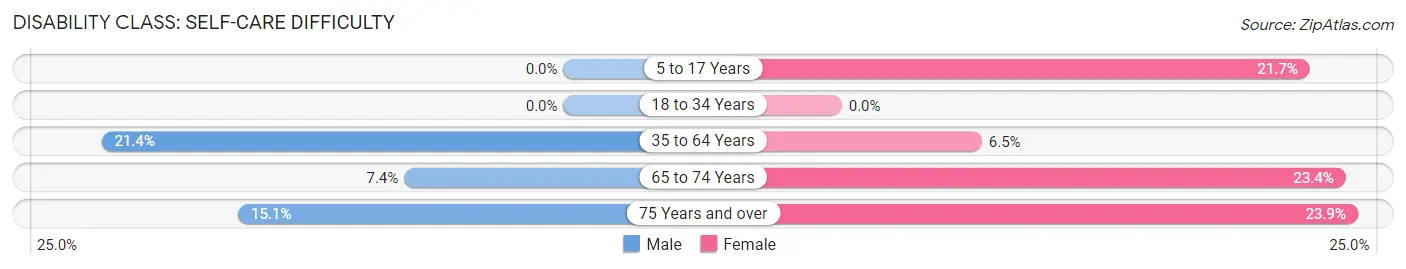
| Age Bracket | Male | Female |
| 5 to 17 Years | 0 (0.0%) | 33 (21.7%) |
| 18 to 34 Years | 0 (0.0%) | 0 (0.0%) |
| 35 to 64 Years | 93 (21.4%) | 41 (6.5%) |
| 65 to 74 Years | 13 (7.4%) | 36 (23.4%) |
| 75 Years and over | 24 (15.1%) | 34 (23.9%) |
Technology Access in Ceiba
Computing Device Access in Ceiba
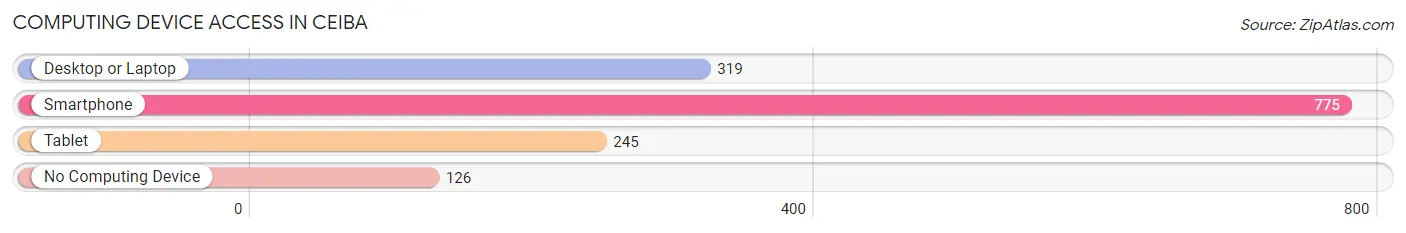
| Device Type | # Households | % Households |
| Desktop or Laptop | 319 | 35.4% |
| Smartphone | 775 | 86.0% |
| Tablet | 245 | 27.2% |
| No Computing Device | 126 | 14.0% |
| Total | 901 | 100.0% |
Internet Access in Ceiba
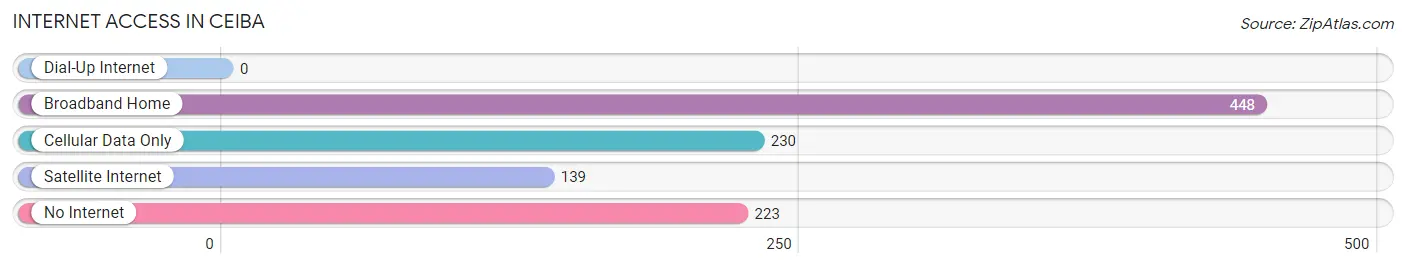
| Internet Type | # Households | % Households |
| Dial-Up Internet | 0 | 0.0% |
| Broadband Home | 448 | 49.7% |
| Cellular Data Only | 230 | 25.5% |
| Satellite Internet | 139 | 15.4% |
| No Internet | 223 | 24.7% |
| Total | 901 | 100.0% |
Ceiba Summary
Ceiba is a municipality located in the eastern region of Puerto Rico. It is part of the Fajardo Metropolitan Statistical Area. The municipality is located on the eastern coast of the island, bordered by the municipalities of Naguabo to the west, Las Piedras to the south, and Fajardo to the north. Ceiba is known as the “Gateway to the East” and is home to the Roosevelt Roads Naval Station, the largest naval base in the Caribbean.
History
The area that is now Ceiba was originally inhabited by the Taíno Indians. The Taíno were a peaceful people who lived in small villages and subsisted on fishing and farming. The area was later colonized by the Spanish in the 16th century. The town of Ceiba was founded in 1719 and was named after the ceiba tree, which is native to the area.
In the 19th century, Ceiba became an important port for the export of sugar and other agricultural products. The town was also a major center for the production of rum. During the Spanish-American War, the town was occupied by the United States Navy and the Roosevelt Roads Naval Station was established. The base was used as a training and supply center for the U.S. Navy during World War II.
Geography
Ceiba is located on the eastern coast of Puerto Rico, bordered by the municipalities of Naguabo to the west, Las Piedras to the south, and Fajardo to the north. The municipality covers an area of approximately 33 square miles and is home to a population of approximately 24,000 people.
The terrain of Ceiba is mostly flat with some hills and valleys. The municipality is located in a tropical climate with temperatures ranging from the mid-70s to the mid-80s. The area receives an average of 60 inches of rain per year.
Economy
The economy of Ceiba is largely based on tourism and the Roosevelt Roads Naval Station. The base is the largest naval base in the Caribbean and provides employment for many of the residents of Ceiba. The municipality is also home to several small businesses, including restaurants, hotels, and retail stores.
The municipality is also home to several agricultural operations, including sugar cane, coffee, and tobacco farms. Fishing is also an important part of the local economy, with the municipality’s ports providing access to the Atlantic Ocean.
Demographics
As of the 2010 census, the population of Ceiba was 24,072. The population is predominantly of Puerto Rican descent, with a small percentage of African and European descent. The median age of the population is 38.5 years.
The majority of the population is Roman Catholic, with a small percentage of other religious affiliations. The official language of Ceiba is Spanish, although English is also spoken. The median household income is $20,000.
Ceiba is a vibrant and diverse municipality with a rich history and culture. The municipality is home to a variety of attractions, including the Roosevelt Roads Naval Station, the El Yunque National Forest, and the Ceiba Marina. The municipality is also home to a variety of restaurants, hotels, and retail stores. Ceiba is an ideal destination for those looking to experience the beauty and culture of Puerto Rico.
Common Questions
What is Per Capita Income in Ceiba?
Per Capita income in Ceiba is $13,282.
What is the Median Family Income in Ceiba?
Median Family Income in Ceiba is $23,784.
What is the Median Household income in Ceiba?
Median Household Income in Ceiba is $22,118.
What is Income or Wage Gap in Ceiba?
Income or Wage Gap in Ceiba is 6.6%.
Women in Ceiba earn 93.4 cents for every dollar earned by a man.
What is Inequality or Gini Index in Ceiba?
Inequality or Gini Index in Ceiba is 0.53.
What is the Total Population of Ceiba?
Total Population of Ceiba is 2,652.
What is the Total Male Population of Ceiba?
Total Male Population of Ceiba is 1,309.
What is the Total Female Population of Ceiba?
Total Female Population of Ceiba is 1,343.
What is the Ratio of Males per 100 Females in Ceiba?
There are 97.47 Males per 100 Females in Ceiba.
What is the Ratio of Females per 100 Males in Ceiba?
There are 102.60 Females per 100 Males in Ceiba.
What is the Median Population Age in Ceiba?
Median Population Age in Ceiba is 48.5 Years.
What is the Average Family Size in Ceiba
Average Family Size in Ceiba is 3.4 People.
What is the Average Household Size in Ceiba
Average Household Size in Ceiba is 2.9 People.
How Large is the Labor Force in Ceiba?
There are 982 People in the Labor Forcein in Ceiba.
What is the Percentage of People in the Labor Force in Ceiba?
45.2% of People are in the Labor Force in Ceiba.
What is the Unemployment Rate in Ceiba?
Unemployment Rate in Ceiba is 28.8%.