Santa Clara, NM Map & Demographics
Santa Clara Map
Santa Clara Overview
$21,344
PER CAPITA INCOME
$62,500
AVG FAMILY INCOME
$46,078
AVG HOUSEHOLD INCOME
33.6%
WAGE / INCOME GAP [ % ]
66.4¢/ $1
WAGE / INCOME GAP [ $ ]
0.43
INEQUALITY / GINI INDEX
1,744
TOTAL POPULATION
757
MALE POPULATION
987
FEMALE POPULATION
76.70
MALES / 100 FEMALES
130.38
FEMALES / 100 MALES
44.9
MEDIAN AGE
3.5
AVG FAMILY SIZE
2.9
AVG HOUSEHOLD SIZE
550
LABOR FORCE [ PEOPLE ]
38.5%
PERCENT IN LABOR FORCE
5.6%
UNEMPLOYMENT RATE
Santa Clara Zip Codes
Santa Clara Area Codes
Income in Santa Clara
Income Overview in Santa Clara
Per Capita Income in Santa Clara is $21,344, while median incomes of families and households are $62,500 and $46,078 respectively.
| Characteristic | Number | Measure |
| Per Capita Income | 1,744 | $21,344 |
| Median Family Income | 348 | $62,500 |
| Mean Family Income | 348 | $69,467 |
| Median Household Income | 555 | $46,078 |
| Mean Household Income | 555 | $54,133 |
| Income Deficit | 348 | $0 |
| Wage / Income Gap (%) | 1,744 | 33.56% |
| Wage / Income Gap ($) | 1,744 | 66.44¢ per $1 |
| Gini / Inequality Index | 1,744 | 0.43 |
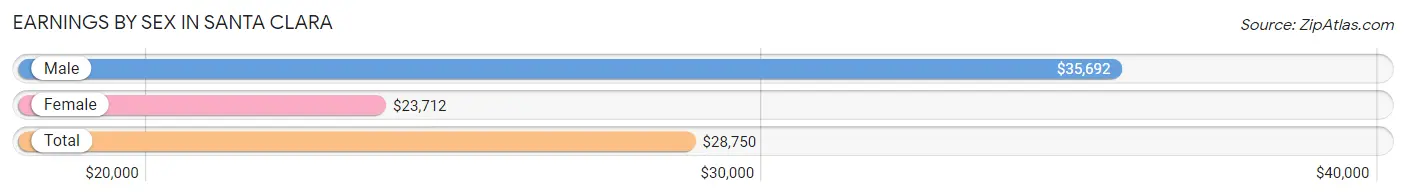
Earnings by Sex in Santa Clara
Average Earnings in Santa Clara are $28,750, $35,692 for men and $23,712 for women, a difference of 33.6%.
| Sex | Number | Average Earnings |
| Male | 287 (49.1%) | $35,692 |
| Female | 298 (50.9%) | $23,712 |
| Total | 585 (100.0%) | $28,750 |
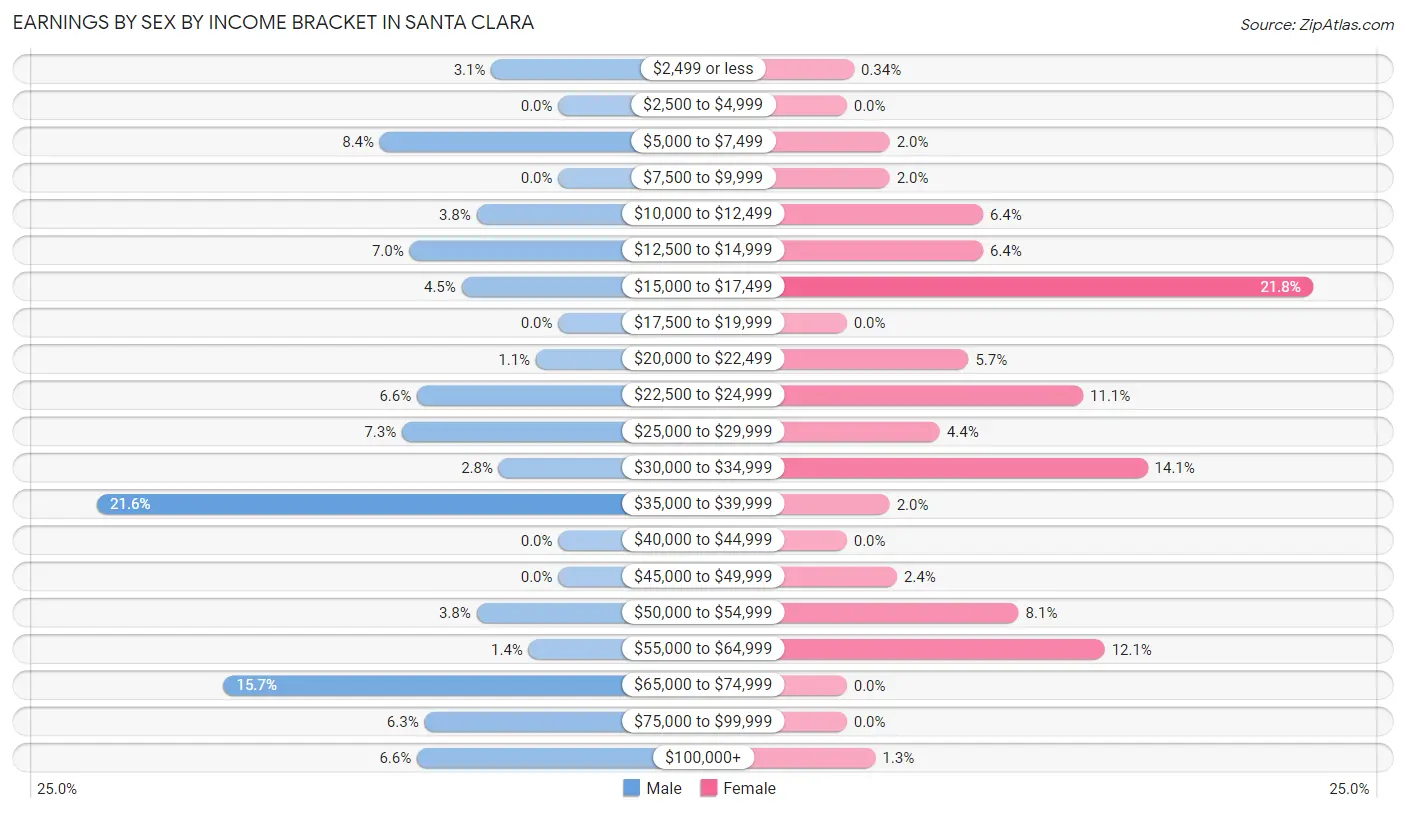
Earnings by Sex by Income Bracket in Santa Clara
The most common earnings brackets in Santa Clara are $35,000 to $39,999 for men (62 | 21.6%) and $15,000 to $17,499 for women (65 | 21.8%).
| Income | Male | Female |
| $2,499 or less | 9 (3.1%) | 1 (0.3%) |
| $2,500 to $4,999 | 0 (0.0%) | 0 (0.0%) |
| $5,000 to $7,499 | 24 (8.4%) | 6 (2.0%) |
| $7,500 to $9,999 | 0 (0.0%) | 6 (2.0%) |
| $10,000 to $12,499 | 11 (3.8%) | 19 (6.4%) |
| $12,500 to $14,999 | 20 (7.0%) | 19 (6.4%) |
| $15,000 to $17,499 | 13 (4.5%) | 65 (21.8%) |
| $17,500 to $19,999 | 0 (0.0%) | 0 (0.0%) |
| $20,000 to $22,499 | 3 (1.1%) | 17 (5.7%) |
| $22,500 to $24,999 | 19 (6.6%) | 33 (11.1%) |
| $25,000 to $29,999 | 21 (7.3%) | 13 (4.4%) |
| $30,000 to $34,999 | 8 (2.8%) | 42 (14.1%) |
| $35,000 to $39,999 | 62 (21.6%) | 6 (2.0%) |
| $40,000 to $44,999 | 0 (0.0%) | 0 (0.0%) |
| $45,000 to $49,999 | 0 (0.0%) | 7 (2.4%) |
| $50,000 to $54,999 | 11 (3.8%) | 24 (8.1%) |
| $55,000 to $64,999 | 4 (1.4%) | 36 (12.1%) |
| $65,000 to $74,999 | 45 (15.7%) | 0 (0.0%) |
| $75,000 to $99,999 | 18 (6.3%) | 0 (0.0%) |
| $100,000+ | 19 (6.6%) | 4 (1.3%) |
| Total | 287 (100.0%) | 298 (100.0%) |
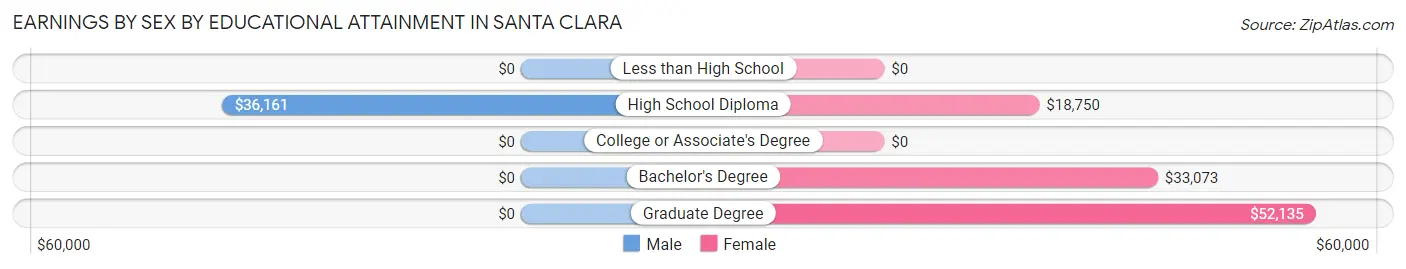
Earnings by Sex by Educational Attainment in Santa Clara
Average earnings in Santa Clara are $36,451 for men and $28,462 for women, a difference of 21.9%. Men with an educational attainment of high school diploma enjoy the highest average annual earnings of $36,161, while those with high school diploma education earn the least with $36,161. Women with an educational attainment of graduate degree earn the most with the average annual earnings of $52,135, while those with high school diploma education have the smallest earnings of $18,750.
| Educational Attainment | Male Income | Female Income |
| Less than High School | - | - |
| High School Diploma | $36,161 | $18,750 |
| College or Associate's Degree | - | - |
| Bachelor's Degree | - | - |
| Graduate Degree | - | - |
| Total | $36,451 | $28,462 |
Family Income in Santa Clara
Family Income Brackets in Santa Clara
According to the Santa Clara family income data, there are 136 families falling into the $50,000 to $74,999 income range, which is the most common income bracket and makes up 39.1% of all families.
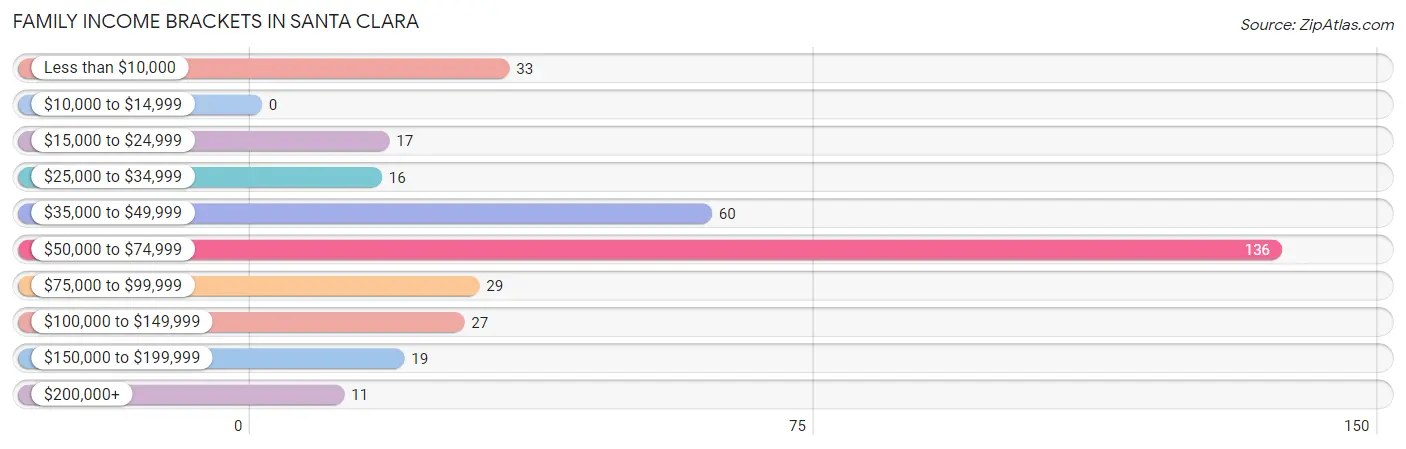
| Income Bracket | # Families | % Families |
| Less than $10,000 | 33 | 9.5% |
| $10,000 to $14,999 | 0 | 0.0% |
| $15,000 to $24,999 | 17 | 4.9% |
| $25,000 to $34,999 | 16 | 4.6% |
| $35,000 to $49,999 | 60 | 17.2% |
| $50,000 to $74,999 | 136 | 39.1% |
| $75,000 to $99,999 | 29 | 8.3% |
| $100,000 to $149,999 | 27 | 7.8% |
| $150,000 to $199,999 | 19 | 5.5% |
| $200,000+ | 11 | 3.2% |
Family Income by Famaliy Size in Santa Clara
3-person families (56 | 16.1%) account for the highest median family income in Santa Clara with $68,056 per family, while 2-person families (226 | 64.9%) have the highest median income of $31,428 per family member.
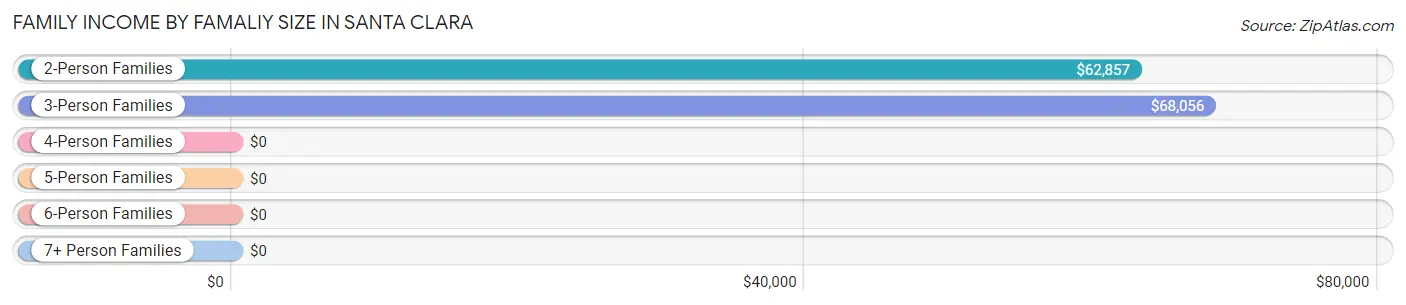
| Income Bracket | # Families | Median Income |
| 2-Person Families | 226 (64.9%) | $62,857 |
| 3-Person Families | 56 (16.1%) | $68,056 |
| 4-Person Families | 41 (11.8%) | $0 |
| 5-Person Families | 17 (4.9%) | $0 |
| 6-Person Families | 0 (0.0%) | $0 |
| 7+ Person Families | 8 (2.3%) | $0 |
| Total | 348 (100.0%) | $62,500 |
Family Income by Number of Earners in Santa Clara
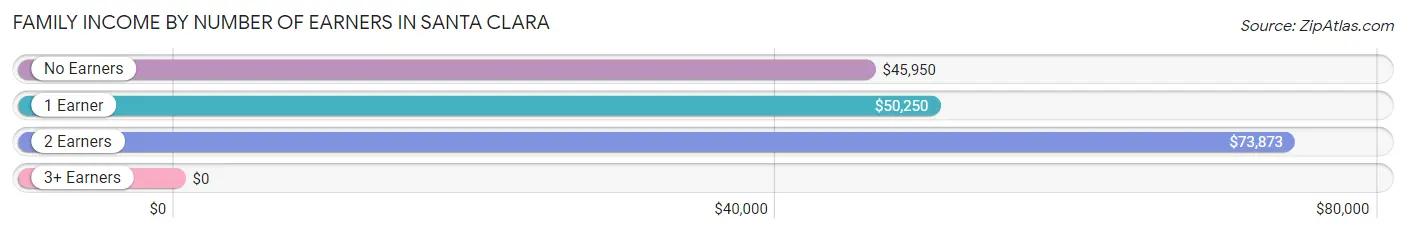
| Number of Earners | # Families | Median Income |
| No Earners | 101 (29.0%) | $45,950 |
| 1 Earner | 90 (25.9%) | $50,250 |
| 2 Earners | 130 (37.4%) | $73,873 |
| 3+ Earners | 27 (7.8%) | $0 |
| Total | 348 (100.0%) | $62,500 |
Household Income in Santa Clara
Household Income Brackets in Santa Clara
With 142 households falling in the category, the $50,000 to $74,999 income range is the most frequent in Santa Clara, accounting for 25.6% of all households. In contrast, only 11 households (2.0%) fall into the $200,000+ income bracket, making it the least populous group.
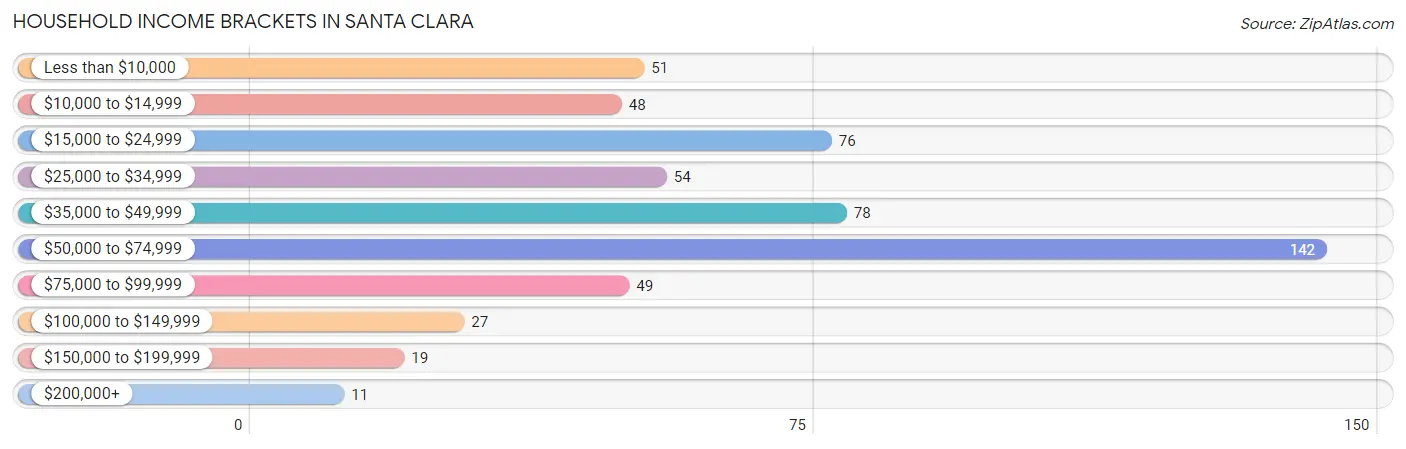
| Income Bracket | # Households | % Households |
| Less than $10,000 | 51 | 9.2% |
| $10,000 to $14,999 | 48 | 8.6% |
| $15,000 to $24,999 | 76 | 13.7% |
| $25,000 to $34,999 | 54 | 9.7% |
| $35,000 to $49,999 | 78 | 14.1% |
| $50,000 to $74,999 | 142 | 25.6% |
| $75,000 to $99,999 | 49 | 8.8% |
| $100,000 to $149,999 | 27 | 4.9% |
| $150,000 to $199,999 | 19 | 3.4% |
| $200,000+ | 11 | 2.0% |
Household Income by Householder Age in Santa Clara
The median household income in Santa Clara is $46,078, with the highest median household income of $56,563 found in the 45 to 64 years age bracket for the primary householder. A total of 192 households (34.6%) fall into this category. Meanwhile, the 15 to 24 years age bracket for the primary householder has the lowest median household income of $0, with 26 households (4.7%) in this group.
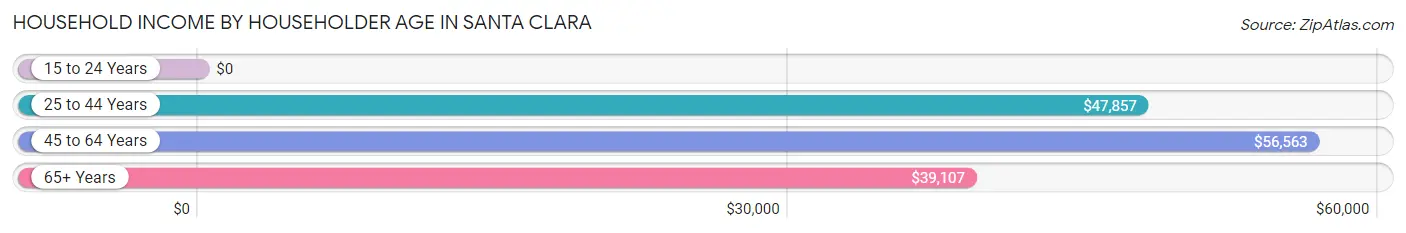
| Income Bracket | # Households | Median Income |
| 15 to 24 Years | 26 (4.7%) | $0 |
| 25 to 44 Years | 92 (16.6%) | $47,857 |
| 45 to 64 Years | 192 (34.6%) | $56,563 |
| 65+ Years | 245 (44.1%) | $39,107 |
| Total | 555 (100.0%) | $46,078 |
Poverty in Santa Clara
Income Below Poverty by Sex and Age in Santa Clara
With 22.9% poverty level for males and 35.0% for females among the residents of Santa Clara, under 5 year old males and under 5 year old females are the most vulnerable to poverty, with 78 males (100.0%) and 31 females (100.0%) in their respective age groups living below the poverty level.
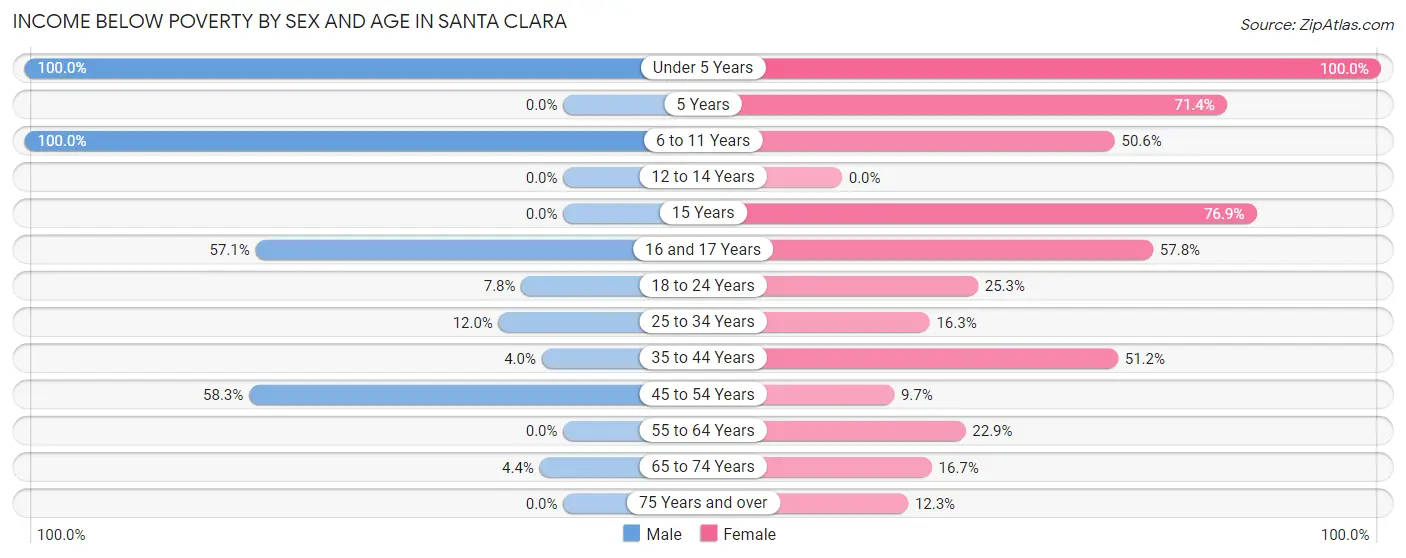
| Age Bracket | Male | Female |
| Under 5 Years | 78 (100.0%) | 31 (100.0%) |
| 5 Years | 0 (0.0%) | 25 (71.4%) |
| 6 to 11 Years | 25 (100.0%) | 41 (50.6%) |
| 12 to 14 Years | 0 (0.0%) | 0 (0.0%) |
| 15 Years | 0 (0.0%) | 10 (76.9%) |
| 16 and 17 Years | 4 (57.1%) | 41 (57.8%) |
| 18 to 24 Years | 6 (7.8%) | 25 (25.3%) |
| 25 to 34 Years | 3 (12.0%) | 7 (16.3%) |
| 35 to 44 Years | 3 (4.0%) | 83 (51.2%) |
| 45 to 54 Years | 35 (58.3%) | 6 (9.7%) |
| 55 to 64 Years | 0 (0.0%) | 25 (22.9%) |
| 65 to 74 Years | 5 (4.4%) | 12 (16.7%) |
| 75 Years and over | 0 (0.0%) | 14 (12.3%) |
| Total | 159 (22.9%) | 320 (35.0%) |
Income Above Poverty by Sex and Age in Santa Clara
According to the poverty statistics in Santa Clara, males aged 5 years and females aged 12 to 14 years are the age groups that are most secure financially, with 100.0% of males and 100.0% of females in these age groups living above the poverty line.
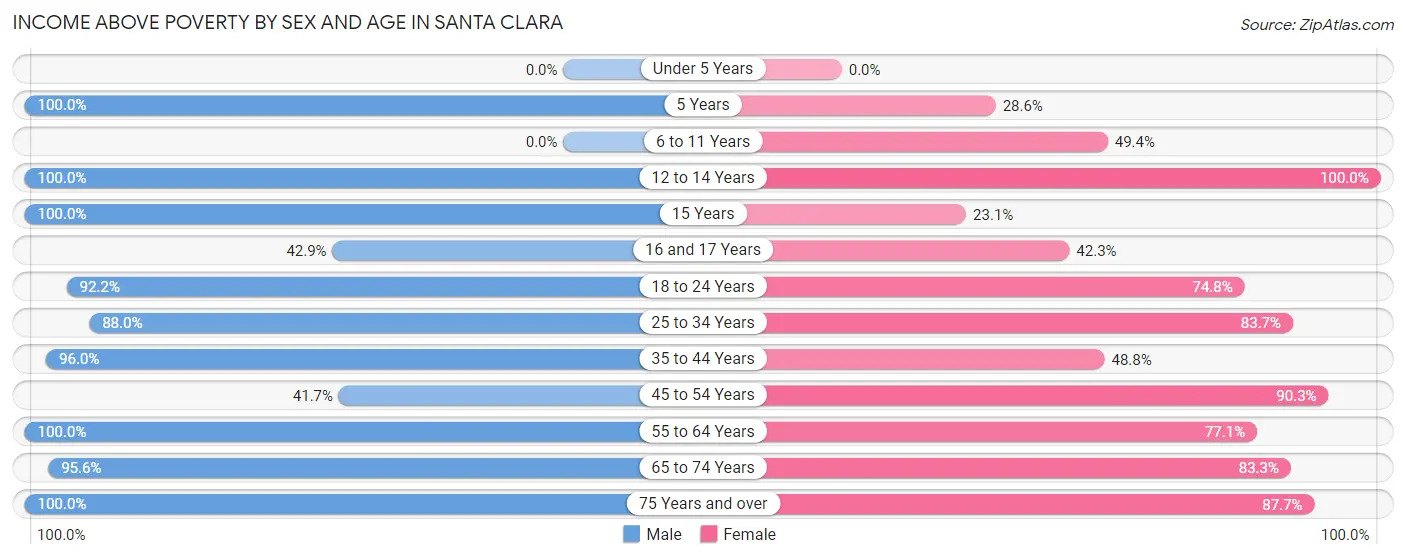
| Age Bracket | Male | Female |
| Under 5 Years | 0 (0.0%) | 0 (0.0%) |
| 5 Years | 17 (100.0%) | 10 (28.6%) |
| 6 to 11 Years | 0 (0.0%) | 40 (49.4%) |
| 12 to 14 Years | 6 (100.0%) | 23 (100.0%) |
| 15 Years | 6 (100.0%) | 3 (23.1%) |
| 16 and 17 Years | 3 (42.9%) | 30 (42.2%) |
| 18 to 24 Years | 71 (92.2%) | 74 (74.8%) |
| 25 to 34 Years | 22 (88.0%) | 36 (83.7%) |
| 35 to 44 Years | 72 (96.0%) | 79 (48.8%) |
| 45 to 54 Years | 25 (41.7%) | 56 (90.3%) |
| 55 to 64 Years | 138 (100.0%) | 84 (77.1%) |
| 65 to 74 Years | 109 (95.6%) | 60 (83.3%) |
| 75 Years and over | 67 (100.0%) | 100 (87.7%) |
| Total | 536 (77.1%) | 595 (65.0%) |
Income Below Poverty Among Married-Couple Families in Santa Clara
The poverty statistics for married-couple families in Santa Clara show that 4.5% or 8 of the total 176 families live below the poverty line. Families with 5 or more children have the highest poverty rate of 100.0%, comprising of 8 families. On the other hand, families with no children have the lowest poverty rate of 0.0%, which includes 0 families.
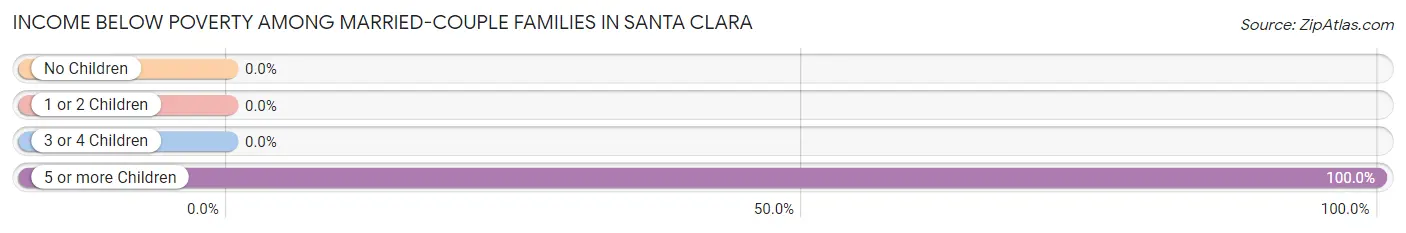
| Children | Above Poverty | Below Poverty |
| No Children | 121 (100.0%) | 0 (0.0%) |
| 1 or 2 Children | 47 (100.0%) | 0 (0.0%) |
| 3 or 4 Children | 0 (0.0%) | 0 (0.0%) |
| 5 or more Children | 0 (0.0%) | 8 (100.0%) |
| Total | 168 (95.5%) | 8 (4.5%) |
Income Below Poverty Among Single-Parent Households in Santa Clara
According to the poverty data in Santa Clara, 15.5% or 11 single-father households and 31.7% or 32 single-mother households are living below the poverty line. Among single-father households, those with 1 or 2 children have the highest poverty rate, with 8 households (100.0%) experiencing poverty. Likewise, among single-mother households, those with 3 or 4 children have the highest poverty rate, with 8 households (100.0%) falling below the poverty line.
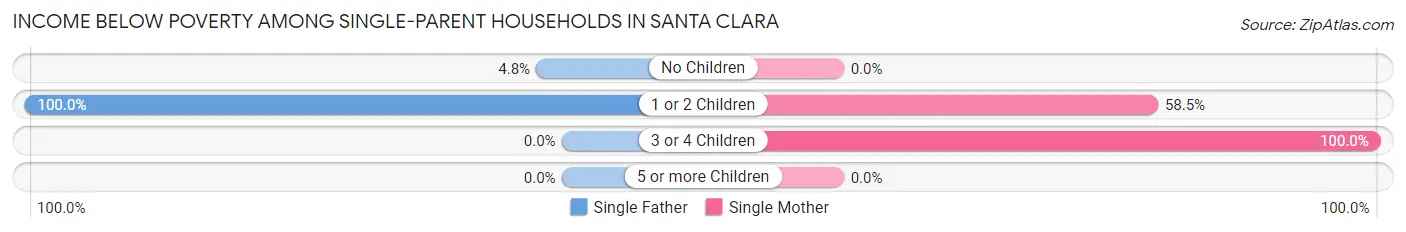
| Children | Single Father | Single Mother |
| No Children | 3 (4.8%) | 0 (0.0%) |
| 1 or 2 Children | 8 (100.0%) | 24 (58.5%) |
| 3 or 4 Children | 0 (0.0%) | 8 (100.0%) |
| 5 or more Children | 0 (0.0%) | 0 (0.0%) |
| Total | 11 (15.5%) | 32 (31.7%) |
Income Below Poverty Among Married-Couple vs Single-Parent Households in Santa Clara
The poverty data for Santa Clara shows that 8 of the married-couple family households (4.5%) and 43 of the single-parent households (25.0%) are living below the poverty level. Within the married-couple family households, those with 5 or more children have the highest poverty rate, with 8 households (100.0%) falling below the poverty line. Among the single-parent households, those with 3 or 4 children have the highest poverty rate, with 8 household (100.0%) living below poverty.
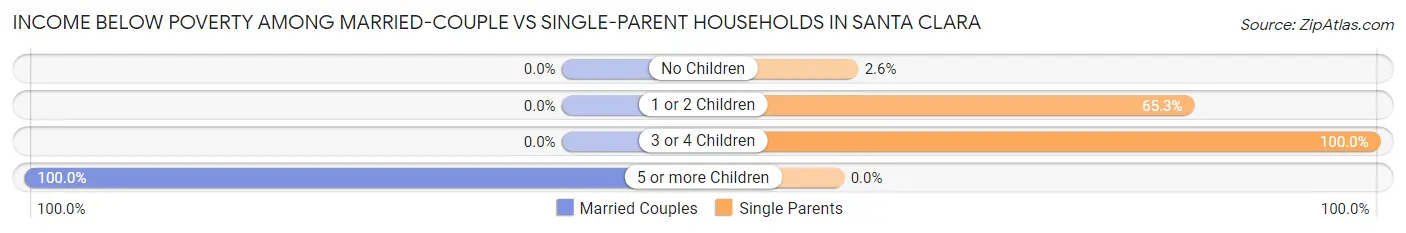
| Children | Married-Couple Families | Single-Parent Households |
| No Children | 0 (0.0%) | 3 (2.6%) |
| 1 or 2 Children | 0 (0.0%) | 32 (65.3%) |
| 3 or 4 Children | 0 (0.0%) | 8 (100.0%) |
| 5 or more Children | 8 (100.0%) | 0 (0.0%) |
| Total | 8 (4.5%) | 43 (25.0%) |
Race in Santa Clara
The most populous races in Santa Clara are Hispanic or Latino (1,369 | 78.5%), White / Caucasian (1,122 | 64.3%), and Two or more Races (616 | 35.3%).
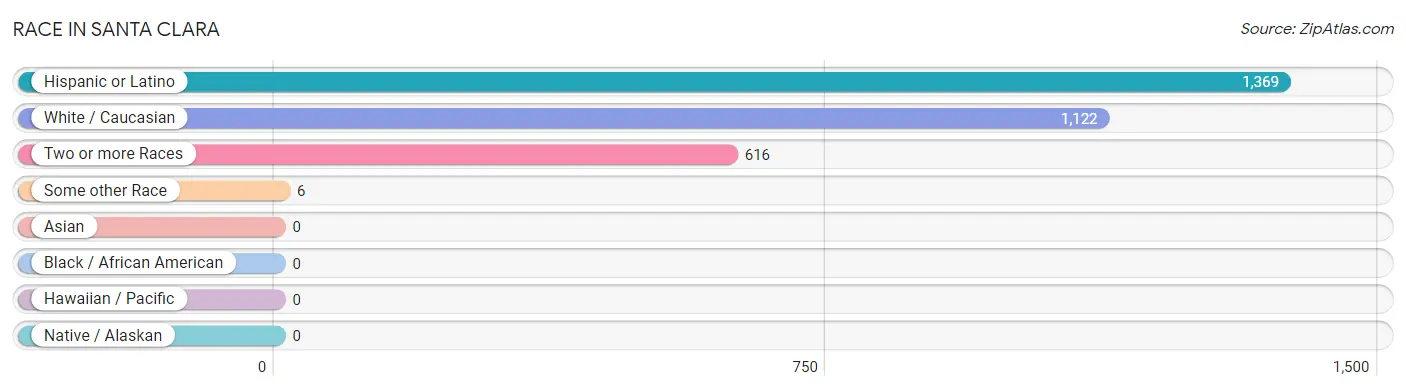
| Race | # Population | % Population |
| Asian | 0 | 0.0% |
| Black / African American | 0 | 0.0% |
| Hawaiian / Pacific | 0 | 0.0% |
| Hispanic or Latino | 1,369 | 78.5% |
| Native / Alaskan | 0 | 0.0% |
| White / Caucasian | 1,122 | 64.3% |
| Two or more Races | 616 | 35.3% |
| Some other Race | 6 | 0.3% |
| Total | 1,744 | 100.0% |
Ancestry in Santa Clara
The most populous ancestries reported in Santa Clara are Mexican (1,339 | 76.8%), English (58 | 3.3%), Irish (46 | 2.6%), American (40 | 2.3%), and European (27 | 1.5%), together accounting for 86.6% of all Santa Clara residents.
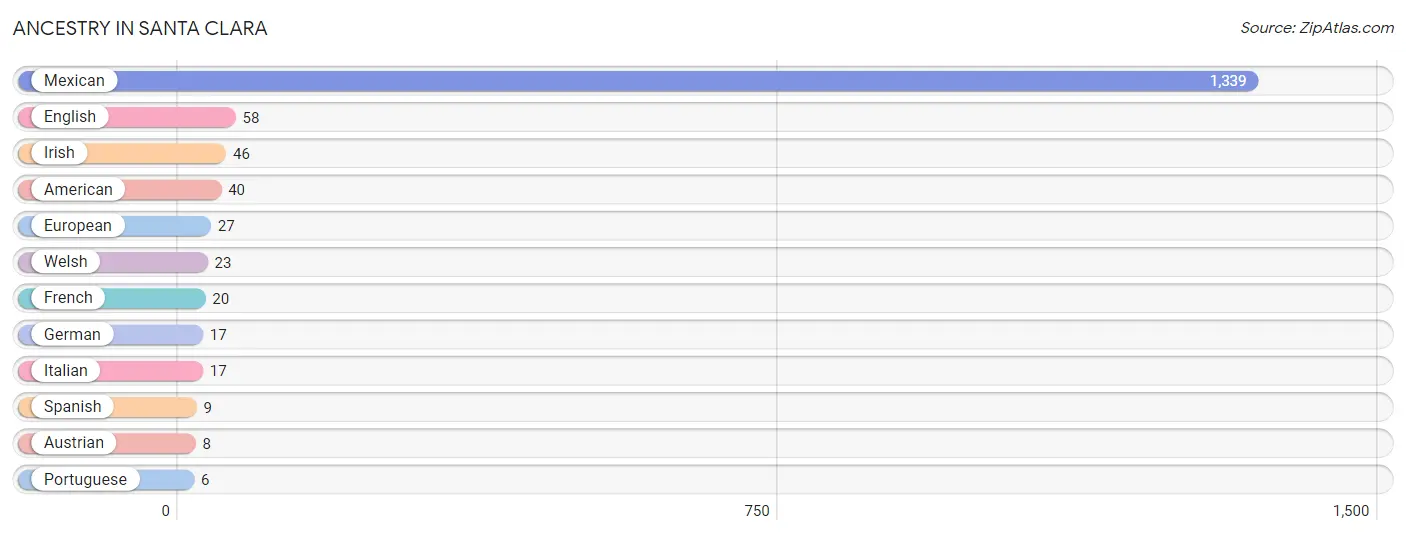
| Ancestry | # Population | % Population |
| American | 40 | 2.3% |
| Austrian | 8 | 0.5% |
| English | 58 | 3.3% |
| European | 27 | 1.5% |
| French | 20 | 1.1% |
| German | 17 | 1.0% |
| Irish | 46 | 2.6% |
| Italian | 17 | 1.0% |
| Mexican | 1,339 | 76.8% |
| Portuguese | 6 | 0.3% |
| Spanish | 9 | 0.5% |
| Welsh | 23 | 1.3% | View All 12 Rows |
Immigrants in Santa Clara
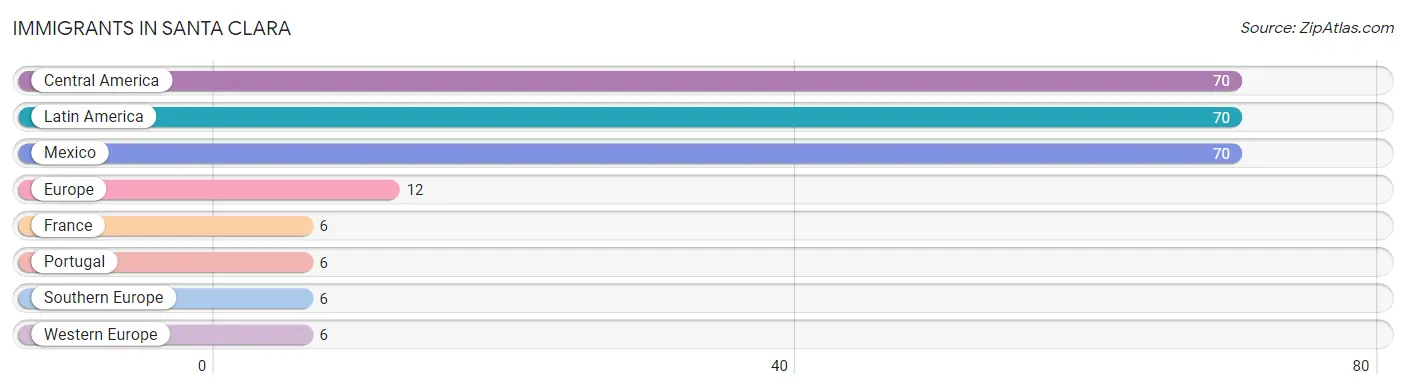
The most numerous immigrant groups reported in Santa Clara came from Central America (70 | 4.0%), Latin America (70 | 4.0%), Mexico (70 | 4.0%), Europe (12 | 0.7%), and France (6 | 0.3%), together accounting for 13.1% of all Santa Clara residents.
| Immigration Origin | # Population | % Population |
| Central America | 70 | 4.0% |
| Europe | 12 | 0.7% |
| France | 6 | 0.3% |
| Latin America | 70 | 4.0% |
| Mexico | 70 | 4.0% |
| Portugal | 6 | 0.3% |
| Southern Europe | 6 | 0.3% |
| Western Europe | 6 | 0.3% | View All 8 Rows |
Sex and Age in Santa Clara
Sex and Age in Santa Clara
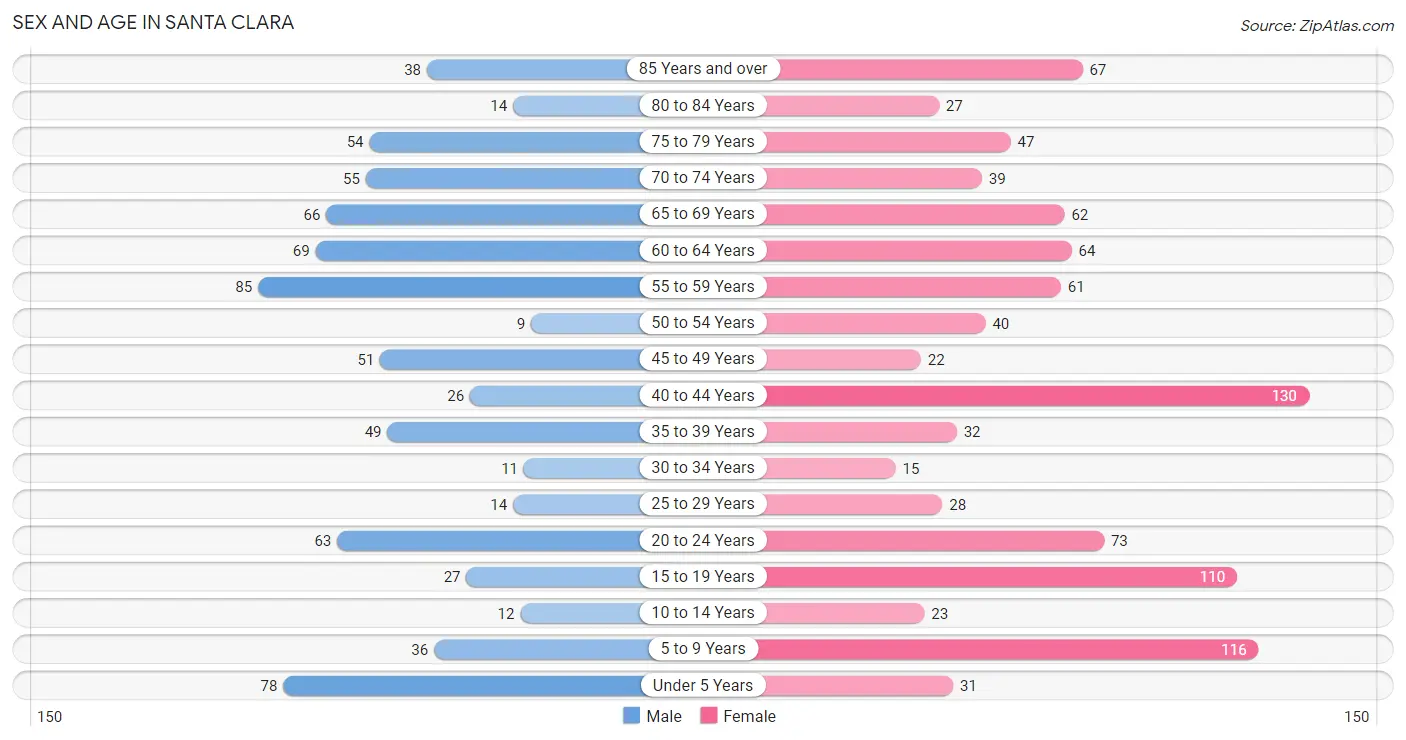
The most populous age groups in Santa Clara are 55 to 59 Years (85 | 11.2%) for men and 40 to 44 Years (130 | 13.2%) for women.
| Age Bracket | Male | Female |
| Under 5 Years | 78 (10.3%) | 31 (3.1%) |
| 5 to 9 Years | 36 (4.8%) | 116 (11.7%) |
| 10 to 14 Years | 12 (1.6%) | 23 (2.3%) |
| 15 to 19 Years | 27 (3.6%) | 110 (11.1%) |
| 20 to 24 Years | 63 (8.3%) | 73 (7.4%) |
| 25 to 29 Years | 14 (1.8%) | 28 (2.8%) |
| 30 to 34 Years | 11 (1.5%) | 15 (1.5%) |
| 35 to 39 Years | 49 (6.5%) | 32 (3.2%) |
| 40 to 44 Years | 26 (3.4%) | 130 (13.2%) |
| 45 to 49 Years | 51 (6.7%) | 22 (2.2%) |
| 50 to 54 Years | 9 (1.2%) | 40 (4.1%) |
| 55 to 59 Years | 85 (11.2%) | 61 (6.2%) |
| 60 to 64 Years | 69 (9.1%) | 64 (6.5%) |
| 65 to 69 Years | 66 (8.7%) | 62 (6.3%) |
| 70 to 74 Years | 55 (7.3%) | 39 (4.0%) |
| 75 to 79 Years | 54 (7.1%) | 47 (4.8%) |
| 80 to 84 Years | 14 (1.8%) | 27 (2.7%) |
| 85 Years and over | 38 (5.0%) | 67 (6.8%) |
| Total | 757 (100.0%) | 987 (100.0%) |
Families and Households in Santa Clara
Median Family Size in Santa Clara
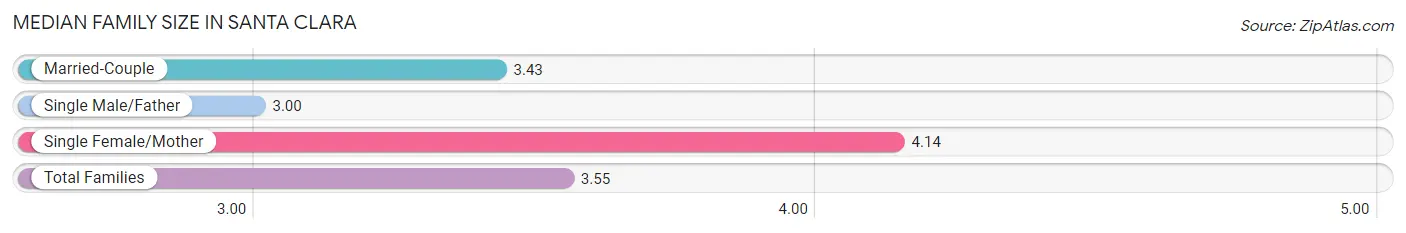
The median family size in Santa Clara is 3.55 persons per family, with single female/mother families (101 | 29.0%) accounting for the largest median family size of 4.14 persons per family. On the other hand, single male/father families (71 | 20.4%) represent the smallest median family size with 3.00 persons per family.
| Family Type | # Families | Family Size |
| Married-Couple | 176 (50.6%) | 3.43 |
| Single Male/Father | 71 (20.4%) | 3.00 |
| Single Female/Mother | 101 (29.0%) | 4.14 |
| Total Families | 348 (100.0%) | 3.55 |
Median Household Size in Santa Clara
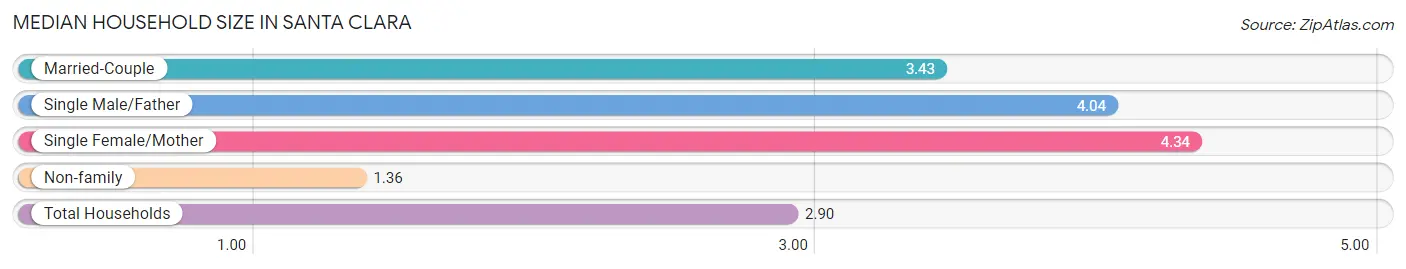
The median household size in Santa Clara is 2.90 persons per household, with single female/mother households (101 | 18.2%) accounting for the largest median household size of 4.34 persons per household. non-family households (207 | 37.3%) represent the smallest median household size with 1.36 persons per household.
| Household Type | # Households | Household Size |
| Married-Couple | 176 (31.7%) | 3.43 |
| Single Male/Father | 71 (12.8%) | 4.04 |
| Single Female/Mother | 101 (18.2%) | 4.34 |
| Non-family | 207 (37.3%) | 1.36 |
| Total Households | 555 (100.0%) | 2.90 |
Household Size by Marriage Status in Santa Clara
Out of a total of 555 households in Santa Clara, 348 (62.7%) are family households, while 207 (37.3%) are nonfamily households. The most numerous type of family households are 2-person households, comprising 204, and the most common type of nonfamily households are 1-person households, comprising 192.
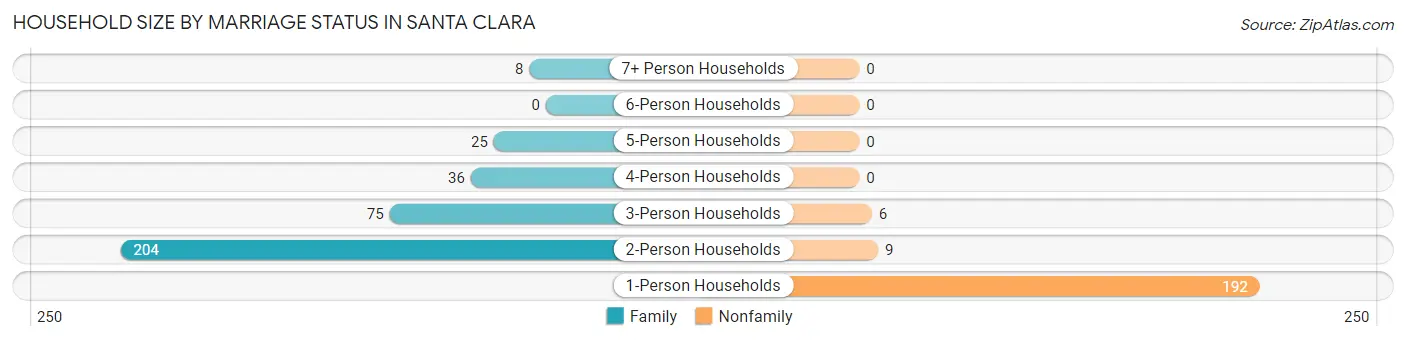
| Household Size | Family Households | Nonfamily Households |
| 1-Person Households | - | 192 (34.6%) |
| 2-Person Households | 204 (36.8%) | 9 (1.6%) |
| 3-Person Households | 75 (13.5%) | 6 (1.1%) |
| 4-Person Households | 36 (6.5%) | 0 (0.0%) |
| 5-Person Households | 25 (4.5%) | 0 (0.0%) |
| 6-Person Households | 0 (0.0%) | 0 (0.0%) |
| 7+ Person Households | 8 (1.4%) | 0 (0.0%) |
| Total | 348 (62.7%) | 207 (37.3%) |
Female Fertility in Santa Clara
Fertility by Age in Santa Clara
Average fertility rate in Santa Clara is 18.0 births per 1,000 women. Women in the age bracket of 20 to 34 years have the highest fertility rate with 69.0 births per 1,000 women. Women in the age bracket of 20 to 34 years acount for 100.0% of all women with births.
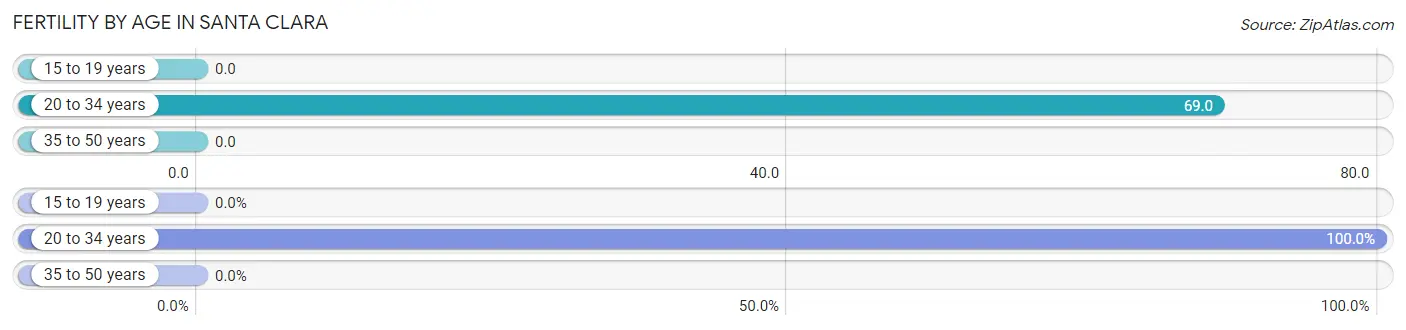
| Age Bracket | Women with Births | Births / 1,000 Women |
| 15 to 19 years | 0 (0.0%) | 0.0 |
| 20 to 34 years | 8 (100.0%) | 69.0 |
| 35 to 50 years | 0 (0.0%) | 0.0 |
| Total | 8 (100.0%) | 18.0 |
Fertility by Age by Marriage Status in Santa Clara
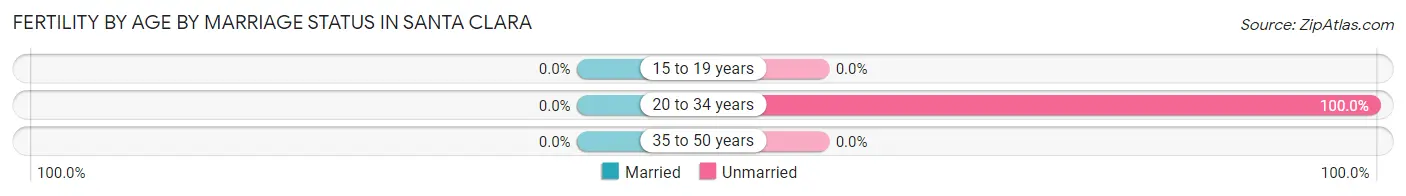
| Age Bracket | Married | Unmarried |
| 15 to 19 years | 0 (0.0%) | 0 (0.0%) |
| 20 to 34 years | 0 (0.0%) | 8 (100.0%) |
| 35 to 50 years | 0 (0.0%) | 0 (0.0%) |
| Total | 0 (0.0%) | 8 (100.0%) |
Fertility by Education in Santa Clara
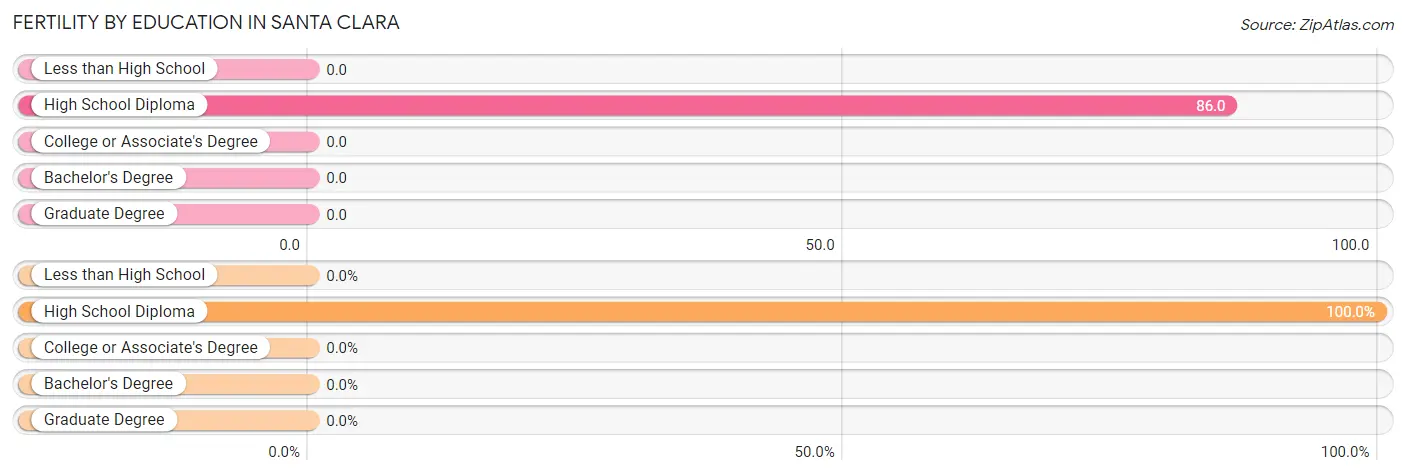
| Educational Attainment | Women with Births | Births / 1,000 Women |
| Less than High School | 0 (0.0%) | 0.0 |
| High School Diploma | 8 (100.0%) | 86.0 |
| College or Associate's Degree | 0 (0.0%) | 0.0 |
| Bachelor's Degree | 0 (0.0%) | 0.0 |
| Graduate Degree | 0 (0.0%) | 0.0 |
| Total | 8 (100.0%) | 18.0 |
Fertility by Education by Marriage Status in Santa Clara
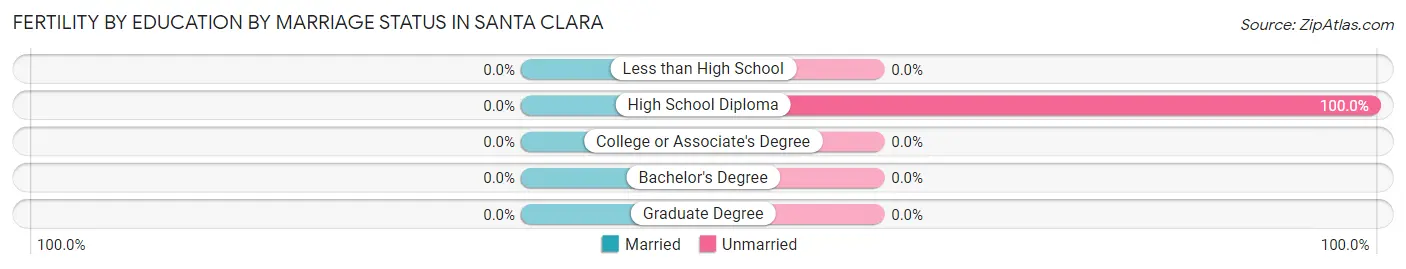
| Educational Attainment | Married | Unmarried |
| Less than High School | 0 (0.0%) | 0 (0.0%) |
| High School Diploma | 0 (0.0%) | 8 (100.0%) |
| College or Associate's Degree | 0 (0.0%) | 0 (0.0%) |
| Bachelor's Degree | 0 (0.0%) | 0 (0.0%) |
| Graduate Degree | 0 (0.0%) | 0 (0.0%) |
| Total | 0 (0.0%) | 8 (100.0%) |
Employment Characteristics in Santa Clara
Employment by Class of Employer in Santa Clara
Among the 519 employed individuals in Santa Clara, private company employees (368 | 70.9%), state government employees (83 | 16.0%), and self-employed (not incorporated) (58 | 11.2%) make up the most common classes of employment.
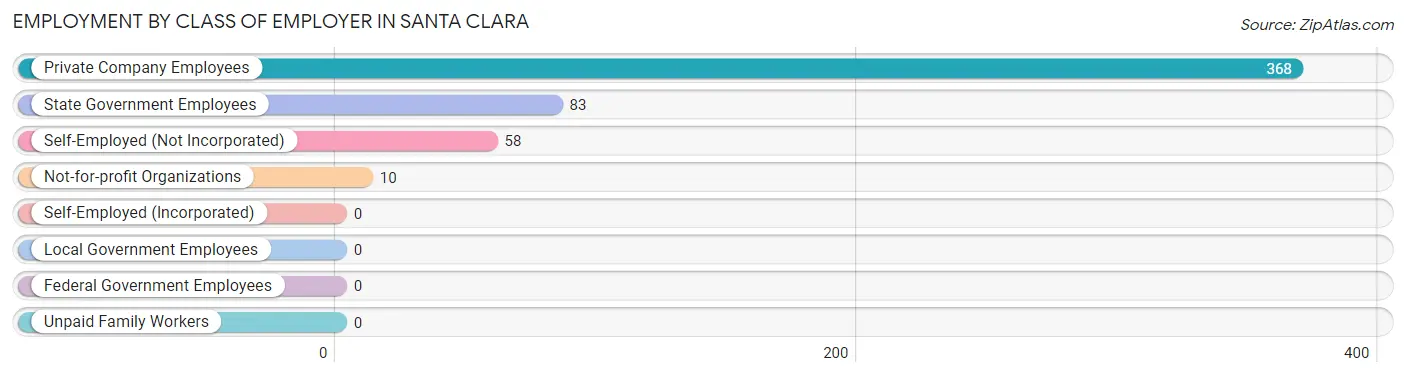
| Employer Class | # Employees | % Employees |
| Private Company Employees | 368 | 70.9% |
| Self-Employed (Incorporated) | 0 | 0.0% |
| Self-Employed (Not Incorporated) | 58 | 11.2% |
| Not-for-profit Organizations | 10 | 1.9% |
| Local Government Employees | 0 | 0.0% |
| State Government Employees | 83 | 16.0% |
| Federal Government Employees | 0 | 0.0% |
| Unpaid Family Workers | 0 | 0.0% |
| Total | 519 | 100.0% |
Employment Status by Age in Santa Clara
According to the labor force statistics for Santa Clara, out of the total population over 16 years of age (1,429), 38.5% or 550 individuals are in the labor force, with 5.6% or 31 of them unemployed. The age group with the highest labor force participation rate is 30 to 34 years, with 100.0% or 26 individuals in the labor force. Within the labor force, the 20 to 24 years age range has the highest percentage of unemployed individuals, with 17.6% or 15 of them being unemployed.
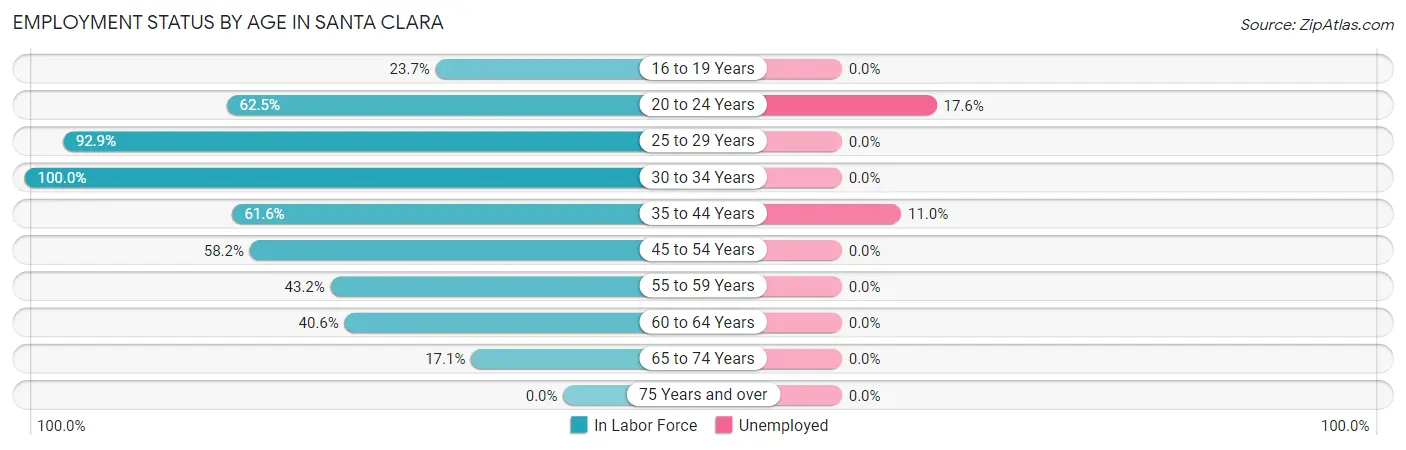
| Age Bracket | In Labor Force | Unemployed |
| 16 to 19 Years | 28 (23.7%) | 0 (0.0%) |
| 20 to 24 Years | 85 (62.5%) | 15 (17.6%) |
| 25 to 29 Years | 39 (92.9%) | 0 (0.0%) |
| 30 to 34 Years | 26 (100.0%) | 0 (0.0%) |
| 35 to 44 Years | 146 (61.6%) | 16 (11.0%) |
| 45 to 54 Years | 71 (58.2%) | 0 (0.0%) |
| 55 to 59 Years | 63 (43.2%) | 0 (0.0%) |
| 60 to 64 Years | 54 (40.6%) | 0 (0.0%) |
| 65 to 74 Years | 38 (17.1%) | 0 (0.0%) |
| 75 Years and over | 0 (0.0%) | 0 (0.0%) |
| Total | 550 (38.5%) | 31 (5.6%) |
Employment Status by Educational Attainment in Santa Clara
According to labor force statistics for Santa Clara, 56.5% of individuals (399) out of the total population between 25 and 64 years of age (706) are in the labor force, with 4.0% or 16 of them being unemployed. The group with the highest labor force participation rate are those with the educational attainment of bachelor's degree or higher, with 89.4% or 110 individuals in the labor force. Within the labor force, individuals with college / associate degree education have the highest percentage of unemployment, with 5.8% or 6 of them being unemployed.
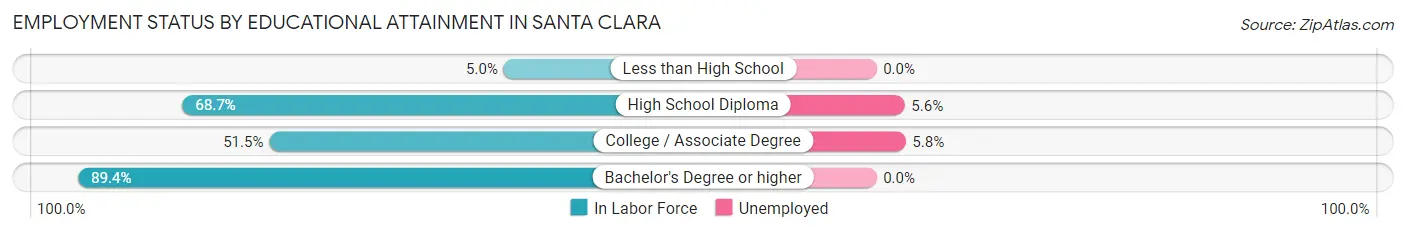
| Educational Attainment | In Labor Force | Unemployed |
| Less than High School | 6 (5.0%) | 0 (0.0%) |
| High School Diploma | 180 (68.7%) | 15 (5.6%) |
| College / Associate Degree | 103 (51.5%) | 12 (5.8%) |
| Bachelor's Degree or higher | 110 (89.4%) | 0 (0.0%) |
| Total | 399 (56.5%) | 28 (4.0%) |
Employment Occupations by Sex in Santa Clara
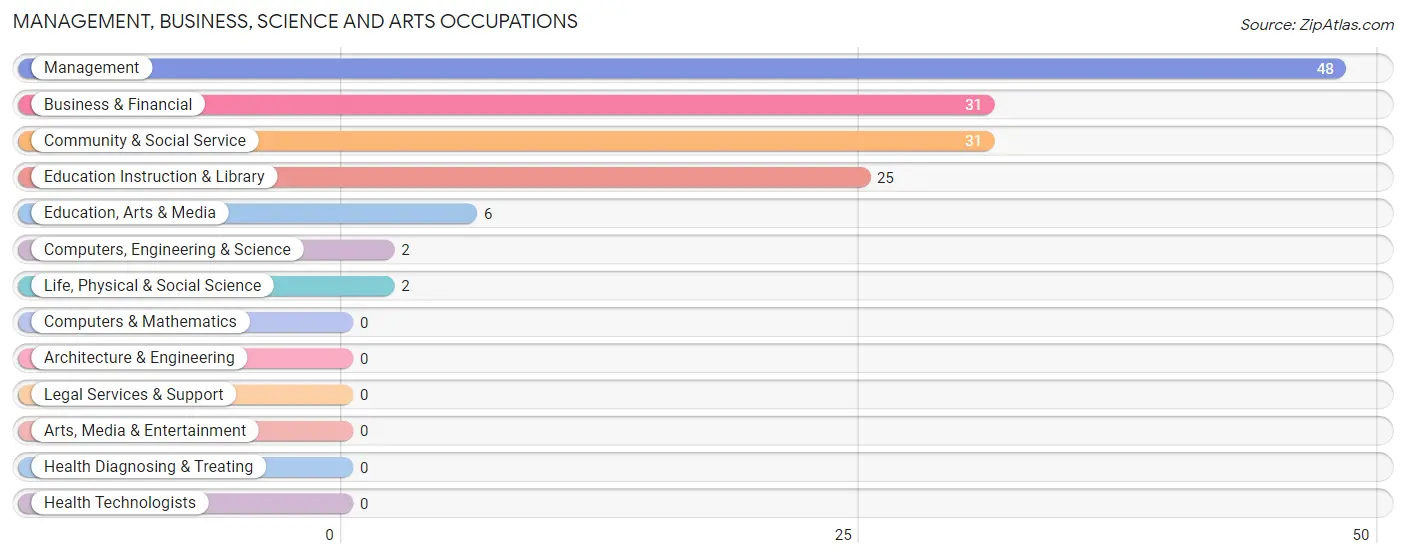
Management, Business, Science and Arts Occupations
The most common Management, Business, Science and Arts occupations in Santa Clara are Management (48 | 9.2%), Business & Financial (31 | 6.0%), Community & Social Service (31 | 6.0%), Education Instruction & Library (25 | 4.8%), and Education, Arts & Media (6 | 1.2%).
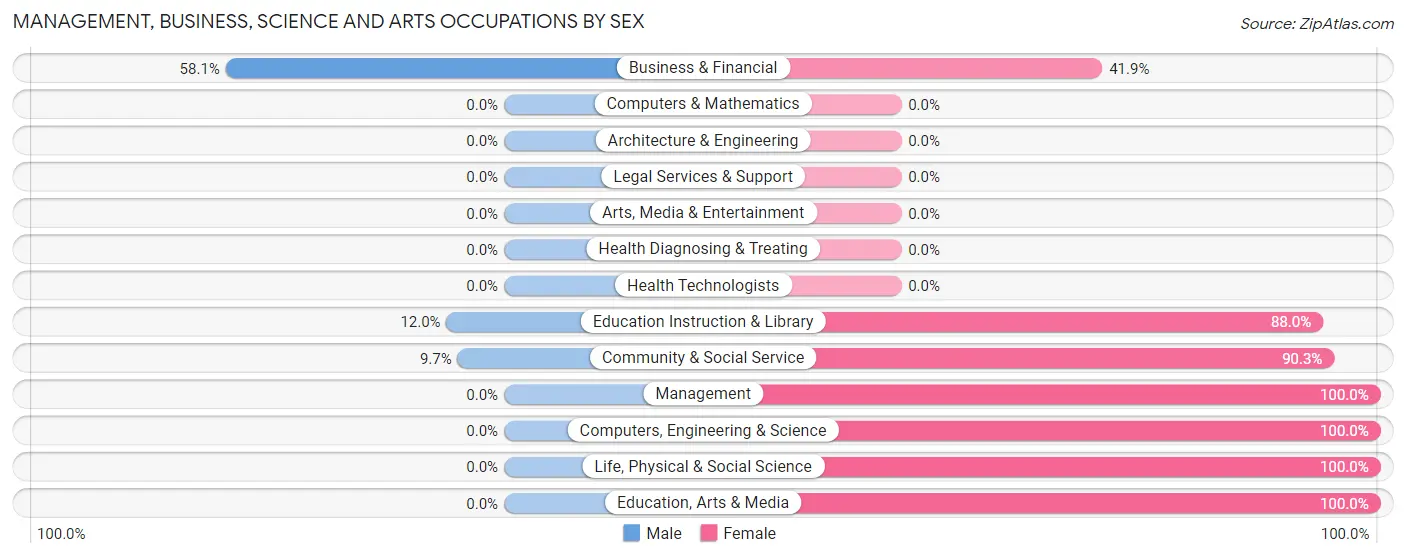
Management, Business, Science and Arts Occupations by Sex
Within the Management, Business, Science and Arts occupations in Santa Clara, the most male-oriented occupations are Business & Financial (58.1%), Education Instruction & Library (12.0%), and Community & Social Service (9.7%), while the most female-oriented occupations are Management (100.0%), Computers, Engineering & Science (100.0%), and Life, Physical & Social Science (100.0%).
| Occupation | Male | Female |
| Management | 0 (0.0%) | 48 (100.0%) |
| Business & Financial | 18 (58.1%) | 13 (41.9%) |
| Computers, Engineering & Science | 0 (0.0%) | 2 (100.0%) |
| Computers & Mathematics | 0 (0.0%) | 0 (0.0%) |
| Architecture & Engineering | 0 (0.0%) | 0 (0.0%) |
| Life, Physical & Social Science | 0 (0.0%) | 2 (100.0%) |
| Community & Social Service | 3 (9.7%) | 28 (90.3%) |
| Education, Arts & Media | 0 (0.0%) | 6 (100.0%) |
| Legal Services & Support | 0 (0.0%) | 0 (0.0%) |
| Education Instruction & Library | 3 (12.0%) | 22 (88.0%) |
| Arts, Media & Entertainment | 0 (0.0%) | 0 (0.0%) |
| Health Diagnosing & Treating | 0 (0.0%) | 0 (0.0%) |
| Health Technologists | 0 (0.0%) | 0 (0.0%) |
| Total (Category) | 21 (18.8%) | 91 (81.2%) |
| Total (Overall) | 255 (49.1%) | 264 (50.9%) |
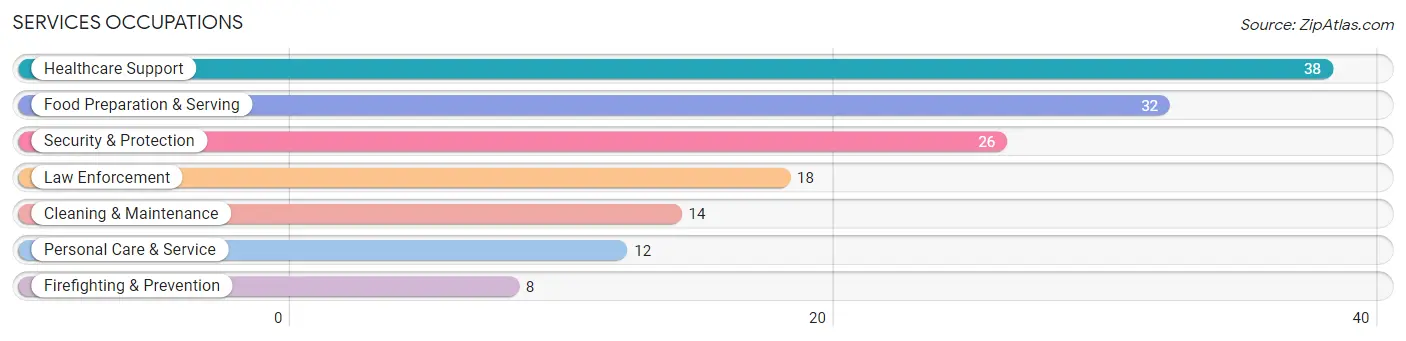
Services Occupations
The most common Services occupations in Santa Clara are Healthcare Support (38 | 7.3%), Food Preparation & Serving (32 | 6.2%), Security & Protection (26 | 5.0%), Law Enforcement (18 | 3.5%), and Cleaning & Maintenance (14 | 2.7%).
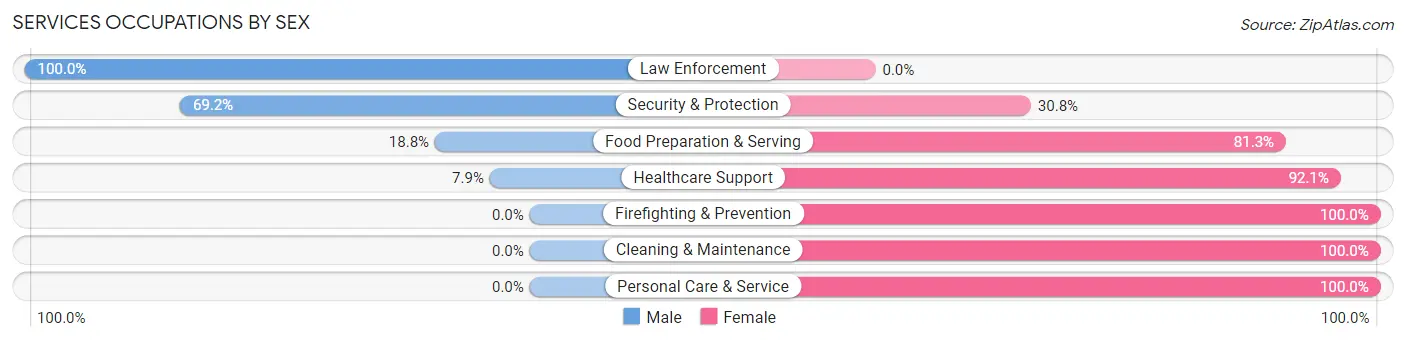
Services Occupations by Sex
Within the Services occupations in Santa Clara, the most male-oriented occupations are Law Enforcement (100.0%), Security & Protection (69.2%), and Food Preparation & Serving (18.8%), while the most female-oriented occupations are Firefighting & Prevention (100.0%), Cleaning & Maintenance (100.0%), and Personal Care & Service (100.0%).
| Occupation | Male | Female |
| Healthcare Support | 3 (7.9%) | 35 (92.1%) |
| Security & Protection | 18 (69.2%) | 8 (30.8%) |
| Firefighting & Prevention | 0 (0.0%) | 8 (100.0%) |
| Law Enforcement | 18 (100.0%) | 0 (0.0%) |
| Food Preparation & Serving | 6 (18.8%) | 26 (81.2%) |
| Cleaning & Maintenance | 0 (0.0%) | 14 (100.0%) |
| Personal Care & Service | 0 (0.0%) | 12 (100.0%) |
| Total (Category) | 27 (22.1%) | 95 (77.9%) |
| Total (Overall) | 255 (49.1%) | 264 (50.9%) |
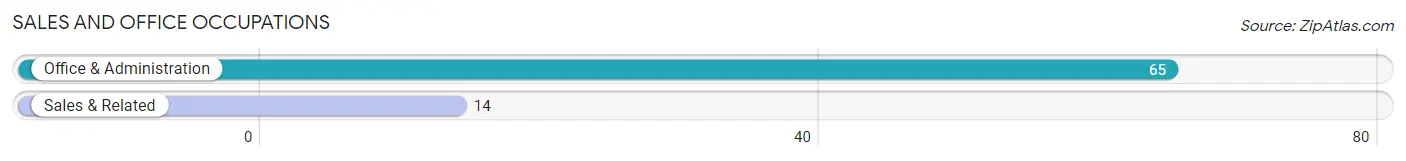
Sales and Office Occupations
The most common Sales and Office occupations in Santa Clara are Office & Administration (65 | 12.5%), and Sales & Related (14 | 2.7%).
Sales and Office Occupations by Sex
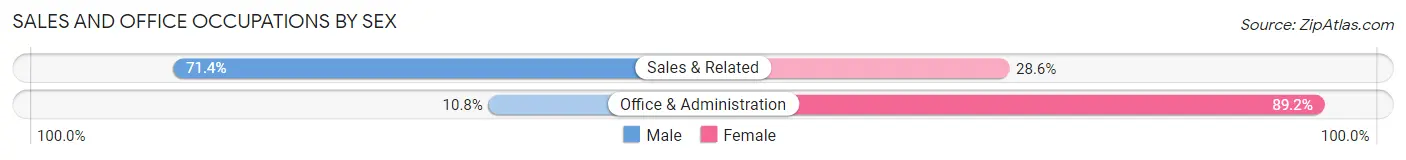
| Occupation | Male | Female |
| Sales & Related | 10 (71.4%) | 4 (28.6%) |
| Office & Administration | 7 (10.8%) | 58 (89.2%) |
| Total (Category) | 17 (21.5%) | 62 (78.5%) |
| Total (Overall) | 255 (49.1%) | 264 (50.9%) |
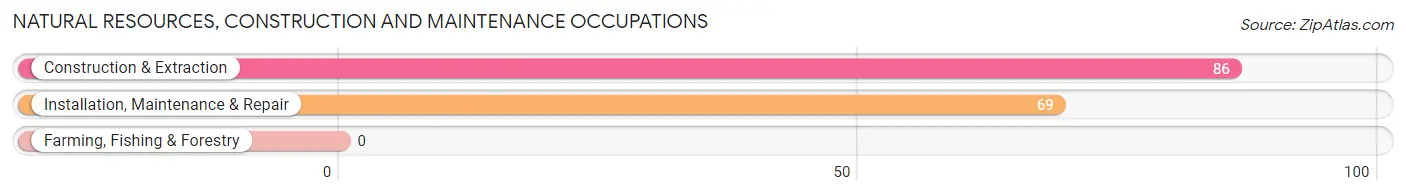
Natural Resources, Construction and Maintenance Occupations
The most common Natural Resources, Construction and Maintenance occupations in Santa Clara are Construction & Extraction (86 | 16.6%), and Installation, Maintenance & Repair (69 | 13.3%).
Natural Resources, Construction and Maintenance Occupations by Sex
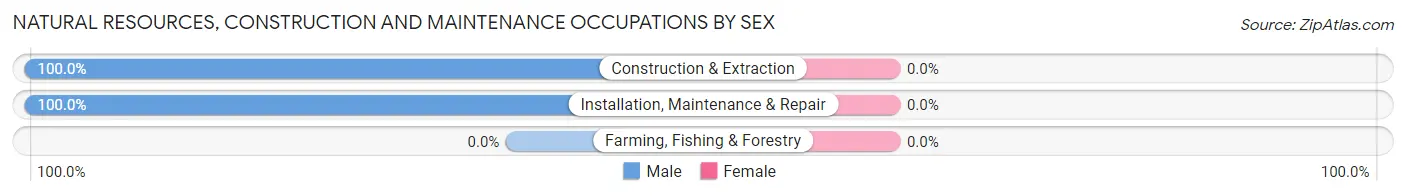
| Occupation | Male | Female |
| Farming, Fishing & Forestry | 0 (0.0%) | 0 (0.0%) |
| Construction & Extraction | 86 (100.0%) | 0 (0.0%) |
| Installation, Maintenance & Repair | 69 (100.0%) | 0 (0.0%) |
| Total (Category) | 155 (100.0%) | 0 (0.0%) |
| Total (Overall) | 255 (49.1%) | 264 (50.9%) |
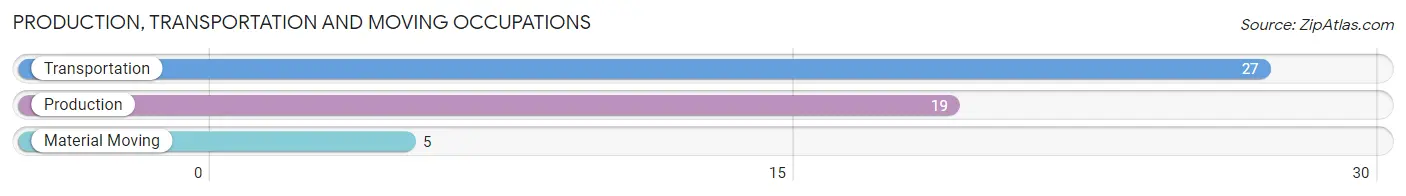
Production, Transportation and Moving Occupations
The most common Production, Transportation and Moving occupations in Santa Clara are Transportation (27 | 5.2%), Production (19 | 3.7%), and Material Moving (5 | 1.0%).
Production, Transportation and Moving Occupations by Sex
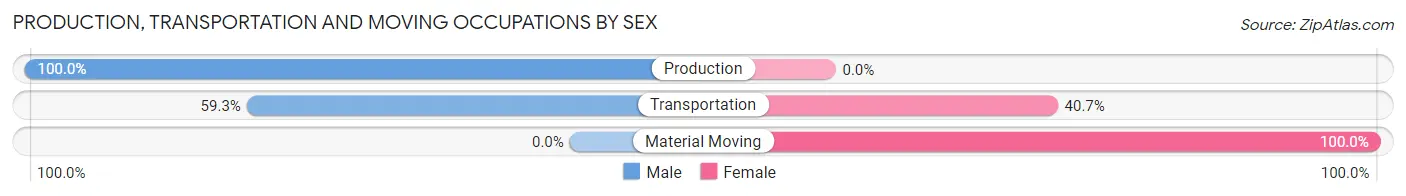
| Occupation | Male | Female |
| Production | 19 (100.0%) | 0 (0.0%) |
| Transportation | 16 (59.3%) | 11 (40.7%) |
| Material Moving | 0 (0.0%) | 5 (100.0%) |
| Total (Category) | 35 (68.6%) | 16 (31.4%) |
| Total (Overall) | 255 (49.1%) | 264 (50.9%) |
Employment Industries by Sex in Santa Clara
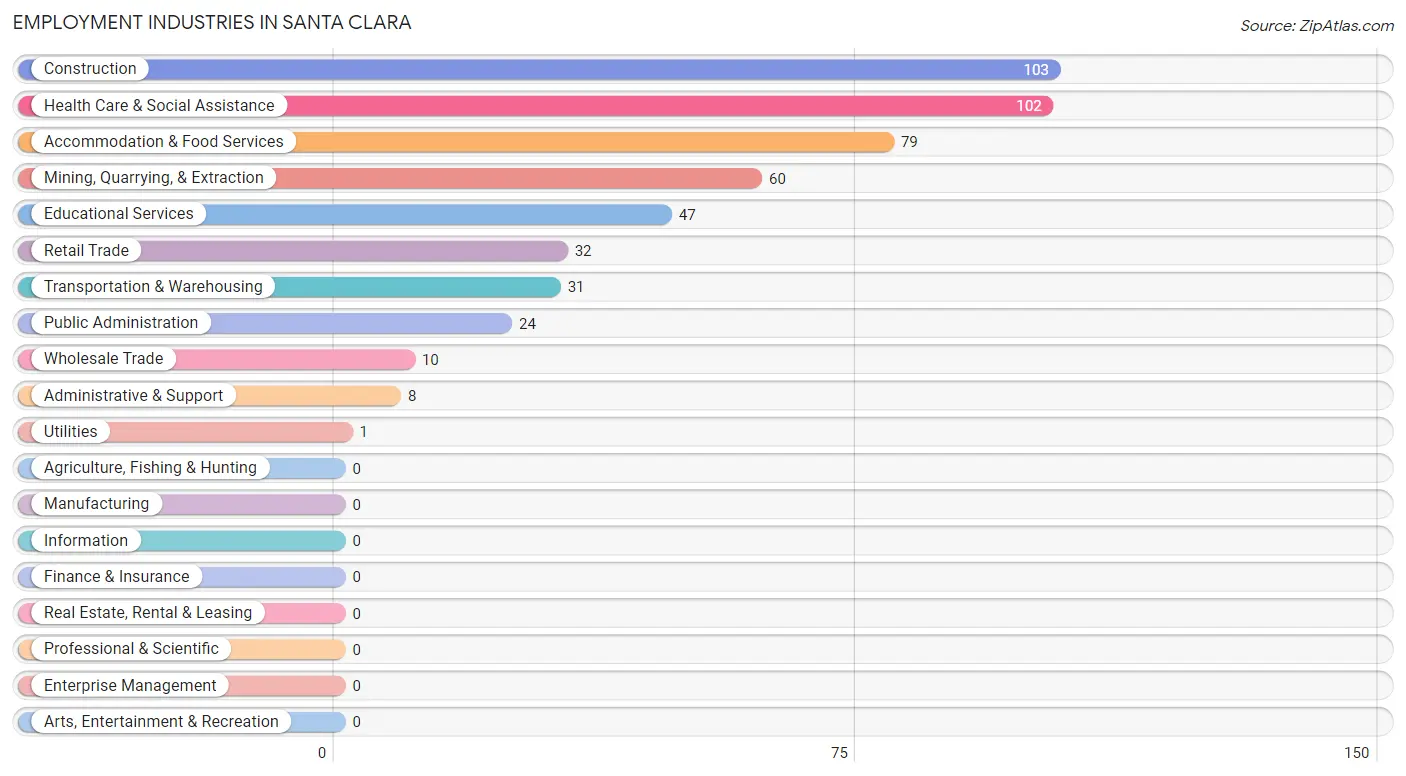
Employment Industries in Santa Clara
The major employment industries in Santa Clara include Construction (103 | 19.9%), Health Care & Social Assistance (102 | 19.7%), Accommodation & Food Services (79 | 15.2%), Mining, Quarrying, & Extraction (60 | 11.6%), and Educational Services (47 | 9.1%).
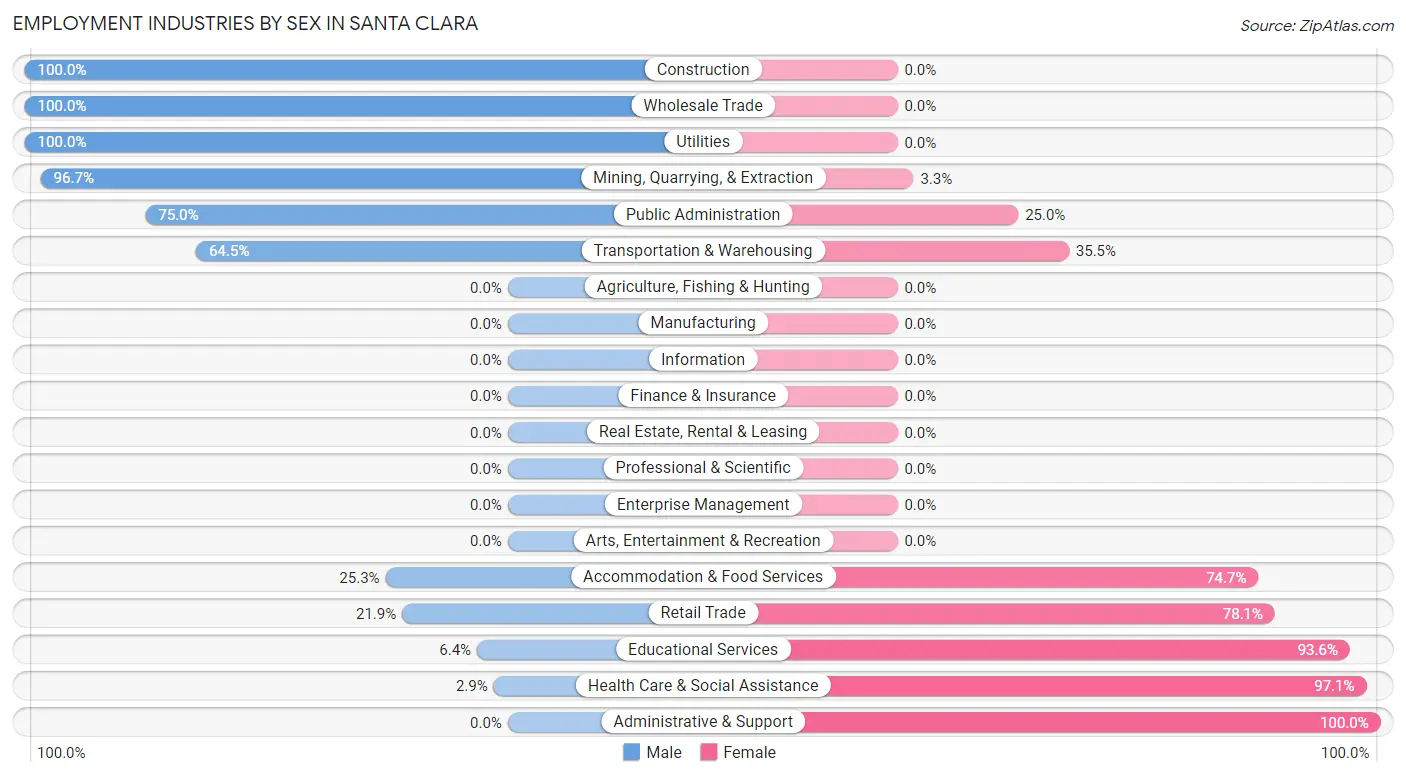
Employment Industries by Sex in Santa Clara
The Santa Clara industries that see more men than women are Construction (100.0%), Wholesale Trade (100.0%), and Utilities (100.0%), whereas the industries that tend to have a higher number of women are Administrative & Support (100.0%), Health Care & Social Assistance (97.1%), and Educational Services (93.6%).
| Industry | Male | Female |
| Agriculture, Fishing & Hunting | 0 (0.0%) | 0 (0.0%) |
| Mining, Quarrying, & Extraction | 58 (96.7%) | 2 (3.3%) |
| Construction | 103 (100.0%) | 0 (0.0%) |
| Manufacturing | 0 (0.0%) | 0 (0.0%) |
| Wholesale Trade | 10 (100.0%) | 0 (0.0%) |
| Retail Trade | 7 (21.9%) | 25 (78.1%) |
| Transportation & Warehousing | 20 (64.5%) | 11 (35.5%) |
| Utilities | 1 (100.0%) | 0 (0.0%) |
| Information | 0 (0.0%) | 0 (0.0%) |
| Finance & Insurance | 0 (0.0%) | 0 (0.0%) |
| Real Estate, Rental & Leasing | 0 (0.0%) | 0 (0.0%) |
| Professional & Scientific | 0 (0.0%) | 0 (0.0%) |
| Enterprise Management | 0 (0.0%) | 0 (0.0%) |
| Administrative & Support | 0 (0.0%) | 8 (100.0%) |
| Educational Services | 3 (6.4%) | 44 (93.6%) |
| Health Care & Social Assistance | 3 (2.9%) | 99 (97.1%) |
| Arts, Entertainment & Recreation | 0 (0.0%) | 0 (0.0%) |
| Accommodation & Food Services | 20 (25.3%) | 59 (74.7%) |
| Public Administration | 18 (75.0%) | 6 (25.0%) |
| Total | 255 (49.1%) | 264 (50.9%) |
Education in Santa Clara
School Enrollment in Santa Clara
The most common levels of schooling among the 279 students in Santa Clara are high school (88 | 31.5%), elementary school (81 | 29.0%), and middle school (39 | 14.0%).
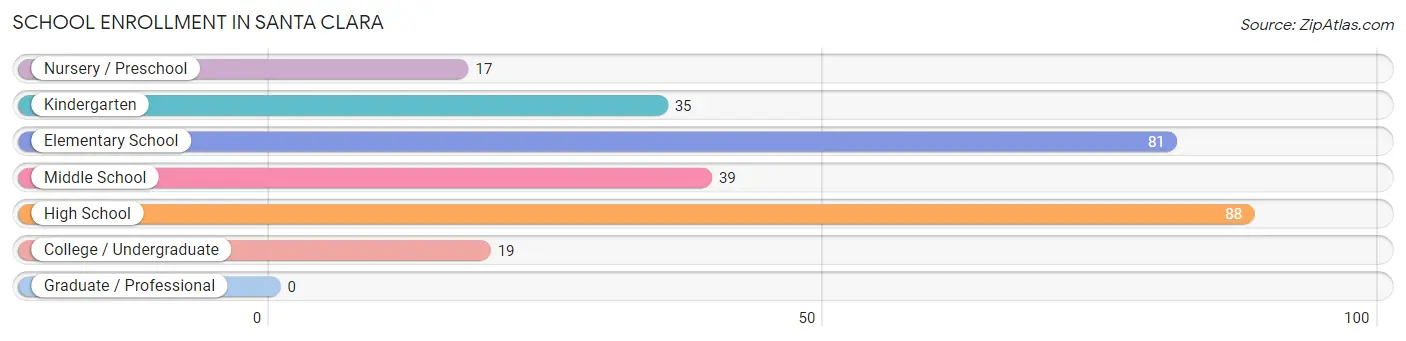
| School Level | # Students | % Students |
| Nursery / Preschool | 17 | 6.1% |
| Kindergarten | 35 | 12.5% |
| Elementary School | 81 | 29.0% |
| Middle School | 39 | 14.0% |
| High School | 88 | 31.5% |
| College / Undergraduate | 19 | 6.8% |
| Graduate / Professional | 0 | 0.0% |
| Total | 279 | 100.0% |
School Enrollment by Age by Funding Source in Santa Clara
Out of a total of 279 students who are enrolled in schools in Santa Clara, 7 (2.5%) attend a private institution, while the remaining 272 (97.5%) are enrolled in public schools. The age group of 15 to 17 year olds has the highest likelihood of being enrolled in private schools, with 7 (9.5% in the age bracket) enrolled. Conversely, the age group of 5 to 9 year old has the lowest likelihood of being enrolled in a private school, with 143 (100.0% in the age bracket) attending a public institution.
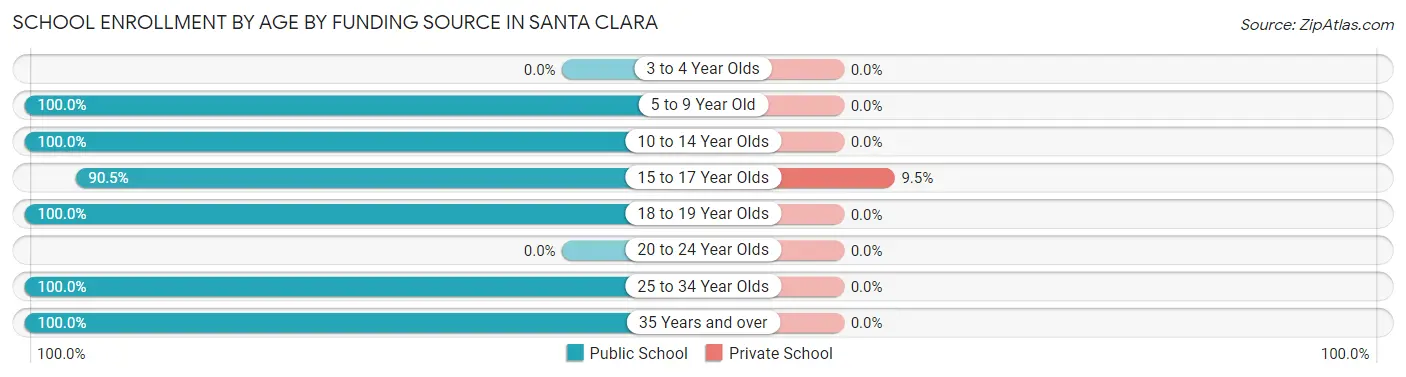
| Age Bracket | Public School | Private School |
| 3 to 4 Year Olds | 0 (0.0%) | 0 (0.0%) |
| 5 to 9 Year Old | 143 (100.0%) | 0 (0.0%) |
| 10 to 14 Year Olds | 29 (100.0%) | 0 (0.0%) |
| 15 to 17 Year Olds | 67 (90.5%) | 7 (9.5%) |
| 18 to 19 Year Olds | 14 (100.0%) | 0 (0.0%) |
| 20 to 24 Year Olds | 0 (0.0%) | 0 (0.0%) |
| 25 to 34 Year Olds | 13 (100.0%) | 0 (0.0%) |
| 35 Years and over | 6 (100.0%) | 0 (0.0%) |
| Total | 272 (97.5%) | 7 (2.5%) |
Educational Attainment by Field of Study in Santa Clara
Education (60 | 27.7%), physical & health sciences (43 | 19.8%), science & technology (36 | 16.6%), visual & performing arts (24 | 11.1%), and psychology (22 | 10.1%) are the most common fields of study among 217 individuals in Santa Clara who have obtained a bachelor's degree or higher.
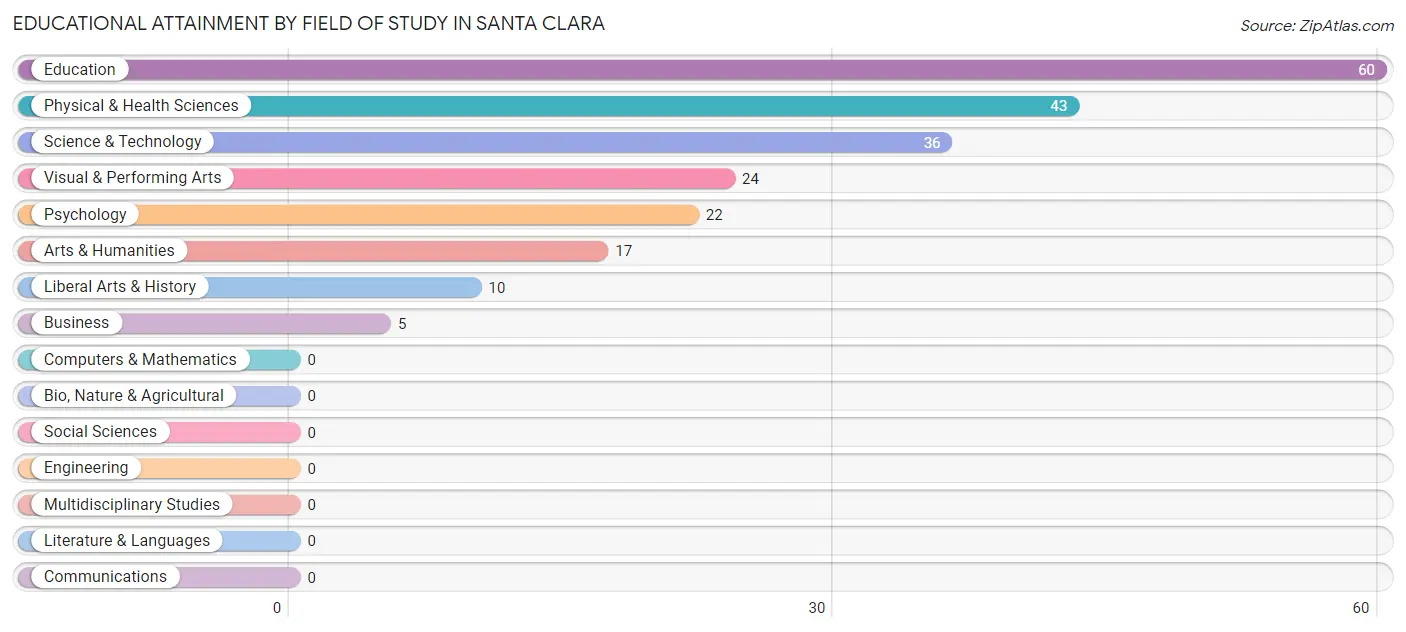
| Field of Study | # Graduates | % Graduates |
| Computers & Mathematics | 0 | 0.0% |
| Bio, Nature & Agricultural | 0 | 0.0% |
| Physical & Health Sciences | 43 | 19.8% |
| Psychology | 22 | 10.1% |
| Social Sciences | 0 | 0.0% |
| Engineering | 0 | 0.0% |
| Multidisciplinary Studies | 0 | 0.0% |
| Science & Technology | 36 | 16.6% |
| Business | 5 | 2.3% |
| Education | 60 | 27.7% |
| Literature & Languages | 0 | 0.0% |
| Liberal Arts & History | 10 | 4.6% |
| Visual & Performing Arts | 24 | 11.1% |
| Communications | 0 | 0.0% |
| Arts & Humanities | 17 | 7.8% |
| Total | 217 | 100.0% |
Transportation & Commute in Santa Clara
Vehicle Availability by Sex in Santa Clara
The most prevalent vehicle ownership categories in Santa Clara are males with 2 vehicles (156, accounting for 61.2%) and females with 2 vehicles (53, making up 59.1%).
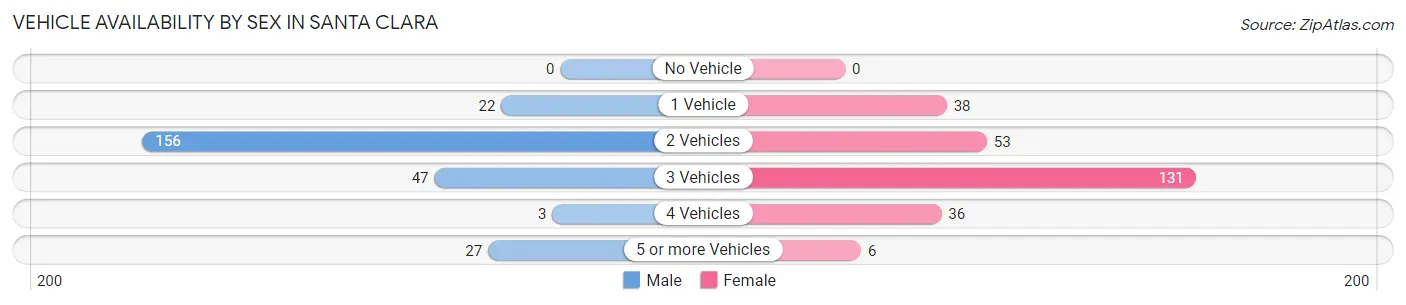
| Vehicles Available | Male | Female |
| No Vehicle | 0 (0.0%) | 0 (0.0%) |
| 1 Vehicle | 22 (8.6%) | 38 (14.4%) |
| 2 Vehicles | 156 (61.2%) | 53 (20.1%) |
| 3 Vehicles | 47 (18.4%) | 131 (49.6%) |
| 4 Vehicles | 3 (1.2%) | 36 (13.6%) |
| 5 or more Vehicles | 27 (10.6%) | 6 (2.3%) |
| Total | 255 (100.0%) | 264 (100.0%) |
Commute Time in Santa Clara
The most frequently occuring commute durations in Santa Clara are 10 to 14 minutes (143 commuters, 29.9%), 5 to 9 minutes (103 commuters, 21.5%), and 15 to 19 minutes (103 commuters, 21.5%).
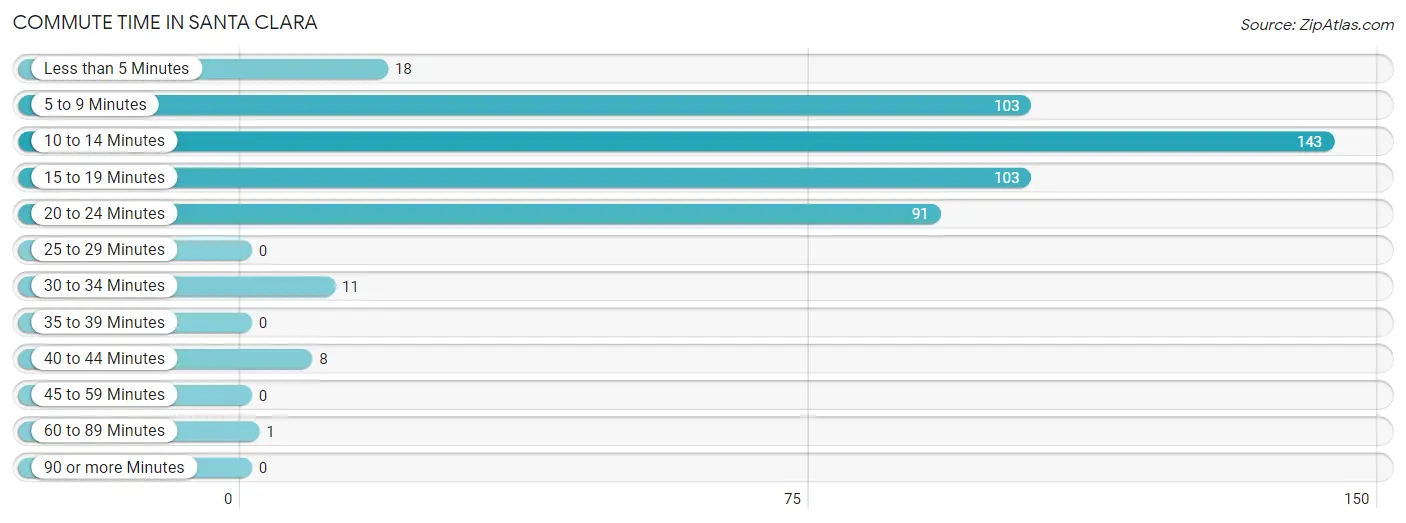
| Commute Time | # Commuters | % Commuters |
| Less than 5 Minutes | 18 | 3.8% |
| 5 to 9 Minutes | 103 | 21.5% |
| 10 to 14 Minutes | 143 | 29.9% |
| 15 to 19 Minutes | 103 | 21.5% |
| 20 to 24 Minutes | 91 | 19.0% |
| 25 to 29 Minutes | 0 | 0.0% |
| 30 to 34 Minutes | 11 | 2.3% |
| 35 to 39 Minutes | 0 | 0.0% |
| 40 to 44 Minutes | 8 | 1.7% |
| 45 to 59 Minutes | 0 | 0.0% |
| 60 to 89 Minutes | 1 | 0.2% |
| 90 or more Minutes | 0 | 0.0% |
Commute Time by Sex in Santa Clara
The most common commute times in Santa Clara are 10 to 14 minutes (125 commuters, 51.2%) for males and 20 to 24 minutes (83 commuters, 35.5%) for females.
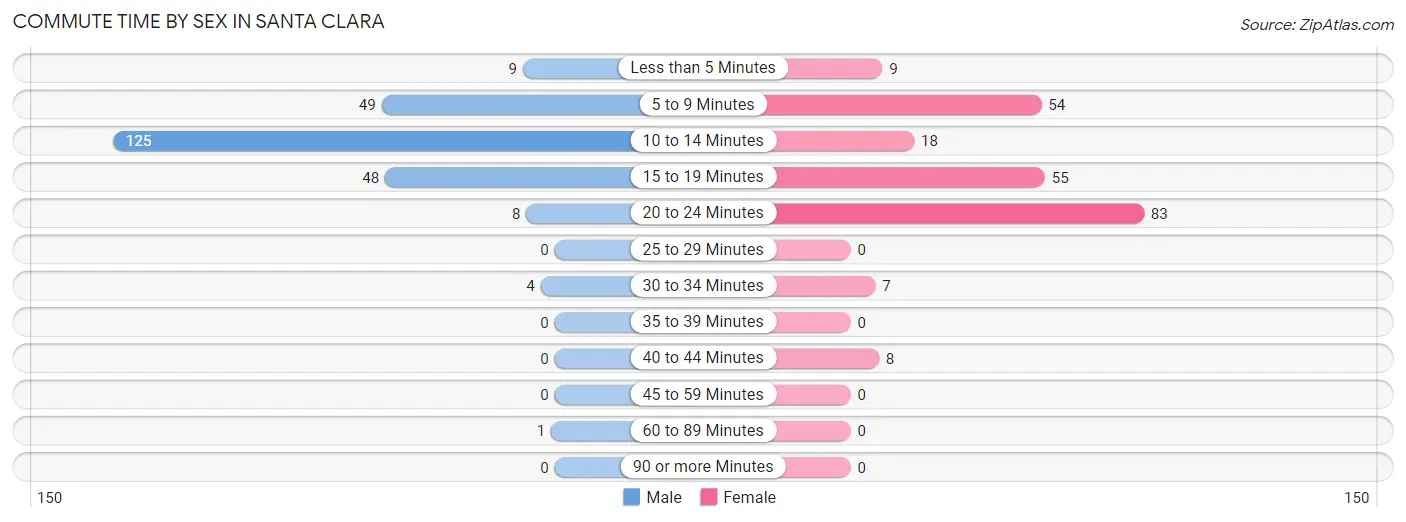
| Commute Time | Male | Female |
| Less than 5 Minutes | 9 (3.7%) | 9 (3.8%) |
| 5 to 9 Minutes | 49 (20.1%) | 54 (23.1%) |
| 10 to 14 Minutes | 125 (51.2%) | 18 (7.7%) |
| 15 to 19 Minutes | 48 (19.7%) | 55 (23.5%) |
| 20 to 24 Minutes | 8 (3.3%) | 83 (35.5%) |
| 25 to 29 Minutes | 0 (0.0%) | 0 (0.0%) |
| 30 to 34 Minutes | 4 (1.6%) | 7 (3.0%) |
| 35 to 39 Minutes | 0 (0.0%) | 0 (0.0%) |
| 40 to 44 Minutes | 0 (0.0%) | 8 (3.4%) |
| 45 to 59 Minutes | 0 (0.0%) | 0 (0.0%) |
| 60 to 89 Minutes | 1 (0.4%) | 0 (0.0%) |
| 90 or more Minutes | 0 (0.0%) | 0 (0.0%) |
Time of Departure to Work by Sex in Santa Clara
The most frequent times of departure to work in Santa Clara are 9:00 AM to 9:59 AM (45, 18.4%) for males and 12:00 PM to 3:59 PM (50, 21.4%) for females.
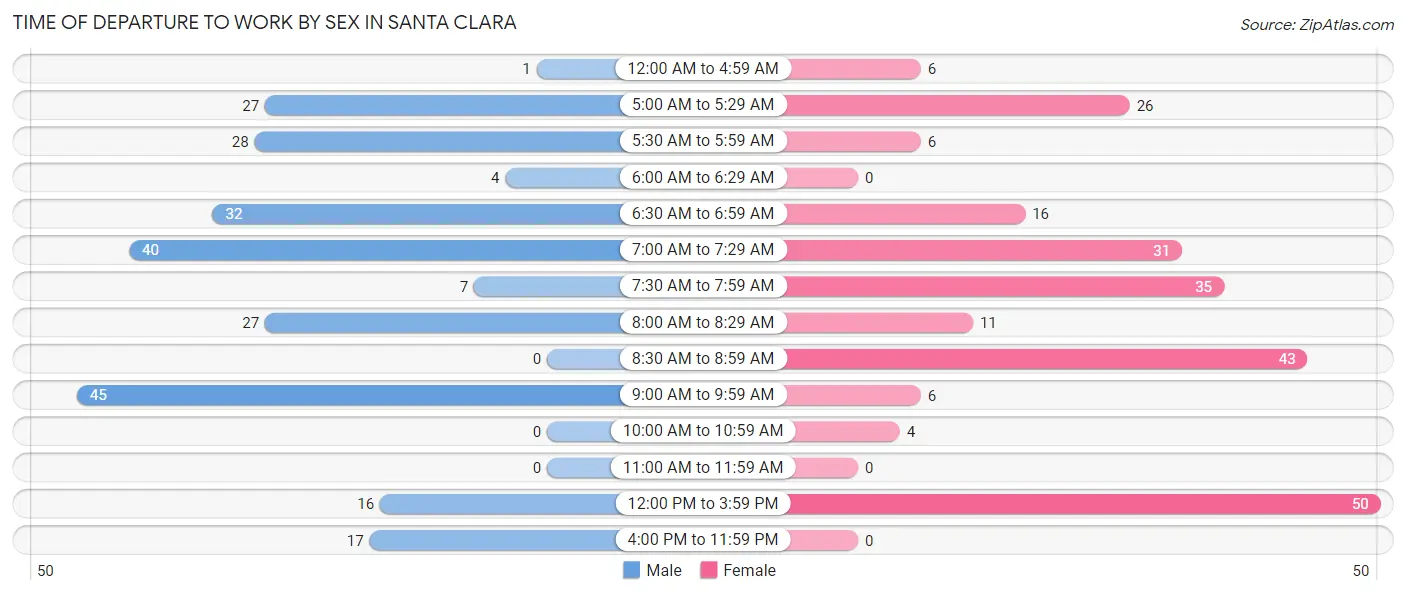
| Time of Departure | Male | Female |
| 12:00 AM to 4:59 AM | 1 (0.4%) | 6 (2.6%) |
| 5:00 AM to 5:29 AM | 27 (11.1%) | 26 (11.1%) |
| 5:30 AM to 5:59 AM | 28 (11.5%) | 6 (2.6%) |
| 6:00 AM to 6:29 AM | 4 (1.6%) | 0 (0.0%) |
| 6:30 AM to 6:59 AM | 32 (13.1%) | 16 (6.8%) |
| 7:00 AM to 7:29 AM | 40 (16.4%) | 31 (13.3%) |
| 7:30 AM to 7:59 AM | 7 (2.9%) | 35 (15.0%) |
| 8:00 AM to 8:29 AM | 27 (11.1%) | 11 (4.7%) |
| 8:30 AM to 8:59 AM | 0 (0.0%) | 43 (18.4%) |
| 9:00 AM to 9:59 AM | 45 (18.4%) | 6 (2.6%) |
| 10:00 AM to 10:59 AM | 0 (0.0%) | 4 (1.7%) |
| 11:00 AM to 11:59 AM | 0 (0.0%) | 0 (0.0%) |
| 12:00 PM to 3:59 PM | 16 (6.6%) | 50 (21.4%) |
| 4:00 PM to 11:59 PM | 17 (7.0%) | 0 (0.0%) |
| Total | 244 (100.0%) | 234 (100.0%) |
Housing Occupancy in Santa Clara
Occupancy by Ownership in Santa Clara
Of the total 555 dwellings in Santa Clara, owner-occupied units account for 380 (68.5%), while renter-occupied units make up 175 (31.5%).
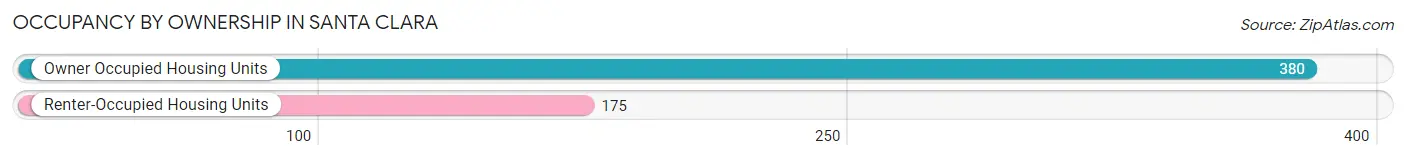
| Occupancy | # Housing Units | % Housing Units |
| Owner Occupied Housing Units | 380 | 68.5% |
| Renter-Occupied Housing Units | 175 | 31.5% |
| Total Occupied Housing Units | 555 | 100.0% |
Occupancy by Household Size in Santa Clara
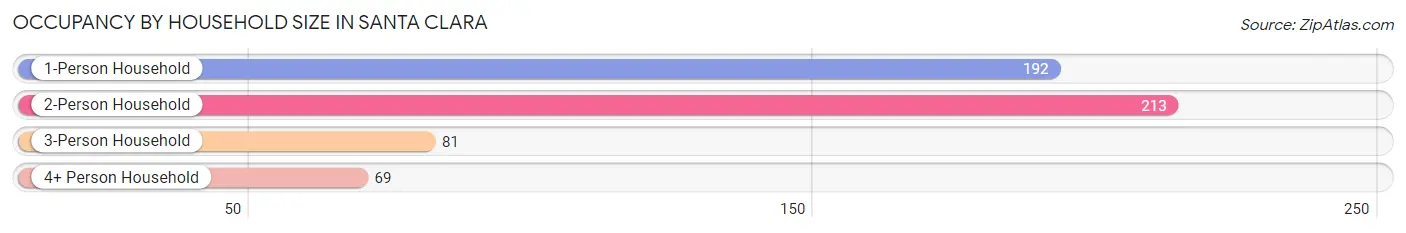
| Household Size | # Housing Units | % Housing Units |
| 1-Person Household | 192 | 34.6% |
| 2-Person Household | 213 | 38.4% |
| 3-Person Household | 81 | 14.6% |
| 4+ Person Household | 69 | 12.4% |
| Total Housing Units | 555 | 100.0% |
Occupancy by Ownership by Household Size in Santa Clara
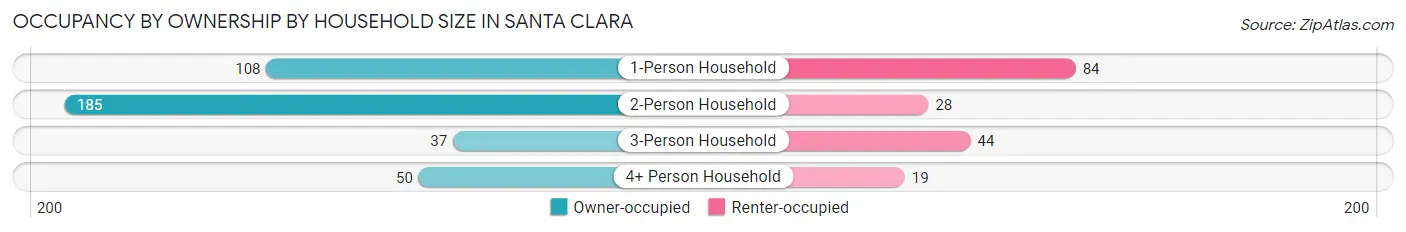
| Household Size | Owner-occupied | Renter-occupied |
| 1-Person Household | 108 (56.2%) | 84 (43.8%) |
| 2-Person Household | 185 (86.9%) | 28 (13.2%) |
| 3-Person Household | 37 (45.7%) | 44 (54.3%) |
| 4+ Person Household | 50 (72.5%) | 19 (27.5%) |
| Total Housing Units | 380 (68.5%) | 175 (31.5%) |
Occupancy by Educational Attainment in Santa Clara
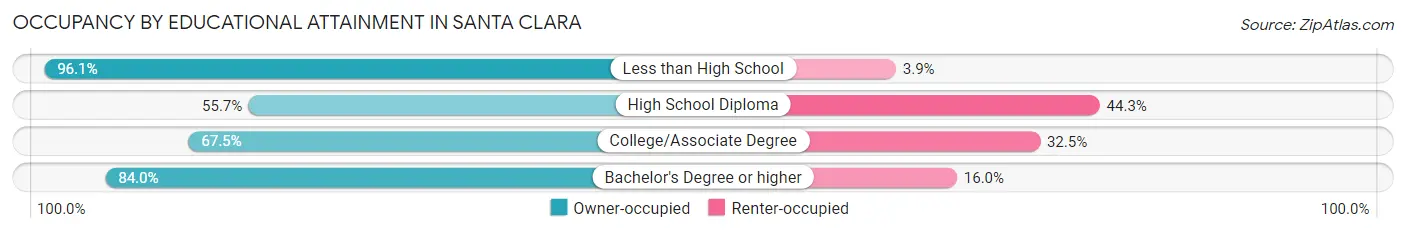
| Household Size | Owner-occupied | Renter-occupied |
| Less than High School | 74 (96.1%) | 3 (3.9%) |
| High School Diploma | 137 (55.7%) | 109 (44.3%) |
| College/Associate Degree | 106 (67.5%) | 51 (32.5%) |
| Bachelor's Degree or higher | 63 (84.0%) | 12 (16.0%) |
Occupancy by Age of Householder in Santa Clara
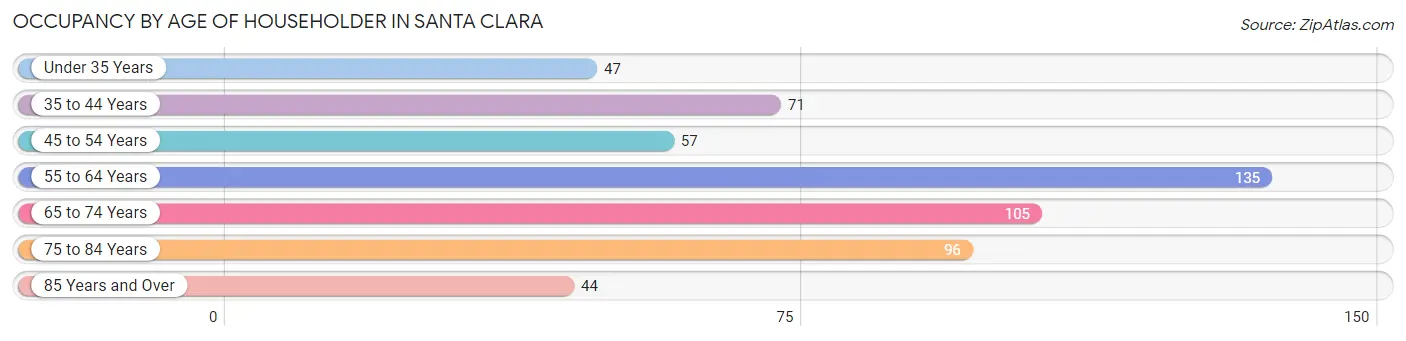
| Age Bracket | # Households | % Households |
| Under 35 Years | 47 | 8.5% |
| 35 to 44 Years | 71 | 12.8% |
| 45 to 54 Years | 57 | 10.3% |
| 55 to 64 Years | 135 | 24.3% |
| 65 to 74 Years | 105 | 18.9% |
| 75 to 84 Years | 96 | 17.3% |
| 85 Years and Over | 44 | 7.9% |
| Total | 555 | 100.0% |
Housing Finances in Santa Clara
Median Income by Occupancy in Santa Clara
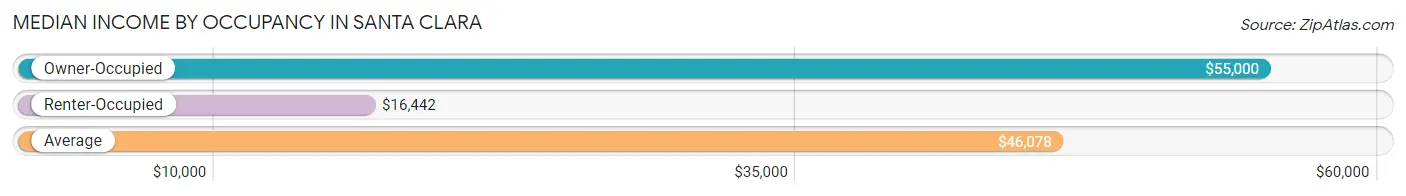
| Occupancy Type | # Households | Median Income |
| Owner-Occupied | 380 (68.5%) | $55,000 |
| Renter-Occupied | 175 (31.5%) | $16,442 |
| Average | 555 (100.0%) | $46,078 |
Occupancy by Householder Income Bracket in Santa Clara
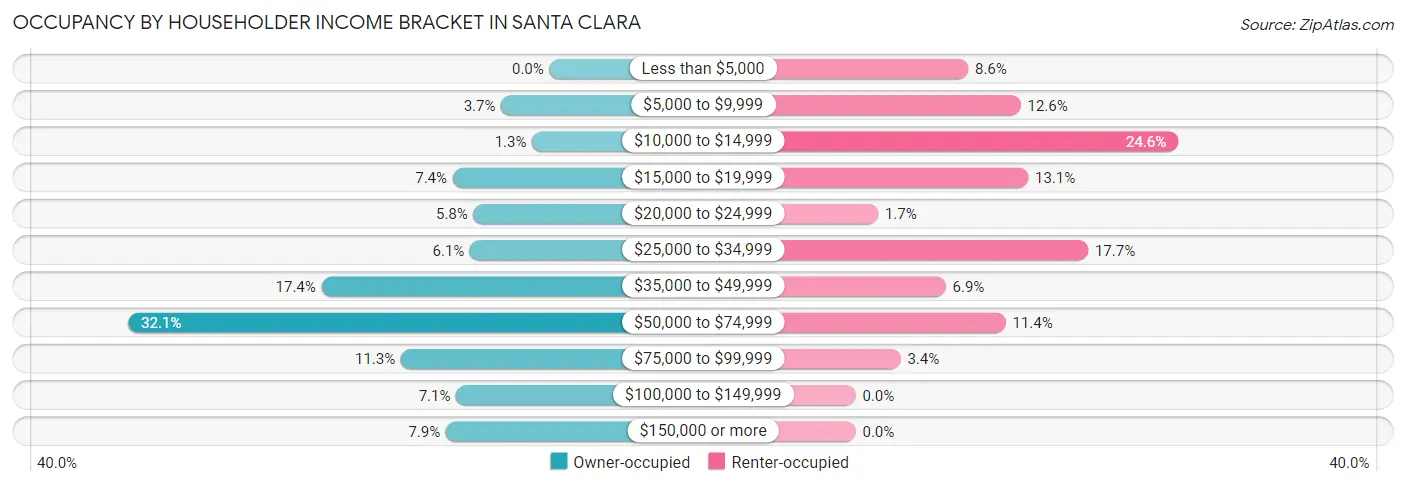
| Income Bracket | Owner-occupied | Renter-occupied |
| Less than $5,000 | 0 (0.0%) | 15 (8.6%) |
| $5,000 to $9,999 | 14 (3.7%) | 22 (12.6%) |
| $10,000 to $14,999 | 5 (1.3%) | 43 (24.6%) |
| $15,000 to $19,999 | 28 (7.4%) | 23 (13.1%) |
| $20,000 to $24,999 | 22 (5.8%) | 3 (1.7%) |
| $25,000 to $34,999 | 23 (6.0%) | 31 (17.7%) |
| $35,000 to $49,999 | 66 (17.4%) | 12 (6.9%) |
| $50,000 to $74,999 | 122 (32.1%) | 20 (11.4%) |
| $75,000 to $99,999 | 43 (11.3%) | 6 (3.4%) |
| $100,000 to $149,999 | 27 (7.1%) | 0 (0.0%) |
| $150,000 or more | 30 (7.9%) | 0 (0.0%) |
| Total | 380 (100.0%) | 175 (100.0%) |
Monthly Housing Cost Tiers in Santa Clara
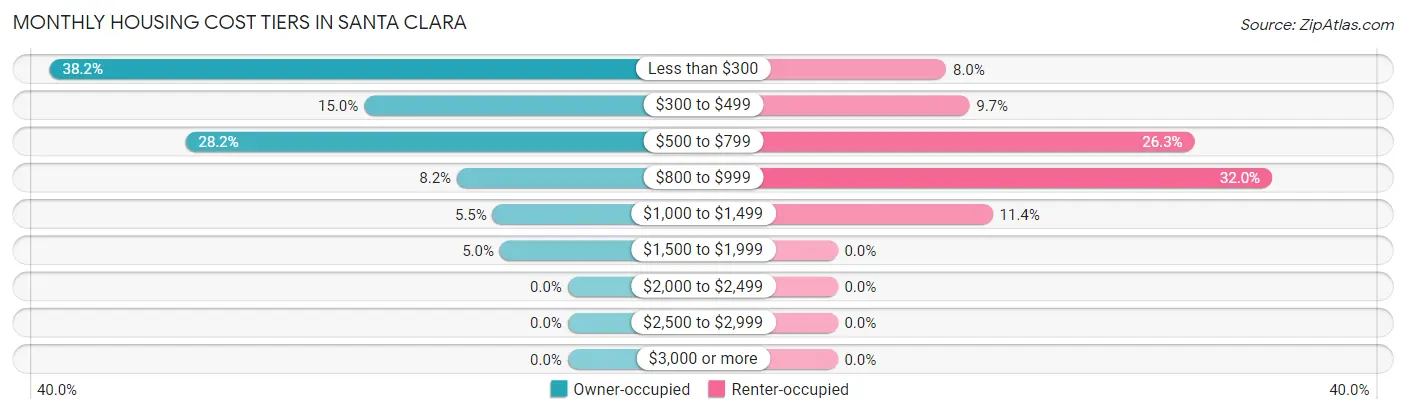
| Monthly Cost | Owner-occupied | Renter-occupied |
| Less than $300 | 145 (38.2%) | 14 (8.0%) |
| $300 to $499 | 57 (15.0%) | 17 (9.7%) |
| $500 to $799 | 107 (28.2%) | 46 (26.3%) |
| $800 to $999 | 31 (8.2%) | 56 (32.0%) |
| $1,000 to $1,499 | 21 (5.5%) | 20 (11.4%) |
| $1,500 to $1,999 | 19 (5.0%) | 0 (0.0%) |
| $2,000 to $2,499 | 0 (0.0%) | 0 (0.0%) |
| $2,500 to $2,999 | 0 (0.0%) | 0 (0.0%) |
| $3,000 or more | 0 (0.0%) | 0 (0.0%) |
| Total | 380 (100.0%) | 175 (100.0%) |
Physical Housing Characteristics in Santa Clara
Housing Structures in Santa Clara
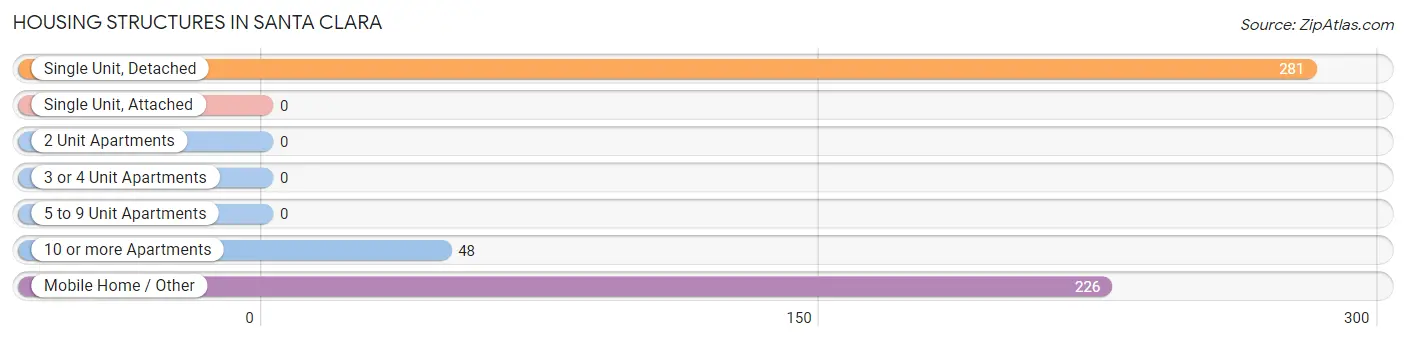
| Structure Type | # Housing Units | % Housing Units |
| Single Unit, Detached | 281 | 50.6% |
| Single Unit, Attached | 0 | 0.0% |
| 2 Unit Apartments | 0 | 0.0% |
| 3 or 4 Unit Apartments | 0 | 0.0% |
| 5 to 9 Unit Apartments | 0 | 0.0% |
| 10 or more Apartments | 48 | 8.6% |
| Mobile Home / Other | 226 | 40.7% |
| Total | 555 | 100.0% |
Housing Structures by Occupancy in Santa Clara
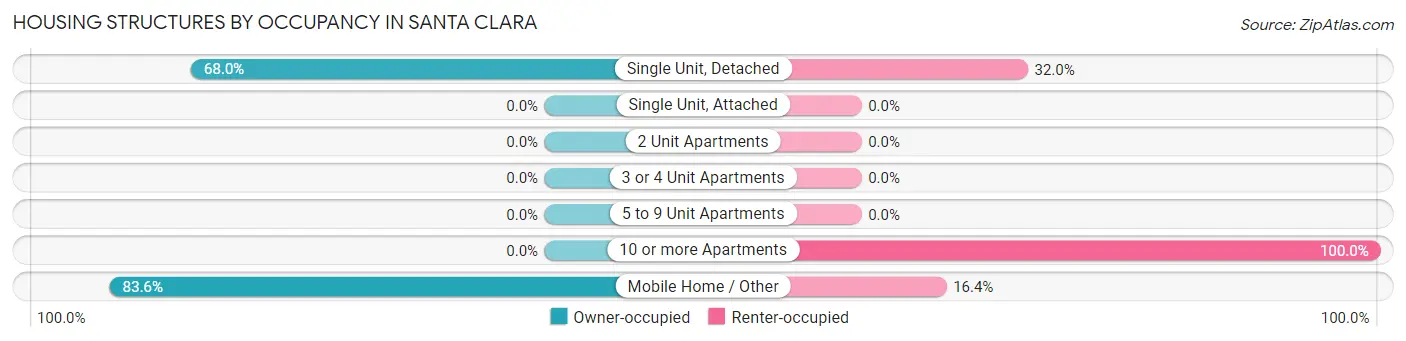
| Structure Type | Owner-occupied | Renter-occupied |
| Single Unit, Detached | 191 (68.0%) | 90 (32.0%) |
| Single Unit, Attached | 0 (0.0%) | 0 (0.0%) |
| 2 Unit Apartments | 0 (0.0%) | 0 (0.0%) |
| 3 or 4 Unit Apartments | 0 (0.0%) | 0 (0.0%) |
| 5 to 9 Unit Apartments | 0 (0.0%) | 0 (0.0%) |
| 10 or more Apartments | 0 (0.0%) | 48 (100.0%) |
| Mobile Home / Other | 189 (83.6%) | 37 (16.4%) |
| Total | 380 (68.5%) | 175 (31.5%) |
Housing Structures by Number of Rooms in Santa Clara
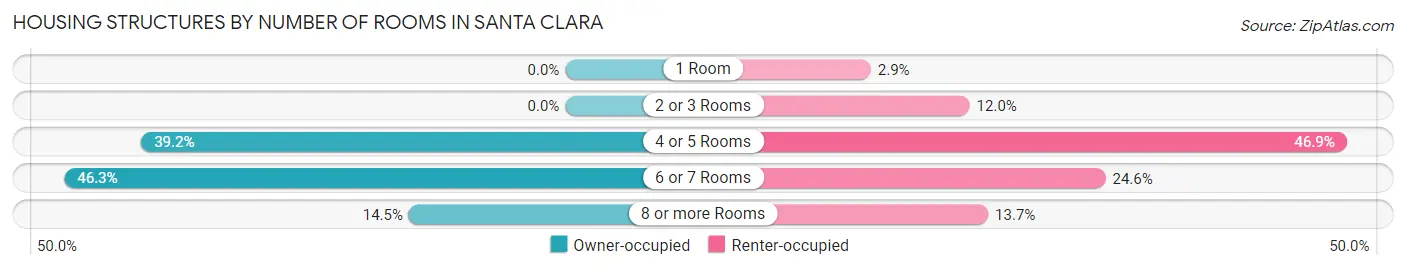
| Number of Rooms | Owner-occupied | Renter-occupied |
| 1 Room | 0 (0.0%) | 5 (2.9%) |
| 2 or 3 Rooms | 0 (0.0%) | 21 (12.0%) |
| 4 or 5 Rooms | 149 (39.2%) | 82 (46.9%) |
| 6 or 7 Rooms | 176 (46.3%) | 43 (24.6%) |
| 8 or more Rooms | 55 (14.5%) | 24 (13.7%) |
| Total | 380 (100.0%) | 175 (100.0%) |
Housing Structure by Heating Type in Santa Clara
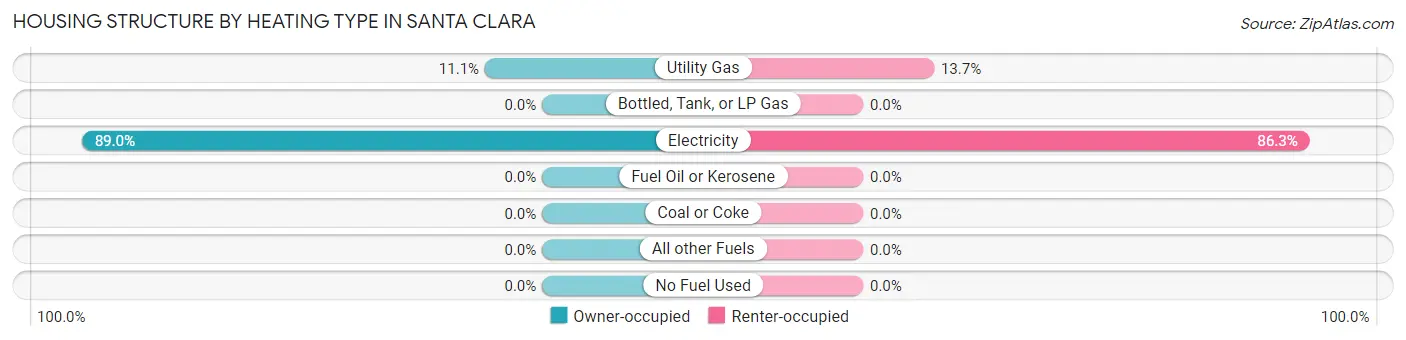
| Heating Type | Owner-occupied | Renter-occupied |
| Utility Gas | 42 (11.1%) | 24 (13.7%) |
| Bottled, Tank, or LP Gas | 0 (0.0%) | 0 (0.0%) |
| Electricity | 338 (88.9%) | 151 (86.3%) |
| Fuel Oil or Kerosene | 0 (0.0%) | 0 (0.0%) |
| Coal or Coke | 0 (0.0%) | 0 (0.0%) |
| All other Fuels | 0 (0.0%) | 0 (0.0%) |
| No Fuel Used | 0 (0.0%) | 0 (0.0%) |
| Total | 380 (100.0%) | 175 (100.0%) |
Household Vehicle Usage in Santa Clara
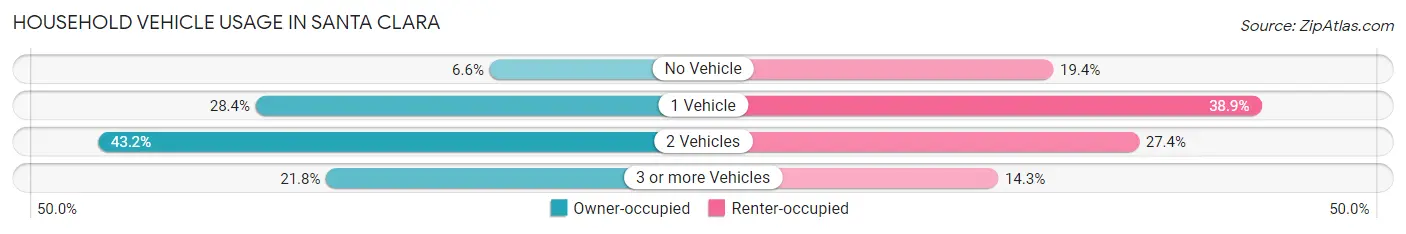
| Vehicles per Household | Owner-occupied | Renter-occupied |
| No Vehicle | 25 (6.6%) | 34 (19.4%) |
| 1 Vehicle | 108 (28.4%) | 68 (38.9%) |
| 2 Vehicles | 164 (43.2%) | 48 (27.4%) |
| 3 or more Vehicles | 83 (21.8%) | 25 (14.3%) |
| Total | 380 (100.0%) | 175 (100.0%) |
Real Estate & Mortgages in Santa Clara
Real Estate and Mortgage Overview in Santa Clara
| Characteristic | Without Mortgage | With Mortgage |
| Housing Units | 208 | 172 |
| Median Property Value | $98,600 | $119,800 |
| Median Household Income | $50,096 | $13 |
| Monthly Housing Costs | $266 | $0 |
| Real Estate Taxes | $391 | $0 |
Property Value by Mortgage Status in Santa Clara
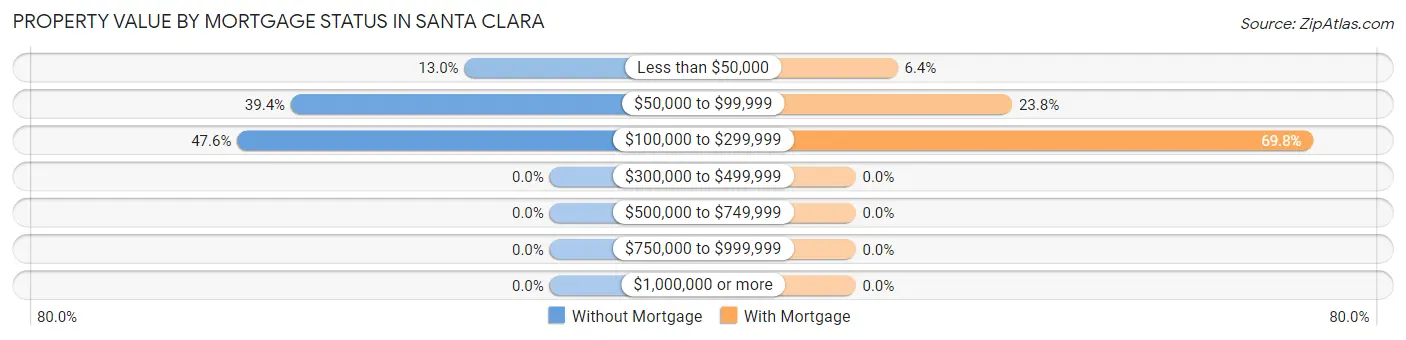
| Property Value | Without Mortgage | With Mortgage |
| Less than $50,000 | 27 (13.0%) | 11 (6.4%) |
| $50,000 to $99,999 | 82 (39.4%) | 41 (23.8%) |
| $100,000 to $299,999 | 99 (47.6%) | 120 (69.8%) |
| $300,000 to $499,999 | 0 (0.0%) | 0 (0.0%) |
| $500,000 to $749,999 | 0 (0.0%) | 0 (0.0%) |
| $750,000 to $999,999 | 0 (0.0%) | 0 (0.0%) |
| $1,000,000 or more | 0 (0.0%) | 0 (0.0%) |
| Total | 208 (100.0%) | 172 (100.0%) |
Household Income by Mortgage Status in Santa Clara
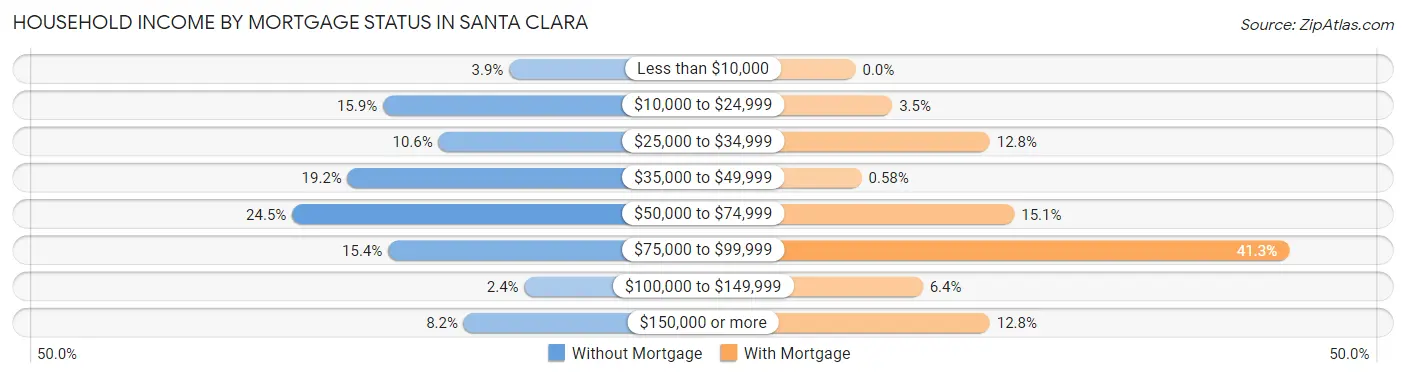
| Household Income | Without Mortgage | With Mortgage |
| Less than $10,000 | 8 (3.8%) | 0 (0.0%) |
| $10,000 to $24,999 | 33 (15.9%) | 6 (3.5%) |
| $25,000 to $34,999 | 22 (10.6%) | 22 (12.8%) |
| $35,000 to $49,999 | 40 (19.2%) | 1 (0.6%) |
| $50,000 to $74,999 | 51 (24.5%) | 26 (15.1%) |
| $75,000 to $99,999 | 32 (15.4%) | 71 (41.3%) |
| $100,000 to $149,999 | 5 (2.4%) | 11 (6.4%) |
| $150,000 or more | 17 (8.2%) | 22 (12.8%) |
| Total | 208 (100.0%) | 172 (100.0%) |
Property Value to Household Income Ratio in Santa Clara
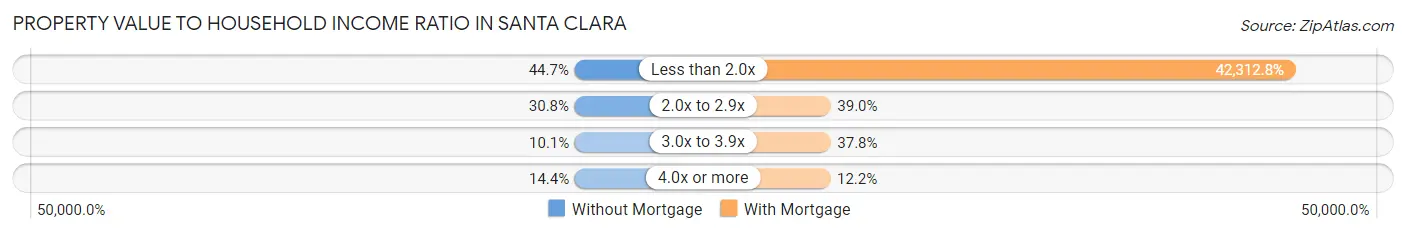
| Value-to-Income Ratio | Without Mortgage | With Mortgage |
| Less than 2.0x | 93 (44.7%) | 72,778 (42,312.8%) |
| 2.0x to 2.9x | 64 (30.8%) | 67 (39.0%) |
| 3.0x to 3.9x | 21 (10.1%) | 65 (37.8%) |
| 4.0x or more | 30 (14.4%) | 21 (12.2%) |
| Total | 208 (100.0%) | 172 (100.0%) |
Real Estate Taxes by Mortgage Status in Santa Clara
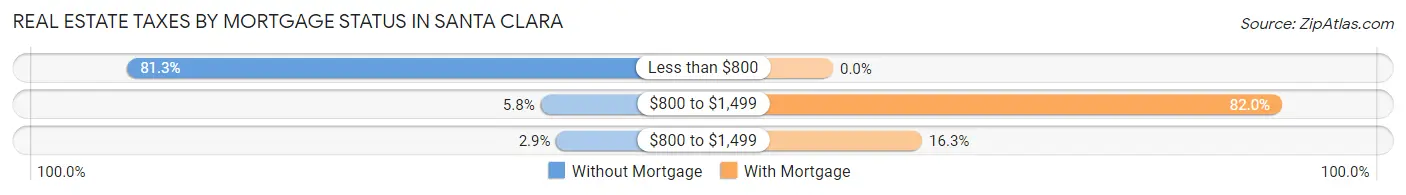
| Property Taxes | Without Mortgage | With Mortgage |
| Less than $800 | 169 (81.2%) | 0 (0.0%) |
| $800 to $1,499 | 12 (5.8%) | 141 (82.0%) |
| $800 to $1,499 | 6 (2.9%) | 28 (16.3%) |
| Total | 208 (100.0%) | 172 (100.0%) |
Health & Disability in Santa Clara
Health Insurance Coverage by Age in Santa Clara
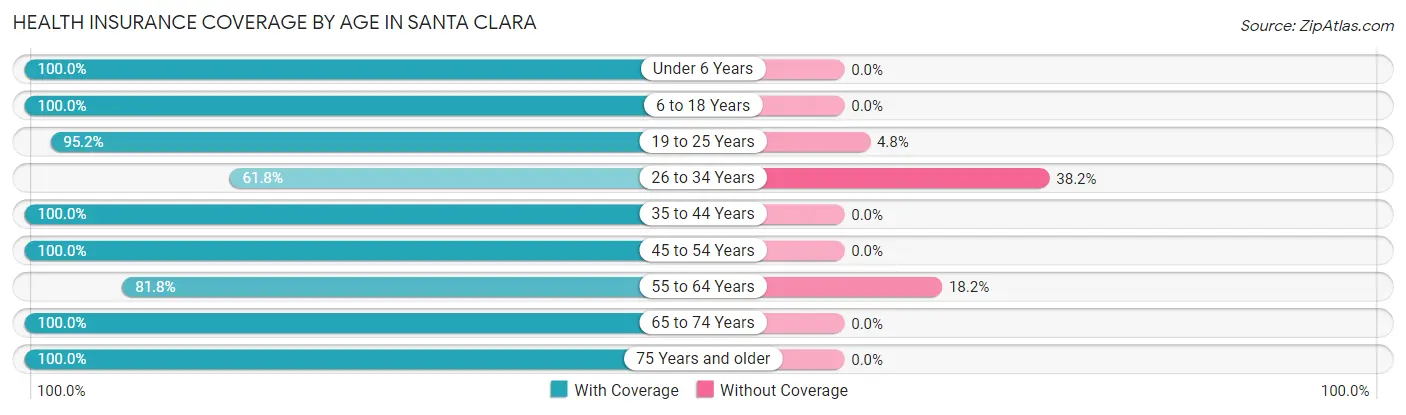
| Age Bracket | With Coverage | Without Coverage |
| Under 6 Years | 161 (100.0%) | 0 (0.0%) |
| 6 to 18 Years | 262 (100.0%) | 0 (0.0%) |
| 19 to 25 Years | 139 (95.2%) | 7 (4.8%) |
| 26 to 34 Years | 42 (61.8%) | 26 (38.2%) |
| 35 to 44 Years | 237 (100.0%) | 0 (0.0%) |
| 45 to 54 Years | 122 (100.0%) | 0 (0.0%) |
| 55 to 64 Years | 202 (81.8%) | 45 (18.2%) |
| 65 to 74 Years | 186 (100.0%) | 0 (0.0%) |
| 75 Years and older | 181 (100.0%) | 0 (0.0%) |
| Total | 1,532 (95.2%) | 78 (4.8%) |
Health Insurance Coverage by Citizenship Status in Santa Clara
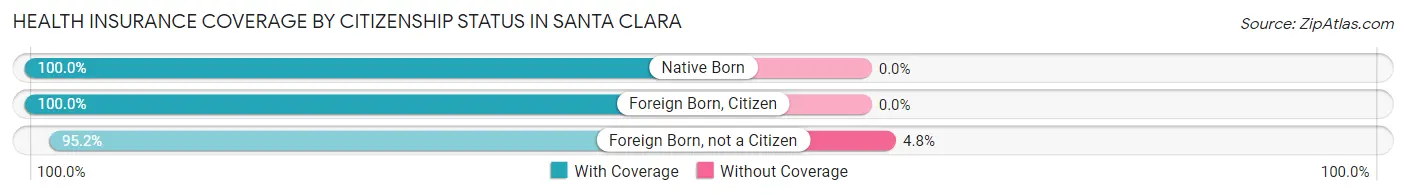
| Citizenship Status | With Coverage | Without Coverage |
| Native Born | 161 (100.0%) | 0 (0.0%) |
| Foreign Born, Citizen | 262 (100.0%) | 0 (0.0%) |
| Foreign Born, not a Citizen | 139 (95.2%) | 7 (4.8%) |
Health Insurance Coverage by Household Income in Santa Clara
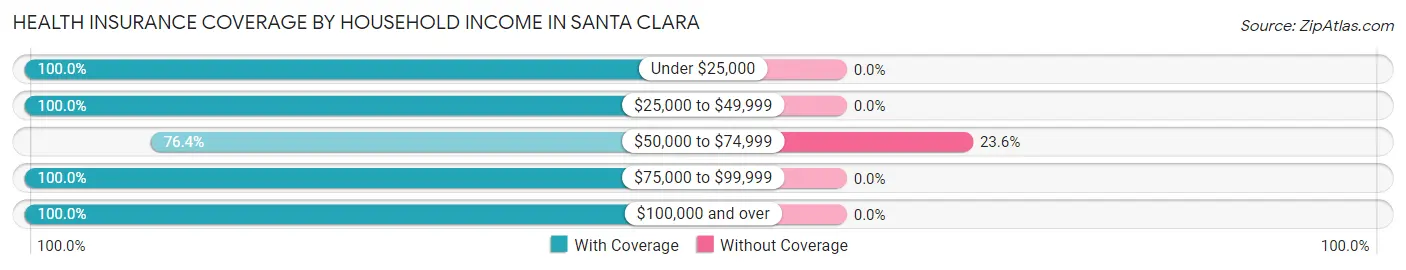
| Household Income | With Coverage | Without Coverage |
| Under $25,000 | 355 (100.0%) | 0 (0.0%) |
| $25,000 to $49,999 | 525 (100.0%) | 0 (0.0%) |
| $50,000 to $74,999 | 252 (76.4%) | 78 (23.6%) |
| $75,000 to $99,999 | 156 (100.0%) | 0 (0.0%) |
| $100,000 and over | 244 (100.0%) | 0 (0.0%) |
Public vs Private Health Insurance Coverage by Age in Santa Clara
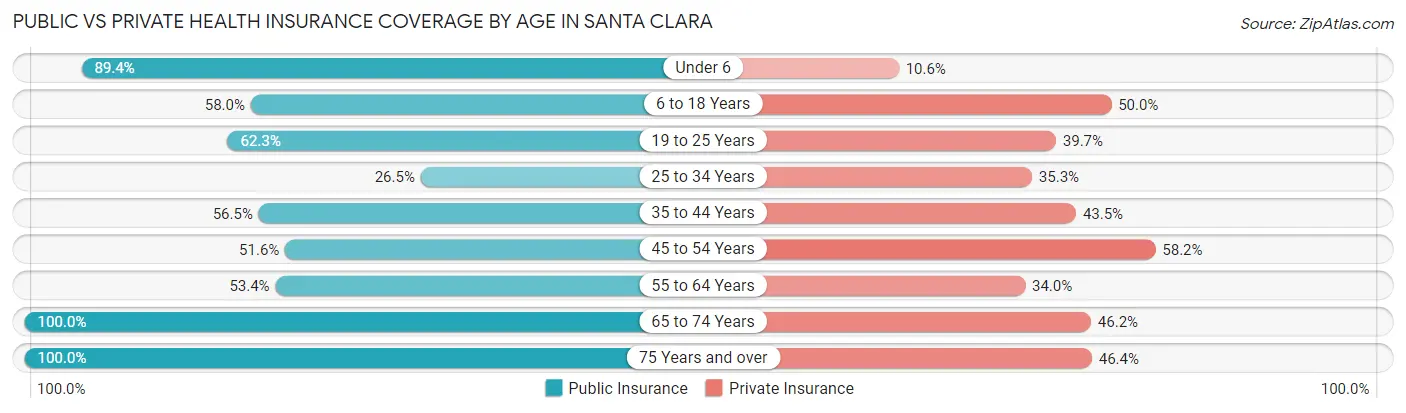
| Age Bracket | Public Insurance | Private Insurance |
| Under 6 | 144 (89.4%) | 17 (10.6%) |
| 6 to 18 Years | 152 (58.0%) | 131 (50.0%) |
| 19 to 25 Years | 91 (62.3%) | 58 (39.7%) |
| 25 to 34 Years | 18 (26.5%) | 24 (35.3%) |
| 35 to 44 Years | 134 (56.5%) | 103 (43.5%) |
| 45 to 54 Years | 63 (51.6%) | 71 (58.2%) |
| 55 to 64 Years | 132 (53.4%) | 84 (34.0%) |
| 65 to 74 Years | 186 (100.0%) | 86 (46.2%) |
| 75 Years and over | 181 (100.0%) | 84 (46.4%) |
| Total | 1,101 (68.4%) | 658 (40.9%) |
Disability Status by Sex by Age in Santa Clara
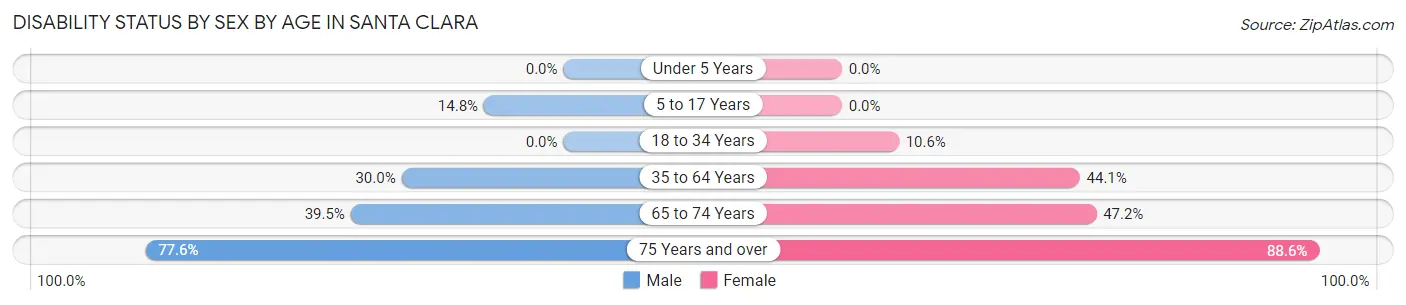
| Age Bracket | Male | Female |
| Under 5 Years | 0 (0.0%) | 0 (0.0%) |
| 5 to 17 Years | 9 (14.7%) | 0 (0.0%) |
| 18 to 34 Years | 0 (0.0%) | 15 (10.6%) |
| 35 to 64 Years | 82 (30.0%) | 147 (44.1%) |
| 65 to 74 Years | 45 (39.5%) | 34 (47.2%) |
| 75 Years and over | 52 (77.6%) | 101 (88.6%) |
Disability Class by Sex by Age in Santa Clara
Disability Class: Hearing Difficulty
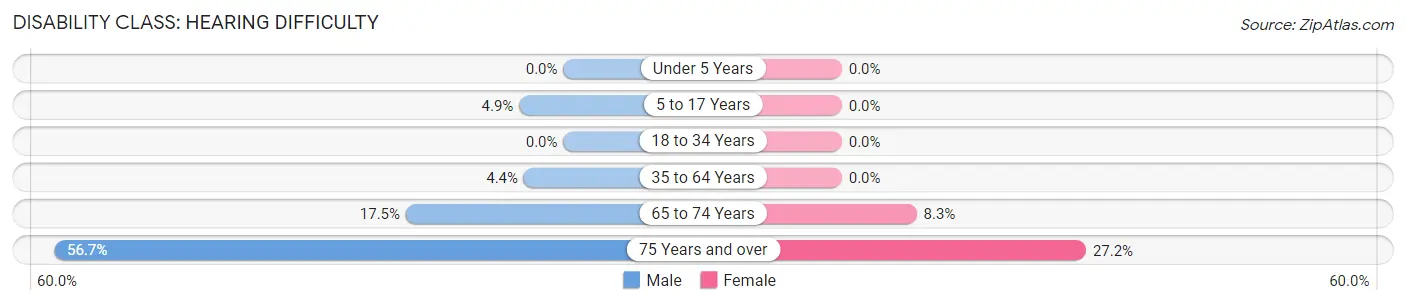
| Age Bracket | Male | Female |
| Under 5 Years | 0 (0.0%) | 0 (0.0%) |
| 5 to 17 Years | 3 (4.9%) | 0 (0.0%) |
| 18 to 34 Years | 0 (0.0%) | 0 (0.0%) |
| 35 to 64 Years | 12 (4.4%) | 0 (0.0%) |
| 65 to 74 Years | 20 (17.5%) | 6 (8.3%) |
| 75 Years and over | 38 (56.7%) | 31 (27.2%) |
Disability Class: Vision Difficulty
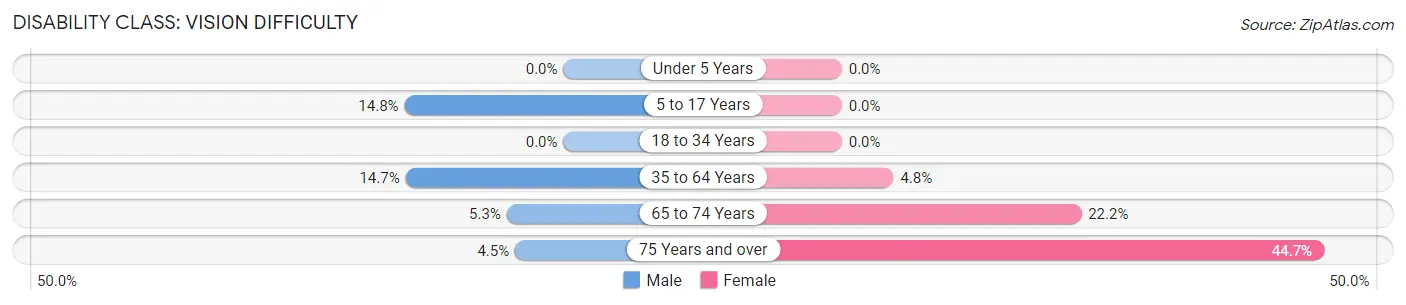
| Age Bracket | Male | Female |
| Under 5 Years | 0 (0.0%) | 0 (0.0%) |
| 5 to 17 Years | 9 (14.7%) | 0 (0.0%) |
| 18 to 34 Years | 0 (0.0%) | 0 (0.0%) |
| 35 to 64 Years | 40 (14.6%) | 16 (4.8%) |
| 65 to 74 Years | 6 (5.3%) | 16 (22.2%) |
| 75 Years and over | 3 (4.5%) | 51 (44.7%) |
Disability Class: Cognitive Difficulty
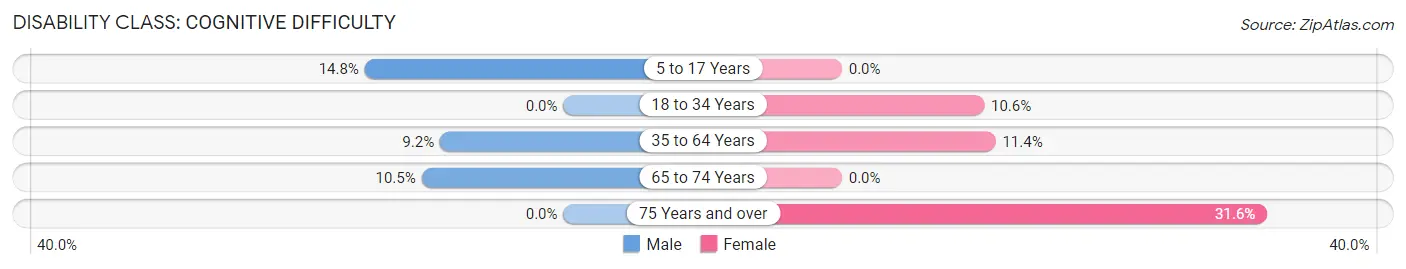
| Age Bracket | Male | Female |
| 5 to 17 Years | 9 (14.7%) | 0 (0.0%) |
| 18 to 34 Years | 0 (0.0%) | 15 (10.6%) |
| 35 to 64 Years | 25 (9.2%) | 38 (11.4%) |
| 65 to 74 Years | 12 (10.5%) | 0 (0.0%) |
| 75 Years and over | 0 (0.0%) | 36 (31.6%) |
Disability Class: Ambulatory Difficulty
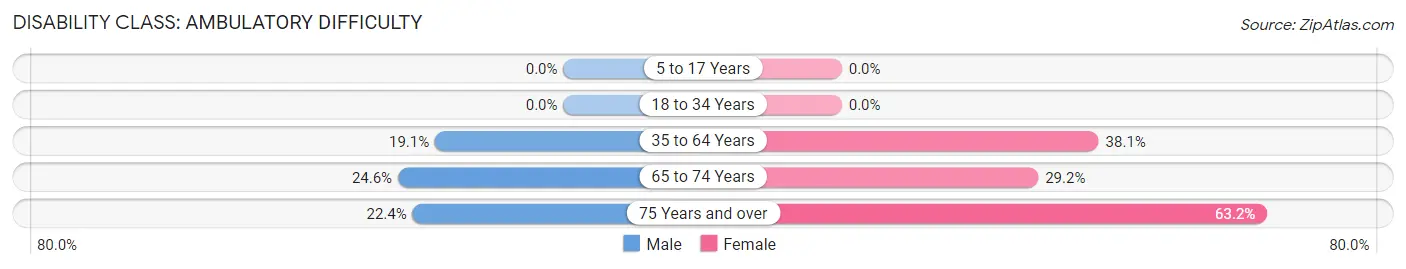
| Age Bracket | Male | Female |
| 5 to 17 Years | 0 (0.0%) | 0 (0.0%) |
| 18 to 34 Years | 0 (0.0%) | 0 (0.0%) |
| 35 to 64 Years | 52 (19.1%) | 127 (38.1%) |
| 65 to 74 Years | 28 (24.6%) | 21 (29.2%) |
| 75 Years and over | 15 (22.4%) | 72 (63.2%) |
Disability Class: Self-Care Difficulty
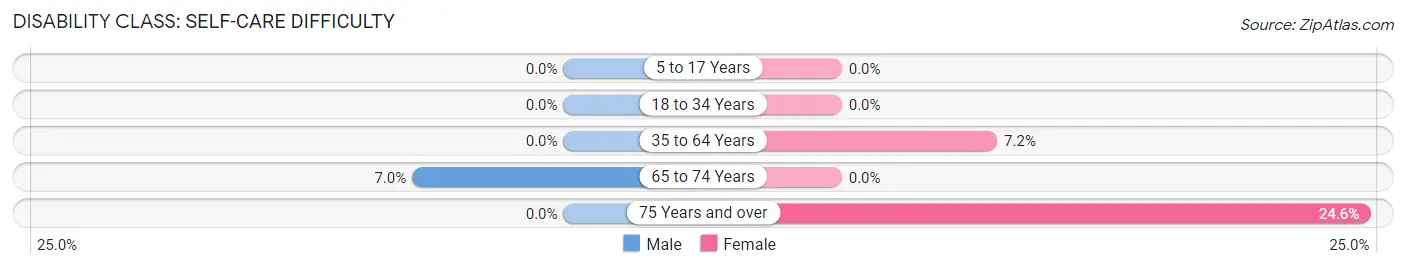
| Age Bracket | Male | Female |
| 5 to 17 Years | 0 (0.0%) | 0 (0.0%) |
| 18 to 34 Years | 0 (0.0%) | 0 (0.0%) |
| 35 to 64 Years | 0 (0.0%) | 24 (7.2%) |
| 65 to 74 Years | 8 (7.0%) | 0 (0.0%) |
| 75 Years and over | 0 (0.0%) | 28 (24.6%) |
Technology Access in Santa Clara
Computing Device Access in Santa Clara
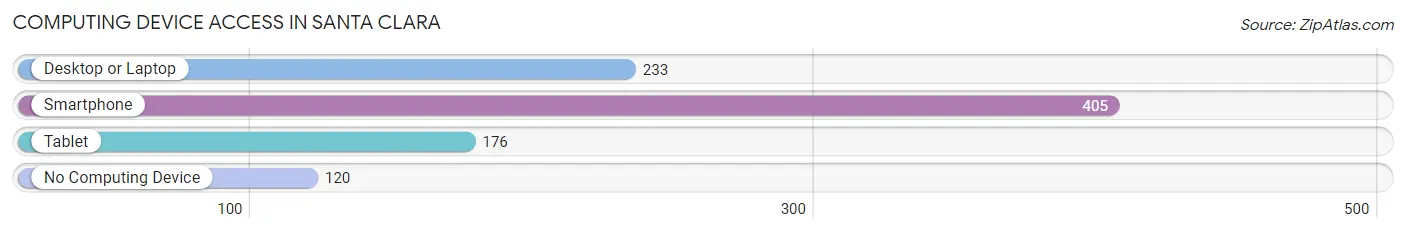
| Device Type | # Households | % Households |
| Desktop or Laptop | 233 | 42.0% |
| Smartphone | 405 | 73.0% |
| Tablet | 176 | 31.7% |
| No Computing Device | 120 | 21.6% |
| Total | 555 | 100.0% |
Internet Access in Santa Clara
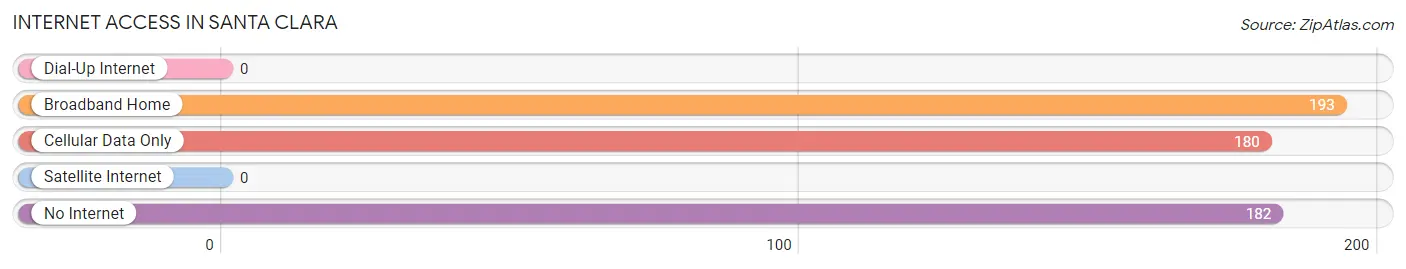
| Internet Type | # Households | % Households |
| Dial-Up Internet | 0 | 0.0% |
| Broadband Home | 193 | 34.8% |
| Cellular Data Only | 180 | 32.4% |
| Satellite Internet | 0 | 0.0% |
| No Internet | 182 | 32.8% |
| Total | 555 | 100.0% |
Santa Clara Summary
Santa Clara, New Mexico is a small village located in the northern part of the state, in the county of Rio Arriba. It is situated in the foothills of the Sangre de Cristo Mountains, and is surrounded by the Santa Clara Pueblo, the San Juan Pueblo, and the Jicarilla Apache Reservation. The village is located about 25 miles north of Española, and about 50 miles north of Santa Fe.
History
Santa Clara was founded in 1776 by Spanish settlers, who named it after Saint Clare of Assisi. The village was originally part of the Santa Clara Pueblo, and was used as a trading post for the Puebloans. In 1821, the village was annexed by Mexico, and in 1848, it became part of the United States.
In the late 19th century, the village was a popular stop for travelers on the Santa Fe Trail. The village was also home to a number of businesses, including a hotel, a general store, and a post office.
In the early 20th century, the village was home to a number of small farms and ranches. The village was also home to a number of small businesses, including a blacksmith shop, a barber shop, and a livery stable.
Geography
Santa Clara is located in the northern part of New Mexico, in the county of Rio Arriba. It is situated in the foothills of the Sangre de Cristo Mountains, and is surrounded by the Santa Clara Pueblo, the San Juan Pueblo, and the Jicarilla Apache Reservation. The village is located about 25 miles north of Española, and about 50 miles north of Santa Fe.
The village is situated at an elevation of 6,000 feet, and has a total area of 0.6 square miles. The climate is semi-arid, with hot summers and cold winters. The average annual precipitation is about 12 inches.
Economy
The economy of Santa Clara is largely based on agriculture and tourism. The village is home to a number of small farms and ranches, which produce a variety of crops, including corn, beans, squash, and melons. The village is also home to a number of small businesses, including a blacksmith shop, a barber shop, and a livery stable.
Tourism is an important part of the local economy. The village is home to a number of historic sites, including the Santa Clara Mission, the Santa Clara Pueblo, and the San Juan Pueblo. The village is also home to a number of outdoor recreation areas, including the Santa Clara Wildlife Refuge and the Santa Clara River.
Demographics
As of the 2010 census, the population of Santa Clara was 1,788. The racial makeup of the village was 73.3% White, 0.7% African American, 0.9% Native American, 0.2% Asian, 0.1% Pacific Islander, 22.2% from other races, and 2.7% from two or more races. Hispanic or Latino of any race were 44.3% of the population.
The median household income in Santa Clara was $25,938, and the median family income was $30,938. The per capita income was $13,938. About 24.3% of the population was below the poverty line.
Common Questions
What is Per Capita Income in Santa Clara?
Per Capita income in Santa Clara is $21,344.
What is the Median Family Income in Santa Clara?
Median Family Income in Santa Clara is $62,500.
What is the Median Household income in Santa Clara?
Median Household Income in Santa Clara is $46,078.
What is Income or Wage Gap in Santa Clara?
Income or Wage Gap in Santa Clara is 33.6%.
Women in Santa Clara earn 66.4 cents for every dollar earned by a man.
What is Inequality or Gini Index in Santa Clara?
Inequality or Gini Index in Santa Clara is 0.43.
What is the Total Population of Santa Clara?
Total Population of Santa Clara is 1,744.
What is the Total Male Population of Santa Clara?
Total Male Population of Santa Clara is 757.
What is the Total Female Population of Santa Clara?
Total Female Population of Santa Clara is 987.
What is the Ratio of Males per 100 Females in Santa Clara?
There are 76.70 Males per 100 Females in Santa Clara.
What is the Ratio of Females per 100 Males in Santa Clara?
There are 130.38 Females per 100 Males in Santa Clara.
What is the Median Population Age in Santa Clara?
Median Population Age in Santa Clara is 44.9 Years.
What is the Average Family Size in Santa Clara
Average Family Size in Santa Clara is 3.5 People.
What is the Average Household Size in Santa Clara
Average Household Size in Santa Clara is 2.9 People.
How Large is the Labor Force in Santa Clara?
There are 550 People in the Labor Forcein in Santa Clara.
What is the Percentage of People in the Labor Force in Santa Clara?
38.5% of People are in the Labor Force in Santa Clara.
What is the Unemployment Rate in Santa Clara?
Unemployment Rate in Santa Clara is 5.6%.