Harlem Heights, FL Map & Demographics
Harlem Heights Map
Harlem Heights Overview
$18,538
PER CAPITA INCOME
$37,806
AVG FAMILY INCOME
$29,878
AVG HOUSEHOLD INCOME
1.2%
WAGE / INCOME GAP [ % ]
98.8¢/ $1
WAGE / INCOME GAP [ $ ]
0.36
INEQUALITY / GINI INDEX
1,694
TOTAL POPULATION
861
MALE POPULATION
833
FEMALE POPULATION
103.36
MALES / 100 FEMALES
96.75
FEMALES / 100 MALES
26.5
MEDIAN AGE
4.1
AVG FAMILY SIZE
3.0
AVG HOUSEHOLD SIZE
712
LABOR FORCE [ PEOPLE ]
52.9%
PERCENT IN LABOR FORCE
16.6%
UNEMPLOYMENT RATE
Income in Harlem Heights
Income Overview in Harlem Heights
Per Capita Income in Harlem Heights is $18,538, while median incomes of families and households are $37,806 and $29,878 respectively.
| Characteristic | Number | Measure |
| Per Capita Income | 1,694 | $18,538 |
| Median Family Income | 349 | $37,806 |
| Mean Family Income | 349 | $44,643 |
| Median Household Income | 562 | $29,878 |
| Mean Household Income | 562 | $52,609 |
| Income Deficit | 349 | $0 |
| Wage / Income Gap (%) | 1,694 | 1.18% |
| Wage / Income Gap ($) | 1,694 | 98.82¢ per $1 |
| Gini / Inequality Index | 1,694 | 0.36 |
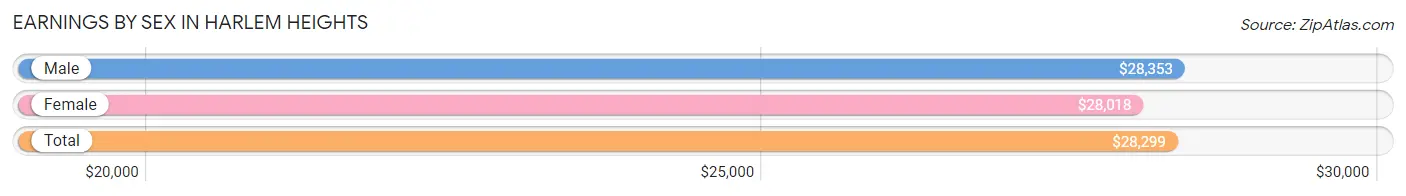
Earnings by Sex in Harlem Heights
Average Earnings in Harlem Heights are $28,299, $28,353 for men and $28,018 for women, a difference of 1.2%.
| Sex | Number | Average Earnings |
| Male | 404 (57.1%) | $28,353 |
| Female | 303 (42.9%) | $28,018 |
| Total | 707 (100.0%) | $28,299 |
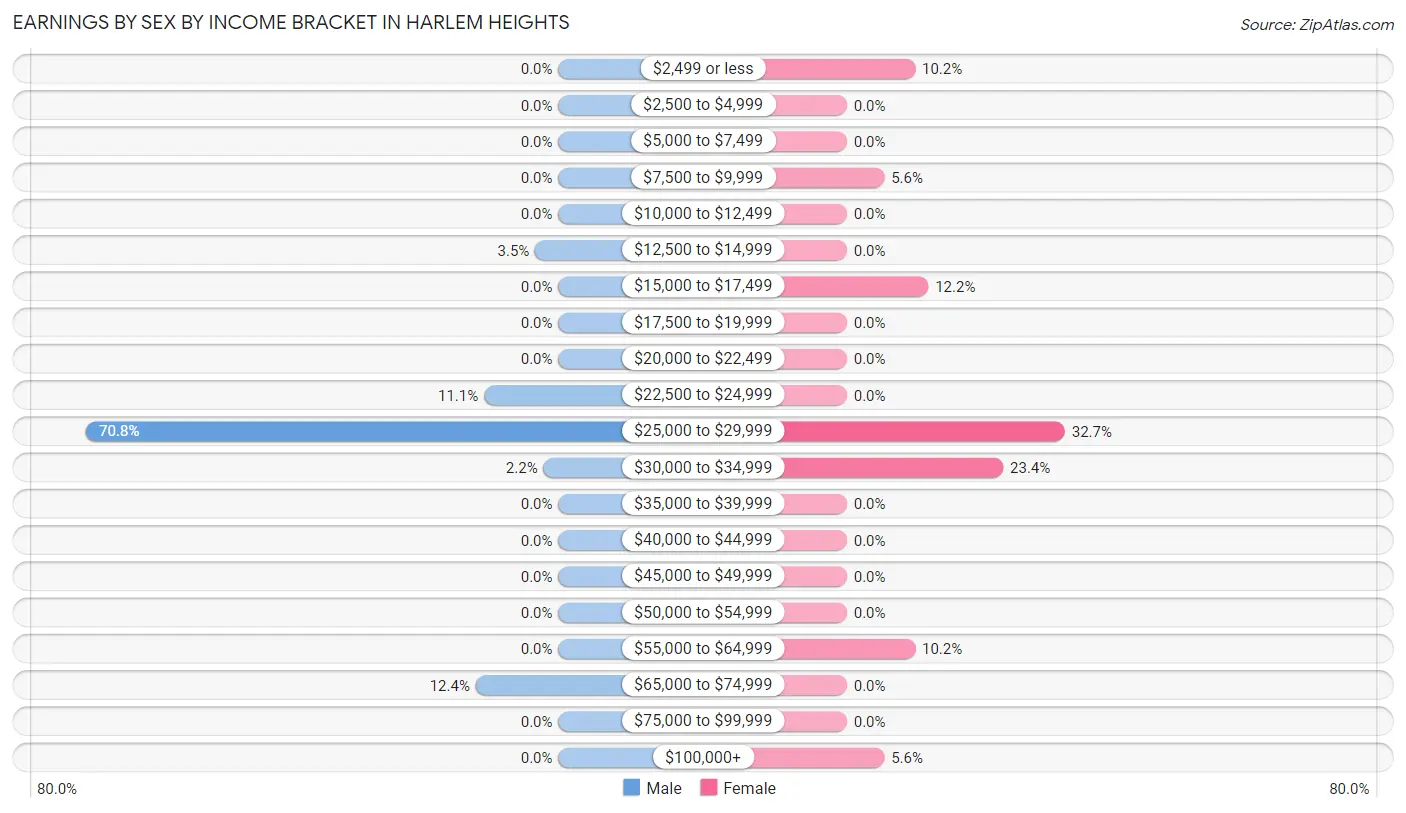
Earnings by Sex by Income Bracket in Harlem Heights
The most common earnings brackets in Harlem Heights are $25,000 to $29,999 for men (286 | 70.8%) and $25,000 to $29,999 for women (99 | 32.7%).
| Income | Male | Female |
| $2,499 or less | 0 (0.0%) | 31 (10.2%) |
| $2,500 to $4,999 | 0 (0.0%) | 0 (0.0%) |
| $5,000 to $7,499 | 0 (0.0%) | 0 (0.0%) |
| $7,500 to $9,999 | 0 (0.0%) | 17 (5.6%) |
| $10,000 to $12,499 | 0 (0.0%) | 0 (0.0%) |
| $12,500 to $14,999 | 14 (3.5%) | 0 (0.0%) |
| $15,000 to $17,499 | 0 (0.0%) | 37 (12.2%) |
| $17,500 to $19,999 | 0 (0.0%) | 0 (0.0%) |
| $20,000 to $22,499 | 0 (0.0%) | 0 (0.0%) |
| $22,500 to $24,999 | 45 (11.1%) | 0 (0.0%) |
| $25,000 to $29,999 | 286 (70.8%) | 99 (32.7%) |
| $30,000 to $34,999 | 9 (2.2%) | 71 (23.4%) |
| $35,000 to $39,999 | 0 (0.0%) | 0 (0.0%) |
| $40,000 to $44,999 | 0 (0.0%) | 0 (0.0%) |
| $45,000 to $49,999 | 0 (0.0%) | 0 (0.0%) |
| $50,000 to $54,999 | 0 (0.0%) | 0 (0.0%) |
| $55,000 to $64,999 | 0 (0.0%) | 31 (10.2%) |
| $65,000 to $74,999 | 50 (12.4%) | 0 (0.0%) |
| $75,000 to $99,999 | 0 (0.0%) | 0 (0.0%) |
| $100,000+ | 0 (0.0%) | 17 (5.6%) |
| Total | 404 (100.0%) | 303 (100.0%) |
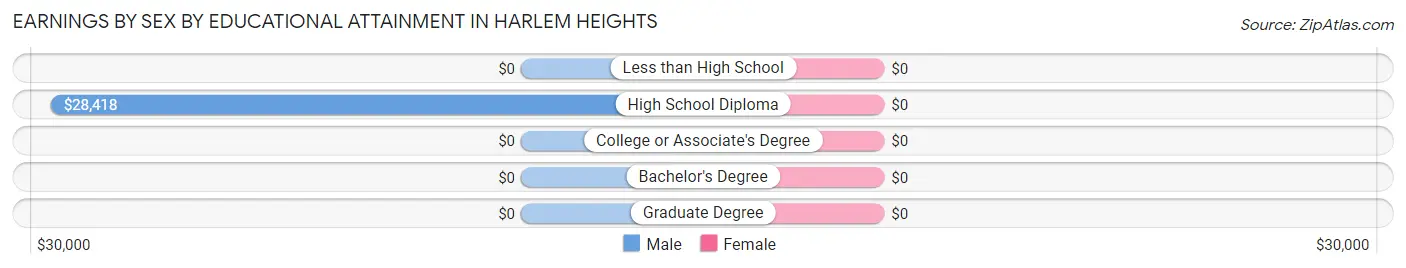
Earnings by Sex by Educational Attainment in Harlem Heights
| Educational Attainment | Male Income | Female Income |
| Less than High School | - | - |
| High School Diploma | $28,418 | $0 |
| College or Associate's Degree | - | - |
| Bachelor's Degree | - | - |
| Graduate Degree | - | - |
| Total | $28,433 | $27,561 |
Family Income in Harlem Heights
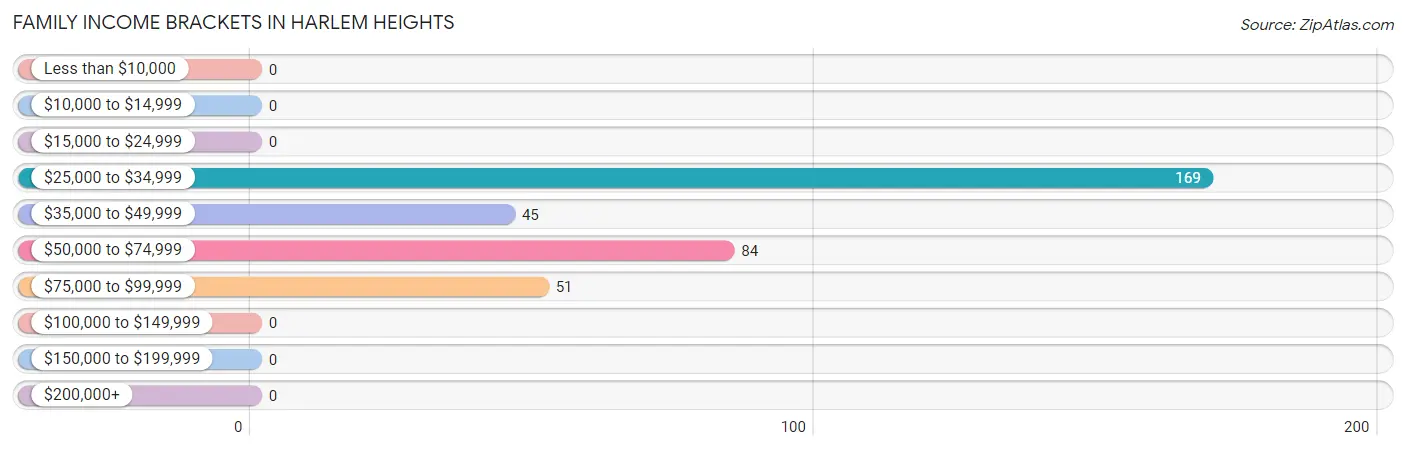
Family Income Brackets in Harlem Heights
According to the Harlem Heights family income data, there are 169 families falling into the $25,000 to $34,999 income range, which is the most common income bracket and makes up 48.4% of all families.
| Income Bracket | # Families | % Families |
| Less than $10,000 | 0 | 0.0% |
| $10,000 to $14,999 | 0 | 0.0% |
| $15,000 to $24,999 | 0 | 0.0% |
| $25,000 to $34,999 | 169 | 48.4% |
| $35,000 to $49,999 | 45 | 12.9% |
| $50,000 to $74,999 | 84 | 24.1% |
| $75,000 to $99,999 | 51 | 14.6% |
| $100,000 to $149,999 | 0 | 0.0% |
| $150,000 to $199,999 | 0 | 0.0% |
| $200,000+ | 0 | 0.0% |
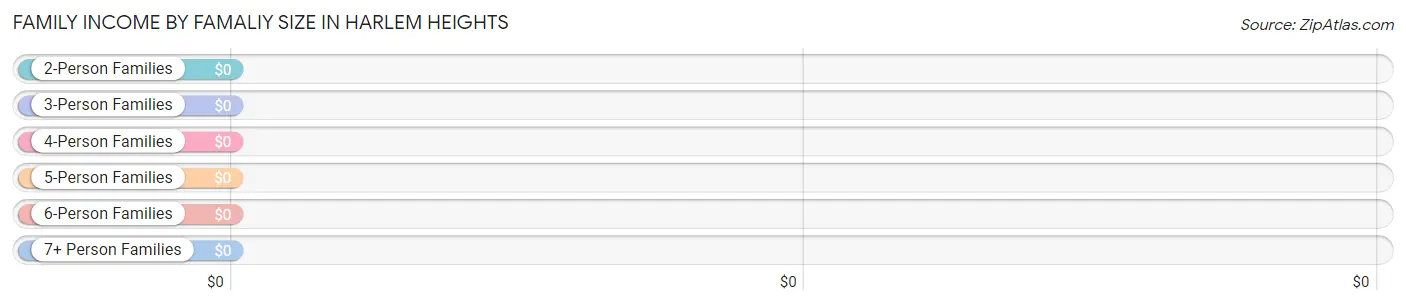
Family Income by Famaliy Size in Harlem Heights
| Income Bracket | # Families | Median Income |
| 2-Person Families | 84 (24.1%) | $0 |
| 3-Person Families | 68 (19.5%) | $0 |
| 4-Person Families | 41 (11.7%) | $0 |
| 5-Person Families | 156 (44.7%) | $0 |
| 6-Person Families | 0 (0.0%) | $0 |
| 7+ Person Families | 0 (0.0%) | $0 |
| Total | 349 (100.0%) | $37,806 |
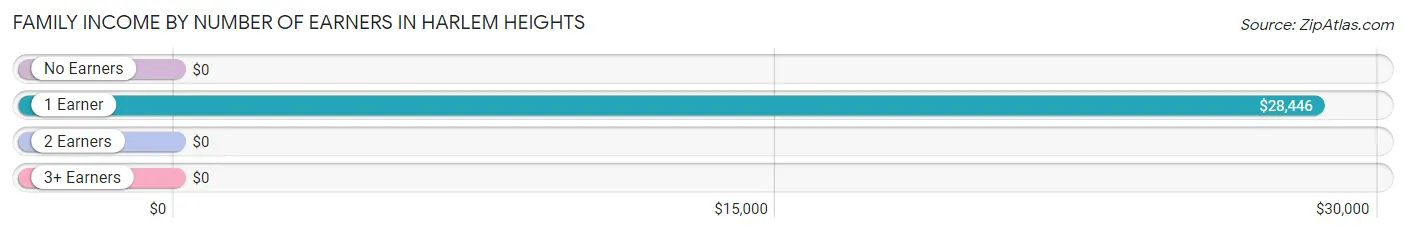
Family Income by Number of Earners in Harlem Heights
| Number of Earners | # Families | Median Income |
| No Earners | 53 (15.2%) | $0 |
| 1 Earner | 200 (57.3%) | $28,446 |
| 2 Earners | 45 (12.9%) | $0 |
| 3+ Earners | 51 (14.6%) | $0 |
| Total | 349 (100.0%) | $37,806 |
Household Income in Harlem Heights
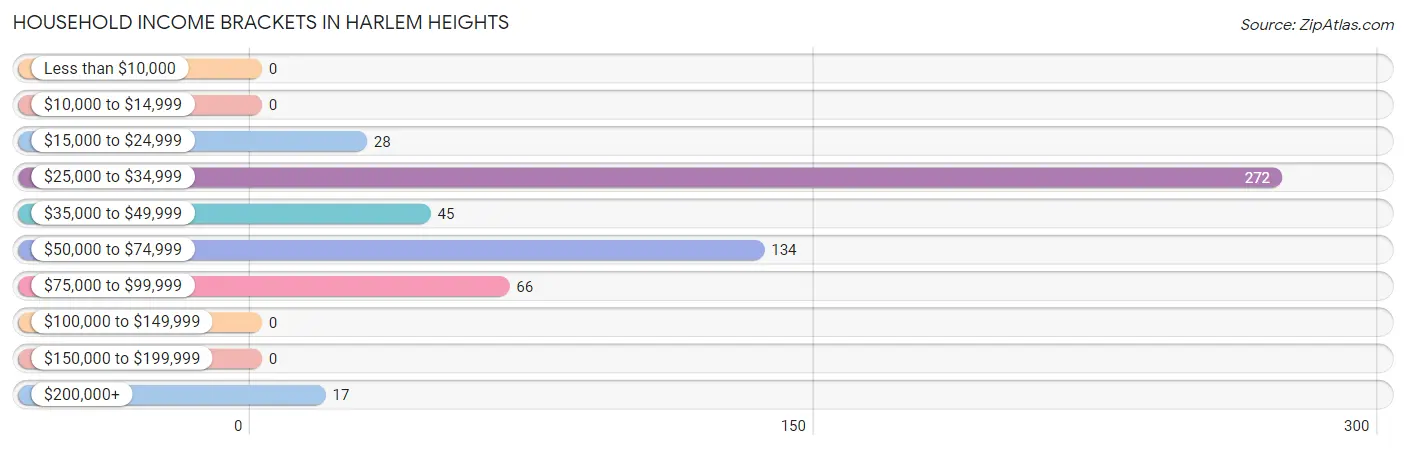
Household Income Brackets in Harlem Heights
With 272 households falling in the category, the $25,000 to $34,999 income range is the most frequent in Harlem Heights, accounting for 48.4% of all households.
| Income Bracket | # Households | % Households |
| Less than $10,000 | 0 | 0.0% |
| $10,000 to $14,999 | 0 | 0.0% |
| $15,000 to $24,999 | 28 | 5.0% |
| $25,000 to $34,999 | 272 | 48.4% |
| $35,000 to $49,999 | 45 | 8.0% |
| $50,000 to $74,999 | 134 | 23.8% |
| $75,000 to $99,999 | 66 | 11.7% |
| $100,000 to $149,999 | 0 | 0.0% |
| $150,000 to $199,999 | 0 | 0.0% |
| $200,000+ | 17 | 3.0% |
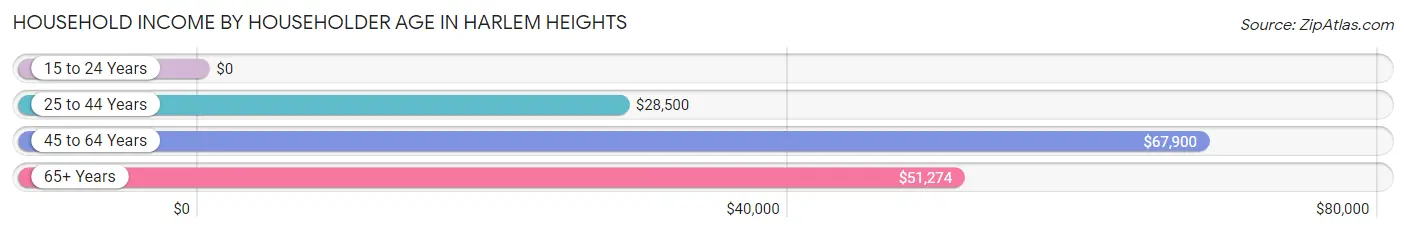
Household Income by Householder Age in Harlem Heights
The median household income in Harlem Heights is $29,878, with the highest median household income of $67,900 found in the 45 to 64 years age bracket for the primary householder. A total of 186 households (33.1%) fall into this category. Meanwhile, the 15 to 24 years age bracket for the primary householder has the lowest median household income of $0, with 14 households (2.5%) in this group.
| Income Bracket | # Households | Median Income |
| 15 to 24 Years | 14 (2.5%) | $0 |
| 25 to 44 Years | 280 (49.8%) | $28,500 |
| 45 to 64 Years | 186 (33.1%) | $67,900 |
| 65+ Years | 82 (14.6%) | $51,274 |
| Total | 562 (100.0%) | $29,878 |
Poverty in Harlem Heights
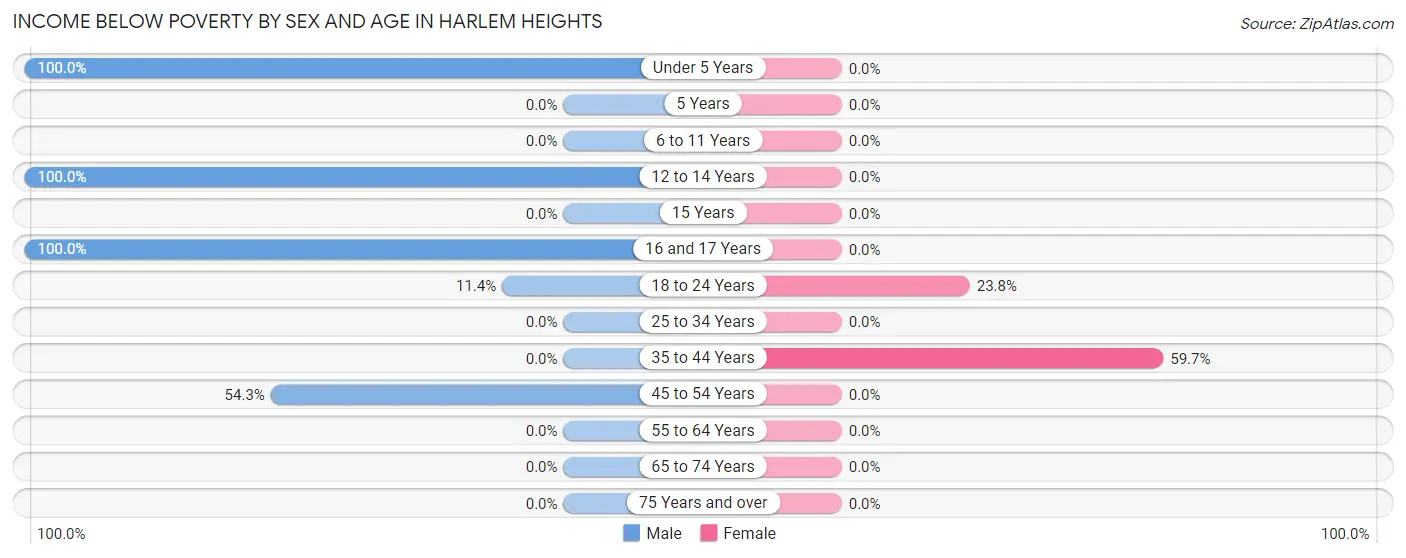
Income Below Poverty by Sex and Age in Harlem Heights
With 53.4% poverty level for males and 19.1% for females among the residents of Harlem Heights, under 5 year old males and 35 to 44 year old females are the most vulnerable to poverty, with 114 males (100.0%) and 111 females (59.7%) in their respective age groups living below the poverty level.
| Age Bracket | Male | Female |
| Under 5 Years | 114 (100.0%) | 0 (0.0%) |
| 5 Years | 0 (0.0%) | 0 (0.0%) |
| 6 to 11 Years | 0 (0.0%) | 0 (0.0%) |
| 12 to 14 Years | 117 (100.0%) | 0 (0.0%) |
| 15 Years | 0 (0.0%) | 0 (0.0%) |
| 16 and 17 Years | 102 (100.0%) | 0 (0.0%) |
| 18 to 24 Years | 14 (11.4%) | 48 (23.8%) |
| 25 to 34 Years | 0 (0.0%) | 0 (0.0%) |
| 35 to 44 Years | 0 (0.0%) | 111 (59.7%) |
| 45 to 54 Years | 113 (54.3%) | 0 (0.0%) |
| 55 to 64 Years | 0 (0.0%) | 0 (0.0%) |
| 65 to 74 Years | 0 (0.0%) | 0 (0.0%) |
| 75 Years and over | 0 (0.0%) | 0 (0.0%) |
| Total | 460 (53.4%) | 159 (19.1%) |
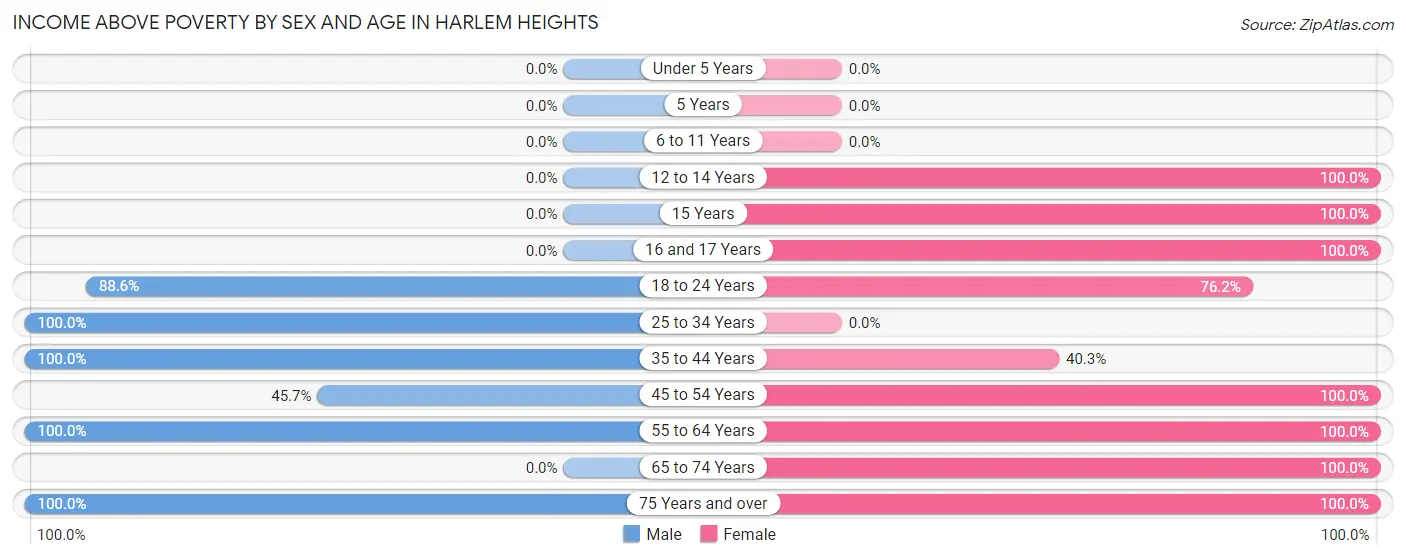
Income Above Poverty by Sex and Age in Harlem Heights
According to the poverty statistics in Harlem Heights, males aged 25 to 34 years and females aged 12 to 14 years are the age groups that are most secure financially, with 100.0% of males and 100.0% of females in these age groups living above the poverty line.
| Age Bracket | Male | Female |
| Under 5 Years | 0 (0.0%) | 0 (0.0%) |
| 5 Years | 0 (0.0%) | 0 (0.0%) |
| 6 to 11 Years | 0 (0.0%) | 0 (0.0%) |
| 12 to 14 Years | 0 (0.0%) | 77 (100.0%) |
| 15 Years | 0 (0.0%) | 41 (100.0%) |
| 16 and 17 Years | 0 (0.0%) | 37 (100.0%) |
| 18 to 24 Years | 109 (88.6%) | 154 (76.2%) |
| 25 to 34 Years | 69 (100.0%) | 0 (0.0%) |
| 35 to 44 Years | 94 (100.0%) | 75 (40.3%) |
| 45 to 54 Years | 95 (45.7%) | 109 (100.0%) |
| 55 to 64 Years | 19 (100.0%) | 8 (100.0%) |
| 65 to 74 Years | 0 (0.0%) | 159 (100.0%) |
| 75 Years and over | 15 (100.0%) | 14 (100.0%) |
| Total | 401 (46.6%) | 674 (80.9%) |
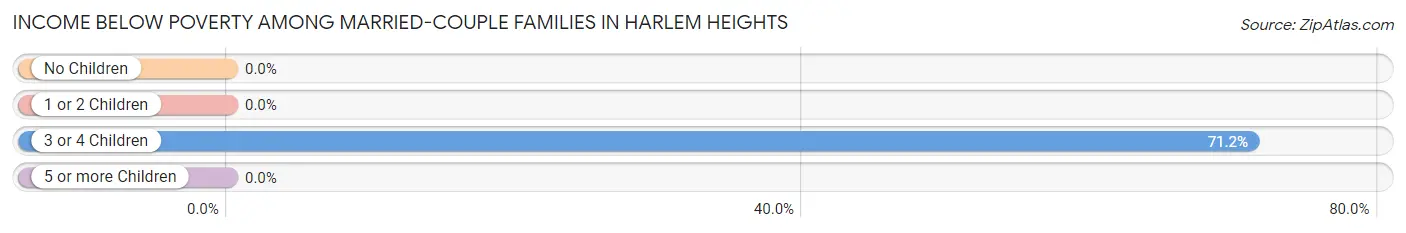
Income Below Poverty Among Married-Couple Families in Harlem Heights
The poverty statistics for married-couple families in Harlem Heights show that 66.9% or 111 of the total 166 families live below the poverty line. Families with 3 or 4 children have the highest poverty rate of 71.2%, comprising of 111 families. On the other hand, families with no children have the lowest poverty rate of 0.0%, which includes 0 families.
| Children | Above Poverty | Below Poverty |
| No Children | 10 (100.0%) | 0 (0.0%) |
| 1 or 2 Children | 0 (0.0%) | 0 (0.0%) |
| 3 or 4 Children | 45 (28.8%) | 111 (71.2%) |
| 5 or more Children | 0 (0.0%) | 0 (0.0%) |
| Total | 55 (33.1%) | 111 (66.9%) |
Income Below Poverty Among Single-Parent Households in Harlem Heights
| Children | Single Father | Single Mother |
| No Children | 0 (0.0%) | 0 (0.0%) |
| 1 or 2 Children | 0 (0.0%) | 0 (0.0%) |
| 3 or 4 Children | 0 (0.0%) | 0 (0.0%) |
| 5 or more Children | 0 (0.0%) | 0 (0.0%) |
| Total | 0 (0.0%) | 0 (0.0%) |
Income Below Poverty Among Married-Couple vs Single-Parent Households in Harlem Heights
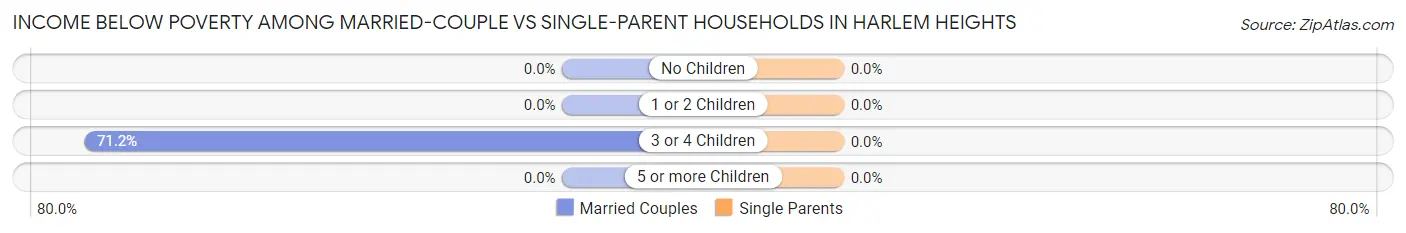
| Children | Married-Couple Families | Single-Parent Households |
| No Children | 0 (0.0%) | 0 (0.0%) |
| 1 or 2 Children | 0 (0.0%) | 0 (0.0%) |
| 3 or 4 Children | 111 (71.2%) | 0 (0.0%) |
| 5 or more Children | 0 (0.0%) | 0 (0.0%) |
| Total | 111 (66.9%) | 0 (0.0%) |
Race in Harlem Heights
The most populous races in Harlem Heights are Hispanic or Latino (1,376 | 81.2%), White / Caucasian (992 | 58.6%), and Some other Race (412 | 24.3%).
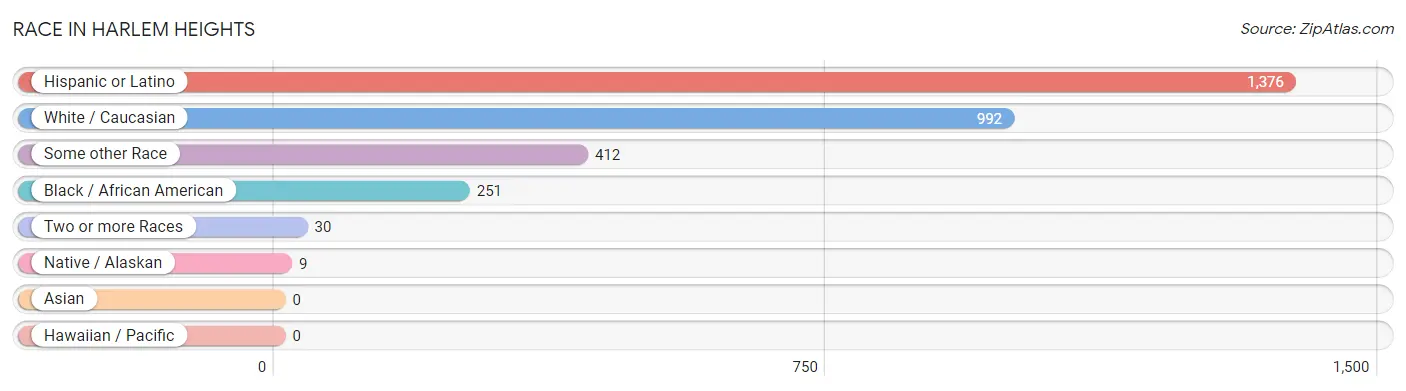
| Race | # Population | % Population |
| Asian | 0 | 0.0% |
| Black / African American | 251 | 14.8% |
| Hawaiian / Pacific | 0 | 0.0% |
| Hispanic or Latino | 1,376 | 81.2% |
| Native / Alaskan | 9 | 0.5% |
| White / Caucasian | 992 | 58.6% |
| Two or more Races | 30 | 1.8% |
| Some other Race | 412 | 24.3% |
| Total | 1,694 | 100.0% |
Ancestry in Harlem Heights
The most populous ancestries reported in Harlem Heights are Central American (557 | 32.9%), Nicaraguan (557 | 32.9%), Puerto Rican (418 | 24.7%), Mexican (370 | 21.8%), and American (250 | 14.8%), together accounting for 127.0% of all Harlem Heights residents.
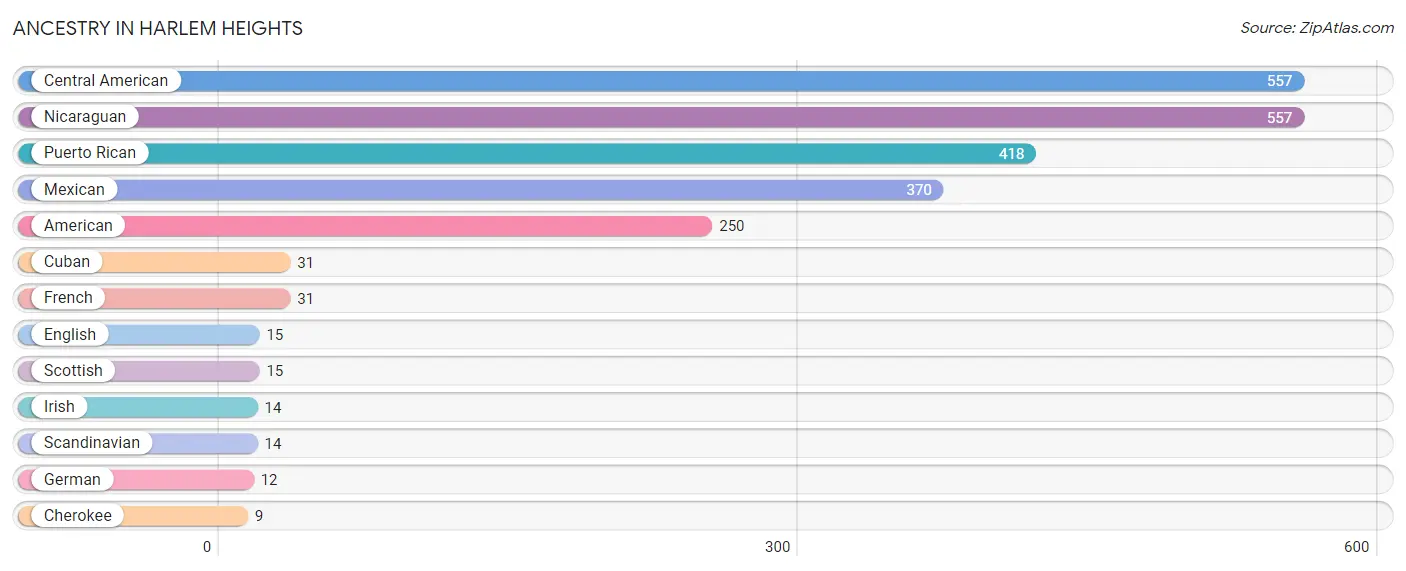
| Ancestry | # Population | % Population |
| American | 250 | 14.8% |
| Central American | 557 | 32.9% |
| Cherokee | 9 | 0.5% |
| Cuban | 31 | 1.8% |
| English | 15 | 0.9% |
| French | 31 | 1.8% |
| German | 12 | 0.7% |
| Irish | 14 | 0.8% |
| Mexican | 370 | 21.8% |
| Nicaraguan | 557 | 32.9% |
| Puerto Rican | 418 | 24.7% |
| Scandinavian | 14 | 0.8% |
| Scottish | 15 | 0.9% | View All 13 Rows |
Immigrants in Harlem Heights
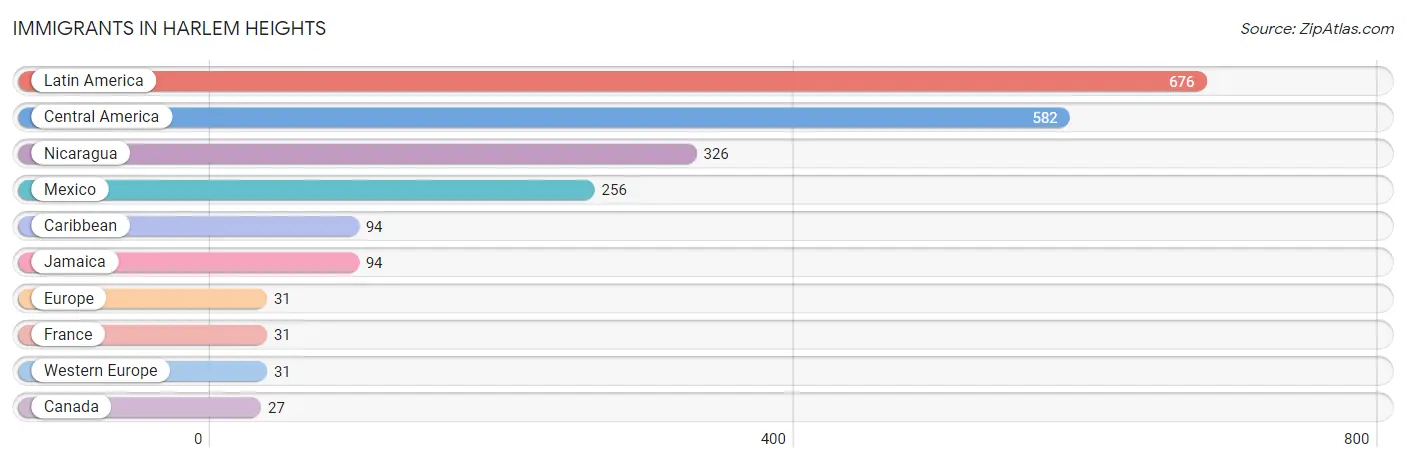
The most numerous immigrant groups reported in Harlem Heights came from Latin America (676 | 39.9%), Central America (582 | 34.4%), Nicaragua (326 | 19.2%), Mexico (256 | 15.1%), and Caribbean (94 | 5.6%), together accounting for 114.2% of all Harlem Heights residents.
| Immigration Origin | # Population | % Population |
| Canada | 27 | 1.6% |
| Caribbean | 94 | 5.6% |
| Central America | 582 | 34.4% |
| Europe | 31 | 1.8% |
| France | 31 | 1.8% |
| Jamaica | 94 | 5.6% |
| Latin America | 676 | 39.9% |
| Mexico | 256 | 15.1% |
| Nicaragua | 326 | 19.2% |
| Western Europe | 31 | 1.8% | View All 10 Rows |
Sex and Age in Harlem Heights
Sex and Age in Harlem Heights
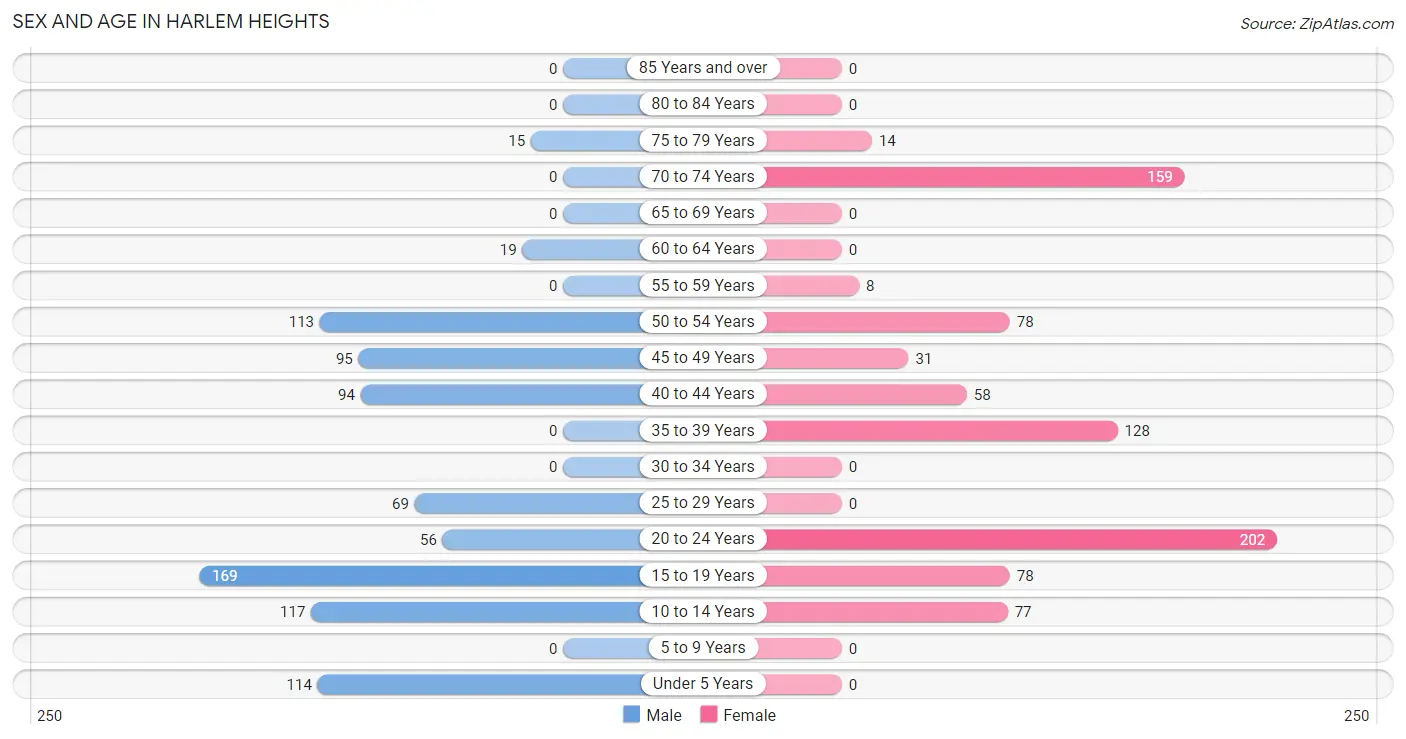
The most populous age groups in Harlem Heights are 15 to 19 Years (169 | 19.6%) for men and 20 to 24 Years (202 | 24.2%) for women.
| Age Bracket | Male | Female |
| Under 5 Years | 114 (13.2%) | 0 (0.0%) |
| 5 to 9 Years | 0 (0.0%) | 0 (0.0%) |
| 10 to 14 Years | 117 (13.6%) | 77 (9.2%) |
| 15 to 19 Years | 169 (19.6%) | 78 (9.4%) |
| 20 to 24 Years | 56 (6.5%) | 202 (24.2%) |
| 25 to 29 Years | 69 (8.0%) | 0 (0.0%) |
| 30 to 34 Years | 0 (0.0%) | 0 (0.0%) |
| 35 to 39 Years | 0 (0.0%) | 128 (15.4%) |
| 40 to 44 Years | 94 (10.9%) | 58 (7.0%) |
| 45 to 49 Years | 95 (11.0%) | 31 (3.7%) |
| 50 to 54 Years | 113 (13.1%) | 78 (9.4%) |
| 55 to 59 Years | 0 (0.0%) | 8 (1.0%) |
| 60 to 64 Years | 19 (2.2%) | 0 (0.0%) |
| 65 to 69 Years | 0 (0.0%) | 0 (0.0%) |
| 70 to 74 Years | 0 (0.0%) | 159 (19.1%) |
| 75 to 79 Years | 15 (1.7%) | 14 (1.7%) |
| 80 to 84 Years | 0 (0.0%) | 0 (0.0%) |
| 85 Years and over | 0 (0.0%) | 0 (0.0%) |
| Total | 861 (100.0%) | 833 (100.0%) |
Families and Households in Harlem Heights
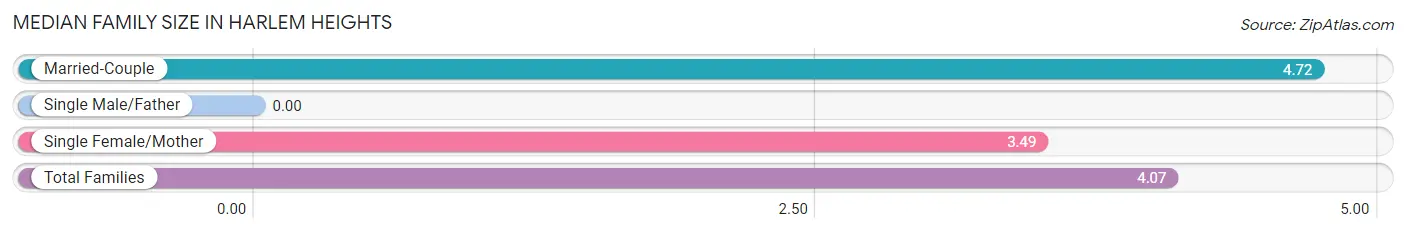
Median Family Size in Harlem Heights
| Family Type | # Families | Family Size |
| Married-Couple | 166 (47.6%) | 4.72 |
| Single Male/Father | 0 (0.0%) | - |
| Single Female/Mother | 183 (52.4%) | 3.49 |
| Total Families | 349 (100.0%) | 4.07 |
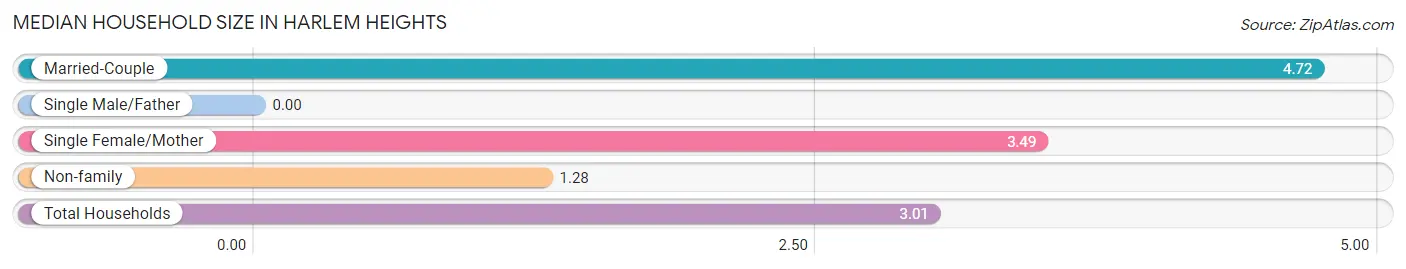
Median Household Size in Harlem Heights
| Household Type | # Households | Household Size |
| Married-Couple | 166 (29.5%) | 4.72 |
| Single Male/Father | 0 (0.0%) | - |
| Single Female/Mother | 183 (32.6%) | 3.49 |
| Non-family | 213 (37.9%) | 1.28 |
| Total Households | 562 (100.0%) | 3.01 |
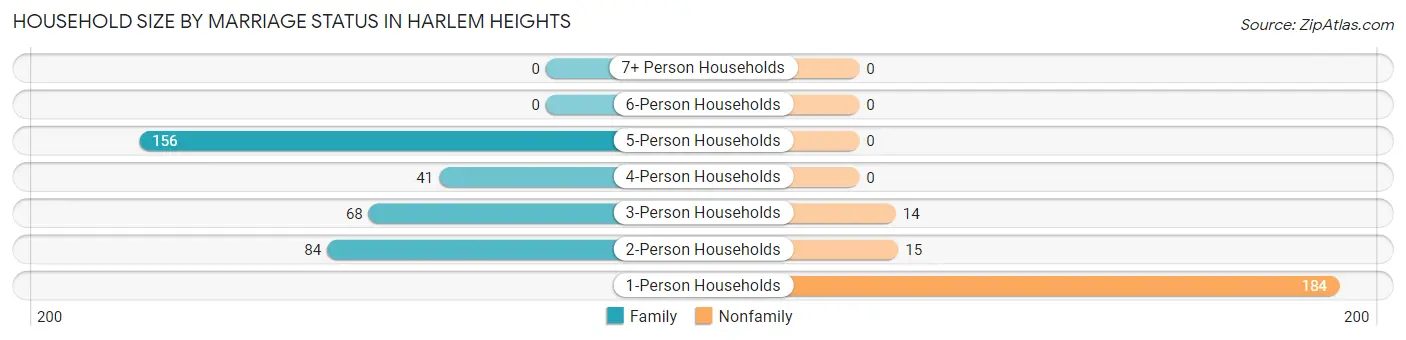
Household Size by Marriage Status in Harlem Heights
Out of a total of 562 households in Harlem Heights, 349 (62.1%) are family households, while 213 (37.9%) are nonfamily households. The most numerous type of family households are 5-person households, comprising 156, and the most common type of nonfamily households are 1-person households, comprising 184.
| Household Size | Family Households | Nonfamily Households |
| 1-Person Households | - | 184 (32.7%) |
| 2-Person Households | 84 (14.9%) | 15 (2.7%) |
| 3-Person Households | 68 (12.1%) | 14 (2.5%) |
| 4-Person Households | 41 (7.3%) | 0 (0.0%) |
| 5-Person Households | 156 (27.8%) | 0 (0.0%) |
| 6-Person Households | 0 (0.0%) | 0 (0.0%) |
| 7+ Person Households | 0 (0.0%) | 0 (0.0%) |
| Total | 349 (62.1%) | 213 (37.9%) |
Female Fertility in Harlem Heights
Fertility by Age in Harlem Heights
| Age Bracket | Women with Births | Births / 1,000 Women |
| 15 to 19 years | 0 (0.0%) | 0.0 |
| 20 to 34 years | 0 (0.0%) | 0.0 |
| 35 to 50 years | 0 (0.0%) | 0.0 |
| Total | 0 (0.0%) | 0.0 |
Fertility by Age by Marriage Status in Harlem Heights
| Age Bracket | Married | Unmarried |
| 15 to 19 years | 0 (0.0%) | 0 (0.0%) |
| 20 to 34 years | 0 (0.0%) | 0 (0.0%) |
| 35 to 50 years | 0 (0.0%) | 0 (0.0%) |
| Total | 0 (0.0%) | 0 (0.0%) |
Fertility by Education in Harlem Heights
| Educational Attainment | Women with Births | Births / 1,000 Women |
| Less than High School | 0 (0.0%) | 0.0 |
| High School Diploma | 0 (0.0%) | 0.0 |
| College or Associate's Degree | 0 (0.0%) | 0.0 |
| Bachelor's Degree | 0 (0.0%) | 0.0 |
| Graduate Degree | 0 (0.0%) | 0.0 |
| Total | 0 (0.0%) | 0.0 |
Fertility by Education by Marriage Status in Harlem Heights
| Educational Attainment | Married | Unmarried |
| Less than High School | 0 (0.0%) | 0 (0.0%) |
| High School Diploma | 0 (0.0%) | 0 (0.0%) |
| College or Associate's Degree | 0 (0.0%) | 0 (0.0%) |
| Bachelor's Degree | 0 (0.0%) | 0 (0.0%) |
| Graduate Degree | 0 (0.0%) | 0 (0.0%) |
| Total | 0 (0.0%) | 0 (0.0%) |
Employment Characteristics in Harlem Heights
Employment by Class of Employer in Harlem Heights
Among the 594 employed individuals in Harlem Heights, private company employees (384 | 64.6%), local government employees (72 | 12.1%), and self-employed (incorporated) (63 | 10.6%) make up the most common classes of employment.
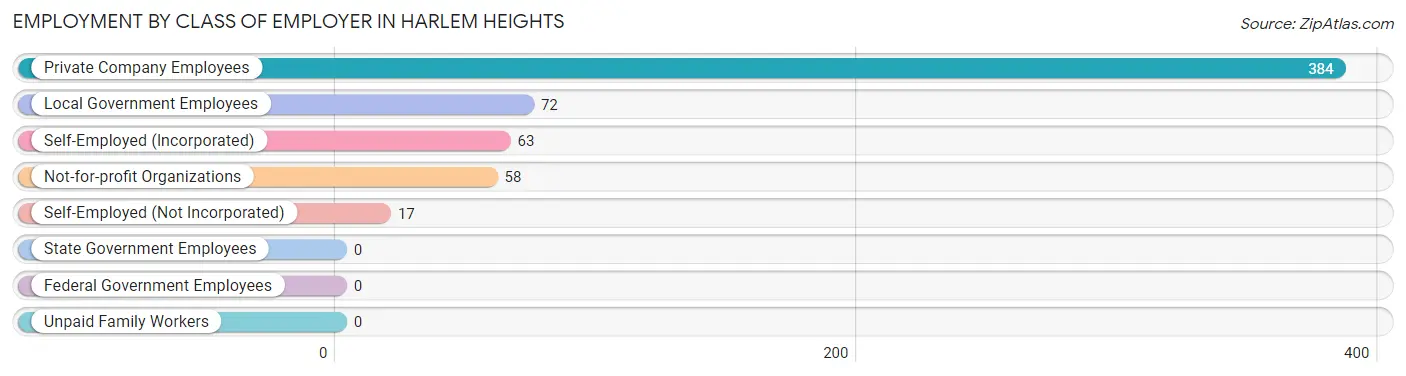
| Employer Class | # Employees | % Employees |
| Private Company Employees | 384 | 64.6% |
| Self-Employed (Incorporated) | 63 | 10.6% |
| Self-Employed (Not Incorporated) | 17 | 2.9% |
| Not-for-profit Organizations | 58 | 9.8% |
| Local Government Employees | 72 | 12.1% |
| State Government Employees | 0 | 0.0% |
| Federal Government Employees | 0 | 0.0% |
| Unpaid Family Workers | 0 | 0.0% |
| Total | 594 | 100.0% |
Employment Status by Age in Harlem Heights
According to the labor force statistics for Harlem Heights, out of the total population over 16 years of age (1,345), 52.9% or 712 individuals are in the labor force, with 16.6% or 118 of them unemployed. The age group with the highest labor force participation rate is 25 to 29 years, with 100.0% or 69 individuals in the labor force. Within the labor force, the 20 to 24 years age range has the highest percentage of unemployed individuals, with 43.7% or 73 of them being unemployed.
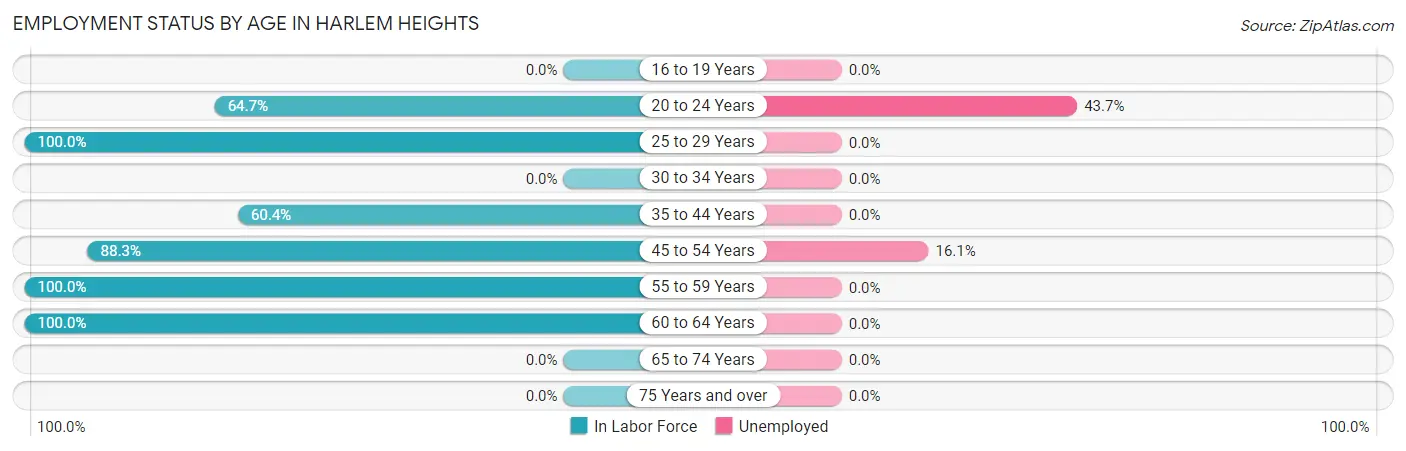
| Age Bracket | In Labor Force | Unemployed |
| 16 to 19 Years | 0 (0.0%) | 0 (0.0%) |
| 20 to 24 Years | 167 (64.7%) | 73 (43.7%) |
| 25 to 29 Years | 69 (100.0%) | 0 (0.0%) |
| 30 to 34 Years | 0 (0.0%) | 0 (0.0%) |
| 35 to 44 Years | 169 (60.4%) | 0 (0.0%) |
| 45 to 54 Years | 280 (88.3%) | 45 (16.1%) |
| 55 to 59 Years | 8 (100.0%) | 0 (0.0%) |
| 60 to 64 Years | 19 (100.0%) | 0 (0.0%) |
| 65 to 74 Years | 0 (0.0%) | 0 (0.0%) |
| 75 Years and over | 0 (0.0%) | 0 (0.0%) |
| Total | 712 (52.9%) | 118 (16.6%) |
Employment Status by Educational Attainment in Harlem Heights
According to labor force statistics for Harlem Heights, 78.6% of individuals (545) out of the total population between 25 and 64 years of age (693) are in the labor force, with 8.3% or 45 of them being unemployed. The group with the highest labor force participation rate are those with the educational attainment of college / associate degree, with 100.0% or 93 individuals in the labor force. Within the labor force, individuals with high school diploma education have the highest percentage of unemployment, with 10.7% or 45 of them being unemployed.
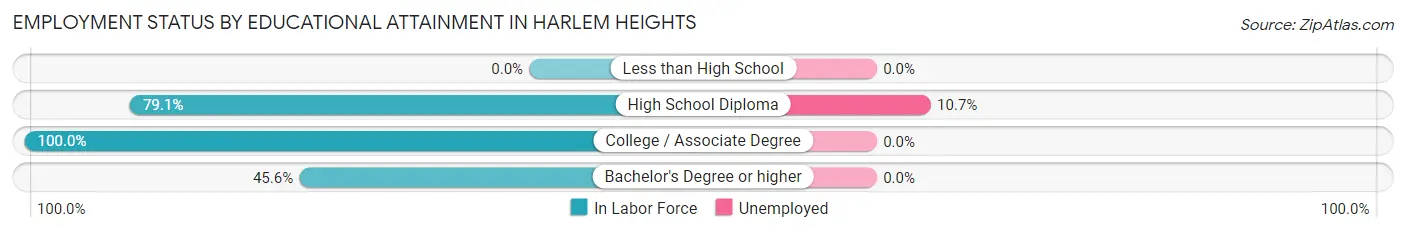
| Educational Attainment | In Labor Force | Unemployed |
| Less than High School | 0 (0.0%) | 0 (0.0%) |
| High School Diploma | 421 (79.1%) | 57 (10.7%) |
| College / Associate Degree | 93 (100.0%) | 0 (0.0%) |
| Bachelor's Degree or higher | 31 (45.6%) | 0 (0.0%) |
| Total | 545 (78.6%) | 58 (8.3%) |
Employment Occupations by Sex in Harlem Heights
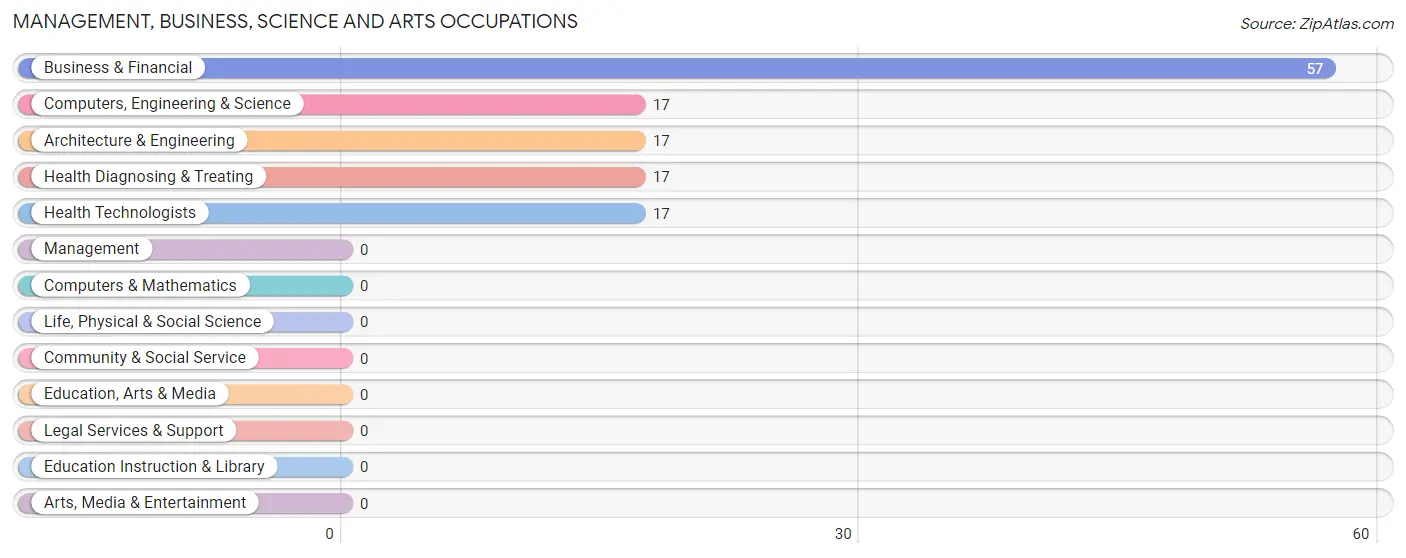
Management, Business, Science and Arts Occupations
The most common Management, Business, Science and Arts occupations in Harlem Heights are Business & Financial (57 | 9.6%), Computers, Engineering & Science (17 | 2.9%), Architecture & Engineering (17 | 2.9%), Health Diagnosing & Treating (17 | 2.9%), and Health Technologists (17 | 2.9%).
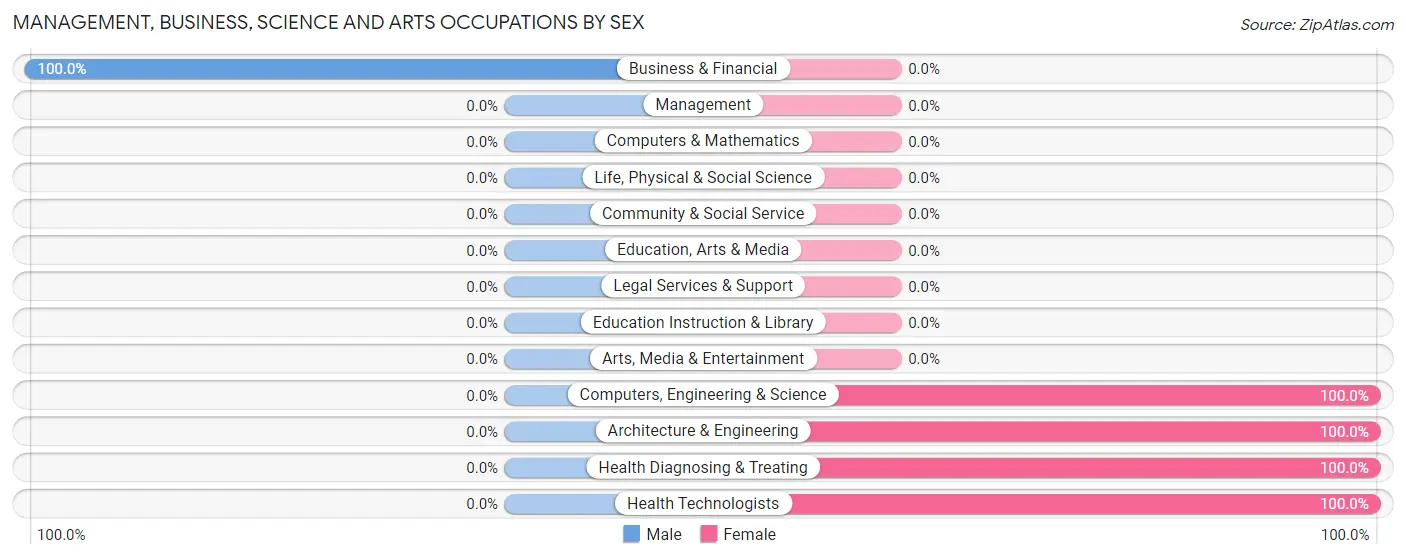
Management, Business, Science and Arts Occupations by Sex
| Occupation | Male | Female |
| Management | 0 (0.0%) | 0 (0.0%) |
| Business & Financial | 57 (100.0%) | 0 (0.0%) |
| Computers, Engineering & Science | 0 (0.0%) | 17 (100.0%) |
| Computers & Mathematics | 0 (0.0%) | 0 (0.0%) |
| Architecture & Engineering | 0 (0.0%) | 17 (100.0%) |
| Life, Physical & Social Science | 0 (0.0%) | 0 (0.0%) |
| Community & Social Service | 0 (0.0%) | 0 (0.0%) |
| Education, Arts & Media | 0 (0.0%) | 0 (0.0%) |
| Legal Services & Support | 0 (0.0%) | 0 (0.0%) |
| Education Instruction & Library | 0 (0.0%) | 0 (0.0%) |
| Arts, Media & Entertainment | 0 (0.0%) | 0 (0.0%) |
| Health Diagnosing & Treating | 0 (0.0%) | 17 (100.0%) |
| Health Technologists | 0 (0.0%) | 17 (100.0%) |
| Total (Category) | 57 (62.6%) | 34 (37.4%) |
| Total (Overall) | 359 (60.4%) | 235 (39.6%) |
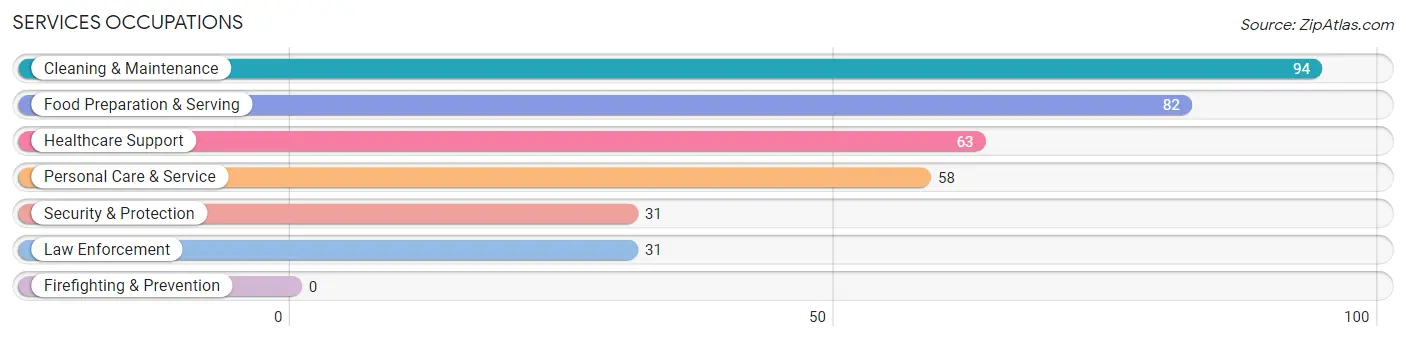
Services Occupations
The most common Services occupations in Harlem Heights are Cleaning & Maintenance (94 | 15.8%), Food Preparation & Serving (82 | 13.8%), Healthcare Support (63 | 10.6%), Personal Care & Service (58 | 9.8%), and Security & Protection (31 | 5.2%).
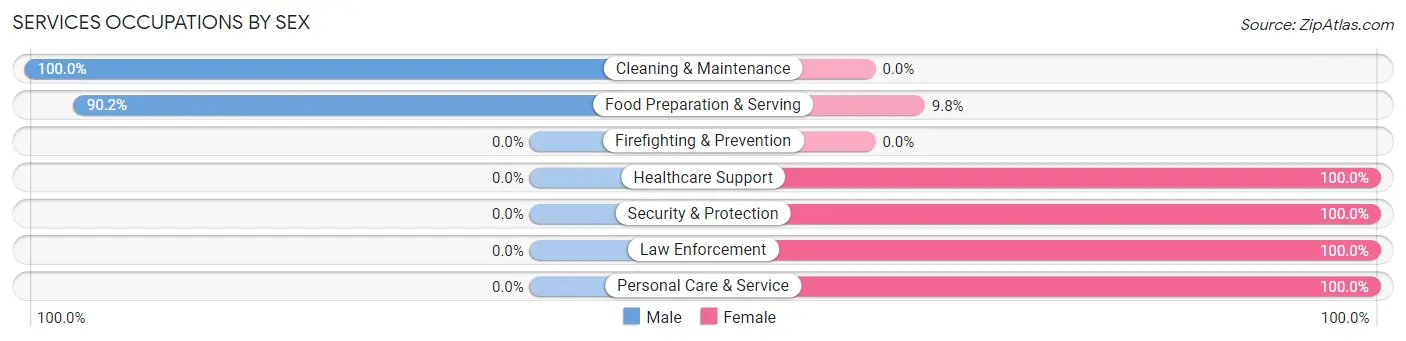
Services Occupations by Sex
Within the Services occupations in Harlem Heights, the most male-oriented occupations are Cleaning & Maintenance (100.0%), and Food Preparation & Serving (90.2%), while the most female-oriented occupations are Healthcare Support (100.0%), Security & Protection (100.0%), and Law Enforcement (100.0%).
| Occupation | Male | Female |
| Healthcare Support | 0 (0.0%) | 63 (100.0%) |
| Security & Protection | 0 (0.0%) | 31 (100.0%) |
| Firefighting & Prevention | 0 (0.0%) | 0 (0.0%) |
| Law Enforcement | 0 (0.0%) | 31 (100.0%) |
| Food Preparation & Serving | 74 (90.2%) | 8 (9.8%) |
| Cleaning & Maintenance | 94 (100.0%) | 0 (0.0%) |
| Personal Care & Service | 0 (0.0%) | 58 (100.0%) |
| Total (Category) | 168 (51.2%) | 160 (48.8%) |
| Total (Overall) | 359 (60.4%) | 235 (39.6%) |
Sales and Office Occupations
The most common Sales and Office occupations in Harlem Heights are , and Sales & Related (9 | 1.5%).
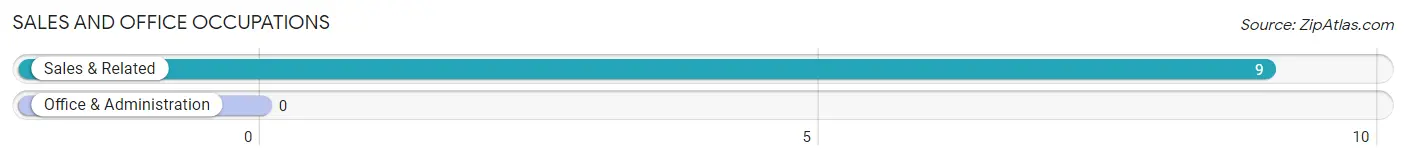
Sales and Office Occupations by Sex
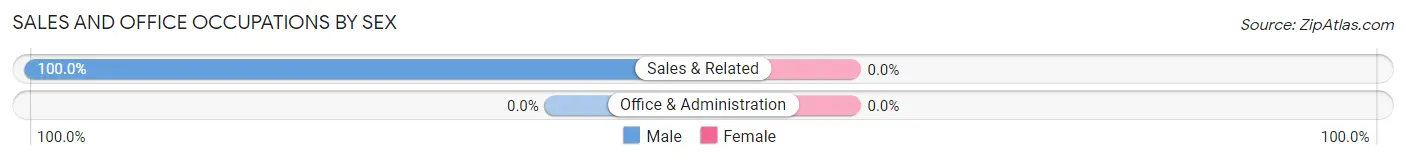
| Occupation | Male | Female |
| Sales & Related | 9 (100.0%) | 0 (0.0%) |
| Office & Administration | 0 (0.0%) | 0 (0.0%) |
| Total (Category) | 9 (100.0%) | 0 (0.0%) |
| Total (Overall) | 359 (60.4%) | 235 (39.6%) |
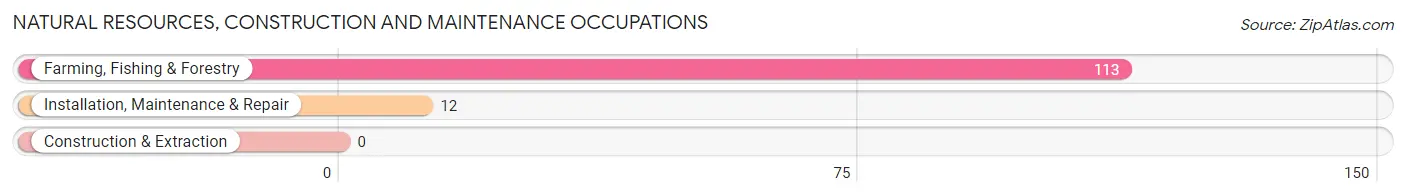
Natural Resources, Construction and Maintenance Occupations
The most common Natural Resources, Construction and Maintenance occupations in Harlem Heights are Farming, Fishing & Forestry (113 | 19.0%), and Installation, Maintenance & Repair (12 | 2.0%).
Natural Resources, Construction and Maintenance Occupations by Sex
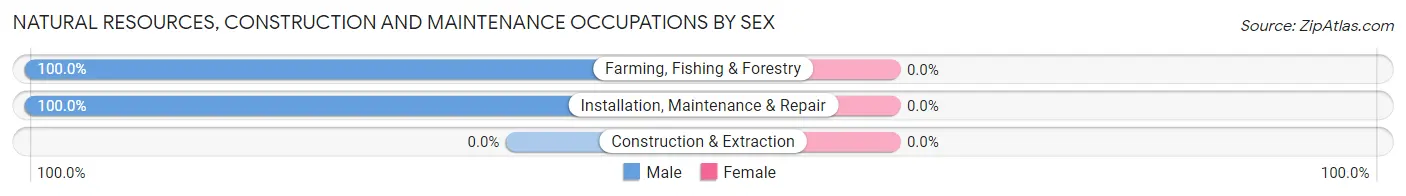
| Occupation | Male | Female |
| Farming, Fishing & Forestry | 113 (100.0%) | 0 (0.0%) |
| Construction & Extraction | 0 (0.0%) | 0 (0.0%) |
| Installation, Maintenance & Repair | 12 (100.0%) | 0 (0.0%) |
| Total (Category) | 125 (100.0%) | 0 (0.0%) |
| Total (Overall) | 359 (60.4%) | 235 (39.6%) |
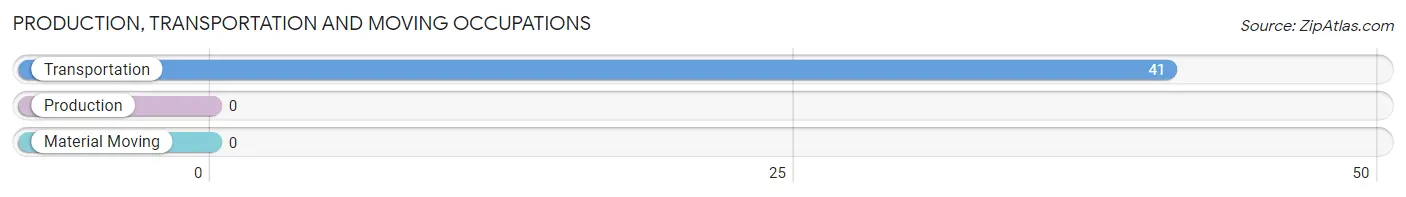
Production, Transportation and Moving Occupations
The most common Production, Transportation and Moving occupations in Harlem Heights are , and Transportation (41 | 6.9%).
Production, Transportation and Moving Occupations by Sex
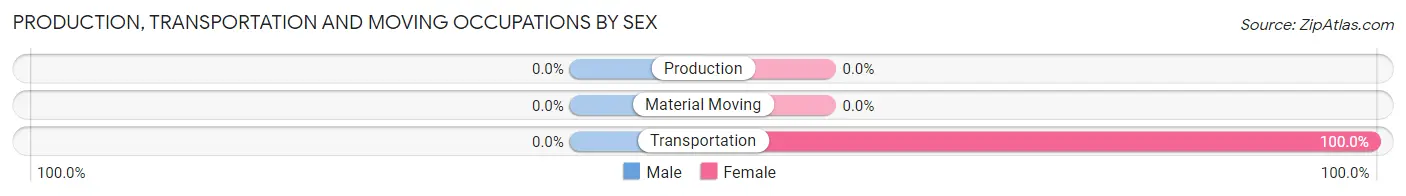
| Occupation | Male | Female |
| Production | 0 (0.0%) | 0 (0.0%) |
| Transportation | 0 (0.0%) | 41 (100.0%) |
| Material Moving | 0 (0.0%) | 0 (0.0%) |
| Total (Category) | 0 (0.0%) | 41 (100.0%) |
| Total (Overall) | 359 (60.4%) | 235 (39.6%) |
Employment Industries by Sex in Harlem Heights
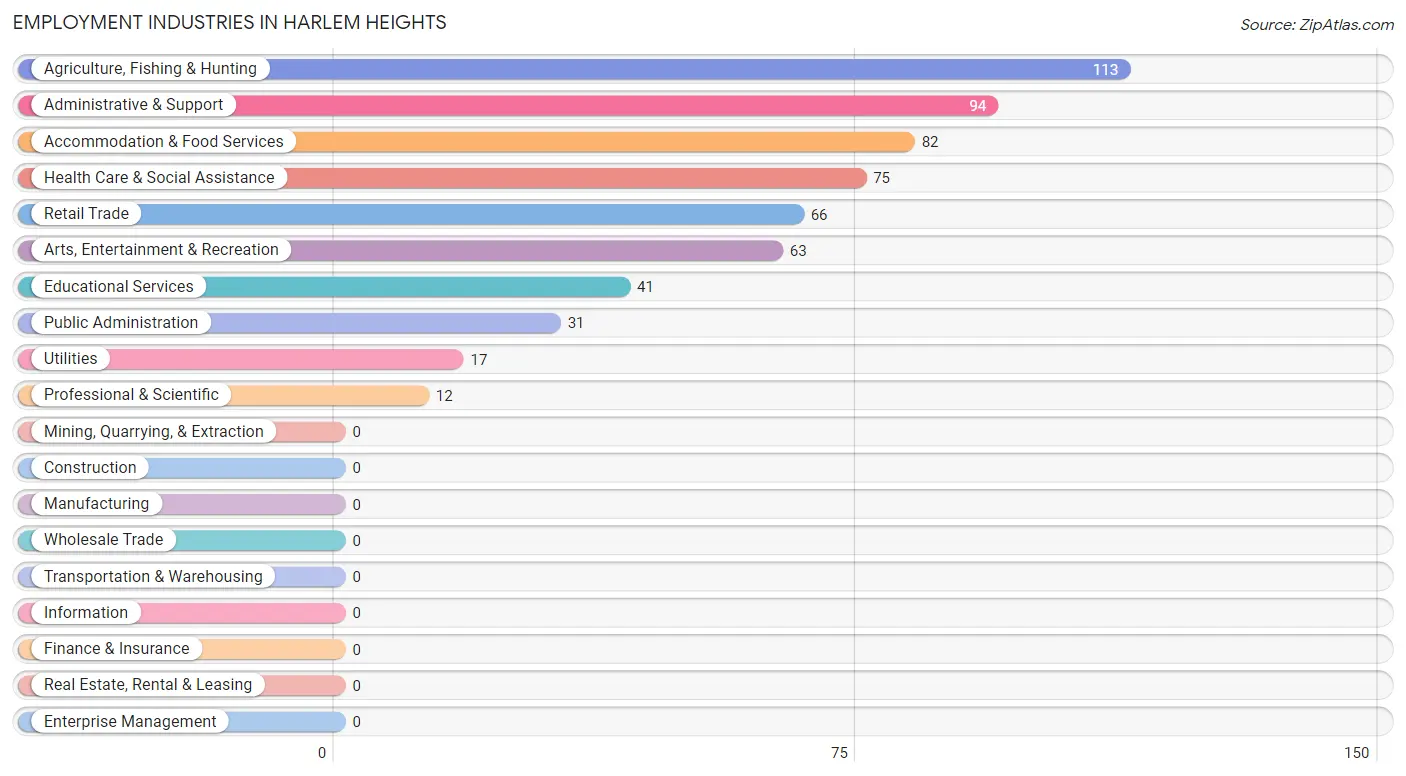
Employment Industries in Harlem Heights
The major employment industries in Harlem Heights include Agriculture, Fishing & Hunting (113 | 19.0%), Administrative & Support (94 | 15.8%), Accommodation & Food Services (82 | 13.8%), Health Care & Social Assistance (75 | 12.6%), and Retail Trade (66 | 11.1%).
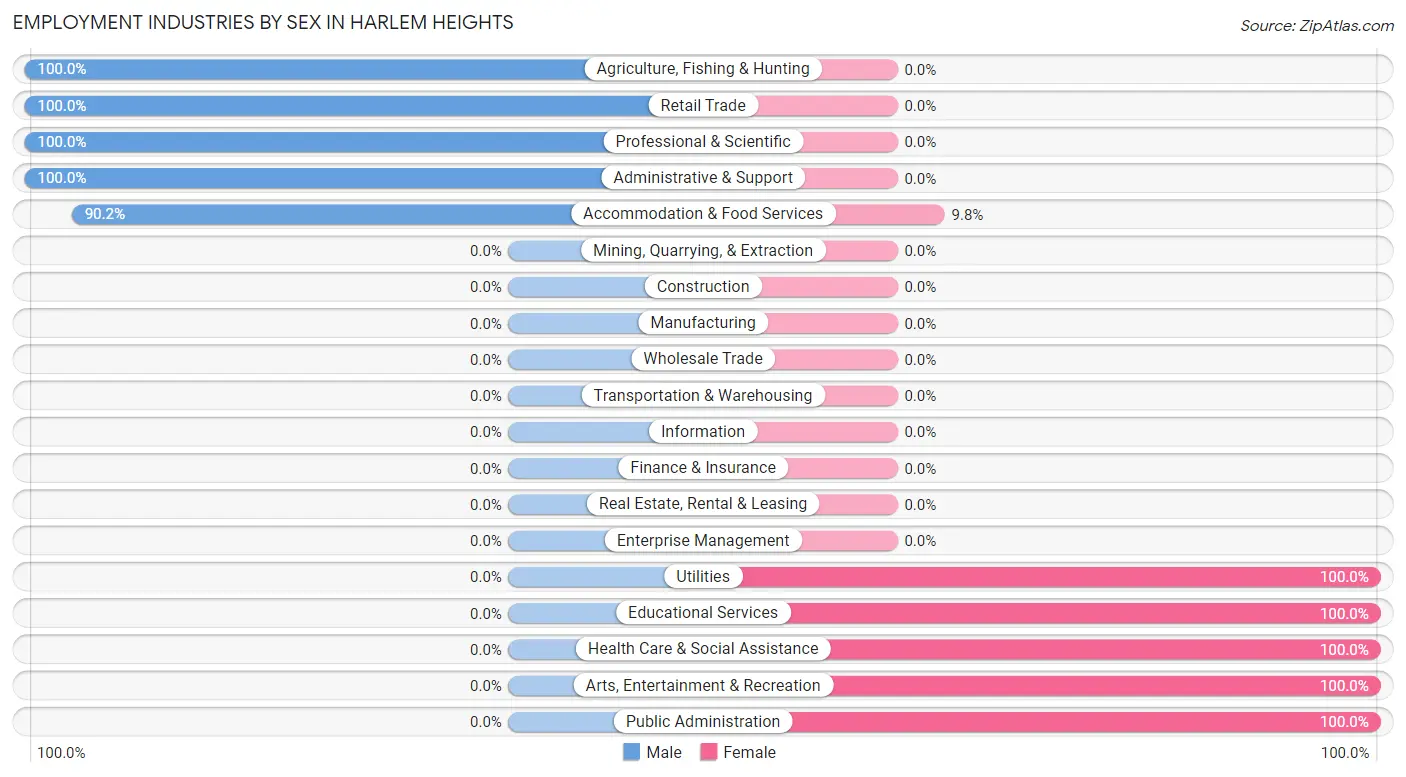
Employment Industries by Sex in Harlem Heights
The Harlem Heights industries that see more men than women are Agriculture, Fishing & Hunting (100.0%), Retail Trade (100.0%), and Professional & Scientific (100.0%), whereas the industries that tend to have a higher number of women are Utilities (100.0%), Educational Services (100.0%), and Health Care & Social Assistance (100.0%).
| Industry | Male | Female |
| Agriculture, Fishing & Hunting | 113 (100.0%) | 0 (0.0%) |
| Mining, Quarrying, & Extraction | 0 (0.0%) | 0 (0.0%) |
| Construction | 0 (0.0%) | 0 (0.0%) |
| Manufacturing | 0 (0.0%) | 0 (0.0%) |
| Wholesale Trade | 0 (0.0%) | 0 (0.0%) |
| Retail Trade | 66 (100.0%) | 0 (0.0%) |
| Transportation & Warehousing | 0 (0.0%) | 0 (0.0%) |
| Utilities | 0 (0.0%) | 17 (100.0%) |
| Information | 0 (0.0%) | 0 (0.0%) |
| Finance & Insurance | 0 (0.0%) | 0 (0.0%) |
| Real Estate, Rental & Leasing | 0 (0.0%) | 0 (0.0%) |
| Professional & Scientific | 12 (100.0%) | 0 (0.0%) |
| Enterprise Management | 0 (0.0%) | 0 (0.0%) |
| Administrative & Support | 94 (100.0%) | 0 (0.0%) |
| Educational Services | 0 (0.0%) | 41 (100.0%) |
| Health Care & Social Assistance | 0 (0.0%) | 75 (100.0%) |
| Arts, Entertainment & Recreation | 0 (0.0%) | 63 (100.0%) |
| Accommodation & Food Services | 74 (90.2%) | 8 (9.8%) |
| Public Administration | 0 (0.0%) | 31 (100.0%) |
| Total | 359 (60.4%) | 235 (39.6%) |
Education in Harlem Heights
School Enrollment in Harlem Heights
The most common levels of schooling among the 381 students in Harlem Heights are middle school (155 | 40.7%), high school (117 | 30.7%), and college / undergraduate (109 | 28.6%).
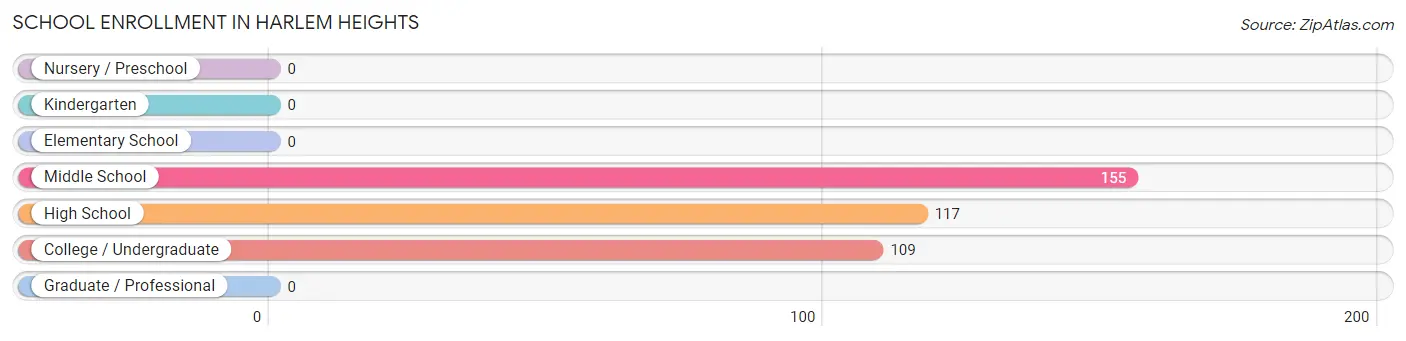
| School Level | # Students | % Students |
| Nursery / Preschool | 0 | 0.0% |
| Kindergarten | 0 | 0.0% |
| Elementary School | 0 | 0.0% |
| Middle School | 155 | 40.7% |
| High School | 117 | 30.7% |
| College / Undergraduate | 109 | 28.6% |
| Graduate / Professional | 0 | 0.0% |
| Total | 381 | 100.0% |
School Enrollment by Age by Funding Source in Harlem Heights
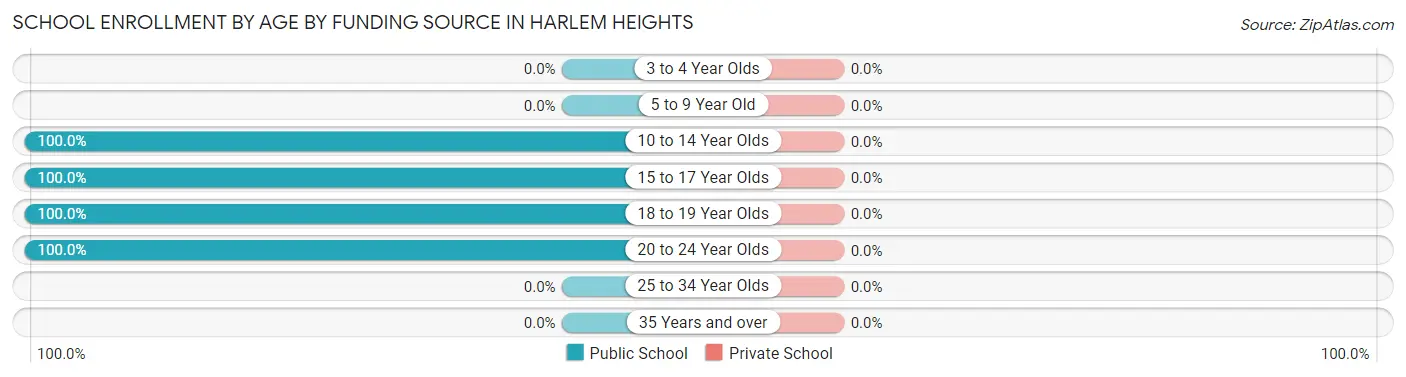
| Age Bracket | Public School | Private School |
| 3 to 4 Year Olds | 0 (0.0%) | 0 (0.0%) |
| 5 to 9 Year Old | 0 (0.0%) | 0 (0.0%) |
| 10 to 14 Year Olds | 194 (100.0%) | 0 (0.0%) |
| 15 to 17 Year Olds | 78 (100.0%) | 0 (0.0%) |
| 18 to 19 Year Olds | 67 (100.0%) | 0 (0.0%) |
| 20 to 24 Year Olds | 42 (100.0%) | 0 (0.0%) |
| 25 to 34 Year Olds | 0 (0.0%) | 0 (0.0%) |
| 35 Years and over | 0 (0.0%) | 0 (0.0%) |
| Total | 381 (100.0%) | 0 (0.0%) |
Educational Attainment by Field of Study in Harlem Heights
Education (53 | 36.0%), business (45 | 30.6%), science & technology (37 | 25.2%), and social sciences (12 | 8.2%) are the most common fields of study among 147 individuals in Harlem Heights who have obtained a bachelor's degree or higher.
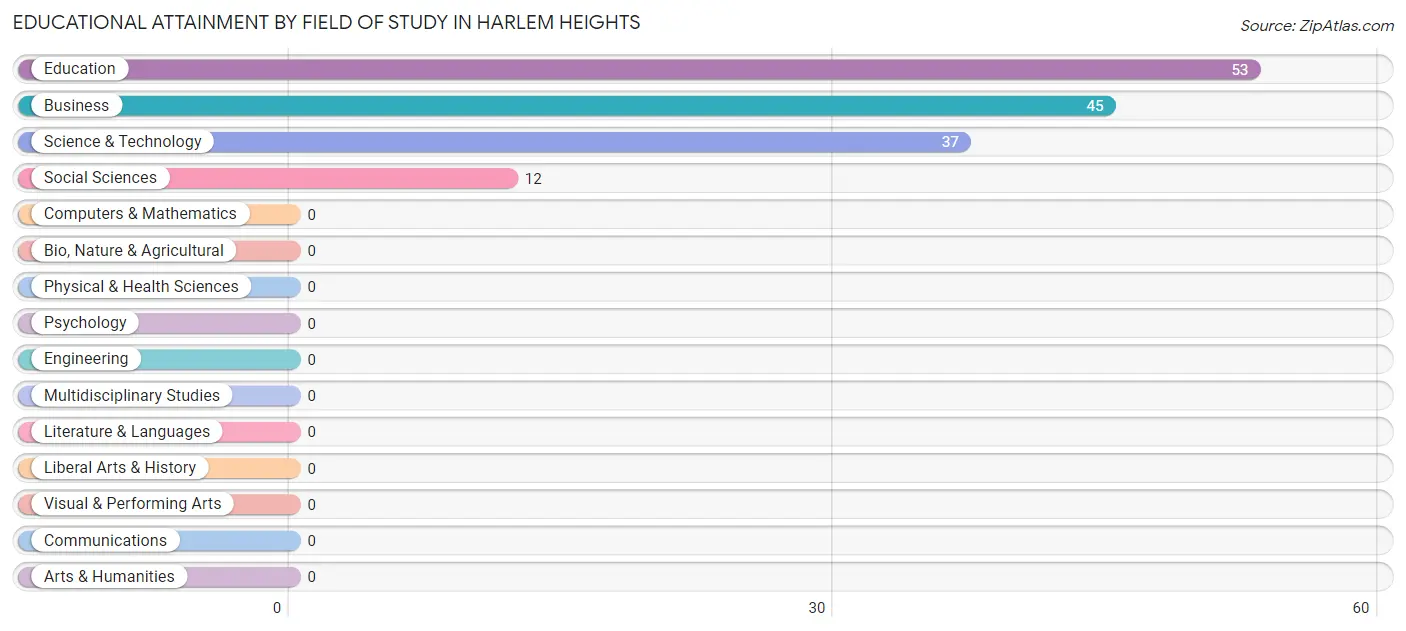
| Field of Study | # Graduates | % Graduates |
| Computers & Mathematics | 0 | 0.0% |
| Bio, Nature & Agricultural | 0 | 0.0% |
| Physical & Health Sciences | 0 | 0.0% |
| Psychology | 0 | 0.0% |
| Social Sciences | 12 | 8.2% |
| Engineering | 0 | 0.0% |
| Multidisciplinary Studies | 0 | 0.0% |
| Science & Technology | 37 | 25.2% |
| Business | 45 | 30.6% |
| Education | 53 | 36.0% |
| Literature & Languages | 0 | 0.0% |
| Liberal Arts & History | 0 | 0.0% |
| Visual & Performing Arts | 0 | 0.0% |
| Communications | 0 | 0.0% |
| Arts & Humanities | 0 | 0.0% |
| Total | 147 | 100.0% |
Transportation & Commute in Harlem Heights
Vehicle Availability by Sex in Harlem Heights
The most prevalent vehicle ownership categories in Harlem Heights are males with no vehicle (144, accounting for 40.1%) and females with no vehicle (0, making up 61.3%).
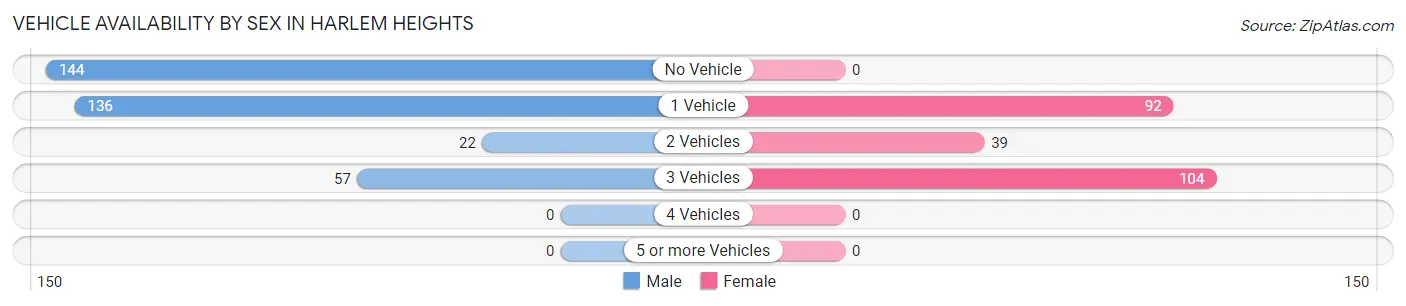
| Vehicles Available | Male | Female |
| No Vehicle | 144 (40.1%) | 0 (0.0%) |
| 1 Vehicle | 136 (37.9%) | 92 (39.2%) |
| 2 Vehicles | 22 (6.1%) | 39 (16.6%) |
| 3 Vehicles | 57 (15.9%) | 104 (44.3%) |
| 4 Vehicles | 0 (0.0%) | 0 (0.0%) |
| 5 or more Vehicles | 0 (0.0%) | 0 (0.0%) |
| Total | 359 (100.0%) | 235 (100.0%) |
Commute Time in Harlem Heights
The most frequently occuring commute durations in Harlem Heights are 10 to 14 minutes (211 commuters, 36.6%), 20 to 24 minutes (165 commuters, 28.6%), and 30 to 34 minutes (81 commuters, 14.0%).
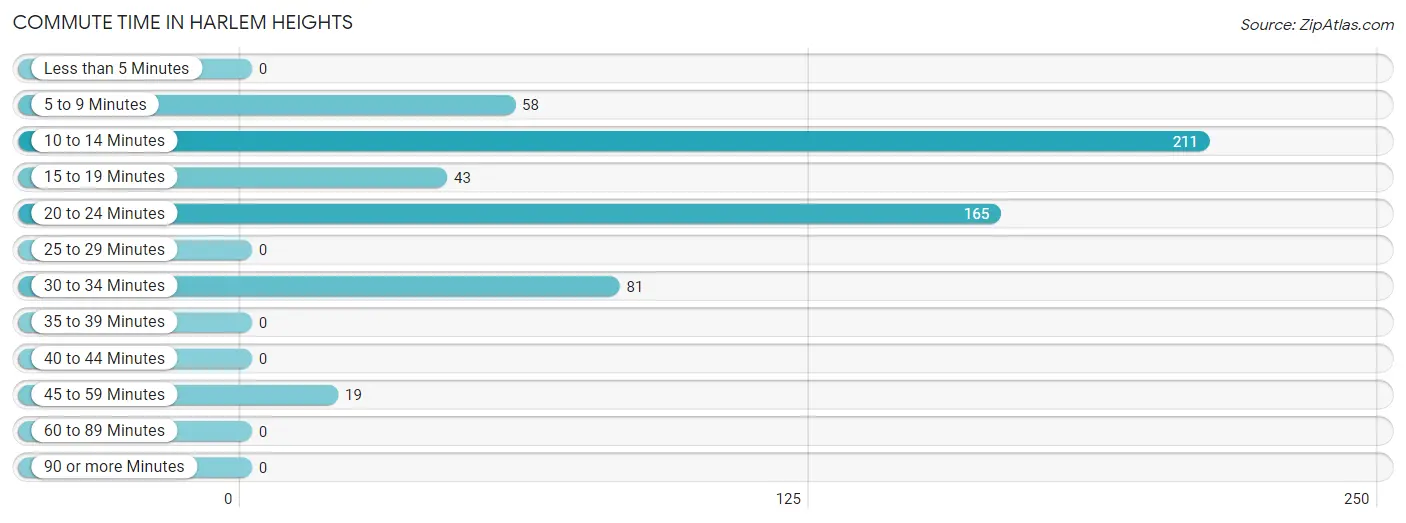
| Commute Time | # Commuters | % Commuters |
| Less than 5 Minutes | 0 | 0.0% |
| 5 to 9 Minutes | 58 | 10.1% |
| 10 to 14 Minutes | 211 | 36.6% |
| 15 to 19 Minutes | 43 | 7.4% |
| 20 to 24 Minutes | 165 | 28.6% |
| 25 to 29 Minutes | 0 | 0.0% |
| 30 to 34 Minutes | 81 | 14.0% |
| 35 to 39 Minutes | 0 | 0.0% |
| 40 to 44 Minutes | 0 | 0.0% |
| 45 to 59 Minutes | 19 | 3.3% |
| 60 to 89 Minutes | 0 | 0.0% |
| 90 or more Minutes | 0 | 0.0% |
Commute Time by Sex in Harlem Heights
The most common commute times in Harlem Heights are 10 to 14 minutes (170 commuters, 47.3%) for males and 20 to 24 minutes (71 commuters, 32.6%) for females.
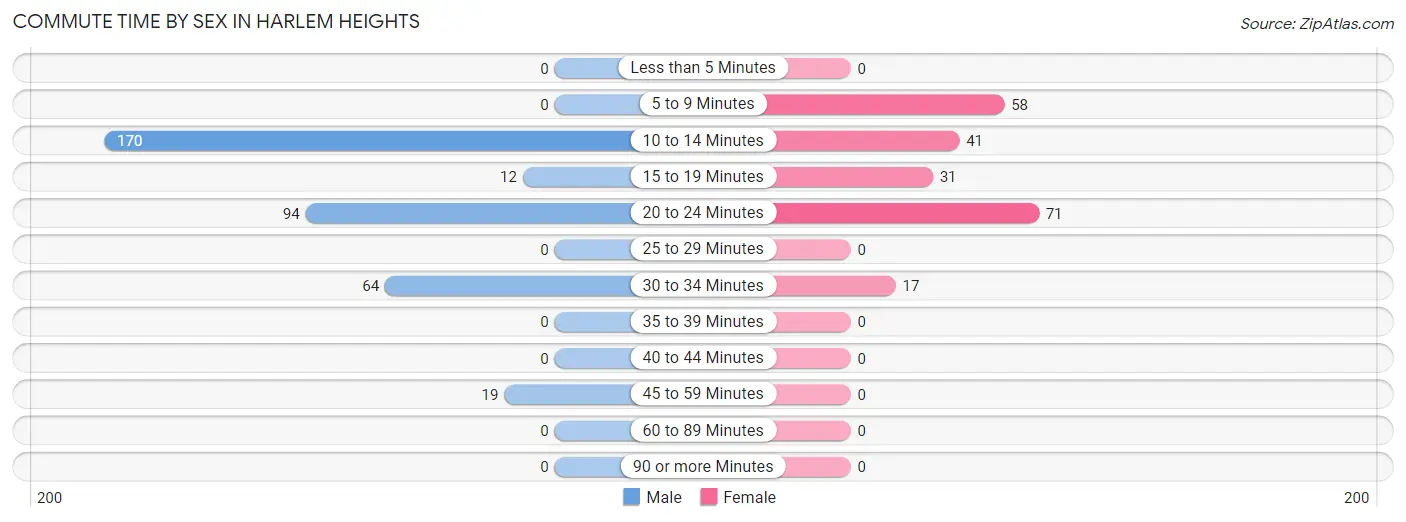
| Commute Time | Male | Female |
| Less than 5 Minutes | 0 (0.0%) | 0 (0.0%) |
| 5 to 9 Minutes | 0 (0.0%) | 58 (26.6%) |
| 10 to 14 Minutes | 170 (47.3%) | 41 (18.8%) |
| 15 to 19 Minutes | 12 (3.3%) | 31 (14.2%) |
| 20 to 24 Minutes | 94 (26.2%) | 71 (32.6%) |
| 25 to 29 Minutes | 0 (0.0%) | 0 (0.0%) |
| 30 to 34 Minutes | 64 (17.8%) | 17 (7.8%) |
| 35 to 39 Minutes | 0 (0.0%) | 0 (0.0%) |
| 40 to 44 Minutes | 0 (0.0%) | 0 (0.0%) |
| 45 to 59 Minutes | 19 (5.3%) | 0 (0.0%) |
| 60 to 89 Minutes | 0 (0.0%) | 0 (0.0%) |
| 90 or more Minutes | 0 (0.0%) | 0 (0.0%) |
Time of Departure to Work by Sex in Harlem Heights
The most frequent times of departure to work in Harlem Heights are 6:00 AM to 6:29 AM (151, 42.1%) for males and 6:00 AM to 6:29 AM (104, 47.7%) for females.
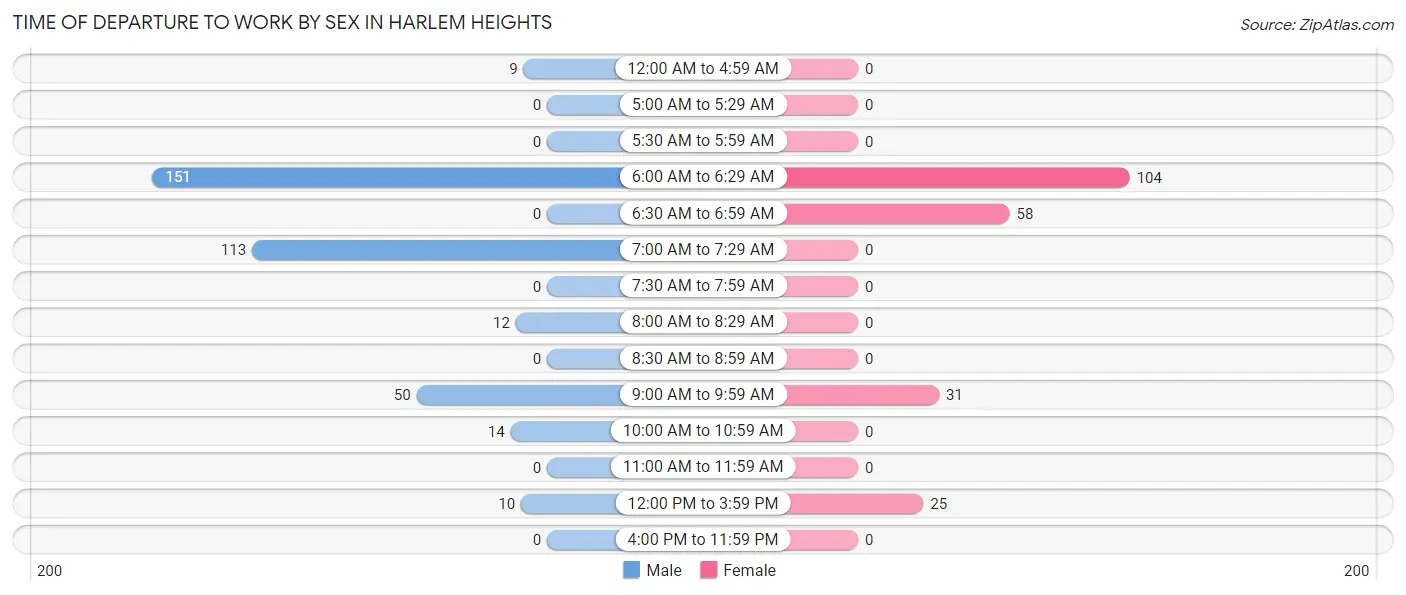
| Time of Departure | Male | Female |
| 12:00 AM to 4:59 AM | 9 (2.5%) | 0 (0.0%) |
| 5:00 AM to 5:29 AM | 0 (0.0%) | 0 (0.0%) |
| 5:30 AM to 5:59 AM | 0 (0.0%) | 0 (0.0%) |
| 6:00 AM to 6:29 AM | 151 (42.1%) | 104 (47.7%) |
| 6:30 AM to 6:59 AM | 0 (0.0%) | 58 (26.6%) |
| 7:00 AM to 7:29 AM | 113 (31.5%) | 0 (0.0%) |
| 7:30 AM to 7:59 AM | 0 (0.0%) | 0 (0.0%) |
| 8:00 AM to 8:29 AM | 12 (3.3%) | 0 (0.0%) |
| 8:30 AM to 8:59 AM | 0 (0.0%) | 0 (0.0%) |
| 9:00 AM to 9:59 AM | 50 (13.9%) | 31 (14.2%) |
| 10:00 AM to 10:59 AM | 14 (3.9%) | 0 (0.0%) |
| 11:00 AM to 11:59 AM | 0 (0.0%) | 0 (0.0%) |
| 12:00 PM to 3:59 PM | 10 (2.8%) | 25 (11.5%) |
| 4:00 PM to 11:59 PM | 0 (0.0%) | 0 (0.0%) |
| Total | 359 (100.0%) | 218 (100.0%) |
Housing Occupancy in Harlem Heights
Occupancy by Ownership in Harlem Heights
Of the total 562 dwellings in Harlem Heights, owner-occupied units account for 274 (48.7%), while renter-occupied units make up 288 (51.2%).
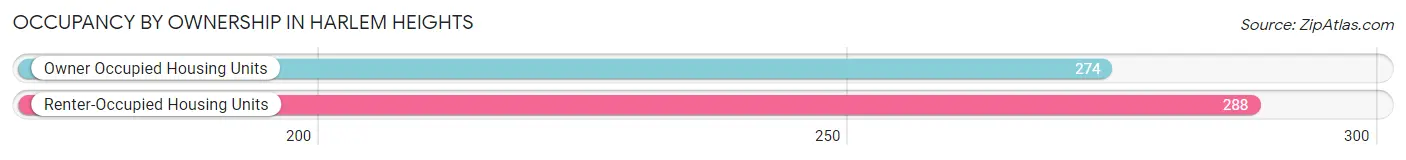
| Occupancy | # Housing Units | % Housing Units |
| Owner Occupied Housing Units | 274 | 48.7% |
| Renter-Occupied Housing Units | 288 | 51.2% |
| Total Occupied Housing Units | 562 | 100.0% |
Occupancy by Household Size in Harlem Heights
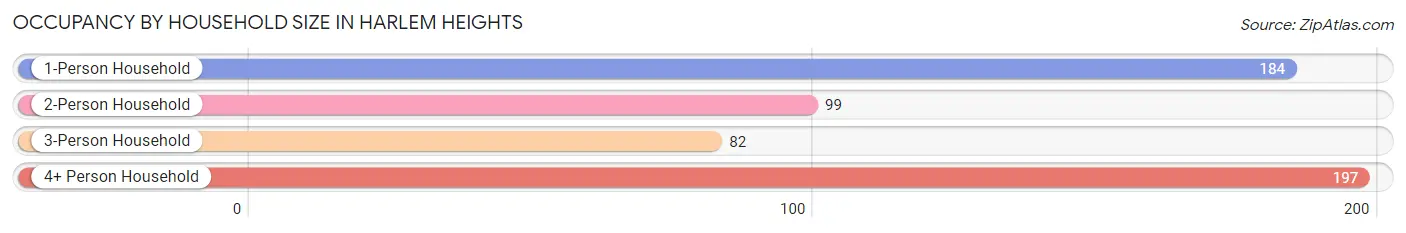
| Household Size | # Housing Units | % Housing Units |
| 1-Person Household | 184 | 32.7% |
| 2-Person Household | 99 | 17.6% |
| 3-Person Household | 82 | 14.6% |
| 4+ Person Household | 197 | 35.0% |
| Total Housing Units | 562 | 100.0% |
Occupancy by Ownership by Household Size in Harlem Heights
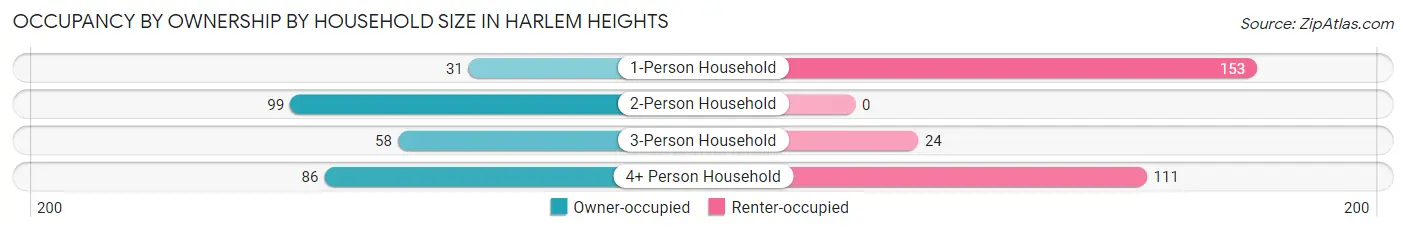
| Household Size | Owner-occupied | Renter-occupied |
| 1-Person Household | 31 (16.9%) | 153 (83.2%) |
| 2-Person Household | 99 (100.0%) | 0 (0.0%) |
| 3-Person Household | 58 (70.7%) | 24 (29.3%) |
| 4+ Person Household | 86 (43.6%) | 111 (56.4%) |
| Total Housing Units | 274 (48.7%) | 288 (51.2%) |
Occupancy by Educational Attainment in Harlem Heights
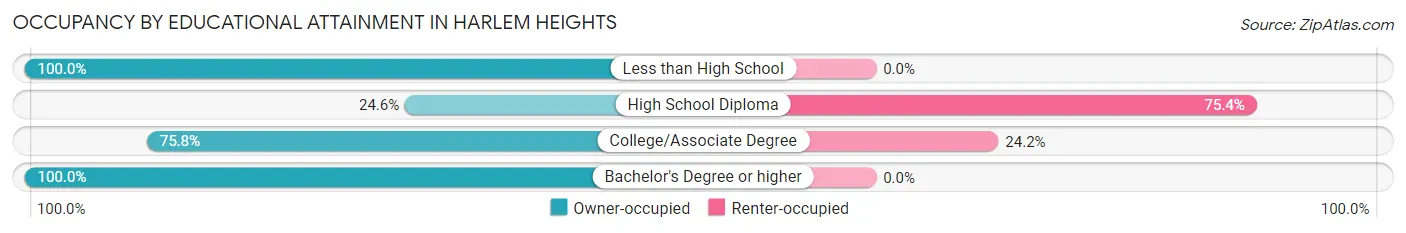
| Household Size | Owner-occupied | Renter-occupied |
| Less than High School | 15 (100.0%) | 0 (0.0%) |
| High School Diploma | 86 (24.6%) | 264 (75.4%) |
| College/Associate Degree | 75 (75.8%) | 24 (24.2%) |
| Bachelor's Degree or higher | 98 (100.0%) | 0 (0.0%) |
Occupancy by Age of Householder in Harlem Heights
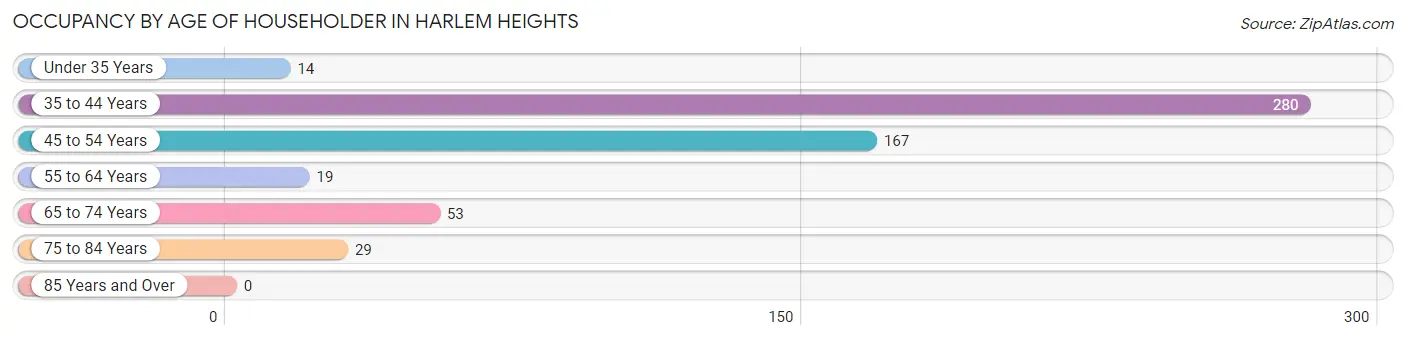
| Age Bracket | # Households | % Households |
| Under 35 Years | 14 | 2.5% |
| 35 to 44 Years | 280 | 49.8% |
| 45 to 54 Years | 167 | 29.7% |
| 55 to 64 Years | 19 | 3.4% |
| 65 to 74 Years | 53 | 9.4% |
| 75 to 84 Years | 29 | 5.2% |
| 85 Years and Over | 0 | 0.0% |
| Total | 562 | 100.0% |
Housing Finances in Harlem Heights
Median Income by Occupancy in Harlem Heights
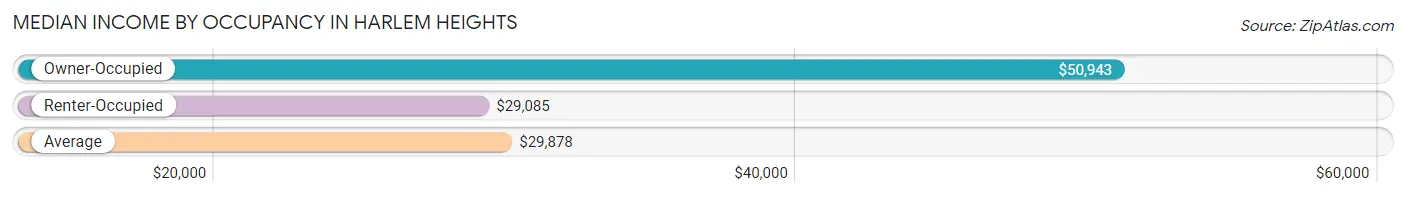
| Occupancy Type | # Households | Median Income |
| Owner-Occupied | 274 (48.7%) | $50,943 |
| Renter-Occupied | 288 (51.2%) | $29,085 |
| Average | 562 (100.0%) | $29,878 |
Occupancy by Householder Income Bracket in Harlem Heights
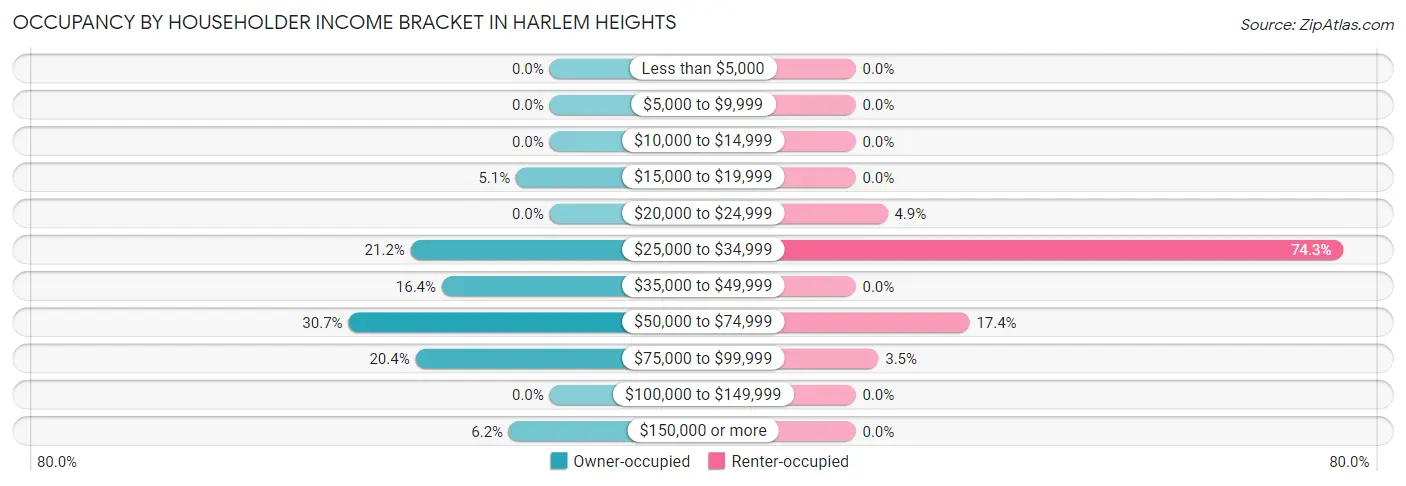
| Income Bracket | Owner-occupied | Renter-occupied |
| Less than $5,000 | 0 (0.0%) | 0 (0.0%) |
| $5,000 to $9,999 | 0 (0.0%) | 0 (0.0%) |
| $10,000 to $14,999 | 0 (0.0%) | 0 (0.0%) |
| $15,000 to $19,999 | 14 (5.1%) | 0 (0.0%) |
| $20,000 to $24,999 | 0 (0.0%) | 14 (4.9%) |
| $25,000 to $34,999 | 58 (21.2%) | 214 (74.3%) |
| $35,000 to $49,999 | 45 (16.4%) | 0 (0.0%) |
| $50,000 to $74,999 | 84 (30.7%) | 50 (17.4%) |
| $75,000 to $99,999 | 56 (20.4%) | 10 (3.5%) |
| $100,000 to $149,999 | 0 (0.0%) | 0 (0.0%) |
| $150,000 or more | 17 (6.2%) | 0 (0.0%) |
| Total | 274 (100.0%) | 288 (100.0%) |
Monthly Housing Cost Tiers in Harlem Heights
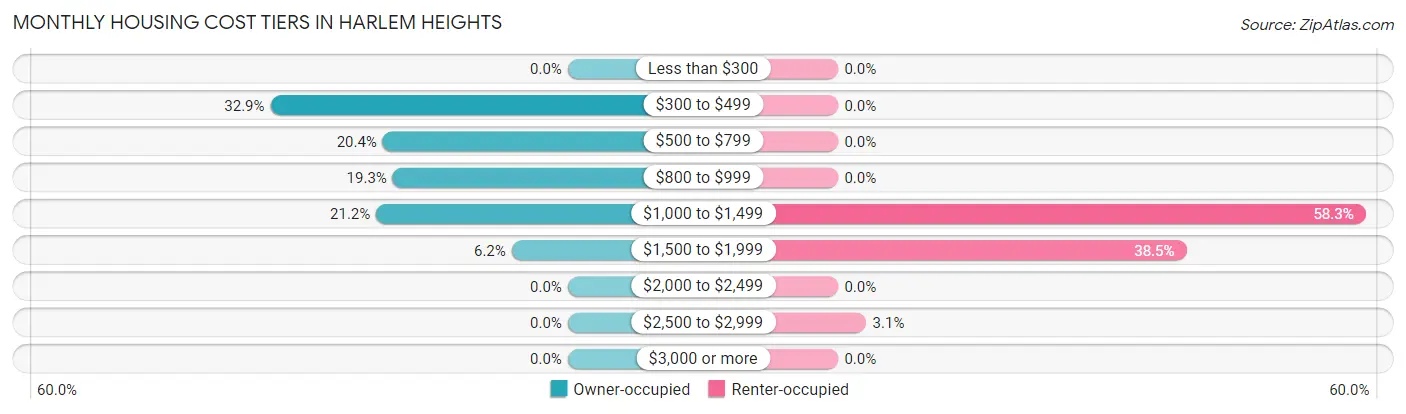
| Monthly Cost | Owner-occupied | Renter-occupied |
| Less than $300 | 0 (0.0%) | 0 (0.0%) |
| $300 to $499 | 90 (32.9%) | 0 (0.0%) |
| $500 to $799 | 56 (20.4%) | 0 (0.0%) |
| $800 to $999 | 53 (19.3%) | 0 (0.0%) |
| $1,000 to $1,499 | 58 (21.2%) | 168 (58.3%) |
| $1,500 to $1,999 | 17 (6.2%) | 111 (38.5%) |
| $2,000 to $2,499 | 0 (0.0%) | 0 (0.0%) |
| $2,500 to $2,999 | 0 (0.0%) | 9 (3.1%) |
| $3,000 or more | 0 (0.0%) | 0 (0.0%) |
| Total | 274 (100.0%) | 288 (100.0%) |
Physical Housing Characteristics in Harlem Heights
Housing Structures in Harlem Heights
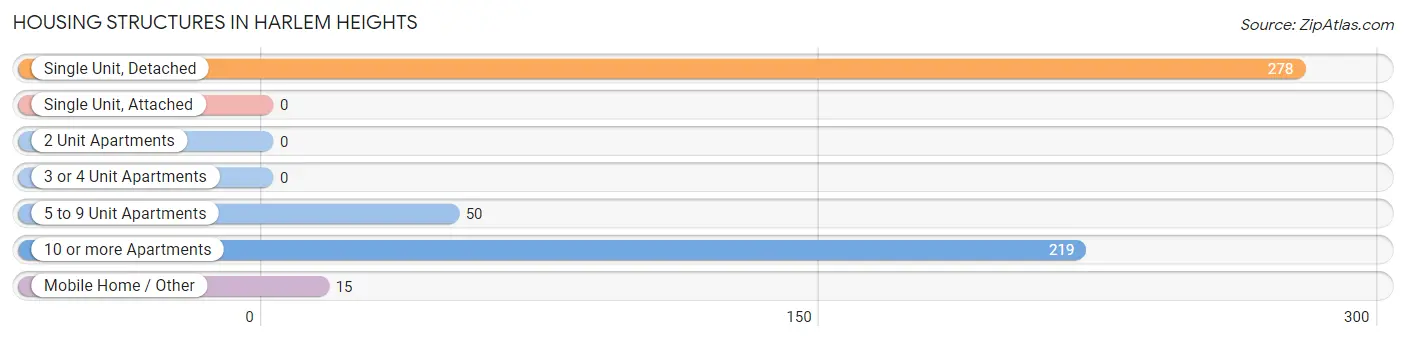
| Structure Type | # Housing Units | % Housing Units |
| Single Unit, Detached | 278 | 49.5% |
| Single Unit, Attached | 0 | 0.0% |
| 2 Unit Apartments | 0 | 0.0% |
| 3 or 4 Unit Apartments | 0 | 0.0% |
| 5 to 9 Unit Apartments | 50 | 8.9% |
| 10 or more Apartments | 219 | 39.0% |
| Mobile Home / Other | 15 | 2.7% |
| Total | 562 | 100.0% |
Housing Structures by Occupancy in Harlem Heights
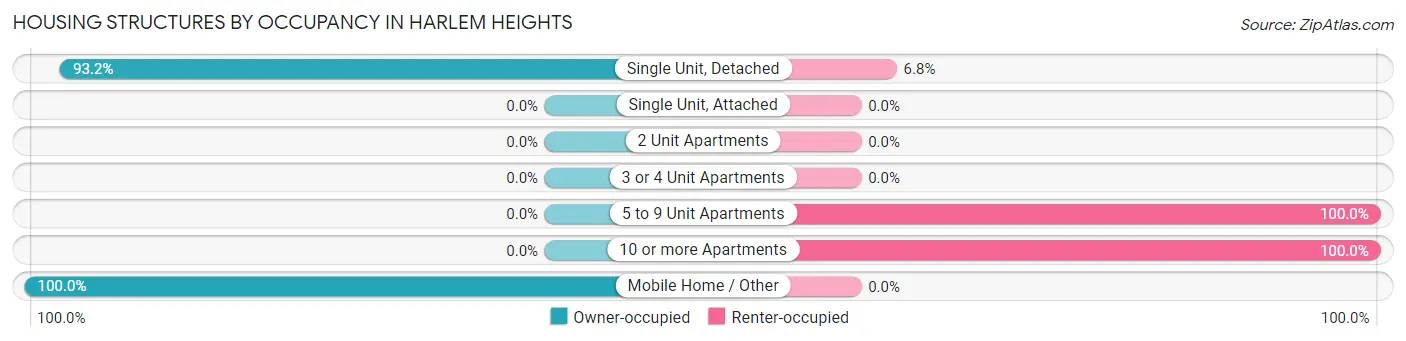
| Structure Type | Owner-occupied | Renter-occupied |
| Single Unit, Detached | 259 (93.2%) | 19 (6.8%) |
| Single Unit, Attached | 0 (0.0%) | 0 (0.0%) |
| 2 Unit Apartments | 0 (0.0%) | 0 (0.0%) |
| 3 or 4 Unit Apartments | 0 (0.0%) | 0 (0.0%) |
| 5 to 9 Unit Apartments | 0 (0.0%) | 50 (100.0%) |
| 10 or more Apartments | 0 (0.0%) | 219 (100.0%) |
| Mobile Home / Other | 15 (100.0%) | 0 (0.0%) |
| Total | 274 (48.7%) | 288 (51.2%) |
Housing Structures by Number of Rooms in Harlem Heights
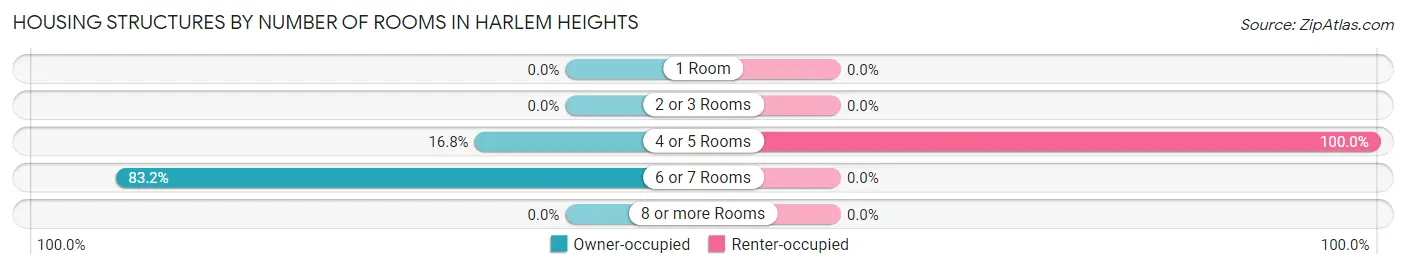
| Number of Rooms | Owner-occupied | Renter-occupied |
| 1 Room | 0 (0.0%) | 0 (0.0%) |
| 2 or 3 Rooms | 0 (0.0%) | 0 (0.0%) |
| 4 or 5 Rooms | 46 (16.8%) | 288 (100.0%) |
| 6 or 7 Rooms | 228 (83.2%) | 0 (0.0%) |
| 8 or more Rooms | 0 (0.0%) | 0 (0.0%) |
| Total | 274 (100.0%) | 288 (100.0%) |
Housing Structure by Heating Type in Harlem Heights
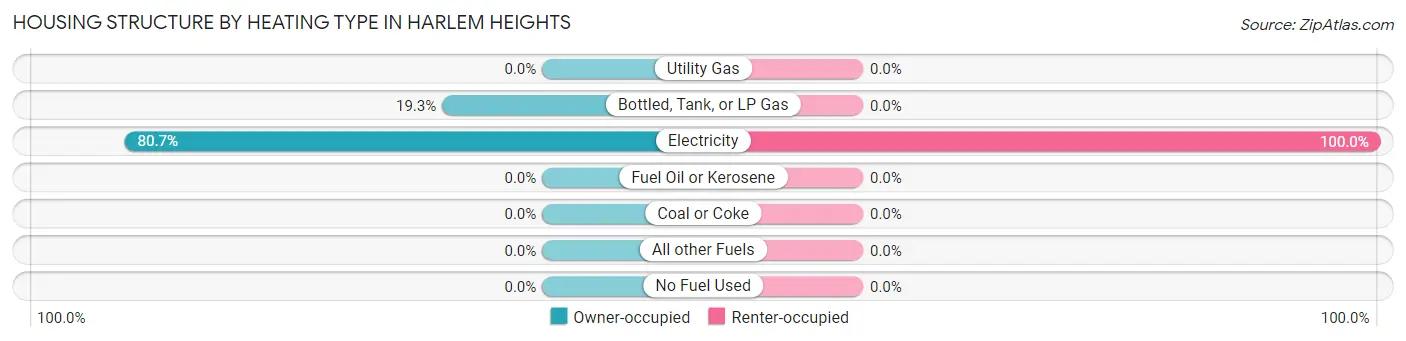
| Heating Type | Owner-occupied | Renter-occupied |
| Utility Gas | 0 (0.0%) | 0 (0.0%) |
| Bottled, Tank, or LP Gas | 53 (19.3%) | 0 (0.0%) |
| Electricity | 221 (80.7%) | 288 (100.0%) |
| Fuel Oil or Kerosene | 0 (0.0%) | 0 (0.0%) |
| Coal or Coke | 0 (0.0%) | 0 (0.0%) |
| All other Fuels | 0 (0.0%) | 0 (0.0%) |
| No Fuel Used | 0 (0.0%) | 0 (0.0%) |
| Total | 274 (100.0%) | 288 (100.0%) |
Household Vehicle Usage in Harlem Heights
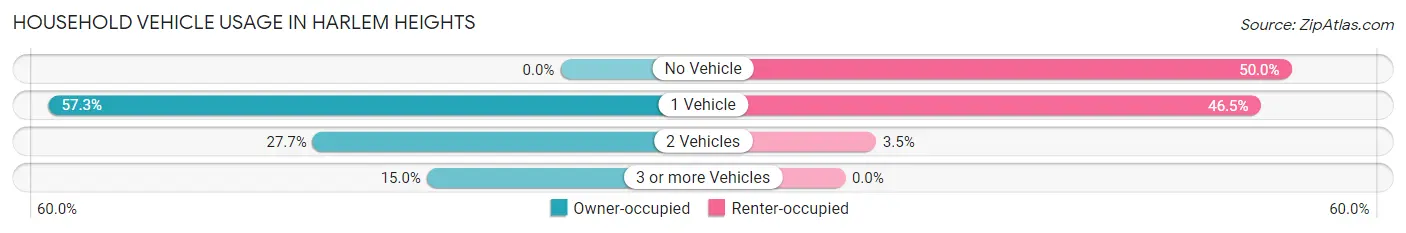
| Vehicles per Household | Owner-occupied | Renter-occupied |
| No Vehicle | 0 (0.0%) | 144 (50.0%) |
| 1 Vehicle | 157 (57.3%) | 134 (46.5%) |
| 2 Vehicles | 76 (27.7%) | 10 (3.5%) |
| 3 or more Vehicles | 41 (15.0%) | 0 (0.0%) |
| Total | 274 (100.0%) | 288 (100.0%) |
Real Estate & Mortgages in Harlem Heights
Real Estate and Mortgage Overview in Harlem Heights
| Characteristic | Without Mortgage | With Mortgage |
| Housing Units | 105 | 169 |
| Median Property Value | $115,900 | $157,000 |
| Median Household Income | - | - |
| Monthly Housing Costs | $458 | $0 |
| Real Estate Taxes | $938 | $0 |
Property Value by Mortgage Status in Harlem Heights
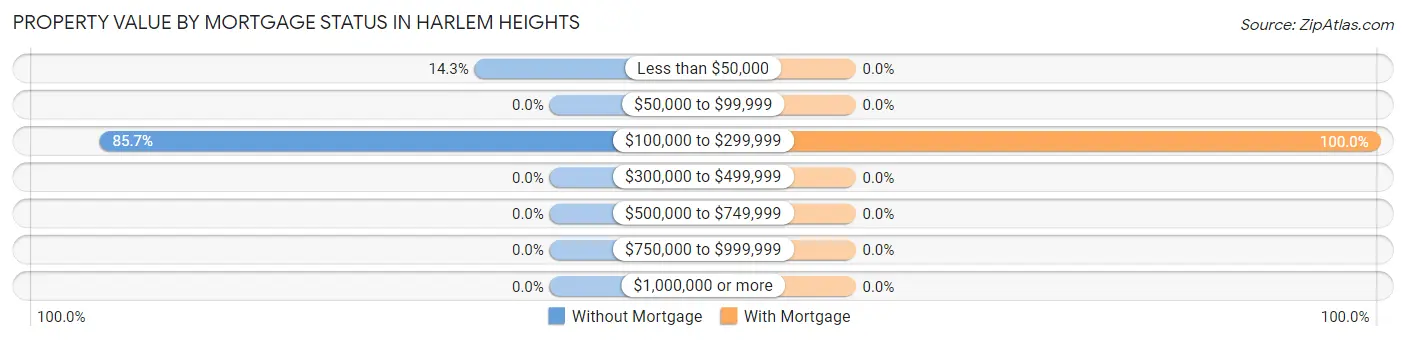
| Property Value | Without Mortgage | With Mortgage |
| Less than $50,000 | 15 (14.3%) | 0 (0.0%) |
| $50,000 to $99,999 | 0 (0.0%) | 0 (0.0%) |
| $100,000 to $299,999 | 90 (85.7%) | 169 (100.0%) |
| $300,000 to $499,999 | 0 (0.0%) | 0 (0.0%) |
| $500,000 to $749,999 | 0 (0.0%) | 0 (0.0%) |
| $750,000 to $999,999 | 0 (0.0%) | 0 (0.0%) |
| $1,000,000 or more | 0 (0.0%) | 0 (0.0%) |
| Total | 105 (100.0%) | 169 (100.0%) |
Household Income by Mortgage Status in Harlem Heights
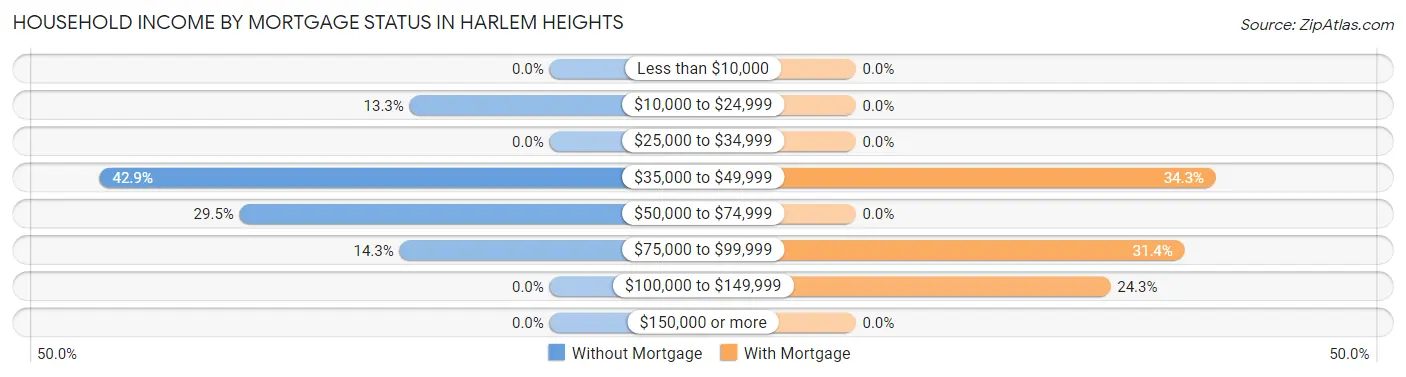
| Household Income | Without Mortgage | With Mortgage |
| Less than $10,000 | 0 (0.0%) | 0 (0.0%) |
| $10,000 to $24,999 | 14 (13.3%) | 0 (0.0%) |
| $25,000 to $34,999 | 0 (0.0%) | 0 (0.0%) |
| $35,000 to $49,999 | 45 (42.9%) | 58 (34.3%) |
| $50,000 to $74,999 | 31 (29.5%) | 0 (0.0%) |
| $75,000 to $99,999 | 15 (14.3%) | 53 (31.4%) |
| $100,000 to $149,999 | 0 (0.0%) | 41 (24.3%) |
| $150,000 or more | 0 (0.0%) | 0 (0.0%) |
| Total | 105 (100.0%) | 169 (100.0%) |
Property Value to Household Income Ratio in Harlem Heights
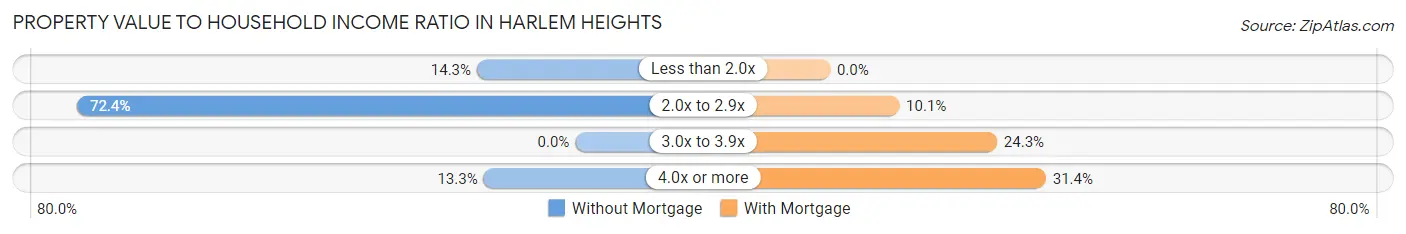
| Value-to-Income Ratio | Without Mortgage | With Mortgage |
| Less than 2.0x | 15 (14.3%) | 0 (0.0%) |
| 2.0x to 2.9x | 76 (72.4%) | 17 (10.1%) |
| 3.0x to 3.9x | 0 (0.0%) | 41 (24.3%) |
| 4.0x or more | 14 (13.3%) | 53 (31.4%) |
| Total | 105 (100.0%) | 169 (100.0%) |
Real Estate Taxes by Mortgage Status in Harlem Heights
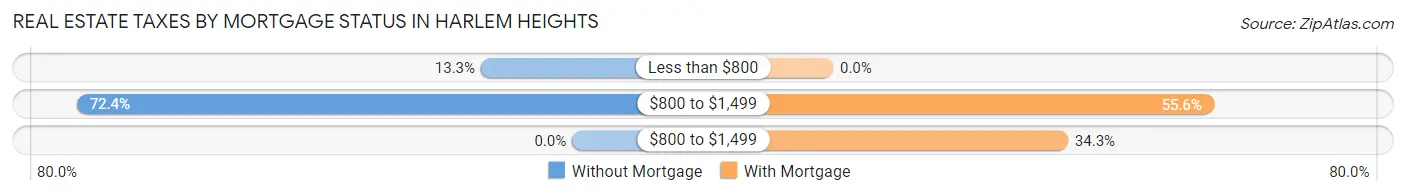
| Property Taxes | Without Mortgage | With Mortgage |
| Less than $800 | 14 (13.3%) | 0 (0.0%) |
| $800 to $1,499 | 76 (72.4%) | 94 (55.6%) |
| $800 to $1,499 | 0 (0.0%) | 58 (34.3%) |
| Total | 105 (100.0%) | 169 (100.0%) |
Health & Disability in Harlem Heights
Health Insurance Coverage by Age in Harlem Heights
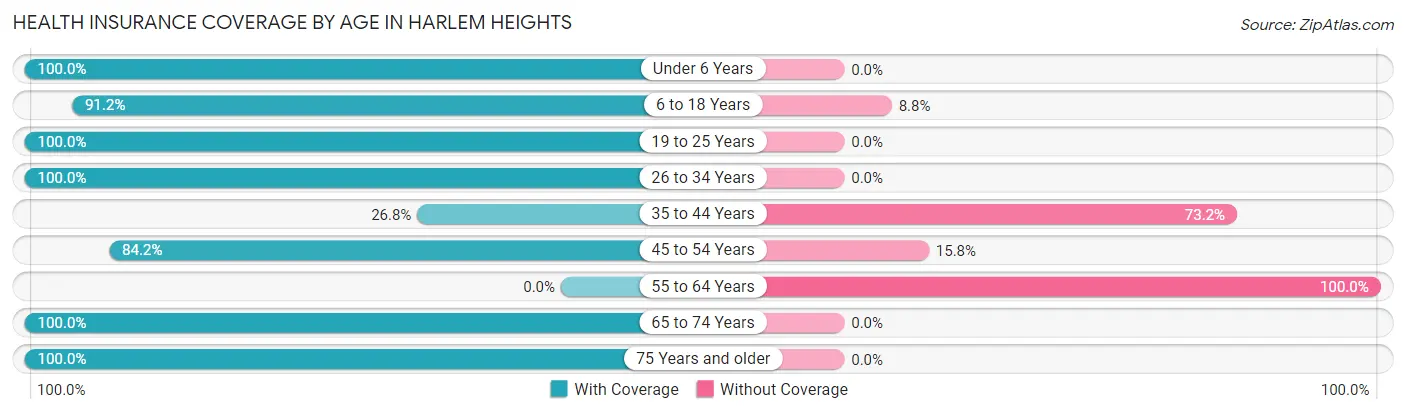
| Age Bracket | With Coverage | Without Coverage |
| Under 6 Years | 114 (100.0%) | 0 (0.0%) |
| 6 to 18 Years | 402 (91.2%) | 39 (8.8%) |
| 19 to 25 Years | 258 (100.0%) | 0 (0.0%) |
| 26 to 34 Years | 69 (100.0%) | 0 (0.0%) |
| 35 to 44 Years | 75 (26.8%) | 205 (73.2%) |
| 45 to 54 Years | 267 (84.2%) | 50 (15.8%) |
| 55 to 64 Years | 0 (0.0%) | 27 (100.0%) |
| 65 to 74 Years | 159 (100.0%) | 0 (0.0%) |
| 75 Years and older | 29 (100.0%) | 0 (0.0%) |
| Total | 1,373 (81.0%) | 321 (19.0%) |
Health Insurance Coverage by Citizenship Status in Harlem Heights
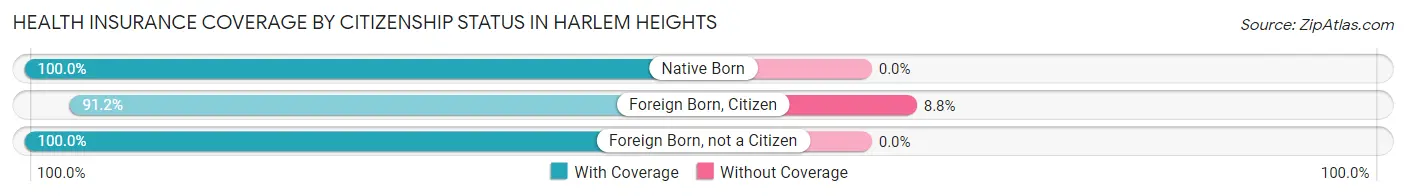
| Citizenship Status | With Coverage | Without Coverage |
| Native Born | 114 (100.0%) | 0 (0.0%) |
| Foreign Born, Citizen | 402 (91.2%) | 39 (8.8%) |
| Foreign Born, not a Citizen | 258 (100.0%) | 0 (0.0%) |
Health Insurance Coverage by Household Income in Harlem Heights
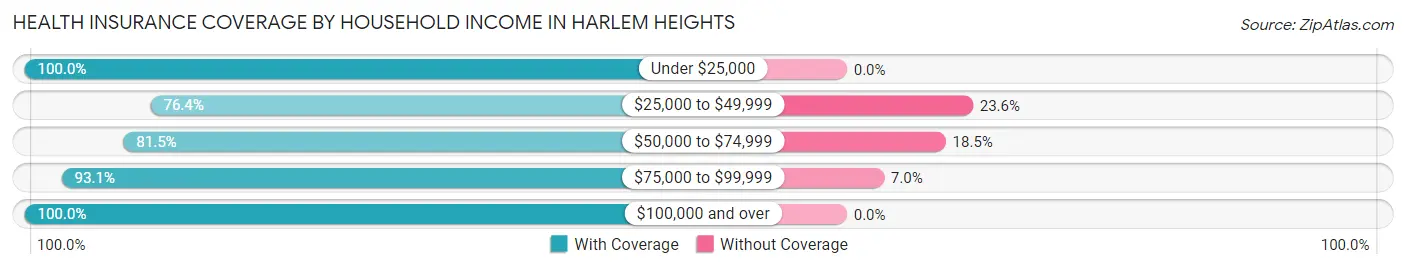
| Household Income | With Coverage | Without Coverage |
| Under $25,000 | 76 (100.0%) | 0 (0.0%) |
| $25,000 to $49,999 | 819 (76.4%) | 253 (23.6%) |
| $50,000 to $74,999 | 220 (81.5%) | 50 (18.5%) |
| $75,000 to $99,999 | 241 (93.0%) | 18 (7.0%) |
| $100,000 and over | 17 (100.0%) | 0 (0.0%) |
Public vs Private Health Insurance Coverage by Age in Harlem Heights
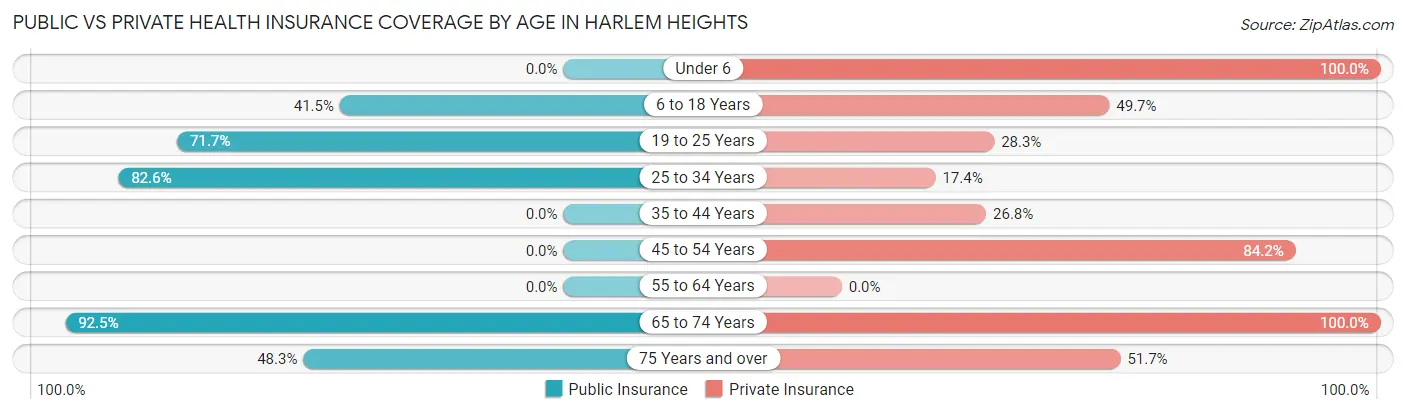
| Age Bracket | Public Insurance | Private Insurance |
| Under 6 | 0 (0.0%) | 114 (100.0%) |
| 6 to 18 Years | 183 (41.5%) | 219 (49.7%) |
| 19 to 25 Years | 185 (71.7%) | 73 (28.3%) |
| 25 to 34 Years | 57 (82.6%) | 12 (17.4%) |
| 35 to 44 Years | 0 (0.0%) | 75 (26.8%) |
| 45 to 54 Years | 0 (0.0%) | 267 (84.2%) |
| 55 to 64 Years | 0 (0.0%) | 0 (0.0%) |
| 65 to 74 Years | 147 (92.4%) | 159 (100.0%) |
| 75 Years and over | 14 (48.3%) | 15 (51.7%) |
| Total | 586 (34.6%) | 934 (55.1%) |
Disability Status by Sex by Age in Harlem Heights
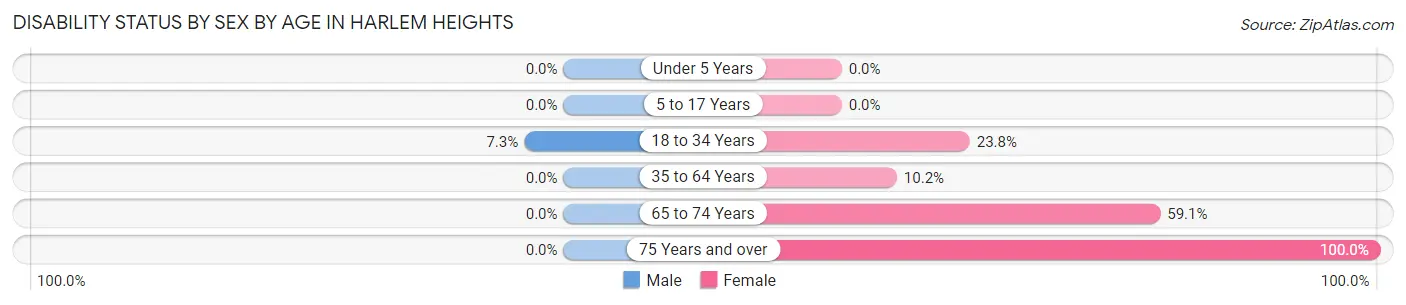
| Age Bracket | Male | Female |
| Under 5 Years | 0 (0.0%) | 0 (0.0%) |
| 5 to 17 Years | 0 (0.0%) | 0 (0.0%) |
| 18 to 34 Years | 14 (7.3%) | 48 (23.8%) |
| 35 to 64 Years | 0 (0.0%) | 31 (10.2%) |
| 65 to 74 Years | 0 (0.0%) | 94 (59.1%) |
| 75 Years and over | 0 (0.0%) | 14 (100.0%) |
Disability Class by Sex by Age in Harlem Heights
Disability Class: Hearing Difficulty
| Age Bracket | Male | Female |
| Under 5 Years | 0 (0.0%) | 0 (0.0%) |
| 5 to 17 Years | 0 (0.0%) | 0 (0.0%) |
| 18 to 34 Years | 0 (0.0%) | 0 (0.0%) |
| 35 to 64 Years | 0 (0.0%) | 0 (0.0%) |
| 65 to 74 Years | 0 (0.0%) | 0 (0.0%) |
| 75 Years and over | 0 (0.0%) | 0 (0.0%) |
Disability Class: Vision Difficulty
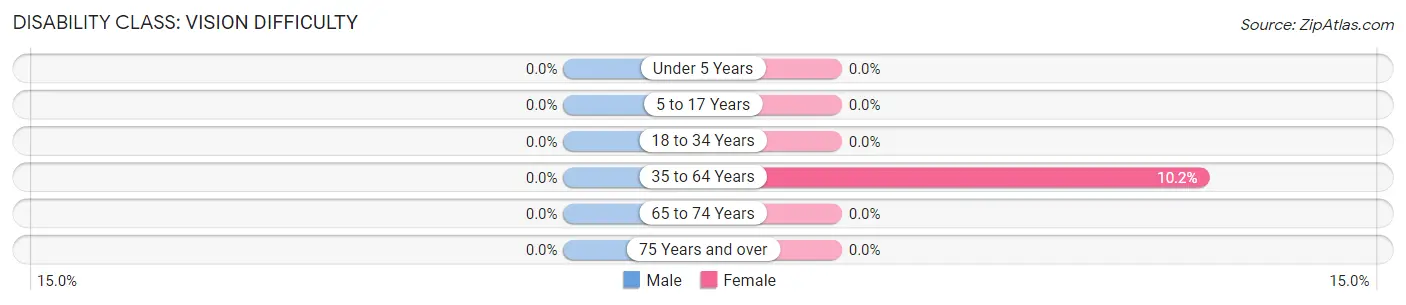
| Age Bracket | Male | Female |
| Under 5 Years | 0 (0.0%) | 0 (0.0%) |
| 5 to 17 Years | 0 (0.0%) | 0 (0.0%) |
| 18 to 34 Years | 0 (0.0%) | 0 (0.0%) |
| 35 to 64 Years | 0 (0.0%) | 31 (10.2%) |
| 65 to 74 Years | 0 (0.0%) | 0 (0.0%) |
| 75 Years and over | 0 (0.0%) | 0 (0.0%) |
Disability Class: Cognitive Difficulty
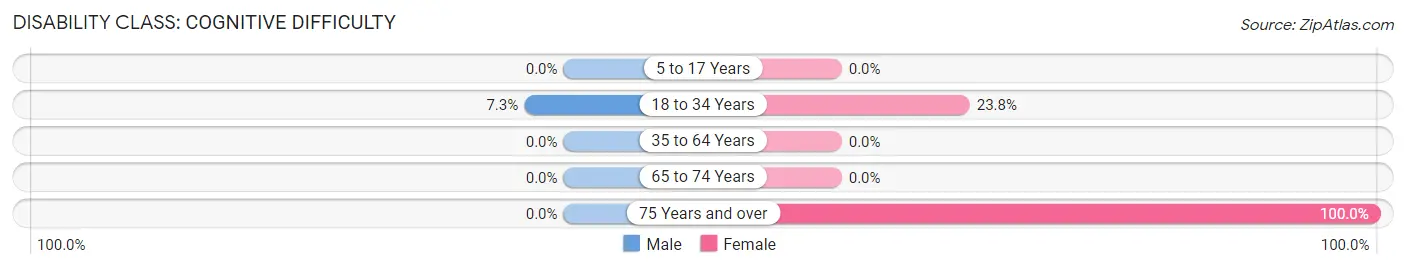
| Age Bracket | Male | Female |
| 5 to 17 Years | 0 (0.0%) | 0 (0.0%) |
| 18 to 34 Years | 14 (7.3%) | 48 (23.8%) |
| 35 to 64 Years | 0 (0.0%) | 0 (0.0%) |
| 65 to 74 Years | 0 (0.0%) | 0 (0.0%) |
| 75 Years and over | 0 (0.0%) | 14 (100.0%) |
Disability Class: Ambulatory Difficulty
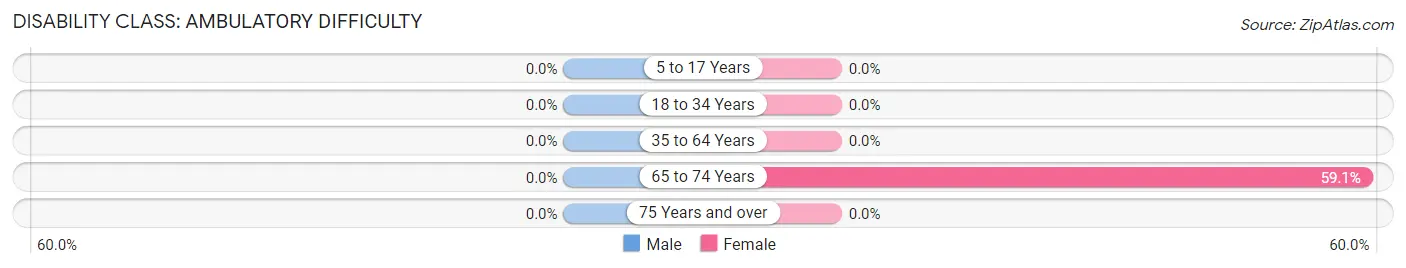
| Age Bracket | Male | Female |
| 5 to 17 Years | 0 (0.0%) | 0 (0.0%) |
| 18 to 34 Years | 0 (0.0%) | 0 (0.0%) |
| 35 to 64 Years | 0 (0.0%) | 0 (0.0%) |
| 65 to 74 Years | 0 (0.0%) | 94 (59.1%) |
| 75 Years and over | 0 (0.0%) | 0 (0.0%) |
Disability Class: Self-Care Difficulty
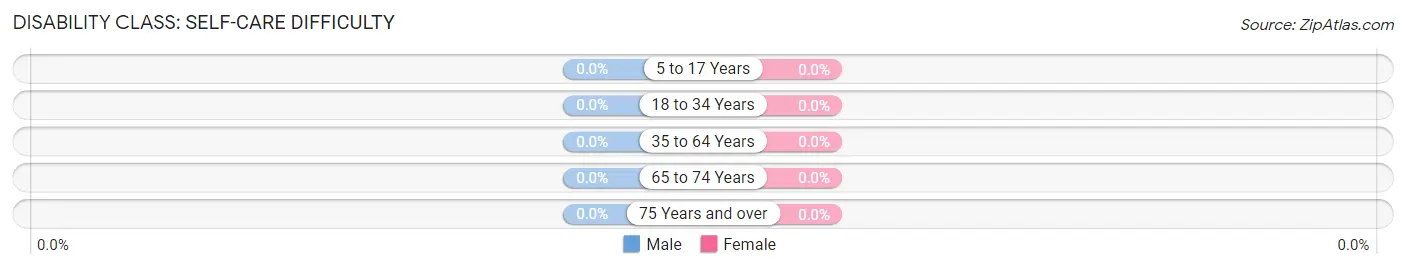
| Age Bracket | Male | Female |
| 5 to 17 Years | 0 (0.0%) | 0 (0.0%) |
| 18 to 34 Years | 0 (0.0%) | 0 (0.0%) |
| 35 to 64 Years | 0 (0.0%) | 0 (0.0%) |
| 65 to 74 Years | 0 (0.0%) | 0 (0.0%) |
| 75 Years and over | 0 (0.0%) | 0 (0.0%) |
Technology Access in Harlem Heights
Computing Device Access in Harlem Heights
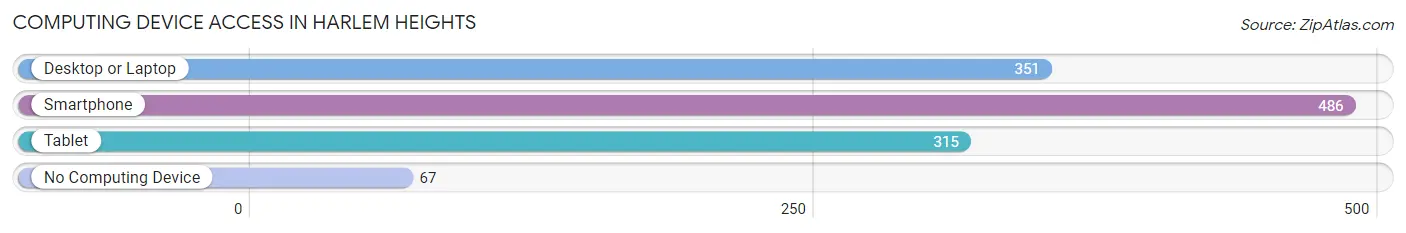
| Device Type | # Households | % Households |
| Desktop or Laptop | 351 | 62.5% |
| Smartphone | 486 | 86.5% |
| Tablet | 315 | 56.0% |
| No Computing Device | 67 | 11.9% |
| Total | 562 | 100.0% |
Internet Access in Harlem Heights
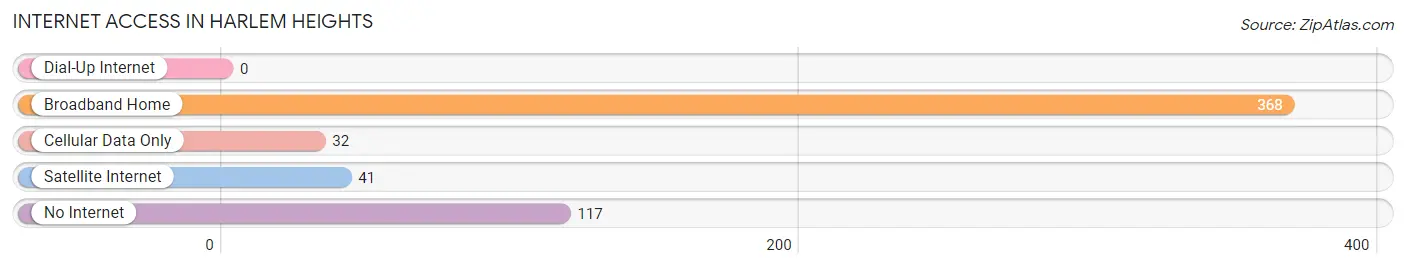
| Internet Type | # Households | % Households |
| Dial-Up Internet | 0 | 0.0% |
| Broadband Home | 368 | 65.5% |
| Cellular Data Only | 32 | 5.7% |
| Satellite Internet | 41 | 7.3% |
| No Internet | 117 | 20.8% |
| Total | 562 | 100.0% |
Harlem Heights Summary
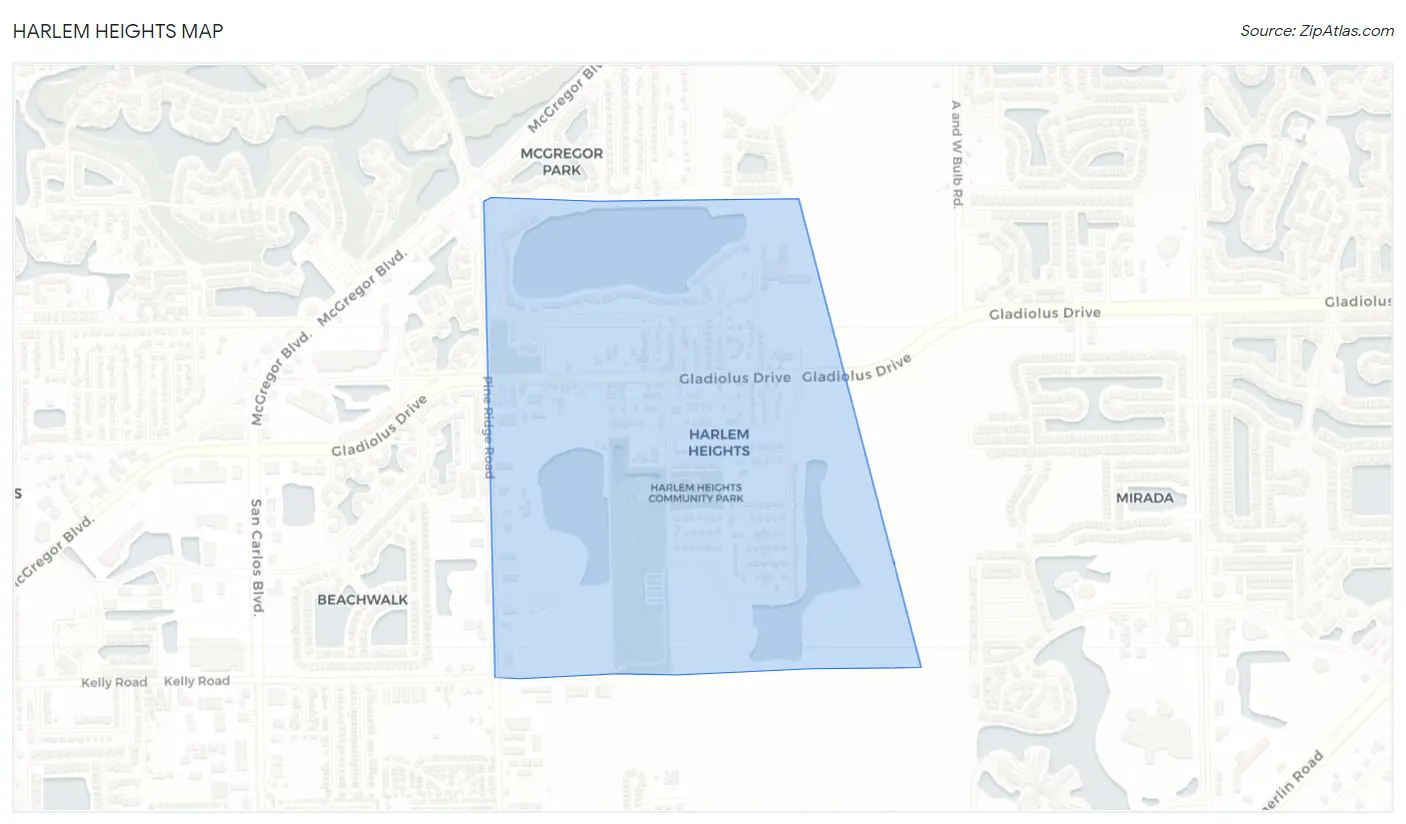
Harlem Heights is an unincorporated community located in Lee County, Florida, United States. It is located in the northern part of the county, just south of Fort Myers. The community is bordered by the Caloosahatchee River to the east and the Orange River to the west.
History
Harlem Heights was originally settled by freed slaves in the late 19th century. The community was named after the city of Harlem in New York City. The first settlers were former slaves who had been freed after the Civil War. They were attracted to the area by the fertile soil and the abundance of wildlife. The community grew slowly but steadily over the years, and by the early 20th century, it had become a thriving agricultural community.
The community was largely self-sufficient, with its own stores, churches, and schools. The community was also home to a number of African-American businesses, including a barber shop, a grocery store, and a restaurant.
In the 1950s, the community began to decline as many of its residents moved away in search of better opportunities. By the 1970s, the population had dwindled to just a few hundred people. In recent years, the community has seen a resurgence in population as new residents have moved in and revitalized the area.
Geography
Harlem Heights is located in northern Lee County, just south of Fort Myers. The community is bordered by the Caloosahatchee River to the east and the Orange River to the west. The area is mostly flat, with some low hills in the northern part of the community. The soil is mostly sandy and loamy, with some areas of clay.
The climate in Harlem Heights is subtropical, with hot, humid summers and mild winters. The average annual temperature is around 75°F (24°C). The average annual precipitation is around 50 inches (127 cm).
Economy
The economy of Harlem Heights is largely based on agriculture. The area is home to a number of farms, which produce a variety of crops, including citrus fruits, vegetables, and hay. The community is also home to a number of small businesses, including restaurants, convenience stores, and auto repair shops.
Demographics
As of the 2010 census, the population of Harlem Heights was 1,845. The racial makeup of the community was 79.3% White, 15.2% African American, 0.7% Native American, 0.5% Asian, 0.1% Pacific Islander, and 4.2% from other races. The median household income was $37,917, and the median family income was $41,917. The per capita income was $17,917.
Conclusion
Harlem Heights is a small, unincorporated community located in Lee County, Florida. The community was originally settled by freed slaves in the late 19th century and has since grown into a thriving agricultural community. The economy of the community is largely based on agriculture, and the population is mostly White and African American. The area has seen a resurgence in population in recent years, and the community is now home to a number of small businesses.
Common Questions
What is Per Capita Income in Harlem Heights?
Per Capita income in Harlem Heights is $18,538.
What is the Median Family Income in Harlem Heights?
Median Family Income in Harlem Heights is $37,806.
What is the Median Household income in Harlem Heights?
Median Household Income in Harlem Heights is $29,878.
What is Income or Wage Gap in Harlem Heights?
Income or Wage Gap in Harlem Heights is 1.2%.
Women in Harlem Heights earn 98.8 cents for every dollar earned by a man.
What is Inequality or Gini Index in Harlem Heights?
Inequality or Gini Index in Harlem Heights is 0.36.
What is the Total Population of Harlem Heights?
Total Population of Harlem Heights is 1,694.
What is the Total Male Population of Harlem Heights?
Total Male Population of Harlem Heights is 861.
What is the Total Female Population of Harlem Heights?
Total Female Population of Harlem Heights is 833.
What is the Ratio of Males per 100 Females in Harlem Heights?
There are 103.36 Males per 100 Females in Harlem Heights.
What is the Ratio of Females per 100 Males in Harlem Heights?
There are 96.75 Females per 100 Males in Harlem Heights.
What is the Median Population Age in Harlem Heights?
Median Population Age in Harlem Heights is 26.5 Years.
What is the Average Family Size in Harlem Heights
Average Family Size in Harlem Heights is 4.1 People.
What is the Average Household Size in Harlem Heights
Average Household Size in Harlem Heights is 3.0 People.
How Large is the Labor Force in Harlem Heights?
There are 712 People in the Labor Forcein in Harlem Heights.
What is the Percentage of People in the Labor Force in Harlem Heights?
52.9% of People are in the Labor Force in Harlem Heights.
What is the Unemployment Rate in Harlem Heights?
Unemployment Rate in Harlem Heights is 16.6%.