Ingenio, PR Map & Demographics
Ingenio Map
Ingenio Overview
$10,324
PER CAPITA INCOME
$24,453
AVG FAMILY INCOME
$22,192
AVG HOUSEHOLD INCOME
36.6%
WAGE / INCOME GAP [ % ]
63.4¢/ $1
WAGE / INCOME GAP [ $ ]
0.41
INEQUALITY / GINI INDEX
2,613
TOTAL POPULATION
1,363
MALE POPULATION
1,250
FEMALE POPULATION
109.04
MALES / 100 FEMALES
91.71
FEMALES / 100 MALES
43.8
MEDIAN AGE
3.5
AVG FAMILY SIZE
2.8
AVG HOUSEHOLD SIZE
889
LABOR FORCE [ PEOPLE ]
40.1%
PERCENT IN LABOR FORCE
16.4%
UNEMPLOYMENT RATE
Income in Ingenio
Income Overview in Ingenio
Per Capita Income in Ingenio is $10,324, while median incomes of families and households are $24,453 and $22,192 respectively.
| Characteristic | Number | Measure |
| Per Capita Income | 2,613 | $10,324 |
| Median Family Income | 585 | $24,453 |
| Mean Family Income | 585 | $28,410 |
| Median Household Income | 920 | $22,192 |
| Mean Household Income | 920 | $26,922 |
| Income Deficit | 585 | $0 |
| Wage / Income Gap (%) | 2,613 | 36.59% |
| Wage / Income Gap ($) | 2,613 | 63.41¢ per $1 |
| Gini / Inequality Index | 2,613 | 0.41 |
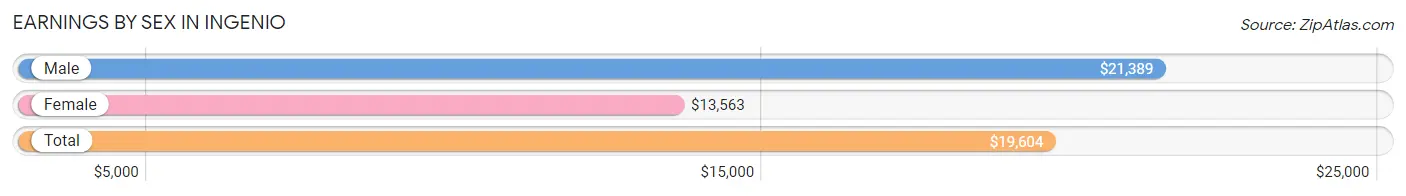
Earnings by Sex in Ingenio
Average Earnings in Ingenio are $19,604, $21,389 for men and $13,563 for women, a difference of 36.6%.
| Sex | Number | Average Earnings |
| Male | 530 (65.0%) | $21,389 |
| Female | 285 (35.0%) | $13,563 |
| Total | 815 (100.0%) | $19,604 |
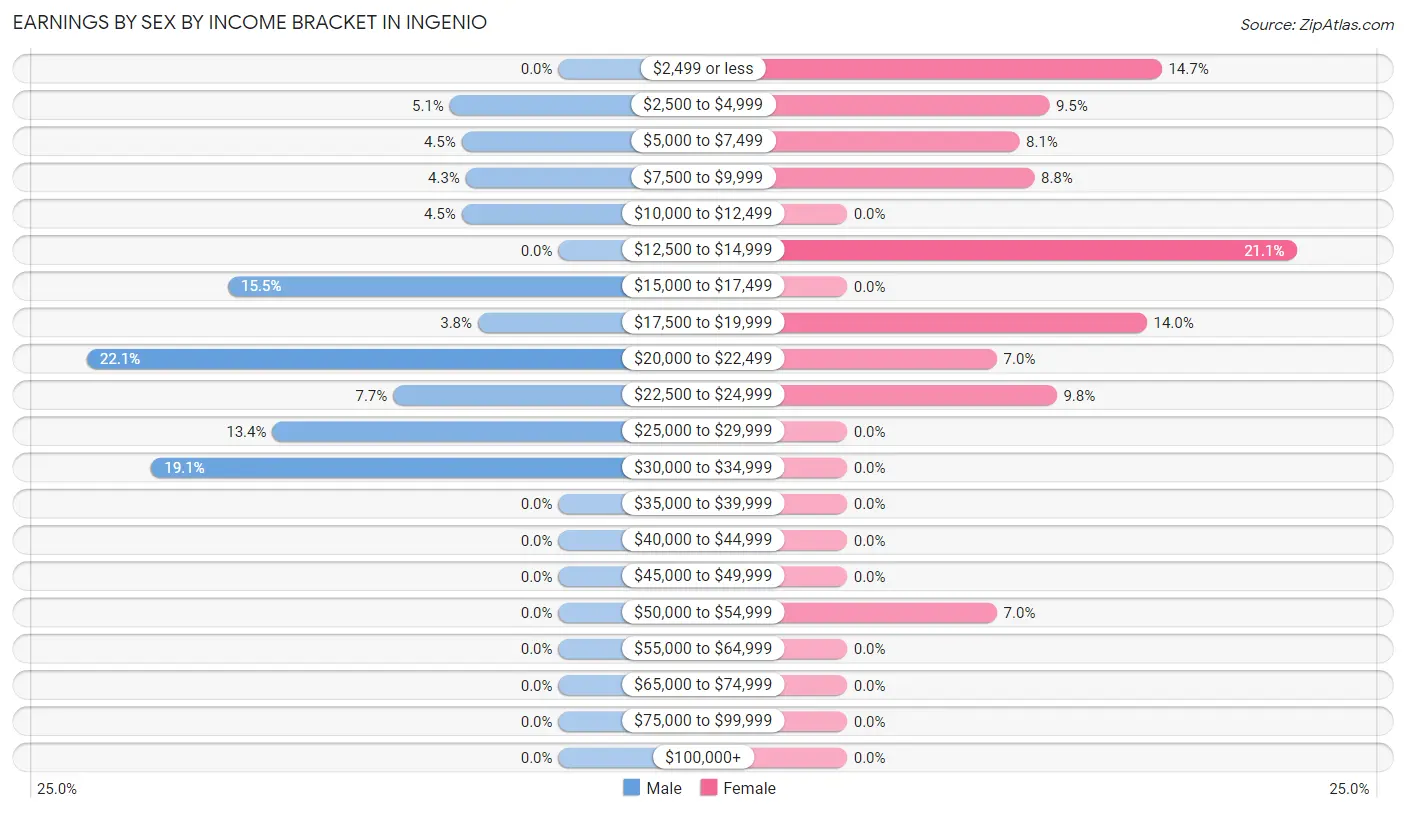
Earnings by Sex by Income Bracket in Ingenio
The most common earnings brackets in Ingenio are $20,000 to $22,499 for men (117 | 22.1%) and $12,500 to $14,999 for women (60 | 21.0%).
| Income | Male | Female |
| $2,499 or less | 0 (0.0%) | 42 (14.7%) |
| $2,500 to $4,999 | 27 (5.1%) | 27 (9.5%) |
| $5,000 to $7,499 | 24 (4.5%) | 23 (8.1%) |
| $7,500 to $9,999 | 23 (4.3%) | 25 (8.8%) |
| $10,000 to $12,499 | 24 (4.5%) | 0 (0.0%) |
| $12,500 to $14,999 | 0 (0.0%) | 60 (21.0%) |
| $15,000 to $17,499 | 82 (15.5%) | 0 (0.0%) |
| $17,500 to $19,999 | 20 (3.8%) | 40 (14.0%) |
| $20,000 to $22,499 | 117 (22.1%) | 20 (7.0%) |
| $22,500 to $24,999 | 41 (7.7%) | 28 (9.8%) |
| $25,000 to $29,999 | 71 (13.4%) | 0 (0.0%) |
| $30,000 to $34,999 | 101 (19.1%) | 0 (0.0%) |
| $35,000 to $39,999 | 0 (0.0%) | 0 (0.0%) |
| $40,000 to $44,999 | 0 (0.0%) | 0 (0.0%) |
| $45,000 to $49,999 | 0 (0.0%) | 0 (0.0%) |
| $50,000 to $54,999 | 0 (0.0%) | 20 (7.0%) |
| $55,000 to $64,999 | 0 (0.0%) | 0 (0.0%) |
| $65,000 to $74,999 | 0 (0.0%) | 0 (0.0%) |
| $75,000 to $99,999 | 0 (0.0%) | 0 (0.0%) |
| $100,000+ | 0 (0.0%) | 0 (0.0%) |
| Total | 530 (100.0%) | 285 (100.0%) |
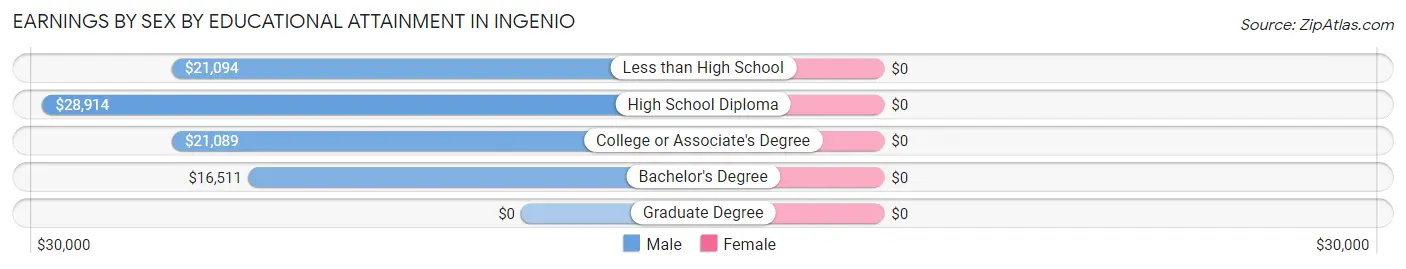
Earnings by Sex by Educational Attainment in Ingenio
| Educational Attainment | Male Income | Female Income |
| Less than High School | $21,094 | $0 |
| High School Diploma | $28,914 | $0 |
| College or Associate's Degree | $21,089 | $0 |
| Bachelor's Degree | $16,511 | $0 |
| Graduate Degree | - | - |
| Total | $21,603 | $13,563 |
Family Income in Ingenio
Family Income Brackets in Ingenio
According to the Ingenio family income data, there are 143 families falling into the $15,000 to $24,999 income range, which is the most common income bracket and makes up 24.4% of all families.
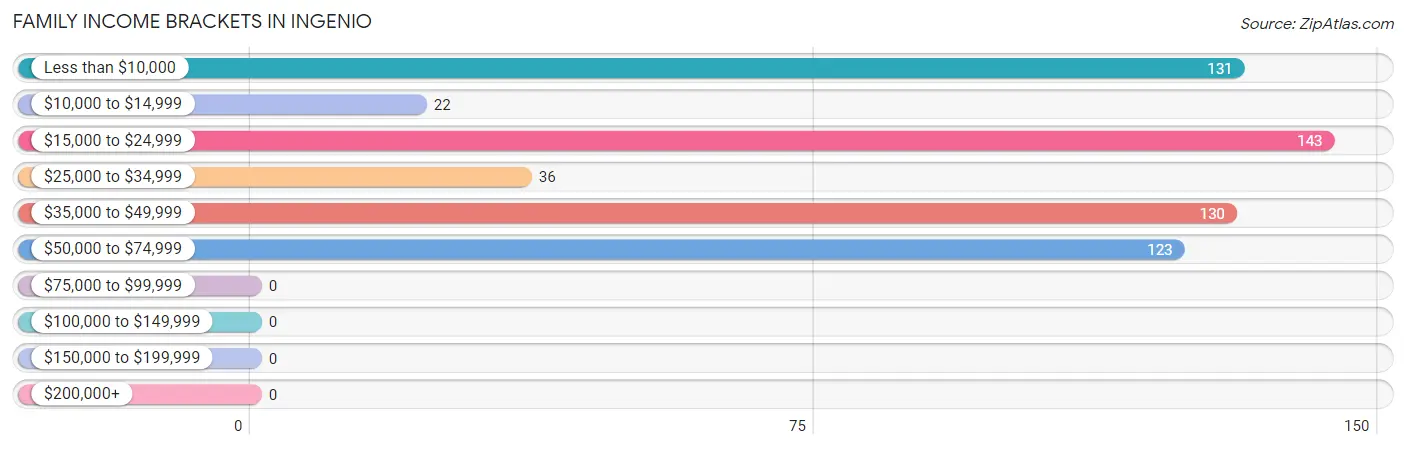
| Income Bracket | # Families | % Families |
| Less than $10,000 | 131 | 22.4% |
| $10,000 to $14,999 | 22 | 3.8% |
| $15,000 to $24,999 | 143 | 24.4% |
| $25,000 to $34,999 | 36 | 6.2% |
| $35,000 to $49,999 | 130 | 22.2% |
| $50,000 to $74,999 | 123 | 21.0% |
| $75,000 to $99,999 | 0 | 0.0% |
| $100,000 to $149,999 | 0 | 0.0% |
| $150,000 to $199,999 | 0 | 0.0% |
| $200,000+ | 0 | 0.0% |
Family Income by Famaliy Size in Ingenio
4-person families (115 | 19.7%) account for the highest median family income in Ingenio with $42,228 per family, while 2-person families (247 | 42.2%) have the highest median income of $14,568 per family member.
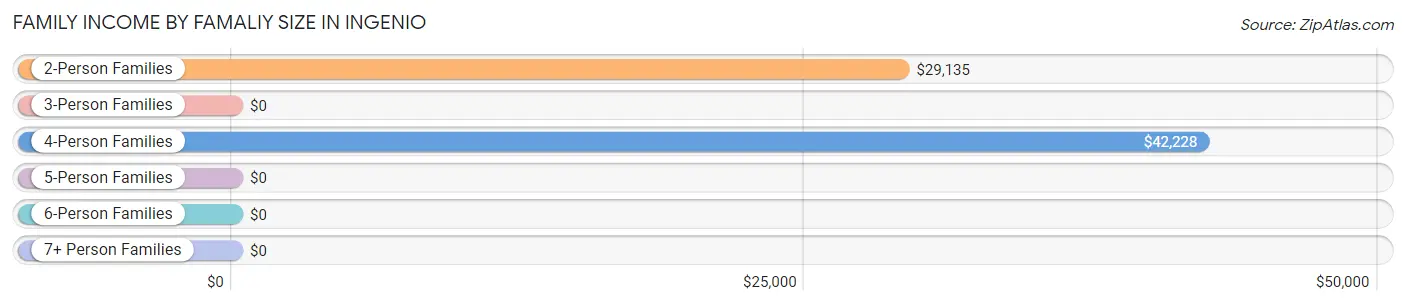
| Income Bracket | # Families | Median Income |
| 2-Person Families | 247 (42.2%) | $29,135 |
| 3-Person Families | 186 (31.8%) | $0 |
| 4-Person Families | 115 (19.7%) | $42,228 |
| 5-Person Families | 0 (0.0%) | $0 |
| 6-Person Families | 37 (6.3%) | $0 |
| 7+ Person Families | 0 (0.0%) | $0 |
| Total | 585 (100.0%) | $24,453 |
Family Income by Number of Earners in Ingenio
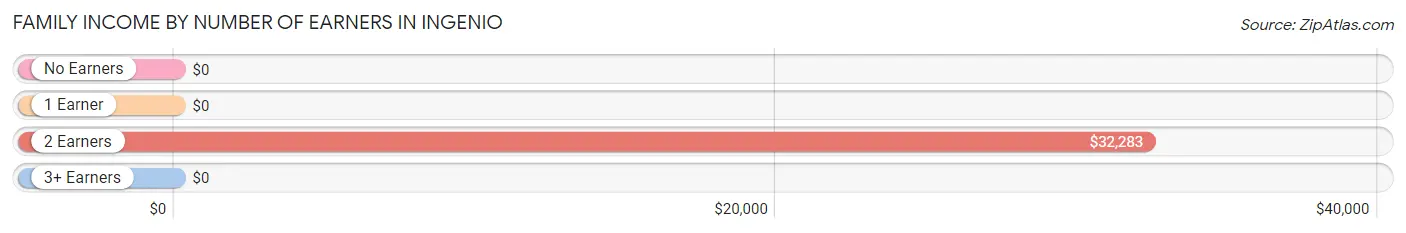
| Number of Earners | # Families | Median Income |
| No Earners | 229 (39.2%) | $0 |
| 1 Earner | 213 (36.4%) | $0 |
| 2 Earners | 126 (21.5%) | $32,283 |
| 3+ Earners | 17 (2.9%) | $0 |
| Total | 585 (100.0%) | $24,453 |
Household Income in Ingenio
Household Income Brackets in Ingenio
With 230 households falling in the category, the $15,000 to $24,999 income range is the most frequent in Ingenio, accounting for 25.0% of all households.
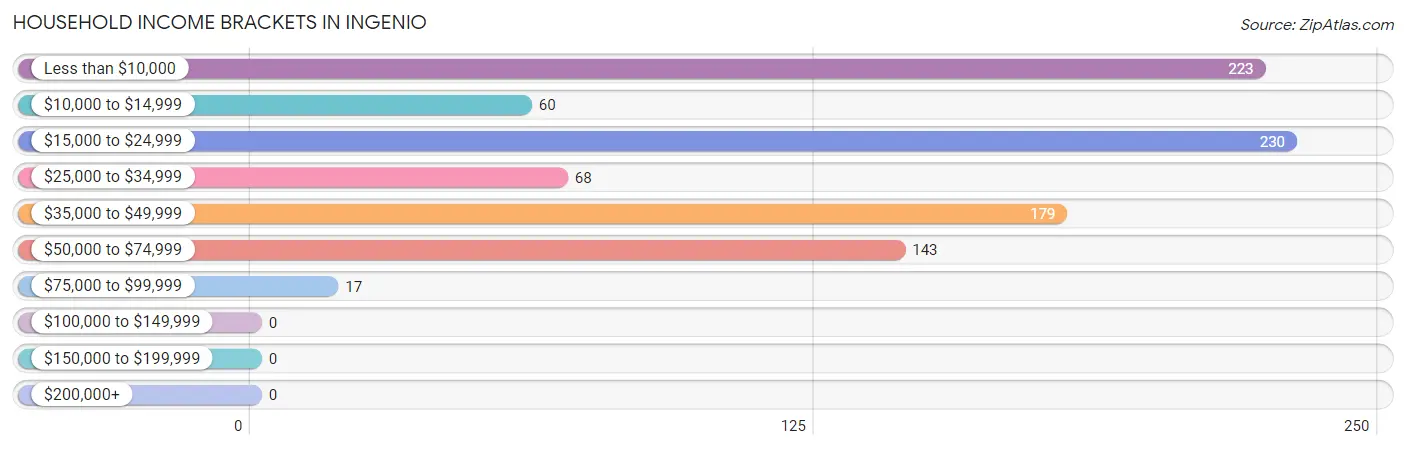
| Income Bracket | # Households | % Households |
| Less than $10,000 | 223 | 24.2% |
| $10,000 to $14,999 | 60 | 6.5% |
| $15,000 to $24,999 | 230 | 25.0% |
| $25,000 to $34,999 | 68 | 7.4% |
| $35,000 to $49,999 | 179 | 19.5% |
| $50,000 to $74,999 | 143 | 15.5% |
| $75,000 to $99,999 | 17 | 1.8% |
| $100,000 to $149,999 | 0 | 0.0% |
| $150,000 to $199,999 | 0 | 0.0% |
| $200,000+ | 0 | 0.0% |
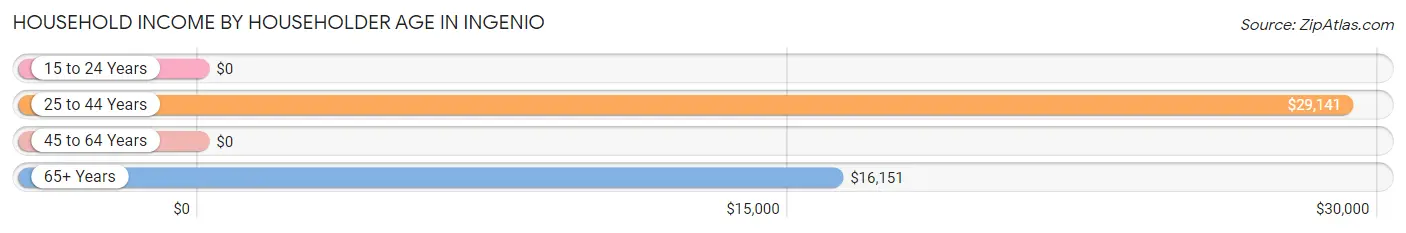
Household Income by Householder Age in Ingenio
The median household income in Ingenio is $22,192, with the highest median household income of $29,141 found in the 25 to 44 years age bracket for the primary householder. A total of 288 households (31.3%) fall into this category. Meanwhile, the 15 to 24 years age bracket for the primary householder has the lowest median household income of $0, with 24 households (2.6%) in this group.
| Income Bracket | # Households | Median Income |
| 15 to 24 Years | 24 (2.6%) | $0 |
| 25 to 44 Years | 288 (31.3%) | $29,141 |
| 45 to 64 Years | 257 (27.9%) | $0 |
| 65+ Years | 351 (38.2%) | $16,151 |
| Total | 920 (100.0%) | $22,192 |
Poverty in Ingenio
Income Below Poverty by Sex and Age in Ingenio
With 40.4% poverty level for males and 46.3% for females among the residents of Ingenio, under 5 year old males and 18 to 24 year old females are the most vulnerable to poverty, with 32 males (100.0%) and 24 females (100.0%) in their respective age groups living below the poverty level.
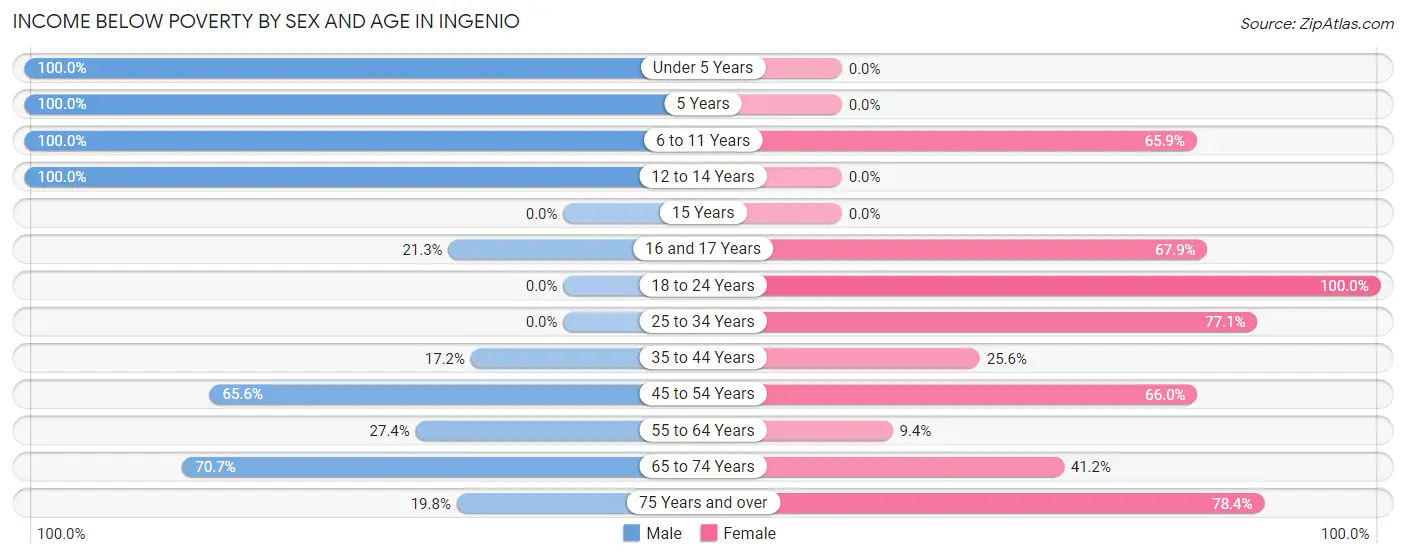
| Age Bracket | Male | Female |
| Under 5 Years | 32 (100.0%) | 0 (0.0%) |
| 5 Years | 42 (100.0%) | 0 (0.0%) |
| 6 to 11 Years | 30 (100.0%) | 143 (65.9%) |
| 12 to 14 Years | 30 (100.0%) | 0 (0.0%) |
| 15 Years | 0 (0.0%) | 0 (0.0%) |
| 16 and 17 Years | 32 (21.3%) | 57 (67.9%) |
| 18 to 24 Years | 0 (0.0%) | 24 (100.0%) |
| 25 to 34 Years | 0 (0.0%) | 54 (77.1%) |
| 35 to 44 Years | 51 (17.2%) | 52 (25.6%) |
| 45 to 54 Years | 128 (65.6%) | 33 (66.0%) |
| 55 to 64 Years | 34 (27.4%) | 21 (9.4%) |
| 65 to 74 Years | 152 (70.7%) | 75 (41.2%) |
| 75 Years and over | 19 (19.8%) | 120 (78.4%) |
| Total | 550 (40.4%) | 579 (46.3%) |
Income Above Poverty by Sex and Age in Ingenio
According to the poverty statistics in Ingenio, males aged 18 to 24 years and females aged 15 years are the age groups that are most secure financially, with 100.0% of males and 100.0% of females in these age groups living above the poverty line.
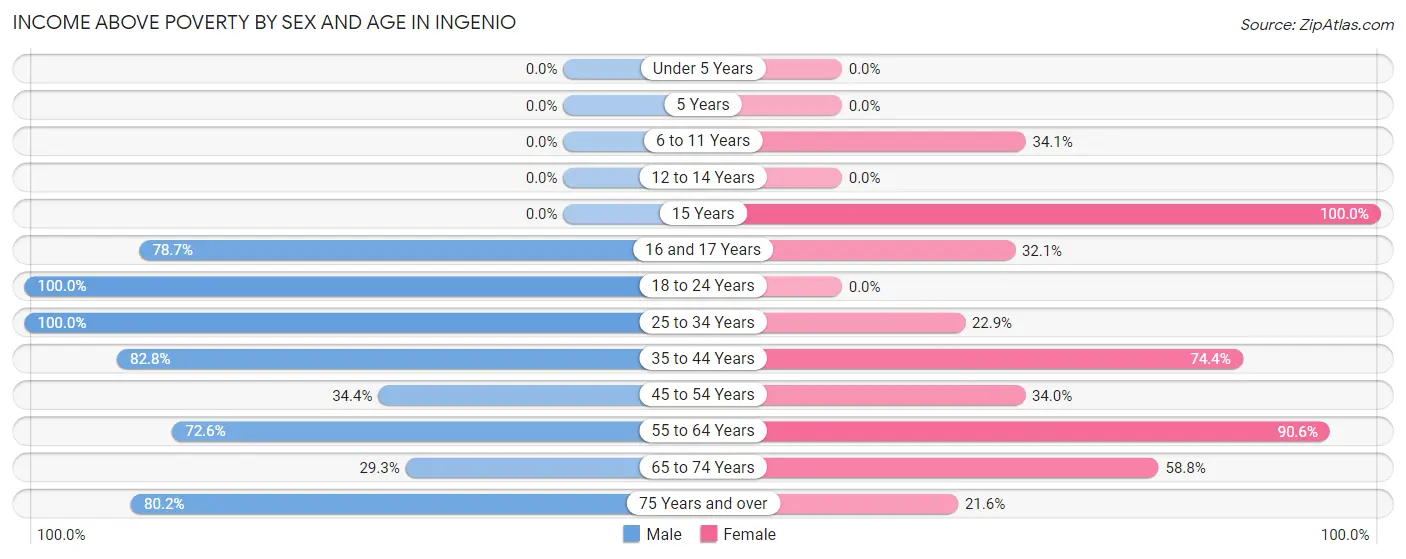
| Age Bracket | Male | Female |
| Under 5 Years | 0 (0.0%) | 0 (0.0%) |
| 5 Years | 0 (0.0%) | 0 (0.0%) |
| 6 to 11 Years | 0 (0.0%) | 74 (34.1%) |
| 12 to 14 Years | 0 (0.0%) | 0 (0.0%) |
| 15 Years | 0 (0.0%) | 44 (100.0%) |
| 16 and 17 Years | 118 (78.7%) | 27 (32.1%) |
| 18 to 24 Years | 70 (100.0%) | 0 (0.0%) |
| 25 to 34 Years | 82 (100.0%) | 16 (22.9%) |
| 35 to 44 Years | 246 (82.8%) | 151 (74.4%) |
| 45 to 54 Years | 67 (34.4%) | 17 (34.0%) |
| 55 to 64 Years | 90 (72.6%) | 202 (90.6%) |
| 65 to 74 Years | 63 (29.3%) | 107 (58.8%) |
| 75 Years and over | 77 (80.2%) | 33 (21.6%) |
| Total | 813 (59.7%) | 671 (53.7%) |
Income Below Poverty Among Married-Couple Families in Ingenio
The poverty statistics for married-couple families in Ingenio show that 15.2% or 46 of the total 303 families live below the poverty line. Families with no children have the highest poverty rate of 22.4%, comprising of 46 families. On the other hand, families with 1 or 2 children have the lowest poverty rate of 0.0%, which includes 0 families.
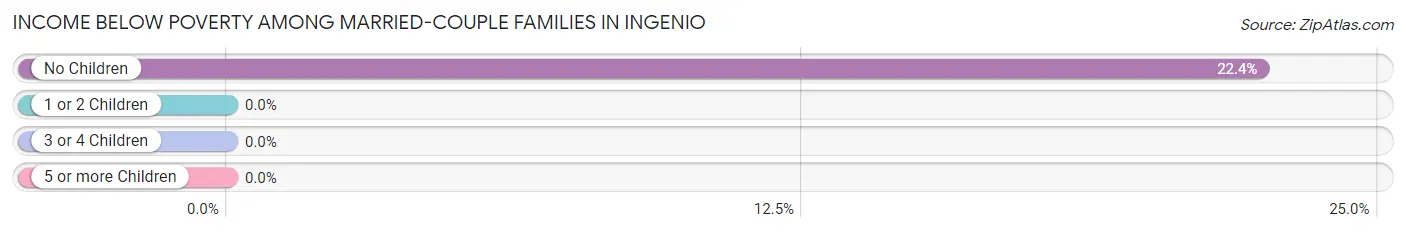
| Children | Above Poverty | Below Poverty |
| No Children | 159 (77.6%) | 46 (22.4%) |
| 1 or 2 Children | 98 (100.0%) | 0 (0.0%) |
| 3 or 4 Children | 0 (0.0%) | 0 (0.0%) |
| 5 or more Children | 0 (0.0%) | 0 (0.0%) |
| Total | 257 (84.8%) | 46 (15.2%) |
Income Below Poverty Among Single-Parent Households in Ingenio
According to the poverty data in Ingenio, 40.3% or 27 single-father households and 76.7% or 165 single-mother households are living below the poverty line. Among single-father households, those with 1 or 2 children have the highest poverty rate, with 27 households (100.0%) experiencing poverty. Likewise, among single-mother households, those with 1 or 2 children have the highest poverty rate, with 130 households (100.0%) falling below the poverty line.
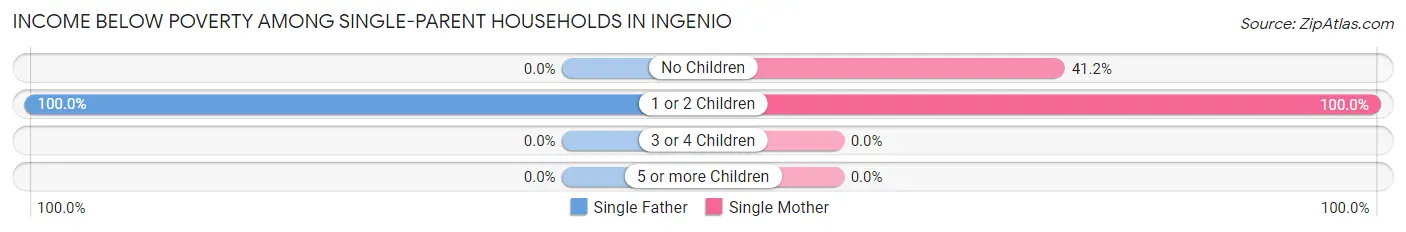
| Children | Single Father | Single Mother |
| No Children | 0 (0.0%) | 35 (41.2%) |
| 1 or 2 Children | 27 (100.0%) | 130 (100.0%) |
| 3 or 4 Children | 0 (0.0%) | 0 (0.0%) |
| 5 or more Children | 0 (0.0%) | 0 (0.0%) |
| Total | 27 (40.3%) | 165 (76.7%) |
Income Below Poverty Among Married-Couple vs Single-Parent Households in Ingenio
The poverty data for Ingenio shows that 46 of the married-couple family households (15.2%) and 192 of the single-parent households (68.1%) are living below the poverty level. Within the married-couple family households, those with no children have the highest poverty rate, with 46 households (22.4%) falling below the poverty line. Among the single-parent households, those with 1 or 2 children have the highest poverty rate, with 157 household (100.0%) living below poverty.
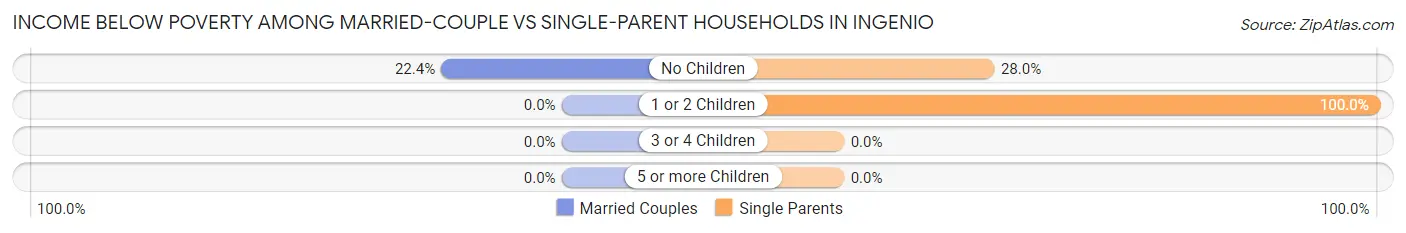
| Children | Married-Couple Families | Single-Parent Households |
| No Children | 46 (22.4%) | 35 (28.0%) |
| 1 or 2 Children | 0 (0.0%) | 157 (100.0%) |
| 3 or 4 Children | 0 (0.0%) | 0 (0.0%) |
| 5 or more Children | 0 (0.0%) | 0 (0.0%) |
| Total | 46 (15.2%) | 192 (68.1%) |
Race in Ingenio
The most populous races in Ingenio are Hispanic or Latino (2,583 | 98.9%), Some other Race (1,114 | 42.6%), and White / Caucasian (1,040 | 39.8%).
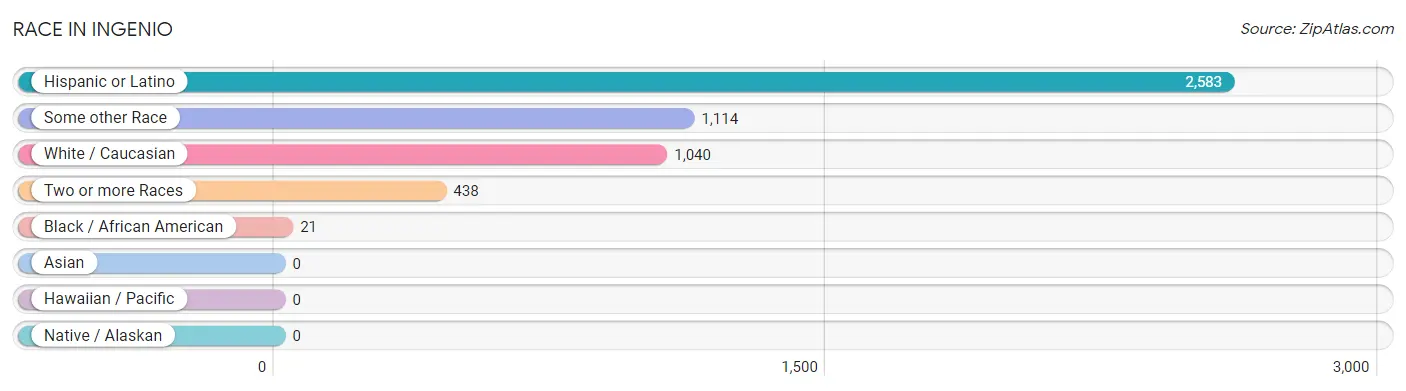
| Race | # Population | % Population |
| Asian | 0 | 0.0% |
| Black / African American | 21 | 0.8% |
| Hawaiian / Pacific | 0 | 0.0% |
| Hispanic or Latino | 2,583 | 98.9% |
| Native / Alaskan | 0 | 0.0% |
| White / Caucasian | 1,040 | 39.8% |
| Two or more Races | 438 | 16.8% |
| Some other Race | 1,114 | 42.6% |
| Total | 2,613 | 100.0% |
Ancestry in Ingenio
The most populous ancestries reported in Ingenio are Puerto Rican (2,536 | 97.1%), and Dominican (47 | 1.8%), together accounting for 98.9% of all Ingenio residents.
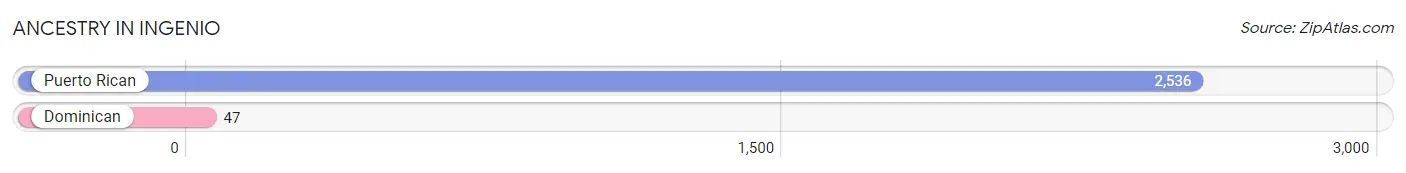
| Ancestry | # Population | % Population |
| Dominican | 47 | 1.8% |
| Puerto Rican | 2,536 | 97.1% | View All 2 Rows |
Immigrants in Ingenio

| Immigration Origin | # Population | % Population | View All 0 Rows |
Sex and Age in Ingenio
Sex and Age in Ingenio
The most populous age groups in Ingenio are 40 to 44 Years (193 | 14.2%) for men and 70 to 74 Years (161 | 12.9%) for women.
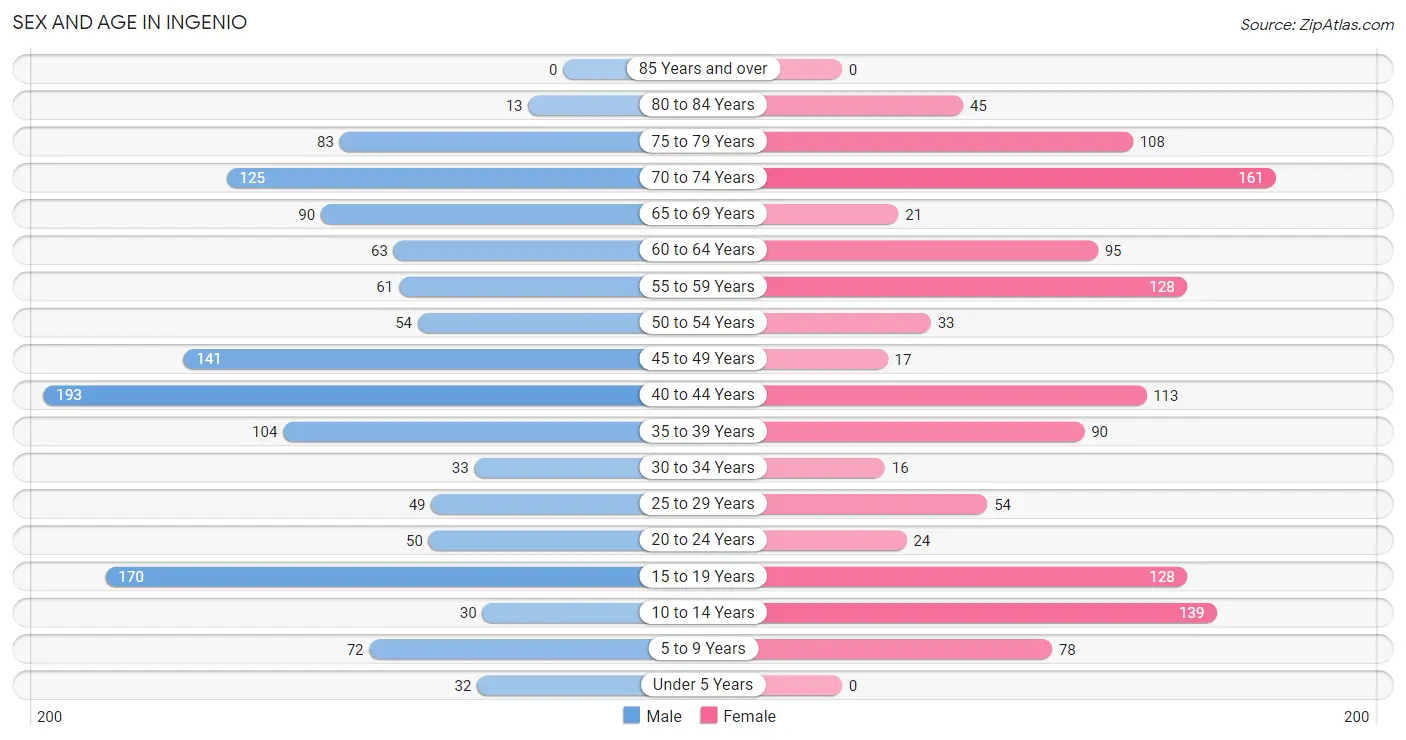
| Age Bracket | Male | Female |
| Under 5 Years | 32 (2.4%) | 0 (0.0%) |
| 5 to 9 Years | 72 (5.3%) | 78 (6.2%) |
| 10 to 14 Years | 30 (2.2%) | 139 (11.1%) |
| 15 to 19 Years | 170 (12.5%) | 128 (10.2%) |
| 20 to 24 Years | 50 (3.7%) | 24 (1.9%) |
| 25 to 29 Years | 49 (3.6%) | 54 (4.3%) |
| 30 to 34 Years | 33 (2.4%) | 16 (1.3%) |
| 35 to 39 Years | 104 (7.6%) | 90 (7.2%) |
| 40 to 44 Years | 193 (14.2%) | 113 (9.0%) |
| 45 to 49 Years | 141 (10.3%) | 17 (1.4%) |
| 50 to 54 Years | 54 (4.0%) | 33 (2.6%) |
| 55 to 59 Years | 61 (4.5%) | 128 (10.2%) |
| 60 to 64 Years | 63 (4.6%) | 95 (7.6%) |
| 65 to 69 Years | 90 (6.6%) | 21 (1.7%) |
| 70 to 74 Years | 125 (9.2%) | 161 (12.9%) |
| 75 to 79 Years | 83 (6.1%) | 108 (8.6%) |
| 80 to 84 Years | 13 (0.9%) | 45 (3.6%) |
| 85 Years and over | 0 (0.0%) | 0 (0.0%) |
| Total | 1,363 (100.0%) | 1,250 (100.0%) |
Families and Households in Ingenio
Median Family Size in Ingenio
The median family size in Ingenio is 3.50 persons per family, with married-couple families (303 | 51.8%) accounting for the largest median family size of 3.79 persons per family. On the other hand, single male/father families (67 | 11.5%) represent the smallest median family size with 3.00 persons per family.
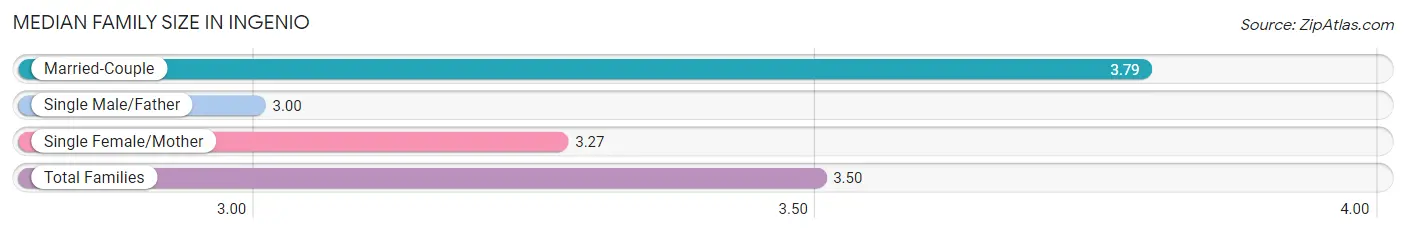
| Family Type | # Families | Family Size |
| Married-Couple | 303 (51.8%) | 3.79 |
| Single Male/Father | 67 (11.5%) | 3.00 |
| Single Female/Mother | 215 (36.7%) | 3.27 |
| Total Families | 585 (100.0%) | 3.50 |
Median Household Size in Ingenio
The median household size in Ingenio is 2.84 persons per household, with married-couple households (303 | 32.9%) accounting for the largest median household size of 3.99 persons per household. non-family households (335 | 36.4%) represent the smallest median household size with 1.10 persons per household.
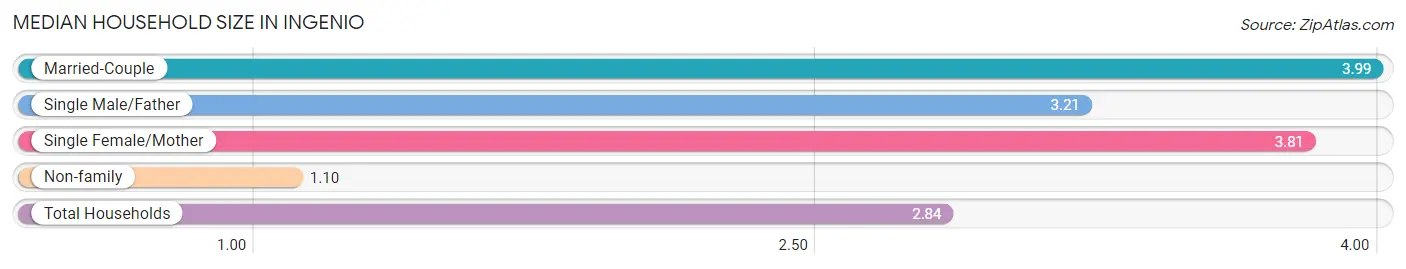
| Household Type | # Households | Household Size |
| Married-Couple | 303 (32.9%) | 3.99 |
| Single Male/Father | 67 (7.3%) | 3.21 |
| Single Female/Mother | 215 (23.4%) | 3.81 |
| Non-family | 335 (36.4%) | 1.10 |
| Total Households | 920 (100.0%) | 2.84 |
Household Size by Marriage Status in Ingenio
Out of a total of 920 households in Ingenio, 585 (63.6%) are family households, while 335 (36.4%) are nonfamily households. The most numerous type of family households are 2-person households, comprising 212, and the most common type of nonfamily households are 1-person households, comprising 303.
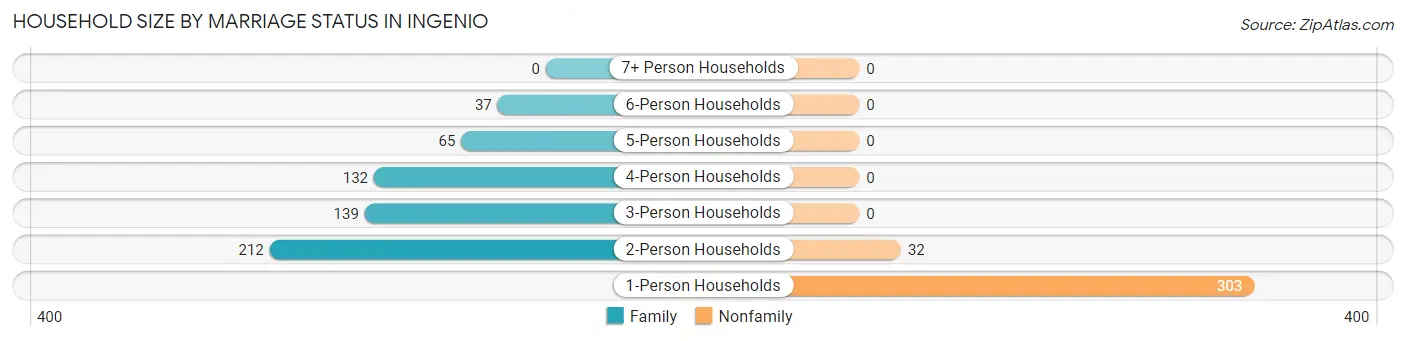
| Household Size | Family Households | Nonfamily Households |
| 1-Person Households | - | 303 (32.9%) |
| 2-Person Households | 212 (23.0%) | 32 (3.5%) |
| 3-Person Households | 139 (15.1%) | 0 (0.0%) |
| 4-Person Households | 132 (14.3%) | 0 (0.0%) |
| 5-Person Households | 65 (7.1%) | 0 (0.0%) |
| 6-Person Households | 37 (4.0%) | 0 (0.0%) |
| 7+ Person Households | 0 (0.0%) | 0 (0.0%) |
| Total | 585 (63.6%) | 335 (36.4%) |
Female Fertility in Ingenio
Fertility by Age in Ingenio
| Age Bracket | Women with Births | Births / 1,000 Women |
| 15 to 19 years | 0 (0.0%) | 0.0 |
| 20 to 34 years | 0 (0.0%) | 0.0 |
| 35 to 50 years | 0 (0.0%) | 0.0 |
| Total | 0 (0.0%) | 0.0 |
Fertility by Age by Marriage Status in Ingenio
| Age Bracket | Married | Unmarried |
| 15 to 19 years | 0 (0.0%) | 0 (0.0%) |
| 20 to 34 years | 0 (0.0%) | 0 (0.0%) |
| 35 to 50 years | 0 (0.0%) | 0 (0.0%) |
| Total | 0 (0.0%) | 0 (0.0%) |
Fertility by Education in Ingenio
| Educational Attainment | Women with Births | Births / 1,000 Women |
| Less than High School | 0 (0.0%) | 0.0 |
| High School Diploma | 0 (0.0%) | 0.0 |
| College or Associate's Degree | 0 (0.0%) | 0.0 |
| Bachelor's Degree | 0 (0.0%) | 0.0 |
| Graduate Degree | 0 (0.0%) | 0.0 |
| Total | 0 (0.0%) | 0.0 |
Fertility by Education by Marriage Status in Ingenio
| Educational Attainment | Married | Unmarried |
| Less than High School | 0 (0.0%) | 0 (0.0%) |
| High School Diploma | 0 (0.0%) | 0 (0.0%) |
| College or Associate's Degree | 0 (0.0%) | 0 (0.0%) |
| Bachelor's Degree | 0 (0.0%) | 0 (0.0%) |
| Graduate Degree | 0 (0.0%) | 0 (0.0%) |
| Total | 0 (0.0%) | 0 (0.0%) |
Employment Characteristics in Ingenio
Employment by Class of Employer in Ingenio
Among the 726 employed individuals in Ingenio, private company employees (447 | 61.6%), self-employed (incorporated) (90 | 12.4%), and self-employed (not incorporated) (90 | 12.4%) make up the most common classes of employment.
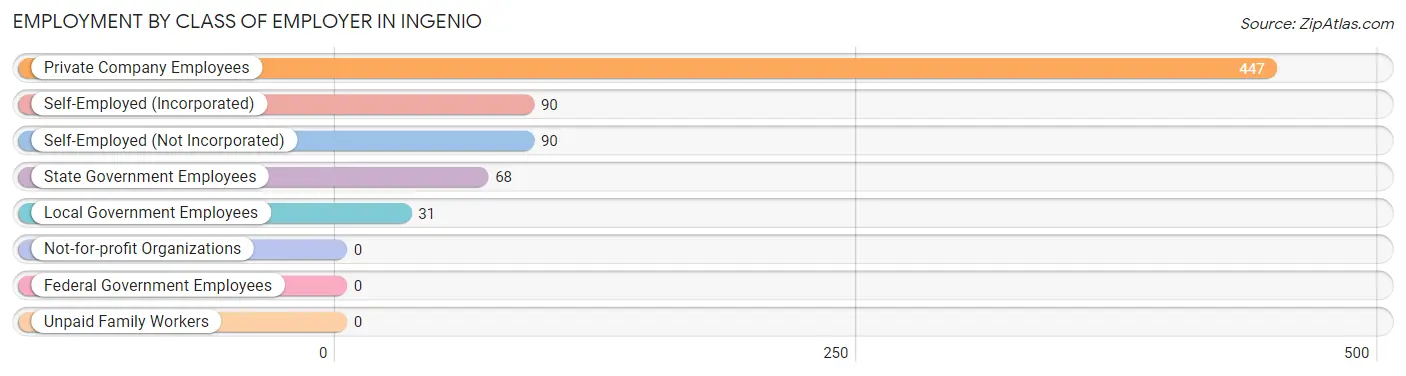
| Employer Class | # Employees | % Employees |
| Private Company Employees | 447 | 61.6% |
| Self-Employed (Incorporated) | 90 | 12.4% |
| Self-Employed (Not Incorporated) | 90 | 12.4% |
| Not-for-profit Organizations | 0 | 0.0% |
| Local Government Employees | 31 | 4.3% |
| State Government Employees | 68 | 9.4% |
| Federal Government Employees | 0 | 0.0% |
| Unpaid Family Workers | 0 | 0.0% |
| Total | 726 | 100.0% |
Employment Status by Age in Ingenio
According to the labor force statistics for Ingenio, out of the total population over 16 years of age (2,218), 40.1% or 889 individuals are in the labor force, with 16.4% or 146 of them unemployed. The age group with the highest labor force participation rate is 35 to 44 years, with 81.2% or 406 individuals in the labor force. Within the labor force, the 45 to 54 years age range has the highest percentage of unemployed individuals, with 45.2% or 89 of them being unemployed.
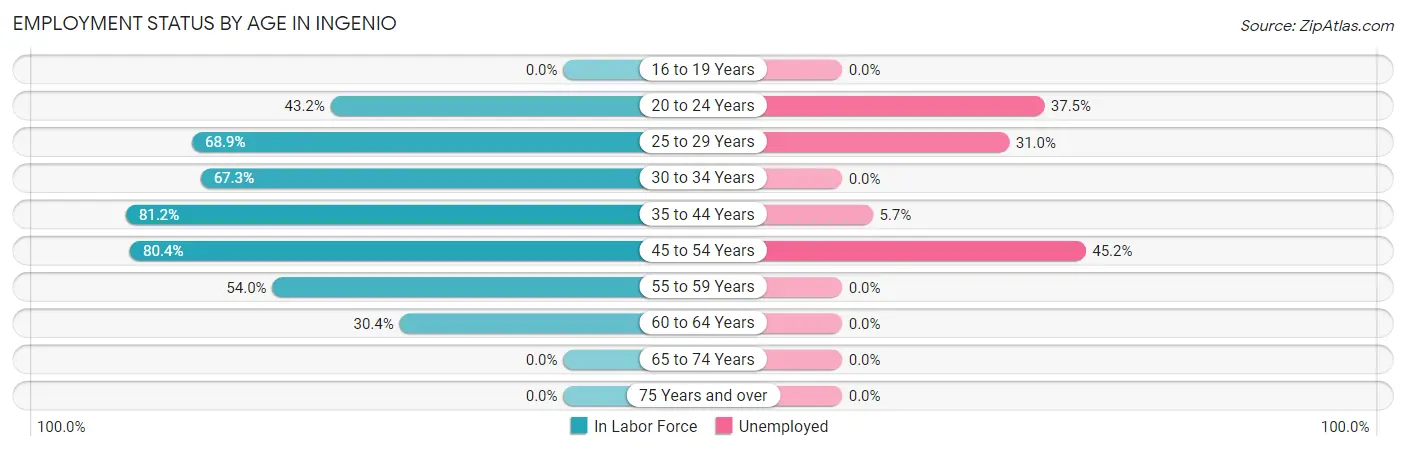
| Age Bracket | In Labor Force | Unemployed |
| 16 to 19 Years | 0 (0.0%) | 0 (0.0%) |
| 20 to 24 Years | 32 (43.2%) | 12 (37.5%) |
| 25 to 29 Years | 71 (68.9%) | 22 (31.0%) |
| 30 to 34 Years | 33 (67.3%) | 0 (0.0%) |
| 35 to 44 Years | 406 (81.2%) | 23 (5.7%) |
| 45 to 54 Years | 197 (80.4%) | 89 (45.2%) |
| 55 to 59 Years | 102 (54.0%) | 0 (0.0%) |
| 60 to 64 Years | 48 (30.4%) | 0 (0.0%) |
| 65 to 74 Years | 0 (0.0%) | 0 (0.0%) |
| 75 Years and over | 0 (0.0%) | 0 (0.0%) |
| Total | 889 (40.1%) | 146 (16.4%) |
Employment Status by Educational Attainment in Ingenio
According to labor force statistics for Ingenio, 68.9% of individuals (857) out of the total population between 25 and 64 years of age (1,244) are in the labor force, with 15.6% or 134 of them being unemployed. The group with the highest labor force participation rate are those with the educational attainment of less than high school, with 77.1% or 111 individuals in the labor force. Within the labor force, individuals with college / associate degree education have the highest percentage of unemployment, with 37.4% or 89 of them being unemployed.
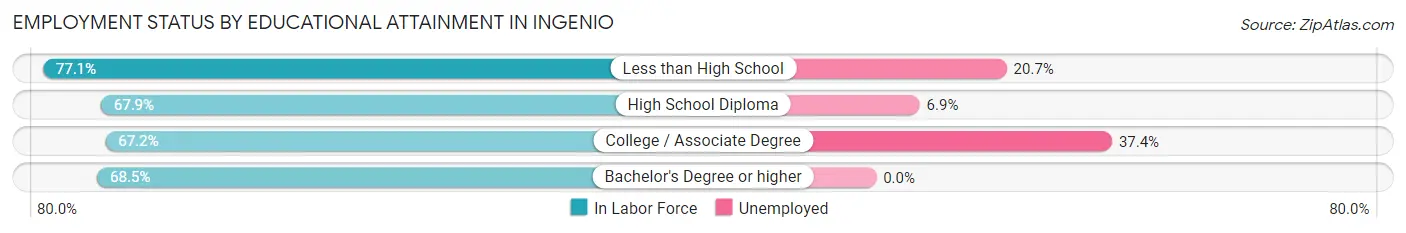
| Educational Attainment | In Labor Force | Unemployed |
| Less than High School | 111 (77.1%) | 30 (20.7%) |
| High School Diploma | 321 (67.9%) | 33 (6.9%) |
| College / Associate Degree | 238 (67.2%) | 132 (37.4%) |
| Bachelor's Degree or higher | 187 (68.5%) | 0 (0.0%) |
| Total | 857 (68.9%) | 194 (15.6%) |
Employment Occupations by Sex in Ingenio
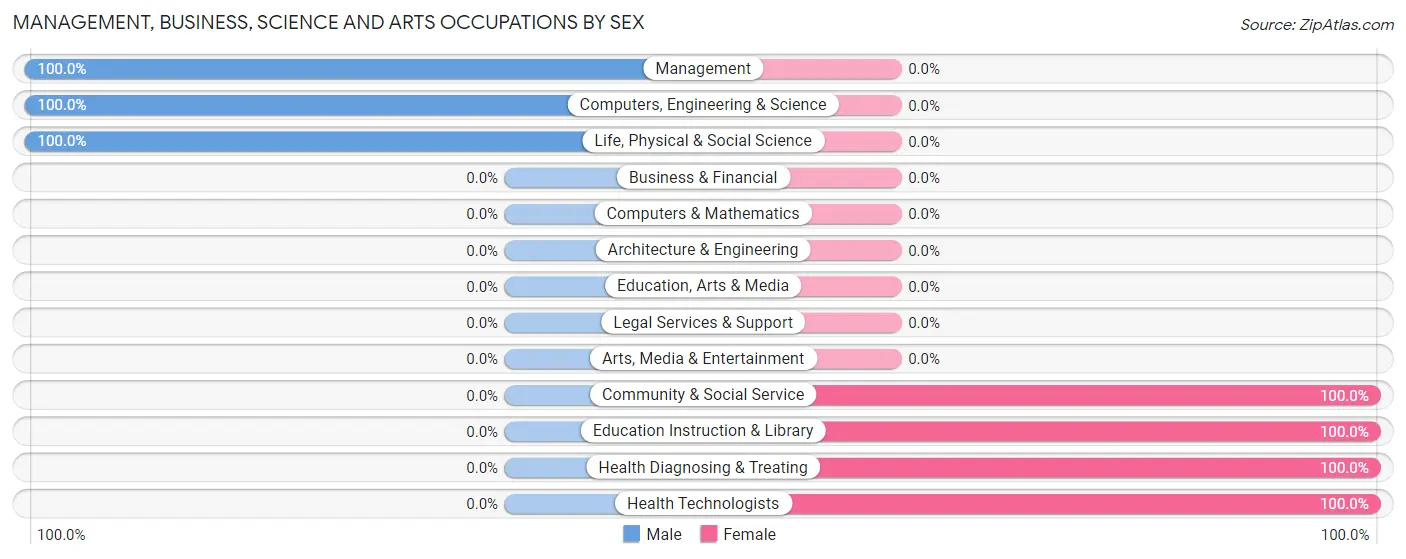
Management, Business, Science and Arts Occupations
The most common Management, Business, Science and Arts occupations in Ingenio are Management (128 | 17.2%), Computers, Engineering & Science (46 | 6.2%), Life, Physical & Social Science (46 | 6.2%), Community & Social Service (20 | 2.7%), and Education Instruction & Library (20 | 2.7%).
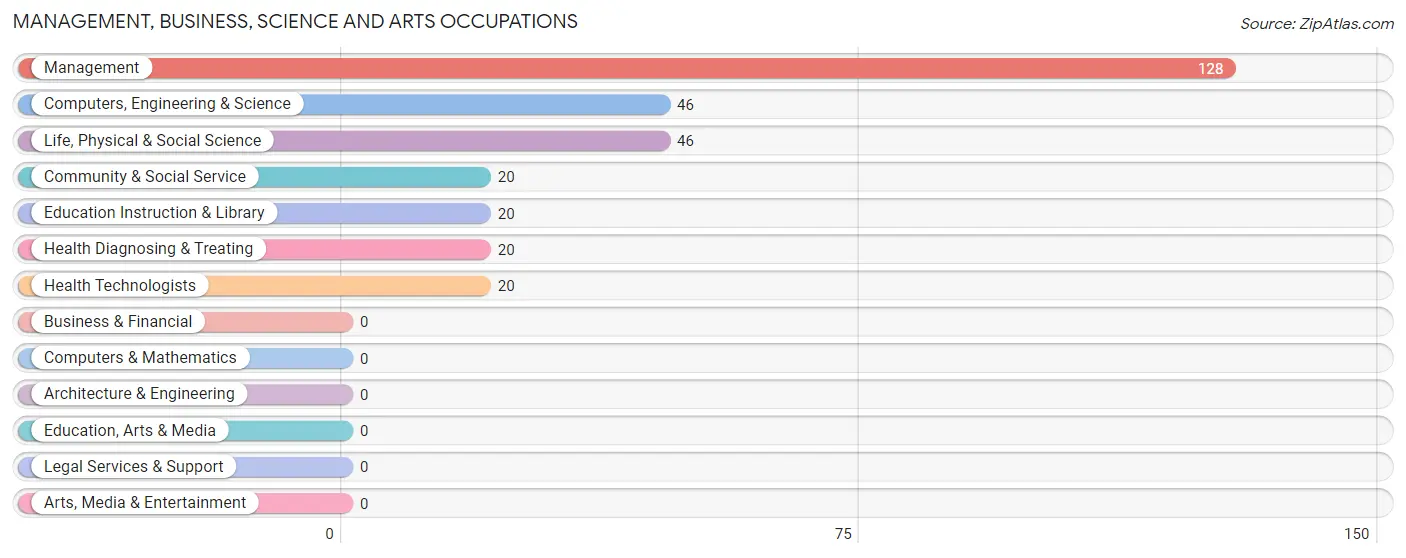
Management, Business, Science and Arts Occupations by Sex
Within the Management, Business, Science and Arts occupations in Ingenio, the most male-oriented occupations are Management (100.0%), Computers, Engineering & Science (100.0%), and Life, Physical & Social Science (100.0%), while the most female-oriented occupations are Community & Social Service (100.0%), Education Instruction & Library (100.0%), and Health Diagnosing & Treating (100.0%).
| Occupation | Male | Female |
| Management | 128 (100.0%) | 0 (0.0%) |
| Business & Financial | 0 (0.0%) | 0 (0.0%) |
| Computers, Engineering & Science | 46 (100.0%) | 0 (0.0%) |
| Computers & Mathematics | 0 (0.0%) | 0 (0.0%) |
| Architecture & Engineering | 0 (0.0%) | 0 (0.0%) |
| Life, Physical & Social Science | 46 (100.0%) | 0 (0.0%) |
| Community & Social Service | 0 (0.0%) | 20 (100.0%) |
| Education, Arts & Media | 0 (0.0%) | 0 (0.0%) |
| Legal Services & Support | 0 (0.0%) | 0 (0.0%) |
| Education Instruction & Library | 0 (0.0%) | 20 (100.0%) |
| Arts, Media & Entertainment | 0 (0.0%) | 0 (0.0%) |
| Health Diagnosing & Treating | 0 (0.0%) | 20 (100.0%) |
| Health Technologists | 0 (0.0%) | 20 (100.0%) |
| Total (Category) | 174 (81.3%) | 40 (18.7%) |
| Total (Overall) | 507 (68.2%) | 236 (31.8%) |
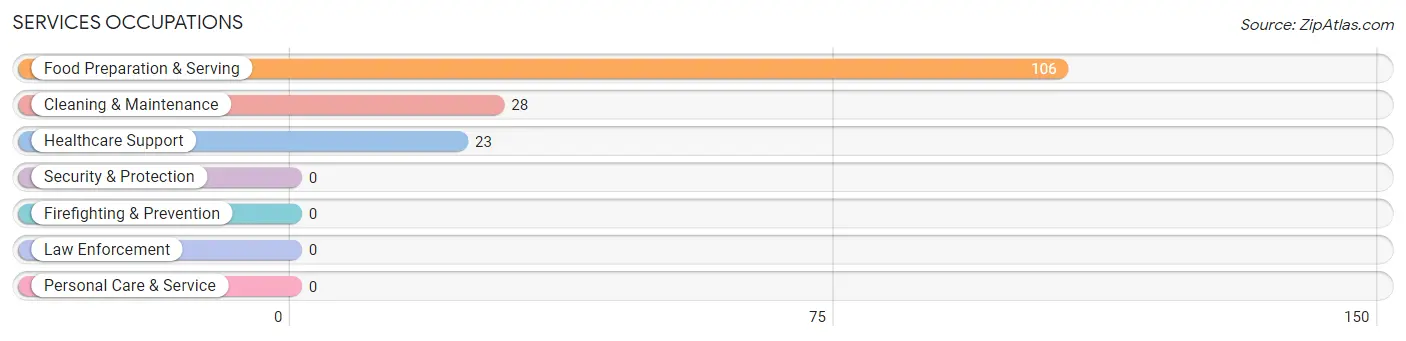
Services Occupations
The most common Services occupations in Ingenio are Food Preparation & Serving (106 | 14.3%), Cleaning & Maintenance (28 | 3.8%), and Healthcare Support (23 | 3.1%).
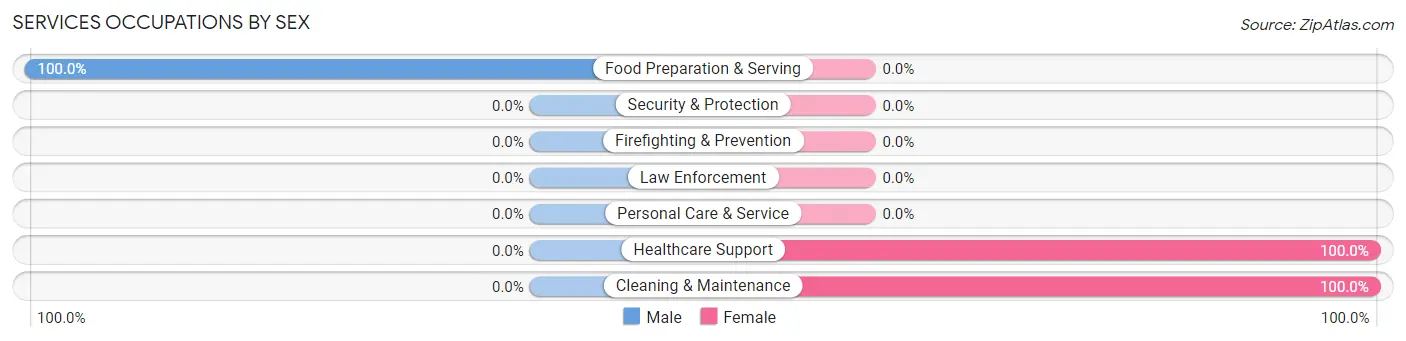
Services Occupations by Sex
| Occupation | Male | Female |
| Healthcare Support | 0 (0.0%) | 23 (100.0%) |
| Security & Protection | 0 (0.0%) | 0 (0.0%) |
| Firefighting & Prevention | 0 (0.0%) | 0 (0.0%) |
| Law Enforcement | 0 (0.0%) | 0 (0.0%) |
| Food Preparation & Serving | 106 (100.0%) | 0 (0.0%) |
| Cleaning & Maintenance | 0 (0.0%) | 28 (100.0%) |
| Personal Care & Service | 0 (0.0%) | 0 (0.0%) |
| Total (Category) | 106 (67.5%) | 51 (32.5%) |
| Total (Overall) | 507 (68.2%) | 236 (31.8%) |
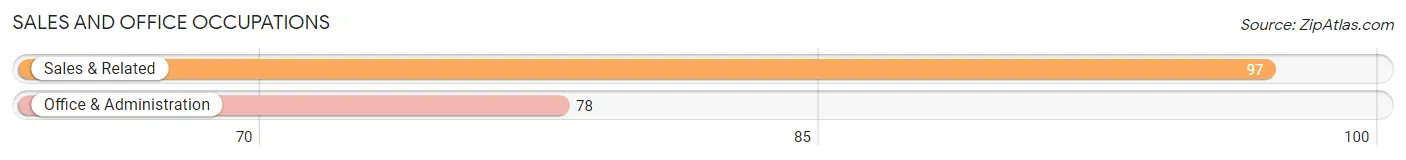
Sales and Office Occupations
The most common Sales and Office occupations in Ingenio are Sales & Related (97 | 13.1%), and Office & Administration (78 | 10.5%).
Sales and Office Occupations by Sex
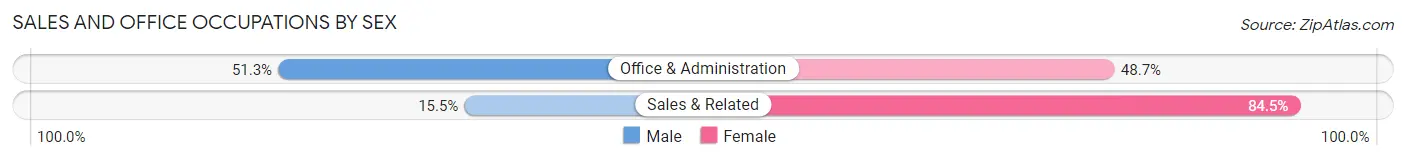
| Occupation | Male | Female |
| Sales & Related | 15 (15.5%) | 82 (84.5%) |
| Office & Administration | 40 (51.3%) | 38 (48.7%) |
| Total (Category) | 55 (31.4%) | 120 (68.6%) |
| Total (Overall) | 507 (68.2%) | 236 (31.8%) |
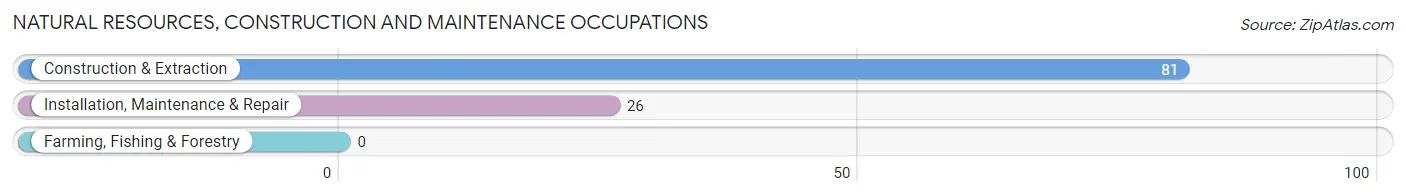
Natural Resources, Construction and Maintenance Occupations
The most common Natural Resources, Construction and Maintenance occupations in Ingenio are Construction & Extraction (81 | 10.9%), and Installation, Maintenance & Repair (26 | 3.5%).
Natural Resources, Construction and Maintenance Occupations by Sex
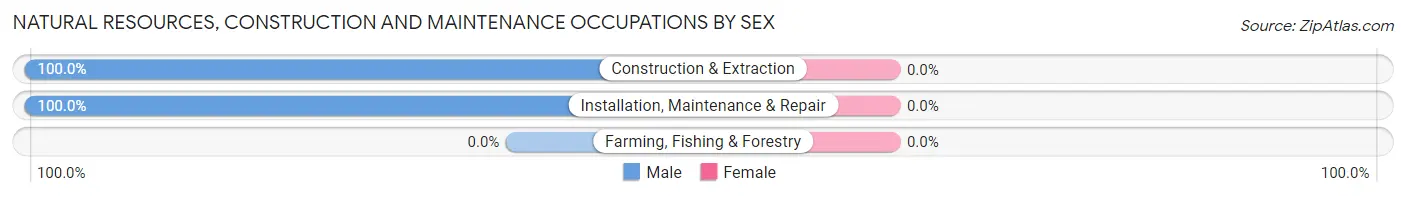
| Occupation | Male | Female |
| Farming, Fishing & Forestry | 0 (0.0%) | 0 (0.0%) |
| Construction & Extraction | 81 (100.0%) | 0 (0.0%) |
| Installation, Maintenance & Repair | 26 (100.0%) | 0 (0.0%) |
| Total (Category) | 107 (100.0%) | 0 (0.0%) |
| Total (Overall) | 507 (68.2%) | 236 (31.8%) |
Production, Transportation and Moving Occupations
The most common Production, Transportation and Moving occupations in Ingenio are Production (50 | 6.7%), Material Moving (25 | 3.4%), and Transportation (15 | 2.0%).
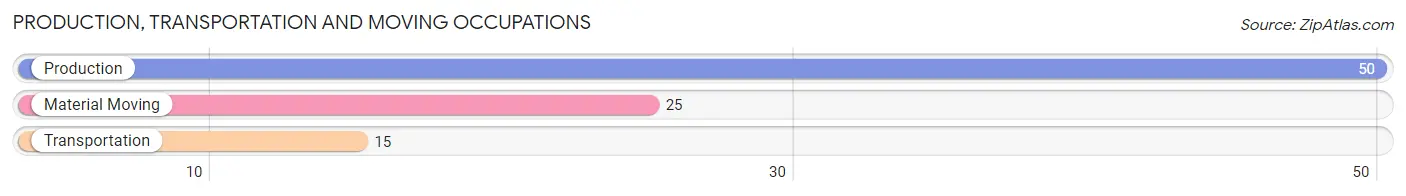
Production, Transportation and Moving Occupations by Sex
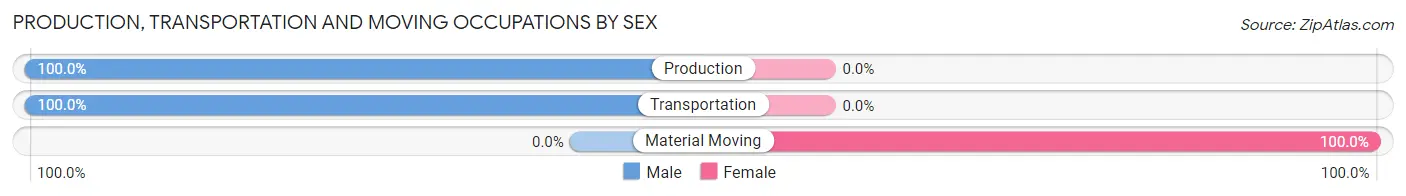
| Occupation | Male | Female |
| Production | 50 (100.0%) | 0 (0.0%) |
| Transportation | 15 (100.0%) | 0 (0.0%) |
| Material Moving | 0 (0.0%) | 25 (100.0%) |
| Total (Category) | 65 (72.2%) | 25 (27.8%) |
| Total (Overall) | 507 (68.2%) | 236 (31.8%) |
Employment Industries by Sex in Ingenio
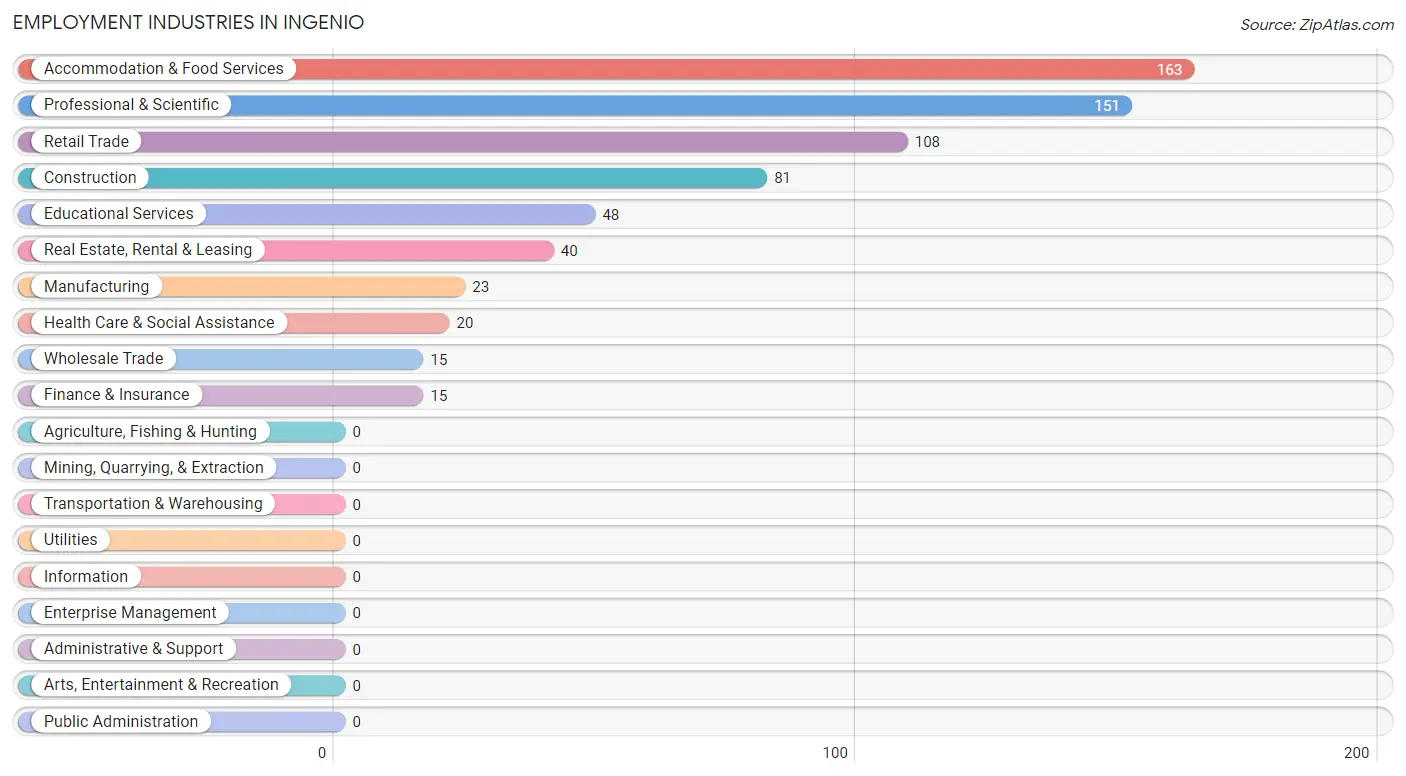
Employment Industries in Ingenio
The major employment industries in Ingenio include Accommodation & Food Services (163 | 21.9%), Professional & Scientific (151 | 20.3%), Retail Trade (108 | 14.5%), Construction (81 | 10.9%), and Educational Services (48 | 6.5%).
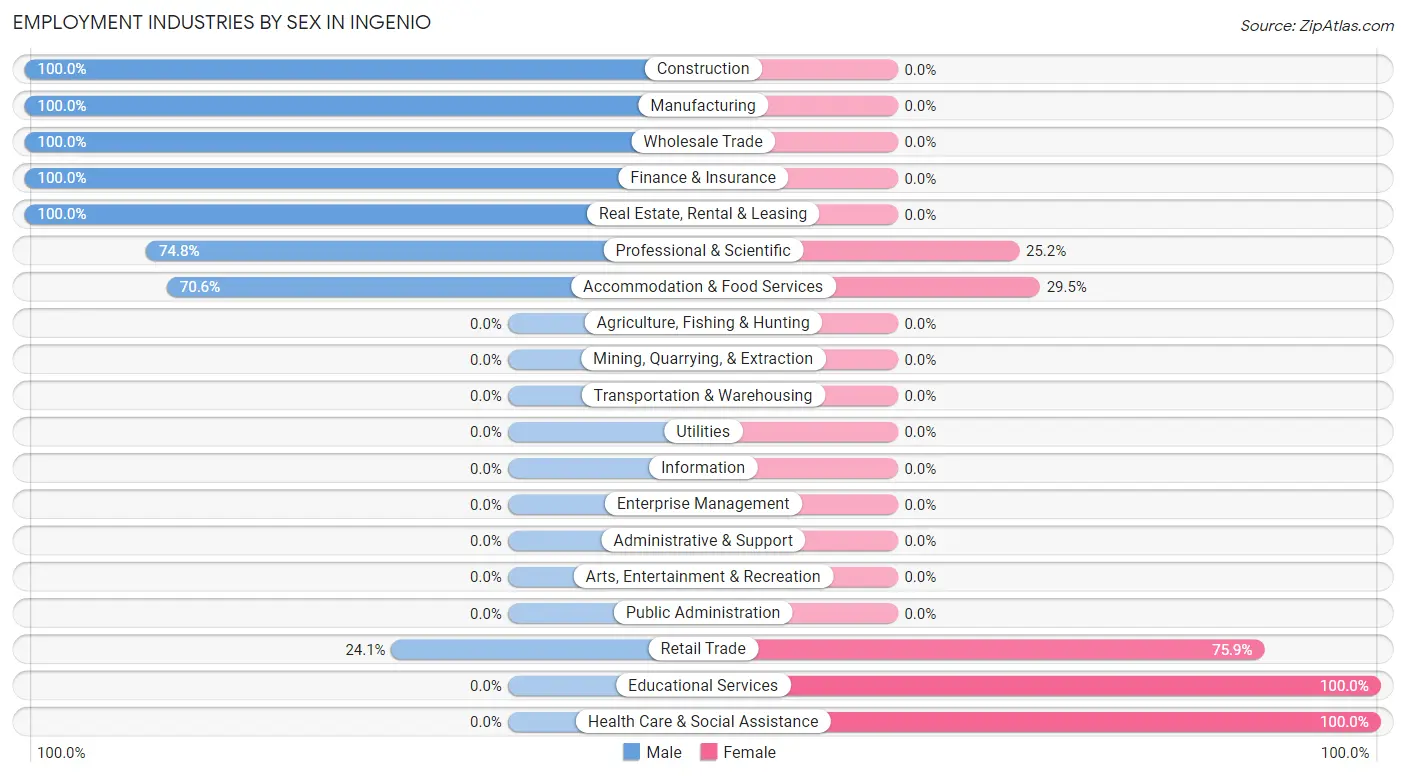
Employment Industries by Sex in Ingenio
The Ingenio industries that see more men than women are Construction (100.0%), Manufacturing (100.0%), and Wholesale Trade (100.0%), whereas the industries that tend to have a higher number of women are Educational Services (100.0%), Health Care & Social Assistance (100.0%), and Retail Trade (75.9%).
| Industry | Male | Female |
| Agriculture, Fishing & Hunting | 0 (0.0%) | 0 (0.0%) |
| Mining, Quarrying, & Extraction | 0 (0.0%) | 0 (0.0%) |
| Construction | 81 (100.0%) | 0 (0.0%) |
| Manufacturing | 23 (100.0%) | 0 (0.0%) |
| Wholesale Trade | 15 (100.0%) | 0 (0.0%) |
| Retail Trade | 26 (24.1%) | 82 (75.9%) |
| Transportation & Warehousing | 0 (0.0%) | 0 (0.0%) |
| Utilities | 0 (0.0%) | 0 (0.0%) |
| Information | 0 (0.0%) | 0 (0.0%) |
| Finance & Insurance | 15 (100.0%) | 0 (0.0%) |
| Real Estate, Rental & Leasing | 40 (100.0%) | 0 (0.0%) |
| Professional & Scientific | 113 (74.8%) | 38 (25.2%) |
| Enterprise Management | 0 (0.0%) | 0 (0.0%) |
| Administrative & Support | 0 (0.0%) | 0 (0.0%) |
| Educational Services | 0 (0.0%) | 48 (100.0%) |
| Health Care & Social Assistance | 0 (0.0%) | 20 (100.0%) |
| Arts, Entertainment & Recreation | 0 (0.0%) | 0 (0.0%) |
| Accommodation & Food Services | 115 (70.6%) | 48 (29.4%) |
| Public Administration | 0 (0.0%) | 0 (0.0%) |
| Total | 507 (68.2%) | 236 (31.8%) |
Education in Ingenio
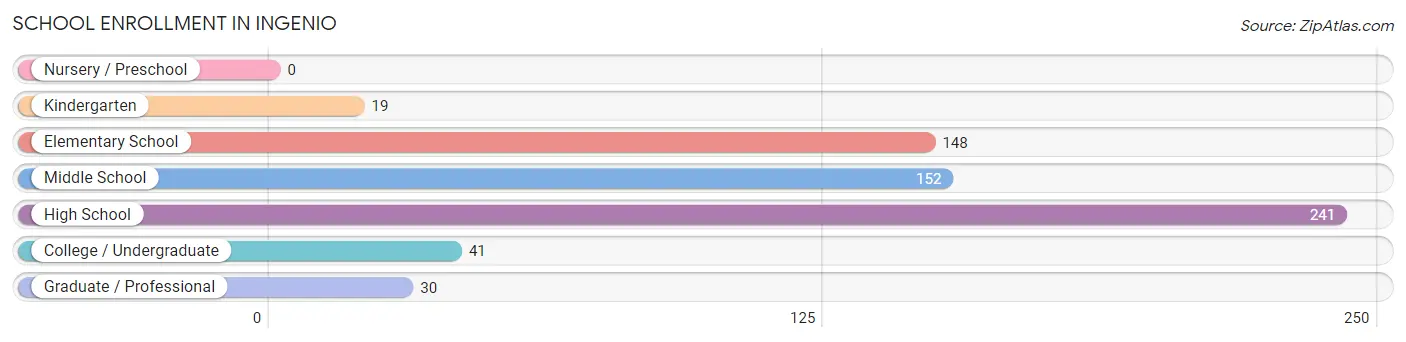
School Enrollment in Ingenio
The most common levels of schooling among the 631 students in Ingenio are high school (241 | 38.2%), middle school (152 | 24.1%), and elementary school (148 | 23.4%).
| School Level | # Students | % Students |
| Nursery / Preschool | 0 | 0.0% |
| Kindergarten | 19 | 3.0% |
| Elementary School | 148 | 23.4% |
| Middle School | 152 | 24.1% |
| High School | 241 | 38.2% |
| College / Undergraduate | 41 | 6.5% |
| Graduate / Professional | 30 | 4.8% |
| Total | 631 | 100.0% |
School Enrollment by Age by Funding Source in Ingenio
Out of a total of 631 students who are enrolled in schools in Ingenio, 246 (39.0%) attend a private institution, while the remaining 385 (61.0%) are enrolled in public schools. The age group of 15 to 17 year olds has the highest likelihood of being enrolled in private schools, with 162 (64.8% in the age bracket) enrolled. Conversely, the age group of 10 to 14 year olds has the lowest likelihood of being enrolled in a private school, with 169 (100.0% in the age bracket) attending a public institution.
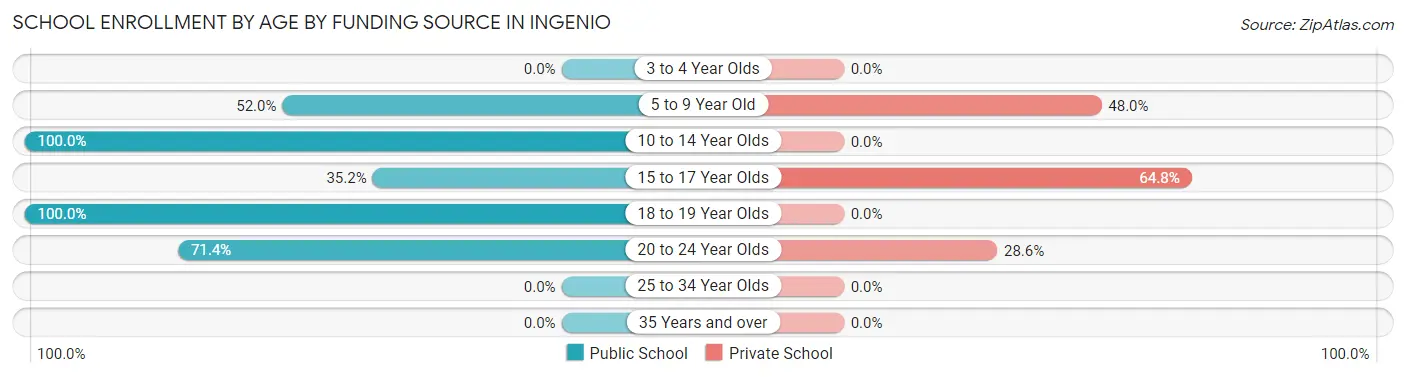
| Age Bracket | Public School | Private School |
| 3 to 4 Year Olds | 0 (0.0%) | 0 (0.0%) |
| 5 to 9 Year Old | 78 (52.0%) | 72 (48.0%) |
| 10 to 14 Year Olds | 169 (100.0%) | 0 (0.0%) |
| 15 to 17 Year Olds | 88 (35.2%) | 162 (64.8%) |
| 18 to 19 Year Olds | 20 (100.0%) | 0 (0.0%) |
| 20 to 24 Year Olds | 30 (71.4%) | 12 (28.6%) |
| 25 to 34 Year Olds | 0 (0.0%) | 0 (0.0%) |
| 35 Years and over | 0 (0.0%) | 0 (0.0%) |
| Total | 385 (61.0%) | 246 (39.0%) |
Educational Attainment by Field of Study in Ingenio
Education (157 | 55.9%), computers & mathematics (67 | 23.8%), and business (57 | 20.3%) are the most common fields of study among 281 individuals in Ingenio who have obtained a bachelor's degree or higher.
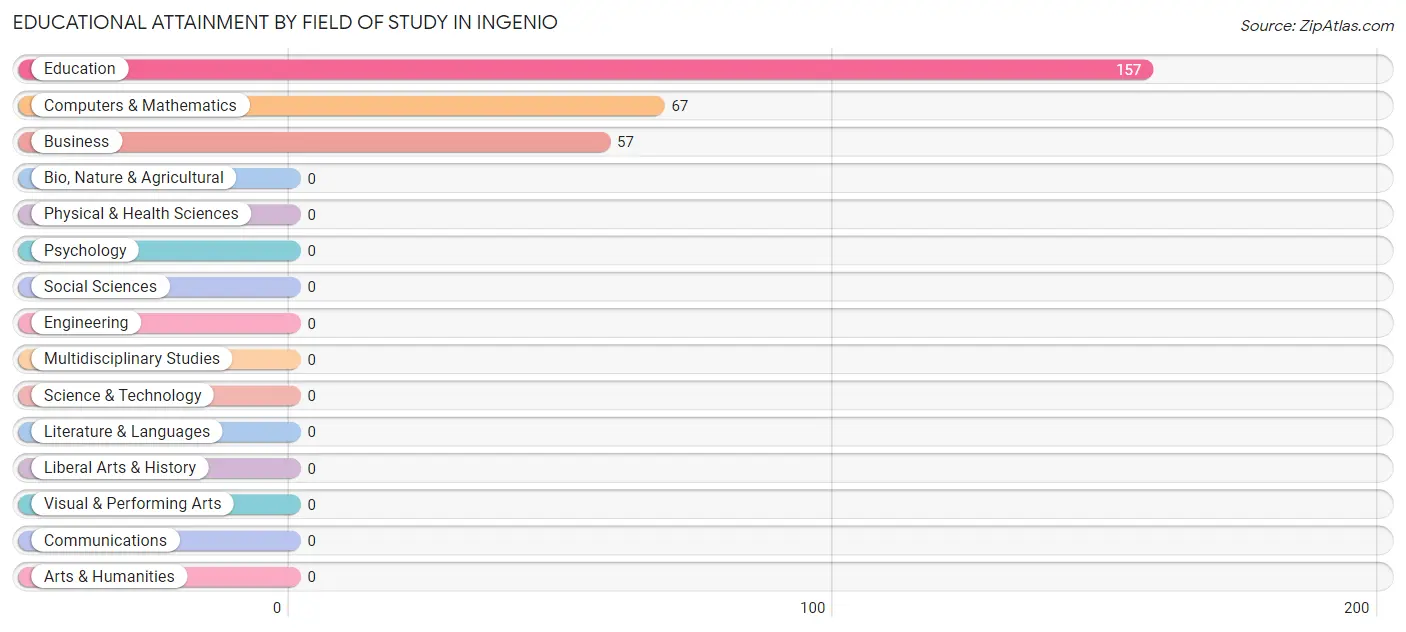
| Field of Study | # Graduates | % Graduates |
| Computers & Mathematics | 67 | 23.8% |
| Bio, Nature & Agricultural | 0 | 0.0% |
| Physical & Health Sciences | 0 | 0.0% |
| Psychology | 0 | 0.0% |
| Social Sciences | 0 | 0.0% |
| Engineering | 0 | 0.0% |
| Multidisciplinary Studies | 0 | 0.0% |
| Science & Technology | 0 | 0.0% |
| Business | 57 | 20.3% |
| Education | 157 | 55.9% |
| Literature & Languages | 0 | 0.0% |
| Liberal Arts & History | 0 | 0.0% |
| Visual & Performing Arts | 0 | 0.0% |
| Communications | 0 | 0.0% |
| Arts & Humanities | 0 | 0.0% |
| Total | 281 | 100.0% |
Transportation & Commute in Ingenio
Vehicle Availability by Sex in Ingenio
The most prevalent vehicle ownership categories in Ingenio are males with 2 vehicles (210, accounting for 41.4%) and females with 2 vehicles (46, making up 95.9%).
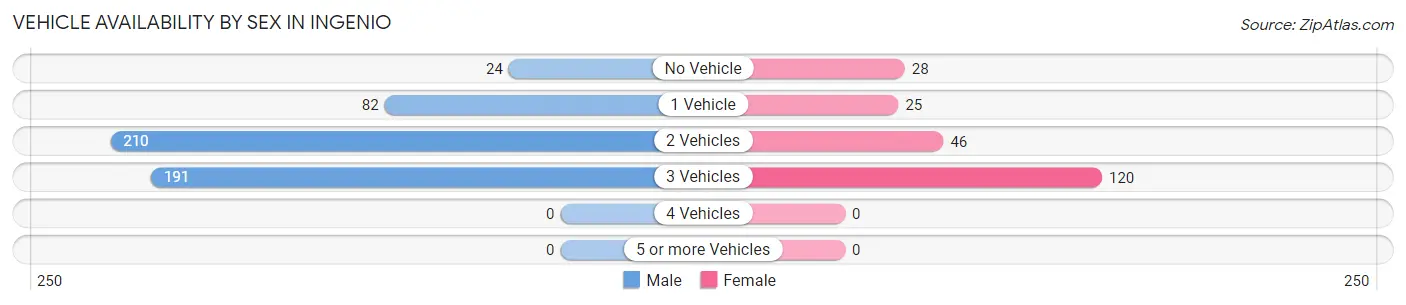
| Vehicles Available | Male | Female |
| No Vehicle | 24 (4.7%) | 28 (12.8%) |
| 1 Vehicle | 82 (16.2%) | 25 (11.4%) |
| 2 Vehicles | 210 (41.4%) | 46 (21.0%) |
| 3 Vehicles | 191 (37.7%) | 120 (54.8%) |
| 4 Vehicles | 0 (0.0%) | 0 (0.0%) |
| 5 or more Vehicles | 0 (0.0%) | 0 (0.0%) |
| Total | 507 (100.0%) | 219 (100.0%) |
Commute Time in Ingenio
The most frequently occuring commute durations in Ingenio are 20 to 24 minutes (190 commuters, 32.0%), 30 to 34 minutes (92 commuters, 15.5%), and 45 to 59 minutes (81 commuters, 13.7%).
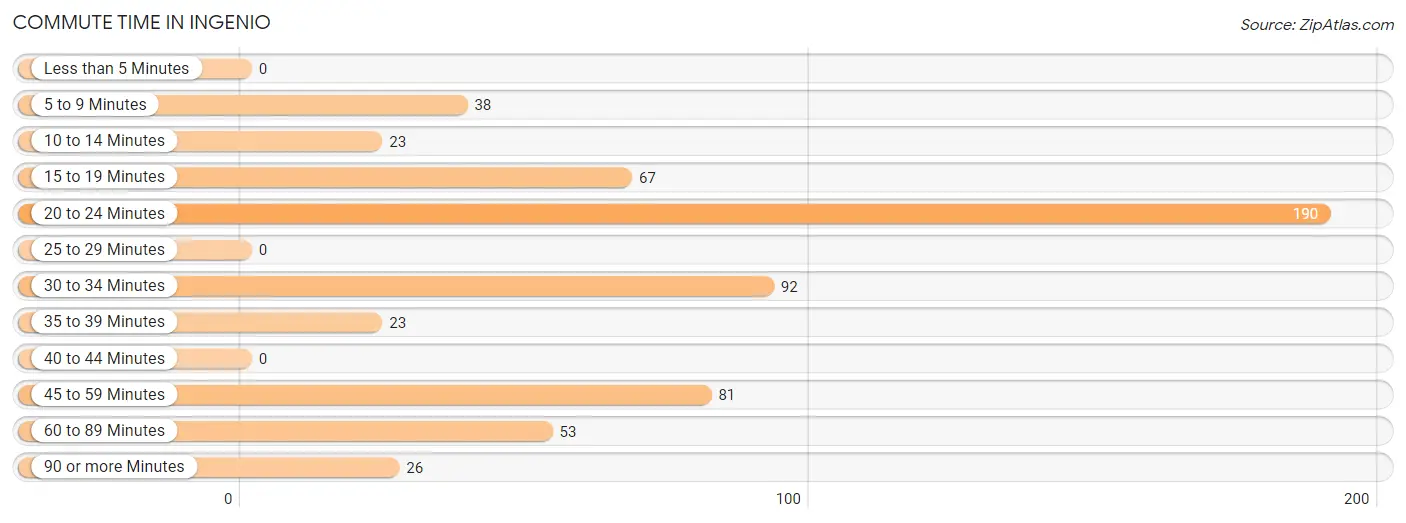
| Commute Time | # Commuters | % Commuters |
| Less than 5 Minutes | 0 | 0.0% |
| 5 to 9 Minutes | 38 | 6.4% |
| 10 to 14 Minutes | 23 | 3.9% |
| 15 to 19 Minutes | 67 | 11.3% |
| 20 to 24 Minutes | 190 | 32.0% |
| 25 to 29 Minutes | 0 | 0.0% |
| 30 to 34 Minutes | 92 | 15.5% |
| 35 to 39 Minutes | 23 | 3.9% |
| 40 to 44 Minutes | 0 | 0.0% |
| 45 to 59 Minutes | 81 | 13.7% |
| 60 to 89 Minutes | 53 | 8.9% |
| 90 or more Minutes | 26 | 4.4% |
Commute Time by Sex in Ingenio
The most common commute times in Ingenio are 20 to 24 minutes (137 commuters, 32.9%) for males and 20 to 24 minutes (53 commuters, 29.9%) for females.
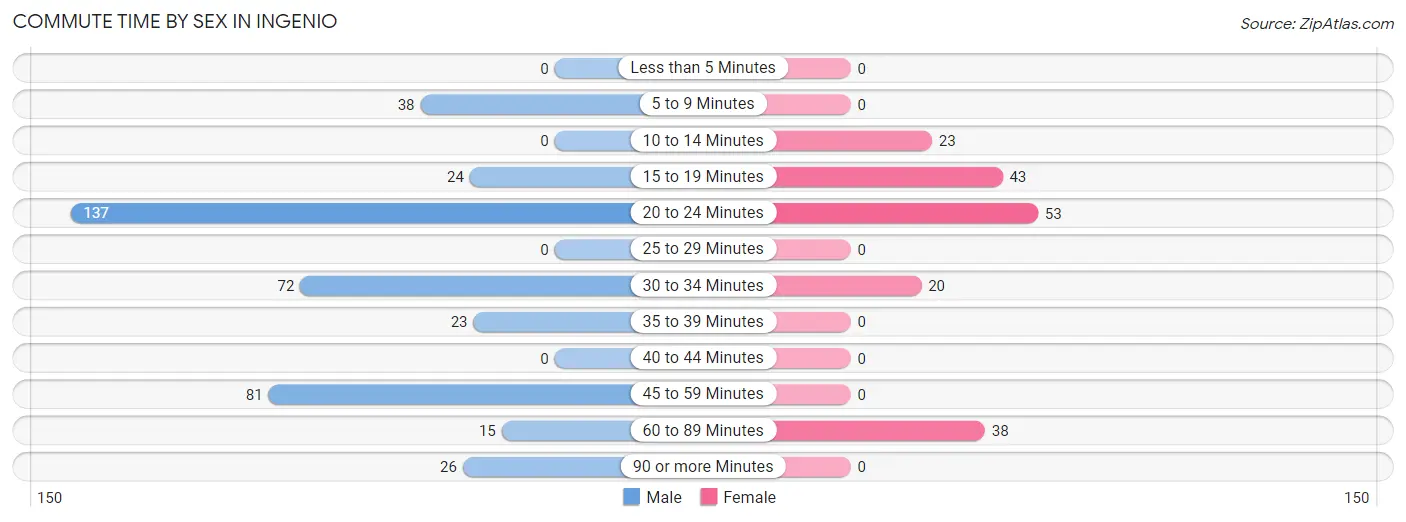
| Commute Time | Male | Female |
| Less than 5 Minutes | 0 (0.0%) | 0 (0.0%) |
| 5 to 9 Minutes | 38 (9.1%) | 0 (0.0%) |
| 10 to 14 Minutes | 0 (0.0%) | 23 (13.0%) |
| 15 to 19 Minutes | 24 (5.8%) | 43 (24.3%) |
| 20 to 24 Minutes | 137 (32.9%) | 53 (29.9%) |
| 25 to 29 Minutes | 0 (0.0%) | 0 (0.0%) |
| 30 to 34 Minutes | 72 (17.3%) | 20 (11.3%) |
| 35 to 39 Minutes | 23 (5.5%) | 0 (0.0%) |
| 40 to 44 Minutes | 0 (0.0%) | 0 (0.0%) |
| 45 to 59 Minutes | 81 (19.5%) | 0 (0.0%) |
| 60 to 89 Minutes | 15 (3.6%) | 38 (21.5%) |
| 90 or more Minutes | 26 (6.2%) | 0 (0.0%) |
Time of Departure to Work by Sex in Ingenio
The most frequent times of departure to work in Ingenio are 6:30 AM to 6:59 AM (87, 20.9%) for males and 7:00 AM to 7:29 AM (81, 45.8%) for females.
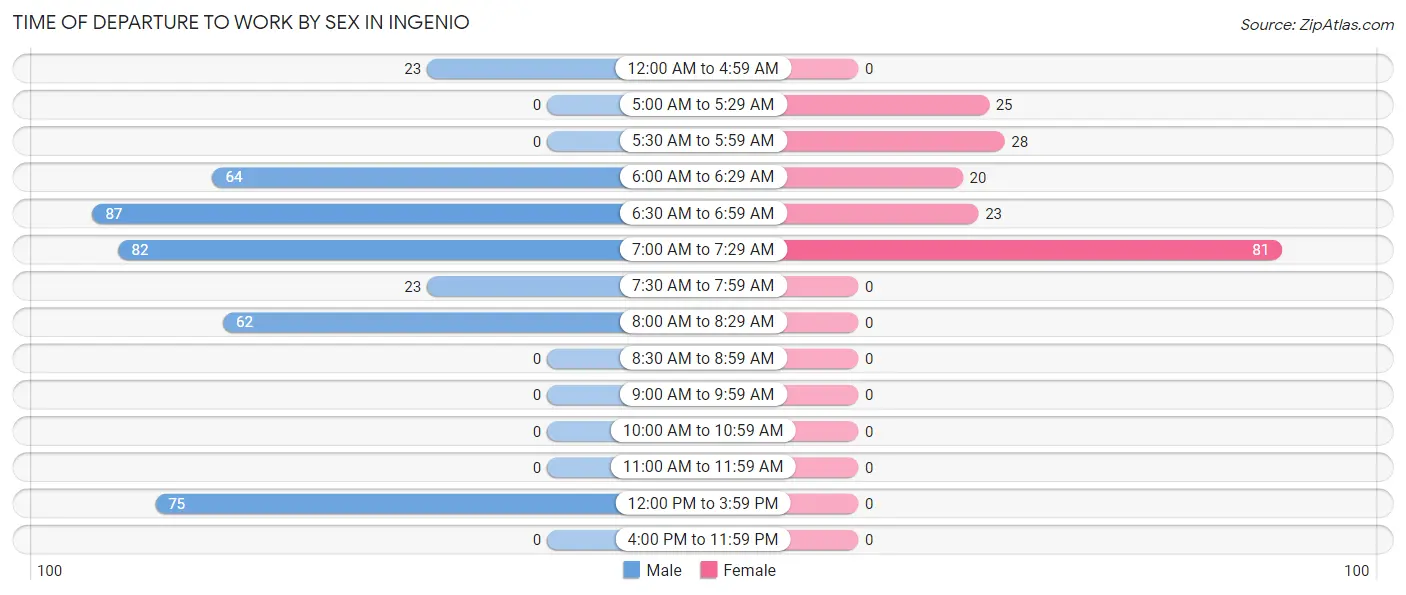
| Time of Departure | Male | Female |
| 12:00 AM to 4:59 AM | 23 (5.5%) | 0 (0.0%) |
| 5:00 AM to 5:29 AM | 0 (0.0%) | 25 (14.1%) |
| 5:30 AM to 5:59 AM | 0 (0.0%) | 28 (15.8%) |
| 6:00 AM to 6:29 AM | 64 (15.4%) | 20 (11.3%) |
| 6:30 AM to 6:59 AM | 87 (20.9%) | 23 (13.0%) |
| 7:00 AM to 7:29 AM | 82 (19.7%) | 81 (45.8%) |
| 7:30 AM to 7:59 AM | 23 (5.5%) | 0 (0.0%) |
| 8:00 AM to 8:29 AM | 62 (14.9%) | 0 (0.0%) |
| 8:30 AM to 8:59 AM | 0 (0.0%) | 0 (0.0%) |
| 9:00 AM to 9:59 AM | 0 (0.0%) | 0 (0.0%) |
| 10:00 AM to 10:59 AM | 0 (0.0%) | 0 (0.0%) |
| 11:00 AM to 11:59 AM | 0 (0.0%) | 0 (0.0%) |
| 12:00 PM to 3:59 PM | 75 (18.0%) | 0 (0.0%) |
| 4:00 PM to 11:59 PM | 0 (0.0%) | 0 (0.0%) |
| Total | 416 (100.0%) | 177 (100.0%) |
Housing Occupancy in Ingenio
Occupancy by Ownership in Ingenio
Of the total 920 dwellings in Ingenio, owner-occupied units account for 654 (71.1%), while renter-occupied units make up 266 (28.9%).
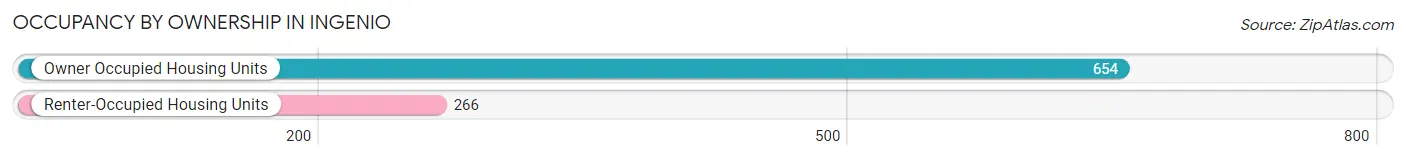
| Occupancy | # Housing Units | % Housing Units |
| Owner Occupied Housing Units | 654 | 71.1% |
| Renter-Occupied Housing Units | 266 | 28.9% |
| Total Occupied Housing Units | 920 | 100.0% |
Occupancy by Household Size in Ingenio
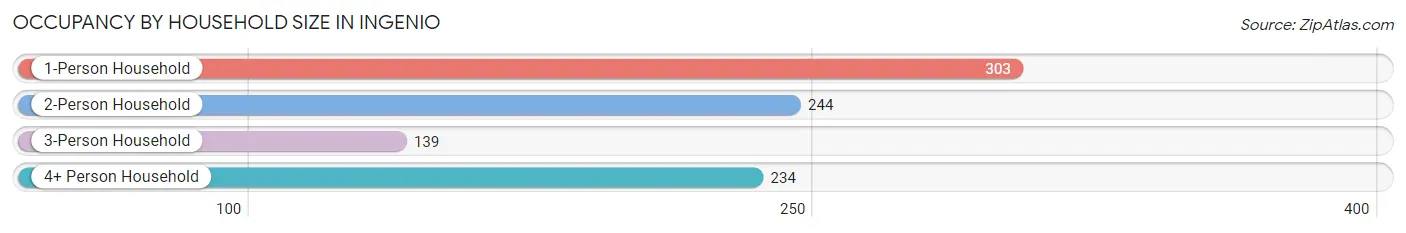
| Household Size | # Housing Units | % Housing Units |
| 1-Person Household | 303 | 32.9% |
| 2-Person Household | 244 | 26.5% |
| 3-Person Household | 139 | 15.1% |
| 4+ Person Household | 234 | 25.4% |
| Total Housing Units | 920 | 100.0% |
Occupancy by Ownership by Household Size in Ingenio
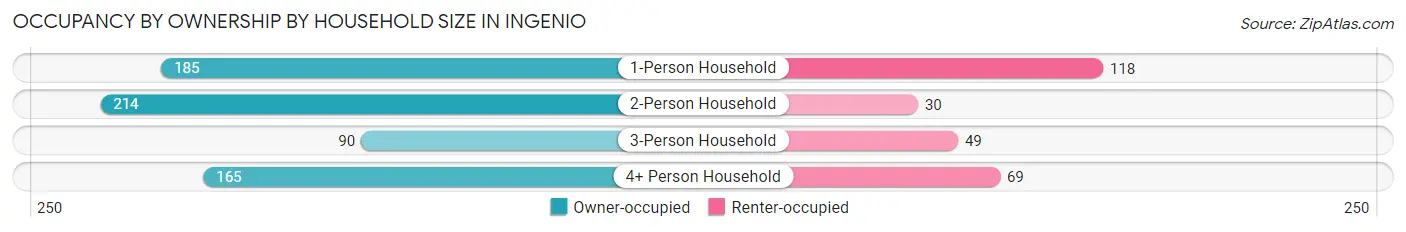
| Household Size | Owner-occupied | Renter-occupied |
| 1-Person Household | 185 (61.1%) | 118 (38.9%) |
| 2-Person Household | 214 (87.7%) | 30 (12.3%) |
| 3-Person Household | 90 (64.7%) | 49 (35.2%) |
| 4+ Person Household | 165 (70.5%) | 69 (29.5%) |
| Total Housing Units | 654 (71.1%) | 266 (28.9%) |
Occupancy by Educational Attainment in Ingenio
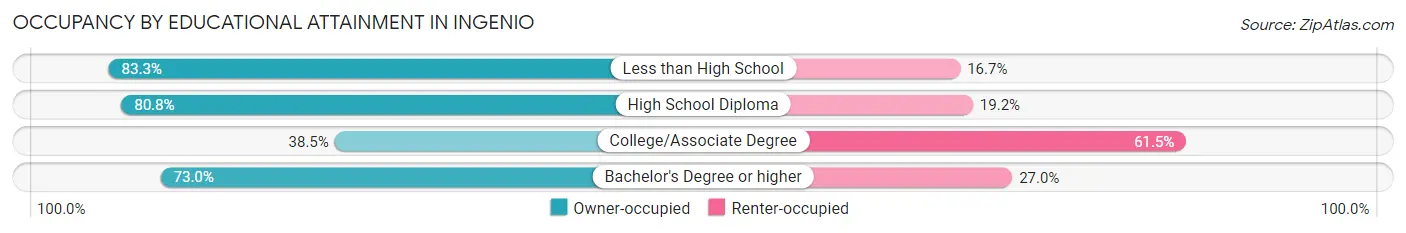
| Household Size | Owner-occupied | Renter-occupied |
| Less than High School | 135 (83.3%) | 27 (16.7%) |
| High School Diploma | 375 (80.8%) | 89 (19.2%) |
| College/Associate Degree | 79 (38.5%) | 126 (61.5%) |
| Bachelor's Degree or higher | 65 (73.0%) | 24 (27.0%) |
Occupancy by Age of Householder in Ingenio
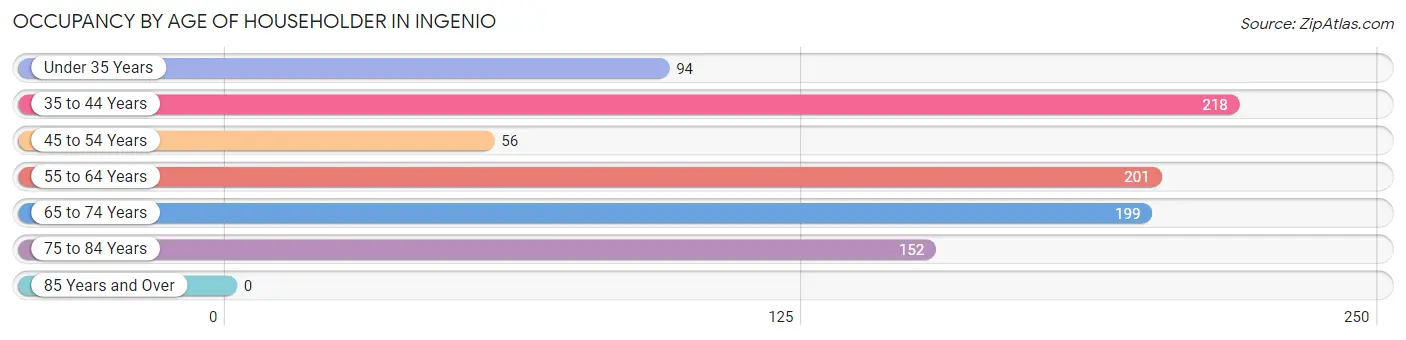
| Age Bracket | # Households | % Households |
| Under 35 Years | 94 | 10.2% |
| 35 to 44 Years | 218 | 23.7% |
| 45 to 54 Years | 56 | 6.1% |
| 55 to 64 Years | 201 | 21.8% |
| 65 to 74 Years | 199 | 21.6% |
| 75 to 84 Years | 152 | 16.5% |
| 85 Years and Over | 0 | 0.0% |
| Total | 920 | 100.0% |
Housing Finances in Ingenio
Median Income by Occupancy in Ingenio
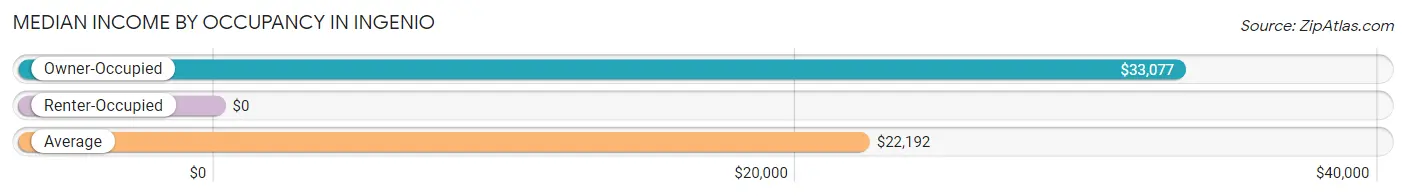
| Occupancy Type | # Households | Median Income |
| Owner-Occupied | 654 (71.1%) | $33,077 |
| Renter-Occupied | 266 (28.9%) | $0 |
| Average | 920 (100.0%) | $22,192 |
Occupancy by Householder Income Bracket in Ingenio
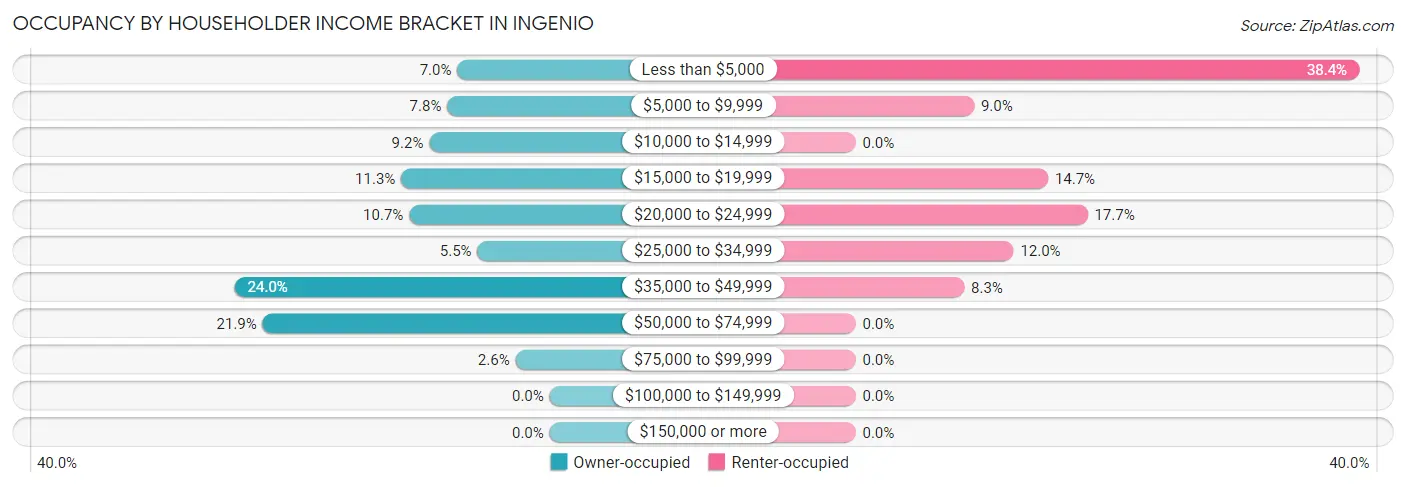
| Income Bracket | Owner-occupied | Renter-occupied |
| Less than $5,000 | 46 (7.0%) | 102 (38.4%) |
| $5,000 to $9,999 | 51 (7.8%) | 24 (9.0%) |
| $10,000 to $14,999 | 60 (9.2%) | 0 (0.0%) |
| $15,000 to $19,999 | 74 (11.3%) | 39 (14.7%) |
| $20,000 to $24,999 | 70 (10.7%) | 47 (17.7%) |
| $25,000 to $34,999 | 36 (5.5%) | 32 (12.0%) |
| $35,000 to $49,999 | 157 (24.0%) | 22 (8.3%) |
| $50,000 to $74,999 | 143 (21.9%) | 0 (0.0%) |
| $75,000 to $99,999 | 17 (2.6%) | 0 (0.0%) |
| $100,000 to $149,999 | 0 (0.0%) | 0 (0.0%) |
| $150,000 or more | 0 (0.0%) | 0 (0.0%) |
| Total | 654 (100.0%) | 266 (100.0%) |
Monthly Housing Cost Tiers in Ingenio
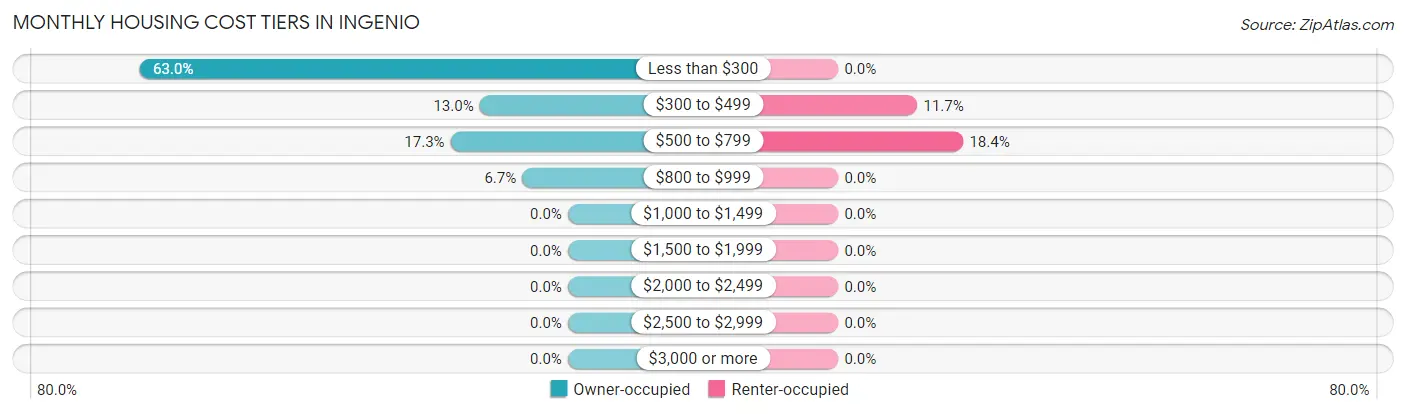
| Monthly Cost | Owner-occupied | Renter-occupied |
| Less than $300 | 412 (63.0%) | 0 (0.0%) |
| $300 to $499 | 85 (13.0%) | 31 (11.7%) |
| $500 to $799 | 113 (17.3%) | 49 (18.4%) |
| $800 to $999 | 44 (6.7%) | 0 (0.0%) |
| $1,000 to $1,499 | 0 (0.0%) | 0 (0.0%) |
| $1,500 to $1,999 | 0 (0.0%) | 0 (0.0%) |
| $2,000 to $2,499 | 0 (0.0%) | 0 (0.0%) |
| $2,500 to $2,999 | 0 (0.0%) | 0 (0.0%) |
| $3,000 or more | 0 (0.0%) | 0 (0.0%) |
| Total | 654 (100.0%) | 266 (100.0%) |
Physical Housing Characteristics in Ingenio
Housing Structures in Ingenio
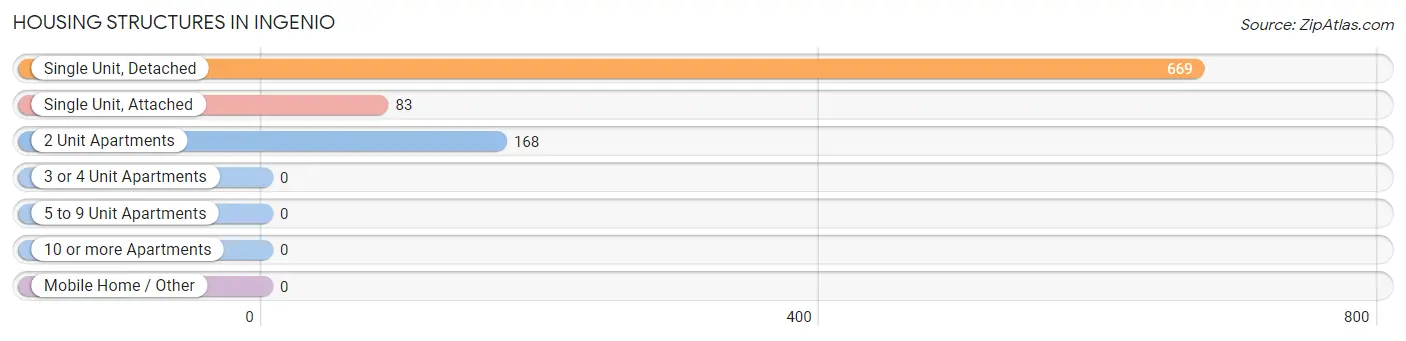
| Structure Type | # Housing Units | % Housing Units |
| Single Unit, Detached | 669 | 72.7% |
| Single Unit, Attached | 83 | 9.0% |
| 2 Unit Apartments | 168 | 18.3% |
| 3 or 4 Unit Apartments | 0 | 0.0% |
| 5 to 9 Unit Apartments | 0 | 0.0% |
| 10 or more Apartments | 0 | 0.0% |
| Mobile Home / Other | 0 | 0.0% |
| Total | 920 | 100.0% |
Housing Structures by Occupancy in Ingenio
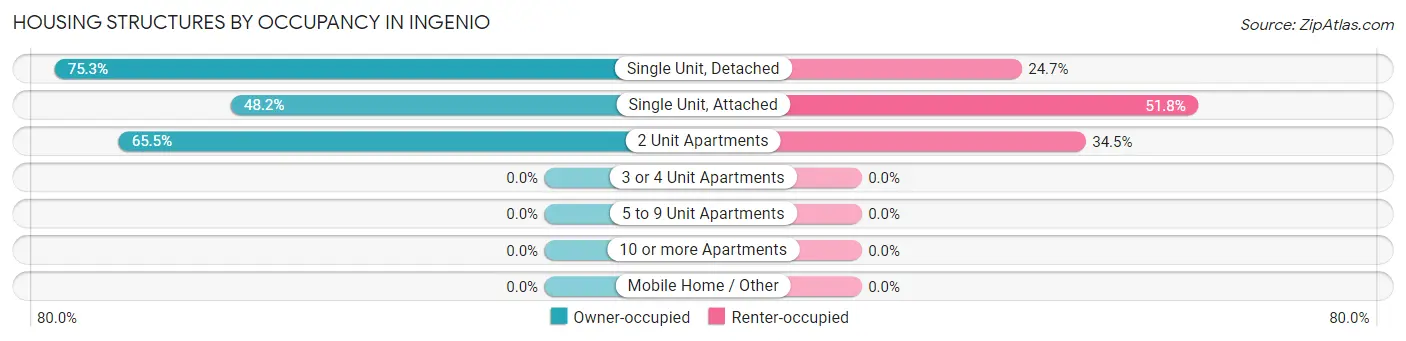
| Structure Type | Owner-occupied | Renter-occupied |
| Single Unit, Detached | 504 (75.3%) | 165 (24.7%) |
| Single Unit, Attached | 40 (48.2%) | 43 (51.8%) |
| 2 Unit Apartments | 110 (65.5%) | 58 (34.5%) |
| 3 or 4 Unit Apartments | 0 (0.0%) | 0 (0.0%) |
| 5 to 9 Unit Apartments | 0 (0.0%) | 0 (0.0%) |
| 10 or more Apartments | 0 (0.0%) | 0 (0.0%) |
| Mobile Home / Other | 0 (0.0%) | 0 (0.0%) |
| Total | 654 (71.1%) | 266 (28.9%) |
Housing Structures by Number of Rooms in Ingenio
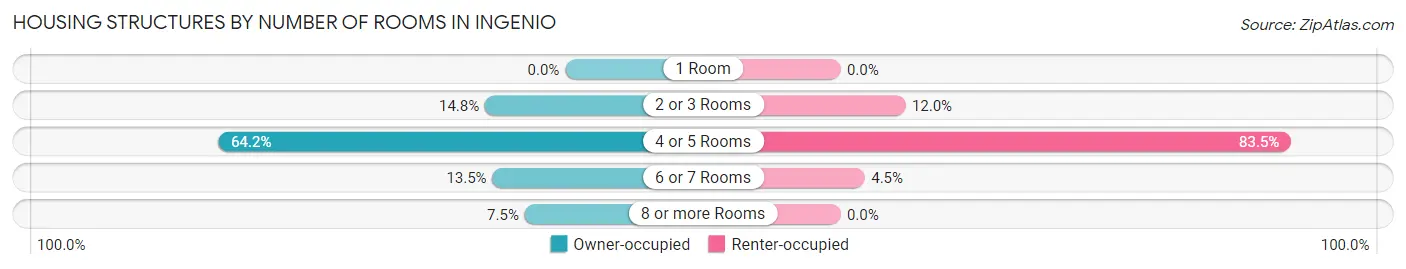
| Number of Rooms | Owner-occupied | Renter-occupied |
| 1 Room | 0 (0.0%) | 0 (0.0%) |
| 2 or 3 Rooms | 97 (14.8%) | 32 (12.0%) |
| 4 or 5 Rooms | 420 (64.2%) | 222 (83.5%) |
| 6 or 7 Rooms | 88 (13.5%) | 12 (4.5%) |
| 8 or more Rooms | 49 (7.5%) | 0 (0.0%) |
| Total | 654 (100.0%) | 266 (100.0%) |
Housing Structure by Heating Type in Ingenio
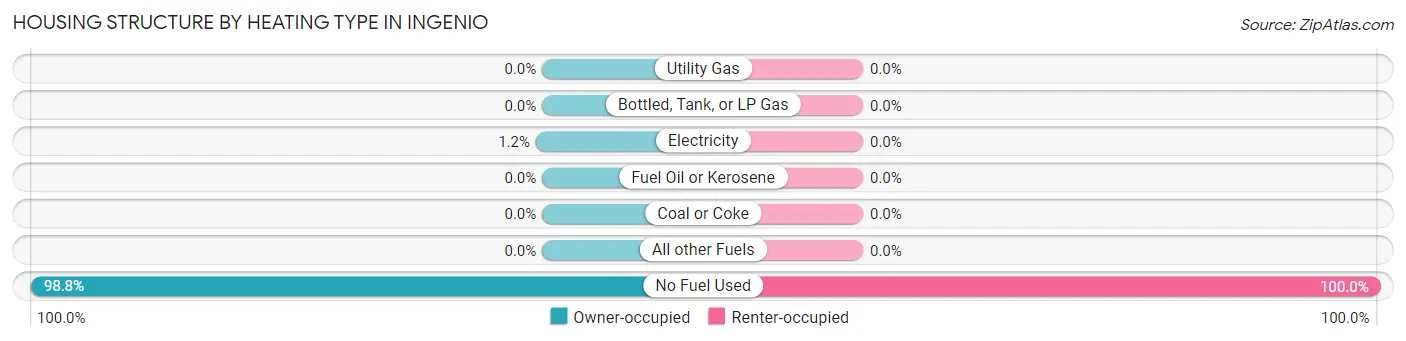
| Heating Type | Owner-occupied | Renter-occupied |
| Utility Gas | 0 (0.0%) | 0 (0.0%) |
| Bottled, Tank, or LP Gas | 0 (0.0%) | 0 (0.0%) |
| Electricity | 8 (1.2%) | 0 (0.0%) |
| Fuel Oil or Kerosene | 0 (0.0%) | 0 (0.0%) |
| Coal or Coke | 0 (0.0%) | 0 (0.0%) |
| All other Fuels | 0 (0.0%) | 0 (0.0%) |
| No Fuel Used | 646 (98.8%) | 266 (100.0%) |
| Total | 654 (100.0%) | 266 (100.0%) |
Household Vehicle Usage in Ingenio
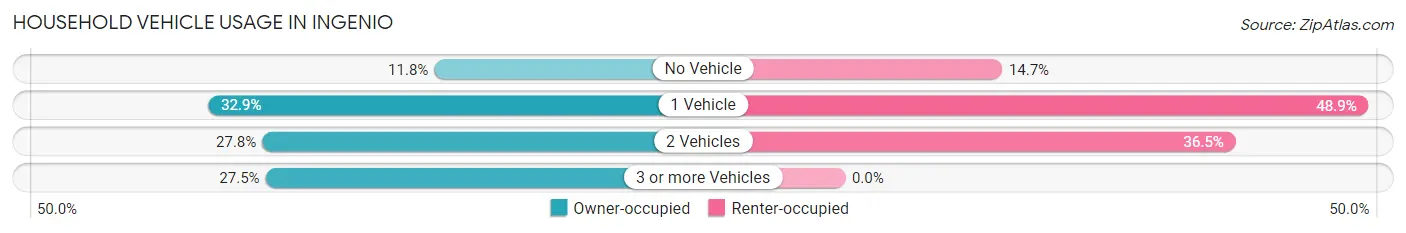
| Vehicles per Household | Owner-occupied | Renter-occupied |
| No Vehicle | 77 (11.8%) | 39 (14.7%) |
| 1 Vehicle | 215 (32.9%) | 130 (48.9%) |
| 2 Vehicles | 182 (27.8%) | 97 (36.5%) |
| 3 or more Vehicles | 180 (27.5%) | 0 (0.0%) |
| Total | 654 (100.0%) | 266 (100.0%) |
Real Estate & Mortgages in Ingenio
Real Estate and Mortgage Overview in Ingenio
| Characteristic | Without Mortgage | With Mortgage |
| Housing Units | 527 | 127 |
| Median Property Value | $95,800 | $119,800 |
| Median Household Income | $21,935 | $0 |
| Monthly Housing Costs | $220 | $0 |
| Real Estate Taxes | - | - |
Property Value by Mortgage Status in Ingenio
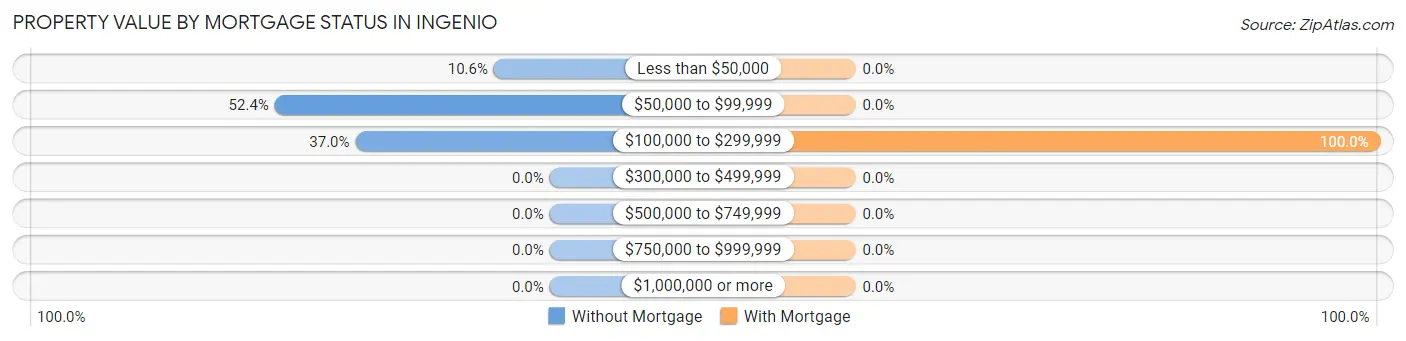
| Property Value | Without Mortgage | With Mortgage |
| Less than $50,000 | 56 (10.6%) | 0 (0.0%) |
| $50,000 to $99,999 | 276 (52.4%) | 0 (0.0%) |
| $100,000 to $299,999 | 195 (37.0%) | 127 (100.0%) |
| $300,000 to $499,999 | 0 (0.0%) | 0 (0.0%) |
| $500,000 to $749,999 | 0 (0.0%) | 0 (0.0%) |
| $750,000 to $999,999 | 0 (0.0%) | 0 (0.0%) |
| $1,000,000 or more | 0 (0.0%) | 0 (0.0%) |
| Total | 527 (100.0%) | 127 (100.0%) |
Household Income by Mortgage Status in Ingenio
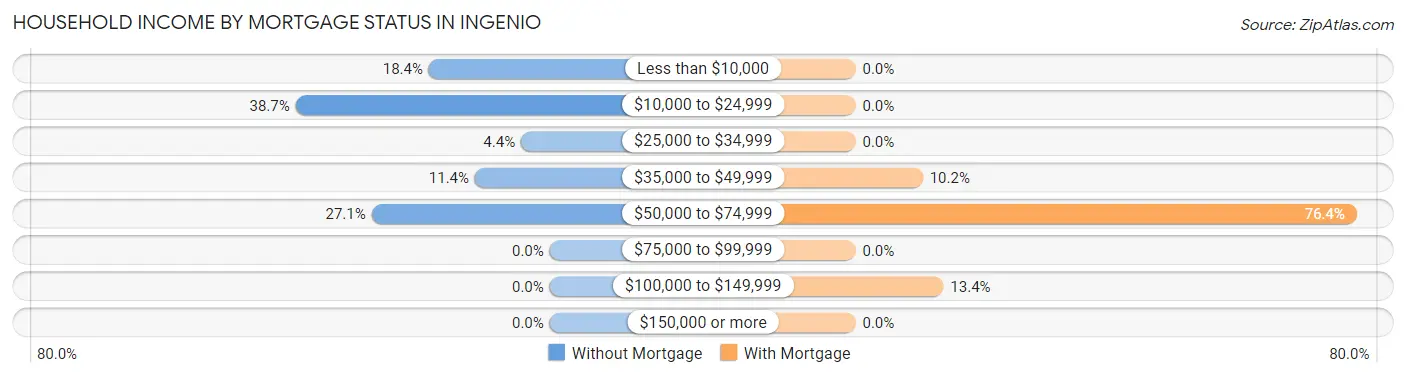
| Household Income | Without Mortgage | With Mortgage |
| Less than $10,000 | 97 (18.4%) | 0 (0.0%) |
| $10,000 to $24,999 | 204 (38.7%) | 0 (0.0%) |
| $25,000 to $34,999 | 23 (4.4%) | 0 (0.0%) |
| $35,000 to $49,999 | 60 (11.4%) | 13 (10.2%) |
| $50,000 to $74,999 | 143 (27.1%) | 97 (76.4%) |
| $75,000 to $99,999 | 0 (0.0%) | 0 (0.0%) |
| $100,000 to $149,999 | 0 (0.0%) | 17 (13.4%) |
| $150,000 or more | 0 (0.0%) | 0 (0.0%) |
| Total | 527 (100.0%) | 127 (100.0%) |
Property Value to Household Income Ratio in Ingenio
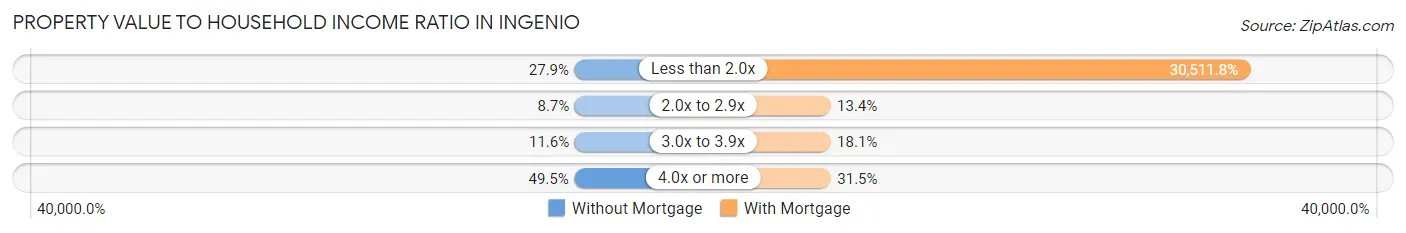
| Value-to-Income Ratio | Without Mortgage | With Mortgage |
| Less than 2.0x | 147 (27.9%) | 38,750 (30,511.8%) |
| 2.0x to 2.9x | 46 (8.7%) | 17 (13.4%) |
| 3.0x to 3.9x | 61 (11.6%) | 23 (18.1%) |
| 4.0x or more | 261 (49.5%) | 40 (31.5%) |
| Total | 527 (100.0%) | 127 (100.0%) |
Real Estate Taxes by Mortgage Status in Ingenio
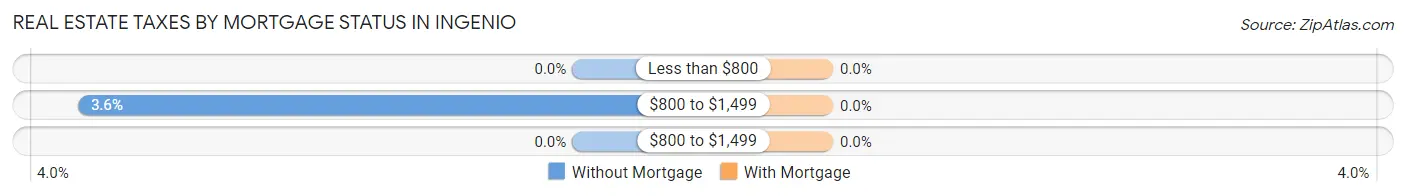
| Property Taxes | Without Mortgage | With Mortgage |
| Less than $800 | 0 (0.0%) | 0 (0.0%) |
| $800 to $1,499 | 19 (3.6%) | 0 (0.0%) |
| $800 to $1,499 | 0 (0.0%) | 0 (0.0%) |
| Total | 527 (100.0%) | 127 (100.0%) |
Health & Disability in Ingenio
Health Insurance Coverage by Age in Ingenio
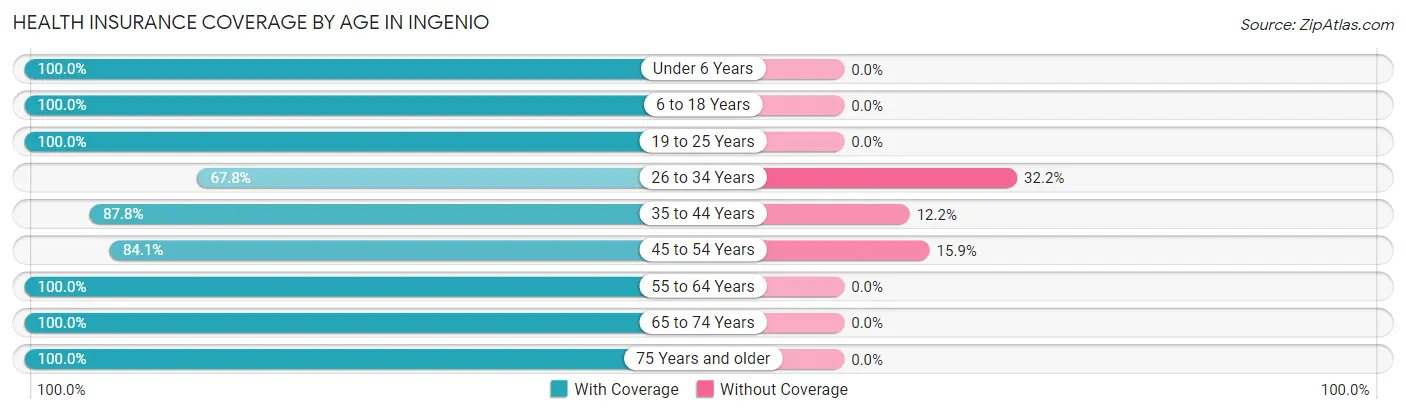
| Age Bracket | With Coverage | Without Coverage |
| Under 6 Years | 74 (100.0%) | 0 (0.0%) |
| 6 to 18 Years | 575 (100.0%) | 0 (0.0%) |
| 19 to 25 Years | 74 (100.0%) | 0 (0.0%) |
| 26 to 34 Years | 103 (67.8%) | 49 (32.2%) |
| 35 to 44 Years | 439 (87.8%) | 61 (12.2%) |
| 45 to 54 Years | 206 (84.1%) | 39 (15.9%) |
| 55 to 64 Years | 347 (100.0%) | 0 (0.0%) |
| 65 to 74 Years | 397 (100.0%) | 0 (0.0%) |
| 75 Years and older | 249 (100.0%) | 0 (0.0%) |
| Total | 2,464 (94.3%) | 149 (5.7%) |
Health Insurance Coverage by Citizenship Status in Ingenio
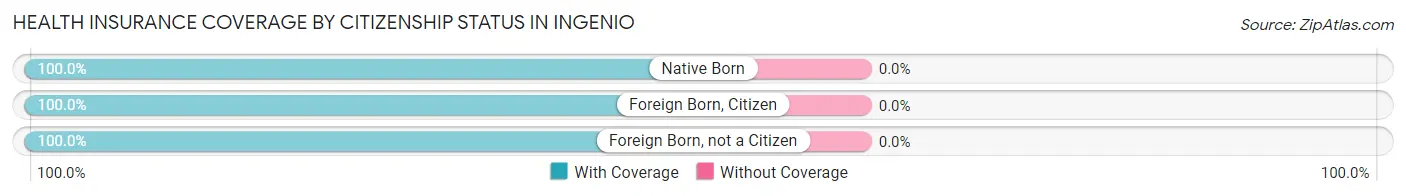
| Citizenship Status | With Coverage | Without Coverage |
| Native Born | 74 (100.0%) | 0 (0.0%) |
| Foreign Born, Citizen | 575 (100.0%) | 0 (0.0%) |
| Foreign Born, not a Citizen | 74 (100.0%) | 0 (0.0%) |
Health Insurance Coverage by Household Income in Ingenio
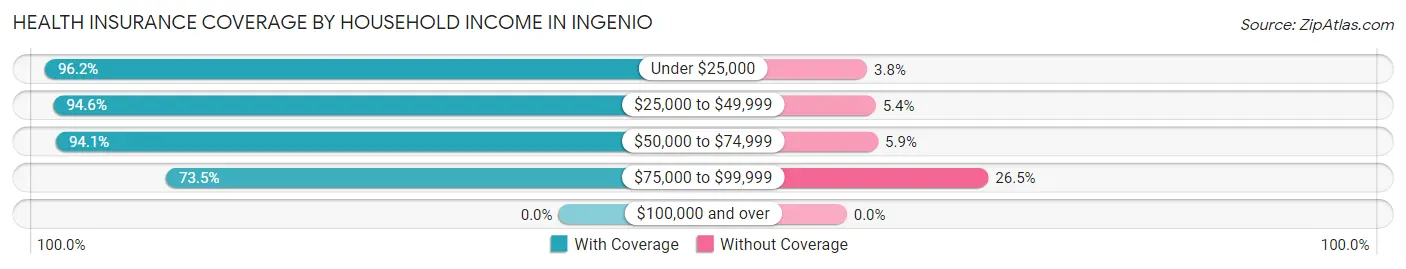
| Household Income | With Coverage | Without Coverage |
| Under $25,000 | 982 (96.2%) | 39 (3.8%) |
| $25,000 to $49,999 | 802 (94.6%) | 46 (5.4%) |
| $50,000 to $74,999 | 608 (94.1%) | 38 (5.9%) |
| $75,000 to $99,999 | 72 (73.5%) | 26 (26.5%) |
| $100,000 and over | 0 (0.0%) | 0 (0.0%) |
Public vs Private Health Insurance Coverage by Age in Ingenio
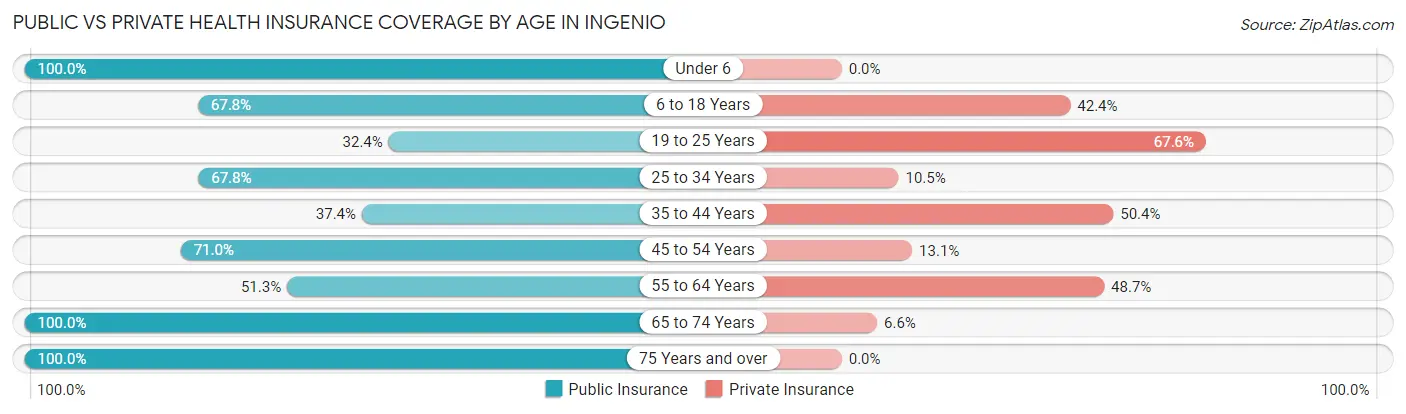
| Age Bracket | Public Insurance | Private Insurance |
| Under 6 | 74 (100.0%) | 0 (0.0%) |
| 6 to 18 Years | 390 (67.8%) | 244 (42.4%) |
| 19 to 25 Years | 24 (32.4%) | 50 (67.6%) |
| 25 to 34 Years | 103 (67.8%) | 16 (10.5%) |
| 35 to 44 Years | 187 (37.4%) | 252 (50.4%) |
| 45 to 54 Years | 174 (71.0%) | 32 (13.1%) |
| 55 to 64 Years | 178 (51.3%) | 169 (48.7%) |
| 65 to 74 Years | 397 (100.0%) | 26 (6.6%) |
| 75 Years and over | 249 (100.0%) | 0 (0.0%) |
| Total | 1,776 (68.0%) | 789 (30.2%) |
Disability Status by Sex by Age in Ingenio
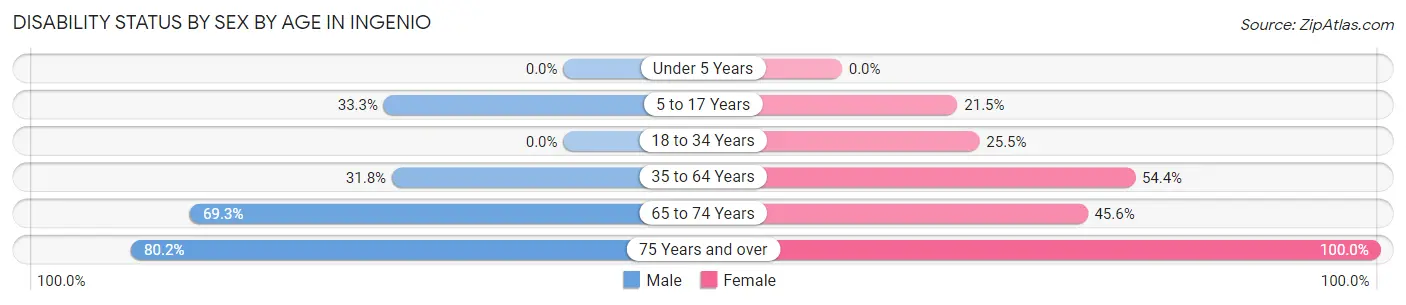
| Age Bracket | Male | Female |
| Under 5 Years | 0 (0.0%) | 0 (0.0%) |
| 5 to 17 Years | 84 (33.3%) | 74 (21.4%) |
| 18 to 34 Years | 0 (0.0%) | 24 (25.5%) |
| 35 to 64 Years | 196 (31.8%) | 259 (54.4%) |
| 65 to 74 Years | 149 (69.3%) | 83 (45.6%) |
| 75 Years and over | 77 (80.2%) | 153 (100.0%) |
Disability Class by Sex by Age in Ingenio
Disability Class: Hearing Difficulty
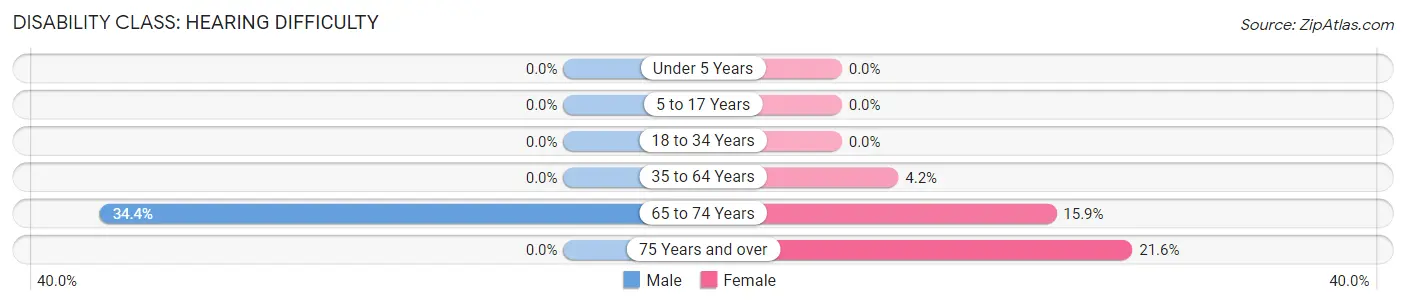
| Age Bracket | Male | Female |
| Under 5 Years | 0 (0.0%) | 0 (0.0%) |
| 5 to 17 Years | 0 (0.0%) | 0 (0.0%) |
| 18 to 34 Years | 0 (0.0%) | 0 (0.0%) |
| 35 to 64 Years | 0 (0.0%) | 20 (4.2%) |
| 65 to 74 Years | 74 (34.4%) | 29 (15.9%) |
| 75 Years and over | 0 (0.0%) | 33 (21.6%) |
Disability Class: Vision Difficulty
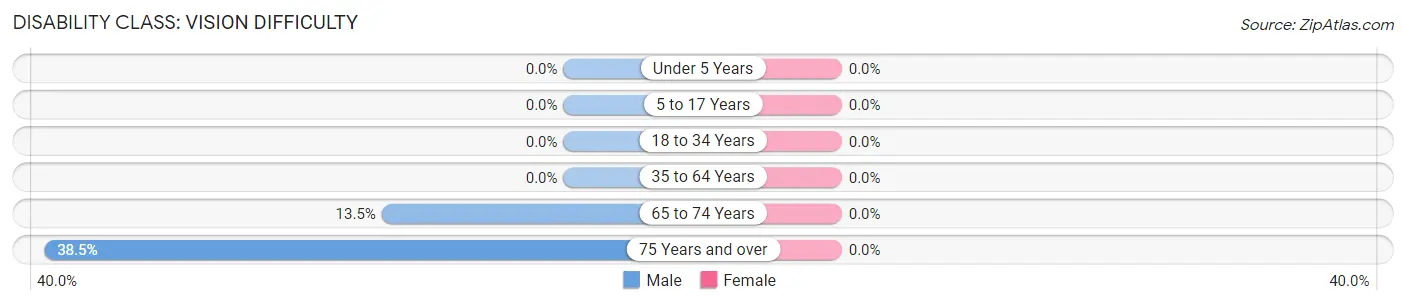
| Age Bracket | Male | Female |
| Under 5 Years | 0 (0.0%) | 0 (0.0%) |
| 5 to 17 Years | 0 (0.0%) | 0 (0.0%) |
| 18 to 34 Years | 0 (0.0%) | 0 (0.0%) |
| 35 to 64 Years | 0 (0.0%) | 0 (0.0%) |
| 65 to 74 Years | 29 (13.5%) | 0 (0.0%) |
| 75 Years and over | 37 (38.5%) | 0 (0.0%) |
Disability Class: Cognitive Difficulty
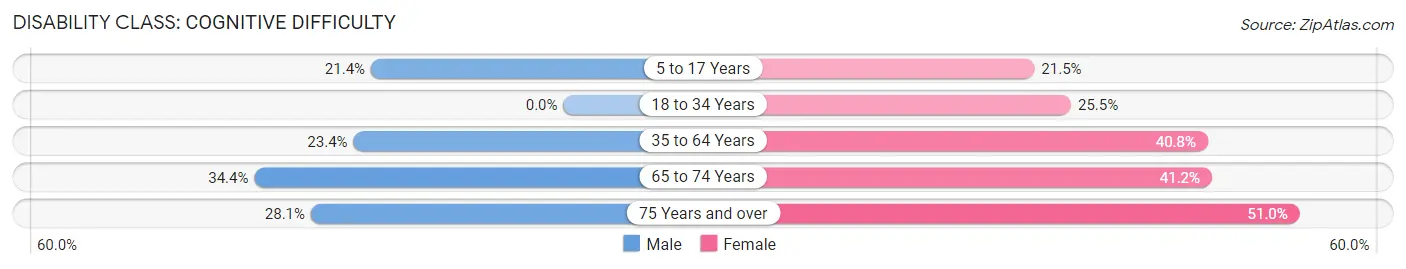
| Age Bracket | Male | Female |
| 5 to 17 Years | 54 (21.4%) | 74 (21.4%) |
| 18 to 34 Years | 0 (0.0%) | 24 (25.5%) |
| 35 to 64 Years | 144 (23.4%) | 194 (40.8%) |
| 65 to 74 Years | 74 (34.4%) | 75 (41.2%) |
| 75 Years and over | 27 (28.1%) | 78 (51.0%) |
Disability Class: Ambulatory Difficulty
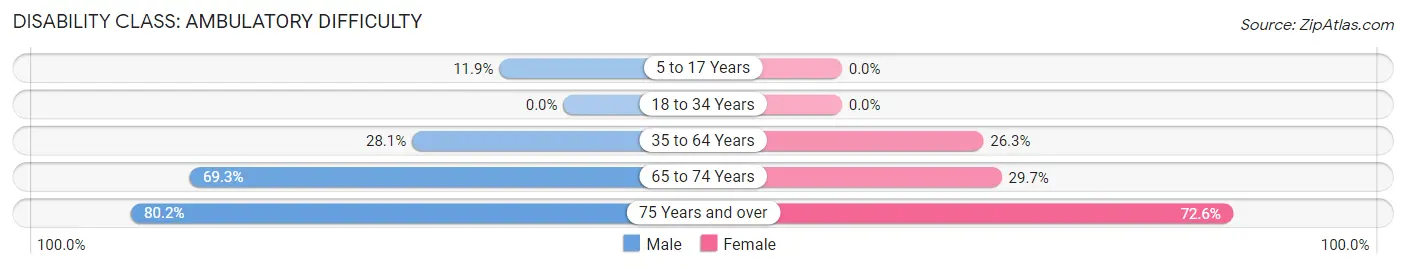
| Age Bracket | Male | Female |
| 5 to 17 Years | 30 (11.9%) | 0 (0.0%) |
| 18 to 34 Years | 0 (0.0%) | 0 (0.0%) |
| 35 to 64 Years | 173 (28.1%) | 125 (26.3%) |
| 65 to 74 Years | 149 (69.3%) | 54 (29.7%) |
| 75 Years and over | 77 (80.2%) | 111 (72.6%) |
Disability Class: Self-Care Difficulty
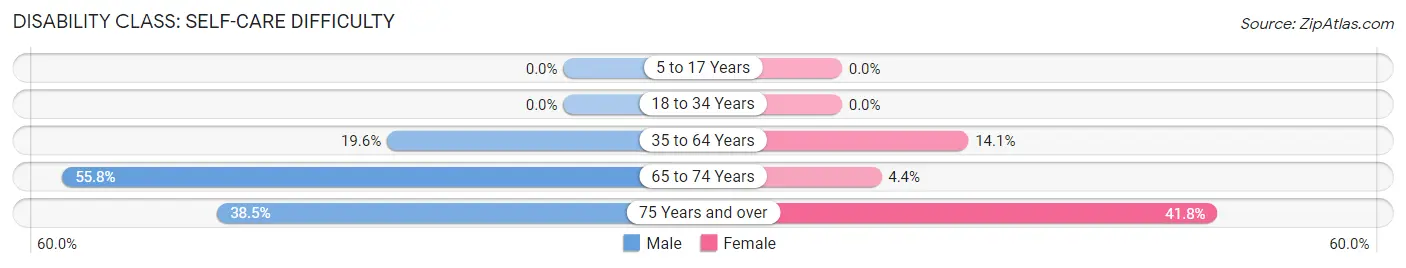
| Age Bracket | Male | Female |
| 5 to 17 Years | 0 (0.0%) | 0 (0.0%) |
| 18 to 34 Years | 0 (0.0%) | 0 (0.0%) |
| 35 to 64 Years | 121 (19.6%) | 67 (14.1%) |
| 65 to 74 Years | 120 (55.8%) | 8 (4.4%) |
| 75 Years and over | 37 (38.5%) | 64 (41.8%) |
Technology Access in Ingenio
Computing Device Access in Ingenio
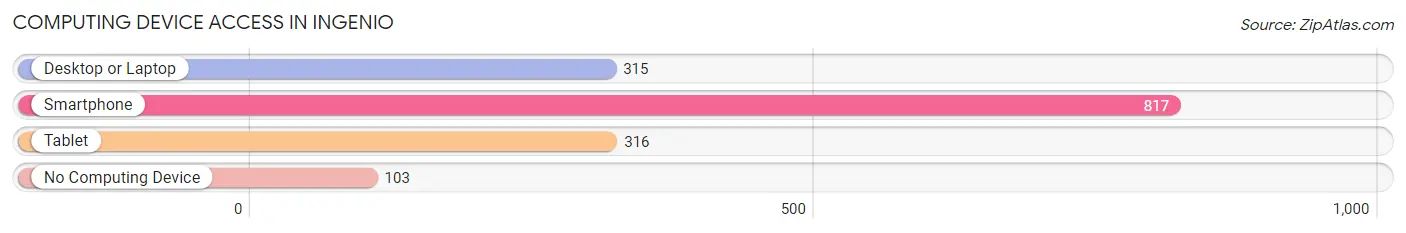
| Device Type | # Households | % Households |
| Desktop or Laptop | 315 | 34.2% |
| Smartphone | 817 | 88.8% |
| Tablet | 316 | 34.4% |
| No Computing Device | 103 | 11.2% |
| Total | 920 | 100.0% |
Internet Access in Ingenio
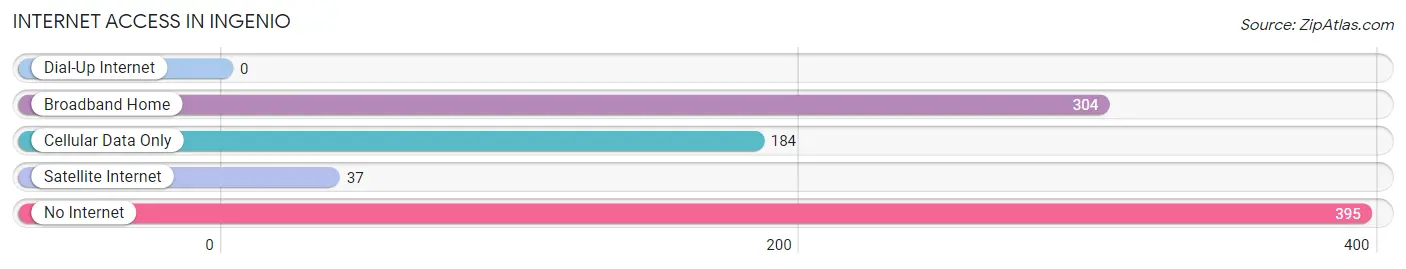
| Internet Type | # Households | % Households |
| Dial-Up Internet | 0 | 0.0% |
| Broadband Home | 304 | 33.0% |
| Cellular Data Only | 184 | 20.0% |
| Satellite Internet | 37 | 4.0% |
| No Internet | 395 | 42.9% |
| Total | 920 | 100.0% |
Ingenio Summary
Ingenio is a municipality located in the eastern part of Puerto Rico, in the region known as the Eastern Region. It is located in the center of the island, in the middle of the Cordillera Central mountain range. The municipality is bordered by the municipalities of Jayuya, Utuado, Ciales, and Orocovis. It is part of the San Juan-Caguas-Guaynabo Metropolitan Statistical Area.
History
The area of Ingenio was originally inhabited by the Taíno Indians. The first Spanish settlers arrived in the area in the early 16th century. The area was originally part of the municipality of Utuado, but in 1824 it was established as its own municipality. The name of the municipality comes from the Spanish word for “ingenuity”, which was chosen to reflect the hardworking and resourceful nature of the people of the area.
Geography
Ingenio is located in the center of Puerto Rico, in the middle of the Cordillera Central mountain range. The municipality covers an area of approximately 24 square miles (62 square kilometers). The terrain is mostly mountainous, with some flat areas in the lower elevations. The highest point in the municipality is Cerro de Punta, which has an elevation of 3,087 feet (941 meters). The climate is tropical, with temperatures ranging from the mid-70s to the mid-80s Fahrenheit (21-29 Celsius).
Economy
The economy of Ingenio is largely based on agriculture. The main crops grown in the area are coffee, plantains, bananas, and sugarcane. The municipality also has some light industry, including food processing and furniture manufacturing. Tourism is also an important part of the economy, with many visitors coming to the area to enjoy the natural beauty of the mountains and rivers.
Demographics
As of the 2010 census, the population of Ingenio was 8,945. The population is mostly of mixed European and Taíno descent. The majority of the population (90.3%) is of Hispanic or Latino origin. The median household income in the municipality is $17,845, which is lower than the national average. The unemployment rate is also higher than the national average, at 16.2%.
Conclusion
Ingenio is a municipality located in the eastern part of Puerto Rico, in the region known as the Eastern Region. It is bordered by the municipalities of Jayuya, Utuado, Ciales, and Orocovis. The economy of Ingenio is largely based on agriculture, with some light industry and tourism also contributing to the local economy. The population of Ingenio is mostly of mixed European and Taíno descent, with a median household income of $17,845 and an unemployment rate of 16.2%.
Common Questions
What is Per Capita Income in Ingenio?
Per Capita income in Ingenio is $10,324.
What is the Median Family Income in Ingenio?
Median Family Income in Ingenio is $24,453.
What is the Median Household income in Ingenio?
Median Household Income in Ingenio is $22,192.
What is Income or Wage Gap in Ingenio?
Income or Wage Gap in Ingenio is 36.6%.
Women in Ingenio earn 63.4 cents for every dollar earned by a man.
What is Inequality or Gini Index in Ingenio?
Inequality or Gini Index in Ingenio is 0.41.
What is the Total Population of Ingenio?
Total Population of Ingenio is 2,613.
What is the Total Male Population of Ingenio?
Total Male Population of Ingenio is 1,363.
What is the Total Female Population of Ingenio?
Total Female Population of Ingenio is 1,250.
What is the Ratio of Males per 100 Females in Ingenio?
There are 109.04 Males per 100 Females in Ingenio.
What is the Ratio of Females per 100 Males in Ingenio?
There are 91.71 Females per 100 Males in Ingenio.
What is the Median Population Age in Ingenio?
Median Population Age in Ingenio is 43.8 Years.
What is the Average Family Size in Ingenio
Average Family Size in Ingenio is 3.5 People.
What is the Average Household Size in Ingenio
Average Household Size in Ingenio is 2.8 People.
How Large is the Labor Force in Ingenio?
There are 889 People in the Labor Forcein in Ingenio.
What is the Percentage of People in the Labor Force in Ingenio?
40.1% of People are in the Labor Force in Ingenio.
What is the Unemployment Rate in Ingenio?
Unemployment Rate in Ingenio is 16.4%.