Shenandoah Retreat, VA Map & Demographics
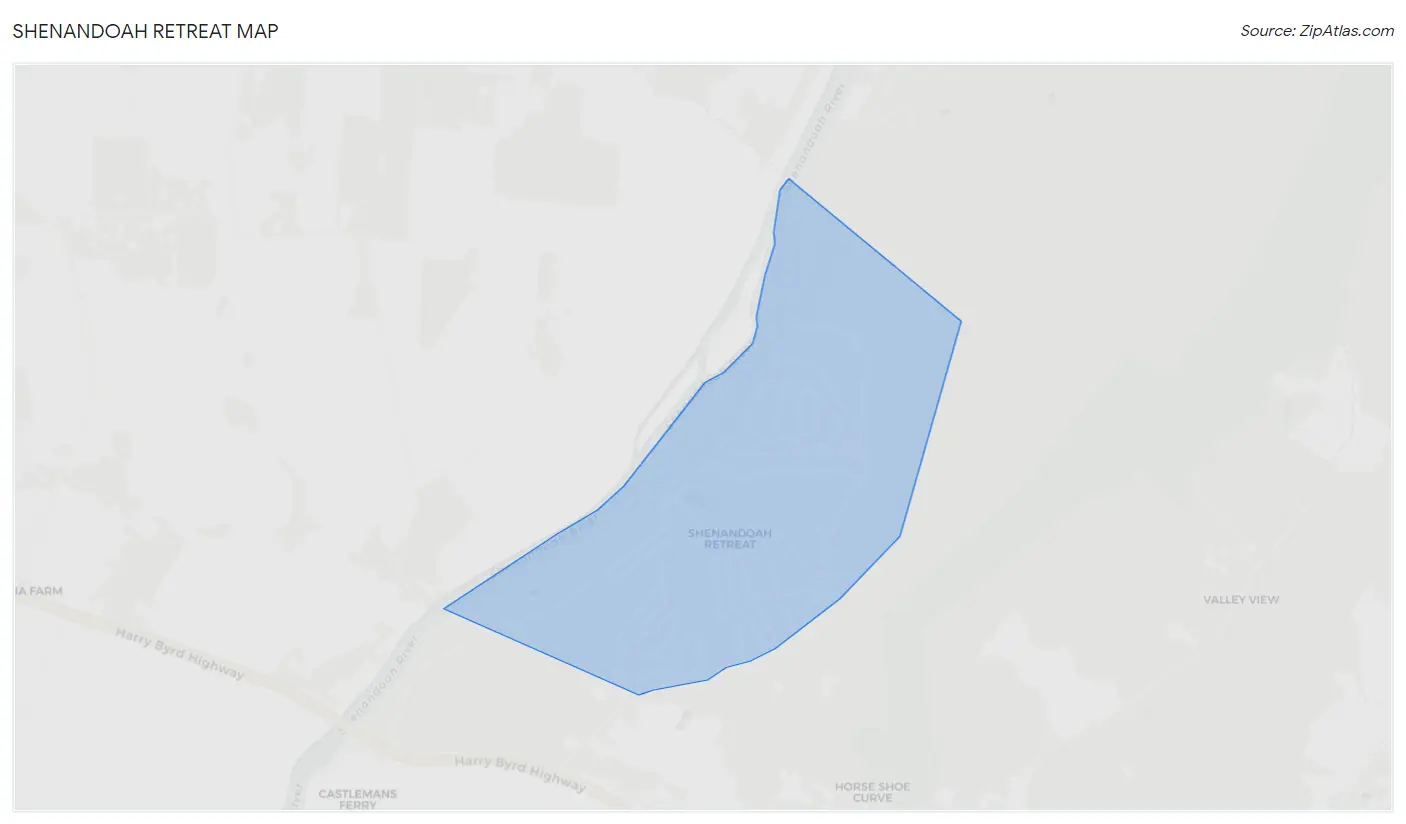
Shenandoah Retreat Map
Shenandoah Retreat Overview
$38,713
PER CAPITA INCOME
$111,797
AVG FAMILY INCOME
$65,156
AVG HOUSEHOLD INCOME
17.2%
WAGE / INCOME GAP [ % ]
82.8¢/ $1
WAGE / INCOME GAP [ $ ]
0.35
INEQUALITY / GINI INDEX
622
TOTAL POPULATION
406
MALE POPULATION
216
FEMALE POPULATION
187.96
MALES / 100 FEMALES
53.20
FEMALES / 100 MALES
47.4
MEDIAN AGE
3.6
AVG FAMILY SIZE
2.2
AVG HOUSEHOLD SIZE
360
LABOR FORCE [ PEOPLE ]
67.5%
PERCENT IN LABOR FORCE
0.6%
UNEMPLOYMENT RATE
Income in Shenandoah Retreat
Income Overview in Shenandoah Retreat
Per Capita Income in Shenandoah Retreat is $38,713, while median incomes of families and households are $111,797 and $65,156 respectively.
| Characteristic | Number | Measure |
| Per Capita Income | 622 | $38,713 |
| Median Family Income | 127 | $111,797 |
| Mean Family Income | 127 | $114,310 |
| Median Household Income | 277 | $65,156 |
| Mean Household Income | 277 | $82,406 |
| Income Deficit | 127 | $0 |
| Wage / Income Gap (%) | 622 | 17.19% |
| Wage / Income Gap ($) | 622 | 82.81¢ per $1 |
| Gini / Inequality Index | 622 | 0.35 |
Earnings by Sex in Shenandoah Retreat
Average Earnings in Shenandoah Retreat are $47,083, $55,284 for men and $45,781 for women, a difference of 17.2%.
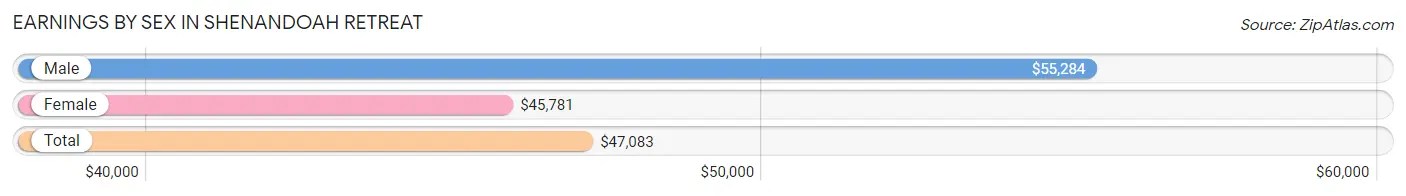
| Sex | Number | Average Earnings |
| Male | 247 (68.6%) | $55,284 |
| Female | 113 (31.4%) | $45,781 |
| Total | 360 (100.0%) | $47,083 |
Earnings by Sex by Income Bracket in Shenandoah Retreat
The most common earnings brackets in Shenandoah Retreat are $55,000 to $64,999 for men (63 | 25.5%) and $100,000+ for women (22 | 19.5%).
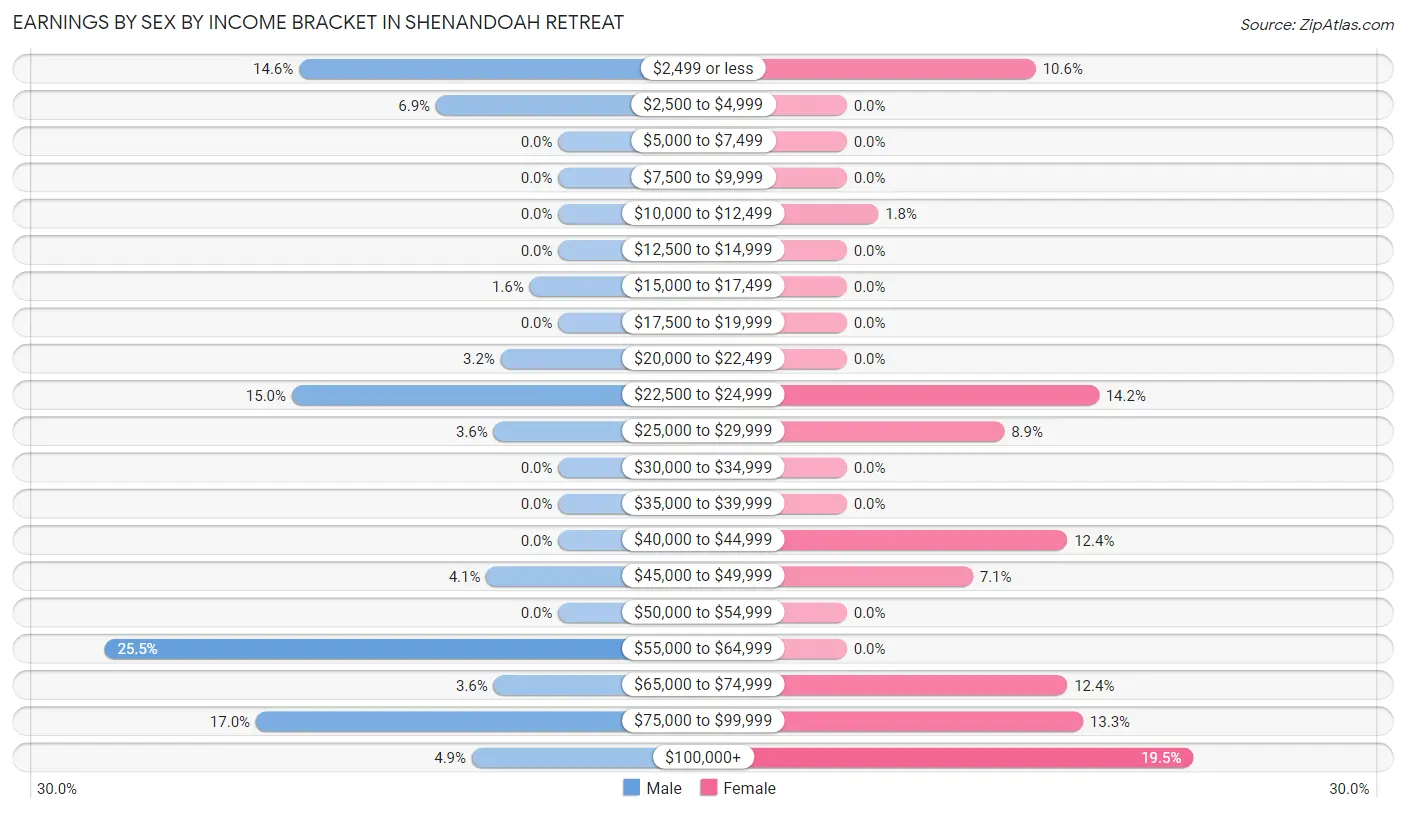
| Income | Male | Female |
| $2,499 or less | 36 (14.6%) | 12 (10.6%) |
| $2,500 to $4,999 | 17 (6.9%) | 0 (0.0%) |
| $5,000 to $7,499 | 0 (0.0%) | 0 (0.0%) |
| $7,500 to $9,999 | 0 (0.0%) | 0 (0.0%) |
| $10,000 to $12,499 | 0 (0.0%) | 2 (1.8%) |
| $12,500 to $14,999 | 0 (0.0%) | 0 (0.0%) |
| $15,000 to $17,499 | 4 (1.6%) | 0 (0.0%) |
| $17,500 to $19,999 | 0 (0.0%) | 0 (0.0%) |
| $20,000 to $22,499 | 8 (3.2%) | 0 (0.0%) |
| $22,500 to $24,999 | 37 (15.0%) | 16 (14.2%) |
| $25,000 to $29,999 | 9 (3.6%) | 10 (8.8%) |
| $30,000 to $34,999 | 0 (0.0%) | 0 (0.0%) |
| $35,000 to $39,999 | 0 (0.0%) | 0 (0.0%) |
| $40,000 to $44,999 | 0 (0.0%) | 14 (12.4%) |
| $45,000 to $49,999 | 10 (4.1%) | 8 (7.1%) |
| $50,000 to $54,999 | 0 (0.0%) | 0 (0.0%) |
| $55,000 to $64,999 | 63 (25.5%) | 0 (0.0%) |
| $65,000 to $74,999 | 9 (3.6%) | 14 (12.4%) |
| $75,000 to $99,999 | 42 (17.0%) | 15 (13.3%) |
| $100,000+ | 12 (4.9%) | 22 (19.5%) |
| Total | 247 (100.0%) | 113 (100.0%) |
Earnings by Sex by Educational Attainment in Shenandoah Retreat
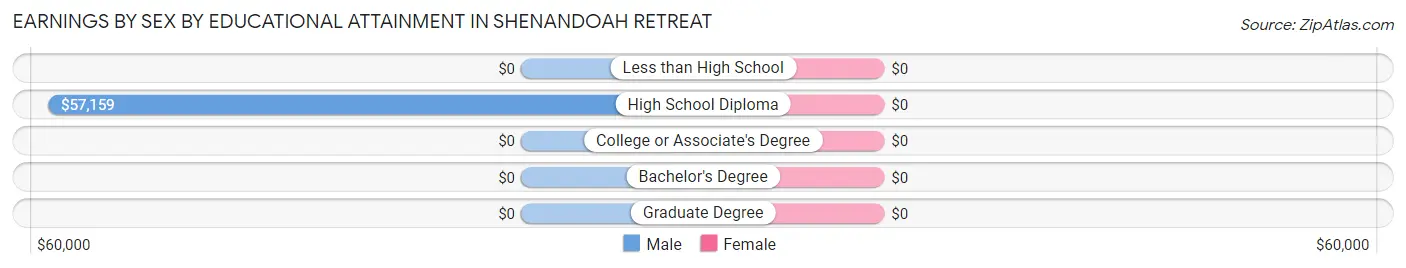
| Educational Attainment | Male Income | Female Income |
| Less than High School | - | - |
| High School Diploma | $57,159 | $0 |
| College or Associate's Degree | - | - |
| Bachelor's Degree | - | - |
| Graduate Degree | - | - |
| Total | $56,875 | $67,768 |
Family Income in Shenandoah Retreat
Family Income Brackets in Shenandoah Retreat
According to the Shenandoah Retreat family income data, there are 52 families falling into the $100,000 to $149,999 income range, which is the most common income bracket and makes up 40.9% of all families.
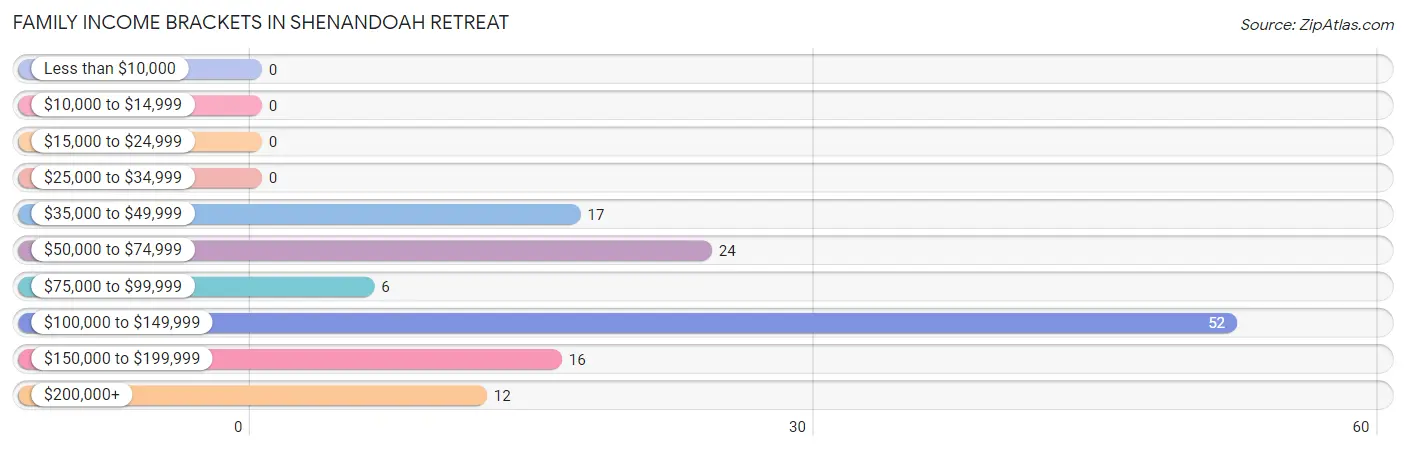
| Income Bracket | # Families | % Families |
| Less than $10,000 | 0 | 0.0% |
| $10,000 to $14,999 | 0 | 0.0% |
| $15,000 to $24,999 | 0 | 0.0% |
| $25,000 to $34,999 | 0 | 0.0% |
| $35,000 to $49,999 | 17 | 13.4% |
| $50,000 to $74,999 | 24 | 18.9% |
| $75,000 to $99,999 | 6 | 4.7% |
| $100,000 to $149,999 | 52 | 40.9% |
| $150,000 to $199,999 | 16 | 12.6% |
| $200,000+ | 12 | 9.4% |
Family Income by Famaliy Size in Shenandoah Retreat
3-person families (24 | 18.9%) account for the highest median family income in Shenandoah Retreat with $205,000 per family, while 3-person families (24 | 18.9%) have the highest median income of $68,333 per family member.
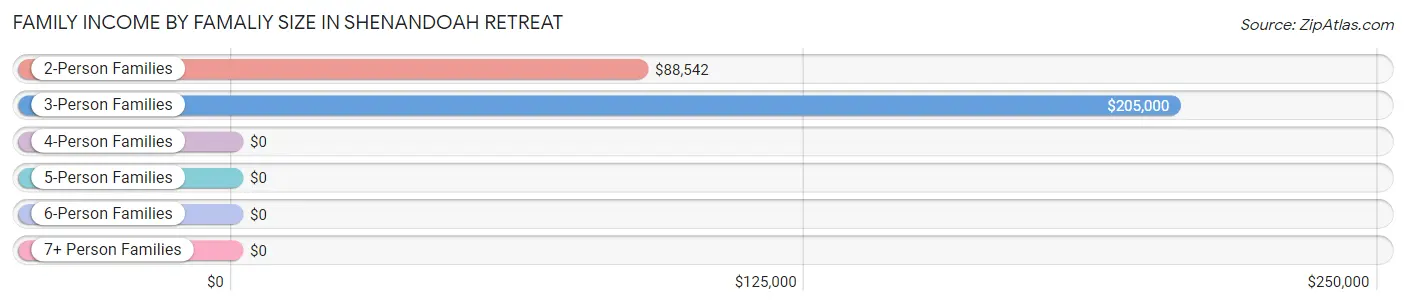
| Income Bracket | # Families | Median Income |
| 2-Person Families | 53 (41.7%) | $88,542 |
| 3-Person Families | 24 (18.9%) | $205,000 |
| 4-Person Families | 42 (33.1%) | $0 |
| 5-Person Families | 0 (0.0%) | $0 |
| 6-Person Families | 0 (0.0%) | $0 |
| 7+ Person Families | 8 (6.3%) | $0 |
| Total | 127 (100.0%) | $111,797 |
Family Income by Number of Earners in Shenandoah Retreat
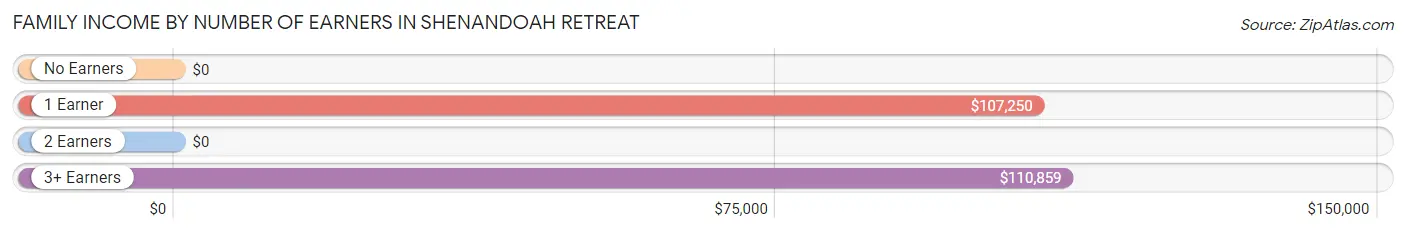
| Number of Earners | # Families | Median Income |
| No Earners | 22 (17.3%) | $0 |
| 1 Earner | 25 (19.7%) | $107,250 |
| 2 Earners | 35 (27.6%) | $0 |
| 3+ Earners | 45 (35.4%) | $110,859 |
| Total | 127 (100.0%) | $111,797 |
Household Income in Shenandoah Retreat
Household Income Brackets in Shenandoah Retreat
With 71 households falling in the category, the $50,000 to $74,999 income range is the most frequent in Shenandoah Retreat, accounting for 25.6% of all households.
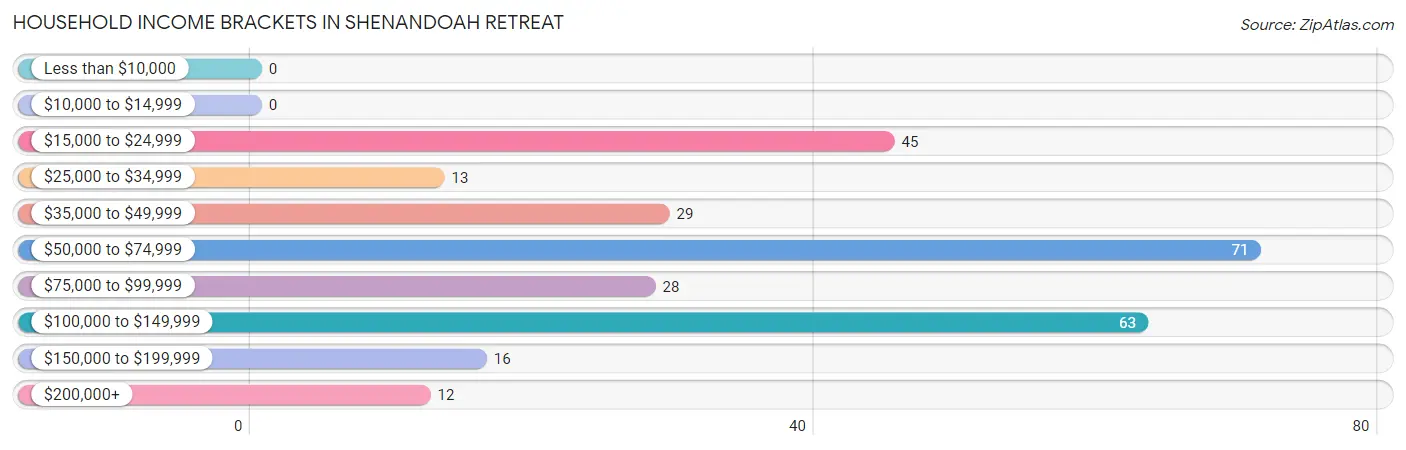
| Income Bracket | # Households | % Households |
| Less than $10,000 | 0 | 0.0% |
| $10,000 to $14,999 | 0 | 0.0% |
| $15,000 to $24,999 | 45 | 16.2% |
| $25,000 to $34,999 | 13 | 4.7% |
| $35,000 to $49,999 | 29 | 10.5% |
| $50,000 to $74,999 | 71 | 25.6% |
| $75,000 to $99,999 | 28 | 10.1% |
| $100,000 to $149,999 | 63 | 22.7% |
| $150,000 to $199,999 | 16 | 5.8% |
| $200,000+ | 12 | 4.3% |
Household Income by Householder Age in Shenandoah Retreat
The median household income in Shenandoah Retreat is $65,156, with the highest median household income of $113,194 found in the 25 to 44 years age bracket for the primary householder. A total of 37 households (13.4%) fall into this category.
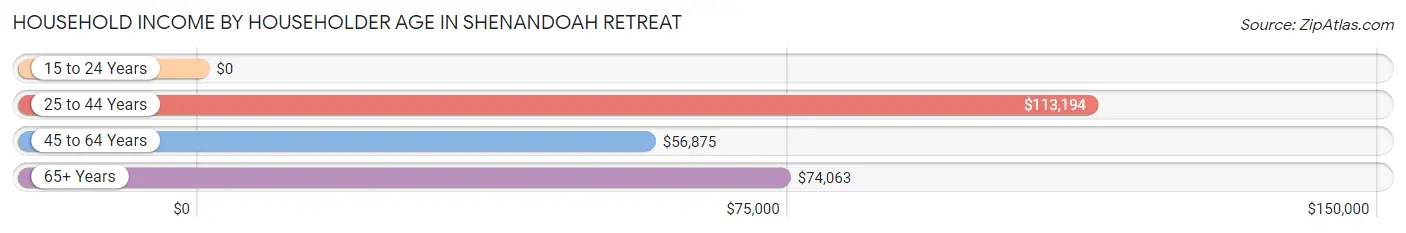
| Income Bracket | # Households | Median Income |
| 15 to 24 Years | 0 (0.0%) | $0 |
| 25 to 44 Years | 37 (13.4%) | $113,194 |
| 45 to 64 Years | 185 (66.8%) | $56,875 |
| 65+ Years | 55 (19.9%) | $74,063 |
| Total | 277 (100.0%) | $65,156 |
Poverty in Shenandoah Retreat
Income Below Poverty by Sex and Age in Shenandoah Retreat
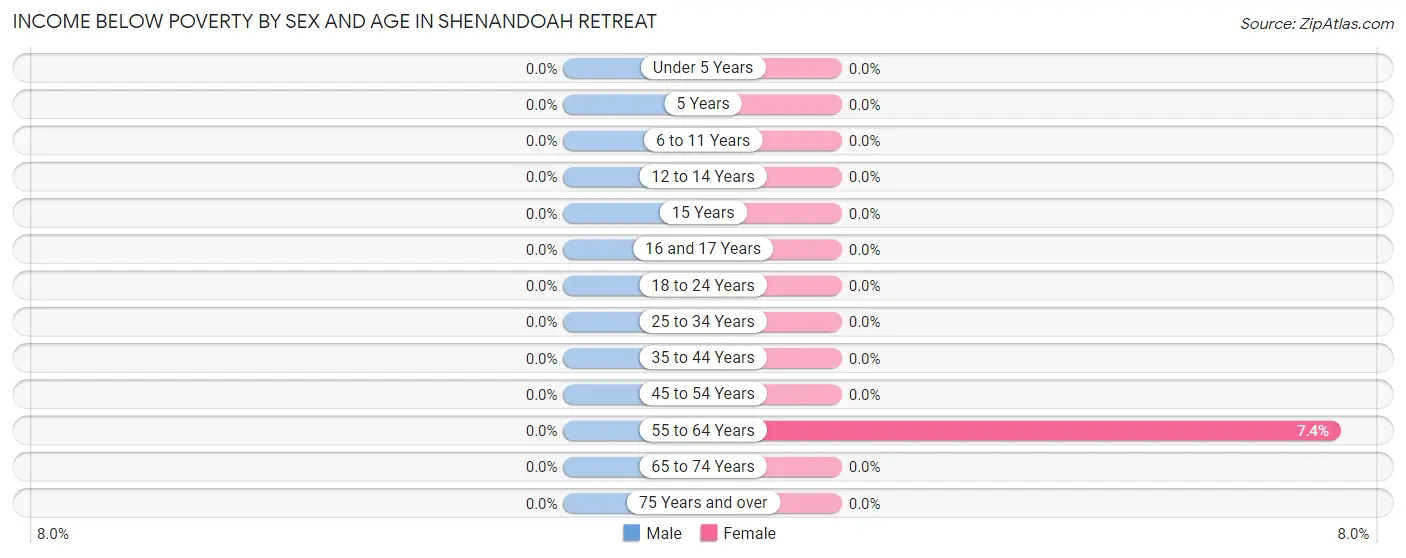
| Age Bracket | Male | Female |
| Under 5 Years | 0 (0.0%) | 0 (0.0%) |
| 5 Years | 0 (0.0%) | 0 (0.0%) |
| 6 to 11 Years | 0 (0.0%) | 0 (0.0%) |
| 12 to 14 Years | 0 (0.0%) | 0 (0.0%) |
| 15 Years | 0 (0.0%) | 0 (0.0%) |
| 16 and 17 Years | 0 (0.0%) | 0 (0.0%) |
| 18 to 24 Years | 0 (0.0%) | 0 (0.0%) |
| 25 to 34 Years | 0 (0.0%) | 0 (0.0%) |
| 35 to 44 Years | 0 (0.0%) | 0 (0.0%) |
| 45 to 54 Years | 0 (0.0%) | 0 (0.0%) |
| 55 to 64 Years | 0 (0.0%) | 2 (7.4%) |
| 65 to 74 Years | 0 (0.0%) | 0 (0.0%) |
| 75 Years and over | 0 (0.0%) | 0 (0.0%) |
| Total | 0 (0.0%) | 2 (0.9%) |
Income Above Poverty by Sex and Age in Shenandoah Retreat
According to the poverty statistics in Shenandoah Retreat, males aged under 5 years and females aged under 5 years are the age groups that are most secure financially, with 100.0% of males and 100.0% of females in these age groups living above the poverty line.
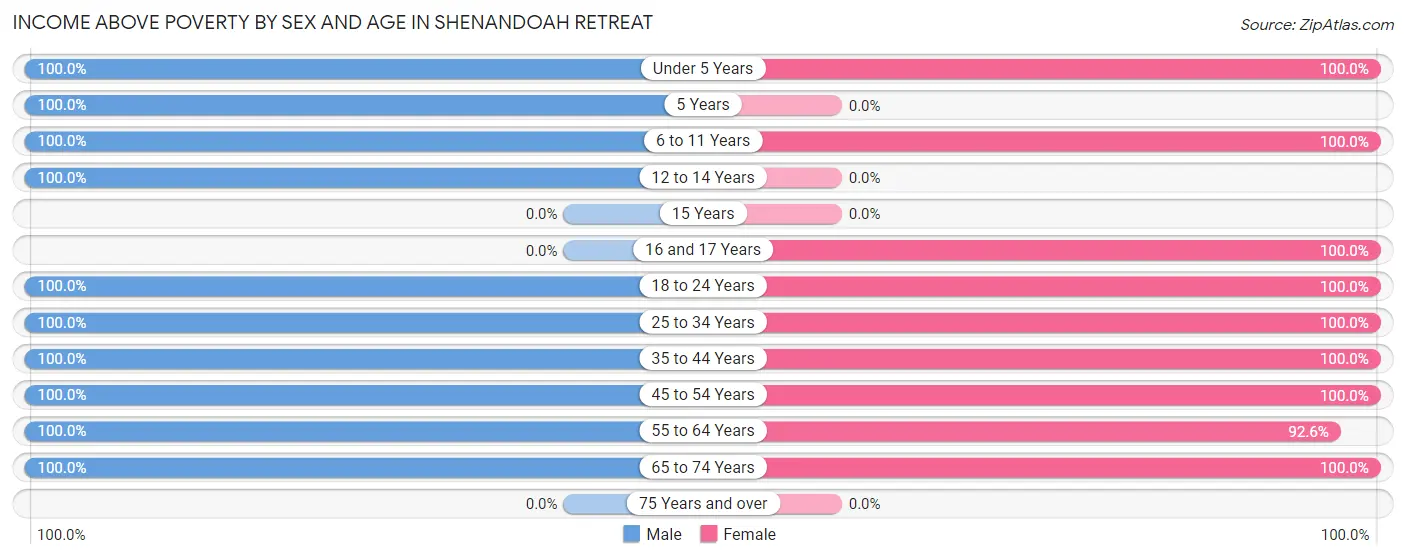
| Age Bracket | Male | Female |
| Under 5 Years | 34 (100.0%) | 10 (100.0%) |
| 5 Years | 10 (100.0%) | 0 (0.0%) |
| 6 to 11 Years | 10 (100.0%) | 9 (100.0%) |
| 12 to 14 Years | 16 (100.0%) | 0 (0.0%) |
| 15 Years | 0 (0.0%) | 0 (0.0%) |
| 16 and 17 Years | 0 (0.0%) | 58 (100.0%) |
| 18 to 24 Years | 28 (100.0%) | 14 (100.0%) |
| 25 to 34 Years | 4 (100.0%) | 17 (100.0%) |
| 35 to 44 Years | 56 (100.0%) | 28 (100.0%) |
| 45 to 54 Years | 113 (100.0%) | 26 (100.0%) |
| 55 to 64 Years | 70 (100.0%) | 25 (92.6%) |
| 65 to 74 Years | 65 (100.0%) | 27 (100.0%) |
| 75 Years and over | 0 (0.0%) | 0 (0.0%) |
| Total | 406 (100.0%) | 214 (99.1%) |
Income Below Poverty Among Married-Couple Families in Shenandoah Retreat
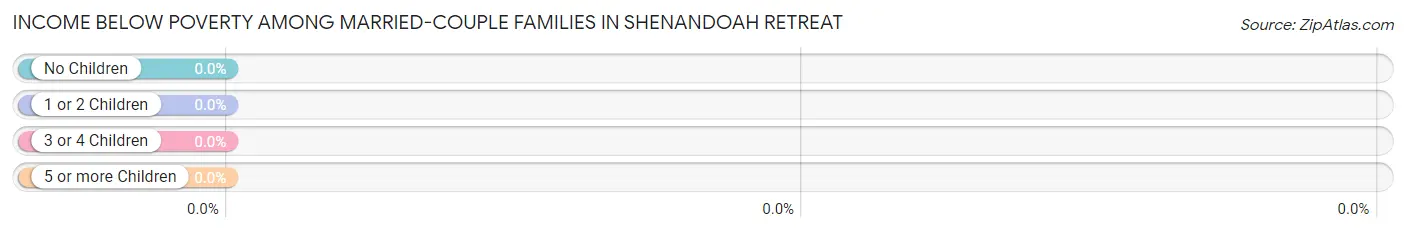
| Children | Above Poverty | Below Poverty |
| No Children | 53 (100.0%) | 0 (0.0%) |
| 1 or 2 Children | 42 (100.0%) | 0 (0.0%) |
| 3 or 4 Children | 0 (0.0%) | 0 (0.0%) |
| 5 or more Children | 8 (100.0%) | 0 (0.0%) |
| Total | 103 (100.0%) | 0 (0.0%) |
Income Below Poverty Among Single-Parent Households in Shenandoah Retreat
| Children | Single Father | Single Mother |
| No Children | 0 (0.0%) | 0 (0.0%) |
| 1 or 2 Children | 0 (0.0%) | 0 (0.0%) |
| 3 or 4 Children | 0 (0.0%) | 0 (0.0%) |
| 5 or more Children | 0 (0.0%) | 0 (0.0%) |
| Total | 0 (0.0%) | 0 (0.0%) |
Income Below Poverty Among Married-Couple vs Single-Parent Households in Shenandoah Retreat
| Children | Married-Couple Families | Single-Parent Households |
| No Children | 0 (0.0%) | 0 (0.0%) |
| 1 or 2 Children | 0 (0.0%) | 0 (0.0%) |
| 3 or 4 Children | 0 (0.0%) | 0 (0.0%) |
| 5 or more Children | 0 (0.0%) | 0 (0.0%) |
| Total | 0 (0.0%) | 0 (0.0%) |
Race in Shenandoah Retreat
The most populous races in Shenandoah Retreat are White / Caucasian (580 | 93.2%), and Two or more Races (42 | 6.8%).
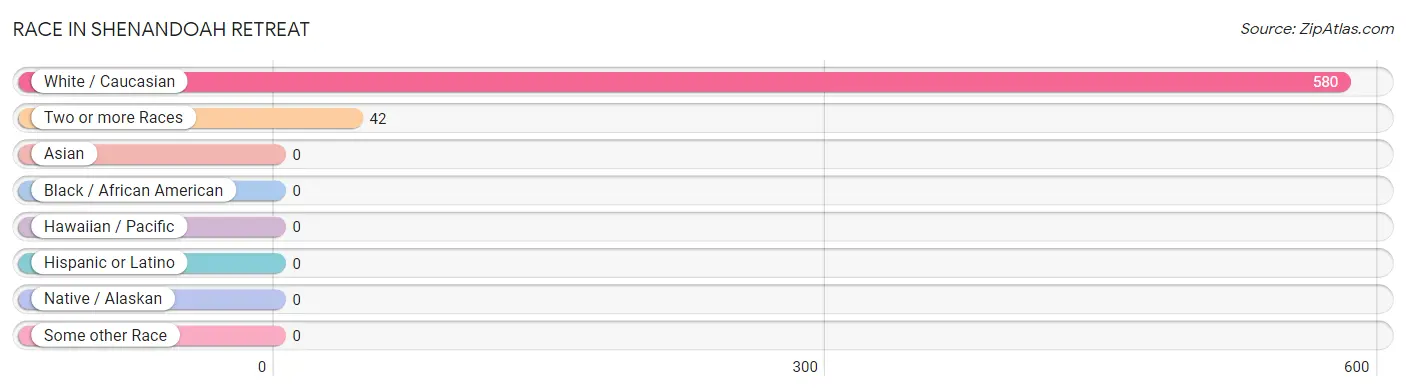
| Race | # Population | % Population |
| Asian | 0 | 0.0% |
| Black / African American | 0 | 0.0% |
| Hawaiian / Pacific | 0 | 0.0% |
| Hispanic or Latino | 0 | 0.0% |
| Native / Alaskan | 0 | 0.0% |
| White / Caucasian | 580 | 93.2% |
| Two or more Races | 42 | 6.8% |
| Some other Race | 0 | 0.0% |
| Total | 622 | 100.0% |
Ancestry in Shenandoah Retreat
The most populous ancestries reported in Shenandoah Retreat are German (176 | 28.3%), English (173 | 27.8%), Irish (83 | 13.3%), Greek (37 | 5.9%), and Bhutanese (29 | 4.7%), together accounting for 80.1% of all Shenandoah Retreat residents.
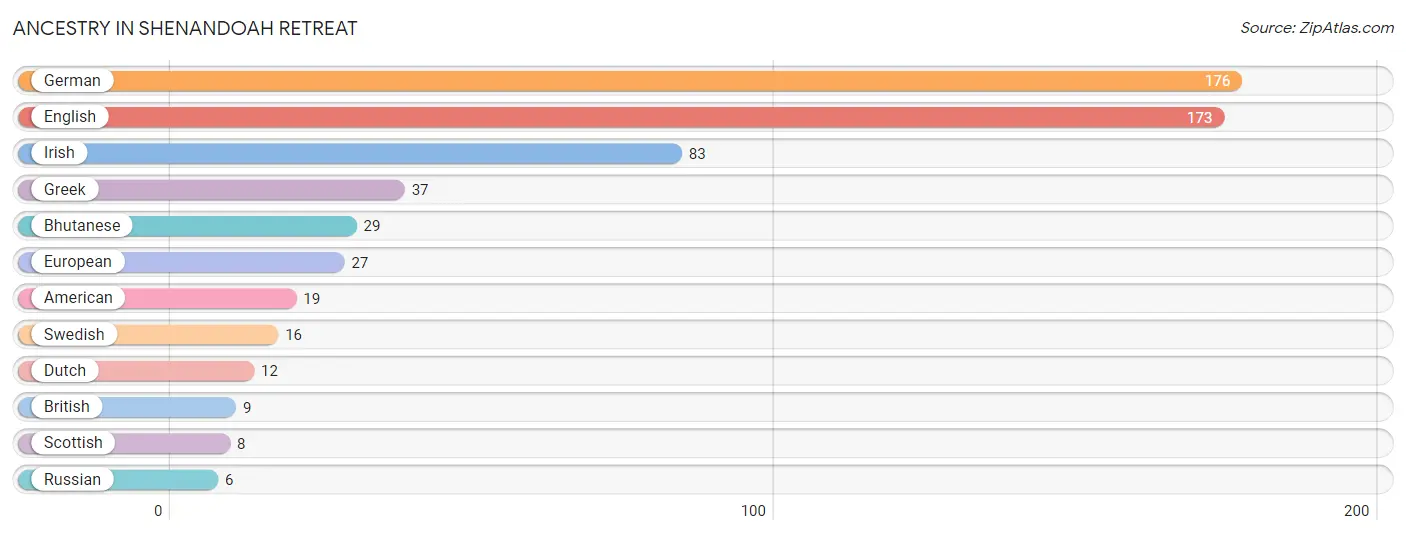
| Ancestry | # Population | % Population |
| American | 19 | 3.0% |
| Bhutanese | 29 | 4.7% |
| British | 9 | 1.5% |
| Dutch | 12 | 1.9% |
| English | 173 | 27.8% |
| European | 27 | 4.3% |
| German | 176 | 28.3% |
| Greek | 37 | 5.9% |
| Irish | 83 | 13.3% |
| Russian | 6 | 1.0% |
| Scottish | 8 | 1.3% |
| Swedish | 16 | 2.6% | View All 12 Rows |
Immigrants in Shenandoah Retreat
The most numerous immigrant groups reported in Shenandoah Retreat came from Europe (22 | 3.5%), Northern Europe (22 | 3.5%), and England (13 | 2.1%), together accounting for 9.2% of all Shenandoah Retreat residents.
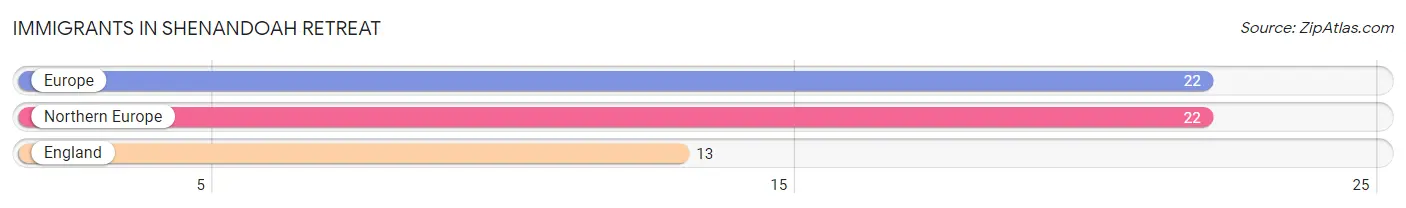
| Immigration Origin | # Population | % Population |
| England | 13 | 2.1% |
| Europe | 22 | 3.5% |
| Northern Europe | 22 | 3.5% | View All 3 Rows |
Sex and Age in Shenandoah Retreat
Sex and Age in Shenandoah Retreat
The most populous age groups in Shenandoah Retreat are 50 to 54 Years (73 | 18.0%) for men and 15 to 19 Years (58 | 26.9%) for women.
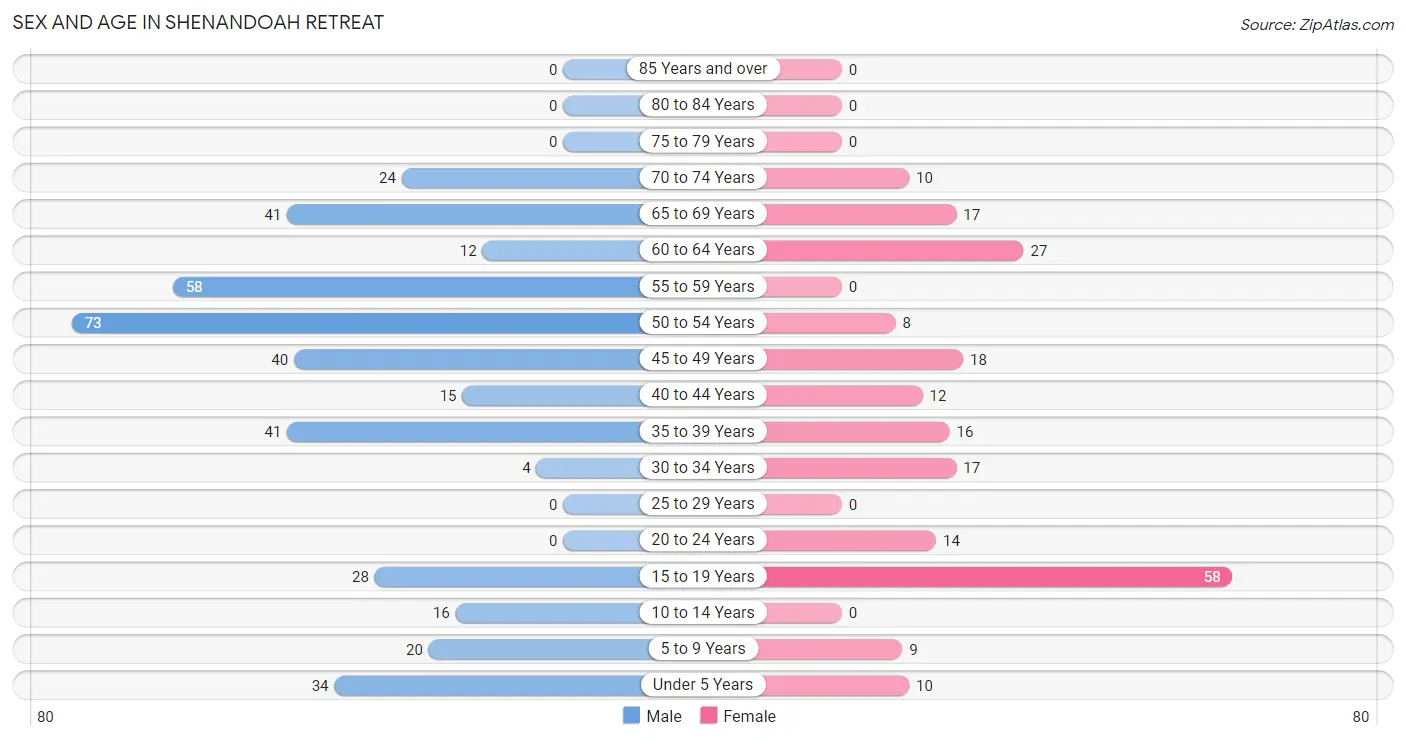
| Age Bracket | Male | Female |
| Under 5 Years | 34 (8.4%) | 10 (4.6%) |
| 5 to 9 Years | 20 (4.9%) | 9 (4.2%) |
| 10 to 14 Years | 16 (3.9%) | 0 (0.0%) |
| 15 to 19 Years | 28 (6.9%) | 58 (26.9%) |
| 20 to 24 Years | 0 (0.0%) | 14 (6.5%) |
| 25 to 29 Years | 0 (0.0%) | 0 (0.0%) |
| 30 to 34 Years | 4 (1.0%) | 17 (7.9%) |
| 35 to 39 Years | 41 (10.1%) | 16 (7.4%) |
| 40 to 44 Years | 15 (3.7%) | 12 (5.6%) |
| 45 to 49 Years | 40 (9.9%) | 18 (8.3%) |
| 50 to 54 Years | 73 (18.0%) | 8 (3.7%) |
| 55 to 59 Years | 58 (14.3%) | 0 (0.0%) |
| 60 to 64 Years | 12 (3.0%) | 27 (12.5%) |
| 65 to 69 Years | 41 (10.1%) | 17 (7.9%) |
| 70 to 74 Years | 24 (5.9%) | 10 (4.6%) |
| 75 to 79 Years | 0 (0.0%) | 0 (0.0%) |
| 80 to 84 Years | 0 (0.0%) | 0 (0.0%) |
| 85 Years and over | 0 (0.0%) | 0 (0.0%) |
| Total | 406 (100.0%) | 216 (100.0%) |
Families and Households in Shenandoah Retreat
Median Family Size in Shenandoah Retreat
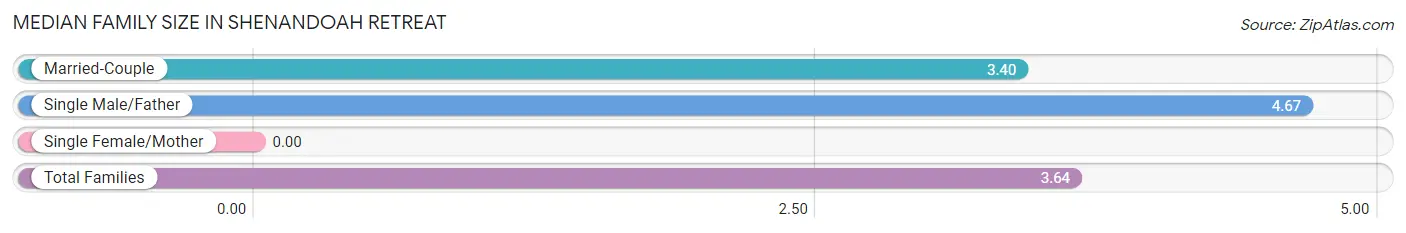
| Family Type | # Families | Family Size |
| Married-Couple | 103 (81.1%) | 3.40 |
| Single Male/Father | 24 (18.9%) | 4.67 |
| Single Female/Mother | 0 (0.0%) | - |
| Total Families | 127 (100.0%) | 3.64 |
Median Household Size in Shenandoah Retreat
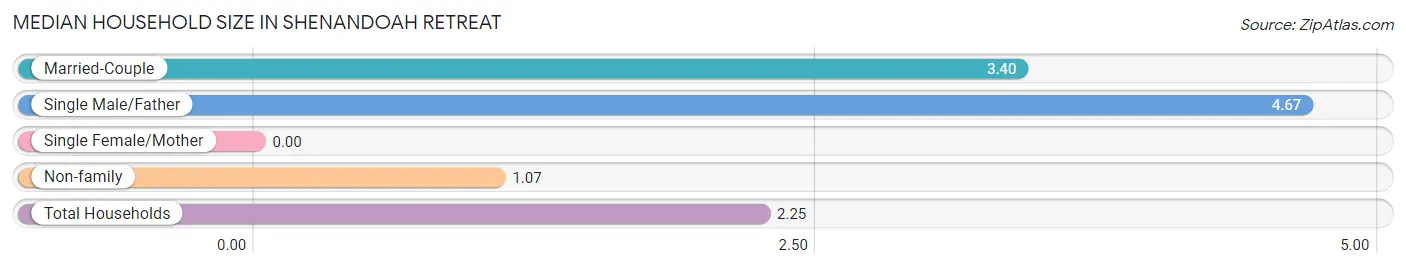
| Household Type | # Households | Household Size |
| Married-Couple | 103 (37.2%) | 3.40 |
| Single Male/Father | 24 (8.7%) | 4.67 |
| Single Female/Mother | 0 (0.0%) | - |
| Non-family | 150 (54.1%) | 1.07 |
| Total Households | 277 (100.0%) | 2.25 |
Household Size by Marriage Status in Shenandoah Retreat
Out of a total of 277 households in Shenandoah Retreat, 127 (45.9%) are family households, while 150 (54.1%) are nonfamily households. The most numerous type of family households are 2-person households, comprising 53, and the most common type of nonfamily households are 1-person households, comprising 148.
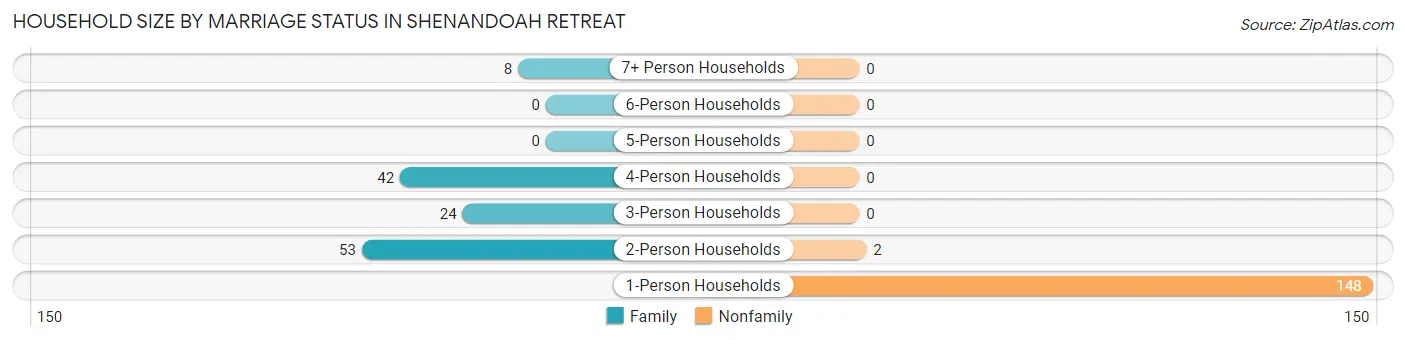
| Household Size | Family Households | Nonfamily Households |
| 1-Person Households | - | 148 (53.4%) |
| 2-Person Households | 53 (19.1%) | 2 (0.7%) |
| 3-Person Households | 24 (8.7%) | 0 (0.0%) |
| 4-Person Households | 42 (15.2%) | 0 (0.0%) |
| 5-Person Households | 0 (0.0%) | 0 (0.0%) |
| 6-Person Households | 0 (0.0%) | 0 (0.0%) |
| 7+ Person Households | 8 (2.9%) | 0 (0.0%) |
| Total | 127 (45.9%) | 150 (54.1%) |
Female Fertility in Shenandoah Retreat
Fertility by Age in Shenandoah Retreat
| Age Bracket | Women with Births | Births / 1,000 Women |
| 15 to 19 years | 0 (0.0%) | 0.0 |
| 20 to 34 years | 0 (0.0%) | 0.0 |
| 35 to 50 years | 0 (0.0%) | 0.0 |
| Total | 0 (0.0%) | 0.0 |
Fertility by Age by Marriage Status in Shenandoah Retreat
| Age Bracket | Married | Unmarried |
| 15 to 19 years | 0 (0.0%) | 0 (0.0%) |
| 20 to 34 years | 0 (0.0%) | 0 (0.0%) |
| 35 to 50 years | 0 (0.0%) | 0 (0.0%) |
| Total | 0 (0.0%) | 0 (0.0%) |
Fertility by Education in Shenandoah Retreat
| Educational Attainment | Women with Births | Births / 1,000 Women |
| Less than High School | 0 (0.0%) | 0.0 |
| High School Diploma | 0 (0.0%) | 0.0 |
| College or Associate's Degree | 0 (0.0%) | 0.0 |
| Bachelor's Degree | 0 (0.0%) | 0.0 |
| Graduate Degree | 0 (0.0%) | 0.0 |
| Total | 0 (0.0%) | 0.0 |
Fertility by Education by Marriage Status in Shenandoah Retreat
| Educational Attainment | Married | Unmarried |
| Less than High School | 0 (0.0%) | 0 (0.0%) |
| High School Diploma | 0 (0.0%) | 0 (0.0%) |
| College or Associate's Degree | 0 (0.0%) | 0 (0.0%) |
| Bachelor's Degree | 0 (0.0%) | 0 (0.0%) |
| Graduate Degree | 0 (0.0%) | 0 (0.0%) |
| Total | 0 (0.0%) | 0 (0.0%) |
Employment Characteristics in Shenandoah Retreat
Employment by Class of Employer in Shenandoah Retreat
Among the 342 employed individuals in Shenandoah Retreat, private company employees (186 | 54.4%), self-employed (incorporated) (68 | 19.9%), and self-employed (not incorporated) (39 | 11.4%) make up the most common classes of employment.
| Employer Class | # Employees | % Employees |
| Private Company Employees | 186 | 54.4% |
| Self-Employed (Incorporated) | 68 | 19.9% |
| Self-Employed (Not Incorporated) | 39 | 11.4% |
| Not-for-profit Organizations | 0 | 0.0% |
| Local Government Employees | 31 | 9.1% |
| State Government Employees | 0 | 0.0% |
| Federal Government Employees | 18 | 5.3% |
| Unpaid Family Workers | 0 | 0.0% |
| Total | 342 | 100.0% |
Employment Status by Age in Shenandoah Retreat
According to the labor force statistics for Shenandoah Retreat, out of the total population over 16 years of age (533), 67.5% or 360 individuals are in the labor force, with 0.6% or 2 of them unemployed. The age group with the highest labor force participation rate is 20 to 24 years, with 100.0% or 14 individuals in the labor force. Within the labor force, the 60 to 64 years age range has the highest percentage of unemployed individuals, with 5.1% or 2 of them being unemployed.
| Age Bracket | In Labor Force | Unemployed |
| 16 to 19 Years | 28 (32.6%) | 0 (0.0%) |
| 20 to 24 Years | 14 (100.0%) | 0 (0.0%) |
| 25 to 29 Years | 0 (0.0%) | 0 (0.0%) |
| 30 to 34 Years | 12 (57.1%) | 0 (0.0%) |
| 35 to 44 Years | 60 (71.4%) | 0 (0.0%) |
| 45 to 54 Years | 126 (90.6%) | 0 (0.0%) |
| 55 to 59 Years | 42 (72.4%) | 0 (0.0%) |
| 60 to 64 Years | 39 (100.0%) | 2 (5.1%) |
| 65 to 74 Years | 39 (42.4%) | 0 (0.0%) |
| 75 Years and over | 0 (0.0%) | 0 (0.0%) |
| Total | 360 (67.5%) | 2 (0.6%) |
Employment Status by Educational Attainment in Shenandoah Retreat
According to labor force statistics for Shenandoah Retreat, 81.8% of individuals (279) out of the total population between 25 and 64 years of age (341) are in the labor force, with 0.7% or 2 of them being unemployed. The group with the highest labor force participation rate are those with the educational attainment of less than high school, with 100.0% or 10 individuals in the labor force. Within the labor force, individuals with college / associate degree education have the highest percentage of unemployment, with 2.4% or 2 of them being unemployed.
| Educational Attainment | In Labor Force | Unemployed |
| Less than High School | 10 (100.0%) | 0 (0.0%) |
| High School Diploma | 136 (85.5%) | 0 (0.0%) |
| College / Associate Degree | 84 (86.6%) | 2 (2.4%) |
| Bachelor's Degree or higher | 49 (65.3%) | 0 (0.0%) |
| Total | 279 (81.8%) | 2 (0.7%) |
Employment Occupations by Sex in Shenandoah Retreat
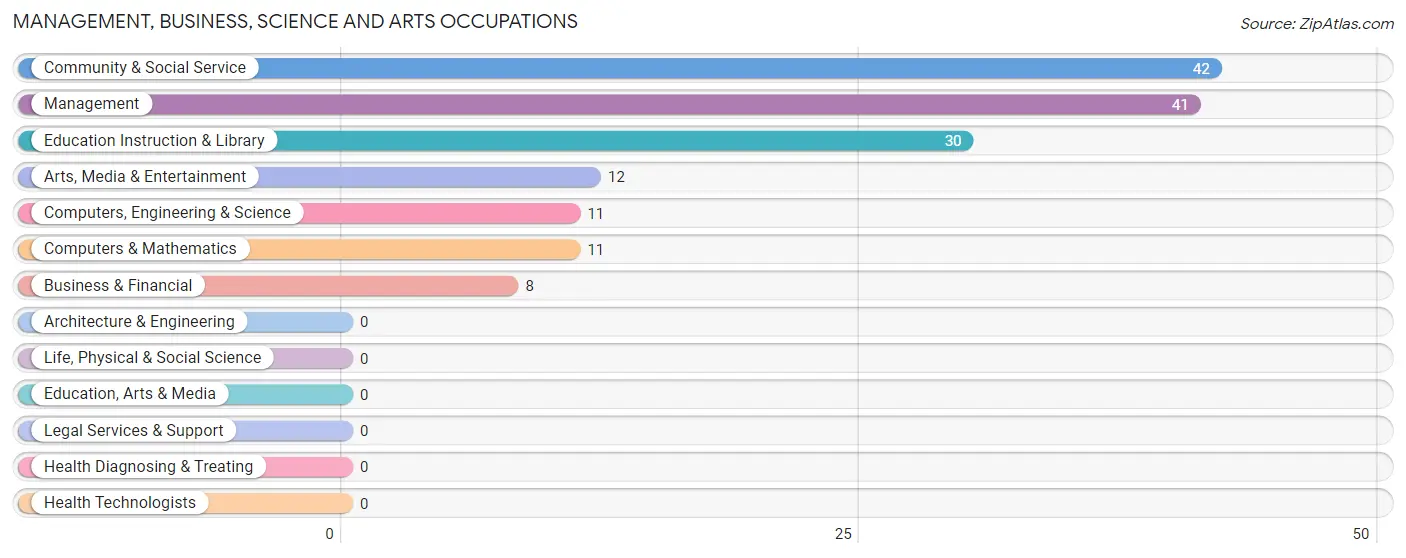
Management, Business, Science and Arts Occupations
The most common Management, Business, Science and Arts occupations in Shenandoah Retreat are Community & Social Service (42 | 11.7%), Management (41 | 11.5%), Education Instruction & Library (30 | 8.4%), Arts, Media & Entertainment (12 | 3.4%), and Computers, Engineering & Science (11 | 3.1%).
Management, Business, Science and Arts Occupations by Sex
Within the Management, Business, Science and Arts occupations in Shenandoah Retreat, the most male-oriented occupations are Management (73.2%), Computers, Engineering & Science (36.4%), and Computers & Mathematics (36.4%), while the most female-oriented occupations are Business & Financial (100.0%), Community & Social Service (100.0%), and Education Instruction & Library (100.0%).
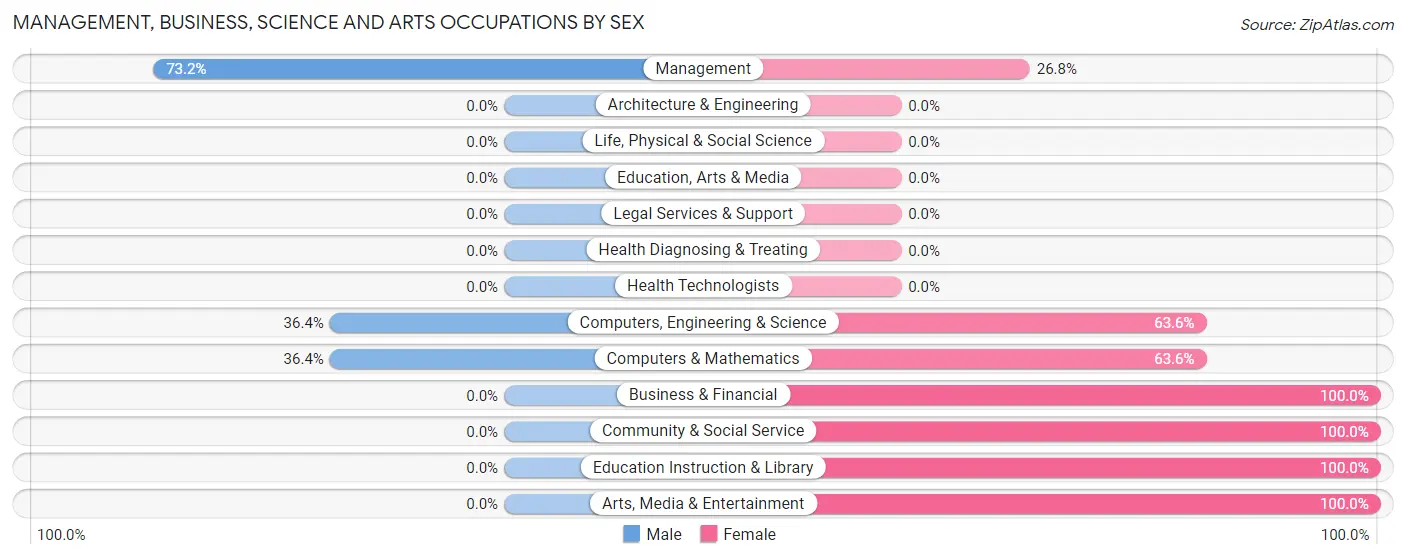
| Occupation | Male | Female |
| Management | 30 (73.2%) | 11 (26.8%) |
| Business & Financial | 0 (0.0%) | 8 (100.0%) |
| Computers, Engineering & Science | 4 (36.4%) | 7 (63.6%) |
| Computers & Mathematics | 4 (36.4%) | 7 (63.6%) |
| Architecture & Engineering | 0 (0.0%) | 0 (0.0%) |
| Life, Physical & Social Science | 0 (0.0%) | 0 (0.0%) |
| Community & Social Service | 0 (0.0%) | 42 (100.0%) |
| Education, Arts & Media | 0 (0.0%) | 0 (0.0%) |
| Legal Services & Support | 0 (0.0%) | 0 (0.0%) |
| Education Instruction & Library | 0 (0.0%) | 30 (100.0%) |
| Arts, Media & Entertainment | 0 (0.0%) | 12 (100.0%) |
| Health Diagnosing & Treating | 0 (0.0%) | 0 (0.0%) |
| Health Technologists | 0 (0.0%) | 0 (0.0%) |
| Total (Category) | 34 (33.3%) | 68 (66.7%) |
| Total (Overall) | 247 (69.0%) | 111 (31.0%) |
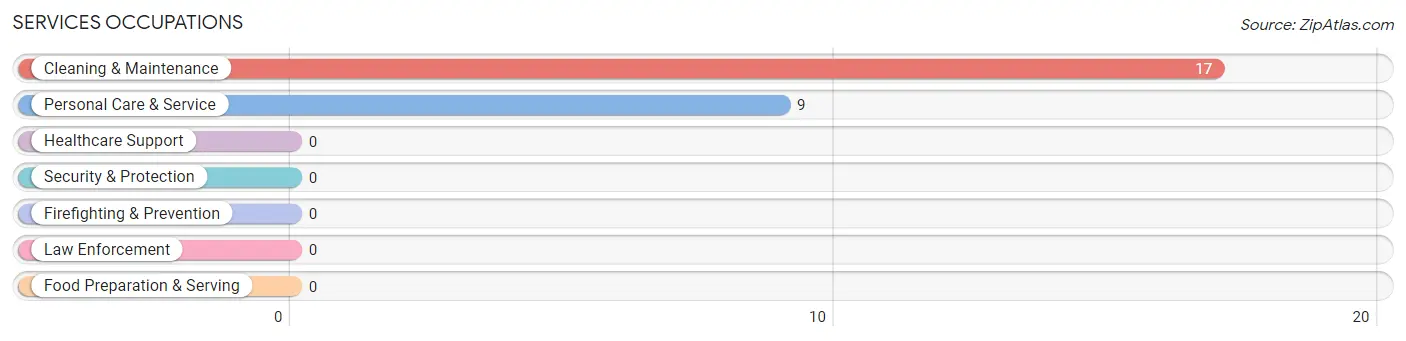
Services Occupations
The most common Services occupations in Shenandoah Retreat are Cleaning & Maintenance (17 | 4.8%), and Personal Care & Service (9 | 2.5%).
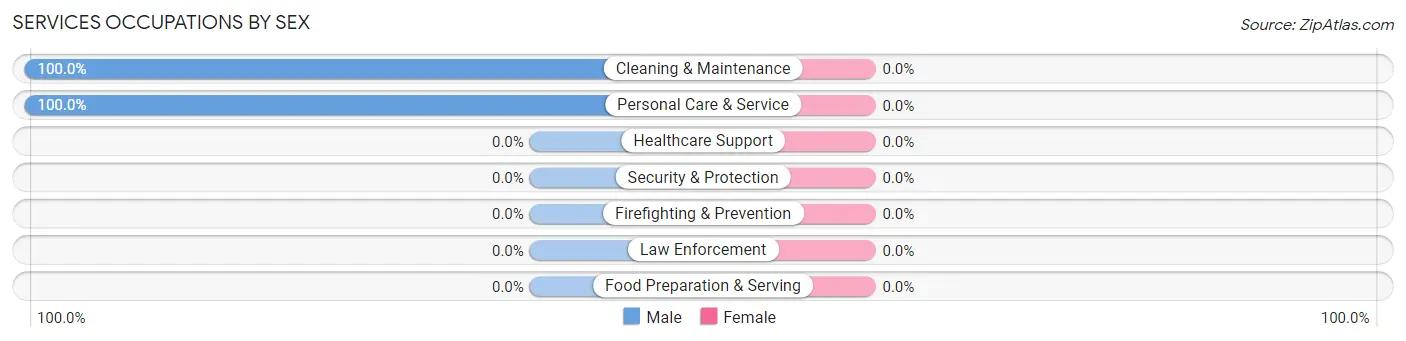
Services Occupations by Sex
| Occupation | Male | Female |
| Healthcare Support | 0 (0.0%) | 0 (0.0%) |
| Security & Protection | 0 (0.0%) | 0 (0.0%) |
| Firefighting & Prevention | 0 (0.0%) | 0 (0.0%) |
| Law Enforcement | 0 (0.0%) | 0 (0.0%) |
| Food Preparation & Serving | 0 (0.0%) | 0 (0.0%) |
| Cleaning & Maintenance | 17 (100.0%) | 0 (0.0%) |
| Personal Care & Service | 9 (100.0%) | 0 (0.0%) |
| Total (Category) | 26 (100.0%) | 0 (0.0%) |
| Total (Overall) | 247 (69.0%) | 111 (31.0%) |
Sales and Office Occupations
The most common Sales and Office occupations in Shenandoah Retreat are Sales & Related (30 | 8.4%), and Office & Administration (20 | 5.6%).
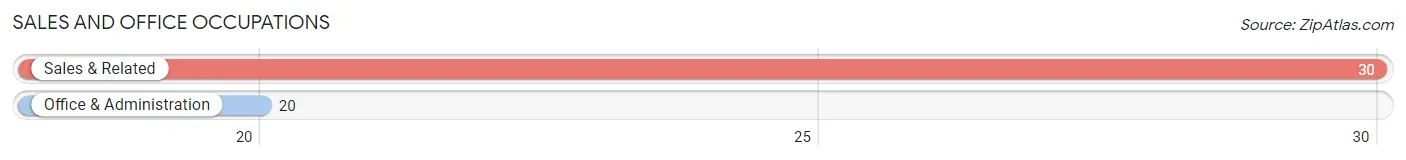
Sales and Office Occupations by Sex
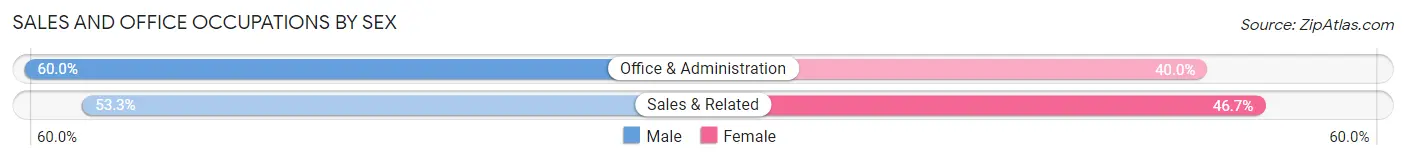
| Occupation | Male | Female |
| Sales & Related | 16 (53.3%) | 14 (46.7%) |
| Office & Administration | 12 (60.0%) | 8 (40.0%) |
| Total (Category) | 28 (56.0%) | 22 (44.0%) |
| Total (Overall) | 247 (69.0%) | 111 (31.0%) |
Natural Resources, Construction and Maintenance Occupations
The most common Natural Resources, Construction and Maintenance occupations in Shenandoah Retreat are Construction & Extraction (59 | 16.5%), and Installation, Maintenance & Repair (57 | 15.9%).
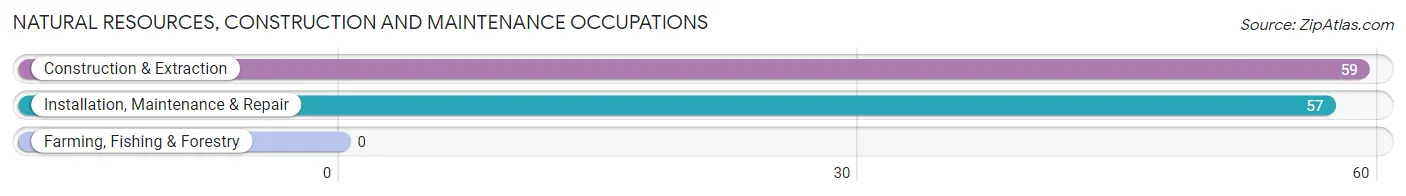
Natural Resources, Construction and Maintenance Occupations by Sex
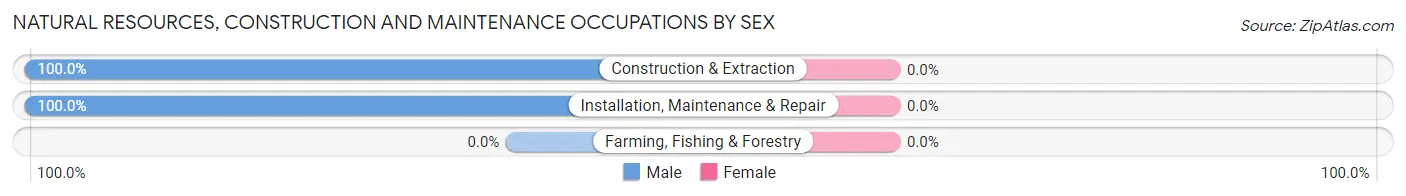
| Occupation | Male | Female |
| Farming, Fishing & Forestry | 0 (0.0%) | 0 (0.0%) |
| Construction & Extraction | 59 (100.0%) | 0 (0.0%) |
| Installation, Maintenance & Repair | 57 (100.0%) | 0 (0.0%) |
| Total (Category) | 116 (100.0%) | 0 (0.0%) |
| Total (Overall) | 247 (69.0%) | 111 (31.0%) |
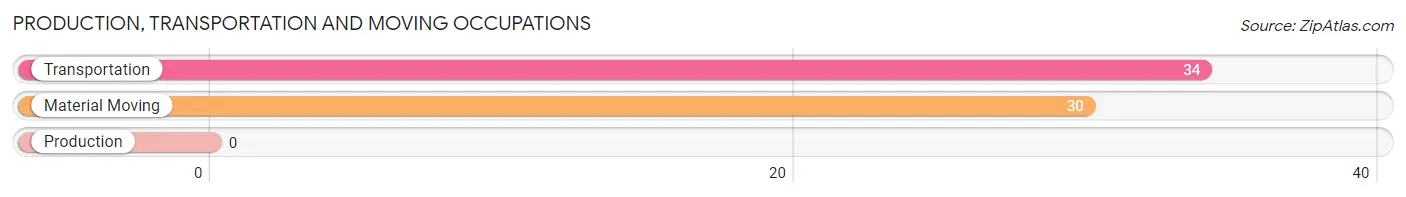
Production, Transportation and Moving Occupations
The most common Production, Transportation and Moving occupations in Shenandoah Retreat are Transportation (34 | 9.5%), and Material Moving (30 | 8.4%).
Production, Transportation and Moving Occupations by Sex
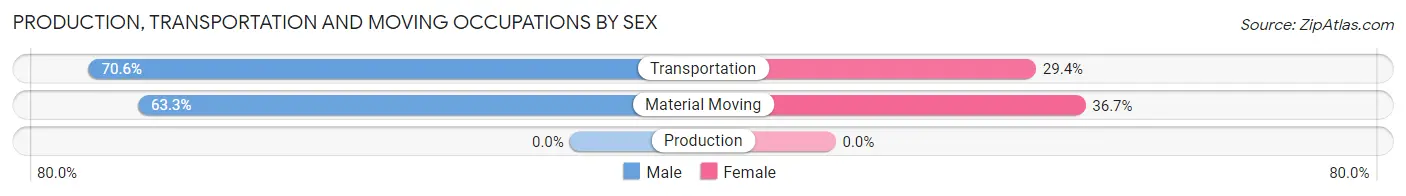
| Occupation | Male | Female |
| Production | 0 (0.0%) | 0 (0.0%) |
| Transportation | 24 (70.6%) | 10 (29.4%) |
| Material Moving | 19 (63.3%) | 11 (36.7%) |
| Total (Category) | 43 (67.2%) | 21 (32.8%) |
| Total (Overall) | 247 (69.0%) | 111 (31.0%) |
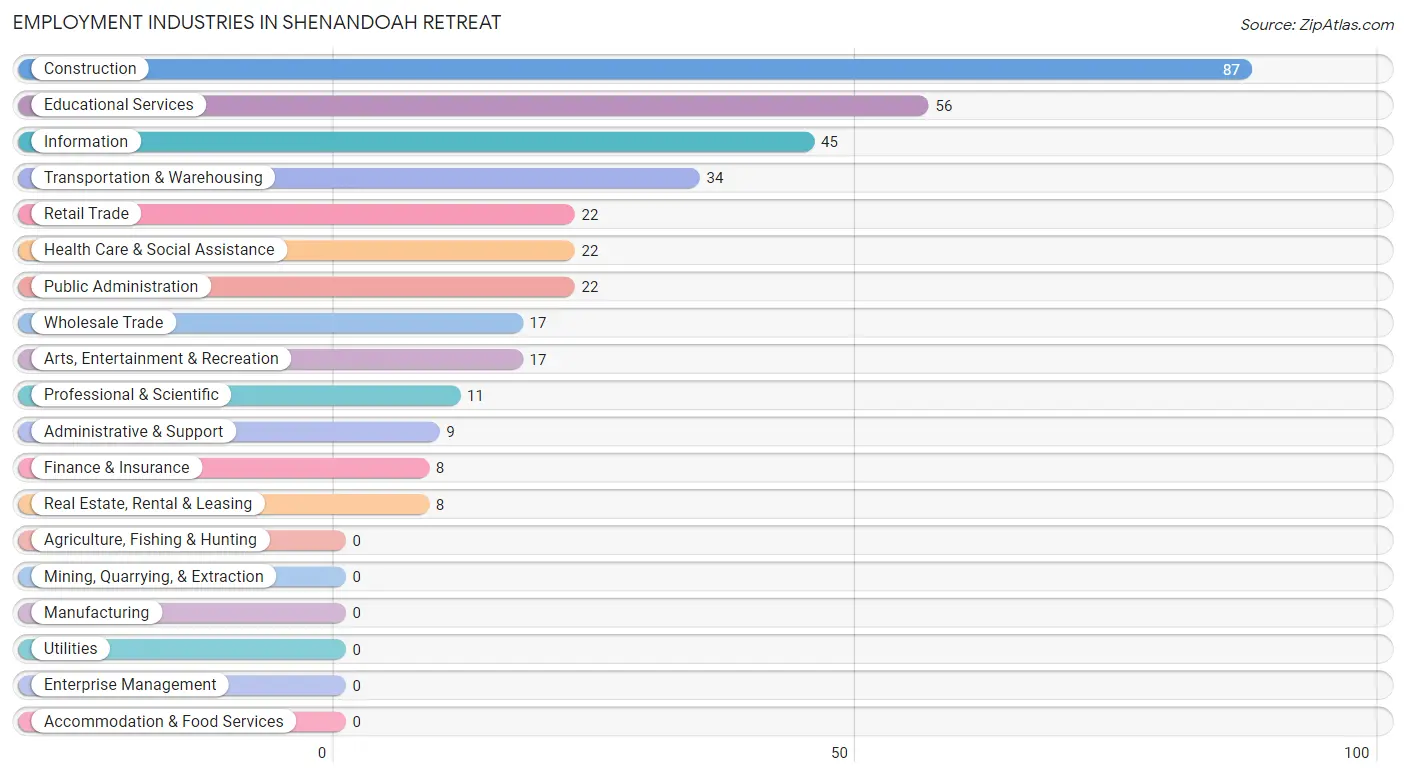
Employment Industries by Sex in Shenandoah Retreat
Employment Industries in Shenandoah Retreat
The major employment industries in Shenandoah Retreat include Construction (87 | 24.3%), Educational Services (56 | 15.6%), Information (45 | 12.6%), Transportation & Warehousing (34 | 9.5%), and Retail Trade (22 | 6.1%).
Employment Industries by Sex in Shenandoah Retreat
The Shenandoah Retreat industries that see more men than women are Construction (100.0%), Wholesale Trade (100.0%), and Transportation & Warehousing (100.0%), whereas the industries that tend to have a higher number of women are Finance & Insurance (100.0%), Professional & Scientific (100.0%), and Health Care & Social Assistance (100.0%).
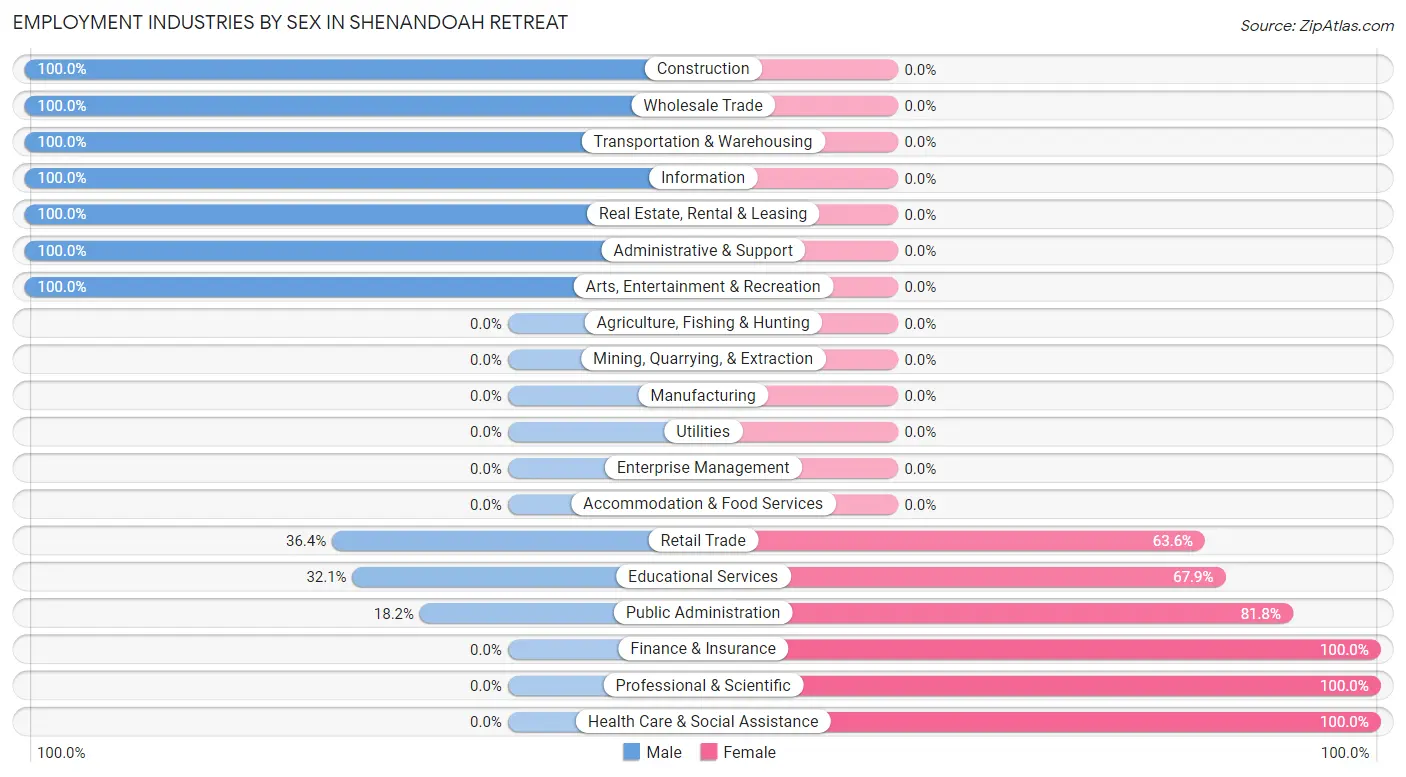
| Industry | Male | Female |
| Agriculture, Fishing & Hunting | 0 (0.0%) | 0 (0.0%) |
| Mining, Quarrying, & Extraction | 0 (0.0%) | 0 (0.0%) |
| Construction | 87 (100.0%) | 0 (0.0%) |
| Manufacturing | 0 (0.0%) | 0 (0.0%) |
| Wholesale Trade | 17 (100.0%) | 0 (0.0%) |
| Retail Trade | 8 (36.4%) | 14 (63.6%) |
| Transportation & Warehousing | 34 (100.0%) | 0 (0.0%) |
| Utilities | 0 (0.0%) | 0 (0.0%) |
| Information | 45 (100.0%) | 0 (0.0%) |
| Finance & Insurance | 0 (0.0%) | 8 (100.0%) |
| Real Estate, Rental & Leasing | 8 (100.0%) | 0 (0.0%) |
| Professional & Scientific | 0 (0.0%) | 11 (100.0%) |
| Enterprise Management | 0 (0.0%) | 0 (0.0%) |
| Administrative & Support | 9 (100.0%) | 0 (0.0%) |
| Educational Services | 18 (32.1%) | 38 (67.9%) |
| Health Care & Social Assistance | 0 (0.0%) | 22 (100.0%) |
| Arts, Entertainment & Recreation | 17 (100.0%) | 0 (0.0%) |
| Accommodation & Food Services | 0 (0.0%) | 0 (0.0%) |
| Public Administration | 4 (18.2%) | 18 (81.8%) |
| Total | 247 (69.0%) | 111 (31.0%) |
Education in Shenandoah Retreat
School Enrollment in Shenandoah Retreat
The most common levels of schooling among the 125 students in Shenandoah Retreat are high school (58 | 46.4%), elementary school (19 | 15.2%), and graduate / professional (17 | 13.6%).
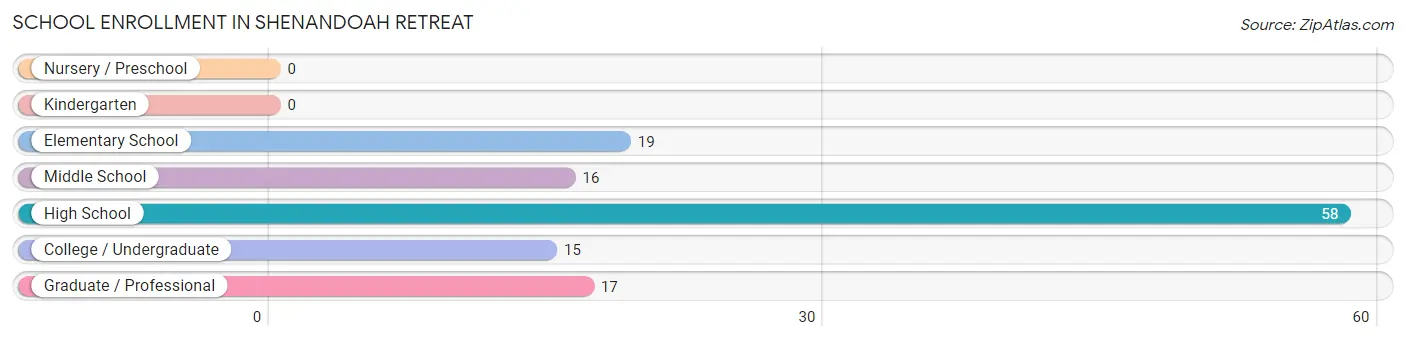
| School Level | # Students | % Students |
| Nursery / Preschool | 0 | 0.0% |
| Kindergarten | 0 | 0.0% |
| Elementary School | 19 | 15.2% |
| Middle School | 16 | 12.8% |
| High School | 58 | 46.4% |
| College / Undergraduate | 15 | 12.0% |
| Graduate / Professional | 17 | 13.6% |
| Total | 125 | 100.0% |
School Enrollment by Age by Funding Source in Shenandoah Retreat
Out of a total of 125 students who are enrolled in schools in Shenandoah Retreat, 51 (40.8%) attend a private institution, while the remaining 74 (59.2%) are enrolled in public schools. The age group of 5 to 9 year old has the highest likelihood of being enrolled in private schools, with 19 (100.0% in the age bracket) enrolled. Conversely, the age group of 10 to 14 year olds has the lowest likelihood of being enrolled in a private school, with 16 (100.0% in the age bracket) attending a public institution.
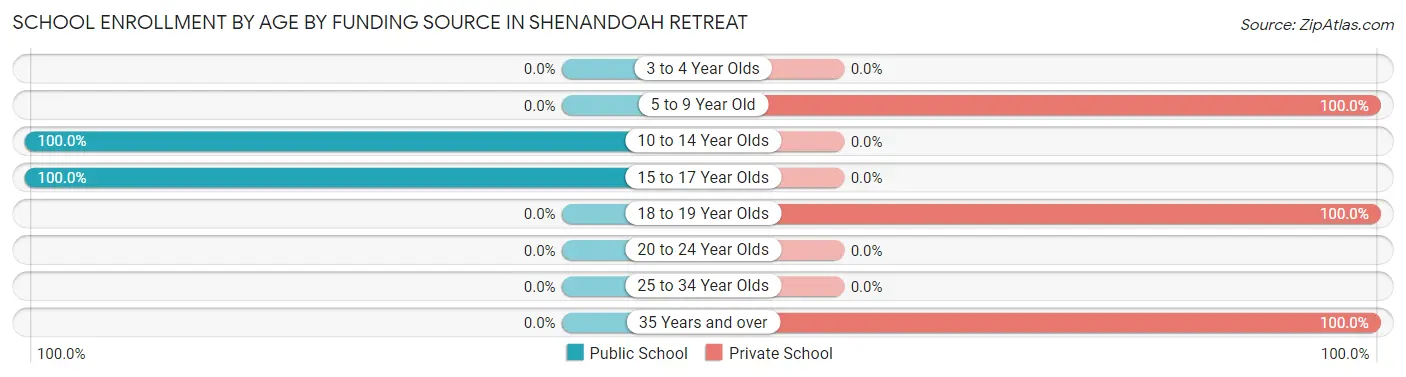
| Age Bracket | Public School | Private School |
| 3 to 4 Year Olds | 0 (0.0%) | 0 (0.0%) |
| 5 to 9 Year Old | 0 (0.0%) | 19 (100.0%) |
| 10 to 14 Year Olds | 16 (100.0%) | 0 (0.0%) |
| 15 to 17 Year Olds | 58 (100.0%) | 0 (0.0%) |
| 18 to 19 Year Olds | 0 (0.0%) | 11 (100.0%) |
| 20 to 24 Year Olds | 0 (0.0%) | 0 (0.0%) |
| 25 to 34 Year Olds | 0 (0.0%) | 0 (0.0%) |
| 35 Years and over | 0 (0.0%) | 21 (100.0%) |
| Total | 74 (59.2%) | 51 (40.8%) |
Educational Attainment by Field of Study in Shenandoah Retreat
Business (45 | 38.8%), literature & languages (20 | 17.2%), social sciences (17 | 14.7%), education (14 | 12.1%), and communications (12 | 10.3%) are the most common fields of study among 116 individuals in Shenandoah Retreat who have obtained a bachelor's degree or higher.
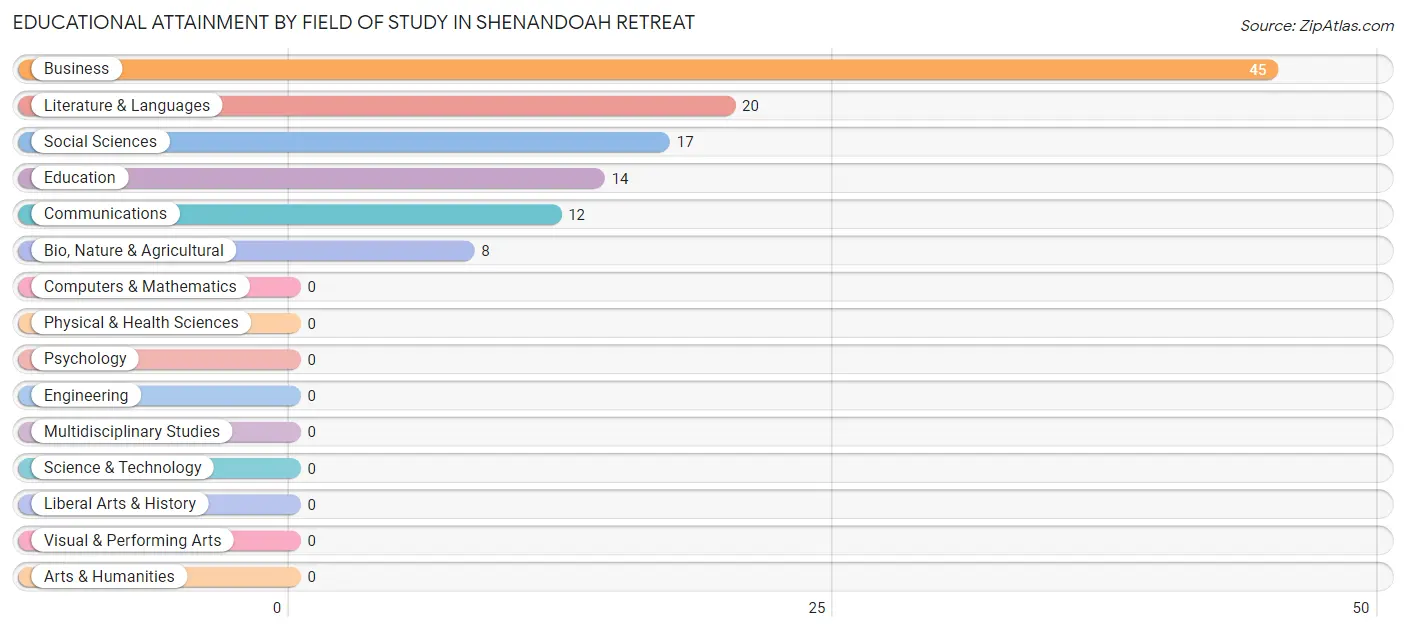
| Field of Study | # Graduates | % Graduates |
| Computers & Mathematics | 0 | 0.0% |
| Bio, Nature & Agricultural | 8 | 6.9% |
| Physical & Health Sciences | 0 | 0.0% |
| Psychology | 0 | 0.0% |
| Social Sciences | 17 | 14.7% |
| Engineering | 0 | 0.0% |
| Multidisciplinary Studies | 0 | 0.0% |
| Science & Technology | 0 | 0.0% |
| Business | 45 | 38.8% |
| Education | 14 | 12.1% |
| Literature & Languages | 20 | 17.2% |
| Liberal Arts & History | 0 | 0.0% |
| Visual & Performing Arts | 0 | 0.0% |
| Communications | 12 | 10.3% |
| Arts & Humanities | 0 | 0.0% |
| Total | 116 | 100.0% |
Transportation & Commute in Shenandoah Retreat
Vehicle Availability by Sex in Shenandoah Retreat
The most prevalent vehicle ownership categories in Shenandoah Retreat are males with 2 vehicles (92, accounting for 37.2%) and females with 2 vehicles (33, making up 96.8%).
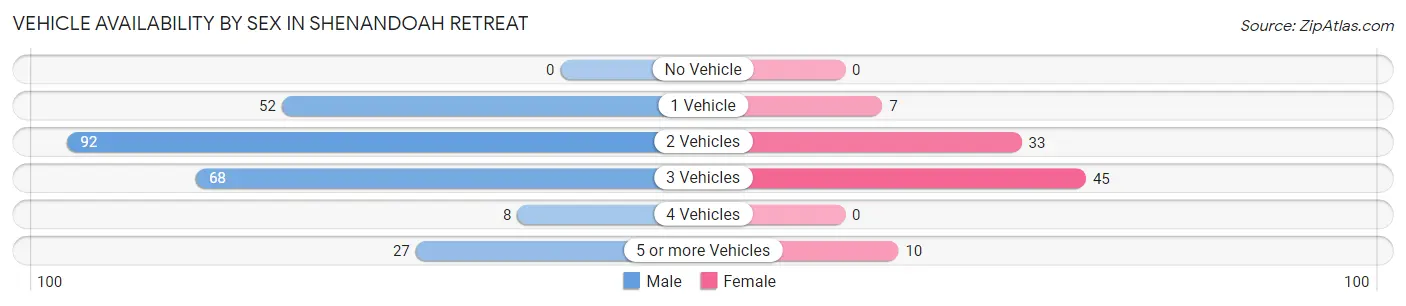
| Vehicles Available | Male | Female |
| No Vehicle | 0 (0.0%) | 0 (0.0%) |
| 1 Vehicle | 52 (21.0%) | 7 (7.4%) |
| 2 Vehicles | 92 (37.2%) | 33 (34.7%) |
| 3 Vehicles | 68 (27.5%) | 45 (47.4%) |
| 4 Vehicles | 8 (3.2%) | 0 (0.0%) |
| 5 or more Vehicles | 27 (10.9%) | 10 (10.5%) |
| Total | 247 (100.0%) | 95 (100.0%) |
Commute Time in Shenandoah Retreat
The most frequently occuring commute durations in Shenandoah Retreat are 30 to 34 minutes (41 commuters, 15.9%), 35 to 39 minutes (41 commuters, 15.9%), and 25 to 29 minutes (38 commuters, 14.7%).
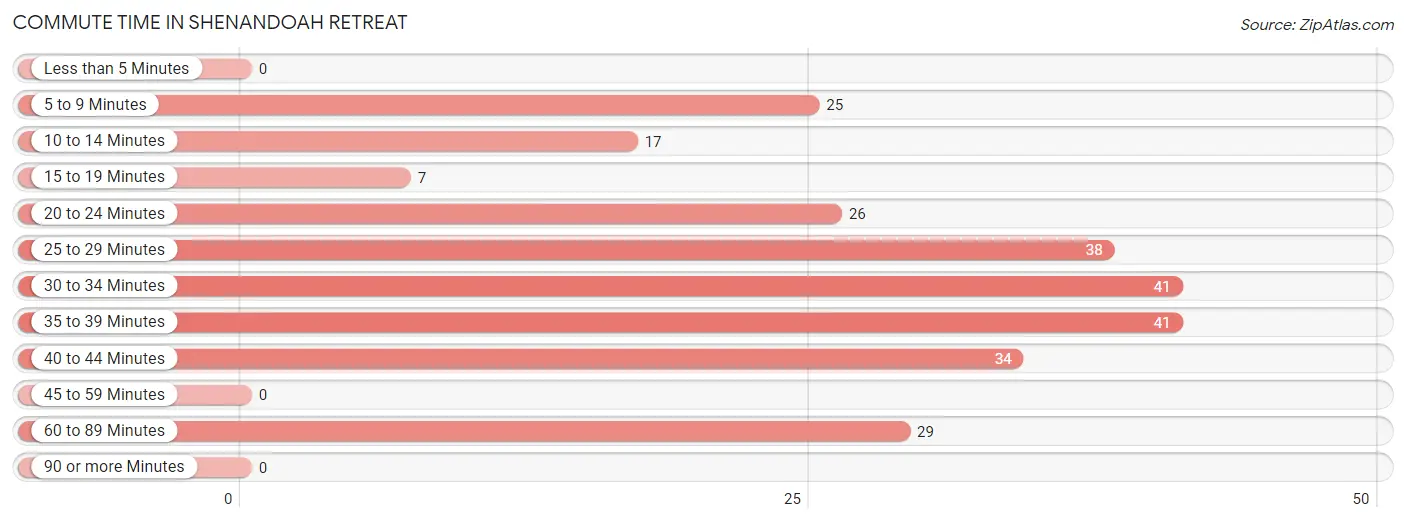
| Commute Time | # Commuters | % Commuters |
| Less than 5 Minutes | 0 | 0.0% |
| 5 to 9 Minutes | 25 | 9.7% |
| 10 to 14 Minutes | 17 | 6.6% |
| 15 to 19 Minutes | 7 | 2.7% |
| 20 to 24 Minutes | 26 | 10.1% |
| 25 to 29 Minutes | 38 | 14.7% |
| 30 to 34 Minutes | 41 | 15.9% |
| 35 to 39 Minutes | 41 | 15.9% |
| 40 to 44 Minutes | 34 | 13.2% |
| 45 to 59 Minutes | 0 | 0.0% |
| 60 to 89 Minutes | 29 | 11.2% |
| 90 or more Minutes | 0 | 0.0% |
Commute Time by Sex in Shenandoah Retreat
The most common commute times in Shenandoah Retreat are 30 to 34 minutes (41 commuters, 22.2%) for males and 40 to 44 minutes (34 commuters, 46.6%) for females.
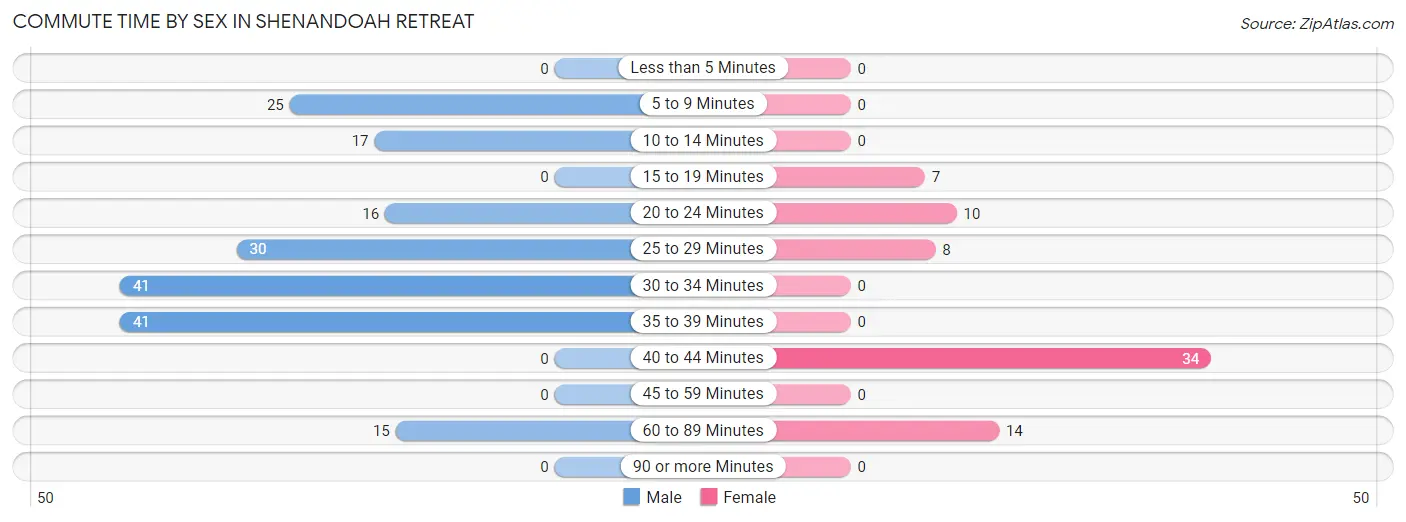
| Commute Time | Male | Female |
| Less than 5 Minutes | 0 (0.0%) | 0 (0.0%) |
| 5 to 9 Minutes | 25 (13.5%) | 0 (0.0%) |
| 10 to 14 Minutes | 17 (9.2%) | 0 (0.0%) |
| 15 to 19 Minutes | 0 (0.0%) | 7 (9.6%) |
| 20 to 24 Minutes | 16 (8.6%) | 10 (13.7%) |
| 25 to 29 Minutes | 30 (16.2%) | 8 (11.0%) |
| 30 to 34 Minutes | 41 (22.2%) | 0 (0.0%) |
| 35 to 39 Minutes | 41 (22.2%) | 0 (0.0%) |
| 40 to 44 Minutes | 0 (0.0%) | 34 (46.6%) |
| 45 to 59 Minutes | 0 (0.0%) | 0 (0.0%) |
| 60 to 89 Minutes | 15 (8.1%) | 14 (19.2%) |
| 90 or more Minutes | 0 (0.0%) | 0 (0.0%) |
Time of Departure to Work by Sex in Shenandoah Retreat
The most frequent times of departure to work in Shenandoah Retreat are 12:00 AM to 4:59 AM (42, 22.7%) for males and 7:00 AM to 7:29 AM (21, 28.8%) for females.
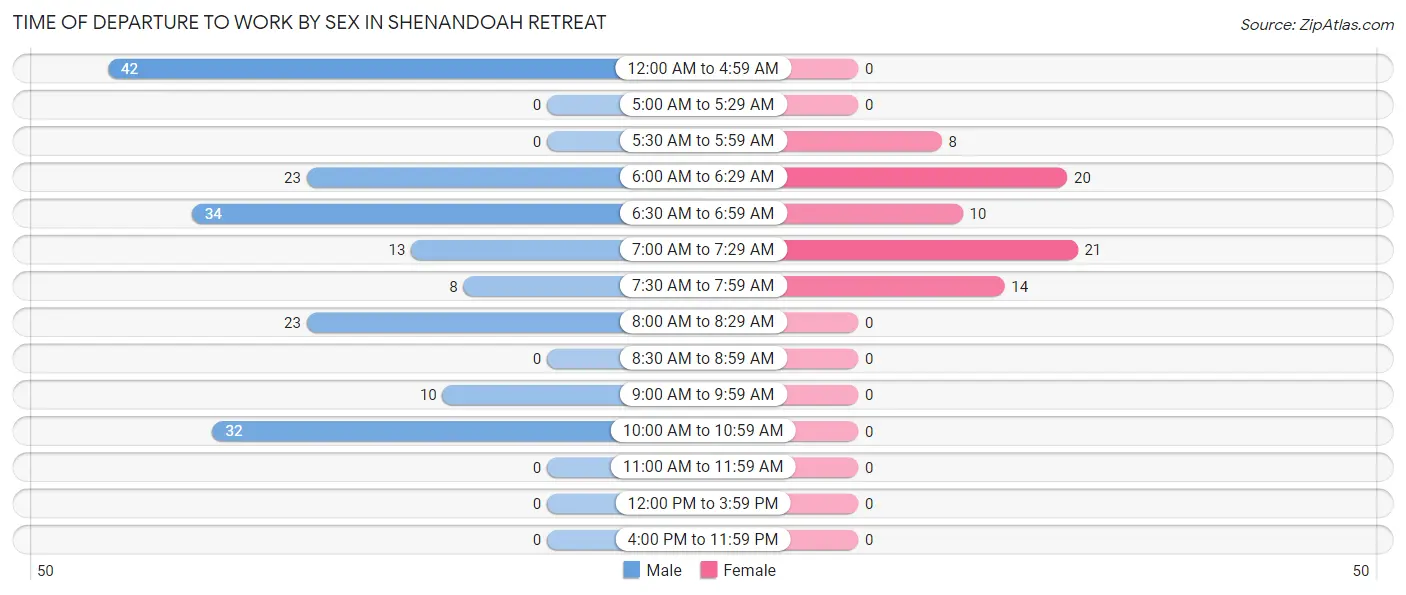
| Time of Departure | Male | Female |
| 12:00 AM to 4:59 AM | 42 (22.7%) | 0 (0.0%) |
| 5:00 AM to 5:29 AM | 0 (0.0%) | 0 (0.0%) |
| 5:30 AM to 5:59 AM | 0 (0.0%) | 8 (11.0%) |
| 6:00 AM to 6:29 AM | 23 (12.4%) | 20 (27.4%) |
| 6:30 AM to 6:59 AM | 34 (18.4%) | 10 (13.7%) |
| 7:00 AM to 7:29 AM | 13 (7.0%) | 21 (28.8%) |
| 7:30 AM to 7:59 AM | 8 (4.3%) | 14 (19.2%) |
| 8:00 AM to 8:29 AM | 23 (12.4%) | 0 (0.0%) |
| 8:30 AM to 8:59 AM | 0 (0.0%) | 0 (0.0%) |
| 9:00 AM to 9:59 AM | 10 (5.4%) | 0 (0.0%) |
| 10:00 AM to 10:59 AM | 32 (17.3%) | 0 (0.0%) |
| 11:00 AM to 11:59 AM | 0 (0.0%) | 0 (0.0%) |
| 12:00 PM to 3:59 PM | 0 (0.0%) | 0 (0.0%) |
| 4:00 PM to 11:59 PM | 0 (0.0%) | 0 (0.0%) |
| Total | 185 (100.0%) | 73 (100.0%) |
Housing Occupancy in Shenandoah Retreat
Occupancy by Ownership in Shenandoah Retreat
Of the total 277 dwellings in Shenandoah Retreat, owner-occupied units account for 240 (86.6%), while renter-occupied units make up 37 (13.4%).
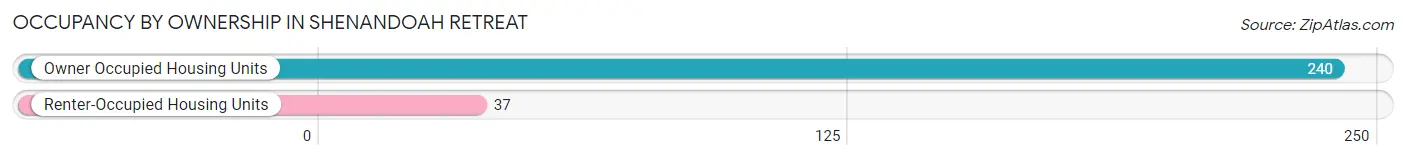
| Occupancy | # Housing Units | % Housing Units |
| Owner Occupied Housing Units | 240 | 86.6% |
| Renter-Occupied Housing Units | 37 | 13.4% |
| Total Occupied Housing Units | 277 | 100.0% |
Occupancy by Household Size in Shenandoah Retreat
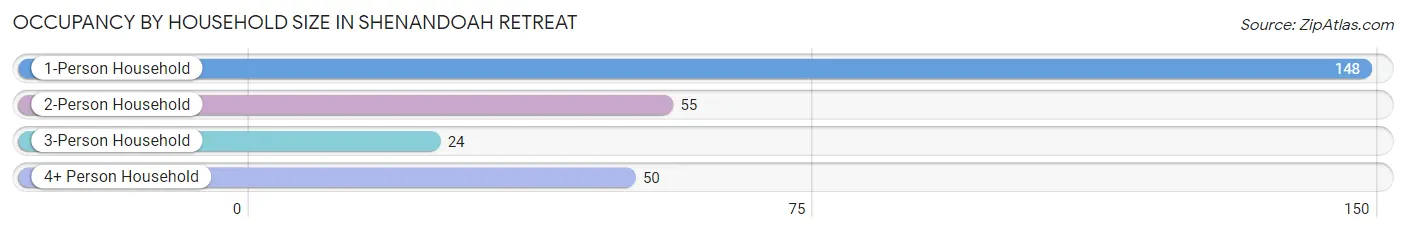
| Household Size | # Housing Units | % Housing Units |
| 1-Person Household | 148 | 53.4% |
| 2-Person Household | 55 | 19.9% |
| 3-Person Household | 24 | 8.7% |
| 4+ Person Household | 50 | 18.0% |
| Total Housing Units | 277 | 100.0% |
Occupancy by Ownership by Household Size in Shenandoah Retreat
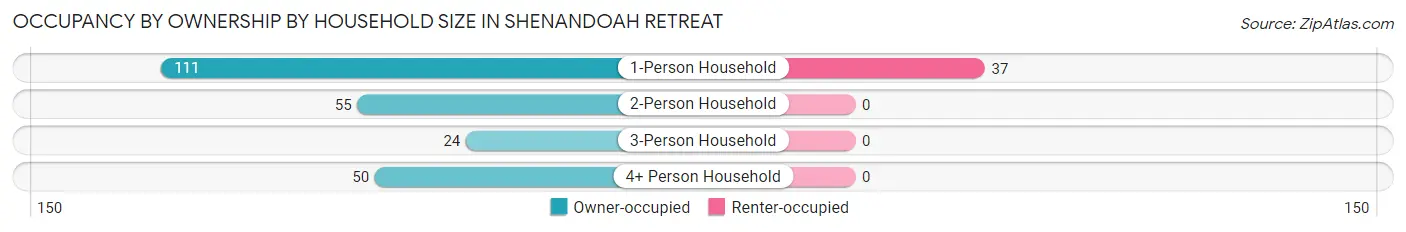
| Household Size | Owner-occupied | Renter-occupied |
| 1-Person Household | 111 (75.0%) | 37 (25.0%) |
| 2-Person Household | 55 (100.0%) | 0 (0.0%) |
| 3-Person Household | 24 (100.0%) | 0 (0.0%) |
| 4+ Person Household | 50 (100.0%) | 0 (0.0%) |
| Total Housing Units | 240 (86.6%) | 37 (13.4%) |
Occupancy by Educational Attainment in Shenandoah Retreat
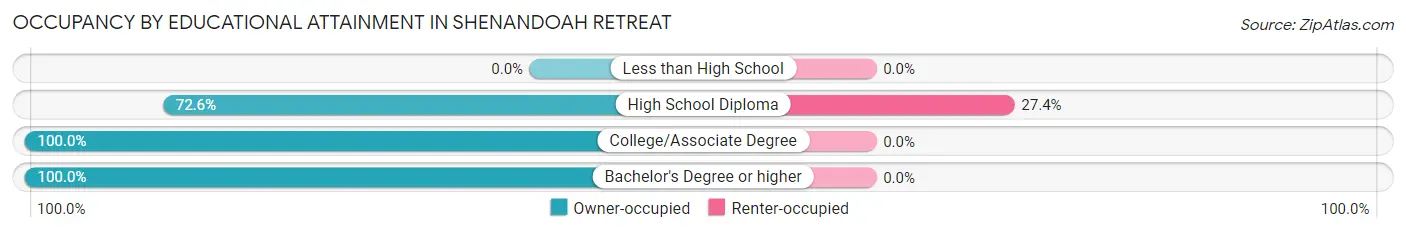
| Household Size | Owner-occupied | Renter-occupied |
| Less than High School | 0 (0.0%) | 0 (0.0%) |
| High School Diploma | 98 (72.6%) | 37 (27.4%) |
| College/Associate Degree | 101 (100.0%) | 0 (0.0%) |
| Bachelor's Degree or higher | 41 (100.0%) | 0 (0.0%) |
Occupancy by Age of Householder in Shenandoah Retreat
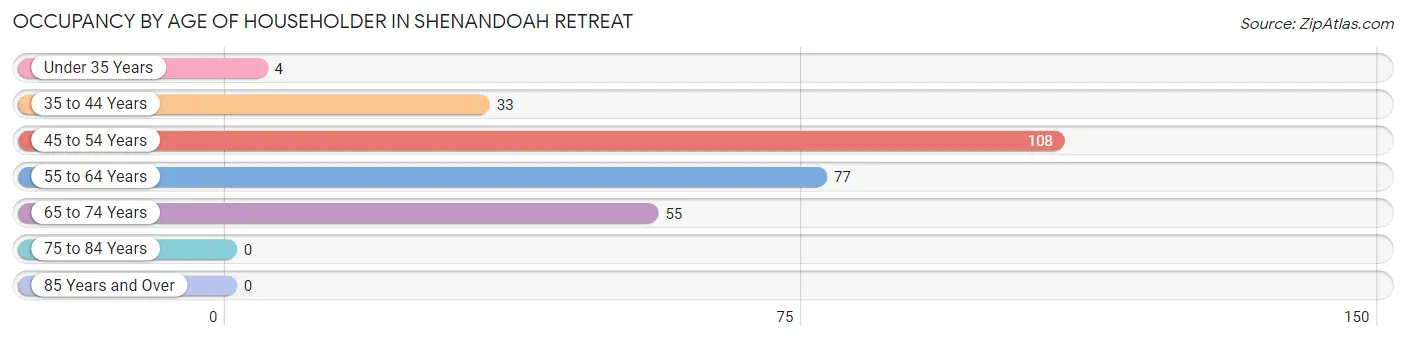
| Age Bracket | # Households | % Households |
| Under 35 Years | 4 | 1.4% |
| 35 to 44 Years | 33 | 11.9% |
| 45 to 54 Years | 108 | 39.0% |
| 55 to 64 Years | 77 | 27.8% |
| 65 to 74 Years | 55 | 19.9% |
| 75 to 84 Years | 0 | 0.0% |
| 85 Years and Over | 0 | 0.0% |
| Total | 277 | 100.0% |
Housing Finances in Shenandoah Retreat
Median Income by Occupancy in Shenandoah Retreat
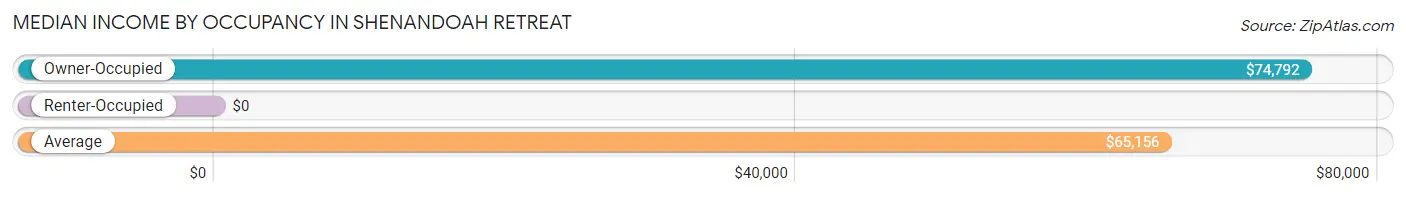
| Occupancy Type | # Households | Median Income |
| Owner-Occupied | 240 (86.6%) | $74,792 |
| Renter-Occupied | 37 (13.4%) | $0 |
| Average | 277 (100.0%) | $65,156 |
Occupancy by Householder Income Bracket in Shenandoah Retreat
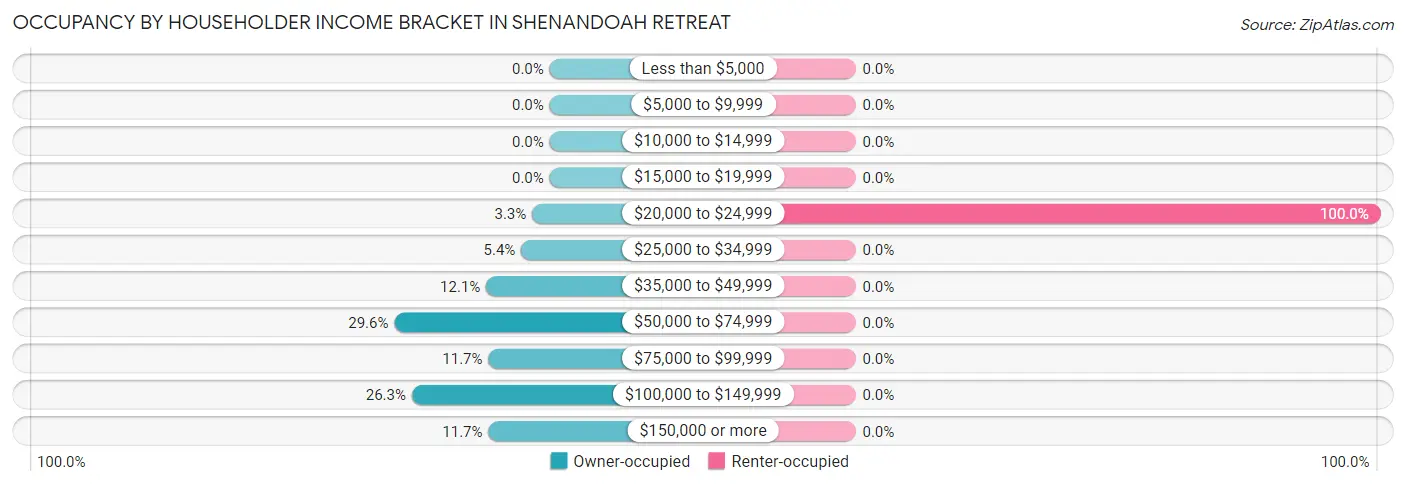
| Income Bracket | Owner-occupied | Renter-occupied |
| Less than $5,000 | 0 (0.0%) | 0 (0.0%) |
| $5,000 to $9,999 | 0 (0.0%) | 0 (0.0%) |
| $10,000 to $14,999 | 0 (0.0%) | 0 (0.0%) |
| $15,000 to $19,999 | 0 (0.0%) | 0 (0.0%) |
| $20,000 to $24,999 | 8 (3.3%) | 37 (100.0%) |
| $25,000 to $34,999 | 13 (5.4%) | 0 (0.0%) |
| $35,000 to $49,999 | 29 (12.1%) | 0 (0.0%) |
| $50,000 to $74,999 | 71 (29.6%) | 0 (0.0%) |
| $75,000 to $99,999 | 28 (11.7%) | 0 (0.0%) |
| $100,000 to $149,999 | 63 (26.3%) | 0 (0.0%) |
| $150,000 or more | 28 (11.7%) | 0 (0.0%) |
| Total | 240 (100.0%) | 37 (100.0%) |
Monthly Housing Cost Tiers in Shenandoah Retreat
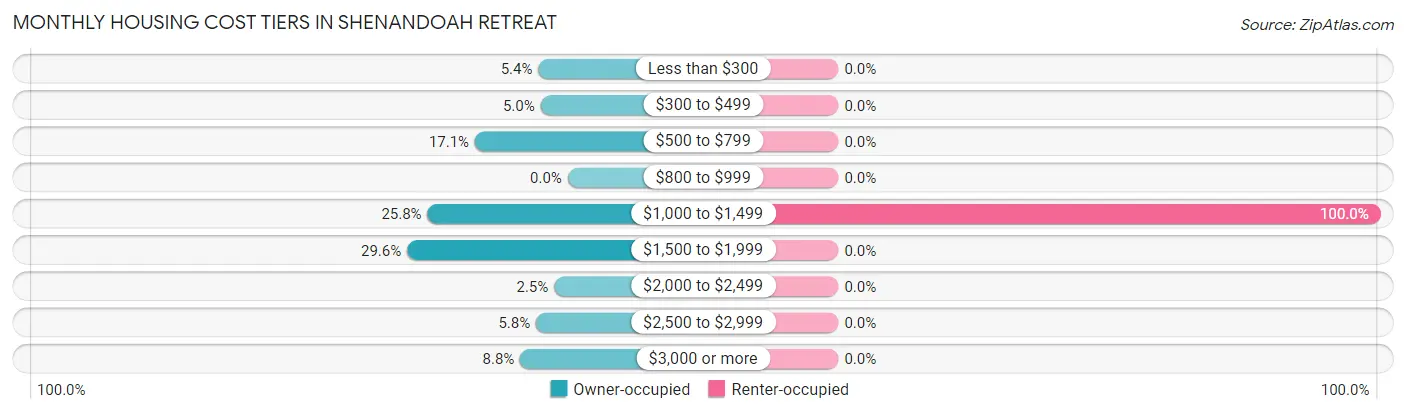
| Monthly Cost | Owner-occupied | Renter-occupied |
| Less than $300 | 13 (5.4%) | 0 (0.0%) |
| $300 to $499 | 12 (5.0%) | 0 (0.0%) |
| $500 to $799 | 41 (17.1%) | 0 (0.0%) |
| $800 to $999 | 0 (0.0%) | 0 (0.0%) |
| $1,000 to $1,499 | 62 (25.8%) | 37 (100.0%) |
| $1,500 to $1,999 | 71 (29.6%) | 0 (0.0%) |
| $2,000 to $2,499 | 6 (2.5%) | 0 (0.0%) |
| $2,500 to $2,999 | 14 (5.8%) | 0 (0.0%) |
| $3,000 or more | 21 (8.7%) | 0 (0.0%) |
| Total | 240 (100.0%) | 37 (100.0%) |
Physical Housing Characteristics in Shenandoah Retreat
Housing Structures in Shenandoah Retreat
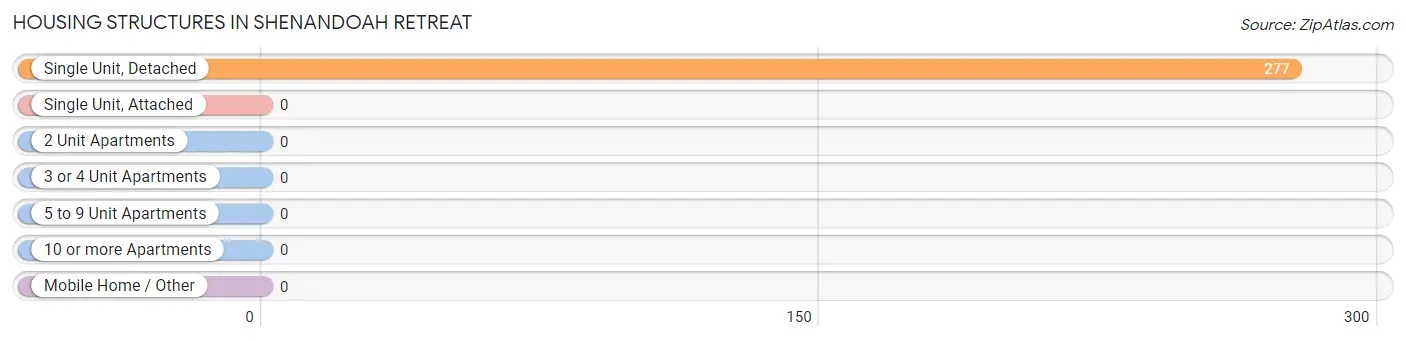
| Structure Type | # Housing Units | % Housing Units |
| Single Unit, Detached | 277 | 100.0% |
| Single Unit, Attached | 0 | 0.0% |
| 2 Unit Apartments | 0 | 0.0% |
| 3 or 4 Unit Apartments | 0 | 0.0% |
| 5 to 9 Unit Apartments | 0 | 0.0% |
| 10 or more Apartments | 0 | 0.0% |
| Mobile Home / Other | 0 | 0.0% |
| Total | 277 | 100.0% |
Housing Structures by Occupancy in Shenandoah Retreat
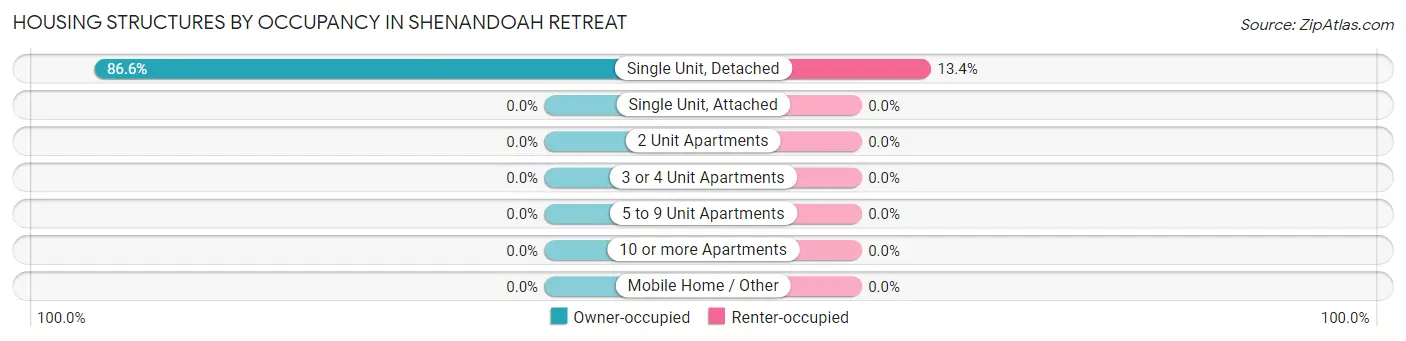
| Structure Type | Owner-occupied | Renter-occupied |
| Single Unit, Detached | 240 (86.6%) | 37 (13.4%) |
| Single Unit, Attached | 0 (0.0%) | 0 (0.0%) |
| 2 Unit Apartments | 0 (0.0%) | 0 (0.0%) |
| 3 or 4 Unit Apartments | 0 (0.0%) | 0 (0.0%) |
| 5 to 9 Unit Apartments | 0 (0.0%) | 0 (0.0%) |
| 10 or more Apartments | 0 (0.0%) | 0 (0.0%) |
| Mobile Home / Other | 0 (0.0%) | 0 (0.0%) |
| Total | 240 (86.6%) | 37 (13.4%) |
Housing Structures by Number of Rooms in Shenandoah Retreat
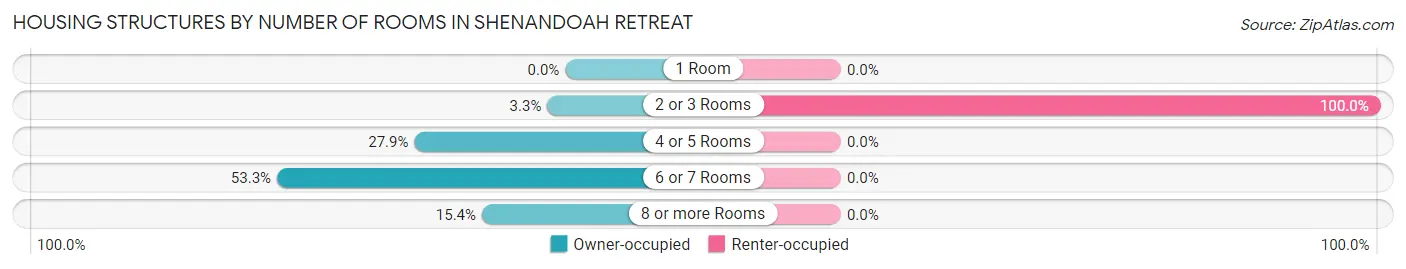
| Number of Rooms | Owner-occupied | Renter-occupied |
| 1 Room | 0 (0.0%) | 0 (0.0%) |
| 2 or 3 Rooms | 8 (3.3%) | 37 (100.0%) |
| 4 or 5 Rooms | 67 (27.9%) | 0 (0.0%) |
| 6 or 7 Rooms | 128 (53.3%) | 0 (0.0%) |
| 8 or more Rooms | 37 (15.4%) | 0 (0.0%) |
| Total | 240 (100.0%) | 37 (100.0%) |
Housing Structure by Heating Type in Shenandoah Retreat
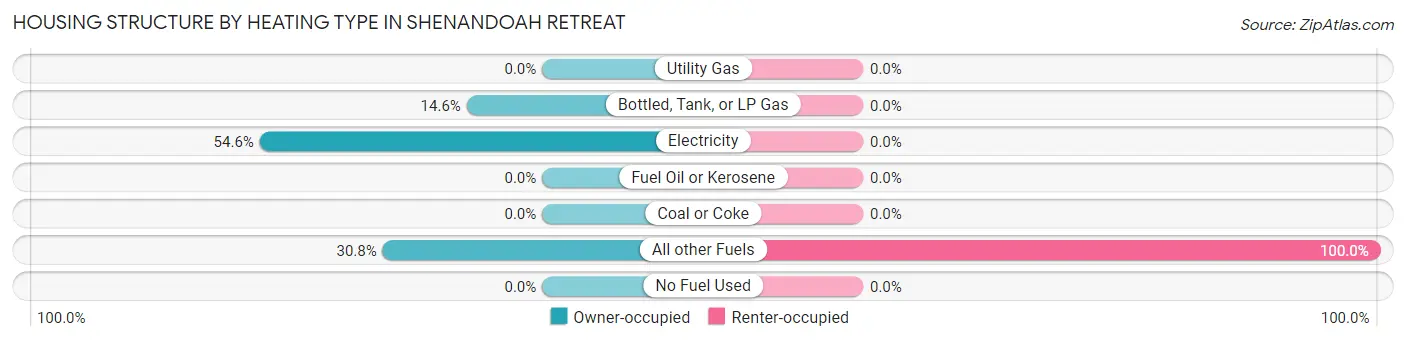
| Heating Type | Owner-occupied | Renter-occupied |
| Utility Gas | 0 (0.0%) | 0 (0.0%) |
| Bottled, Tank, or LP Gas | 35 (14.6%) | 0 (0.0%) |
| Electricity | 131 (54.6%) | 0 (0.0%) |
| Fuel Oil or Kerosene | 0 (0.0%) | 0 (0.0%) |
| Coal or Coke | 0 (0.0%) | 0 (0.0%) |
| All other Fuels | 74 (30.8%) | 37 (100.0%) |
| No Fuel Used | 0 (0.0%) | 0 (0.0%) |
| Total | 240 (100.0%) | 37 (100.0%) |
Household Vehicle Usage in Shenandoah Retreat
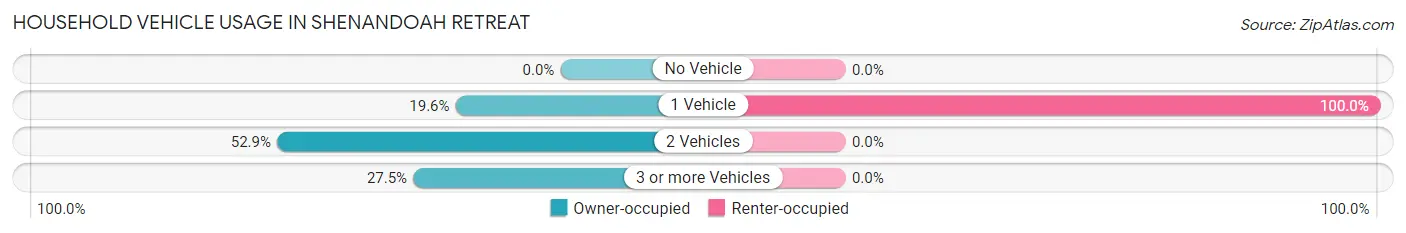
| Vehicles per Household | Owner-occupied | Renter-occupied |
| No Vehicle | 0 (0.0%) | 0 (0.0%) |
| 1 Vehicle | 47 (19.6%) | 37 (100.0%) |
| 2 Vehicles | 127 (52.9%) | 0 (0.0%) |
| 3 or more Vehicles | 66 (27.5%) | 0 (0.0%) |
| Total | 240 (100.0%) | 37 (100.0%) |
Real Estate & Mortgages in Shenandoah Retreat
Real Estate and Mortgage Overview in Shenandoah Retreat
| Characteristic | Without Mortgage | With Mortgage |
| Housing Units | 33 | 207 |
| Median Property Value | $221,900 | $362,500 |
| Median Household Income | $29,135 | $28 |
| Monthly Housing Costs | $429 | $21 |
| Real Estate Taxes | $1,670 | $15 |
Property Value by Mortgage Status in Shenandoah Retreat
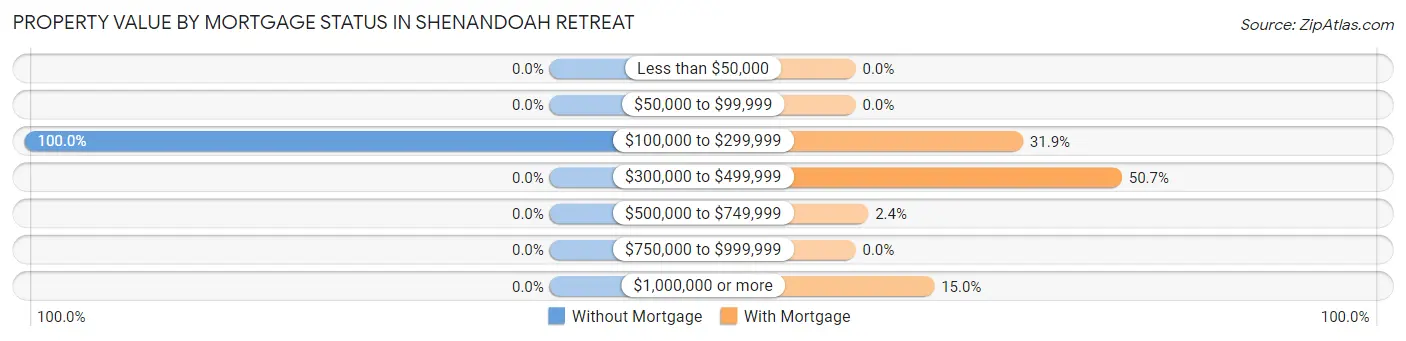
| Property Value | Without Mortgage | With Mortgage |
| Less than $50,000 | 0 (0.0%) | 0 (0.0%) |
| $50,000 to $99,999 | 0 (0.0%) | 0 (0.0%) |
| $100,000 to $299,999 | 33 (100.0%) | 66 (31.9%) |
| $300,000 to $499,999 | 0 (0.0%) | 105 (50.7%) |
| $500,000 to $749,999 | 0 (0.0%) | 5 (2.4%) |
| $750,000 to $999,999 | 0 (0.0%) | 0 (0.0%) |
| $1,000,000 or more | 0 (0.0%) | 31 (15.0%) |
| Total | 33 (100.0%) | 207 (100.0%) |
Household Income by Mortgage Status in Shenandoah Retreat
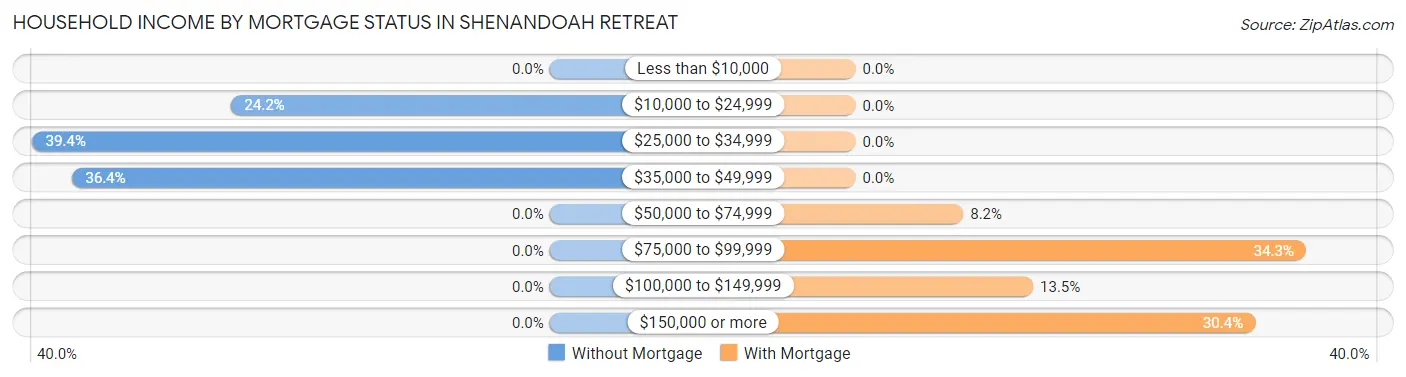
| Household Income | Without Mortgage | With Mortgage |
| Less than $10,000 | 0 (0.0%) | 0 (0.0%) |
| $10,000 to $24,999 | 8 (24.2%) | 0 (0.0%) |
| $25,000 to $34,999 | 13 (39.4%) | 0 (0.0%) |
| $35,000 to $49,999 | 12 (36.4%) | 0 (0.0%) |
| $50,000 to $74,999 | 0 (0.0%) | 17 (8.2%) |
| $75,000 to $99,999 | 0 (0.0%) | 71 (34.3%) |
| $100,000 to $149,999 | 0 (0.0%) | 28 (13.5%) |
| $150,000 or more | 0 (0.0%) | 63 (30.4%) |
| Total | 33 (100.0%) | 207 (100.0%) |
Property Value to Household Income Ratio in Shenandoah Retreat
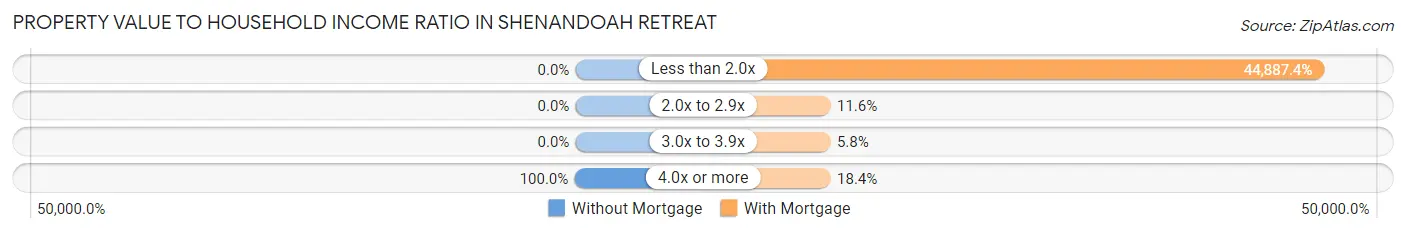
| Value-to-Income Ratio | Without Mortgage | With Mortgage |
| Less than 2.0x | 0 (0.0%) | 92,917 (44,887.4%) |
| 2.0x to 2.9x | 0 (0.0%) | 24 (11.6%) |
| 3.0x to 3.9x | 0 (0.0%) | 12 (5.8%) |
| 4.0x or more | 33 (100.0%) | 38 (18.4%) |
| Total | 33 (100.0%) | 207 (100.0%) |
Real Estate Taxes by Mortgage Status in Shenandoah Retreat
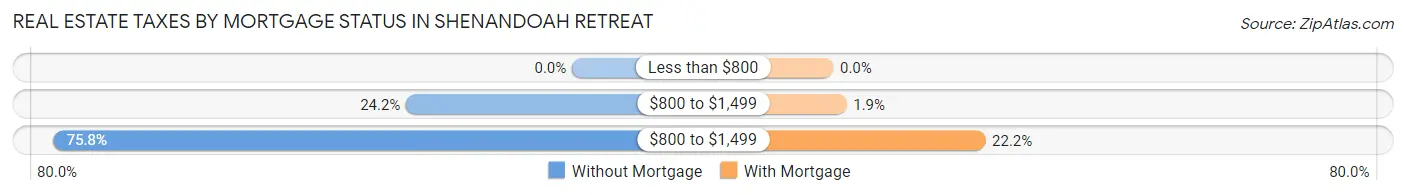
| Property Taxes | Without Mortgage | With Mortgage |
| Less than $800 | 0 (0.0%) | 0 (0.0%) |
| $800 to $1,499 | 8 (24.2%) | 4 (1.9%) |
| $800 to $1,499 | 25 (75.8%) | 46 (22.2%) |
| Total | 33 (100.0%) | 207 (100.0%) |
Health & Disability in Shenandoah Retreat
Health Insurance Coverage by Age in Shenandoah Retreat
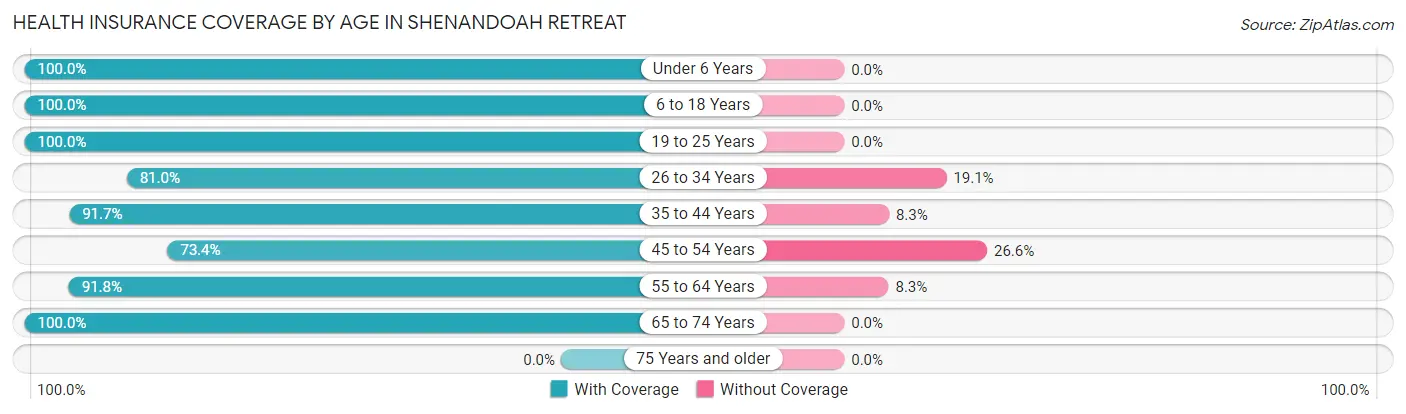
| Age Bracket | With Coverage | Without Coverage |
| Under 6 Years | 54 (100.0%) | 0 (0.0%) |
| 6 to 18 Years | 104 (100.0%) | 0 (0.0%) |
| 19 to 25 Years | 31 (100.0%) | 0 (0.0%) |
| 26 to 34 Years | 17 (80.9%) | 4 (19.1%) |
| 35 to 44 Years | 77 (91.7%) | 7 (8.3%) |
| 45 to 54 Years | 102 (73.4%) | 37 (26.6%) |
| 55 to 64 Years | 89 (91.7%) | 8 (8.3%) |
| 65 to 74 Years | 92 (100.0%) | 0 (0.0%) |
| 75 Years and older | 0 (0.0%) | 0 (0.0%) |
| Total | 566 (91.0%) | 56 (9.0%) |
Health Insurance Coverage by Citizenship Status in Shenandoah Retreat
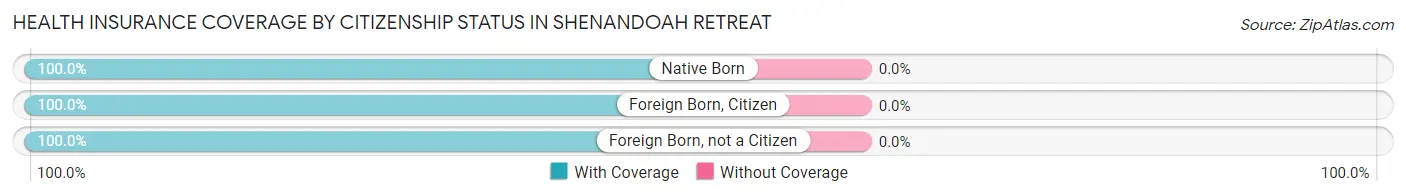
| Citizenship Status | With Coverage | Without Coverage |
| Native Born | 54 (100.0%) | 0 (0.0%) |
| Foreign Born, Citizen | 104 (100.0%) | 0 (0.0%) |
| Foreign Born, not a Citizen | 31 (100.0%) | 0 (0.0%) |
Health Insurance Coverage by Household Income in Shenandoah Retreat
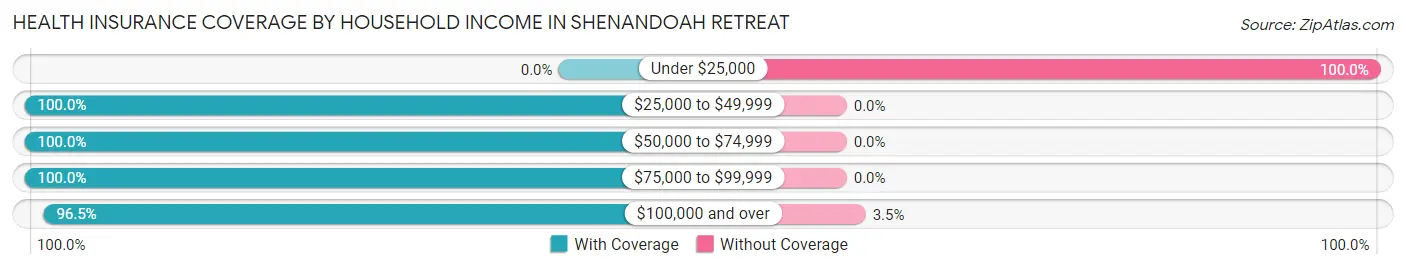
| Household Income | With Coverage | Without Coverage |
| Under $25,000 | 0 (0.0%) | 45 (100.0%) |
| $25,000 to $49,999 | 81 (100.0%) | 0 (0.0%) |
| $50,000 to $74,999 | 145 (100.0%) | 0 (0.0%) |
| $75,000 to $99,999 | 40 (100.0%) | 0 (0.0%) |
| $100,000 and over | 300 (96.5%) | 11 (3.5%) |
Public vs Private Health Insurance Coverage by Age in Shenandoah Retreat
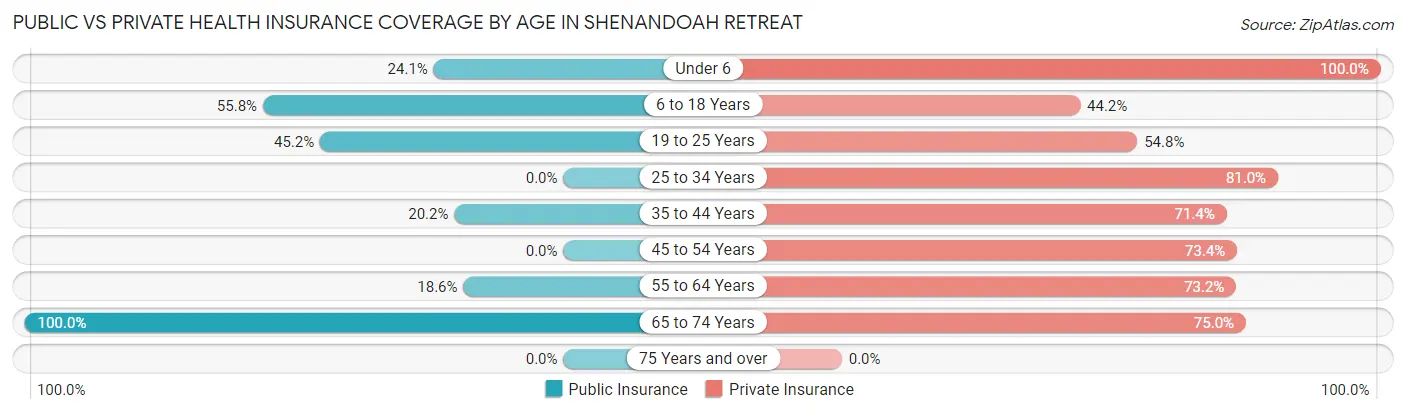
| Age Bracket | Public Insurance | Private Insurance |
| Under 6 | 13 (24.1%) | 54 (100.0%) |
| 6 to 18 Years | 58 (55.8%) | 46 (44.2%) |
| 19 to 25 Years | 14 (45.2%) | 17 (54.8%) |
| 25 to 34 Years | 0 (0.0%) | 17 (80.9%) |
| 35 to 44 Years | 17 (20.2%) | 60 (71.4%) |
| 45 to 54 Years | 0 (0.0%) | 102 (73.4%) |
| 55 to 64 Years | 18 (18.6%) | 71 (73.2%) |
| 65 to 74 Years | 92 (100.0%) | 69 (75.0%) |
| 75 Years and over | 0 (0.0%) | 0 (0.0%) |
| Total | 212 (34.1%) | 436 (70.1%) |
Disability Status by Sex by Age in Shenandoah Retreat
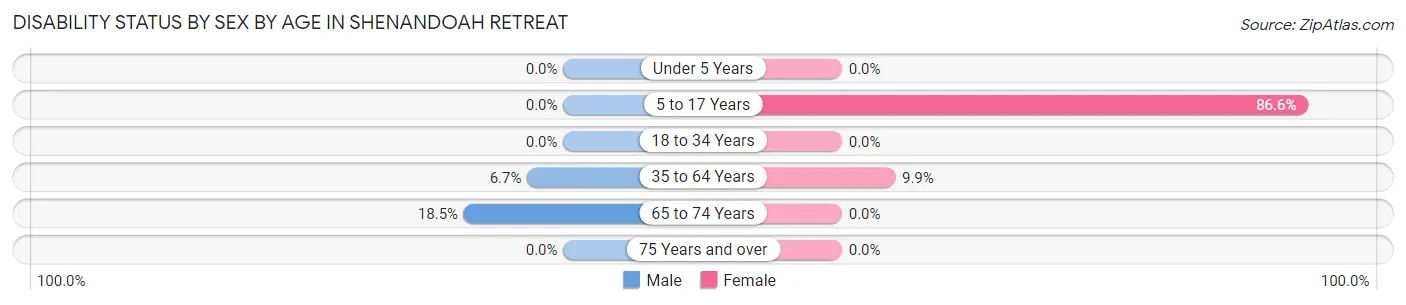
| Age Bracket | Male | Female |
| Under 5 Years | 0 (0.0%) | 0 (0.0%) |
| 5 to 17 Years | 0 (0.0%) | 58 (86.6%) |
| 18 to 34 Years | 0 (0.0%) | 0 (0.0%) |
| 35 to 64 Years | 16 (6.7%) | 8 (9.9%) |
| 65 to 74 Years | 12 (18.5%) | 0 (0.0%) |
| 75 Years and over | 0 (0.0%) | 0 (0.0%) |
Disability Class by Sex by Age in Shenandoah Retreat
Disability Class: Hearing Difficulty
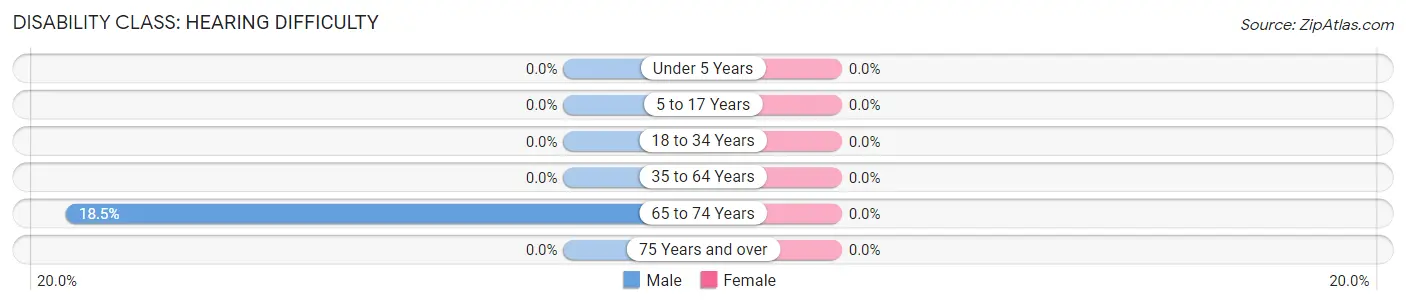
| Age Bracket | Male | Female |
| Under 5 Years | 0 (0.0%) | 0 (0.0%) |
| 5 to 17 Years | 0 (0.0%) | 0 (0.0%) |
| 18 to 34 Years | 0 (0.0%) | 0 (0.0%) |
| 35 to 64 Years | 0 (0.0%) | 0 (0.0%) |
| 65 to 74 Years | 12 (18.5%) | 0 (0.0%) |
| 75 Years and over | 0 (0.0%) | 0 (0.0%) |
Disability Class: Vision Difficulty
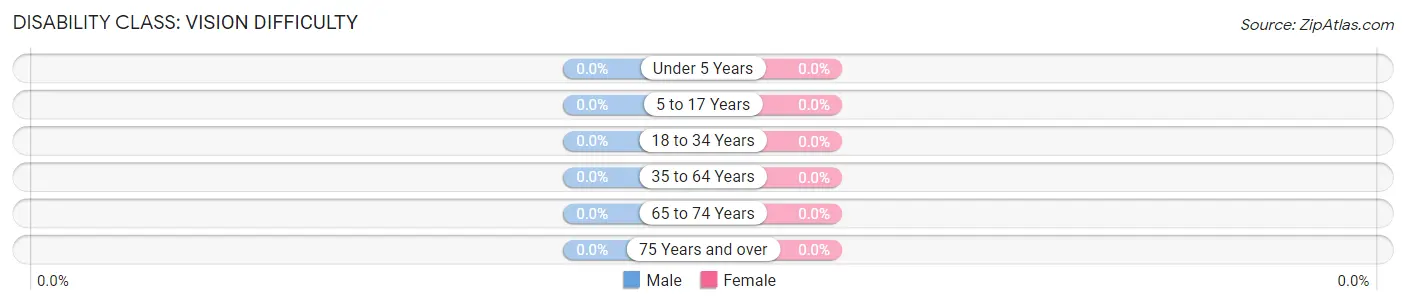
| Age Bracket | Male | Female |
| Under 5 Years | 0 (0.0%) | 0 (0.0%) |
| 5 to 17 Years | 0 (0.0%) | 0 (0.0%) |
| 18 to 34 Years | 0 (0.0%) | 0 (0.0%) |
| 35 to 64 Years | 0 (0.0%) | 0 (0.0%) |
| 65 to 74 Years | 0 (0.0%) | 0 (0.0%) |
| 75 Years and over | 0 (0.0%) | 0 (0.0%) |
Disability Class: Cognitive Difficulty
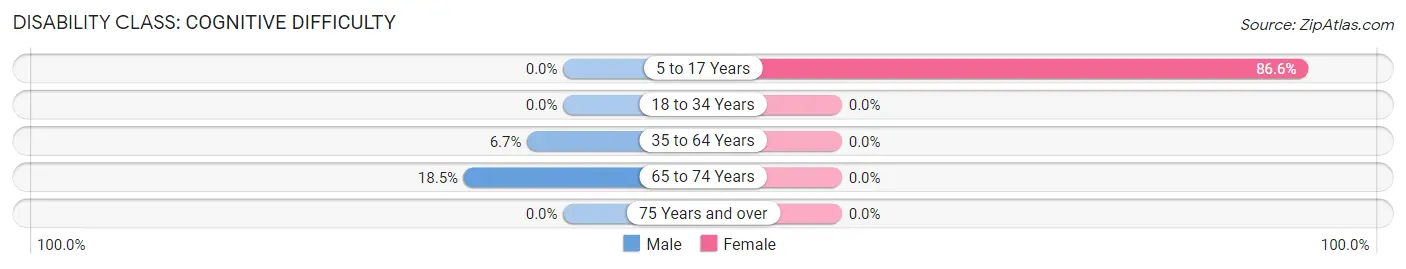
| Age Bracket | Male | Female |
| 5 to 17 Years | 0 (0.0%) | 58 (86.6%) |
| 18 to 34 Years | 0 (0.0%) | 0 (0.0%) |
| 35 to 64 Years | 16 (6.7%) | 0 (0.0%) |
| 65 to 74 Years | 12 (18.5%) | 0 (0.0%) |
| 75 Years and over | 0 (0.0%) | 0 (0.0%) |
Disability Class: Ambulatory Difficulty
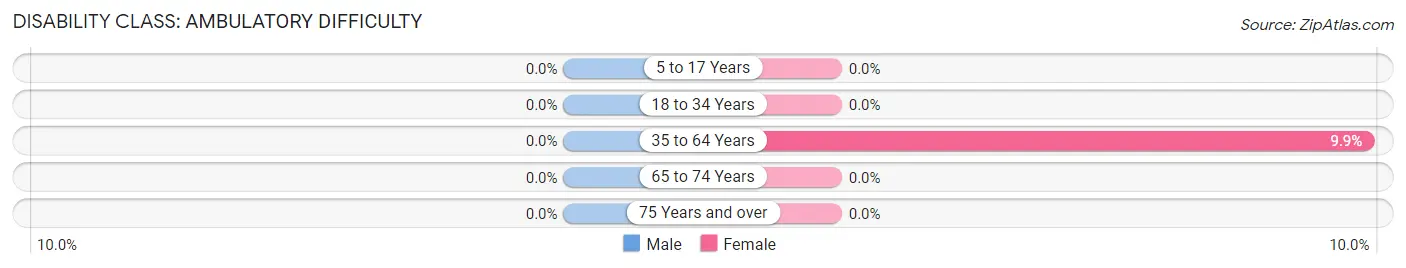
| Age Bracket | Male | Female |
| 5 to 17 Years | 0 (0.0%) | 0 (0.0%) |
| 18 to 34 Years | 0 (0.0%) | 0 (0.0%) |
| 35 to 64 Years | 0 (0.0%) | 8 (9.9%) |
| 65 to 74 Years | 0 (0.0%) | 0 (0.0%) |
| 75 Years and over | 0 (0.0%) | 0 (0.0%) |
Disability Class: Self-Care Difficulty
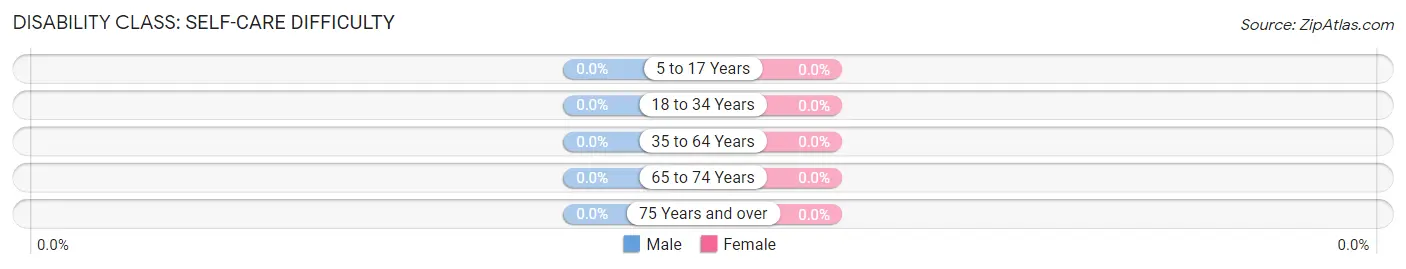
| Age Bracket | Male | Female |
| 5 to 17 Years | 0 (0.0%) | 0 (0.0%) |
| 18 to 34 Years | 0 (0.0%) | 0 (0.0%) |
| 35 to 64 Years | 0 (0.0%) | 0 (0.0%) |
| 65 to 74 Years | 0 (0.0%) | 0 (0.0%) |
| 75 Years and over | 0 (0.0%) | 0 (0.0%) |
Technology Access in Shenandoah Retreat
Computing Device Access in Shenandoah Retreat
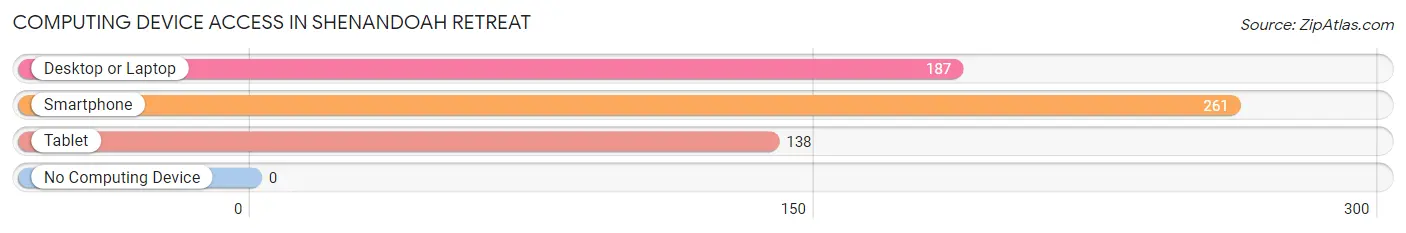
| Device Type | # Households | % Households |
| Desktop or Laptop | 187 | 67.5% |
| Smartphone | 261 | 94.2% |
| Tablet | 138 | 49.8% |
| No Computing Device | 0 | 0.0% |
| Total | 277 | 100.0% |
Internet Access in Shenandoah Retreat
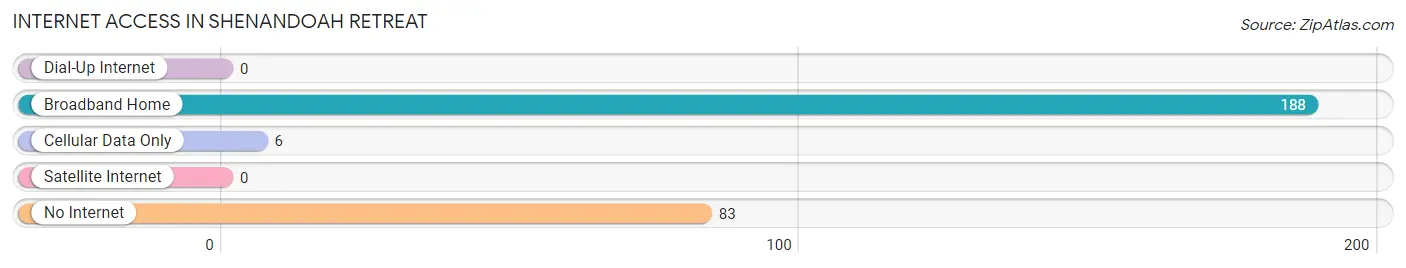
| Internet Type | # Households | % Households |
| Dial-Up Internet | 0 | 0.0% |
| Broadband Home | 188 | 67.9% |
| Cellular Data Only | 6 | 2.2% |
| Satellite Internet | 0 | 0.0% |
| No Internet | 83 | 30.0% |
| Total | 277 | 100.0% |
Shenandoah Retreat Summary
Shenandoah Retreat is a small unincorporated community located in the Shenandoah Valley of Virginia. It is situated in the foothills of the Blue Ridge Mountains, approximately 10 miles south of Harrisonburg and 25 miles north of Staunton. The community is surrounded by the George Washington National Forest and is home to a variety of wildlife, including deer, bear, and wild turkey.
History
Shenandoah Retreat was first settled in the late 1700s by German immigrants who were attracted to the area by its fertile soil and abundant natural resources. The community was originally known as “Shenandoah” and was part of the larger Shenandoah Valley. In the early 1800s, the community was renamed “Shenandoah Retreat” after a nearby retreat center. The retreat center was established by the Methodist Church and was used as a place of rest and relaxation for ministers and their families.
The community grew slowly over the years and by the mid-1800s, it had become a popular destination for travelers and vacationers. The area was known for its scenic beauty and was home to a variety of outdoor activities, including hunting, fishing, and camping.
In the late 1800s, the community began to experience a period of growth and development. The railroad arrived in the area in 1891, connecting Shenandoah Retreat to the larger cities of Harrisonburg and Staunton. This allowed for increased trade and commerce, as well as easier access to the rest of the Shenandoah Valley.
In the early 1900s, the community experienced a period of decline as the railroad began to decline in popularity. However, the community was revitalized in the 1950s when the Shenandoah National Park was established. The park brought an influx of tourists to the area, which helped to revive the local economy.
Geography
Shenandoah Retreat is located in the Shenandoah Valley of Virginia. The community is situated in the foothills of the Blue Ridge Mountains and is surrounded by the George Washington National Forest. The area is known for its scenic beauty and is home to a variety of wildlife, including deer, bear, and wild turkey.
The climate in Shenandoah Retreat is temperate and humid. Summers are hot and humid, with temperatures reaching up to 90 degrees Fahrenheit. Winters are cold and snowy, with temperatures dropping to as low as 10 degrees Fahrenheit.
Economy
Shenandoah Retreat is a small, rural community with a limited economy. The primary industries in the area are tourism and agriculture. The area is home to a variety of outdoor activities, including hunting, fishing, and camping. The Shenandoah National Park is a major tourist attraction and brings in visitors from all over the country.
Agriculture is also an important part of the local economy. The area is known for its fertile soil and is home to a variety of crops, including corn, soybeans, wheat, and hay. Livestock farming is also common in the area, with cattle, sheep, and horses being raised for meat and dairy products.
Demographics
As of the 2010 census, the population of Shenandoah Retreat was 1,845. The population is predominantly white (97.2%) and the median age is 44. The median household income is $45,000 and the median home value is $150,000. The unemployment rate is 5.2%.
Shenandoah Retreat is a small, rural community with a limited economy. The area is known for its scenic beauty and is home to a variety of outdoor activities. The community is predominantly white and the median age is 44. The median household income is $45,000 and the median home value is $150,000. The unemployment rate is 5.2%.
Common Questions
What is Per Capita Income in Shenandoah Retreat?
Per Capita income in Shenandoah Retreat is $38,713.
What is the Median Family Income in Shenandoah Retreat?
Median Family Income in Shenandoah Retreat is $111,797.
What is the Median Household income in Shenandoah Retreat?
Median Household Income in Shenandoah Retreat is $65,156.
What is Income or Wage Gap in Shenandoah Retreat?
Income or Wage Gap in Shenandoah Retreat is 17.2%.
Women in Shenandoah Retreat earn 82.8 cents for every dollar earned by a man.
What is Inequality or Gini Index in Shenandoah Retreat?
Inequality or Gini Index in Shenandoah Retreat is 0.35.
What is the Total Population of Shenandoah Retreat?
Total Population of Shenandoah Retreat is 622.
What is the Total Male Population of Shenandoah Retreat?
Total Male Population of Shenandoah Retreat is 406.
What is the Total Female Population of Shenandoah Retreat?
Total Female Population of Shenandoah Retreat is 216.
What is the Ratio of Males per 100 Females in Shenandoah Retreat?
There are 187.96 Males per 100 Females in Shenandoah Retreat.
What is the Ratio of Females per 100 Males in Shenandoah Retreat?
There are 53.20 Females per 100 Males in Shenandoah Retreat.
What is the Median Population Age in Shenandoah Retreat?
Median Population Age in Shenandoah Retreat is 47.4 Years.
What is the Average Family Size in Shenandoah Retreat
Average Family Size in Shenandoah Retreat is 3.6 People.
What is the Average Household Size in Shenandoah Retreat
Average Household Size in Shenandoah Retreat is 2.2 People.
How Large is the Labor Force in Shenandoah Retreat?
There are 360 People in the Labor Forcein in Shenandoah Retreat.
What is the Percentage of People in the Labor Force in Shenandoah Retreat?
67.5% of People are in the Labor Force in Shenandoah Retreat.
What is the Unemployment Rate in Shenandoah Retreat?
Unemployment Rate in Shenandoah Retreat is 0.6%.