Templeton, VA Map & Demographics
Templeton Map
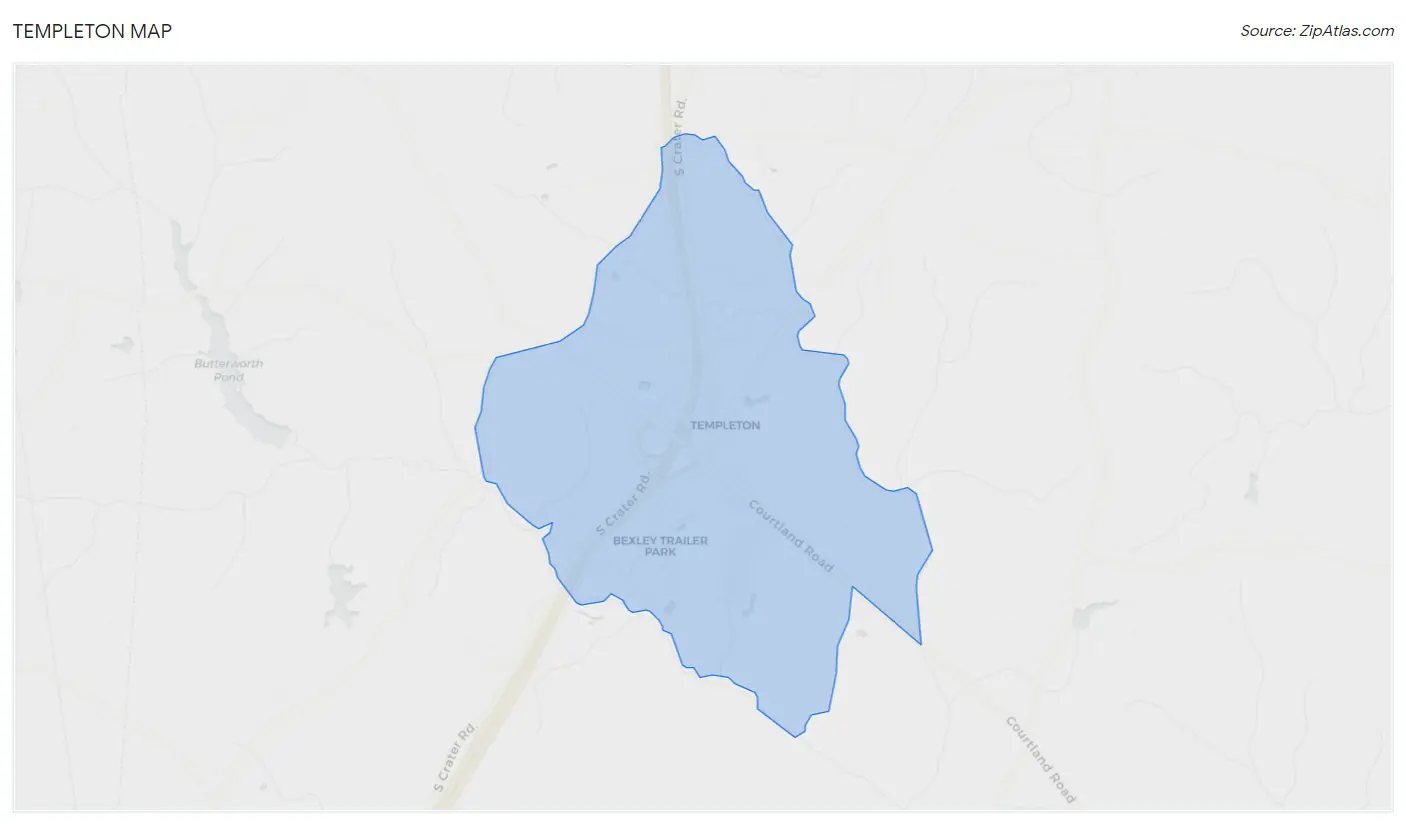
Templeton Overview
$38,561
PER CAPITA INCOME
0.29
INEQUALITY / GINI INDEX
119
TOTAL POPULATION
44
MALE POPULATION
75
FEMALE POPULATION
58.67
MALES / 100 FEMALES
170.45
FEMALES / 100 MALES
53.8
MEDIAN AGE
2.6
AVG FAMILY SIZE
2.5
AVG HOUSEHOLD SIZE
61
LABOR FORCE [ PEOPLE ]
61.6%
PERCENT IN LABOR FORCE
Income in Templeton
Income Overview in Templeton
| Characteristic | Number | Measure |
| Per Capita Income | 119 | $38,561 |
| Median Family Income | 40 | $0 |
| Mean Family Income | 40 | $101,638 |
| Median Household Income | 48 | $0 |
| Mean Household Income | 48 | $89,629 |
| Income Deficit | 40 | $0 |
| Wage / Income Gap (%) | 119 | 0.00% |
| Wage / Income Gap ($) | 119 | 100.00¢ per $1 |
| Gini / Inequality Index | 119 | 0.29 |
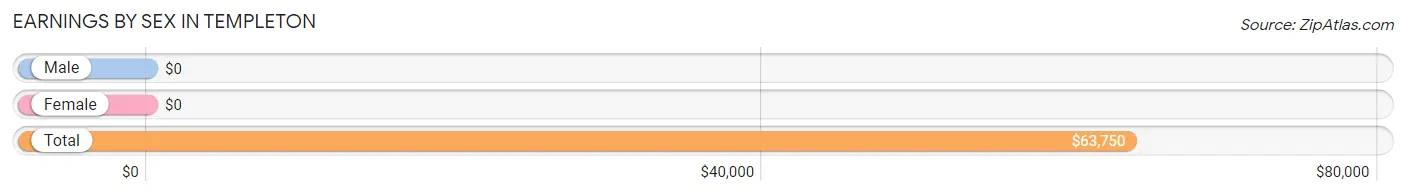
Earnings by Sex in Templeton
| Sex | Number | Average Earnings |
| Male | 29 (47.5%) | $0 |
| Female | 32 (52.5%) | $0 |
| Total | 61 (100.0%) | $63,750 |
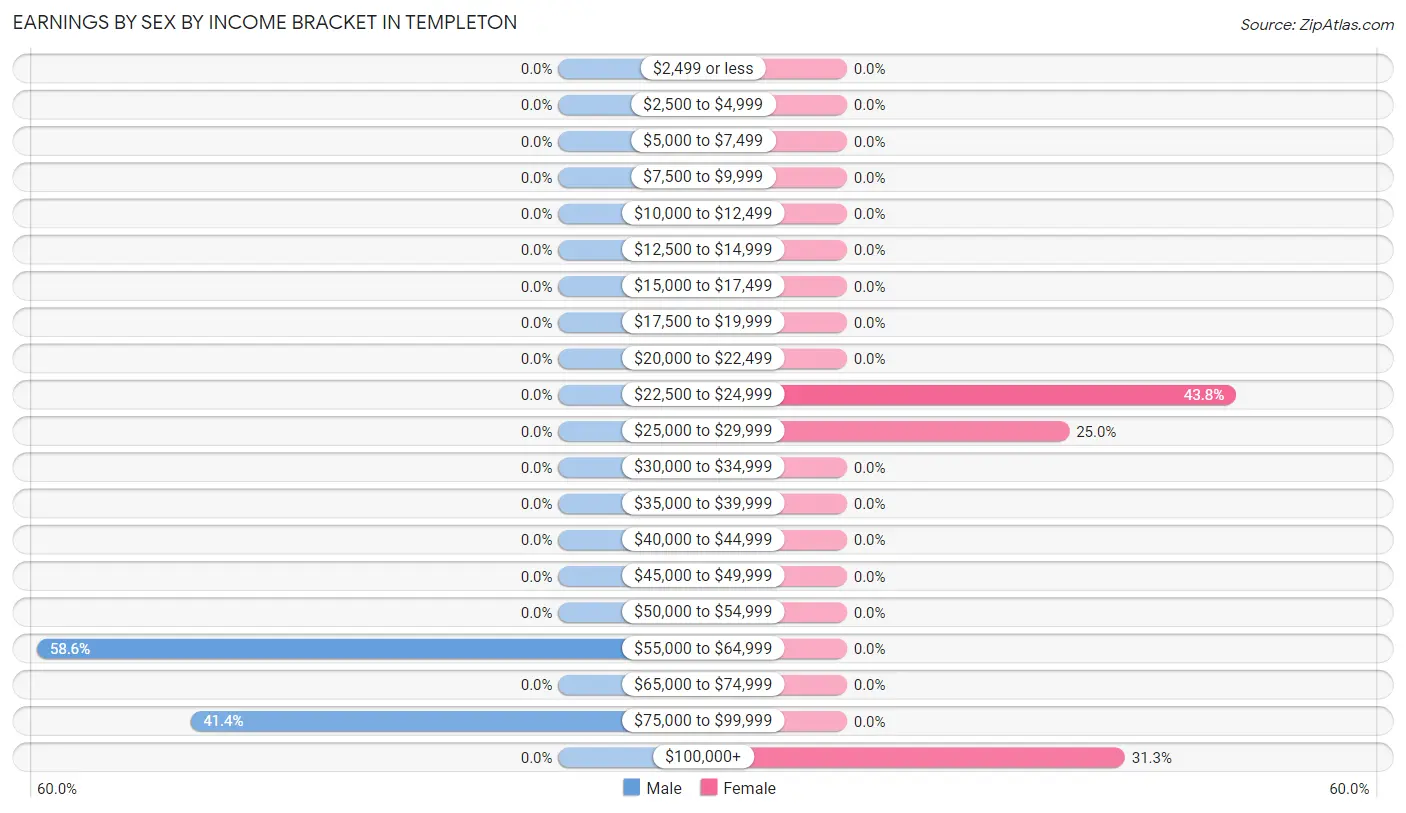
Earnings by Sex by Income Bracket in Templeton
The most common earnings brackets in Templeton are $55,000 to $64,999 for men (17 | 58.6%) and $22,500 to $24,999 for women (14 | 43.8%).
| Income | Male | Female |
| $2,499 or less | 0 (0.0%) | 0 (0.0%) |
| $2,500 to $4,999 | 0 (0.0%) | 0 (0.0%) |
| $5,000 to $7,499 | 0 (0.0%) | 0 (0.0%) |
| $7,500 to $9,999 | 0 (0.0%) | 0 (0.0%) |
| $10,000 to $12,499 | 0 (0.0%) | 0 (0.0%) |
| $12,500 to $14,999 | 0 (0.0%) | 0 (0.0%) |
| $15,000 to $17,499 | 0 (0.0%) | 0 (0.0%) |
| $17,500 to $19,999 | 0 (0.0%) | 0 (0.0%) |
| $20,000 to $22,499 | 0 (0.0%) | 0 (0.0%) |
| $22,500 to $24,999 | 0 (0.0%) | 14 (43.8%) |
| $25,000 to $29,999 | 0 (0.0%) | 8 (25.0%) |
| $30,000 to $34,999 | 0 (0.0%) | 0 (0.0%) |
| $35,000 to $39,999 | 0 (0.0%) | 0 (0.0%) |
| $40,000 to $44,999 | 0 (0.0%) | 0 (0.0%) |
| $45,000 to $49,999 | 0 (0.0%) | 0 (0.0%) |
| $50,000 to $54,999 | 0 (0.0%) | 0 (0.0%) |
| $55,000 to $64,999 | 17 (58.6%) | 0 (0.0%) |
| $65,000 to $74,999 | 0 (0.0%) | 0 (0.0%) |
| $75,000 to $99,999 | 12 (41.4%) | 0 (0.0%) |
| $100,000+ | 0 (0.0%) | 10 (31.2%) |
| Total | 29 (100.0%) | 32 (100.0%) |
Earnings by Sex by Educational Attainment in Templeton
| Educational Attainment | Male Income | Female Income |
| Less than High School | - | - |
| High School Diploma | - | - |
| College or Associate's Degree | - | - |
| Bachelor's Degree | - | - |
| Graduate Degree | - | - |
| Total | - | - |
Family Income in Templeton
Family Income Brackets in Templeton
According to the Templeton family income data, there are 16 families falling into the $50,000 to $74,999 income range, which is the most common income bracket and makes up 40.0% of all families.
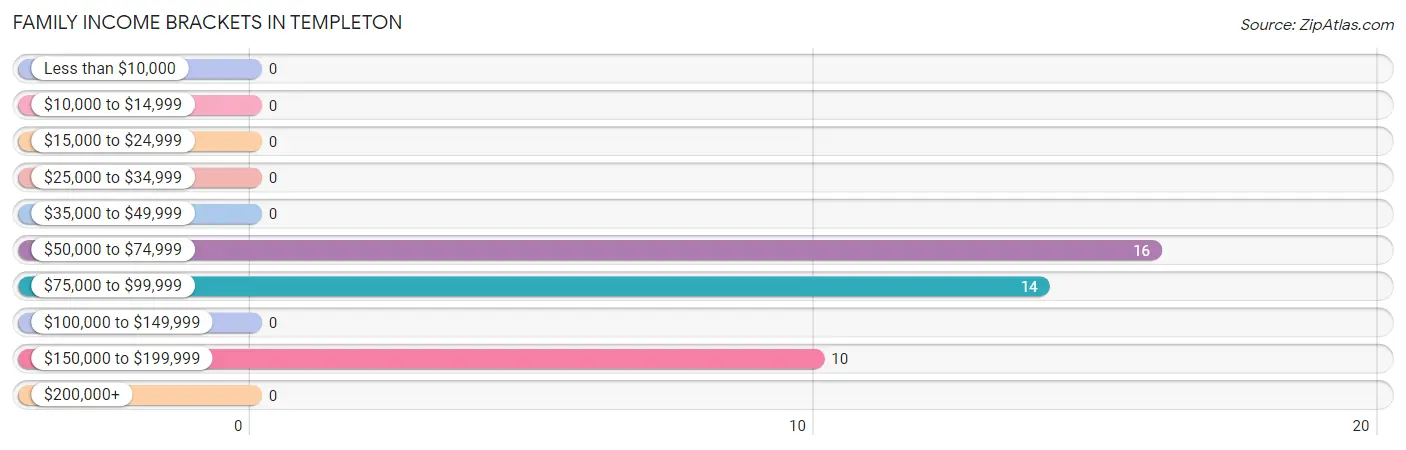
| Income Bracket | # Families | % Families |
| Less than $10,000 | 0 | 0.0% |
| $10,000 to $14,999 | 0 | 0.0% |
| $15,000 to $24,999 | 0 | 0.0% |
| $25,000 to $34,999 | 0 | 0.0% |
| $35,000 to $49,999 | 0 | 0.0% |
| $50,000 to $74,999 | 16 | 40.0% |
| $75,000 to $99,999 | 14 | 35.0% |
| $100,000 to $149,999 | 0 | 0.0% |
| $150,000 to $199,999 | 10 | 25.0% |
| $200,000+ | 0 | 0.0% |
Family Income by Famaliy Size in Templeton
| Income Bracket | # Families | Median Income |
| 2-Person Families | 30 (75.0%) | $0 |
| 3-Person Families | 0 (0.0%) | $0 |
| 4-Person Families | 10 (25.0%) | $0 |
| 5-Person Families | 0 (0.0%) | $0 |
| 6-Person Families | 0 (0.0%) | $0 |
| 7+ Person Families | 0 (0.0%) | $0 |
| Total | 40 (100.0%) | $0 |
Family Income by Number of Earners in Templeton
| Number of Earners | # Families | Median Income |
| No Earners | 16 (40.0%) | $0 |
| 1 Earner | 0 (0.0%) | $0 |
| 2 Earners | 24 (60.0%) | $0 |
| 3+ Earners | 0 (0.0%) | $0 |
| Total | 40 (100.0%) | $0 |
Household Income in Templeton
Household Income Brackets in Templeton
With 16 households falling in the category, the $50,000 to $74,999 income range is the most frequent in Templeton, accounting for 33.3% of all households.
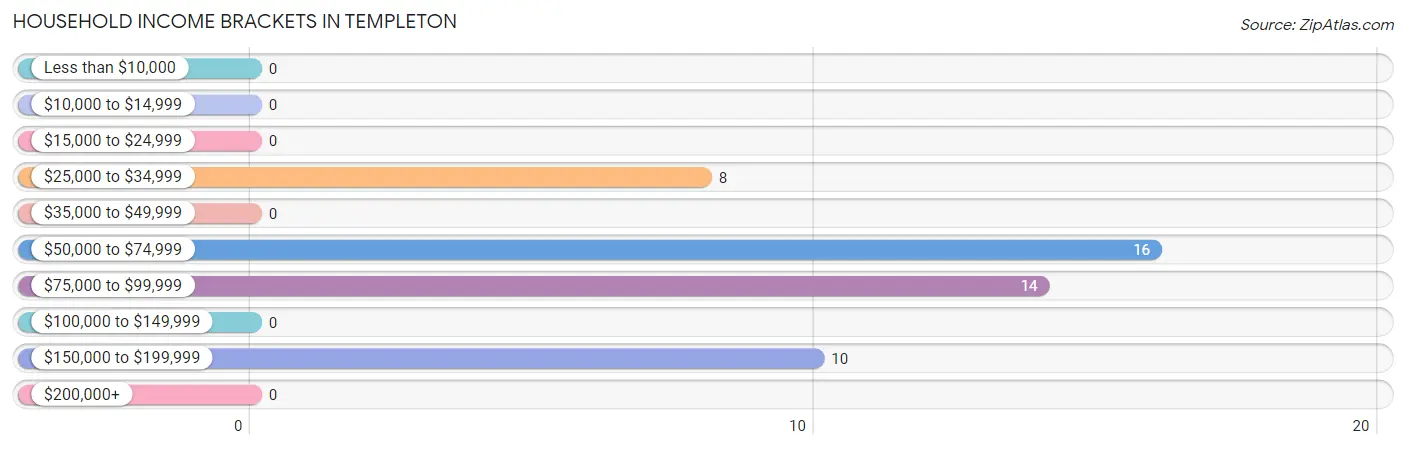
| Income Bracket | # Households | % Households |
| Less than $10,000 | 0 | 0.0% |
| $10,000 to $14,999 | 0 | 0.0% |
| $15,000 to $24,999 | 0 | 0.0% |
| $25,000 to $34,999 | 8 | 16.7% |
| $35,000 to $49,999 | 0 | 0.0% |
| $50,000 to $74,999 | 16 | 33.3% |
| $75,000 to $99,999 | 14 | 29.2% |
| $100,000 to $149,999 | 0 | 0.0% |
| $150,000 to $199,999 | 10 | 20.8% |
| $200,000+ | 0 | 0.0% |
Household Income by Householder Age in Templeton
The median household income in Templeton is $0, with the highest median household income of $98,929 found in the 45 to 64 years age bracket for the primary householder. A total of 32 households (66.7%) fall into this category.
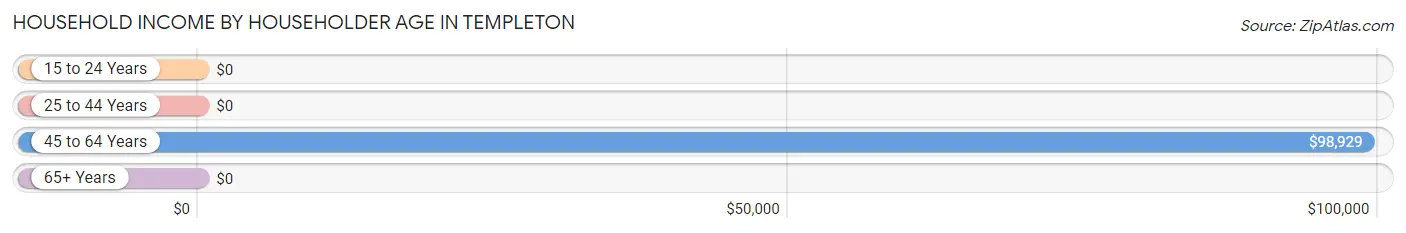
| Income Bracket | # Households | Median Income |
| 15 to 24 Years | 0 (0.0%) | $0 |
| 25 to 44 Years | 0 (0.0%) | $0 |
| 45 to 64 Years | 32 (66.7%) | $98,929 |
| 65+ Years | 16 (33.3%) | $0 |
| Total | 48 (100.0%) | $0 |
Poverty in Templeton
Income Below Poverty by Sex and Age in Templeton
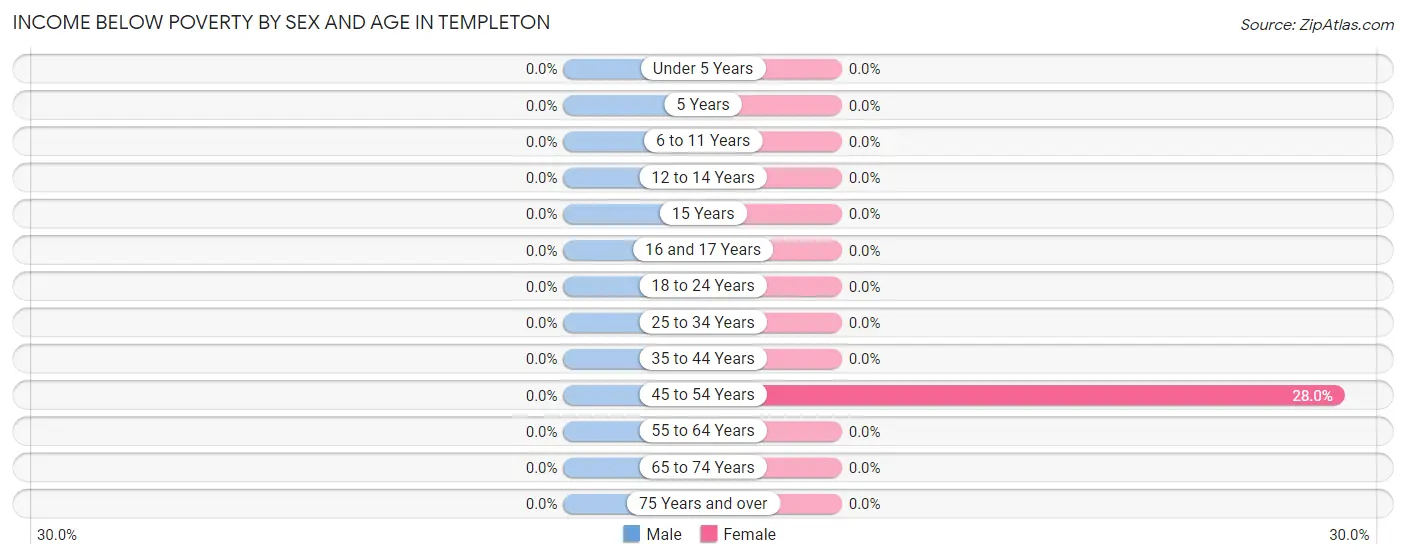
| Age Bracket | Male | Female |
| Under 5 Years | 0 (0.0%) | 0 (0.0%) |
| 5 Years | 0 (0.0%) | 0 (0.0%) |
| 6 to 11 Years | 0 (0.0%) | 0 (0.0%) |
| 12 to 14 Years | 0 (0.0%) | 0 (0.0%) |
| 15 Years | 0 (0.0%) | 0 (0.0%) |
| 16 and 17 Years | 0 (0.0%) | 0 (0.0%) |
| 18 to 24 Years | 0 (0.0%) | 0 (0.0%) |
| 25 to 34 Years | 0 (0.0%) | 0 (0.0%) |
| 35 to 44 Years | 0 (0.0%) | 0 (0.0%) |
| 45 to 54 Years | 0 (0.0%) | 7 (28.0%) |
| 55 to 64 Years | 0 (0.0%) | 0 (0.0%) |
| 65 to 74 Years | 0 (0.0%) | 0 (0.0%) |
| 75 Years and over | 0 (0.0%) | 0 (0.0%) |
| Total | 0 (0.0%) | 7 (9.3%) |
Income Above Poverty by Sex and Age in Templeton
According to the poverty statistics in Templeton, males aged 45 to 54 years and females aged 6 to 11 years are the age groups that are most secure financially, with 100.0% of males and 100.0% of females in these age groups living above the poverty line.
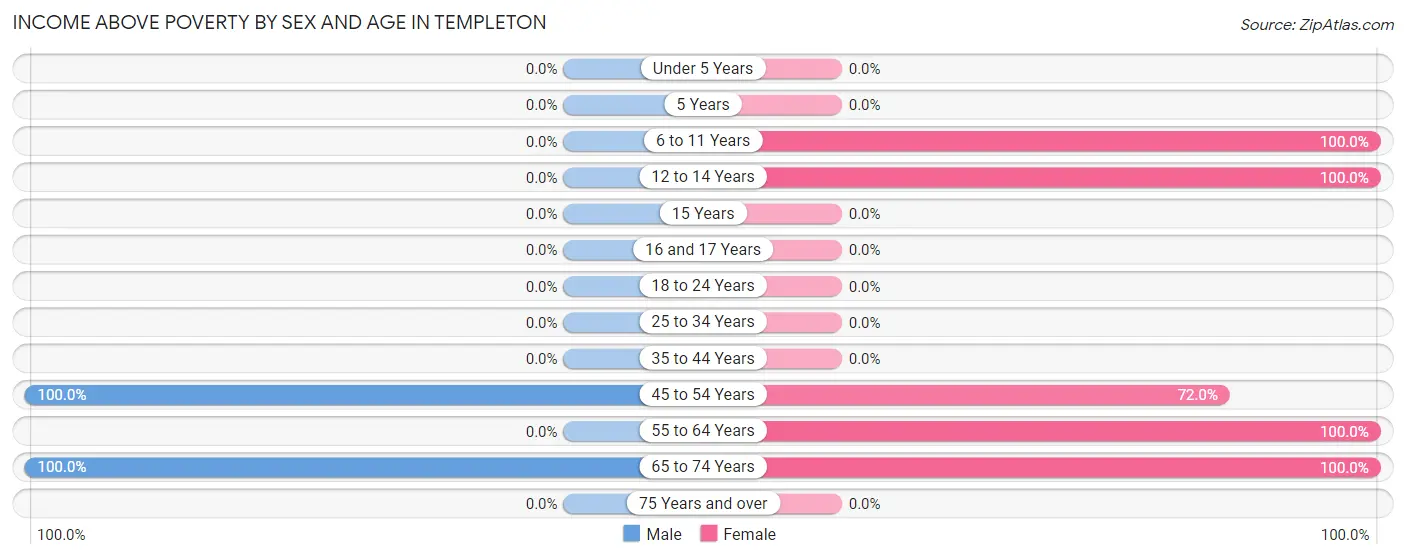
| Age Bracket | Male | Female |
| Under 5 Years | 0 (0.0%) | 0 (0.0%) |
| 5 Years | 0 (0.0%) | 0 (0.0%) |
| 6 to 11 Years | 0 (0.0%) | 10 (100.0%) |
| 12 to 14 Years | 0 (0.0%) | 10 (100.0%) |
| 15 Years | 0 (0.0%) | 0 (0.0%) |
| 16 and 17 Years | 0 (0.0%) | 0 (0.0%) |
| 18 to 24 Years | 0 (0.0%) | 0 (0.0%) |
| 25 to 34 Years | 0 (0.0%) | 0 (0.0%) |
| 35 to 44 Years | 0 (0.0%) | 0 (0.0%) |
| 45 to 54 Years | 17 (100.0%) | 18 (72.0%) |
| 55 to 64 Years | 0 (0.0%) | 14 (100.0%) |
| 65 to 74 Years | 27 (100.0%) | 16 (100.0%) |
| 75 Years and over | 0 (0.0%) | 0 (0.0%) |
| Total | 44 (100.0%) | 68 (90.7%) |
Income Below Poverty Among Married-Couple Families in Templeton
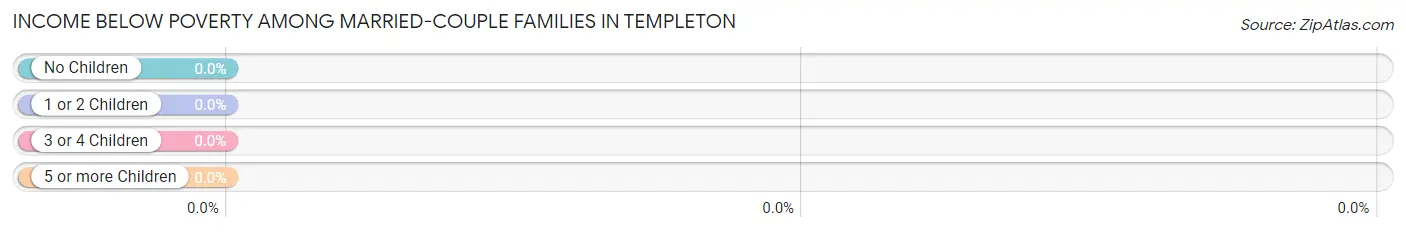
| Children | Above Poverty | Below Poverty |
| No Children | 30 (100.0%) | 0 (0.0%) |
| 1 or 2 Children | 10 (100.0%) | 0 (0.0%) |
| 3 or 4 Children | 0 (0.0%) | 0 (0.0%) |
| 5 or more Children | 0 (0.0%) | 0 (0.0%) |
| Total | 40 (100.0%) | 0 (0.0%) |
Income Below Poverty Among Single-Parent Households in Templeton
| Children | Single Father | Single Mother |
| No Children | 0 (0.0%) | 0 (0.0%) |
| 1 or 2 Children | 0 (0.0%) | 0 (0.0%) |
| 3 or 4 Children | 0 (0.0%) | 0 (0.0%) |
| 5 or more Children | 0 (0.0%) | 0 (0.0%) |
| Total | 0 (0.0%) | 0 (0.0%) |
Income Below Poverty Among Married-Couple vs Single-Parent Households in Templeton
| Children | Married-Couple Families | Single-Parent Households |
| No Children | 0 (0.0%) | 0 (0.0%) |
| 1 or 2 Children | 0 (0.0%) | 0 (0.0%) |
| 3 or 4 Children | 0 (0.0%) | 0 (0.0%) |
| 5 or more Children | 0 (0.0%) | 0 (0.0%) |
| Total | 0 (0.0%) | 0 (0.0%) |
Race in Templeton
The most populous races in Templeton are White / Caucasian (93 | 78.1%), and Black / African American (26 | 21.8%).
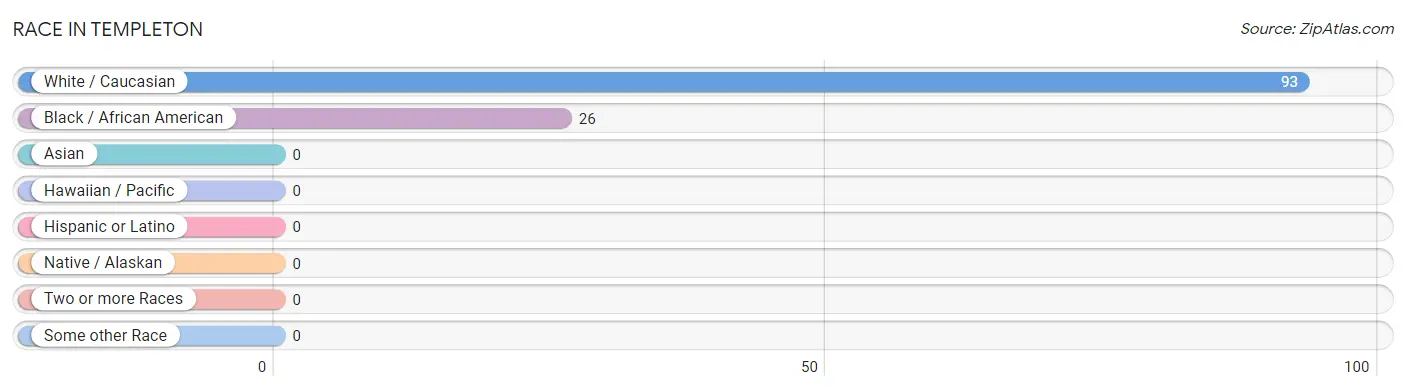
| Race | # Population | % Population |
| Asian | 0 | 0.0% |
| Black / African American | 26 | 21.8% |
| Hawaiian / Pacific | 0 | 0.0% |
| Hispanic or Latino | 0 | 0.0% |
| Native / Alaskan | 0 | 0.0% |
| White / Caucasian | 93 | 78.1% |
| Two or more Races | 0 | 0.0% |
| Some other Race | 0 | 0.0% |
| Total | 119 | 100.0% |
Ancestry in Templeton
The most populous ancestries reported in Templeton are English (68 | 57.1%), Italian (16 | 13.5%), Irish (15 | 12.6%), American (14 | 11.8%), and Polish (10 | 8.4%), together accounting for 103.4% of all Templeton residents.
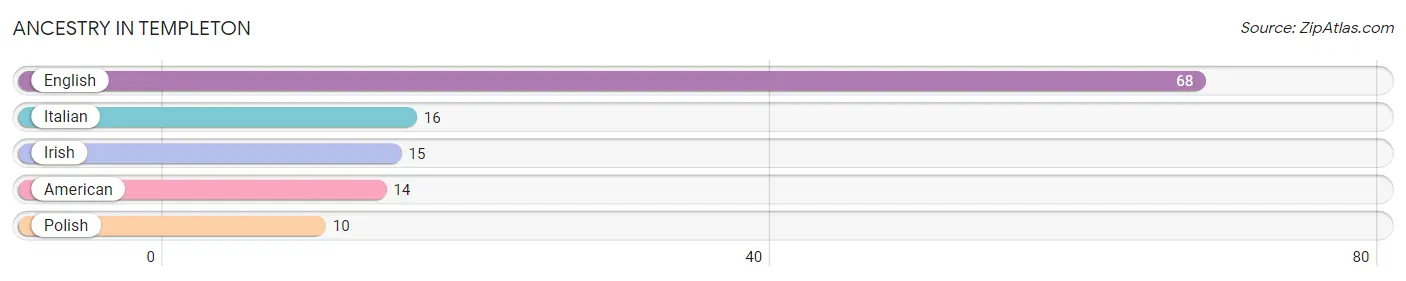
| Ancestry | # Population | % Population |
| American | 14 | 11.8% |
| English | 68 | 57.1% |
| Irish | 15 | 12.6% |
| Italian | 16 | 13.5% |
| Polish | 10 | 8.4% | View All 5 Rows |
Immigrants in Templeton

| Immigration Origin | # Population | % Population | View All 0 Rows |
Sex and Age in Templeton
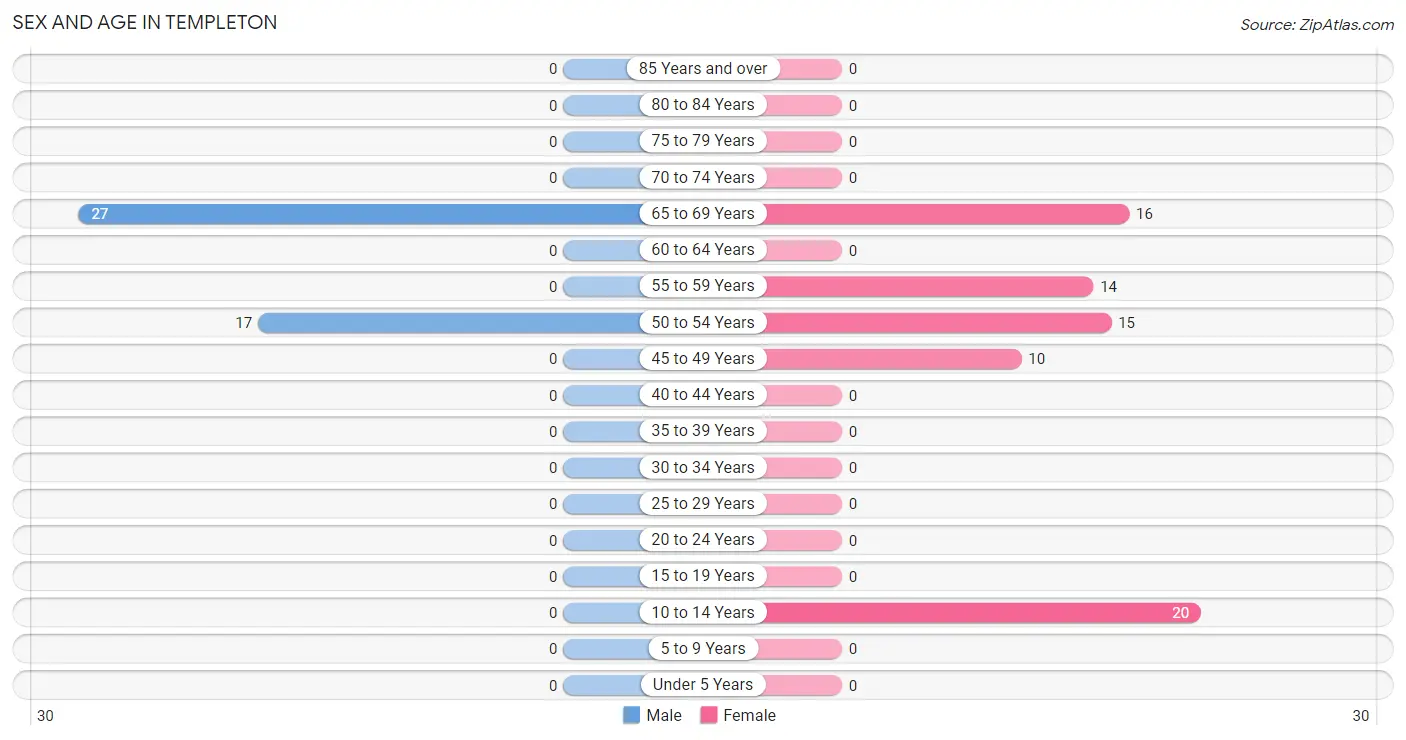
Sex and Age in Templeton
The most populous age groups in Templeton are 65 to 69 Years (27 | 61.4%) for men and 10 to 14 Years (20 | 26.7%) for women.
| Age Bracket | Male | Female |
| Under 5 Years | 0 (0.0%) | 0 (0.0%) |
| 5 to 9 Years | 0 (0.0%) | 0 (0.0%) |
| 10 to 14 Years | 0 (0.0%) | 20 (26.7%) |
| 15 to 19 Years | 0 (0.0%) | 0 (0.0%) |
| 20 to 24 Years | 0 (0.0%) | 0 (0.0%) |
| 25 to 29 Years | 0 (0.0%) | 0 (0.0%) |
| 30 to 34 Years | 0 (0.0%) | 0 (0.0%) |
| 35 to 39 Years | 0 (0.0%) | 0 (0.0%) |
| 40 to 44 Years | 0 (0.0%) | 0 (0.0%) |
| 45 to 49 Years | 0 (0.0%) | 10 (13.3%) |
| 50 to 54 Years | 17 (38.6%) | 15 (20.0%) |
| 55 to 59 Years | 0 (0.0%) | 14 (18.7%) |
| 60 to 64 Years | 0 (0.0%) | 0 (0.0%) |
| 65 to 69 Years | 27 (61.4%) | 16 (21.3%) |
| 70 to 74 Years | 0 (0.0%) | 0 (0.0%) |
| 75 to 79 Years | 0 (0.0%) | 0 (0.0%) |
| 80 to 84 Years | 0 (0.0%) | 0 (0.0%) |
| 85 Years and over | 0 (0.0%) | 0 (0.0%) |
| Total | 44 (100.0%) | 75 (100.0%) |
Families and Households in Templeton
Median Family Size in Templeton
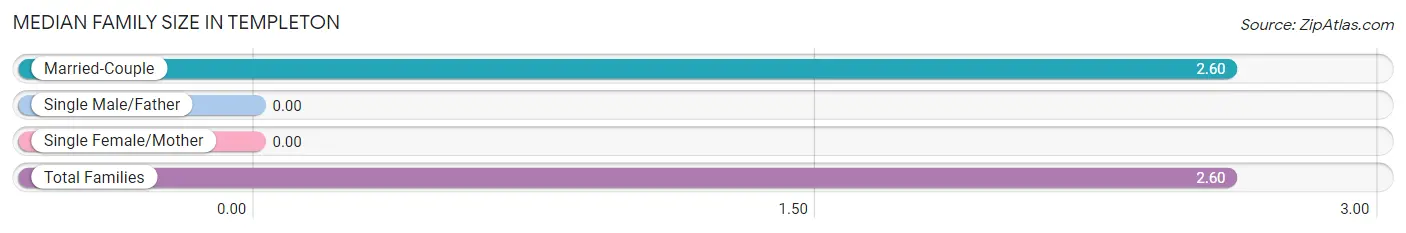
| Family Type | # Families | Family Size |
| Married-Couple | 40 (100.0%) | 2.60 |
| Single Male/Father | 0 (0.0%) | - |
| Single Female/Mother | 0 (0.0%) | - |
| Total Families | 40 (100.0%) | 2.60 |
Median Household Size in Templeton
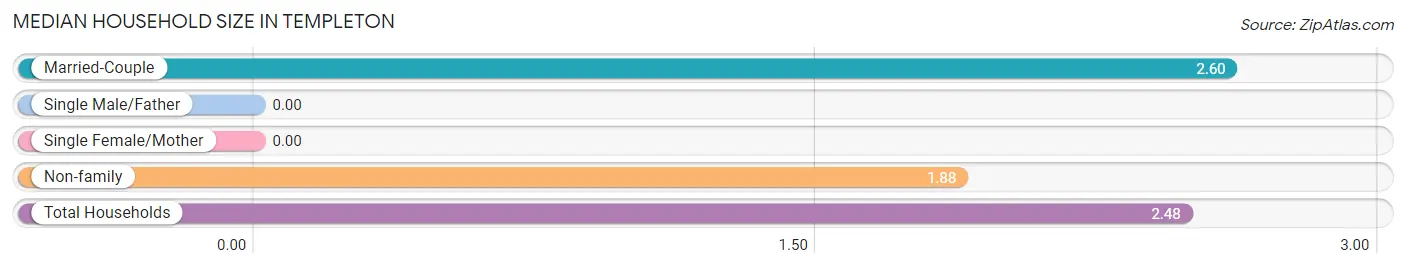
| Household Type | # Households | Household Size |
| Married-Couple | 40 (83.3%) | 2.60 |
| Single Male/Father | 0 (0.0%) | - |
| Single Female/Mother | 0 (0.0%) | - |
| Non-family | 8 (16.7%) | 1.88 |
| Total Households | 48 (100.0%) | 2.48 |
Household Size by Marriage Status in Templeton
Out of a total of 48 households in Templeton, 40 (83.3%) are family households, while 8 (16.7%) are nonfamily households. The most numerous type of family households are 2-person households, comprising 30, and the most common type of nonfamily households are 2-person households, comprising 8.
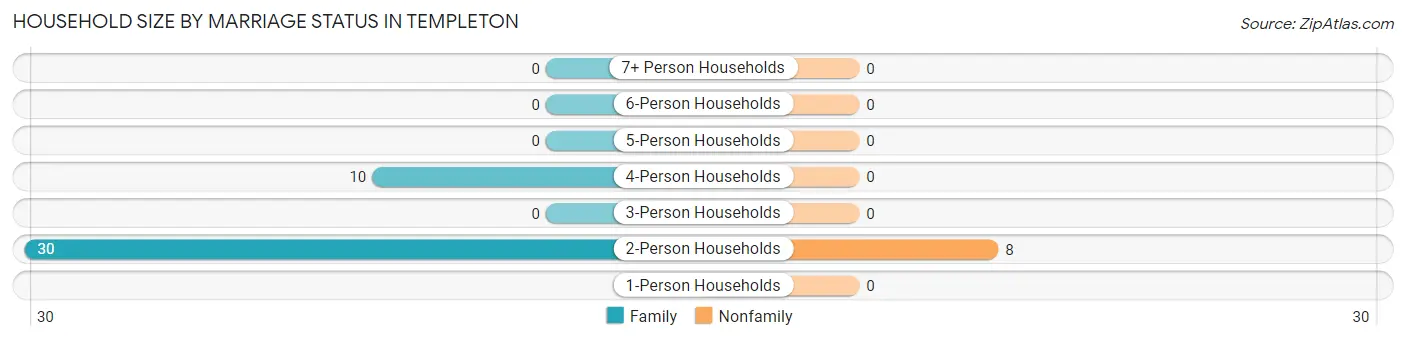
| Household Size | Family Households | Nonfamily Households |
| 1-Person Households | - | 0 (0.0%) |
| 2-Person Households | 30 (62.5%) | 8 (16.7%) |
| 3-Person Households | 0 (0.0%) | 0 (0.0%) |
| 4-Person Households | 10 (20.8%) | 0 (0.0%) |
| 5-Person Households | 0 (0.0%) | 0 (0.0%) |
| 6-Person Households | 0 (0.0%) | 0 (0.0%) |
| 7+ Person Households | 0 (0.0%) | 0 (0.0%) |
| Total | 40 (83.3%) | 8 (16.7%) |
Female Fertility in Templeton
Fertility by Age in Templeton
| Age Bracket | Women with Births | Births / 1,000 Women |
| 15 to 19 years | 0 (0.0%) | 0.0 |
| 20 to 34 years | 0 (0.0%) | 0.0 |
| 35 to 50 years | 0 (0.0%) | 0.0 |
| Total | 0 (0.0%) | 0.0 |
Fertility by Age by Marriage Status in Templeton
| Age Bracket | Married | Unmarried |
| 15 to 19 years | 0 (0.0%) | 0 (0.0%) |
| 20 to 34 years | 0 (0.0%) | 0 (0.0%) |
| 35 to 50 years | 0 (0.0%) | 0 (0.0%) |
| Total | 0 (0.0%) | 0 (0.0%) |
Fertility by Education in Templeton
| Educational Attainment | Women with Births | Births / 1,000 Women |
| Less than High School | 0 (0.0%) | 0.0 |
| High School Diploma | 0 (0.0%) | 0.0 |
| College or Associate's Degree | 0 (0.0%) | 0.0 |
| Bachelor's Degree | 0 (0.0%) | 0.0 |
| Graduate Degree | 0 (0.0%) | 0.0 |
| Total | 0 (0.0%) | 0.0 |
Fertility by Education by Marriage Status in Templeton
| Educational Attainment | Married | Unmarried |
| Less than High School | 0 (0.0%) | 0 (0.0%) |
| High School Diploma | 0 (0.0%) | 0 (0.0%) |
| College or Associate's Degree | 0 (0.0%) | 0 (0.0%) |
| Bachelor's Degree | 0 (0.0%) | 0 (0.0%) |
| Graduate Degree | 0 (0.0%) | 0 (0.0%) |
| Total | 0 (0.0%) | 0 (0.0%) |
Employment Characteristics in Templeton
Employment by Class of Employer in Templeton
Among the 61 employed individuals in Templeton, local government employees (31 | 50.8%), state government employees (12 | 19.7%), and federal government employees (10 | 16.4%) make up the most common classes of employment.
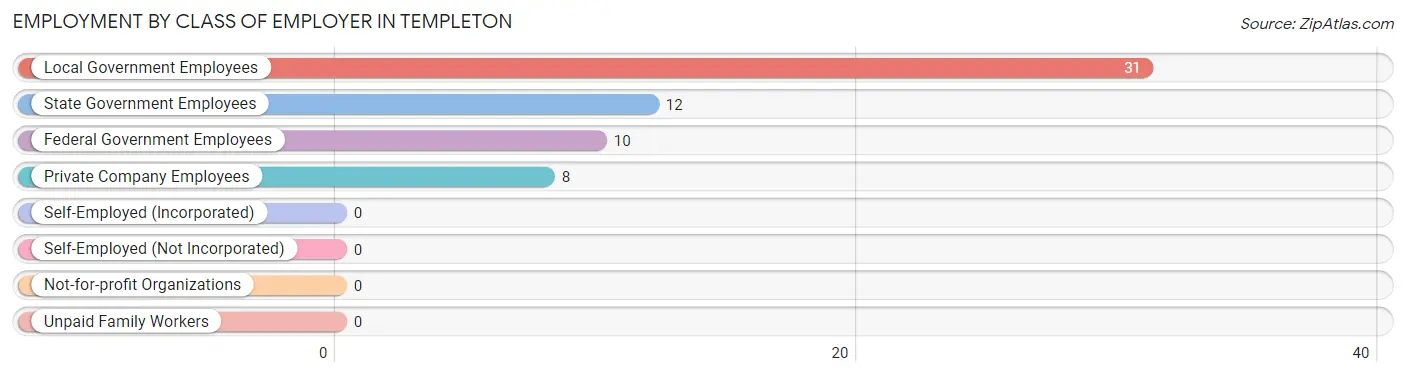
| Employer Class | # Employees | % Employees |
| Private Company Employees | 8 | 13.1% |
| Self-Employed (Incorporated) | 0 | 0.0% |
| Self-Employed (Not Incorporated) | 0 | 0.0% |
| Not-for-profit Organizations | 0 | 0.0% |
| Local Government Employees | 31 | 50.8% |
| State Government Employees | 12 | 19.7% |
| Federal Government Employees | 10 | 16.4% |
| Unpaid Family Workers | 0 | 0.0% |
| Total | 61 | 100.0% |
Employment Status by Age in Templeton
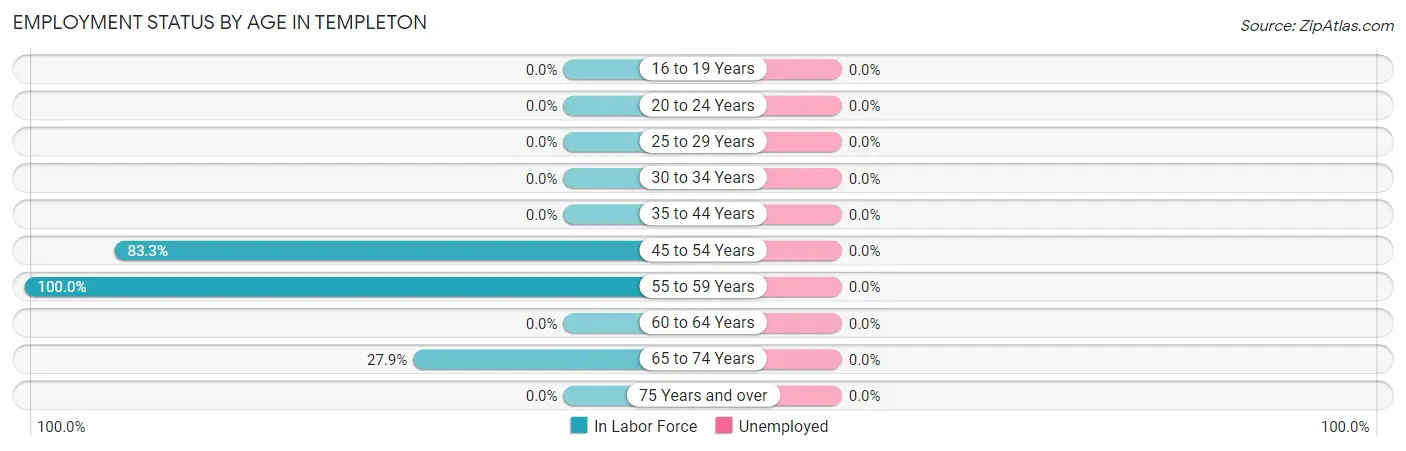
| Age Bracket | In Labor Force | Unemployed |
| 16 to 19 Years | 0 (0.0%) | 0 (0.0%) |
| 20 to 24 Years | 0 (0.0%) | 0 (0.0%) |
| 25 to 29 Years | 0 (0.0%) | 0 (0.0%) |
| 30 to 34 Years | 0 (0.0%) | 0 (0.0%) |
| 35 to 44 Years | 0 (0.0%) | 0 (0.0%) |
| 45 to 54 Years | 35 (83.3%) | 0 (0.0%) |
| 55 to 59 Years | 14 (100.0%) | 0 (0.0%) |
| 60 to 64 Years | 0 (0.0%) | 0 (0.0%) |
| 65 to 74 Years | 12 (27.9%) | 0 (0.0%) |
| 75 Years and over | 0 (0.0%) | 0 (0.0%) |
| Total | 61 (61.6%) | 0 (0.0%) |
Employment Status by Educational Attainment in Templeton
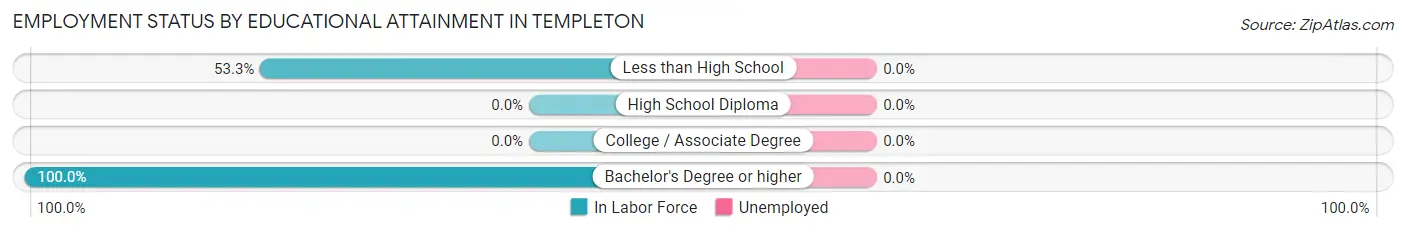
| Educational Attainment | In Labor Force | Unemployed |
| Less than High School | 8 (53.3%) | 0 (0.0%) |
| High School Diploma | 0 (0.0%) | 0 (0.0%) |
| College / Associate Degree | 0 (0.0%) | 0 (0.0%) |
| Bachelor's Degree or higher | 41 (100.0%) | 0 (0.0%) |
| Total | 49 (87.5%) | 0 (0.0%) |
Employment Occupations by Sex in Templeton
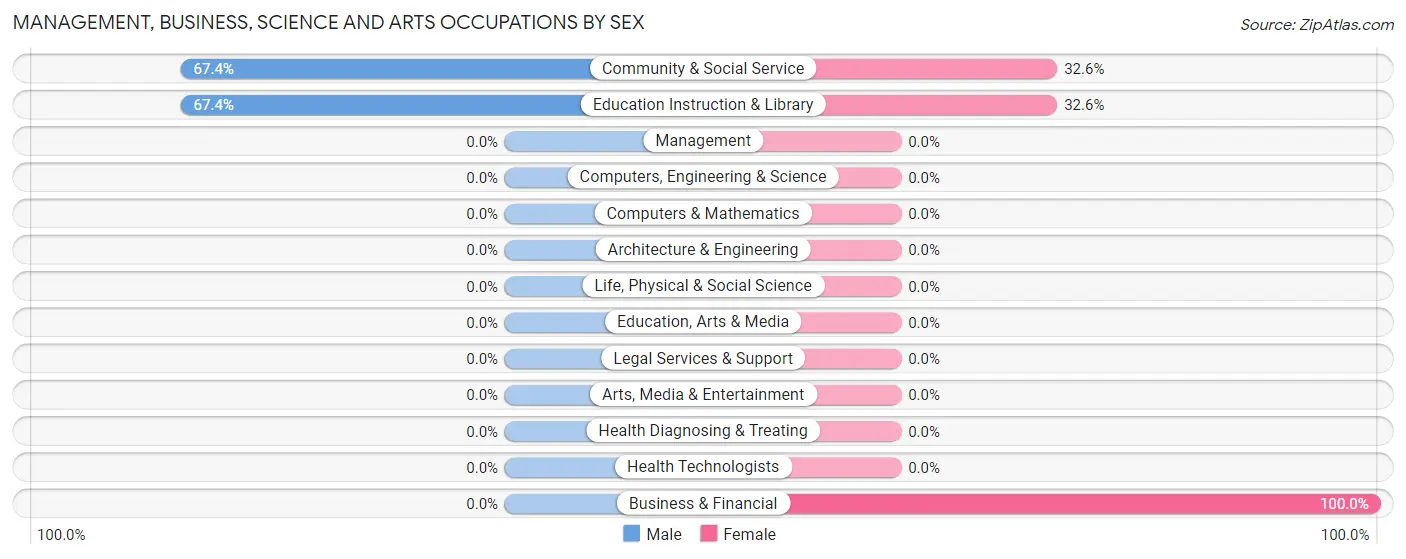
Management, Business, Science and Arts Occupations
The most common Management, Business, Science and Arts occupations in Templeton are Community & Social Service (43 | 70.5%), Education Instruction & Library (43 | 70.5%), and Business & Financial (10 | 16.4%).
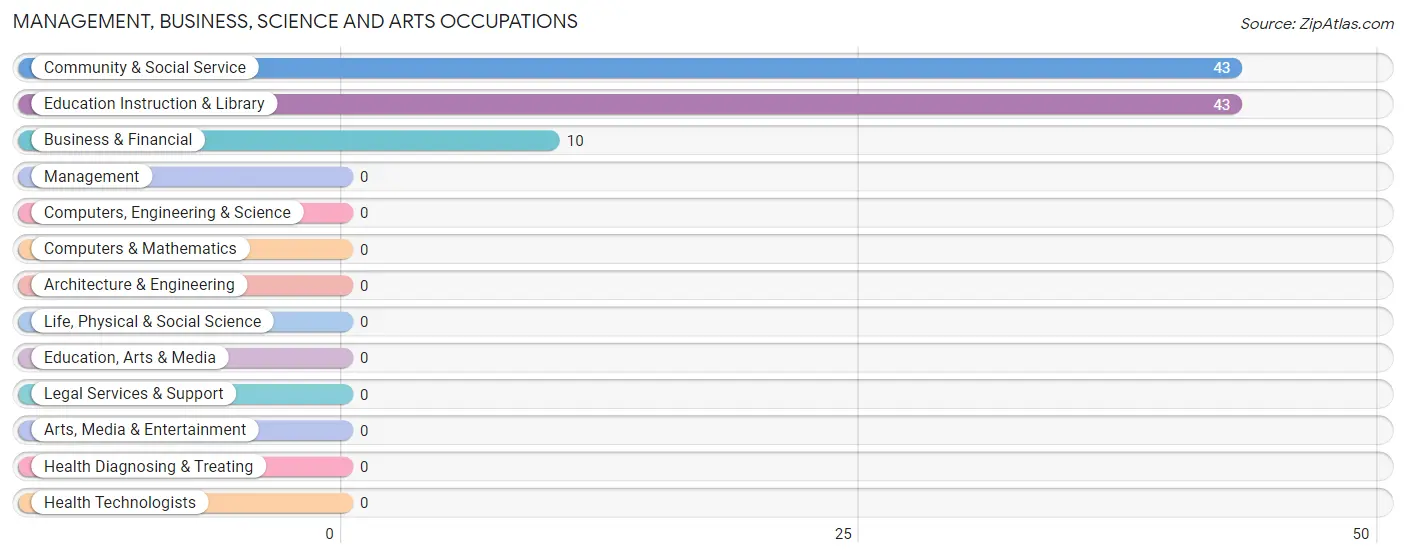
Management, Business, Science and Arts Occupations by Sex
Within the Management, Business, Science and Arts occupations in Templeton, the most male-oriented occupations are Community & Social Service (67.4%), and Education Instruction & Library (67.4%), while the most female-oriented occupations are Business & Financial (100.0%), Community & Social Service (32.6%), and Education Instruction & Library (32.6%).
| Occupation | Male | Female |
| Management | 0 (0.0%) | 0 (0.0%) |
| Business & Financial | 0 (0.0%) | 10 (100.0%) |
| Computers, Engineering & Science | 0 (0.0%) | 0 (0.0%) |
| Computers & Mathematics | 0 (0.0%) | 0 (0.0%) |
| Architecture & Engineering | 0 (0.0%) | 0 (0.0%) |
| Life, Physical & Social Science | 0 (0.0%) | 0 (0.0%) |
| Community & Social Service | 29 (67.4%) | 14 (32.6%) |
| Education, Arts & Media | 0 (0.0%) | 0 (0.0%) |
| Legal Services & Support | 0 (0.0%) | 0 (0.0%) |
| Education Instruction & Library | 29 (67.4%) | 14 (32.6%) |
| Arts, Media & Entertainment | 0 (0.0%) | 0 (0.0%) |
| Health Diagnosing & Treating | 0 (0.0%) | 0 (0.0%) |
| Health Technologists | 0 (0.0%) | 0 (0.0%) |
| Total (Category) | 29 (54.7%) | 24 (45.3%) |
| Total (Overall) | 29 (47.5%) | 32 (52.5%) |
Services Occupations
Services Occupations by Sex
| Occupation | Male | Female |
| Healthcare Support | 0 (0.0%) | 0 (0.0%) |
| Security & Protection | 0 (0.0%) | 0 (0.0%) |
| Firefighting & Prevention | 0 (0.0%) | 0 (0.0%) |
| Law Enforcement | 0 (0.0%) | 0 (0.0%) |
| Food Preparation & Serving | 0 (0.0%) | 0 (0.0%) |
| Cleaning & Maintenance | 0 (0.0%) | 0 (0.0%) |
| Personal Care & Service | 0 (0.0%) | 0 (0.0%) |
| Total (Category) | 0 (0.0%) | 0 (0.0%) |
| Total (Overall) | 29 (47.5%) | 32 (52.5%) |
Sales and Office Occupations
Sales and Office Occupations by Sex
| Occupation | Male | Female |
| Sales & Related | 0 (0.0%) | 0 (0.0%) |
| Office & Administration | 0 (0.0%) | 0 (0.0%) |
| Total (Category) | 0 (0.0%) | 0 (0.0%) |
| Total (Overall) | 29 (47.5%) | 32 (52.5%) |
Natural Resources, Construction and Maintenance Occupations
Natural Resources, Construction and Maintenance Occupations by Sex
| Occupation | Male | Female |
| Farming, Fishing & Forestry | 0 (0.0%) | 0 (0.0%) |
| Construction & Extraction | 0 (0.0%) | 0 (0.0%) |
| Installation, Maintenance & Repair | 0 (0.0%) | 0 (0.0%) |
| Total (Category) | 0 (0.0%) | 0 (0.0%) |
| Total (Overall) | 29 (47.5%) | 32 (52.5%) |
Production, Transportation and Moving Occupations
The most common Production, Transportation and Moving occupations in Templeton are , and Material Moving (8 | 13.1%).
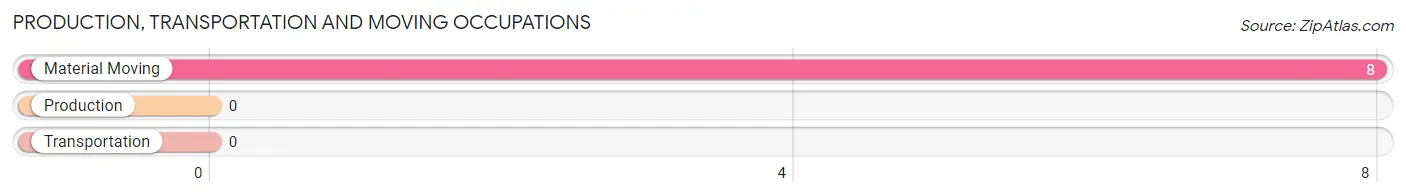
Production, Transportation and Moving Occupations by Sex
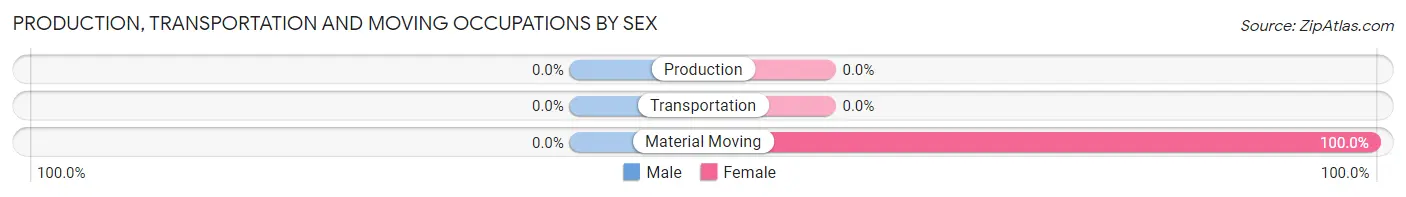
| Occupation | Male | Female |
| Production | 0 (0.0%) | 0 (0.0%) |
| Transportation | 0 (0.0%) | 0 (0.0%) |
| Material Moving | 0 (0.0%) | 8 (100.0%) |
| Total (Category) | 0 (0.0%) | 8 (100.0%) |
| Total (Overall) | 29 (47.5%) | 32 (52.5%) |
Employment Industries by Sex in Templeton
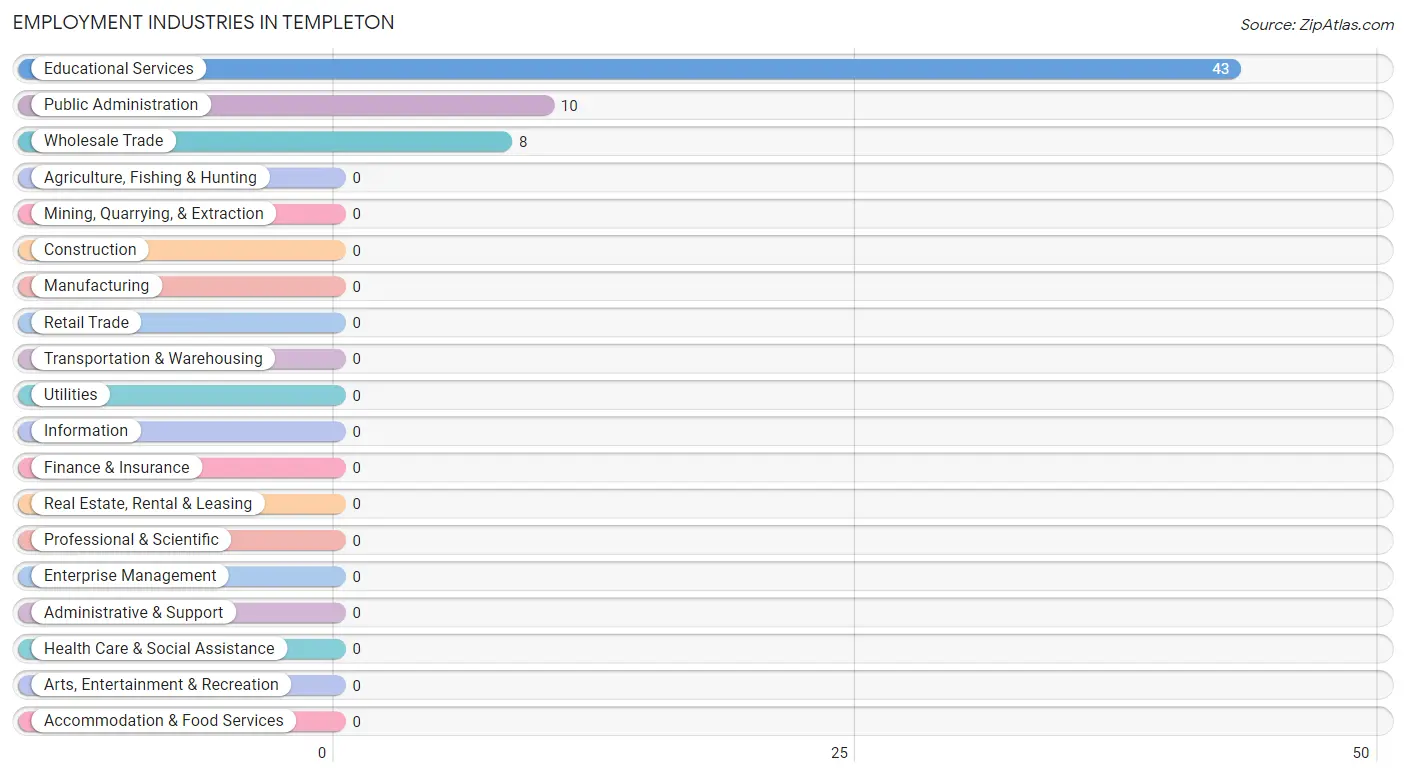
Employment Industries in Templeton
The major employment industries in Templeton include Educational Services (43 | 70.5%), Public Administration (10 | 16.4%), and Wholesale Trade (8 | 13.1%).
Employment Industries by Sex in Templeton
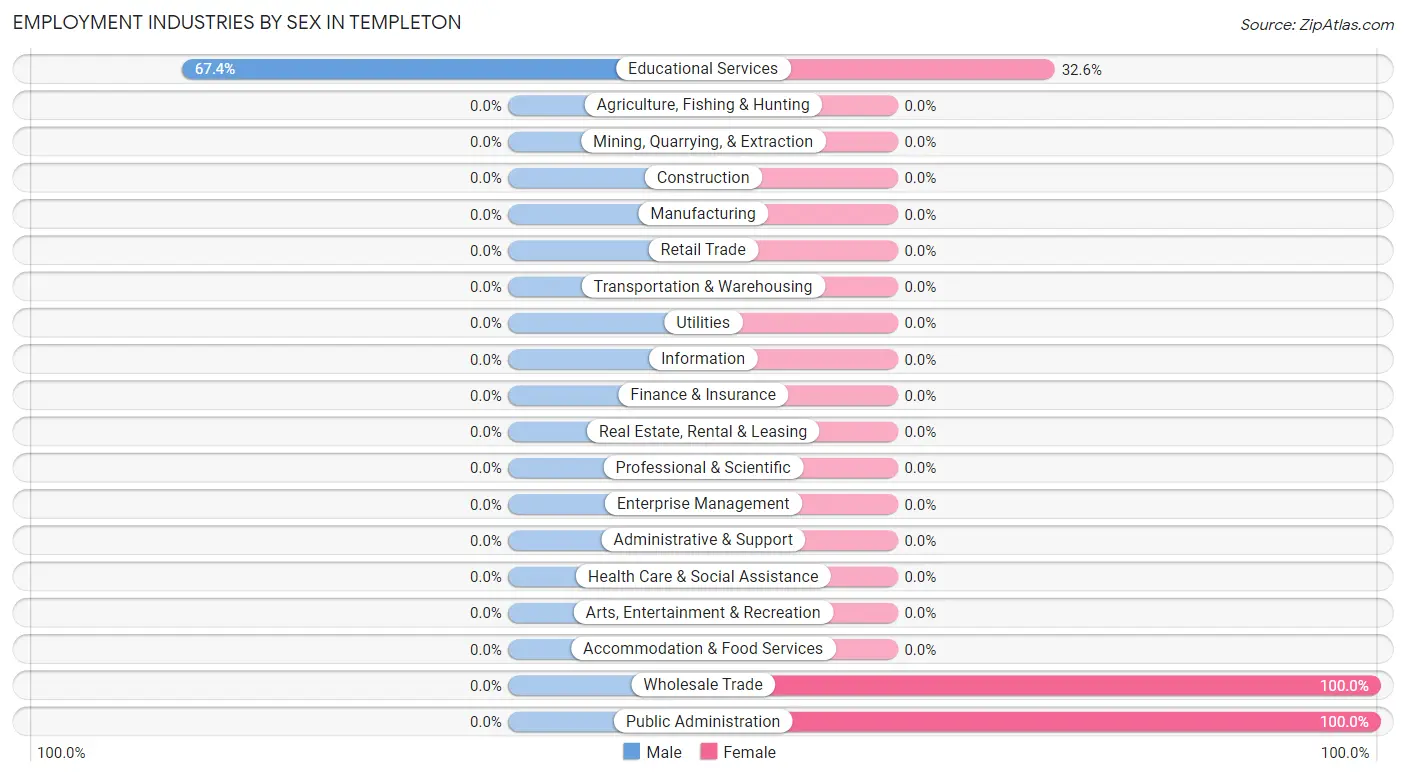
| Industry | Male | Female |
| Agriculture, Fishing & Hunting | 0 (0.0%) | 0 (0.0%) |
| Mining, Quarrying, & Extraction | 0 (0.0%) | 0 (0.0%) |
| Construction | 0 (0.0%) | 0 (0.0%) |
| Manufacturing | 0 (0.0%) | 0 (0.0%) |
| Wholesale Trade | 0 (0.0%) | 8 (100.0%) |
| Retail Trade | 0 (0.0%) | 0 (0.0%) |
| Transportation & Warehousing | 0 (0.0%) | 0 (0.0%) |
| Utilities | 0 (0.0%) | 0 (0.0%) |
| Information | 0 (0.0%) | 0 (0.0%) |
| Finance & Insurance | 0 (0.0%) | 0 (0.0%) |
| Real Estate, Rental & Leasing | 0 (0.0%) | 0 (0.0%) |
| Professional & Scientific | 0 (0.0%) | 0 (0.0%) |
| Enterprise Management | 0 (0.0%) | 0 (0.0%) |
| Administrative & Support | 0 (0.0%) | 0 (0.0%) |
| Educational Services | 29 (67.4%) | 14 (32.6%) |
| Health Care & Social Assistance | 0 (0.0%) | 0 (0.0%) |
| Arts, Entertainment & Recreation | 0 (0.0%) | 0 (0.0%) |
| Accommodation & Food Services | 0 (0.0%) | 0 (0.0%) |
| Public Administration | 0 (0.0%) | 10 (100.0%) |
| Total | 29 (47.5%) | 32 (52.5%) |
Education in Templeton
School Enrollment in Templeton
The most common levels of schooling among the 20 students in Templeton are middle school (10 | 50.0%), and high school (10 | 50.0%).
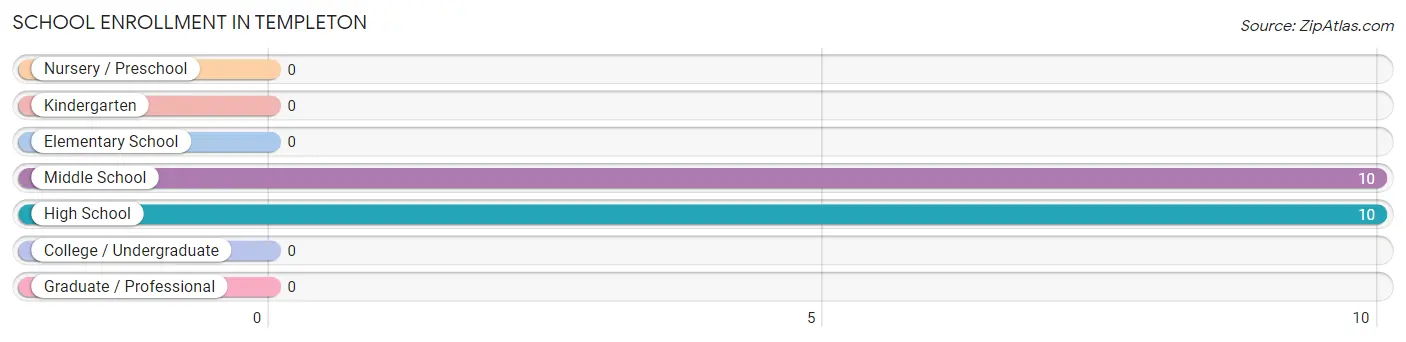
| School Level | # Students | % Students |
| Nursery / Preschool | 0 | 0.0% |
| Kindergarten | 0 | 0.0% |
| Elementary School | 0 | 0.0% |
| Middle School | 10 | 50.0% |
| High School | 10 | 50.0% |
| College / Undergraduate | 0 | 0.0% |
| Graduate / Professional | 0 | 0.0% |
| Total | 20 | 100.0% |
School Enrollment by Age by Funding Source in Templeton
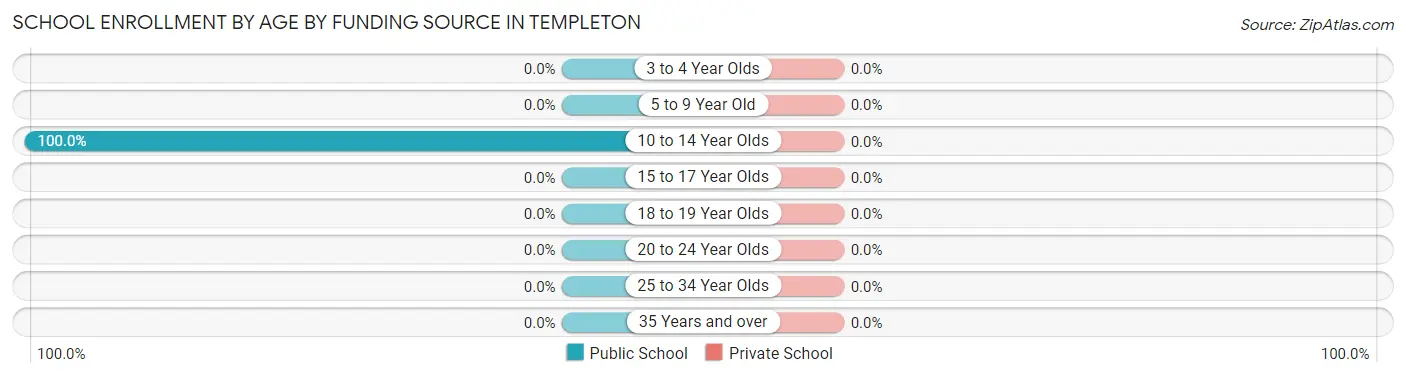
| Age Bracket | Public School | Private School |
| 3 to 4 Year Olds | 0 (0.0%) | 0 (0.0%) |
| 5 to 9 Year Old | 0 (0.0%) | 0 (0.0%) |
| 10 to 14 Year Olds | 20 (100.0%) | 0 (0.0%) |
| 15 to 17 Year Olds | 0 (0.0%) | 0 (0.0%) |
| 18 to 19 Year Olds | 0 (0.0%) | 0 (0.0%) |
| 20 to 24 Year Olds | 0 (0.0%) | 0 (0.0%) |
| 25 to 34 Year Olds | 0 (0.0%) | 0 (0.0%) |
| 35 Years and over | 0 (0.0%) | 0 (0.0%) |
| Total | 20 (100.0%) | 0 (0.0%) |
Educational Attainment by Field of Study in Templeton
Visual & performing arts (26 | 23.2%), education (17 | 15.2%), psychology (16 | 14.3%), social sciences (16 | 14.3%), and liberal arts & history (15 | 13.4%) are the most common fields of study among 112 individuals in Templeton who have obtained a bachelor's degree or higher.
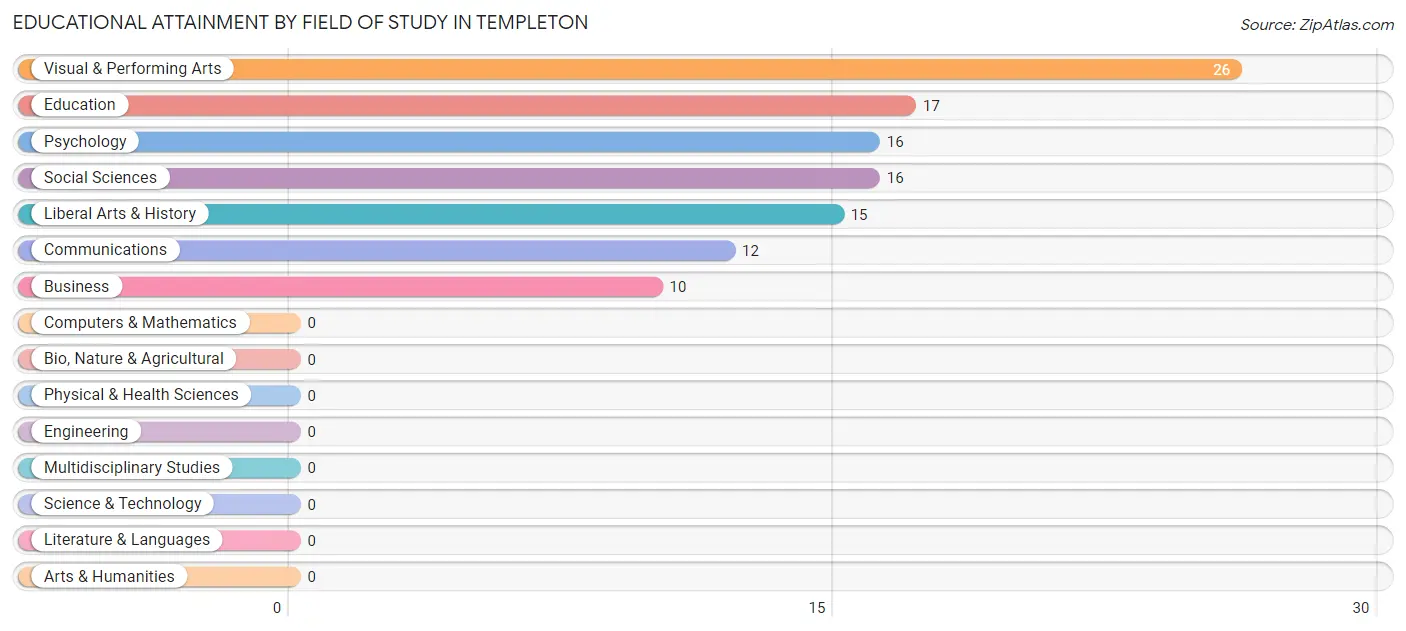
| Field of Study | # Graduates | % Graduates |
| Computers & Mathematics | 0 | 0.0% |
| Bio, Nature & Agricultural | 0 | 0.0% |
| Physical & Health Sciences | 0 | 0.0% |
| Psychology | 16 | 14.3% |
| Social Sciences | 16 | 14.3% |
| Engineering | 0 | 0.0% |
| Multidisciplinary Studies | 0 | 0.0% |
| Science & Technology | 0 | 0.0% |
| Business | 10 | 8.9% |
| Education | 17 | 15.2% |
| Literature & Languages | 0 | 0.0% |
| Liberal Arts & History | 15 | 13.4% |
| Visual & Performing Arts | 26 | 23.2% |
| Communications | 12 | 10.7% |
| Arts & Humanities | 0 | 0.0% |
| Total | 112 | 100.0% |
Transportation & Commute in Templeton
Vehicle Availability by Sex in Templeton
The most prevalent vehicle ownership categories in Templeton are males with 3 vehicles (17, accounting for 58.6%) and females with 3 vehicles (10, making up 53.1%).
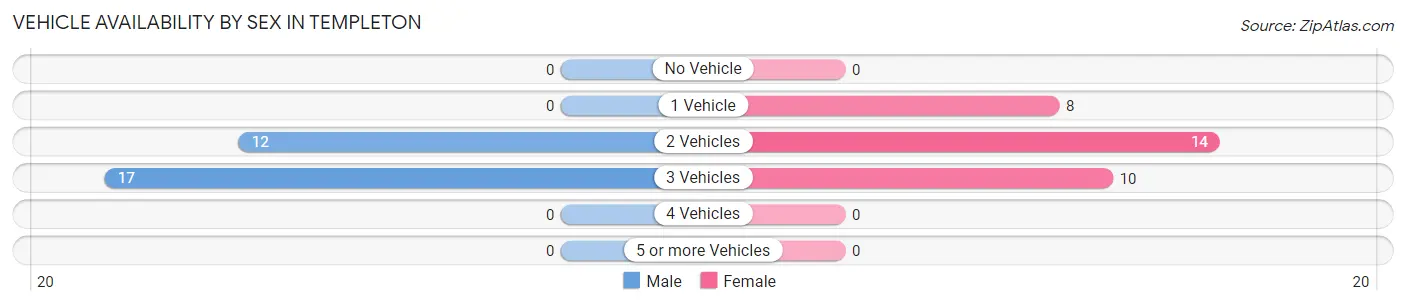
| Vehicles Available | Male | Female |
| No Vehicle | 0 (0.0%) | 0 (0.0%) |
| 1 Vehicle | 0 (0.0%) | 8 (25.0%) |
| 2 Vehicles | 12 (41.4%) | 14 (43.8%) |
| 3 Vehicles | 17 (58.6%) | 10 (31.2%) |
| 4 Vehicles | 0 (0.0%) | 0 (0.0%) |
| 5 or more Vehicles | 0 (0.0%) | 0 (0.0%) |
| Total | 29 (100.0%) | 32 (100.0%) |
Commute Time in Templeton
The most frequently occuring commute durations in Templeton are 15 to 19 minutes (22 commuters, 43.1%), 20 to 24 minutes (17 commuters, 33.3%), and 10 to 14 minutes (12 commuters, 23.5%).
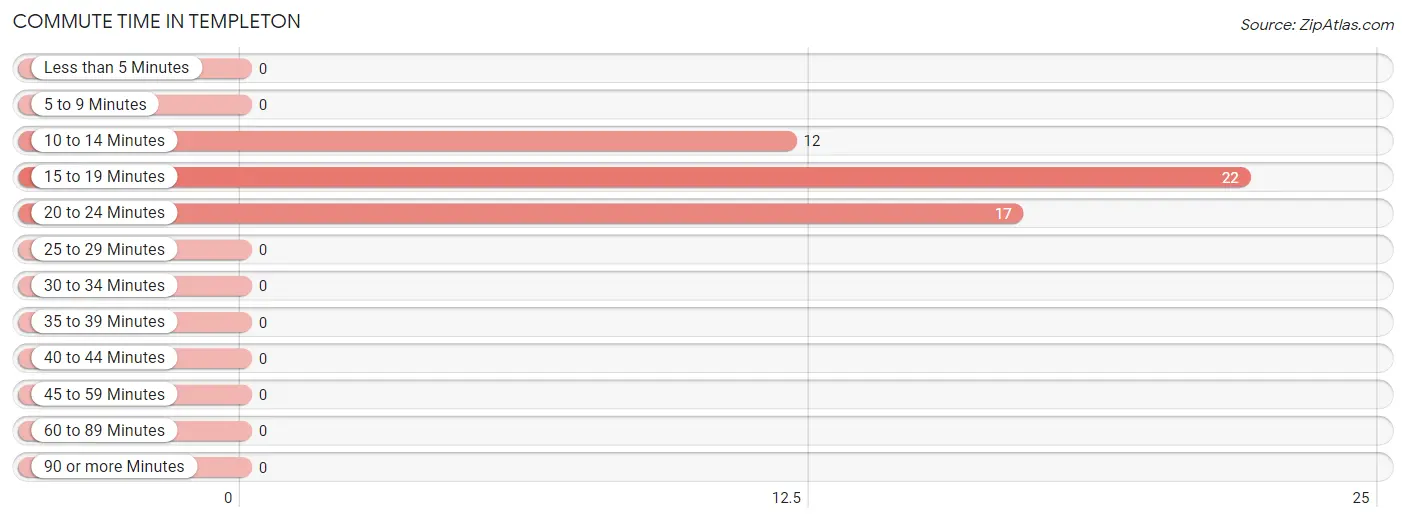
| Commute Time | # Commuters | % Commuters |
| Less than 5 Minutes | 0 | 0.0% |
| 5 to 9 Minutes | 0 | 0.0% |
| 10 to 14 Minutes | 12 | 23.5% |
| 15 to 19 Minutes | 22 | 43.1% |
| 20 to 24 Minutes | 17 | 33.3% |
| 25 to 29 Minutes | 0 | 0.0% |
| 30 to 34 Minutes | 0 | 0.0% |
| 35 to 39 Minutes | 0 | 0.0% |
| 40 to 44 Minutes | 0 | 0.0% |
| 45 to 59 Minutes | 0 | 0.0% |
| 60 to 89 Minutes | 0 | 0.0% |
| 90 or more Minutes | 0 | 0.0% |
Commute Time by Sex in Templeton
The most common commute times in Templeton are 20 to 24 minutes (17 commuters, 58.6%) for males and 15 to 19 minutes (22 commuters, 100.0%) for females.
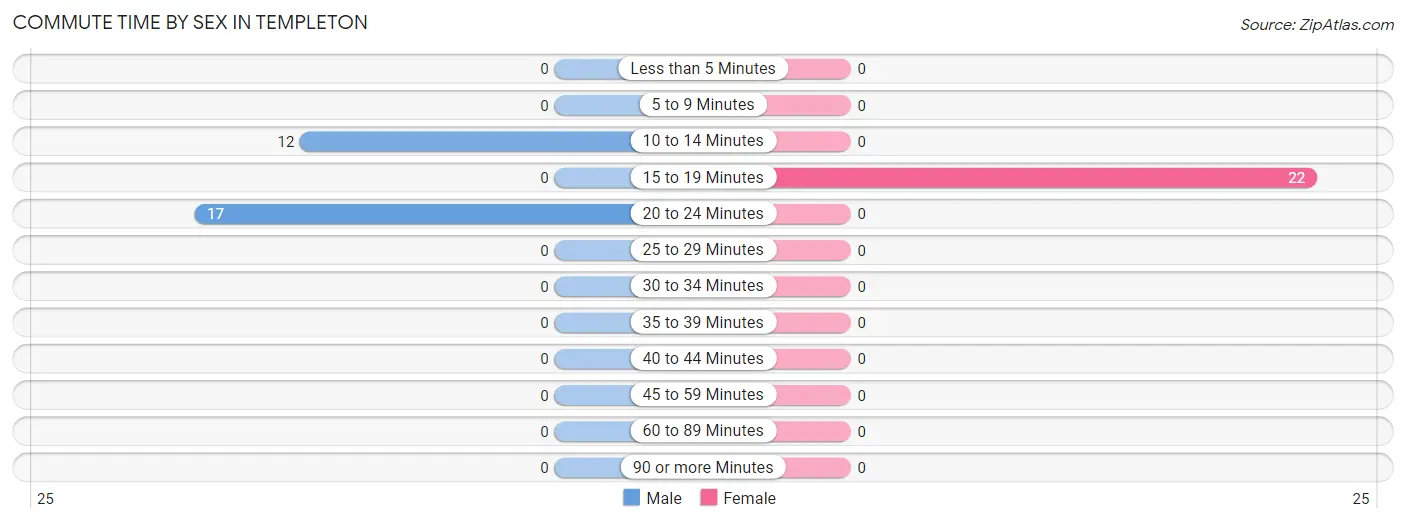
| Commute Time | Male | Female |
| Less than 5 Minutes | 0 (0.0%) | 0 (0.0%) |
| 5 to 9 Minutes | 0 (0.0%) | 0 (0.0%) |
| 10 to 14 Minutes | 12 (41.4%) | 0 (0.0%) |
| 15 to 19 Minutes | 0 (0.0%) | 22 (100.0%) |
| 20 to 24 Minutes | 17 (58.6%) | 0 (0.0%) |
| 25 to 29 Minutes | 0 (0.0%) | 0 (0.0%) |
| 30 to 34 Minutes | 0 (0.0%) | 0 (0.0%) |
| 35 to 39 Minutes | 0 (0.0%) | 0 (0.0%) |
| 40 to 44 Minutes | 0 (0.0%) | 0 (0.0%) |
| 45 to 59 Minutes | 0 (0.0%) | 0 (0.0%) |
| 60 to 89 Minutes | 0 (0.0%) | 0 (0.0%) |
| 90 or more Minutes | 0 (0.0%) | 0 (0.0%) |
Time of Departure to Work by Sex in Templeton
The most frequent times of departure to work in Templeton are 7:00 AM to 7:29 AM (17, 58.6%) for males and 8:00 AM to 8:29 AM (14, 63.6%) for females.
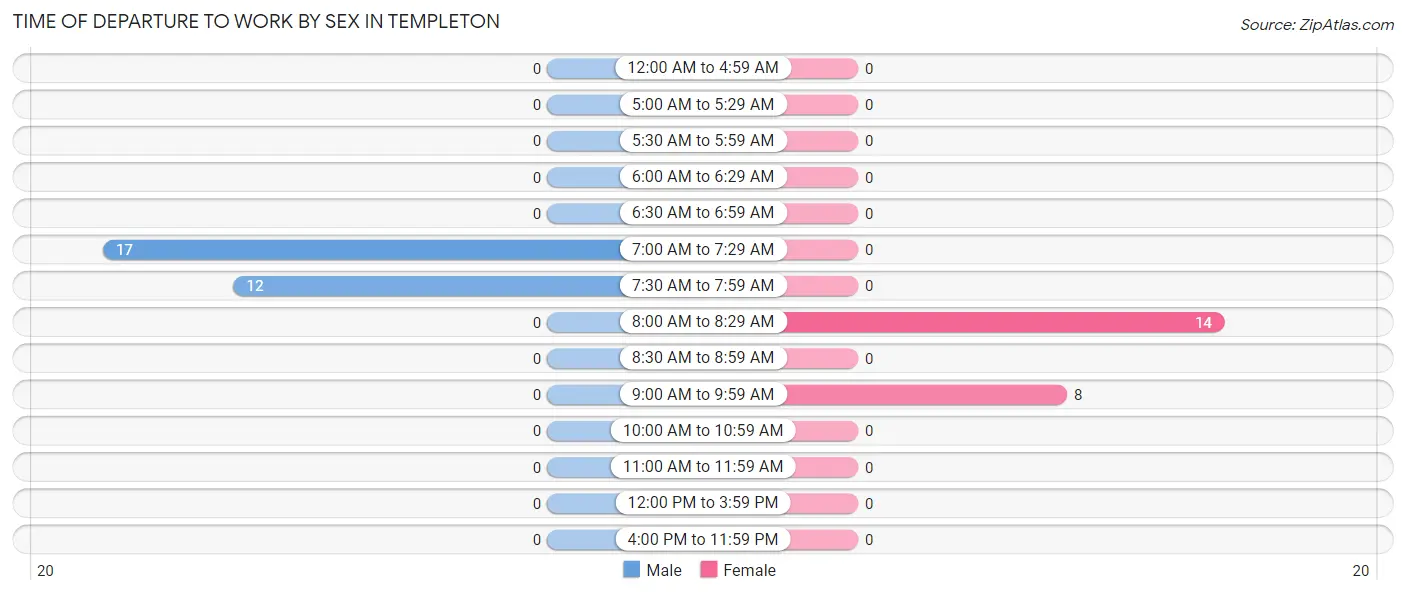
| Time of Departure | Male | Female |
| 12:00 AM to 4:59 AM | 0 (0.0%) | 0 (0.0%) |
| 5:00 AM to 5:29 AM | 0 (0.0%) | 0 (0.0%) |
| 5:30 AM to 5:59 AM | 0 (0.0%) | 0 (0.0%) |
| 6:00 AM to 6:29 AM | 0 (0.0%) | 0 (0.0%) |
| 6:30 AM to 6:59 AM | 0 (0.0%) | 0 (0.0%) |
| 7:00 AM to 7:29 AM | 17 (58.6%) | 0 (0.0%) |
| 7:30 AM to 7:59 AM | 12 (41.4%) | 0 (0.0%) |
| 8:00 AM to 8:29 AM | 0 (0.0%) | 14 (63.6%) |
| 8:30 AM to 8:59 AM | 0 (0.0%) | 0 (0.0%) |
| 9:00 AM to 9:59 AM | 0 (0.0%) | 8 (36.4%) |
| 10:00 AM to 10:59 AM | 0 (0.0%) | 0 (0.0%) |
| 11:00 AM to 11:59 AM | 0 (0.0%) | 0 (0.0%) |
| 12:00 PM to 3:59 PM | 0 (0.0%) | 0 (0.0%) |
| 4:00 PM to 11:59 PM | 0 (0.0%) | 0 (0.0%) |
| Total | 29 (100.0%) | 22 (100.0%) |
Housing Occupancy in Templeton
Occupancy by Ownership in Templeton
Of the total 48 dwellings in Templeton, owner-occupied units account for 32 (66.7%), while renter-occupied units make up 16 (33.3%).
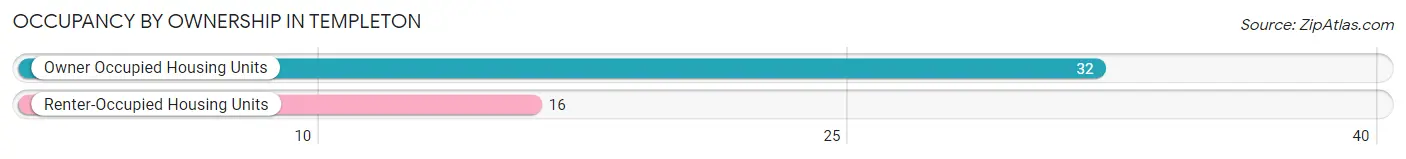
| Occupancy | # Housing Units | % Housing Units |
| Owner Occupied Housing Units | 32 | 66.7% |
| Renter-Occupied Housing Units | 16 | 33.3% |
| Total Occupied Housing Units | 48 | 100.0% |
Occupancy by Household Size in Templeton
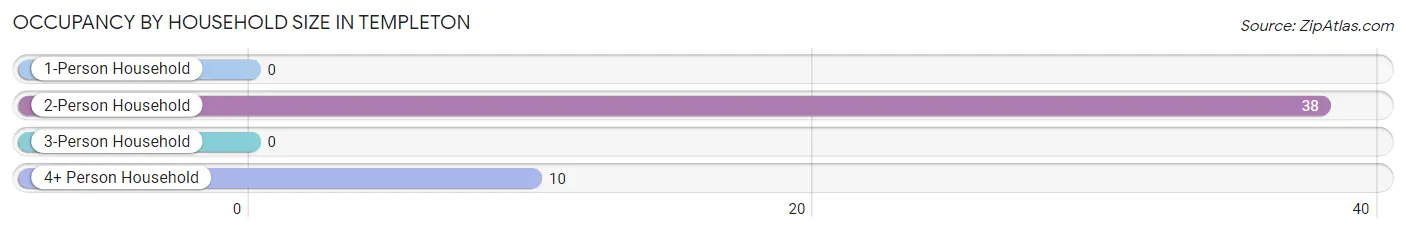
| Household Size | # Housing Units | % Housing Units |
| 1-Person Household | 0 | 0.0% |
| 2-Person Household | 38 | 79.2% |
| 3-Person Household | 0 | 0.0% |
| 4+ Person Household | 10 | 20.8% |
| Total Housing Units | 48 | 100.0% |
Occupancy by Ownership by Household Size in Templeton
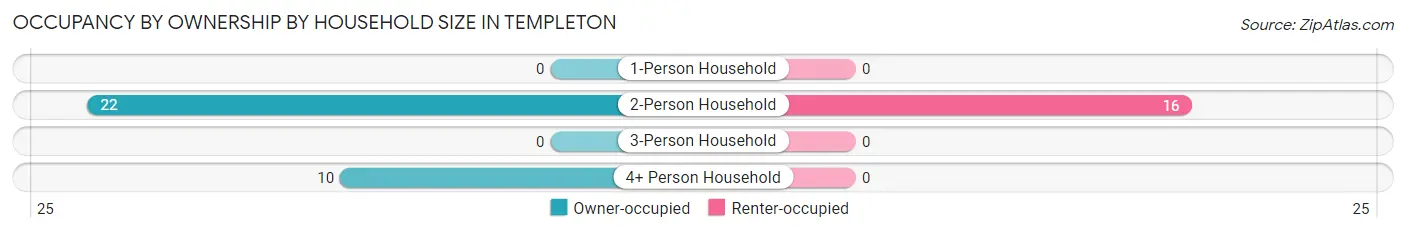
| Household Size | Owner-occupied | Renter-occupied |
| 1-Person Household | 0 (0.0%) | 0 (0.0%) |
| 2-Person Household | 22 (57.9%) | 16 (42.1%) |
| 3-Person Household | 0 (0.0%) | 0 (0.0%) |
| 4+ Person Household | 10 (100.0%) | 0 (0.0%) |
| Total Housing Units | 32 (66.7%) | 16 (33.3%) |
Occupancy by Educational Attainment in Templeton
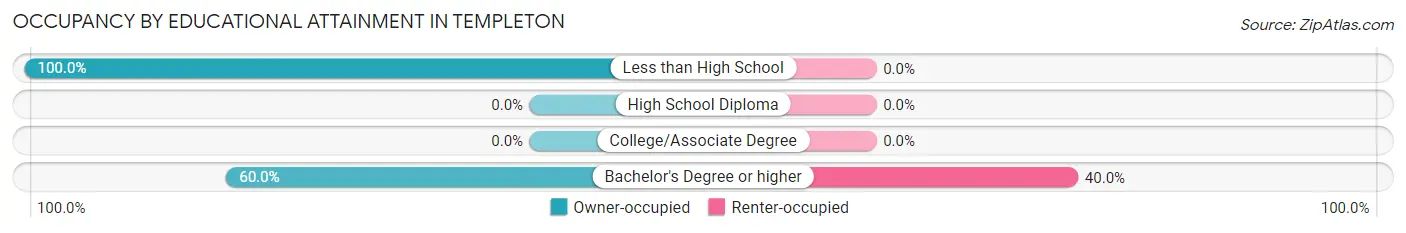
| Household Size | Owner-occupied | Renter-occupied |
| Less than High School | 8 (100.0%) | 0 (0.0%) |
| High School Diploma | 0 (0.0%) | 0 (0.0%) |
| College/Associate Degree | 0 (0.0%) | 0 (0.0%) |
| Bachelor's Degree or higher | 24 (60.0%) | 16 (40.0%) |
Occupancy by Age of Householder in Templeton
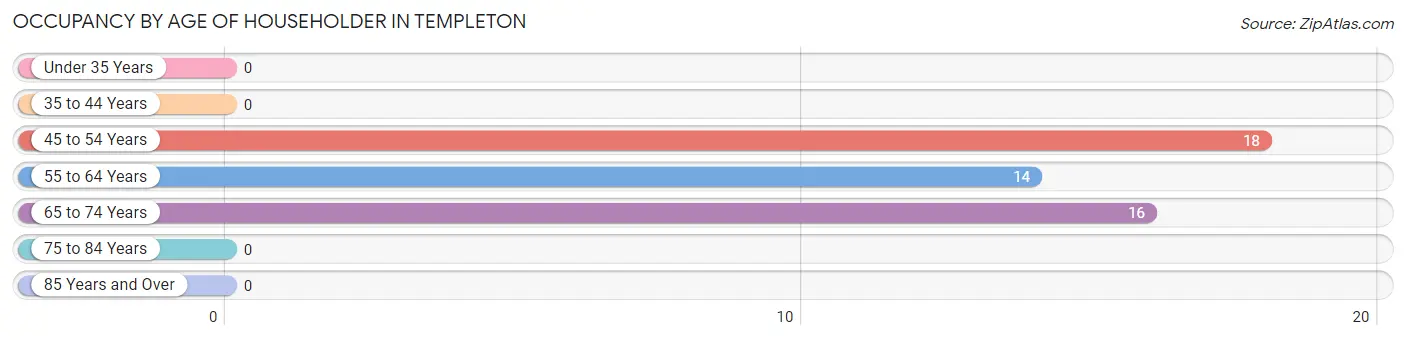
| Age Bracket | # Households | % Households |
| Under 35 Years | 0 | 0.0% |
| 35 to 44 Years | 0 | 0.0% |
| 45 to 54 Years | 18 | 37.5% |
| 55 to 64 Years | 14 | 29.2% |
| 65 to 74 Years | 16 | 33.3% |
| 75 to 84 Years | 0 | 0.0% |
| 85 Years and Over | 0 | 0.0% |
| Total | 48 | 100.0% |
Housing Finances in Templeton
Median Income by Occupancy in Templeton
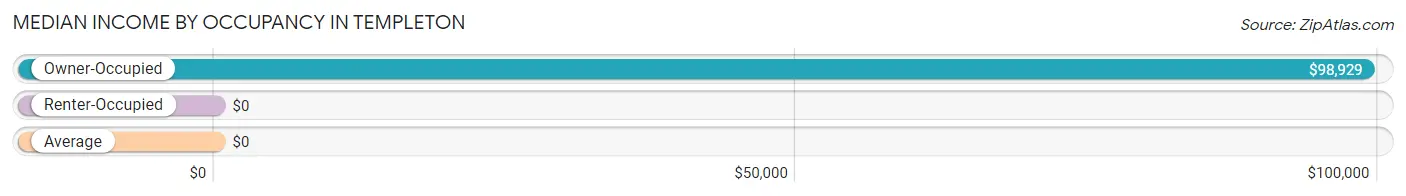
| Occupancy Type | # Households | Median Income |
| Owner-Occupied | 32 (66.7%) | $98,929 |
| Renter-Occupied | 16 (33.3%) | $0 |
| Average | 48 (100.0%) | $0 |
Occupancy by Householder Income Bracket in Templeton
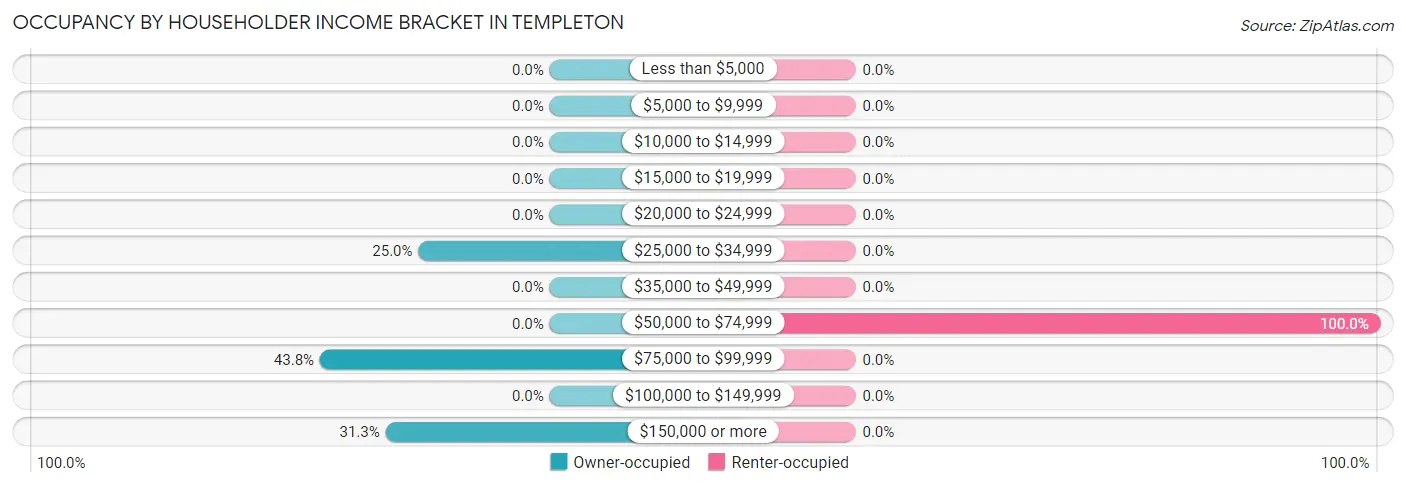
| Income Bracket | Owner-occupied | Renter-occupied |
| Less than $5,000 | 0 (0.0%) | 0 (0.0%) |
| $5,000 to $9,999 | 0 (0.0%) | 0 (0.0%) |
| $10,000 to $14,999 | 0 (0.0%) | 0 (0.0%) |
| $15,000 to $19,999 | 0 (0.0%) | 0 (0.0%) |
| $20,000 to $24,999 | 0 (0.0%) | 0 (0.0%) |
| $25,000 to $34,999 | 8 (25.0%) | 0 (0.0%) |
| $35,000 to $49,999 | 0 (0.0%) | 0 (0.0%) |
| $50,000 to $74,999 | 0 (0.0%) | 16 (100.0%) |
| $75,000 to $99,999 | 14 (43.8%) | 0 (0.0%) |
| $100,000 to $149,999 | 0 (0.0%) | 0 (0.0%) |
| $150,000 or more | 10 (31.2%) | 0 (0.0%) |
| Total | 32 (100.0%) | 16 (100.0%) |
Monthly Housing Cost Tiers in Templeton
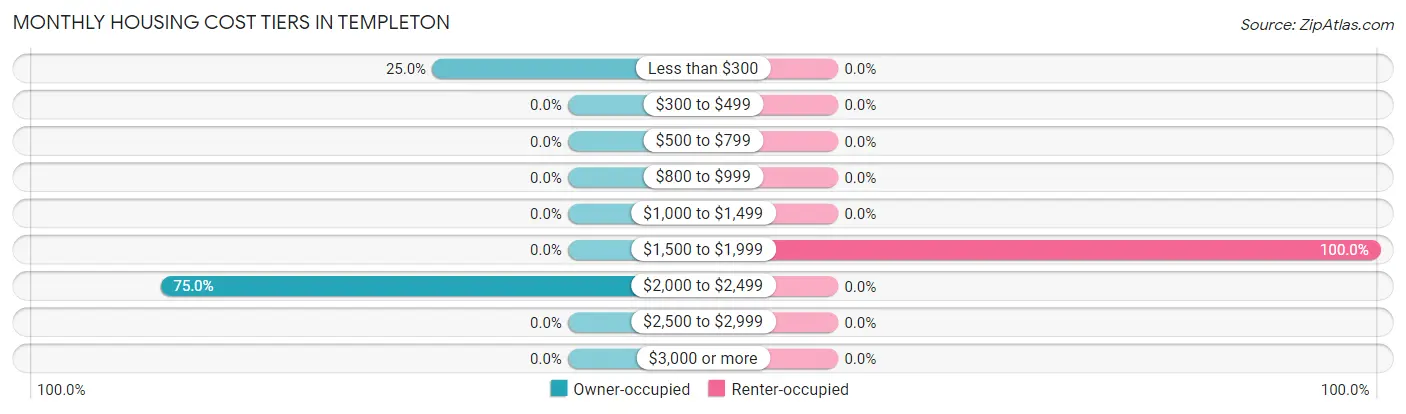
| Monthly Cost | Owner-occupied | Renter-occupied |
| Less than $300 | 8 (25.0%) | 0 (0.0%) |
| $300 to $499 | 0 (0.0%) | 0 (0.0%) |
| $500 to $799 | 0 (0.0%) | 0 (0.0%) |
| $800 to $999 | 0 (0.0%) | 0 (0.0%) |
| $1,000 to $1,499 | 0 (0.0%) | 0 (0.0%) |
| $1,500 to $1,999 | 0 (0.0%) | 16 (100.0%) |
| $2,000 to $2,499 | 24 (75.0%) | 0 (0.0%) |
| $2,500 to $2,999 | 0 (0.0%) | 0 (0.0%) |
| $3,000 or more | 0 (0.0%) | 0 (0.0%) |
| Total | 32 (100.0%) | 16 (100.0%) |
Physical Housing Characteristics in Templeton
Housing Structures in Templeton
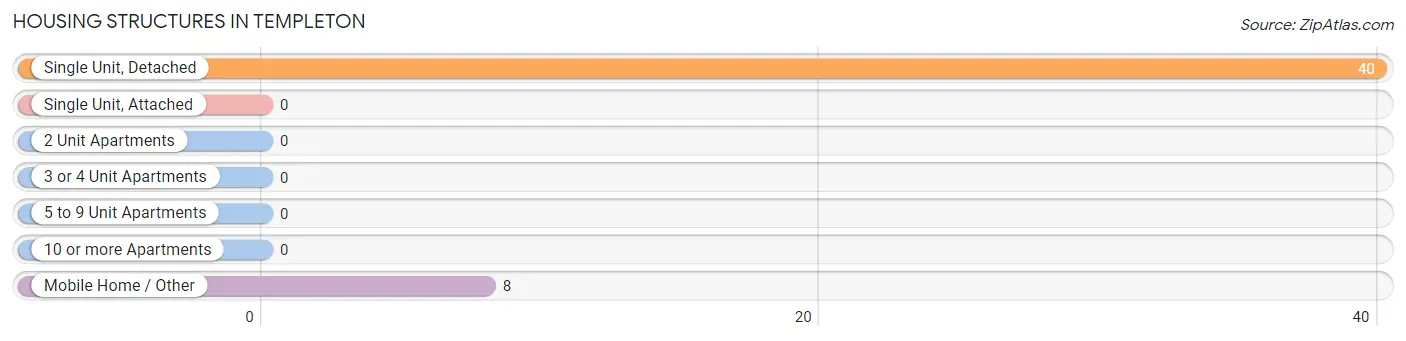
| Structure Type | # Housing Units | % Housing Units |
| Single Unit, Detached | 40 | 83.3% |
| Single Unit, Attached | 0 | 0.0% |
| 2 Unit Apartments | 0 | 0.0% |
| 3 or 4 Unit Apartments | 0 | 0.0% |
| 5 to 9 Unit Apartments | 0 | 0.0% |
| 10 or more Apartments | 0 | 0.0% |
| Mobile Home / Other | 8 | 16.7% |
| Total | 48 | 100.0% |
Housing Structures by Occupancy in Templeton
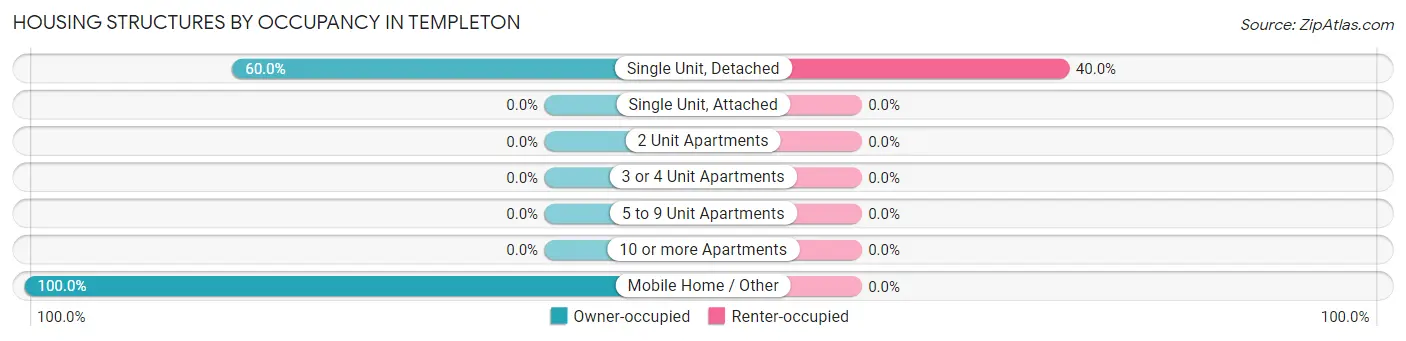
| Structure Type | Owner-occupied | Renter-occupied |
| Single Unit, Detached | 24 (60.0%) | 16 (40.0%) |
| Single Unit, Attached | 0 (0.0%) | 0 (0.0%) |
| 2 Unit Apartments | 0 (0.0%) | 0 (0.0%) |
| 3 or 4 Unit Apartments | 0 (0.0%) | 0 (0.0%) |
| 5 to 9 Unit Apartments | 0 (0.0%) | 0 (0.0%) |
| 10 or more Apartments | 0 (0.0%) | 0 (0.0%) |
| Mobile Home / Other | 8 (100.0%) | 0 (0.0%) |
| Total | 32 (66.7%) | 16 (33.3%) |
Housing Structures by Number of Rooms in Templeton
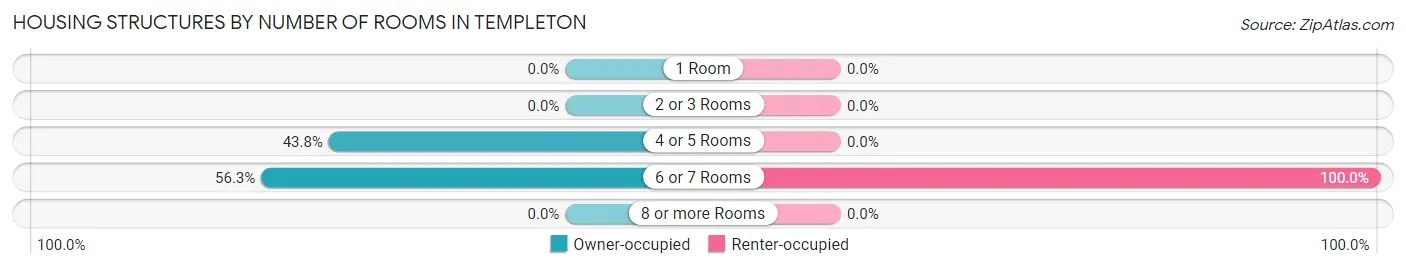
| Number of Rooms | Owner-occupied | Renter-occupied |
| 1 Room | 0 (0.0%) | 0 (0.0%) |
| 2 or 3 Rooms | 0 (0.0%) | 0 (0.0%) |
| 4 or 5 Rooms | 14 (43.8%) | 0 (0.0%) |
| 6 or 7 Rooms | 18 (56.2%) | 16 (100.0%) |
| 8 or more Rooms | 0 (0.0%) | 0 (0.0%) |
| Total | 32 (100.0%) | 16 (100.0%) |
Housing Structure by Heating Type in Templeton
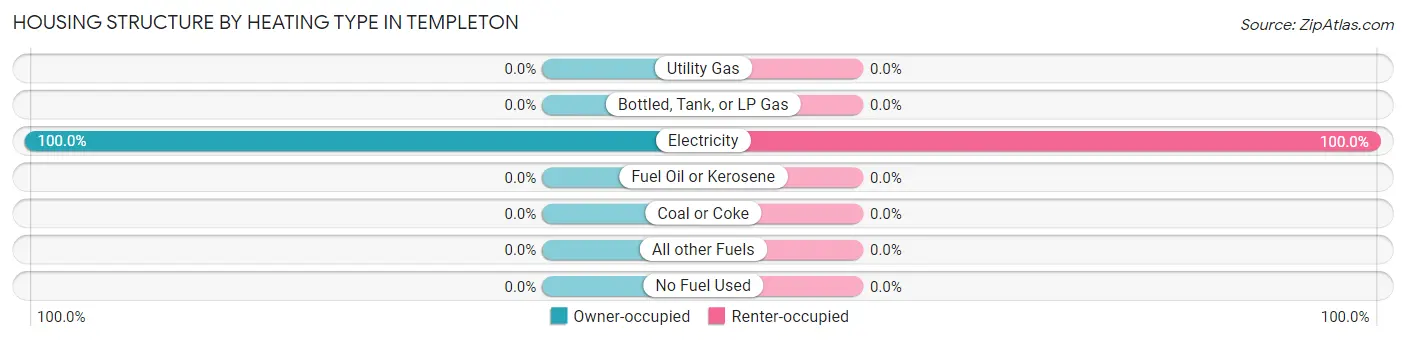
| Heating Type | Owner-occupied | Renter-occupied |
| Utility Gas | 0 (0.0%) | 0 (0.0%) |
| Bottled, Tank, or LP Gas | 0 (0.0%) | 0 (0.0%) |
| Electricity | 32 (100.0%) | 16 (100.0%) |
| Fuel Oil or Kerosene | 0 (0.0%) | 0 (0.0%) |
| Coal or Coke | 0 (0.0%) | 0 (0.0%) |
| All other Fuels | 0 (0.0%) | 0 (0.0%) |
| No Fuel Used | 0 (0.0%) | 0 (0.0%) |
| Total | 32 (100.0%) | 16 (100.0%) |
Household Vehicle Usage in Templeton
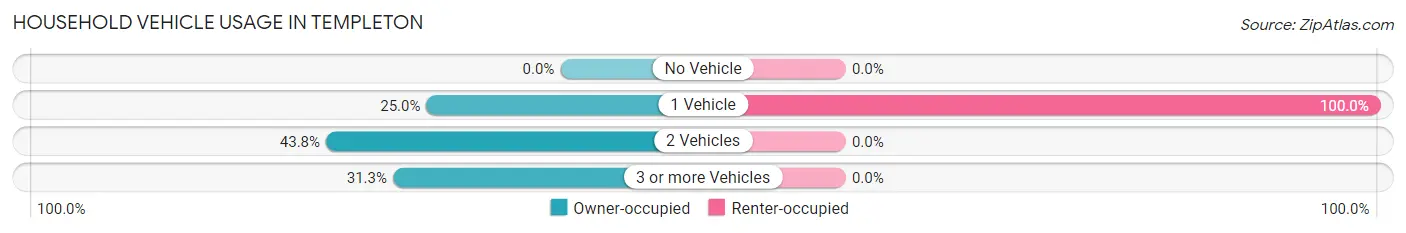
| Vehicles per Household | Owner-occupied | Renter-occupied |
| No Vehicle | 0 (0.0%) | 0 (0.0%) |
| 1 Vehicle | 8 (25.0%) | 16 (100.0%) |
| 2 Vehicles | 14 (43.8%) | 0 (0.0%) |
| 3 or more Vehicles | 10 (31.2%) | 0 (0.0%) |
| Total | 32 (100.0%) | 16 (100.0%) |
Real Estate & Mortgages in Templeton
Real Estate and Mortgage Overview in Templeton
| Characteristic | Without Mortgage | With Mortgage |
| Housing Units | 8 | 24 |
| Median Property Value | - | - |
| Median Household Income | - | - |
| Monthly Housing Costs | - | - |
| Real Estate Taxes | - | - |
Property Value by Mortgage Status in Templeton
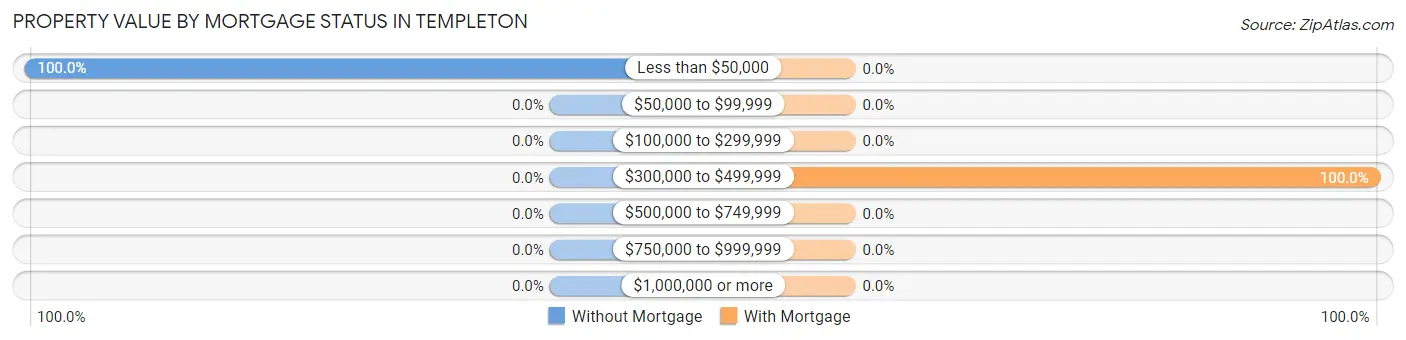
| Property Value | Without Mortgage | With Mortgage |
| Less than $50,000 | 8 (100.0%) | 0 (0.0%) |
| $50,000 to $99,999 | 0 (0.0%) | 0 (0.0%) |
| $100,000 to $299,999 | 0 (0.0%) | 0 (0.0%) |
| $300,000 to $499,999 | 0 (0.0%) | 24 (100.0%) |
| $500,000 to $749,999 | 0 (0.0%) | 0 (0.0%) |
| $750,000 to $999,999 | 0 (0.0%) | 0 (0.0%) |
| $1,000,000 or more | 0 (0.0%) | 0 (0.0%) |
| Total | 8 (100.0%) | 24 (100.0%) |
Household Income by Mortgage Status in Templeton
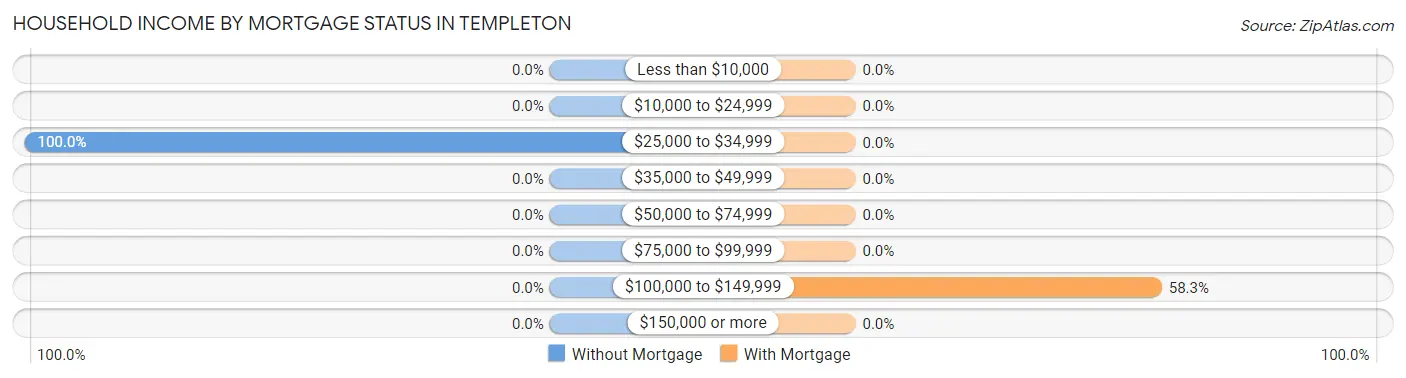
| Household Income | Without Mortgage | With Mortgage |
| Less than $10,000 | 0 (0.0%) | 0 (0.0%) |
| $10,000 to $24,999 | 0 (0.0%) | 0 (0.0%) |
| $25,000 to $34,999 | 8 (100.0%) | 0 (0.0%) |
| $35,000 to $49,999 | 0 (0.0%) | 0 (0.0%) |
| $50,000 to $74,999 | 0 (0.0%) | 0 (0.0%) |
| $75,000 to $99,999 | 0 (0.0%) | 0 (0.0%) |
| $100,000 to $149,999 | 0 (0.0%) | 14 (58.3%) |
| $150,000 or more | 0 (0.0%) | 0 (0.0%) |
| Total | 8 (100.0%) | 24 (100.0%) |
Property Value to Household Income Ratio in Templeton
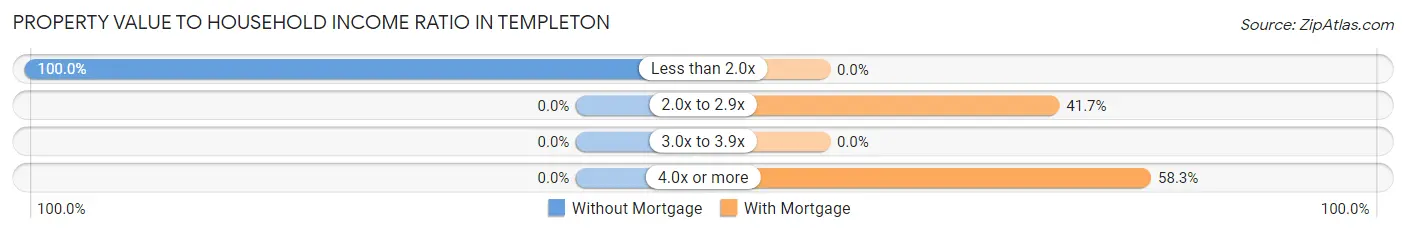
| Value-to-Income Ratio | Without Mortgage | With Mortgage |
| Less than 2.0x | 8 (100.0%) | 0 (0.0%) |
| 2.0x to 2.9x | 0 (0.0%) | 10 (41.7%) |
| 3.0x to 3.9x | 0 (0.0%) | 0 (0.0%) |
| 4.0x or more | 0 (0.0%) | 14 (58.3%) |
| Total | 8 (100.0%) | 24 (100.0%) |
Real Estate Taxes by Mortgage Status in Templeton
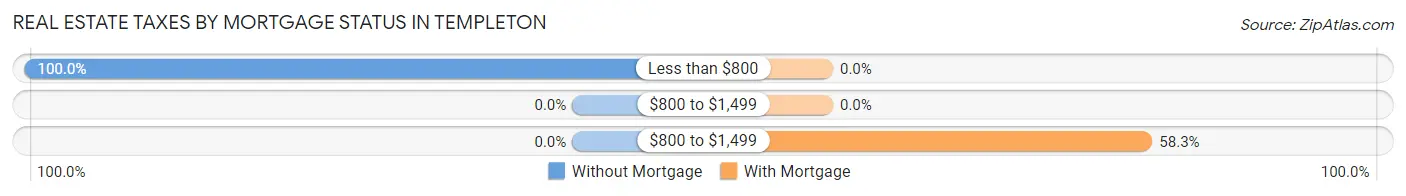
| Property Taxes | Without Mortgage | With Mortgage |
| Less than $800 | 8 (100.0%) | 0 (0.0%) |
| $800 to $1,499 | 0 (0.0%) | 0 (0.0%) |
| $800 to $1,499 | 0 (0.0%) | 14 (58.3%) |
| Total | 8 (100.0%) | 24 (100.0%) |
Health & Disability in Templeton
Health Insurance Coverage by Age in Templeton
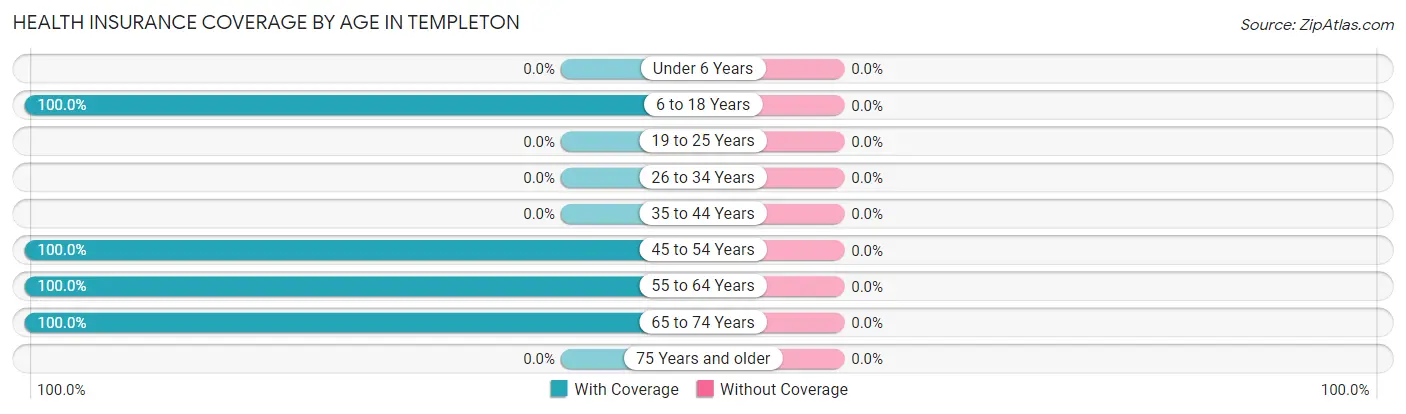
| Age Bracket | With Coverage | Without Coverage |
| Under 6 Years | 0 (0.0%) | 0 (0.0%) |
| 6 to 18 Years | 20 (100.0%) | 0 (0.0%) |
| 19 to 25 Years | 0 (0.0%) | 0 (0.0%) |
| 26 to 34 Years | 0 (0.0%) | 0 (0.0%) |
| 35 to 44 Years | 0 (0.0%) | 0 (0.0%) |
| 45 to 54 Years | 42 (100.0%) | 0 (0.0%) |
| 55 to 64 Years | 14 (100.0%) | 0 (0.0%) |
| 65 to 74 Years | 43 (100.0%) | 0 (0.0%) |
| 75 Years and older | 0 (0.0%) | 0 (0.0%) |
| Total | 119 (100.0%) | 0 (0.0%) |
Health Insurance Coverage by Citizenship Status in Templeton
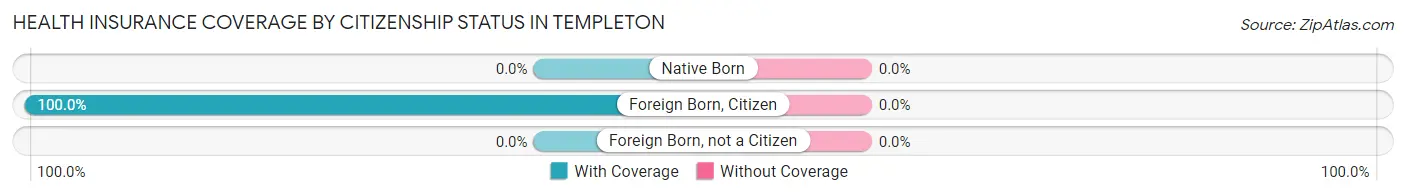
| Citizenship Status | With Coverage | Without Coverage |
| Native Born | 0 (0.0%) | 0 (0.0%) |
| Foreign Born, Citizen | 20 (100.0%) | 0 (0.0%) |
| Foreign Born, not a Citizen | 0 (0.0%) | 0 (0.0%) |
Health Insurance Coverage by Household Income in Templeton
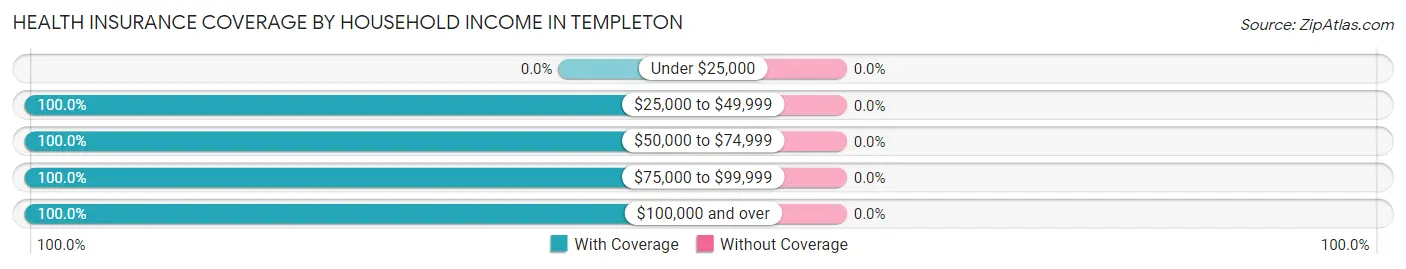
| Household Income | With Coverage | Without Coverage |
| Under $25,000 | 0 (0.0%) | 0 (0.0%) |
| $25,000 to $49,999 | 15 (100.0%) | 0 (0.0%) |
| $50,000 to $74,999 | 31 (100.0%) | 0 (0.0%) |
| $75,000 to $99,999 | 26 (100.0%) | 0 (0.0%) |
| $100,000 and over | 47 (100.0%) | 0 (0.0%) |
Public vs Private Health Insurance Coverage by Age in Templeton
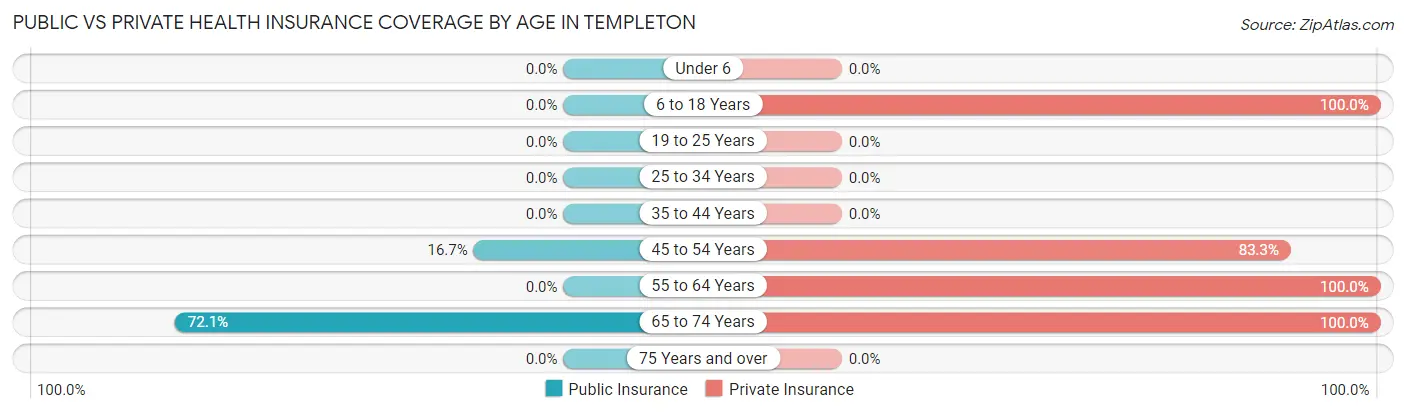
| Age Bracket | Public Insurance | Private Insurance |
| Under 6 | 0 (0.0%) | 0 (0.0%) |
| 6 to 18 Years | 0 (0.0%) | 20 (100.0%) |
| 19 to 25 Years | 0 (0.0%) | 0 (0.0%) |
| 25 to 34 Years | 0 (0.0%) | 0 (0.0%) |
| 35 to 44 Years | 0 (0.0%) | 0 (0.0%) |
| 45 to 54 Years | 7 (16.7%) | 35 (83.3%) |
| 55 to 64 Years | 0 (0.0%) | 14 (100.0%) |
| 65 to 74 Years | 31 (72.1%) | 43 (100.0%) |
| 75 Years and over | 0 (0.0%) | 0 (0.0%) |
| Total | 38 (31.9%) | 112 (94.1%) |
Disability Status by Sex by Age in Templeton
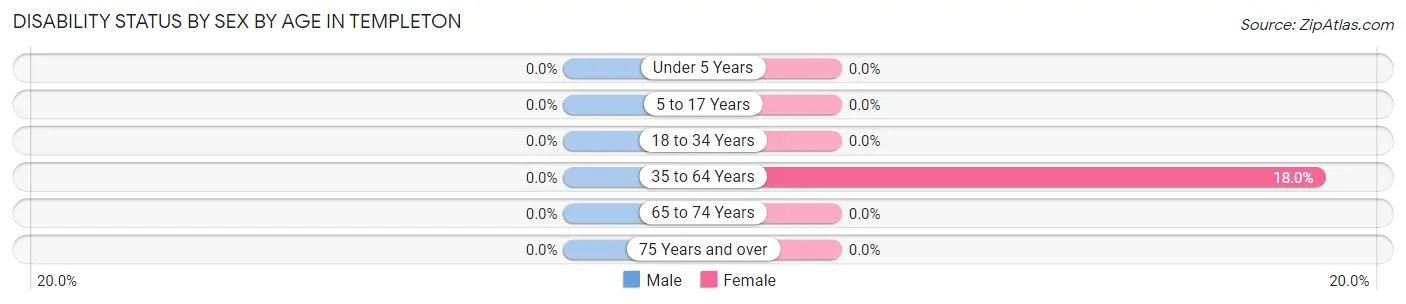
| Age Bracket | Male | Female |
| Under 5 Years | 0 (0.0%) | 0 (0.0%) |
| 5 to 17 Years | 0 (0.0%) | 0 (0.0%) |
| 18 to 34 Years | 0 (0.0%) | 0 (0.0%) |
| 35 to 64 Years | 0 (0.0%) | 7 (17.9%) |
| 65 to 74 Years | 0 (0.0%) | 0 (0.0%) |
| 75 Years and over | 0 (0.0%) | 0 (0.0%) |
Disability Class by Sex by Age in Templeton
Disability Class: Hearing Difficulty
| Age Bracket | Male | Female |
| Under 5 Years | 0 (0.0%) | 0 (0.0%) |
| 5 to 17 Years | 0 (0.0%) | 0 (0.0%) |
| 18 to 34 Years | 0 (0.0%) | 0 (0.0%) |
| 35 to 64 Years | 0 (0.0%) | 0 (0.0%) |
| 65 to 74 Years | 0 (0.0%) | 0 (0.0%) |
| 75 Years and over | 0 (0.0%) | 0 (0.0%) |
Disability Class: Vision Difficulty
| Age Bracket | Male | Female |
| Under 5 Years | 0 (0.0%) | 0 (0.0%) |
| 5 to 17 Years | 0 (0.0%) | 0 (0.0%) |
| 18 to 34 Years | 0 (0.0%) | 0 (0.0%) |
| 35 to 64 Years | 0 (0.0%) | 0 (0.0%) |
| 65 to 74 Years | 0 (0.0%) | 0 (0.0%) |
| 75 Years and over | 0 (0.0%) | 0 (0.0%) |
Disability Class: Cognitive Difficulty
| Age Bracket | Male | Female |
| 5 to 17 Years | 0 (0.0%) | 0 (0.0%) |
| 18 to 34 Years | 0 (0.0%) | 0 (0.0%) |
| 35 to 64 Years | 0 (0.0%) | 7 (17.9%) |
| 65 to 74 Years | 0 (0.0%) | 0 (0.0%) |
| 75 Years and over | 0 (0.0%) | 0 (0.0%) |
Disability Class: Ambulatory Difficulty
| Age Bracket | Male | Female |
| 5 to 17 Years | 0 (0.0%) | 0 (0.0%) |
| 18 to 34 Years | 0 (0.0%) | 0 (0.0%) |
| 35 to 64 Years | 0 (0.0%) | 0 (0.0%) |
| 65 to 74 Years | 0 (0.0%) | 0 (0.0%) |
| 75 Years and over | 0 (0.0%) | 0 (0.0%) |
Disability Class: Self-Care Difficulty
| Age Bracket | Male | Female |
| 5 to 17 Years | 0 (0.0%) | 0 (0.0%) |
| 18 to 34 Years | 0 (0.0%) | 0 (0.0%) |
| 35 to 64 Years | 0 (0.0%) | 0 (0.0%) |
| 65 to 74 Years | 0 (0.0%) | 0 (0.0%) |
| 75 Years and over | 0 (0.0%) | 0 (0.0%) |
Technology Access in Templeton
Computing Device Access in Templeton
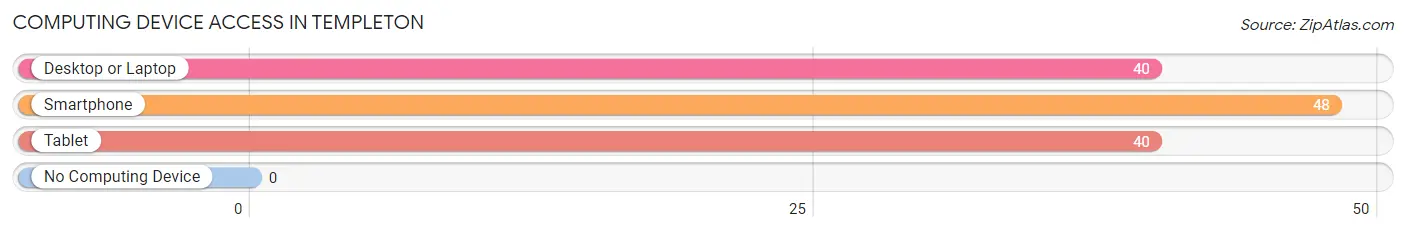
| Device Type | # Households | % Households |
| Desktop or Laptop | 40 | 83.3% |
| Smartphone | 48 | 100.0% |
| Tablet | 40 | 83.3% |
| No Computing Device | 0 | 0.0% |
| Total | 48 | 100.0% |
Internet Access in Templeton
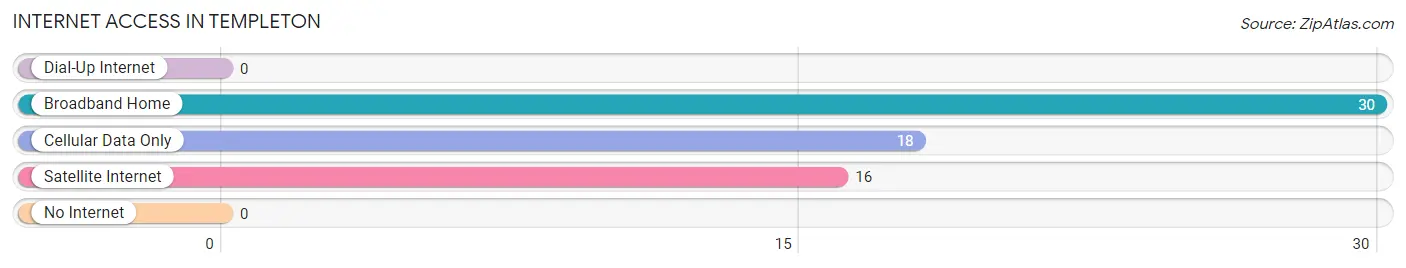
| Internet Type | # Households | % Households |
| Dial-Up Internet | 0 | 0.0% |
| Broadband Home | 30 | 62.5% |
| Cellular Data Only | 18 | 37.5% |
| Satellite Internet | 16 | 33.3% |
| No Internet | 0 | 0.0% |
| Total | 48 | 100.0% |
Templeton Summary
Templeton is a small unincorporated community located in the state of Virginia. It is situated in the northern part of the state, in the Shenandoah Valley region. The community is located in the county of Rockingham, and is part of the Harrisonburg Metropolitan Statistical Area.
History
The area that is now Templeton was first settled in the late 1700s by German immigrants. The community was originally known as “New Market”, and was later renamed “Templeton” in honor of a local landowner, William Templeton. The community was officially established in 1820, and the first post office was established in 1821.
The community grew slowly over the years, and by the mid-1800s, it had become a thriving agricultural community. The area was known for its production of apples, peaches, and other fruits. In addition, the area was also known for its production of wool and other livestock.
In the late 1800s, the area began to experience a period of industrialization. The first railroad line was built in the area in 1881, and this helped to spur the growth of the community. By the early 1900s, the area had become a major hub for the production of lumber and other wood products.
Geography
Templeton is located in the northern part of the state of Virginia, in the Shenandoah Valley region. The community is situated in the county of Rockingham, and is part of the Harrisonburg Metropolitan Statistical Area.
The community is located in a rural area, and is surrounded by rolling hills and farmland. The area is known for its scenic beauty, and is home to several parks and recreational areas. The nearest major city is Harrisonburg, which is located about 25 miles to the south.
Economy
The economy of Templeton is largely based on agriculture and tourism. The area is known for its production of apples, peaches, and other fruits. In addition, the area is also known for its production of wool and other livestock.
The area is also home to several small businesses, including restaurants, shops, and other services. The area is also home to several wineries, which attract tourists from all over the region.
Demographics
As of the 2010 census, the population of Templeton was 1,845. The racial makeup of the community was 95.3% White, 1.2% African American, 0.3% Native American, 0.3% Asian, 0.1% Pacific Islander, and 2.8% from other races. The median household income was $41,250, and the median family income was $50,000.
The area is served by the Rockingham County Public Schools system. The area is also home to several churches, including the Templeton United Methodist Church and the Templeton Presbyterian Church.
Conclusion
Templeton is a small unincorporated community located in the state of Virginia. It is situated in the northern part of the state, in the Shenandoah Valley region. The community was first settled in the late 1700s by German immigrants, and was officially established in 1820. The economy of the area is largely based on agriculture and tourism, and the area is known for its production of apples, peaches, and other fruits. As of the 2010 census, the population of Templeton was 1,845. The area is served by the Rockingham County Public Schools system, and is home to several churches.
Common Questions
What is Per Capita Income in Templeton?
Per Capita income in Templeton is $38,561.
What is Inequality or Gini Index in Templeton?
Inequality or Gini Index in Templeton is 0.29.
What is the Total Population of Templeton?
Total Population of Templeton is 119.
What is the Total Male Population of Templeton?
Total Male Population of Templeton is 44.
What is the Total Female Population of Templeton?
Total Female Population of Templeton is 75.
What is the Ratio of Males per 100 Females in Templeton?
There are 58.67 Males per 100 Females in Templeton.
What is the Ratio of Females per 100 Males in Templeton?
There are 170.45 Females per 100 Males in Templeton.
What is the Median Population Age in Templeton?
Median Population Age in Templeton is 53.8 Years.
What is the Average Family Size in Templeton
Average Family Size in Templeton is 2.6 People.
What is the Average Household Size in Templeton
Average Household Size in Templeton is 2.5 People.
How Large is the Labor Force in Templeton?
There are 61 People in the Labor Forcein in Templeton.
What is the Percentage of People in the Labor Force in Templeton?
61.6% of People are in the Labor Force in Templeton.