Gasburg, VA Map & Demographics
Gasburg Map
Gasburg Overview
$39,862
PER CAPITA INCOME
$88,125
AVG FAMILY INCOME
$62,857
AVG HOUSEHOLD INCOME
0.49
INEQUALITY / GINI INDEX
606
TOTAL POPULATION
186
MALE POPULATION
420
FEMALE POPULATION
44.29
MALES / 100 FEMALES
225.81
FEMALES / 100 MALES
59.9
MEDIAN AGE
2.8
AVG FAMILY SIZE
1.7
AVG HOUSEHOLD SIZE
206
LABOR FORCE [ PEOPLE ]
38.6%
PERCENT IN LABOR FORCE
10.2%
UNEMPLOYMENT RATE
Gasburg Zip Codes
Gasburg Area Codes
Income in Gasburg
Income Overview in Gasburg
Per Capita Income in Gasburg is $39,862, while median incomes of families and households are $88,125 and $62,857 respectively.
| Characteristic | Number | Measure |
| Per Capita Income | 606 | $39,862 |
| Median Family Income | 143 | $88,125 |
| Mean Family Income | 143 | $111,855 |
| Median Household Income | 348 | $62,857 |
| Mean Household Income | 348 | $65,679 |
| Income Deficit | 143 | $0 |
| Wage / Income Gap (%) | 606 | 0.00% |
| Wage / Income Gap ($) | 606 | 100.00¢ per $1 |
| Gini / Inequality Index | 606 | 0.49 |
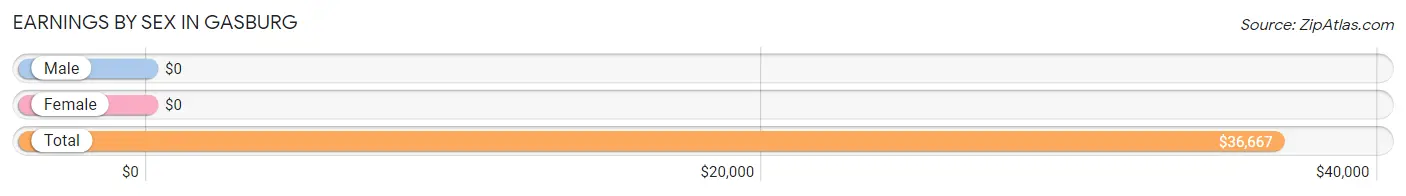
Earnings by Sex in Gasburg
| Sex | Number | Average Earnings |
| Male | 88 (31.2%) | $0 |
| Female | 194 (68.8%) | $0 |
| Total | 282 (100.0%) | $36,667 |
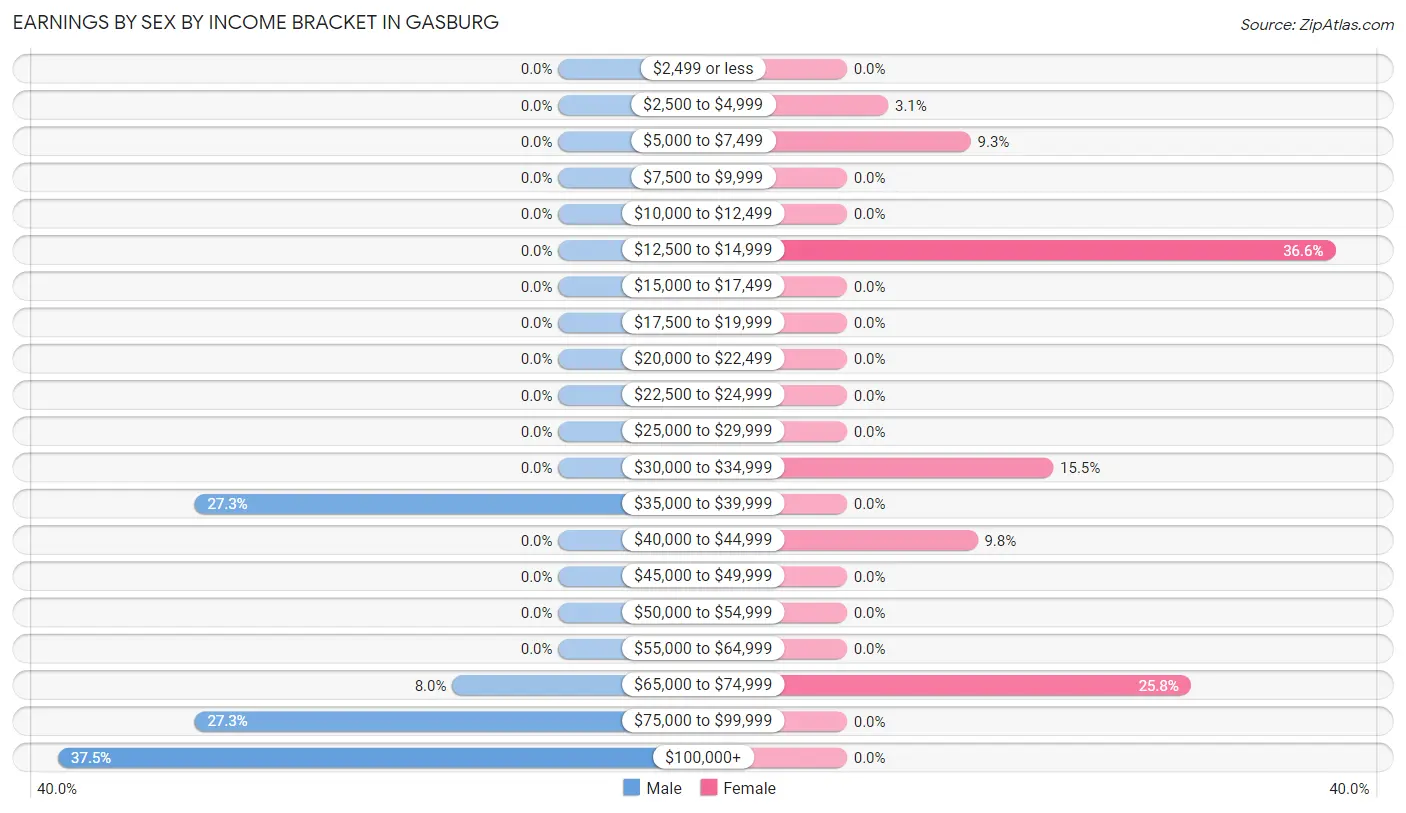
Earnings by Sex by Income Bracket in Gasburg
The most common earnings brackets in Gasburg are $100,000+ for men (33 | 37.5%) and $12,500 to $14,999 for women (71 | 36.6%).
| Income | Male | Female |
| $2,499 or less | 0 (0.0%) | 0 (0.0%) |
| $2,500 to $4,999 | 0 (0.0%) | 6 (3.1%) |
| $5,000 to $7,499 | 0 (0.0%) | 18 (9.3%) |
| $7,500 to $9,999 | 0 (0.0%) | 0 (0.0%) |
| $10,000 to $12,499 | 0 (0.0%) | 0 (0.0%) |
| $12,500 to $14,999 | 0 (0.0%) | 71 (36.6%) |
| $15,000 to $17,499 | 0 (0.0%) | 0 (0.0%) |
| $17,500 to $19,999 | 0 (0.0%) | 0 (0.0%) |
| $20,000 to $22,499 | 0 (0.0%) | 0 (0.0%) |
| $22,500 to $24,999 | 0 (0.0%) | 0 (0.0%) |
| $25,000 to $29,999 | 0 (0.0%) | 0 (0.0%) |
| $30,000 to $34,999 | 0 (0.0%) | 30 (15.5%) |
| $35,000 to $39,999 | 24 (27.3%) | 0 (0.0%) |
| $40,000 to $44,999 | 0 (0.0%) | 19 (9.8%) |
| $45,000 to $49,999 | 0 (0.0%) | 0 (0.0%) |
| $50,000 to $54,999 | 0 (0.0%) | 0 (0.0%) |
| $55,000 to $64,999 | 0 (0.0%) | 0 (0.0%) |
| $65,000 to $74,999 | 7 (8.0%) | 50 (25.8%) |
| $75,000 to $99,999 | 24 (27.3%) | 0 (0.0%) |
| $100,000+ | 33 (37.5%) | 0 (0.0%) |
| Total | 88 (100.0%) | 194 (100.0%) |
Earnings by Sex by Educational Attainment in Gasburg
| Educational Attainment | Male Income | Female Income |
| Less than High School | - | - |
| High School Diploma | - | - |
| College or Associate's Degree | - | - |
| Bachelor's Degree | - | - |
| Graduate Degree | - | - |
| Total | - | - |
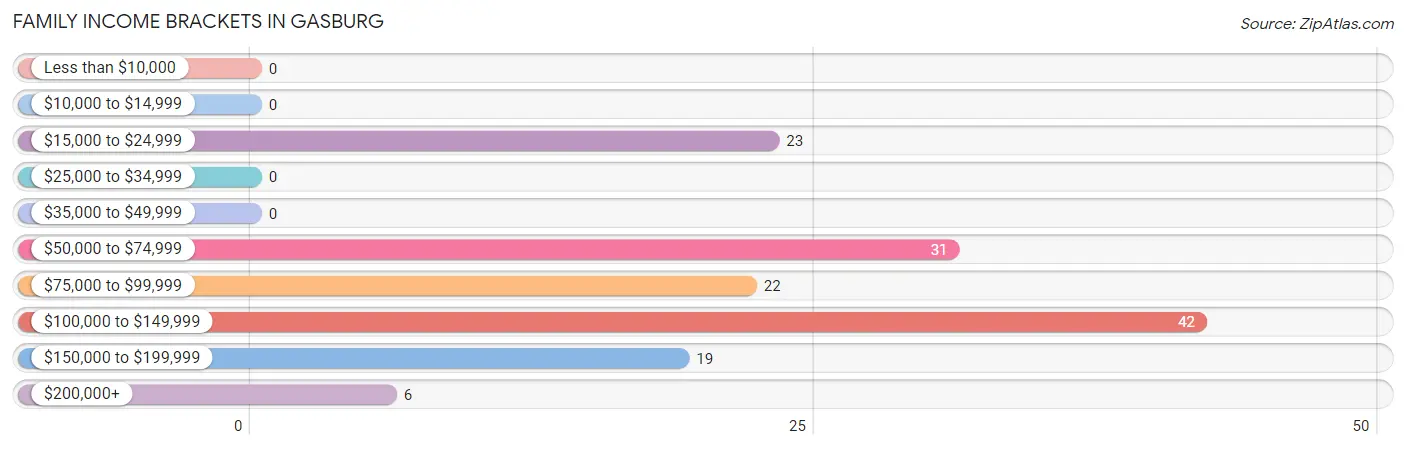
Family Income in Gasburg
Family Income Brackets in Gasburg
According to the Gasburg family income data, there are 42 families falling into the $100,000 to $149,999 income range, which is the most common income bracket and makes up 29.4% of all families.
| Income Bracket | # Families | % Families |
| Less than $10,000 | 0 | 0.0% |
| $10,000 to $14,999 | 0 | 0.0% |
| $15,000 to $24,999 | 23 | 16.1% |
| $25,000 to $34,999 | 0 | 0.0% |
| $35,000 to $49,999 | 0 | 0.0% |
| $50,000 to $74,999 | 31 | 21.7% |
| $75,000 to $99,999 | 22 | 15.4% |
| $100,000 to $149,999 | 42 | 29.4% |
| $150,000 to $199,999 | 19 | 13.3% |
| $200,000+ | 6 | 4.2% |
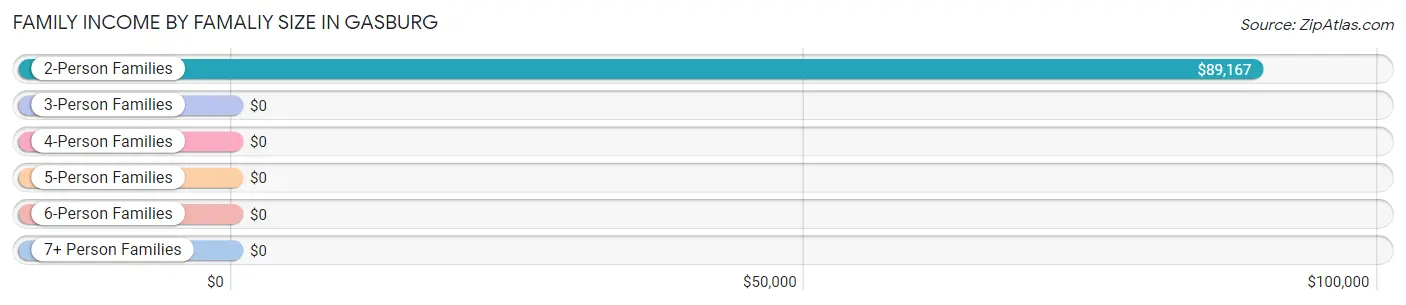
Family Income by Famaliy Size in Gasburg
2-person families (100 | 69.9%) account for the highest median family income in Gasburg with $89,167 per family, while 2-person families (100 | 69.9%) have the highest median income of $44,584 per family member.
| Income Bracket | # Families | Median Income |
| 2-Person Families | 100 (69.9%) | $89,167 |
| 3-Person Families | 19 (13.3%) | $0 |
| 4-Person Families | 0 (0.0%) | $0 |
| 5-Person Families | 24 (16.8%) | $0 |
| 6-Person Families | 0 (0.0%) | $0 |
| 7+ Person Families | 0 (0.0%) | $0 |
| Total | 143 (100.0%) | $88,125 |
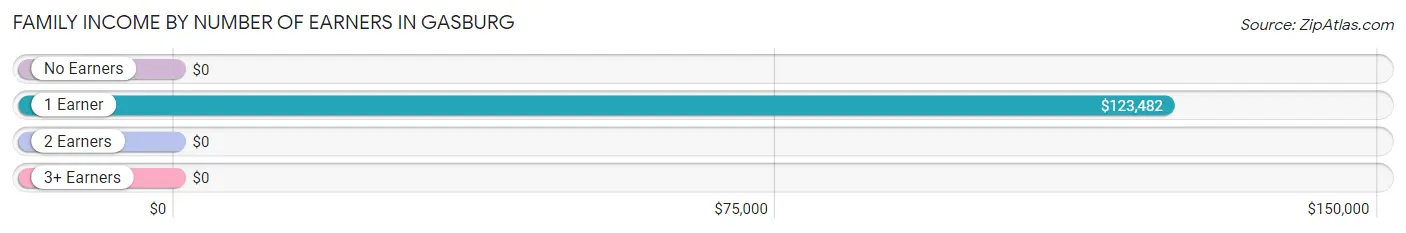
Family Income by Number of Earners in Gasburg
| Number of Earners | # Families | Median Income |
| No Earners | 36 (25.2%) | $0 |
| 1 Earner | 67 (46.9%) | $123,482 |
| 2 Earners | 40 (28.0%) | $0 |
| 3+ Earners | 0 (0.0%) | $0 |
| Total | 143 (100.0%) | $88,125 |
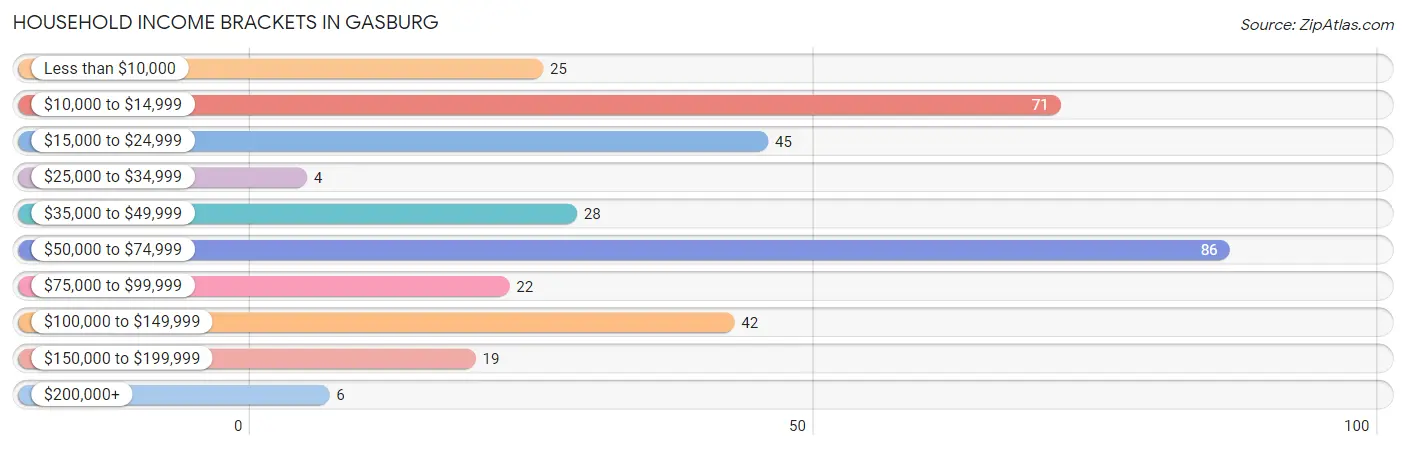
Household Income in Gasburg
Household Income Brackets in Gasburg
With 86 households falling in the category, the $50,000 to $74,999 income range is the most frequent in Gasburg, accounting for 24.7% of all households. In contrast, only 4 households (1.1%) fall into the $25,000 to $34,999 income bracket, making it the least populous group.
| Income Bracket | # Households | % Households |
| Less than $10,000 | 25 | 7.2% |
| $10,000 to $14,999 | 71 | 20.4% |
| $15,000 to $24,999 | 45 | 12.9% |
| $25,000 to $34,999 | 4 | 1.1% |
| $35,000 to $49,999 | 28 | 8.0% |
| $50,000 to $74,999 | 86 | 24.7% |
| $75,000 to $99,999 | 22 | 6.3% |
| $100,000 to $149,999 | 42 | 12.1% |
| $150,000 to $199,999 | 19 | 5.5% |
| $200,000+ | 6 | 1.7% |
Household Income by Householder Age in Gasburg
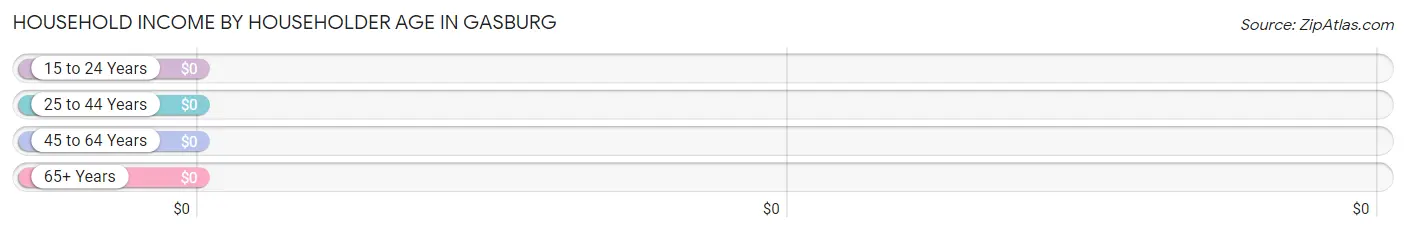
| Income Bracket | # Households | Median Income |
| 15 to 24 Years | 0 (0.0%) | $0 |
| 25 to 44 Years | 43 (12.4%) | $0 |
| 45 to 64 Years | 167 (48.0%) | $0 |
| 65+ Years | 138 (39.7%) | $0 |
| Total | 348 (100.0%) | $62,857 |
Poverty in Gasburg
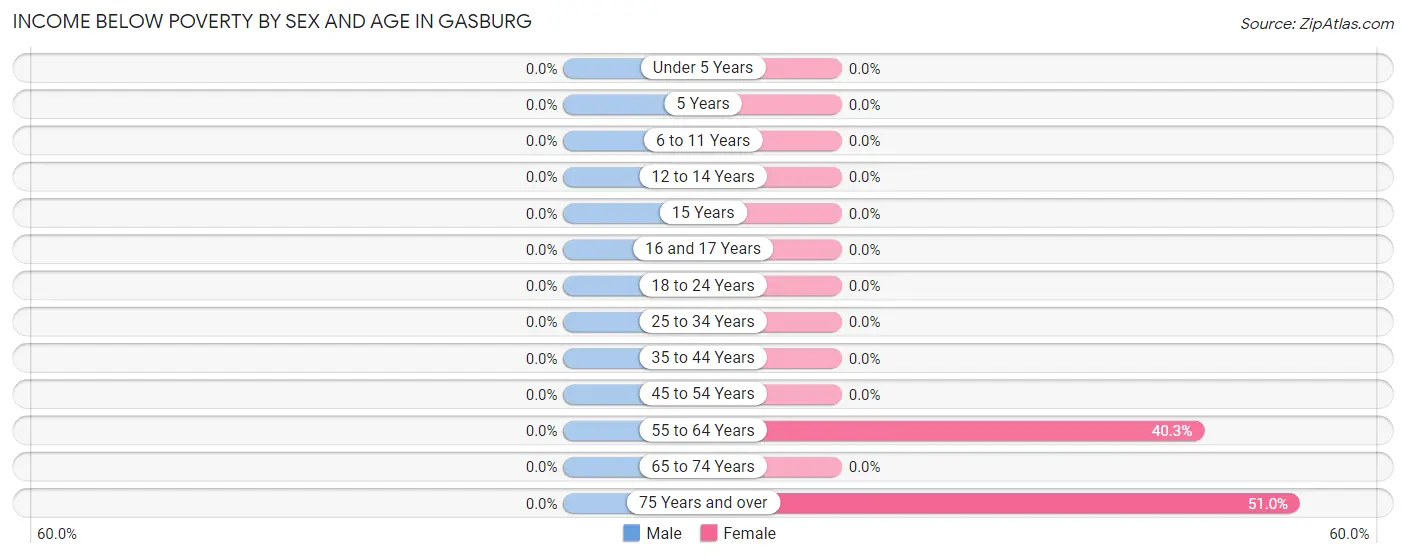
Income Below Poverty by Sex and Age in Gasburg
| Age Bracket | Male | Female |
| Under 5 Years | 0 (0.0%) | 0 (0.0%) |
| 5 Years | 0 (0.0%) | 0 (0.0%) |
| 6 to 11 Years | 0 (0.0%) | 0 (0.0%) |
| 12 to 14 Years | 0 (0.0%) | 0 (0.0%) |
| 15 Years | 0 (0.0%) | 0 (0.0%) |
| 16 and 17 Years | 0 (0.0%) | 0 (0.0%) |
| 18 to 24 Years | 0 (0.0%) | 0 (0.0%) |
| 25 to 34 Years | 0 (0.0%) | 0 (0.0%) |
| 35 to 44 Years | 0 (0.0%) | 0 (0.0%) |
| 45 to 54 Years | 0 (0.0%) | 0 (0.0%) |
| 55 to 64 Years | 0 (0.0%) | 71 (40.3%) |
| 65 to 74 Years | 0 (0.0%) | 0 (0.0%) |
| 75 Years and over | 0 (0.0%) | 25 (51.0%) |
| Total | 0 (0.0%) | 96 (22.9%) |
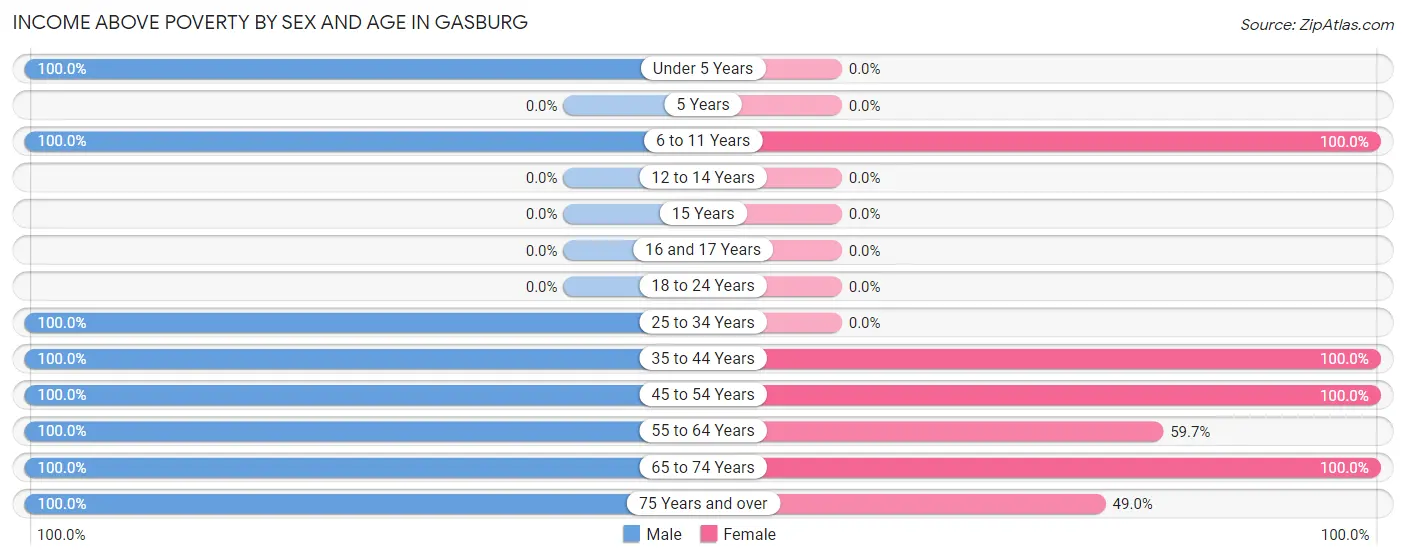
Income Above Poverty by Sex and Age in Gasburg
According to the poverty statistics in Gasburg, males aged under 5 years and females aged 6 to 11 years are the age groups that are most secure financially, with 100.0% of males and 100.0% of females in these age groups living above the poverty line.
| Age Bracket | Male | Female |
| Under 5 Years | 19 (100.0%) | 0 (0.0%) |
| 5 Years | 0 (0.0%) | 0 (0.0%) |
| 6 to 11 Years | 14 (100.0%) | 40 (100.0%) |
| 12 to 14 Years | 0 (0.0%) | 0 (0.0%) |
| 15 Years | 0 (0.0%) | 0 (0.0%) |
| 16 and 17 Years | 0 (0.0%) | 0 (0.0%) |
| 18 to 24 Years | 0 (0.0%) | 0 (0.0%) |
| 25 to 34 Years | 29 (100.0%) | 0 (0.0%) |
| 35 to 44 Years | 24 (100.0%) | 43 (100.0%) |
| 45 to 54 Years | 11 (100.0%) | 7 (100.0%) |
| 55 to 64 Years | 33 (100.0%) | 105 (59.7%) |
| 65 to 74 Years | 39 (100.0%) | 105 (100.0%) |
| 75 Years and over | 17 (100.0%) | 24 (49.0%) |
| Total | 186 (100.0%) | 324 (77.1%) |
Income Below Poverty Among Married-Couple Families in Gasburg
| Children | Above Poverty | Below Poverty |
| No Children | 100 (100.0%) | 0 (0.0%) |
| 1 or 2 Children | 19 (100.0%) | 0 (0.0%) |
| 3 or 4 Children | 24 (100.0%) | 0 (0.0%) |
| 5 or more Children | 0 (0.0%) | 0 (0.0%) |
| Total | 143 (100.0%) | 0 (0.0%) |
Income Below Poverty Among Single-Parent Households in Gasburg
| Children | Single Father | Single Mother |
| No Children | 0 (0.0%) | 0 (0.0%) |
| 1 or 2 Children | 0 (0.0%) | 0 (0.0%) |
| 3 or 4 Children | 0 (0.0%) | 0 (0.0%) |
| 5 or more Children | 0 (0.0%) | 0 (0.0%) |
| Total | 0 (0.0%) | 0 (0.0%) |
Income Below Poverty Among Married-Couple vs Single-Parent Households in Gasburg
| Children | Married-Couple Families | Single-Parent Households |
| No Children | 0 (0.0%) | 0 (0.0%) |
| 1 or 2 Children | 0 (0.0%) | 0 (0.0%) |
| 3 or 4 Children | 0 (0.0%) | 0 (0.0%) |
| 5 or more Children | 0 (0.0%) | 0 (0.0%) |
| Total | 0 (0.0%) | 0 (0.0%) |
Race in Gasburg
The most populous races in Gasburg are White / Caucasian (573 | 94.6%), Two or more Races (28 | 4.6%), and Black / African American (5 | 0.8%).
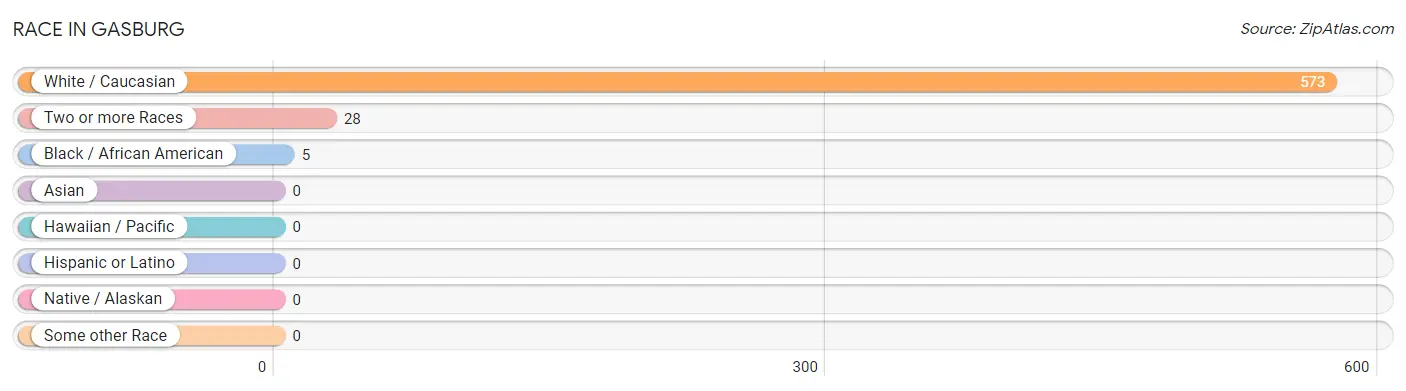
| Race | # Population | % Population |
| Asian | 0 | 0.0% |
| Black / African American | 5 | 0.8% |
| Hawaiian / Pacific | 0 | 0.0% |
| Hispanic or Latino | 0 | 0.0% |
| Native / Alaskan | 0 | 0.0% |
| White / Caucasian | 573 | 94.6% |
| Two or more Races | 28 | 4.6% |
| Some other Race | 0 | 0.0% |
| Total | 606 | 100.0% |
Ancestry in Gasburg
The most populous ancestries reported in Gasburg are English (119 | 19.6%), American (107 | 17.7%), French (72 | 11.9%), German (67 | 11.1%), and Irish (38 | 6.3%), together accounting for 66.5% of all Gasburg residents.
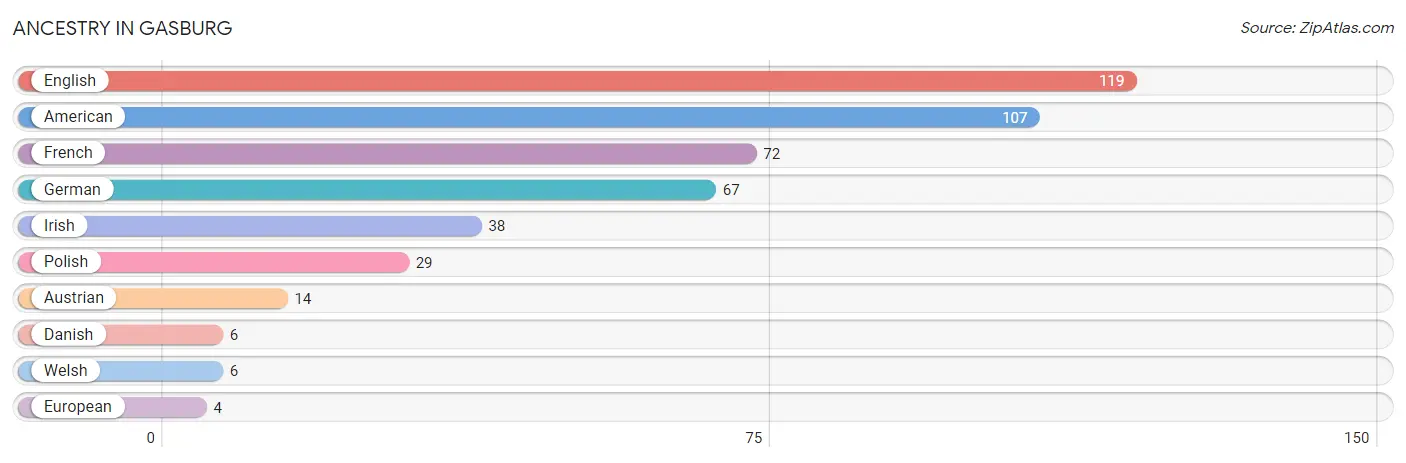
| Ancestry | # Population | % Population |
| American | 107 | 17.7% |
| Austrian | 14 | 2.3% |
| Danish | 6 | 1.0% |
| English | 119 | 19.6% |
| European | 4 | 0.7% |
| French | 72 | 11.9% |
| German | 67 | 11.1% |
| Irish | 38 | 6.3% |
| Polish | 29 | 4.8% |
| Welsh | 6 | 1.0% | View All 10 Rows |
Immigrants in Gasburg

| Immigration Origin | # Population | % Population | View All 0 Rows |
Sex and Age in Gasburg
Sex and Age in Gasburg
The most populous age groups in Gasburg are 60 to 64 Years (33 | 17.7%) for men and 55 to 59 Years (127 | 30.2%) for women.
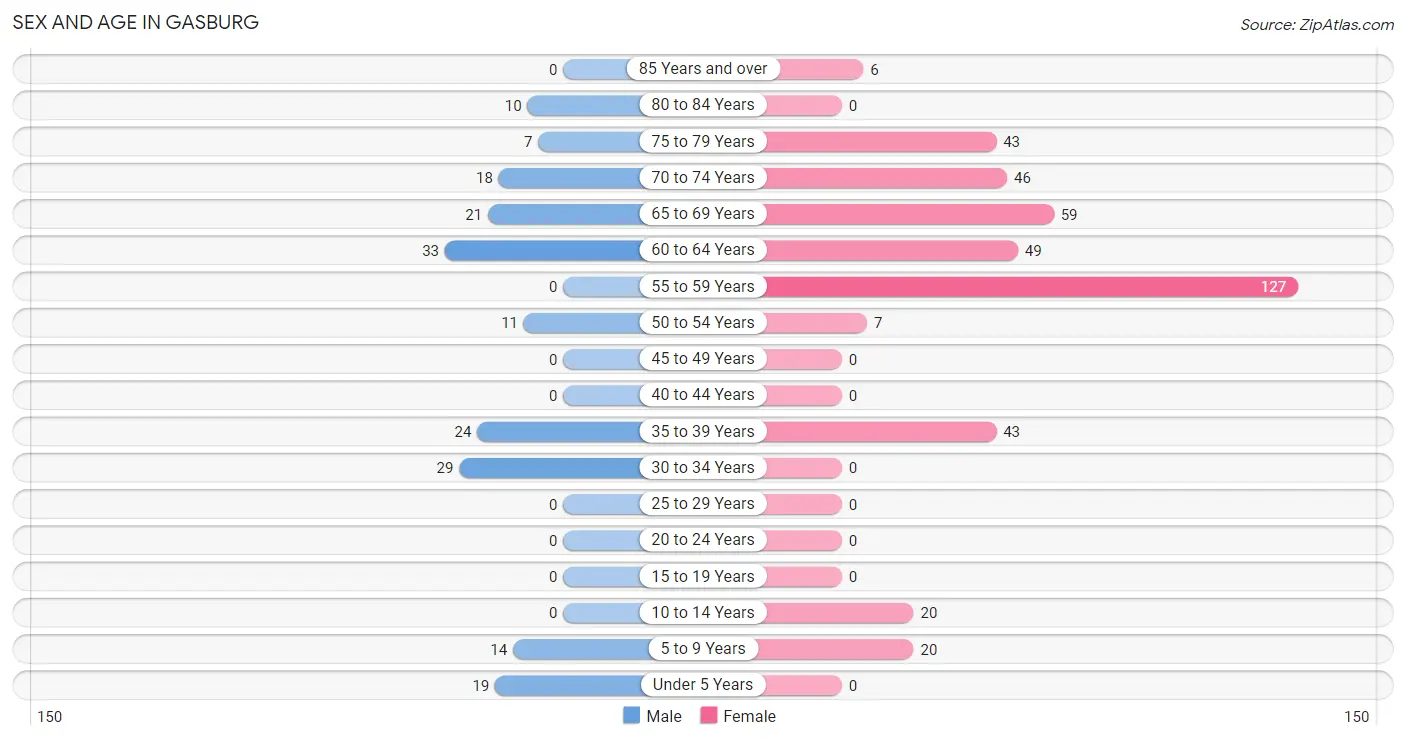
| Age Bracket | Male | Female |
| Under 5 Years | 19 (10.2%) | 0 (0.0%) |
| 5 to 9 Years | 14 (7.5%) | 20 (4.8%) |
| 10 to 14 Years | 0 (0.0%) | 20 (4.8%) |
| 15 to 19 Years | 0 (0.0%) | 0 (0.0%) |
| 20 to 24 Years | 0 (0.0%) | 0 (0.0%) |
| 25 to 29 Years | 0 (0.0%) | 0 (0.0%) |
| 30 to 34 Years | 29 (15.6%) | 0 (0.0%) |
| 35 to 39 Years | 24 (12.9%) | 43 (10.2%) |
| 40 to 44 Years | 0 (0.0%) | 0 (0.0%) |
| 45 to 49 Years | 0 (0.0%) | 0 (0.0%) |
| 50 to 54 Years | 11 (5.9%) | 7 (1.7%) |
| 55 to 59 Years | 0 (0.0%) | 127 (30.2%) |
| 60 to 64 Years | 33 (17.7%) | 49 (11.7%) |
| 65 to 69 Years | 21 (11.3%) | 59 (14.1%) |
| 70 to 74 Years | 18 (9.7%) | 46 (11.0%) |
| 75 to 79 Years | 7 (3.8%) | 43 (10.2%) |
| 80 to 84 Years | 10 (5.4%) | 0 (0.0%) |
| 85 Years and over | 0 (0.0%) | 6 (1.4%) |
| Total | 186 (100.0%) | 420 (100.0%) |
Families and Households in Gasburg
Median Family Size in Gasburg
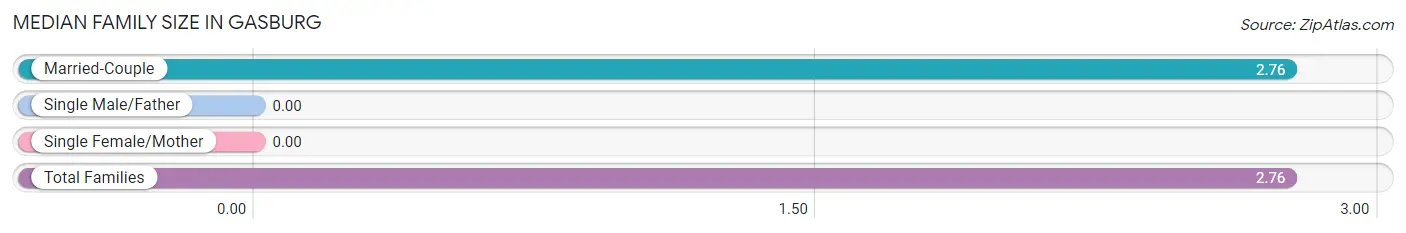
| Family Type | # Families | Family Size |
| Married-Couple | 143 (100.0%) | 2.76 |
| Single Male/Father | 0 (0.0%) | - |
| Single Female/Mother | 0 (0.0%) | - |
| Total Families | 143 (100.0%) | 2.76 |
Median Household Size in Gasburg
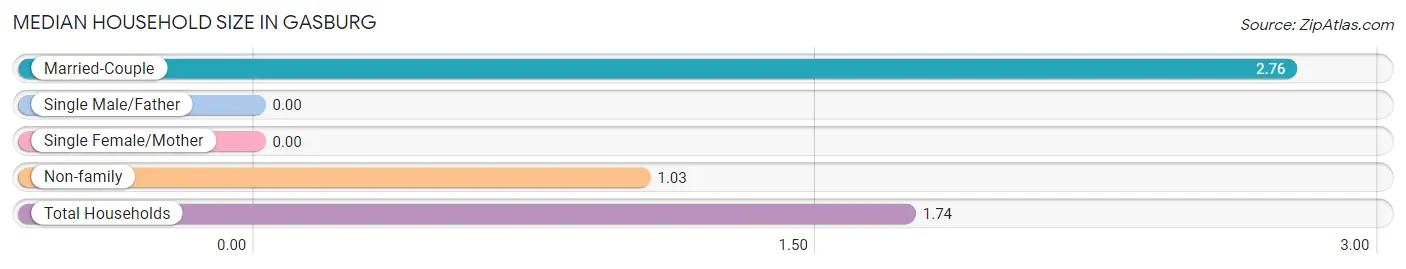
| Household Type | # Households | Household Size |
| Married-Couple | 143 (41.1%) | 2.76 |
| Single Male/Father | 0 (0.0%) | - |
| Single Female/Mother | 0 (0.0%) | - |
| Non-family | 205 (58.9%) | 1.03 |
| Total Households | 348 (100.0%) | 1.74 |
Household Size by Marriage Status in Gasburg
Out of a total of 348 households in Gasburg, 143 (41.1%) are family households, while 205 (58.9%) are nonfamily households. The most numerous type of family households are 2-person households, comprising 100, and the most common type of nonfamily households are 1-person households, comprising 200.
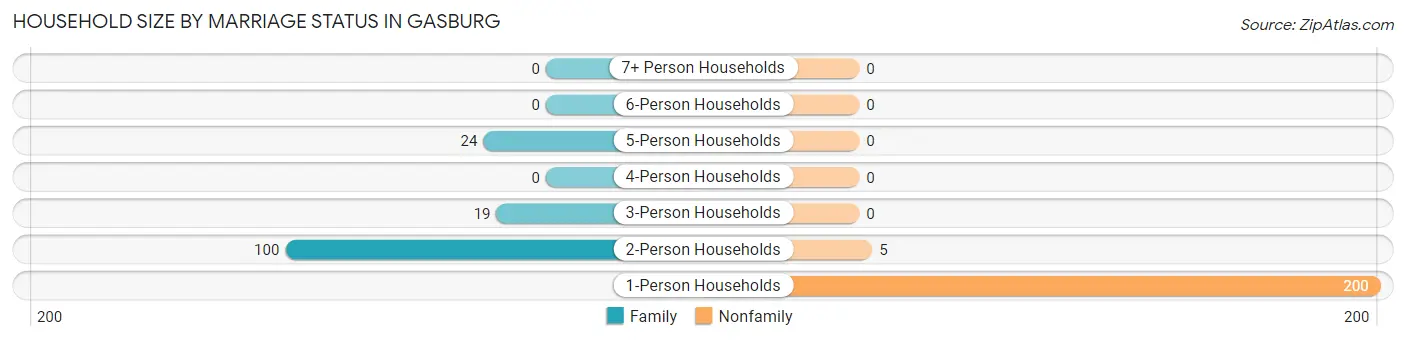
| Household Size | Family Households | Nonfamily Households |
| 1-Person Households | - | 200 (57.5%) |
| 2-Person Households | 100 (28.7%) | 5 (1.4%) |
| 3-Person Households | 19 (5.5%) | 0 (0.0%) |
| 4-Person Households | 0 (0.0%) | 0 (0.0%) |
| 5-Person Households | 24 (6.9%) | 0 (0.0%) |
| 6-Person Households | 0 (0.0%) | 0 (0.0%) |
| 7+ Person Households | 0 (0.0%) | 0 (0.0%) |
| Total | 143 (41.1%) | 205 (58.9%) |
Female Fertility in Gasburg
Fertility by Age in Gasburg
| Age Bracket | Women with Births | Births / 1,000 Women |
| 15 to 19 years | 0 (0.0%) | 0.0 |
| 20 to 34 years | 0 (0.0%) | 0.0 |
| 35 to 50 years | 0 (0.0%) | 0.0 |
| Total | 0 (0.0%) | 0.0 |
Fertility by Age by Marriage Status in Gasburg
| Age Bracket | Married | Unmarried |
| 15 to 19 years | 0 (0.0%) | 0 (0.0%) |
| 20 to 34 years | 0 (0.0%) | 0 (0.0%) |
| 35 to 50 years | 0 (0.0%) | 0 (0.0%) |
| Total | 0 (0.0%) | 0 (0.0%) |
Fertility by Education in Gasburg
| Educational Attainment | Women with Births | Births / 1,000 Women |
| Less than High School | 0 (0.0%) | 0.0 |
| High School Diploma | 0 (0.0%) | 0.0 |
| College or Associate's Degree | 0 (0.0%) | 0.0 |
| Bachelor's Degree | 0 (0.0%) | 0.0 |
| Graduate Degree | 0 (0.0%) | 0.0 |
| Total | 0 (0.0%) | 0.0 |
Fertility by Education by Marriage Status in Gasburg
| Educational Attainment | Married | Unmarried |
| Less than High School | 0 (0.0%) | 0 (0.0%) |
| High School Diploma | 0 (0.0%) | 0 (0.0%) |
| College or Associate's Degree | 0 (0.0%) | 0 (0.0%) |
| Bachelor's Degree | 0 (0.0%) | 0 (0.0%) |
| Graduate Degree | 0 (0.0%) | 0 (0.0%) |
| Total | 0 (0.0%) | 0 (0.0%) |
Employment Characteristics in Gasburg
Employment by Class of Employer in Gasburg
Among the 161 employed individuals in Gasburg, private company employees (114 | 70.8%), not-for-profit organizations (24 | 14.9%), and self-employed (not incorporated) (23 | 14.3%) make up the most common classes of employment.
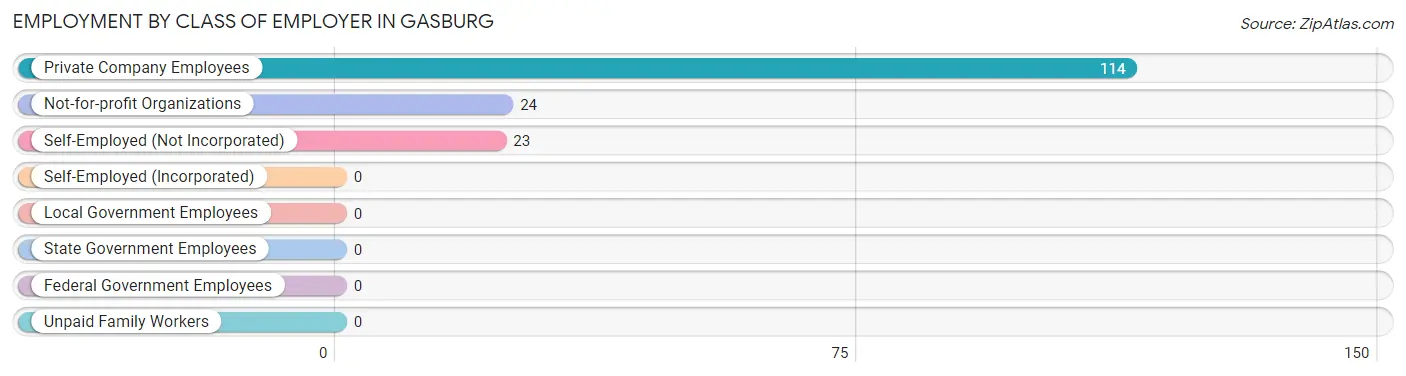
| Employer Class | # Employees | % Employees |
| Private Company Employees | 114 | 70.8% |
| Self-Employed (Incorporated) | 0 | 0.0% |
| Self-Employed (Not Incorporated) | 23 | 14.3% |
| Not-for-profit Organizations | 24 | 14.9% |
| Local Government Employees | 0 | 0.0% |
| State Government Employees | 0 | 0.0% |
| Federal Government Employees | 0 | 0.0% |
| Unpaid Family Workers | 0 | 0.0% |
| Total | 161 | 100.0% |
Employment Status by Age in Gasburg
According to the labor force statistics for Gasburg, out of the total population over 16 years of age (533), 38.6% or 206 individuals are in the labor force, with 10.2% or 21 of them unemployed. The age group with the highest labor force participation rate is 30 to 34 years, with 100.0% or 29 individuals in the labor force. Within the labor force, the 45 to 54 years age range has the highest percentage of unemployed individuals, with 61.1% or 11 of them being unemployed.
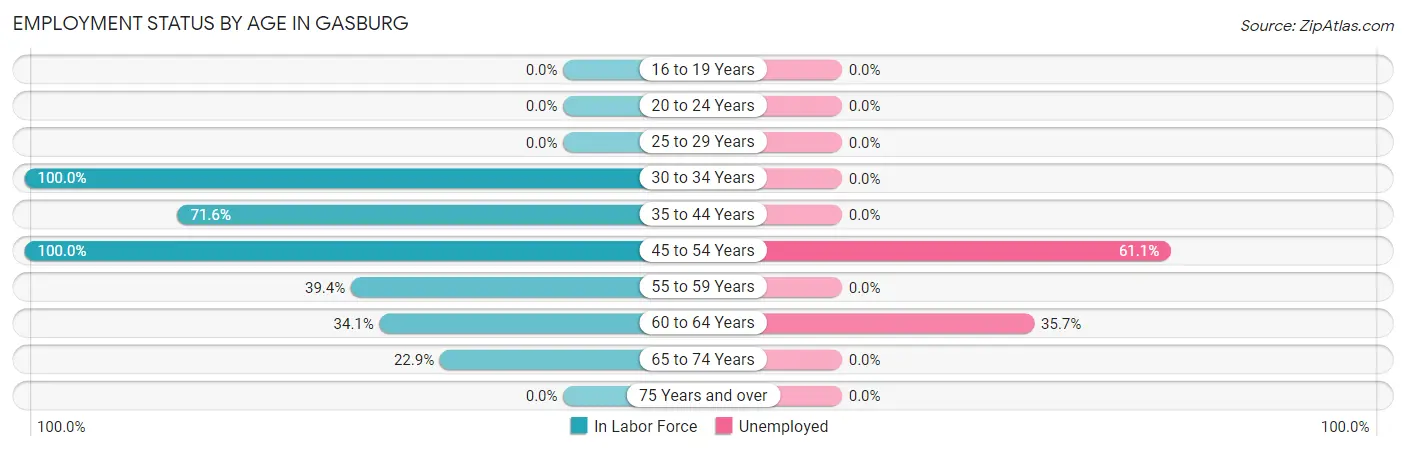
| Age Bracket | In Labor Force | Unemployed |
| 16 to 19 Years | 0 (0.0%) | 0 (0.0%) |
| 20 to 24 Years | 0 (0.0%) | 0 (0.0%) |
| 25 to 29 Years | 0 (0.0%) | 0 (0.0%) |
| 30 to 34 Years | 29 (100.0%) | 0 (0.0%) |
| 35 to 44 Years | 48 (71.6%) | 0 (0.0%) |
| 45 to 54 Years | 18 (100.0%) | 11 (61.1%) |
| 55 to 59 Years | 50 (39.4%) | 0 (0.0%) |
| 60 to 64 Years | 28 (34.1%) | 10 (35.7%) |
| 65 to 74 Years | 33 (22.9%) | 0 (0.0%) |
| 75 Years and over | 0 (0.0%) | 0 (0.0%) |
| Total | 206 (38.6%) | 21 (10.2%) |
Employment Status by Educational Attainment in Gasburg
According to labor force statistics for Gasburg, 53.6% of individuals (173) out of the total population between 25 and 64 years of age (323) are in the labor force, with 12.1% or 21 of them being unemployed. The group with the highest labor force participation rate are those with the educational attainment of high school diploma, with 100.0% or 57 individuals in the labor force. Within the labor force, individuals with college / associate degree education have the highest percentage of unemployment, with 48.6% or 17 of them being unemployed.
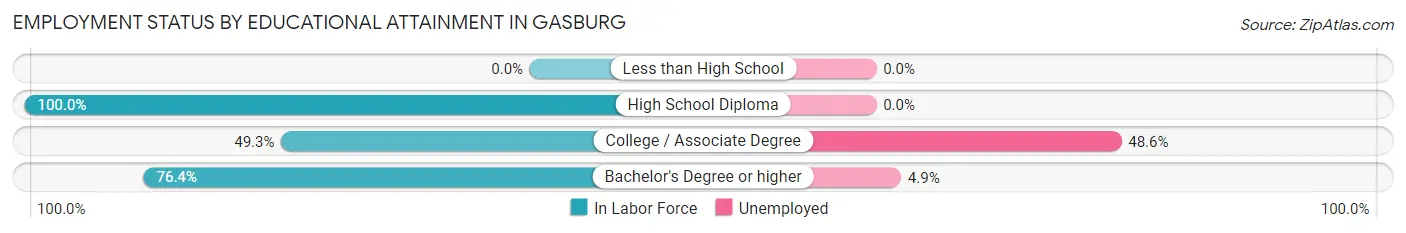
| Educational Attainment | In Labor Force | Unemployed |
| Less than High School | 0 (0.0%) | 0 (0.0%) |
| High School Diploma | 57 (100.0%) | 0 (0.0%) |
| College / Associate Degree | 35 (49.3%) | 35 (48.6%) |
| Bachelor's Degree or higher | 81 (76.4%) | 5 (4.9%) |
| Total | 173 (53.6%) | 39 (12.1%) |
Employment Occupations by Sex in Gasburg
Management, Business, Science and Arts Occupations
The most common Management, Business, Science and Arts occupations in Gasburg are Health Diagnosing & Treating (29 | 15.7%), Health Technologists (29 | 15.7%), Community & Social Service (24 | 13.0%), and Education, Arts & Media (24 | 13.0%).
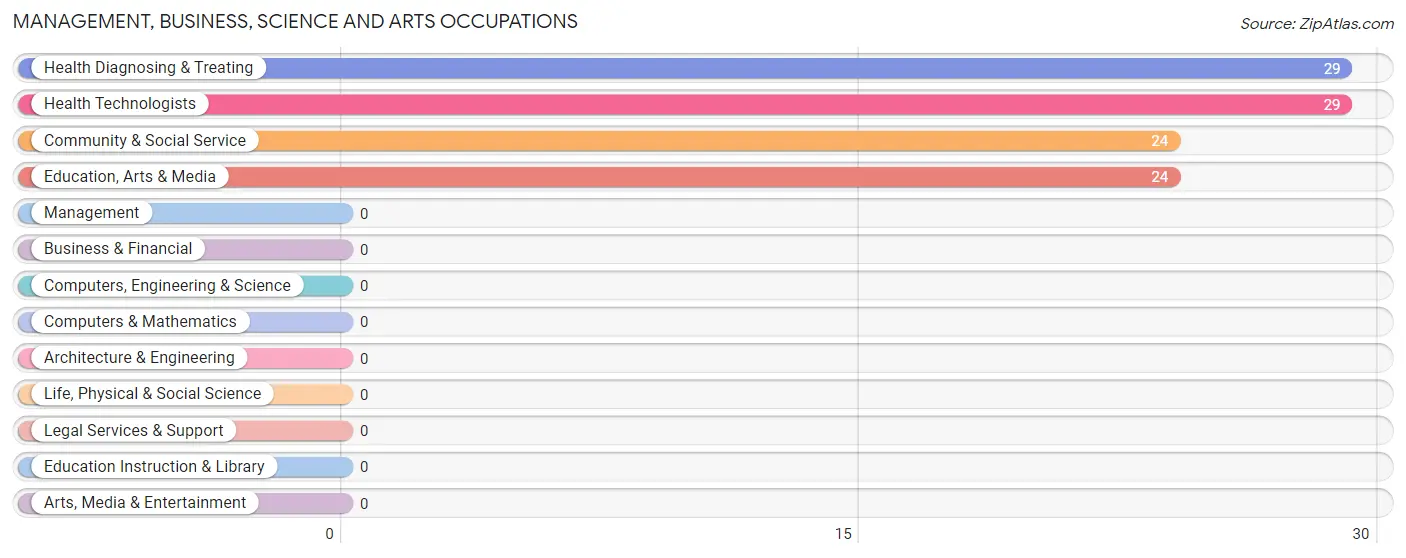
Management, Business, Science and Arts Occupations by Sex
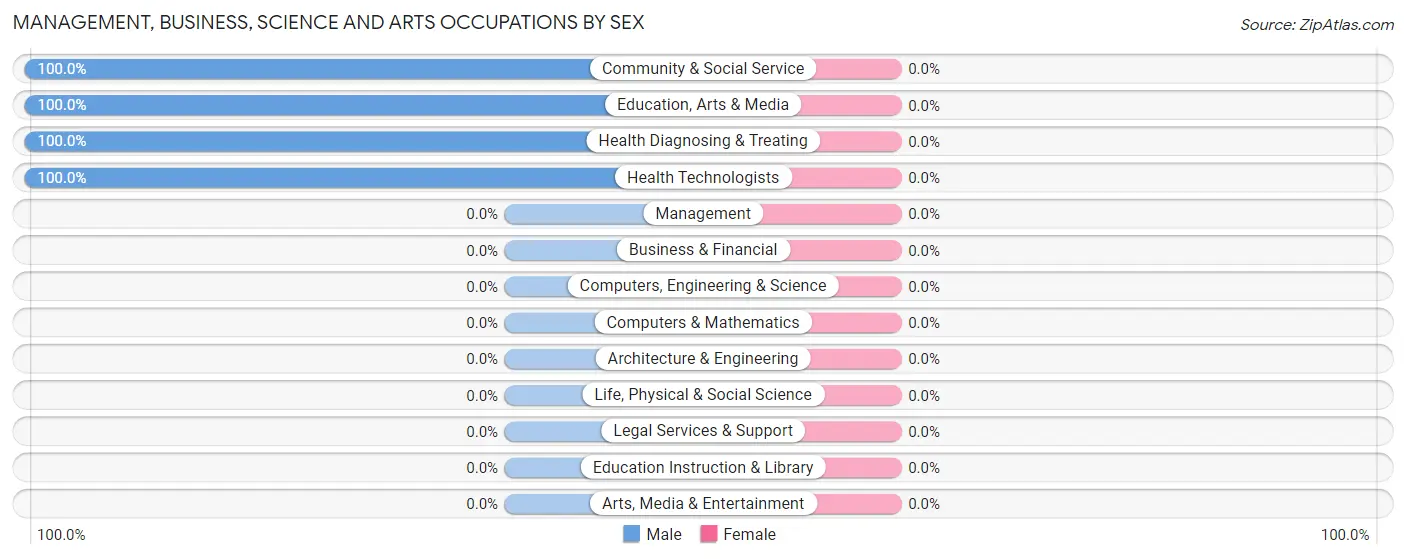
| Occupation | Male | Female |
| Management | 0 (0.0%) | 0 (0.0%) |
| Business & Financial | 0 (0.0%) | 0 (0.0%) |
| Computers, Engineering & Science | 0 (0.0%) | 0 (0.0%) |
| Computers & Mathematics | 0 (0.0%) | 0 (0.0%) |
| Architecture & Engineering | 0 (0.0%) | 0 (0.0%) |
| Life, Physical & Social Science | 0 (0.0%) | 0 (0.0%) |
| Community & Social Service | 24 (100.0%) | 0 (0.0%) |
| Education, Arts & Media | 24 (100.0%) | 0 (0.0%) |
| Legal Services & Support | 0 (0.0%) | 0 (0.0%) |
| Education Instruction & Library | 0 (0.0%) | 0 (0.0%) |
| Arts, Media & Entertainment | 0 (0.0%) | 0 (0.0%) |
| Health Diagnosing & Treating | 29 (100.0%) | 0 (0.0%) |
| Health Technologists | 29 (100.0%) | 0 (0.0%) |
| Total (Category) | 53 (100.0%) | 0 (0.0%) |
| Total (Overall) | 76 (41.1%) | 109 (58.9%) |
Services Occupations
Services Occupations by Sex
| Occupation | Male | Female |
| Healthcare Support | 0 (0.0%) | 0 (0.0%) |
| Security & Protection | 0 (0.0%) | 0 (0.0%) |
| Firefighting & Prevention | 0 (0.0%) | 0 (0.0%) |
| Law Enforcement | 0 (0.0%) | 0 (0.0%) |
| Food Preparation & Serving | 0 (0.0%) | 0 (0.0%) |
| Cleaning & Maintenance | 0 (0.0%) | 0 (0.0%) |
| Personal Care & Service | 0 (0.0%) | 0 (0.0%) |
| Total (Category) | 0 (0.0%) | 0 (0.0%) |
| Total (Overall) | 76 (41.1%) | 109 (58.9%) |
Sales and Office Occupations
The most common Sales and Office occupations in Gasburg are , and Sales & Related (108 | 58.4%).
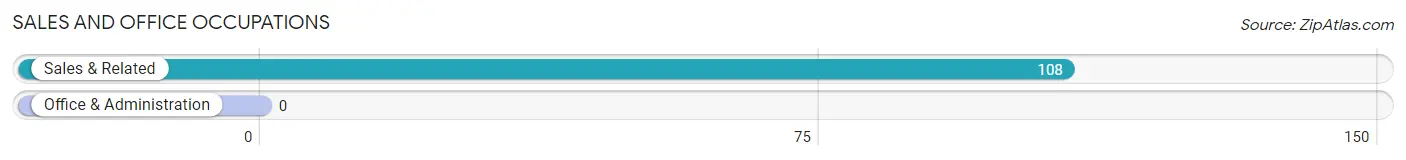
Sales and Office Occupations by Sex

| Occupation | Male | Female |
| Sales & Related | 16 (14.8%) | 92 (85.2%) |
| Office & Administration | 0 (0.0%) | 0 (0.0%) |
| Total (Category) | 16 (14.8%) | 92 (85.2%) |
| Total (Overall) | 76 (41.1%) | 109 (58.9%) |
Natural Resources, Construction and Maintenance Occupations

Natural Resources, Construction and Maintenance Occupations by Sex
| Occupation | Male | Female |
| Farming, Fishing & Forestry | 0 (0.0%) | 0 (0.0%) |
| Construction & Extraction | 0 (0.0%) | 0 (0.0%) |
| Installation, Maintenance & Repair | 0 (0.0%) | 0 (0.0%) |
| Total (Category) | 0 (0.0%) | 0 (0.0%) |
| Total (Overall) | 76 (41.1%) | 109 (58.9%) |
Production, Transportation and Moving Occupations
The most common Production, Transportation and Moving occupations in Gasburg are Production (17 | 9.2%), and Transportation (7 | 3.8%).
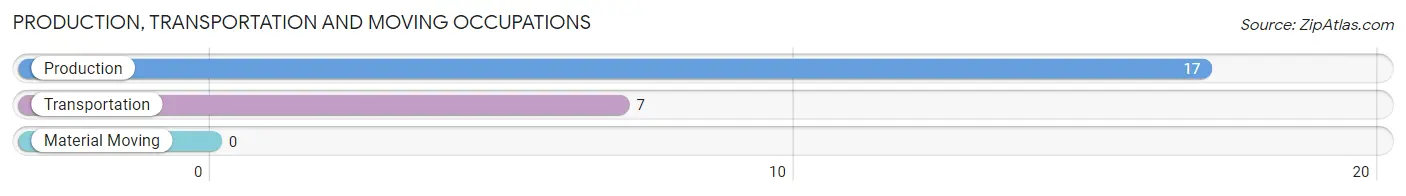
Production, Transportation and Moving Occupations by Sex
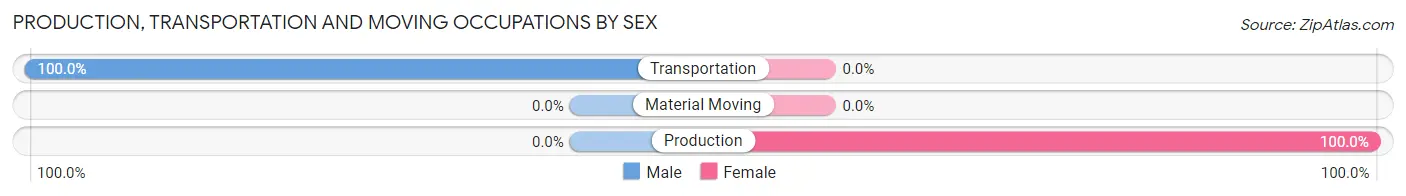
| Occupation | Male | Female |
| Production | 0 (0.0%) | 17 (100.0%) |
| Transportation | 7 (100.0%) | 0 (0.0%) |
| Material Moving | 0 (0.0%) | 0 (0.0%) |
| Total (Category) | 7 (29.2%) | 17 (70.8%) |
| Total (Overall) | 76 (41.1%) | 109 (58.9%) |
Employment Industries by Sex in Gasburg
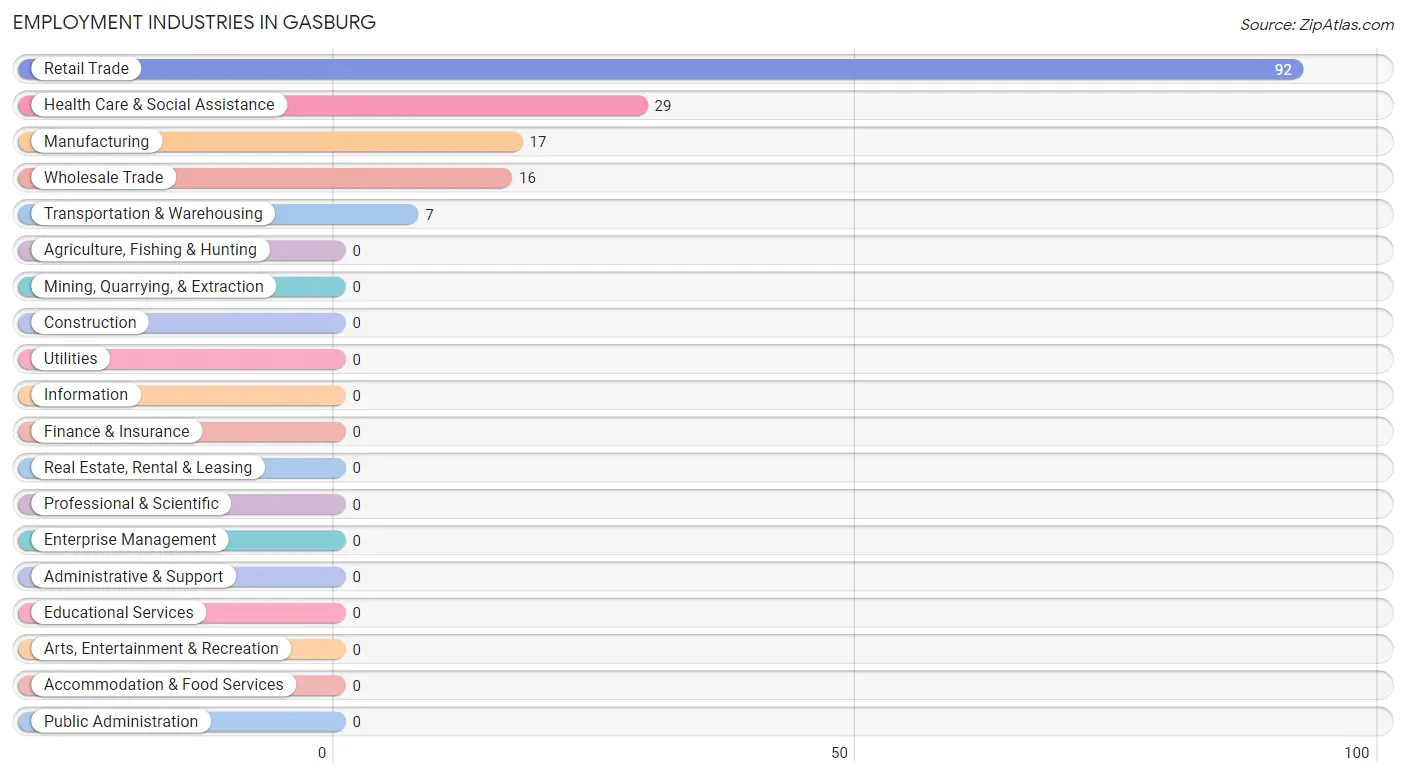
Employment Industries in Gasburg
The major employment industries in Gasburg include Retail Trade (92 | 49.7%), Health Care & Social Assistance (29 | 15.7%), Manufacturing (17 | 9.2%), Wholesale Trade (16 | 8.6%), and Transportation & Warehousing (7 | 3.8%).
Employment Industries by Sex in Gasburg
The Gasburg industries that see more men than women are Wholesale Trade (100.0%), Transportation & Warehousing (100.0%), and Health Care & Social Assistance (100.0%), whereas the industries that tend to have a higher number of women are Manufacturing (100.0%), and Retail Trade (100.0%).
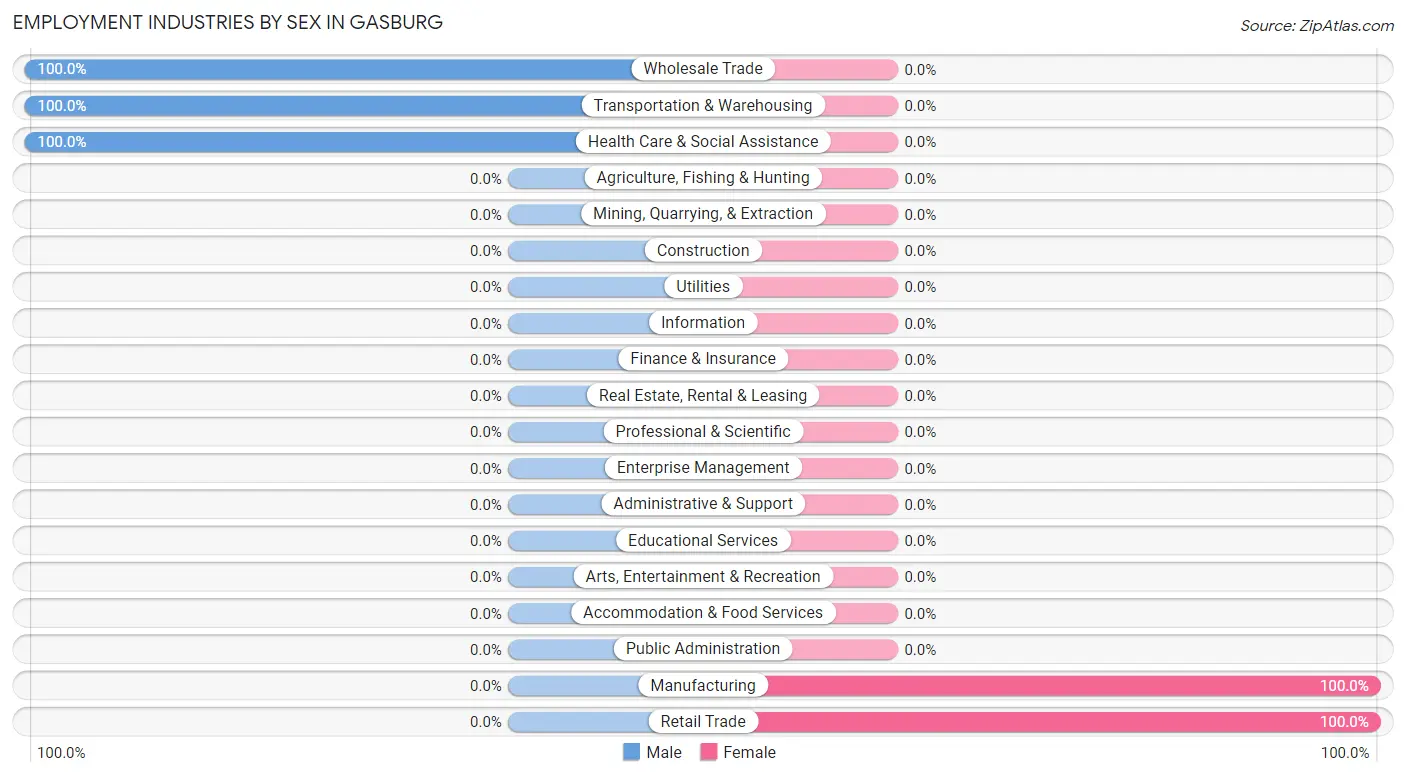
| Industry | Male | Female |
| Agriculture, Fishing & Hunting | 0 (0.0%) | 0 (0.0%) |
| Mining, Quarrying, & Extraction | 0 (0.0%) | 0 (0.0%) |
| Construction | 0 (0.0%) | 0 (0.0%) |
| Manufacturing | 0 (0.0%) | 17 (100.0%) |
| Wholesale Trade | 16 (100.0%) | 0 (0.0%) |
| Retail Trade | 0 (0.0%) | 92 (100.0%) |
| Transportation & Warehousing | 7 (100.0%) | 0 (0.0%) |
| Utilities | 0 (0.0%) | 0 (0.0%) |
| Information | 0 (0.0%) | 0 (0.0%) |
| Finance & Insurance | 0 (0.0%) | 0 (0.0%) |
| Real Estate, Rental & Leasing | 0 (0.0%) | 0 (0.0%) |
| Professional & Scientific | 0 (0.0%) | 0 (0.0%) |
| Enterprise Management | 0 (0.0%) | 0 (0.0%) |
| Administrative & Support | 0 (0.0%) | 0 (0.0%) |
| Educational Services | 0 (0.0%) | 0 (0.0%) |
| Health Care & Social Assistance | 29 (100.0%) | 0 (0.0%) |
| Arts, Entertainment & Recreation | 0 (0.0%) | 0 (0.0%) |
| Accommodation & Food Services | 0 (0.0%) | 0 (0.0%) |
| Public Administration | 0 (0.0%) | 0 (0.0%) |
| Total | 76 (41.1%) | 109 (58.9%) |
Education in Gasburg
School Enrollment in Gasburg
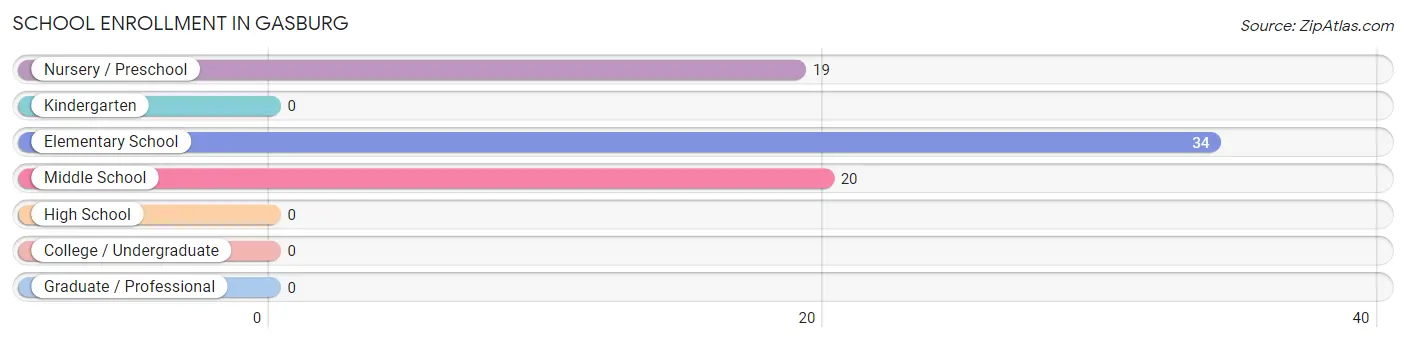
The most common levels of schooling among the 73 students in Gasburg are elementary school (34 | 46.6%), middle school (20 | 27.4%), and nursery / preschool (19 | 26.0%).
| School Level | # Students | % Students |
| Nursery / Preschool | 19 | 26.0% |
| Kindergarten | 0 | 0.0% |
| Elementary School | 34 | 46.6% |
| Middle School | 20 | 27.4% |
| High School | 0 | 0.0% |
| College / Undergraduate | 0 | 0.0% |
| Graduate / Professional | 0 | 0.0% |
| Total | 73 | 100.0% |
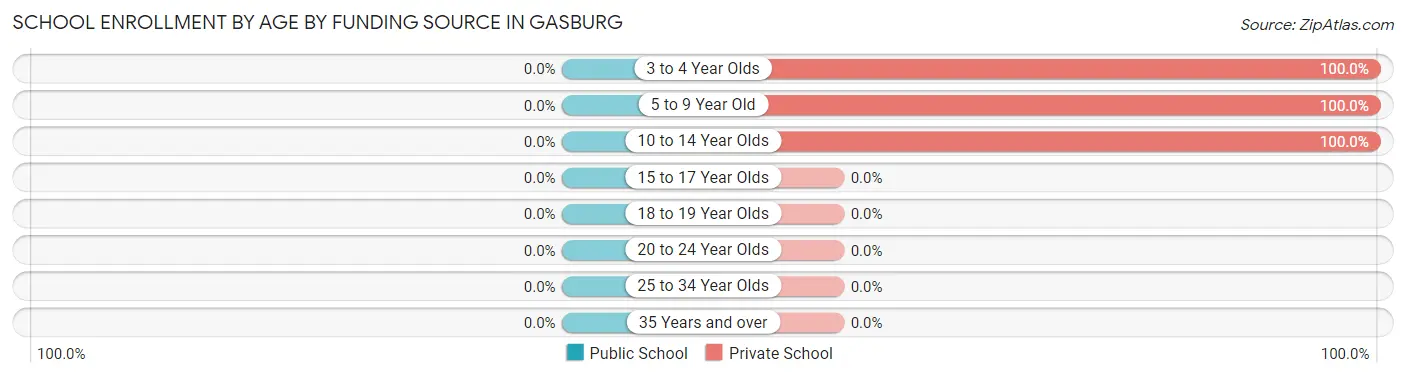
School Enrollment by Age by Funding Source in Gasburg
| Age Bracket | Public School | Private School |
| 3 to 4 Year Olds | 0 (0.0%) | 19 (100.0%) |
| 5 to 9 Year Old | 0 (0.0%) | 34 (100.0%) |
| 10 to 14 Year Olds | 0 (0.0%) | 20 (100.0%) |
| 15 to 17 Year Olds | 0 (0.0%) | 0 (0.0%) |
| 18 to 19 Year Olds | 0 (0.0%) | 0 (0.0%) |
| 20 to 24 Year Olds | 0 (0.0%) | 0 (0.0%) |
| 25 to 34 Year Olds | 0 (0.0%) | 0 (0.0%) |
| 35 Years and over | 0 (0.0%) | 0 (0.0%) |
| Total | 0 (0.0%) | 73 (100.0%) |
Educational Attainment by Field of Study in Gasburg
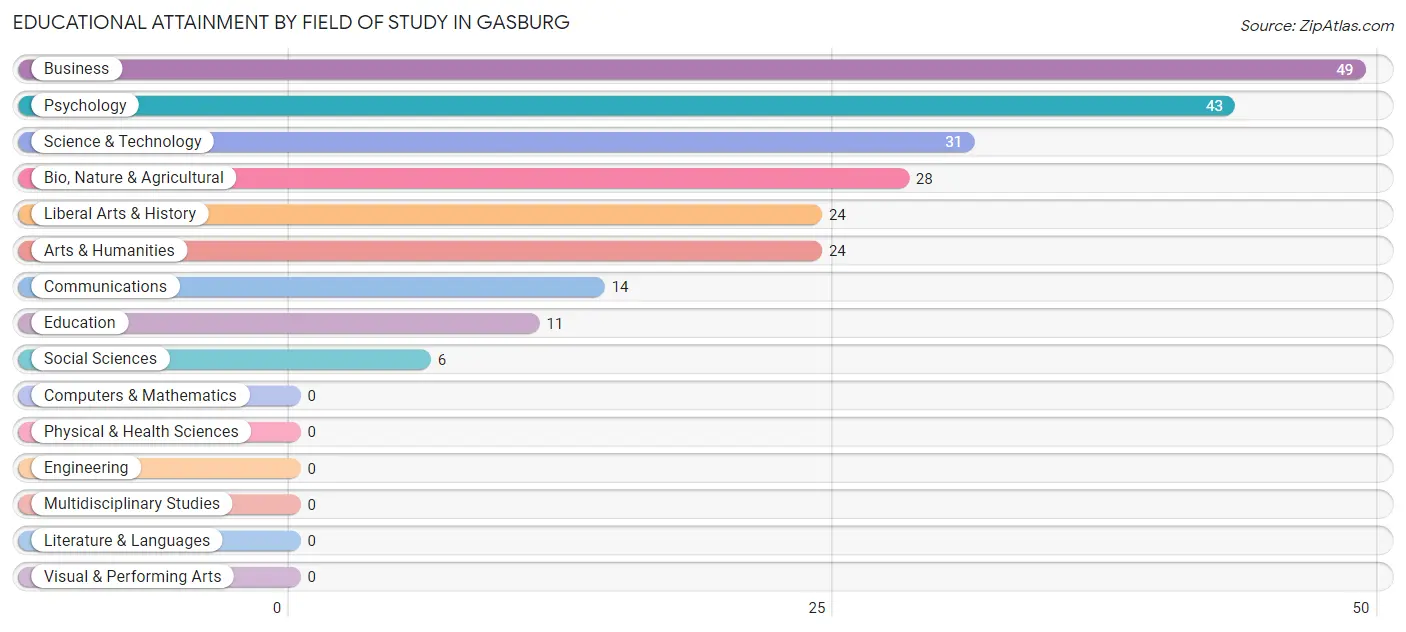
Business (49 | 21.3%), psychology (43 | 18.7%), science & technology (31 | 13.5%), bio, nature & agricultural (28 | 12.2%), and liberal arts & history (24 | 10.4%) are the most common fields of study among 230 individuals in Gasburg who have obtained a bachelor's degree or higher.
| Field of Study | # Graduates | % Graduates |
| Computers & Mathematics | 0 | 0.0% |
| Bio, Nature & Agricultural | 28 | 12.2% |
| Physical & Health Sciences | 0 | 0.0% |
| Psychology | 43 | 18.7% |
| Social Sciences | 6 | 2.6% |
| Engineering | 0 | 0.0% |
| Multidisciplinary Studies | 0 | 0.0% |
| Science & Technology | 31 | 13.5% |
| Business | 49 | 21.3% |
| Education | 11 | 4.8% |
| Literature & Languages | 0 | 0.0% |
| Liberal Arts & History | 24 | 10.4% |
| Visual & Performing Arts | 0 | 0.0% |
| Communications | 14 | 6.1% |
| Arts & Humanities | 24 | 10.4% |
| Total | 230 | 100.0% |
Transportation & Commute in Gasburg
Vehicle Availability by Sex in Gasburg
The most prevalent vehicle ownership categories in Gasburg are males with 4 vehicles (36, accounting for 47.4%) and females with 4 vehicles (0, making up 42.3%).
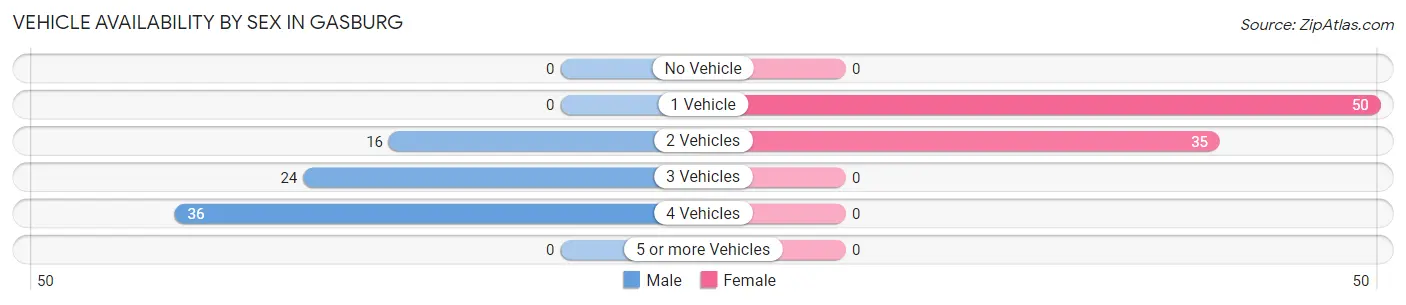
| Vehicles Available | Male | Female |
| No Vehicle | 0 (0.0%) | 0 (0.0%) |
| 1 Vehicle | 0 (0.0%) | 50 (58.8%) |
| 2 Vehicles | 16 (21.0%) | 35 (41.2%) |
| 3 Vehicles | 24 (31.6%) | 0 (0.0%) |
| 4 Vehicles | 36 (47.4%) | 0 (0.0%) |
| 5 or more Vehicles | 0 (0.0%) | 0 (0.0%) |
| Total | 76 (100.0%) | 85 (100.0%) |
Commute Time in Gasburg
The most frequently occuring commute durations in Gasburg are 35 to 39 minutes (50 commuters, 34.7%), 60 to 89 minutes (36 commuters, 25.0%), and less than 5 minutes (24 commuters, 16.7%).
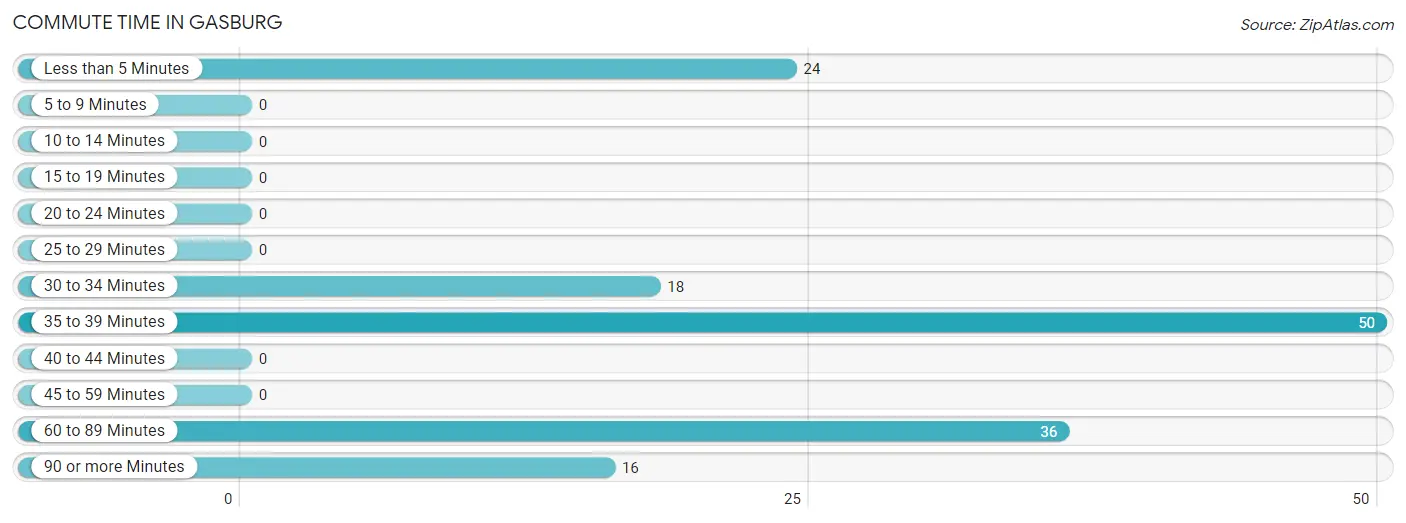
| Commute Time | # Commuters | % Commuters |
| Less than 5 Minutes | 24 | 16.7% |
| 5 to 9 Minutes | 0 | 0.0% |
| 10 to 14 Minutes | 0 | 0.0% |
| 15 to 19 Minutes | 0 | 0.0% |
| 20 to 24 Minutes | 0 | 0.0% |
| 25 to 29 Minutes | 0 | 0.0% |
| 30 to 34 Minutes | 18 | 12.5% |
| 35 to 39 Minutes | 50 | 34.7% |
| 40 to 44 Minutes | 0 | 0.0% |
| 45 to 59 Minutes | 0 | 0.0% |
| 60 to 89 Minutes | 36 | 25.0% |
| 90 or more Minutes | 16 | 11.1% |
Commute Time by Sex in Gasburg
The most common commute times in Gasburg are 60 to 89 minutes (36 commuters, 47.4%) for males and 35 to 39 minutes (50 commuters, 73.5%) for females.
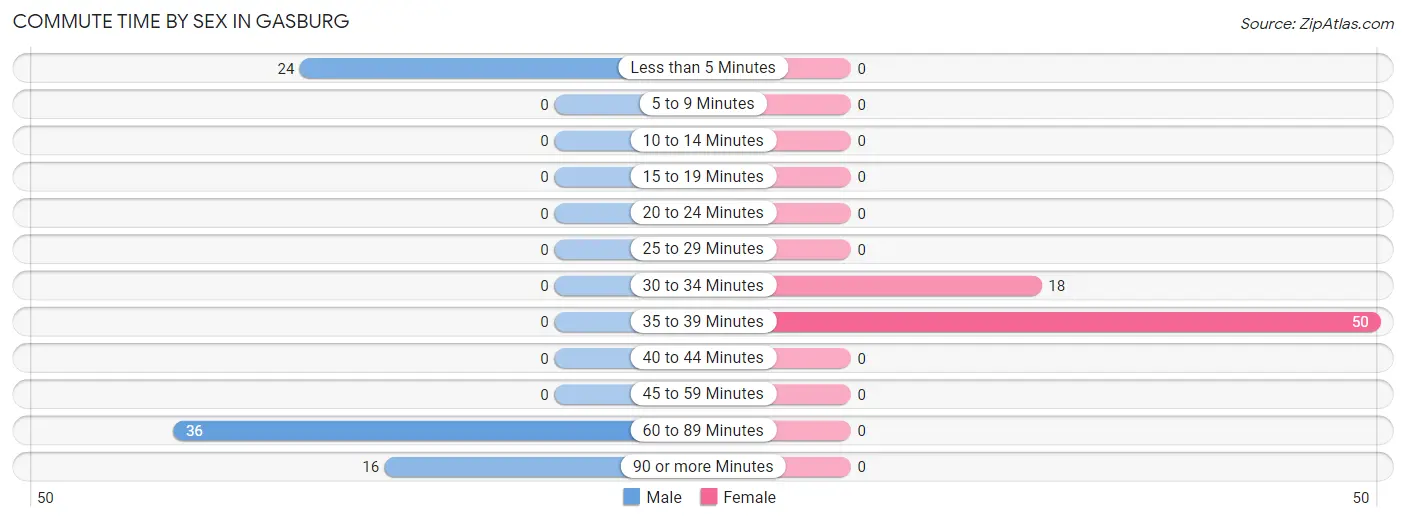
| Commute Time | Male | Female |
| Less than 5 Minutes | 24 (31.6%) | 0 (0.0%) |
| 5 to 9 Minutes | 0 (0.0%) | 0 (0.0%) |
| 10 to 14 Minutes | 0 (0.0%) | 0 (0.0%) |
| 15 to 19 Minutes | 0 (0.0%) | 0 (0.0%) |
| 20 to 24 Minutes | 0 (0.0%) | 0 (0.0%) |
| 25 to 29 Minutes | 0 (0.0%) | 0 (0.0%) |
| 30 to 34 Minutes | 0 (0.0%) | 18 (26.5%) |
| 35 to 39 Minutes | 0 (0.0%) | 50 (73.5%) |
| 40 to 44 Minutes | 0 (0.0%) | 0 (0.0%) |
| 45 to 59 Minutes | 0 (0.0%) | 0 (0.0%) |
| 60 to 89 Minutes | 36 (47.4%) | 0 (0.0%) |
| 90 or more Minutes | 16 (21.0%) | 0 (0.0%) |
Time of Departure to Work by Sex in Gasburg
The most frequent times of departure to work in Gasburg are 5:30 AM to 5:59 AM (53, 69.7%) for males and 6:30 AM to 6:59 AM (50, 73.5%) for females.
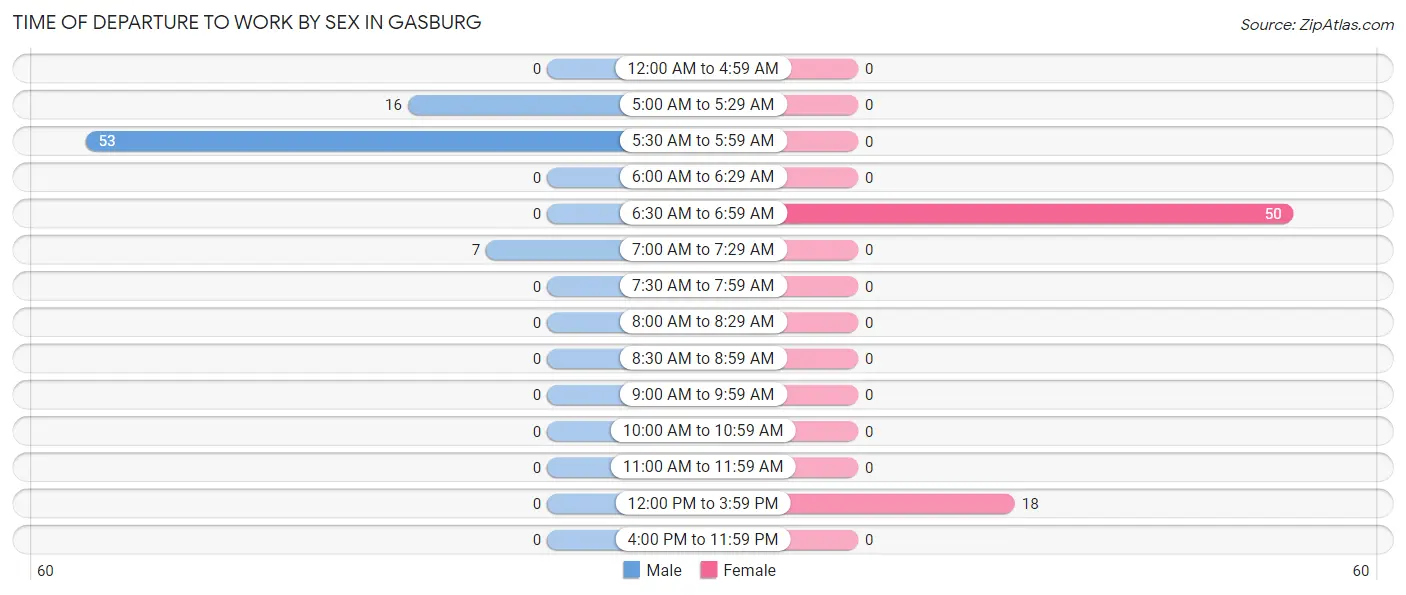
| Time of Departure | Male | Female |
| 12:00 AM to 4:59 AM | 0 (0.0%) | 0 (0.0%) |
| 5:00 AM to 5:29 AM | 16 (21.0%) | 0 (0.0%) |
| 5:30 AM to 5:59 AM | 53 (69.7%) | 0 (0.0%) |
| 6:00 AM to 6:29 AM | 0 (0.0%) | 0 (0.0%) |
| 6:30 AM to 6:59 AM | 0 (0.0%) | 50 (73.5%) |
| 7:00 AM to 7:29 AM | 7 (9.2%) | 0 (0.0%) |
| 7:30 AM to 7:59 AM | 0 (0.0%) | 0 (0.0%) |
| 8:00 AM to 8:29 AM | 0 (0.0%) | 0 (0.0%) |
| 8:30 AM to 8:59 AM | 0 (0.0%) | 0 (0.0%) |
| 9:00 AM to 9:59 AM | 0 (0.0%) | 0 (0.0%) |
| 10:00 AM to 10:59 AM | 0 (0.0%) | 0 (0.0%) |
| 11:00 AM to 11:59 AM | 0 (0.0%) | 0 (0.0%) |
| 12:00 PM to 3:59 PM | 0 (0.0%) | 18 (26.5%) |
| 4:00 PM to 11:59 PM | 0 (0.0%) | 0 (0.0%) |
| Total | 76 (100.0%) | 68 (100.0%) |
Housing Occupancy in Gasburg
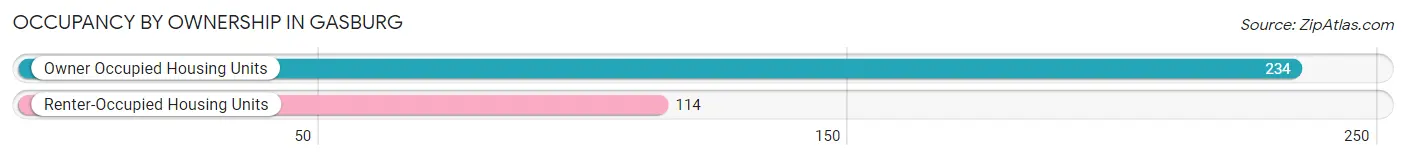
Occupancy by Ownership in Gasburg
Of the total 348 dwellings in Gasburg, owner-occupied units account for 234 (67.2%), while renter-occupied units make up 114 (32.8%).
| Occupancy | # Housing Units | % Housing Units |
| Owner Occupied Housing Units | 234 | 67.2% |
| Renter-Occupied Housing Units | 114 | 32.8% |
| Total Occupied Housing Units | 348 | 100.0% |
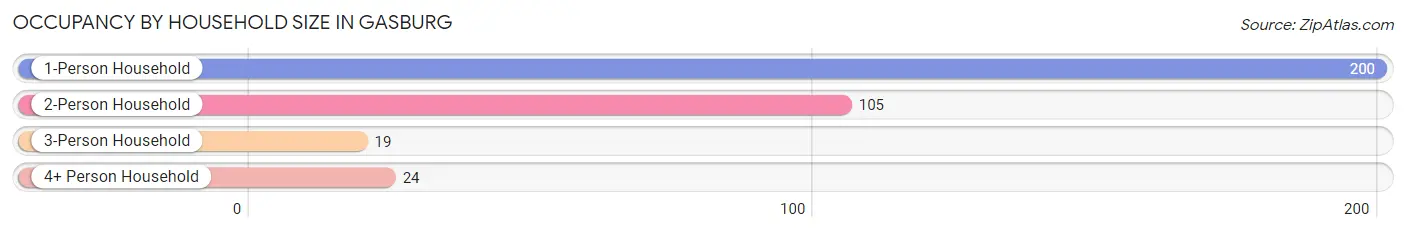
Occupancy by Household Size in Gasburg
| Household Size | # Housing Units | % Housing Units |
| 1-Person Household | 200 | 57.5% |
| 2-Person Household | 105 | 30.2% |
| 3-Person Household | 19 | 5.5% |
| 4+ Person Household | 24 | 6.9% |
| Total Housing Units | 348 | 100.0% |
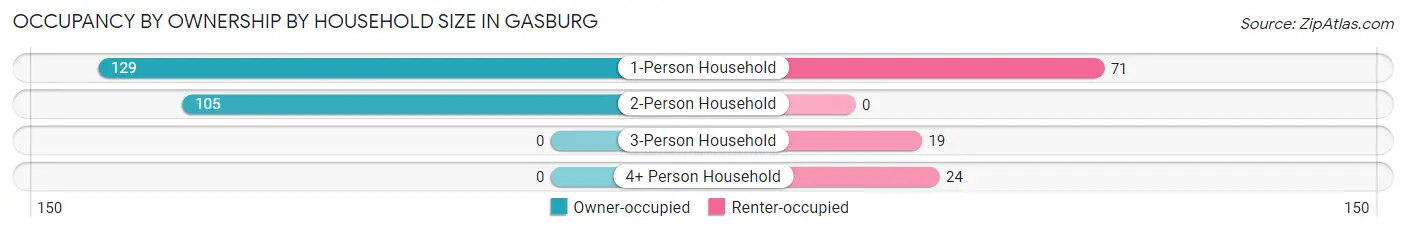
Occupancy by Ownership by Household Size in Gasburg
| Household Size | Owner-occupied | Renter-occupied |
| 1-Person Household | 129 (64.5%) | 71 (35.5%) |
| 2-Person Household | 105 (100.0%) | 0 (0.0%) |
| 3-Person Household | 0 (0.0%) | 19 (100.0%) |
| 4+ Person Household | 0 (0.0%) | 24 (100.0%) |
| Total Housing Units | 234 (67.2%) | 114 (32.8%) |
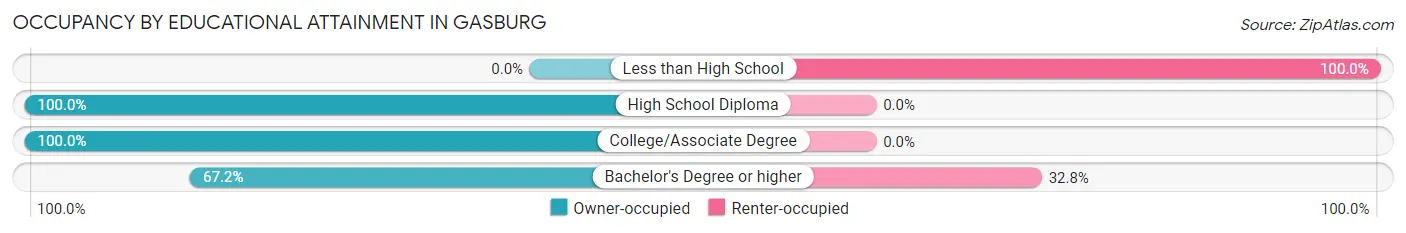
Occupancy by Educational Attainment in Gasburg
| Household Size | Owner-occupied | Renter-occupied |
| Less than High School | 0 (0.0%) | 71 (100.0%) |
| High School Diploma | 63 (100.0%) | 0 (0.0%) |
| College/Associate Degree | 83 (100.0%) | 0 (0.0%) |
| Bachelor's Degree or higher | 88 (67.2%) | 43 (32.8%) |
Occupancy by Age of Householder in Gasburg
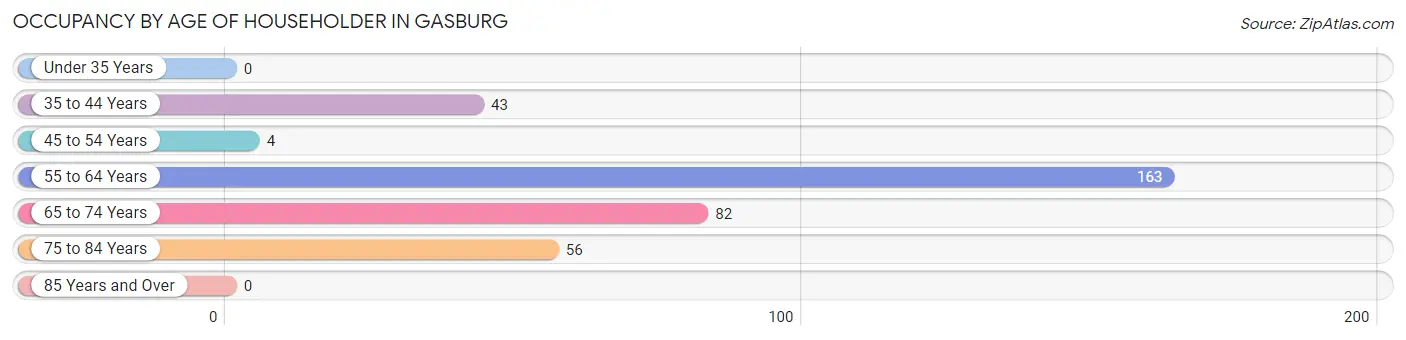
| Age Bracket | # Households | % Households |
| Under 35 Years | 0 | 0.0% |
| 35 to 44 Years | 43 | 12.4% |
| 45 to 54 Years | 4 | 1.1% |
| 55 to 64 Years | 163 | 46.8% |
| 65 to 74 Years | 82 | 23.6% |
| 75 to 84 Years | 56 | 16.1% |
| 85 Years and Over | 0 | 0.0% |
| Total | 348 | 100.0% |
Housing Finances in Gasburg
Median Income by Occupancy in Gasburg
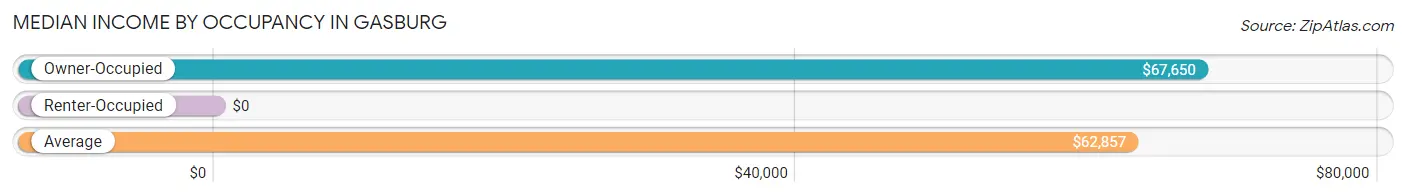
| Occupancy Type | # Households | Median Income |
| Owner-Occupied | 234 (67.2%) | $67,650 |
| Renter-Occupied | 114 (32.8%) | $0 |
| Average | 348 (100.0%) | $62,857 |
Occupancy by Householder Income Bracket in Gasburg
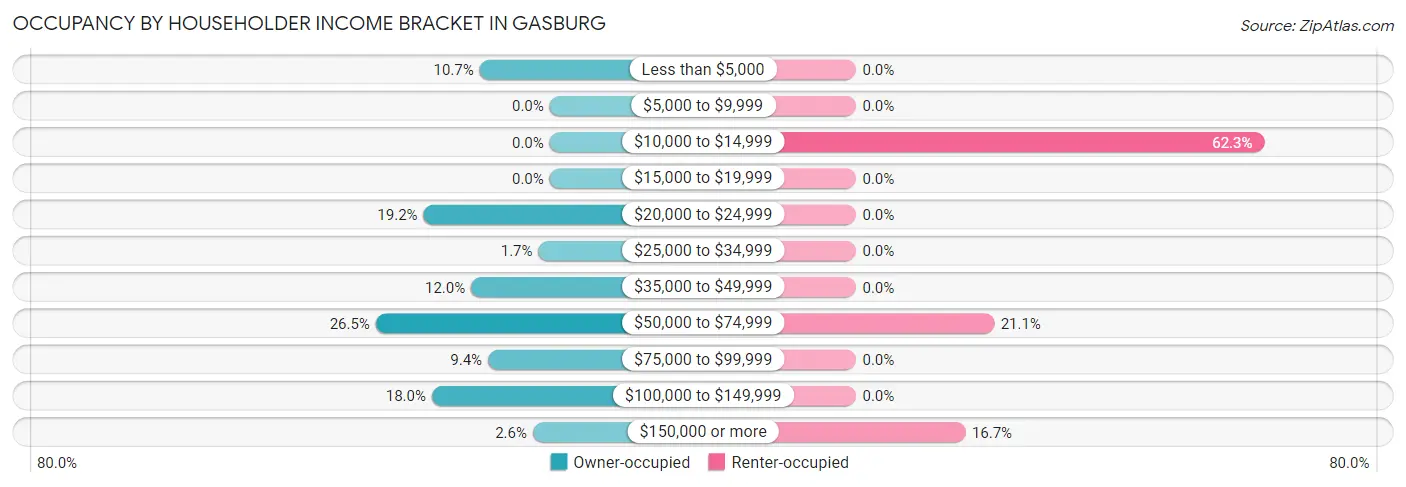
| Income Bracket | Owner-occupied | Renter-occupied |
| Less than $5,000 | 25 (10.7%) | 0 (0.0%) |
| $5,000 to $9,999 | 0 (0.0%) | 0 (0.0%) |
| $10,000 to $14,999 | 0 (0.0%) | 71 (62.3%) |
| $15,000 to $19,999 | 0 (0.0%) | 0 (0.0%) |
| $20,000 to $24,999 | 45 (19.2%) | 0 (0.0%) |
| $25,000 to $34,999 | 4 (1.7%) | 0 (0.0%) |
| $35,000 to $49,999 | 28 (12.0%) | 0 (0.0%) |
| $50,000 to $74,999 | 62 (26.5%) | 24 (21.0%) |
| $75,000 to $99,999 | 22 (9.4%) | 0 (0.0%) |
| $100,000 to $149,999 | 42 (17.9%) | 0 (0.0%) |
| $150,000 or more | 6 (2.6%) | 19 (16.7%) |
| Total | 234 (100.0%) | 114 (100.0%) |
Monthly Housing Cost Tiers in Gasburg
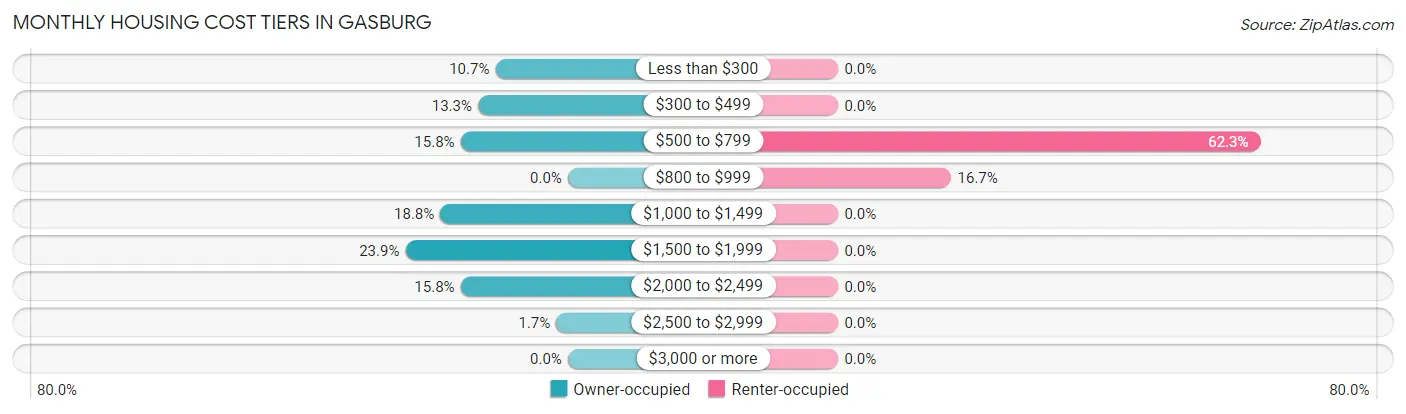
| Monthly Cost | Owner-occupied | Renter-occupied |
| Less than $300 | 25 (10.7%) | 0 (0.0%) |
| $300 to $499 | 31 (13.3%) | 0 (0.0%) |
| $500 to $799 | 37 (15.8%) | 71 (62.3%) |
| $800 to $999 | 0 (0.0%) | 19 (16.7%) |
| $1,000 to $1,499 | 44 (18.8%) | 0 (0.0%) |
| $1,500 to $1,999 | 56 (23.9%) | 0 (0.0%) |
| $2,000 to $2,499 | 37 (15.8%) | 0 (0.0%) |
| $2,500 to $2,999 | 4 (1.7%) | 0 (0.0%) |
| $3,000 or more | 0 (0.0%) | 0 (0.0%) |
| Total | 234 (100.0%) | 114 (100.0%) |
Physical Housing Characteristics in Gasburg
Housing Structures in Gasburg
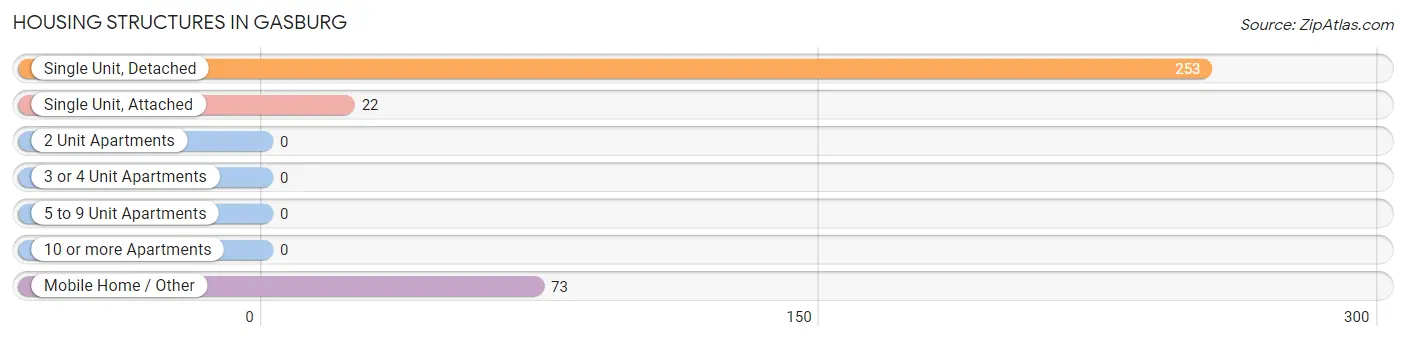
| Structure Type | # Housing Units | % Housing Units |
| Single Unit, Detached | 253 | 72.7% |
| Single Unit, Attached | 22 | 6.3% |
| 2 Unit Apartments | 0 | 0.0% |
| 3 or 4 Unit Apartments | 0 | 0.0% |
| 5 to 9 Unit Apartments | 0 | 0.0% |
| 10 or more Apartments | 0 | 0.0% |
| Mobile Home / Other | 73 | 21.0% |
| Total | 348 | 100.0% |
Housing Structures by Occupancy in Gasburg
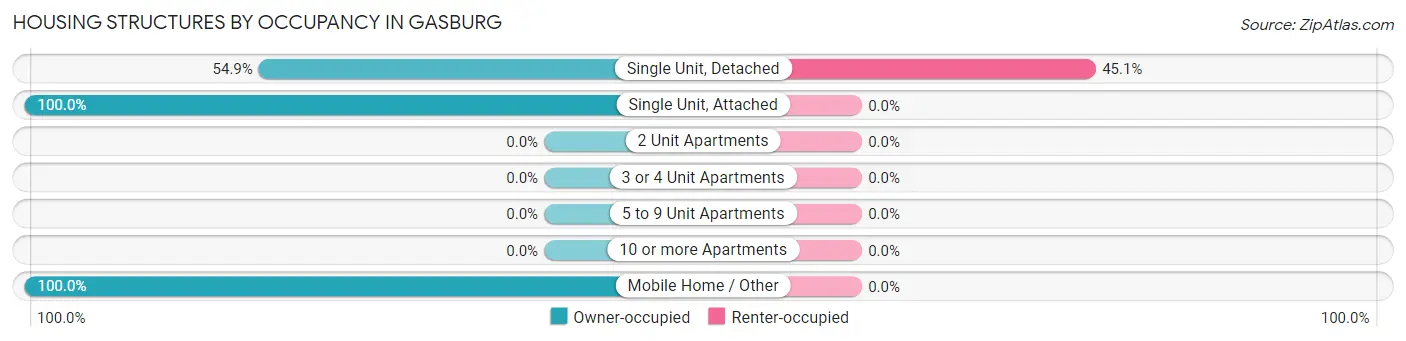
| Structure Type | Owner-occupied | Renter-occupied |
| Single Unit, Detached | 139 (54.9%) | 114 (45.1%) |
| Single Unit, Attached | 22 (100.0%) | 0 (0.0%) |
| 2 Unit Apartments | 0 (0.0%) | 0 (0.0%) |
| 3 or 4 Unit Apartments | 0 (0.0%) | 0 (0.0%) |
| 5 to 9 Unit Apartments | 0 (0.0%) | 0 (0.0%) |
| 10 or more Apartments | 0 (0.0%) | 0 (0.0%) |
| Mobile Home / Other | 73 (100.0%) | 0 (0.0%) |
| Total | 234 (67.2%) | 114 (32.8%) |
Housing Structures by Number of Rooms in Gasburg
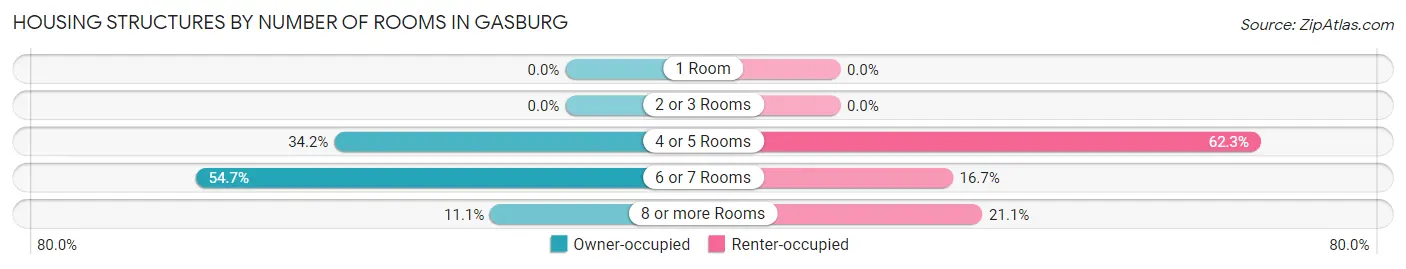
| Number of Rooms | Owner-occupied | Renter-occupied |
| 1 Room | 0 (0.0%) | 0 (0.0%) |
| 2 or 3 Rooms | 0 (0.0%) | 0 (0.0%) |
| 4 or 5 Rooms | 80 (34.2%) | 71 (62.3%) |
| 6 or 7 Rooms | 128 (54.7%) | 19 (16.7%) |
| 8 or more Rooms | 26 (11.1%) | 24 (21.0%) |
| Total | 234 (100.0%) | 114 (100.0%) |
Housing Structure by Heating Type in Gasburg
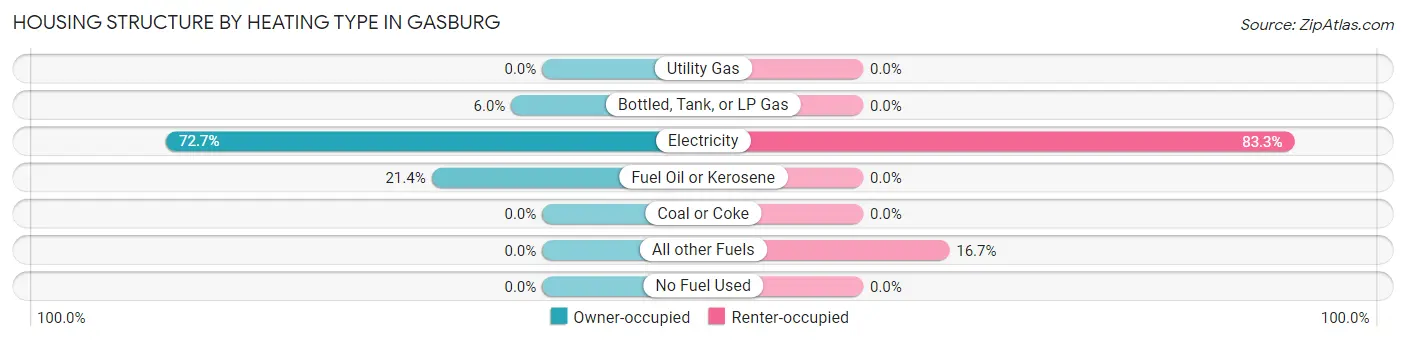
| Heating Type | Owner-occupied | Renter-occupied |
| Utility Gas | 0 (0.0%) | 0 (0.0%) |
| Bottled, Tank, or LP Gas | 14 (6.0%) | 0 (0.0%) |
| Electricity | 170 (72.7%) | 95 (83.3%) |
| Fuel Oil or Kerosene | 50 (21.4%) | 0 (0.0%) |
| Coal or Coke | 0 (0.0%) | 0 (0.0%) |
| All other Fuels | 0 (0.0%) | 19 (16.7%) |
| No Fuel Used | 0 (0.0%) | 0 (0.0%) |
| Total | 234 (100.0%) | 114 (100.0%) |
Household Vehicle Usage in Gasburg
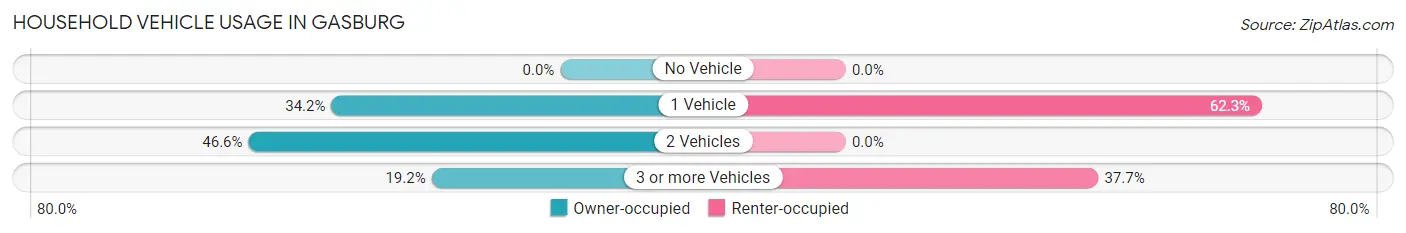
| Vehicles per Household | Owner-occupied | Renter-occupied |
| No Vehicle | 0 (0.0%) | 0 (0.0%) |
| 1 Vehicle | 80 (34.2%) | 71 (62.3%) |
| 2 Vehicles | 109 (46.6%) | 0 (0.0%) |
| 3 or more Vehicles | 45 (19.2%) | 43 (37.7%) |
| Total | 234 (100.0%) | 114 (100.0%) |
Real Estate & Mortgages in Gasburg
Real Estate and Mortgage Overview in Gasburg
| Characteristic | Without Mortgage | With Mortgage |
| Housing Units | 74 | 160 |
| Median Property Value | - | - |
| Median Household Income | - | - |
| Monthly Housing Costs | $326 | $0 |
| Real Estate Taxes | $652 | $0 |
Property Value by Mortgage Status in Gasburg
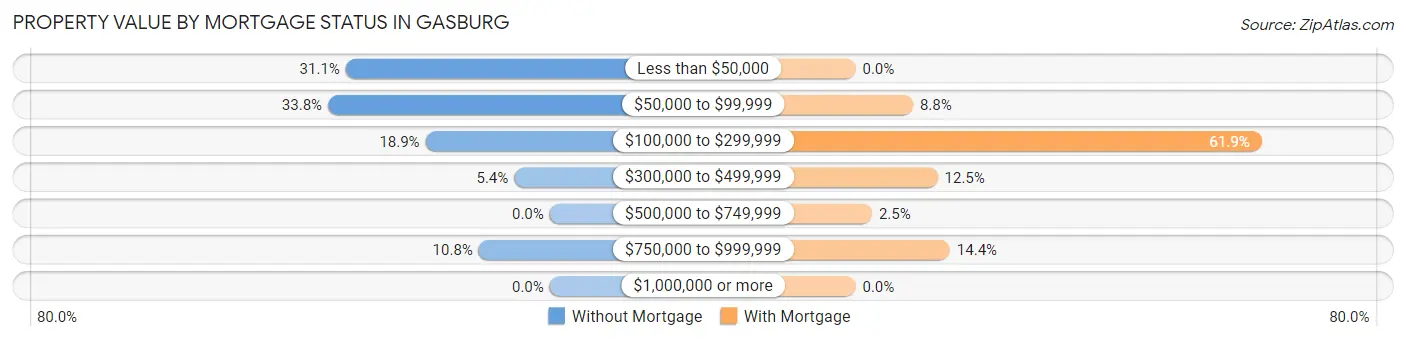
| Property Value | Without Mortgage | With Mortgage |
| Less than $50,000 | 23 (31.1%) | 0 (0.0%) |
| $50,000 to $99,999 | 25 (33.8%) | 14 (8.7%) |
| $100,000 to $299,999 | 14 (18.9%) | 99 (61.9%) |
| $300,000 to $499,999 | 4 (5.4%) | 20 (12.5%) |
| $500,000 to $749,999 | 0 (0.0%) | 4 (2.5%) |
| $750,000 to $999,999 | 8 (10.8%) | 23 (14.4%) |
| $1,000,000 or more | 0 (0.0%) | 0 (0.0%) |
| Total | 74 (100.0%) | 160 (100.0%) |
Household Income by Mortgage Status in Gasburg
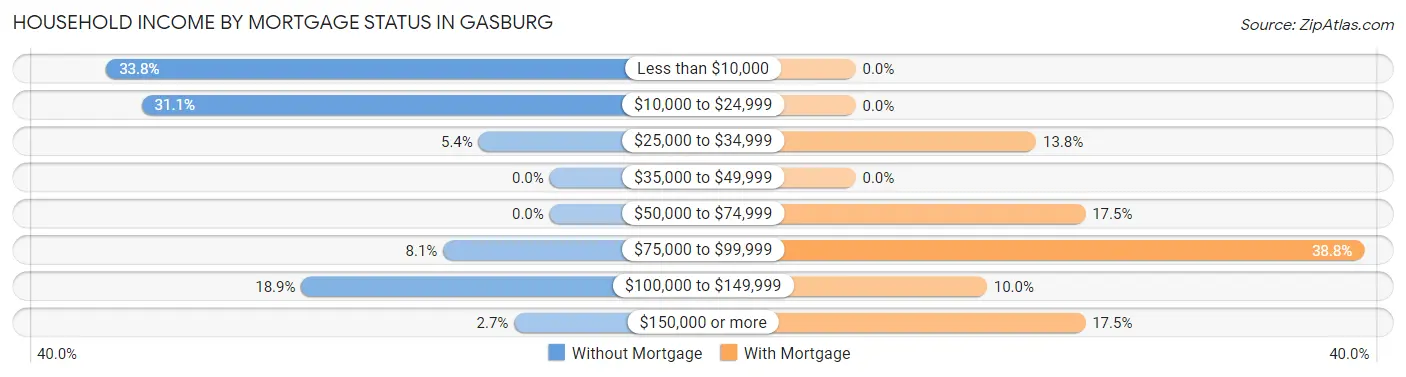
| Household Income | Without Mortgage | With Mortgage |
| Less than $10,000 | 25 (33.8%) | 0 (0.0%) |
| $10,000 to $24,999 | 23 (31.1%) | 0 (0.0%) |
| $25,000 to $34,999 | 4 (5.4%) | 22 (13.8%) |
| $35,000 to $49,999 | 0 (0.0%) | 0 (0.0%) |
| $50,000 to $74,999 | 0 (0.0%) | 28 (17.5%) |
| $75,000 to $99,999 | 6 (8.1%) | 62 (38.8%) |
| $100,000 to $149,999 | 14 (18.9%) | 16 (10.0%) |
| $150,000 or more | 2 (2.7%) | 28 (17.5%) |
| Total | 74 (100.0%) | 160 (100.0%) |
Property Value to Household Income Ratio in Gasburg
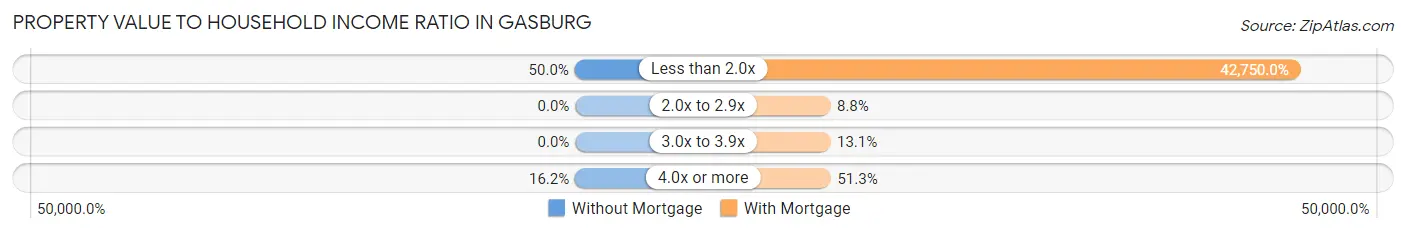
| Value-to-Income Ratio | Without Mortgage | With Mortgage |
| Less than 2.0x | 37 (50.0%) | 68,400 (42,750.0%) |
| 2.0x to 2.9x | 0 (0.0%) | 14 (8.7%) |
| 3.0x to 3.9x | 0 (0.0%) | 21 (13.1%) |
| 4.0x or more | 12 (16.2%) | 82 (51.2%) |
| Total | 74 (100.0%) | 160 (100.0%) |
Real Estate Taxes by Mortgage Status in Gasburg
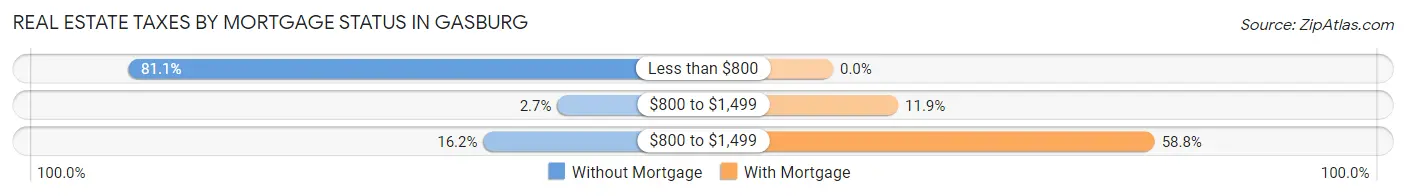
| Property Taxes | Without Mortgage | With Mortgage |
| Less than $800 | 60 (81.1%) | 0 (0.0%) |
| $800 to $1,499 | 2 (2.7%) | 19 (11.9%) |
| $800 to $1,499 | 12 (16.2%) | 94 (58.8%) |
| Total | 74 (100.0%) | 160 (100.0%) |
Health & Disability in Gasburg
Health Insurance Coverage by Age in Gasburg
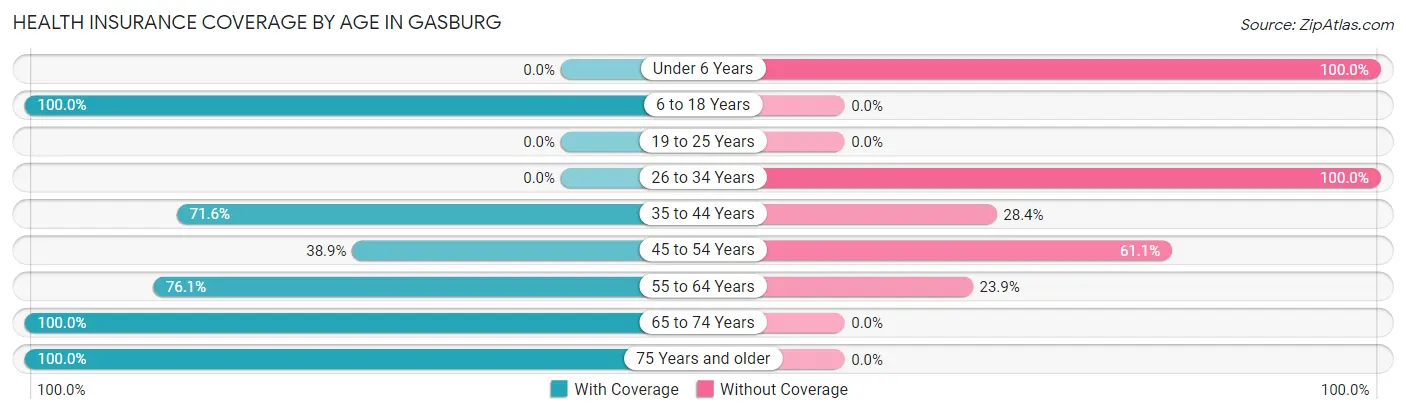
| Age Bracket | With Coverage | Without Coverage |
| Under 6 Years | 0 (0.0%) | 19 (100.0%) |
| 6 to 18 Years | 54 (100.0%) | 0 (0.0%) |
| 19 to 25 Years | 0 (0.0%) | 0 (0.0%) |
| 26 to 34 Years | 0 (0.0%) | 29 (100.0%) |
| 35 to 44 Years | 48 (71.6%) | 19 (28.4%) |
| 45 to 54 Years | 7 (38.9%) | 11 (61.1%) |
| 55 to 64 Years | 159 (76.1%) | 50 (23.9%) |
| 65 to 74 Years | 144 (100.0%) | 0 (0.0%) |
| 75 Years and older | 66 (100.0%) | 0 (0.0%) |
| Total | 478 (78.9%) | 128 (21.1%) |
Health Insurance Coverage by Citizenship Status in Gasburg
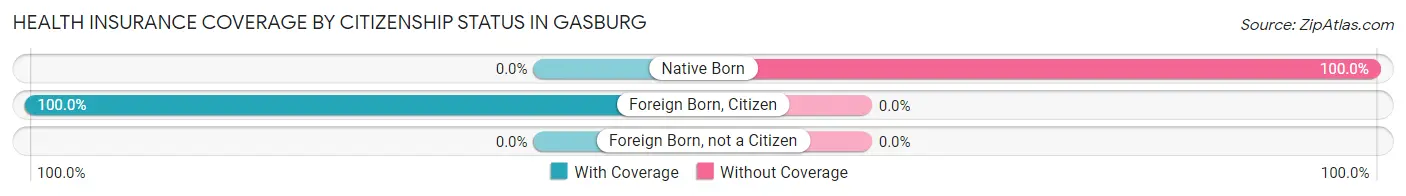
| Citizenship Status | With Coverage | Without Coverage |
| Native Born | 0 (0.0%) | 19 (100.0%) |
| Foreign Born, Citizen | 54 (100.0%) | 0 (0.0%) |
| Foreign Born, not a Citizen | 0 (0.0%) | 0 (0.0%) |
Health Insurance Coverage by Household Income in Gasburg
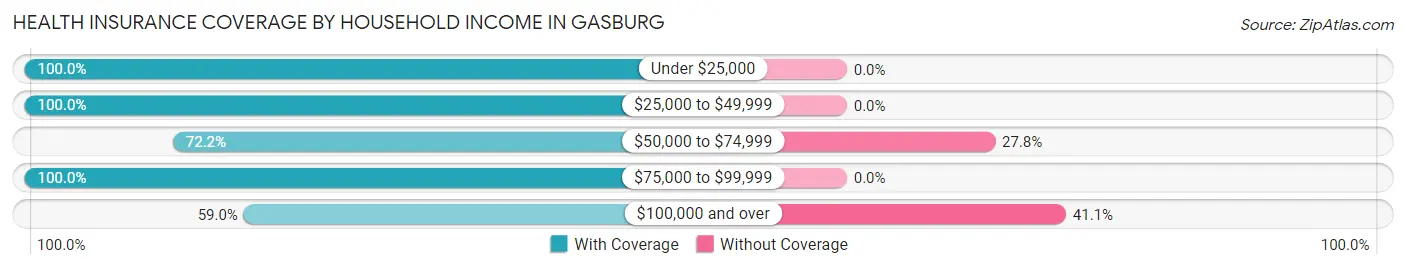
| Household Income | With Coverage | Without Coverage |
| Under $25,000 | 159 (100.0%) | 0 (0.0%) |
| $25,000 to $49,999 | 32 (100.0%) | 0 (0.0%) |
| $50,000 to $74,999 | 130 (72.2%) | 50 (27.8%) |
| $75,000 to $99,999 | 45 (100.0%) | 0 (0.0%) |
| $100,000 and over | 112 (59.0%) | 78 (41.0%) |
Public vs Private Health Insurance Coverage by Age in Gasburg
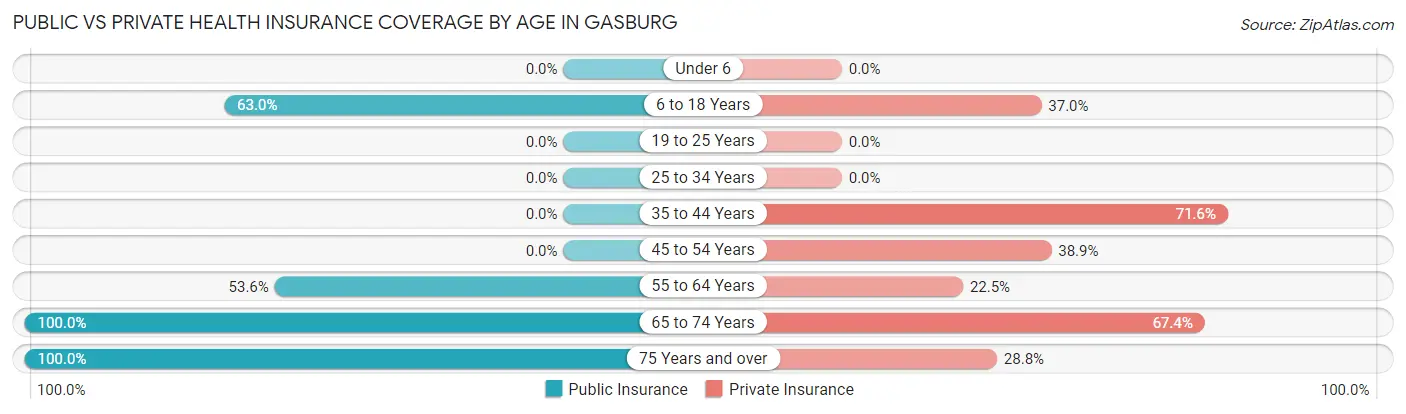
| Age Bracket | Public Insurance | Private Insurance |
| Under 6 | 0 (0.0%) | 0 (0.0%) |
| 6 to 18 Years | 34 (63.0%) | 20 (37.0%) |
| 19 to 25 Years | 0 (0.0%) | 0 (0.0%) |
| 25 to 34 Years | 0 (0.0%) | 0 (0.0%) |
| 35 to 44 Years | 0 (0.0%) | 48 (71.6%) |
| 45 to 54 Years | 0 (0.0%) | 7 (38.9%) |
| 55 to 64 Years | 112 (53.6%) | 47 (22.5%) |
| 65 to 74 Years | 144 (100.0%) | 97 (67.4%) |
| 75 Years and over | 66 (100.0%) | 19 (28.8%) |
| Total | 356 (58.8%) | 238 (39.3%) |
Disability Status by Sex by Age in Gasburg
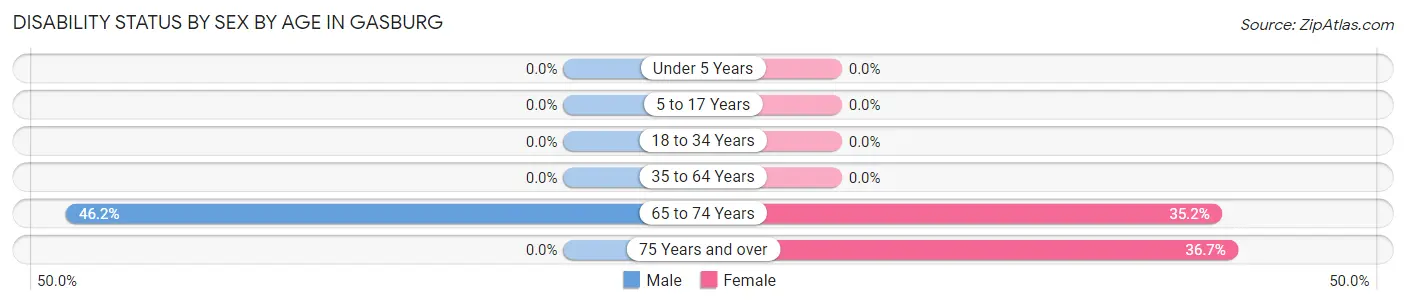
| Age Bracket | Male | Female |
| Under 5 Years | 0 (0.0%) | 0 (0.0%) |
| 5 to 17 Years | 0 (0.0%) | 0 (0.0%) |
| 18 to 34 Years | 0 (0.0%) | 0 (0.0%) |
| 35 to 64 Years | 0 (0.0%) | 0 (0.0%) |
| 65 to 74 Years | 18 (46.2%) | 37 (35.2%) |
| 75 Years and over | 0 (0.0%) | 18 (36.7%) |
Disability Class by Sex by Age in Gasburg
Disability Class: Hearing Difficulty
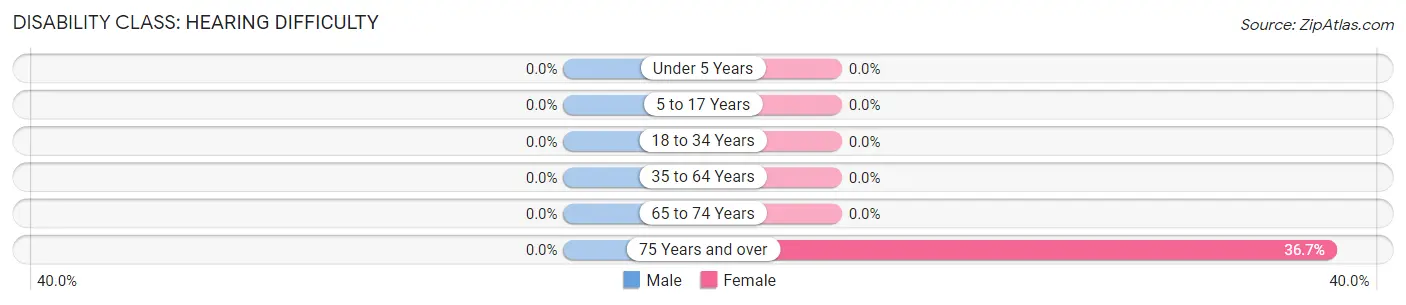
| Age Bracket | Male | Female |
| Under 5 Years | 0 (0.0%) | 0 (0.0%) |
| 5 to 17 Years | 0 (0.0%) | 0 (0.0%) |
| 18 to 34 Years | 0 (0.0%) | 0 (0.0%) |
| 35 to 64 Years | 0 (0.0%) | 0 (0.0%) |
| 65 to 74 Years | 0 (0.0%) | 0 (0.0%) |
| 75 Years and over | 0 (0.0%) | 18 (36.7%) |
Disability Class: Vision Difficulty
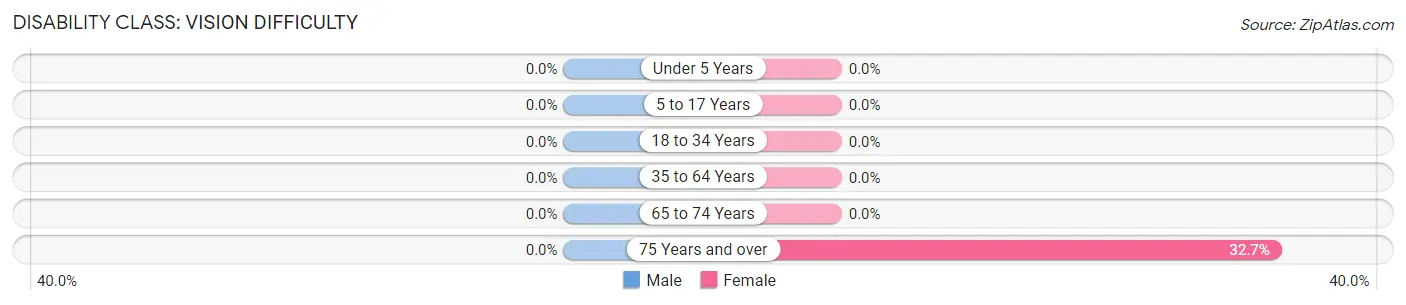
| Age Bracket | Male | Female |
| Under 5 Years | 0 (0.0%) | 0 (0.0%) |
| 5 to 17 Years | 0 (0.0%) | 0 (0.0%) |
| 18 to 34 Years | 0 (0.0%) | 0 (0.0%) |
| 35 to 64 Years | 0 (0.0%) | 0 (0.0%) |
| 65 to 74 Years | 0 (0.0%) | 0 (0.0%) |
| 75 Years and over | 0 (0.0%) | 16 (32.7%) |
Disability Class: Cognitive Difficulty
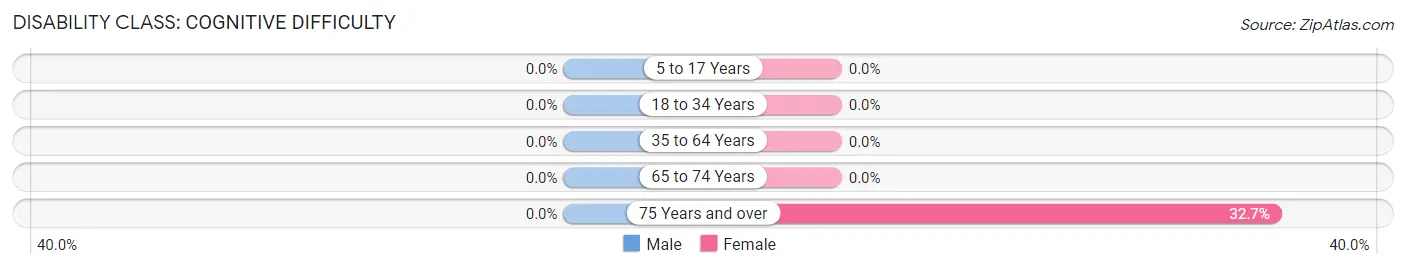
| Age Bracket | Male | Female |
| 5 to 17 Years | 0 (0.0%) | 0 (0.0%) |
| 18 to 34 Years | 0 (0.0%) | 0 (0.0%) |
| 35 to 64 Years | 0 (0.0%) | 0 (0.0%) |
| 65 to 74 Years | 0 (0.0%) | 0 (0.0%) |
| 75 Years and over | 0 (0.0%) | 16 (32.7%) |
Disability Class: Ambulatory Difficulty
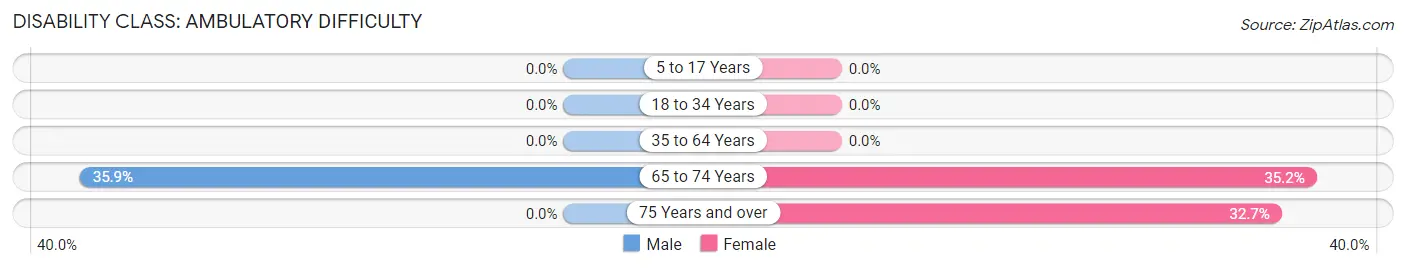
| Age Bracket | Male | Female |
| 5 to 17 Years | 0 (0.0%) | 0 (0.0%) |
| 18 to 34 Years | 0 (0.0%) | 0 (0.0%) |
| 35 to 64 Years | 0 (0.0%) | 0 (0.0%) |
| 65 to 74 Years | 14 (35.9%) | 37 (35.2%) |
| 75 Years and over | 0 (0.0%) | 16 (32.7%) |
Disability Class: Self-Care Difficulty
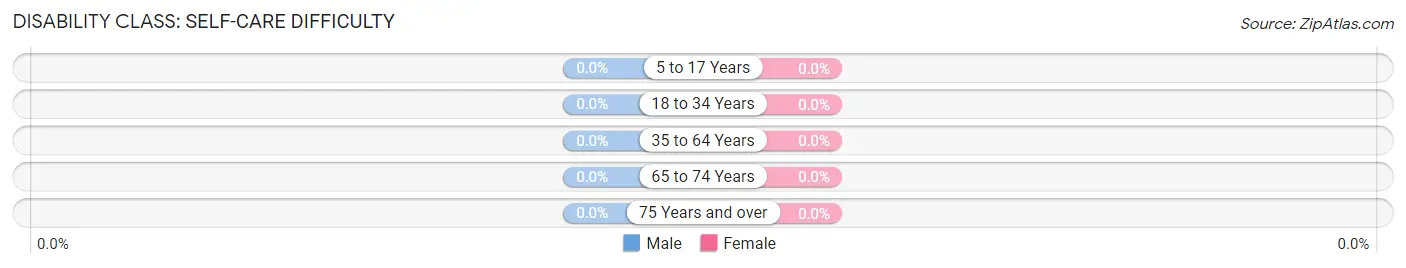
| Age Bracket | Male | Female |
| 5 to 17 Years | 0 (0.0%) | 0 (0.0%) |
| 18 to 34 Years | 0 (0.0%) | 0 (0.0%) |
| 35 to 64 Years | 0 (0.0%) | 0 (0.0%) |
| 65 to 74 Years | 0 (0.0%) | 0 (0.0%) |
| 75 Years and over | 0 (0.0%) | 0 (0.0%) |
Technology Access in Gasburg
Computing Device Access in Gasburg
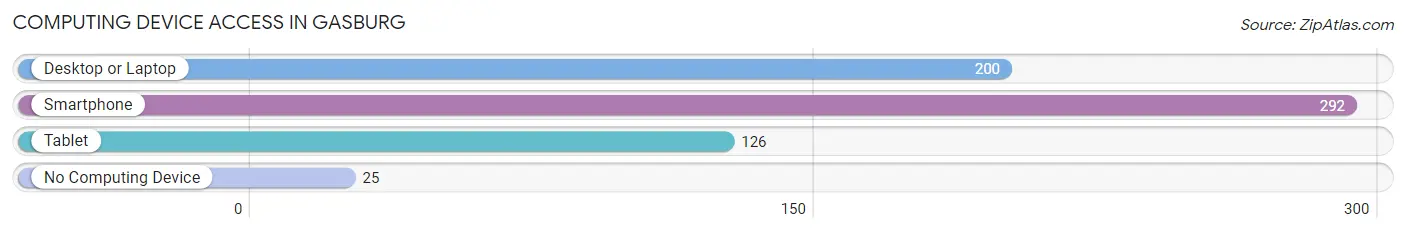
| Device Type | # Households | % Households |
| Desktop or Laptop | 200 | 57.5% |
| Smartphone | 292 | 83.9% |
| Tablet | 126 | 36.2% |
| No Computing Device | 25 | 7.2% |
| Total | 348 | 100.0% |
Internet Access in Gasburg
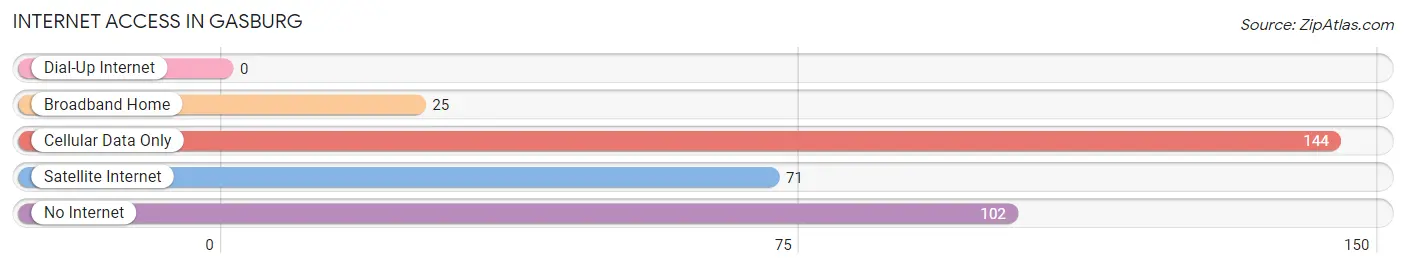
| Internet Type | # Households | % Households |
| Dial-Up Internet | 0 | 0.0% |
| Broadband Home | 25 | 7.2% |
| Cellular Data Only | 144 | 41.4% |
| Satellite Internet | 71 | 20.4% |
| No Internet | 102 | 29.3% |
| Total | 348 | 100.0% |
Gasburg Summary
History
Gasburg is a small town located in Brunswick County, Virginia. It was founded in 1872 and was named after the local gas company. The town was originally a small farming community, but it has since grown to become a thriving community with a population of over 1,000 people.
The town was originally known as Gasburg Station, as it was a stop on the Norfolk and Western Railroad. The railroad was a major factor in the growth of the town, as it allowed for the transportation of goods and people. The town was also home to a number of businesses, including a sawmill, a gristmill, a blacksmith shop, and a general store.
In the early 1900s, the town began to experience a period of growth. The population increased from just over 200 in 1900 to over 1,000 by the 1950s. This growth was largely due to the development of the nearby Lake Gaston, which provided a source of recreation and tourism for the area.
The town has also been home to a number of notable people, including former Virginia Governor Mills Godwin, Jr., and former U.S. Senator William B. Spong, Jr.
Geography
Gasburg is located in Brunswick County, Virginia, in the southeastern part of the state. It is situated on the banks of the Meherrin River, which flows through the town. The town is located approximately 30 miles from the state capital of Richmond and is part of the Richmond-Petersburg metropolitan area.
The town is located in a rural area, with the majority of the land being used for farming and forestry. The town is surrounded by forests and is home to a number of wildlife species, including deer, turkey, and various species of birds.
Economy
The economy of Gasburg is largely based on agriculture and forestry. The town is home to a number of farms, which produce a variety of crops, including corn, soybeans, and wheat. The town is also home to a number of timber companies, which harvest timber from the surrounding forests.
In addition to agriculture and forestry, the town is also home to a number of businesses, including restaurants, retail stores, and service providers. The town is also home to a number of manufacturing companies, which produce a variety of products, including furniture, clothing, and electronics.
Demographics
As of the 2010 census, the population of Gasburg was 1,072. The racial makeup of the town was 94.3% White, 3.2% African American, 0.3% Native American, 0.2% Asian, 0.1% Pacific Islander, 0.7% from other races, and 1.3% from two or more races. Hispanic or Latino of any race were 1.7% of the population.
The median income for a household in the town was $37,500, and the median income for a family was $45,000. The per capita income for the town was $19,845. About 11.2% of families and 14.2% of the population were below the poverty line, including 18.2% of those under age 18 and 8.3% of those age 65 or over.
Common Questions
What is Per Capita Income in Gasburg?
Per Capita income in Gasburg is $39,862.
What is the Median Family Income in Gasburg?
Median Family Income in Gasburg is $88,125.
What is the Median Household income in Gasburg?
Median Household Income in Gasburg is $62,857.
What is Inequality or Gini Index in Gasburg?
Inequality or Gini Index in Gasburg is 0.49.
What is the Total Population of Gasburg?
Total Population of Gasburg is 606.
What is the Total Male Population of Gasburg?
Total Male Population of Gasburg is 186.
What is the Total Female Population of Gasburg?
Total Female Population of Gasburg is 420.
What is the Ratio of Males per 100 Females in Gasburg?
There are 44.29 Males per 100 Females in Gasburg.
What is the Ratio of Females per 100 Males in Gasburg?
There are 225.81 Females per 100 Males in Gasburg.
What is the Median Population Age in Gasburg?
Median Population Age in Gasburg is 59.9 Years.
What is the Average Family Size in Gasburg
Average Family Size in Gasburg is 2.8 People.
What is the Average Household Size in Gasburg
Average Household Size in Gasburg is 1.7 People.
How Large is the Labor Force in Gasburg?
There are 206 People in the Labor Forcein in Gasburg.
What is the Percentage of People in the Labor Force in Gasburg?
38.6% of People are in the Labor Force in Gasburg.
What is the Unemployment Rate in Gasburg?
Unemployment Rate in Gasburg is 10.2%.