Laymantown, VA Map & Demographics
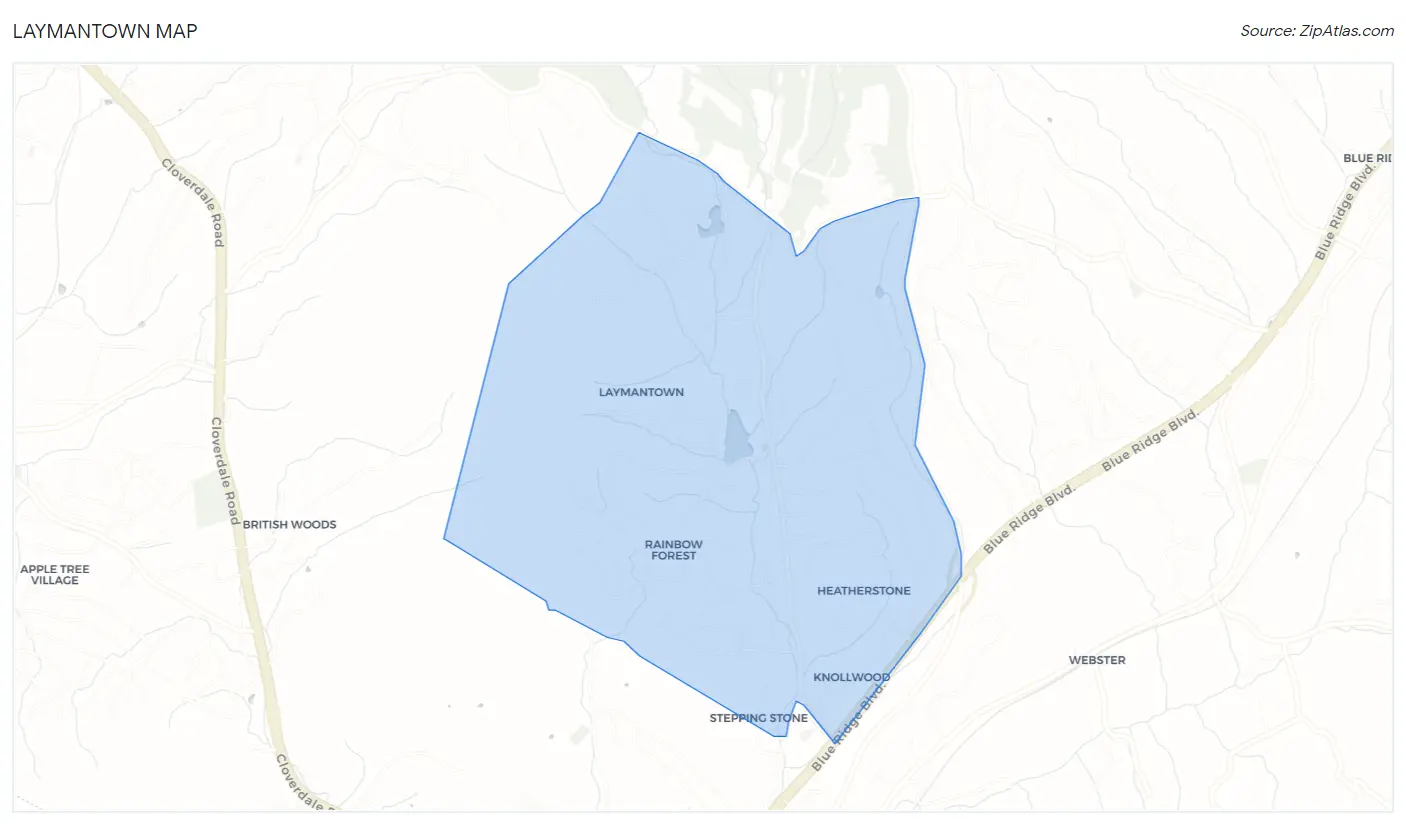
Laymantown Map
Laymantown Overview
$34,234
PER CAPITA INCOME
$76,765
AVG FAMILY INCOME
$76,397
AVG HOUSEHOLD INCOME
31.6%
WAGE / INCOME GAP [ % ]
68.4¢/ $1
WAGE / INCOME GAP [ $ ]
0.33
INEQUALITY / GINI INDEX
1,685
TOTAL POPULATION
880
MALE POPULATION
805
FEMALE POPULATION
109.32
MALES / 100 FEMALES
91.48
FEMALES / 100 MALES
54.7
MEDIAN AGE
2.7
AVG FAMILY SIZE
2.5
AVG HOUSEHOLD SIZE
794
LABOR FORCE [ PEOPLE ]
54.0%
PERCENT IN LABOR FORCE
Income in Laymantown
Income Overview in Laymantown
Per Capita Income in Laymantown is $34,234, while median incomes of families and households are $76,765 and $76,397 respectively.
| Characteristic | Number | Measure |
| Per Capita Income | 1,685 | $34,234 |
| Median Family Income | 566 | $76,765 |
| Mean Family Income | 566 | $84,519 |
| Median Household Income | 681 | $76,397 |
| Mean Household Income | 681 | $79,920 |
| Income Deficit | 566 | $0 |
| Wage / Income Gap (%) | 1,685 | 31.59% |
| Wage / Income Gap ($) | 1,685 | 68.41¢ per $1 |
| Gini / Inequality Index | 1,685 | 0.33 |
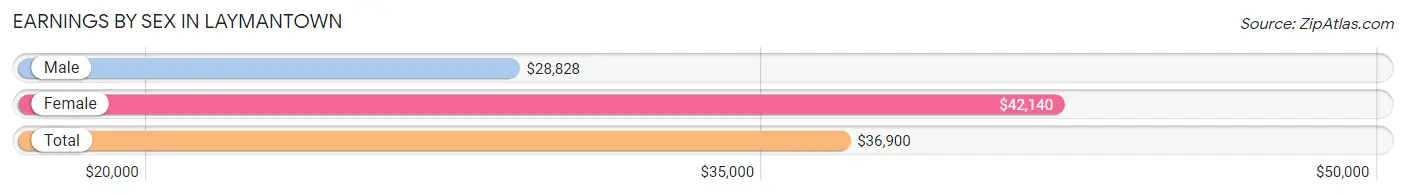
Earnings by Sex in Laymantown
Average Earnings in Laymantown are $36,900, $28,828 for men and $42,140 for women, a difference of 31.6%.
| Sex | Number | Average Earnings |
| Male | 535 (60.1%) | $28,828 |
| Female | 355 (39.9%) | $42,140 |
| Total | 890 (100.0%) | $36,900 |
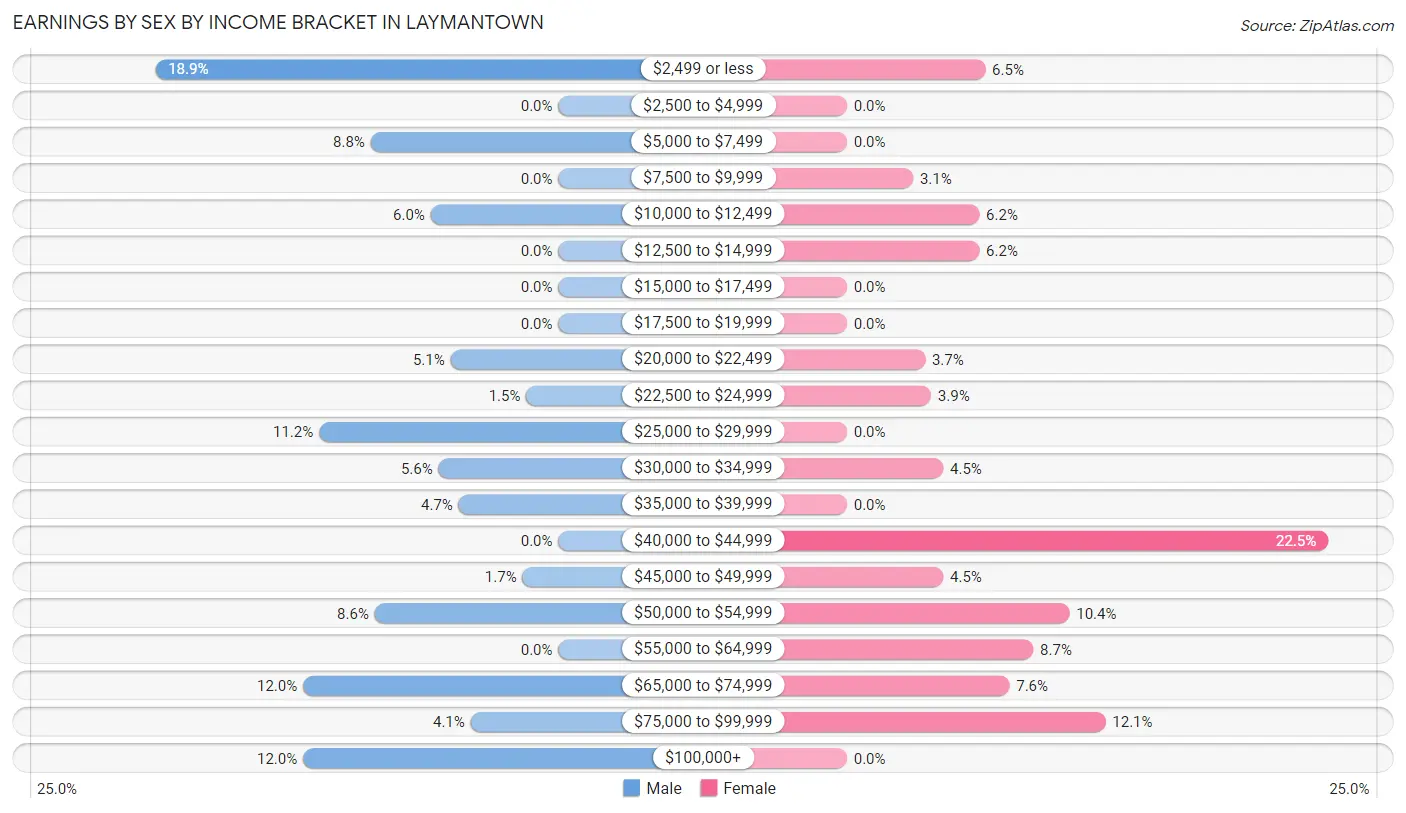
Earnings by Sex by Income Bracket in Laymantown
The most common earnings brackets in Laymantown are $2,499 or less for men (101 | 18.9%) and $40,000 to $44,999 for women (80 | 22.5%).
| Income | Male | Female |
| $2,499 or less | 101 (18.9%) | 23 (6.5%) |
| $2,500 to $4,999 | 0 (0.0%) | 0 (0.0%) |
| $5,000 to $7,499 | 47 (8.8%) | 0 (0.0%) |
| $7,500 to $9,999 | 0 (0.0%) | 11 (3.1%) |
| $10,000 to $12,499 | 32 (6.0%) | 22 (6.2%) |
| $12,500 to $14,999 | 0 (0.0%) | 22 (6.2%) |
| $15,000 to $17,499 | 0 (0.0%) | 0 (0.0%) |
| $17,500 to $19,999 | 0 (0.0%) | 0 (0.0%) |
| $20,000 to $22,499 | 27 (5.1%) | 13 (3.7%) |
| $22,500 to $24,999 | 8 (1.5%) | 14 (3.9%) |
| $25,000 to $29,999 | 60 (11.2%) | 0 (0.0%) |
| $30,000 to $34,999 | 30 (5.6%) | 16 (4.5%) |
| $35,000 to $39,999 | 25 (4.7%) | 0 (0.0%) |
| $40,000 to $44,999 | 0 (0.0%) | 80 (22.5%) |
| $45,000 to $49,999 | 9 (1.7%) | 16 (4.5%) |
| $50,000 to $54,999 | 46 (8.6%) | 37 (10.4%) |
| $55,000 to $64,999 | 0 (0.0%) | 31 (8.7%) |
| $65,000 to $74,999 | 64 (12.0%) | 27 (7.6%) |
| $75,000 to $99,999 | 22 (4.1%) | 43 (12.1%) |
| $100,000+ | 64 (12.0%) | 0 (0.0%) |
| Total | 535 (100.0%) | 355 (100.0%) |
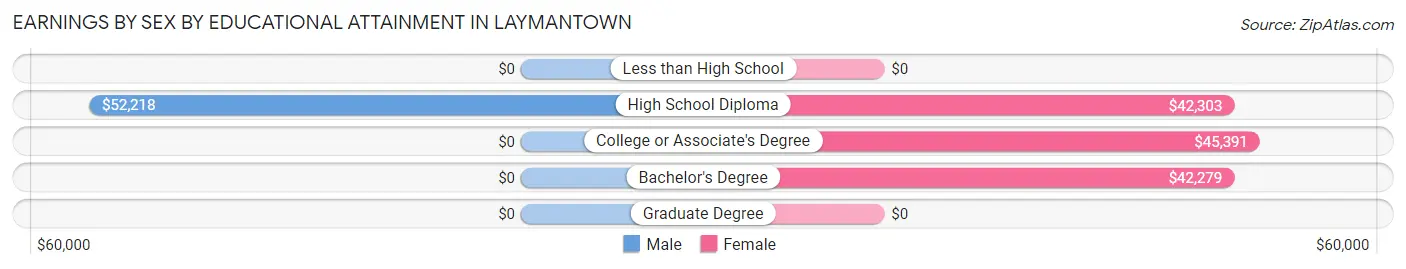
Earnings by Sex by Educational Attainment in Laymantown
Average earnings in Laymantown are $31,827 for men and $45,938 for women, a difference of 30.7%. Men with an educational attainment of high school diploma enjoy the highest average annual earnings of $52,218, while those with high school diploma education earn the least with $52,218. Women with an educational attainment of college or associate's degree earn the most with the average annual earnings of $45,391, while those with bachelor's degree education have the smallest earnings of $42,279.
| Educational Attainment | Male Income | Female Income |
| Less than High School | - | - |
| High School Diploma | $52,218 | $42,303 |
| College or Associate's Degree | - | - |
| Bachelor's Degree | - | - |
| Graduate Degree | - | - |
| Total | $31,827 | $45,938 |
Family Income in Laymantown
Family Income Brackets in Laymantown
According to the Laymantown family income data, there are 113 families falling into the $35,000 to $49,999 income range, which is the most common income bracket and makes up 20.0% of all families.
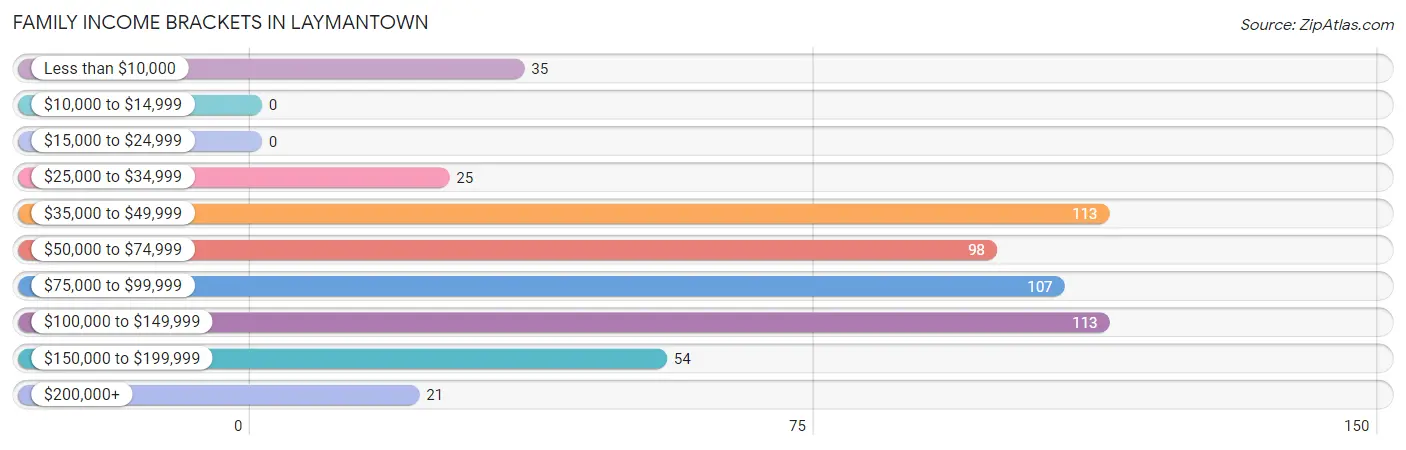
| Income Bracket | # Families | % Families |
| Less than $10,000 | 35 | 6.2% |
| $10,000 to $14,999 | 0 | 0.0% |
| $15,000 to $24,999 | 0 | 0.0% |
| $25,000 to $34,999 | 25 | 4.4% |
| $35,000 to $49,999 | 113 | 20.0% |
| $50,000 to $74,999 | 98 | 17.3% |
| $75,000 to $99,999 | 107 | 18.9% |
| $100,000 to $149,999 | 113 | 20.0% |
| $150,000 to $199,999 | 54 | 9.5% |
| $200,000+ | 21 | 3.7% |
Family Income by Famaliy Size in Laymantown
4-person families (66 | 11.7%) account for the highest median family income in Laymantown with $113,462 per family, while 2-person families (341 | 60.3%) have the highest median income of $32,723 per family member.
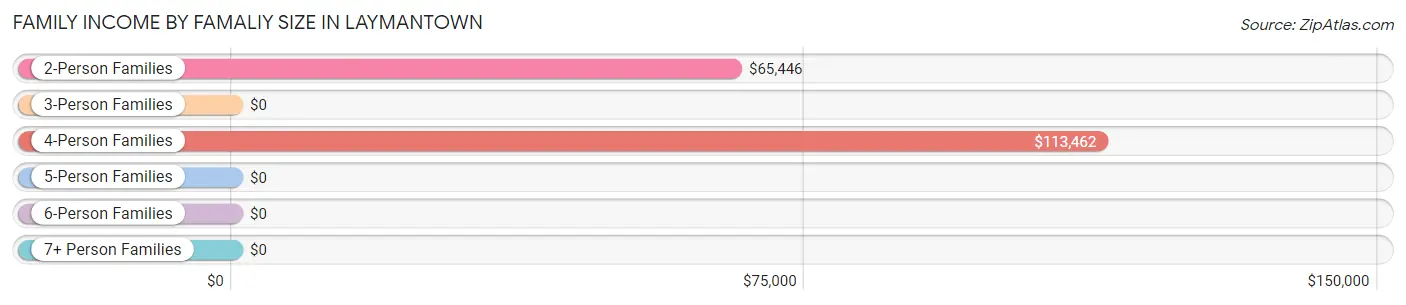
| Income Bracket | # Families | Median Income |
| 2-Person Families | 341 (60.3%) | $65,446 |
| 3-Person Families | 159 (28.1%) | $0 |
| 4-Person Families | 66 (11.7%) | $113,462 |
| 5-Person Families | 0 (0.0%) | $0 |
| 6-Person Families | 0 (0.0%) | $0 |
| 7+ Person Families | 0 (0.0%) | $0 |
| Total | 566 (100.0%) | $76,765 |
Family Income by Number of Earners in Laymantown
The median family income in Laymantown is $76,765, with families comprising 3+ earners (48) having the highest median family income of $114,130, while families with no earners (189) have the lowest median family income of $48,717, accounting for 8.5% and 33.4% of families, respectively.
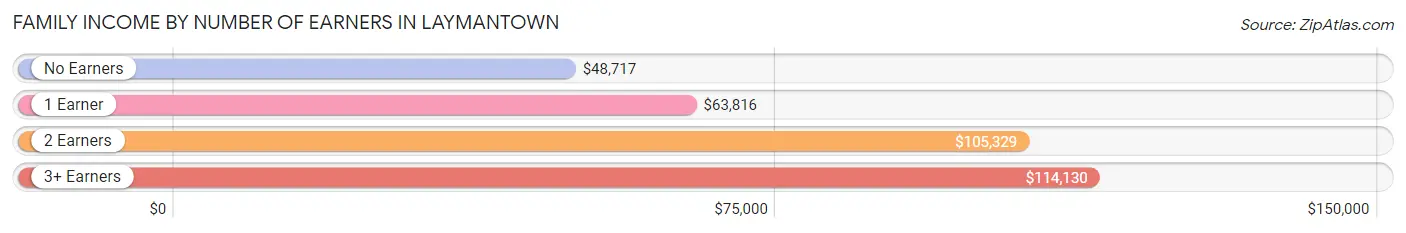
| Number of Earners | # Families | Median Income |
| No Earners | 189 (33.4%) | $48,717 |
| 1 Earner | 138 (24.4%) | $63,816 |
| 2 Earners | 191 (33.8%) | $105,329 |
| 3+ Earners | 48 (8.5%) | $114,130 |
| Total | 566 (100.0%) | $76,765 |
Household Income in Laymantown
Household Income Brackets in Laymantown
With 142 households falling in the category, the $75,000 to $99,999 income range is the most frequent in Laymantown, accounting for 20.8% of all households.
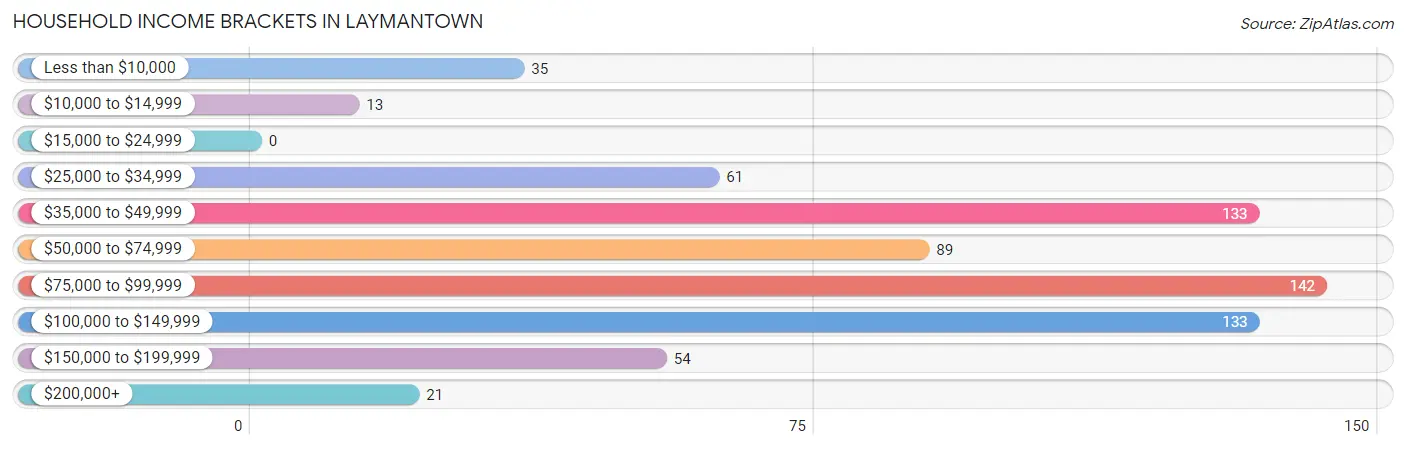
| Income Bracket | # Households | % Households |
| Less than $10,000 | 35 | 5.1% |
| $10,000 to $14,999 | 13 | 1.9% |
| $15,000 to $24,999 | 0 | 0.0% |
| $25,000 to $34,999 | 61 | 9.0% |
| $35,000 to $49,999 | 133 | 19.5% |
| $50,000 to $74,999 | 89 | 13.1% |
| $75,000 to $99,999 | 142 | 20.9% |
| $100,000 to $149,999 | 133 | 19.5% |
| $150,000 to $199,999 | 54 | 7.9% |
| $200,000+ | 21 | 3.1% |
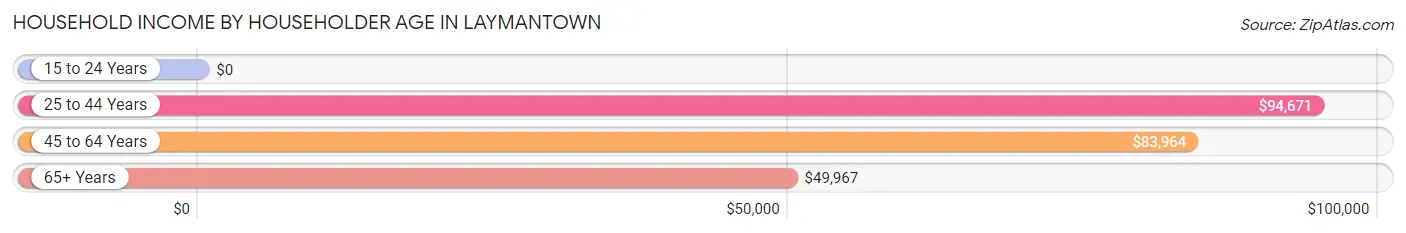
Household Income by Householder Age in Laymantown
The median household income in Laymantown is $76,397, with the highest median household income of $94,671 found in the 25 to 44 years age bracket for the primary householder. A total of 125 households (18.4%) fall into this category.
| Income Bracket | # Households | Median Income |
| 15 to 24 Years | 0 (0.0%) | $0 |
| 25 to 44 Years | 125 (18.4%) | $94,671 |
| 45 to 64 Years | 257 (37.7%) | $83,964 |
| 65+ Years | 299 (43.9%) | $49,967 |
| Total | 681 (100.0%) | $76,397 |
Poverty in Laymantown
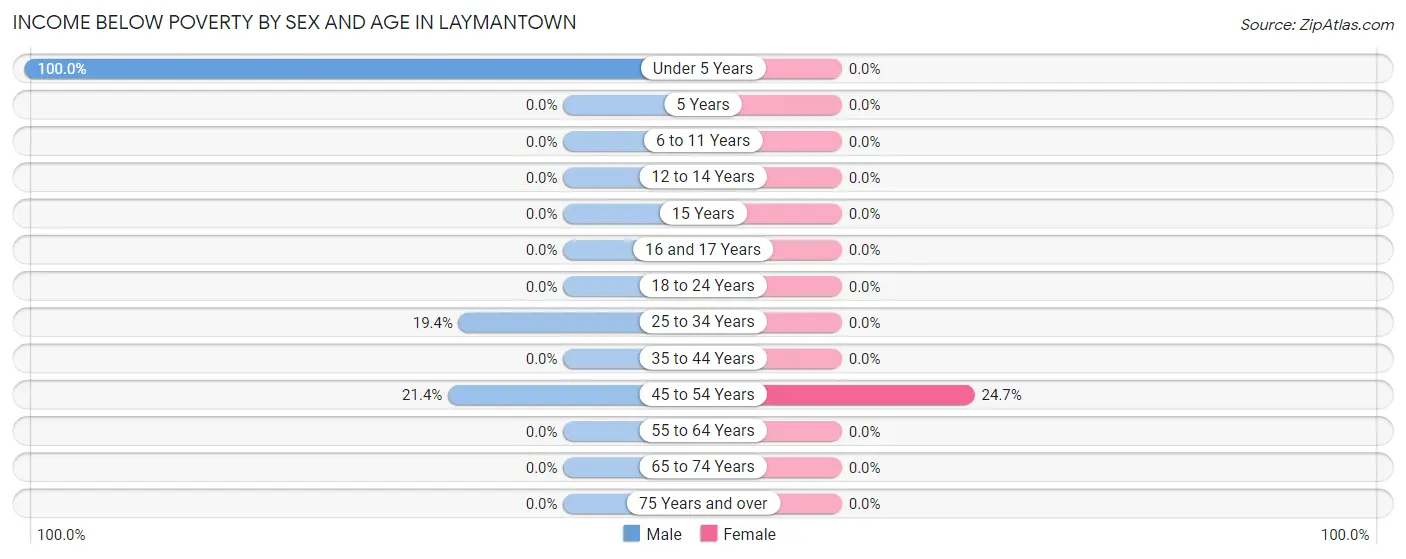
Income Below Poverty by Sex and Age in Laymantown
With 10.4% poverty level for males and 4.3% for females among the residents of Laymantown, under 5 year old males and 45 to 54 year old females are the most vulnerable to poverty, with 48 males (100.0%) and 35 females (24.6%) in their respective age groups living below the poverty level.
| Age Bracket | Male | Female |
| Under 5 Years | 48 (100.0%) | 0 (0.0%) |
| 5 Years | 0 (0.0%) | 0 (0.0%) |
| 6 to 11 Years | 0 (0.0%) | 0 (0.0%) |
| 12 to 14 Years | 0 (0.0%) | 0 (0.0%) |
| 15 Years | 0 (0.0%) | 0 (0.0%) |
| 16 and 17 Years | 0 (0.0%) | 0 (0.0%) |
| 18 to 24 Years | 0 (0.0%) | 0 (0.0%) |
| 25 to 34 Years | 13 (19.4%) | 0 (0.0%) |
| 35 to 44 Years | 0 (0.0%) | 0 (0.0%) |
| 45 to 54 Years | 31 (21.4%) | 35 (24.6%) |
| 55 to 64 Years | 0 (0.0%) | 0 (0.0%) |
| 65 to 74 Years | 0 (0.0%) | 0 (0.0%) |
| 75 Years and over | 0 (0.0%) | 0 (0.0%) |
| Total | 92 (10.4%) | 35 (4.3%) |
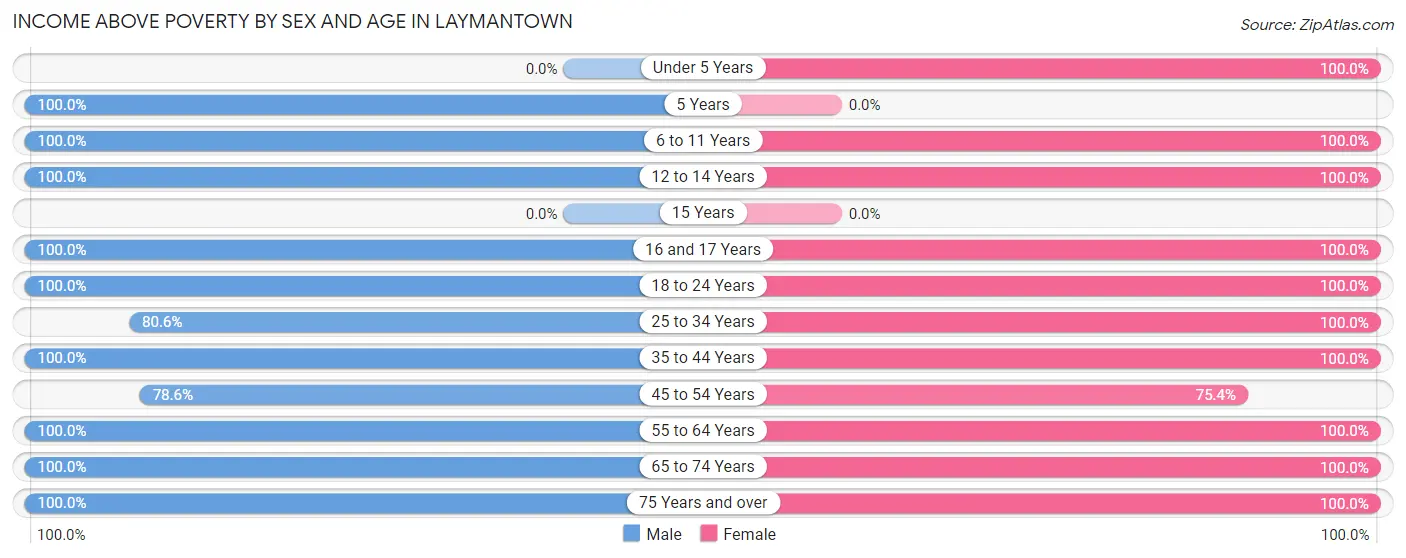
Income Above Poverty by Sex and Age in Laymantown
According to the poverty statistics in Laymantown, males aged 5 years and females aged under 5 years are the age groups that are most secure financially, with 100.0% of males and 100.0% of females in these age groups living above the poverty line.
| Age Bracket | Male | Female |
| Under 5 Years | 0 (0.0%) | 27 (100.0%) |
| 5 Years | 12 (100.0%) | 0 (0.0%) |
| 6 to 11 Years | 43 (100.0%) | 57 (100.0%) |
| 12 to 14 Years | 13 (100.0%) | 14 (100.0%) |
| 15 Years | 0 (0.0%) | 0 (0.0%) |
| 16 and 17 Years | 17 (100.0%) | 11 (100.0%) |
| 18 to 24 Years | 64 (100.0%) | 48 (100.0%) |
| 25 to 34 Years | 54 (80.6%) | 89 (100.0%) |
| 35 to 44 Years | 44 (100.0%) | 23 (100.0%) |
| 45 to 54 Years | 114 (78.6%) | 107 (75.3%) |
| 55 to 64 Years | 68 (100.0%) | 129 (100.0%) |
| 65 to 74 Years | 273 (100.0%) | 107 (100.0%) |
| 75 Years and over | 86 (100.0%) | 158 (100.0%) |
| Total | 788 (89.5%) | 770 (95.7%) |
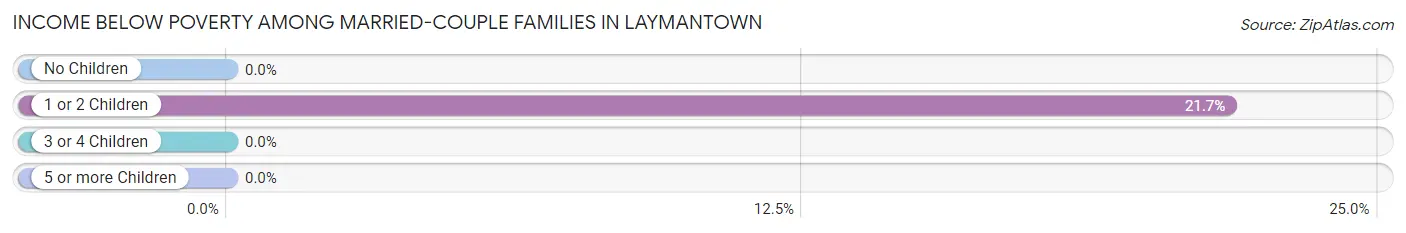
Income Below Poverty Among Married-Couple Families in Laymantown
The poverty statistics for married-couple families in Laymantown show that 6.9% or 35 of the total 507 families live below the poverty line. Families with 1 or 2 children have the highest poverty rate of 21.7%, comprising of 35 families. On the other hand, families with no children have the lowest poverty rate of 0.0%, which includes 0 families.
| Children | Above Poverty | Below Poverty |
| No Children | 346 (100.0%) | 0 (0.0%) |
| 1 or 2 Children | 126 (78.3%) | 35 (21.7%) |
| 3 or 4 Children | 0 (0.0%) | 0 (0.0%) |
| 5 or more Children | 0 (0.0%) | 0 (0.0%) |
| Total | 472 (93.1%) | 35 (6.9%) |
Income Below Poverty Among Single-Parent Households in Laymantown
| Children | Single Father | Single Mother |
| No Children | 0 (0.0%) | 0 (0.0%) |
| 1 or 2 Children | 0 (0.0%) | 0 (0.0%) |
| 3 or 4 Children | 0 (0.0%) | 0 (0.0%) |
| 5 or more Children | 0 (0.0%) | 0 (0.0%) |
| Total | 0 (0.0%) | 0 (0.0%) |
Income Below Poverty Among Married-Couple vs Single-Parent Households in Laymantown
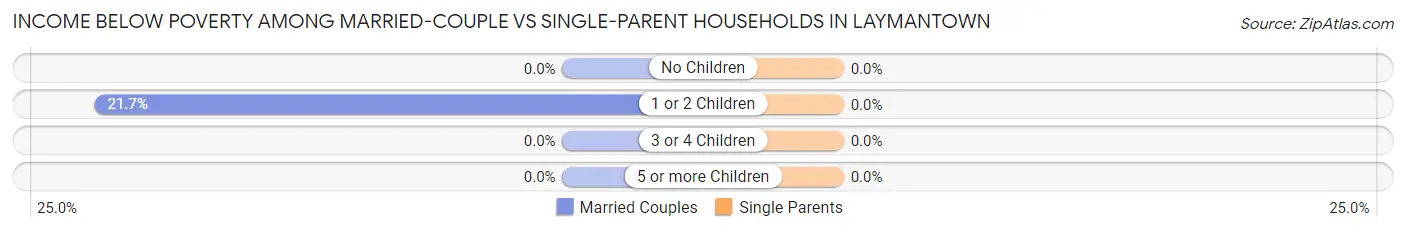
| Children | Married-Couple Families | Single-Parent Households |
| No Children | 0 (0.0%) | 0 (0.0%) |
| 1 or 2 Children | 35 (21.7%) | 0 (0.0%) |
| 3 or 4 Children | 0 (0.0%) | 0 (0.0%) |
| 5 or more Children | 0 (0.0%) | 0 (0.0%) |
| Total | 35 (6.9%) | 0 (0.0%) |
Race in Laymantown
The most populous races in Laymantown are White / Caucasian (1,661 | 98.6%), Two or more Races (24 | 1.4%), and Hispanic or Latino (16 | 0.9%).
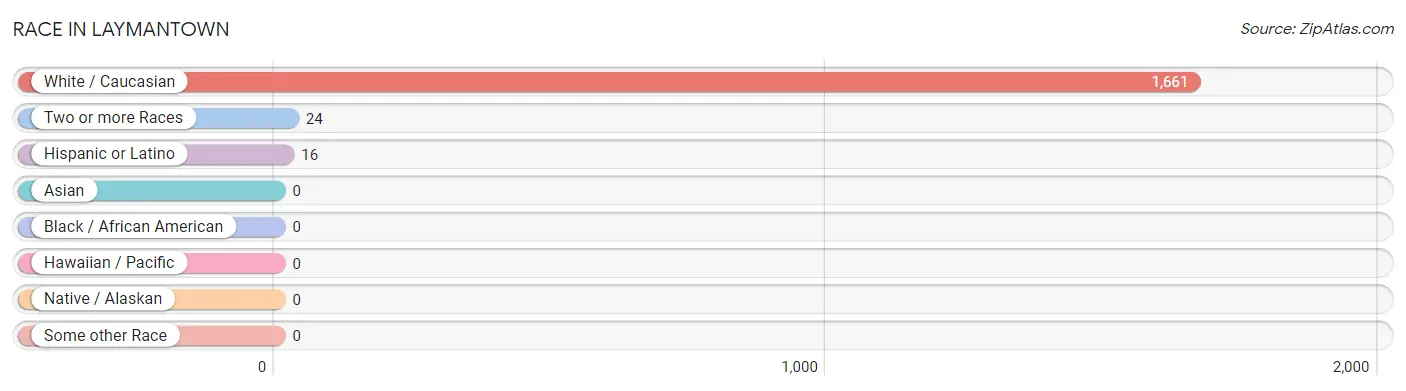
| Race | # Population | % Population |
| Asian | 0 | 0.0% |
| Black / African American | 0 | 0.0% |
| Hawaiian / Pacific | 0 | 0.0% |
| Hispanic or Latino | 16 | 0.9% |
| Native / Alaskan | 0 | 0.0% |
| White / Caucasian | 1,661 | 98.6% |
| Two or more Races | 24 | 1.4% |
| Some other Race | 0 | 0.0% |
| Total | 1,685 | 100.0% |
Ancestry in Laymantown
The most populous ancestries reported in Laymantown are American (317 | 18.8%), English (240 | 14.2%), German (210 | 12.5%), Ukrainian (105 | 6.2%), and Irish (97 | 5.8%), together accounting for 57.5% of all Laymantown residents.
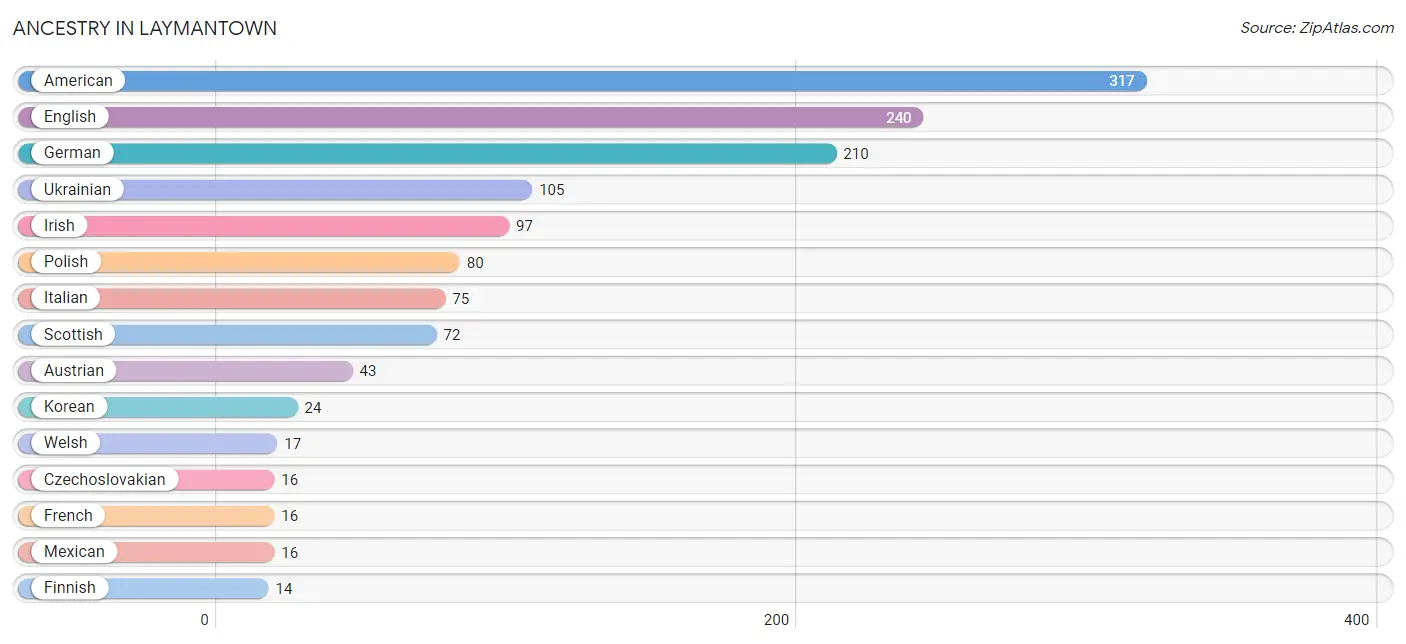
| Ancestry | # Population | % Population |
| American | 317 | 18.8% |
| Austrian | 43 | 2.5% |
| British | 12 | 0.7% |
| Canadian | 9 | 0.5% |
| Czechoslovakian | 16 | 0.9% |
| Danish | 13 | 0.8% |
| Dutch | 12 | 0.7% |
| English | 240 | 14.2% |
| European | 13 | 0.8% |
| Finnish | 14 | 0.8% |
| French | 16 | 0.9% |
| German | 210 | 12.5% |
| Irish | 97 | 5.8% |
| Italian | 75 | 4.4% |
| Korean | 24 | 1.4% |
| Mexican | 16 | 0.9% |
| Polish | 80 | 4.8% |
| Scottish | 72 | 4.3% |
| Ukrainian | 105 | 6.2% |
| Welsh | 17 | 1.0% | View All 20 Rows |
Immigrants in Laymantown
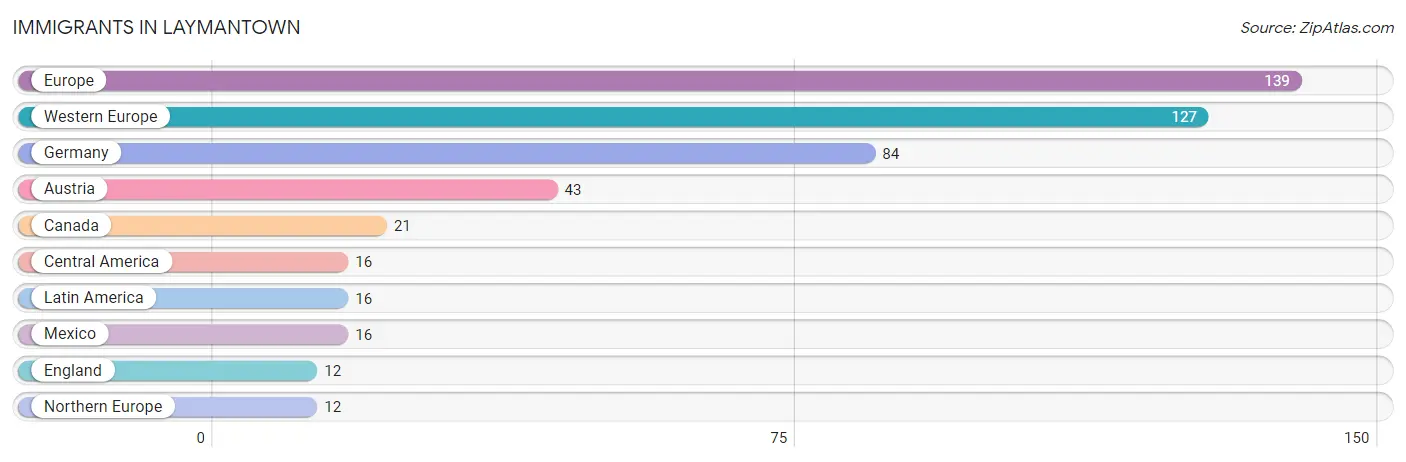
The most numerous immigrant groups reported in Laymantown came from Europe (139 | 8.3%), Western Europe (127 | 7.5%), Germany (84 | 5.0%), Austria (43 | 2.5%), and Canada (21 | 1.3%), together accounting for 24.6% of all Laymantown residents.
| Immigration Origin | # Population | % Population |
| Austria | 43 | 2.5% |
| Canada | 21 | 1.3% |
| Central America | 16 | 0.9% |
| England | 12 | 0.7% |
| Europe | 139 | 8.3% |
| Germany | 84 | 5.0% |
| Latin America | 16 | 0.9% |
| Mexico | 16 | 0.9% |
| Northern Europe | 12 | 0.7% |
| Western Europe | 127 | 7.5% | View All 10 Rows |
Sex and Age in Laymantown
Sex and Age in Laymantown
The most populous age groups in Laymantown are 70 to 74 Years (143 | 16.3%) for men and 60 to 64 Years (104 | 12.9%) for women.
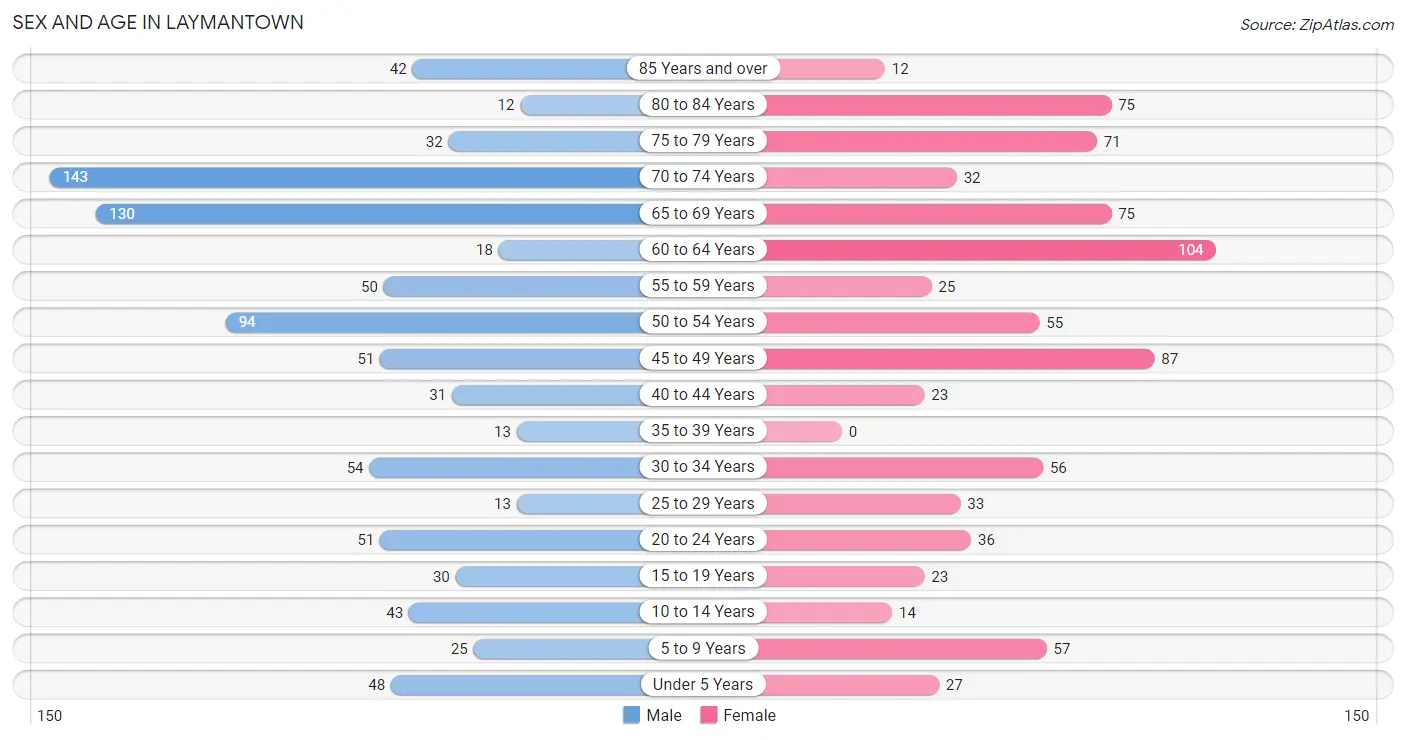
| Age Bracket | Male | Female |
| Under 5 Years | 48 (5.4%) | 27 (3.4%) |
| 5 to 9 Years | 25 (2.8%) | 57 (7.1%) |
| 10 to 14 Years | 43 (4.9%) | 14 (1.7%) |
| 15 to 19 Years | 30 (3.4%) | 23 (2.9%) |
| 20 to 24 Years | 51 (5.8%) | 36 (4.5%) |
| 25 to 29 Years | 13 (1.5%) | 33 (4.1%) |
| 30 to 34 Years | 54 (6.1%) | 56 (7.0%) |
| 35 to 39 Years | 13 (1.5%) | 0 (0.0%) |
| 40 to 44 Years | 31 (3.5%) | 23 (2.9%) |
| 45 to 49 Years | 51 (5.8%) | 87 (10.8%) |
| 50 to 54 Years | 94 (10.7%) | 55 (6.8%) |
| 55 to 59 Years | 50 (5.7%) | 25 (3.1%) |
| 60 to 64 Years | 18 (2.1%) | 104 (12.9%) |
| 65 to 69 Years | 130 (14.8%) | 75 (9.3%) |
| 70 to 74 Years | 143 (16.3%) | 32 (4.0%) |
| 75 to 79 Years | 32 (3.6%) | 71 (8.8%) |
| 80 to 84 Years | 12 (1.4%) | 75 (9.3%) |
| 85 Years and over | 42 (4.8%) | 12 (1.5%) |
| Total | 880 (100.0%) | 805 (100.0%) |
Families and Households in Laymantown
Median Family Size in Laymantown
The median family size in Laymantown is 2.72 persons per family, with single male/father families (29 | 5.1%) accounting for the largest median family size of 5.69 persons per family. On the other hand, married-couple families (507 | 89.6%) represent the smallest median family size with 2.53 persons per family.
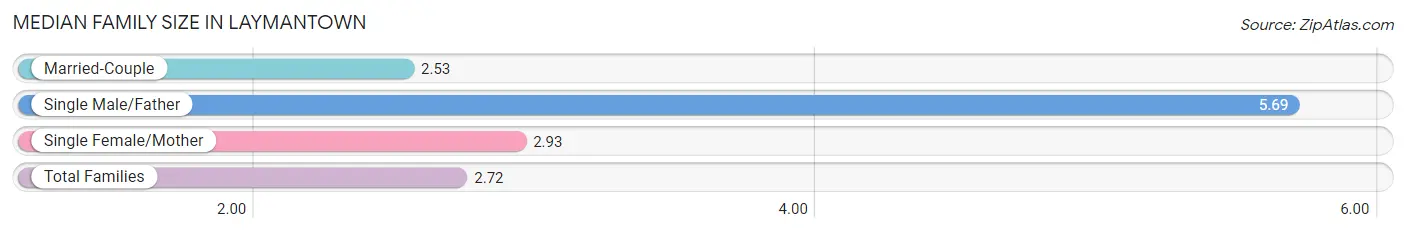
| Family Type | # Families | Family Size |
| Married-Couple | 507 (89.6%) | 2.53 |
| Single Male/Father | 29 (5.1%) | 5.69 |
| Single Female/Mother | 30 (5.3%) | 2.93 |
| Total Families | 566 (100.0%) | 2.72 |
Median Household Size in Laymantown
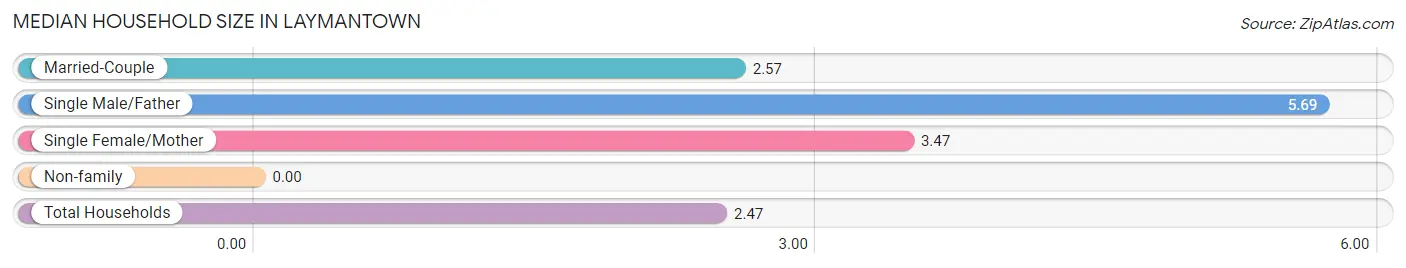
| Household Type | # Households | Household Size |
| Married-Couple | 507 (74.5%) | 2.57 |
| Single Male/Father | 29 (4.3%) | 5.69 |
| Single Female/Mother | 30 (4.4%) | 3.47 |
| Non-family | 115 (16.9%) | - |
| Total Households | 681 (100.0%) | 2.47 |
Household Size by Marriage Status in Laymantown
Out of a total of 681 households in Laymantown, 566 (83.1%) are family households, while 115 (16.9%) are nonfamily households. The most numerous type of family households are 2-person households, comprising 330, and the most common type of nonfamily households are 1-person households, comprising 115.
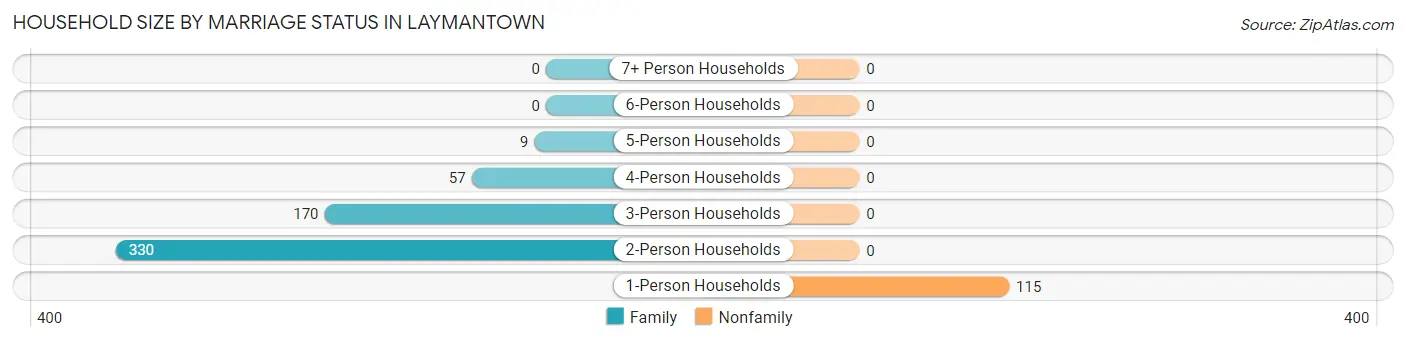
| Household Size | Family Households | Nonfamily Households |
| 1-Person Households | - | 115 (16.9%) |
| 2-Person Households | 330 (48.5%) | 0 (0.0%) |
| 3-Person Households | 170 (25.0%) | 0 (0.0%) |
| 4-Person Households | 57 (8.4%) | 0 (0.0%) |
| 5-Person Households | 9 (1.3%) | 0 (0.0%) |
| 6-Person Households | 0 (0.0%) | 0 (0.0%) |
| 7+ Person Households | 0 (0.0%) | 0 (0.0%) |
| Total | 566 (83.1%) | 115 (16.9%) |
Female Fertility in Laymantown
Fertility by Age in Laymantown
| Age Bracket | Women with Births | Births / 1,000 Women |
| 15 to 19 years | 0 (0.0%) | 0.0 |
| 20 to 34 years | 0 (0.0%) | 0.0 |
| 35 to 50 years | 0 (0.0%) | 0.0 |
| Total | 0 (0.0%) | 0.0 |
Fertility by Age by Marriage Status in Laymantown
| Age Bracket | Married | Unmarried |
| 15 to 19 years | 0 (0.0%) | 0 (0.0%) |
| 20 to 34 years | 0 (0.0%) | 0 (0.0%) |
| 35 to 50 years | 0 (0.0%) | 0 (0.0%) |
| Total | 0 (0.0%) | 0 (0.0%) |
Fertility by Education in Laymantown
| Educational Attainment | Women with Births | Births / 1,000 Women |
| Less than High School | 0 (0.0%) | 0.0 |
| High School Diploma | 0 (0.0%) | 0.0 |
| College or Associate's Degree | 0 (0.0%) | 0.0 |
| Bachelor's Degree | 0 (0.0%) | 0.0 |
| Graduate Degree | 0 (0.0%) | 0.0 |
| Total | 0 (0.0%) | 0.0 |
Fertility by Education by Marriage Status in Laymantown
| Educational Attainment | Married | Unmarried |
| Less than High School | 0 (0.0%) | 0 (0.0%) |
| High School Diploma | 0 (0.0%) | 0 (0.0%) |
| College or Associate's Degree | 0 (0.0%) | 0 (0.0%) |
| Bachelor's Degree | 0 (0.0%) | 0 (0.0%) |
| Graduate Degree | 0 (0.0%) | 0 (0.0%) |
| Total | 0 (0.0%) | 0 (0.0%) |
Employment Characteristics in Laymantown
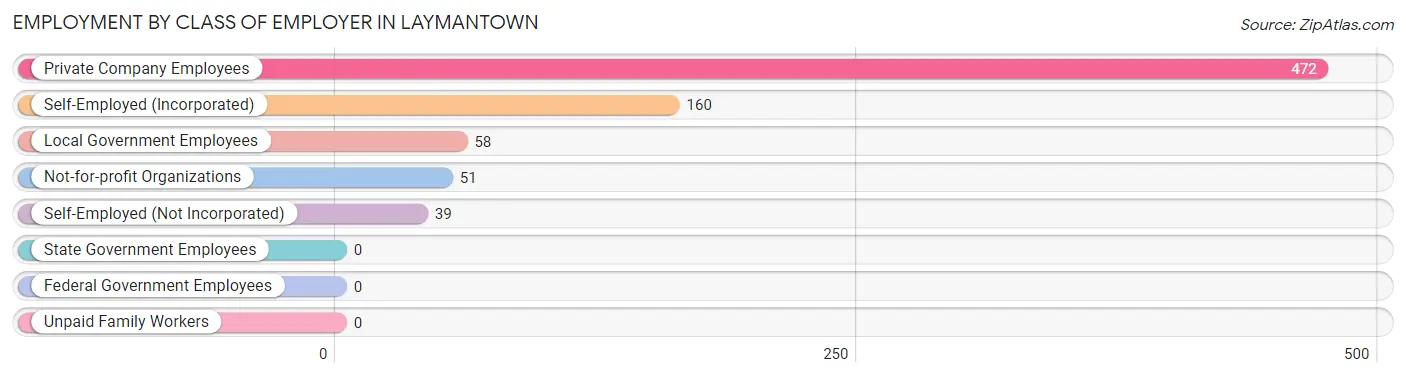
Employment by Class of Employer in Laymantown
Among the 780 employed individuals in Laymantown, private company employees (472 | 60.5%), self-employed (incorporated) (160 | 20.5%), and local government employees (58 | 7.4%) make up the most common classes of employment.
| Employer Class | # Employees | % Employees |
| Private Company Employees | 472 | 60.5% |
| Self-Employed (Incorporated) | 160 | 20.5% |
| Self-Employed (Not Incorporated) | 39 | 5.0% |
| Not-for-profit Organizations | 51 | 6.5% |
| Local Government Employees | 58 | 7.4% |
| State Government Employees | 0 | 0.0% |
| Federal Government Employees | 0 | 0.0% |
| Unpaid Family Workers | 0 | 0.0% |
| Total | 780 | 100.0% |
Employment Status by Age in Laymantown
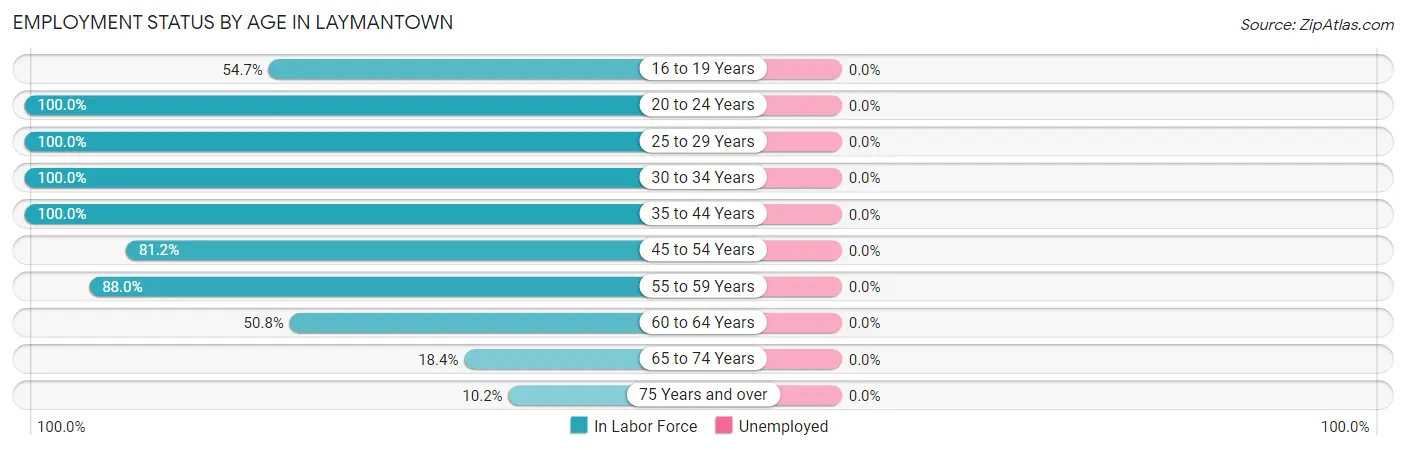
| Age Bracket | In Labor Force | Unemployed |
| 16 to 19 Years | 29 (54.7%) | 0 (0.0%) |
| 20 to 24 Years | 87 (100.0%) | 0 (0.0%) |
| 25 to 29 Years | 46 (100.0%) | 0 (0.0%) |
| 30 to 34 Years | 110 (100.0%) | 0 (0.0%) |
| 35 to 44 Years | 67 (100.0%) | 0 (0.0%) |
| 45 to 54 Years | 233 (81.2%) | 0 (0.0%) |
| 55 to 59 Years | 66 (88.0%) | 0 (0.0%) |
| 60 to 64 Years | 62 (50.8%) | 0 (0.0%) |
| 65 to 74 Years | 70 (18.4%) | 0 (0.0%) |
| 75 Years and over | 25 (10.2%) | 0 (0.0%) |
| Total | 794 (54.0%) | 0 (0.0%) |
Employment Status by Educational Attainment in Laymantown
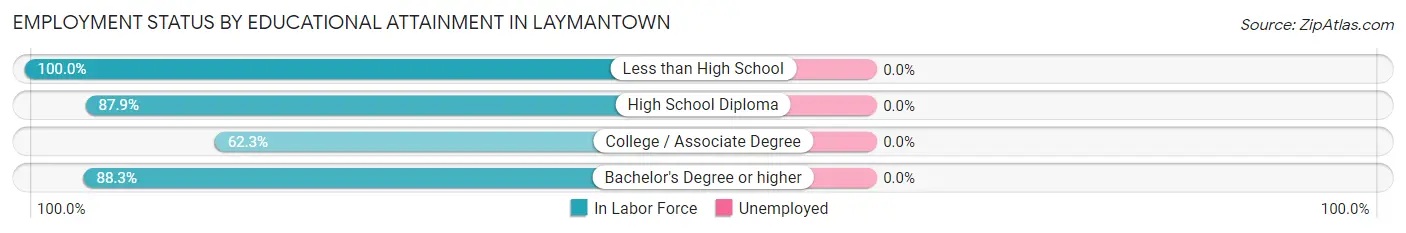
| Educational Attainment | In Labor Force | Unemployed |
| Less than High School | 19 (100.0%) | 0 (0.0%) |
| High School Diploma | 203 (87.9%) | 0 (0.0%) |
| College / Associate Degree | 99 (62.3%) | 0 (0.0%) |
| Bachelor's Degree or higher | 263 (88.3%) | 0 (0.0%) |
| Total | 584 (82.6%) | 0 (0.0%) |
Employment Occupations by Sex in Laymantown
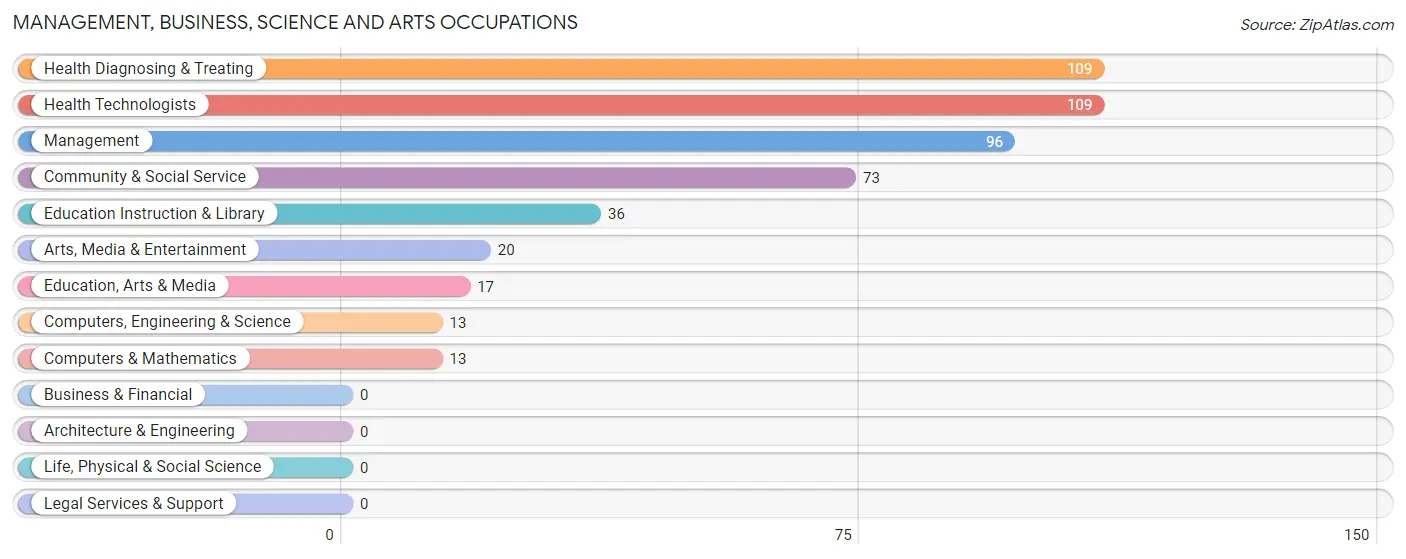
Management, Business, Science and Arts Occupations
The most common Management, Business, Science and Arts occupations in Laymantown are Health Diagnosing & Treating (109 | 13.7%), Health Technologists (109 | 13.7%), Management (96 | 12.1%), Community & Social Service (73 | 9.2%), and Education Instruction & Library (36 | 4.5%).
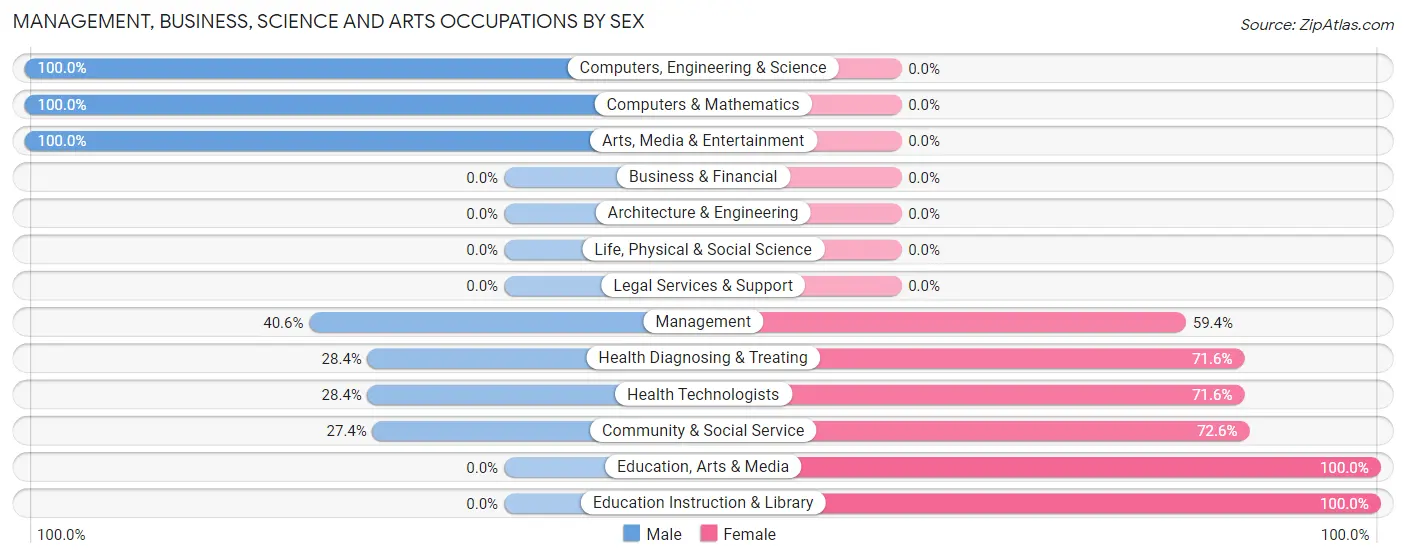
Management, Business, Science and Arts Occupations by Sex
Within the Management, Business, Science and Arts occupations in Laymantown, the most male-oriented occupations are Computers, Engineering & Science (100.0%), Computers & Mathematics (100.0%), and Arts, Media & Entertainment (100.0%), while the most female-oriented occupations are Education, Arts & Media (100.0%), Education Instruction & Library (100.0%), and Community & Social Service (72.6%).
| Occupation | Male | Female |
| Management | 39 (40.6%) | 57 (59.4%) |
| Business & Financial | 0 (0.0%) | 0 (0.0%) |
| Computers, Engineering & Science | 13 (100.0%) | 0 (0.0%) |
| Computers & Mathematics | 13 (100.0%) | 0 (0.0%) |
| Architecture & Engineering | 0 (0.0%) | 0 (0.0%) |
| Life, Physical & Social Science | 0 (0.0%) | 0 (0.0%) |
| Community & Social Service | 20 (27.4%) | 53 (72.6%) |
| Education, Arts & Media | 0 (0.0%) | 17 (100.0%) |
| Legal Services & Support | 0 (0.0%) | 0 (0.0%) |
| Education Instruction & Library | 0 (0.0%) | 36 (100.0%) |
| Arts, Media & Entertainment | 20 (100.0%) | 0 (0.0%) |
| Health Diagnosing & Treating | 31 (28.4%) | 78 (71.6%) |
| Health Technologists | 31 (28.4%) | 78 (71.6%) |
| Total (Category) | 103 (35.4%) | 188 (64.6%) |
| Total (Overall) | 451 (56.7%) | 344 (43.3%) |
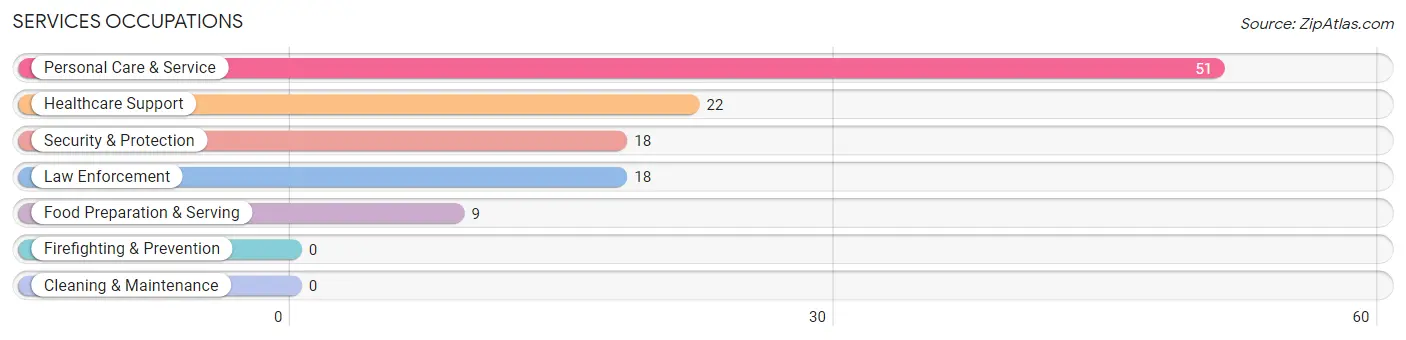
Services Occupations
The most common Services occupations in Laymantown are Personal Care & Service (51 | 6.4%), Healthcare Support (22 | 2.8%), Security & Protection (18 | 2.3%), Law Enforcement (18 | 2.3%), and Food Preparation & Serving (9 | 1.1%).
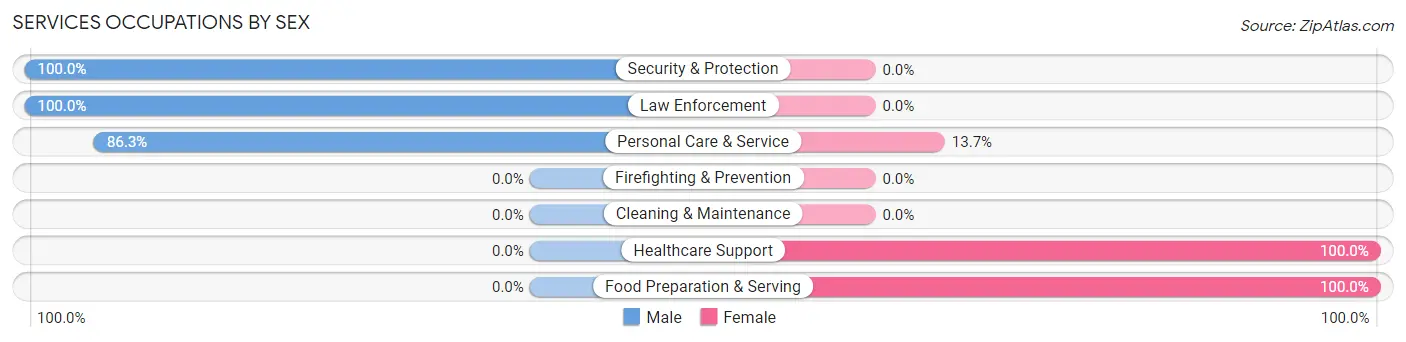
Services Occupations by Sex
Within the Services occupations in Laymantown, the most male-oriented occupations are Security & Protection (100.0%), Law Enforcement (100.0%), and Personal Care & Service (86.3%), while the most female-oriented occupations are Healthcare Support (100.0%), Food Preparation & Serving (100.0%), and Personal Care & Service (13.7%).
| Occupation | Male | Female |
| Healthcare Support | 0 (0.0%) | 22 (100.0%) |
| Security & Protection | 18 (100.0%) | 0 (0.0%) |
| Firefighting & Prevention | 0 (0.0%) | 0 (0.0%) |
| Law Enforcement | 18 (100.0%) | 0 (0.0%) |
| Food Preparation & Serving | 0 (0.0%) | 9 (100.0%) |
| Cleaning & Maintenance | 0 (0.0%) | 0 (0.0%) |
| Personal Care & Service | 44 (86.3%) | 7 (13.7%) |
| Total (Category) | 62 (62.0%) | 38 (38.0%) |
| Total (Overall) | 451 (56.7%) | 344 (43.3%) |
Sales and Office Occupations
The most common Sales and Office occupations in Laymantown are Office & Administration (142 | 17.9%), and Sales & Related (66 | 8.3%).
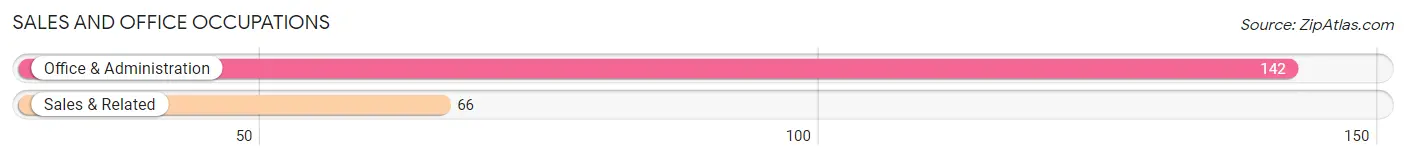
Sales and Office Occupations by Sex

| Occupation | Male | Female |
| Sales & Related | 66 (100.0%) | 0 (0.0%) |
| Office & Administration | 36 (25.4%) | 106 (74.7%) |
| Total (Category) | 102 (49.0%) | 106 (51.0%) |
| Total (Overall) | 451 (56.7%) | 344 (43.3%) |
Natural Resources, Construction and Maintenance Occupations
The most common Natural Resources, Construction and Maintenance occupations in Laymantown are Construction & Extraction (33 | 4.2%), Installation, Maintenance & Repair (28 | 3.5%), and Farming, Fishing & Forestry (15 | 1.9%).
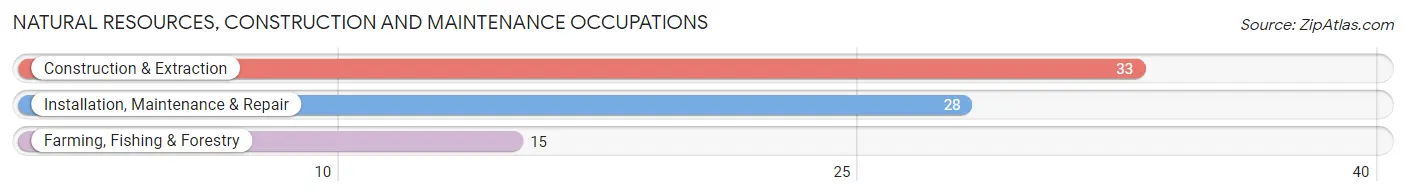
Natural Resources, Construction and Maintenance Occupations by Sex
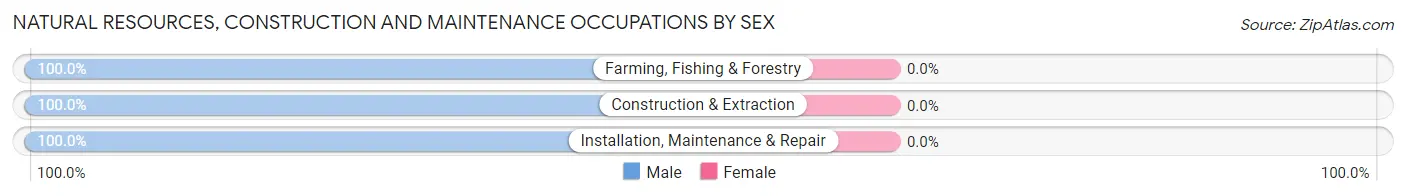
| Occupation | Male | Female |
| Farming, Fishing & Forestry | 15 (100.0%) | 0 (0.0%) |
| Construction & Extraction | 33 (100.0%) | 0 (0.0%) |
| Installation, Maintenance & Repair | 28 (100.0%) | 0 (0.0%) |
| Total (Category) | 76 (100.0%) | 0 (0.0%) |
| Total (Overall) | 451 (56.7%) | 344 (43.3%) |
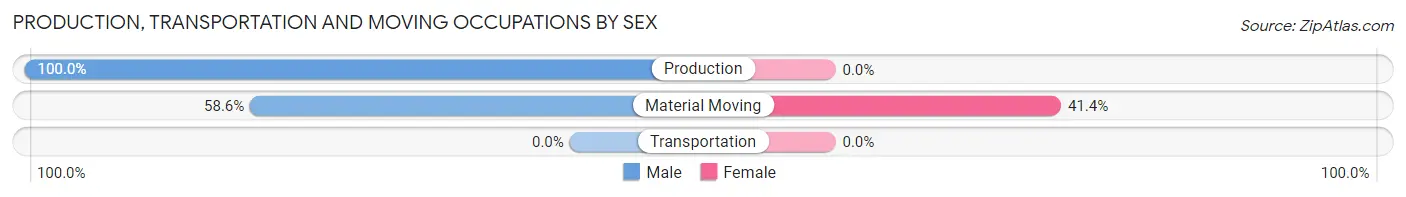
Production, Transportation and Moving Occupations
The most common Production, Transportation and Moving occupations in Laymantown are Production (91 | 11.5%), and Material Moving (29 | 3.6%).
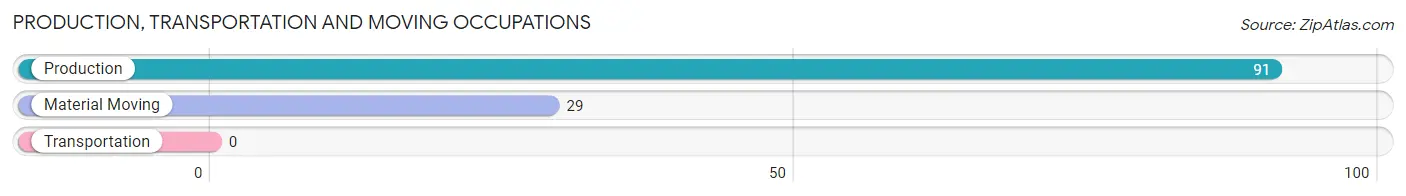
Production, Transportation and Moving Occupations by Sex
| Occupation | Male | Female |
| Production | 91 (100.0%) | 0 (0.0%) |
| Transportation | 0 (0.0%) | 0 (0.0%) |
| Material Moving | 17 (58.6%) | 12 (41.4%) |
| Total (Category) | 108 (90.0%) | 12 (10.0%) |
| Total (Overall) | 451 (56.7%) | 344 (43.3%) |
Employment Industries by Sex in Laymantown
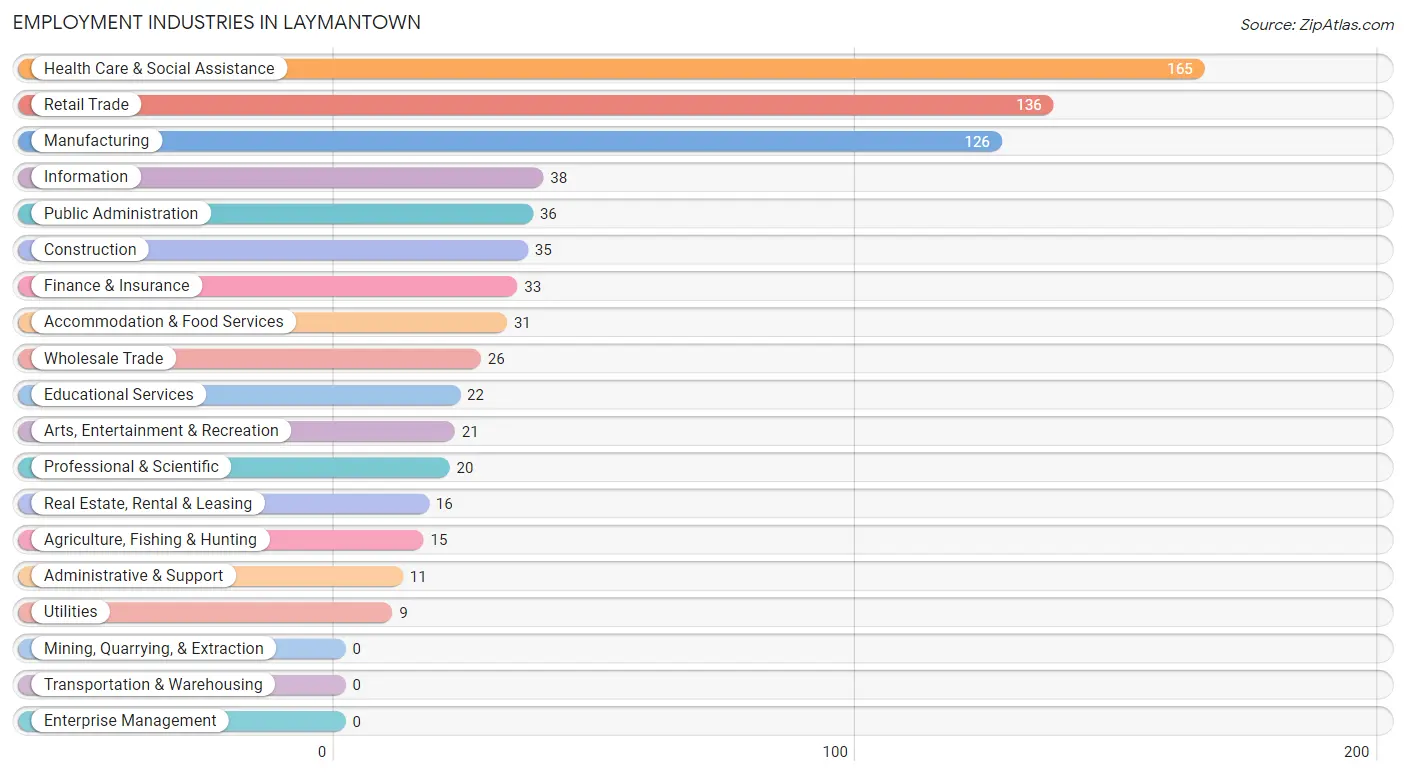
Employment Industries in Laymantown
The major employment industries in Laymantown include Health Care & Social Assistance (165 | 20.7%), Retail Trade (136 | 17.1%), Manufacturing (126 | 15.9%), Information (38 | 4.8%), and Public Administration (36 | 4.5%).
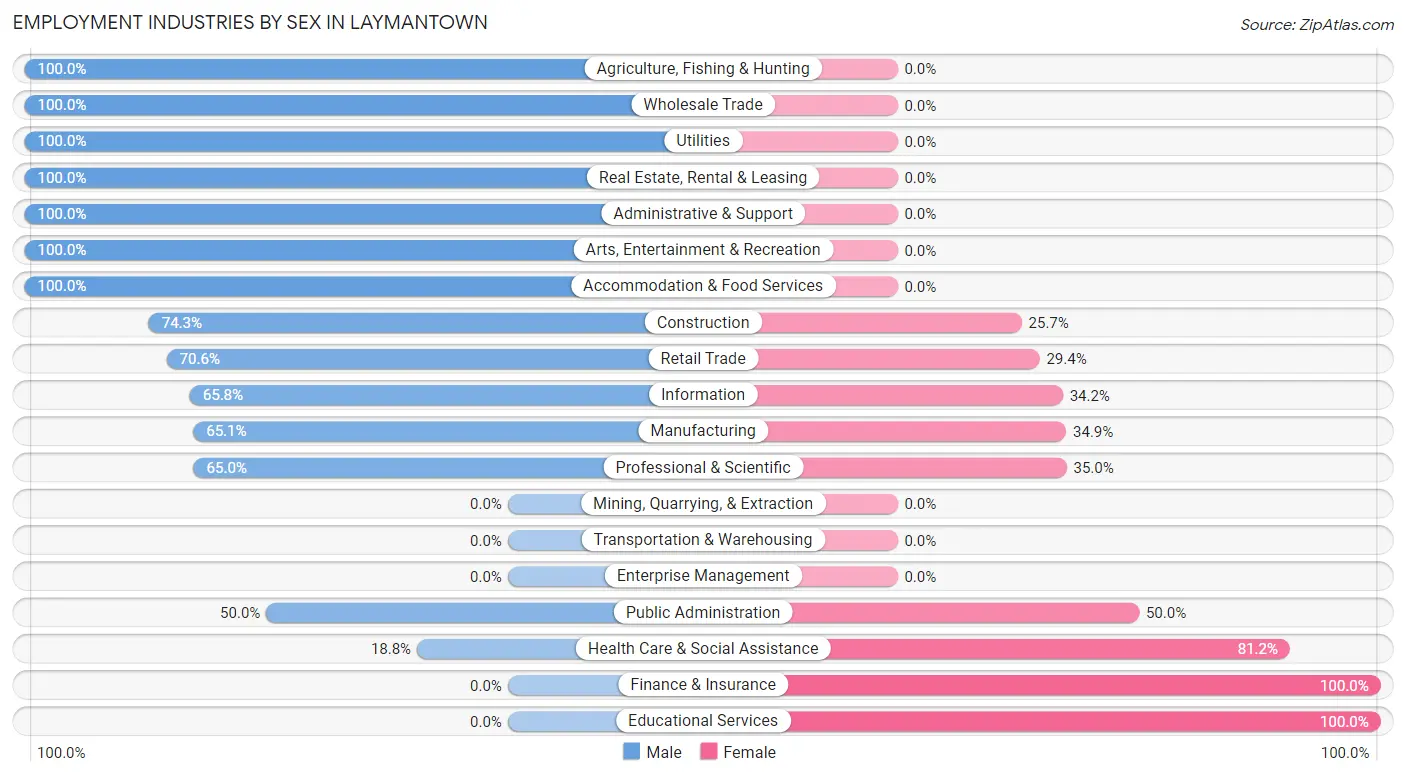
Employment Industries by Sex in Laymantown
The Laymantown industries that see more men than women are Agriculture, Fishing & Hunting (100.0%), Wholesale Trade (100.0%), and Utilities (100.0%), whereas the industries that tend to have a higher number of women are Finance & Insurance (100.0%), Educational Services (100.0%), and Health Care & Social Assistance (81.2%).
| Industry | Male | Female |
| Agriculture, Fishing & Hunting | 15 (100.0%) | 0 (0.0%) |
| Mining, Quarrying, & Extraction | 0 (0.0%) | 0 (0.0%) |
| Construction | 26 (74.3%) | 9 (25.7%) |
| Manufacturing | 82 (65.1%) | 44 (34.9%) |
| Wholesale Trade | 26 (100.0%) | 0 (0.0%) |
| Retail Trade | 96 (70.6%) | 40 (29.4%) |
| Transportation & Warehousing | 0 (0.0%) | 0 (0.0%) |
| Utilities | 9 (100.0%) | 0 (0.0%) |
| Information | 25 (65.8%) | 13 (34.2%) |
| Finance & Insurance | 0 (0.0%) | 33 (100.0%) |
| Real Estate, Rental & Leasing | 16 (100.0%) | 0 (0.0%) |
| Professional & Scientific | 13 (65.0%) | 7 (35.0%) |
| Enterprise Management | 0 (0.0%) | 0 (0.0%) |
| Administrative & Support | 11 (100.0%) | 0 (0.0%) |
| Educational Services | 0 (0.0%) | 22 (100.0%) |
| Health Care & Social Assistance | 31 (18.8%) | 134 (81.2%) |
| Arts, Entertainment & Recreation | 21 (100.0%) | 0 (0.0%) |
| Accommodation & Food Services | 31 (100.0%) | 0 (0.0%) |
| Public Administration | 18 (50.0%) | 18 (50.0%) |
| Total | 451 (56.7%) | 344 (43.3%) |
Education in Laymantown
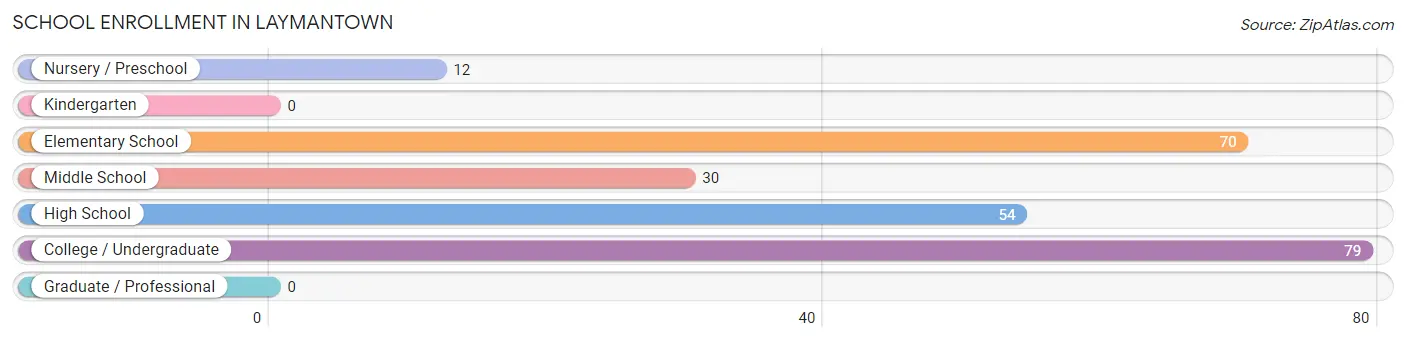
School Enrollment in Laymantown
The most common levels of schooling among the 245 students in Laymantown are college / undergraduate (79 | 32.2%), elementary school (70 | 28.6%), and high school (54 | 22.0%).
| School Level | # Students | % Students |
| Nursery / Preschool | 12 | 4.9% |
| Kindergarten | 0 | 0.0% |
| Elementary School | 70 | 28.6% |
| Middle School | 30 | 12.2% |
| High School | 54 | 22.0% |
| College / Undergraduate | 79 | 32.2% |
| Graduate / Professional | 0 | 0.0% |
| Total | 245 | 100.0% |
School Enrollment by Age by Funding Source in Laymantown
Out of a total of 245 students who are enrolled in schools in Laymantown, 26 (10.6%) attend a private institution, while the remaining 219 (89.4%) are enrolled in public schools. The age group of 35 years and over has the highest likelihood of being enrolled in private schools, with 12 (100.0% in the age bracket) enrolled. Conversely, the age group of 5 to 9 year old has the lowest likelihood of being enrolled in a private school, with 82 (100.0% in the age bracket) attending a public institution.
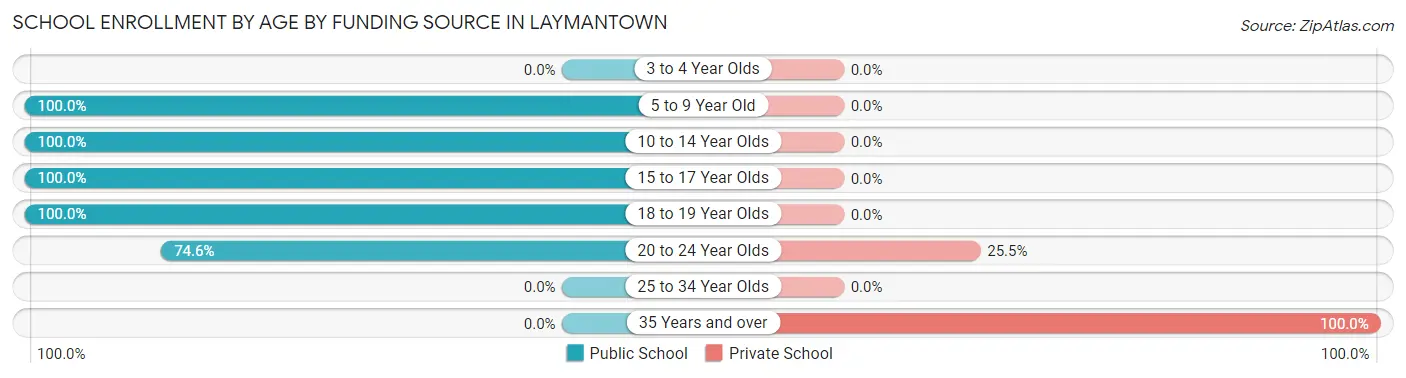
| Age Bracket | Public School | Private School |
| 3 to 4 Year Olds | 0 (0.0%) | 0 (0.0%) |
| 5 to 9 Year Old | 82 (100.0%) | 0 (0.0%) |
| 10 to 14 Year Olds | 43 (100.0%) | 0 (0.0%) |
| 15 to 17 Year Olds | 28 (100.0%) | 0 (0.0%) |
| 18 to 19 Year Olds | 25 (100.0%) | 0 (0.0%) |
| 20 to 24 Year Olds | 41 (74.6%) | 14 (25.5%) |
| 25 to 34 Year Olds | 0 (0.0%) | 0 (0.0%) |
| 35 Years and over | 0 (0.0%) | 12 (100.0%) |
| Total | 219 (89.4%) | 26 (10.6%) |
Educational Attainment by Field of Study in Laymantown
Business (111 | 22.6%), psychology (62 | 12.6%), liberal arts & history (61 | 12.4%), communications (56 | 11.4%), and education (48 | 9.8%) are the most common fields of study among 492 individuals in Laymantown who have obtained a bachelor's degree or higher.
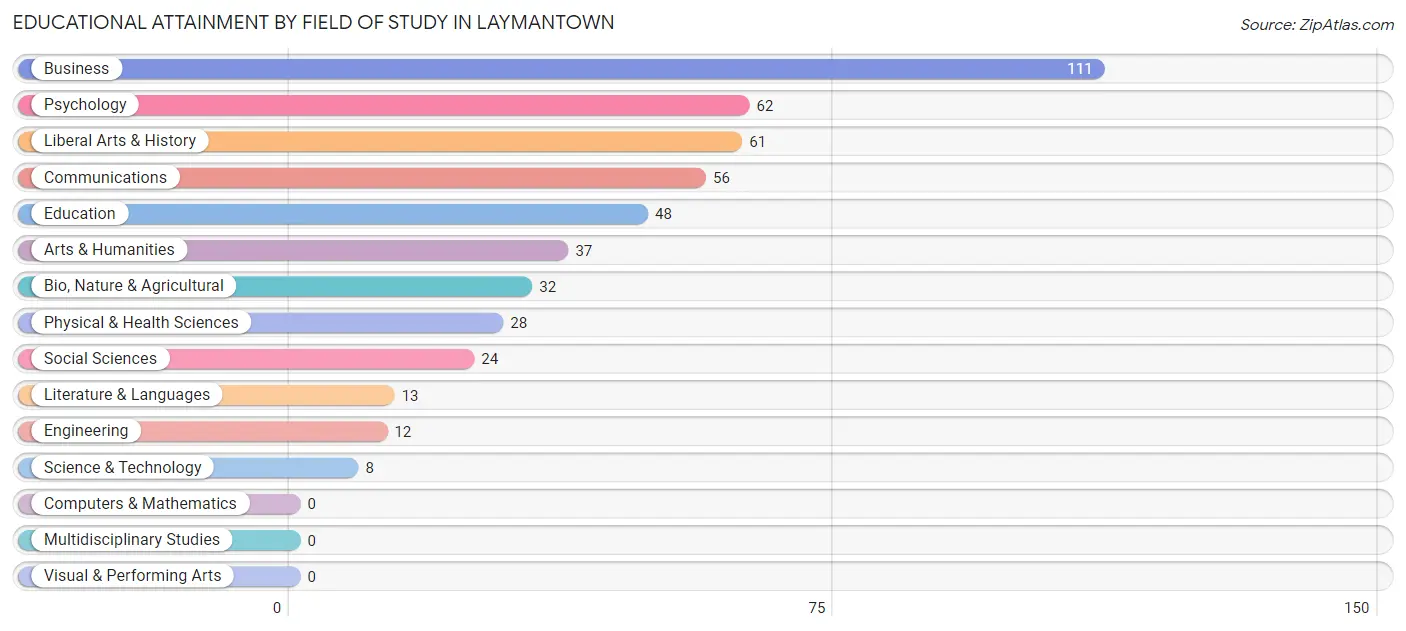
| Field of Study | # Graduates | % Graduates |
| Computers & Mathematics | 0 | 0.0% |
| Bio, Nature & Agricultural | 32 | 6.5% |
| Physical & Health Sciences | 28 | 5.7% |
| Psychology | 62 | 12.6% |
| Social Sciences | 24 | 4.9% |
| Engineering | 12 | 2.4% |
| Multidisciplinary Studies | 0 | 0.0% |
| Science & Technology | 8 | 1.6% |
| Business | 111 | 22.6% |
| Education | 48 | 9.8% |
| Literature & Languages | 13 | 2.6% |
| Liberal Arts & History | 61 | 12.4% |
| Visual & Performing Arts | 0 | 0.0% |
| Communications | 56 | 11.4% |
| Arts & Humanities | 37 | 7.5% |
| Total | 492 | 100.0% |
Transportation & Commute in Laymantown
Vehicle Availability by Sex in Laymantown
The most prevalent vehicle ownership categories in Laymantown are males with 2 vehicles (199, accounting for 45.6%) and females with 2 vehicles (145, making up 57.9%).
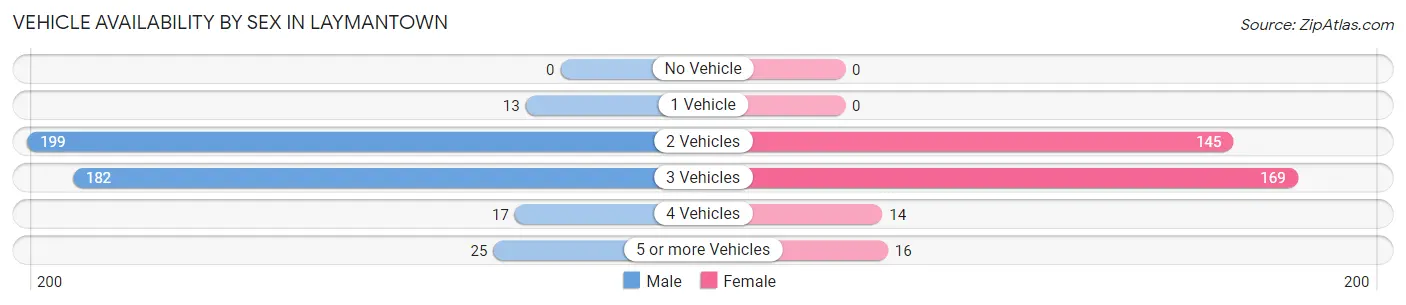
| Vehicles Available | Male | Female |
| No Vehicle | 0 (0.0%) | 0 (0.0%) |
| 1 Vehicle | 13 (3.0%) | 0 (0.0%) |
| 2 Vehicles | 199 (45.6%) | 145 (42.1%) |
| 3 Vehicles | 182 (41.7%) | 169 (49.1%) |
| 4 Vehicles | 17 (3.9%) | 14 (4.1%) |
| 5 or more Vehicles | 25 (5.7%) | 16 (4.6%) |
| Total | 436 (100.0%) | 344 (100.0%) |
Commute Time in Laymantown
The most frequently occuring commute durations in Laymantown are 15 to 19 minutes (141 commuters, 20.9%), 30 to 34 minutes (136 commuters, 20.2%), and 20 to 24 minutes (103 commuters, 15.3%).
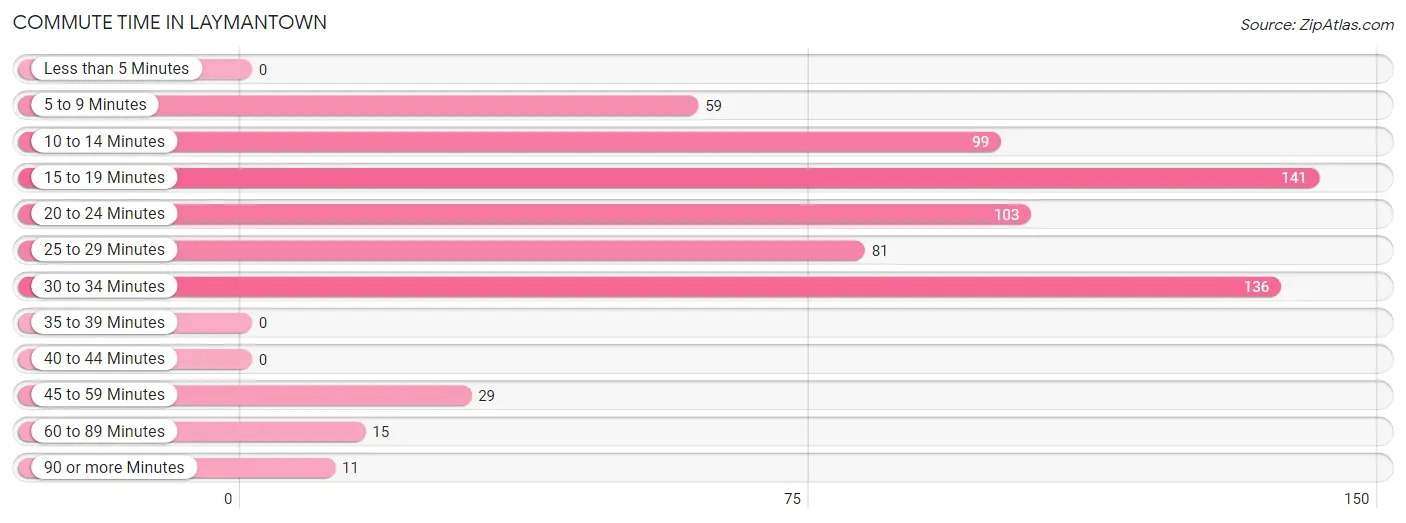
| Commute Time | # Commuters | % Commuters |
| Less than 5 Minutes | 0 | 0.0% |
| 5 to 9 Minutes | 59 | 8.7% |
| 10 to 14 Minutes | 99 | 14.7% |
| 15 to 19 Minutes | 141 | 20.9% |
| 20 to 24 Minutes | 103 | 15.3% |
| 25 to 29 Minutes | 81 | 12.0% |
| 30 to 34 Minutes | 136 | 20.2% |
| 35 to 39 Minutes | 0 | 0.0% |
| 40 to 44 Minutes | 0 | 0.0% |
| 45 to 59 Minutes | 29 | 4.3% |
| 60 to 89 Minutes | 15 | 2.2% |
| 90 or more Minutes | 11 | 1.6% |
Commute Time by Sex in Laymantown
The most common commute times in Laymantown are 20 to 24 minutes (81 commuters, 20.4%) for males and 30 to 34 minutes (85 commuters, 30.6%) for females.
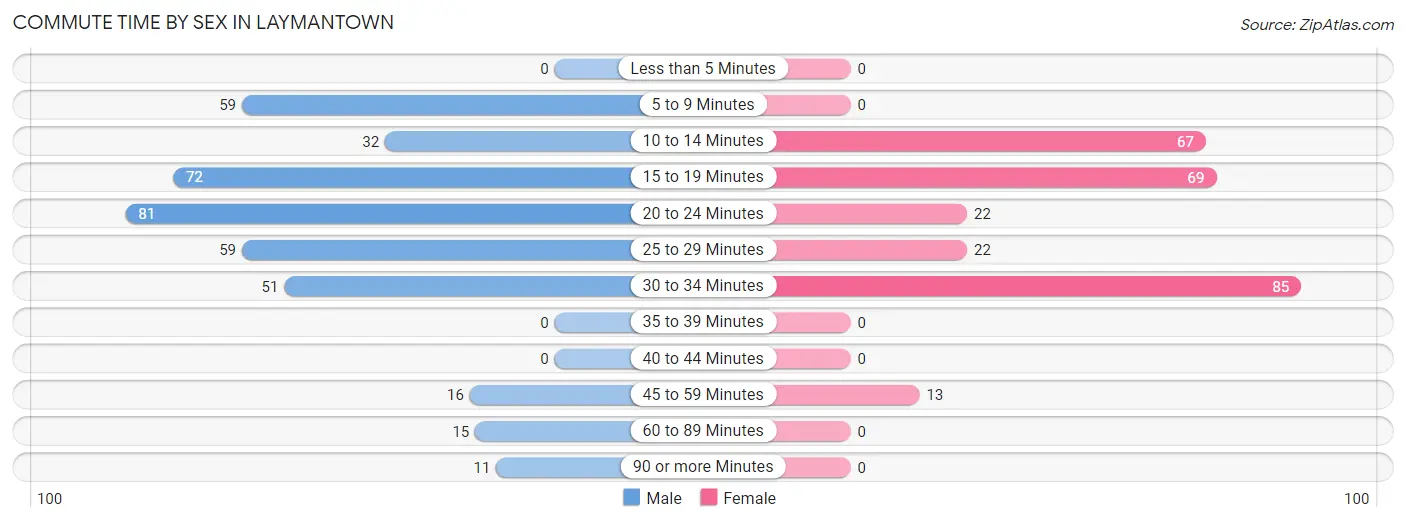
| Commute Time | Male | Female |
| Less than 5 Minutes | 0 (0.0%) | 0 (0.0%) |
| 5 to 9 Minutes | 59 (14.9%) | 0 (0.0%) |
| 10 to 14 Minutes | 32 (8.1%) | 67 (24.1%) |
| 15 to 19 Minutes | 72 (18.2%) | 69 (24.8%) |
| 20 to 24 Minutes | 81 (20.4%) | 22 (7.9%) |
| 25 to 29 Minutes | 59 (14.9%) | 22 (7.9%) |
| 30 to 34 Minutes | 51 (12.9%) | 85 (30.6%) |
| 35 to 39 Minutes | 0 (0.0%) | 0 (0.0%) |
| 40 to 44 Minutes | 0 (0.0%) | 0 (0.0%) |
| 45 to 59 Minutes | 16 (4.0%) | 13 (4.7%) |
| 60 to 89 Minutes | 15 (3.8%) | 0 (0.0%) |
| 90 or more Minutes | 11 (2.8%) | 0 (0.0%) |
Time of Departure to Work by Sex in Laymantown
The most frequent times of departure to work in Laymantown are 4:00 PM to 11:59 PM (73, 18.4%) for males and 8:00 AM to 8:29 AM (103, 37.0%) for females.
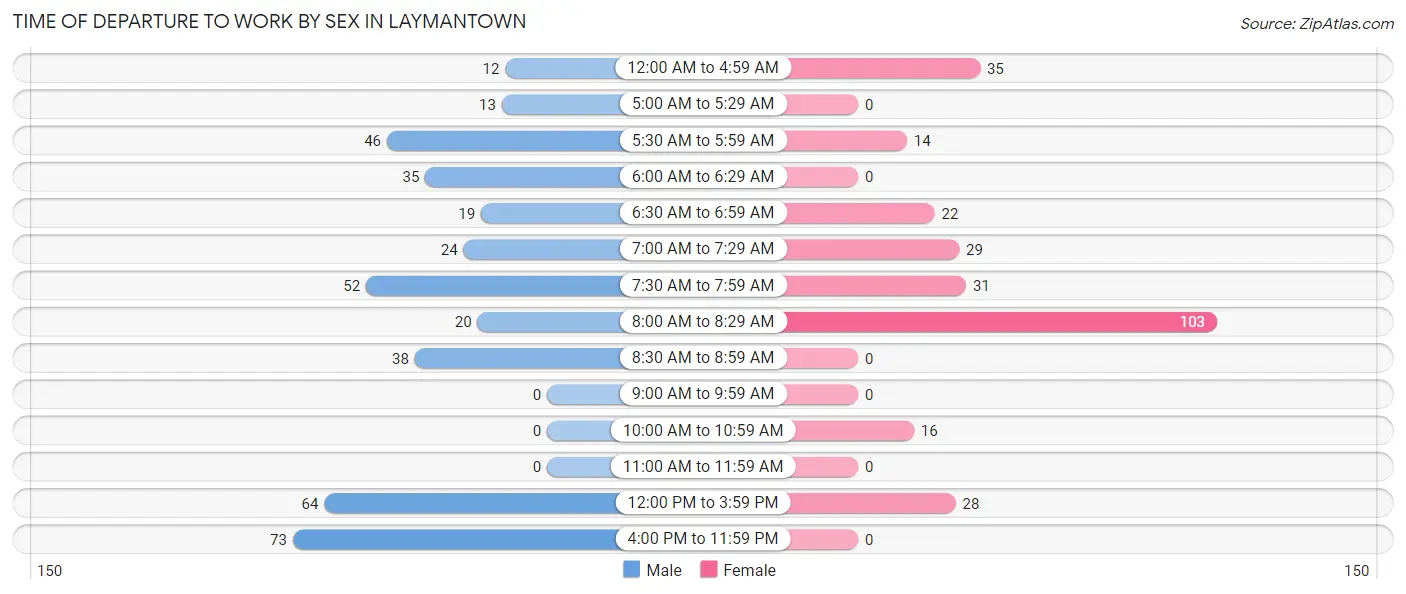
| Time of Departure | Male | Female |
| 12:00 AM to 4:59 AM | 12 (3.0%) | 35 (12.6%) |
| 5:00 AM to 5:29 AM | 13 (3.3%) | 0 (0.0%) |
| 5:30 AM to 5:59 AM | 46 (11.6%) | 14 (5.0%) |
| 6:00 AM to 6:29 AM | 35 (8.8%) | 0 (0.0%) |
| 6:30 AM to 6:59 AM | 19 (4.8%) | 22 (7.9%) |
| 7:00 AM to 7:29 AM | 24 (6.1%) | 29 (10.4%) |
| 7:30 AM to 7:59 AM | 52 (13.1%) | 31 (11.2%) |
| 8:00 AM to 8:29 AM | 20 (5.1%) | 103 (37.0%) |
| 8:30 AM to 8:59 AM | 38 (9.6%) | 0 (0.0%) |
| 9:00 AM to 9:59 AM | 0 (0.0%) | 0 (0.0%) |
| 10:00 AM to 10:59 AM | 0 (0.0%) | 16 (5.8%) |
| 11:00 AM to 11:59 AM | 0 (0.0%) | 0 (0.0%) |
| 12:00 PM to 3:59 PM | 64 (16.2%) | 28 (10.1%) |
| 4:00 PM to 11:59 PM | 73 (18.4%) | 0 (0.0%) |
| Total | 396 (100.0%) | 278 (100.0%) |
Housing Occupancy in Laymantown
Occupancy by Ownership in Laymantown
Of the total 681 dwellings in Laymantown, owner-occupied units account for 681 (100.0%), while renter-occupied units make up 0 (0.0%).
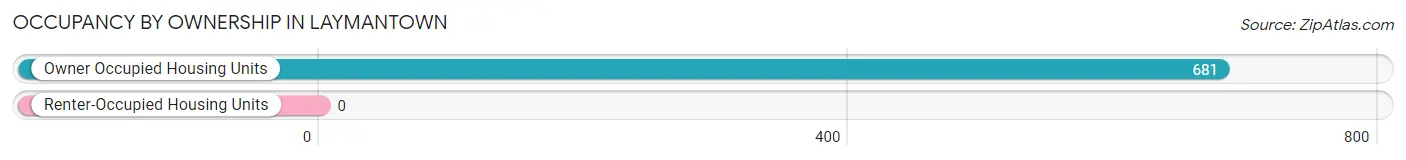
| Occupancy | # Housing Units | % Housing Units |
| Owner Occupied Housing Units | 681 | 100.0% |
| Renter-Occupied Housing Units | 0 | 0.0% |
| Total Occupied Housing Units | 681 | 100.0% |
Occupancy by Household Size in Laymantown
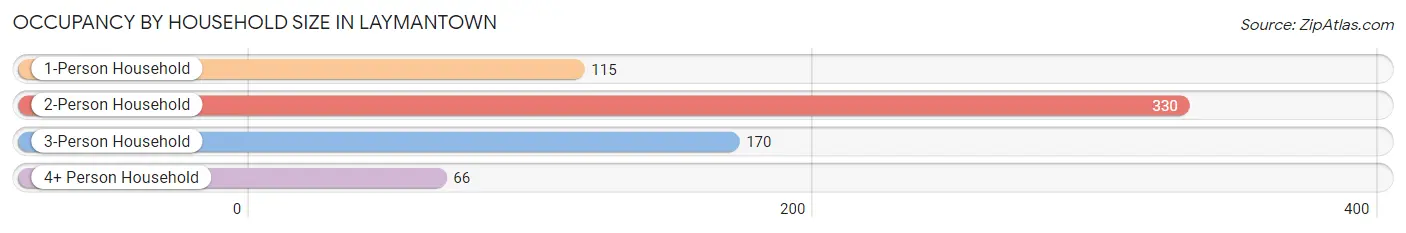
| Household Size | # Housing Units | % Housing Units |
| 1-Person Household | 115 | 16.9% |
| 2-Person Household | 330 | 48.5% |
| 3-Person Household | 170 | 25.0% |
| 4+ Person Household | 66 | 9.7% |
| Total Housing Units | 681 | 100.0% |
Occupancy by Ownership by Household Size in Laymantown
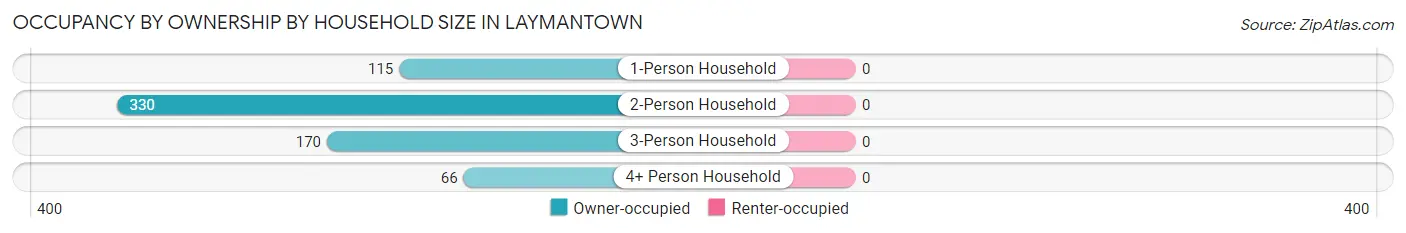
| Household Size | Owner-occupied | Renter-occupied |
| 1-Person Household | 115 (100.0%) | 0 (0.0%) |
| 2-Person Household | 330 (100.0%) | 0 (0.0%) |
| 3-Person Household | 170 (100.0%) | 0 (0.0%) |
| 4+ Person Household | 66 (100.0%) | 0 (0.0%) |
| Total Housing Units | 681 (100.0%) | 0 (0.0%) |
Occupancy by Educational Attainment in Laymantown
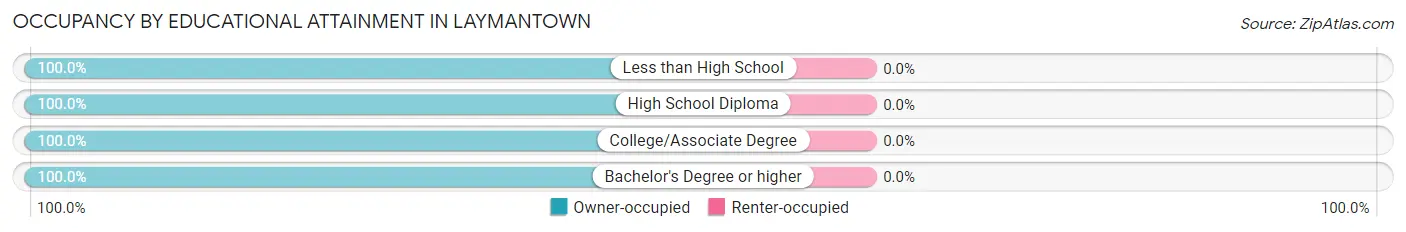
| Household Size | Owner-occupied | Renter-occupied |
| Less than High School | 49 (100.0%) | 0 (0.0%) |
| High School Diploma | 171 (100.0%) | 0 (0.0%) |
| College/Associate Degree | 260 (100.0%) | 0 (0.0%) |
| Bachelor's Degree or higher | 201 (100.0%) | 0 (0.0%) |
Occupancy by Age of Householder in Laymantown
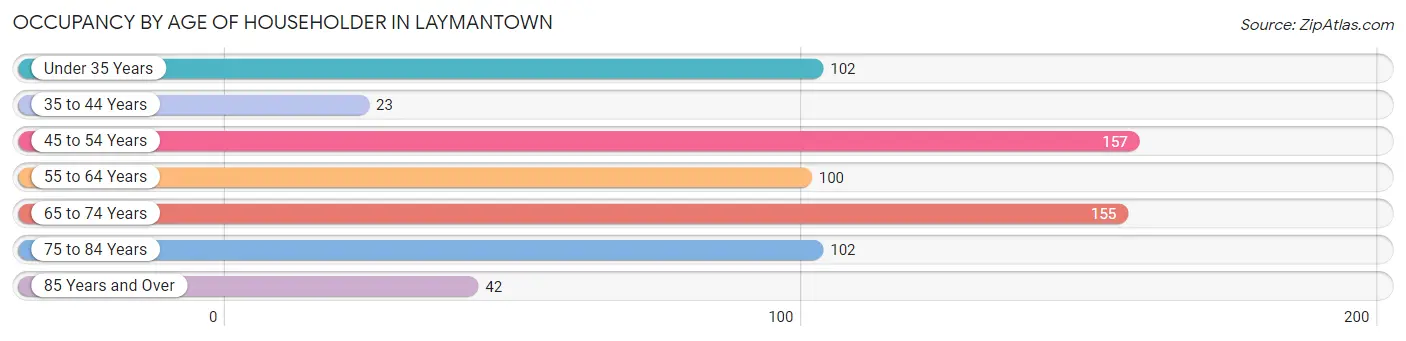
| Age Bracket | # Households | % Households |
| Under 35 Years | 102 | 15.0% |
| 35 to 44 Years | 23 | 3.4% |
| 45 to 54 Years | 157 | 23.1% |
| 55 to 64 Years | 100 | 14.7% |
| 65 to 74 Years | 155 | 22.8% |
| 75 to 84 Years | 102 | 15.0% |
| 85 Years and Over | 42 | 6.2% |
| Total | 681 | 100.0% |
Housing Finances in Laymantown
Median Income by Occupancy in Laymantown
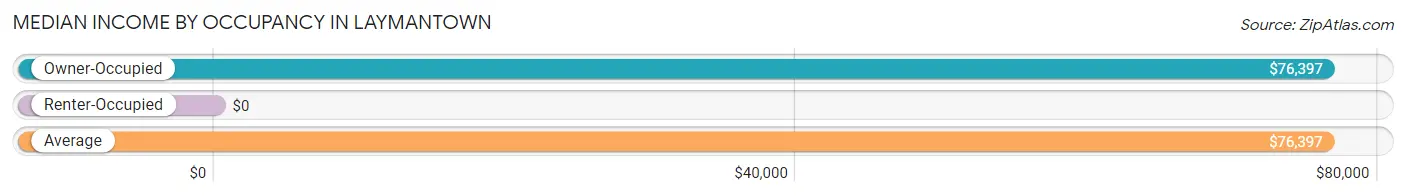
| Occupancy Type | # Households | Median Income |
| Owner-Occupied | 681 (100.0%) | $76,397 |
| Renter-Occupied | 0 (0.0%) | $0 |
| Average | 681 (100.0%) | $76,397 |
Occupancy by Householder Income Bracket in Laymantown
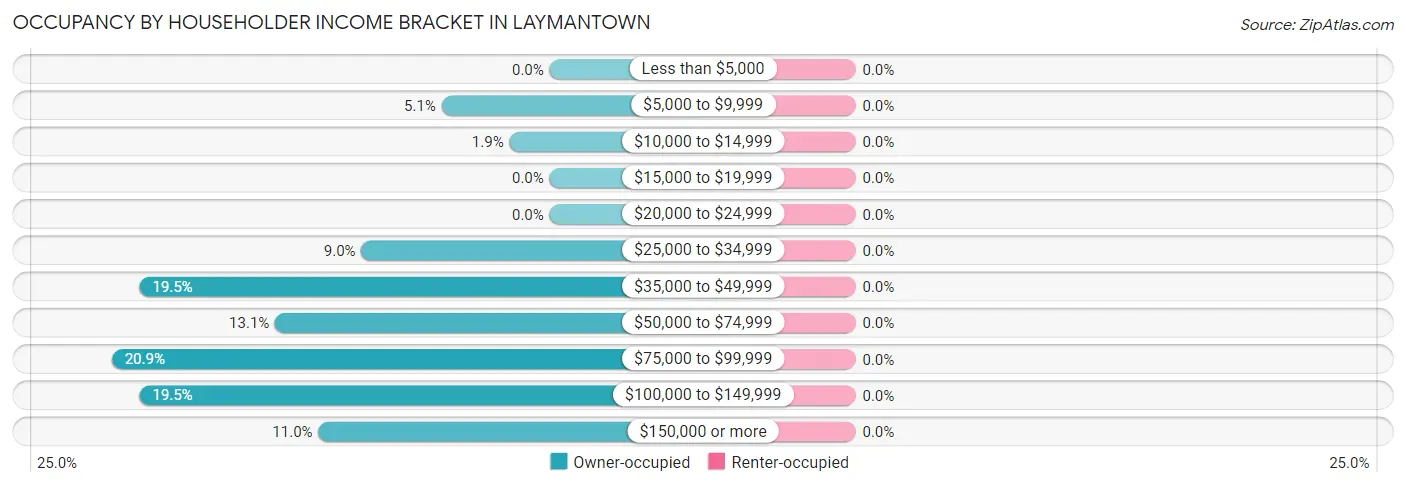
| Income Bracket | Owner-occupied | Renter-occupied |
| Less than $5,000 | 0 (0.0%) | 0 (0.0%) |
| $5,000 to $9,999 | 35 (5.1%) | 0 (0.0%) |
| $10,000 to $14,999 | 13 (1.9%) | 0 (0.0%) |
| $15,000 to $19,999 | 0 (0.0%) | 0 (0.0%) |
| $20,000 to $24,999 | 0 (0.0%) | 0 (0.0%) |
| $25,000 to $34,999 | 61 (9.0%) | 0 (0.0%) |
| $35,000 to $49,999 | 133 (19.5%) | 0 (0.0%) |
| $50,000 to $74,999 | 89 (13.1%) | 0 (0.0%) |
| $75,000 to $99,999 | 142 (20.8%) | 0 (0.0%) |
| $100,000 to $149,999 | 133 (19.5%) | 0 (0.0%) |
| $150,000 or more | 75 (11.0%) | 0 (0.0%) |
| Total | 681 (100.0%) | 0 (0.0%) |
Monthly Housing Cost Tiers in Laymantown
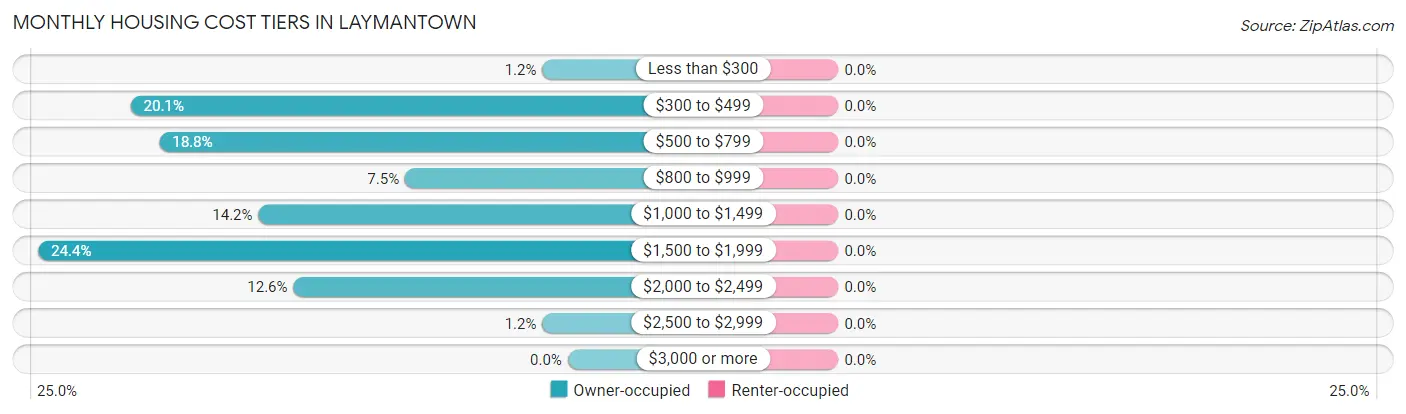
| Monthly Cost | Owner-occupied | Renter-occupied |
| Less than $300 | 8 (1.2%) | 0 (0.0%) |
| $300 to $499 | 137 (20.1%) | 0 (0.0%) |
| $500 to $799 | 128 (18.8%) | 0 (0.0%) |
| $800 to $999 | 51 (7.5%) | 0 (0.0%) |
| $1,000 to $1,499 | 97 (14.2%) | 0 (0.0%) |
| $1,500 to $1,999 | 166 (24.4%) | 0 (0.0%) |
| $2,000 to $2,499 | 86 (12.6%) | 0 (0.0%) |
| $2,500 to $2,999 | 8 (1.2%) | 0 (0.0%) |
| $3,000 or more | 0 (0.0%) | 0 (0.0%) |
| Total | 681 (100.0%) | 0 (0.0%) |
Physical Housing Characteristics in Laymantown
Housing Structures in Laymantown
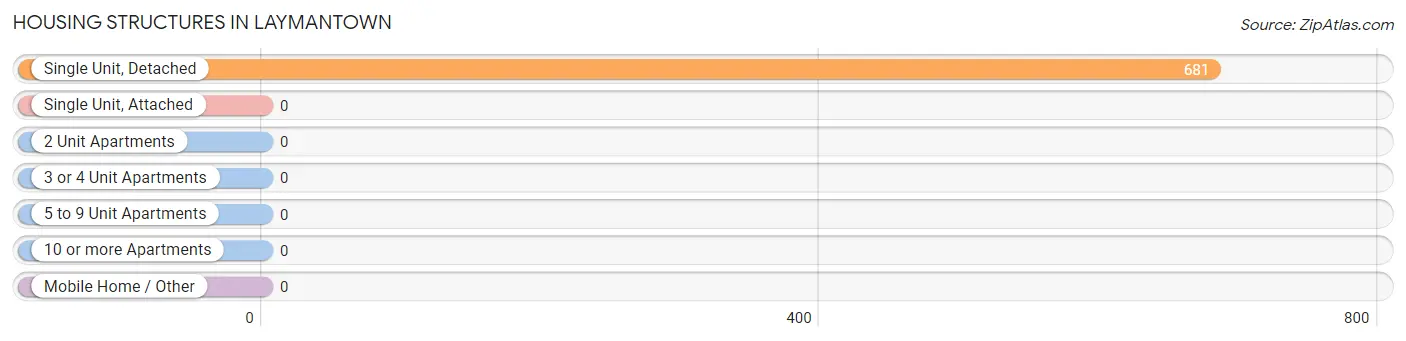
| Structure Type | # Housing Units | % Housing Units |
| Single Unit, Detached | 681 | 100.0% |
| Single Unit, Attached | 0 | 0.0% |
| 2 Unit Apartments | 0 | 0.0% |
| 3 or 4 Unit Apartments | 0 | 0.0% |
| 5 to 9 Unit Apartments | 0 | 0.0% |
| 10 or more Apartments | 0 | 0.0% |
| Mobile Home / Other | 0 | 0.0% |
| Total | 681 | 100.0% |
Housing Structures by Occupancy in Laymantown
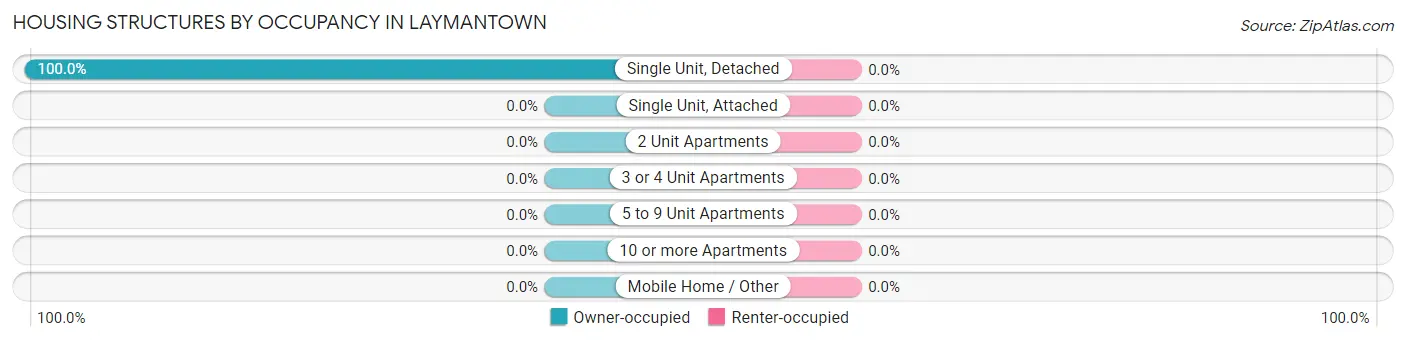
| Structure Type | Owner-occupied | Renter-occupied |
| Single Unit, Detached | 681 (100.0%) | 0 (0.0%) |
| Single Unit, Attached | 0 (0.0%) | 0 (0.0%) |
| 2 Unit Apartments | 0 (0.0%) | 0 (0.0%) |
| 3 or 4 Unit Apartments | 0 (0.0%) | 0 (0.0%) |
| 5 to 9 Unit Apartments | 0 (0.0%) | 0 (0.0%) |
| 10 or more Apartments | 0 (0.0%) | 0 (0.0%) |
| Mobile Home / Other | 0 (0.0%) | 0 (0.0%) |
| Total | 681 (100.0%) | 0 (0.0%) |
Housing Structures by Number of Rooms in Laymantown
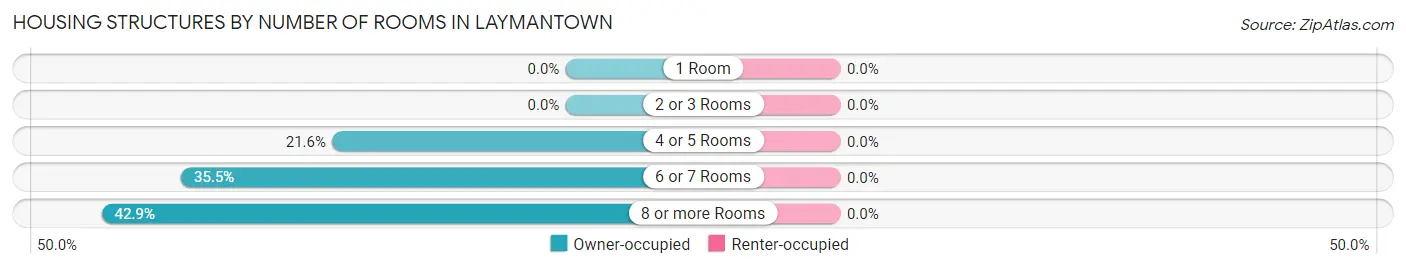
| Number of Rooms | Owner-occupied | Renter-occupied |
| 1 Room | 0 (0.0%) | 0 (0.0%) |
| 2 or 3 Rooms | 0 (0.0%) | 0 (0.0%) |
| 4 or 5 Rooms | 147 (21.6%) | 0 (0.0%) |
| 6 or 7 Rooms | 242 (35.5%) | 0 (0.0%) |
| 8 or more Rooms | 292 (42.9%) | 0 (0.0%) |
| Total | 681 (100.0%) | 0 (0.0%) |
Housing Structure by Heating Type in Laymantown
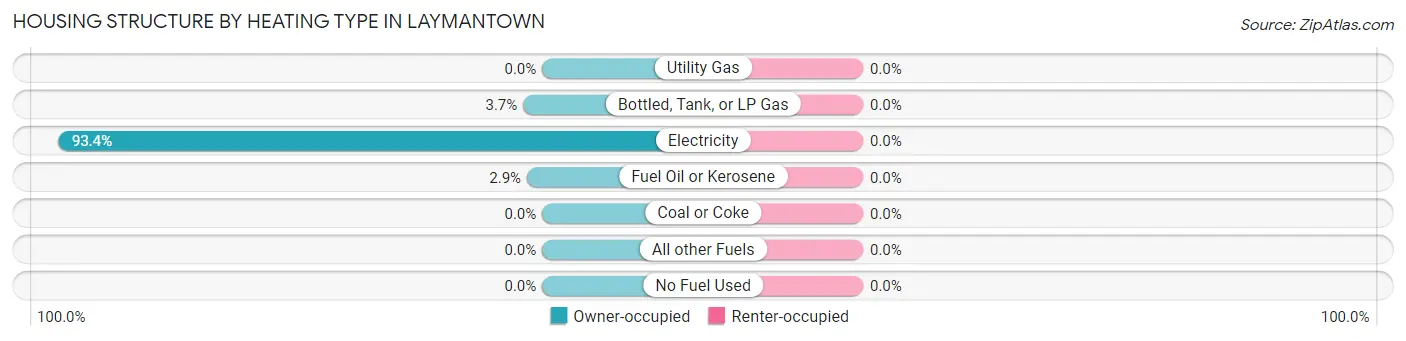
| Heating Type | Owner-occupied | Renter-occupied |
| Utility Gas | 0 (0.0%) | 0 (0.0%) |
| Bottled, Tank, or LP Gas | 25 (3.7%) | 0 (0.0%) |
| Electricity | 636 (93.4%) | 0 (0.0%) |
| Fuel Oil or Kerosene | 20 (2.9%) | 0 (0.0%) |
| Coal or Coke | 0 (0.0%) | 0 (0.0%) |
| All other Fuels | 0 (0.0%) | 0 (0.0%) |
| No Fuel Used | 0 (0.0%) | 0 (0.0%) |
| Total | 681 (100.0%) | 0 (0.0%) |
Household Vehicle Usage in Laymantown
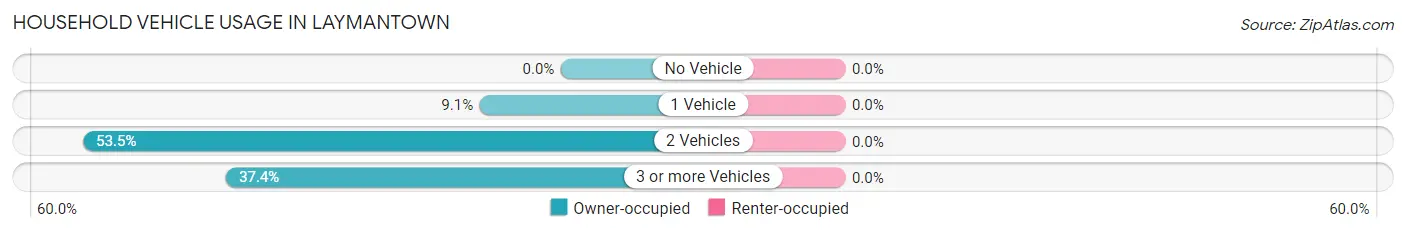
| Vehicles per Household | Owner-occupied | Renter-occupied |
| No Vehicle | 0 (0.0%) | 0 (0.0%) |
| 1 Vehicle | 62 (9.1%) | 0 (0.0%) |
| 2 Vehicles | 364 (53.4%) | 0 (0.0%) |
| 3 or more Vehicles | 255 (37.4%) | 0 (0.0%) |
| Total | 681 (100.0%) | 0 (0.0%) |
Real Estate & Mortgages in Laymantown
Real Estate and Mortgage Overview in Laymantown
| Characteristic | Without Mortgage | With Mortgage |
| Housing Units | 273 | 408 |
| Median Property Value | $270,500 | $253,200 |
| Median Household Income | $61,094 | $61 |
| Monthly Housing Costs | $493 | $0 |
| Real Estate Taxes | $1,678 | $0 |
Property Value by Mortgage Status in Laymantown
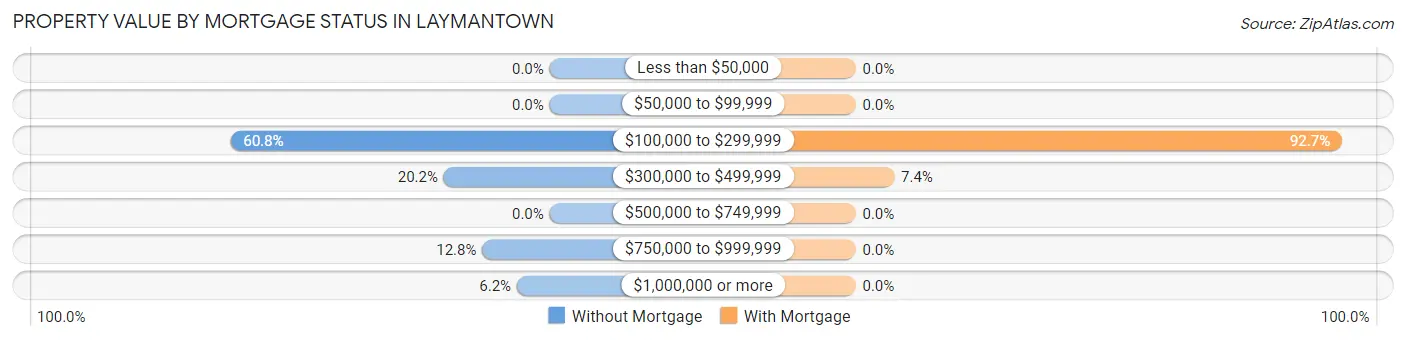
| Property Value | Without Mortgage | With Mortgage |
| Less than $50,000 | 0 (0.0%) | 0 (0.0%) |
| $50,000 to $99,999 | 0 (0.0%) | 0 (0.0%) |
| $100,000 to $299,999 | 166 (60.8%) | 378 (92.6%) |
| $300,000 to $499,999 | 55 (20.2%) | 30 (7.3%) |
| $500,000 to $749,999 | 0 (0.0%) | 0 (0.0%) |
| $750,000 to $999,999 | 35 (12.8%) | 0 (0.0%) |
| $1,000,000 or more | 17 (6.2%) | 0 (0.0%) |
| Total | 273 (100.0%) | 408 (100.0%) |
Household Income by Mortgage Status in Laymantown
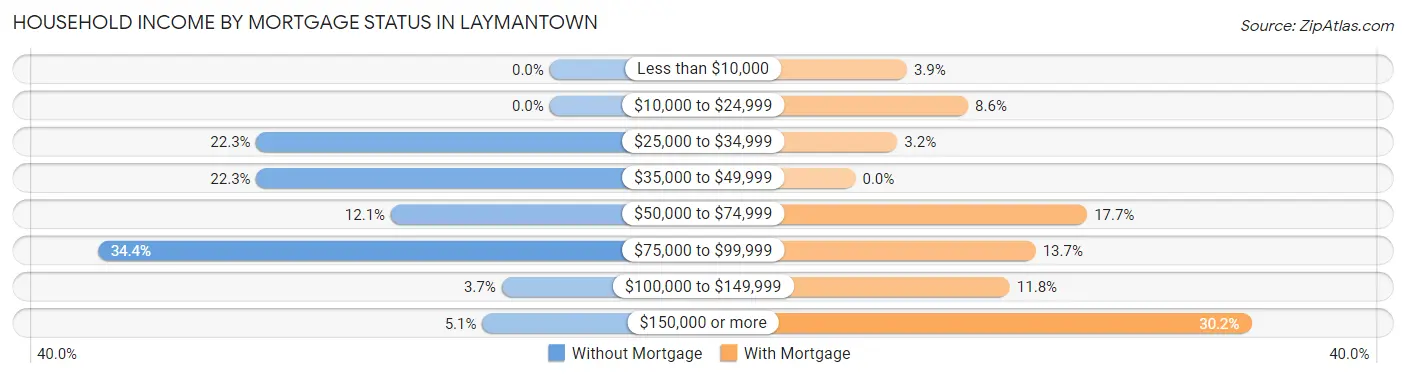
| Household Income | Without Mortgage | With Mortgage |
| Less than $10,000 | 0 (0.0%) | 16 (3.9%) |
| $10,000 to $24,999 | 0 (0.0%) | 35 (8.6%) |
| $25,000 to $34,999 | 61 (22.3%) | 13 (3.2%) |
| $35,000 to $49,999 | 61 (22.3%) | 0 (0.0%) |
| $50,000 to $74,999 | 33 (12.1%) | 72 (17.6%) |
| $75,000 to $99,999 | 94 (34.4%) | 56 (13.7%) |
| $100,000 to $149,999 | 10 (3.7%) | 48 (11.8%) |
| $150,000 or more | 14 (5.1%) | 123 (30.1%) |
| Total | 273 (100.0%) | 408 (100.0%) |
Property Value to Household Income Ratio in Laymantown
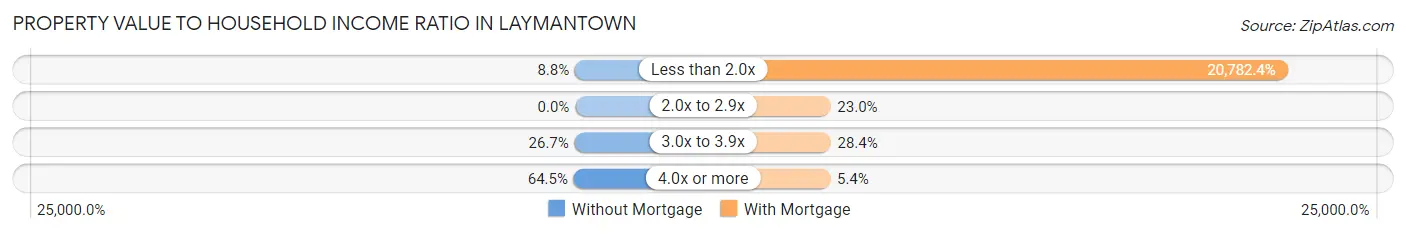
| Value-to-Income Ratio | Without Mortgage | With Mortgage |
| Less than 2.0x | 24 (8.8%) | 84,792 (20,782.3%) |
| 2.0x to 2.9x | 0 (0.0%) | 94 (23.0%) |
| 3.0x to 3.9x | 73 (26.7%) | 116 (28.4%) |
| 4.0x or more | 176 (64.5%) | 22 (5.4%) |
| Total | 273 (100.0%) | 408 (100.0%) |
Real Estate Taxes by Mortgage Status in Laymantown
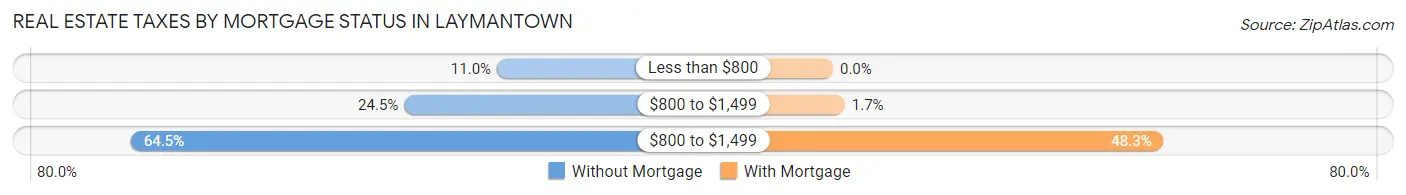
| Property Taxes | Without Mortgage | With Mortgage |
| Less than $800 | 30 (11.0%) | 0 (0.0%) |
| $800 to $1,499 | 67 (24.5%) | 7 (1.7%) |
| $800 to $1,499 | 176 (64.5%) | 197 (48.3%) |
| Total | 273 (100.0%) | 408 (100.0%) |
Health & Disability in Laymantown
Health Insurance Coverage by Age in Laymantown
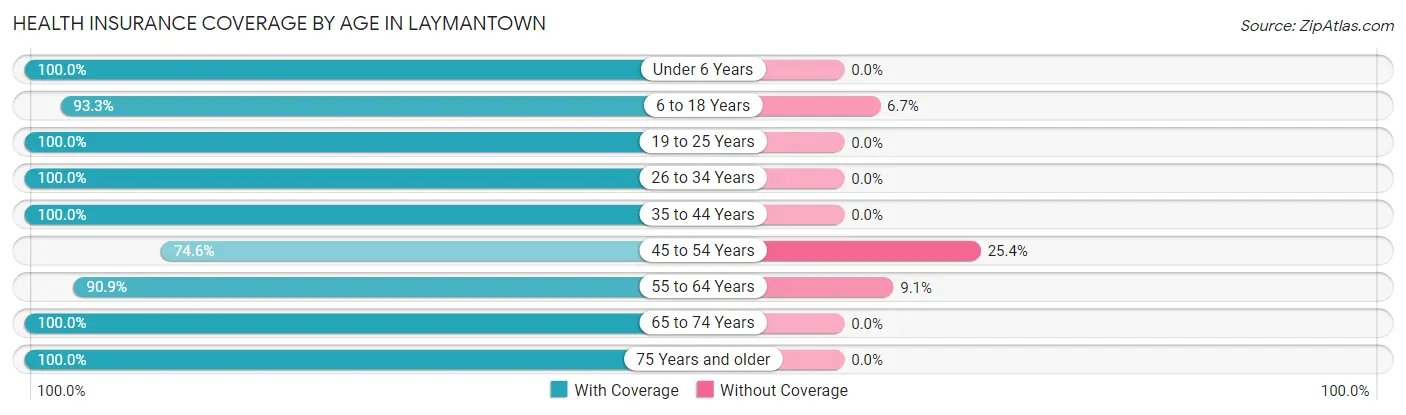
| Age Bracket | With Coverage | Without Coverage |
| Under 6 Years | 87 (100.0%) | 0 (0.0%) |
| 6 to 18 Years | 168 (93.3%) | 12 (6.7%) |
| 19 to 25 Years | 87 (100.0%) | 0 (0.0%) |
| 26 to 34 Years | 156 (100.0%) | 0 (0.0%) |
| 35 to 44 Years | 67 (100.0%) | 0 (0.0%) |
| 45 to 54 Years | 214 (74.6%) | 73 (25.4%) |
| 55 to 64 Years | 179 (90.9%) | 18 (9.1%) |
| 65 to 74 Years | 380 (100.0%) | 0 (0.0%) |
| 75 Years and older | 244 (100.0%) | 0 (0.0%) |
| Total | 1,582 (93.9%) | 103 (6.1%) |
Health Insurance Coverage by Citizenship Status in Laymantown
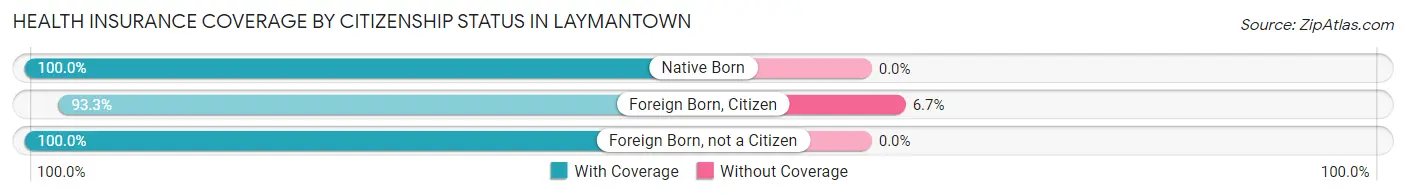
| Citizenship Status | With Coverage | Without Coverage |
| Native Born | 87 (100.0%) | 0 (0.0%) |
| Foreign Born, Citizen | 168 (93.3%) | 12 (6.7%) |
| Foreign Born, not a Citizen | 87 (100.0%) | 0 (0.0%) |
Health Insurance Coverage by Household Income in Laymantown
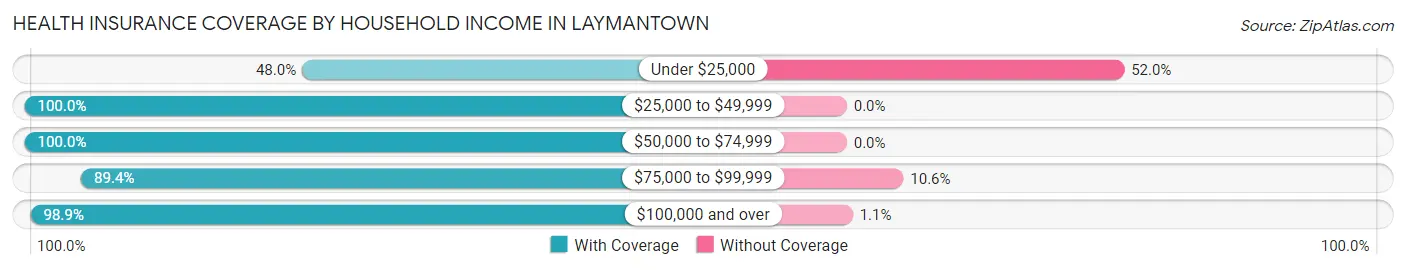
| Household Income | With Coverage | Without Coverage |
| Under $25,000 | 61 (48.0%) | 66 (52.0%) |
| $25,000 to $49,999 | 329 (100.0%) | 0 (0.0%) |
| $50,000 to $74,999 | 318 (100.0%) | 0 (0.0%) |
| $75,000 to $99,999 | 253 (89.4%) | 30 (10.6%) |
| $100,000 and over | 621 (98.9%) | 7 (1.1%) |
Public vs Private Health Insurance Coverage by Age in Laymantown
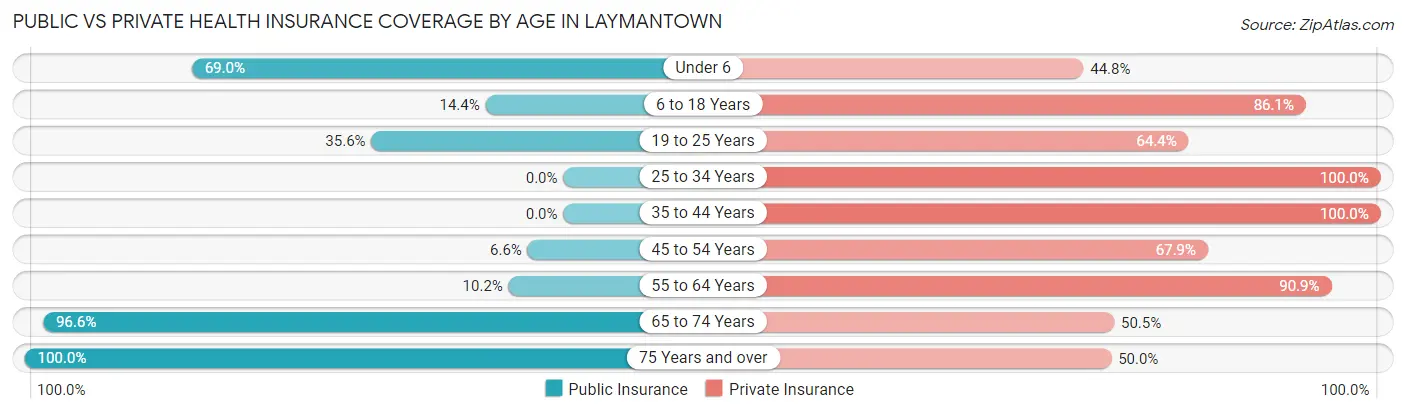
| Age Bracket | Public Insurance | Private Insurance |
| Under 6 | 60 (69.0%) | 39 (44.8%) |
| 6 to 18 Years | 26 (14.4%) | 155 (86.1%) |
| 19 to 25 Years | 31 (35.6%) | 56 (64.4%) |
| 25 to 34 Years | 0 (0.0%) | 156 (100.0%) |
| 35 to 44 Years | 0 (0.0%) | 67 (100.0%) |
| 45 to 54 Years | 19 (6.6%) | 195 (67.9%) |
| 55 to 64 Years | 20 (10.2%) | 179 (90.9%) |
| 65 to 74 Years | 367 (96.6%) | 192 (50.5%) |
| 75 Years and over | 244 (100.0%) | 122 (50.0%) |
| Total | 767 (45.5%) | 1,161 (68.9%) |
Disability Status by Sex by Age in Laymantown
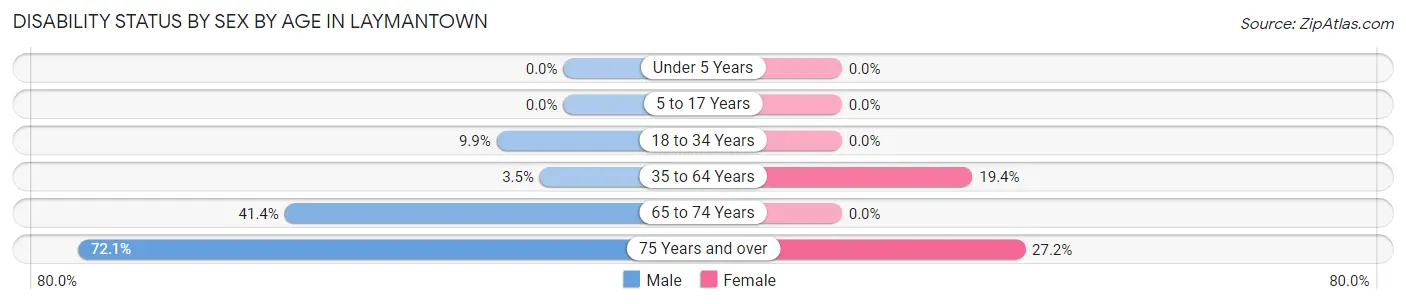
| Age Bracket | Male | Female |
| Under 5 Years | 0 (0.0%) | 0 (0.0%) |
| 5 to 17 Years | 0 (0.0%) | 0 (0.0%) |
| 18 to 34 Years | 13 (9.9%) | 0 (0.0%) |
| 35 to 64 Years | 9 (3.5%) | 57 (19.4%) |
| 65 to 74 Years | 113 (41.4%) | 0 (0.0%) |
| 75 Years and over | 62 (72.1%) | 43 (27.2%) |
Disability Class by Sex by Age in Laymantown
Disability Class: Hearing Difficulty
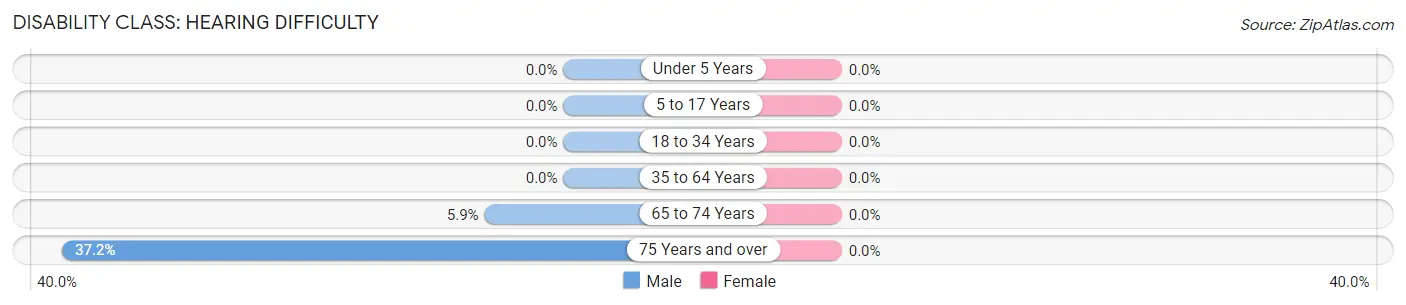
| Age Bracket | Male | Female |
| Under 5 Years | 0 (0.0%) | 0 (0.0%) |
| 5 to 17 Years | 0 (0.0%) | 0 (0.0%) |
| 18 to 34 Years | 0 (0.0%) | 0 (0.0%) |
| 35 to 64 Years | 0 (0.0%) | 0 (0.0%) |
| 65 to 74 Years | 16 (5.9%) | 0 (0.0%) |
| 75 Years and over | 32 (37.2%) | 0 (0.0%) |
Disability Class: Vision Difficulty
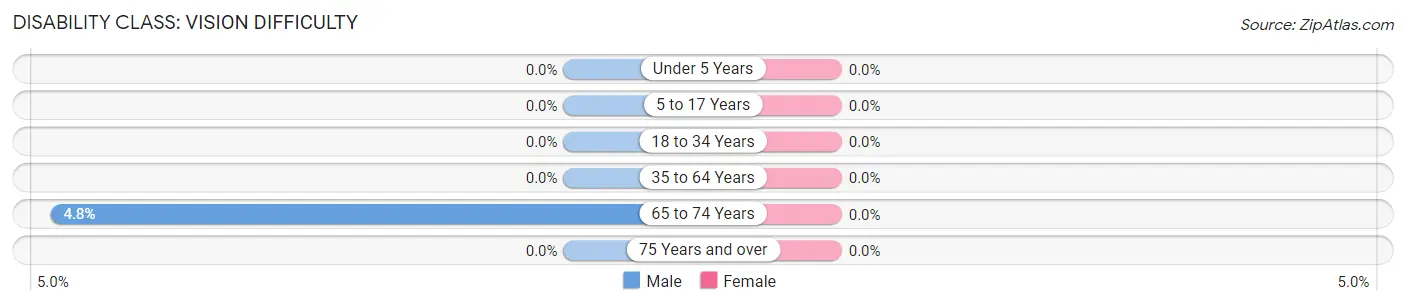
| Age Bracket | Male | Female |
| Under 5 Years | 0 (0.0%) | 0 (0.0%) |
| 5 to 17 Years | 0 (0.0%) | 0 (0.0%) |
| 18 to 34 Years | 0 (0.0%) | 0 (0.0%) |
| 35 to 64 Years | 0 (0.0%) | 0 (0.0%) |
| 65 to 74 Years | 13 (4.8%) | 0 (0.0%) |
| 75 Years and over | 0 (0.0%) | 0 (0.0%) |
Disability Class: Cognitive Difficulty
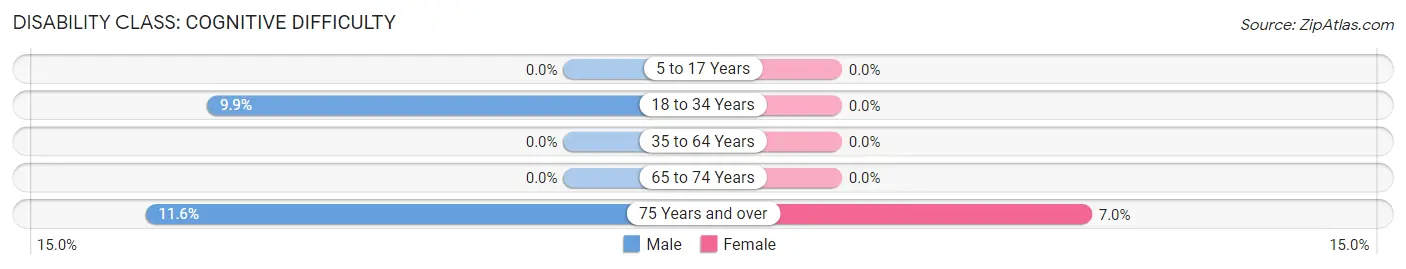
| Age Bracket | Male | Female |
| 5 to 17 Years | 0 (0.0%) | 0 (0.0%) |
| 18 to 34 Years | 13 (9.9%) | 0 (0.0%) |
| 35 to 64 Years | 0 (0.0%) | 0 (0.0%) |
| 65 to 74 Years | 0 (0.0%) | 0 (0.0%) |
| 75 Years and over | 10 (11.6%) | 11 (7.0%) |
Disability Class: Ambulatory Difficulty
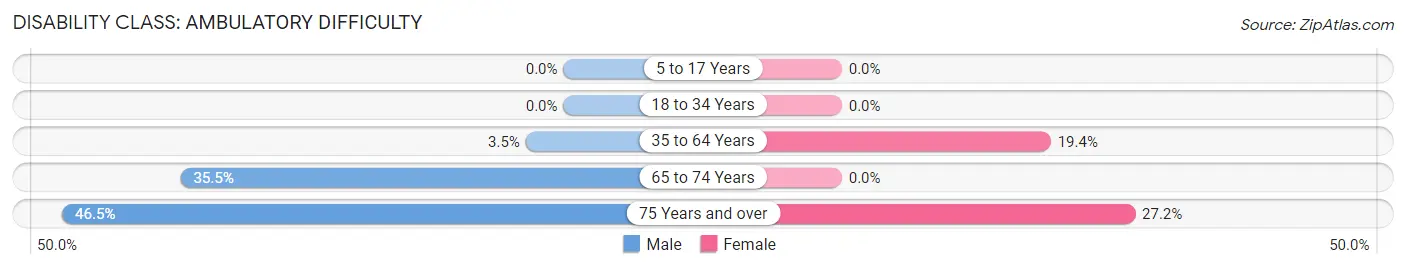
| Age Bracket | Male | Female |
| 5 to 17 Years | 0 (0.0%) | 0 (0.0%) |
| 18 to 34 Years | 0 (0.0%) | 0 (0.0%) |
| 35 to 64 Years | 9 (3.5%) | 57 (19.4%) |
| 65 to 74 Years | 97 (35.5%) | 0 (0.0%) |
| 75 Years and over | 40 (46.5%) | 43 (27.2%) |
Disability Class: Self-Care Difficulty
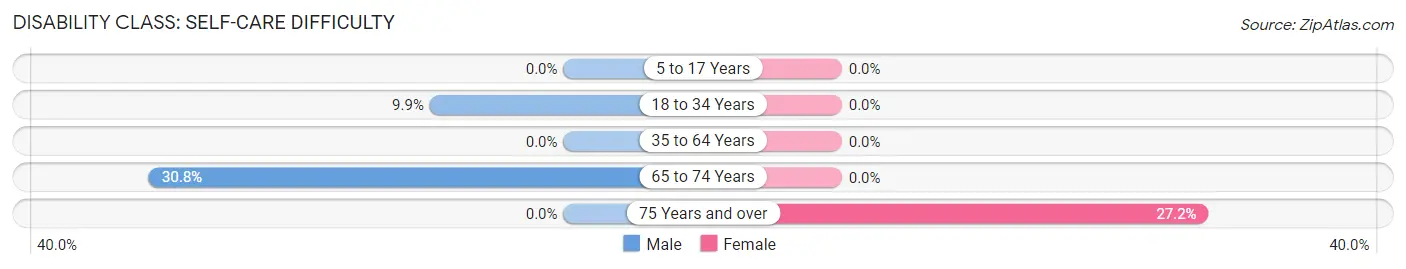
| Age Bracket | Male | Female |
| 5 to 17 Years | 0 (0.0%) | 0 (0.0%) |
| 18 to 34 Years | 13 (9.9%) | 0 (0.0%) |
| 35 to 64 Years | 0 (0.0%) | 0 (0.0%) |
| 65 to 74 Years | 84 (30.8%) | 0 (0.0%) |
| 75 Years and over | 0 (0.0%) | 43 (27.2%) |
Technology Access in Laymantown
Computing Device Access in Laymantown
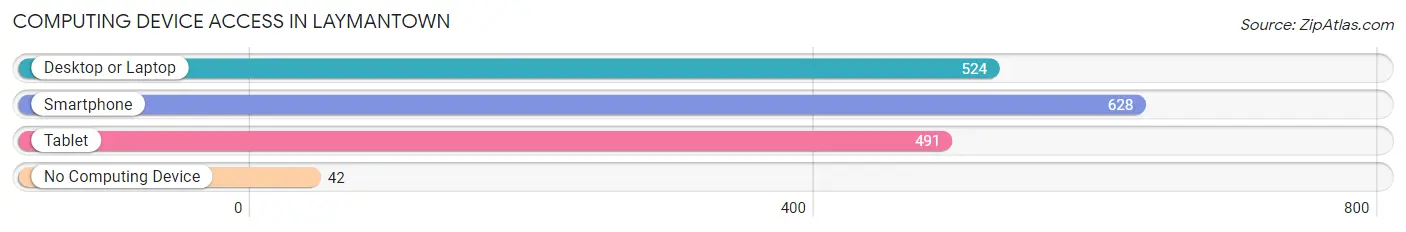
| Device Type | # Households | % Households |
| Desktop or Laptop | 524 | 76.9% |
| Smartphone | 628 | 92.2% |
| Tablet | 491 | 72.1% |
| No Computing Device | 42 | 6.2% |
| Total | 681 | 100.0% |
Internet Access in Laymantown
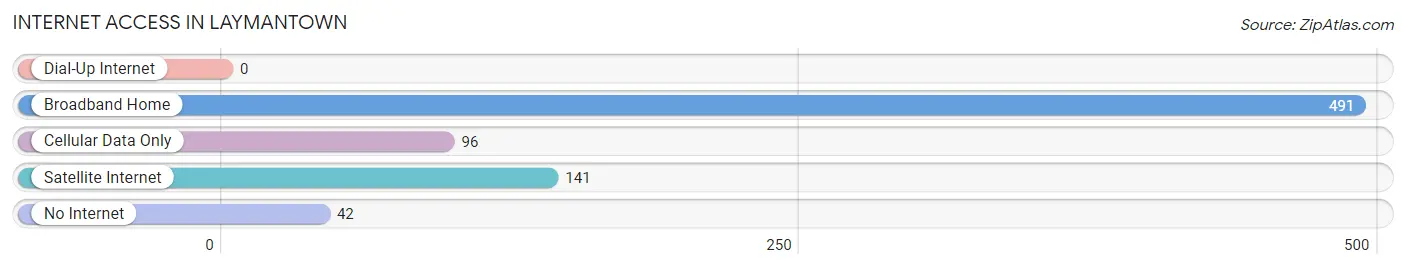
| Internet Type | # Households | % Households |
| Dial-Up Internet | 0 | 0.0% |
| Broadband Home | 491 | 72.1% |
| Cellular Data Only | 96 | 14.1% |
| Satellite Internet | 141 | 20.7% |
| No Internet | 42 | 6.2% |
| Total | 681 | 100.0% |
Laymantown Summary
Laymantown, Virginia is a small town located in the western part of the state, in the foothills of the Blue Ridge Mountains. It is situated in the Roanoke Valley, about 10 miles south of Roanoke and about 20 miles north of Blacksburg. The town is named after the Layman family, who were among the first settlers in the area.
History
The area that is now Laymantown was first settled in the late 1700s by the Layman family. The family had migrated from Pennsylvania and established a homestead in the area. The Layman family was among the first settlers in the area and their homestead was the first permanent settlement in the area.
The town of Laymantown was officially established in 1845. The town was named after the Layman family and was incorporated in 1848. The town was originally a farming community and the main crops grown were corn, wheat, and tobacco.
In the late 1800s, the town began to grow and develop. The railroad was built through the town in 1881, which helped to spur economic growth. The town also became a popular tourist destination, as it was located near the Blue Ridge Mountains.
In the early 1900s, the town began to experience a decline in population. This was due to the decline of the railroad and the lack of economic opportunities in the area. The population of the town decreased from a peak of 1,000 in the early 1900s to just over 500 in the late 1990s.
Geography
Laymantown is located in the western part of Virginia, in the foothills of the Blue Ridge Mountains. The town is situated in the Roanoke Valley, about 10 miles south of Roanoke and about 20 miles north of Blacksburg. The town is located at an elevation of 1,400 feet above sea level.
The town is located in a rural area and is surrounded by rolling hills and farmland. The town is located near the Blue Ridge Parkway, which is a popular tourist destination. The town is also located near the Appalachian Trail, which is a popular hiking destination.
Economy
The economy of Laymantown is largely based on agriculture. The main crops grown in the area are corn, wheat, and tobacco. The town also has a few small businesses, such as a grocery store, a hardware store, and a few restaurants.
The town is also home to a few small manufacturing companies, such as a furniture manufacturer and a plastics manufacturer. The town is also home to a few small technology companies, such as a software development company and a web design company.
Demographics
As of the 2010 census, the population of Laymantown was 545. The town has a population that is predominantly white (94.2%) and the median age is 44. The median household income is $45,000 and the median home value is $150,000.
The town has a low unemployment rate (3.2%) and a high rate of homeownership (83.3%). The town is also home to a few small businesses, such as a grocery store, a hardware store, and a few restaurants.
Conclusion
Laymantown, Virginia is a small town located in the western part of the state, in the foothills of the Blue Ridge Mountains. The town was established in 1845 and was named after the Layman family, who were among the first settlers in the area. The town is largely based on agriculture and has a few small businesses, such as a grocery store, a hardware store, and a few restaurants. The town has a population that is predominantly white and the median age is 44. The median household income is $45,000 and the median home value is $150,000. The town has a low unemployment rate and a high rate of homeownership.
Common Questions
What is Per Capita Income in Laymantown?
Per Capita income in Laymantown is $34,234.
What is the Median Family Income in Laymantown?
Median Family Income in Laymantown is $76,765.
What is the Median Household income in Laymantown?
Median Household Income in Laymantown is $76,397.
What is Income or Wage Gap in Laymantown?
Income or Wage Gap in Laymantown is 31.6%.
Women in Laymantown earn 68.4 cents for every dollar earned by a man.
What is Inequality or Gini Index in Laymantown?
Inequality or Gini Index in Laymantown is 0.33.
What is the Total Population of Laymantown?
Total Population of Laymantown is 1,685.
What is the Total Male Population of Laymantown?
Total Male Population of Laymantown is 880.
What is the Total Female Population of Laymantown?
Total Female Population of Laymantown is 805.
What is the Ratio of Males per 100 Females in Laymantown?
There are 109.32 Males per 100 Females in Laymantown.
What is the Ratio of Females per 100 Males in Laymantown?
There are 91.48 Females per 100 Males in Laymantown.
What is the Median Population Age in Laymantown?
Median Population Age in Laymantown is 54.7 Years.
What is the Average Family Size in Laymantown
Average Family Size in Laymantown is 2.7 People.
What is the Average Household Size in Laymantown
Average Household Size in Laymantown is 2.5 People.
How Large is the Labor Force in Laymantown?
There are 794 People in the Labor Forcein in Laymantown.
What is the Percentage of People in the Labor Force in Laymantown?
54.0% of People are in the Labor Force in Laymantown.