Sperryville, VA Map & Demographics
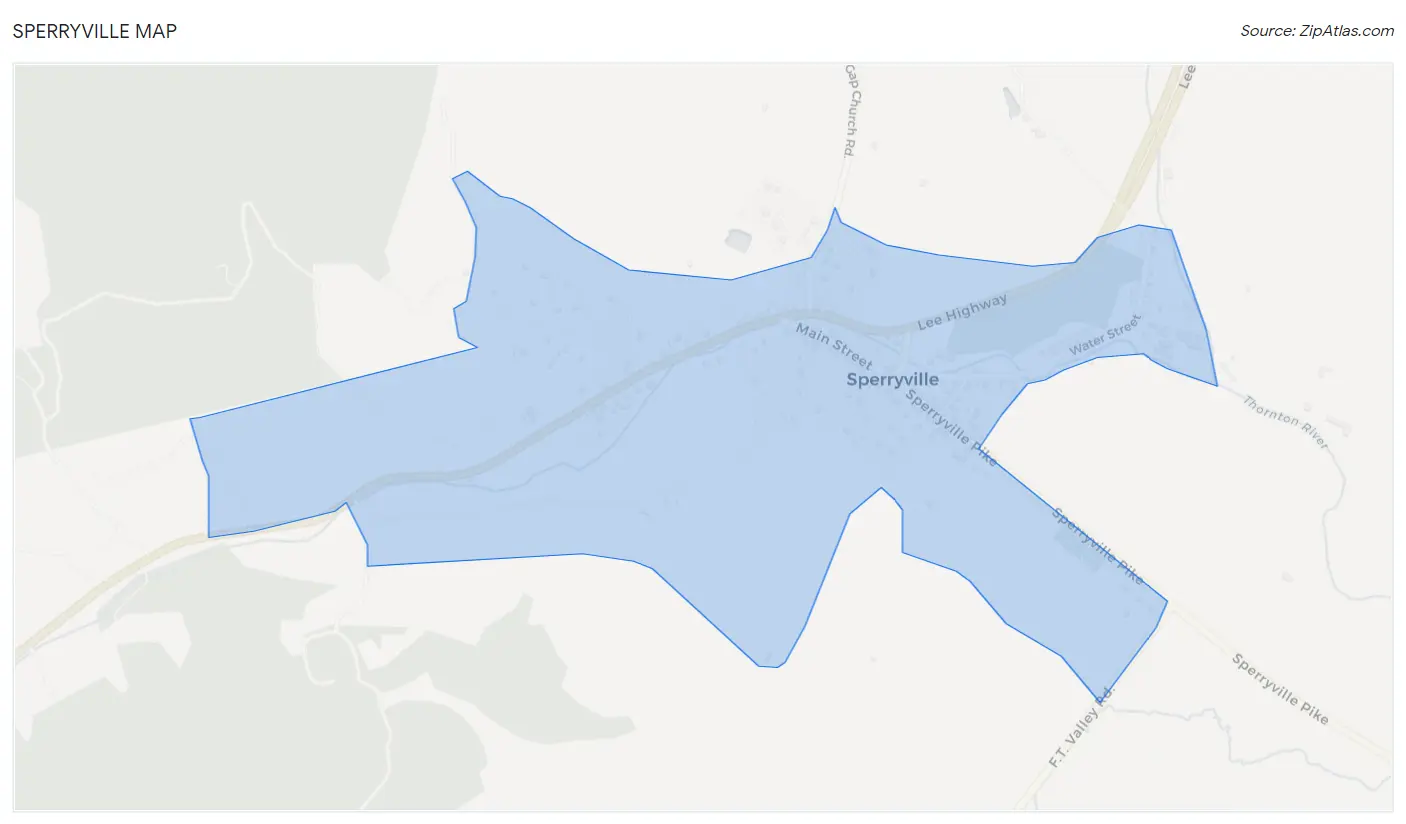
Sperryville Map
Sperryville Overview
$32,714
PER CAPITA INCOME
$90,931
AVG FAMILY INCOME
$90,637
AVG HOUSEHOLD INCOME
0.16
INEQUALITY / GINI INDEX
327
TOTAL POPULATION
154
MALE POPULATION
173
FEMALE POPULATION
89.02
MALES / 100 FEMALES
112.34
FEMALES / 100 MALES
48.8
MEDIAN AGE
2.6
AVG FAMILY SIZE
2.2
AVG HOUSEHOLD SIZE
130
LABOR FORCE [ PEOPLE ]
49.4%
PERCENT IN LABOR FORCE
Sperryville Zip Codes
Sperryville Area Codes
Income in Sperryville
Income Overview in Sperryville
Per Capita Income in Sperryville is $32,714, while median incomes of families and households are $90,931 and $90,637 respectively.
| Characteristic | Number | Measure |
| Per Capita Income | 327 | $32,714 |
| Median Family Income | 96 | $90,931 |
| Mean Family Income | 96 | $78,222 |
| Median Household Income | 146 | $90,637 |
| Mean Household Income | 146 | $75,873 |
| Income Deficit | 96 | $0 |
| Wage / Income Gap (%) | 327 | 0.00% |
| Wage / Income Gap ($) | 327 | 100.00¢ per $1 |
| Gini / Inequality Index | 327 | 0.16 |
Earnings by Sex in Sperryville
| Sex | Number | Average Earnings |
| Male | 76 (49.0%) | $0 |
| Female | 79 (51.0%) | $0 |
| Total | 155 (100.0%) | $0 |
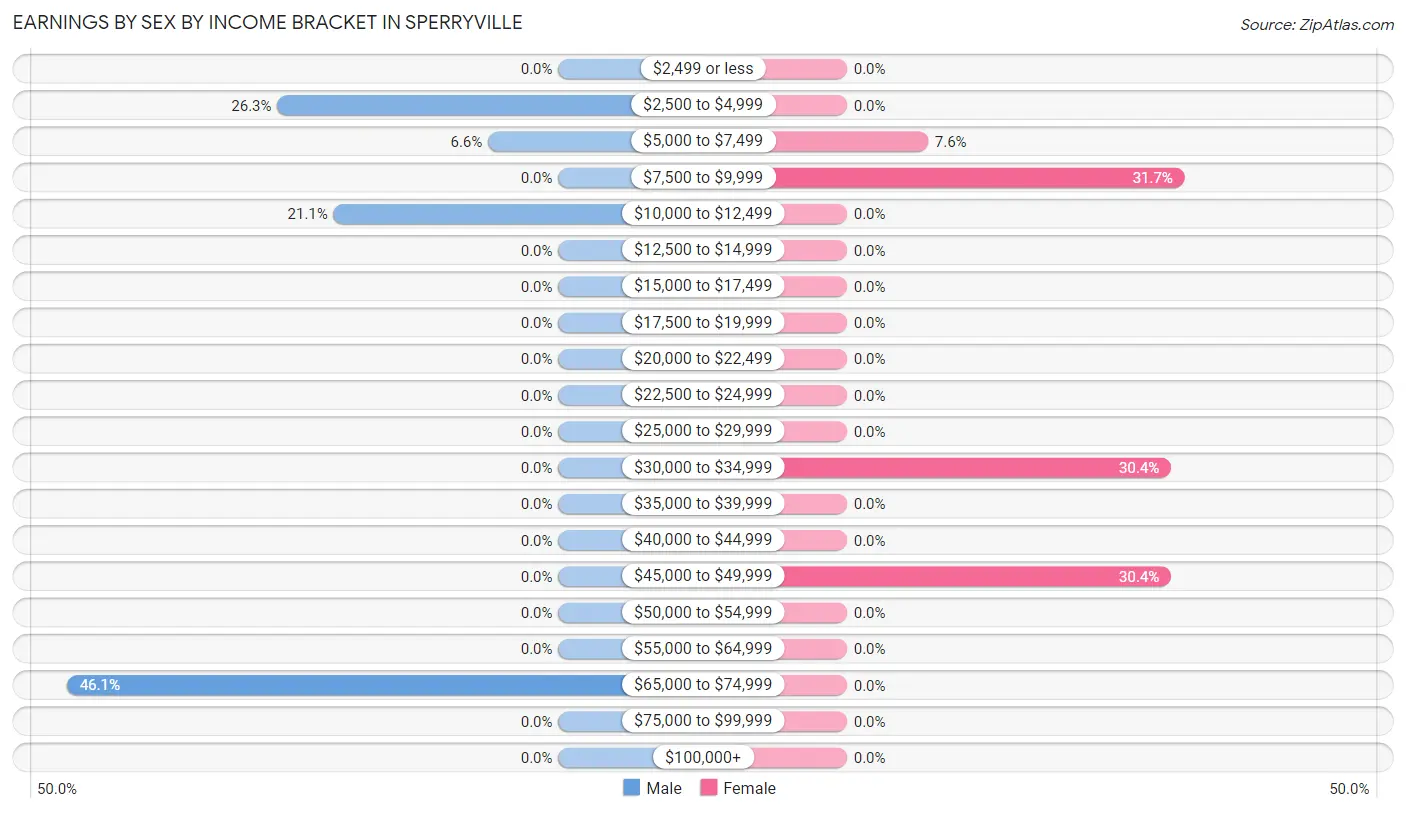
Earnings by Sex by Income Bracket in Sperryville
The most common earnings brackets in Sperryville are $65,000 to $74,999 for men (35 | 46.1%) and $7,500 to $9,999 for women (25 | 31.7%).
| Income | Male | Female |
| $2,499 or less | 0 (0.0%) | 0 (0.0%) |
| $2,500 to $4,999 | 20 (26.3%) | 0 (0.0%) |
| $5,000 to $7,499 | 5 (6.6%) | 6 (7.6%) |
| $7,500 to $9,999 | 0 (0.0%) | 25 (31.7%) |
| $10,000 to $12,499 | 16 (21.0%) | 0 (0.0%) |
| $12,500 to $14,999 | 0 (0.0%) | 0 (0.0%) |
| $15,000 to $17,499 | 0 (0.0%) | 0 (0.0%) |
| $17,500 to $19,999 | 0 (0.0%) | 0 (0.0%) |
| $20,000 to $22,499 | 0 (0.0%) | 0 (0.0%) |
| $22,500 to $24,999 | 0 (0.0%) | 0 (0.0%) |
| $25,000 to $29,999 | 0 (0.0%) | 0 (0.0%) |
| $30,000 to $34,999 | 0 (0.0%) | 24 (30.4%) |
| $35,000 to $39,999 | 0 (0.0%) | 0 (0.0%) |
| $40,000 to $44,999 | 0 (0.0%) | 0 (0.0%) |
| $45,000 to $49,999 | 0 (0.0%) | 24 (30.4%) |
| $50,000 to $54,999 | 0 (0.0%) | 0 (0.0%) |
| $55,000 to $64,999 | 0 (0.0%) | 0 (0.0%) |
| $65,000 to $74,999 | 35 (46.1%) | 0 (0.0%) |
| $75,000 to $99,999 | 0 (0.0%) | 0 (0.0%) |
| $100,000+ | 0 (0.0%) | 0 (0.0%) |
| Total | 76 (100.0%) | 79 (100.0%) |
Earnings by Sex by Educational Attainment in Sperryville
| Educational Attainment | Male Income | Female Income |
| Less than High School | - | - |
| High School Diploma | - | - |
| College or Associate's Degree | - | - |
| Bachelor's Degree | - | - |
| Graduate Degree | - | - |
| Total | - | - |
Family Income in Sperryville
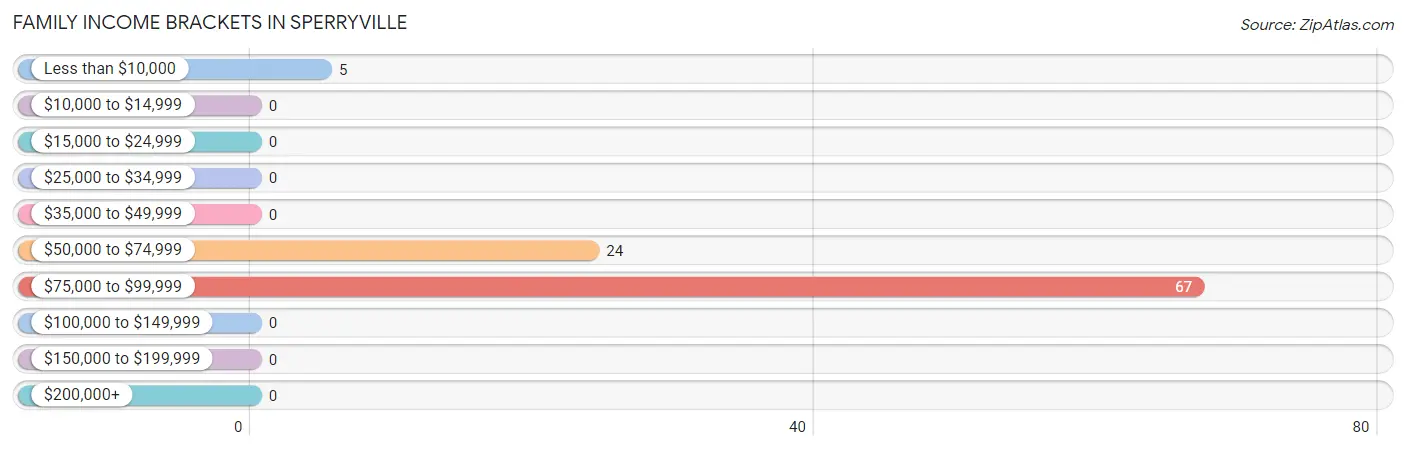
Family Income Brackets in Sperryville
According to the Sperryville family income data, there are 67 families falling into the $75,000 to $99,999 income range, which is the most common income bracket and makes up 69.8% of all families.
| Income Bracket | # Families | % Families |
| Less than $10,000 | 5 | 5.2% |
| $10,000 to $14,999 | 0 | 0.0% |
| $15,000 to $24,999 | 0 | 0.0% |
| $25,000 to $34,999 | 0 | 0.0% |
| $35,000 to $49,999 | 0 | 0.0% |
| $50,000 to $74,999 | 24 | 25.0% |
| $75,000 to $99,999 | 67 | 69.8% |
| $100,000 to $149,999 | 0 | 0.0% |
| $150,000 to $199,999 | 0 | 0.0% |
| $200,000+ | 0 | 0.0% |
Family Income by Famaliy Size in Sperryville
| Income Bracket | # Families | Median Income |
| 2-Person Families | 67 (69.8%) | $0 |
| 3-Person Families | 0 (0.0%) | $0 |
| 4-Person Families | 29 (30.2%) | $0 |
| 5-Person Families | 0 (0.0%) | $0 |
| 6-Person Families | 0 (0.0%) | $0 |
| 7+ Person Families | 0 (0.0%) | $0 |
| Total | 96 (100.0%) | $90,931 |
Family Income by Number of Earners in Sperryville
| Number of Earners | # Families | Median Income |
| No Earners | 51 (53.1%) | $0 |
| 1 Earner | 5 (5.2%) | $0 |
| 2 Earners | 40 (41.7%) | $0 |
| 3+ Earners | 0 (0.0%) | $0 |
| Total | 96 (100.0%) | $90,931 |
Household Income in Sperryville
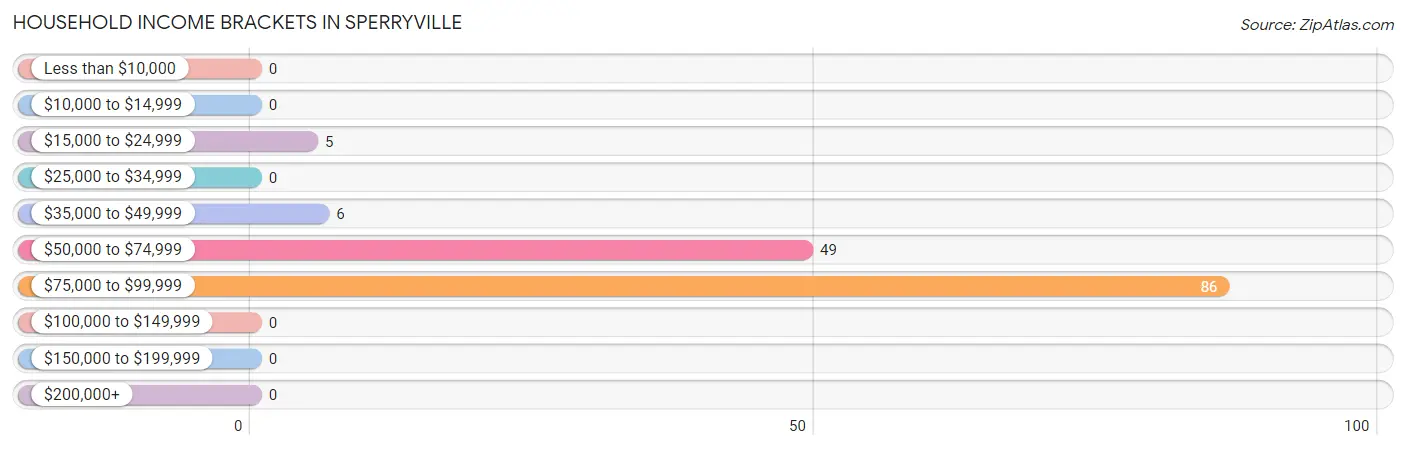
Household Income Brackets in Sperryville
With 86 households falling in the category, the $75,000 to $99,999 income range is the most frequent in Sperryville, accounting for 58.9% of all households.
| Income Bracket | # Households | % Households |
| Less than $10,000 | 0 | 0.0% |
| $10,000 to $14,999 | 0 | 0.0% |
| $15,000 to $24,999 | 5 | 3.4% |
| $25,000 to $34,999 | 0 | 0.0% |
| $35,000 to $49,999 | 6 | 4.1% |
| $50,000 to $74,999 | 49 | 33.6% |
| $75,000 to $99,999 | 86 | 58.9% |
| $100,000 to $149,999 | 0 | 0.0% |
| $150,000 to $199,999 | 0 | 0.0% |
| $200,000+ | 0 | 0.0% |
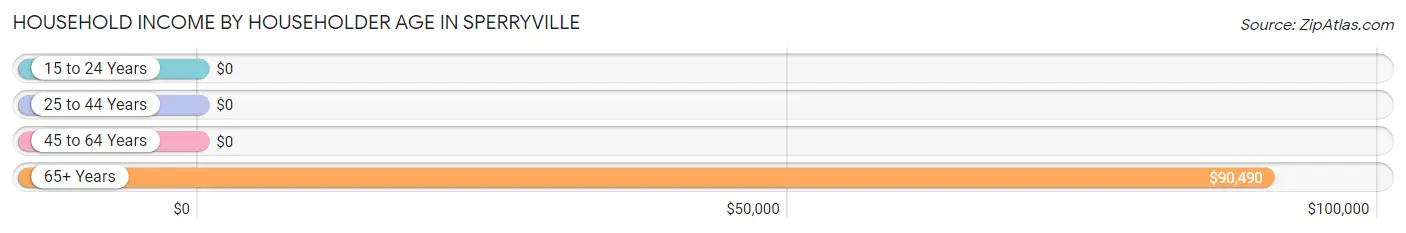
Household Income by Householder Age in Sperryville
The median household income in Sperryville is $90,637, with the highest median household income of $90,490 found in the 65+ years age bracket for the primary householder. A total of 82 households (56.2%) fall into this category. Meanwhile, the 15 to 24 years age bracket for the primary householder has the lowest median household income of $0, with 5 households (3.4%) in this group.
| Income Bracket | # Households | Median Income |
| 15 to 24 Years | 5 (3.4%) | $0 |
| 25 to 44 Years | 24 (16.4%) | $0 |
| 45 to 64 Years | 35 (24.0%) | $0 |
| 65+ Years | 82 (56.2%) | $90,490 |
| Total | 146 (100.0%) | $90,637 |
Poverty in Sperryville
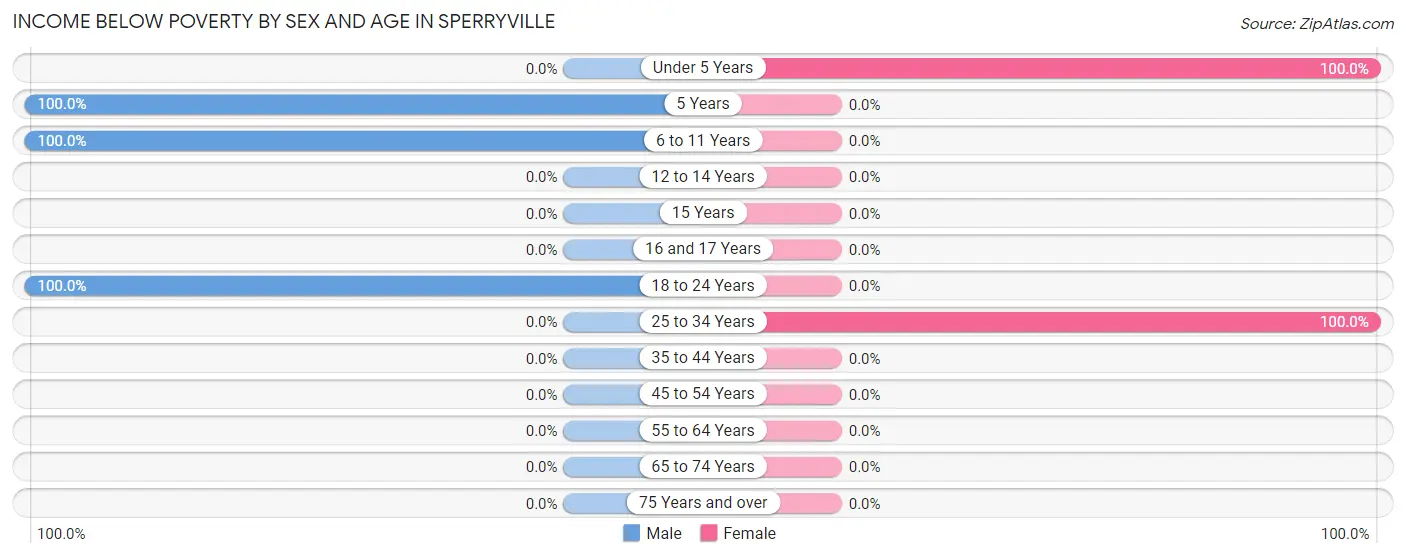
Income Below Poverty by Sex and Age in Sperryville
With 16.9% poverty level for males and 5.8% for females among the residents of Sperryville, 5 year old males and under 5 year old females are the most vulnerable to poverty, with 9 males (100.0%) and 4 females (100.0%) in their respective age groups living below the poverty level.
| Age Bracket | Male | Female |
| Under 5 Years | 0 (0.0%) | 4 (100.0%) |
| 5 Years | 9 (100.0%) | 0 (0.0%) |
| 6 to 11 Years | 12 (100.0%) | 0 (0.0%) |
| 12 to 14 Years | 0 (0.0%) | 0 (0.0%) |
| 15 Years | 0 (0.0%) | 0 (0.0%) |
| 16 and 17 Years | 0 (0.0%) | 0 (0.0%) |
| 18 to 24 Years | 5 (100.0%) | 0 (0.0%) |
| 25 to 34 Years | 0 (0.0%) | 6 (100.0%) |
| 35 to 44 Years | 0 (0.0%) | 0 (0.0%) |
| 45 to 54 Years | 0 (0.0%) | 0 (0.0%) |
| 55 to 64 Years | 0 (0.0%) | 0 (0.0%) |
| 65 to 74 Years | 0 (0.0%) | 0 (0.0%) |
| 75 Years and over | 0 (0.0%) | 0 (0.0%) |
| Total | 26 (16.9%) | 10 (5.8%) |
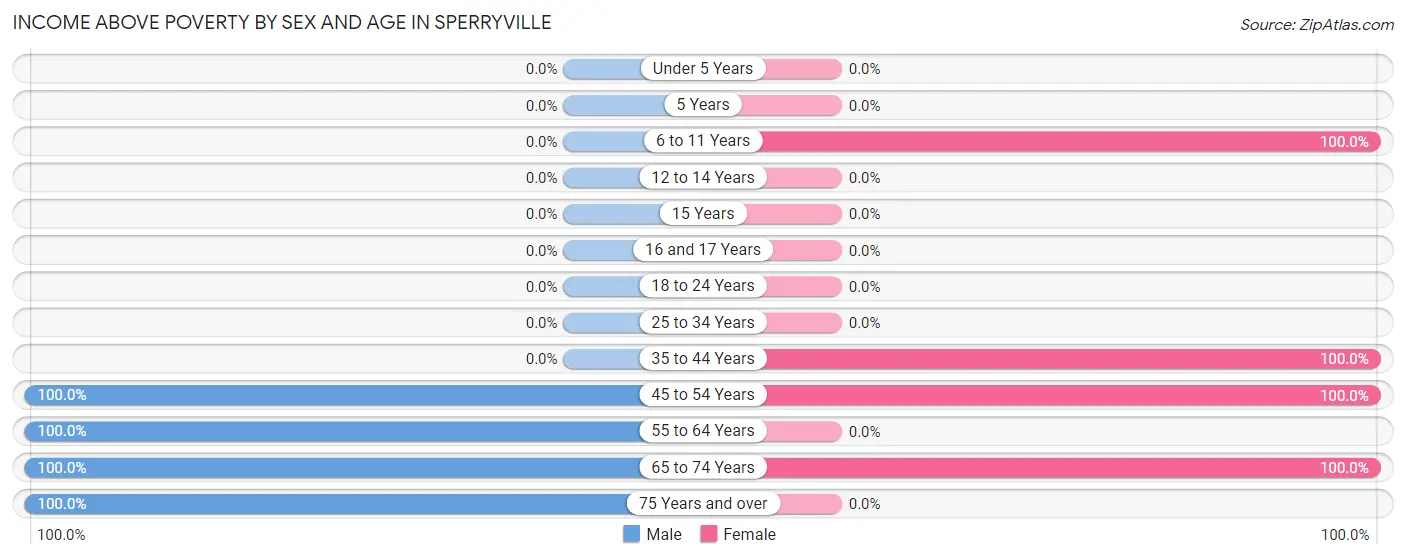
Income Above Poverty by Sex and Age in Sperryville
According to the poverty statistics in Sperryville, males aged 45 to 54 years and females aged 6 to 11 years are the age groups that are most secure financially, with 100.0% of males and 100.0% of females in these age groups living above the poverty line.
| Age Bracket | Male | Female |
| Under 5 Years | 0 (0.0%) | 0 (0.0%) |
| 5 Years | 0 (0.0%) | 0 (0.0%) |
| 6 to 11 Years | 0 (0.0%) | 39 (100.0%) |
| 12 to 14 Years | 0 (0.0%) | 0 (0.0%) |
| 15 Years | 0 (0.0%) | 0 (0.0%) |
| 16 and 17 Years | 0 (0.0%) | 0 (0.0%) |
| 18 to 24 Years | 0 (0.0%) | 0 (0.0%) |
| 25 to 34 Years | 0 (0.0%) | 0 (0.0%) |
| 35 to 44 Years | 0 (0.0%) | 48 (100.0%) |
| 45 to 54 Years | 39 (100.0%) | 25 (100.0%) |
| 55 to 64 Years | 16 (100.0%) | 0 (0.0%) |
| 65 to 74 Years | 57 (100.0%) | 51 (100.0%) |
| 75 Years and over | 16 (100.0%) | 0 (0.0%) |
| Total | 128 (83.1%) | 163 (94.2%) |
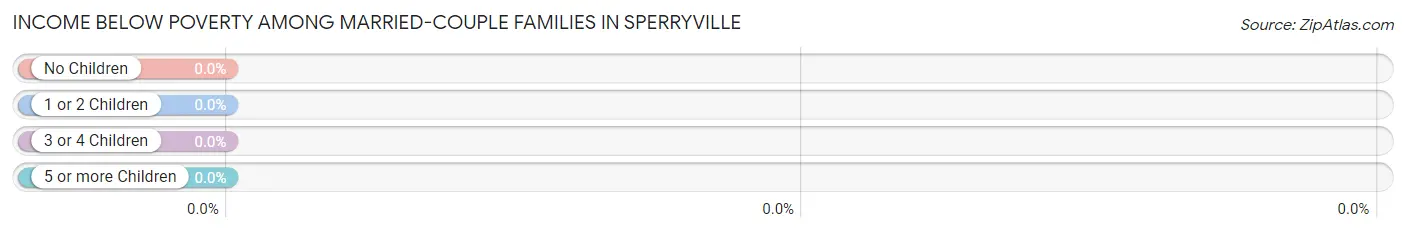
Income Below Poverty Among Married-Couple Families in Sperryville
| Children | Above Poverty | Below Poverty |
| No Children | 67 (100.0%) | 0 (0.0%) |
| 1 or 2 Children | 24 (100.0%) | 0 (0.0%) |
| 3 or 4 Children | 0 (0.0%) | 0 (0.0%) |
| 5 or more Children | 0 (0.0%) | 0 (0.0%) |
| Total | 91 (100.0%) | 0 (0.0%) |
Income Below Poverty Among Single-Parent Households in Sperryville
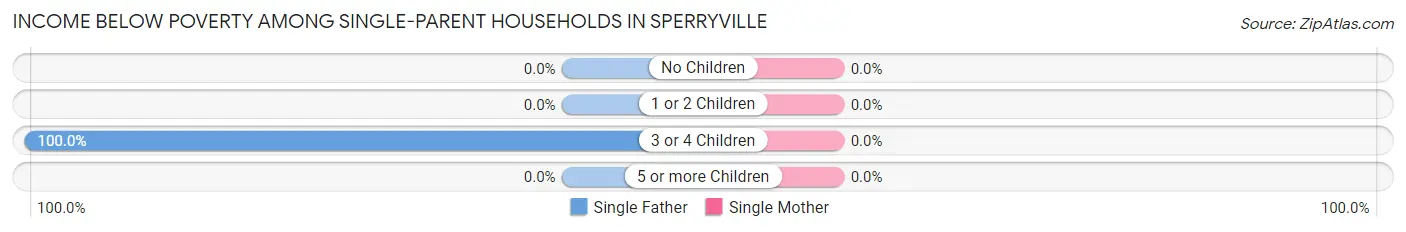
| Children | Single Father | Single Mother |
| No Children | 0 (0.0%) | 0 (0.0%) |
| 1 or 2 Children | 0 (0.0%) | 0 (0.0%) |
| 3 or 4 Children | 5 (100.0%) | 0 (0.0%) |
| 5 or more Children | 0 (0.0%) | 0 (0.0%) |
| Total | 5 (100.0%) | 0 (0.0%) |
Income Below Poverty Among Married-Couple vs Single-Parent Households in Sperryville
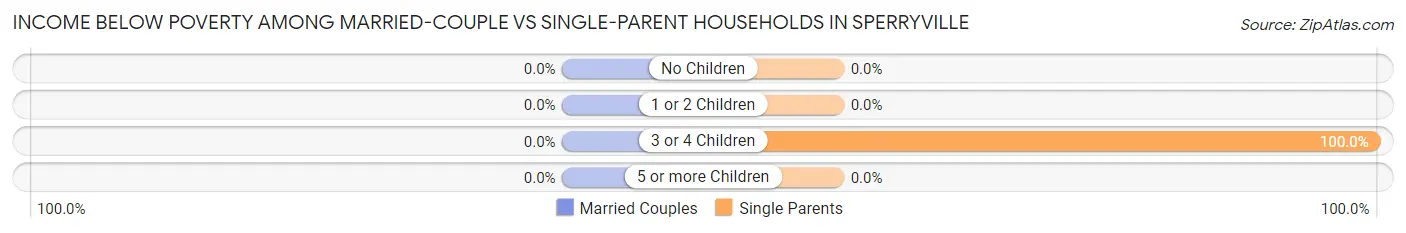
| Children | Married-Couple Families | Single-Parent Households |
| No Children | 0 (0.0%) | 0 (0.0%) |
| 1 or 2 Children | 0 (0.0%) | 0 (0.0%) |
| 3 or 4 Children | 0 (0.0%) | 5 (100.0%) |
| 5 or more Children | 0 (0.0%) | 0 (0.0%) |
| Total | 0 (0.0%) | 5 (100.0%) |
Race in Sperryville
The most populous races in Sperryville are , and White / Caucasian (327 | 100.0%).
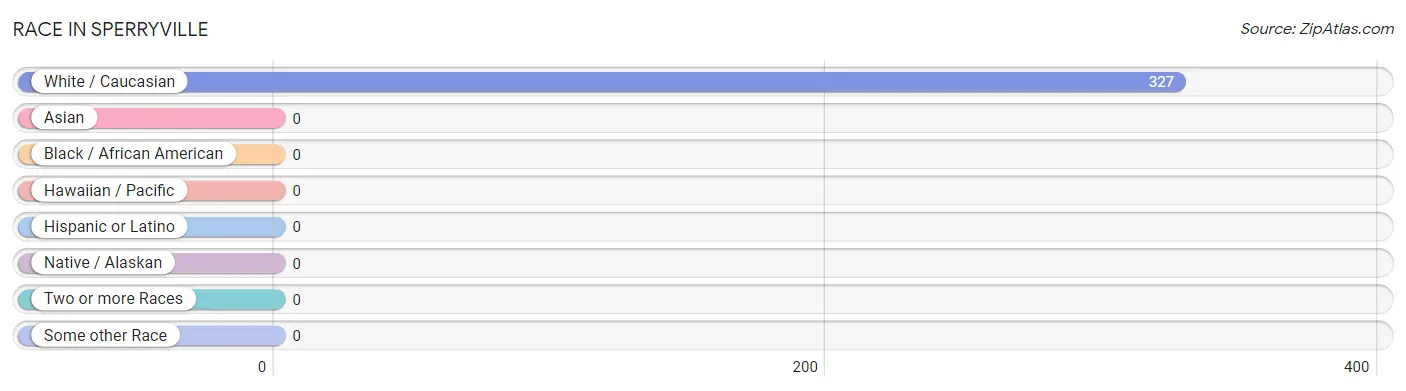
| Race | # Population | % Population |
| Asian | 0 | 0.0% |
| Black / African American | 0 | 0.0% |
| Hawaiian / Pacific | 0 | 0.0% |
| Hispanic or Latino | 0 | 0.0% |
| Native / Alaskan | 0 | 0.0% |
| White / Caucasian | 327 | 100.0% |
| Two or more Races | 0 | 0.0% |
| Some other Race | 0 | 0.0% |
| Total | 327 | 100.0% |
Ancestry in Sperryville
The most populous ancestries reported in Sperryville are German (134 | 41.0%), English (74 | 22.6%), Lithuanian (51 | 15.6%), Irish (49 | 15.0%), and Italian (27 | 8.3%), together accounting for 102.4% of all Sperryville residents.
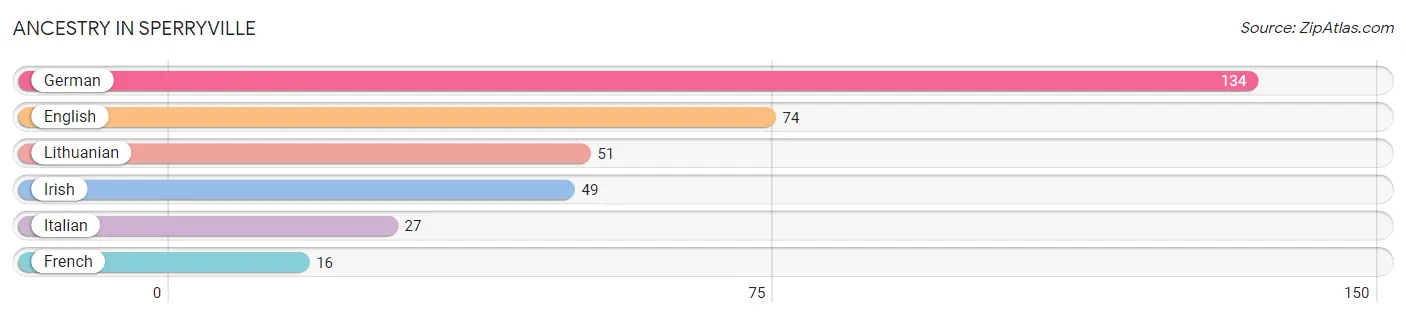
| Ancestry | # Population | % Population |
| English | 74 | 22.6% |
| French | 16 | 4.9% |
| German | 134 | 41.0% |
| Irish | 49 | 15.0% |
| Italian | 27 | 8.3% |
| Lithuanian | 51 | 15.6% | View All 6 Rows |
Immigrants in Sperryville

| Immigration Origin | # Population | % Population | View All 0 Rows |
Sex and Age in Sperryville
Sex and Age in Sperryville
The most populous age groups in Sperryville are 70 to 74 Years (57 | 37.0%) for men and 70 to 74 Years (51 | 29.5%) for women.
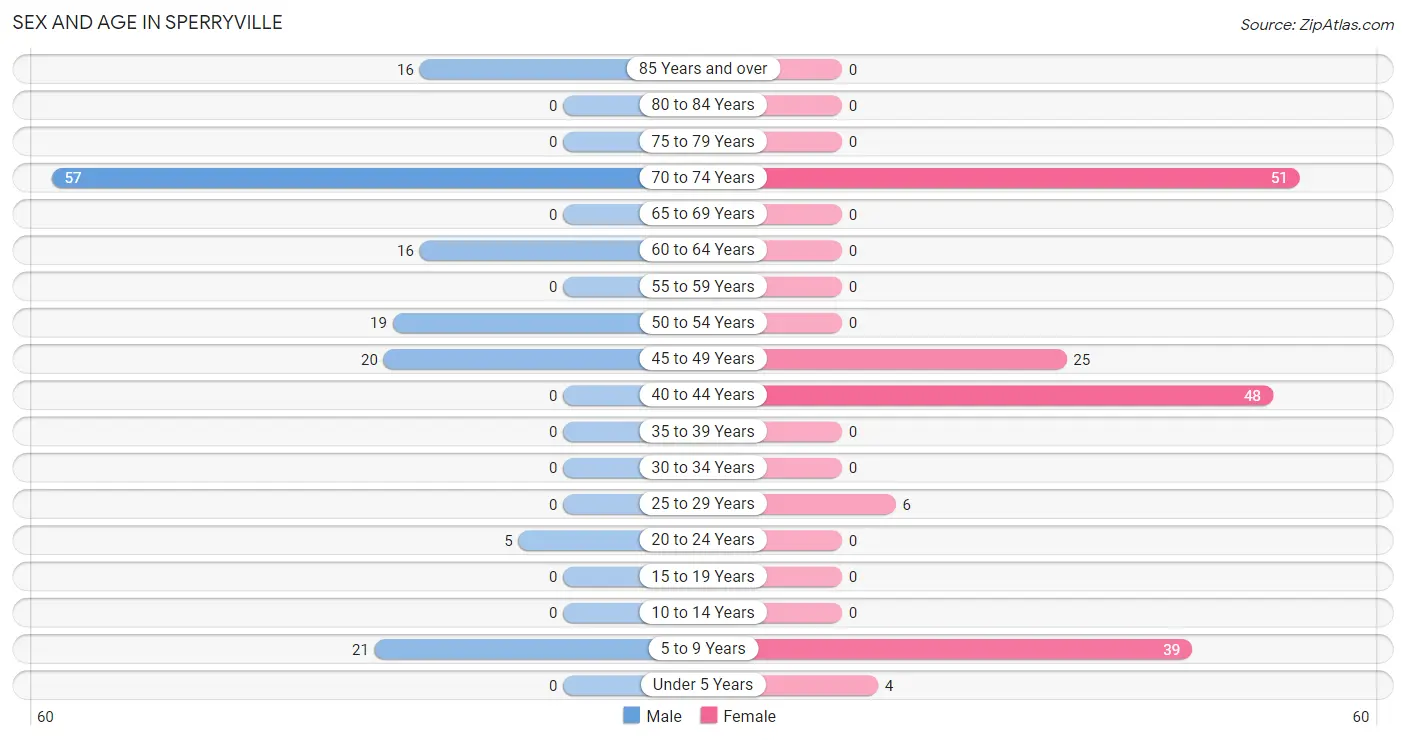
| Age Bracket | Male | Female |
| Under 5 Years | 0 (0.0%) | 4 (2.3%) |
| 5 to 9 Years | 21 (13.6%) | 39 (22.5%) |
| 10 to 14 Years | 0 (0.0%) | 0 (0.0%) |
| 15 to 19 Years | 0 (0.0%) | 0 (0.0%) |
| 20 to 24 Years | 5 (3.3%) | 0 (0.0%) |
| 25 to 29 Years | 0 (0.0%) | 6 (3.5%) |
| 30 to 34 Years | 0 (0.0%) | 0 (0.0%) |
| 35 to 39 Years | 0 (0.0%) | 0 (0.0%) |
| 40 to 44 Years | 0 (0.0%) | 48 (27.8%) |
| 45 to 49 Years | 20 (13.0%) | 25 (14.4%) |
| 50 to 54 Years | 19 (12.3%) | 0 (0.0%) |
| 55 to 59 Years | 0 (0.0%) | 0 (0.0%) |
| 60 to 64 Years | 16 (10.4%) | 0 (0.0%) |
| 65 to 69 Years | 0 (0.0%) | 0 (0.0%) |
| 70 to 74 Years | 57 (37.0%) | 51 (29.5%) |
| 75 to 79 Years | 0 (0.0%) | 0 (0.0%) |
| 80 to 84 Years | 0 (0.0%) | 0 (0.0%) |
| 85 Years and over | 16 (10.4%) | 0 (0.0%) |
| Total | 154 (100.0%) | 173 (100.0%) |
Families and Households in Sperryville
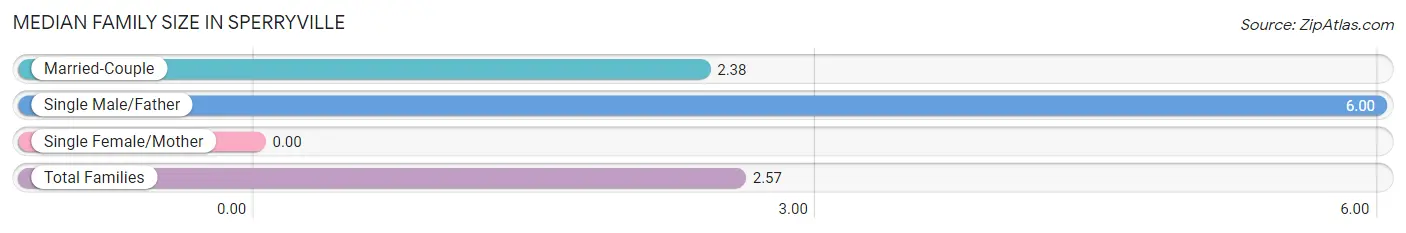
Median Family Size in Sperryville
| Family Type | # Families | Family Size |
| Married-Couple | 91 (94.8%) | 2.38 |
| Single Male/Father | 5 (5.2%) | 6.00 |
| Single Female/Mother | 0 (0.0%) | - |
| Total Families | 96 (100.0%) | 2.57 |
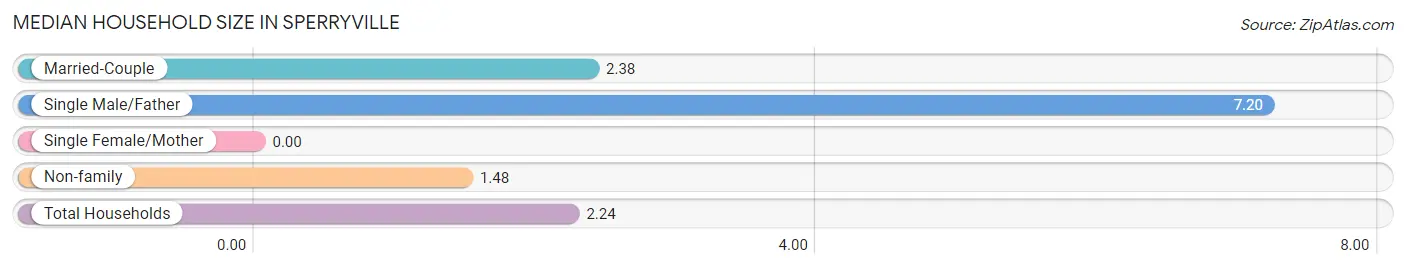
Median Household Size in Sperryville
| Household Type | # Households | Household Size |
| Married-Couple | 91 (62.3%) | 2.38 |
| Single Male/Father | 5 (3.4%) | 7.20 |
| Single Female/Mother | 0 (0.0%) | - |
| Non-family | 50 (34.3%) | 1.48 |
| Total Households | 146 (100.0%) | 2.24 |
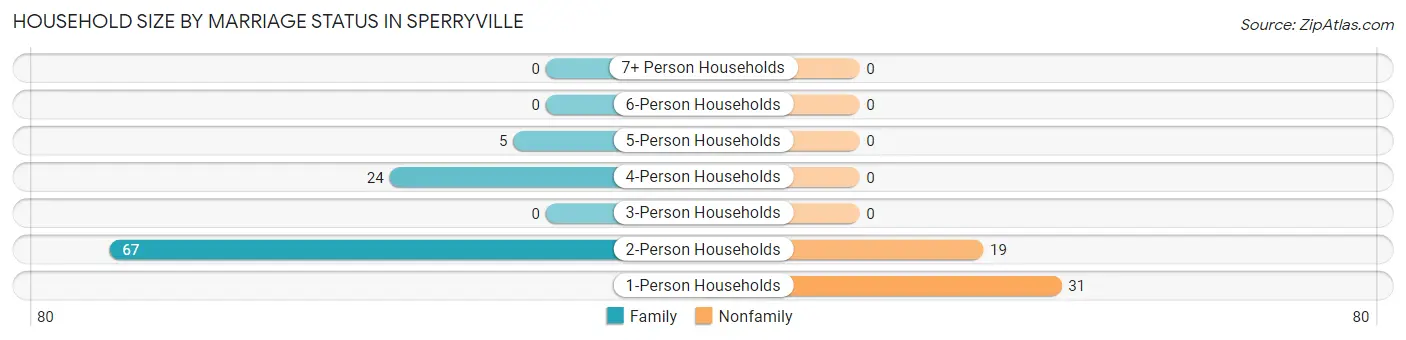
Household Size by Marriage Status in Sperryville
Out of a total of 146 households in Sperryville, 96 (65.7%) are family households, while 50 (34.3%) are nonfamily households. The most numerous type of family households are 2-person households, comprising 67, and the most common type of nonfamily households are 1-person households, comprising 31.
| Household Size | Family Households | Nonfamily Households |
| 1-Person Households | - | 31 (21.2%) |
| 2-Person Households | 67 (45.9%) | 19 (13.0%) |
| 3-Person Households | 0 (0.0%) | 0 (0.0%) |
| 4-Person Households | 24 (16.4%) | 0 (0.0%) |
| 5-Person Households | 5 (3.4%) | 0 (0.0%) |
| 6-Person Households | 0 (0.0%) | 0 (0.0%) |
| 7+ Person Households | 0 (0.0%) | 0 (0.0%) |
| Total | 96 (65.7%) | 50 (34.3%) |
Female Fertility in Sperryville
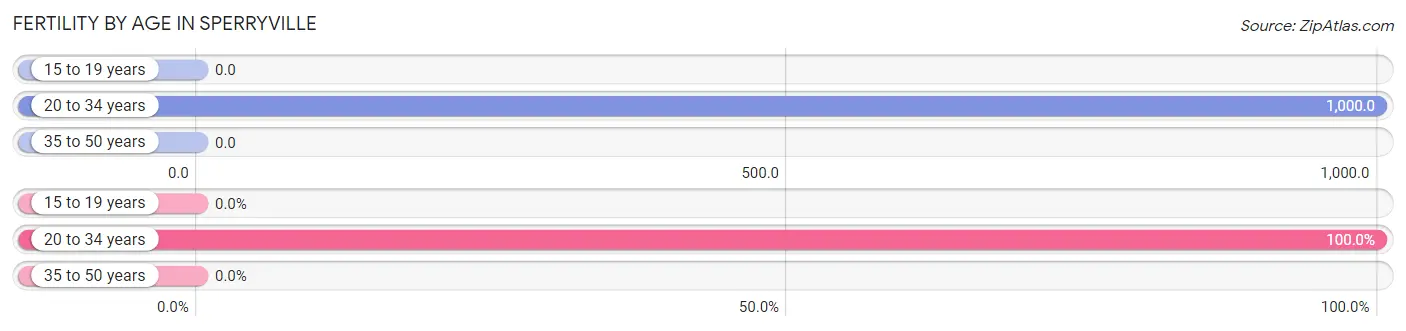
Fertility by Age in Sperryville
Average fertility rate in Sperryville is 76.0 births per 1,000 women. Women in the age bracket of 20 to 34 years have the highest fertility rate with 1,000.0 births per 1,000 women. Women in the age bracket of 20 to 34 years acount for 100.0% of all women with births.
| Age Bracket | Women with Births | Births / 1,000 Women |
| 15 to 19 years | 0 (0.0%) | 0.0 |
| 20 to 34 years | 6 (100.0%) | 1,000.0 |
| 35 to 50 years | 0 (0.0%) | 0.0 |
| Total | 6 (100.0%) | 76.0 |
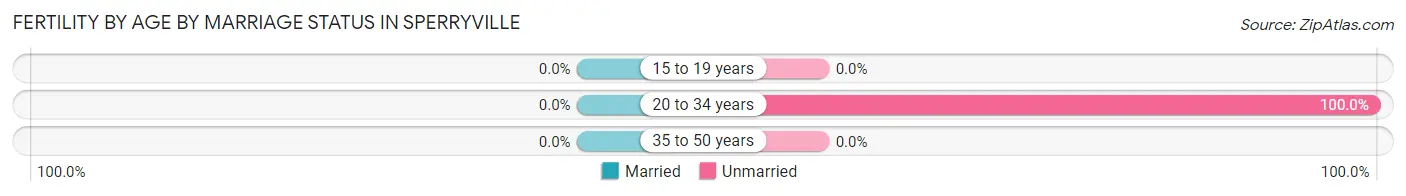
Fertility by Age by Marriage Status in Sperryville
| Age Bracket | Married | Unmarried |
| 15 to 19 years | 0 (0.0%) | 0 (0.0%) |
| 20 to 34 years | 0 (0.0%) | 6 (100.0%) |
| 35 to 50 years | 0 (0.0%) | 0 (0.0%) |
| Total | 0 (0.0%) | 6 (100.0%) |
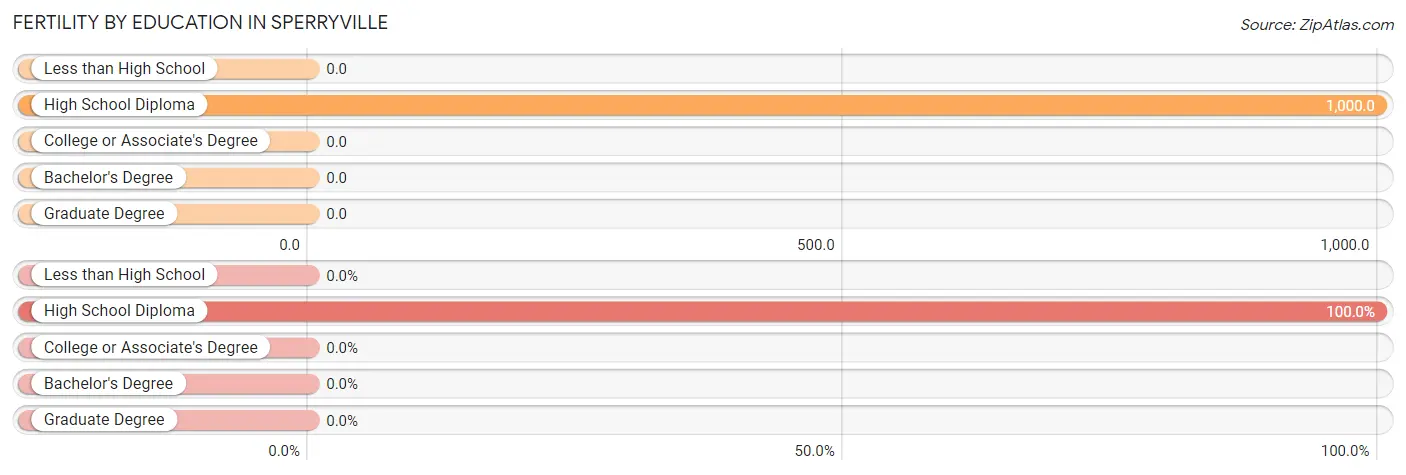
Fertility by Education in Sperryville
| Educational Attainment | Women with Births | Births / 1,000 Women |
| Less than High School | 0 (0.0%) | 0.0 |
| High School Diploma | 6 (100.0%) | 1,000.0 |
| College or Associate's Degree | 0 (0.0%) | 0.0 |
| Bachelor's Degree | 0 (0.0%) | 0.0 |
| Graduate Degree | 0 (0.0%) | 0.0 |
| Total | 6 (100.0%) | 76.0 |
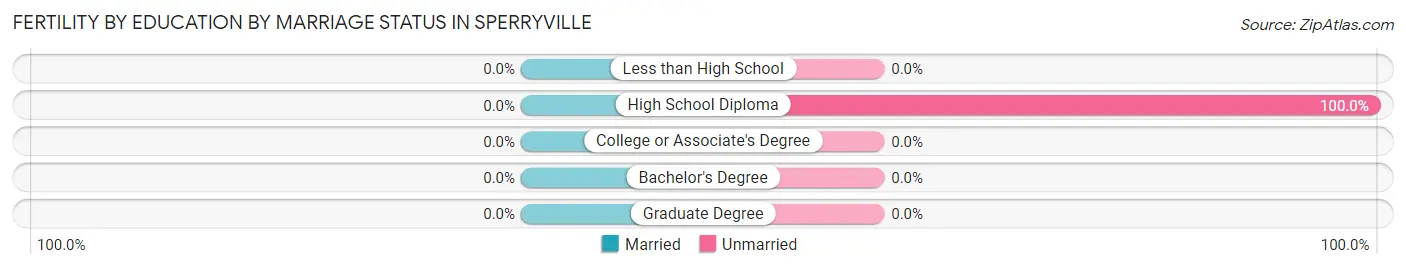
Fertility by Education by Marriage Status in Sperryville
| Educational Attainment | Married | Unmarried |
| Less than High School | 0 (0.0%) | 0 (0.0%) |
| High School Diploma | 0 (0.0%) | 6 (100.0%) |
| College or Associate's Degree | 0 (0.0%) | 0 (0.0%) |
| Bachelor's Degree | 0 (0.0%) | 0 (0.0%) |
| Graduate Degree | 0 (0.0%) | 0 (0.0%) |
| Total | 0 (0.0%) | 6 (100.0%) |
Employment Characteristics in Sperryville
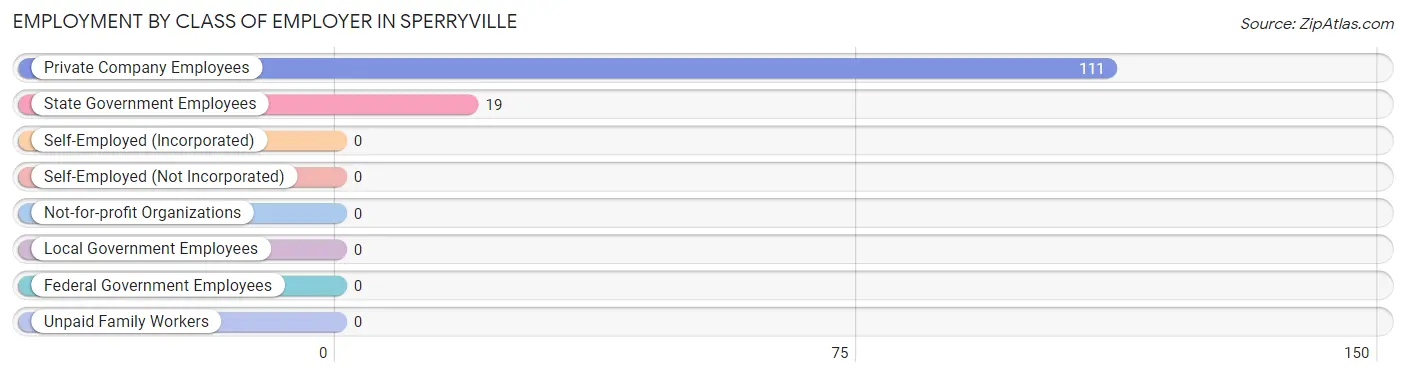
Employment by Class of Employer in Sperryville
Among the 130 employed individuals in Sperryville, private company employees (111 | 85.4%), and state government employees (19 | 14.6%) make up the most common classes of employment.
| Employer Class | # Employees | % Employees |
| Private Company Employees | 111 | 85.4% |
| Self-Employed (Incorporated) | 0 | 0.0% |
| Self-Employed (Not Incorporated) | 0 | 0.0% |
| Not-for-profit Organizations | 0 | 0.0% |
| Local Government Employees | 0 | 0.0% |
| State Government Employees | 19 | 14.6% |
| Federal Government Employees | 0 | 0.0% |
| Unpaid Family Workers | 0 | 0.0% |
| Total | 130 | 100.0% |
Employment Status by Age in Sperryville
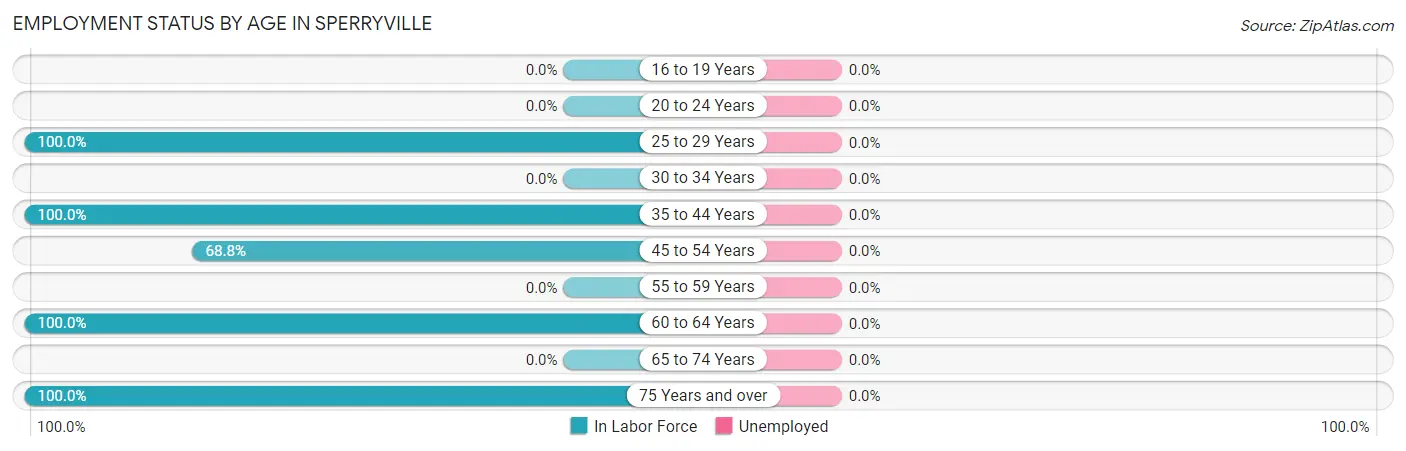
| Age Bracket | In Labor Force | Unemployed |
| 16 to 19 Years | 0 (0.0%) | 0 (0.0%) |
| 20 to 24 Years | 0 (0.0%) | 0 (0.0%) |
| 25 to 29 Years | 6 (100.0%) | 0 (0.0%) |
| 30 to 34 Years | 0 (0.0%) | 0 (0.0%) |
| 35 to 44 Years | 48 (100.0%) | 0 (0.0%) |
| 45 to 54 Years | 44 (68.8%) | 0 (0.0%) |
| 55 to 59 Years | 0 (0.0%) | 0 (0.0%) |
| 60 to 64 Years | 16 (100.0%) | 0 (0.0%) |
| 65 to 74 Years | 0 (0.0%) | 0 (0.0%) |
| 75 Years and over | 16 (100.0%) | 0 (0.0%) |
| Total | 130 (49.4%) | 0 (0.0%) |
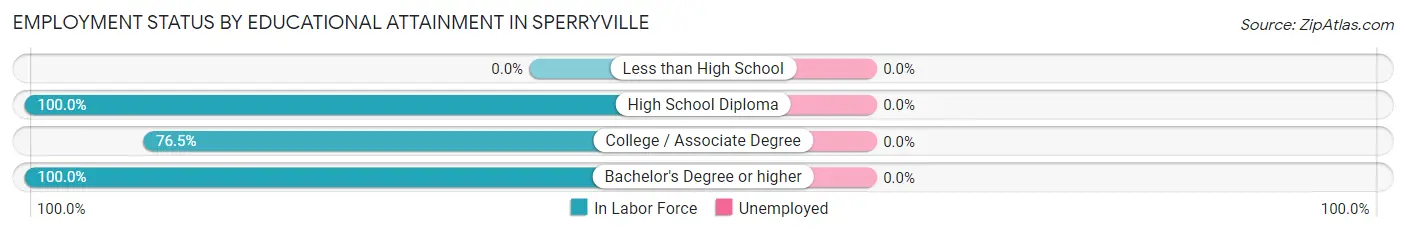
Employment Status by Educational Attainment in Sperryville
| Educational Attainment | In Labor Force | Unemployed |
| Less than High School | 0 (0.0%) | 0 (0.0%) |
| High School Diploma | 25 (100.0%) | 0 (0.0%) |
| College / Associate Degree | 65 (76.5%) | 0 (0.0%) |
| Bachelor's Degree or higher | 24 (100.0%) | 0 (0.0%) |
| Total | 114 (85.1%) | 0 (0.0%) |
Employment Occupations by Sex in Sperryville
Management, Business, Science and Arts Occupations
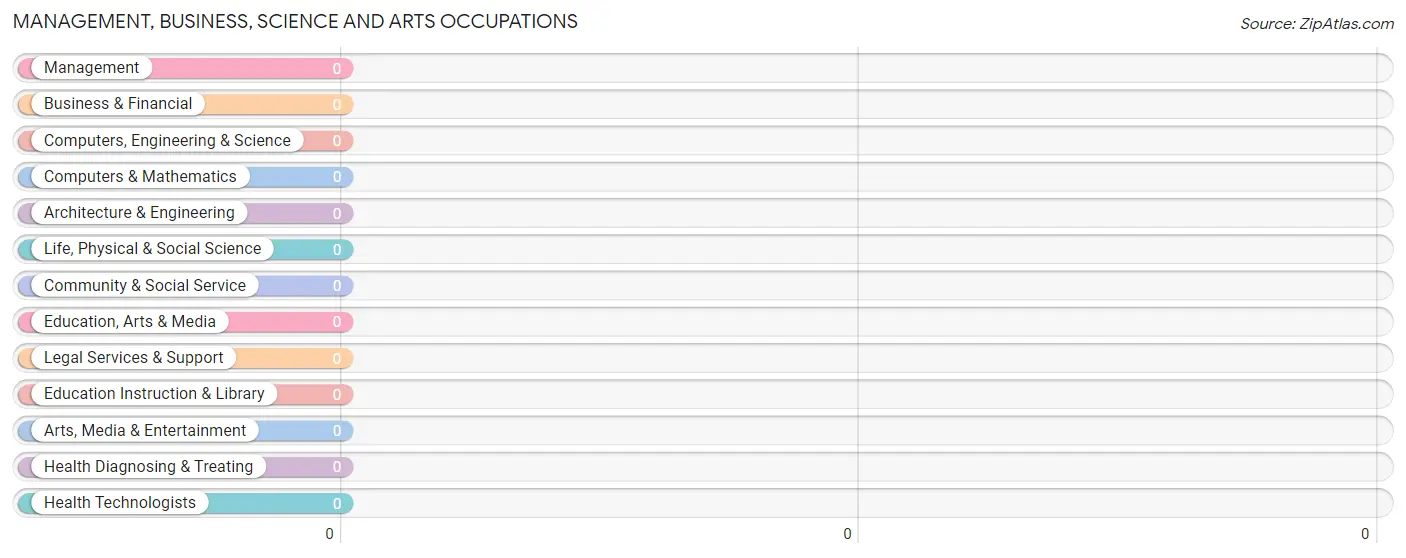
Management, Business, Science and Arts Occupations by Sex
| Occupation | Male | Female |
| Management | 0 (0.0%) | 0 (0.0%) |
| Business & Financial | 0 (0.0%) | 0 (0.0%) |
| Computers, Engineering & Science | 0 (0.0%) | 0 (0.0%) |
| Computers & Mathematics | 0 (0.0%) | 0 (0.0%) |
| Architecture & Engineering | 0 (0.0%) | 0 (0.0%) |
| Life, Physical & Social Science | 0 (0.0%) | 0 (0.0%) |
| Community & Social Service | 0 (0.0%) | 0 (0.0%) |
| Education, Arts & Media | 0 (0.0%) | 0 (0.0%) |
| Legal Services & Support | 0 (0.0%) | 0 (0.0%) |
| Education Instruction & Library | 0 (0.0%) | 0 (0.0%) |
| Arts, Media & Entertainment | 0 (0.0%) | 0 (0.0%) |
| Health Diagnosing & Treating | 0 (0.0%) | 0 (0.0%) |
| Health Technologists | 0 (0.0%) | 0 (0.0%) |
| Total (Category) | 0 (0.0%) | 0 (0.0%) |
| Total (Overall) | 51 (39.2%) | 79 (60.8%) |
Services Occupations
The most common Services occupations in Sperryville are Healthcare Support (24 | 18.5%), and Food Preparation & Serving (24 | 18.5%).
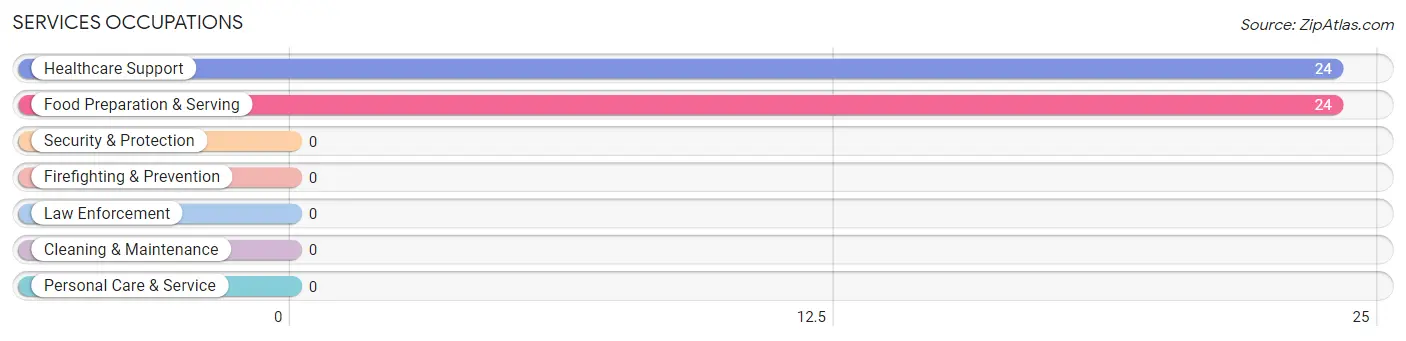
Services Occupations by Sex
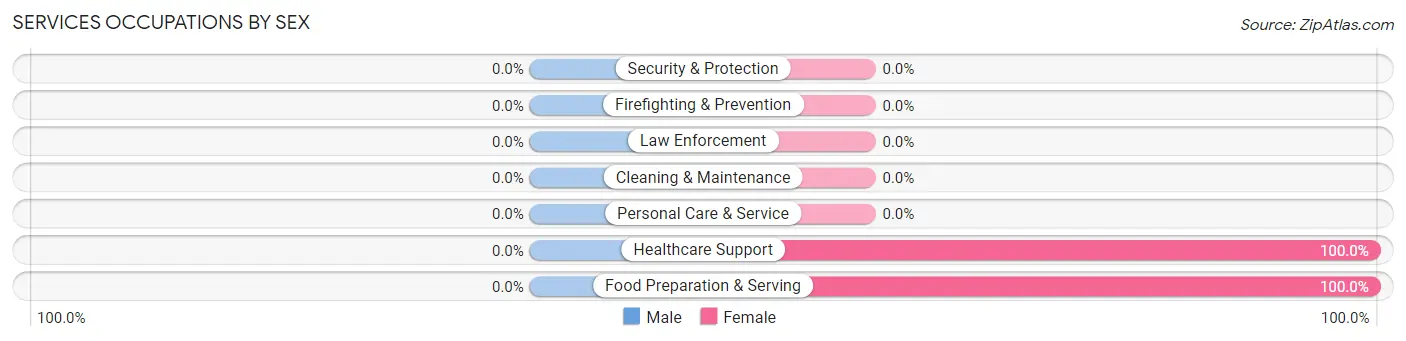
| Occupation | Male | Female |
| Healthcare Support | 0 (0.0%) | 24 (100.0%) |
| Security & Protection | 0 (0.0%) | 0 (0.0%) |
| Firefighting & Prevention | 0 (0.0%) | 0 (0.0%) |
| Law Enforcement | 0 (0.0%) | 0 (0.0%) |
| Food Preparation & Serving | 0 (0.0%) | 24 (100.0%) |
| Cleaning & Maintenance | 0 (0.0%) | 0 (0.0%) |
| Personal Care & Service | 0 (0.0%) | 0 (0.0%) |
| Total (Category) | 0 (0.0%) | 48 (100.0%) |
| Total (Overall) | 51 (39.2%) | 79 (60.8%) |
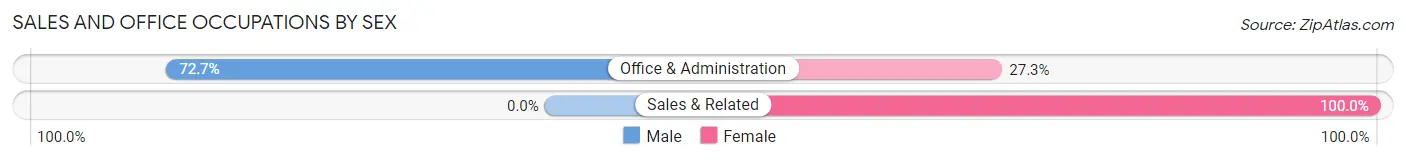
Sales and Office Occupations
The most common Sales and Office occupations in Sperryville are Sales & Related (25 | 19.2%), and Office & Administration (22 | 16.9%).
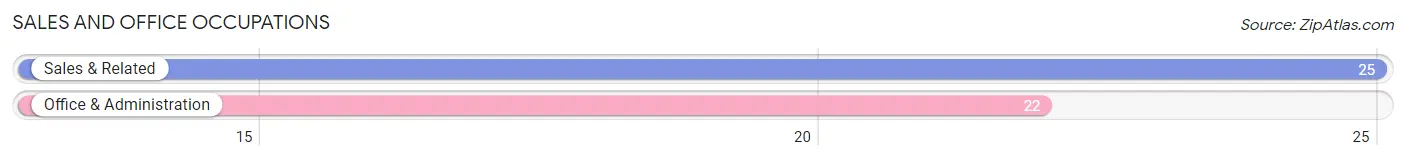
Sales and Office Occupations by Sex
| Occupation | Male | Female |
| Sales & Related | 0 (0.0%) | 25 (100.0%) |
| Office & Administration | 16 (72.7%) | 6 (27.3%) |
| Total (Category) | 16 (34.0%) | 31 (66.0%) |
| Total (Overall) | 51 (39.2%) | 79 (60.8%) |
Natural Resources, Construction and Maintenance Occupations
The most common Natural Resources, Construction and Maintenance occupations in Sperryville are , and Construction & Extraction (35 | 26.9%).
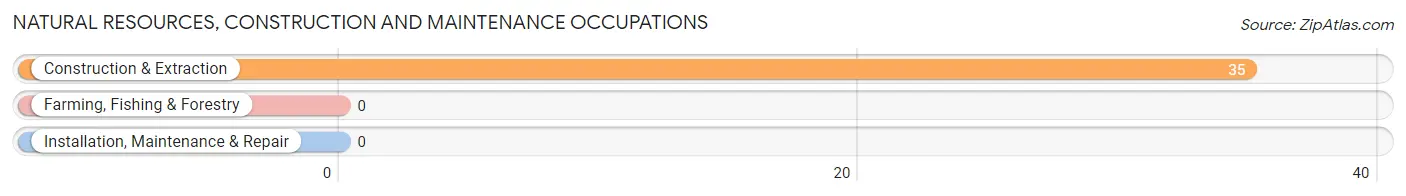
Natural Resources, Construction and Maintenance Occupations by Sex
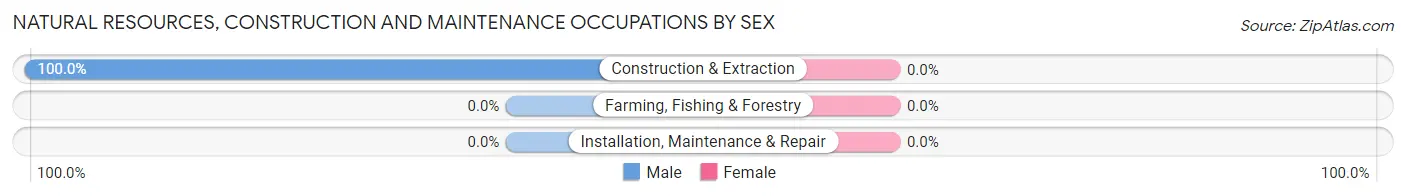
| Occupation | Male | Female |
| Farming, Fishing & Forestry | 0 (0.0%) | 0 (0.0%) |
| Construction & Extraction | 35 (100.0%) | 0 (0.0%) |
| Installation, Maintenance & Repair | 0 (0.0%) | 0 (0.0%) |
| Total (Category) | 35 (100.0%) | 0 (0.0%) |
| Total (Overall) | 51 (39.2%) | 79 (60.8%) |
Production, Transportation and Moving Occupations
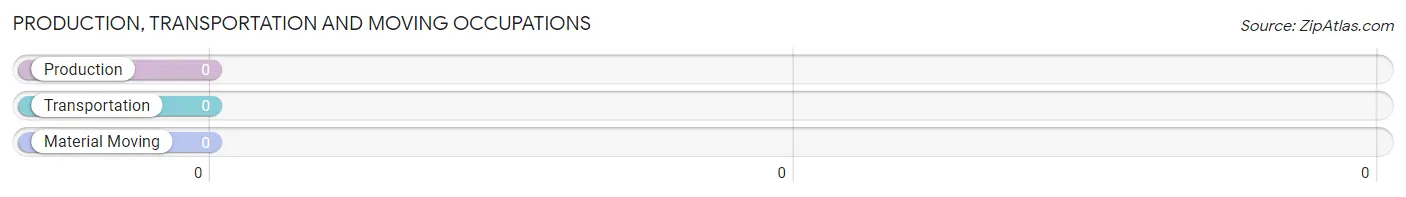
Production, Transportation and Moving Occupations by Sex
| Occupation | Male | Female |
| Production | 0 (0.0%) | 0 (0.0%) |
| Transportation | 0 (0.0%) | 0 (0.0%) |
| Material Moving | 0 (0.0%) | 0 (0.0%) |
| Total (Category) | 0 (0.0%) | 0 (0.0%) |
| Total (Overall) | 51 (39.2%) | 79 (60.8%) |
Employment Industries by Sex in Sperryville
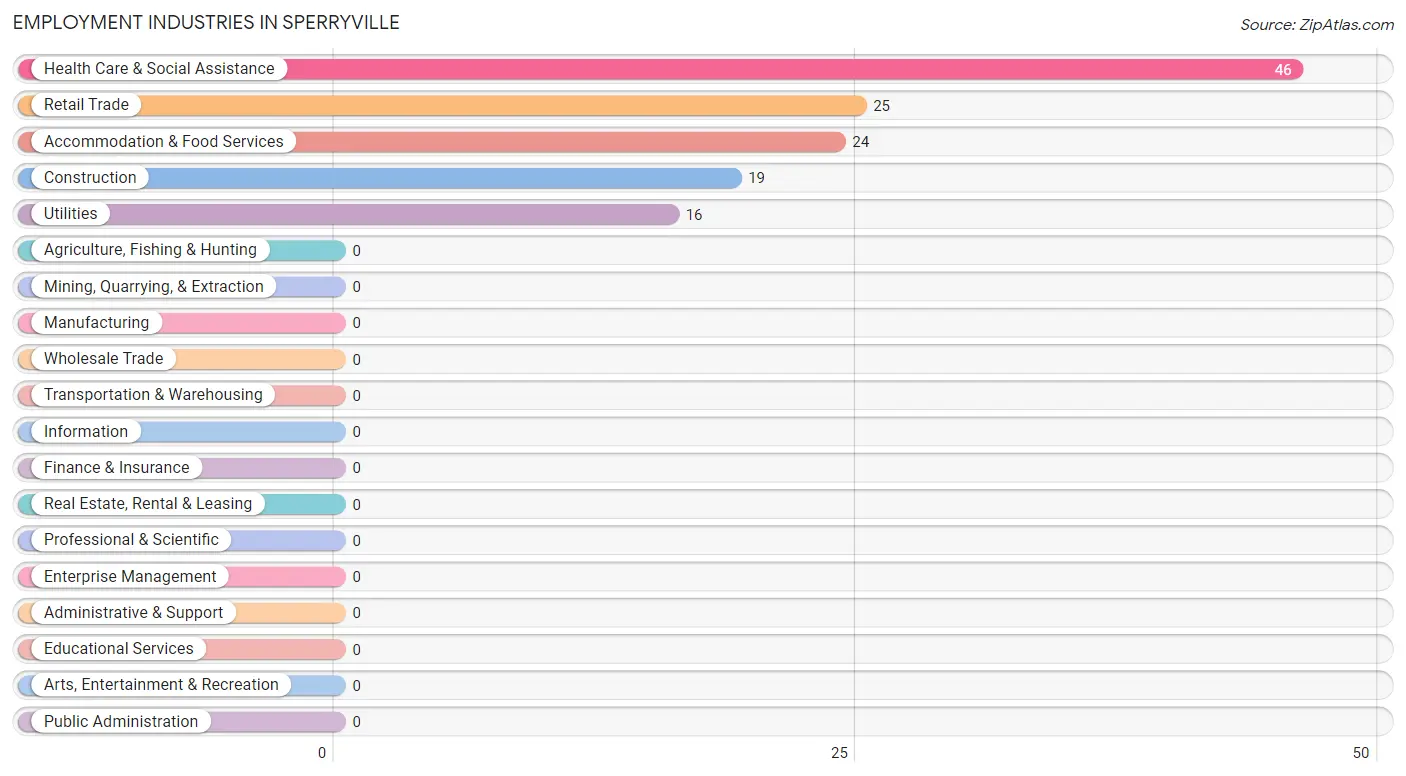
Employment Industries in Sperryville
The major employment industries in Sperryville include Health Care & Social Assistance (46 | 35.4%), Retail Trade (25 | 19.2%), Accommodation & Food Services (24 | 18.5%), Construction (19 | 14.6%), and Utilities (16 | 12.3%).
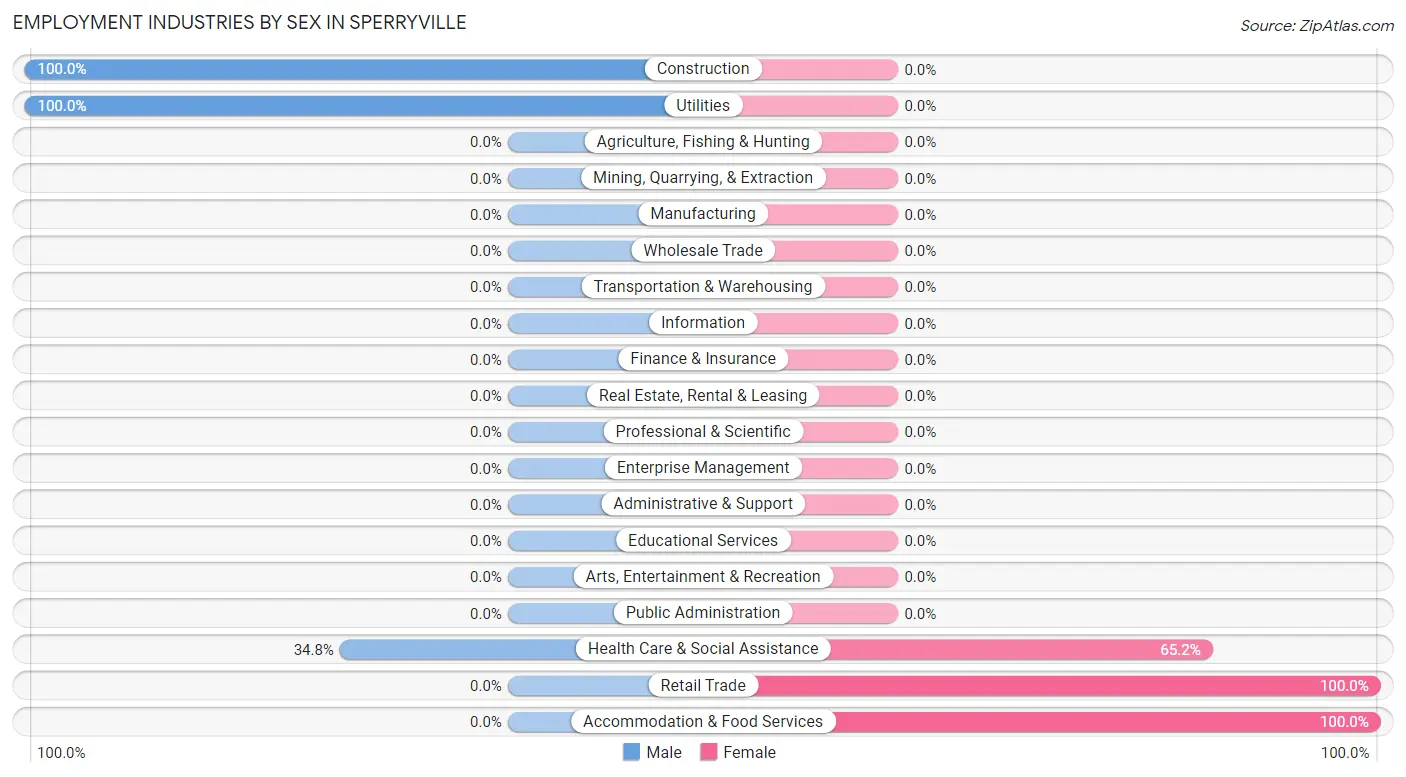
Employment Industries by Sex in Sperryville
The Sperryville industries that see more men than women are Construction (100.0%), Utilities (100.0%), and Health Care & Social Assistance (34.8%), whereas the industries that tend to have a higher number of women are Retail Trade (100.0%), Accommodation & Food Services (100.0%), and Health Care & Social Assistance (65.2%).
| Industry | Male | Female |
| Agriculture, Fishing & Hunting | 0 (0.0%) | 0 (0.0%) |
| Mining, Quarrying, & Extraction | 0 (0.0%) | 0 (0.0%) |
| Construction | 19 (100.0%) | 0 (0.0%) |
| Manufacturing | 0 (0.0%) | 0 (0.0%) |
| Wholesale Trade | 0 (0.0%) | 0 (0.0%) |
| Retail Trade | 0 (0.0%) | 25 (100.0%) |
| Transportation & Warehousing | 0 (0.0%) | 0 (0.0%) |
| Utilities | 16 (100.0%) | 0 (0.0%) |
| Information | 0 (0.0%) | 0 (0.0%) |
| Finance & Insurance | 0 (0.0%) | 0 (0.0%) |
| Real Estate, Rental & Leasing | 0 (0.0%) | 0 (0.0%) |
| Professional & Scientific | 0 (0.0%) | 0 (0.0%) |
| Enterprise Management | 0 (0.0%) | 0 (0.0%) |
| Administrative & Support | 0 (0.0%) | 0 (0.0%) |
| Educational Services | 0 (0.0%) | 0 (0.0%) |
| Health Care & Social Assistance | 16 (34.8%) | 30 (65.2%) |
| Arts, Entertainment & Recreation | 0 (0.0%) | 0 (0.0%) |
| Accommodation & Food Services | 0 (0.0%) | 24 (100.0%) |
| Public Administration | 0 (0.0%) | 0 (0.0%) |
| Total | 51 (39.2%) | 79 (60.8%) |
Education in Sperryville
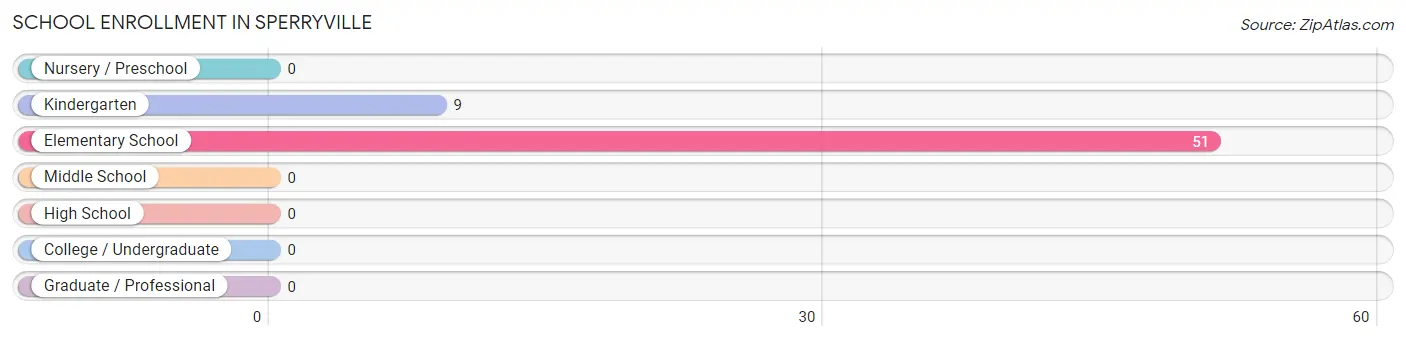
School Enrollment in Sperryville
The most common levels of schooling among the 60 students in Sperryville are elementary school (51 | 85.0%), and kindergarten (9 | 15.0%).
| School Level | # Students | % Students |
| Nursery / Preschool | 0 | 0.0% |
| Kindergarten | 9 | 15.0% |
| Elementary School | 51 | 85.0% |
| Middle School | 0 | 0.0% |
| High School | 0 | 0.0% |
| College / Undergraduate | 0 | 0.0% |
| Graduate / Professional | 0 | 0.0% |
| Total | 60 | 100.0% |
School Enrollment by Age by Funding Source in Sperryville
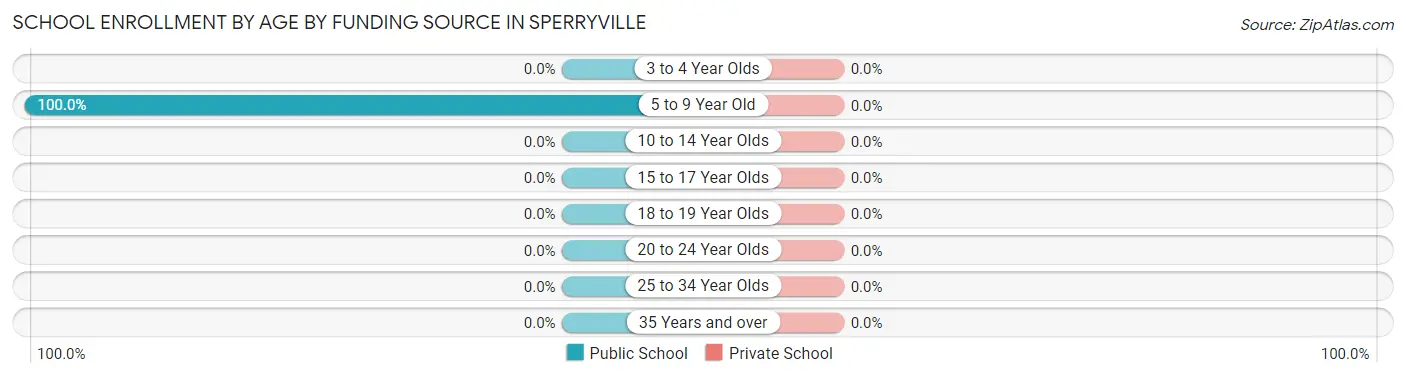
| Age Bracket | Public School | Private School |
| 3 to 4 Year Olds | 0 (0.0%) | 0 (0.0%) |
| 5 to 9 Year Old | 60 (100.0%) | 0 (0.0%) |
| 10 to 14 Year Olds | 0 (0.0%) | 0 (0.0%) |
| 15 to 17 Year Olds | 0 (0.0%) | 0 (0.0%) |
| 18 to 19 Year Olds | 0 (0.0%) | 0 (0.0%) |
| 20 to 24 Year Olds | 0 (0.0%) | 0 (0.0%) |
| 25 to 34 Year Olds | 0 (0.0%) | 0 (0.0%) |
| 35 Years and over | 0 (0.0%) | 0 (0.0%) |
| Total | 60 (100.0%) | 0 (0.0%) |
Educational Attainment by Field of Study in Sperryville
Social sciences (51 | 60.7%), communications (24 | 28.6%), and psychology (9 | 10.7%) are the most common fields of study among 84 individuals in Sperryville who have obtained a bachelor's degree or higher.
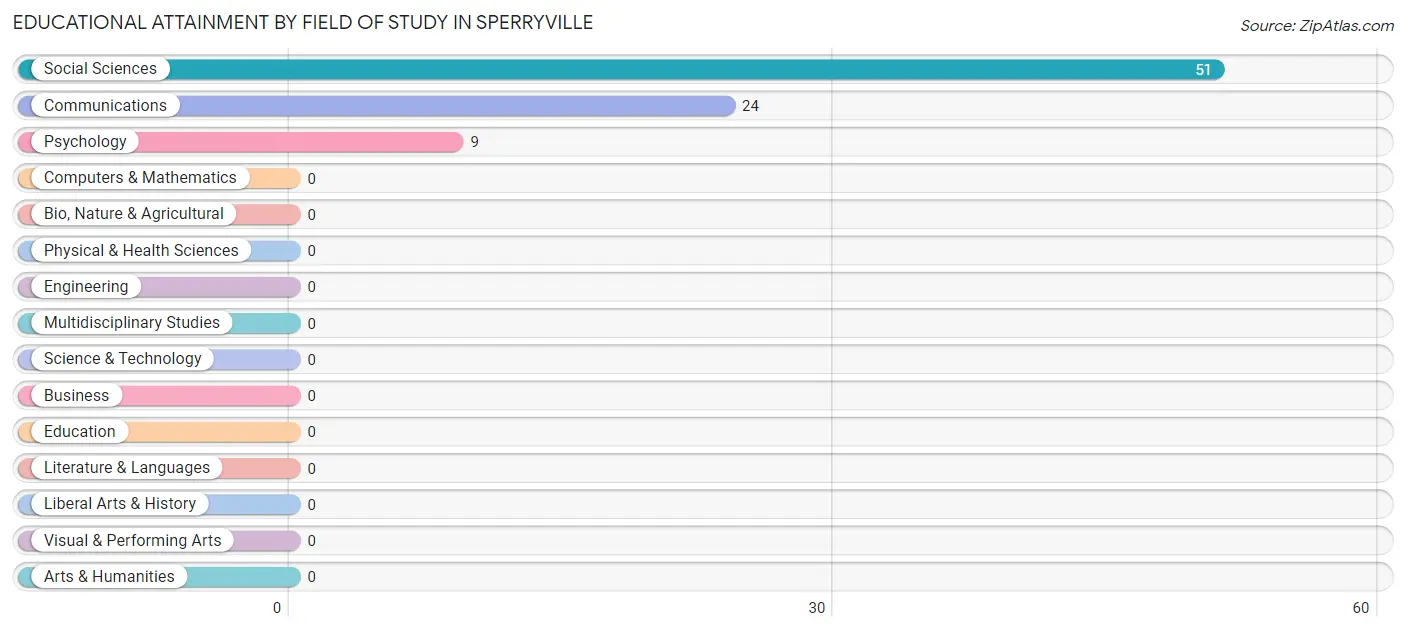
| Field of Study | # Graduates | % Graduates |
| Computers & Mathematics | 0 | 0.0% |
| Bio, Nature & Agricultural | 0 | 0.0% |
| Physical & Health Sciences | 0 | 0.0% |
| Psychology | 9 | 10.7% |
| Social Sciences | 51 | 60.7% |
| Engineering | 0 | 0.0% |
| Multidisciplinary Studies | 0 | 0.0% |
| Science & Technology | 0 | 0.0% |
| Business | 0 | 0.0% |
| Education | 0 | 0.0% |
| Literature & Languages | 0 | 0.0% |
| Liberal Arts & History | 0 | 0.0% |
| Visual & Performing Arts | 0 | 0.0% |
| Communications | 24 | 28.6% |
| Arts & Humanities | 0 | 0.0% |
| Total | 84 | 100.0% |
Transportation & Commute in Sperryville
Vehicle Availability by Sex in Sperryville
The most prevalent vehicle ownership categories in Sperryville are males with 1 vehicle (32, accounting for 62.7%) and females with 1 vehicle (49, making up 40.5%).
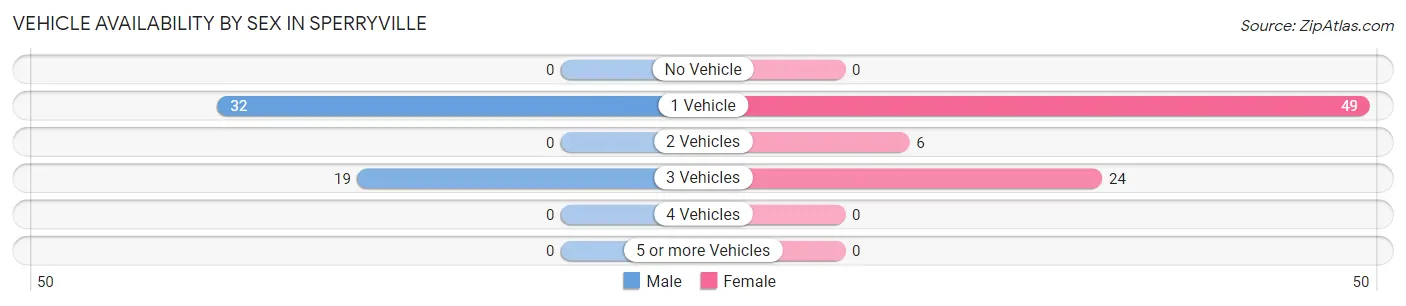
| Vehicles Available | Male | Female |
| No Vehicle | 0 (0.0%) | 0 (0.0%) |
| 1 Vehicle | 32 (62.7%) | 49 (62.0%) |
| 2 Vehicles | 0 (0.0%) | 6 (7.6%) |
| 3 Vehicles | 19 (37.2%) | 24 (30.4%) |
| 4 Vehicles | 0 (0.0%) | 0 (0.0%) |
| 5 or more Vehicles | 0 (0.0%) | 0 (0.0%) |
| Total | 51 (100.0%) | 79 (100.0%) |
Commute Time in Sperryville
The most frequently occuring commute durations in Sperryville are 45 to 59 minutes (43 commuters, 33.1%), 30 to 34 minutes (30 commuters, 23.1%), and 10 to 14 minutes (25 commuters, 19.2%).
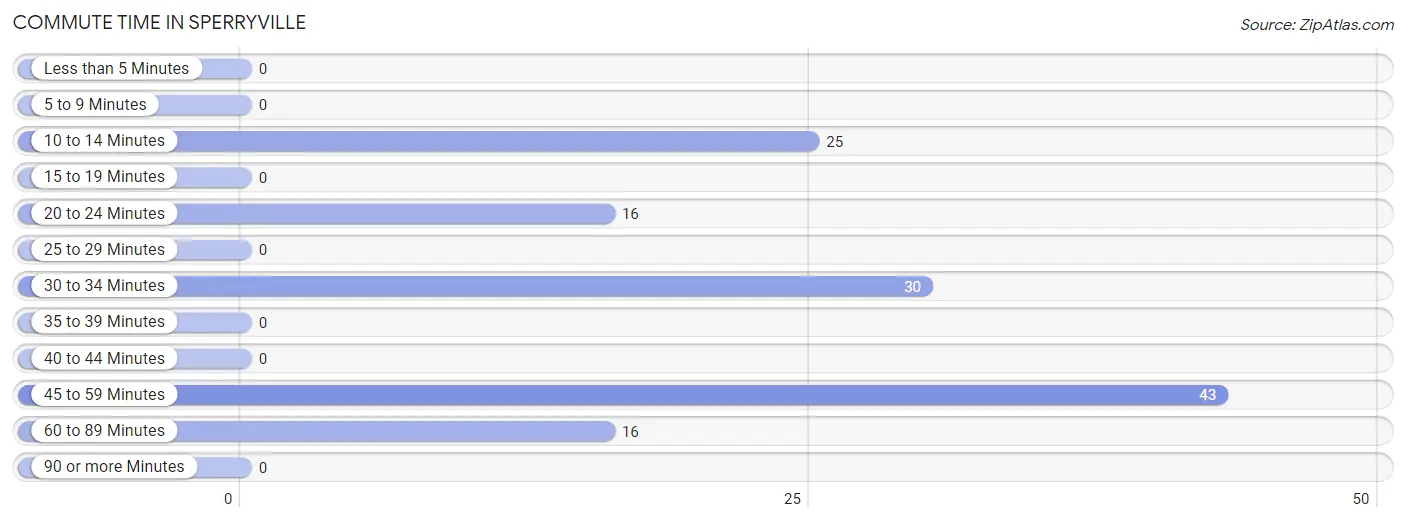
| Commute Time | # Commuters | % Commuters |
| Less than 5 Minutes | 0 | 0.0% |
| 5 to 9 Minutes | 0 | 0.0% |
| 10 to 14 Minutes | 25 | 19.2% |
| 15 to 19 Minutes | 0 | 0.0% |
| 20 to 24 Minutes | 16 | 12.3% |
| 25 to 29 Minutes | 0 | 0.0% |
| 30 to 34 Minutes | 30 | 23.1% |
| 35 to 39 Minutes | 0 | 0.0% |
| 40 to 44 Minutes | 0 | 0.0% |
| 45 to 59 Minutes | 43 | 33.1% |
| 60 to 89 Minutes | 16 | 12.3% |
| 90 or more Minutes | 0 | 0.0% |
Commute Time by Sex in Sperryville
The most common commute times in Sperryville are 45 to 59 minutes (19 commuters, 37.2%) for males and 30 to 34 minutes (30 commuters, 38.0%) for females.
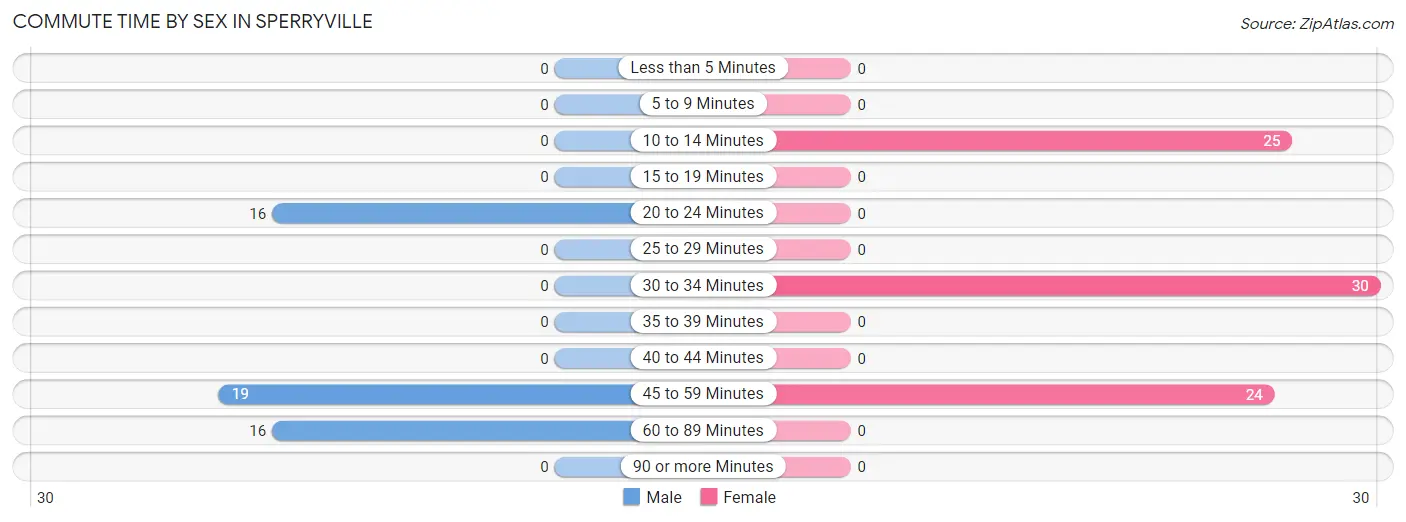
| Commute Time | Male | Female |
| Less than 5 Minutes | 0 (0.0%) | 0 (0.0%) |
| 5 to 9 Minutes | 0 (0.0%) | 0 (0.0%) |
| 10 to 14 Minutes | 0 (0.0%) | 25 (31.7%) |
| 15 to 19 Minutes | 0 (0.0%) | 0 (0.0%) |
| 20 to 24 Minutes | 16 (31.4%) | 0 (0.0%) |
| 25 to 29 Minutes | 0 (0.0%) | 0 (0.0%) |
| 30 to 34 Minutes | 0 (0.0%) | 30 (38.0%) |
| 35 to 39 Minutes | 0 (0.0%) | 0 (0.0%) |
| 40 to 44 Minutes | 0 (0.0%) | 0 (0.0%) |
| 45 to 59 Minutes | 19 (37.2%) | 24 (30.4%) |
| 60 to 89 Minutes | 16 (31.4%) | 0 (0.0%) |
| 90 or more Minutes | 0 (0.0%) | 0 (0.0%) |
Time of Departure to Work by Sex in Sperryville
The most frequent times of departure to work in Sperryville are 6:00 AM to 6:29 AM (19, 37.2%) for males and 8:00 AM to 8:29 AM (31, 39.2%) for females.
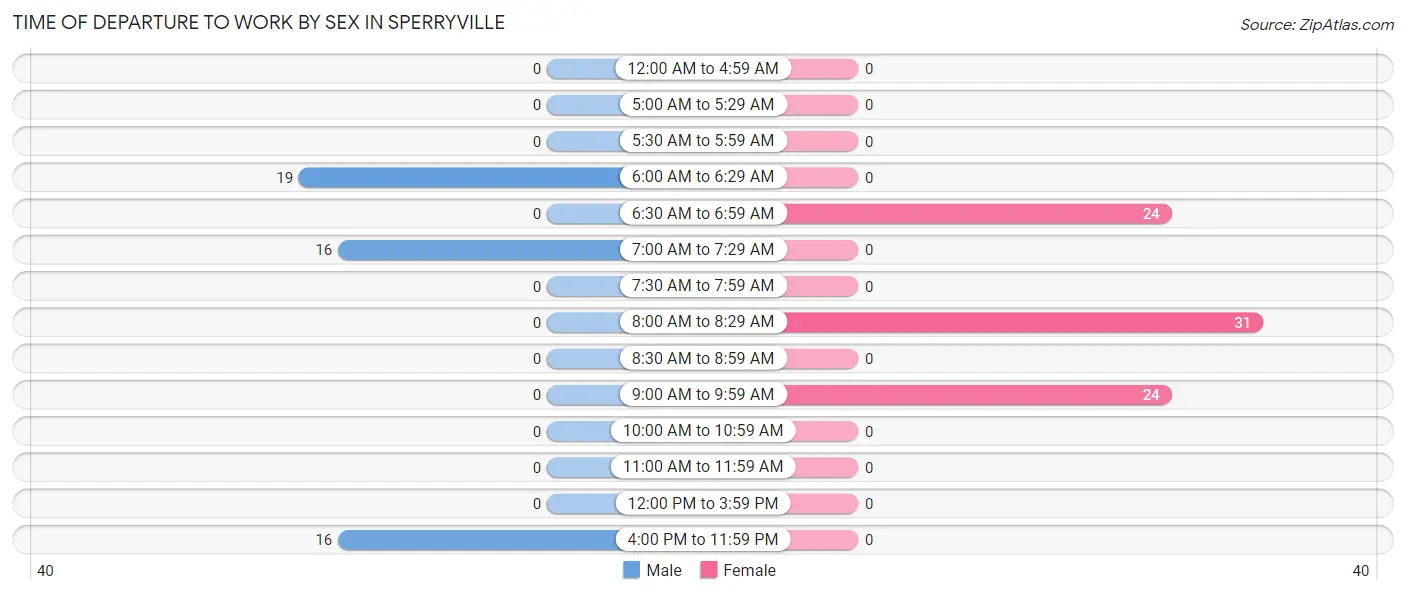
| Time of Departure | Male | Female |
| 12:00 AM to 4:59 AM | 0 (0.0%) | 0 (0.0%) |
| 5:00 AM to 5:29 AM | 0 (0.0%) | 0 (0.0%) |
| 5:30 AM to 5:59 AM | 0 (0.0%) | 0 (0.0%) |
| 6:00 AM to 6:29 AM | 19 (37.2%) | 0 (0.0%) |
| 6:30 AM to 6:59 AM | 0 (0.0%) | 24 (30.4%) |
| 7:00 AM to 7:29 AM | 16 (31.4%) | 0 (0.0%) |
| 7:30 AM to 7:59 AM | 0 (0.0%) | 0 (0.0%) |
| 8:00 AM to 8:29 AM | 0 (0.0%) | 31 (39.2%) |
| 8:30 AM to 8:59 AM | 0 (0.0%) | 0 (0.0%) |
| 9:00 AM to 9:59 AM | 0 (0.0%) | 24 (30.4%) |
| 10:00 AM to 10:59 AM | 0 (0.0%) | 0 (0.0%) |
| 11:00 AM to 11:59 AM | 0 (0.0%) | 0 (0.0%) |
| 12:00 PM to 3:59 PM | 0 (0.0%) | 0 (0.0%) |
| 4:00 PM to 11:59 PM | 16 (31.4%) | 0 (0.0%) |
| Total | 51 (100.0%) | 79 (100.0%) |
Housing Occupancy in Sperryville
Occupancy by Ownership in Sperryville
Of the total 146 dwellings in Sperryville, owner-occupied units account for 101 (69.2%), while renter-occupied units make up 45 (30.8%).
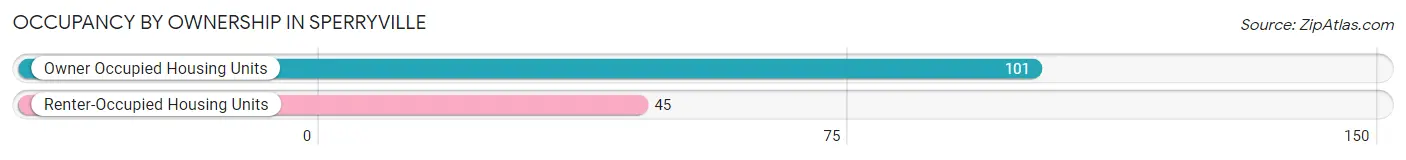
| Occupancy | # Housing Units | % Housing Units |
| Owner Occupied Housing Units | 101 | 69.2% |
| Renter-Occupied Housing Units | 45 | 30.8% |
| Total Occupied Housing Units | 146 | 100.0% |
Occupancy by Household Size in Sperryville
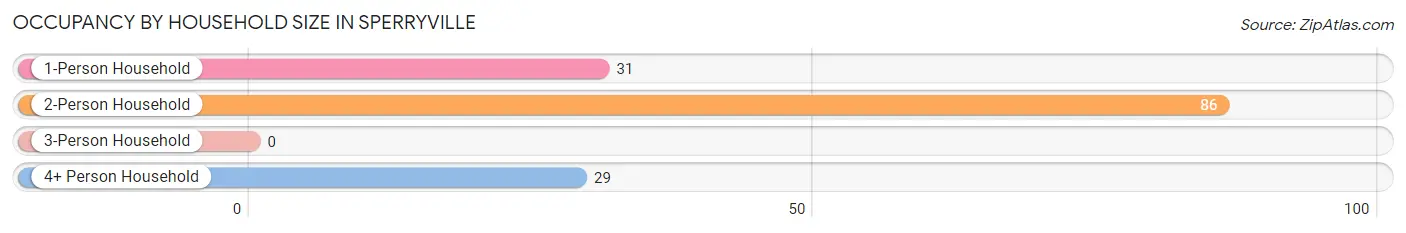
| Household Size | # Housing Units | % Housing Units |
| 1-Person Household | 31 | 21.2% |
| 2-Person Household | 86 | 58.9% |
| 3-Person Household | 0 | 0.0% |
| 4+ Person Household | 29 | 19.9% |
| Total Housing Units | 146 | 100.0% |
Occupancy by Ownership by Household Size in Sperryville
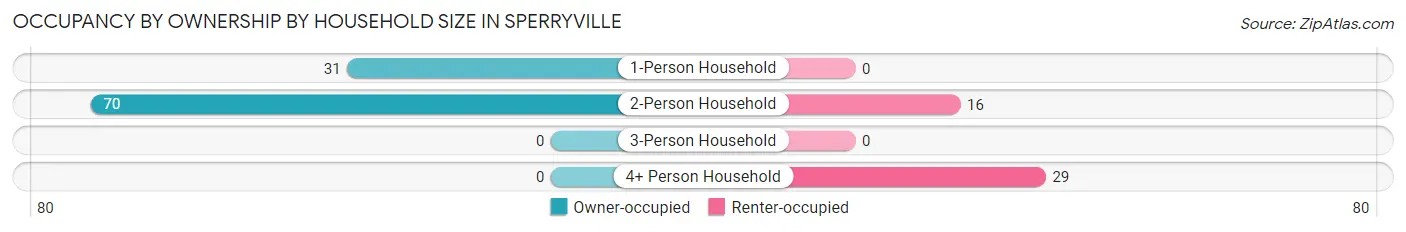
| Household Size | Owner-occupied | Renter-occupied |
| 1-Person Household | 31 (100.0%) | 0 (0.0%) |
| 2-Person Household | 70 (81.4%) | 16 (18.6%) |
| 3-Person Household | 0 (0.0%) | 0 (0.0%) |
| 4+ Person Household | 0 (0.0%) | 29 (100.0%) |
| Total Housing Units | 101 (69.2%) | 45 (30.8%) |
Occupancy by Educational Attainment in Sperryville
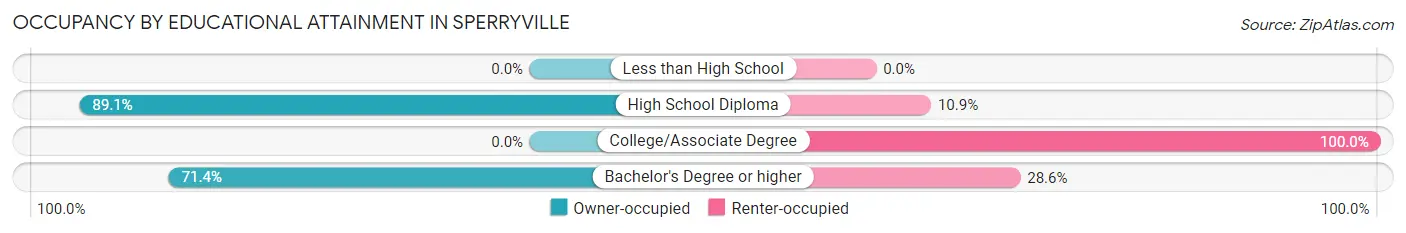
| Household Size | Owner-occupied | Renter-occupied |
| Less than High School | 0 (0.0%) | 0 (0.0%) |
| High School Diploma | 41 (89.1%) | 5 (10.9%) |
| College/Associate Degree | 0 (0.0%) | 16 (100.0%) |
| Bachelor's Degree or higher | 60 (71.4%) | 24 (28.6%) |
Occupancy by Age of Householder in Sperryville
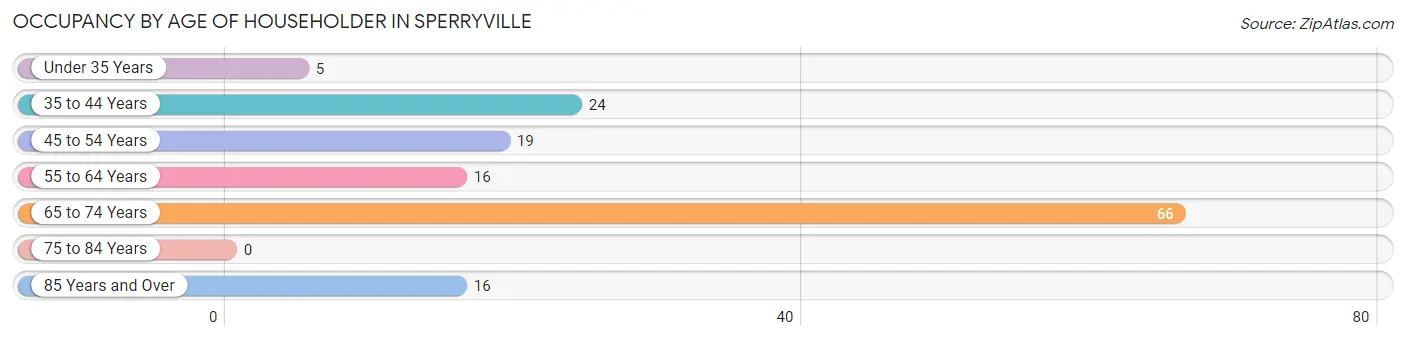
| Age Bracket | # Households | % Households |
| Under 35 Years | 5 | 3.4% |
| 35 to 44 Years | 24 | 16.4% |
| 45 to 54 Years | 19 | 13.0% |
| 55 to 64 Years | 16 | 11.0% |
| 65 to 74 Years | 66 | 45.2% |
| 75 to 84 Years | 0 | 0.0% |
| 85 Years and Over | 16 | 11.0% |
| Total | 146 | 100.0% |
Housing Finances in Sperryville
Median Income by Occupancy in Sperryville
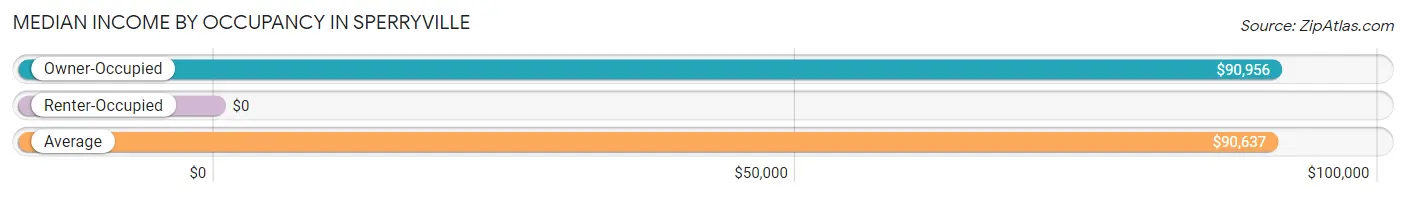
| Occupancy Type | # Households | Median Income |
| Owner-Occupied | 101 (69.2%) | $90,956 |
| Renter-Occupied | 45 (30.8%) | $0 |
| Average | 146 (100.0%) | $90,637 |
Occupancy by Householder Income Bracket in Sperryville
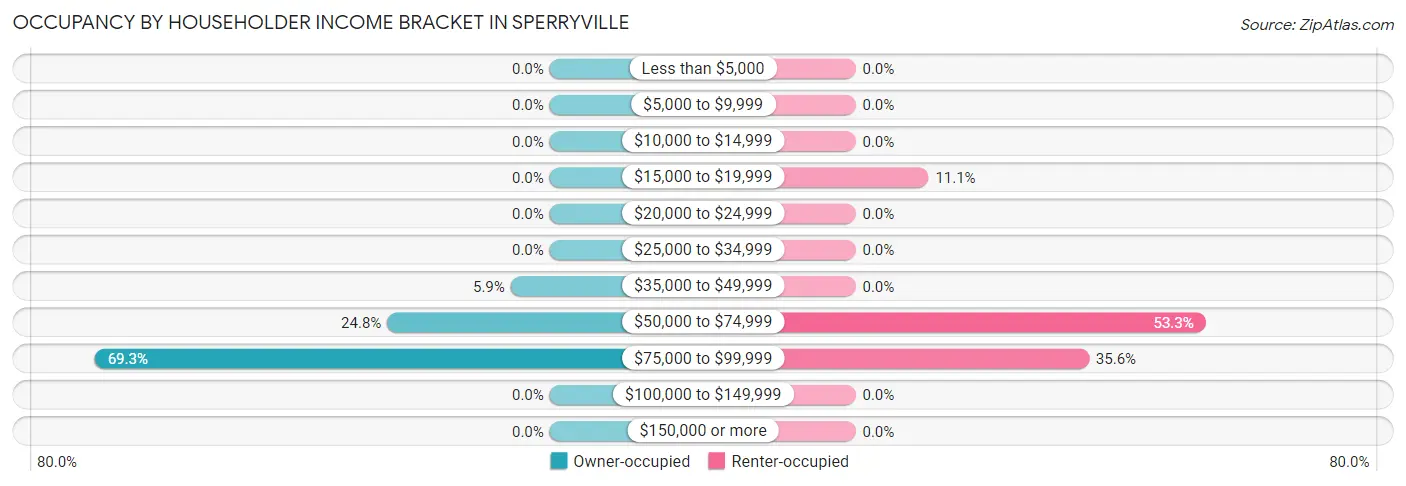
| Income Bracket | Owner-occupied | Renter-occupied |
| Less than $5,000 | 0 (0.0%) | 0 (0.0%) |
| $5,000 to $9,999 | 0 (0.0%) | 0 (0.0%) |
| $10,000 to $14,999 | 0 (0.0%) | 0 (0.0%) |
| $15,000 to $19,999 | 0 (0.0%) | 5 (11.1%) |
| $20,000 to $24,999 | 0 (0.0%) | 0 (0.0%) |
| $25,000 to $34,999 | 0 (0.0%) | 0 (0.0%) |
| $35,000 to $49,999 | 6 (5.9%) | 0 (0.0%) |
| $50,000 to $74,999 | 25 (24.7%) | 24 (53.3%) |
| $75,000 to $99,999 | 70 (69.3%) | 16 (35.6%) |
| $100,000 to $149,999 | 0 (0.0%) | 0 (0.0%) |
| $150,000 or more | 0 (0.0%) | 0 (0.0%) |
| Total | 101 (100.0%) | 45 (100.0%) |
Monthly Housing Cost Tiers in Sperryville
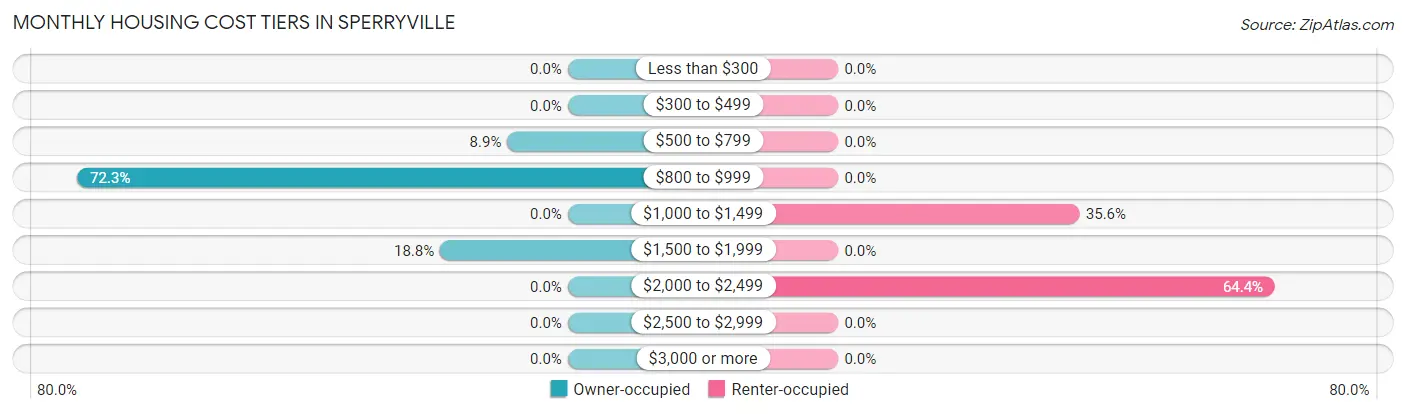
| Monthly Cost | Owner-occupied | Renter-occupied |
| Less than $300 | 0 (0.0%) | 0 (0.0%) |
| $300 to $499 | 0 (0.0%) | 0 (0.0%) |
| $500 to $799 | 9 (8.9%) | 0 (0.0%) |
| $800 to $999 | 73 (72.3%) | 0 (0.0%) |
| $1,000 to $1,499 | 0 (0.0%) | 16 (35.6%) |
| $1,500 to $1,999 | 19 (18.8%) | 0 (0.0%) |
| $2,000 to $2,499 | 0 (0.0%) | 29 (64.4%) |
| $2,500 to $2,999 | 0 (0.0%) | 0 (0.0%) |
| $3,000 or more | 0 (0.0%) | 0 (0.0%) |
| Total | 101 (100.0%) | 45 (100.0%) |
Physical Housing Characteristics in Sperryville
Housing Structures in Sperryville
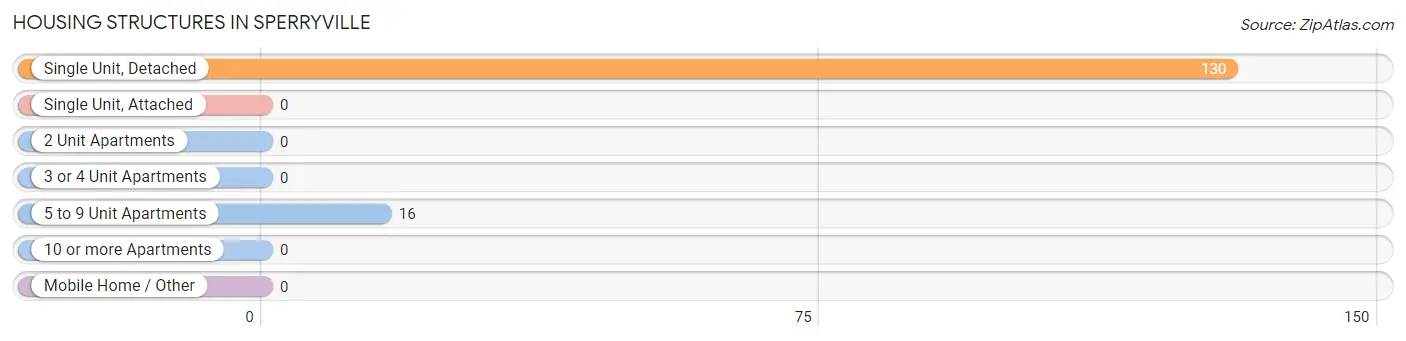
| Structure Type | # Housing Units | % Housing Units |
| Single Unit, Detached | 130 | 89.0% |
| Single Unit, Attached | 0 | 0.0% |
| 2 Unit Apartments | 0 | 0.0% |
| 3 or 4 Unit Apartments | 0 | 0.0% |
| 5 to 9 Unit Apartments | 16 | 11.0% |
| 10 or more Apartments | 0 | 0.0% |
| Mobile Home / Other | 0 | 0.0% |
| Total | 146 | 100.0% |
Housing Structures by Occupancy in Sperryville
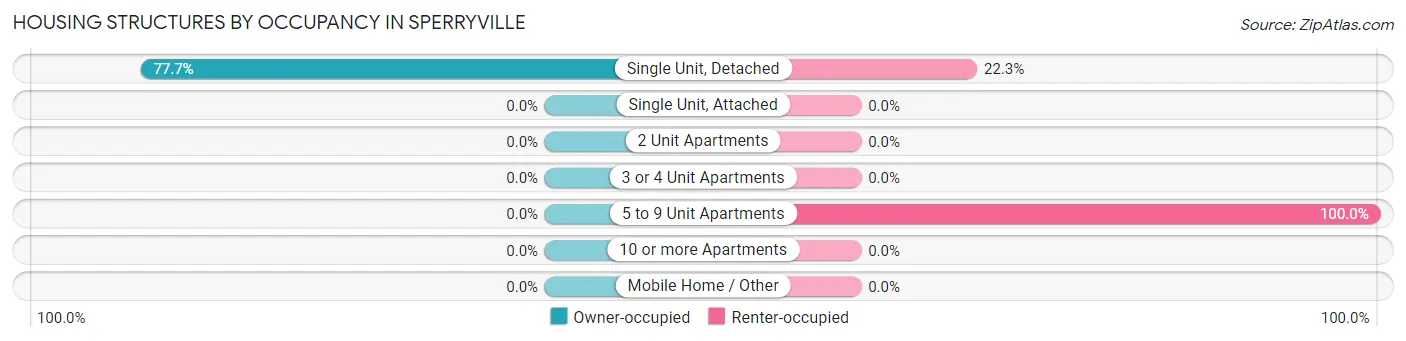
| Structure Type | Owner-occupied | Renter-occupied |
| Single Unit, Detached | 101 (77.7%) | 29 (22.3%) |
| Single Unit, Attached | 0 (0.0%) | 0 (0.0%) |
| 2 Unit Apartments | 0 (0.0%) | 0 (0.0%) |
| 3 or 4 Unit Apartments | 0 (0.0%) | 0 (0.0%) |
| 5 to 9 Unit Apartments | 0 (0.0%) | 16 (100.0%) |
| 10 or more Apartments | 0 (0.0%) | 0 (0.0%) |
| Mobile Home / Other | 0 (0.0%) | 0 (0.0%) |
| Total | 101 (69.2%) | 45 (30.8%) |
Housing Structures by Number of Rooms in Sperryville
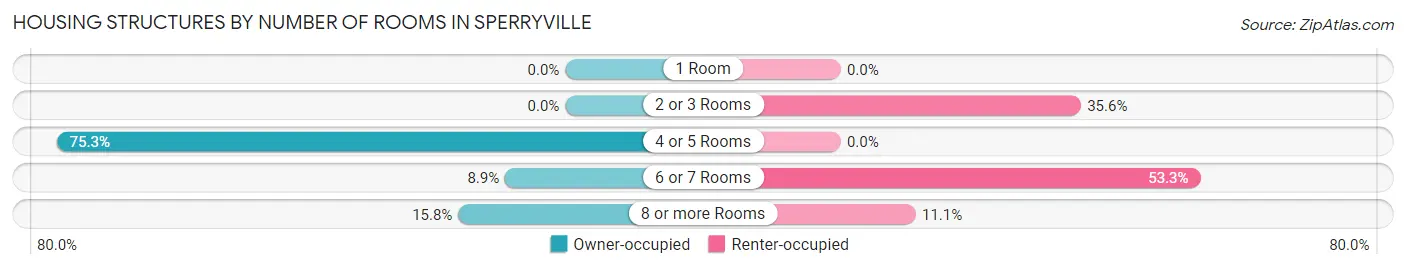
| Number of Rooms | Owner-occupied | Renter-occupied |
| 1 Room | 0 (0.0%) | 0 (0.0%) |
| 2 or 3 Rooms | 0 (0.0%) | 16 (35.6%) |
| 4 or 5 Rooms | 76 (75.2%) | 0 (0.0%) |
| 6 or 7 Rooms | 9 (8.9%) | 24 (53.3%) |
| 8 or more Rooms | 16 (15.8%) | 5 (11.1%) |
| Total | 101 (100.0%) | 45 (100.0%) |
Housing Structure by Heating Type in Sperryville
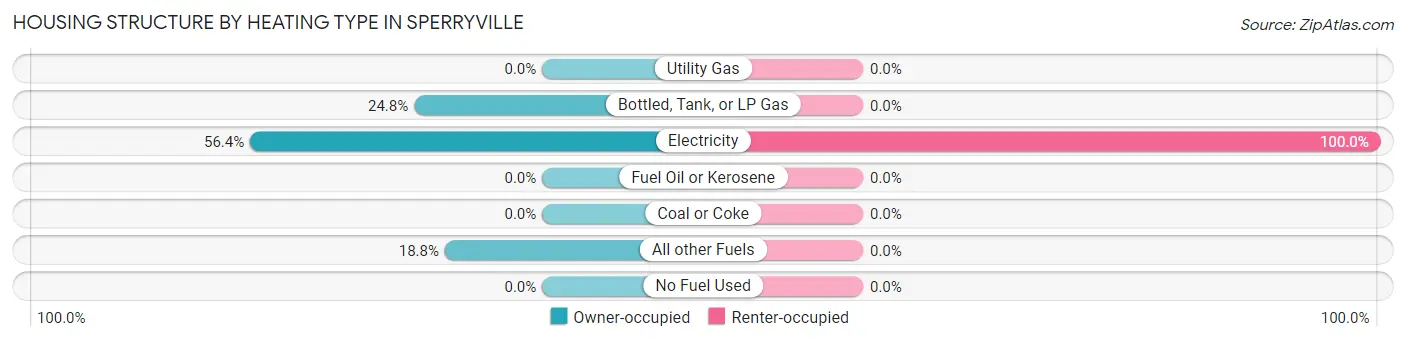
| Heating Type | Owner-occupied | Renter-occupied |
| Utility Gas | 0 (0.0%) | 0 (0.0%) |
| Bottled, Tank, or LP Gas | 25 (24.7%) | 0 (0.0%) |
| Electricity | 57 (56.4%) | 45 (100.0%) |
| Fuel Oil or Kerosene | 0 (0.0%) | 0 (0.0%) |
| Coal or Coke | 0 (0.0%) | 0 (0.0%) |
| All other Fuels | 19 (18.8%) | 0 (0.0%) |
| No Fuel Used | 0 (0.0%) | 0 (0.0%) |
| Total | 101 (100.0%) | 45 (100.0%) |
Household Vehicle Usage in Sperryville
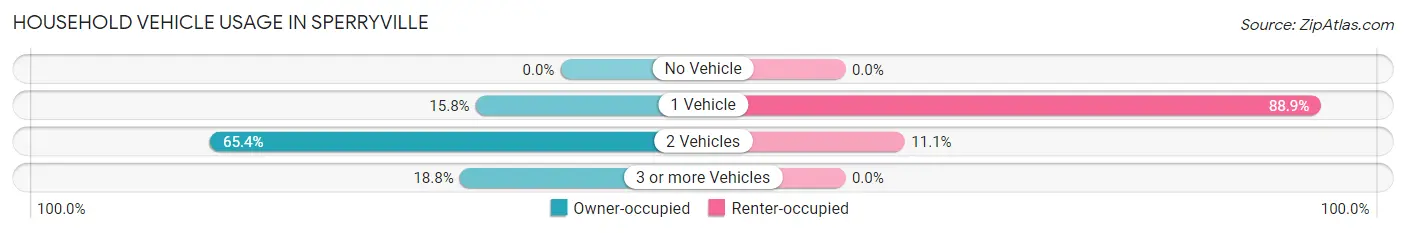
| Vehicles per Household | Owner-occupied | Renter-occupied |
| No Vehicle | 0 (0.0%) | 0 (0.0%) |
| 1 Vehicle | 16 (15.8%) | 40 (88.9%) |
| 2 Vehicles | 66 (65.3%) | 5 (11.1%) |
| 3 or more Vehicles | 19 (18.8%) | 0 (0.0%) |
| Total | 101 (100.0%) | 45 (100.0%) |
Real Estate & Mortgages in Sperryville
Real Estate and Mortgage Overview in Sperryville
| Characteristic | Without Mortgage | With Mortgage |
| Housing Units | 76 | 25 |
| Median Property Value | $356,700 | $0 |
| Median Household Income | $90,637 | $0 |
| Monthly Housing Costs | $857 | $0 |
| Real Estate Taxes | $2,633 | $0 |
Property Value by Mortgage Status in Sperryville
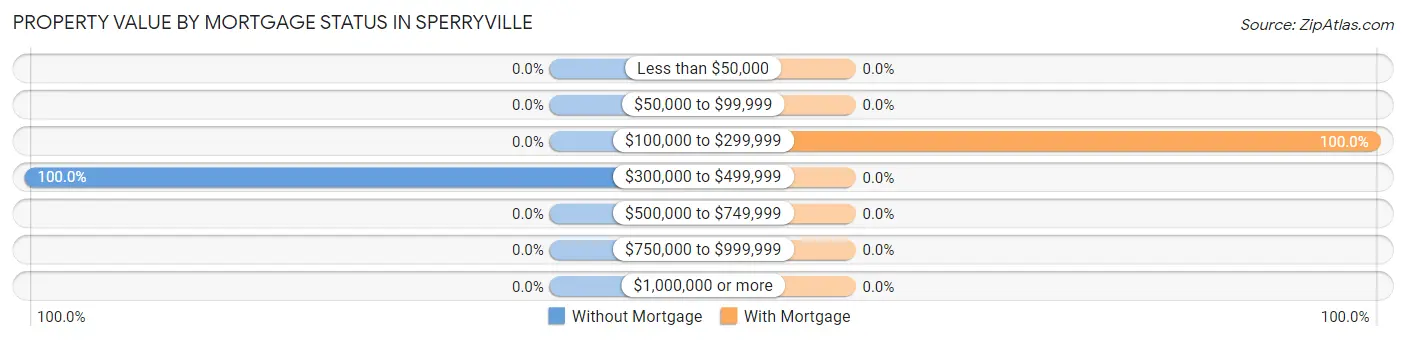
| Property Value | Without Mortgage | With Mortgage |
| Less than $50,000 | 0 (0.0%) | 0 (0.0%) |
| $50,000 to $99,999 | 0 (0.0%) | 0 (0.0%) |
| $100,000 to $299,999 | 0 (0.0%) | 25 (100.0%) |
| $300,000 to $499,999 | 76 (100.0%) | 0 (0.0%) |
| $500,000 to $749,999 | 0 (0.0%) | 0 (0.0%) |
| $750,000 to $999,999 | 0 (0.0%) | 0 (0.0%) |
| $1,000,000 or more | 0 (0.0%) | 0 (0.0%) |
| Total | 76 (100.0%) | 25 (100.0%) |
Household Income by Mortgage Status in Sperryville
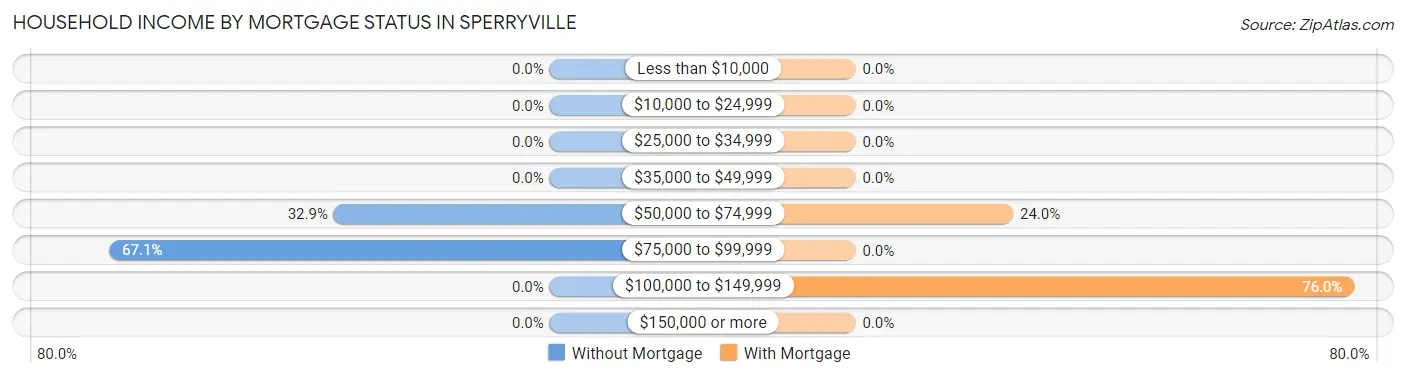
| Household Income | Without Mortgage | With Mortgage |
| Less than $10,000 | 0 (0.0%) | 0 (0.0%) |
| $10,000 to $24,999 | 0 (0.0%) | 0 (0.0%) |
| $25,000 to $34,999 | 0 (0.0%) | 0 (0.0%) |
| $35,000 to $49,999 | 0 (0.0%) | 0 (0.0%) |
| $50,000 to $74,999 | 25 (32.9%) | 6 (24.0%) |
| $75,000 to $99,999 | 51 (67.1%) | 0 (0.0%) |
| $100,000 to $149,999 | 0 (0.0%) | 19 (76.0%) |
| $150,000 or more | 0 (0.0%) | 0 (0.0%) |
| Total | 76 (100.0%) | 25 (100.0%) |
Property Value to Household Income Ratio in Sperryville
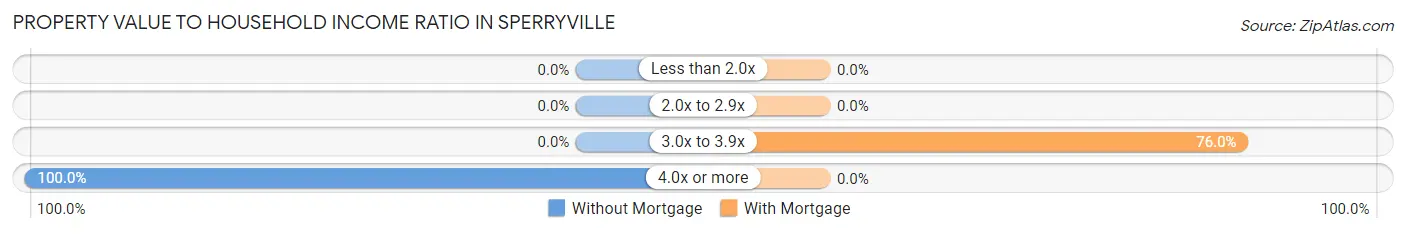
| Value-to-Income Ratio | Without Mortgage | With Mortgage |
| Less than 2.0x | 0 (0.0%) | 0 (0.0%) |
| 2.0x to 2.9x | 0 (0.0%) | 0 (0.0%) |
| 3.0x to 3.9x | 0 (0.0%) | 19 (76.0%) |
| 4.0x or more | 76 (100.0%) | 0 (0.0%) |
| Total | 76 (100.0%) | 25 (100.0%) |
Real Estate Taxes by Mortgage Status in Sperryville
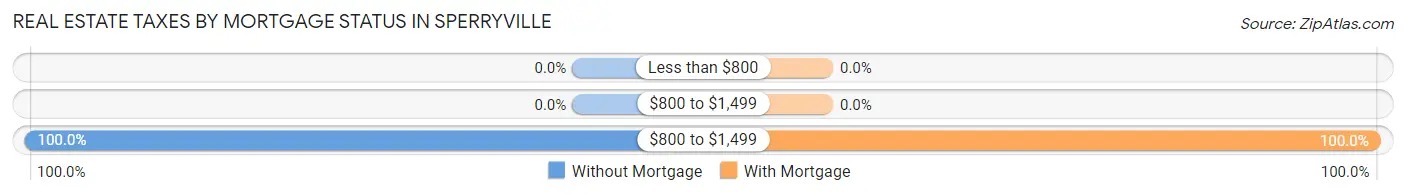
| Property Taxes | Without Mortgage | With Mortgage |
| Less than $800 | 0 (0.0%) | 0 (0.0%) |
| $800 to $1,499 | 0 (0.0%) | 0 (0.0%) |
| $800 to $1,499 | 76 (100.0%) | 25 (100.0%) |
| Total | 76 (100.0%) | 25 (100.0%) |
Health & Disability in Sperryville
Health Insurance Coverage by Age in Sperryville
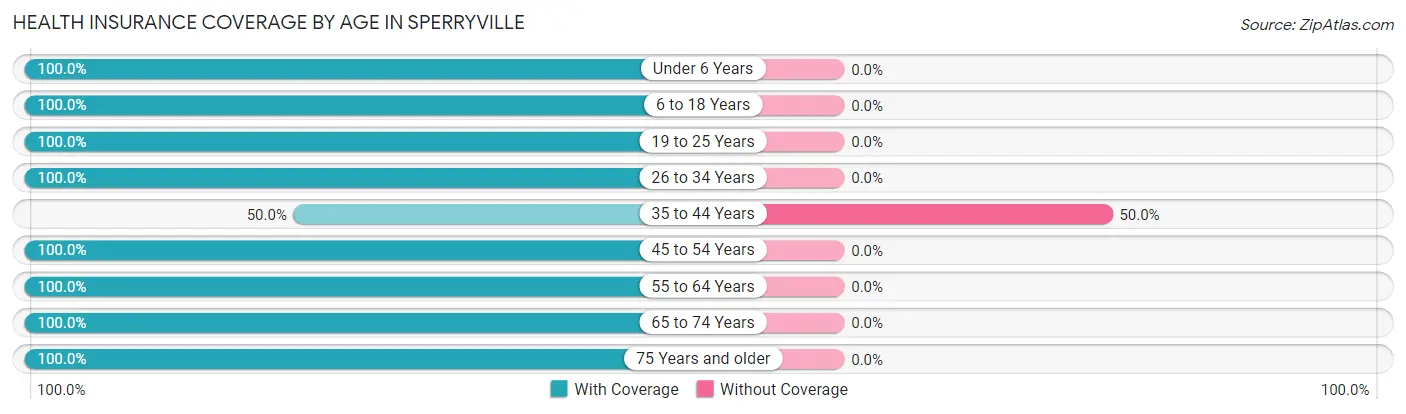
| Age Bracket | With Coverage | Without Coverage |
| Under 6 Years | 13 (100.0%) | 0 (0.0%) |
| 6 to 18 Years | 51 (100.0%) | 0 (0.0%) |
| 19 to 25 Years | 5 (100.0%) | 0 (0.0%) |
| 26 to 34 Years | 6 (100.0%) | 0 (0.0%) |
| 35 to 44 Years | 24 (50.0%) | 24 (50.0%) |
| 45 to 54 Years | 64 (100.0%) | 0 (0.0%) |
| 55 to 64 Years | 16 (100.0%) | 0 (0.0%) |
| 65 to 74 Years | 108 (100.0%) | 0 (0.0%) |
| 75 Years and older | 16 (100.0%) | 0 (0.0%) |
| Total | 303 (92.7%) | 24 (7.3%) |
Health Insurance Coverage by Citizenship Status in Sperryville
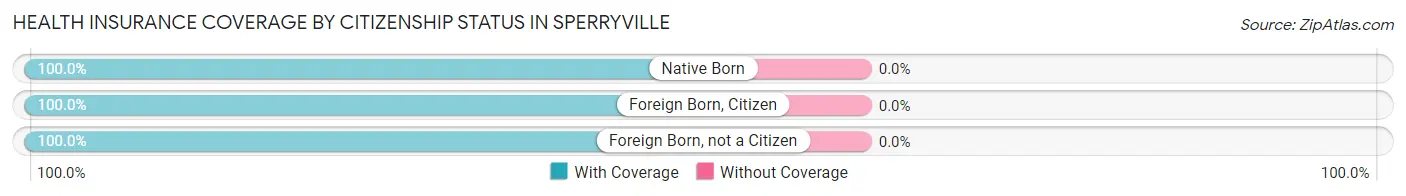
| Citizenship Status | With Coverage | Without Coverage |
| Native Born | 13 (100.0%) | 0 (0.0%) |
| Foreign Born, Citizen | 51 (100.0%) | 0 (0.0%) |
| Foreign Born, not a Citizen | 5 (100.0%) | 0 (0.0%) |
Health Insurance Coverage by Household Income in Sperryville
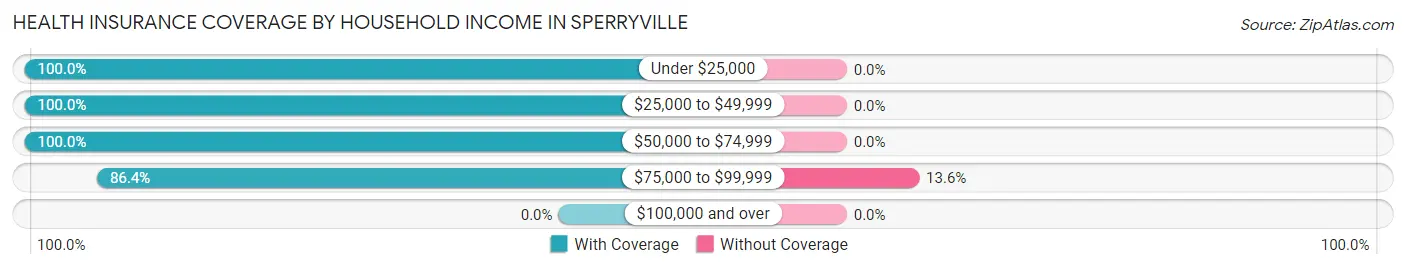
| Household Income | With Coverage | Without Coverage |
| Under $25,000 | 36 (100.0%) | 0 (0.0%) |
| $25,000 to $49,999 | 6 (100.0%) | 0 (0.0%) |
| $50,000 to $74,999 | 108 (100.0%) | 0 (0.0%) |
| $75,000 to $99,999 | 153 (86.4%) | 24 (13.6%) |
| $100,000 and over | 0 (0.0%) | 0 (0.0%) |
Public vs Private Health Insurance Coverage by Age in Sperryville
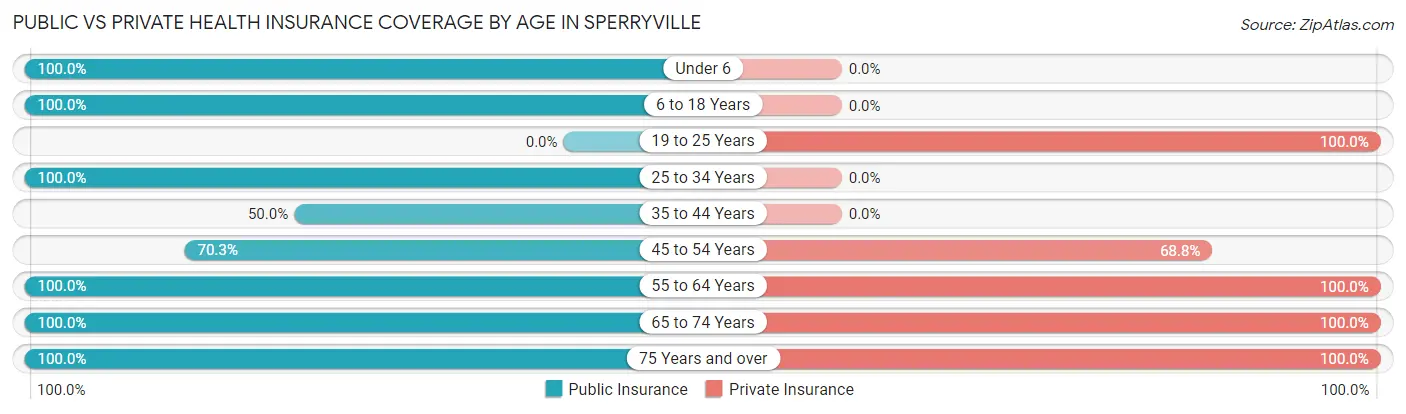
| Age Bracket | Public Insurance | Private Insurance |
| Under 6 | 13 (100.0%) | 0 (0.0%) |
| 6 to 18 Years | 51 (100.0%) | 0 (0.0%) |
| 19 to 25 Years | 0 (0.0%) | 5 (100.0%) |
| 25 to 34 Years | 6 (100.0%) | 0 (0.0%) |
| 35 to 44 Years | 24 (50.0%) | 0 (0.0%) |
| 45 to 54 Years | 45 (70.3%) | 44 (68.8%) |
| 55 to 64 Years | 16 (100.0%) | 16 (100.0%) |
| 65 to 74 Years | 108 (100.0%) | 108 (100.0%) |
| 75 Years and over | 16 (100.0%) | 16 (100.0%) |
| Total | 279 (85.3%) | 189 (57.8%) |
Disability Status by Sex by Age in Sperryville
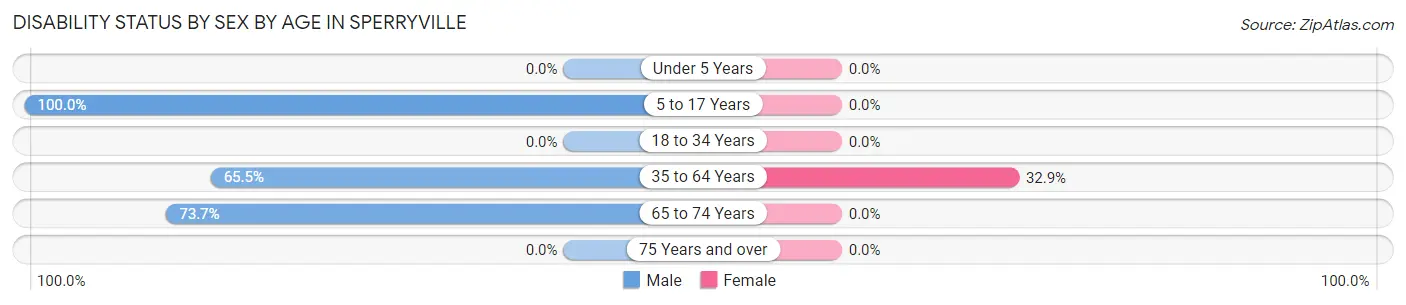
| Age Bracket | Male | Female |
| Under 5 Years | 0 (0.0%) | 0 (0.0%) |
| 5 to 17 Years | 21 (100.0%) | 0 (0.0%) |
| 18 to 34 Years | 0 (0.0%) | 0 (0.0%) |
| 35 to 64 Years | 36 (65.4%) | 24 (32.9%) |
| 65 to 74 Years | 42 (73.7%) | 0 (0.0%) |
| 75 Years and over | 0 (0.0%) | 0 (0.0%) |
Disability Class by Sex by Age in Sperryville
Disability Class: Hearing Difficulty
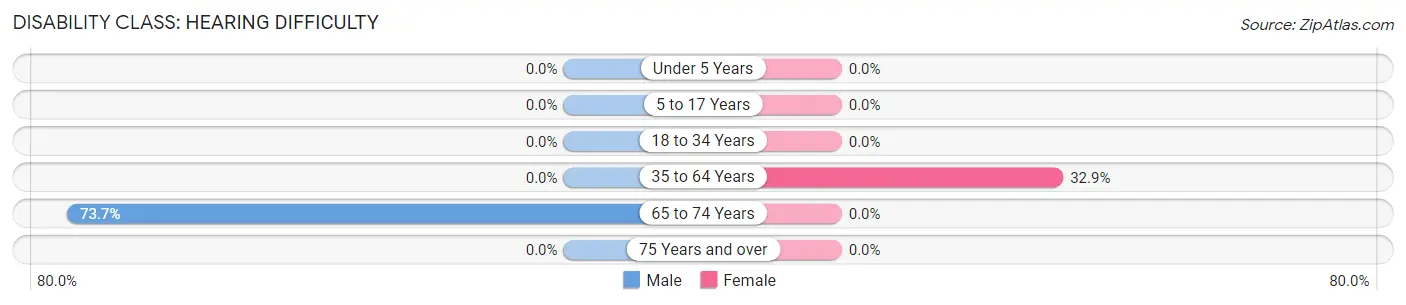
| Age Bracket | Male | Female |
| Under 5 Years | 0 (0.0%) | 0 (0.0%) |
| 5 to 17 Years | 0 (0.0%) | 0 (0.0%) |
| 18 to 34 Years | 0 (0.0%) | 0 (0.0%) |
| 35 to 64 Years | 0 (0.0%) | 24 (32.9%) |
| 65 to 74 Years | 42 (73.7%) | 0 (0.0%) |
| 75 Years and over | 0 (0.0%) | 0 (0.0%) |
Disability Class: Vision Difficulty
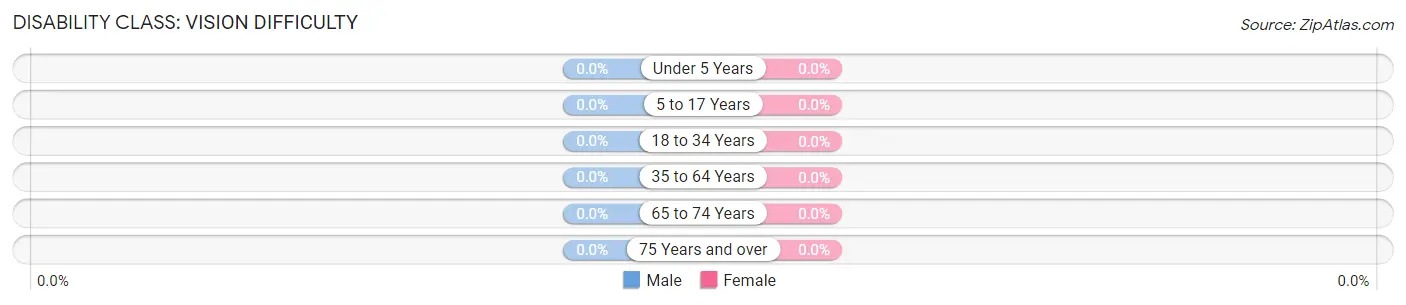
| Age Bracket | Male | Female |
| Under 5 Years | 0 (0.0%) | 0 (0.0%) |
| 5 to 17 Years | 0 (0.0%) | 0 (0.0%) |
| 18 to 34 Years | 0 (0.0%) | 0 (0.0%) |
| 35 to 64 Years | 0 (0.0%) | 0 (0.0%) |
| 65 to 74 Years | 0 (0.0%) | 0 (0.0%) |
| 75 Years and over | 0 (0.0%) | 0 (0.0%) |
Disability Class: Cognitive Difficulty
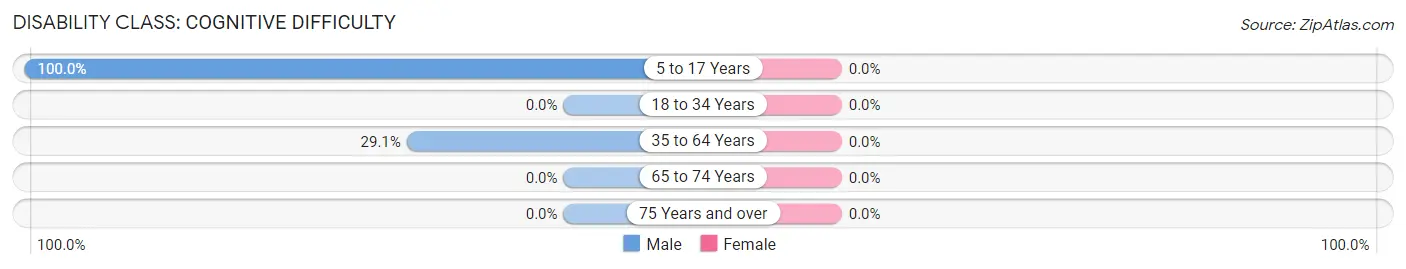
| Age Bracket | Male | Female |
| 5 to 17 Years | 21 (100.0%) | 0 (0.0%) |
| 18 to 34 Years | 0 (0.0%) | 0 (0.0%) |
| 35 to 64 Years | 16 (29.1%) | 0 (0.0%) |
| 65 to 74 Years | 0 (0.0%) | 0 (0.0%) |
| 75 Years and over | 0 (0.0%) | 0 (0.0%) |
Disability Class: Ambulatory Difficulty
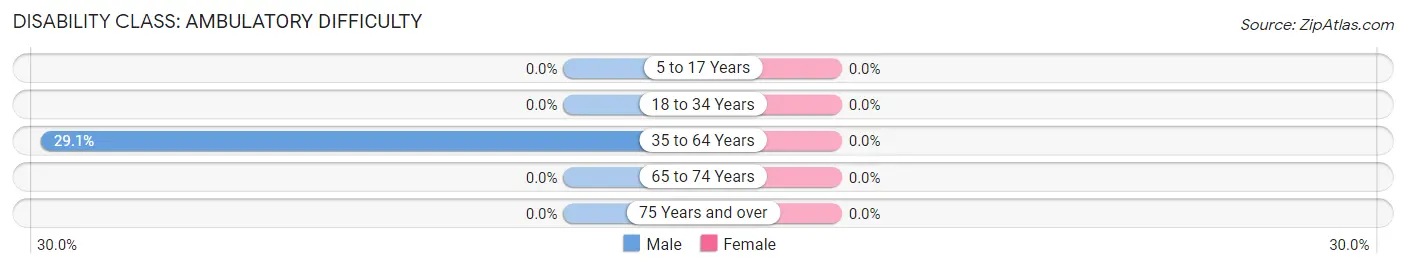
| Age Bracket | Male | Female |
| 5 to 17 Years | 0 (0.0%) | 0 (0.0%) |
| 18 to 34 Years | 0 (0.0%) | 0 (0.0%) |
| 35 to 64 Years | 16 (29.1%) | 0 (0.0%) |
| 65 to 74 Years | 0 (0.0%) | 0 (0.0%) |
| 75 Years and over | 0 (0.0%) | 0 (0.0%) |
Disability Class: Self-Care Difficulty
| Age Bracket | Male | Female |
| 5 to 17 Years | 0 (0.0%) | 0 (0.0%) |
| 18 to 34 Years | 0 (0.0%) | 0 (0.0%) |
| 35 to 64 Years | 0 (0.0%) | 0 (0.0%) |
| 65 to 74 Years | 0 (0.0%) | 0 (0.0%) |
| 75 Years and over | 0 (0.0%) | 0 (0.0%) |
Technology Access in Sperryville
Computing Device Access in Sperryville
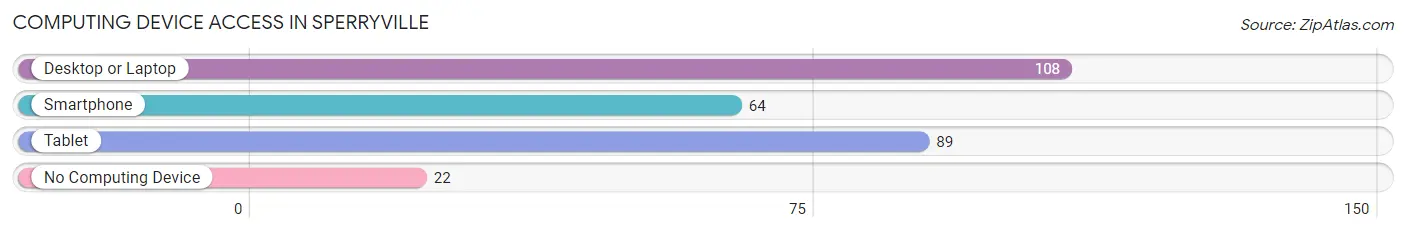
| Device Type | # Households | % Households |
| Desktop or Laptop | 108 | 74.0% |
| Smartphone | 64 | 43.8% |
| Tablet | 89 | 61.0% |
| No Computing Device | 22 | 15.1% |
| Total | 146 | 100.0% |
Internet Access in Sperryville
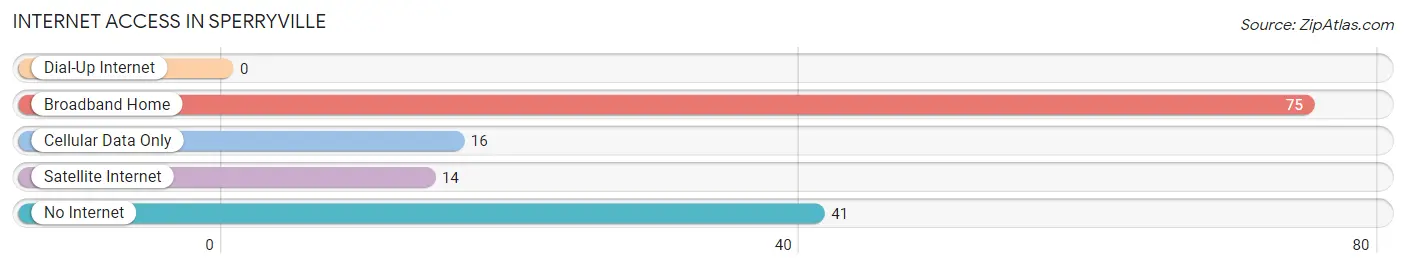
| Internet Type | # Households | % Households |
| Dial-Up Internet | 0 | 0.0% |
| Broadband Home | 75 | 51.4% |
| Cellular Data Only | 16 | 11.0% |
| Satellite Internet | 14 | 9.6% |
| No Internet | 41 | 28.1% |
| Total | 146 | 100.0% |
Sperryville Summary
Sperryville is a small unincorporated community located in Rappahannock County, Virginia. It is situated in the foothills of the Blue Ridge Mountains, approximately 70 miles west of Washington, D.C. and 30 miles north of Charlottesville. The town is home to a population of approximately 500 people and is known for its rural charm and scenic beauty.
History
Sperryville was first settled in the late 1700s by German and Scots-Irish immigrants. The town was named after the Sperry family, who were among the first settlers. The town was officially established in 1817 and was home to a variety of businesses, including a gristmill, a tannery, a blacksmith shop, and a general store.
In the late 1800s, the town experienced a period of growth and prosperity. The railroad arrived in 1881, bringing with it new opportunities for trade and commerce. The town also became a popular destination for tourists, who were drawn to the area’s natural beauty and outdoor recreation.
In the early 1900s, the town began to decline as the railroad was replaced by automobiles and the local economy shifted away from agriculture. The town’s population decreased and many of the businesses closed.
In the late 20th century, the town experienced a resurgence as a popular tourist destination. The town’s historic buildings were restored and new businesses opened. Today, Sperryville is a popular destination for outdoor recreation, shopping, and dining.
Geography
Sperryville is located in the foothills of the Blue Ridge Mountains in Rappahannock County, Virginia. The town is situated along the Thornton River, which flows through the town and is a popular destination for fishing and canoeing. The town is surrounded by the George Washington National Forest, which provides a variety of outdoor recreation opportunities.
The town is located approximately 70 miles west of Washington, D.C. and 30 miles north of Charlottesville. The nearest major cities are Winchester, Virginia (45 miles) and Harrisonburg, Virginia (50 miles).
Economy
The economy of Sperryville is largely based on tourism and outdoor recreation. The town is home to a variety of restaurants, shops, and galleries. The town is also a popular destination for outdoor recreation, including fishing, canoeing, hiking, and camping.
The town is also home to a variety of small businesses, including a winery, a brewery, and a distillery. The town is also home to a variety of agricultural businesses, including a dairy farm, a vegetable farm, and a Christmas tree farm.
Demographics
As of the 2010 census, the population of Sperryville was 498. The racial makeup of the town was 95.2% White, 1.2% African American, 0.2% Native American, 0.6% Asian, 0.2% Pacific Islander, and 2.6% from other races. The median household income was $45,000 and the median age was 44.
Sperryville is a small, rural community with a strong sense of community and a commitment to preserving its rural character. The town is home to a variety of businesses and organizations, including a volunteer fire department, a library, and a community center. The town is also home to a variety of churches, including Baptist, Methodist, and Presbyterian.
Common Questions
What is Per Capita Income in Sperryville?
Per Capita income in Sperryville is $32,714.
What is the Median Family Income in Sperryville?
Median Family Income in Sperryville is $90,931.
What is the Median Household income in Sperryville?
Median Household Income in Sperryville is $90,637.
What is Inequality or Gini Index in Sperryville?
Inequality or Gini Index in Sperryville is 0.16.
What is the Total Population of Sperryville?
Total Population of Sperryville is 327.
What is the Total Male Population of Sperryville?
Total Male Population of Sperryville is 154.
What is the Total Female Population of Sperryville?
Total Female Population of Sperryville is 173.
What is the Ratio of Males per 100 Females in Sperryville?
There are 89.02 Males per 100 Females in Sperryville.
What is the Ratio of Females per 100 Males in Sperryville?
There are 112.34 Females per 100 Males in Sperryville.
What is the Median Population Age in Sperryville?
Median Population Age in Sperryville is 48.8 Years.
What is the Average Family Size in Sperryville
Average Family Size in Sperryville is 2.6 People.
What is the Average Household Size in Sperryville
Average Household Size in Sperryville is 2.2 People.
How Large is the Labor Force in Sperryville?
There are 130 People in the Labor Forcein in Sperryville.
What is the Percentage of People in the Labor Force in Sperryville?
49.4% of People are in the Labor Force in Sperryville.