Rushmere, VA Map & Demographics
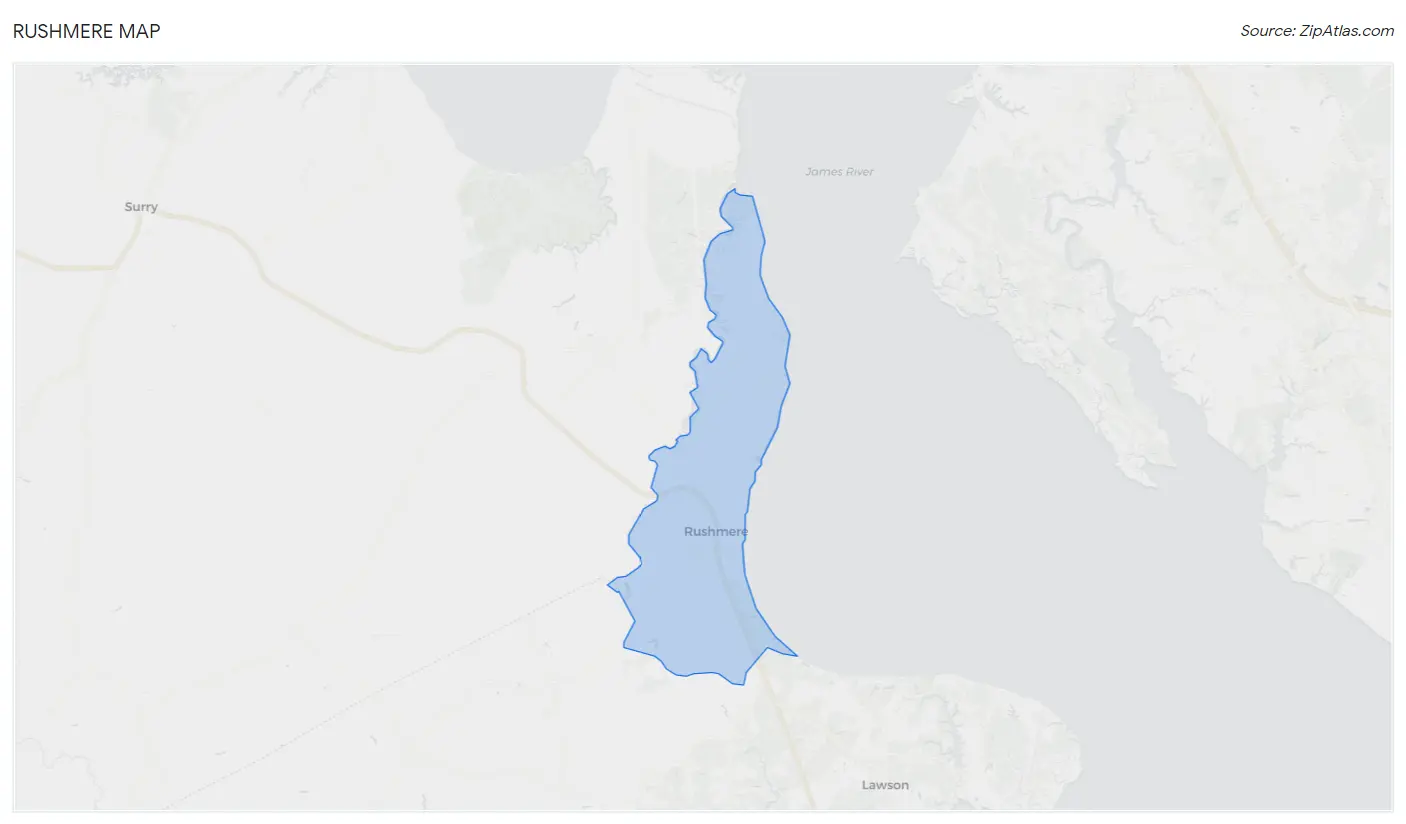
Rushmere Map
Rushmere Overview
$59,965
PER CAPITA INCOME
$111,786
AVG FAMILY INCOME
$51,667
AVG HOUSEHOLD INCOME
20.3%
WAGE / INCOME GAP [ % ]
79.7¢/ $1
WAGE / INCOME GAP [ $ ]
0.55
INEQUALITY / GINI INDEX
896
TOTAL POPULATION
376
MALE POPULATION
520
FEMALE POPULATION
72.31
MALES / 100 FEMALES
138.30
FEMALES / 100 MALES
59.5
MEDIAN AGE
2.7
AVG FAMILY SIZE
2.0
AVG HOUSEHOLD SIZE
425
LABOR FORCE [ PEOPLE ]
54.0%
PERCENT IN LABOR FORCE
6.8%
UNEMPLOYMENT RATE
Income in Rushmere
Income Overview in Rushmere
Per Capita Income in Rushmere is $59,965, while median incomes of families and households are $111,786 and $51,667 respectively.
| Characteristic | Number | Measure |
| Per Capita Income | 896 | $59,965 |
| Median Family Income | 256 | $111,786 |
| Mean Family Income | 256 | $178,595 |
| Median Household Income | 442 | $51,667 |
| Mean Household Income | 442 | $120,216 |
| Income Deficit | 256 | $0 |
| Wage / Income Gap (%) | 896 | 20.33% |
| Wage / Income Gap ($) | 896 | 79.67¢ per $1 |
| Gini / Inequality Index | 896 | 0.55 |
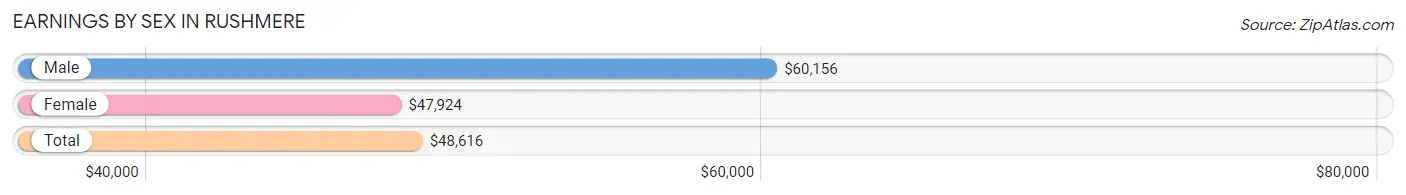
Earnings by Sex in Rushmere
Average Earnings in Rushmere are $48,616, $60,156 for men and $47,924 for women, a difference of 20.3%.
| Sex | Number | Average Earnings |
| Male | 199 (48.1%) | $60,156 |
| Female | 215 (51.9%) | $47,924 |
| Total | 414 (100.0%) | $48,616 |
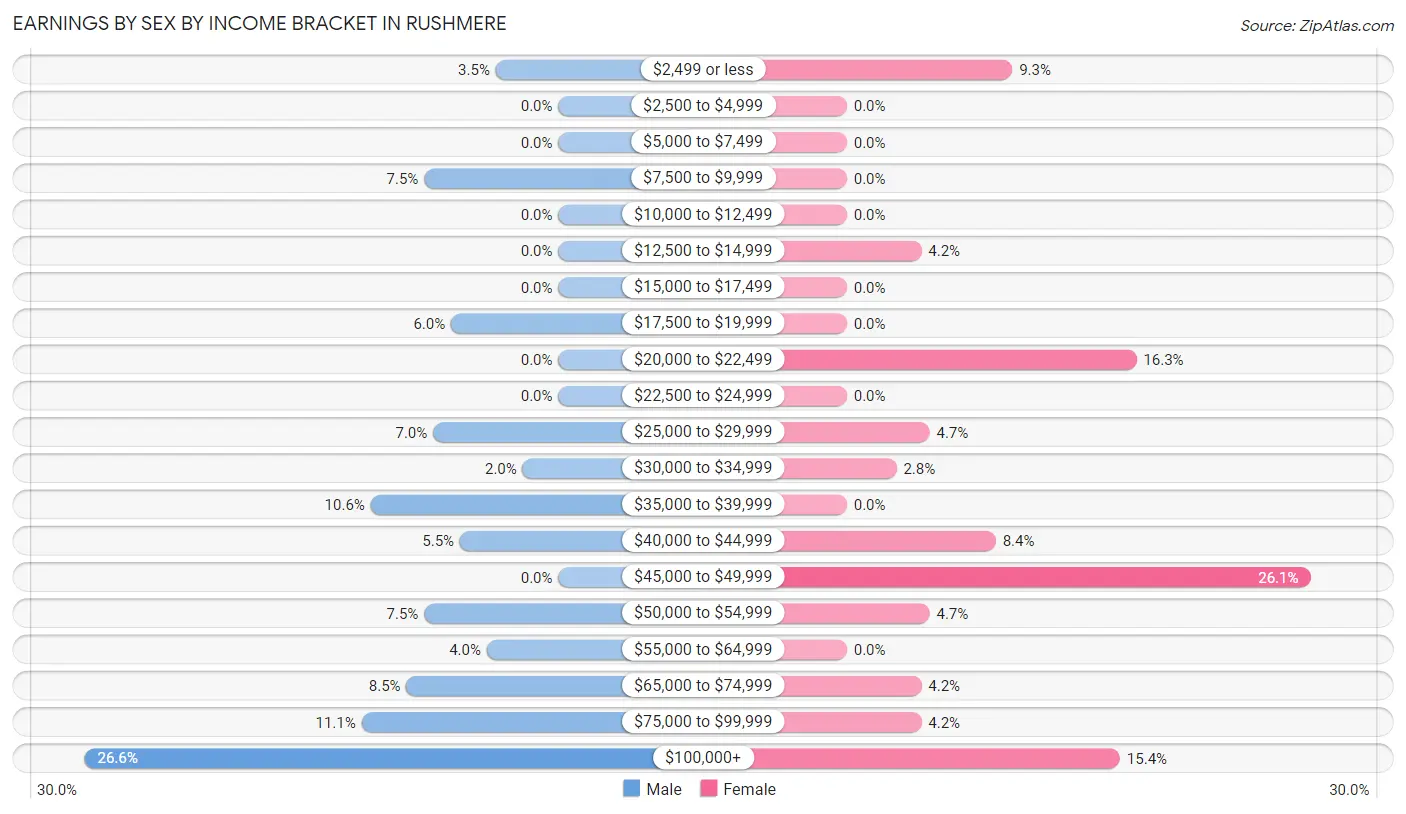
Earnings by Sex by Income Bracket in Rushmere
The most common earnings brackets in Rushmere are $100,000+ for men (53 | 26.6%) and $45,000 to $49,999 for women (56 | 26.1%).
| Income | Male | Female |
| $2,499 or less | 7 (3.5%) | 20 (9.3%) |
| $2,500 to $4,999 | 0 (0.0%) | 0 (0.0%) |
| $5,000 to $7,499 | 0 (0.0%) | 0 (0.0%) |
| $7,500 to $9,999 | 15 (7.5%) | 0 (0.0%) |
| $10,000 to $12,499 | 0 (0.0%) | 0 (0.0%) |
| $12,500 to $14,999 | 0 (0.0%) | 9 (4.2%) |
| $15,000 to $17,499 | 0 (0.0%) | 0 (0.0%) |
| $17,500 to $19,999 | 12 (6.0%) | 0 (0.0%) |
| $20,000 to $22,499 | 0 (0.0%) | 35 (16.3%) |
| $22,500 to $24,999 | 0 (0.0%) | 0 (0.0%) |
| $25,000 to $29,999 | 14 (7.0%) | 10 (4.6%) |
| $30,000 to $34,999 | 4 (2.0%) | 6 (2.8%) |
| $35,000 to $39,999 | 21 (10.5%) | 0 (0.0%) |
| $40,000 to $44,999 | 11 (5.5%) | 18 (8.4%) |
| $45,000 to $49,999 | 0 (0.0%) | 56 (26.1%) |
| $50,000 to $54,999 | 15 (7.5%) | 10 (4.6%) |
| $55,000 to $64,999 | 8 (4.0%) | 0 (0.0%) |
| $65,000 to $74,999 | 17 (8.5%) | 9 (4.2%) |
| $75,000 to $99,999 | 22 (11.1%) | 9 (4.2%) |
| $100,000+ | 53 (26.6%) | 33 (15.3%) |
| Total | 199 (100.0%) | 215 (100.0%) |
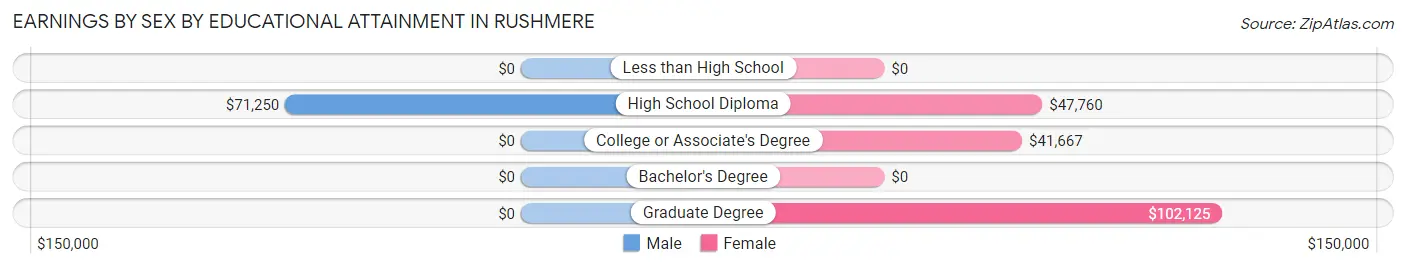
Earnings by Sex by Educational Attainment in Rushmere
Average earnings in Rushmere are $66,912 for men and $48,371 for women, a difference of 27.7%. Men with an educational attainment of high school diploma enjoy the highest average annual earnings of $71,250, while those with high school diploma education earn the least with $71,250. Women with an educational attainment of graduate degree earn the most with the average annual earnings of $102,125, while those with college or associate's degree education have the smallest earnings of $41,667.
| Educational Attainment | Male Income | Female Income |
| Less than High School | - | - |
| High School Diploma | $71,250 | $47,760 |
| College or Associate's Degree | - | - |
| Bachelor's Degree | - | - |
| Graduate Degree | - | - |
| Total | $66,912 | $48,371 |
Family Income in Rushmere
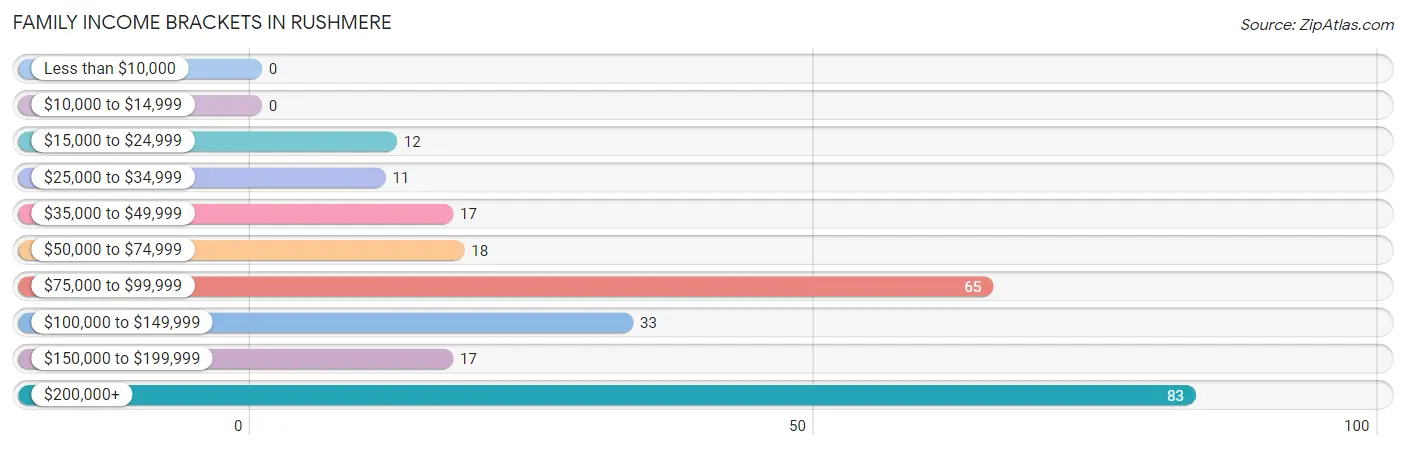
Family Income Brackets in Rushmere
According to the Rushmere family income data, there are 83 families falling into the $200,000+ income range, which is the most common income bracket and makes up 32.4% of all families.
| Income Bracket | # Families | % Families |
| Less than $10,000 | 0 | 0.0% |
| $10,000 to $14,999 | 0 | 0.0% |
| $15,000 to $24,999 | 12 | 4.7% |
| $25,000 to $34,999 | 11 | 4.3% |
| $35,000 to $49,999 | 17 | 6.6% |
| $50,000 to $74,999 | 18 | 7.0% |
| $75,000 to $99,999 | 65 | 25.4% |
| $100,000 to $149,999 | 33 | 12.9% |
| $150,000 to $199,999 | 17 | 6.6% |
| $200,000+ | 83 | 32.4% |
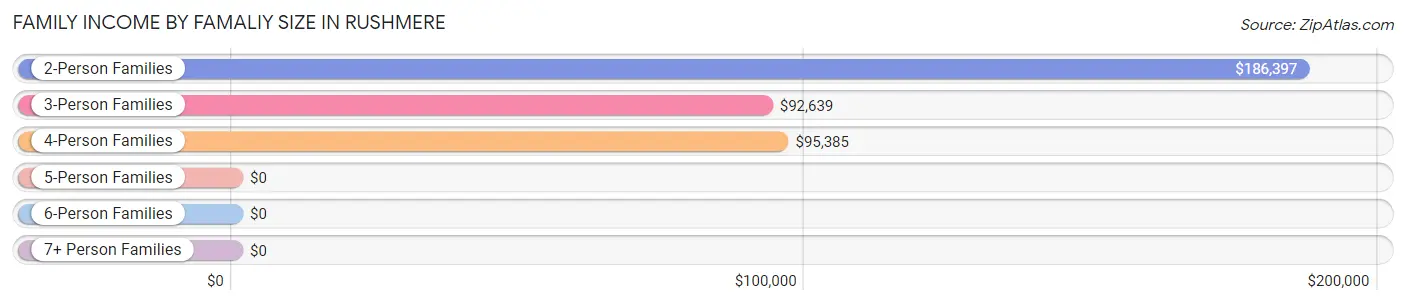
Family Income by Famaliy Size in Rushmere
2-person families (171 | 66.8%) account for the highest median family income in Rushmere with $186,397 per family, while 2-person families (171 | 66.8%) have the highest median income of $93,198 per family member.
| Income Bracket | # Families | Median Income |
| 2-Person Families | 171 (66.8%) | $186,397 |
| 3-Person Families | 45 (17.6%) | $92,639 |
| 4-Person Families | 40 (15.6%) | $95,385 |
| 5-Person Families | 0 (0.0%) | $0 |
| 6-Person Families | 0 (0.0%) | $0 |
| 7+ Person Families | 0 (0.0%) | $0 |
| Total | 256 (100.0%) | $111,786 |
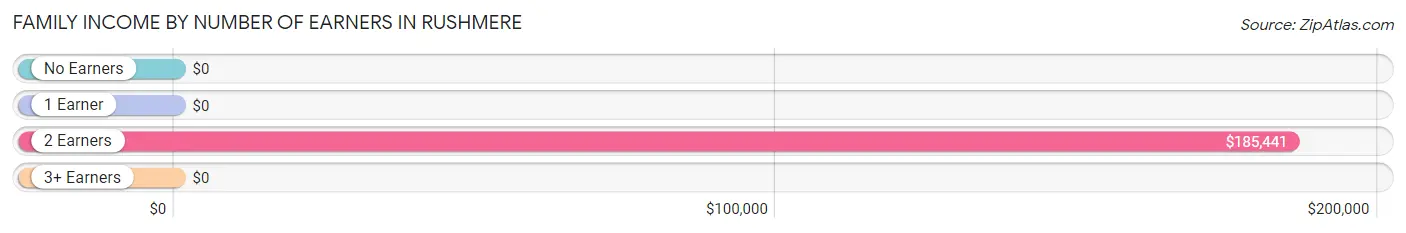
Family Income by Number of Earners in Rushmere
| Number of Earners | # Families | Median Income |
| No Earners | 102 (39.8%) | $0 |
| 1 Earner | 49 (19.1%) | $0 |
| 2 Earners | 90 (35.2%) | $185,441 |
| 3+ Earners | 15 (5.9%) | $0 |
| Total | 256 (100.0%) | $111,786 |
Household Income in Rushmere
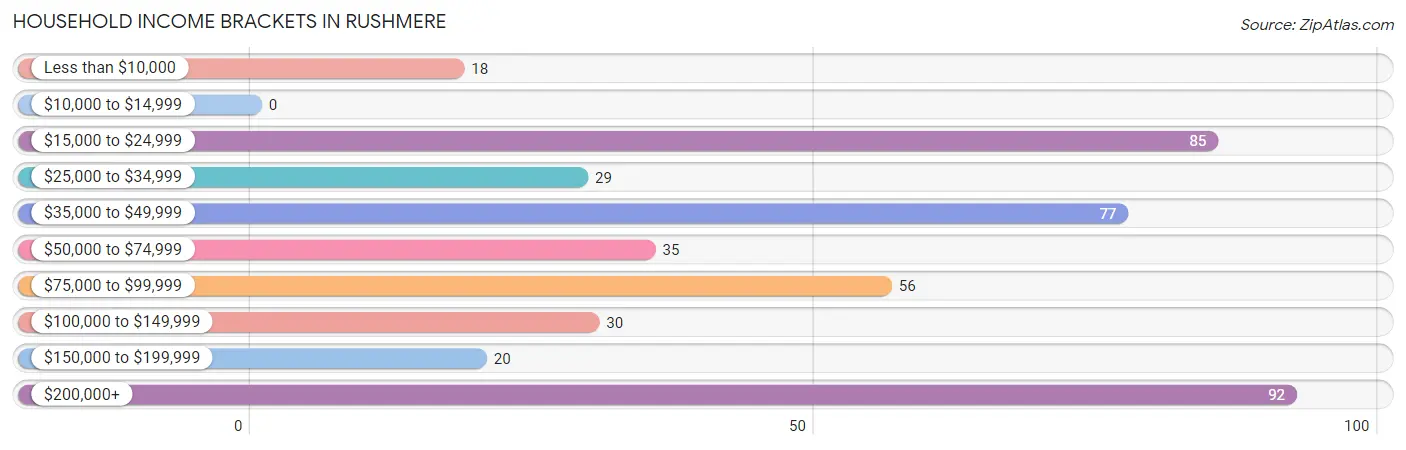
Household Income Brackets in Rushmere
With 92 households falling in the category, the $200,000+ income range is the most frequent in Rushmere, accounting for 20.8% of all households.
| Income Bracket | # Households | % Households |
| Less than $10,000 | 18 | 4.1% |
| $10,000 to $14,999 | 0 | 0.0% |
| $15,000 to $24,999 | 85 | 19.2% |
| $25,000 to $34,999 | 29 | 6.6% |
| $35,000 to $49,999 | 77 | 17.4% |
| $50,000 to $74,999 | 35 | 7.9% |
| $75,000 to $99,999 | 56 | 12.7% |
| $100,000 to $149,999 | 30 | 6.8% |
| $150,000 to $199,999 | 20 | 4.5% |
| $200,000+ | 92 | 20.8% |
Household Income by Householder Age in Rushmere
The median household income in Rushmere is $51,667, with the highest median household income of $82,045 found in the 25 to 44 years age bracket for the primary householder. A total of 56 households (12.7%) fall into this category.
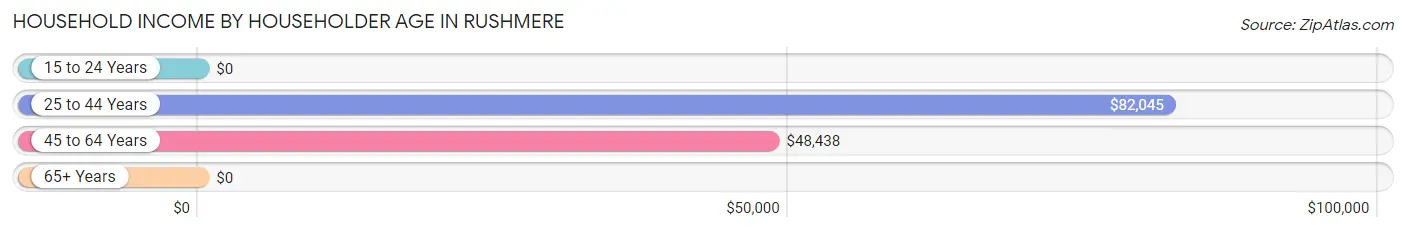
| Income Bracket | # Households | Median Income |
| 15 to 24 Years | 0 (0.0%) | $0 |
| 25 to 44 Years | 56 (12.7%) | $82,045 |
| 45 to 64 Years | 268 (60.6%) | $48,438 |
| 65+ Years | 118 (26.7%) | $0 |
| Total | 442 (100.0%) | $51,667 |
Poverty in Rushmere
Income Below Poverty by Sex and Age in Rushmere
With 6.7% poverty level for males and 6.5% for females among the residents of Rushmere, 45 to 54 year old males and 12 to 14 year old females are the most vulnerable to poverty, with 12 males (37.5%) and 16 females (100.0%) in their respective age groups living below the poverty level.
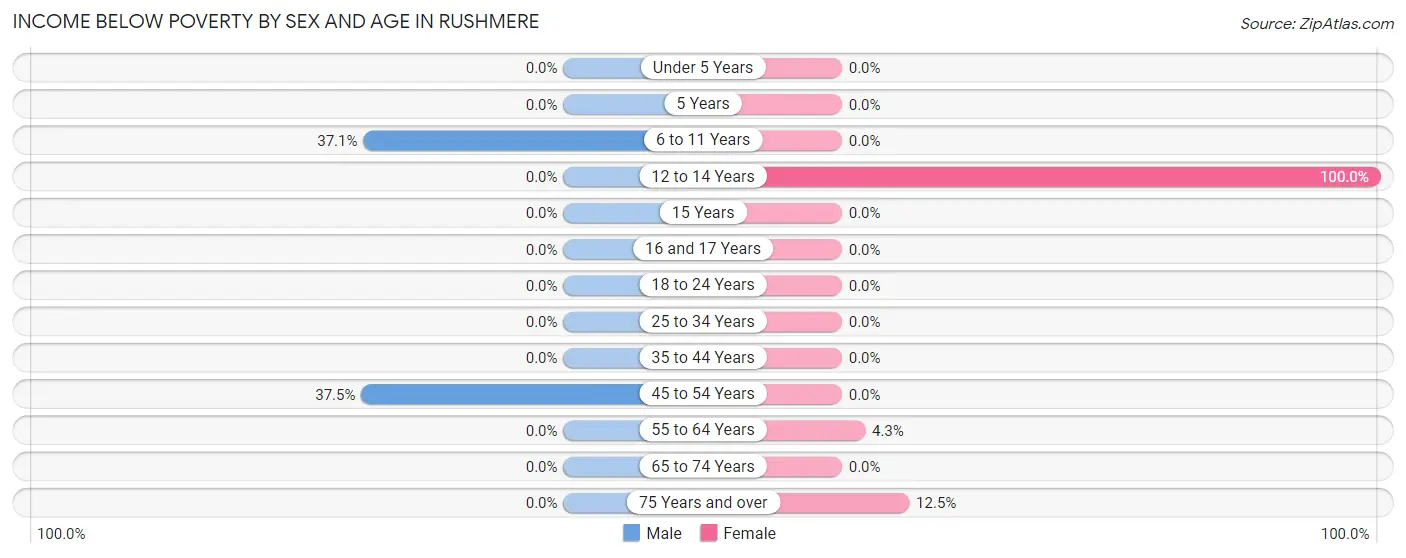
| Age Bracket | Male | Female |
| Under 5 Years | 0 (0.0%) | 0 (0.0%) |
| 5 Years | 0 (0.0%) | 0 (0.0%) |
| 6 to 11 Years | 13 (37.1%) | 0 (0.0%) |
| 12 to 14 Years | 0 (0.0%) | 16 (100.0%) |
| 15 Years | 0 (0.0%) | 0 (0.0%) |
| 16 and 17 Years | 0 (0.0%) | 0 (0.0%) |
| 18 to 24 Years | 0 (0.0%) | 0 (0.0%) |
| 25 to 34 Years | 0 (0.0%) | 0 (0.0%) |
| 35 to 44 Years | 0 (0.0%) | 0 (0.0%) |
| 45 to 54 Years | 12 (37.5%) | 0 (0.0%) |
| 55 to 64 Years | 0 (0.0%) | 10 (4.3%) |
| 65 to 74 Years | 0 (0.0%) | 0 (0.0%) |
| 75 Years and over | 0 (0.0%) | 8 (12.5%) |
| Total | 25 (6.7%) | 34 (6.5%) |
Income Above Poverty by Sex and Age in Rushmere
According to the poverty statistics in Rushmere, males aged 12 to 14 years and females aged 6 to 11 years are the age groups that are most secure financially, with 100.0% of males and 100.0% of females in these age groups living above the poverty line.
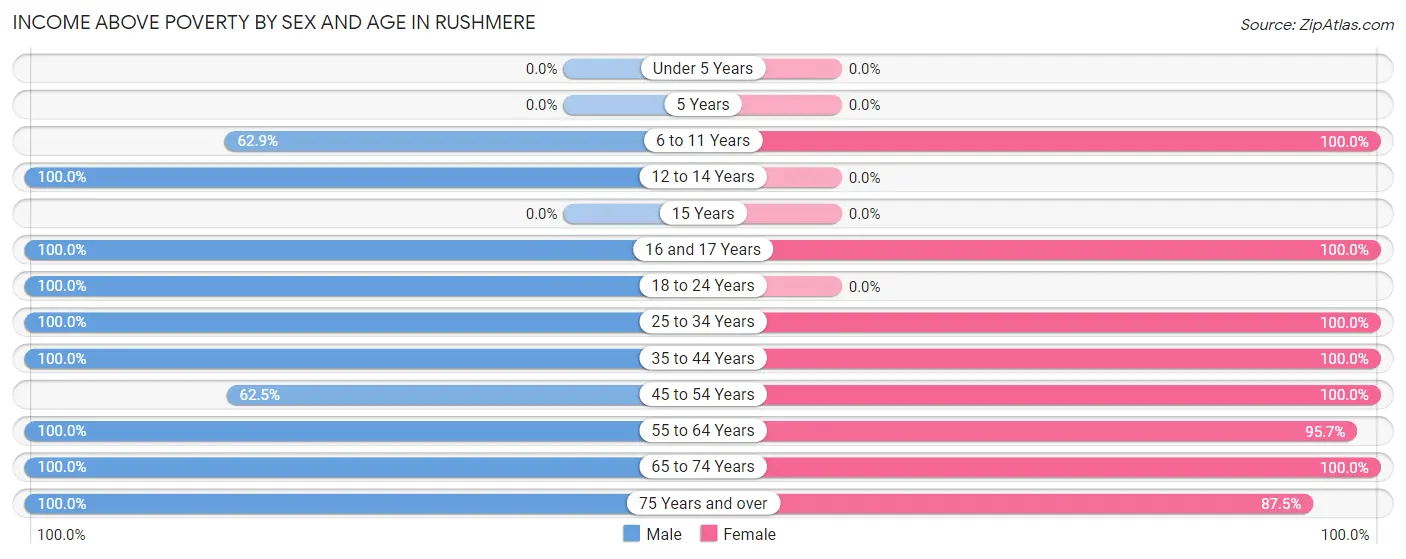
| Age Bracket | Male | Female |
| Under 5 Years | 0 (0.0%) | 0 (0.0%) |
| 5 Years | 0 (0.0%) | 0 (0.0%) |
| 6 to 11 Years | 22 (62.9%) | 45 (100.0%) |
| 12 to 14 Years | 13 (100.0%) | 0 (0.0%) |
| 15 Years | 0 (0.0%) | 0 (0.0%) |
| 16 and 17 Years | 7 (100.0%) | 20 (100.0%) |
| 18 to 24 Years | 34 (100.0%) | 0 (0.0%) |
| 25 to 34 Years | 12 (100.0%) | 25 (100.0%) |
| 35 to 44 Years | 38 (100.0%) | 26 (100.0%) |
| 45 to 54 Years | 20 (62.5%) | 48 (100.0%) |
| 55 to 64 Years | 108 (100.0%) | 222 (95.7%) |
| 65 to 74 Years | 61 (100.0%) | 44 (100.0%) |
| 75 Years and over | 36 (100.0%) | 56 (87.5%) |
| Total | 351 (93.3%) | 486 (93.5%) |
Income Below Poverty Among Married-Couple Families in Rushmere
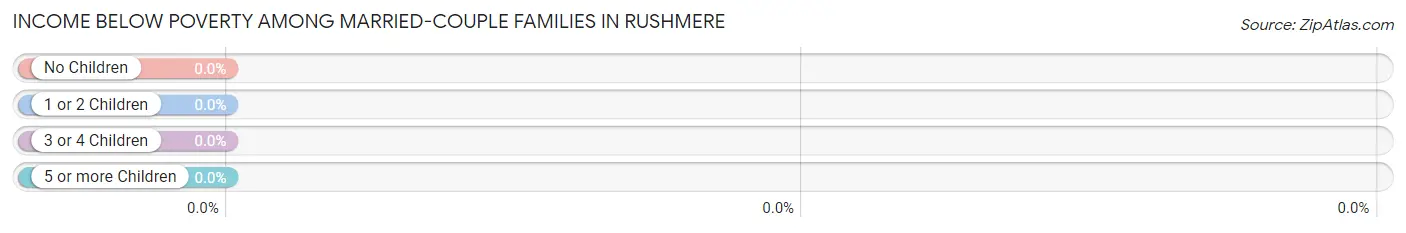
| Children | Above Poverty | Below Poverty |
| No Children | 166 (100.0%) | 0 (0.0%) |
| 1 or 2 Children | 37 (100.0%) | 0 (0.0%) |
| 3 or 4 Children | 0 (0.0%) | 0 (0.0%) |
| 5 or more Children | 0 (0.0%) | 0 (0.0%) |
| Total | 203 (100.0%) | 0 (0.0%) |
Income Below Poverty Among Single-Parent Households in Rushmere
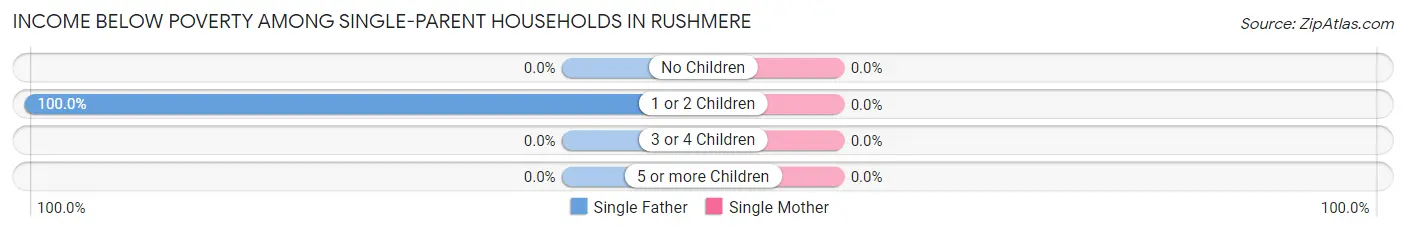
| Children | Single Father | Single Mother |
| No Children | 0 (0.0%) | 0 (0.0%) |
| 1 or 2 Children | 12 (100.0%) | 0 (0.0%) |
| 3 or 4 Children | 0 (0.0%) | 0 (0.0%) |
| 5 or more Children | 0 (0.0%) | 0 (0.0%) |
| Total | 12 (100.0%) | 0 (0.0%) |
Income Below Poverty Among Married-Couple vs Single-Parent Households in Rushmere
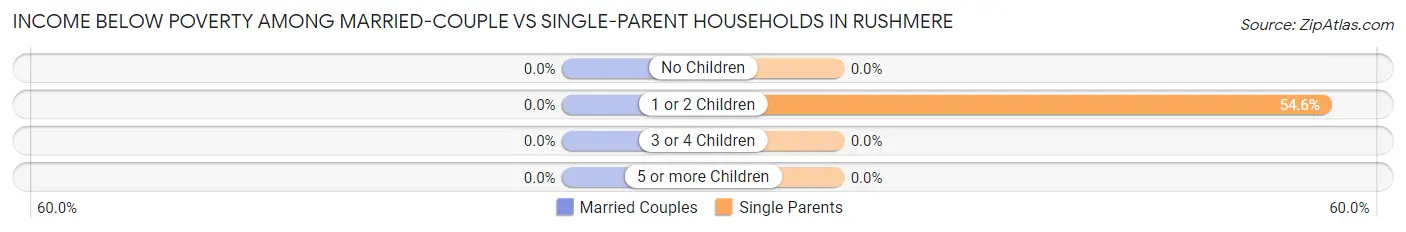
| Children | Married-Couple Families | Single-Parent Households |
| No Children | 0 (0.0%) | 0 (0.0%) |
| 1 or 2 Children | 0 (0.0%) | 12 (54.5%) |
| 3 or 4 Children | 0 (0.0%) | 0 (0.0%) |
| 5 or more Children | 0 (0.0%) | 0 (0.0%) |
| Total | 0 (0.0%) | 12 (22.6%) |
Race in Rushmere
The most populous races in Rushmere are White / Caucasian (471 | 52.6%), Black / African American (387 | 43.2%), and Two or more Races (38 | 4.2%).
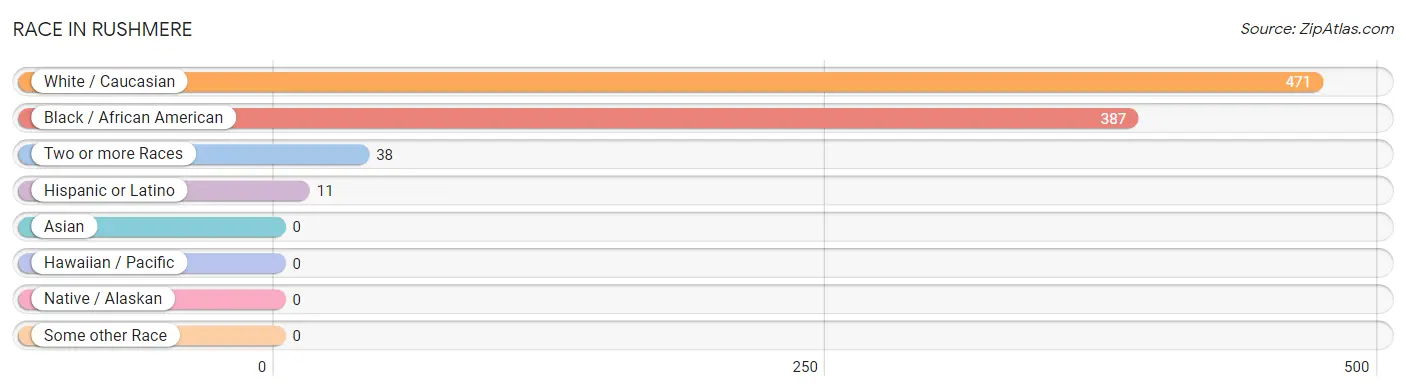
| Race | # Population | % Population |
| Asian | 0 | 0.0% |
| Black / African American | 387 | 43.2% |
| Hawaiian / Pacific | 0 | 0.0% |
| Hispanic or Latino | 11 | 1.2% |
| Native / Alaskan | 0 | 0.0% |
| White / Caucasian | 471 | 52.6% |
| Two or more Races | 38 | 4.2% |
| Some other Race | 0 | 0.0% |
| Total | 896 | 100.0% |
Ancestry in Rushmere
The most populous ancestries reported in Rushmere are Irish (119 | 13.3%), German (116 | 13.0%), English (113 | 12.6%), American (95 | 10.6%), and Scotch-Irish (38 | 4.2%), together accounting for 53.7% of all Rushmere residents.
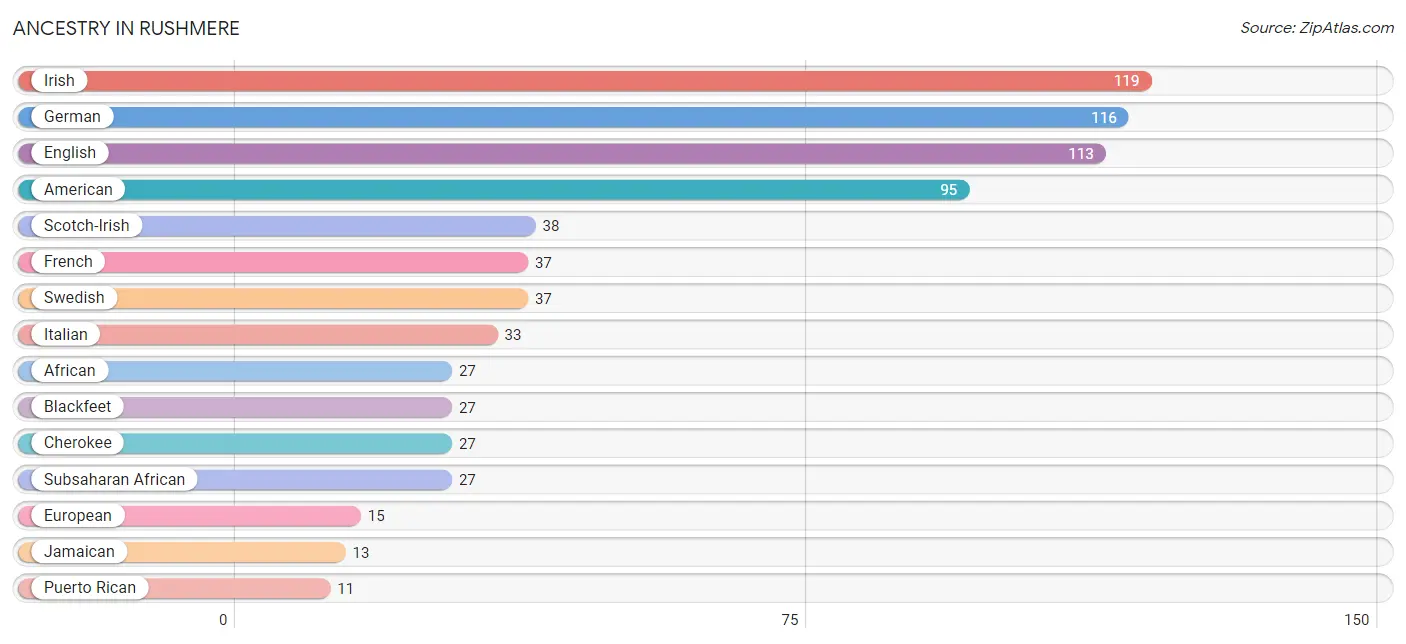
| Ancestry | # Population | % Population |
| African | 27 | 3.0% |
| American | 95 | 10.6% |
| Blackfeet | 27 | 3.0% |
| Cherokee | 27 | 3.0% |
| English | 113 | 12.6% |
| European | 15 | 1.7% |
| French | 37 | 4.1% |
| German | 116 | 13.0% |
| Irish | 119 | 13.3% |
| Italian | 33 | 3.7% |
| Jamaican | 13 | 1.5% |
| Lithuanian | 10 | 1.1% |
| Polish | 9 | 1.0% |
| Puerto Rican | 11 | 1.2% |
| Scotch-Irish | 38 | 4.2% |
| Subsaharan African | 27 | 3.0% |
| Swedish | 37 | 4.1% |
| Welsh | 9 | 1.0% | View All 18 Rows |
Immigrants in Rushmere
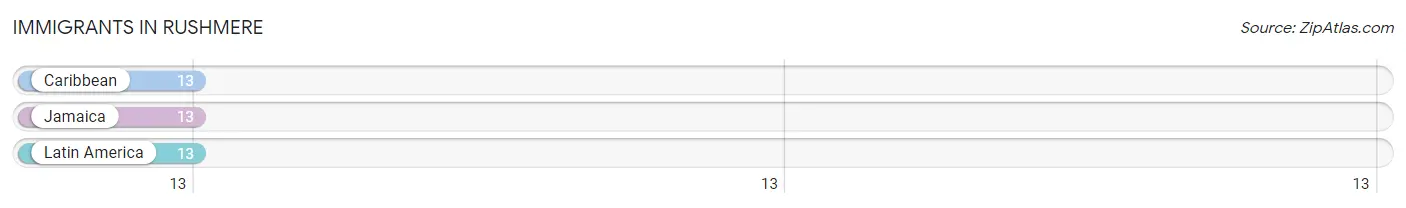
The most numerous immigrant groups reported in Rushmere came from Caribbean (13 | 1.5%), Jamaica (13 | 1.5%), and Latin America (13 | 1.5%), together accounting for 4.4% of all Rushmere residents.
| Immigration Origin | # Population | % Population |
| Caribbean | 13 | 1.5% |
| Jamaica | 13 | 1.5% |
| Latin America | 13 | 1.5% | View All 3 Rows |
Sex and Age in Rushmere
Sex and Age in Rushmere
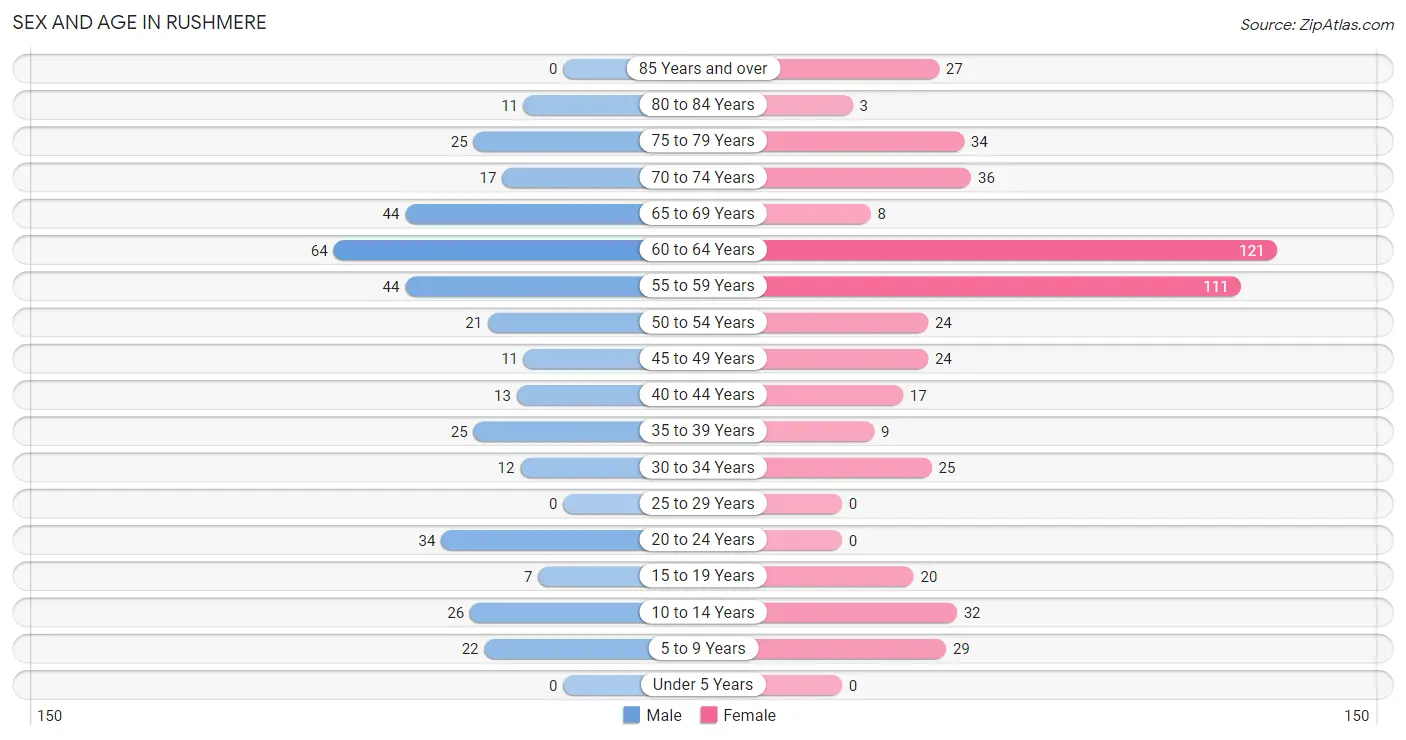
The most populous age groups in Rushmere are 60 to 64 Years (64 | 17.0%) for men and 60 to 64 Years (121 | 23.3%) for women.
| Age Bracket | Male | Female |
| Under 5 Years | 0 (0.0%) | 0 (0.0%) |
| 5 to 9 Years | 22 (5.9%) | 29 (5.6%) |
| 10 to 14 Years | 26 (6.9%) | 32 (6.1%) |
| 15 to 19 Years | 7 (1.9%) | 20 (3.8%) |
| 20 to 24 Years | 34 (9.0%) | 0 (0.0%) |
| 25 to 29 Years | 0 (0.0%) | 0 (0.0%) |
| 30 to 34 Years | 12 (3.2%) | 25 (4.8%) |
| 35 to 39 Years | 25 (6.7%) | 9 (1.7%) |
| 40 to 44 Years | 13 (3.5%) | 17 (3.3%) |
| 45 to 49 Years | 11 (2.9%) | 24 (4.6%) |
| 50 to 54 Years | 21 (5.6%) | 24 (4.6%) |
| 55 to 59 Years | 44 (11.7%) | 111 (21.3%) |
| 60 to 64 Years | 64 (17.0%) | 121 (23.3%) |
| 65 to 69 Years | 44 (11.7%) | 8 (1.5%) |
| 70 to 74 Years | 17 (4.5%) | 36 (6.9%) |
| 75 to 79 Years | 25 (6.7%) | 34 (6.5%) |
| 80 to 84 Years | 11 (2.9%) | 3 (0.6%) |
| 85 Years and over | 0 (0.0%) | 27 (5.2%) |
| Total | 376 (100.0%) | 520 (100.0%) |
Families and Households in Rushmere
Median Family Size in Rushmere
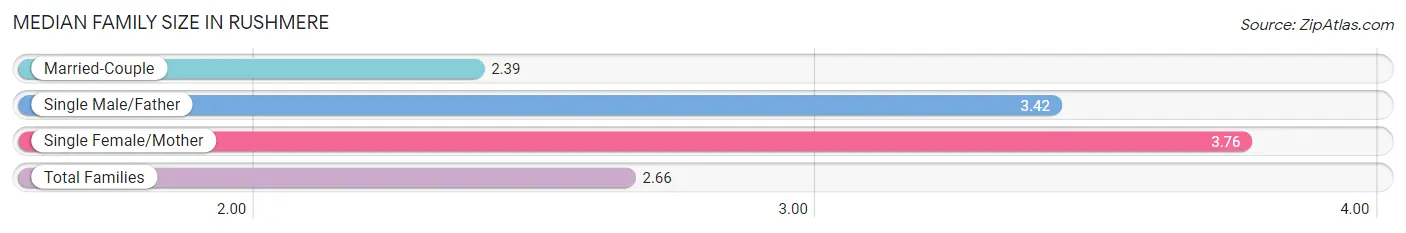
The median family size in Rushmere is 2.66 persons per family, with single female/mother families (41 | 16.0%) accounting for the largest median family size of 3.76 persons per family. On the other hand, married-couple families (203 | 79.3%) represent the smallest median family size with 2.39 persons per family.
| Family Type | # Families | Family Size |
| Married-Couple | 203 (79.3%) | 2.39 |
| Single Male/Father | 12 (4.7%) | 3.42 |
| Single Female/Mother | 41 (16.0%) | 3.76 |
| Total Families | 256 (100.0%) | 2.66 |
Median Household Size in Rushmere
| Household Type | # Households | Household Size |
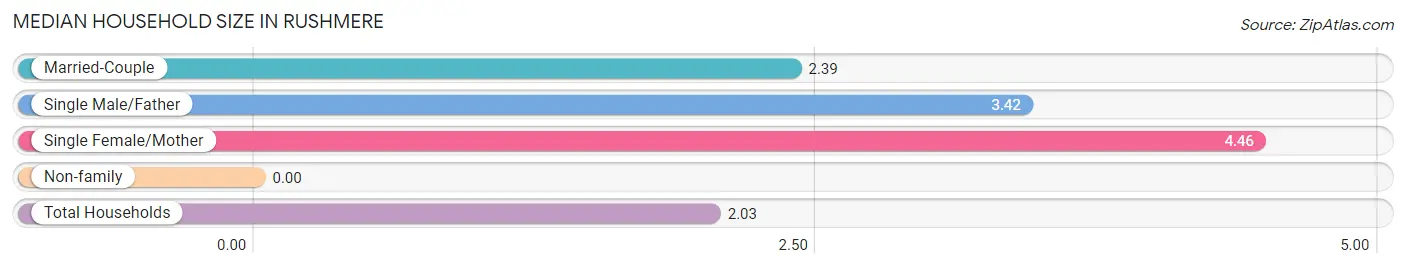
| Married-Couple | 203 (45.9%) | 2.39 |
| Single Male/Father | 12 (2.7%) | 3.42 |
| Single Female/Mother | 41 (9.3%) | 4.46 |
| Non-family | 186 (42.1%) | - |
| Total Households | 442 (100.0%) | 2.03 |
Household Size by Marriage Status in Rushmere
Out of a total of 442 households in Rushmere, 256 (57.9%) are family households, while 186 (42.1%) are nonfamily households. The most numerous type of family households are 2-person households, comprising 171, and the most common type of nonfamily households are 1-person households, comprising 186.
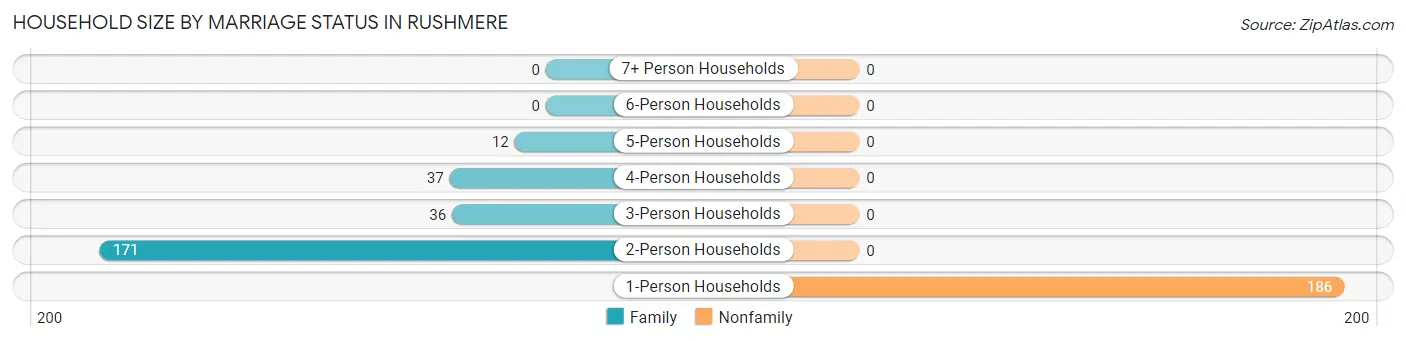
| Household Size | Family Households | Nonfamily Households |
| 1-Person Households | - | 186 (42.1%) |
| 2-Person Households | 171 (38.7%) | 0 (0.0%) |
| 3-Person Households | 36 (8.1%) | 0 (0.0%) |
| 4-Person Households | 37 (8.4%) | 0 (0.0%) |
| 5-Person Households | 12 (2.7%) | 0 (0.0%) |
| 6-Person Households | 0 (0.0%) | 0 (0.0%) |
| 7+ Person Households | 0 (0.0%) | 0 (0.0%) |
| Total | 256 (57.9%) | 186 (42.1%) |
Female Fertility in Rushmere
Fertility by Age in Rushmere
| Age Bracket | Women with Births | Births / 1,000 Women |
| 15 to 19 years | 0 (0.0%) | 0.0 |
| 20 to 34 years | 0 (0.0%) | 0.0 |
| 35 to 50 years | 0 (0.0%) | 0.0 |
| Total | 0 (0.0%) | 0.0 |
Fertility by Age by Marriage Status in Rushmere
| Age Bracket | Married | Unmarried |
| 15 to 19 years | 0 (0.0%) | 0 (0.0%) |
| 20 to 34 years | 0 (0.0%) | 0 (0.0%) |
| 35 to 50 years | 0 (0.0%) | 0 (0.0%) |
| Total | 0 (0.0%) | 0 (0.0%) |
Fertility by Education in Rushmere
| Educational Attainment | Women with Births | Births / 1,000 Women |
| Less than High School | 0 (0.0%) | 0.0 |
| High School Diploma | 0 (0.0%) | 0.0 |
| College or Associate's Degree | 0 (0.0%) | 0.0 |
| Bachelor's Degree | 0 (0.0%) | 0.0 |
| Graduate Degree | 0 (0.0%) | 0.0 |
| Total | 0 (0.0%) | 0.0 |
Fertility by Education by Marriage Status in Rushmere
| Educational Attainment | Married | Unmarried |
| Less than High School | 0 (0.0%) | 0 (0.0%) |
| High School Diploma | 0 (0.0%) | 0 (0.0%) |
| College or Associate's Degree | 0 (0.0%) | 0 (0.0%) |
| Bachelor's Degree | 0 (0.0%) | 0 (0.0%) |
| Graduate Degree | 0 (0.0%) | 0 (0.0%) |
| Total | 0 (0.0%) | 0 (0.0%) |
Employment Characteristics in Rushmere
Employment by Class of Employer in Rushmere
Among the 396 employed individuals in Rushmere, private company employees (282 | 71.2%), federal government employees (39 | 9.9%), and local government employees (27 | 6.8%) make up the most common classes of employment.
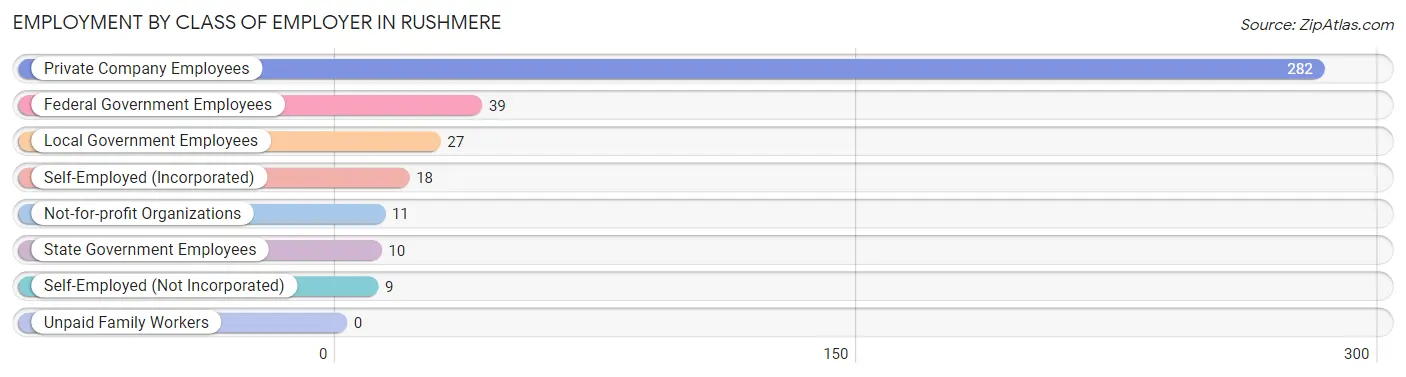
| Employer Class | # Employees | % Employees |
| Private Company Employees | 282 | 71.2% |
| Self-Employed (Incorporated) | 18 | 4.5% |
| Self-Employed (Not Incorporated) | 9 | 2.3% |
| Not-for-profit Organizations | 11 | 2.8% |
| Local Government Employees | 27 | 6.8% |
| State Government Employees | 10 | 2.5% |
| Federal Government Employees | 39 | 9.9% |
| Unpaid Family Workers | 0 | 0.0% |
| Total | 396 | 100.0% |
Employment Status by Age in Rushmere
According to the labor force statistics for Rushmere, out of the total population over 16 years of age (787), 54.0% or 425 individuals are in the labor force, with 6.8% or 29 of them unemployed. The age group with the highest labor force participation rate is 20 to 24 years, with 100.0% or 34 individuals in the labor force. Within the labor force, the 30 to 34 years age range has the highest percentage of unemployed individuals, with 57.1% or 12 of them being unemployed.
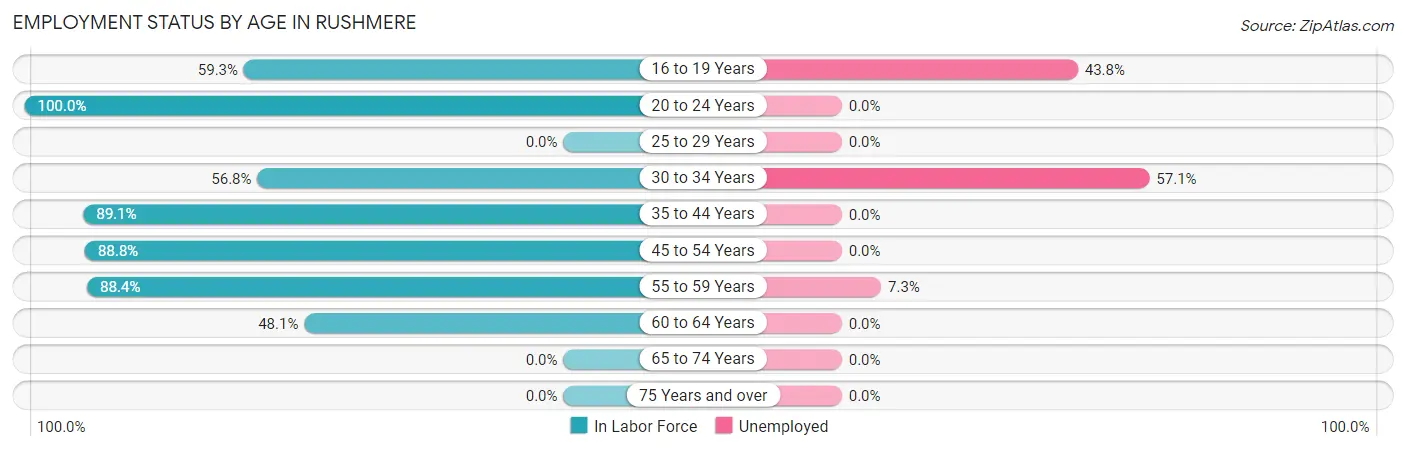
| Age Bracket | In Labor Force | Unemployed |
| 16 to 19 Years | 16 (59.3%) | 7 (43.8%) |
| 20 to 24 Years | 34 (100.0%) | 0 (0.0%) |
| 25 to 29 Years | 0 (0.0%) | 0 (0.0%) |
| 30 to 34 Years | 21 (56.8%) | 12 (57.1%) |
| 35 to 44 Years | 57 (89.1%) | 0 (0.0%) |
| 45 to 54 Years | 71 (88.8%) | 0 (0.0%) |
| 55 to 59 Years | 137 (88.4%) | 10 (7.3%) |
| 60 to 64 Years | 89 (48.1%) | 0 (0.0%) |
| 65 to 74 Years | 0 (0.0%) | 0 (0.0%) |
| 75 Years and over | 0 (0.0%) | 0 (0.0%) |
| Total | 425 (54.0%) | 29 (6.8%) |
Employment Status by Educational Attainment in Rushmere
According to labor force statistics for Rushmere, 72.0% of individuals (375) out of the total population between 25 and 64 years of age (521) are in the labor force, with 5.9% or 22 of them being unemployed. The group with the highest labor force participation rate are those with the educational attainment of less than high school, with 100.0% or 24 individuals in the labor force. Within the labor force, individuals with less than high school education have the highest percentage of unemployment, with 50.0% or 12 of them being unemployed.
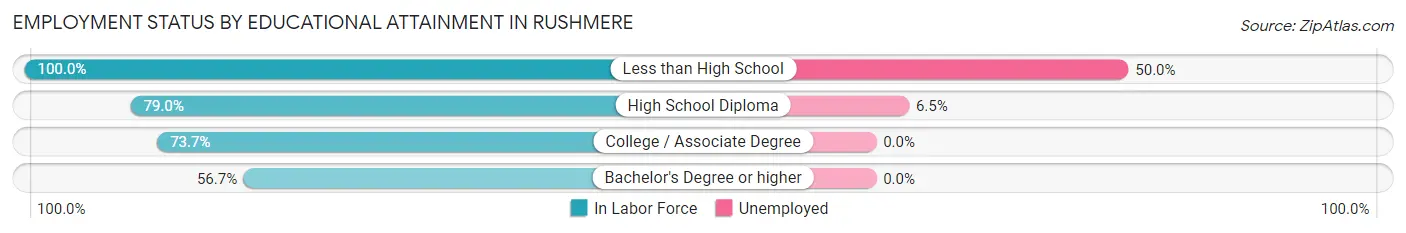
| Educational Attainment | In Labor Force | Unemployed |
| Less than High School | 24 (100.0%) | 12 (50.0%) |
| High School Diploma | 154 (79.0%) | 13 (6.5%) |
| College / Associate Degree | 112 (73.7%) | 0 (0.0%) |
| Bachelor's Degree or higher | 85 (56.7%) | 0 (0.0%) |
| Total | 375 (72.0%) | 31 (5.9%) |
Employment Occupations by Sex in Rushmere
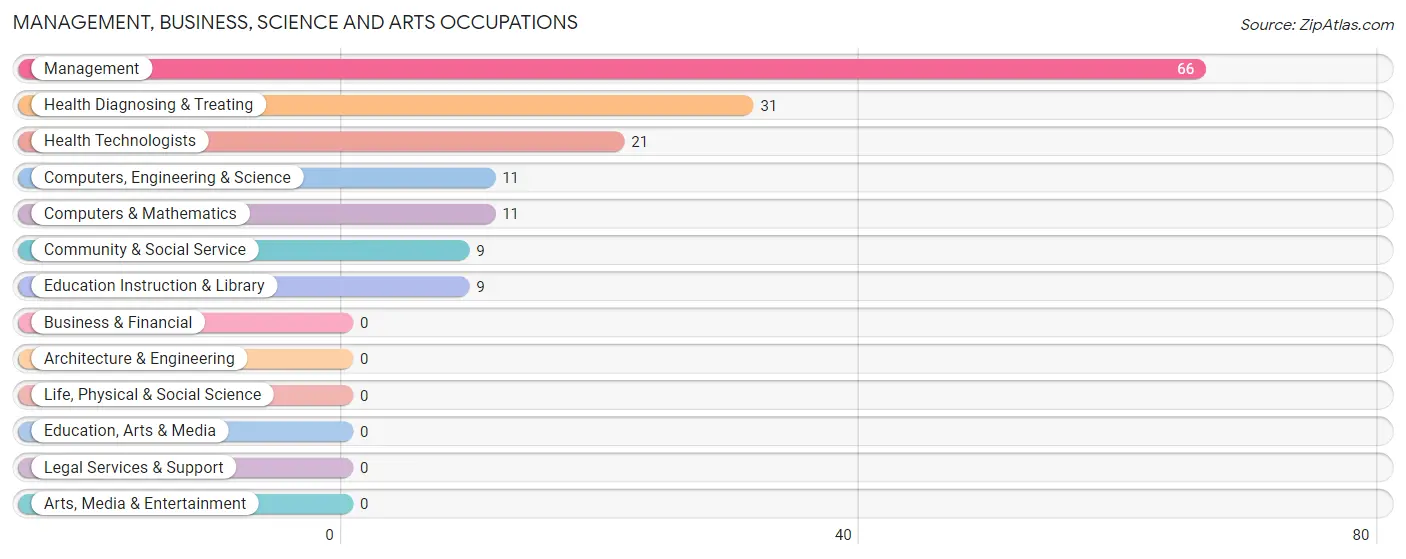
Management, Business, Science and Arts Occupations
The most common Management, Business, Science and Arts occupations in Rushmere are Management (66 | 16.7%), Health Diagnosing & Treating (31 | 7.8%), Health Technologists (21 | 5.3%), Computers, Engineering & Science (11 | 2.8%), and Computers & Mathematics (11 | 2.8%).
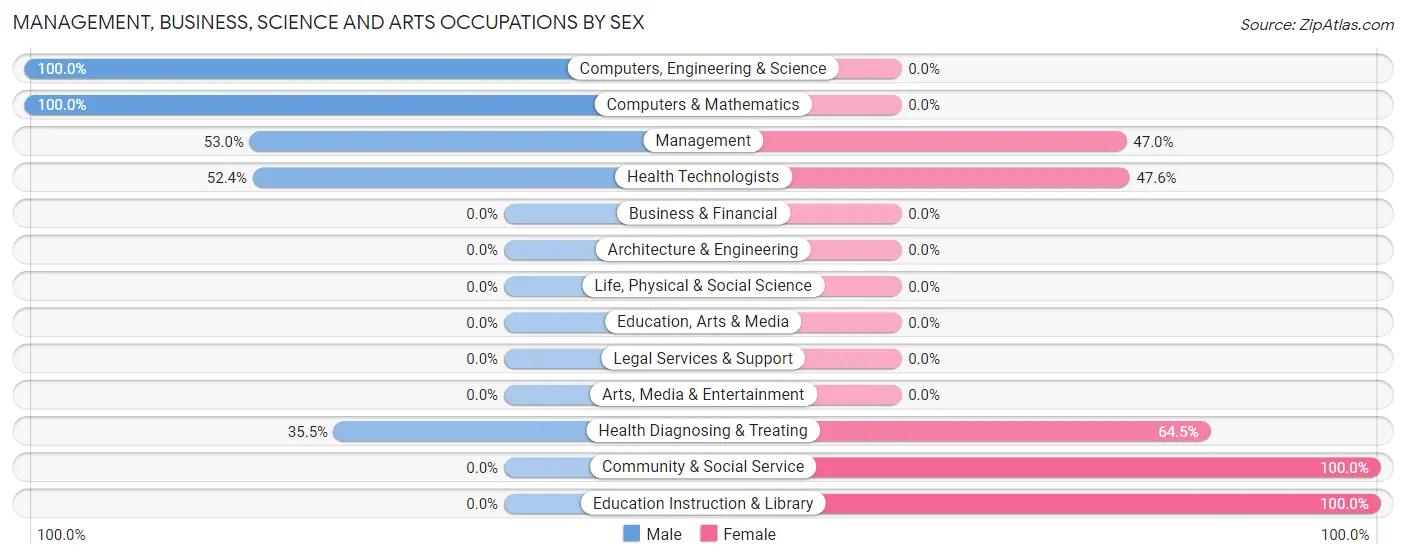
Management, Business, Science and Arts Occupations by Sex
Within the Management, Business, Science and Arts occupations in Rushmere, the most male-oriented occupations are Computers, Engineering & Science (100.0%), Computers & Mathematics (100.0%), and Management (53.0%), while the most female-oriented occupations are Community & Social Service (100.0%), Education Instruction & Library (100.0%), and Health Diagnosing & Treating (64.5%).
| Occupation | Male | Female |
| Management | 35 (53.0%) | 31 (47.0%) |
| Business & Financial | 0 (0.0%) | 0 (0.0%) |
| Computers, Engineering & Science | 11 (100.0%) | 0 (0.0%) |
| Computers & Mathematics | 11 (100.0%) | 0 (0.0%) |
| Architecture & Engineering | 0 (0.0%) | 0 (0.0%) |
| Life, Physical & Social Science | 0 (0.0%) | 0 (0.0%) |
| Community & Social Service | 0 (0.0%) | 9 (100.0%) |
| Education, Arts & Media | 0 (0.0%) | 0 (0.0%) |
| Legal Services & Support | 0 (0.0%) | 0 (0.0%) |
| Education Instruction & Library | 0 (0.0%) | 9 (100.0%) |
| Arts, Media & Entertainment | 0 (0.0%) | 0 (0.0%) |
| Health Diagnosing & Treating | 11 (35.5%) | 20 (64.5%) |
| Health Technologists | 11 (52.4%) | 10 (47.6%) |
| Total (Category) | 57 (48.7%) | 60 (51.3%) |
| Total (Overall) | 192 (48.5%) | 204 (51.5%) |
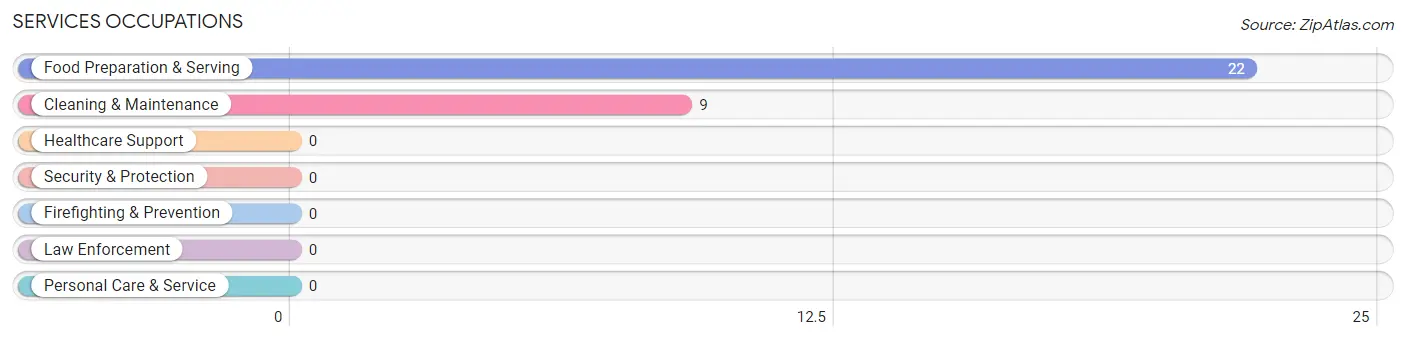
Services Occupations
The most common Services occupations in Rushmere are Food Preparation & Serving (22 | 5.6%), and Cleaning & Maintenance (9 | 2.3%).
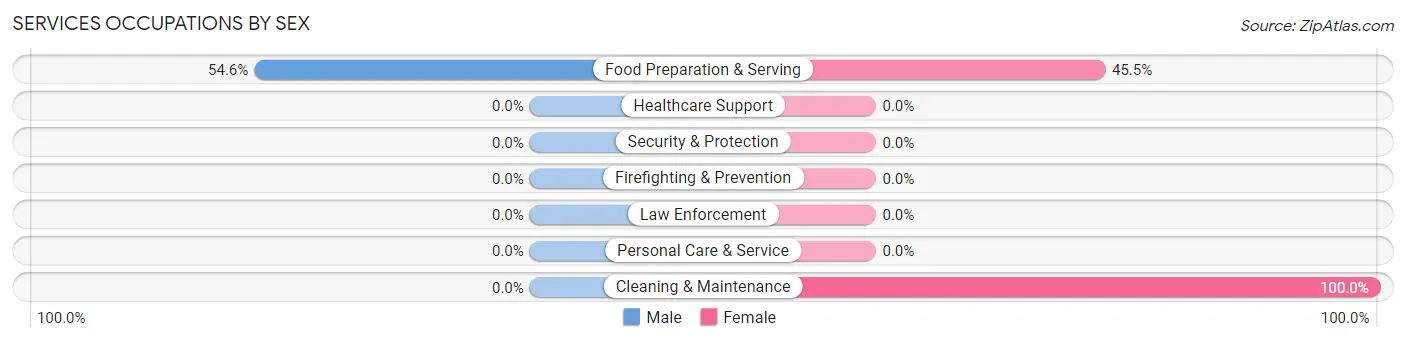
Services Occupations by Sex
| Occupation | Male | Female |
| Healthcare Support | 0 (0.0%) | 0 (0.0%) |
| Security & Protection | 0 (0.0%) | 0 (0.0%) |
| Firefighting & Prevention | 0 (0.0%) | 0 (0.0%) |
| Law Enforcement | 0 (0.0%) | 0 (0.0%) |
| Food Preparation & Serving | 12 (54.5%) | 10 (45.5%) |
| Cleaning & Maintenance | 0 (0.0%) | 9 (100.0%) |
| Personal Care & Service | 0 (0.0%) | 0 (0.0%) |
| Total (Category) | 12 (38.7%) | 19 (61.3%) |
| Total (Overall) | 192 (48.5%) | 204 (51.5%) |
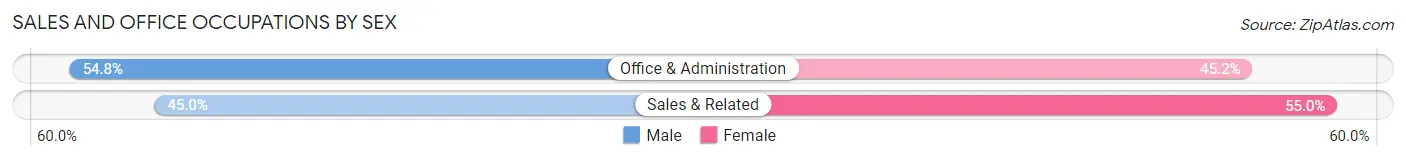
Sales and Office Occupations
The most common Sales and Office occupations in Rushmere are Office & Administration (73 | 18.4%), and Sales & Related (20 | 5.1%).

Sales and Office Occupations by Sex
| Occupation | Male | Female |
| Sales & Related | 9 (45.0%) | 11 (55.0%) |
| Office & Administration | 40 (54.8%) | 33 (45.2%) |
| Total (Category) | 49 (52.7%) | 44 (47.3%) |
| Total (Overall) | 192 (48.5%) | 204 (51.5%) |
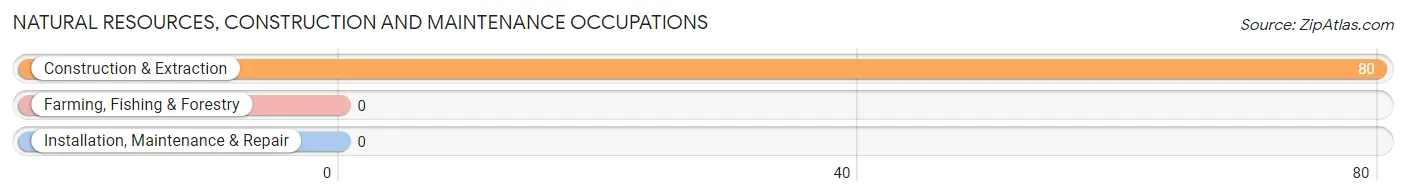
Natural Resources, Construction and Maintenance Occupations
The most common Natural Resources, Construction and Maintenance occupations in Rushmere are , and Construction & Extraction (80 | 20.2%).
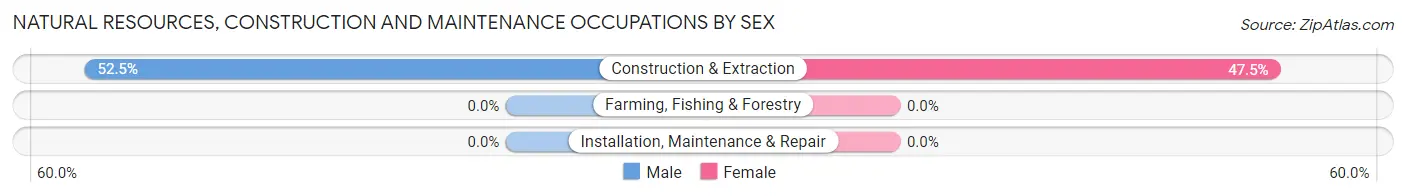
Natural Resources, Construction and Maintenance Occupations by Sex
| Occupation | Male | Female |
| Farming, Fishing & Forestry | 0 (0.0%) | 0 (0.0%) |
| Construction & Extraction | 42 (52.5%) | 38 (47.5%) |
| Installation, Maintenance & Repair | 0 (0.0%) | 0 (0.0%) |
| Total (Category) | 42 (52.5%) | 38 (47.5%) |
| Total (Overall) | 192 (48.5%) | 204 (51.5%) |
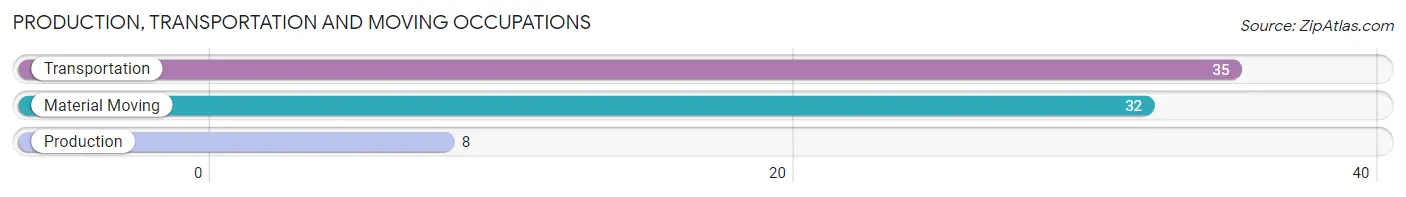
Production, Transportation and Moving Occupations
The most common Production, Transportation and Moving occupations in Rushmere are Transportation (35 | 8.8%), Material Moving (32 | 8.1%), and Production (8 | 2.0%).
Production, Transportation and Moving Occupations by Sex
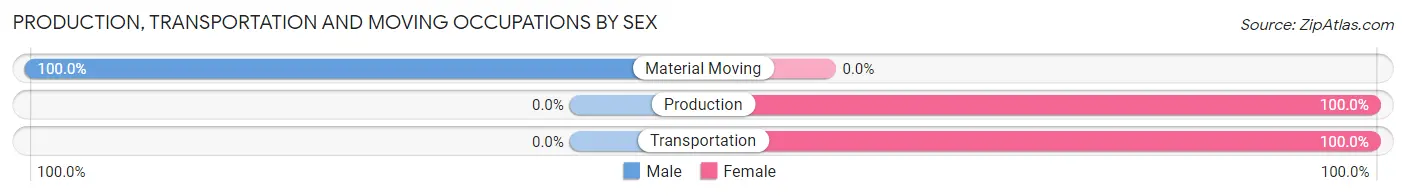
| Occupation | Male | Female |
| Production | 0 (0.0%) | 8 (100.0%) |
| Transportation | 0 (0.0%) | 35 (100.0%) |
| Material Moving | 32 (100.0%) | 0 (0.0%) |
| Total (Category) | 32 (42.7%) | 43 (57.3%) |
| Total (Overall) | 192 (48.5%) | 204 (51.5%) |
Employment Industries by Sex in Rushmere
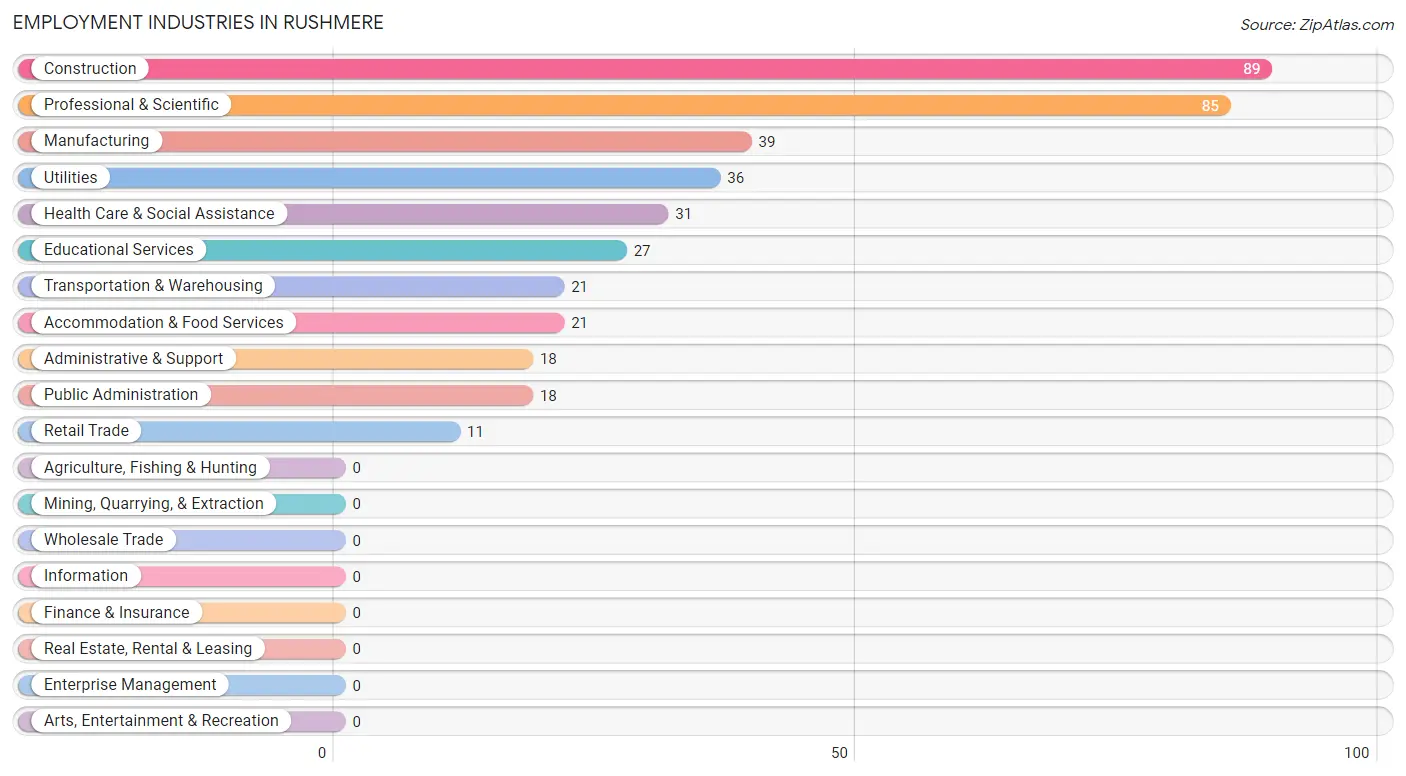
Employment Industries in Rushmere
The major employment industries in Rushmere include Construction (89 | 22.5%), Professional & Scientific (85 | 21.5%), Manufacturing (39 | 9.9%), Utilities (36 | 9.1%), and Health Care & Social Assistance (31 | 7.8%).
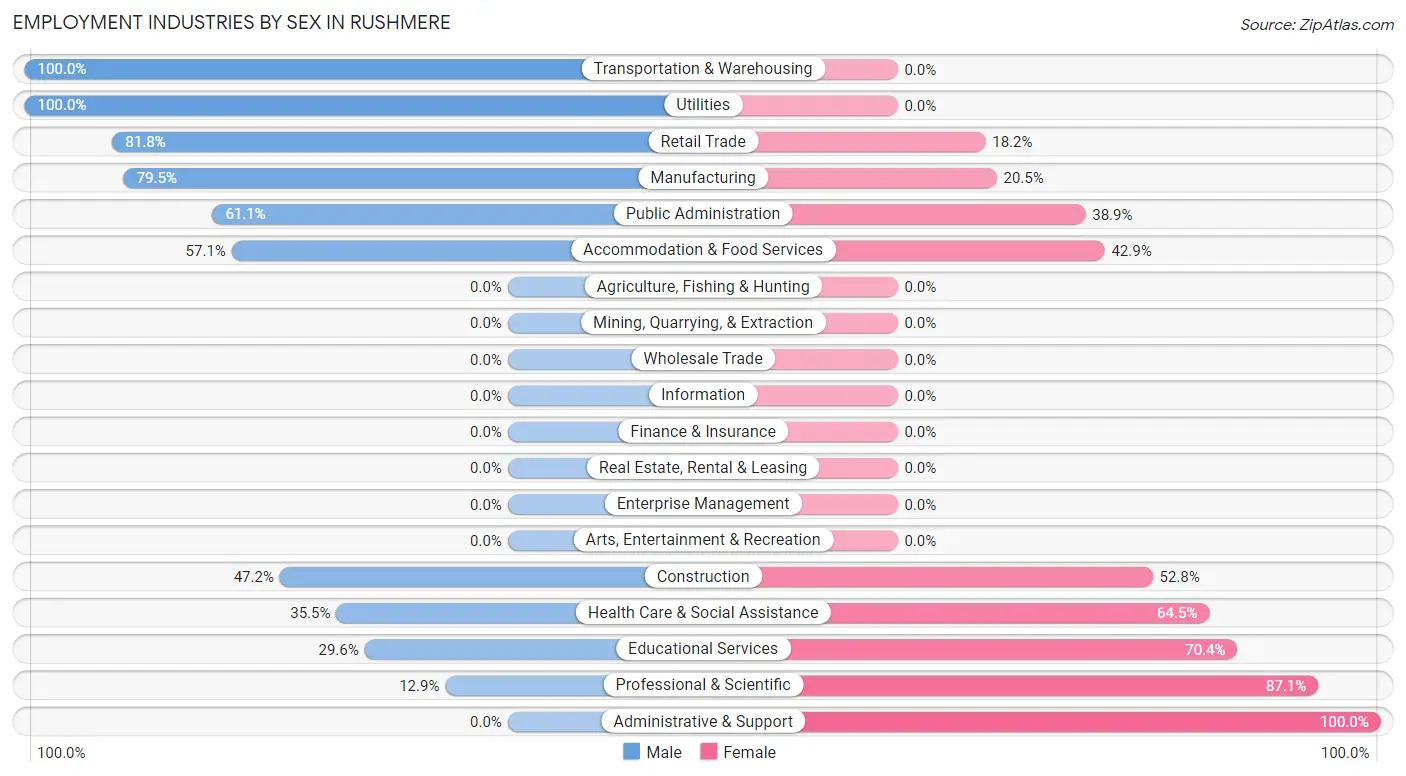
Employment Industries by Sex in Rushmere
The Rushmere industries that see more men than women are Transportation & Warehousing (100.0%), Utilities (100.0%), and Retail Trade (81.8%), whereas the industries that tend to have a higher number of women are Administrative & Support (100.0%), Professional & Scientific (87.1%), and Educational Services (70.4%).
| Industry | Male | Female |
| Agriculture, Fishing & Hunting | 0 (0.0%) | 0 (0.0%) |
| Mining, Quarrying, & Extraction | 0 (0.0%) | 0 (0.0%) |
| Construction | 42 (47.2%) | 47 (52.8%) |
| Manufacturing | 31 (79.5%) | 8 (20.5%) |
| Wholesale Trade | 0 (0.0%) | 0 (0.0%) |
| Retail Trade | 9 (81.8%) | 2 (18.2%) |
| Transportation & Warehousing | 21 (100.0%) | 0 (0.0%) |
| Utilities | 36 (100.0%) | 0 (0.0%) |
| Information | 0 (0.0%) | 0 (0.0%) |
| Finance & Insurance | 0 (0.0%) | 0 (0.0%) |
| Real Estate, Rental & Leasing | 0 (0.0%) | 0 (0.0%) |
| Professional & Scientific | 11 (12.9%) | 74 (87.1%) |
| Enterprise Management | 0 (0.0%) | 0 (0.0%) |
| Administrative & Support | 0 (0.0%) | 18 (100.0%) |
| Educational Services | 8 (29.6%) | 19 (70.4%) |
| Health Care & Social Assistance | 11 (35.5%) | 20 (64.5%) |
| Arts, Entertainment & Recreation | 0 (0.0%) | 0 (0.0%) |
| Accommodation & Food Services | 12 (57.1%) | 9 (42.9%) |
| Public Administration | 11 (61.1%) | 7 (38.9%) |
| Total | 192 (48.5%) | 204 (51.5%) |
Education in Rushmere
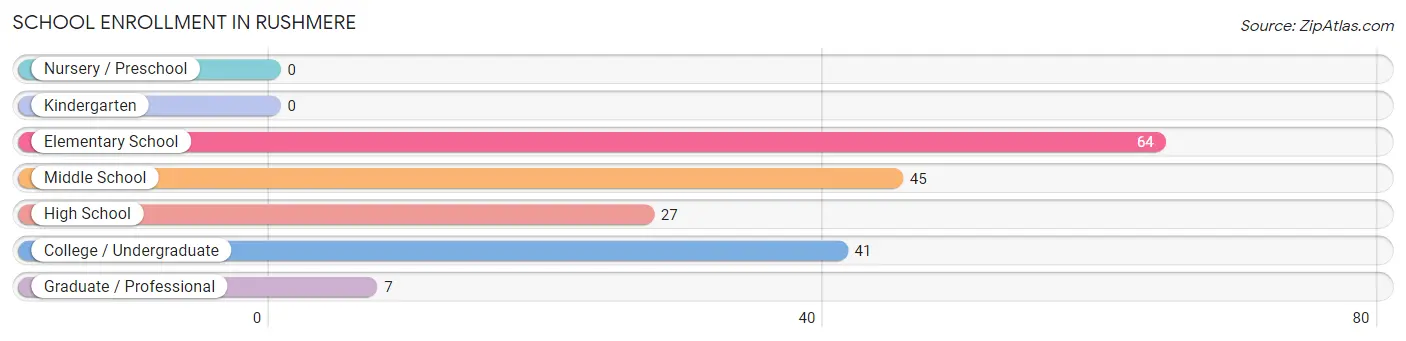
School Enrollment in Rushmere
The most common levels of schooling among the 184 students in Rushmere are elementary school (64 | 34.8%), middle school (45 | 24.5%), and college / undergraduate (41 | 22.3%).
| School Level | # Students | % Students |
| Nursery / Preschool | 0 | 0.0% |
| Kindergarten | 0 | 0.0% |
| Elementary School | 64 | 34.8% |
| Middle School | 45 | 24.5% |
| High School | 27 | 14.7% |
| College / Undergraduate | 41 | 22.3% |
| Graduate / Professional | 7 | 3.8% |
| Total | 184 | 100.0% |
School Enrollment by Age by Funding Source in Rushmere
Out of a total of 184 students who are enrolled in schools in Rushmere, 32 (17.4%) attend a private institution, while the remaining 152 (82.6%) are enrolled in public schools. The age group of 35 years and over has the highest likelihood of being enrolled in private schools, with 21 (43.8% in the age bracket) enrolled. Conversely, the age group of 5 to 9 year old has the lowest likelihood of being enrolled in a private school, with 51 (100.0% in the age bracket) attending a public institution.
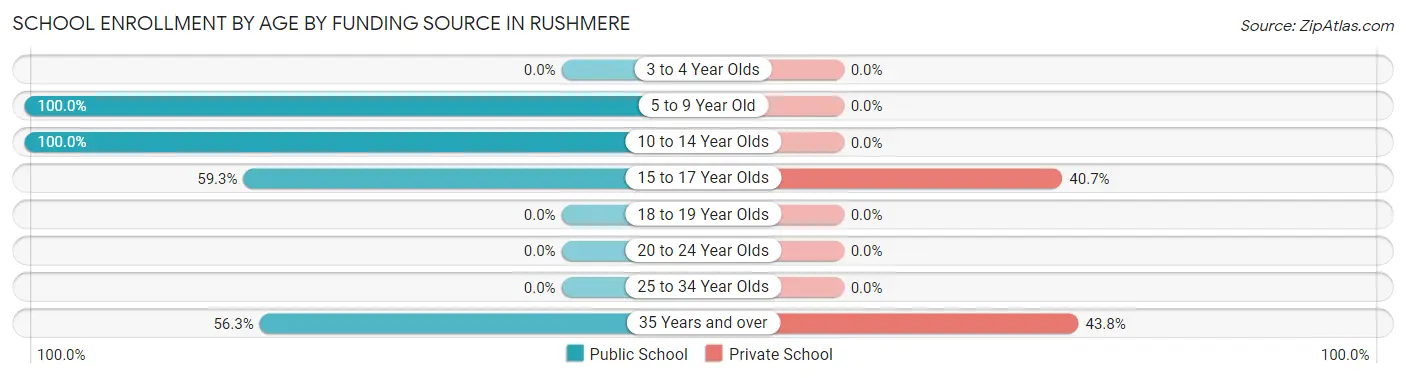
| Age Bracket | Public School | Private School |
| 3 to 4 Year Olds | 0 (0.0%) | 0 (0.0%) |
| 5 to 9 Year Old | 51 (100.0%) | 0 (0.0%) |
| 10 to 14 Year Olds | 58 (100.0%) | 0 (0.0%) |
| 15 to 17 Year Olds | 16 (59.3%) | 11 (40.7%) |
| 18 to 19 Year Olds | 0 (0.0%) | 0 (0.0%) |
| 20 to 24 Year Olds | 0 (0.0%) | 0 (0.0%) |
| 25 to 34 Year Olds | 0 (0.0%) | 0 (0.0%) |
| 35 Years and over | 27 (56.2%) | 21 (43.8%) |
| Total | 152 (82.6%) | 32 (17.4%) |
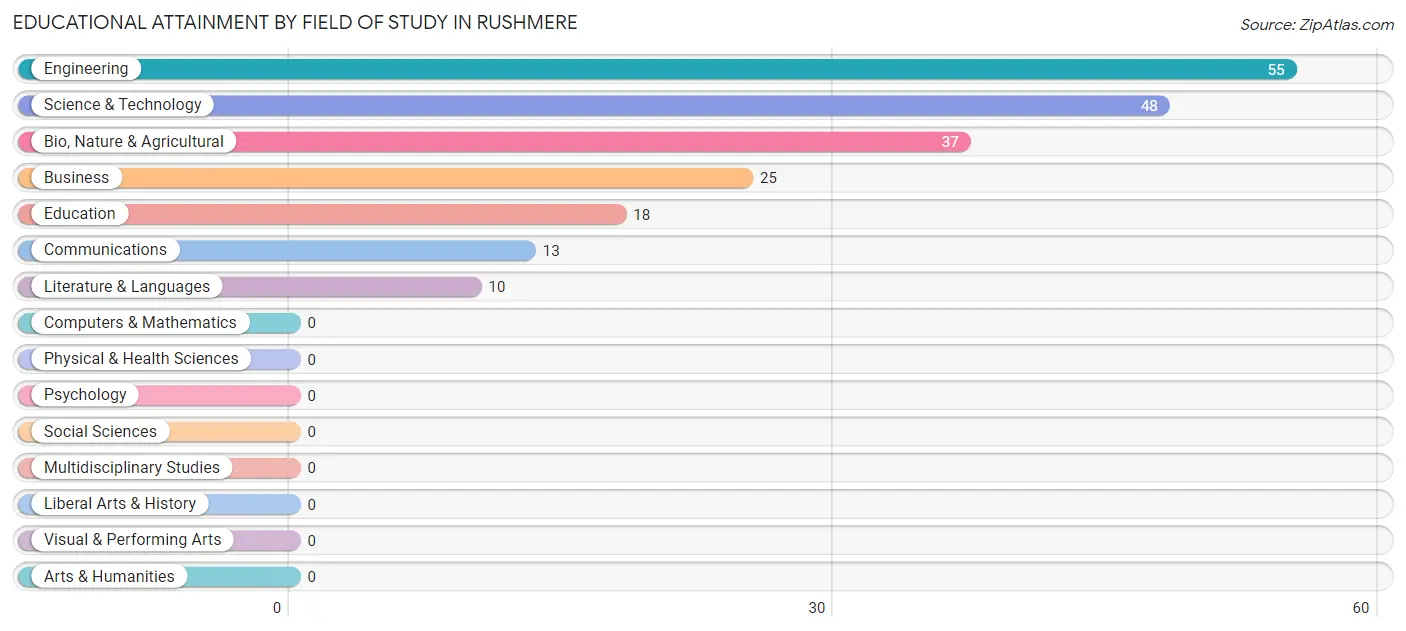
Educational Attainment by Field of Study in Rushmere
Engineering (55 | 26.7%), science & technology (48 | 23.3%), bio, nature & agricultural (37 | 18.0%), business (25 | 12.1%), and education (18 | 8.7%) are the most common fields of study among 206 individuals in Rushmere who have obtained a bachelor's degree or higher.
| Field of Study | # Graduates | % Graduates |
| Computers & Mathematics | 0 | 0.0% |
| Bio, Nature & Agricultural | 37 | 18.0% |
| Physical & Health Sciences | 0 | 0.0% |
| Psychology | 0 | 0.0% |
| Social Sciences | 0 | 0.0% |
| Engineering | 55 | 26.7% |
| Multidisciplinary Studies | 0 | 0.0% |
| Science & Technology | 48 | 23.3% |
| Business | 25 | 12.1% |
| Education | 18 | 8.7% |
| Literature & Languages | 10 | 4.9% |
| Liberal Arts & History | 0 | 0.0% |
| Visual & Performing Arts | 0 | 0.0% |
| Communications | 13 | 6.3% |
| Arts & Humanities | 0 | 0.0% |
| Total | 206 | 100.0% |
Transportation & Commute in Rushmere
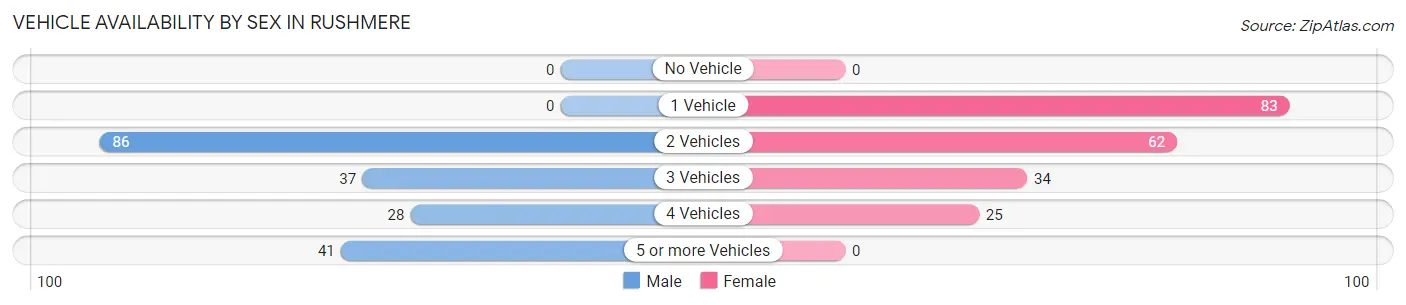
Vehicle Availability by Sex in Rushmere
The most prevalent vehicle ownership categories in Rushmere are males with 2 vehicles (86, accounting for 44.8%) and females with 2 vehicles (62, making up 42.2%).
| Vehicles Available | Male | Female |
| No Vehicle | 0 (0.0%) | 0 (0.0%) |
| 1 Vehicle | 0 (0.0%) | 83 (40.7%) |
| 2 Vehicles | 86 (44.8%) | 62 (30.4%) |
| 3 Vehicles | 37 (19.3%) | 34 (16.7%) |
| 4 Vehicles | 28 (14.6%) | 25 (12.2%) |
| 5 or more Vehicles | 41 (21.3%) | 0 (0.0%) |
| Total | 192 (100.0%) | 204 (100.0%) |
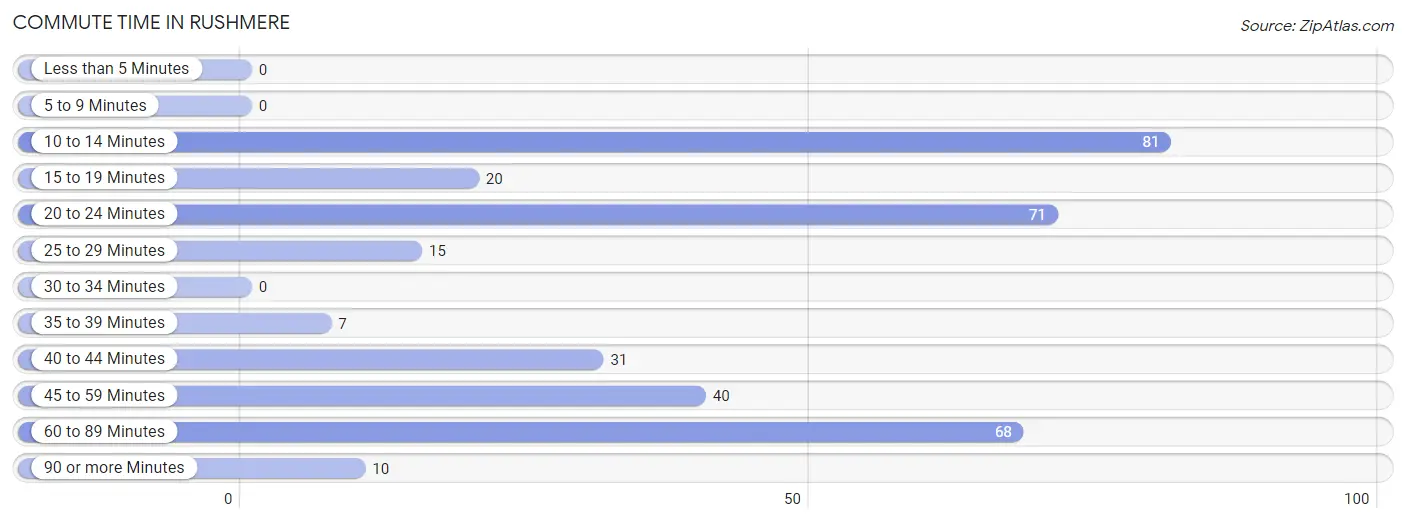
Commute Time in Rushmere
The most frequently occuring commute durations in Rushmere are 10 to 14 minutes (81 commuters, 23.6%), 20 to 24 minutes (71 commuters, 20.7%), and 60 to 89 minutes (68 commuters, 19.8%).
| Commute Time | # Commuters | % Commuters |
| Less than 5 Minutes | 0 | 0.0% |
| 5 to 9 Minutes | 0 | 0.0% |
| 10 to 14 Minutes | 81 | 23.6% |
| 15 to 19 Minutes | 20 | 5.8% |
| 20 to 24 Minutes | 71 | 20.7% |
| 25 to 29 Minutes | 15 | 4.4% |
| 30 to 34 Minutes | 0 | 0.0% |
| 35 to 39 Minutes | 7 | 2.0% |
| 40 to 44 Minutes | 31 | 9.0% |
| 45 to 59 Minutes | 40 | 11.7% |
| 60 to 89 Minutes | 68 | 19.8% |
| 90 or more Minutes | 10 | 2.9% |
Commute Time by Sex in Rushmere
The most common commute times in Rushmere are 60 to 89 minutes (59 commuters, 30.7%) for males and 10 to 14 minutes (56 commuters, 37.1%) for females.
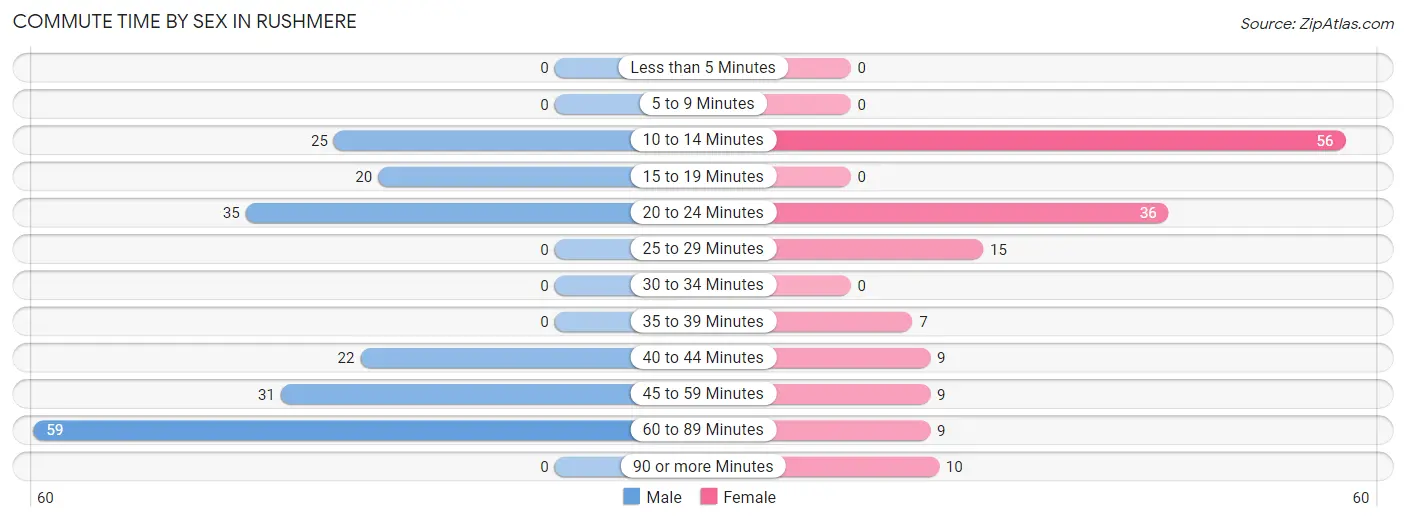
| Commute Time | Male | Female |
| Less than 5 Minutes | 0 (0.0%) | 0 (0.0%) |
| 5 to 9 Minutes | 0 (0.0%) | 0 (0.0%) |
| 10 to 14 Minutes | 25 (13.0%) | 56 (37.1%) |
| 15 to 19 Minutes | 20 (10.4%) | 0 (0.0%) |
| 20 to 24 Minutes | 35 (18.2%) | 36 (23.8%) |
| 25 to 29 Minutes | 0 (0.0%) | 15 (9.9%) |
| 30 to 34 Minutes | 0 (0.0%) | 0 (0.0%) |
| 35 to 39 Minutes | 0 (0.0%) | 7 (4.6%) |
| 40 to 44 Minutes | 22 (11.5%) | 9 (6.0%) |
| 45 to 59 Minutes | 31 (16.2%) | 9 (6.0%) |
| 60 to 89 Minutes | 59 (30.7%) | 9 (6.0%) |
| 90 or more Minutes | 0 (0.0%) | 10 (6.6%) |
Time of Departure to Work by Sex in Rushmere
The most frequent times of departure to work in Rushmere are 6:00 AM to 6:29 AM (46, 24.0%) for males and 4:00 PM to 11:59 PM (48, 31.8%) for females.
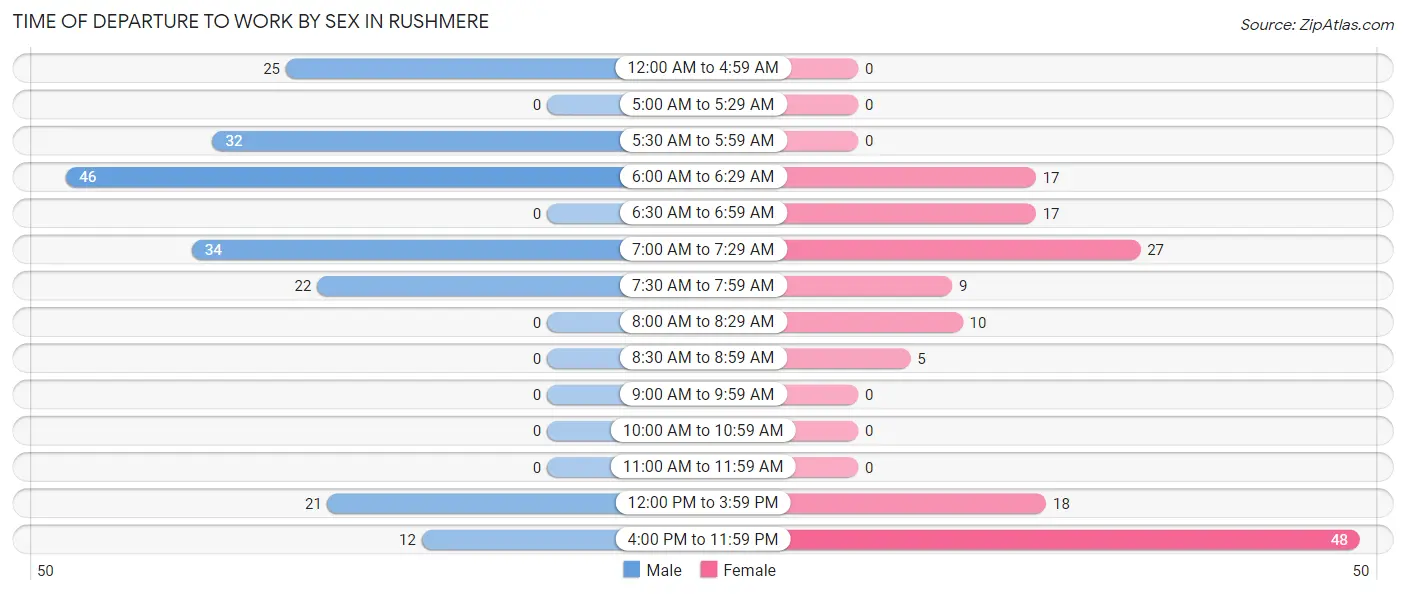
| Time of Departure | Male | Female |
| 12:00 AM to 4:59 AM | 25 (13.0%) | 0 (0.0%) |
| 5:00 AM to 5:29 AM | 0 (0.0%) | 0 (0.0%) |
| 5:30 AM to 5:59 AM | 32 (16.7%) | 0 (0.0%) |
| 6:00 AM to 6:29 AM | 46 (24.0%) | 17 (11.3%) |
| 6:30 AM to 6:59 AM | 0 (0.0%) | 17 (11.3%) |
| 7:00 AM to 7:29 AM | 34 (17.7%) | 27 (17.9%) |
| 7:30 AM to 7:59 AM | 22 (11.5%) | 9 (6.0%) |
| 8:00 AM to 8:29 AM | 0 (0.0%) | 10 (6.6%) |
| 8:30 AM to 8:59 AM | 0 (0.0%) | 5 (3.3%) |
| 9:00 AM to 9:59 AM | 0 (0.0%) | 0 (0.0%) |
| 10:00 AM to 10:59 AM | 0 (0.0%) | 0 (0.0%) |
| 11:00 AM to 11:59 AM | 0 (0.0%) | 0 (0.0%) |
| 12:00 PM to 3:59 PM | 21 (10.9%) | 18 (11.9%) |
| 4:00 PM to 11:59 PM | 12 (6.2%) | 48 (31.8%) |
| Total | 192 (100.0%) | 151 (100.0%) |
Housing Occupancy in Rushmere
Occupancy by Ownership in Rushmere
Of the total 442 dwellings in Rushmere, owner-occupied units account for 332 (75.1%), while renter-occupied units make up 110 (24.9%).
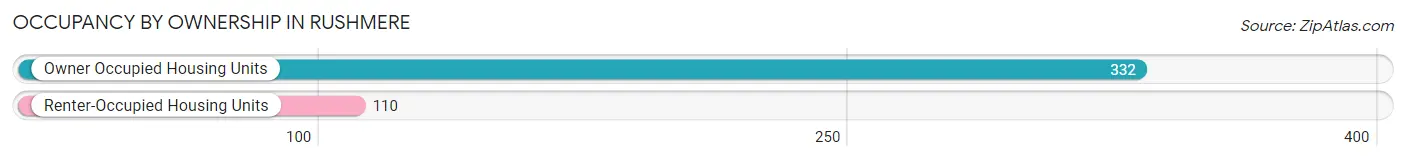
| Occupancy | # Housing Units | % Housing Units |
| Owner Occupied Housing Units | 332 | 75.1% |
| Renter-Occupied Housing Units | 110 | 24.9% |
| Total Occupied Housing Units | 442 | 100.0% |
Occupancy by Household Size in Rushmere
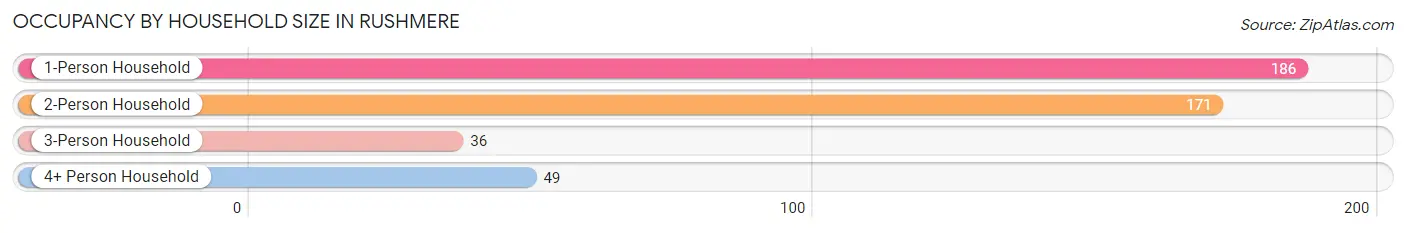
| Household Size | # Housing Units | % Housing Units |
| 1-Person Household | 186 | 42.1% |
| 2-Person Household | 171 | 38.7% |
| 3-Person Household | 36 | 8.1% |
| 4+ Person Household | 49 | 11.1% |
| Total Housing Units | 442 | 100.0% |
Occupancy by Ownership by Household Size in Rushmere
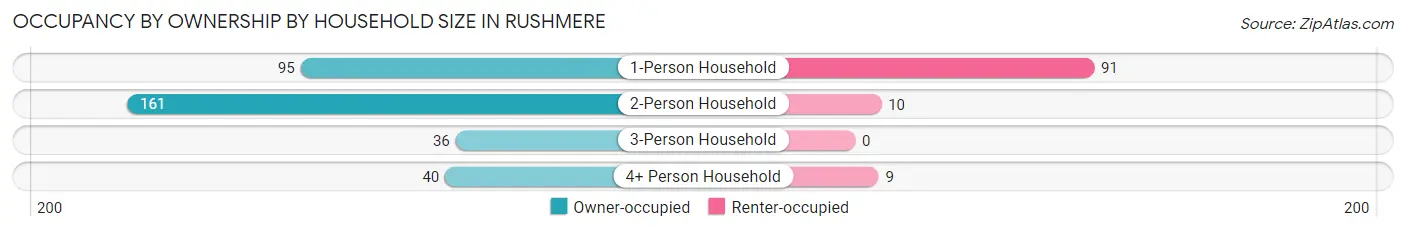
| Household Size | Owner-occupied | Renter-occupied |
| 1-Person Household | 95 (51.1%) | 91 (48.9%) |
| 2-Person Household | 161 (94.2%) | 10 (5.9%) |
| 3-Person Household | 36 (100.0%) | 0 (0.0%) |
| 4+ Person Household | 40 (81.6%) | 9 (18.4%) |
| Total Housing Units | 332 (75.1%) | 110 (24.9%) |
Occupancy by Educational Attainment in Rushmere
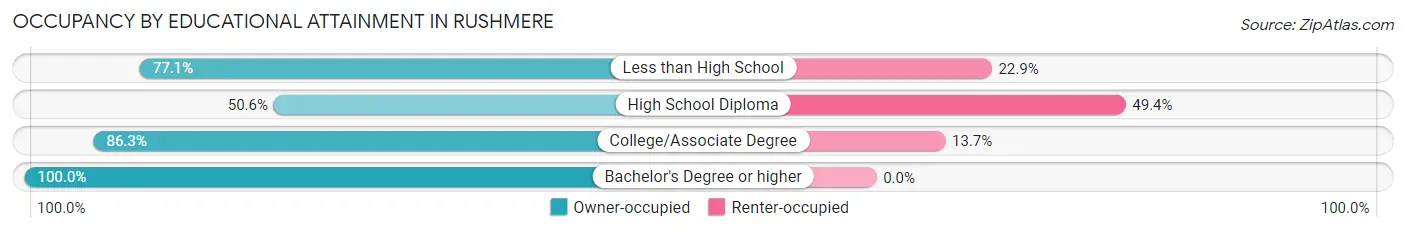
| Household Size | Owner-occupied | Renter-occupied |
| Less than High School | 27 (77.1%) | 8 (22.9%) |
| High School Diploma | 85 (50.6%) | 83 (49.4%) |
| College/Associate Degree | 120 (86.3%) | 19 (13.7%) |
| Bachelor's Degree or higher | 100 (100.0%) | 0 (0.0%) |
Occupancy by Age of Householder in Rushmere
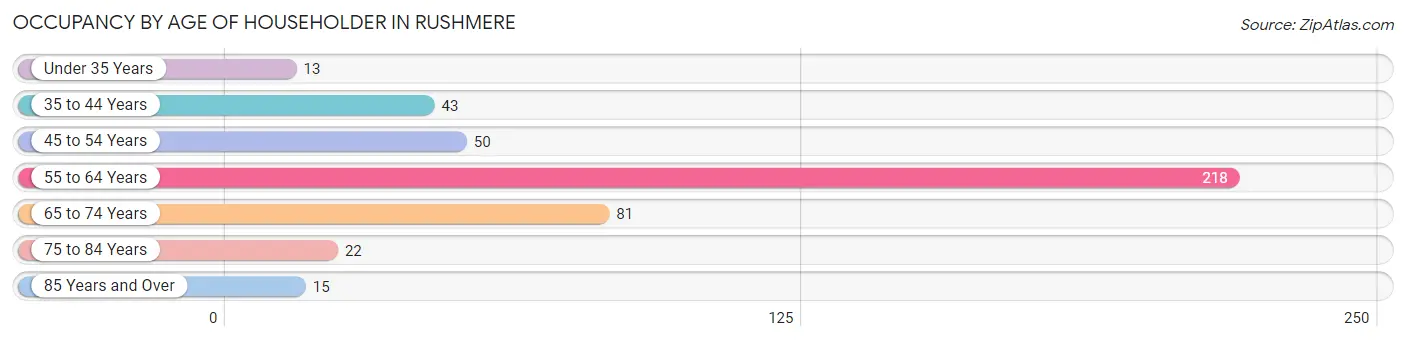
| Age Bracket | # Households | % Households |
| Under 35 Years | 13 | 2.9% |
| 35 to 44 Years | 43 | 9.7% |
| 45 to 54 Years | 50 | 11.3% |
| 55 to 64 Years | 218 | 49.3% |
| 65 to 74 Years | 81 | 18.3% |
| 75 to 84 Years | 22 | 5.0% |
| 85 Years and Over | 15 | 3.4% |
| Total | 442 | 100.0% |
Housing Finances in Rushmere
Median Income by Occupancy in Rushmere
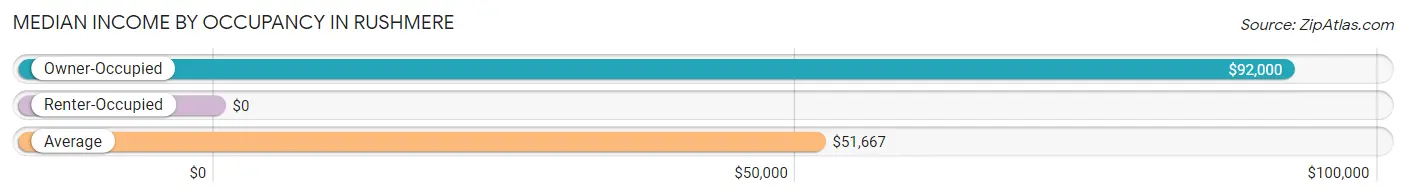
| Occupancy Type | # Households | Median Income |
| Owner-Occupied | 332 (75.1%) | $92,000 |
| Renter-Occupied | 110 (24.9%) | $0 |
| Average | 442 (100.0%) | $51,667 |
Occupancy by Householder Income Bracket in Rushmere
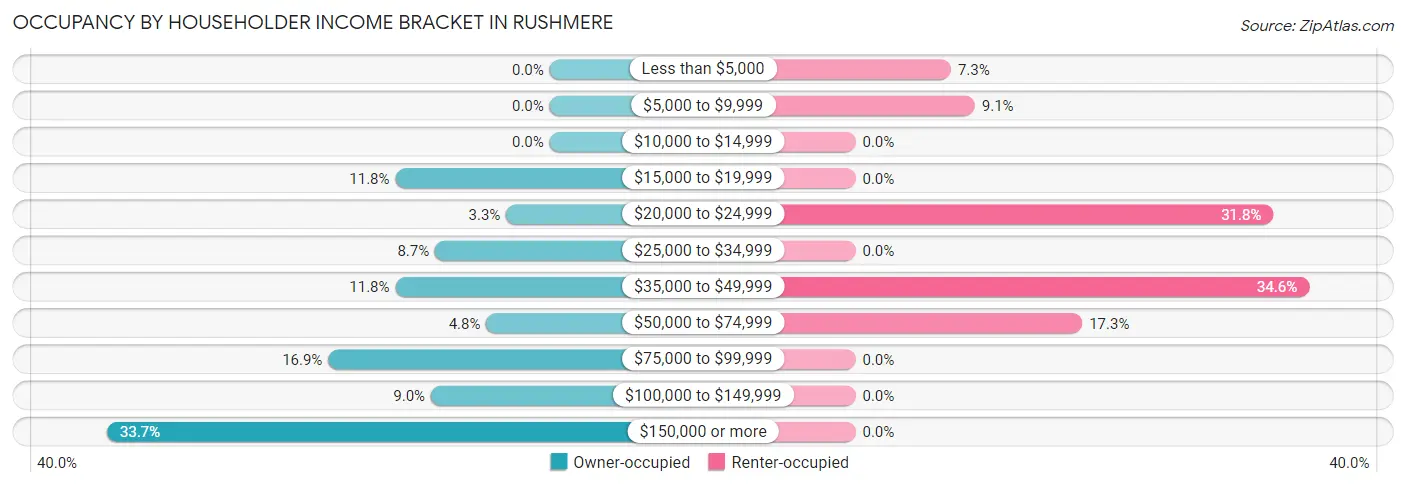
| Income Bracket | Owner-occupied | Renter-occupied |
| Less than $5,000 | 0 (0.0%) | 8 (7.3%) |
| $5,000 to $9,999 | 0 (0.0%) | 10 (9.1%) |
| $10,000 to $14,999 | 0 (0.0%) | 0 (0.0%) |
| $15,000 to $19,999 | 39 (11.7%) | 0 (0.0%) |
| $20,000 to $24,999 | 11 (3.3%) | 35 (31.8%) |
| $25,000 to $34,999 | 29 (8.7%) | 0 (0.0%) |
| $35,000 to $49,999 | 39 (11.7%) | 38 (34.5%) |
| $50,000 to $74,999 | 16 (4.8%) | 19 (17.3%) |
| $75,000 to $99,999 | 56 (16.9%) | 0 (0.0%) |
| $100,000 to $149,999 | 30 (9.0%) | 0 (0.0%) |
| $150,000 or more | 112 (33.7%) | 0 (0.0%) |
| Total | 332 (100.0%) | 110 (100.0%) |
Monthly Housing Cost Tiers in Rushmere
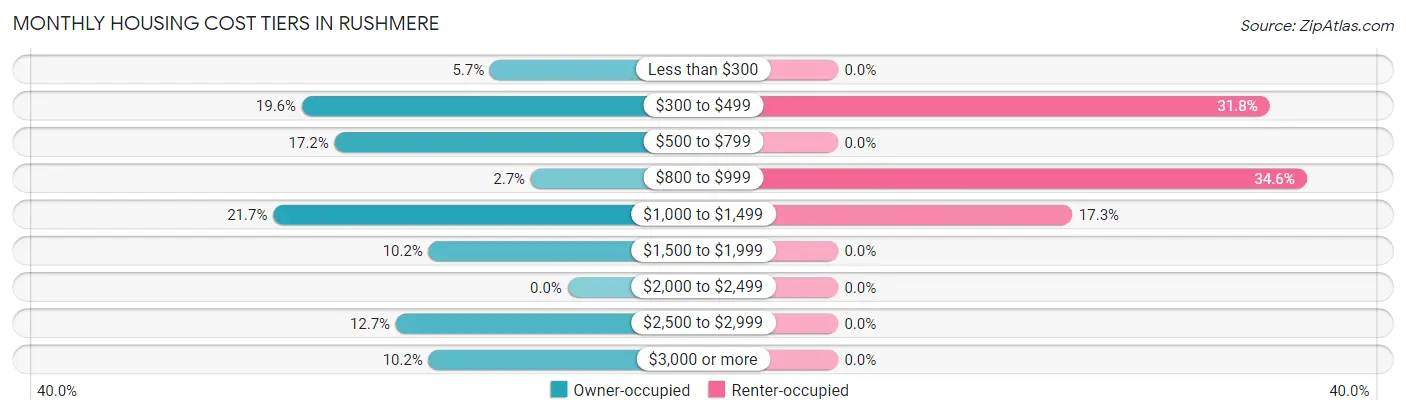
| Monthly Cost | Owner-occupied | Renter-occupied |
| Less than $300 | 19 (5.7%) | 0 (0.0%) |
| $300 to $499 | 65 (19.6%) | 35 (31.8%) |
| $500 to $799 | 57 (17.2%) | 0 (0.0%) |
| $800 to $999 | 9 (2.7%) | 38 (34.5%) |
| $1,000 to $1,499 | 72 (21.7%) | 19 (17.3%) |
| $1,500 to $1,999 | 34 (10.2%) | 0 (0.0%) |
| $2,000 to $2,499 | 0 (0.0%) | 0 (0.0%) |
| $2,500 to $2,999 | 42 (12.7%) | 0 (0.0%) |
| $3,000 or more | 34 (10.2%) | 0 (0.0%) |
| Total | 332 (100.0%) | 110 (100.0%) |
Physical Housing Characteristics in Rushmere
Housing Structures in Rushmere
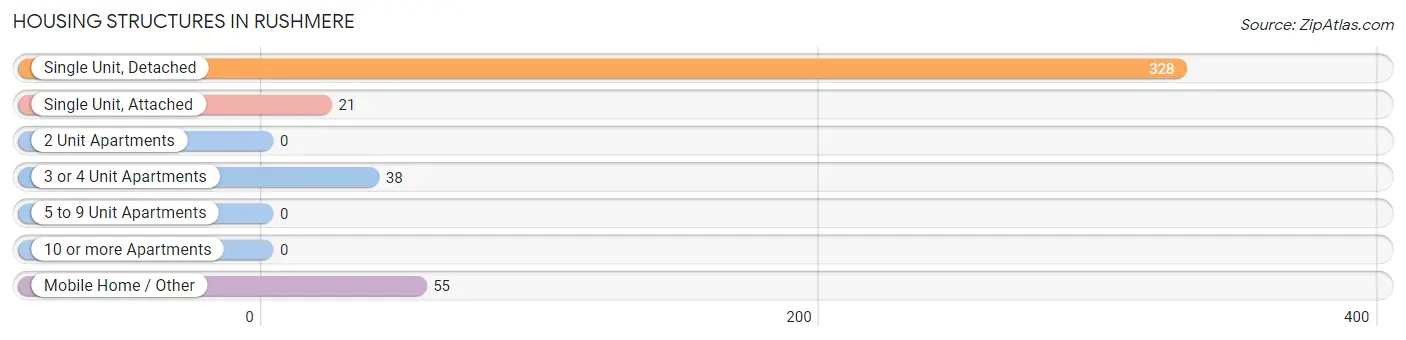
| Structure Type | # Housing Units | % Housing Units |
| Single Unit, Detached | 328 | 74.2% |
| Single Unit, Attached | 21 | 4.8% |
| 2 Unit Apartments | 0 | 0.0% |
| 3 or 4 Unit Apartments | 38 | 8.6% |
| 5 to 9 Unit Apartments | 0 | 0.0% |
| 10 or more Apartments | 0 | 0.0% |
| Mobile Home / Other | 55 | 12.4% |
| Total | 442 | 100.0% |
Housing Structures by Occupancy in Rushmere
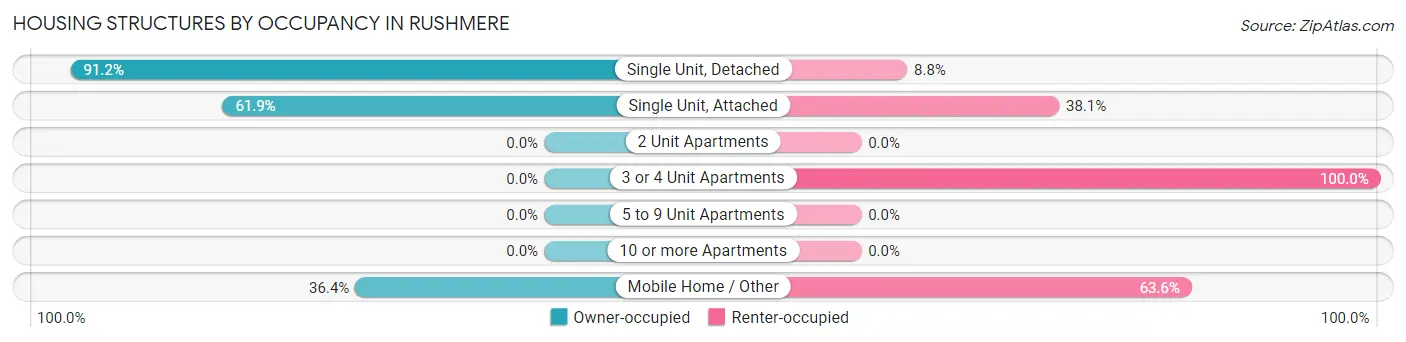
| Structure Type | Owner-occupied | Renter-occupied |
| Single Unit, Detached | 299 (91.2%) | 29 (8.8%) |
| Single Unit, Attached | 13 (61.9%) | 8 (38.1%) |
| 2 Unit Apartments | 0 (0.0%) | 0 (0.0%) |
| 3 or 4 Unit Apartments | 0 (0.0%) | 38 (100.0%) |
| 5 to 9 Unit Apartments | 0 (0.0%) | 0 (0.0%) |
| 10 or more Apartments | 0 (0.0%) | 0 (0.0%) |
| Mobile Home / Other | 20 (36.4%) | 35 (63.6%) |
| Total | 332 (75.1%) | 110 (24.9%) |
Housing Structures by Number of Rooms in Rushmere
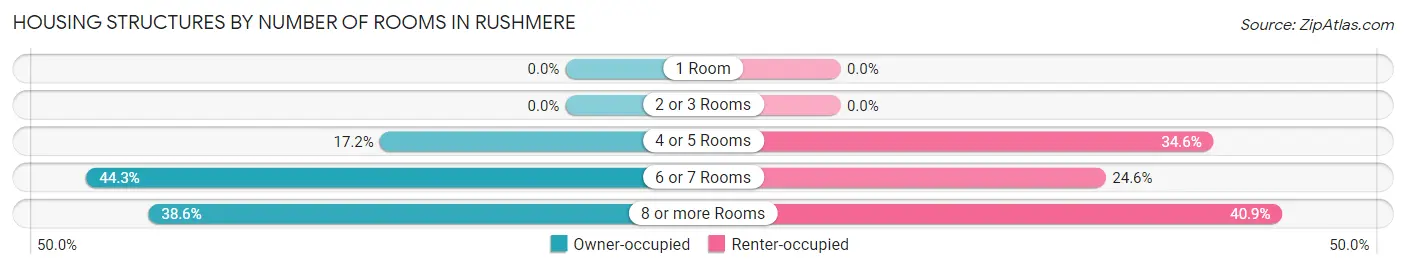
| Number of Rooms | Owner-occupied | Renter-occupied |
| 1 Room | 0 (0.0%) | 0 (0.0%) |
| 2 or 3 Rooms | 0 (0.0%) | 0 (0.0%) |
| 4 or 5 Rooms | 57 (17.2%) | 38 (34.5%) |
| 6 or 7 Rooms | 147 (44.3%) | 27 (24.5%) |
| 8 or more Rooms | 128 (38.6%) | 45 (40.9%) |
| Total | 332 (100.0%) | 110 (100.0%) |
Housing Structure by Heating Type in Rushmere
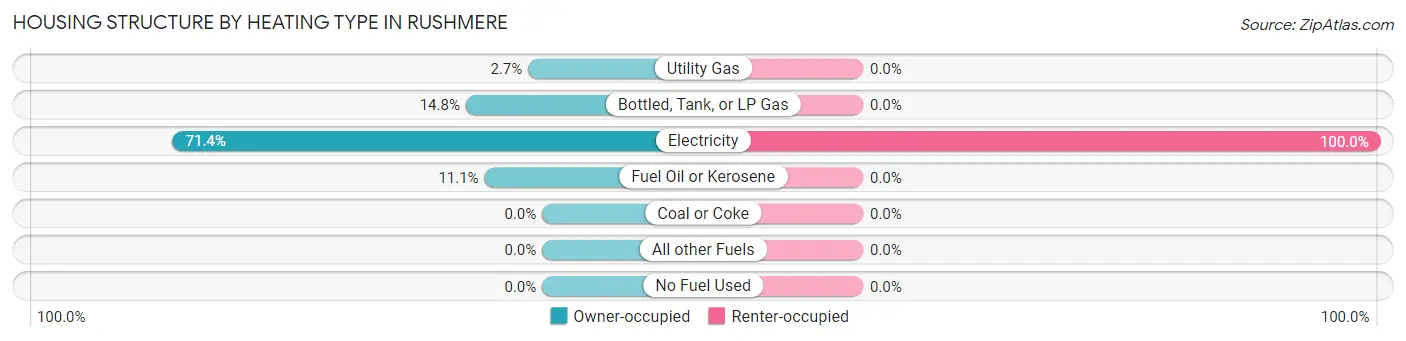
| Heating Type | Owner-occupied | Renter-occupied |
| Utility Gas | 9 (2.7%) | 0 (0.0%) |
| Bottled, Tank, or LP Gas | 49 (14.8%) | 0 (0.0%) |
| Electricity | 237 (71.4%) | 110 (100.0%) |
| Fuel Oil or Kerosene | 37 (11.1%) | 0 (0.0%) |
| Coal or Coke | 0 (0.0%) | 0 (0.0%) |
| All other Fuels | 0 (0.0%) | 0 (0.0%) |
| No Fuel Used | 0 (0.0%) | 0 (0.0%) |
| Total | 332 (100.0%) | 110 (100.0%) |
Household Vehicle Usage in Rushmere
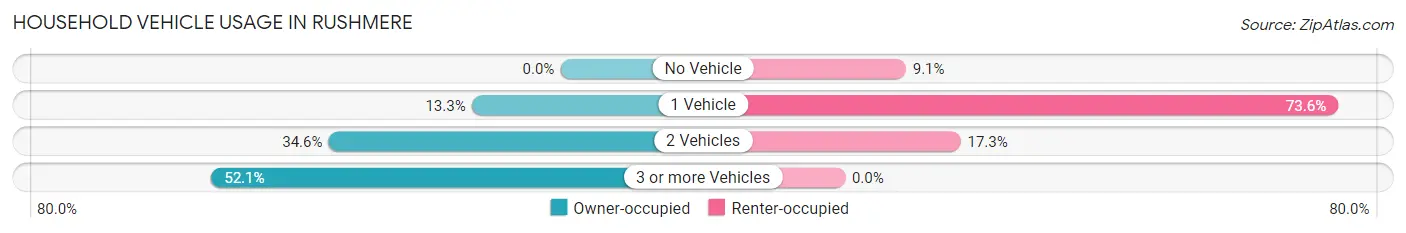
| Vehicles per Household | Owner-occupied | Renter-occupied |
| No Vehicle | 0 (0.0%) | 10 (9.1%) |
| 1 Vehicle | 44 (13.3%) | 81 (73.6%) |
| 2 Vehicles | 115 (34.6%) | 19 (17.3%) |
| 3 or more Vehicles | 173 (52.1%) | 0 (0.0%) |
| Total | 332 (100.0%) | 110 (100.0%) |
Real Estate & Mortgages in Rushmere
Real Estate and Mortgage Overview in Rushmere
| Characteristic | Without Mortgage | With Mortgage |
| Housing Units | 176 | 156 |
| Median Property Value | - | - |
| Median Household Income | - | - |
| Monthly Housing Costs | $527 | $34 |
| Real Estate Taxes | $1,723 | $0 |
Property Value by Mortgage Status in Rushmere
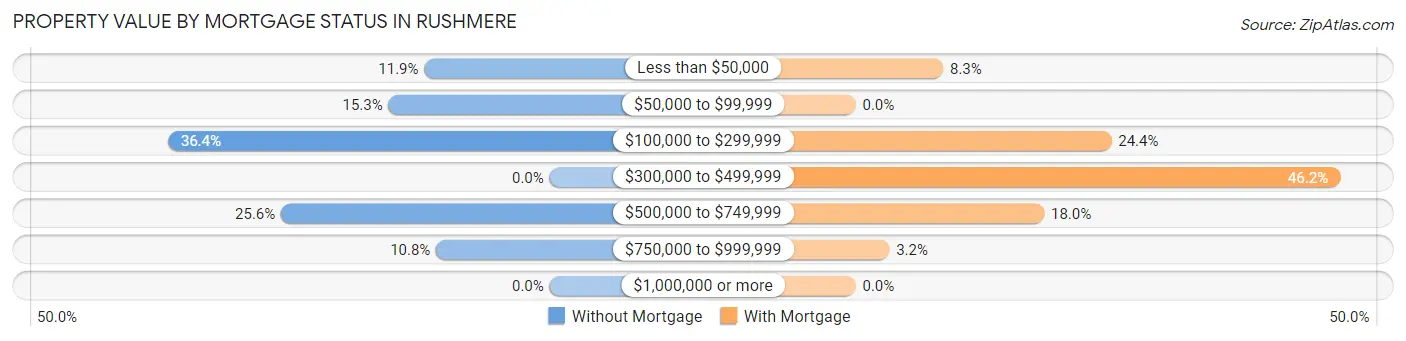
| Property Value | Without Mortgage | With Mortgage |
| Less than $50,000 | 21 (11.9%) | 13 (8.3%) |
| $50,000 to $99,999 | 27 (15.3%) | 0 (0.0%) |
| $100,000 to $299,999 | 64 (36.4%) | 38 (24.4%) |
| $300,000 to $499,999 | 0 (0.0%) | 72 (46.2%) |
| $500,000 to $749,999 | 45 (25.6%) | 28 (17.9%) |
| $750,000 to $999,999 | 19 (10.8%) | 5 (3.2%) |
| $1,000,000 or more | 0 (0.0%) | 0 (0.0%) |
| Total | 176 (100.0%) | 156 (100.0%) |
Household Income by Mortgage Status in Rushmere
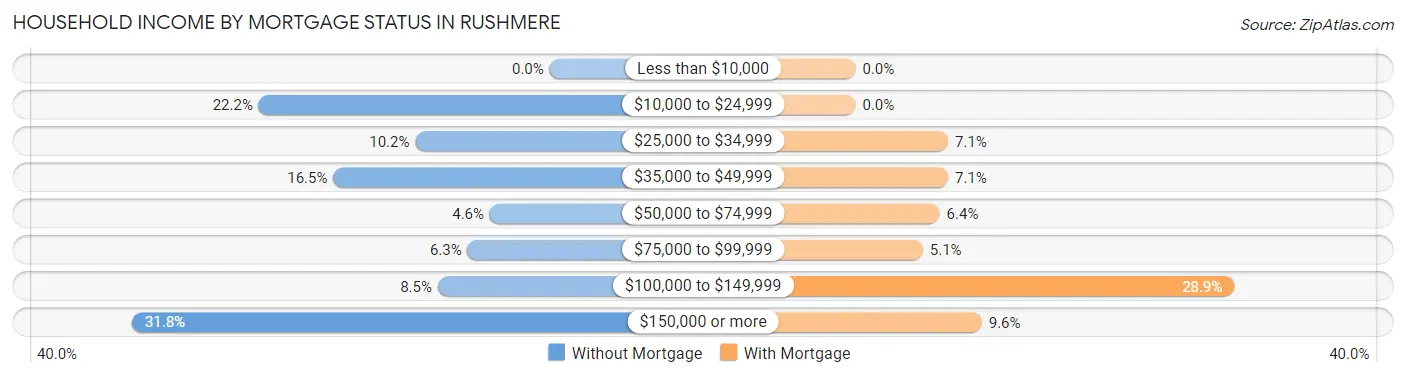
| Household Income | Without Mortgage | With Mortgage |
| Less than $10,000 | 0 (0.0%) | 0 (0.0%) |
| $10,000 to $24,999 | 39 (22.2%) | 0 (0.0%) |
| $25,000 to $34,999 | 18 (10.2%) | 11 (7.0%) |
| $35,000 to $49,999 | 29 (16.5%) | 11 (7.0%) |
| $50,000 to $74,999 | 8 (4.5%) | 10 (6.4%) |
| $75,000 to $99,999 | 11 (6.2%) | 8 (5.1%) |
| $100,000 to $149,999 | 15 (8.5%) | 45 (28.8%) |
| $150,000 or more | 56 (31.8%) | 15 (9.6%) |
| Total | 176 (100.0%) | 156 (100.0%) |
Property Value to Household Income Ratio in Rushmere
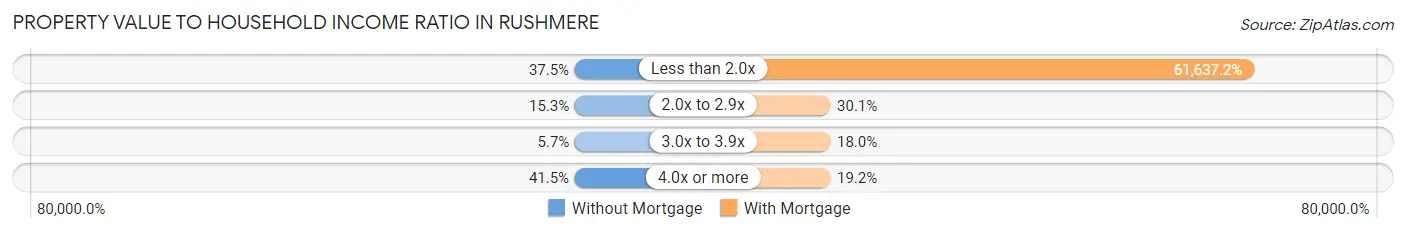
| Value-to-Income Ratio | Without Mortgage | With Mortgage |
| Less than 2.0x | 66 (37.5%) | 96,154 (61,637.2%) |
| 2.0x to 2.9x | 27 (15.3%) | 47 (30.1%) |
| 3.0x to 3.9x | 10 (5.7%) | 28 (17.9%) |
| 4.0x or more | 73 (41.5%) | 30 (19.2%) |
| Total | 176 (100.0%) | 156 (100.0%) |
Real Estate Taxes by Mortgage Status in Rushmere
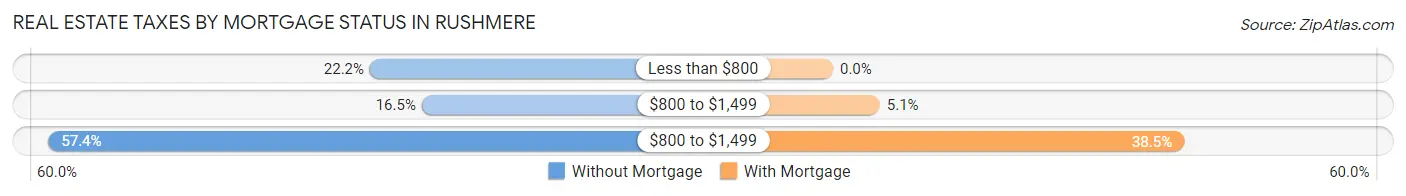
| Property Taxes | Without Mortgage | With Mortgage |
| Less than $800 | 39 (22.2%) | 0 (0.0%) |
| $800 to $1,499 | 29 (16.5%) | 8 (5.1%) |
| $800 to $1,499 | 101 (57.4%) | 60 (38.5%) |
| Total | 176 (100.0%) | 156 (100.0%) |
Health & Disability in Rushmere
Health Insurance Coverage by Age in Rushmere
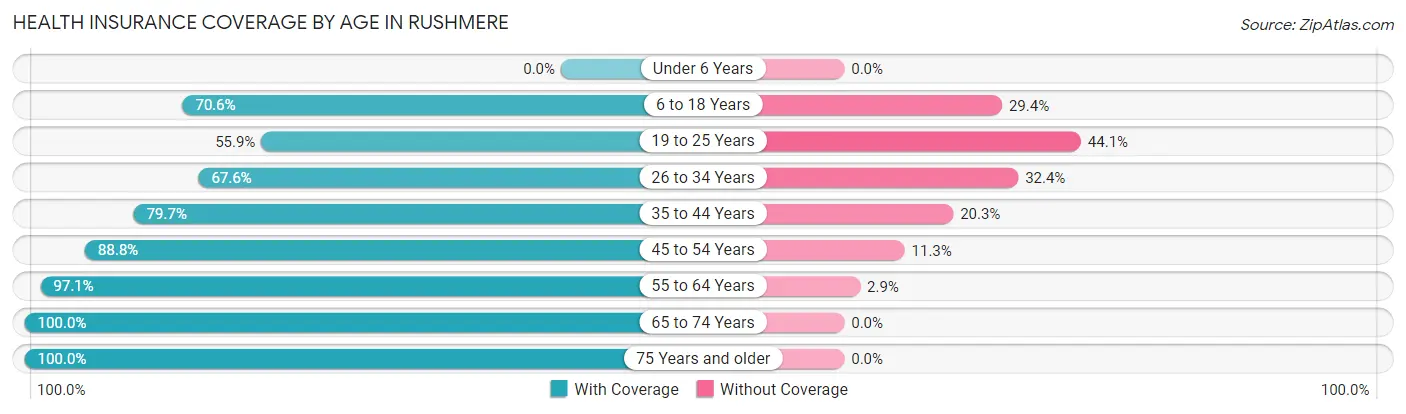
| Age Bracket | With Coverage | Without Coverage |
| Under 6 Years | 0 (0.0%) | 0 (0.0%) |
| 6 to 18 Years | 96 (70.6%) | 40 (29.4%) |
| 19 to 25 Years | 19 (55.9%) | 15 (44.1%) |
| 26 to 34 Years | 25 (67.6%) | 12 (32.4%) |
| 35 to 44 Years | 51 (79.7%) | 13 (20.3%) |
| 45 to 54 Years | 71 (88.7%) | 9 (11.3%) |
| 55 to 64 Years | 330 (97.1%) | 10 (2.9%) |
| 65 to 74 Years | 105 (100.0%) | 0 (0.0%) |
| 75 Years and older | 100 (100.0%) | 0 (0.0%) |
| Total | 797 (88.9%) | 99 (11.1%) |
Health Insurance Coverage by Citizenship Status in Rushmere
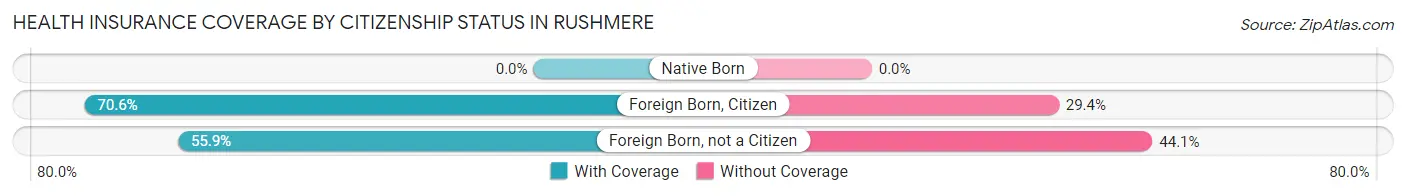
| Citizenship Status | With Coverage | Without Coverage |
| Native Born | 0 (0.0%) | 0 (0.0%) |
| Foreign Born, Citizen | 96 (70.6%) | 40 (29.4%) |
| Foreign Born, not a Citizen | 19 (55.9%) | 15 (44.1%) |
Health Insurance Coverage by Household Income in Rushmere
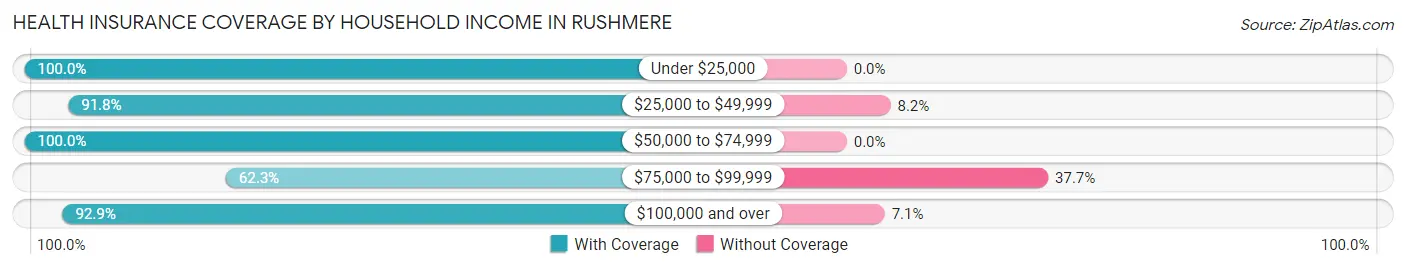
| Household Income | With Coverage | Without Coverage |
| Under $25,000 | 132 (100.0%) | 0 (0.0%) |
| $25,000 to $49,999 | 112 (91.8%) | 10 (8.2%) |
| $50,000 to $74,999 | 109 (100.0%) | 0 (0.0%) |
| $75,000 to $99,999 | 104 (62.3%) | 63 (37.7%) |
| $100,000 and over | 340 (92.9%) | 26 (7.1%) |
Public vs Private Health Insurance Coverage by Age in Rushmere
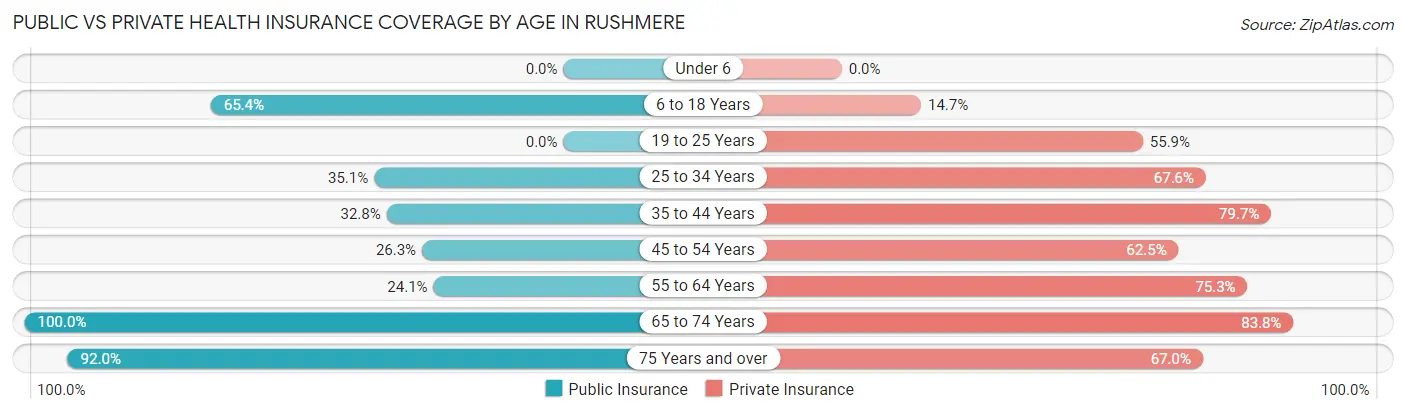
| Age Bracket | Public Insurance | Private Insurance |
| Under 6 | 0 (0.0%) | 0 (0.0%) |
| 6 to 18 Years | 89 (65.4%) | 20 (14.7%) |
| 19 to 25 Years | 0 (0.0%) | 19 (55.9%) |
| 25 to 34 Years | 13 (35.1%) | 25 (67.6%) |
| 35 to 44 Years | 21 (32.8%) | 51 (79.7%) |
| 45 to 54 Years | 21 (26.3%) | 50 (62.5%) |
| 55 to 64 Years | 82 (24.1%) | 256 (75.3%) |
| 65 to 74 Years | 105 (100.0%) | 88 (83.8%) |
| 75 Years and over | 92 (92.0%) | 67 (67.0%) |
| Total | 423 (47.2%) | 576 (64.3%) |
Disability Status by Sex by Age in Rushmere
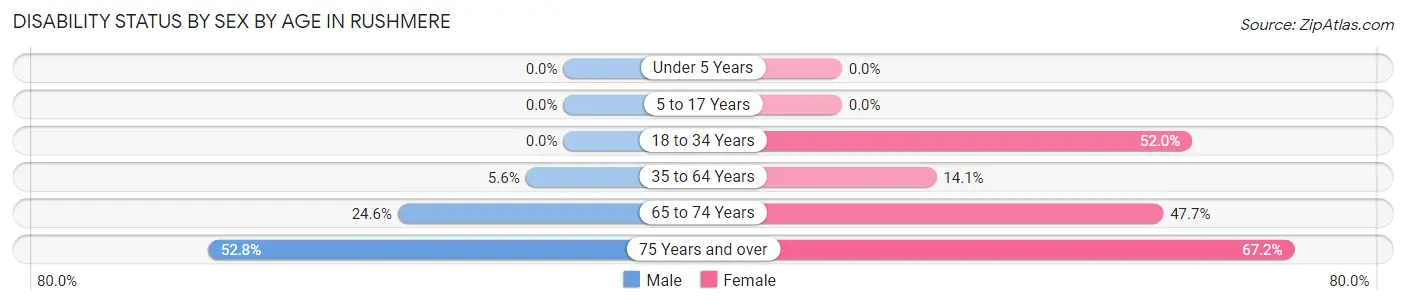
| Age Bracket | Male | Female |
| Under 5 Years | 0 (0.0%) | 0 (0.0%) |
| 5 to 17 Years | 0 (0.0%) | 0 (0.0%) |
| 18 to 34 Years | 0 (0.0%) | 13 (52.0%) |
| 35 to 64 Years | 10 (5.6%) | 43 (14.1%) |
| 65 to 74 Years | 15 (24.6%) | 21 (47.7%) |
| 75 Years and over | 19 (52.8%) | 43 (67.2%) |
Disability Class by Sex by Age in Rushmere
Disability Class: Hearing Difficulty
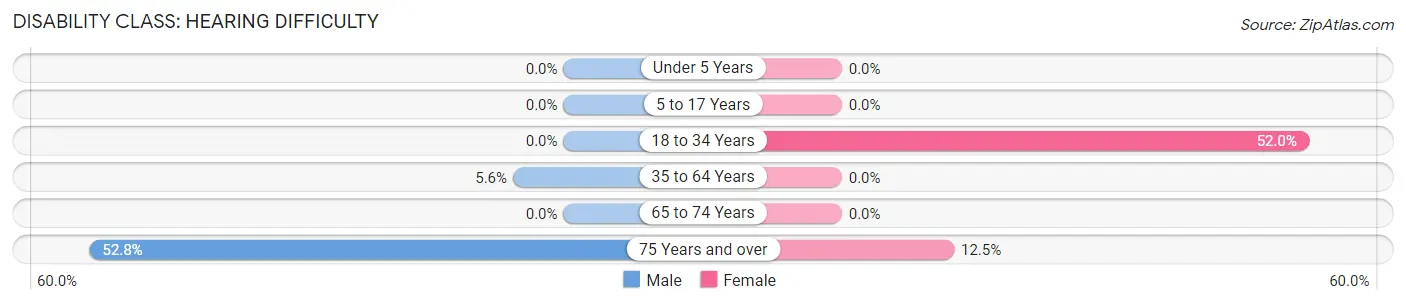
| Age Bracket | Male | Female |
| Under 5 Years | 0 (0.0%) | 0 (0.0%) |
| 5 to 17 Years | 0 (0.0%) | 0 (0.0%) |
| 18 to 34 Years | 0 (0.0%) | 13 (52.0%) |
| 35 to 64 Years | 10 (5.6%) | 0 (0.0%) |
| 65 to 74 Years | 0 (0.0%) | 0 (0.0%) |
| 75 Years and over | 19 (52.8%) | 8 (12.5%) |
Disability Class: Vision Difficulty
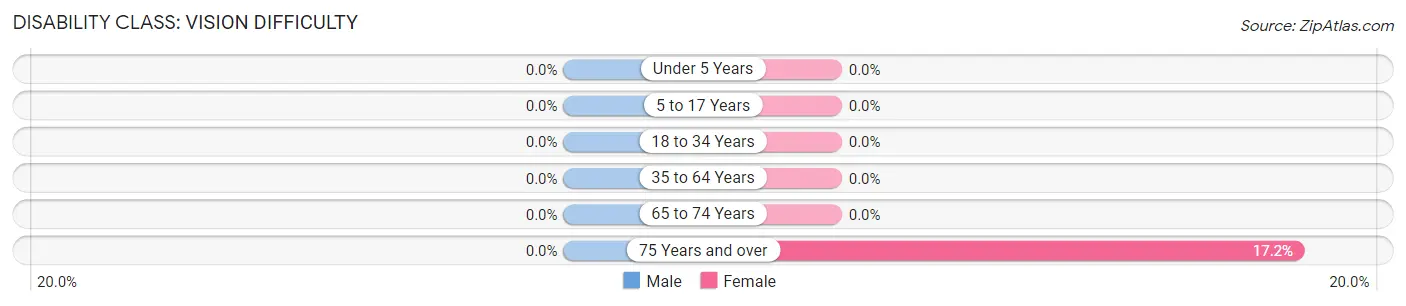
| Age Bracket | Male | Female |
| Under 5 Years | 0 (0.0%) | 0 (0.0%) |
| 5 to 17 Years | 0 (0.0%) | 0 (0.0%) |
| 18 to 34 Years | 0 (0.0%) | 0 (0.0%) |
| 35 to 64 Years | 0 (0.0%) | 0 (0.0%) |
| 65 to 74 Years | 0 (0.0%) | 0 (0.0%) |
| 75 Years and over | 0 (0.0%) | 11 (17.2%) |
Disability Class: Cognitive Difficulty
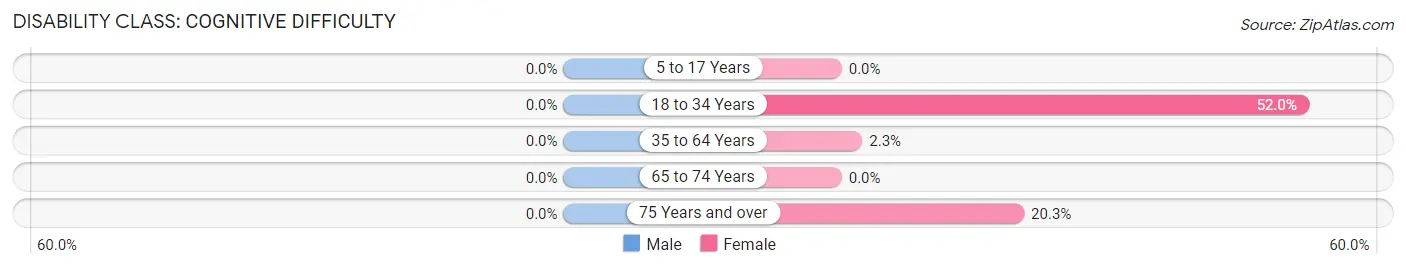
| Age Bracket | Male | Female |
| 5 to 17 Years | 0 (0.0%) | 0 (0.0%) |
| 18 to 34 Years | 0 (0.0%) | 13 (52.0%) |
| 35 to 64 Years | 0 (0.0%) | 7 (2.3%) |
| 65 to 74 Years | 0 (0.0%) | 0 (0.0%) |
| 75 Years and over | 0 (0.0%) | 13 (20.3%) |
Disability Class: Ambulatory Difficulty
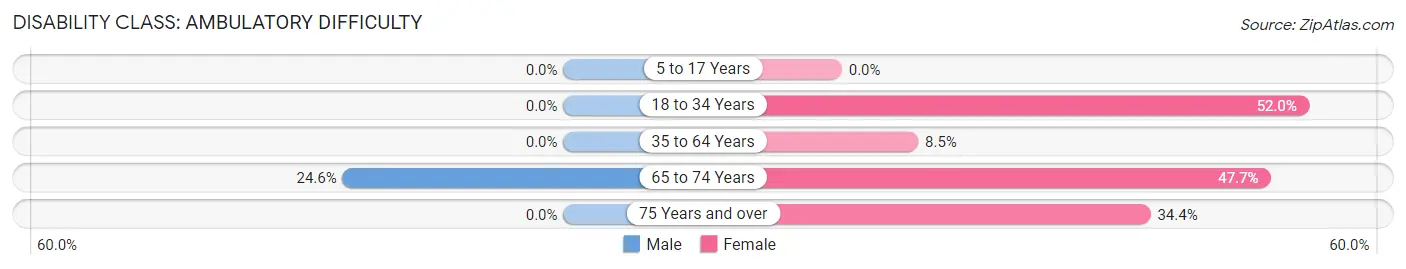
| Age Bracket | Male | Female |
| 5 to 17 Years | 0 (0.0%) | 0 (0.0%) |
| 18 to 34 Years | 0 (0.0%) | 13 (52.0%) |
| 35 to 64 Years | 0 (0.0%) | 26 (8.5%) |
| 65 to 74 Years | 15 (24.6%) | 21 (47.7%) |
| 75 Years and over | 0 (0.0%) | 22 (34.4%) |
Disability Class: Self-Care Difficulty
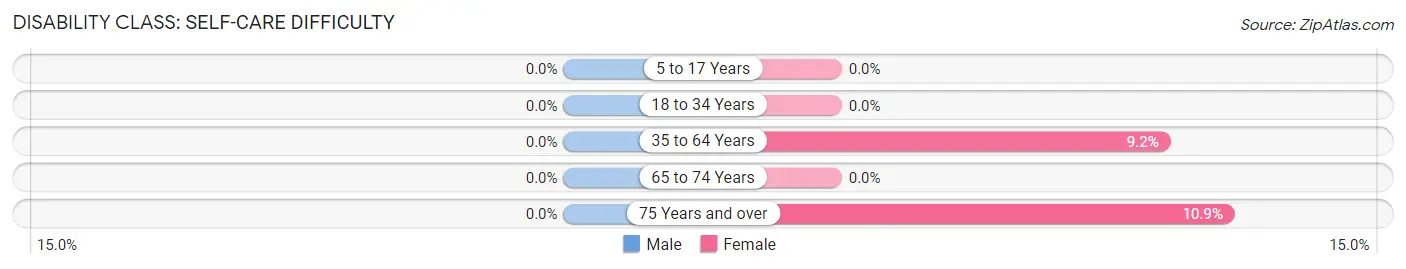
| Age Bracket | Male | Female |
| 5 to 17 Years | 0 (0.0%) | 0 (0.0%) |
| 18 to 34 Years | 0 (0.0%) | 0 (0.0%) |
| 35 to 64 Years | 0 (0.0%) | 28 (9.1%) |
| 65 to 74 Years | 0 (0.0%) | 0 (0.0%) |
| 75 Years and over | 0 (0.0%) | 7 (10.9%) |
Technology Access in Rushmere
Computing Device Access in Rushmere
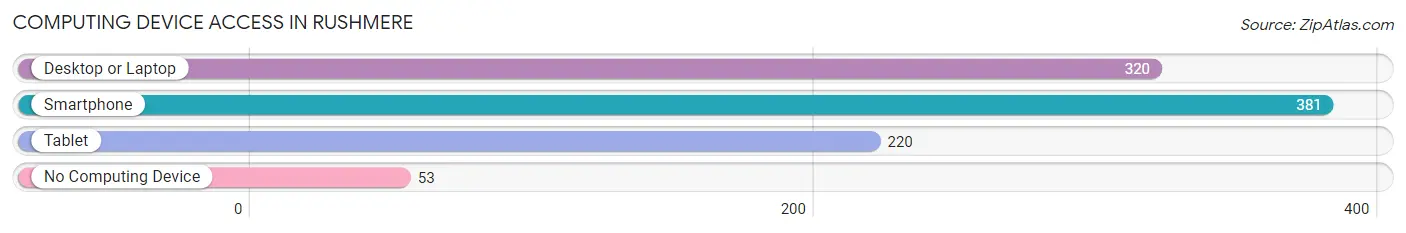
| Device Type | # Households | % Households |
| Desktop or Laptop | 320 | 72.4% |
| Smartphone | 381 | 86.2% |
| Tablet | 220 | 49.8% |
| No Computing Device | 53 | 12.0% |
| Total | 442 | 100.0% |
Internet Access in Rushmere
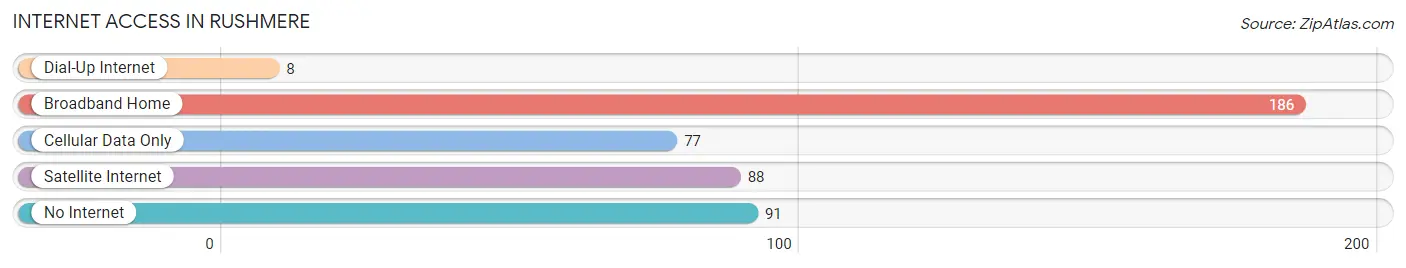
| Internet Type | # Households | % Households |
| Dial-Up Internet | 8 | 1.8% |
| Broadband Home | 186 | 42.1% |
| Cellular Data Only | 77 | 17.4% |
| Satellite Internet | 88 | 19.9% |
| No Internet | 91 | 20.6% |
| Total | 442 | 100.0% |
Rushmere Summary
Rashmere is a small unincorporated community located in Isle of Wight County, Virginia. It is situated on the south side of the James River, approximately 20 miles south of the city of Newport News. The community is bordered by the towns of Smithfield and Windsor, and is part of the Hampton Roads metropolitan area.
History
Rashmere was first settled in the early 1700s by English colonists. The community was named after the nearby Rushmere Plantation, which was owned by the prominent Byrd family. The plantation was established in 1720 and was home to several generations of the Byrd family until it was sold in 1820.
The community of Rushmere was officially established in 1820, when the first post office was opened. The post office was located in the home of the postmaster, William Rush. The community grew slowly over the next several decades, and by the late 1800s, it had become a thriving agricultural community.
Geography
Rushmere is located in Isle of Wight County, Virginia. It is situated on the south side of the James River, approximately 20 miles south of the city of Newport News. The community is bordered by the towns of Smithfield and Windsor, and is part of the Hampton Roads metropolitan area.
The terrain of Rushmere is mostly flat, with some rolling hills. The soil is mostly sandy loam, with some clay and gravel. The climate is humid subtropical, with hot, humid summers and mild winters.
Economy
The economy of Rushmere is largely based on agriculture. The community is home to several farms, which produce a variety of crops, including corn, soybeans, wheat, and hay. The farms also raise livestock, including cattle, hogs, and chickens.
In addition to agriculture, Rushmere is home to several small businesses, including a convenience store, a gas station, and a restaurant. The community also has a few small manufacturing companies, which produce a variety of products, including furniture, clothing, and electronics.
Demographics
As of the 2010 census, the population of Rushmere was 1,093. The racial makeup of the community was 94.3% White, 2.7% African American, 0.7% Native American, 0.3% Asian, and 1.9% from other races. The median household income was $45,000, and the median home value was $150,000.
The majority of the population of Rushmere is employed in the agricultural sector. Other major industries in the community include manufacturing, retail, and hospitality. The unemployment rate in Rushmere is slightly higher than the national average.
Common Questions
What is Per Capita Income in Rushmere?
Per Capita income in Rushmere is $59,965.
What is the Median Family Income in Rushmere?
Median Family Income in Rushmere is $111,786.
What is the Median Household income in Rushmere?
Median Household Income in Rushmere is $51,667.
What is Income or Wage Gap in Rushmere?
Income or Wage Gap in Rushmere is 20.3%.
Women in Rushmere earn 79.7 cents for every dollar earned by a man.
What is Inequality or Gini Index in Rushmere?
Inequality or Gini Index in Rushmere is 0.55.
What is the Total Population of Rushmere?
Total Population of Rushmere is 896.
What is the Total Male Population of Rushmere?
Total Male Population of Rushmere is 376.
What is the Total Female Population of Rushmere?
Total Female Population of Rushmere is 520.
What is the Ratio of Males per 100 Females in Rushmere?
There are 72.31 Males per 100 Females in Rushmere.
What is the Ratio of Females per 100 Males in Rushmere?
There are 138.30 Females per 100 Males in Rushmere.
What is the Median Population Age in Rushmere?
Median Population Age in Rushmere is 59.5 Years.
What is the Average Family Size in Rushmere
Average Family Size in Rushmere is 2.7 People.
What is the Average Household Size in Rushmere
Average Household Size in Rushmere is 2.0 People.
How Large is the Labor Force in Rushmere?
There are 425 People in the Labor Forcein in Rushmere.
What is the Percentage of People in the Labor Force in Rushmere?
54.0% of People are in the Labor Force in Rushmere.
What is the Unemployment Rate in Rushmere?
Unemployment Rate in Rushmere is 6.8%.