Prices Fork, VA Map & Demographics
Prices Fork Map
Prices Fork Overview
$34,975
PER CAPITA INCOME
$103,699
AVG FAMILY INCOME
$72,266
AVG HOUSEHOLD INCOME
6.9%
WAGE / INCOME GAP [ % ]
93.1¢/ $1
WAGE / INCOME GAP [ $ ]
0.40
INEQUALITY / GINI INDEX
1,014
TOTAL POPULATION
545
MALE POPULATION
469
FEMALE POPULATION
116.20
MALES / 100 FEMALES
86.06
FEMALES / 100 MALES
37.7
MEDIAN AGE
2.7
AVG FAMILY SIZE
2.2
AVG HOUSEHOLD SIZE
579
LABOR FORCE [ PEOPLE ]
70.3%
PERCENT IN LABOR FORCE
5.4%
UNEMPLOYMENT RATE
Income in Prices Fork
Income Overview in Prices Fork
Per Capita Income in Prices Fork is $34,975, while median incomes of families and households are $103,699 and $72,266 respectively.
| Characteristic | Number | Measure |
| Per Capita Income | 1,014 | $34,975 |
| Median Family Income | 305 | $103,699 |
| Mean Family Income | 305 | $100,020 |
| Median Household Income | 459 | $72,266 |
| Mean Household Income | 459 | $76,451 |
| Income Deficit | 305 | $0 |
| Wage / Income Gap (%) | 1,014 | 6.88% |
| Wage / Income Gap ($) | 1,014 | 93.12¢ per $1 |
| Gini / Inequality Index | 1,014 | 0.40 |
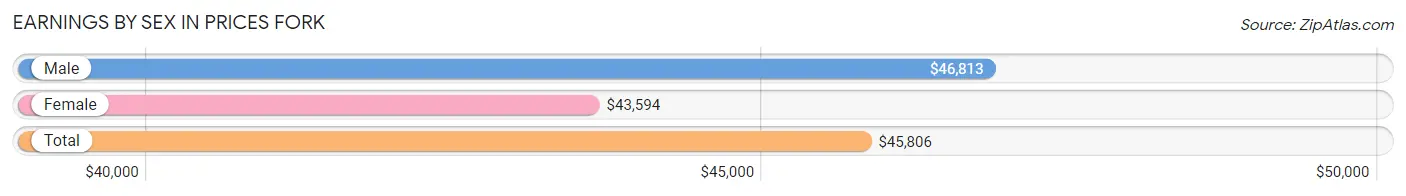
Earnings by Sex in Prices Fork
Average Earnings in Prices Fork are $45,806, $46,813 for men and $43,594 for women, a difference of 6.9%.
| Sex | Number | Average Earnings |
| Male | 299 (54.6%) | $46,813 |
| Female | 249 (45.4%) | $43,594 |
| Total | 548 (100.0%) | $45,806 |
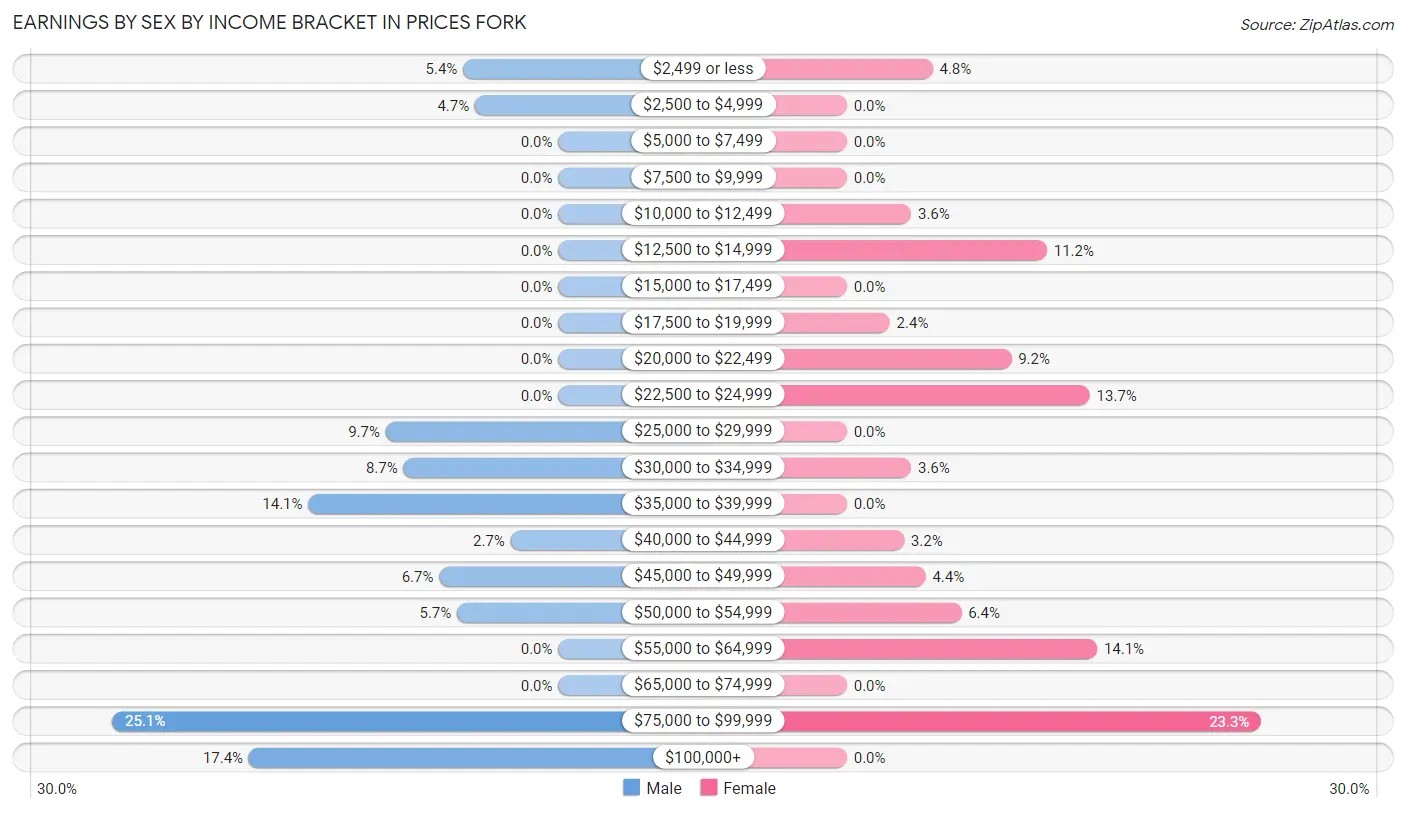
Earnings by Sex by Income Bracket in Prices Fork
The most common earnings brackets in Prices Fork are $75,000 to $99,999 for men (75 | 25.1%) and $75,000 to $99,999 for women (58 | 23.3%).
| Income | Male | Female |
| $2,499 or less | 16 (5.3%) | 12 (4.8%) |
| $2,500 to $4,999 | 14 (4.7%) | 0 (0.0%) |
| $5,000 to $7,499 | 0 (0.0%) | 0 (0.0%) |
| $7,500 to $9,999 | 0 (0.0%) | 0 (0.0%) |
| $10,000 to $12,499 | 0 (0.0%) | 9 (3.6%) |
| $12,500 to $14,999 | 0 (0.0%) | 28 (11.2%) |
| $15,000 to $17,499 | 0 (0.0%) | 0 (0.0%) |
| $17,500 to $19,999 | 0 (0.0%) | 6 (2.4%) |
| $20,000 to $22,499 | 0 (0.0%) | 23 (9.2%) |
| $22,500 to $24,999 | 0 (0.0%) | 34 (13.7%) |
| $25,000 to $29,999 | 29 (9.7%) | 0 (0.0%) |
| $30,000 to $34,999 | 26 (8.7%) | 9 (3.6%) |
| $35,000 to $39,999 | 42 (14.1%) | 0 (0.0%) |
| $40,000 to $44,999 | 8 (2.7%) | 8 (3.2%) |
| $45,000 to $49,999 | 20 (6.7%) | 11 (4.4%) |
| $50,000 to $54,999 | 17 (5.7%) | 16 (6.4%) |
| $55,000 to $64,999 | 0 (0.0%) | 35 (14.1%) |
| $65,000 to $74,999 | 0 (0.0%) | 0 (0.0%) |
| $75,000 to $99,999 | 75 (25.1%) | 58 (23.3%) |
| $100,000+ | 52 (17.4%) | 0 (0.0%) |
| Total | 299 (100.0%) | 249 (100.0%) |
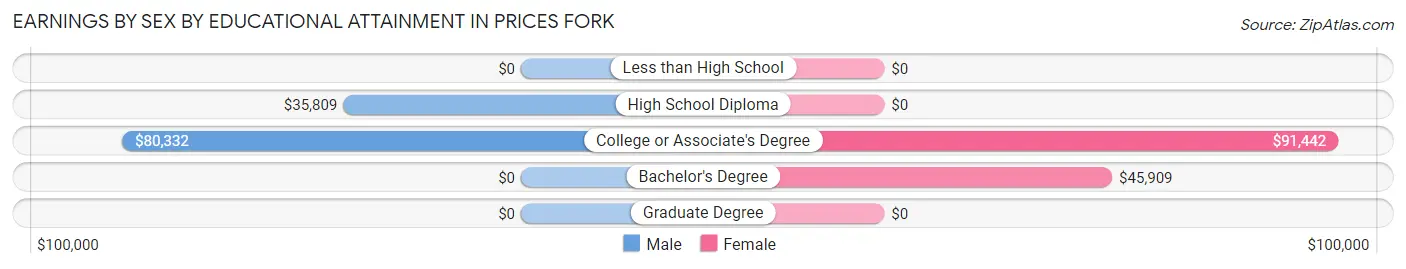
Earnings by Sex by Educational Attainment in Prices Fork
Average earnings in Prices Fork are $53,897 for men and $54,375 for women, a difference of 0.9%. Men with an educational attainment of college or associate's degree enjoy the highest average annual earnings of $80,332, while those with high school diploma education earn the least with $35,809. Women with an educational attainment of college or associate's degree earn the most with the average annual earnings of $91,442, while those with bachelor's degree education have the smallest earnings of $45,909.
| Educational Attainment | Male Income | Female Income |
| Less than High School | - | - |
| High School Diploma | $35,809 | $0 |
| College or Associate's Degree | $80,332 | $91,442 |
| Bachelor's Degree | - | - |
| Graduate Degree | - | - |
| Total | $53,897 | $54,375 |
Family Income in Prices Fork
Family Income Brackets in Prices Fork
According to the Prices Fork family income data, there are 156 families falling into the $100,000 to $149,999 income range, which is the most common income bracket and makes up 51.1% of all families.
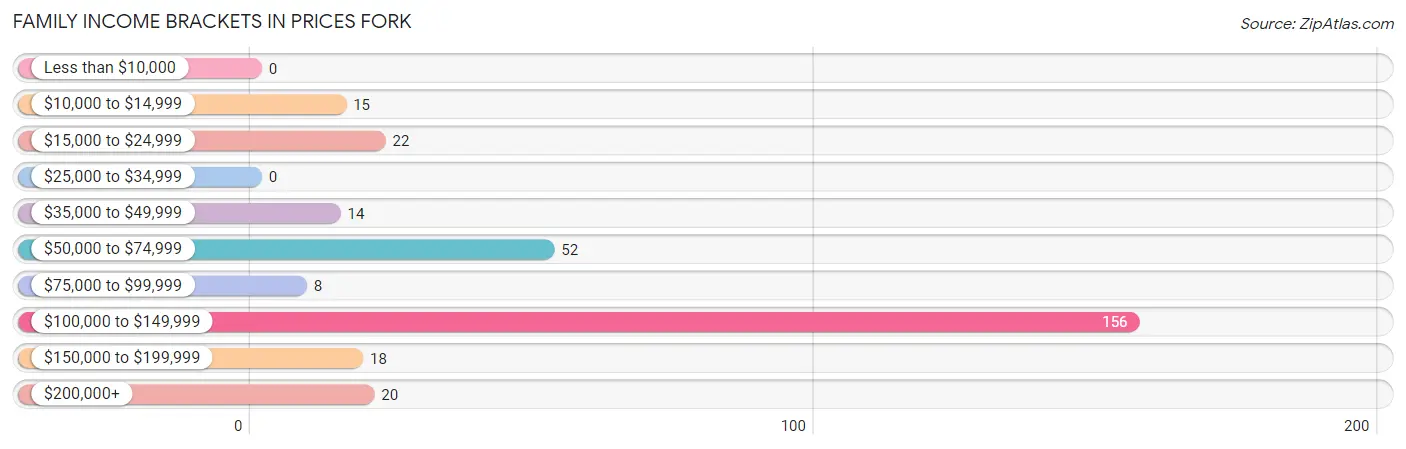
| Income Bracket | # Families | % Families |
| Less than $10,000 | 0 | 0.0% |
| $10,000 to $14,999 | 15 | 4.9% |
| $15,000 to $24,999 | 22 | 7.2% |
| $25,000 to $34,999 | 0 | 0.0% |
| $35,000 to $49,999 | 14 | 4.6% |
| $50,000 to $74,999 | 52 | 17.0% |
| $75,000 to $99,999 | 8 | 2.6% |
| $100,000 to $149,999 | 156 | 51.1% |
| $150,000 to $199,999 | 18 | 5.9% |
| $200,000+ | 20 | 6.6% |
Family Income by Famaliy Size in Prices Fork
3-person families (38 | 12.5%) account for the highest median family income in Prices Fork with $110,469 per family, while 2-person families (203 | 66.6%) have the highest median income of $51,416 per family member.
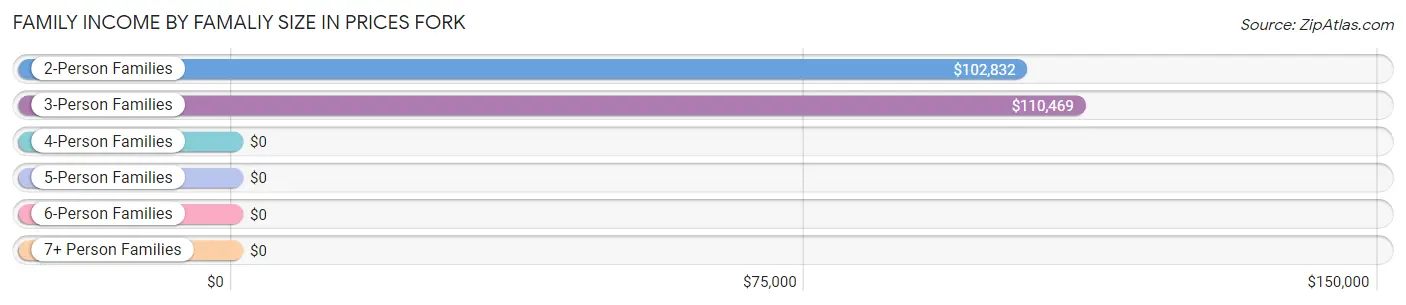
| Income Bracket | # Families | Median Income |
| 2-Person Families | 203 (66.6%) | $102,832 |
| 3-Person Families | 38 (12.5%) | $110,469 |
| 4-Person Families | 20 (6.6%) | $0 |
| 5-Person Families | 26 (8.5%) | $0 |
| 6-Person Families | 18 (5.9%) | $0 |
| 7+ Person Families | 0 (0.0%) | $0 |
| Total | 305 (100.0%) | $103,699 |
Family Income by Number of Earners in Prices Fork
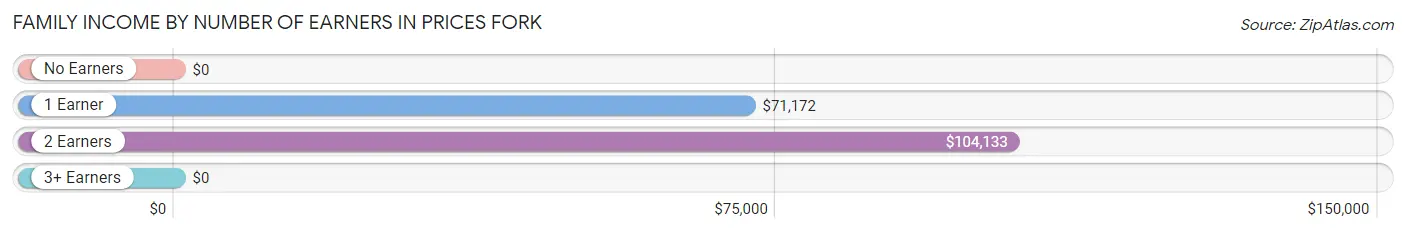
| Number of Earners | # Families | Median Income |
| No Earners | 22 (7.2%) | $0 |
| 1 Earner | 145 (47.5%) | $71,172 |
| 2 Earners | 116 (38.0%) | $104,133 |
| 3+ Earners | 22 (7.2%) | $0 |
| Total | 305 (100.0%) | $103,699 |
Household Income in Prices Fork
Household Income Brackets in Prices Fork
With 156 households falling in the category, the $100,000 to $149,999 income range is the most frequent in Prices Fork, accounting for 34.0% of all households.
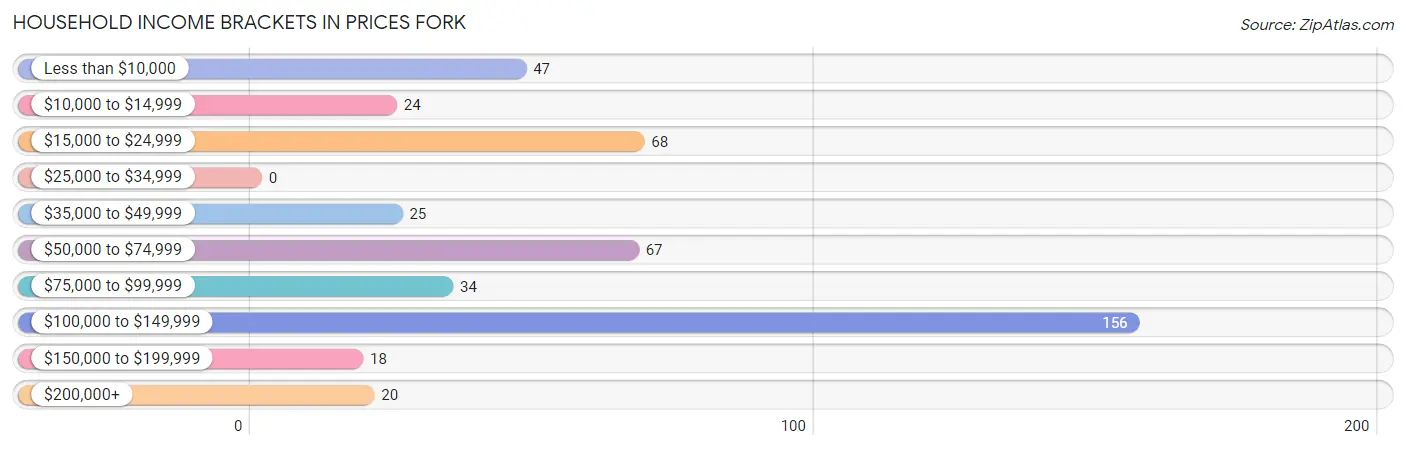
| Income Bracket | # Households | % Households |
| Less than $10,000 | 47 | 10.2% |
| $10,000 to $14,999 | 24 | 5.2% |
| $15,000 to $24,999 | 68 | 14.8% |
| $25,000 to $34,999 | 0 | 0.0% |
| $35,000 to $49,999 | 25 | 5.4% |
| $50,000 to $74,999 | 67 | 14.6% |
| $75,000 to $99,999 | 34 | 7.4% |
| $100,000 to $149,999 | 156 | 34.0% |
| $150,000 to $199,999 | 18 | 3.9% |
| $200,000+ | 20 | 4.4% |
Household Income by Householder Age in Prices Fork
The median household income in Prices Fork is $72,266, with the highest median household income of $103,163 found in the 25 to 44 years age bracket for the primary householder. A total of 228 households (49.7%) fall into this category. Meanwhile, the 15 to 24 years age bracket for the primary householder has the lowest median household income of $0, with 23 households (5.0%) in this group.
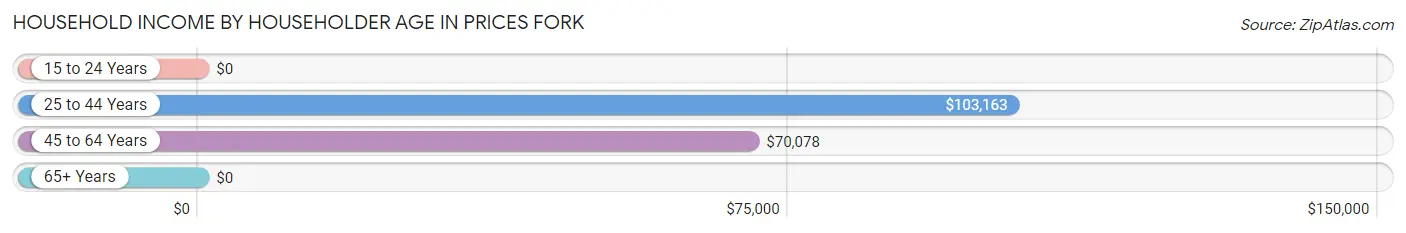
| Income Bracket | # Households | Median Income |
| 15 to 24 Years | 23 (5.0%) | $0 |
| 25 to 44 Years | 228 (49.7%) | $103,163 |
| 45 to 64 Years | 145 (31.6%) | $70,078 |
| 65+ Years | 63 (13.7%) | $0 |
| Total | 459 (100.0%) | $72,266 |
Poverty in Prices Fork
Income Below Poverty by Sex and Age in Prices Fork
With 12.5% poverty level for males and 9.2% for females among the residents of Prices Fork, 18 to 24 year old males and 55 to 64 year old females are the most vulnerable to poverty, with 27 males (100.0%) and 16 females (35.6%) in their respective age groups living below the poverty level.
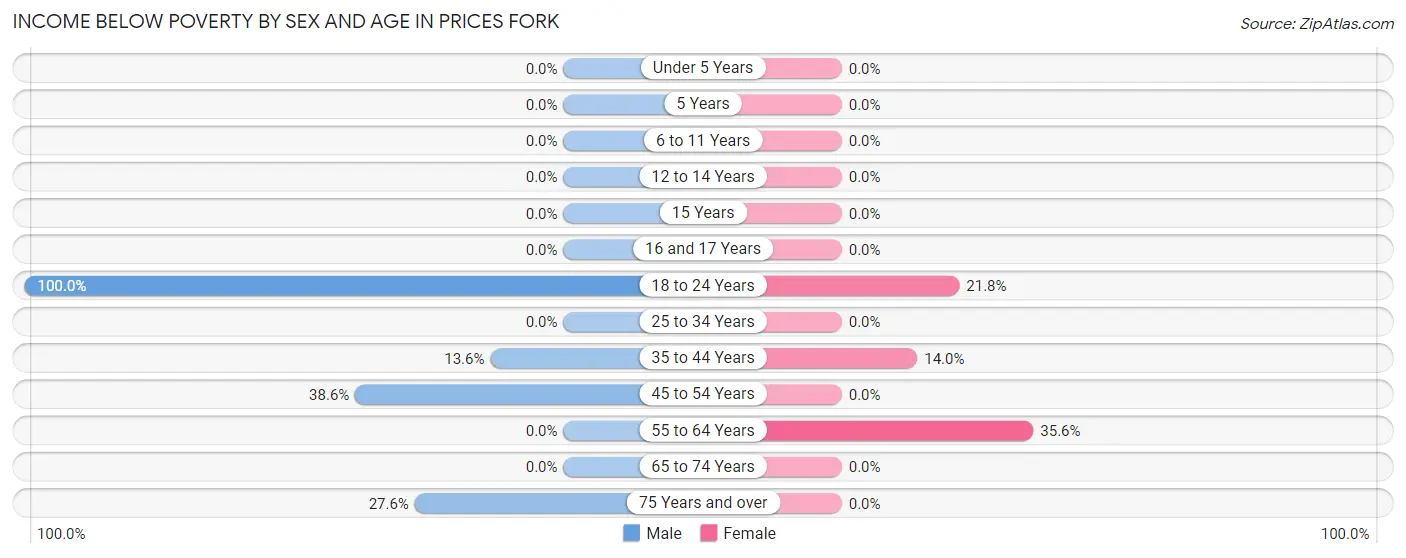
| Age Bracket | Male | Female |
| Under 5 Years | 0 (0.0%) | 0 (0.0%) |
| 5 Years | 0 (0.0%) | 0 (0.0%) |
| 6 to 11 Years | 0 (0.0%) | 0 (0.0%) |
| 12 to 14 Years | 0 (0.0%) | 0 (0.0%) |
| 15 Years | 0 (0.0%) | 0 (0.0%) |
| 16 and 17 Years | 0 (0.0%) | 0 (0.0%) |
| 18 to 24 Years | 27 (100.0%) | 12 (21.8%) |
| 25 to 34 Years | 0 (0.0%) | 0 (0.0%) |
| 35 to 44 Years | 16 (13.6%) | 15 (14.0%) |
| 45 to 54 Years | 17 (38.6%) | 0 (0.0%) |
| 55 to 64 Years | 0 (0.0%) | 16 (35.6%) |
| 65 to 74 Years | 0 (0.0%) | 0 (0.0%) |
| 75 Years and over | 8 (27.6%) | 0 (0.0%) |
| Total | 68 (12.5%) | 43 (9.2%) |
Income Above Poverty by Sex and Age in Prices Fork
According to the poverty statistics in Prices Fork, males aged under 5 years and females aged under 5 years are the age groups that are most secure financially, with 100.0% of males and 100.0% of females in these age groups living above the poverty line.
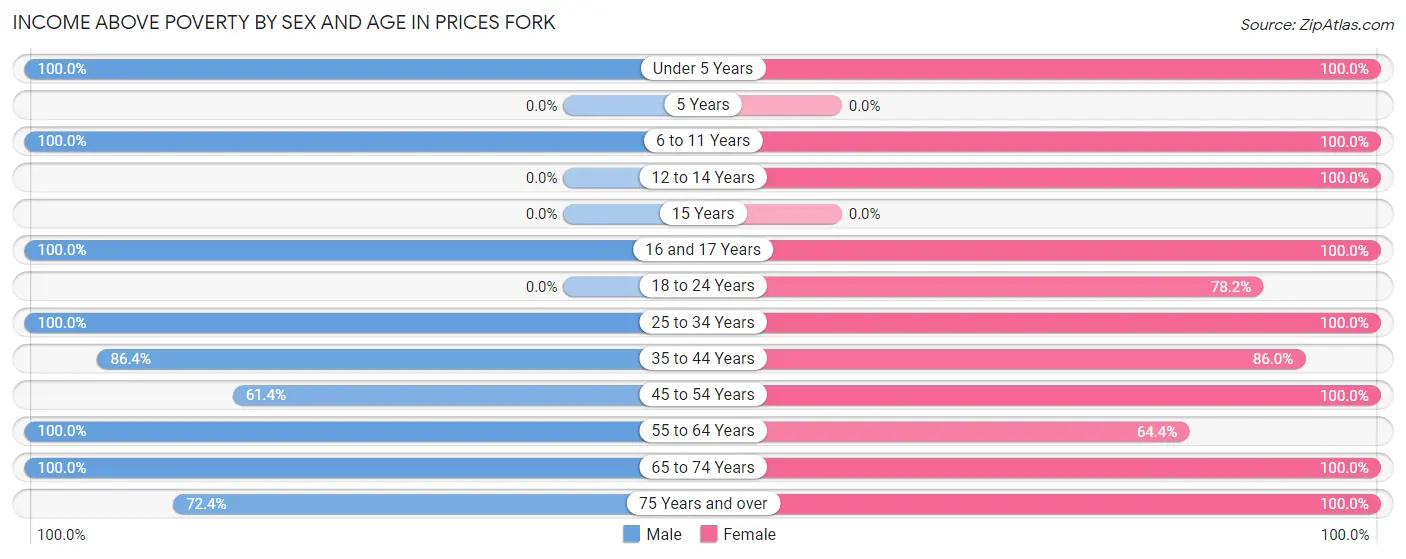
| Age Bracket | Male | Female |
| Under 5 Years | 29 (100.0%) | 16 (100.0%) |
| 5 Years | 0 (0.0%) | 0 (0.0%) |
| 6 to 11 Years | 62 (100.0%) | 66 (100.0%) |
| 12 to 14 Years | 0 (0.0%) | 17 (100.0%) |
| 15 Years | 0 (0.0%) | 0 (0.0%) |
| 16 and 17 Years | 14 (100.0%) | 25 (100.0%) |
| 18 to 24 Years | 0 (0.0%) | 43 (78.2%) |
| 25 to 34 Years | 94 (100.0%) | 18 (100.0%) |
| 35 to 44 Years | 102 (86.4%) | 92 (86.0%) |
| 45 to 54 Years | 27 (61.4%) | 45 (100.0%) |
| 55 to 64 Years | 92 (100.0%) | 29 (64.4%) |
| 65 to 74 Years | 36 (100.0%) | 34 (100.0%) |
| 75 Years and over | 21 (72.4%) | 41 (100.0%) |
| Total | 477 (87.5%) | 426 (90.8%) |
Income Below Poverty Among Married-Couple Families in Prices Fork
The poverty statistics for married-couple families in Prices Fork show that 7.0% or 15 of the total 214 families live below the poverty line. Families with no children have the highest poverty rate of 11.2%, comprising of 15 families. On the other hand, families with 1 or 2 children have the lowest poverty rate of 0.0%, which includes 0 families.
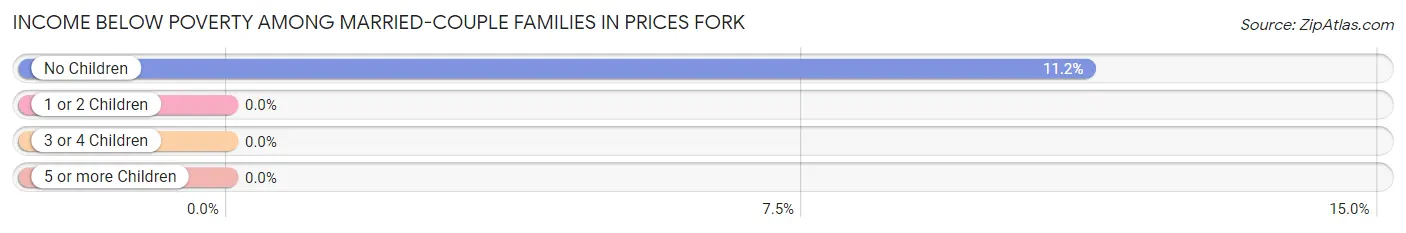
| Children | Above Poverty | Below Poverty |
| No Children | 119 (88.8%) | 15 (11.2%) |
| 1 or 2 Children | 36 (100.0%) | 0 (0.0%) |
| 3 or 4 Children | 44 (100.0%) | 0 (0.0%) |
| 5 or more Children | 0 (0.0%) | 0 (0.0%) |
| Total | 199 (93.0%) | 15 (7.0%) |
Income Below Poverty Among Single-Parent Households in Prices Fork
| Children | Single Father | Single Mother |
| No Children | 0 (0.0%) | 0 (0.0%) |
| 1 or 2 Children | 0 (0.0%) | 0 (0.0%) |
| 3 or 4 Children | 0 (0.0%) | 0 (0.0%) |
| 5 or more Children | 0 (0.0%) | 0 (0.0%) |
| Total | 0 (0.0%) | 0 (0.0%) |
Income Below Poverty Among Married-Couple vs Single-Parent Households in Prices Fork
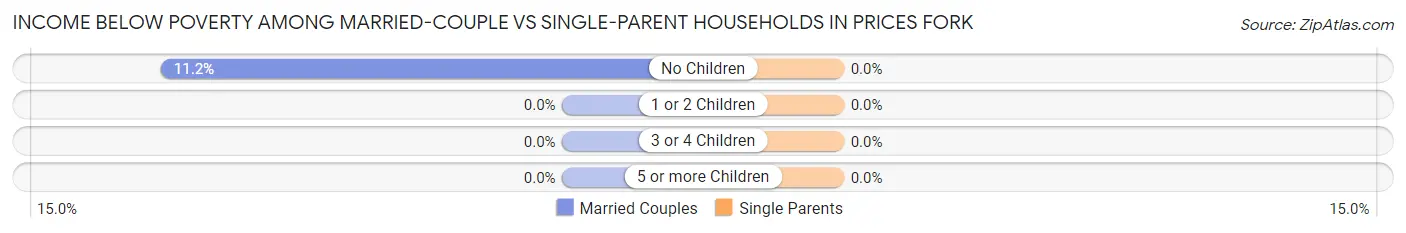
| Children | Married-Couple Families | Single-Parent Households |
| No Children | 15 (11.2%) | 0 (0.0%) |
| 1 or 2 Children | 0 (0.0%) | 0 (0.0%) |
| 3 or 4 Children | 0 (0.0%) | 0 (0.0%) |
| 5 or more Children | 0 (0.0%) | 0 (0.0%) |
| Total | 15 (7.0%) | 0 (0.0%) |
Race in Prices Fork
The most populous races in Prices Fork are White / Caucasian (969 | 95.6%), Hispanic or Latino (51 | 5.0%), and Two or more Races (37 | 3.6%).
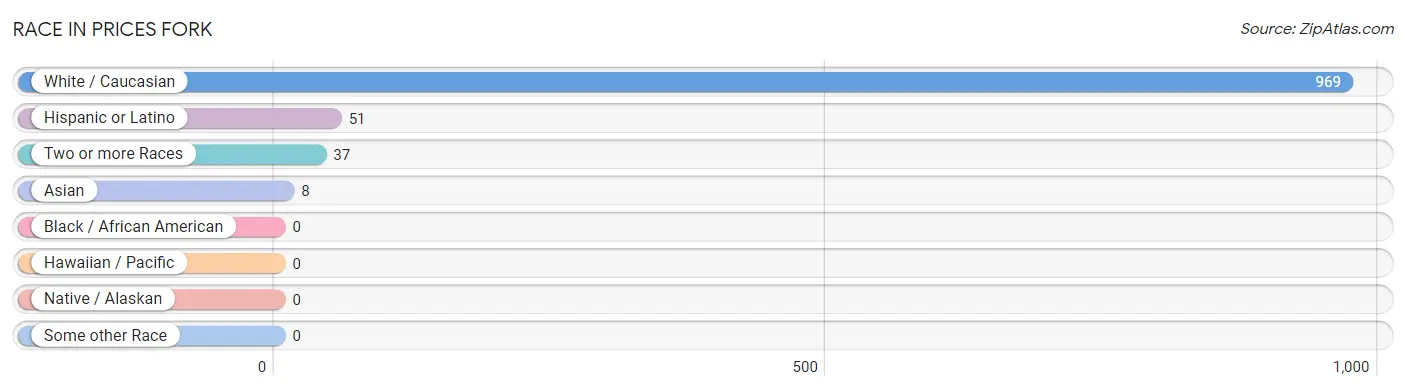
| Race | # Population | % Population |
| Asian | 8 | 0.8% |
| Black / African American | 0 | 0.0% |
| Hawaiian / Pacific | 0 | 0.0% |
| Hispanic or Latino | 51 | 5.0% |
| Native / Alaskan | 0 | 0.0% |
| White / Caucasian | 969 | 95.6% |
| Two or more Races | 37 | 3.6% |
| Some other Race | 0 | 0.0% |
| Total | 1,014 | 100.0% |
Ancestry in Prices Fork
The most populous ancestries reported in Prices Fork are German (226 | 22.3%), Irish (200 | 19.7%), English (172 | 17.0%), Italian (115 | 11.3%), and American (93 | 9.2%), together accounting for 79.5% of all Prices Fork residents.
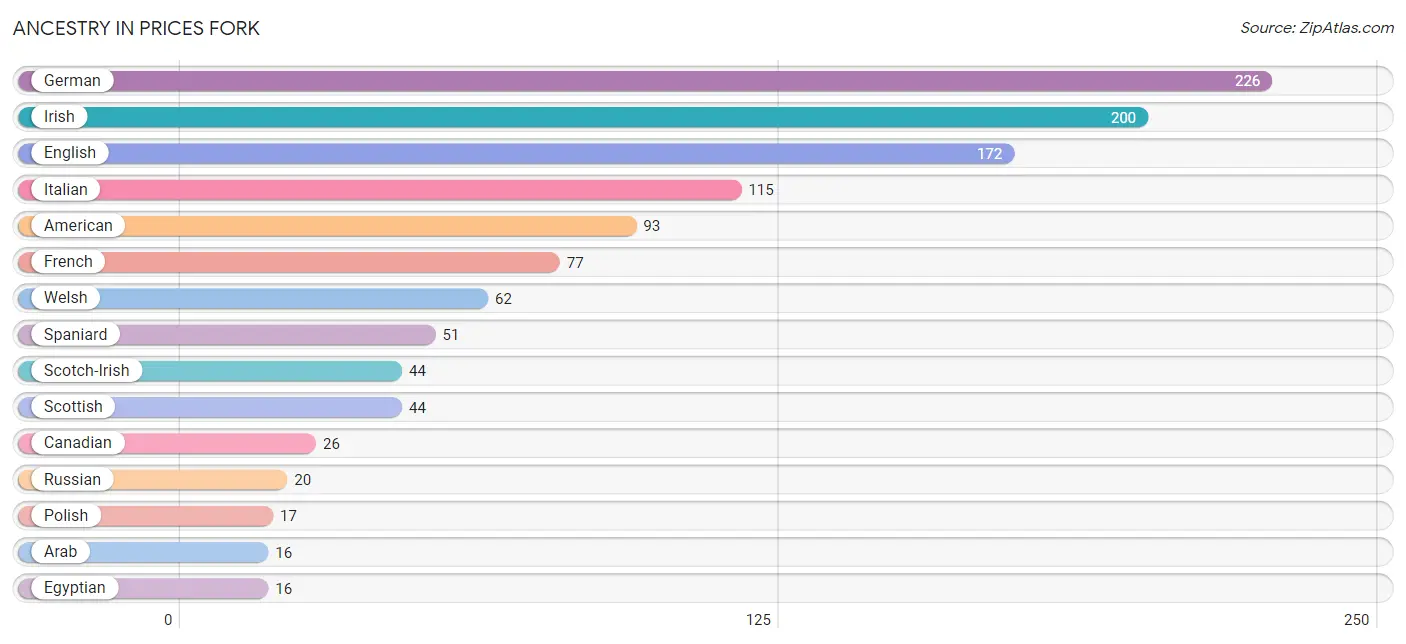
| Ancestry | # Population | % Population |
| American | 93 | 9.2% |
| Arab | 16 | 1.6% |
| Austrian | 8 | 0.8% |
| Canadian | 26 | 2.6% |
| Croatian | 7 | 0.7% |
| Dutch | 15 | 1.5% |
| Egyptian | 16 | 1.6% |
| English | 172 | 17.0% |
| French | 77 | 7.6% |
| French Canadian | 12 | 1.2% |
| German | 226 | 22.3% |
| Irish | 200 | 19.7% |
| Italian | 115 | 11.3% |
| Norwegian | 9 | 0.9% |
| Pakistani | 8 | 0.8% |
| Polish | 17 | 1.7% |
| Russian | 20 | 2.0% |
| Scotch-Irish | 44 | 4.3% |
| Scottish | 44 | 4.3% |
| Spaniard | 51 | 5.0% |
| Swedish | 9 | 0.9% |
| Welsh | 62 | 6.1% | View All 22 Rows |
Immigrants in Prices Fork
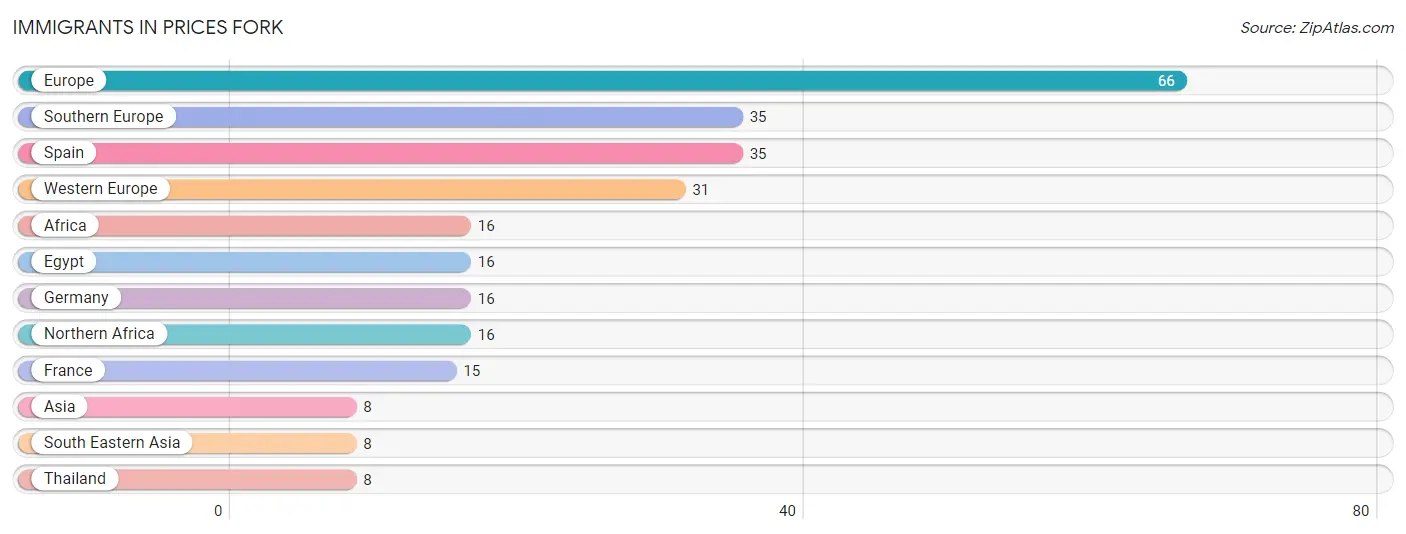
The most numerous immigrant groups reported in Prices Fork came from Europe (66 | 6.5%), Southern Europe (35 | 3.5%), Spain (35 | 3.5%), Western Europe (31 | 3.1%), and Africa (16 | 1.6%), together accounting for 18.0% of all Prices Fork residents.
| Immigration Origin | # Population | % Population |
| Africa | 16 | 1.6% |
| Asia | 8 | 0.8% |
| Egypt | 16 | 1.6% |
| Europe | 66 | 6.5% |
| France | 15 | 1.5% |
| Germany | 16 | 1.6% |
| Northern Africa | 16 | 1.6% |
| South Eastern Asia | 8 | 0.8% |
| Southern Europe | 35 | 3.5% |
| Spain | 35 | 3.5% |
| Thailand | 8 | 0.8% |
| Western Europe | 31 | 3.1% | View All 12 Rows |
Sex and Age in Prices Fork
Sex and Age in Prices Fork
The most populous age groups in Prices Fork are 30 to 34 Years (94 | 17.2%) for men and 35 to 39 Years (99 | 21.1%) for women.
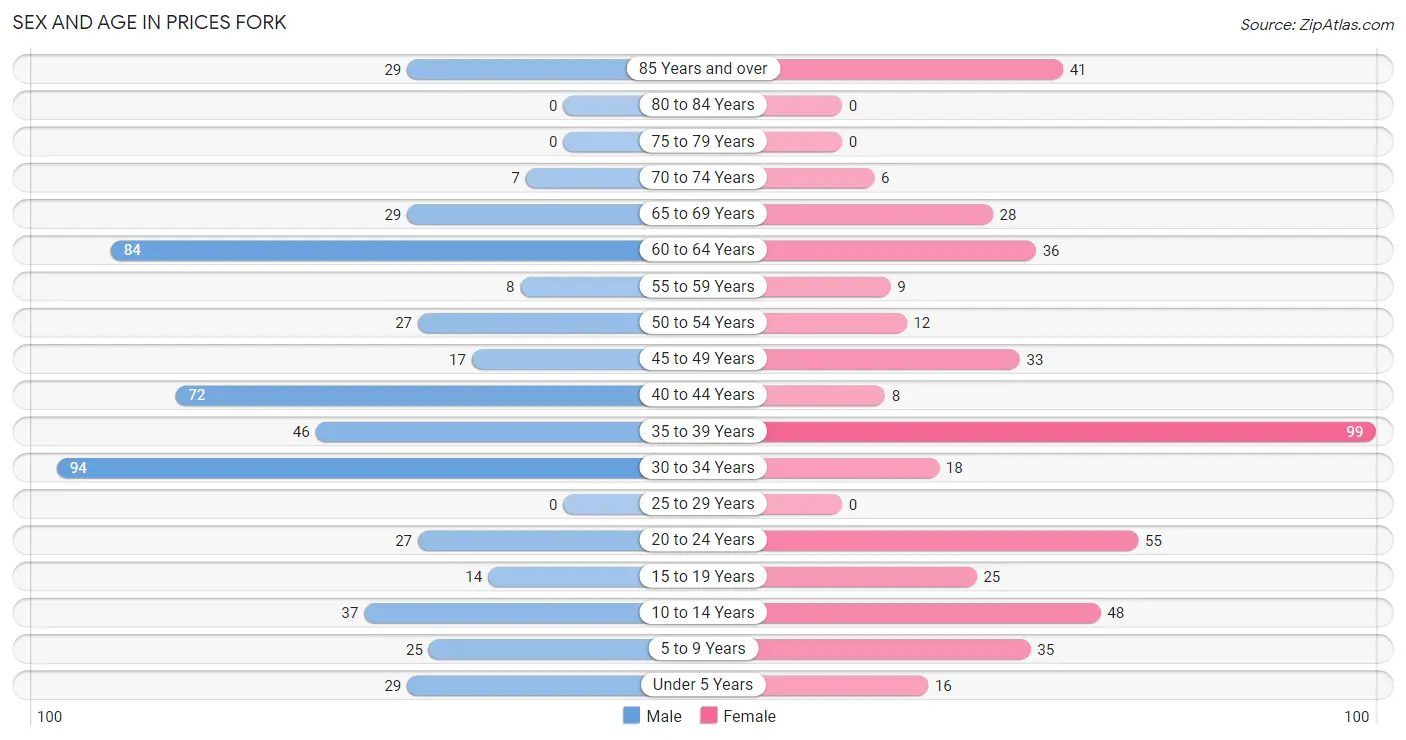
| Age Bracket | Male | Female |
| Under 5 Years | 29 (5.3%) | 16 (3.4%) |
| 5 to 9 Years | 25 (4.6%) | 35 (7.5%) |
| 10 to 14 Years | 37 (6.8%) | 48 (10.2%) |
| 15 to 19 Years | 14 (2.6%) | 25 (5.3%) |
| 20 to 24 Years | 27 (5.0%) | 55 (11.7%) |
| 25 to 29 Years | 0 (0.0%) | 0 (0.0%) |
| 30 to 34 Years | 94 (17.2%) | 18 (3.8%) |
| 35 to 39 Years | 46 (8.4%) | 99 (21.1%) |
| 40 to 44 Years | 72 (13.2%) | 8 (1.7%) |
| 45 to 49 Years | 17 (3.1%) | 33 (7.0%) |
| 50 to 54 Years | 27 (5.0%) | 12 (2.6%) |
| 55 to 59 Years | 8 (1.5%) | 9 (1.9%) |
| 60 to 64 Years | 84 (15.4%) | 36 (7.7%) |
| 65 to 69 Years | 29 (5.3%) | 28 (6.0%) |
| 70 to 74 Years | 7 (1.3%) | 6 (1.3%) |
| 75 to 79 Years | 0 (0.0%) | 0 (0.0%) |
| 80 to 84 Years | 0 (0.0%) | 0 (0.0%) |
| 85 Years and over | 29 (5.3%) | 41 (8.7%) |
| Total | 545 (100.0%) | 469 (100.0%) |
Families and Households in Prices Fork
Median Family Size in Prices Fork
The median family size in Prices Fork is 2.72 persons per family, with single male/father families (23 | 7.5%) accounting for the largest median family size of 3.35 persons per family. On the other hand, single female/mother families (68 | 22.3%) represent the smallest median family size with 2.13 persons per family.
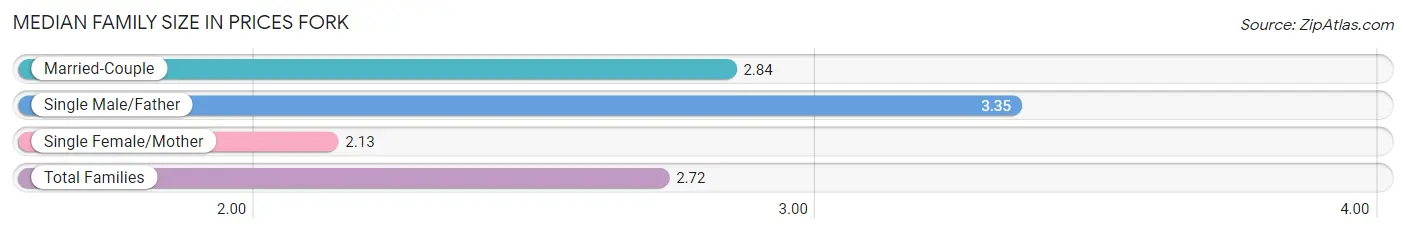
| Family Type | # Families | Family Size |
| Married-Couple | 214 (70.2%) | 2.84 |
| Single Male/Father | 23 (7.5%) | 3.35 |
| Single Female/Mother | 68 (22.3%) | 2.13 |
| Total Families | 305 (100.0%) | 2.72 |
Median Household Size in Prices Fork
The median household size in Prices Fork is 2.21 persons per household, with single male/father households (23 | 5.0%) accounting for the largest median household size of 3.65 persons per household. non-family households (154 | 33.6%) represent the smallest median household size with 1.16 persons per household.
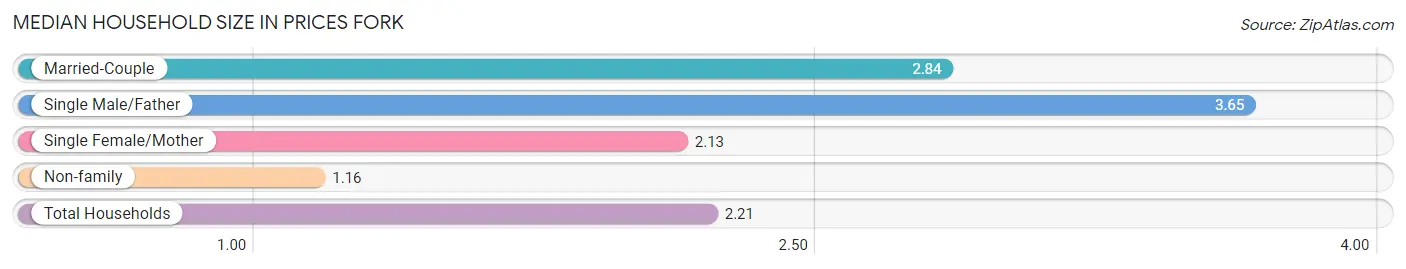
| Household Type | # Households | Household Size |
| Married-Couple | 214 (46.6%) | 2.84 |
| Single Male/Father | 23 (5.0%) | 3.65 |
| Single Female/Mother | 68 (14.8%) | 2.13 |
| Non-family | 154 (33.6%) | 1.16 |
| Total Households | 459 (100.0%) | 2.21 |
Household Size by Marriage Status in Prices Fork
Out of a total of 459 households in Prices Fork, 305 (66.4%) are family households, while 154 (33.6%) are nonfamily households. The most numerous type of family households are 2-person households, comprising 196, and the most common type of nonfamily households are 1-person households, comprising 134.
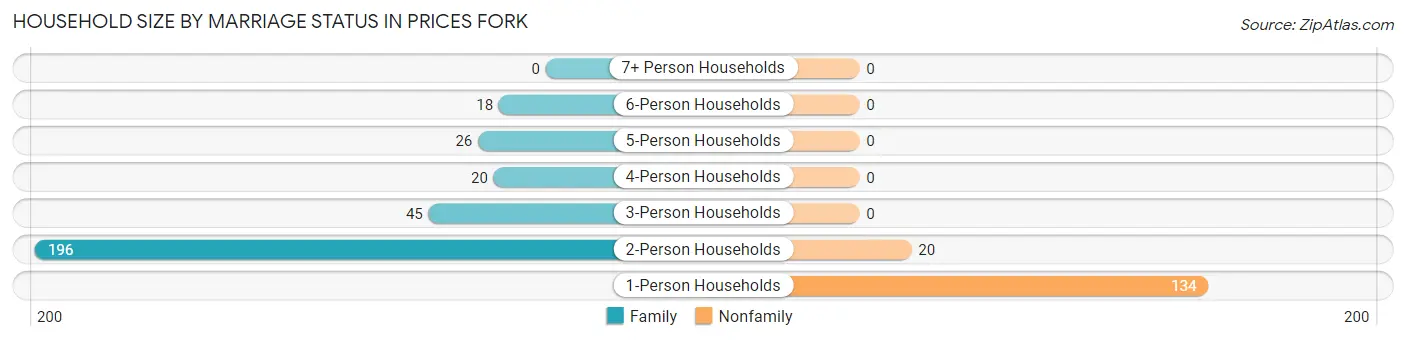
| Household Size | Family Households | Nonfamily Households |
| 1-Person Households | - | 134 (29.2%) |
| 2-Person Households | 196 (42.7%) | 20 (4.4%) |
| 3-Person Households | 45 (9.8%) | 0 (0.0%) |
| 4-Person Households | 20 (4.4%) | 0 (0.0%) |
| 5-Person Households | 26 (5.7%) | 0 (0.0%) |
| 6-Person Households | 18 (3.9%) | 0 (0.0%) |
| 7+ Person Households | 0 (0.0%) | 0 (0.0%) |
| Total | 305 (66.4%) | 154 (33.6%) |
Female Fertility in Prices Fork
Fertility by Age in Prices Fork
| Age Bracket | Women with Births | Births / 1,000 Women |
| 15 to 19 years | 0 (0.0%) | 0.0 |
| 20 to 34 years | 0 (0.0%) | 0.0 |
| 35 to 50 years | 0 (0.0%) | 0.0 |
| Total | 0 (0.0%) | 0.0 |
Fertility by Age by Marriage Status in Prices Fork
| Age Bracket | Married | Unmarried |
| 15 to 19 years | 0 (0.0%) | 0 (0.0%) |
| 20 to 34 years | 0 (0.0%) | 0 (0.0%) |
| 35 to 50 years | 0 (0.0%) | 0 (0.0%) |
| Total | 0 (0.0%) | 0 (0.0%) |
Fertility by Education in Prices Fork
| Educational Attainment | Women with Births | Births / 1,000 Women |
| Less than High School | 0 (0.0%) | 0.0 |
| High School Diploma | 0 (0.0%) | 0.0 |
| College or Associate's Degree | 0 (0.0%) | 0.0 |
| Bachelor's Degree | 0 (0.0%) | 0.0 |
| Graduate Degree | 0 (0.0%) | 0.0 |
| Total | 0 (0.0%) | 0.0 |
Fertility by Education by Marriage Status in Prices Fork
| Educational Attainment | Married | Unmarried |
| Less than High School | 0 (0.0%) | 0 (0.0%) |
| High School Diploma | 0 (0.0%) | 0 (0.0%) |
| College or Associate's Degree | 0 (0.0%) | 0 (0.0%) |
| Bachelor's Degree | 0 (0.0%) | 0 (0.0%) |
| Graduate Degree | 0 (0.0%) | 0 (0.0%) |
| Total | 0 (0.0%) | 0 (0.0%) |
Employment Characteristics in Prices Fork
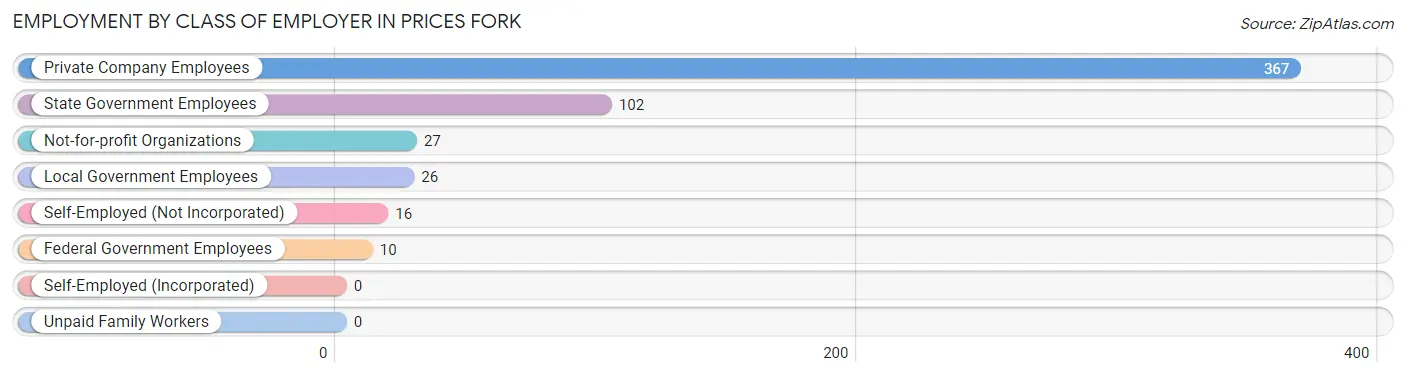
Employment by Class of Employer in Prices Fork
Among the 548 employed individuals in Prices Fork, private company employees (367 | 67.0%), state government employees (102 | 18.6%), and not-for-profit organizations (27 | 4.9%) make up the most common classes of employment.
| Employer Class | # Employees | % Employees |
| Private Company Employees | 367 | 67.0% |
| Self-Employed (Incorporated) | 0 | 0.0% |
| Self-Employed (Not Incorporated) | 16 | 2.9% |
| Not-for-profit Organizations | 27 | 4.9% |
| Local Government Employees | 26 | 4.7% |
| State Government Employees | 102 | 18.6% |
| Federal Government Employees | 10 | 1.8% |
| Unpaid Family Workers | 0 | 0.0% |
| Total | 548 | 100.0% |
Employment Status by Age in Prices Fork
According to the labor force statistics for Prices Fork, out of the total population over 16 years of age (824), 70.3% or 579 individuals are in the labor force, with 5.4% or 31 of them unemployed. The age group with the highest labor force participation rate is 30 to 34 years, with 100.0% or 112 individuals in the labor force. Within the labor force, the 35 to 44 years age range has the highest percentage of unemployed individuals, with 14.8% or 31 of them being unemployed.
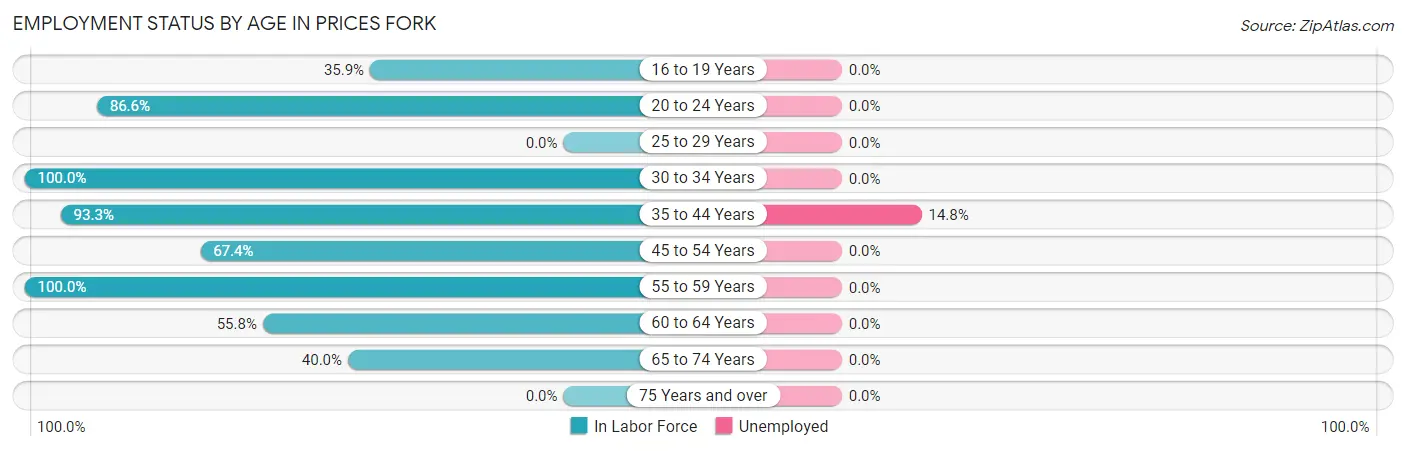
| Age Bracket | In Labor Force | Unemployed |
| 16 to 19 Years | 14 (35.9%) | 0 (0.0%) |
| 20 to 24 Years | 71 (86.6%) | 0 (0.0%) |
| 25 to 29 Years | 0 (0.0%) | 0 (0.0%) |
| 30 to 34 Years | 112 (100.0%) | 0 (0.0%) |
| 35 to 44 Years | 210 (93.3%) | 31 (14.8%) |
| 45 to 54 Years | 60 (67.4%) | 0 (0.0%) |
| 55 to 59 Years | 17 (100.0%) | 0 (0.0%) |
| 60 to 64 Years | 67 (55.8%) | 0 (0.0%) |
| 65 to 74 Years | 28 (40.0%) | 0 (0.0%) |
| 75 Years and over | 0 (0.0%) | 0 (0.0%) |
| Total | 579 (70.3%) | 31 (5.4%) |
Employment Status by Educational Attainment in Prices Fork
According to labor force statistics for Prices Fork, 82.8% of individuals (466) out of the total population between 25 and 64 years of age (563) are in the labor force, with 6.8% or 32 of them being unemployed. The group with the highest labor force participation rate are those with the educational attainment of high school diploma, with 100.0% or 95 individuals in the labor force. Within the labor force, individuals with high school diploma education have the highest percentage of unemployment, with 15.8% or 15 of them being unemployed.
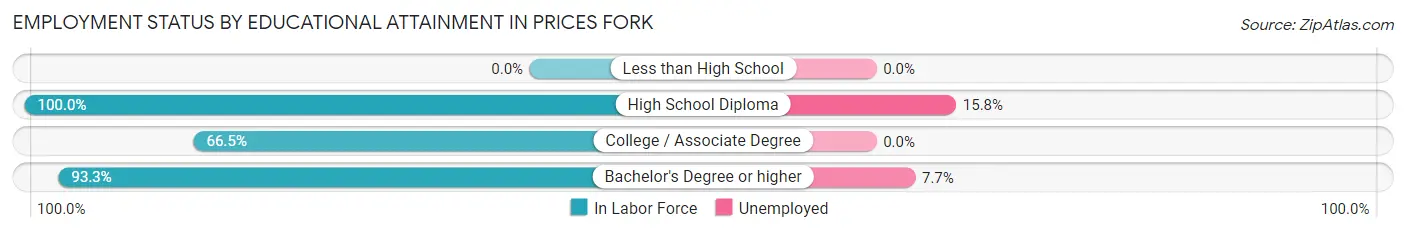
| Educational Attainment | In Labor Force | Unemployed |
| Less than High School | 0 (0.0%) | 0 (0.0%) |
| High School Diploma | 95 (100.0%) | 15 (15.8%) |
| College / Associate Degree | 163 (66.5%) | 0 (0.0%) |
| Bachelor's Degree or higher | 208 (93.3%) | 17 (7.7%) |
| Total | 466 (82.8%) | 38 (6.8%) |
Employment Occupations by Sex in Prices Fork
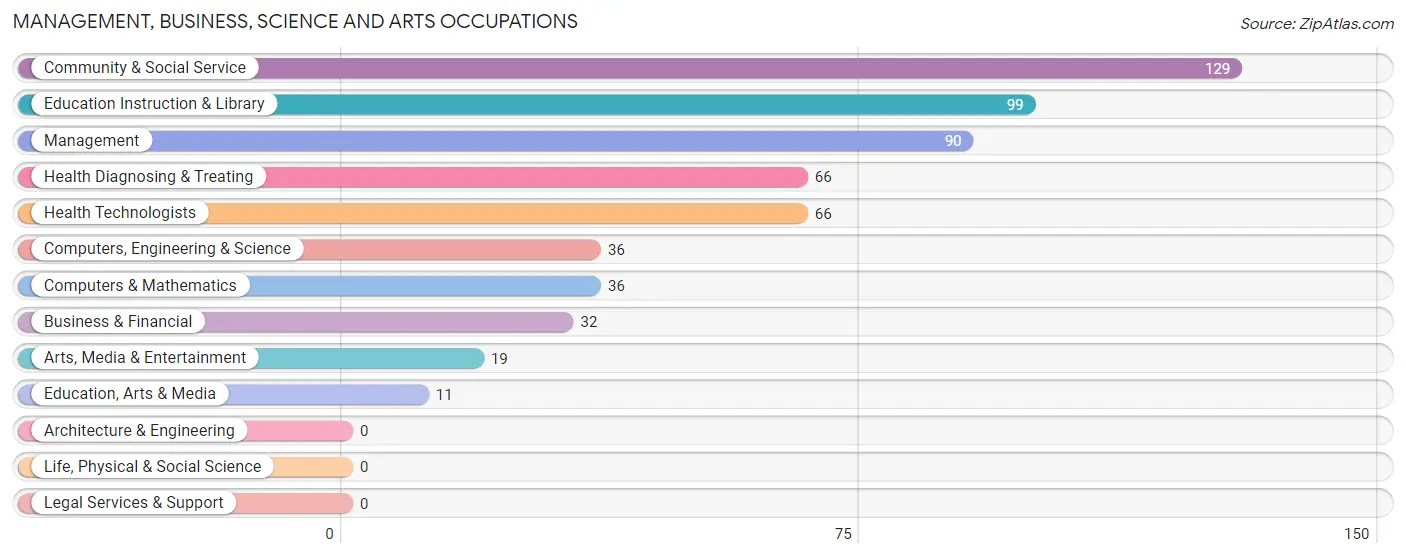
Management, Business, Science and Arts Occupations
The most common Management, Business, Science and Arts occupations in Prices Fork are Community & Social Service (129 | 24.0%), Education Instruction & Library (99 | 18.4%), Management (90 | 16.7%), Health Diagnosing & Treating (66 | 12.3%), and Health Technologists (66 | 12.3%).
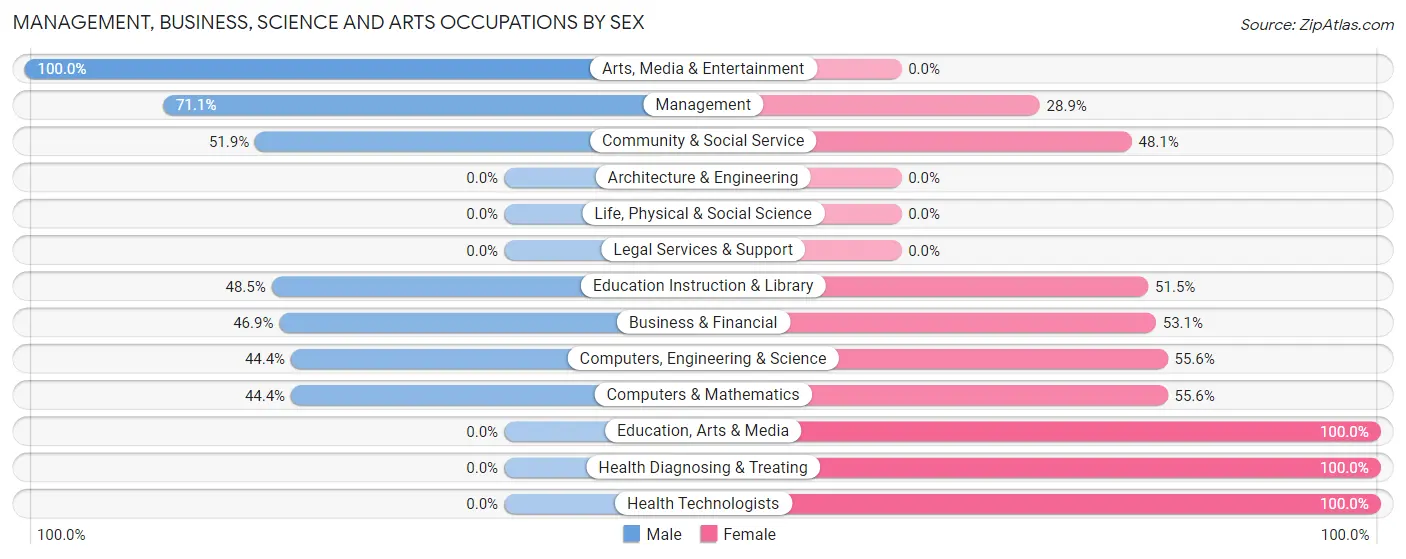
Management, Business, Science and Arts Occupations by Sex
Within the Management, Business, Science and Arts occupations in Prices Fork, the most male-oriented occupations are Arts, Media & Entertainment (100.0%), Management (71.1%), and Community & Social Service (51.9%), while the most female-oriented occupations are Education, Arts & Media (100.0%), Health Diagnosing & Treating (100.0%), and Health Technologists (100.0%).
| Occupation | Male | Female |
| Management | 64 (71.1%) | 26 (28.9%) |
| Business & Financial | 15 (46.9%) | 17 (53.1%) |
| Computers, Engineering & Science | 16 (44.4%) | 20 (55.6%) |
| Computers & Mathematics | 16 (44.4%) | 20 (55.6%) |
| Architecture & Engineering | 0 (0.0%) | 0 (0.0%) |
| Life, Physical & Social Science | 0 (0.0%) | 0 (0.0%) |
| Community & Social Service | 67 (51.9%) | 62 (48.1%) |
| Education, Arts & Media | 0 (0.0%) | 11 (100.0%) |
| Legal Services & Support | 0 (0.0%) | 0 (0.0%) |
| Education Instruction & Library | 48 (48.5%) | 51 (51.5%) |
| Arts, Media & Entertainment | 19 (100.0%) | 0 (0.0%) |
| Health Diagnosing & Treating | 0 (0.0%) | 66 (100.0%) |
| Health Technologists | 0 (0.0%) | 66 (100.0%) |
| Total (Category) | 162 (45.9%) | 191 (54.1%) |
| Total (Overall) | 289 (53.7%) | 249 (46.3%) |
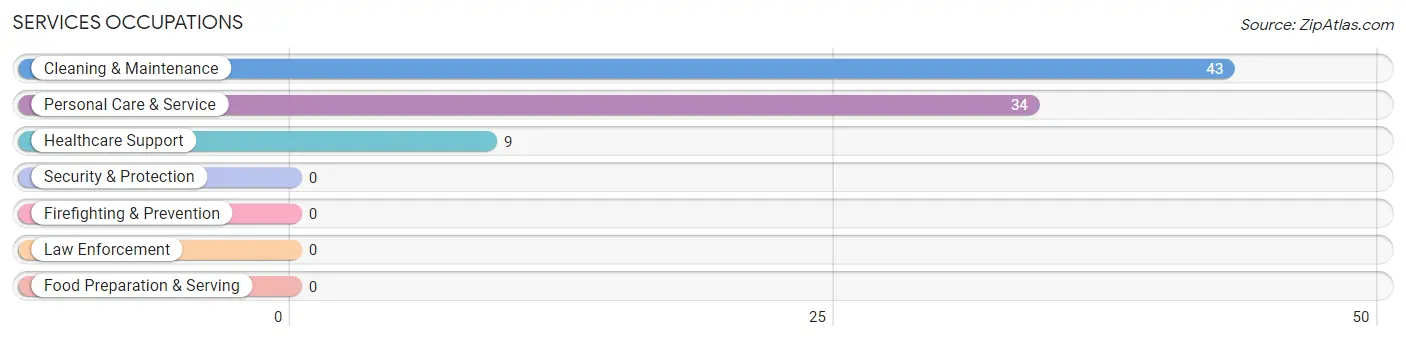
Services Occupations
The most common Services occupations in Prices Fork are Cleaning & Maintenance (43 | 8.0%), Personal Care & Service (34 | 6.3%), and Healthcare Support (9 | 1.7%).
Services Occupations by Sex
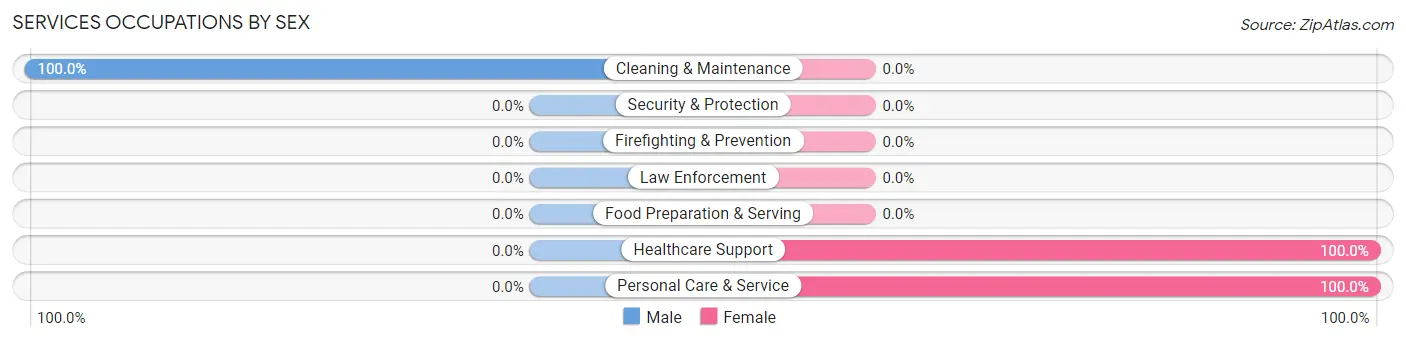
| Occupation | Male | Female |
| Healthcare Support | 0 (0.0%) | 9 (100.0%) |
| Security & Protection | 0 (0.0%) | 0 (0.0%) |
| Firefighting & Prevention | 0 (0.0%) | 0 (0.0%) |
| Law Enforcement | 0 (0.0%) | 0 (0.0%) |
| Food Preparation & Serving | 0 (0.0%) | 0 (0.0%) |
| Cleaning & Maintenance | 43 (100.0%) | 0 (0.0%) |
| Personal Care & Service | 0 (0.0%) | 34 (100.0%) |
| Total (Category) | 43 (50.0%) | 43 (50.0%) |
| Total (Overall) | 289 (53.7%) | 249 (46.3%) |
Sales and Office Occupations
The most common Sales and Office occupations in Prices Fork are Office & Administration (15 | 2.8%), and Sales & Related (7 | 1.3%).
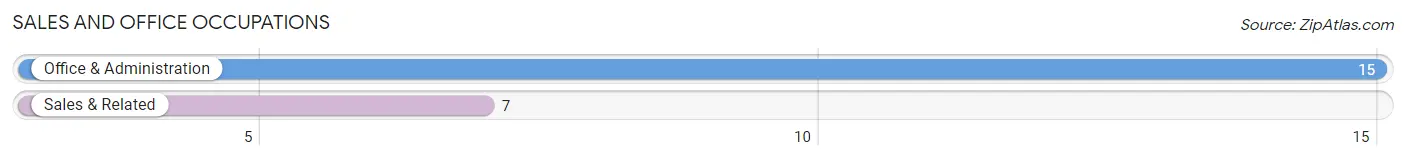
Sales and Office Occupations by Sex
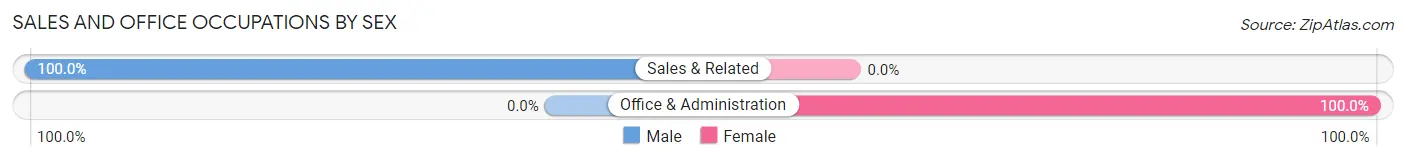
| Occupation | Male | Female |
| Sales & Related | 7 (100.0%) | 0 (0.0%) |
| Office & Administration | 0 (0.0%) | 15 (100.0%) |
| Total (Category) | 7 (31.8%) | 15 (68.2%) |
| Total (Overall) | 289 (53.7%) | 249 (46.3%) |
Natural Resources, Construction and Maintenance Occupations
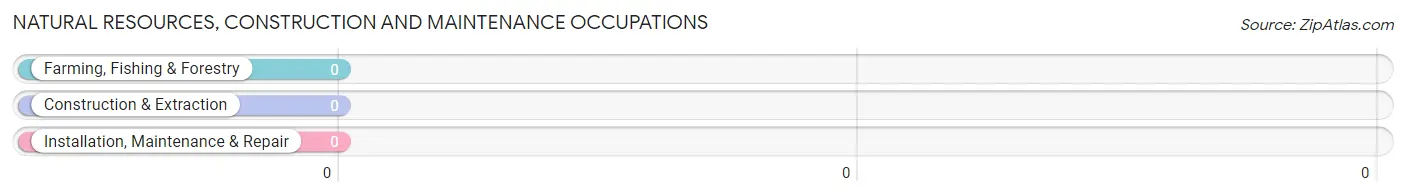
Natural Resources, Construction and Maintenance Occupations by Sex
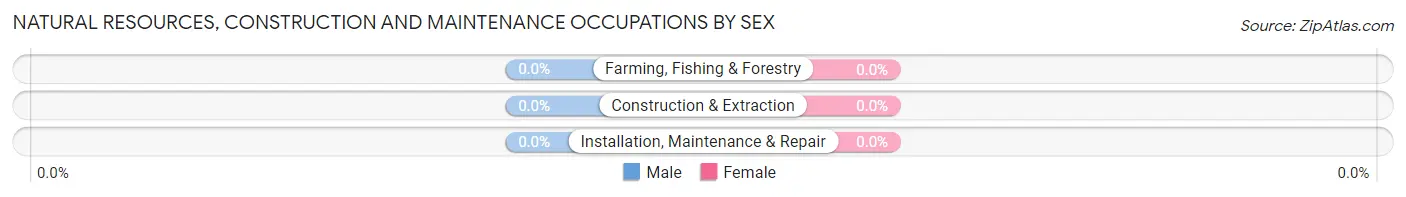
| Occupation | Male | Female |
| Farming, Fishing & Forestry | 0 (0.0%) | 0 (0.0%) |
| Construction & Extraction | 0 (0.0%) | 0 (0.0%) |
| Installation, Maintenance & Repair | 0 (0.0%) | 0 (0.0%) |
| Total (Category) | 0 (0.0%) | 0 (0.0%) |
| Total (Overall) | 289 (53.7%) | 249 (46.3%) |
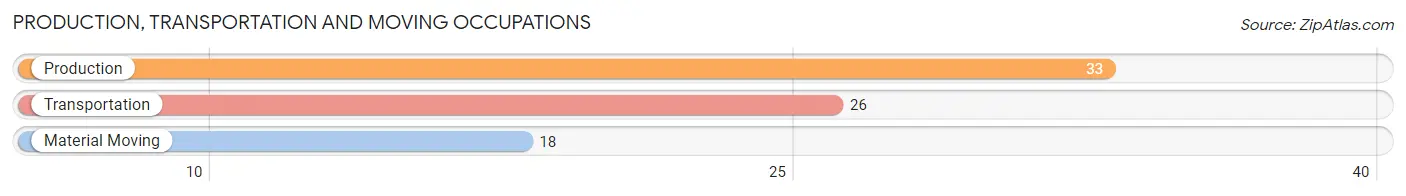
Production, Transportation and Moving Occupations
The most common Production, Transportation and Moving occupations in Prices Fork are Production (33 | 6.1%), Transportation (26 | 4.8%), and Material Moving (18 | 3.4%).
Production, Transportation and Moving Occupations by Sex
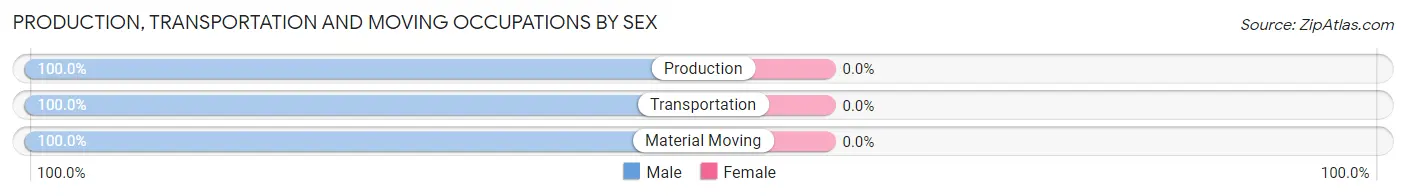
| Occupation | Male | Female |
| Production | 33 (100.0%) | 0 (0.0%) |
| Transportation | 26 (100.0%) | 0 (0.0%) |
| Material Moving | 18 (100.0%) | 0 (0.0%) |
| Total (Category) | 77 (100.0%) | 0 (0.0%) |
| Total (Overall) | 289 (53.7%) | 249 (46.3%) |
Employment Industries by Sex in Prices Fork
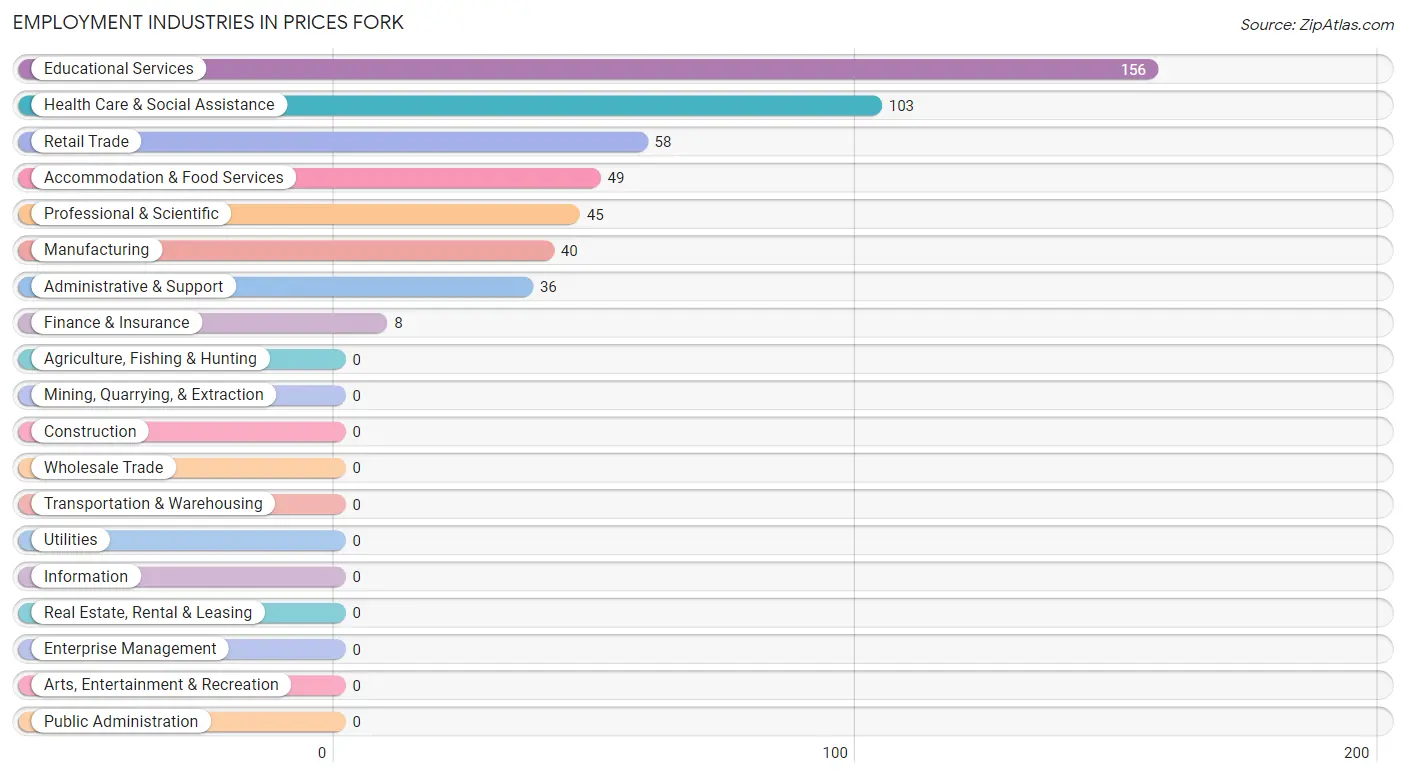
Employment Industries in Prices Fork
The major employment industries in Prices Fork include Educational Services (156 | 29.0%), Health Care & Social Assistance (103 | 19.1%), Retail Trade (58 | 10.8%), Accommodation & Food Services (49 | 9.1%), and Professional & Scientific (45 | 8.4%).
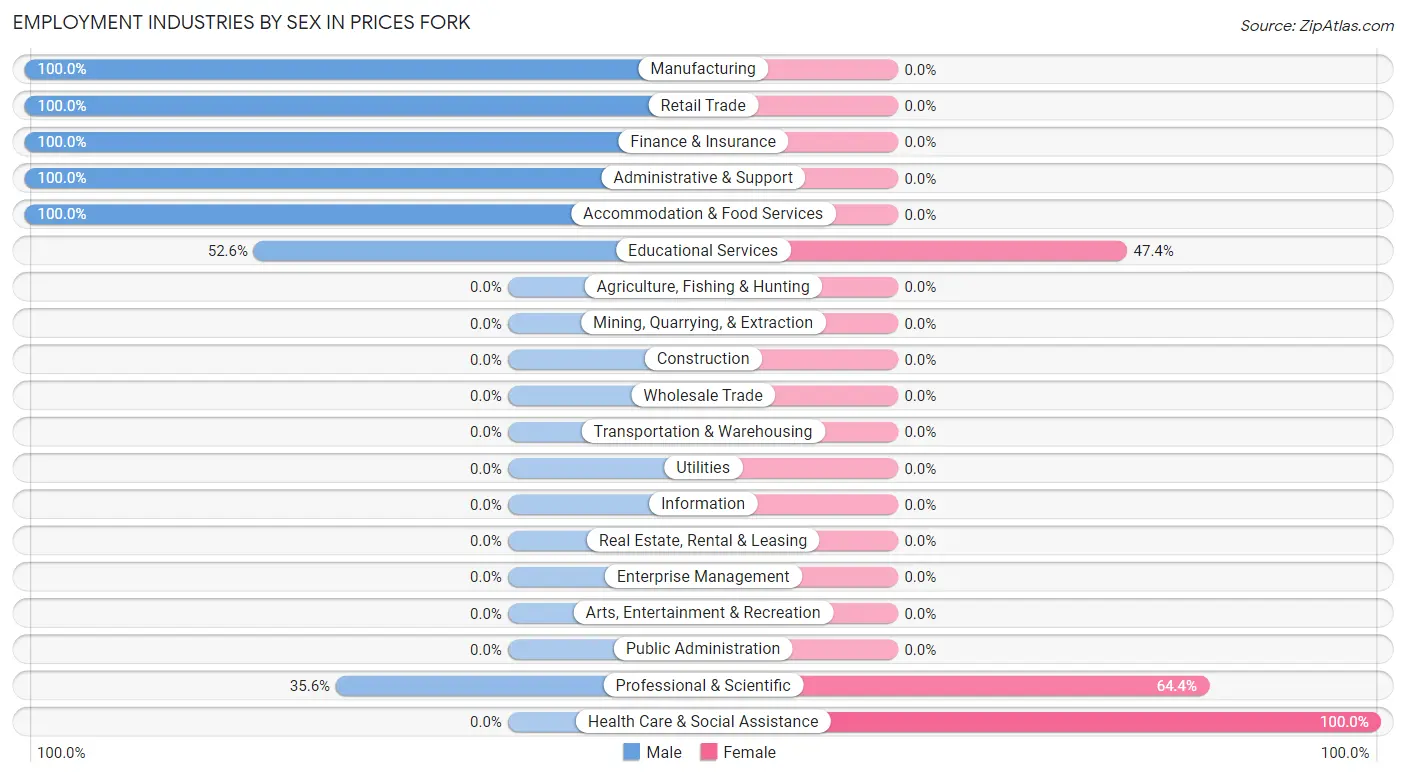
Employment Industries by Sex in Prices Fork
The Prices Fork industries that see more men than women are Manufacturing (100.0%), Retail Trade (100.0%), and Finance & Insurance (100.0%), whereas the industries that tend to have a higher number of women are Health Care & Social Assistance (100.0%), Professional & Scientific (64.4%), and Educational Services (47.4%).
| Industry | Male | Female |
| Agriculture, Fishing & Hunting | 0 (0.0%) | 0 (0.0%) |
| Mining, Quarrying, & Extraction | 0 (0.0%) | 0 (0.0%) |
| Construction | 0 (0.0%) | 0 (0.0%) |
| Manufacturing | 40 (100.0%) | 0 (0.0%) |
| Wholesale Trade | 0 (0.0%) | 0 (0.0%) |
| Retail Trade | 58 (100.0%) | 0 (0.0%) |
| Transportation & Warehousing | 0 (0.0%) | 0 (0.0%) |
| Utilities | 0 (0.0%) | 0 (0.0%) |
| Information | 0 (0.0%) | 0 (0.0%) |
| Finance & Insurance | 8 (100.0%) | 0 (0.0%) |
| Real Estate, Rental & Leasing | 0 (0.0%) | 0 (0.0%) |
| Professional & Scientific | 16 (35.6%) | 29 (64.4%) |
| Enterprise Management | 0 (0.0%) | 0 (0.0%) |
| Administrative & Support | 36 (100.0%) | 0 (0.0%) |
| Educational Services | 82 (52.6%) | 74 (47.4%) |
| Health Care & Social Assistance | 0 (0.0%) | 103 (100.0%) |
| Arts, Entertainment & Recreation | 0 (0.0%) | 0 (0.0%) |
| Accommodation & Food Services | 49 (100.0%) | 0 (0.0%) |
| Public Administration | 0 (0.0%) | 0 (0.0%) |
| Total | 289 (53.7%) | 249 (46.3%) |
Education in Prices Fork
School Enrollment in Prices Fork
The most common levels of schooling among the 271 students in Prices Fork are elementary school (91 | 33.6%), middle school (54 | 19.9%), and college / undergraduate (48 | 17.7%).
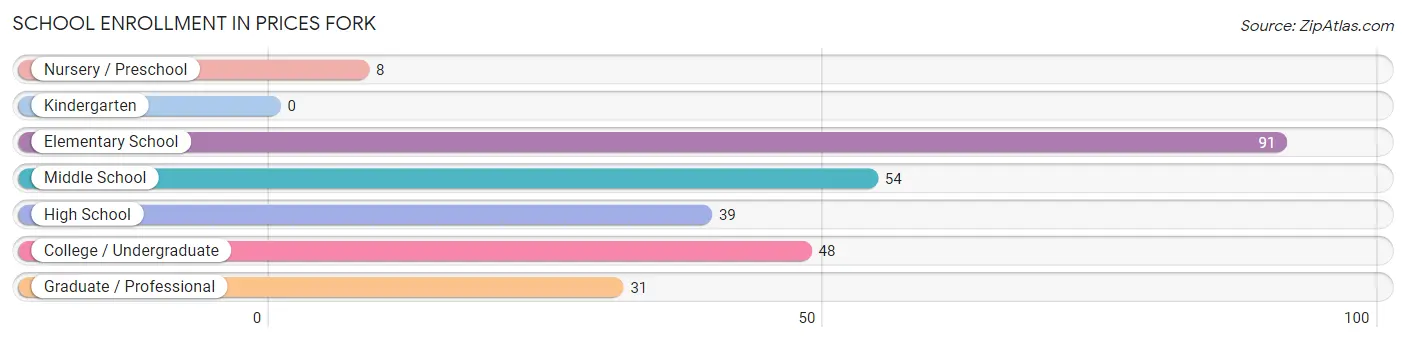
| School Level | # Students | % Students |
| Nursery / Preschool | 8 | 2.9% |
| Kindergarten | 0 | 0.0% |
| Elementary School | 91 | 33.6% |
| Middle School | 54 | 19.9% |
| High School | 39 | 14.4% |
| College / Undergraduate | 48 | 17.7% |
| Graduate / Professional | 31 | 11.4% |
| Total | 271 | 100.0% |
School Enrollment by Age by Funding Source in Prices Fork
Out of a total of 271 students who are enrolled in schools in Prices Fork, 30 (11.1%) attend a private institution, while the remaining 241 (88.9%) are enrolled in public schools. The age group of 3 to 4 year olds has the highest likelihood of being enrolled in private schools, with 8 (100.0% in the age bracket) enrolled. Conversely, the age group of 10 to 14 year olds has the lowest likelihood of being enrolled in a private school, with 85 (100.0% in the age bracket) attending a public institution.
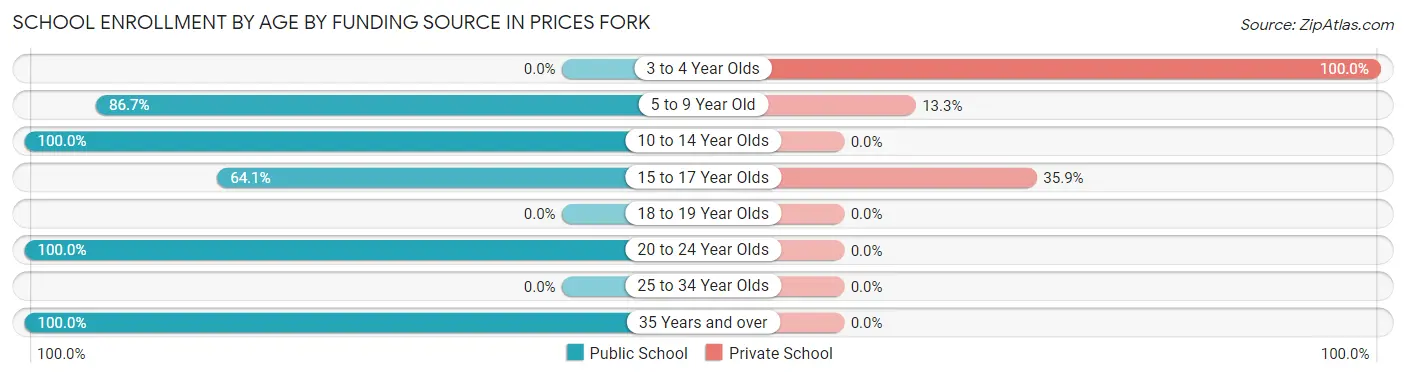
| Age Bracket | Public School | Private School |
| 3 to 4 Year Olds | 0 (0.0%) | 8 (100.0%) |
| 5 to 9 Year Old | 52 (86.7%) | 8 (13.3%) |
| 10 to 14 Year Olds | 85 (100.0%) | 0 (0.0%) |
| 15 to 17 Year Olds | 25 (64.1%) | 14 (35.9%) |
| 18 to 19 Year Olds | 0 (0.0%) | 0 (0.0%) |
| 20 to 24 Year Olds | 48 (100.0%) | 0 (0.0%) |
| 25 to 34 Year Olds | 0 (0.0%) | 0 (0.0%) |
| 35 Years and over | 31 (100.0%) | 0 (0.0%) |
| Total | 241 (88.9%) | 30 (11.1%) |
Educational Attainment by Field of Study in Prices Fork
Engineering (66 | 25.6%), liberal arts & history (31 | 12.0%), business (23 | 8.9%), bio, nature & agricultural (22 | 8.5%), and communications (19 | 7.4%) are the most common fields of study among 258 individuals in Prices Fork who have obtained a bachelor's degree or higher.
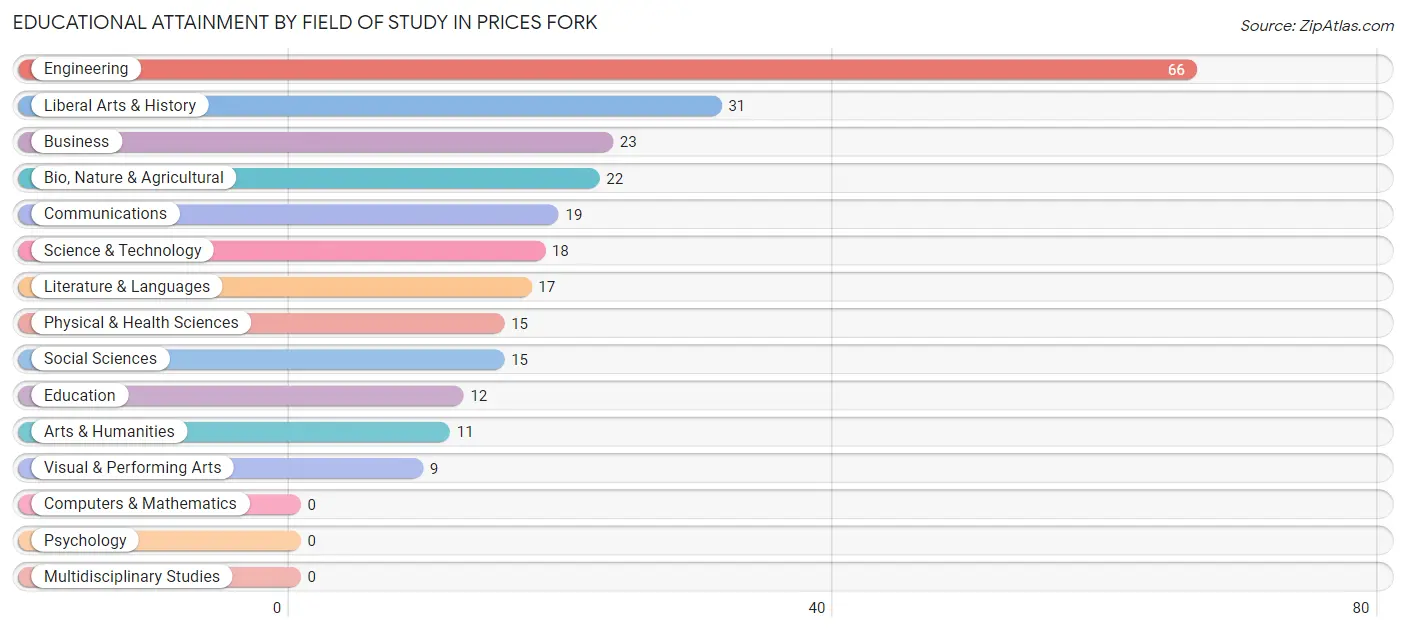
| Field of Study | # Graduates | % Graduates |
| Computers & Mathematics | 0 | 0.0% |
| Bio, Nature & Agricultural | 22 | 8.5% |
| Physical & Health Sciences | 15 | 5.8% |
| Psychology | 0 | 0.0% |
| Social Sciences | 15 | 5.8% |
| Engineering | 66 | 25.6% |
| Multidisciplinary Studies | 0 | 0.0% |
| Science & Technology | 18 | 7.0% |
| Business | 23 | 8.9% |
| Education | 12 | 4.6% |
| Literature & Languages | 17 | 6.6% |
| Liberal Arts & History | 31 | 12.0% |
| Visual & Performing Arts | 9 | 3.5% |
| Communications | 19 | 7.4% |
| Arts & Humanities | 11 | 4.3% |
| Total | 258 | 100.0% |
Transportation & Commute in Prices Fork
Vehicle Availability by Sex in Prices Fork
The most prevalent vehicle ownership categories in Prices Fork are males with 2 vehicles (118, accounting for 39.5%) and females with 2 vehicles (129, making up 47.4%).
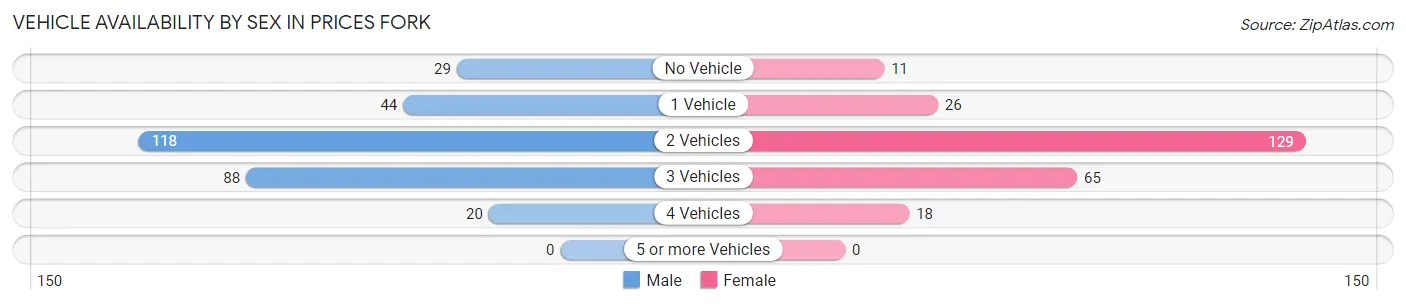
| Vehicles Available | Male | Female |
| No Vehicle | 29 (9.7%) | 11 (4.4%) |
| 1 Vehicle | 44 (14.7%) | 26 (10.4%) |
| 2 Vehicles | 118 (39.5%) | 129 (51.8%) |
| 3 Vehicles | 88 (29.4%) | 65 (26.1%) |
| 4 Vehicles | 20 (6.7%) | 18 (7.2%) |
| 5 or more Vehicles | 0 (0.0%) | 0 (0.0%) |
| Total | 299 (100.0%) | 249 (100.0%) |
Commute Time in Prices Fork
The most frequently occuring commute durations in Prices Fork are 15 to 19 minutes (214 commuters, 40.9%), 10 to 14 minutes (101 commuters, 19.3%), and 20 to 24 minutes (59 commuters, 11.3%).
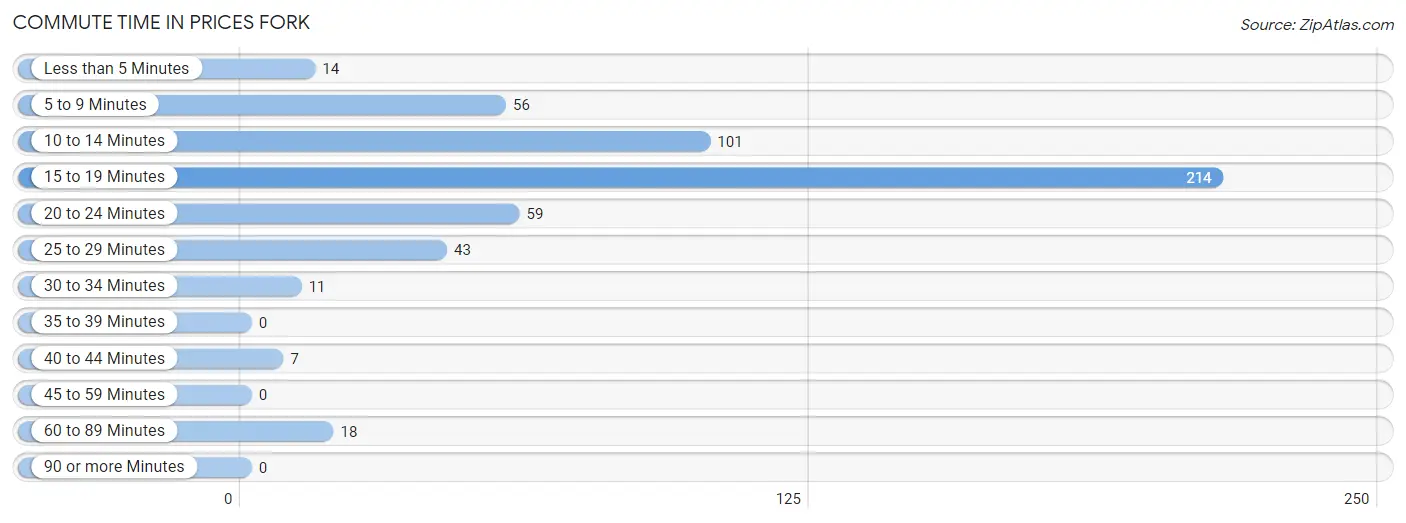
| Commute Time | # Commuters | % Commuters |
| Less than 5 Minutes | 14 | 2.7% |
| 5 to 9 Minutes | 56 | 10.7% |
| 10 to 14 Minutes | 101 | 19.3% |
| 15 to 19 Minutes | 214 | 40.9% |
| 20 to 24 Minutes | 59 | 11.3% |
| 25 to 29 Minutes | 43 | 8.2% |
| 30 to 34 Minutes | 11 | 2.1% |
| 35 to 39 Minutes | 0 | 0.0% |
| 40 to 44 Minutes | 7 | 1.3% |
| 45 to 59 Minutes | 0 | 0.0% |
| 60 to 89 Minutes | 18 | 3.4% |
| 90 or more Minutes | 0 | 0.0% |
Commute Time by Sex in Prices Fork
The most common commute times in Prices Fork are 15 to 19 minutes (148 commuters, 50.9%) for males and 15 to 19 minutes (66 commuters, 28.4%) for females.
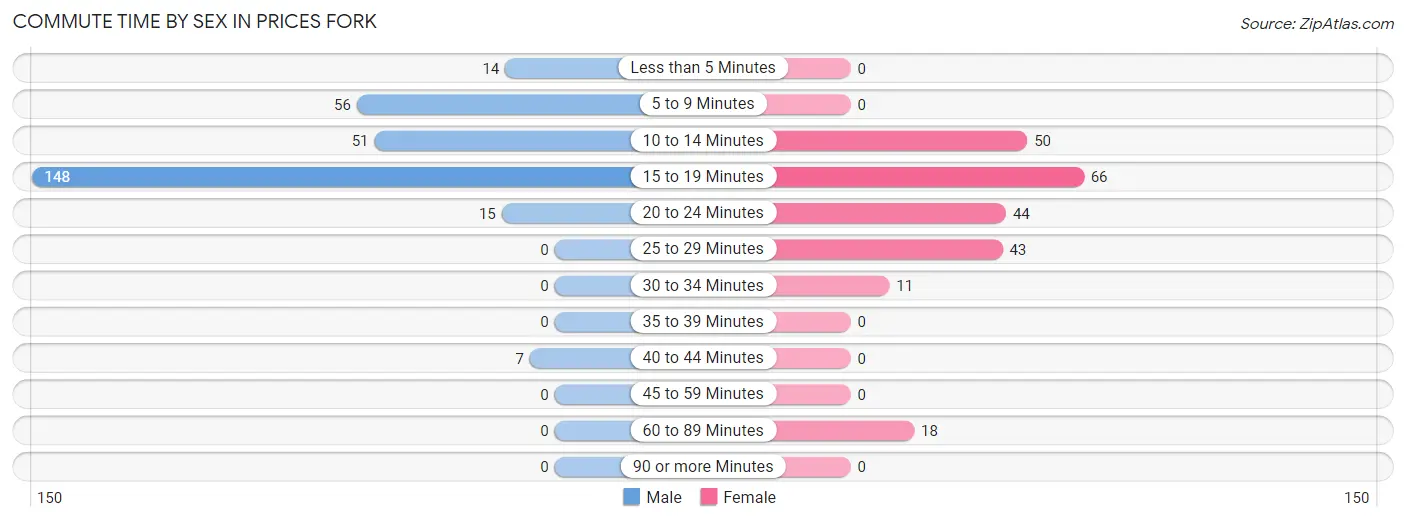
| Commute Time | Male | Female |
| Less than 5 Minutes | 14 (4.8%) | 0 (0.0%) |
| 5 to 9 Minutes | 56 (19.2%) | 0 (0.0%) |
| 10 to 14 Minutes | 51 (17.5%) | 50 (21.5%) |
| 15 to 19 Minutes | 148 (50.9%) | 66 (28.4%) |
| 20 to 24 Minutes | 15 (5.1%) | 44 (19.0%) |
| 25 to 29 Minutes | 0 (0.0%) | 43 (18.5%) |
| 30 to 34 Minutes | 0 (0.0%) | 11 (4.7%) |
| 35 to 39 Minutes | 0 (0.0%) | 0 (0.0%) |
| 40 to 44 Minutes | 7 (2.4%) | 0 (0.0%) |
| 45 to 59 Minutes | 0 (0.0%) | 0 (0.0%) |
| 60 to 89 Minutes | 0 (0.0%) | 18 (7.8%) |
| 90 or more Minutes | 0 (0.0%) | 0 (0.0%) |
Time of Departure to Work by Sex in Prices Fork
The most frequent times of departure to work in Prices Fork are 7:00 AM to 7:29 AM (64, 22.0%) for males and 8:00 AM to 8:29 AM (78, 33.6%) for females.
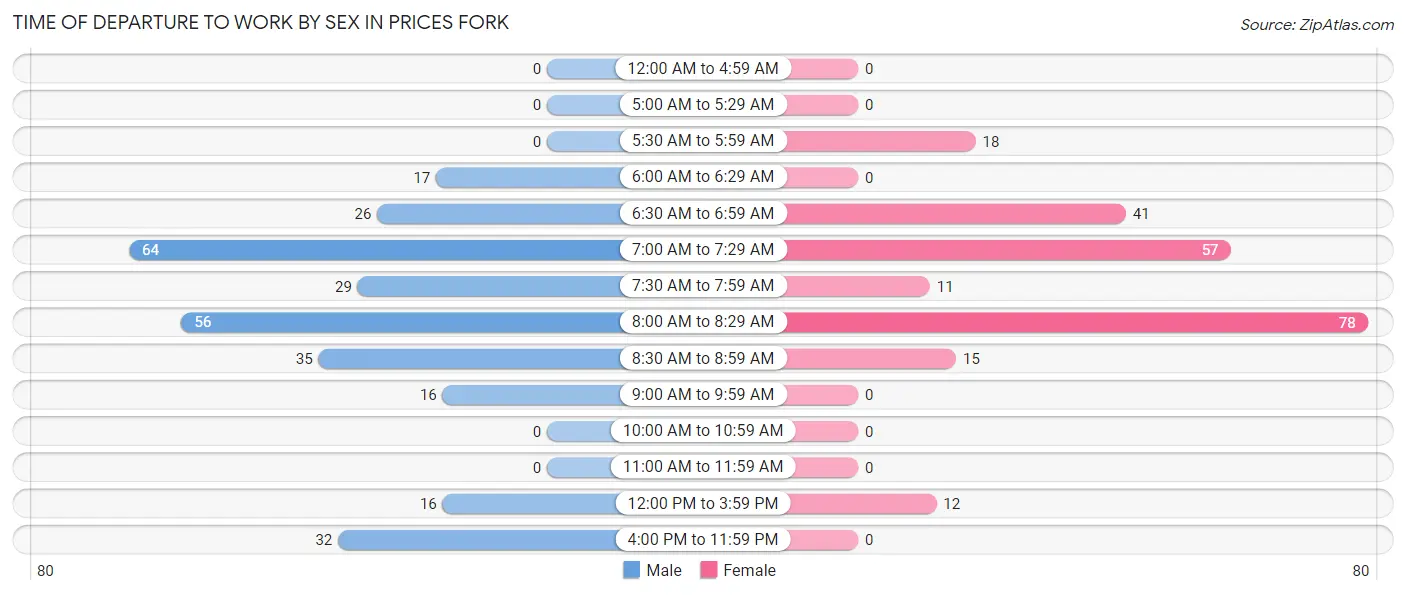
| Time of Departure | Male | Female |
| 12:00 AM to 4:59 AM | 0 (0.0%) | 0 (0.0%) |
| 5:00 AM to 5:29 AM | 0 (0.0%) | 0 (0.0%) |
| 5:30 AM to 5:59 AM | 0 (0.0%) | 18 (7.8%) |
| 6:00 AM to 6:29 AM | 17 (5.8%) | 0 (0.0%) |
| 6:30 AM to 6:59 AM | 26 (8.9%) | 41 (17.7%) |
| 7:00 AM to 7:29 AM | 64 (22.0%) | 57 (24.6%) |
| 7:30 AM to 7:59 AM | 29 (10.0%) | 11 (4.7%) |
| 8:00 AM to 8:29 AM | 56 (19.2%) | 78 (33.6%) |
| 8:30 AM to 8:59 AM | 35 (12.0%) | 15 (6.5%) |
| 9:00 AM to 9:59 AM | 16 (5.5%) | 0 (0.0%) |
| 10:00 AM to 10:59 AM | 0 (0.0%) | 0 (0.0%) |
| 11:00 AM to 11:59 AM | 0 (0.0%) | 0 (0.0%) |
| 12:00 PM to 3:59 PM | 16 (5.5%) | 12 (5.2%) |
| 4:00 PM to 11:59 PM | 32 (11.0%) | 0 (0.0%) |
| Total | 291 (100.0%) | 232 (100.0%) |
Housing Occupancy in Prices Fork
Occupancy by Ownership in Prices Fork
Of the total 459 dwellings in Prices Fork, owner-occupied units account for 201 (43.8%), while renter-occupied units make up 258 (56.2%).
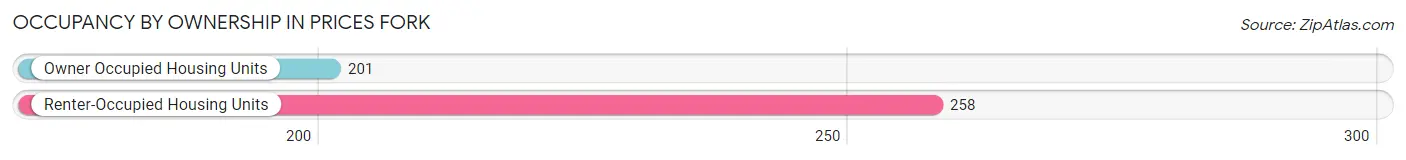
| Occupancy | # Housing Units | % Housing Units |
| Owner Occupied Housing Units | 201 | 43.8% |
| Renter-Occupied Housing Units | 258 | 56.2% |
| Total Occupied Housing Units | 459 | 100.0% |
Occupancy by Household Size in Prices Fork
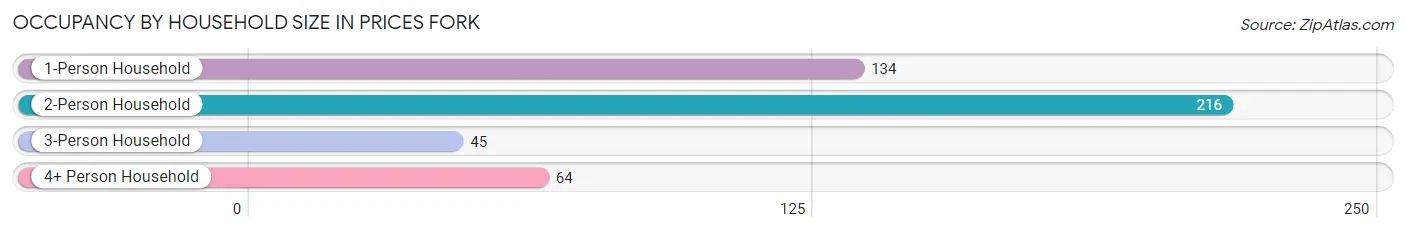
| Household Size | # Housing Units | % Housing Units |
| 1-Person Household | 134 | 29.2% |
| 2-Person Household | 216 | 47.1% |
| 3-Person Household | 45 | 9.8% |
| 4+ Person Household | 64 | 13.9% |
| Total Housing Units | 459 | 100.0% |
Occupancy by Ownership by Household Size in Prices Fork
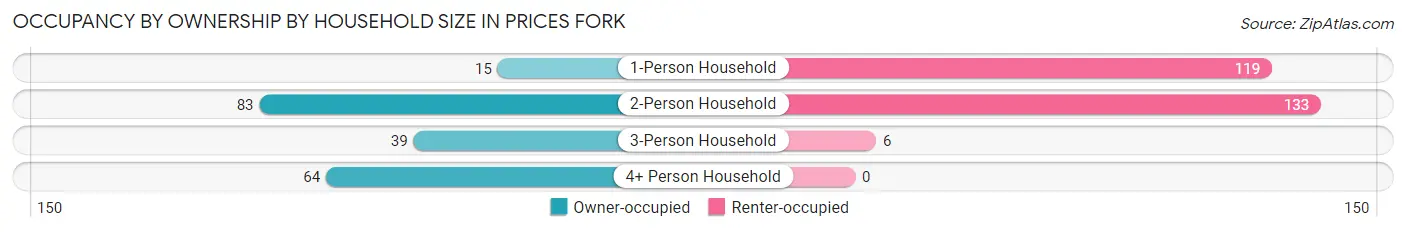
| Household Size | Owner-occupied | Renter-occupied |
| 1-Person Household | 15 (11.2%) | 119 (88.8%) |
| 2-Person Household | 83 (38.4%) | 133 (61.6%) |
| 3-Person Household | 39 (86.7%) | 6 (13.3%) |
| 4+ Person Household | 64 (100.0%) | 0 (0.0%) |
| Total Housing Units | 201 (43.8%) | 258 (56.2%) |
Occupancy by Educational Attainment in Prices Fork
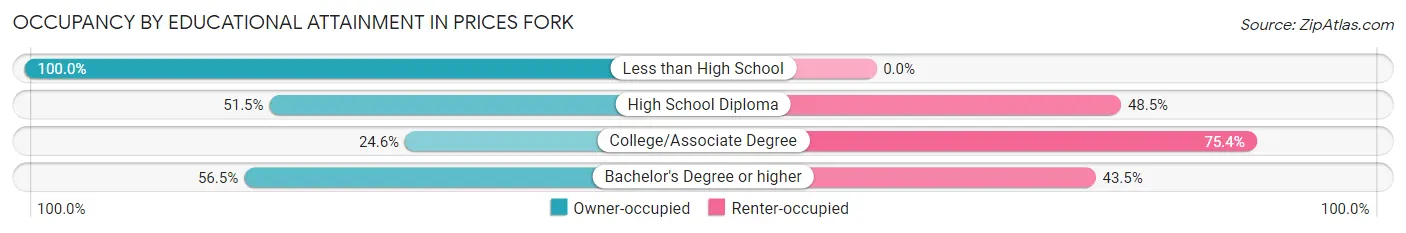
| Household Size | Owner-occupied | Renter-occupied |
| Less than High School | 8 (100.0%) | 0 (0.0%) |
| High School Diploma | 35 (51.5%) | 33 (48.5%) |
| College/Associate Degree | 45 (24.6%) | 138 (75.4%) |
| Bachelor's Degree or higher | 113 (56.5%) | 87 (43.5%) |
Occupancy by Age of Householder in Prices Fork
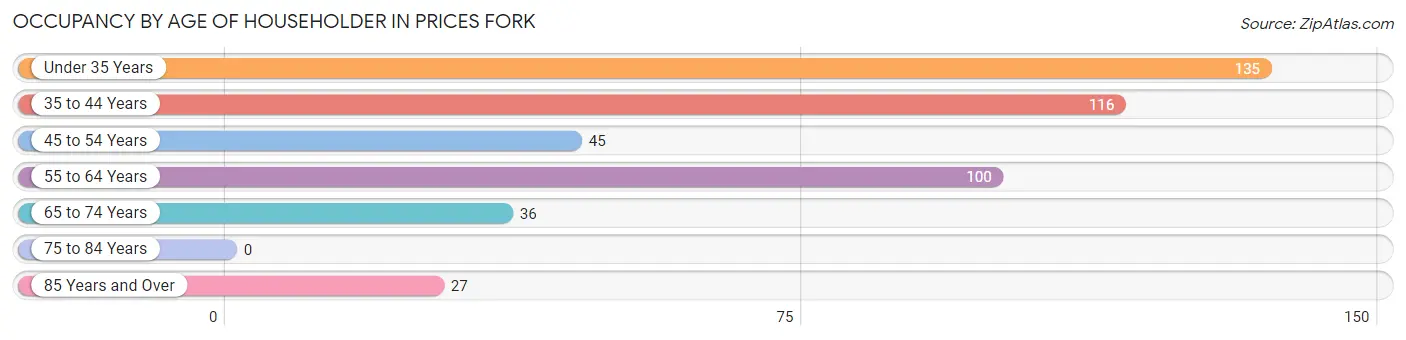
| Age Bracket | # Households | % Households |
| Under 35 Years | 135 | 29.4% |
| 35 to 44 Years | 116 | 25.3% |
| 45 to 54 Years | 45 | 9.8% |
| 55 to 64 Years | 100 | 21.8% |
| 65 to 74 Years | 36 | 7.8% |
| 75 to 84 Years | 0 | 0.0% |
| 85 Years and Over | 27 | 5.9% |
| Total | 459 | 100.0% |
Housing Finances in Prices Fork
Median Income by Occupancy in Prices Fork
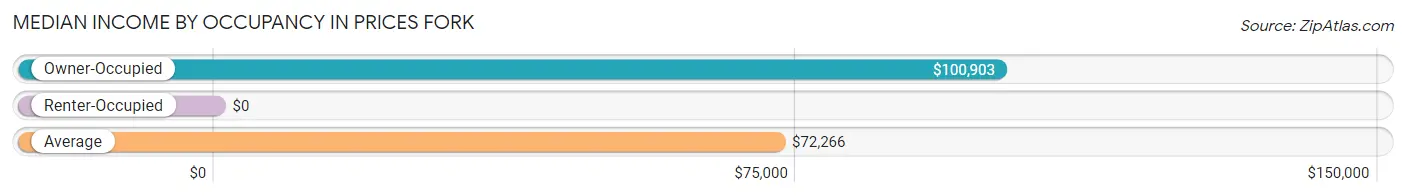
| Occupancy Type | # Households | Median Income |
| Owner-Occupied | 201 (43.8%) | $100,903 |
| Renter-Occupied | 258 (56.2%) | $0 |
| Average | 459 (100.0%) | $72,266 |
Occupancy by Householder Income Bracket in Prices Fork
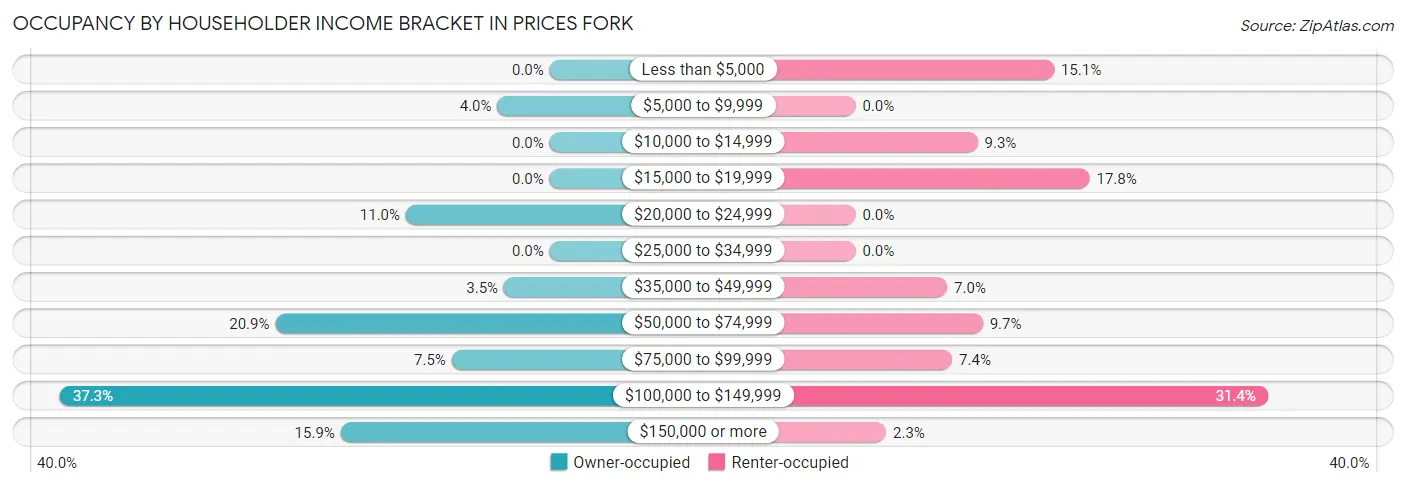
| Income Bracket | Owner-occupied | Renter-occupied |
| Less than $5,000 | 0 (0.0%) | 39 (15.1%) |
| $5,000 to $9,999 | 8 (4.0%) | 0 (0.0%) |
| $10,000 to $14,999 | 0 (0.0%) | 24 (9.3%) |
| $15,000 to $19,999 | 0 (0.0%) | 46 (17.8%) |
| $20,000 to $24,999 | 22 (11.0%) | 0 (0.0%) |
| $25,000 to $34,999 | 0 (0.0%) | 0 (0.0%) |
| $35,000 to $49,999 | 7 (3.5%) | 18 (7.0%) |
| $50,000 to $74,999 | 42 (20.9%) | 25 (9.7%) |
| $75,000 to $99,999 | 15 (7.5%) | 19 (7.4%) |
| $100,000 to $149,999 | 75 (37.3%) | 81 (31.4%) |
| $150,000 or more | 32 (15.9%) | 6 (2.3%) |
| Total | 201 (100.0%) | 258 (100.0%) |
Monthly Housing Cost Tiers in Prices Fork
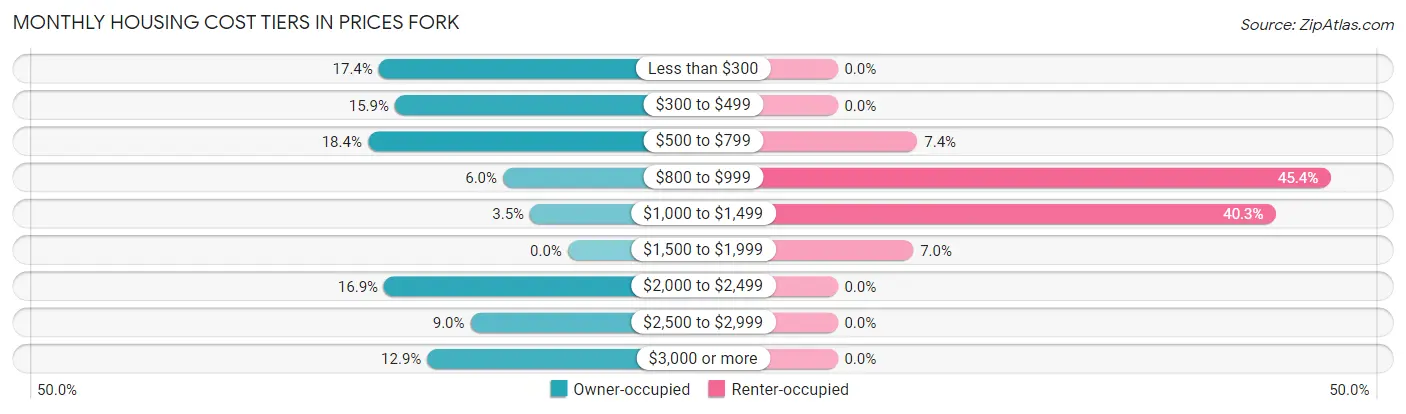
| Monthly Cost | Owner-occupied | Renter-occupied |
| Less than $300 | 35 (17.4%) | 0 (0.0%) |
| $300 to $499 | 32 (15.9%) | 0 (0.0%) |
| $500 to $799 | 37 (18.4%) | 19 (7.4%) |
| $800 to $999 | 12 (6.0%) | 117 (45.4%) |
| $1,000 to $1,499 | 7 (3.5%) | 104 (40.3%) |
| $1,500 to $1,999 | 0 (0.0%) | 18 (7.0%) |
| $2,000 to $2,499 | 34 (16.9%) | 0 (0.0%) |
| $2,500 to $2,999 | 18 (9.0%) | 0 (0.0%) |
| $3,000 or more | 26 (12.9%) | 0 (0.0%) |
| Total | 201 (100.0%) | 258 (100.0%) |
Physical Housing Characteristics in Prices Fork
Housing Structures in Prices Fork
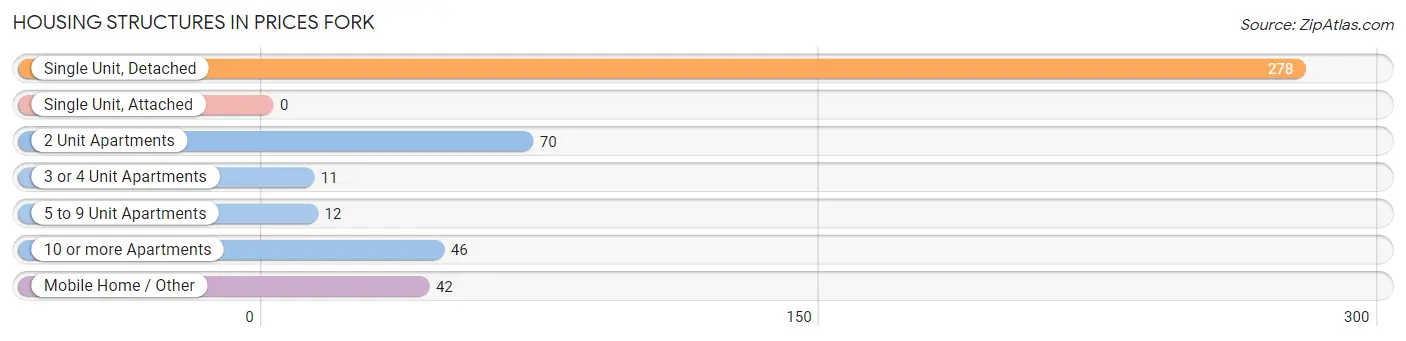
| Structure Type | # Housing Units | % Housing Units |
| Single Unit, Detached | 278 | 60.6% |
| Single Unit, Attached | 0 | 0.0% |
| 2 Unit Apartments | 70 | 15.2% |
| 3 or 4 Unit Apartments | 11 | 2.4% |
| 5 to 9 Unit Apartments | 12 | 2.6% |
| 10 or more Apartments | 46 | 10.0% |
| Mobile Home / Other | 42 | 9.1% |
| Total | 459 | 100.0% |
Housing Structures by Occupancy in Prices Fork
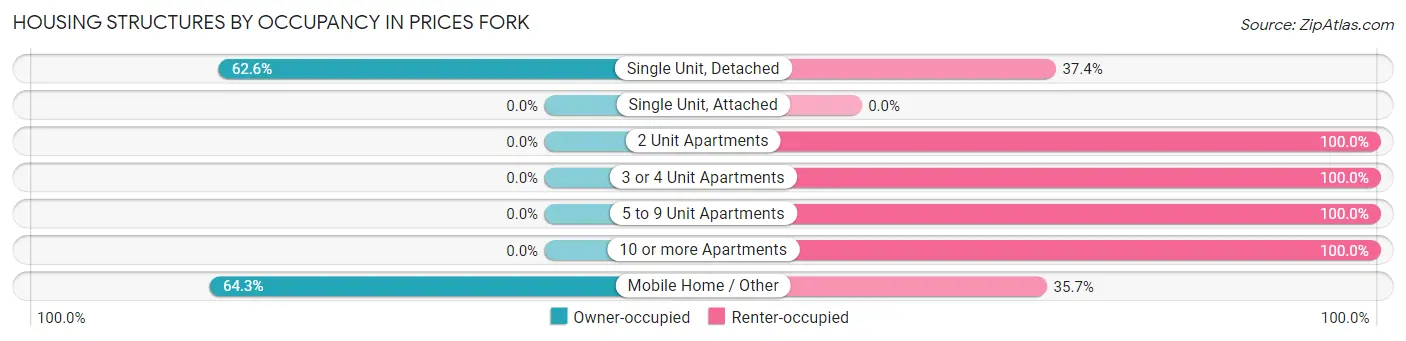
| Structure Type | Owner-occupied | Renter-occupied |
| Single Unit, Detached | 174 (62.6%) | 104 (37.4%) |
| Single Unit, Attached | 0 (0.0%) | 0 (0.0%) |
| 2 Unit Apartments | 0 (0.0%) | 70 (100.0%) |
| 3 or 4 Unit Apartments | 0 (0.0%) | 11 (100.0%) |
| 5 to 9 Unit Apartments | 0 (0.0%) | 12 (100.0%) |
| 10 or more Apartments | 0 (0.0%) | 46 (100.0%) |
| Mobile Home / Other | 27 (64.3%) | 15 (35.7%) |
| Total | 201 (43.8%) | 258 (56.2%) |
Housing Structures by Number of Rooms in Prices Fork
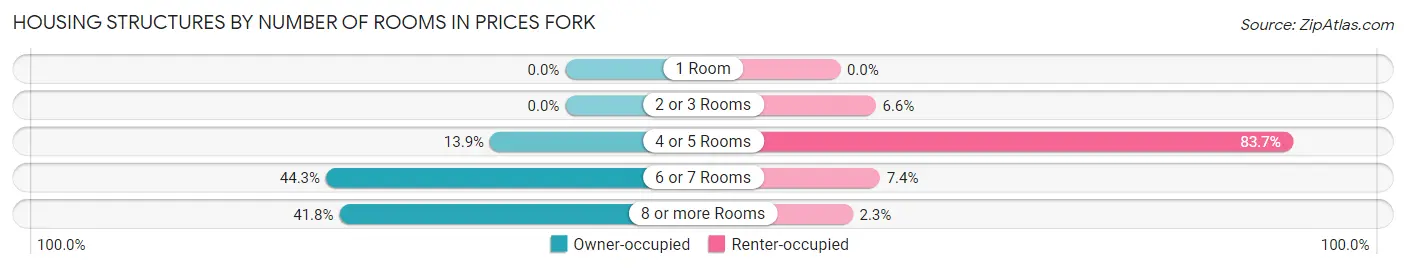
| Number of Rooms | Owner-occupied | Renter-occupied |
| 1 Room | 0 (0.0%) | 0 (0.0%) |
| 2 or 3 Rooms | 0 (0.0%) | 17 (6.6%) |
| 4 or 5 Rooms | 28 (13.9%) | 216 (83.7%) |
| 6 or 7 Rooms | 89 (44.3%) | 19 (7.4%) |
| 8 or more Rooms | 84 (41.8%) | 6 (2.3%) |
| Total | 201 (100.0%) | 258 (100.0%) |
Housing Structure by Heating Type in Prices Fork
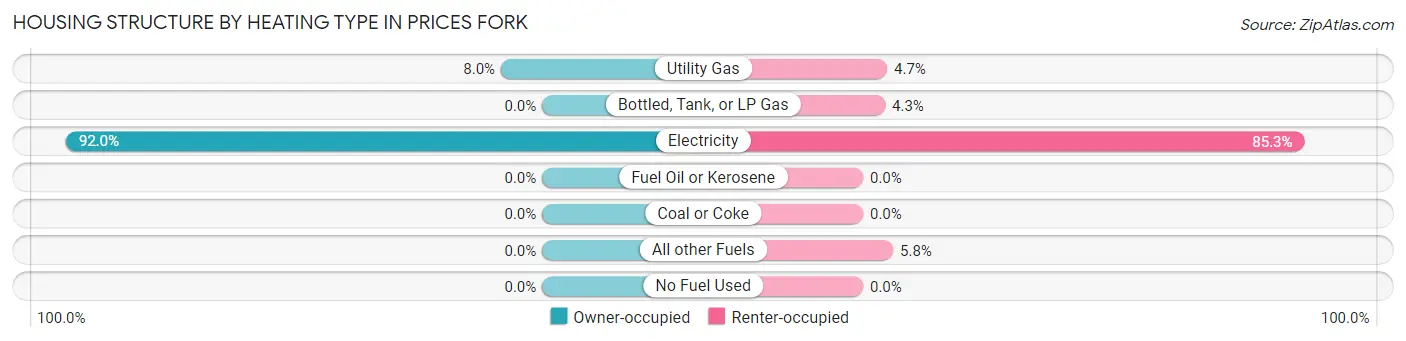
| Heating Type | Owner-occupied | Renter-occupied |
| Utility Gas | 16 (8.0%) | 12 (4.6%) |
| Bottled, Tank, or LP Gas | 0 (0.0%) | 11 (4.3%) |
| Electricity | 185 (92.0%) | 220 (85.3%) |
| Fuel Oil or Kerosene | 0 (0.0%) | 0 (0.0%) |
| Coal or Coke | 0 (0.0%) | 0 (0.0%) |
| All other Fuels | 0 (0.0%) | 15 (5.8%) |
| No Fuel Used | 0 (0.0%) | 0 (0.0%) |
| Total | 201 (100.0%) | 258 (100.0%) |
Household Vehicle Usage in Prices Fork
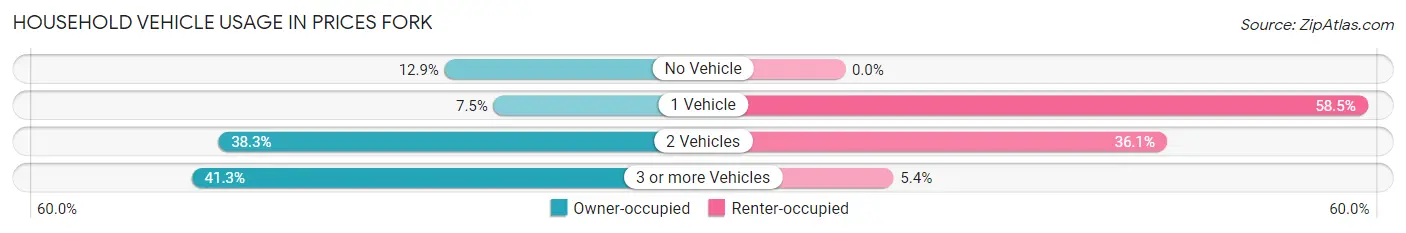
| Vehicles per Household | Owner-occupied | Renter-occupied |
| No Vehicle | 26 (12.9%) | 0 (0.0%) |
| 1 Vehicle | 15 (7.5%) | 151 (58.5%) |
| 2 Vehicles | 77 (38.3%) | 93 (36.0%) |
| 3 or more Vehicles | 83 (41.3%) | 14 (5.4%) |
| Total | 201 (100.0%) | 258 (100.0%) |
Real Estate & Mortgages in Prices Fork
Real Estate and Mortgage Overview in Prices Fork
| Characteristic | Without Mortgage | With Mortgage |
| Housing Units | 104 | 97 |
| Median Property Value | $256,300 | $409,800 |
| Median Household Income | $70,469 | $32 |
| Monthly Housing Costs | $453 | $26 |
| Real Estate Taxes | $2,362 | $0 |
Property Value by Mortgage Status in Prices Fork
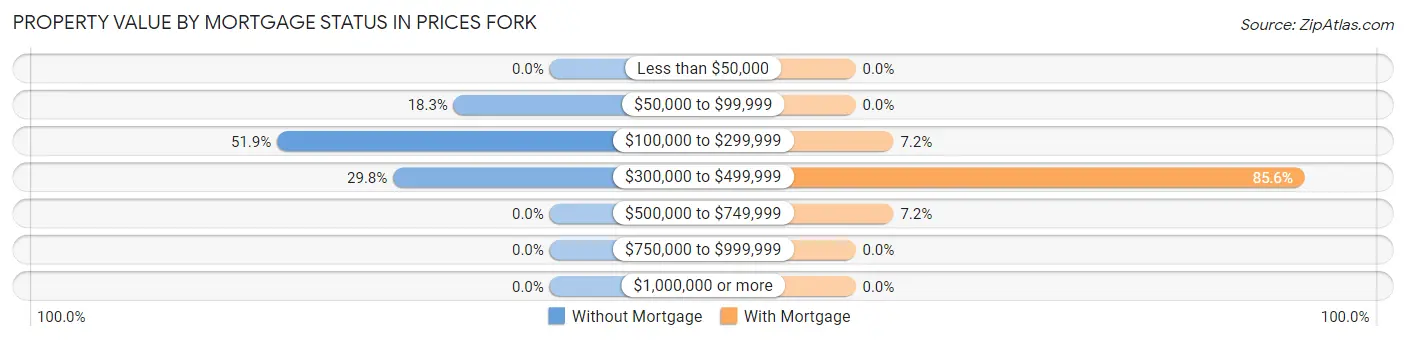
| Property Value | Without Mortgage | With Mortgage |
| Less than $50,000 | 0 (0.0%) | 0 (0.0%) |
| $50,000 to $99,999 | 19 (18.3%) | 0 (0.0%) |
| $100,000 to $299,999 | 54 (51.9%) | 7 (7.2%) |
| $300,000 to $499,999 | 31 (29.8%) | 83 (85.6%) |
| $500,000 to $749,999 | 0 (0.0%) | 7 (7.2%) |
| $750,000 to $999,999 | 0 (0.0%) | 0 (0.0%) |
| $1,000,000 or more | 0 (0.0%) | 0 (0.0%) |
| Total | 104 (100.0%) | 97 (100.0%) |
Household Income by Mortgage Status in Prices Fork
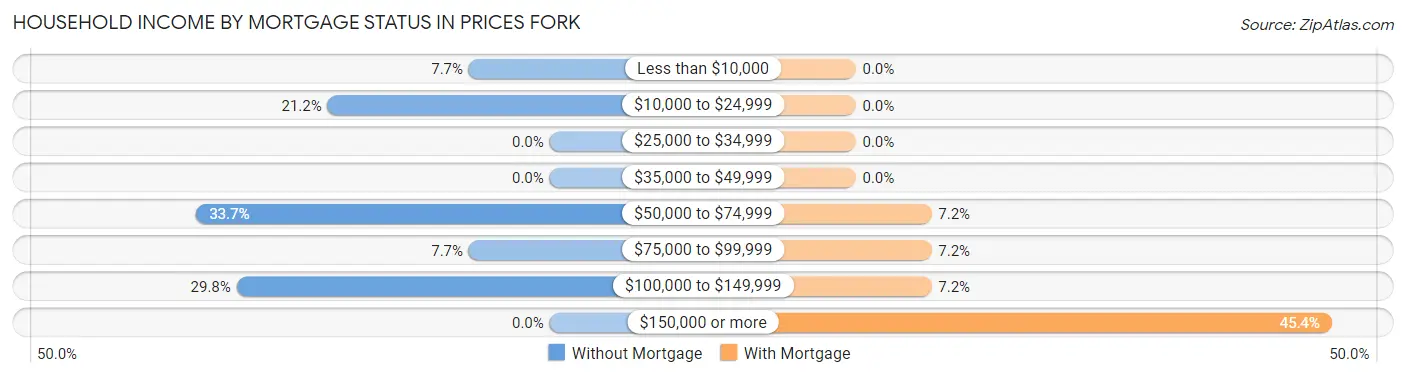
| Household Income | Without Mortgage | With Mortgage |
| Less than $10,000 | 8 (7.7%) | 0 (0.0%) |
| $10,000 to $24,999 | 22 (21.1%) | 0 (0.0%) |
| $25,000 to $34,999 | 0 (0.0%) | 0 (0.0%) |
| $35,000 to $49,999 | 0 (0.0%) | 0 (0.0%) |
| $50,000 to $74,999 | 35 (33.7%) | 7 (7.2%) |
| $75,000 to $99,999 | 8 (7.7%) | 7 (7.2%) |
| $100,000 to $149,999 | 31 (29.8%) | 7 (7.2%) |
| $150,000 or more | 0 (0.0%) | 44 (45.4%) |
| Total | 104 (100.0%) | 97 (100.0%) |
Property Value to Household Income Ratio in Prices Fork
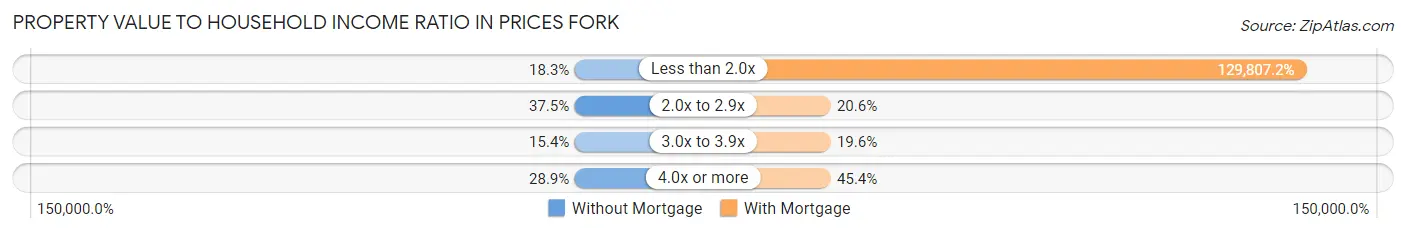
| Value-to-Income Ratio | Without Mortgage | With Mortgage |
| Less than 2.0x | 19 (18.3%) | 125,913 (129,807.2%) |
| 2.0x to 2.9x | 39 (37.5%) | 20 (20.6%) |
| 3.0x to 3.9x | 16 (15.4%) | 19 (19.6%) |
| 4.0x or more | 30 (28.8%) | 44 (45.4%) |
| Total | 104 (100.0%) | 97 (100.0%) |
Real Estate Taxes by Mortgage Status in Prices Fork
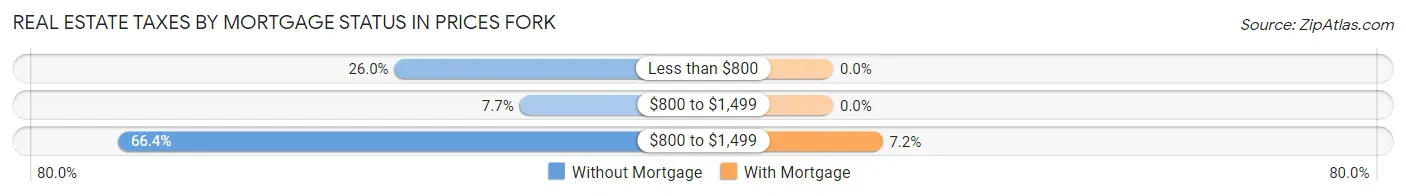
| Property Taxes | Without Mortgage | With Mortgage |
| Less than $800 | 27 (26.0%) | 0 (0.0%) |
| $800 to $1,499 | 8 (7.7%) | 0 (0.0%) |
| $800 to $1,499 | 69 (66.3%) | 7 (7.2%) |
| Total | 104 (100.0%) | 97 (100.0%) |
Health & Disability in Prices Fork
Health Insurance Coverage by Age in Prices Fork
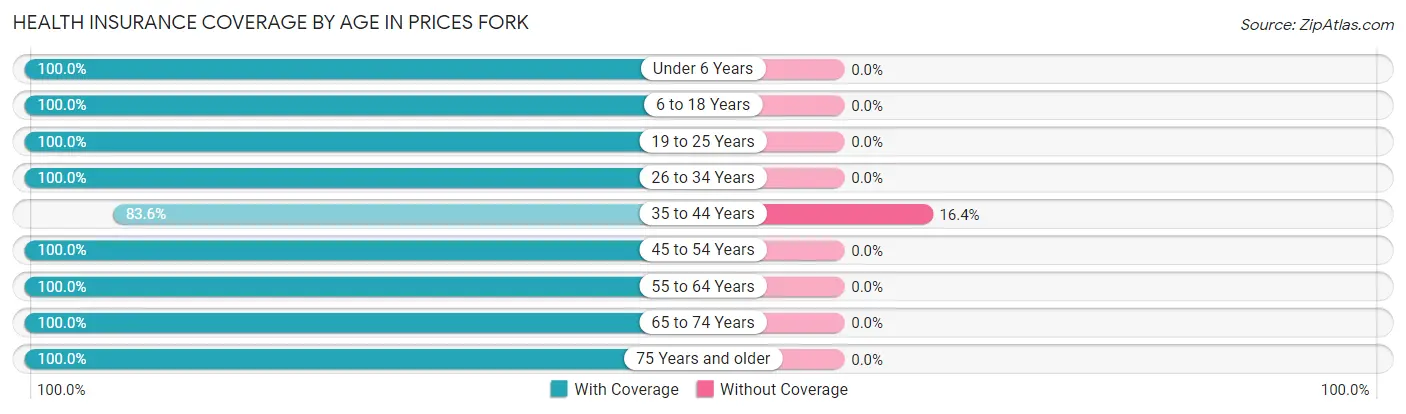
| Age Bracket | With Coverage | Without Coverage |
| Under 6 Years | 45 (100.0%) | 0 (0.0%) |
| 6 to 18 Years | 184 (100.0%) | 0 (0.0%) |
| 19 to 25 Years | 82 (100.0%) | 0 (0.0%) |
| 26 to 34 Years | 112 (100.0%) | 0 (0.0%) |
| 35 to 44 Years | 188 (83.6%) | 37 (16.4%) |
| 45 to 54 Years | 79 (100.0%) | 0 (0.0%) |
| 55 to 64 Years | 137 (100.0%) | 0 (0.0%) |
| 65 to 74 Years | 70 (100.0%) | 0 (0.0%) |
| 75 Years and older | 70 (100.0%) | 0 (0.0%) |
| Total | 967 (96.3%) | 37 (3.7%) |
Health Insurance Coverage by Citizenship Status in Prices Fork
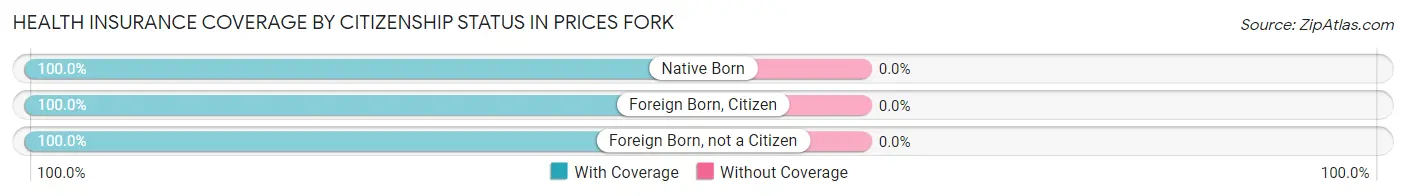
| Citizenship Status | With Coverage | Without Coverage |
| Native Born | 45 (100.0%) | 0 (0.0%) |
| Foreign Born, Citizen | 184 (100.0%) | 0 (0.0%) |
| Foreign Born, not a Citizen | 82 (100.0%) | 0 (0.0%) |
Health Insurance Coverage by Household Income in Prices Fork
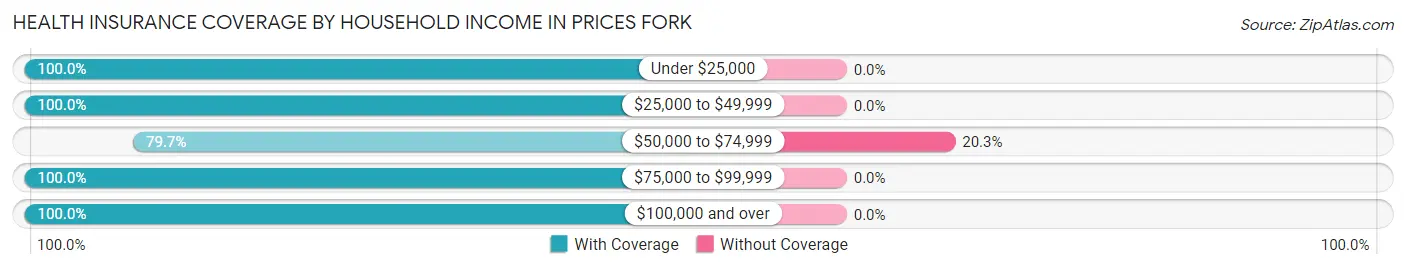
| Household Income | With Coverage | Without Coverage |
| Under $25,000 | 200 (100.0%) | 0 (0.0%) |
| $25,000 to $49,999 | 31 (100.0%) | 0 (0.0%) |
| $50,000 to $74,999 | 145 (79.7%) | 37 (20.3%) |
| $75,000 to $99,999 | 42 (100.0%) | 0 (0.0%) |
| $100,000 and over | 549 (100.0%) | 0 (0.0%) |
Public vs Private Health Insurance Coverage by Age in Prices Fork
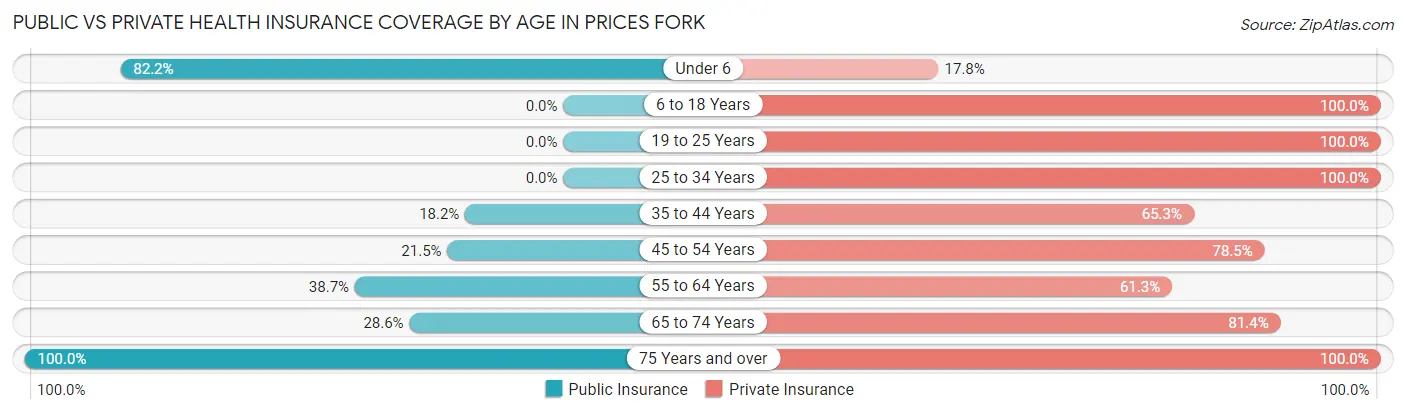
| Age Bracket | Public Insurance | Private Insurance |
| Under 6 | 37 (82.2%) | 8 (17.8%) |
| 6 to 18 Years | 0 (0.0%) | 184 (100.0%) |
| 19 to 25 Years | 0 (0.0%) | 82 (100.0%) |
| 25 to 34 Years | 0 (0.0%) | 112 (100.0%) |
| 35 to 44 Years | 41 (18.2%) | 147 (65.3%) |
| 45 to 54 Years | 17 (21.5%) | 62 (78.5%) |
| 55 to 64 Years | 53 (38.7%) | 84 (61.3%) |
| 65 to 74 Years | 20 (28.6%) | 57 (81.4%) |
| 75 Years and over | 70 (100.0%) | 70 (100.0%) |
| Total | 238 (23.7%) | 806 (80.3%) |
Disability Status by Sex by Age in Prices Fork
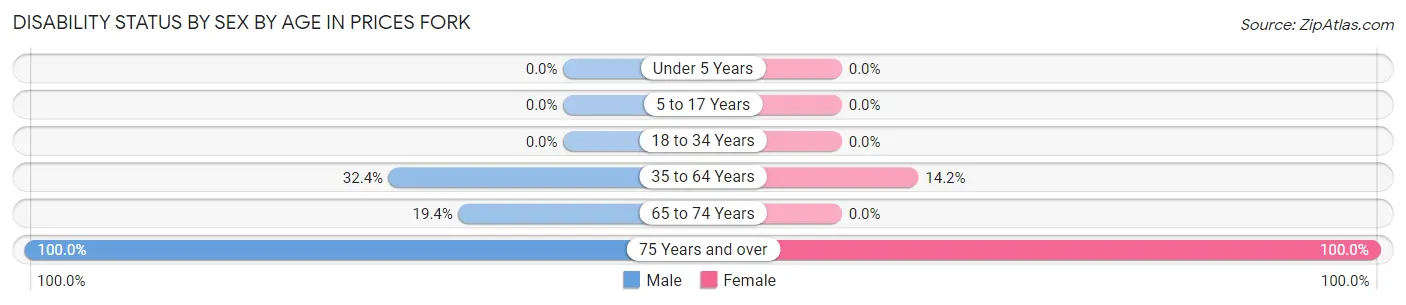
| Age Bracket | Male | Female |
| Under 5 Years | 0 (0.0%) | 0 (0.0%) |
| 5 to 17 Years | 0 (0.0%) | 0 (0.0%) |
| 18 to 34 Years | 0 (0.0%) | 0 (0.0%) |
| 35 to 64 Years | 79 (32.4%) | 28 (14.2%) |
| 65 to 74 Years | 7 (19.4%) | 0 (0.0%) |
| 75 Years and over | 29 (100.0%) | 41 (100.0%) |
Disability Class by Sex by Age in Prices Fork
Disability Class: Hearing Difficulty
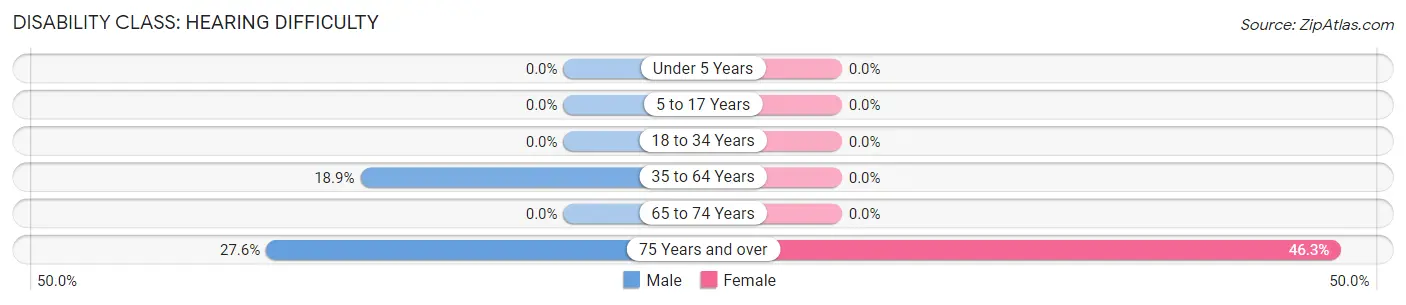
| Age Bracket | Male | Female |
| Under 5 Years | 0 (0.0%) | 0 (0.0%) |
| 5 to 17 Years | 0 (0.0%) | 0 (0.0%) |
| 18 to 34 Years | 0 (0.0%) | 0 (0.0%) |
| 35 to 64 Years | 46 (18.9%) | 0 (0.0%) |
| 65 to 74 Years | 0 (0.0%) | 0 (0.0%) |
| 75 Years and over | 8 (27.6%) | 19 (46.3%) |
Disability Class: Vision Difficulty
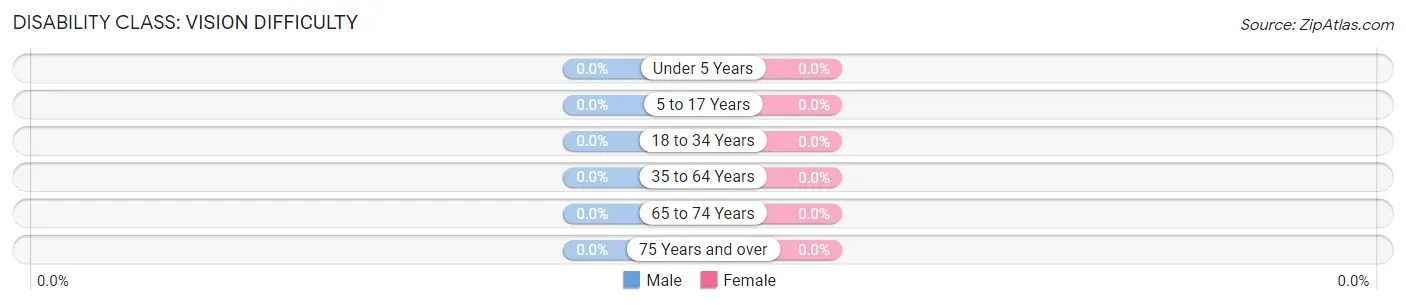
| Age Bracket | Male | Female |
| Under 5 Years | 0 (0.0%) | 0 (0.0%) |
| 5 to 17 Years | 0 (0.0%) | 0 (0.0%) |
| 18 to 34 Years | 0 (0.0%) | 0 (0.0%) |
| 35 to 64 Years | 0 (0.0%) | 0 (0.0%) |
| 65 to 74 Years | 0 (0.0%) | 0 (0.0%) |
| 75 Years and over | 0 (0.0%) | 0 (0.0%) |
Disability Class: Cognitive Difficulty
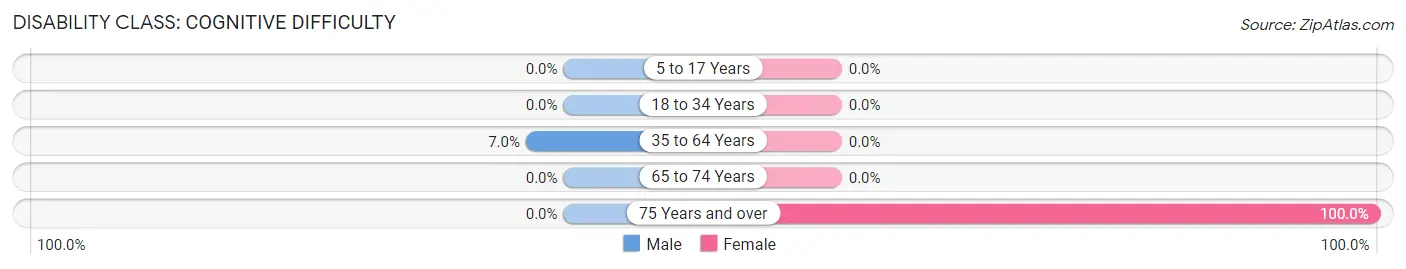
| Age Bracket | Male | Female |
| 5 to 17 Years | 0 (0.0%) | 0 (0.0%) |
| 18 to 34 Years | 0 (0.0%) | 0 (0.0%) |
| 35 to 64 Years | 17 (7.0%) | 0 (0.0%) |
| 65 to 74 Years | 0 (0.0%) | 0 (0.0%) |
| 75 Years and over | 0 (0.0%) | 41 (100.0%) |
Disability Class: Ambulatory Difficulty
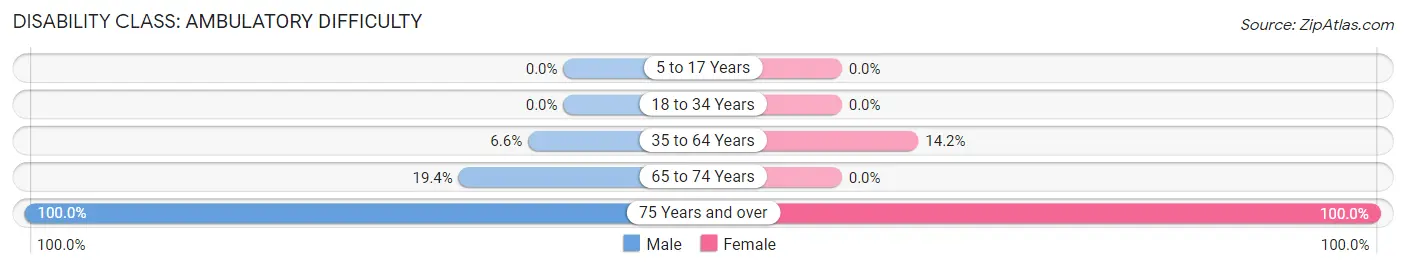
| Age Bracket | Male | Female |
| 5 to 17 Years | 0 (0.0%) | 0 (0.0%) |
| 18 to 34 Years | 0 (0.0%) | 0 (0.0%) |
| 35 to 64 Years | 16 (6.6%) | 28 (14.2%) |
| 65 to 74 Years | 7 (19.4%) | 0 (0.0%) |
| 75 Years and over | 29 (100.0%) | 41 (100.0%) |
Disability Class: Self-Care Difficulty
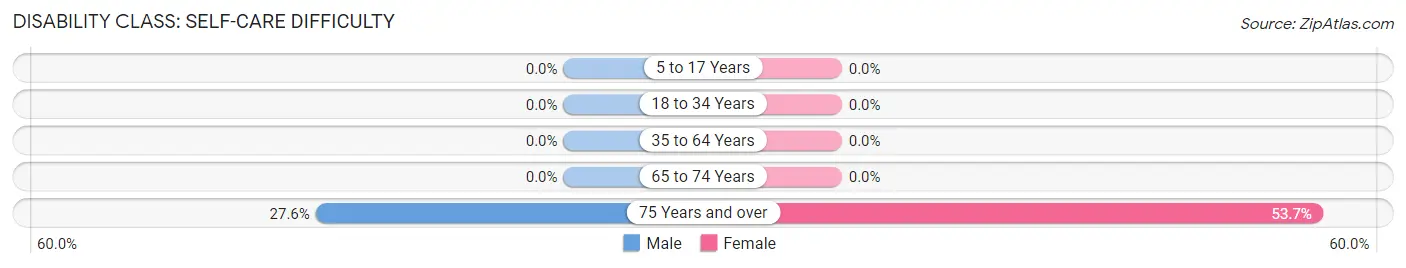
| Age Bracket | Male | Female |
| 5 to 17 Years | 0 (0.0%) | 0 (0.0%) |
| 18 to 34 Years | 0 (0.0%) | 0 (0.0%) |
| 35 to 64 Years | 0 (0.0%) | 0 (0.0%) |
| 65 to 74 Years | 0 (0.0%) | 0 (0.0%) |
| 75 Years and over | 8 (27.6%) | 22 (53.7%) |
Technology Access in Prices Fork
Computing Device Access in Prices Fork
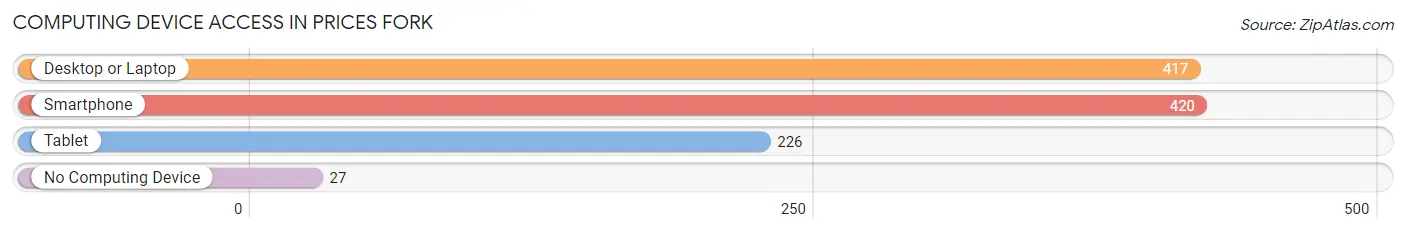
| Device Type | # Households | % Households |
| Desktop or Laptop | 417 | 90.8% |
| Smartphone | 420 | 91.5% |
| Tablet | 226 | 49.2% |
| No Computing Device | 27 | 5.9% |
| Total | 459 | 100.0% |
Internet Access in Prices Fork
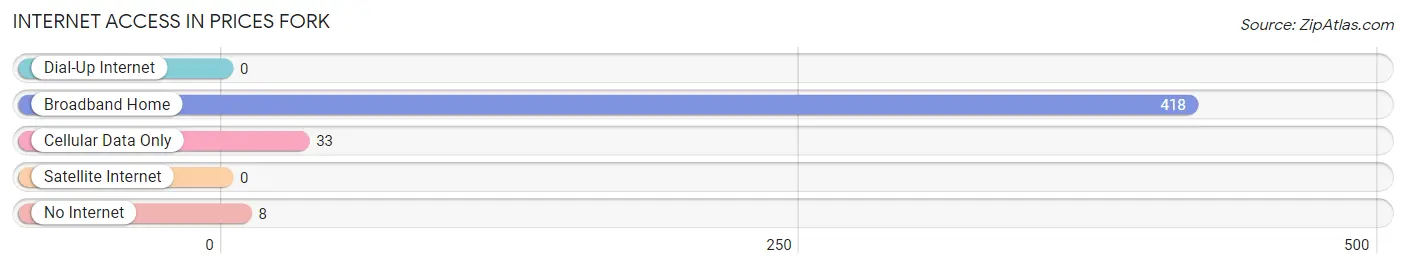
| Internet Type | # Households | % Households |
| Dial-Up Internet | 0 | 0.0% |
| Broadband Home | 418 | 91.1% |
| Cellular Data Only | 33 | 7.2% |
| Satellite Internet | 0 | 0.0% |
| No Internet | 8 | 1.7% |
| Total | 459 | 100.0% |
Prices Fork Summary
Prices Fork is an unincorporated community located in Montgomery County, Virginia. It is situated in the Appalachian Mountains, approximately 10 miles southwest of Blacksburg and 8 miles northeast of Christiansburg. The community is named after the Prices Fork Creek, which runs through the area.
History
The area that is now Prices Fork was first settled in the late 1700s by the Price family, who were among the first settlers in the area. The Prices Fork post office was established in 1883, and the community was officially incorporated in 1891.
The area was primarily agricultural, with many of the residents working in the timber and coal industries. The area was also home to several churches, including the Prices Fork Baptist Church, which was established in 1883.
Geography
Prices Fork is located in the Appalachian Mountains, approximately 10 miles southwest of Blacksburg and 8 miles northeast of Christiansburg. The community is situated in a valley, with the Prices Fork Creek running through it. The area is surrounded by rolling hills and mountains, with the highest peak in the area being Brush Mountain, which rises to an elevation of 3,000 feet.
The climate in Prices Fork is temperate, with hot summers and cold winters. The average annual temperature is around 55 degrees Fahrenheit, with an average annual precipitation of around 40 inches.
Economy
The economy of Prices Fork is largely based on agriculture and timber. The area is home to several farms, which produce a variety of crops, including corn, soybeans, and hay. The timber industry is also important to the local economy, with many of the residents working in the logging and lumber industries.
The area is also home to several small businesses, including a gas station, a grocery store, and a hardware store. There are also several restaurants in the area, including a pizza shop and a Mexican restaurant.
Demographics
As of the 2010 census, the population of Prices Fork was 1,845. The racial makeup of the community was 97.3% White, 0.9% African American, 0.3% Native American, 0.2% Asian, and 0.3% from other races. The median household income was $41,250, and the median home value was $133,000.
The majority of the population is employed in the agricultural and timber industries, with many of the residents also working in the service industry. The area is also home to several small businesses, including a gas station, a grocery store, and a hardware store.
Common Questions
What is Per Capita Income in Prices Fork?
Per Capita income in Prices Fork is $34,975.
What is the Median Family Income in Prices Fork?
Median Family Income in Prices Fork is $103,699.
What is the Median Household income in Prices Fork?
Median Household Income in Prices Fork is $72,266.
What is Income or Wage Gap in Prices Fork?
Income or Wage Gap in Prices Fork is 6.9%.
Women in Prices Fork earn 93.1 cents for every dollar earned by a man.
What is Inequality or Gini Index in Prices Fork?
Inequality or Gini Index in Prices Fork is 0.40.
What is the Total Population of Prices Fork?
Total Population of Prices Fork is 1,014.
What is the Total Male Population of Prices Fork?
Total Male Population of Prices Fork is 545.
What is the Total Female Population of Prices Fork?
Total Female Population of Prices Fork is 469.
What is the Ratio of Males per 100 Females in Prices Fork?
There are 116.20 Males per 100 Females in Prices Fork.
What is the Ratio of Females per 100 Males in Prices Fork?
There are 86.06 Females per 100 Males in Prices Fork.
What is the Median Population Age in Prices Fork?
Median Population Age in Prices Fork is 37.7 Years.
What is the Average Family Size in Prices Fork
Average Family Size in Prices Fork is 2.7 People.
What is the Average Household Size in Prices Fork
Average Household Size in Prices Fork is 2.2 People.
How Large is the Labor Force in Prices Fork?
There are 579 People in the Labor Forcein in Prices Fork.
What is the Percentage of People in the Labor Force in Prices Fork?
70.3% of People are in the Labor Force in Prices Fork.
What is the Unemployment Rate in Prices Fork?
Unemployment Rate in Prices Fork is 5.4%.