Buchanan, VA Map & Demographics
Buchanan Map
Buchanan Overview
$30,280
PER CAPITA INCOME
$66,250
AVG FAMILY INCOME
$54,167
AVG HOUSEHOLD INCOME
29.6%
WAGE / INCOME GAP [ % ]
70.4¢/ $1
WAGE / INCOME GAP [ $ ]
$17,383
FAMILY INCOME DEFICIT
0.39
INEQUALITY / GINI INDEX
1,108
TOTAL POPULATION
574
MALE POPULATION
534
FEMALE POPULATION
107.49
MALES / 100 FEMALES
93.03
FEMALES / 100 MALES
47.7
MEDIAN AGE
3.0
AVG FAMILY SIZE
2.5
AVG HOUSEHOLD SIZE
540
LABOR FORCE [ PEOPLE ]
57.3%
PERCENT IN LABOR FORCE
8.1%
UNEMPLOYMENT RATE
Buchanan Zip Codes
Buchanan Area Codes
Income in Buchanan
Income Overview in Buchanan
Per Capita Income in Buchanan is $30,280, while median incomes of families and households are $66,250 and $54,167 respectively.
| Characteristic | Number | Measure |
| Per Capita Income | 1,108 | $30,280 |
| Median Family Income | 267 | $66,250 |
| Mean Family Income | 267 | $75,657 |
| Median Household Income | 434 | $54,167 |
| Mean Household Income | 434 | $71,187 |
| Income Deficit | 267 | $17,383 |
| Wage / Income Gap (%) | 1,108 | 29.56% |
| Wage / Income Gap ($) | 1,108 | 70.44¢ per $1 |
| Gini / Inequality Index | 1,108 | 0.39 |
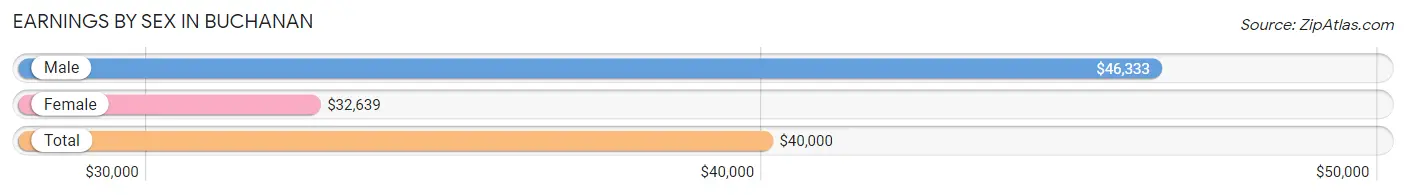
Earnings by Sex in Buchanan
Average Earnings in Buchanan are $40,000, $46,333 for men and $32,639 for women, a difference of 29.6%.
| Sex | Number | Average Earnings |
| Male | 248 (47.9%) | $46,333 |
| Female | 270 (52.1%) | $32,639 |
| Total | 518 (100.0%) | $40,000 |
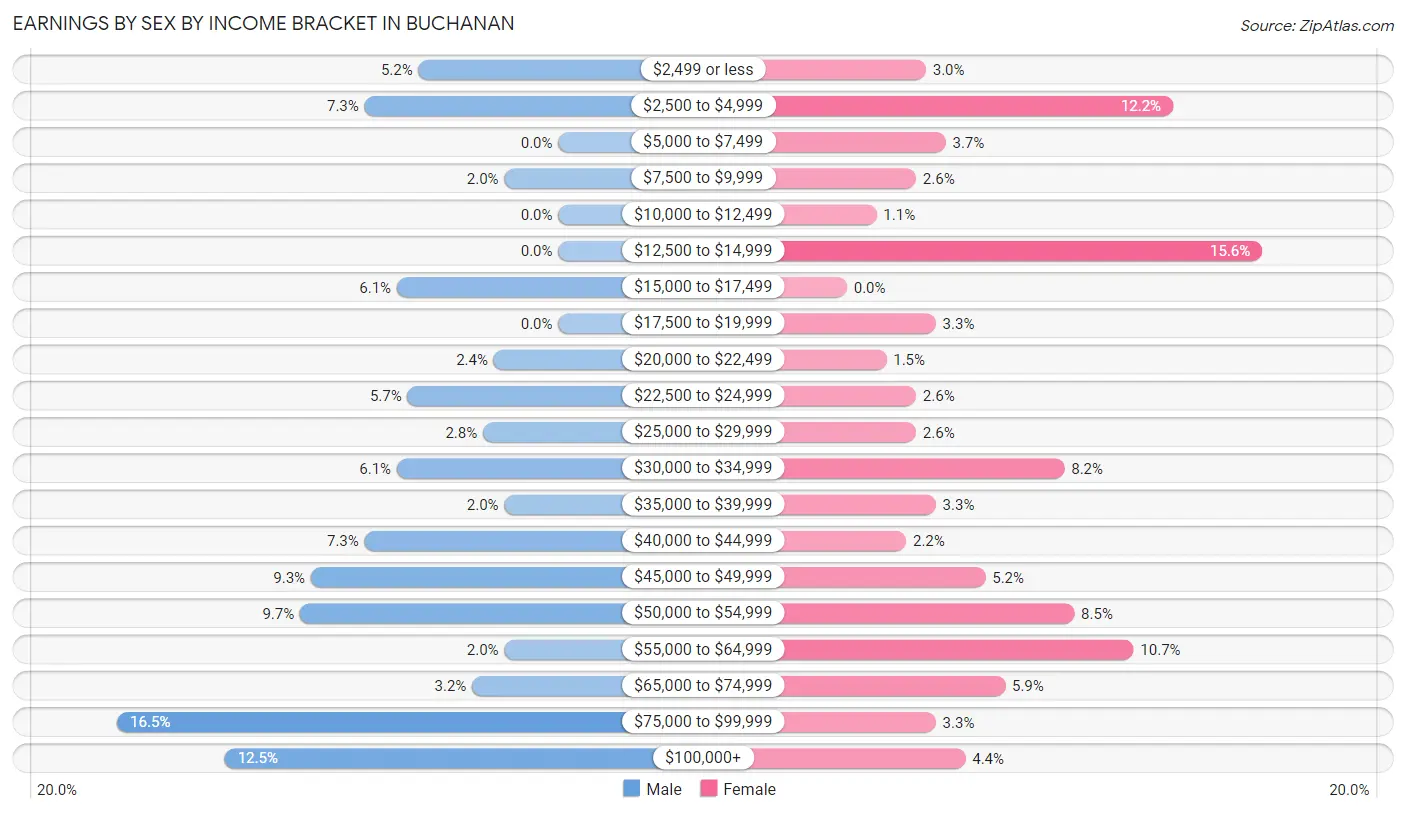
Earnings by Sex by Income Bracket in Buchanan
The most common earnings brackets in Buchanan are $75,000 to $99,999 for men (41 | 16.5%) and $12,500 to $14,999 for women (42 | 15.6%).
| Income | Male | Female |
| $2,499 or less | 13 (5.2%) | 8 (3.0%) |
| $2,500 to $4,999 | 18 (7.3%) | 33 (12.2%) |
| $5,000 to $7,499 | 0 (0.0%) | 10 (3.7%) |
| $7,500 to $9,999 | 5 (2.0%) | 7 (2.6%) |
| $10,000 to $12,499 | 0 (0.0%) | 3 (1.1%) |
| $12,500 to $14,999 | 0 (0.0%) | 42 (15.6%) |
| $15,000 to $17,499 | 15 (6.0%) | 0 (0.0%) |
| $17,500 to $19,999 | 0 (0.0%) | 9 (3.3%) |
| $20,000 to $22,499 | 6 (2.4%) | 4 (1.5%) |
| $22,500 to $24,999 | 14 (5.7%) | 7 (2.6%) |
| $25,000 to $29,999 | 7 (2.8%) | 7 (2.6%) |
| $30,000 to $34,999 | 15 (6.0%) | 22 (8.2%) |
| $35,000 to $39,999 | 5 (2.0%) | 9 (3.3%) |
| $40,000 to $44,999 | 18 (7.3%) | 6 (2.2%) |
| $45,000 to $49,999 | 23 (9.3%) | 14 (5.2%) |
| $50,000 to $54,999 | 24 (9.7%) | 23 (8.5%) |
| $55,000 to $64,999 | 5 (2.0%) | 29 (10.7%) |
| $65,000 to $74,999 | 8 (3.2%) | 16 (5.9%) |
| $75,000 to $99,999 | 41 (16.5%) | 9 (3.3%) |
| $100,000+ | 31 (12.5%) | 12 (4.4%) |
| Total | 248 (100.0%) | 270 (100.0%) |
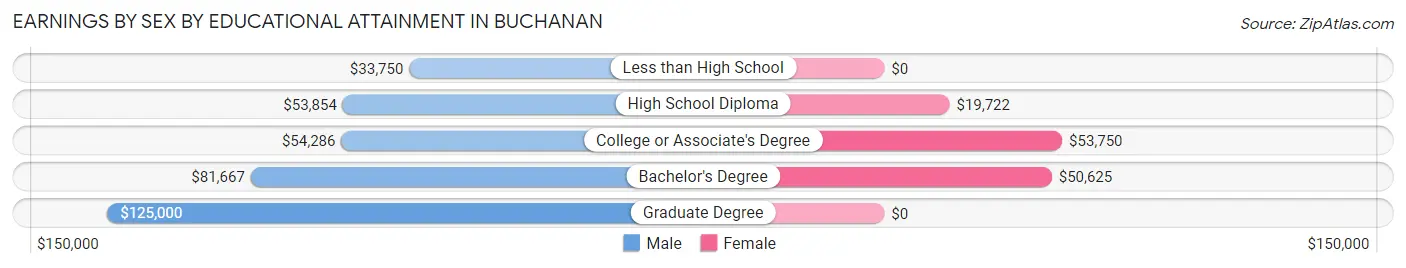
Earnings by Sex by Educational Attainment in Buchanan
Average earnings in Buchanan are $54,145 for men and $48,482 for women, a difference of 10.5%. Men with an educational attainment of graduate degree enjoy the highest average annual earnings of $125,000, while those with less than high school education earn the least with $33,750. Women with an educational attainment of college or associate's degree earn the most with the average annual earnings of $53,750, while those with high school diploma education have the smallest earnings of $19,722.
| Educational Attainment | Male Income | Female Income |
| Less than High School | $33,750 | $0 |
| High School Diploma | $53,854 | $19,722 |
| College or Associate's Degree | $54,286 | $53,750 |
| Bachelor's Degree | $81,667 | $50,625 |
| Graduate Degree | $125,000 | $0 |
| Total | $54,145 | $48,482 |
Family Income in Buchanan
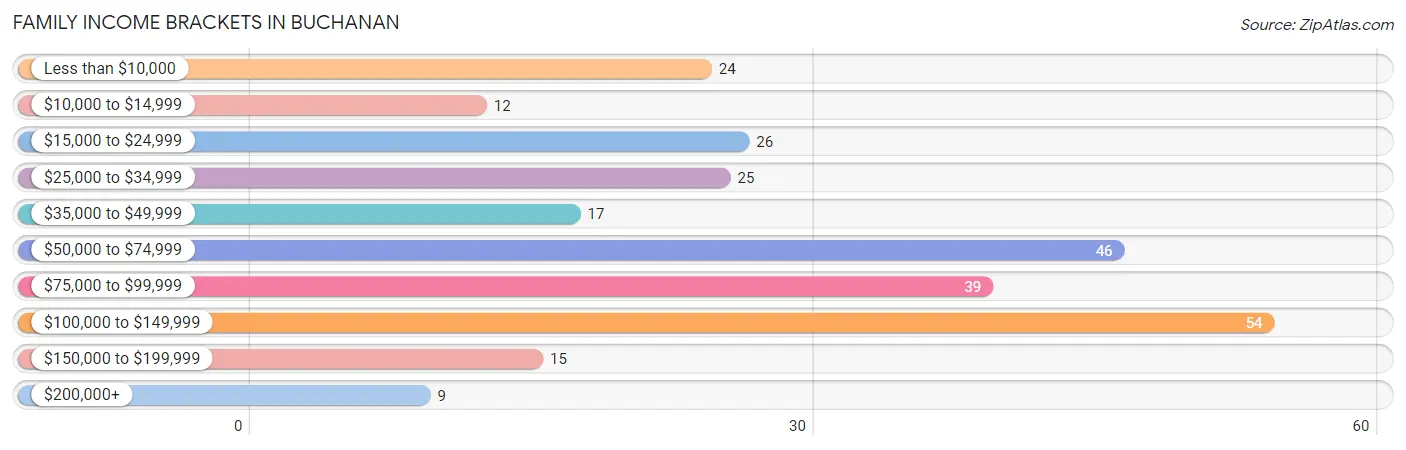
Family Income Brackets in Buchanan
According to the Buchanan family income data, there are 54 families falling into the $100,000 to $149,999 income range, which is the most common income bracket and makes up 20.2% of all families. Conversely, the $200,000+ income bracket is the least frequent group with only 9 families (3.4%) belonging to this category.
| Income Bracket | # Families | % Families |
| Less than $10,000 | 24 | 9.0% |
| $10,000 to $14,999 | 12 | 4.5% |
| $15,000 to $24,999 | 26 | 9.7% |
| $25,000 to $34,999 | 25 | 9.4% |
| $35,000 to $49,999 | 17 | 6.4% |
| $50,000 to $74,999 | 46 | 17.2% |
| $75,000 to $99,999 | 39 | 14.6% |
| $100,000 to $149,999 | 54 | 20.2% |
| $150,000 to $199,999 | 15 | 5.6% |
| $200,000+ | 9 | 3.4% |
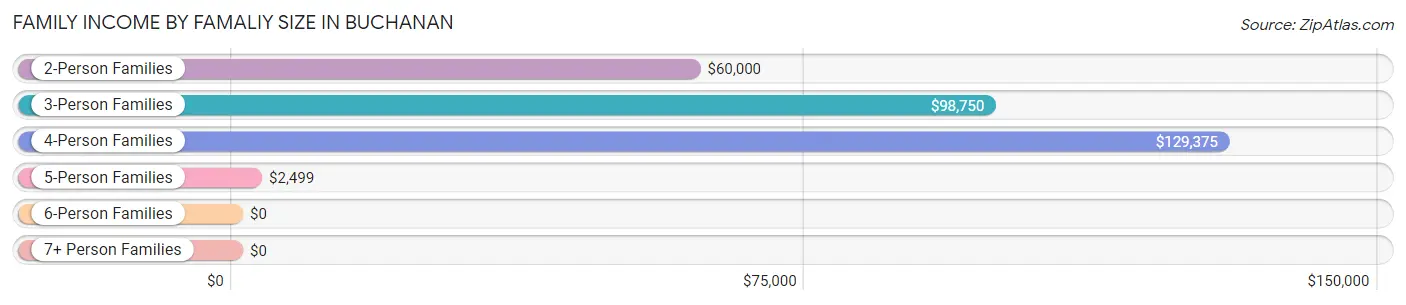
Family Income by Famaliy Size in Buchanan
4-person families (51 | 19.1%) account for the highest median family income in Buchanan with $129,375 per family, while 3-person families (9 | 3.4%) have the highest median income of $32,917 per family member.
| Income Bracket | # Families | Median Income |
| 2-Person Families | 184 (68.9%) | $60,000 |
| 3-Person Families | 9 (3.4%) | $98,750 |
| 4-Person Families | 51 (19.1%) | $129,375 |
| 5-Person Families | 23 (8.6%) | $2,499 |
| 6-Person Families | 0 (0.0%) | $0 |
| 7+ Person Families | 0 (0.0%) | $0 |
| Total | 267 (100.0%) | $66,250 |
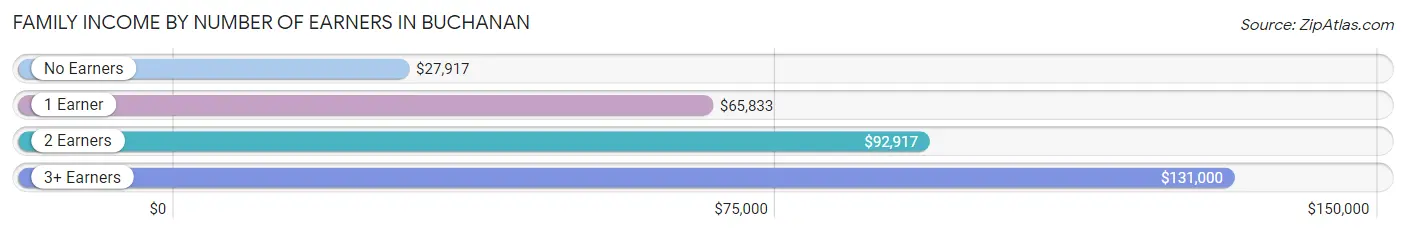
Family Income by Number of Earners in Buchanan
The median family income in Buchanan is $66,250, with families comprising 3+ earners (22) having the highest median family income of $131,000, while families with no earners (112) have the lowest median family income of $27,917, accounting for 8.2% and 41.9% of families, respectively.
| Number of Earners | # Families | Median Income |
| No Earners | 112 (41.9%) | $27,917 |
| 1 Earner | 60 (22.5%) | $65,833 |
| 2 Earners | 73 (27.3%) | $92,917 |
| 3+ Earners | 22 (8.2%) | $131,000 |
| Total | 267 (100.0%) | $66,250 |
Household Income in Buchanan
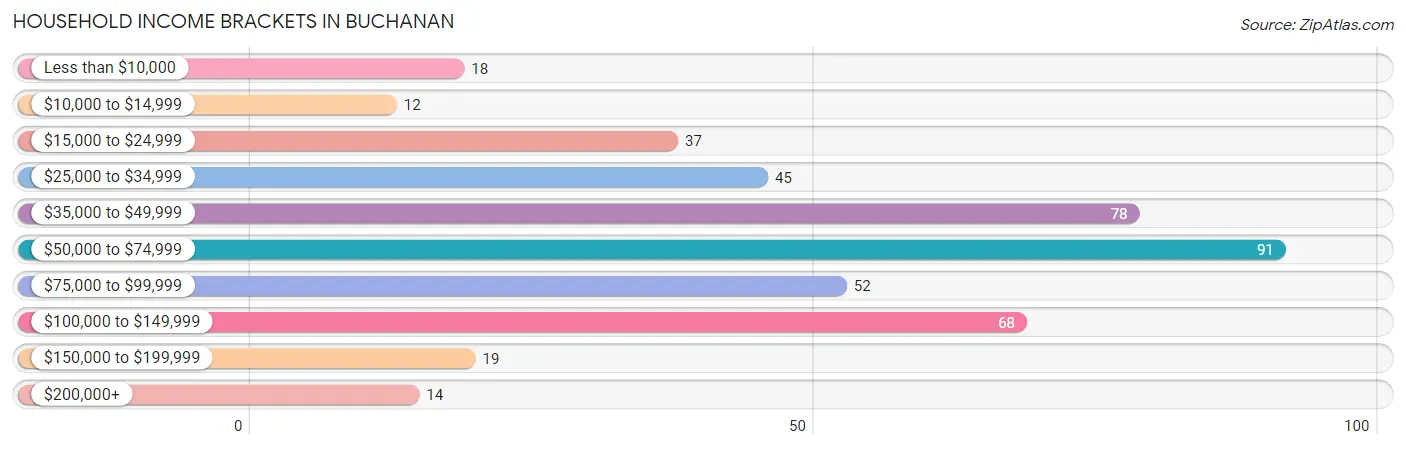
Household Income Brackets in Buchanan
With 91 households falling in the category, the $50,000 to $74,999 income range is the most frequent in Buchanan, accounting for 21.0% of all households. In contrast, only 12 households (2.8%) fall into the $10,000 to $14,999 income bracket, making it the least populous group.
| Income Bracket | # Households | % Households |
| Less than $10,000 | 18 | 4.1% |
| $10,000 to $14,999 | 12 | 2.8% |
| $15,000 to $24,999 | 37 | 8.5% |
| $25,000 to $34,999 | 45 | 10.4% |
| $35,000 to $49,999 | 78 | 18.0% |
| $50,000 to $74,999 | 91 | 21.0% |
| $75,000 to $99,999 | 52 | 12.0% |
| $100,000 to $149,999 | 68 | 15.7% |
| $150,000 to $199,999 | 19 | 4.4% |
| $200,000+ | 14 | 3.2% |
Household Income by Householder Age in Buchanan
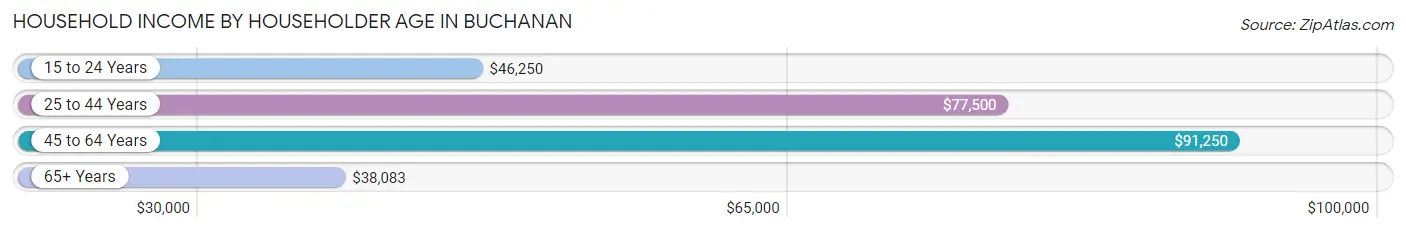
The median household income in Buchanan is $54,167, with the highest median household income of $91,250 found in the 45 to 64 years age bracket for the primary householder. A total of 196 households (45.2%) fall into this category. Meanwhile, the 65+ years age bracket for the primary householder has the lowest median household income of $38,083, with 134 households (30.9%) in this group.
| Income Bracket | # Households | Median Income |
| 15 to 24 Years | 24 (5.5%) | $46,250 |
| 25 to 44 Years | 80 (18.4%) | $77,500 |
| 45 to 64 Years | 196 (45.2%) | $91,250 |
| 65+ Years | 134 (30.9%) | $38,083 |
| Total | 434 (100.0%) | $54,167 |
Poverty in Buchanan
Income Below Poverty by Sex and Age in Buchanan
With 16.6% poverty level for males and 24.2% for females among the residents of Buchanan, 12 to 14 year old males and 18 to 24 year old females are the most vulnerable to poverty, with 17 males (63.0%) and 42 females (57.5%) in their respective age groups living below the poverty level.
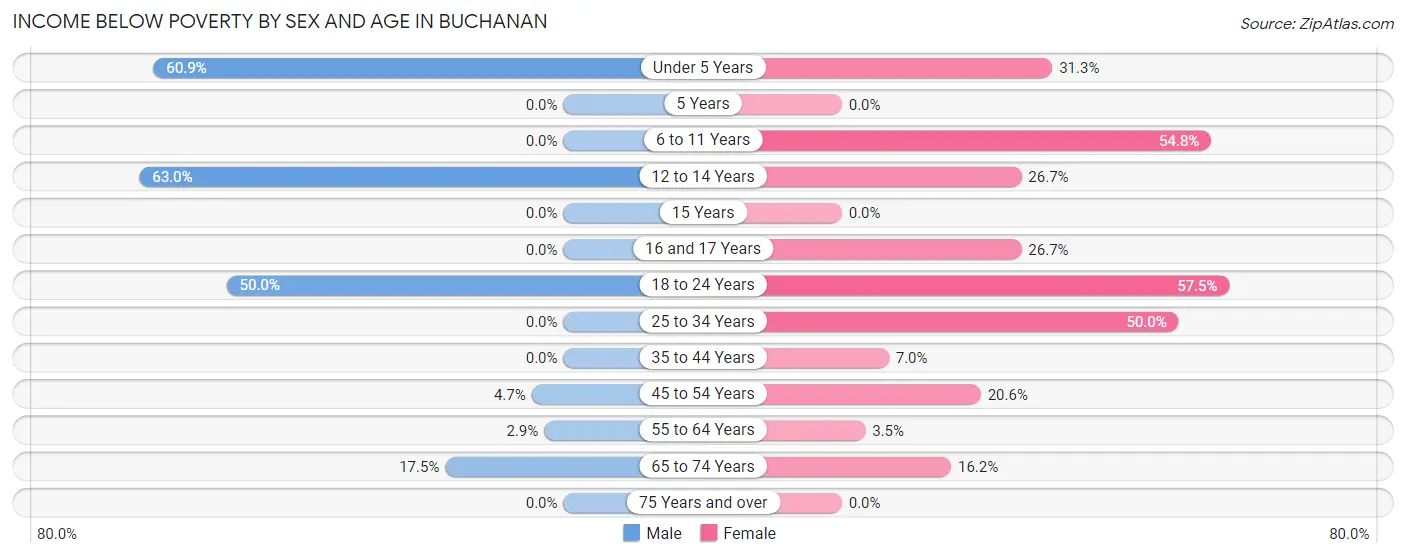
| Age Bracket | Male | Female |
| Under 5 Years | 14 (60.9%) | 10 (31.2%) |
| 5 Years | 0 (0.0%) | 0 (0.0%) |
| 6 to 11 Years | 0 (0.0%) | 17 (54.8%) |
| 12 to 14 Years | 17 (63.0%) | 4 (26.7%) |
| 15 Years | 0 (0.0%) | 0 (0.0%) |
| 16 and 17 Years | 0 (0.0%) | 4 (26.7%) |
| 18 to 24 Years | 45 (50.0%) | 42 (57.5%) |
| 25 to 34 Years | 0 (0.0%) | 21 (50.0%) |
| 35 to 44 Years | 0 (0.0%) | 3 (7.0%) |
| 45 to 54 Years | 6 (4.7%) | 13 (20.6%) |
| 55 to 64 Years | 3 (2.9%) | 3 (3.5%) |
| 65 to 74 Years | 10 (17.5%) | 12 (16.2%) |
| 75 Years and over | 0 (0.0%) | 0 (0.0%) |
| Total | 95 (16.6%) | 129 (24.2%) |
Income Above Poverty by Sex and Age in Buchanan
According to the poverty statistics in Buchanan, males aged 5 years and females aged 5 years are the age groups that are most secure financially, with 100.0% of males and 100.0% of females in these age groups living above the poverty line.
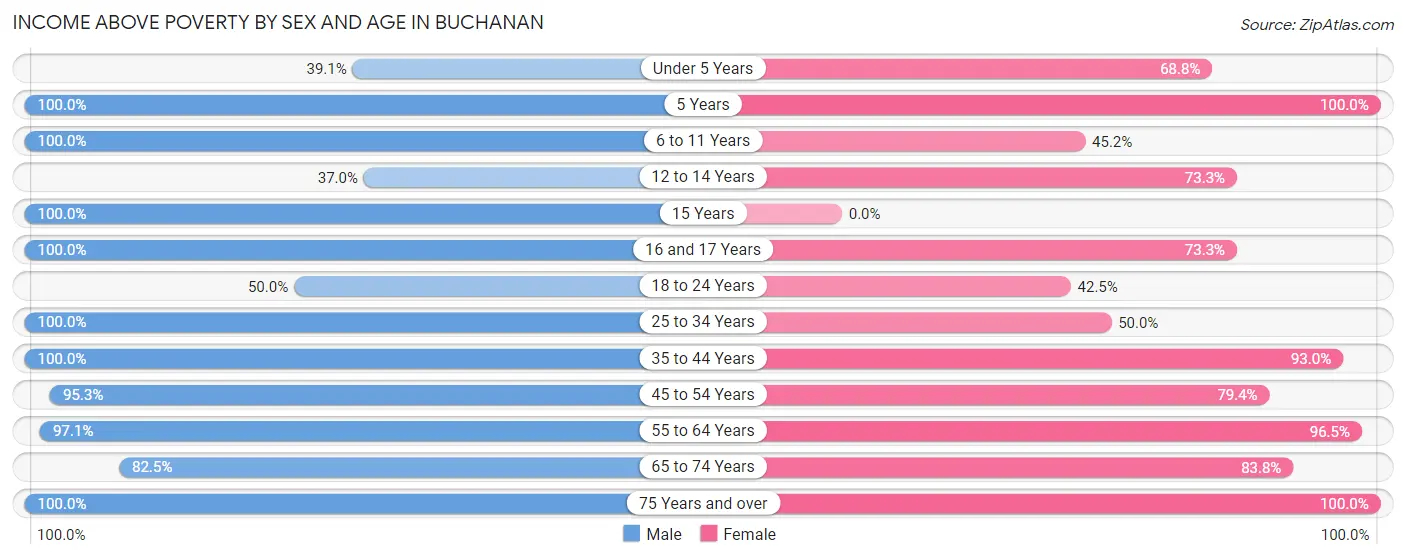
| Age Bracket | Male | Female |
| Under 5 Years | 9 (39.1%) | 22 (68.8%) |
| 5 Years | 5 (100.0%) | 8 (100.0%) |
| 6 to 11 Years | 22 (100.0%) | 14 (45.2%) |
| 12 to 14 Years | 10 (37.0%) | 11 (73.3%) |
| 15 Years | 3 (100.0%) | 0 (0.0%) |
| 16 and 17 Years | 9 (100.0%) | 11 (73.3%) |
| 18 to 24 Years | 45 (50.0%) | 31 (42.5%) |
| 25 to 34 Years | 32 (100.0%) | 21 (50.0%) |
| 35 to 44 Years | 28 (100.0%) | 40 (93.0%) |
| 45 to 54 Years | 121 (95.3%) | 50 (79.4%) |
| 55 to 64 Years | 102 (97.1%) | 83 (96.5%) |
| 65 to 74 Years | 47 (82.5%) | 62 (83.8%) |
| 75 Years and over | 46 (100.0%) | 52 (100.0%) |
| Total | 479 (83.5%) | 405 (75.8%) |
Income Below Poverty Among Married-Couple Families in Buchanan
The poverty statistics for married-couple families in Buchanan show that 7.1% or 15 of the total 210 families live below the poverty line. Families with no children have the highest poverty rate of 9.2%, comprising of 15 families. On the other hand, families with 1 or 2 children have the lowest poverty rate of 0.0%, which includes 0 families.
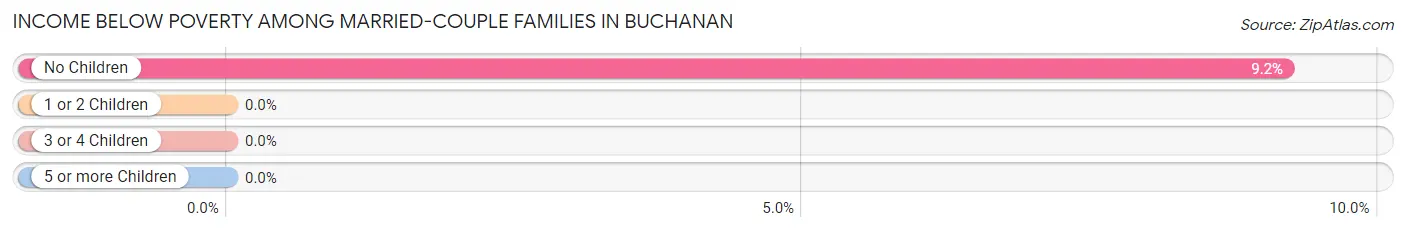
| Children | Above Poverty | Below Poverty |
| No Children | 148 (90.8%) | 15 (9.2%) |
| 1 or 2 Children | 42 (100.0%) | 0 (0.0%) |
| 3 or 4 Children | 5 (100.0%) | 0 (0.0%) |
| 5 or more Children | 0 (0.0%) | 0 (0.0%) |
| Total | 195 (92.9%) | 15 (7.1%) |
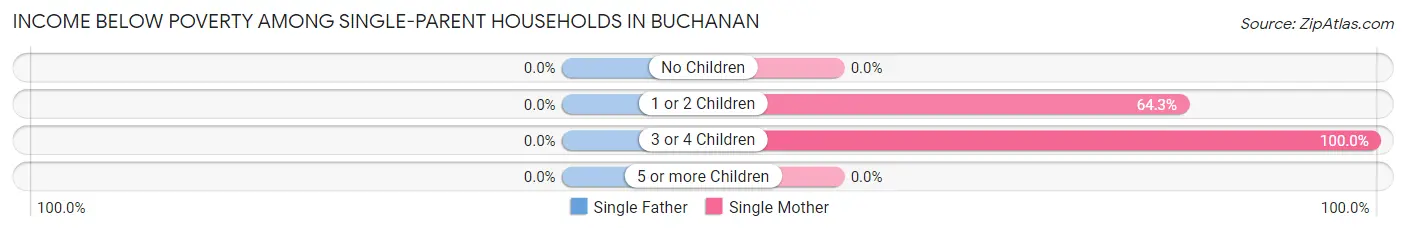
Income Below Poverty Among Single-Parent Households in Buchanan
| Children | Single Father | Single Mother |
| No Children | 0 (0.0%) | 0 (0.0%) |
| 1 or 2 Children | 0 (0.0%) | 9 (64.3%) |
| 3 or 4 Children | 0 (0.0%) | 18 (100.0%) |
| 5 or more Children | 0 (0.0%) | 0 (0.0%) |
| Total | 0 (0.0%) | 27 (79.4%) |
Income Below Poverty Among Married-Couple vs Single-Parent Households in Buchanan
The poverty data for Buchanan shows that 15 of the married-couple family households (7.1%) and 27 of the single-parent households (47.4%) are living below the poverty level. Within the married-couple family households, those with no children have the highest poverty rate, with 15 households (9.2%) falling below the poverty line. Among the single-parent households, those with 3 or 4 children have the highest poverty rate, with 18 household (100.0%) living below poverty.
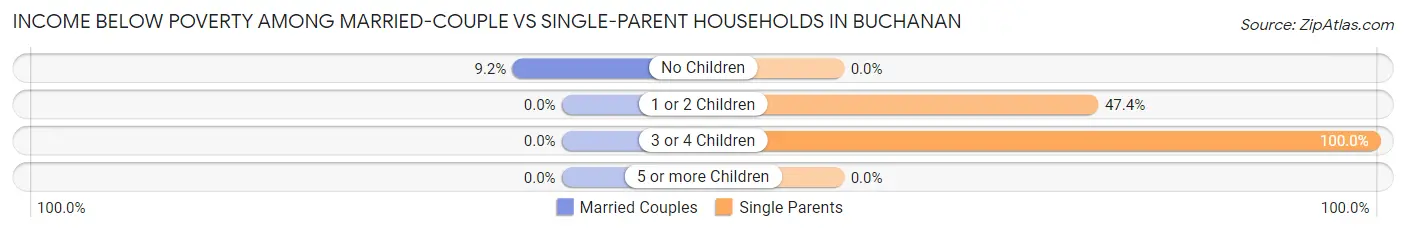
| Children | Married-Couple Families | Single-Parent Households |
| No Children | 15 (9.2%) | 0 (0.0%) |
| 1 or 2 Children | 0 (0.0%) | 9 (47.4%) |
| 3 or 4 Children | 0 (0.0%) | 18 (100.0%) |
| 5 or more Children | 0 (0.0%) | 0 (0.0%) |
| Total | 15 (7.1%) | 27 (47.4%) |
Race in Buchanan
The most populous races in Buchanan are White / Caucasian (1,025 | 92.5%), Black / African American (48 | 4.3%), and Two or more Races (30 | 2.7%).
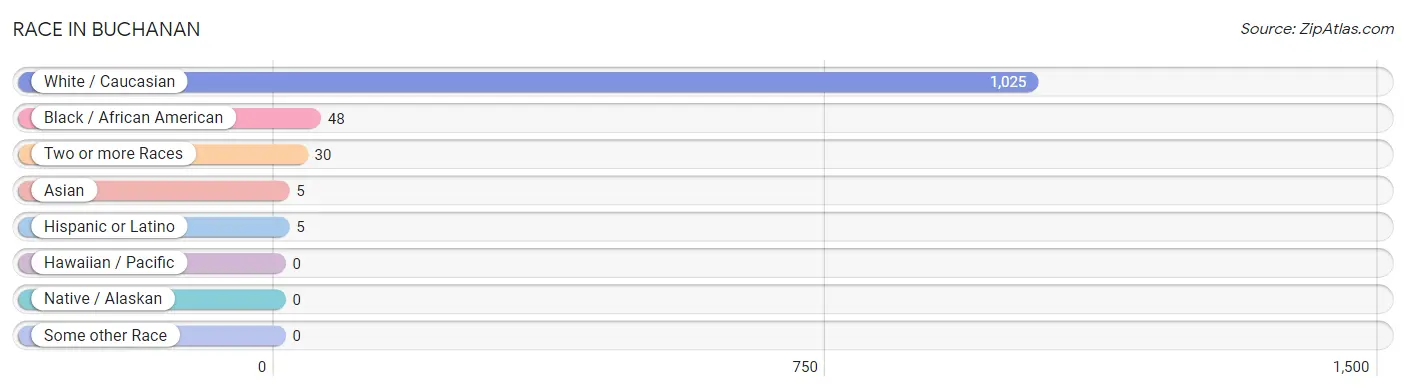
| Race | # Population | % Population |
| Asian | 5 | 0.4% |
| Black / African American | 48 | 4.3% |
| Hawaiian / Pacific | 0 | 0.0% |
| Hispanic or Latino | 5 | 0.4% |
| Native / Alaskan | 0 | 0.0% |
| White / Caucasian | 1,025 | 92.5% |
| Two or more Races | 30 | 2.7% |
| Some other Race | 0 | 0.0% |
| Total | 1,108 | 100.0% |
Ancestry in Buchanan
The most populous ancestries reported in Buchanan are American (341 | 30.8%), English (132 | 11.9%), Irish (92 | 8.3%), German (80 | 7.2%), and Italian (25 | 2.3%), together accounting for 60.5% of all Buchanan residents.
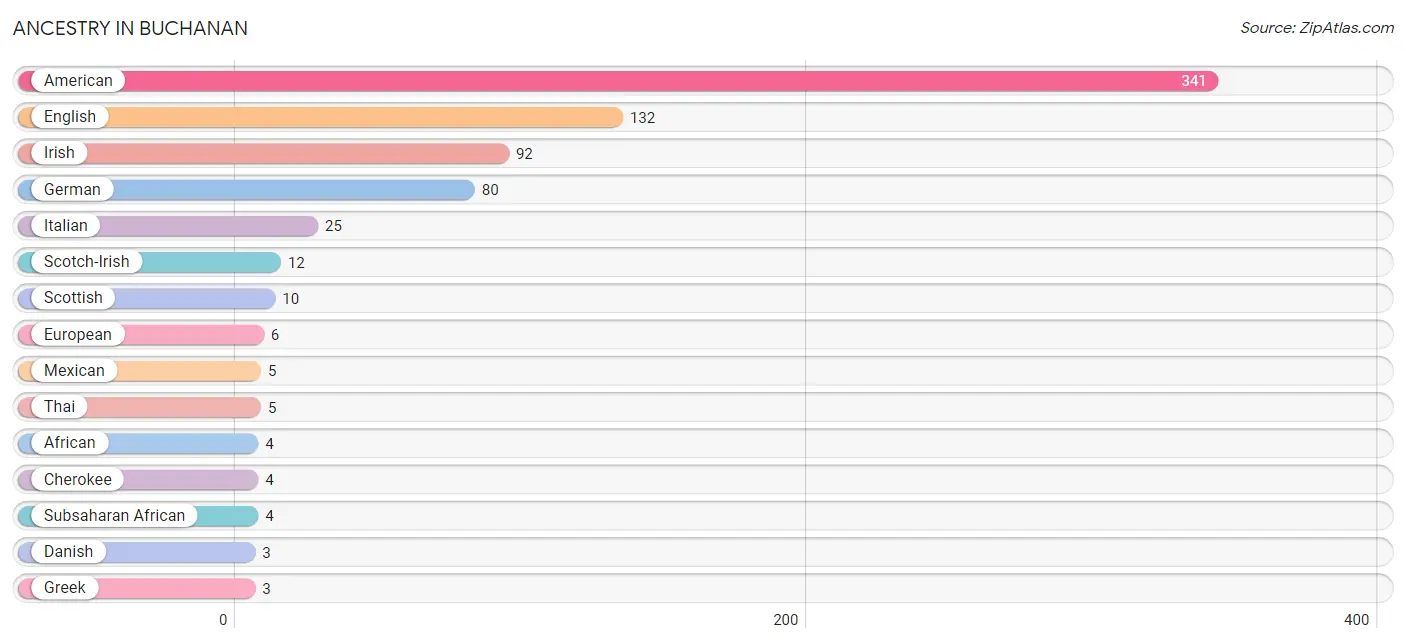
| Ancestry | # Population | % Population |
| African | 4 | 0.4% |
| American | 341 | 30.8% |
| Cherokee | 4 | 0.4% |
| Danish | 3 | 0.3% |
| English | 132 | 11.9% |
| European | 6 | 0.5% |
| German | 80 | 7.2% |
| Greek | 3 | 0.3% |
| Irish | 92 | 8.3% |
| Italian | 25 | 2.3% |
| Mexican | 5 | 0.4% |
| Polish | 2 | 0.2% |
| Scotch-Irish | 12 | 1.1% |
| Scottish | 10 | 0.9% |
| Subsaharan African | 4 | 0.4% |
| Thai | 5 | 0.4% |
| Ukrainian | 3 | 0.3% |
| Welsh | 2 | 0.2% | View All 18 Rows |
Immigrants in Buchanan
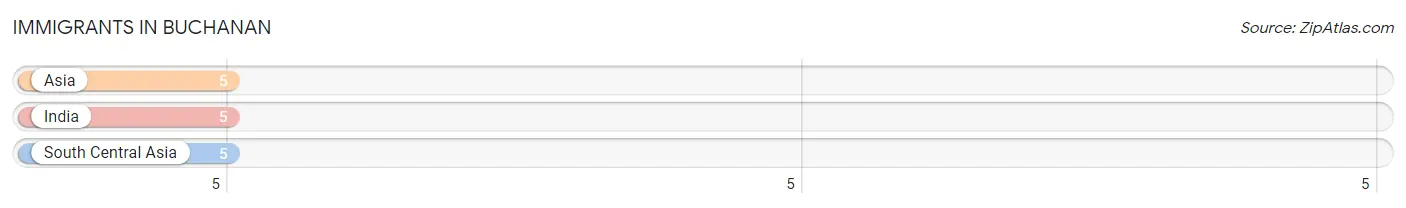
The most numerous immigrant groups reported in Buchanan came from Asia (5 | 0.4%), India (5 | 0.4%), and South Central Asia (5 | 0.4%), together accounting for 1.3% of all Buchanan residents.
| Immigration Origin | # Population | % Population |
| Asia | 5 | 0.4% |
| India | 5 | 0.4% |
| South Central Asia | 5 | 0.4% | View All 3 Rows |
Sex and Age in Buchanan
Sex and Age in Buchanan
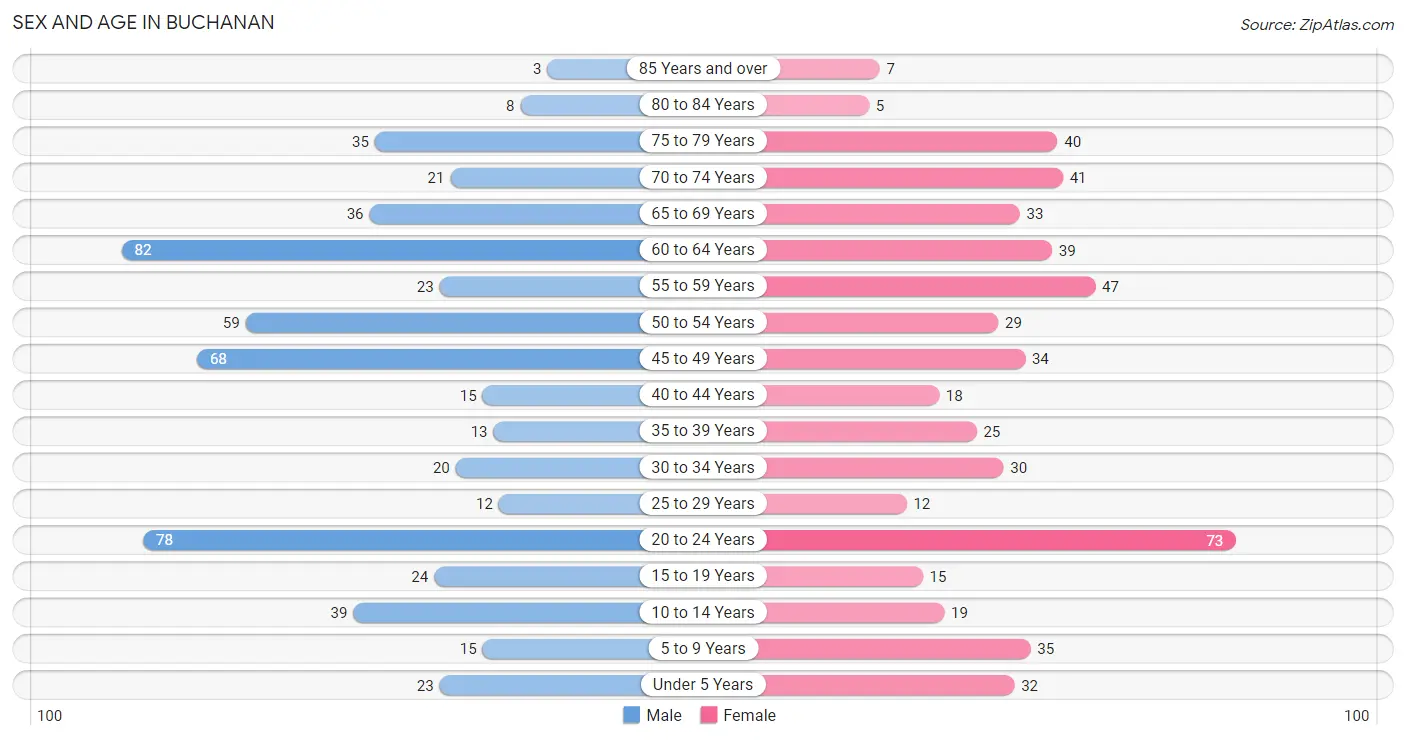
The most populous age groups in Buchanan are 60 to 64 Years (82 | 14.3%) for men and 20 to 24 Years (73 | 13.7%) for women.
| Age Bracket | Male | Female |
| Under 5 Years | 23 (4.0%) | 32 (6.0%) |
| 5 to 9 Years | 15 (2.6%) | 35 (6.6%) |
| 10 to 14 Years | 39 (6.8%) | 19 (3.6%) |
| 15 to 19 Years | 24 (4.2%) | 15 (2.8%) |
| 20 to 24 Years | 78 (13.6%) | 73 (13.7%) |
| 25 to 29 Years | 12 (2.1%) | 12 (2.2%) |
| 30 to 34 Years | 20 (3.5%) | 30 (5.6%) |
| 35 to 39 Years | 13 (2.3%) | 25 (4.7%) |
| 40 to 44 Years | 15 (2.6%) | 18 (3.4%) |
| 45 to 49 Years | 68 (11.8%) | 34 (6.4%) |
| 50 to 54 Years | 59 (10.3%) | 29 (5.4%) |
| 55 to 59 Years | 23 (4.0%) | 47 (8.8%) |
| 60 to 64 Years | 82 (14.3%) | 39 (7.3%) |
| 65 to 69 Years | 36 (6.3%) | 33 (6.2%) |
| 70 to 74 Years | 21 (3.7%) | 41 (7.7%) |
| 75 to 79 Years | 35 (6.1%) | 40 (7.5%) |
| 80 to 84 Years | 8 (1.4%) | 5 (0.9%) |
| 85 Years and over | 3 (0.5%) | 7 (1.3%) |
| Total | 574 (100.0%) | 534 (100.0%) |
Families and Households in Buchanan
Median Family Size in Buchanan
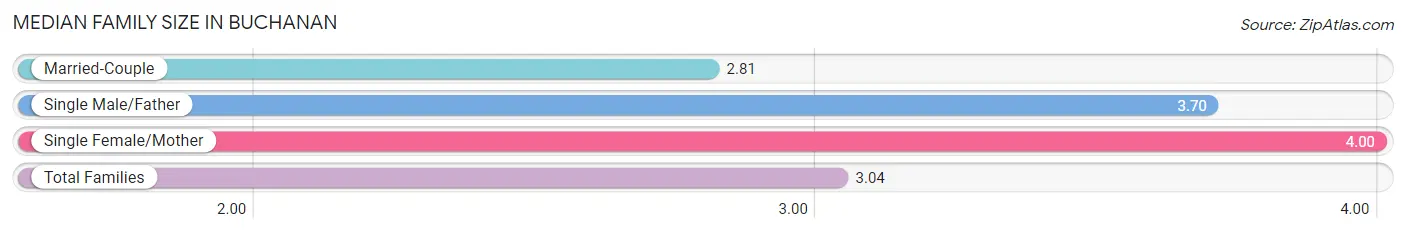
The median family size in Buchanan is 3.04 persons per family, with single female/mother families (34 | 12.7%) accounting for the largest median family size of 4 persons per family. On the other hand, married-couple families (210 | 78.6%) represent the smallest median family size with 2.81 persons per family.
| Family Type | # Families | Family Size |
| Married-Couple | 210 (78.6%) | 2.81 |
| Single Male/Father | 23 (8.6%) | 3.70 |
| Single Female/Mother | 34 (12.7%) | 4.00 |
| Total Families | 267 (100.0%) | 3.04 |
Median Household Size in Buchanan
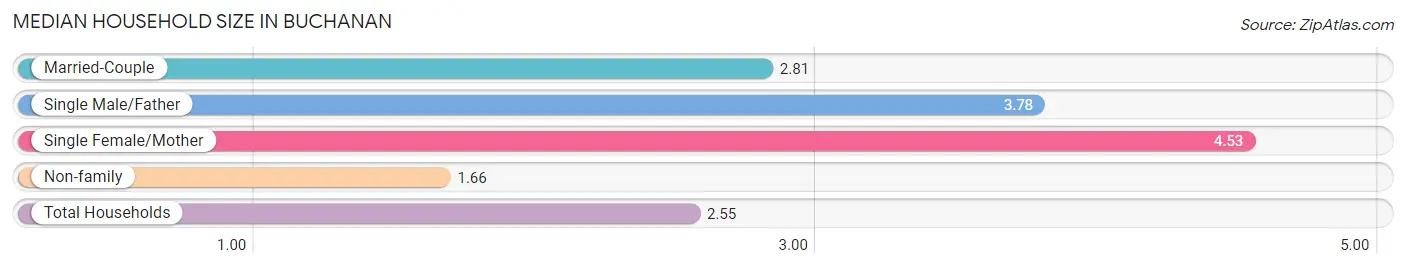
The median household size in Buchanan is 2.55 persons per household, with single female/mother households (34 | 7.8%) accounting for the largest median household size of 4.53 persons per household. non-family households (167 | 38.5%) represent the smallest median household size with 1.66 persons per household.
| Household Type | # Households | Household Size |
| Married-Couple | 210 (48.4%) | 2.81 |
| Single Male/Father | 23 (5.3%) | 3.78 |
| Single Female/Mother | 34 (7.8%) | 4.53 |
| Non-family | 167 (38.5%) | 1.66 |
| Total Households | 434 (100.0%) | 2.55 |
Household Size by Marriage Status in Buchanan
Out of a total of 434 households in Buchanan, 267 (61.5%) are family households, while 167 (38.5%) are nonfamily households. The most numerous type of family households are 2-person households, comprising 177, and the most common type of nonfamily households are 1-person households, comprising 134.
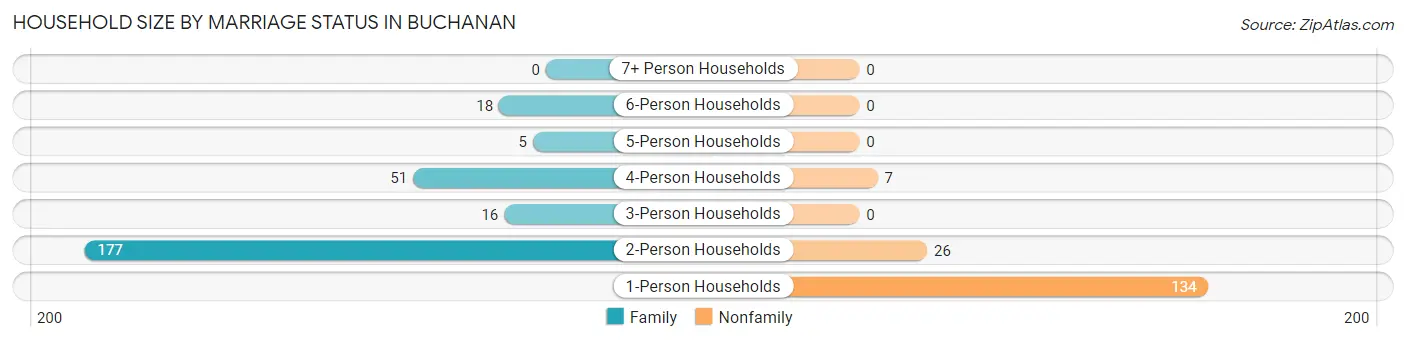
| Household Size | Family Households | Nonfamily Households |
| 1-Person Households | - | 134 (30.9%) |
| 2-Person Households | 177 (40.8%) | 26 (6.0%) |
| 3-Person Households | 16 (3.7%) | 0 (0.0%) |
| 4-Person Households | 51 (11.7%) | 7 (1.6%) |
| 5-Person Households | 5 (1.1%) | 0 (0.0%) |
| 6-Person Households | 18 (4.2%) | 0 (0.0%) |
| 7+ Person Households | 0 (0.0%) | 0 (0.0%) |
| Total | 267 (61.5%) | 167 (38.5%) |
Female Fertility in Buchanan
Fertility by Age in Buchanan
Average fertility rate in Buchanan is 95.0 births per 1,000 women. Women in the age bracket of 20 to 34 years have the highest fertility rate with 157.0 births per 1,000 women. Women in the age bracket of 20 to 34 years acount for 90.0% of all women with births.
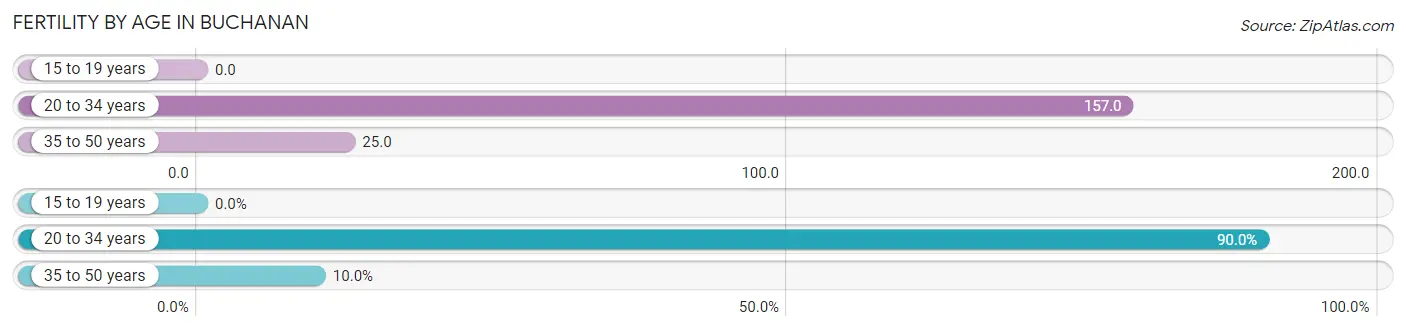
| Age Bracket | Women with Births | Births / 1,000 Women |
| 15 to 19 years | 0 (0.0%) | 0.0 |
| 20 to 34 years | 18 (90.0%) | 157.0 |
| 35 to 50 years | 2 (10.0%) | 25.0 |
| Total | 20 (100.0%) | 95.0 |
Fertility by Age by Marriage Status in Buchanan
15.0% of women with births (20) in Buchanan are married. The highest percentage of unmarried women with births falls into 20 to 34 years age bracket with 94.4% of them unmarried at the time of birth, while the lowest percentage of unmarried women with births belong to 35 to 50 years age bracket with 0.0% of them unmarried.
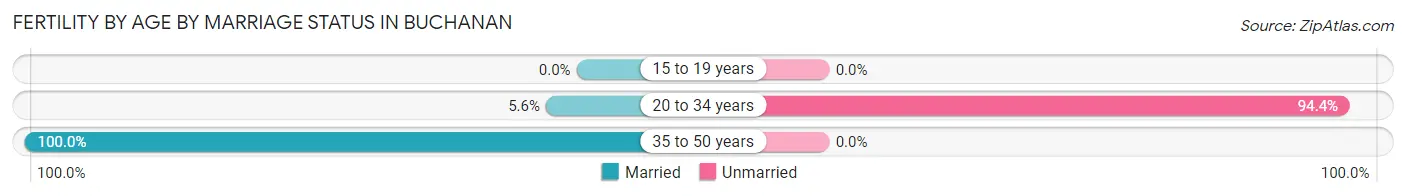
| Age Bracket | Married | Unmarried |
| 15 to 19 years | 0 (0.0%) | 0 (0.0%) |
| 20 to 34 years | 1 (5.6%) | 17 (94.4%) |
| 35 to 50 years | 2 (100.0%) | 0 (0.0%) |
| Total | 3 (15.0%) | 17 (85.0%) |
Fertility by Education in Buchanan
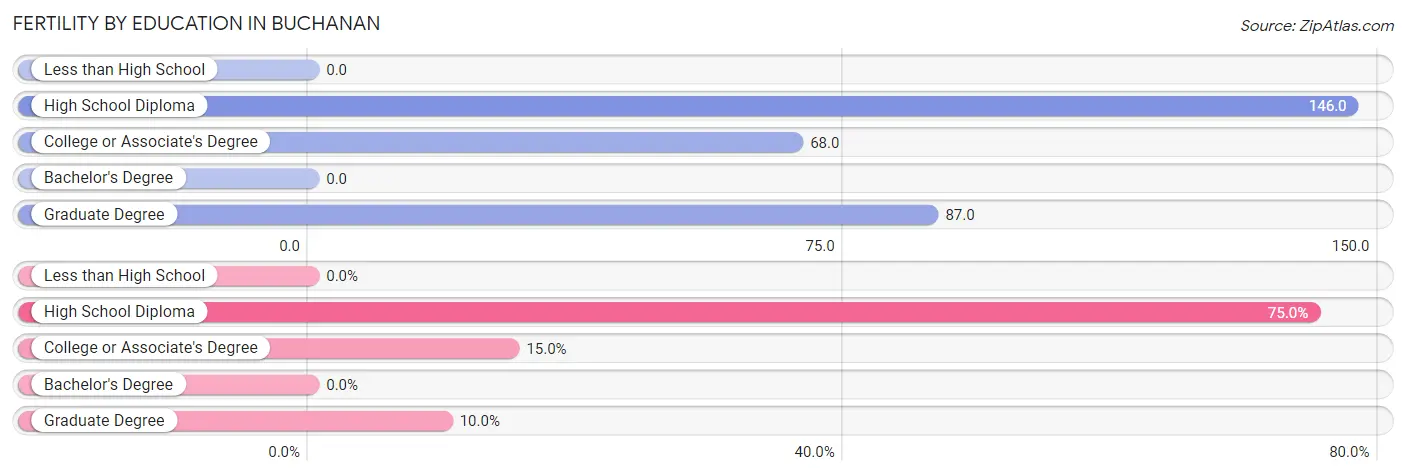
| Educational Attainment | Women with Births | Births / 1,000 Women |
| Less than High School | 0 (0.0%) | 0.0 |
| High School Diploma | 15 (75.0%) | 146.0 |
| College or Associate's Degree | 3 (15.0%) | 68.0 |
| Bachelor's Degree | 0 (0.0%) | 0.0 |
| Graduate Degree | 2 (10.0%) | 87.0 |
| Total | 20 (100.0%) | 95.0 |
Fertility by Education by Marriage Status in Buchanan
85.0% of women with births in Buchanan are unmarried. Women with the educational attainment of graduate degree are most likely to be married with 100.0% of them married at childbirth, while women with the educational attainment of high school diploma are least likely to be married with 100.0% of them unmarried at childbirth.
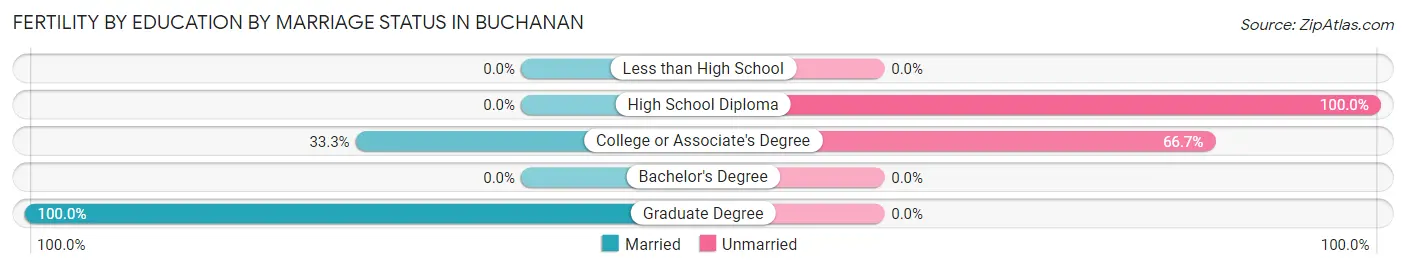
| Educational Attainment | Married | Unmarried |
| Less than High School | 0 (0.0%) | 0 (0.0%) |
| High School Diploma | 0 (0.0%) | 15 (100.0%) |
| College or Associate's Degree | 1 (33.3%) | 2 (66.7%) |
| Bachelor's Degree | 0 (0.0%) | 0 (0.0%) |
| Graduate Degree | 2 (100.0%) | 0 (0.0%) |
| Total | 3 (15.0%) | 17 (85.0%) |
Employment Characteristics in Buchanan
Employment by Class of Employer in Buchanan
Among the 490 employed individuals in Buchanan, private company employees (350 | 71.4%), local government employees (62 | 12.7%), and not-for-profit organizations (28 | 5.7%) make up the most common classes of employment.
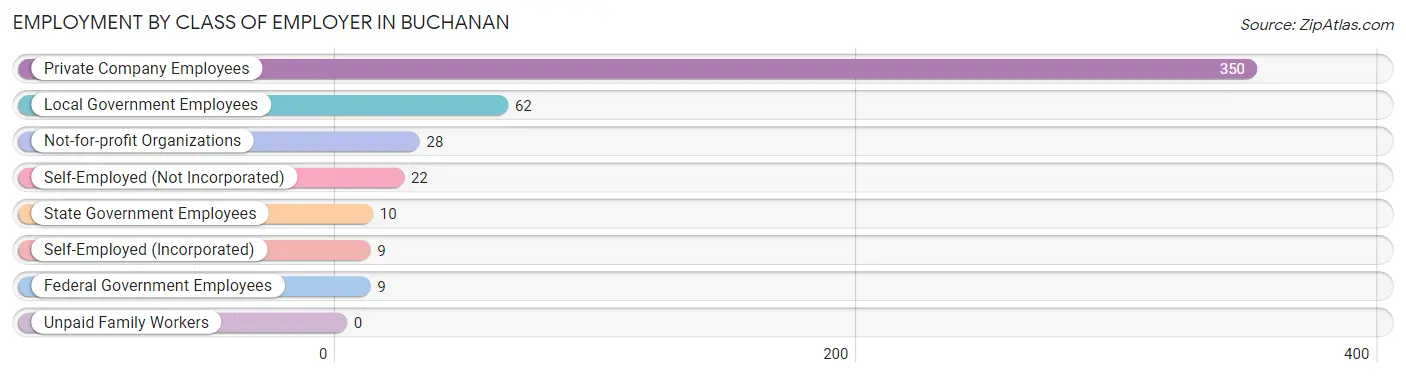
| Employer Class | # Employees | % Employees |
| Private Company Employees | 350 | 71.4% |
| Self-Employed (Incorporated) | 9 | 1.8% |
| Self-Employed (Not Incorporated) | 22 | 4.5% |
| Not-for-profit Organizations | 28 | 5.7% |
| Local Government Employees | 62 | 12.7% |
| State Government Employees | 10 | 2.0% |
| Federal Government Employees | 9 | 1.8% |
| Unpaid Family Workers | 0 | 0.0% |
| Total | 490 | 100.0% |
Employment Status by Age in Buchanan
According to the labor force statistics for Buchanan, out of the total population over 16 years of age (942), 57.3% or 540 individuals are in the labor force, with 8.1% or 44 of them unemployed. The age group with the highest labor force participation rate is 20 to 24 years, with 96.0% or 145 individuals in the labor force. Within the labor force, the 20 to 24 years age range has the highest percentage of unemployed individuals, with 23.4% or 34 of them being unemployed.
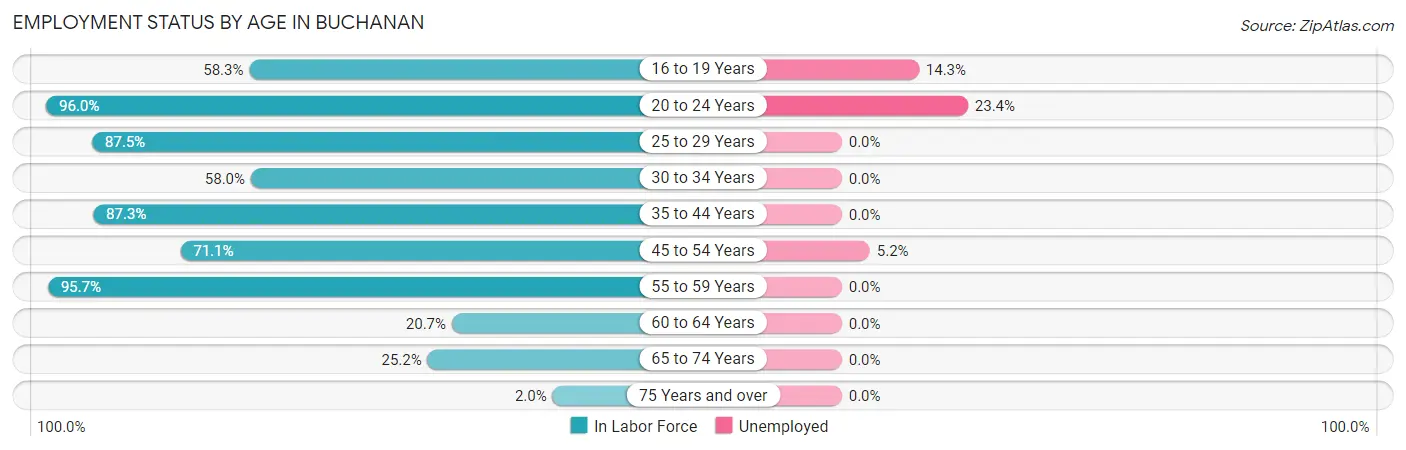
| Age Bracket | In Labor Force | Unemployed |
| 16 to 19 Years | 21 (58.3%) | 3 (14.3%) |
| 20 to 24 Years | 145 (96.0%) | 34 (23.4%) |
| 25 to 29 Years | 21 (87.5%) | 0 (0.0%) |
| 30 to 34 Years | 29 (58.0%) | 0 (0.0%) |
| 35 to 44 Years | 62 (87.3%) | 0 (0.0%) |
| 45 to 54 Years | 135 (71.1%) | 7 (5.2%) |
| 55 to 59 Years | 67 (95.7%) | 0 (0.0%) |
| 60 to 64 Years | 25 (20.7%) | 0 (0.0%) |
| 65 to 74 Years | 33 (25.2%) | 0 (0.0%) |
| 75 Years and over | 2 (2.0%) | 0 (0.0%) |
| Total | 540 (57.3%) | 44 (8.1%) |
Employment Status by Educational Attainment in Buchanan
According to labor force statistics for Buchanan, 64.4% of individuals (339) out of the total population between 25 and 64 years of age (526) are in the labor force, with 2.1% or 7 of them being unemployed. The group with the highest labor force participation rate are those with the educational attainment of bachelor's degree or higher, with 83.6% or 112 individuals in the labor force. Within the labor force, individuals with college / associate degree education have the highest percentage of unemployment, with 3.9% or 4 of them being unemployed.
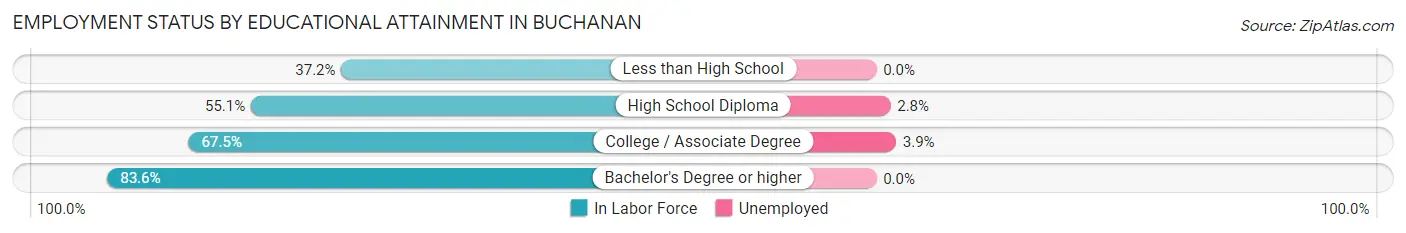
| Educational Attainment | In Labor Force | Unemployed |
| Less than High School | 16 (37.2%) | 0 (0.0%) |
| High School Diploma | 109 (55.1%) | 6 (2.8%) |
| College / Associate Degree | 102 (67.5%) | 6 (3.9%) |
| Bachelor's Degree or higher | 112 (83.6%) | 0 (0.0%) |
| Total | 339 (64.4%) | 11 (2.1%) |
Employment Occupations by Sex in Buchanan
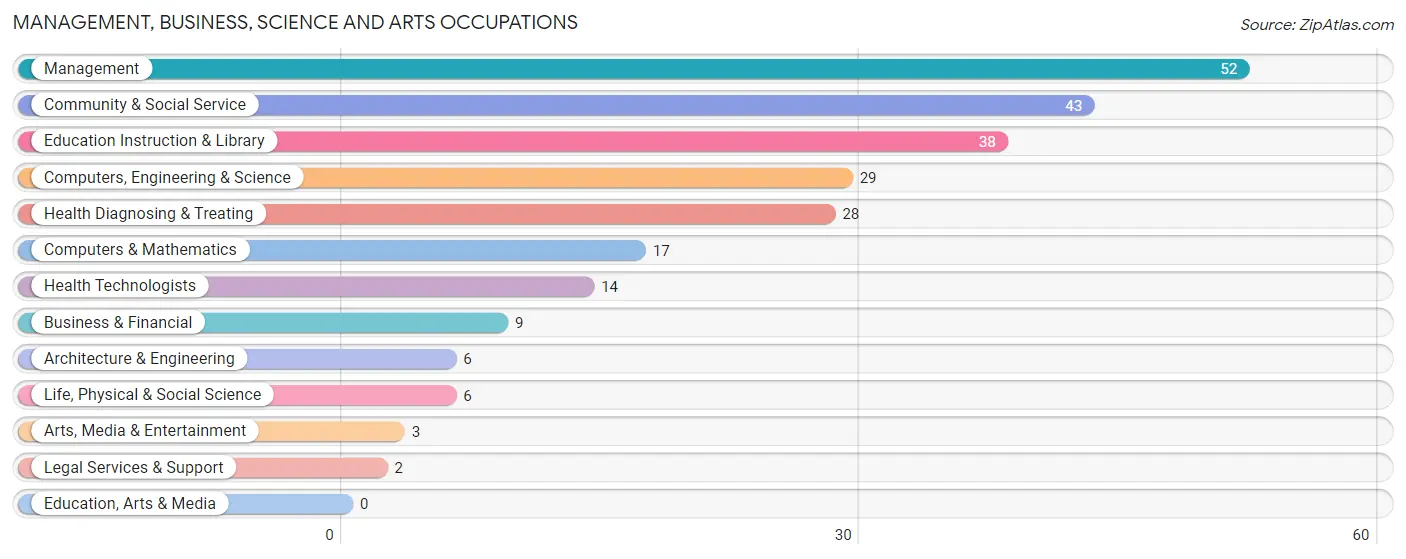
Management, Business, Science and Arts Occupations
The most common Management, Business, Science and Arts occupations in Buchanan are Management (52 | 10.5%), Community & Social Service (43 | 8.7%), Education Instruction & Library (38 | 7.7%), Computers, Engineering & Science (29 | 5.9%), and Health Diagnosing & Treating (28 | 5.7%).
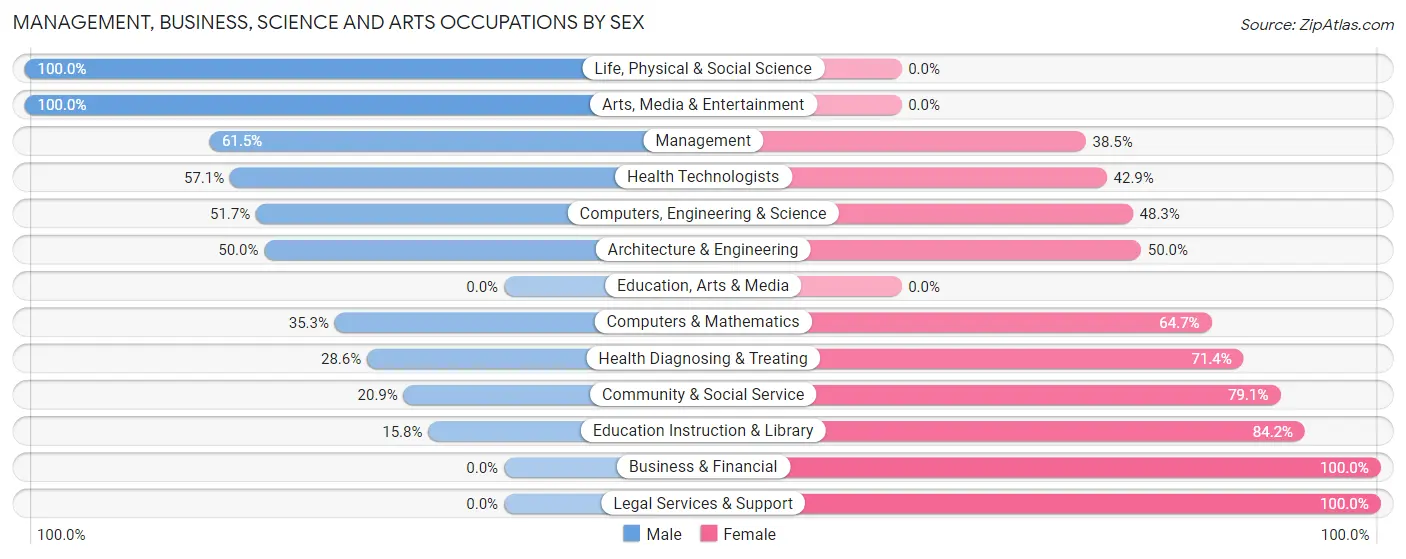
Management, Business, Science and Arts Occupations by Sex
Within the Management, Business, Science and Arts occupations in Buchanan, the most male-oriented occupations are Life, Physical & Social Science (100.0%), Arts, Media & Entertainment (100.0%), and Management (61.5%), while the most female-oriented occupations are Business & Financial (100.0%), Legal Services & Support (100.0%), and Education Instruction & Library (84.2%).
| Occupation | Male | Female |
| Management | 32 (61.5%) | 20 (38.5%) |
| Business & Financial | 0 (0.0%) | 9 (100.0%) |
| Computers, Engineering & Science | 15 (51.7%) | 14 (48.3%) |
| Computers & Mathematics | 6 (35.3%) | 11 (64.7%) |
| Architecture & Engineering | 3 (50.0%) | 3 (50.0%) |
| Life, Physical & Social Science | 6 (100.0%) | 0 (0.0%) |
| Community & Social Service | 9 (20.9%) | 34 (79.1%) |
| Education, Arts & Media | 0 (0.0%) | 0 (0.0%) |
| Legal Services & Support | 0 (0.0%) | 2 (100.0%) |
| Education Instruction & Library | 6 (15.8%) | 32 (84.2%) |
| Arts, Media & Entertainment | 3 (100.0%) | 0 (0.0%) |
| Health Diagnosing & Treating | 8 (28.6%) | 20 (71.4%) |
| Health Technologists | 8 (57.1%) | 6 (42.9%) |
| Total (Category) | 64 (39.8%) | 97 (60.3%) |
| Total (Overall) | 241 (48.6%) | 255 (51.4%) |
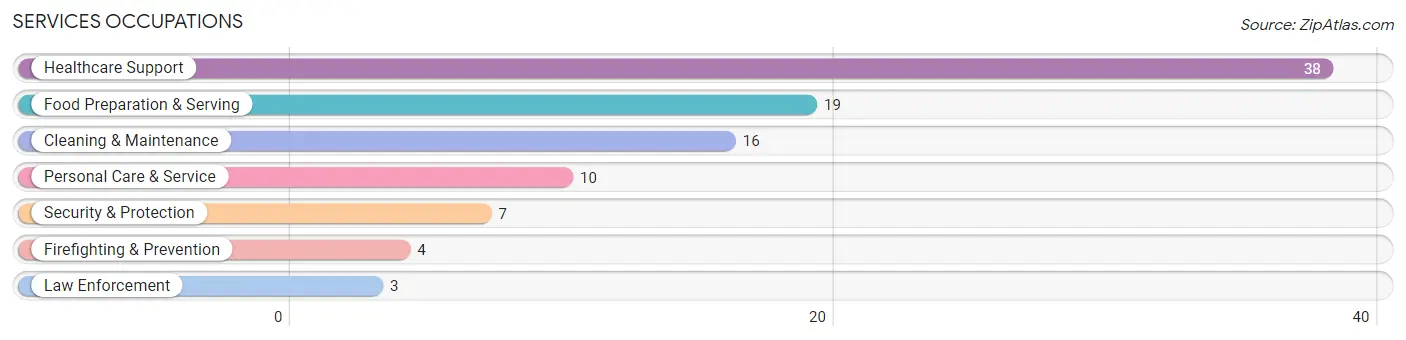
Services Occupations
The most common Services occupations in Buchanan are Healthcare Support (38 | 7.7%), Food Preparation & Serving (19 | 3.8%), Cleaning & Maintenance (16 | 3.2%), Personal Care & Service (10 | 2.0%), and Security & Protection (7 | 1.4%).
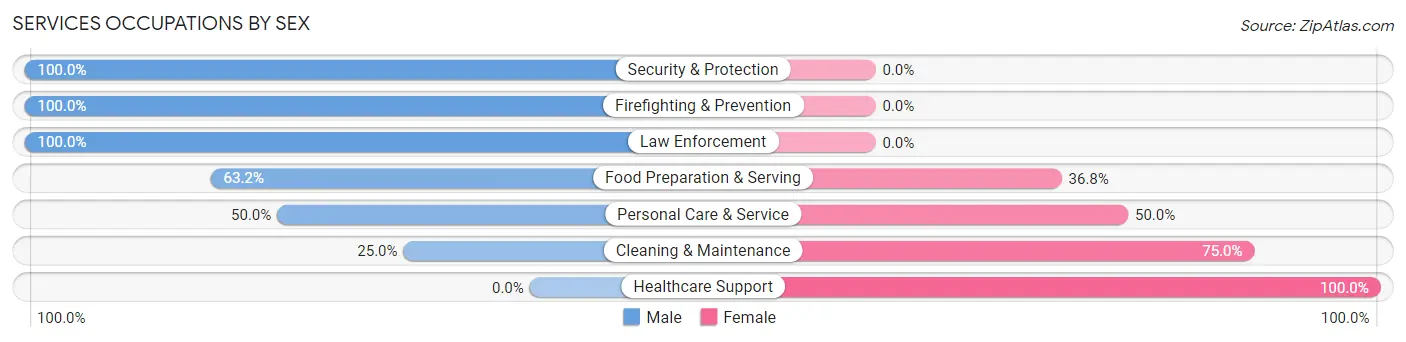
Services Occupations by Sex
Within the Services occupations in Buchanan, the most male-oriented occupations are Security & Protection (100.0%), Firefighting & Prevention (100.0%), and Law Enforcement (100.0%), while the most female-oriented occupations are Healthcare Support (100.0%), Cleaning & Maintenance (75.0%), and Personal Care & Service (50.0%).
| Occupation | Male | Female |
| Healthcare Support | 0 (0.0%) | 38 (100.0%) |
| Security & Protection | 7 (100.0%) | 0 (0.0%) |
| Firefighting & Prevention | 4 (100.0%) | 0 (0.0%) |
| Law Enforcement | 3 (100.0%) | 0 (0.0%) |
| Food Preparation & Serving | 12 (63.2%) | 7 (36.8%) |
| Cleaning & Maintenance | 4 (25.0%) | 12 (75.0%) |
| Personal Care & Service | 5 (50.0%) | 5 (50.0%) |
| Total (Category) | 28 (31.1%) | 62 (68.9%) |
| Total (Overall) | 241 (48.6%) | 255 (51.4%) |
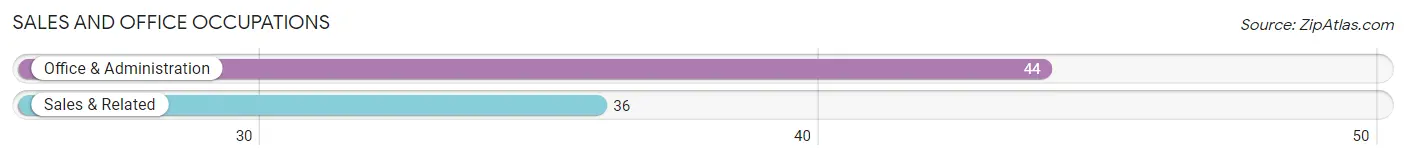
Sales and Office Occupations
The most common Sales and Office occupations in Buchanan are Office & Administration (44 | 8.9%), and Sales & Related (36 | 7.3%).
Sales and Office Occupations by Sex
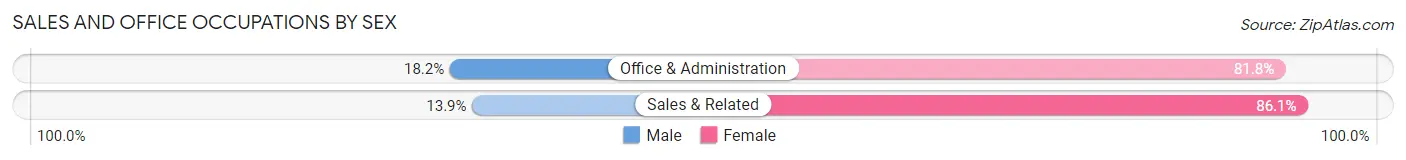
| Occupation | Male | Female |
| Sales & Related | 5 (13.9%) | 31 (86.1%) |
| Office & Administration | 8 (18.2%) | 36 (81.8%) |
| Total (Category) | 13 (16.3%) | 67 (83.8%) |
| Total (Overall) | 241 (48.6%) | 255 (51.4%) |
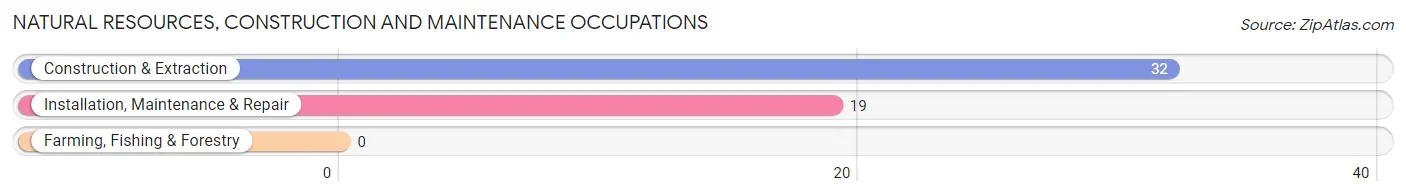
Natural Resources, Construction and Maintenance Occupations
The most common Natural Resources, Construction and Maintenance occupations in Buchanan are Construction & Extraction (32 | 6.5%), and Installation, Maintenance & Repair (19 | 3.8%).
Natural Resources, Construction and Maintenance Occupations by Sex
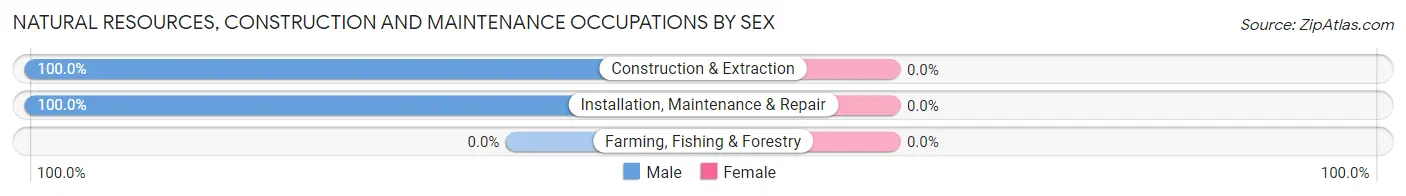
| Occupation | Male | Female |
| Farming, Fishing & Forestry | 0 (0.0%) | 0 (0.0%) |
| Construction & Extraction | 32 (100.0%) | 0 (0.0%) |
| Installation, Maintenance & Repair | 19 (100.0%) | 0 (0.0%) |
| Total (Category) | 51 (100.0%) | 0 (0.0%) |
| Total (Overall) | 241 (48.6%) | 255 (51.4%) |
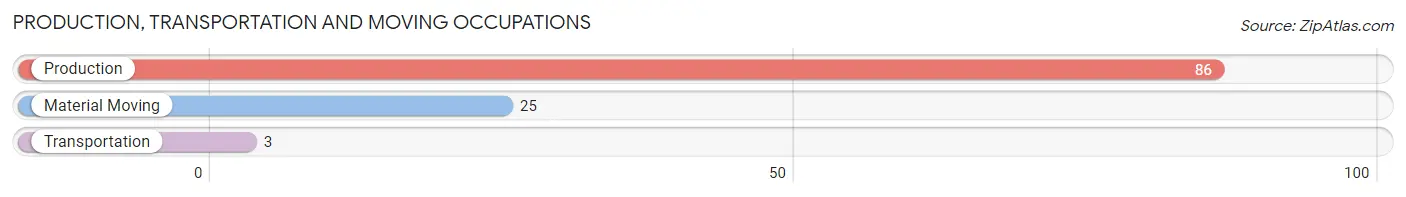
Production, Transportation and Moving Occupations
The most common Production, Transportation and Moving occupations in Buchanan are Production (86 | 17.3%), Material Moving (25 | 5.0%), and Transportation (3 | 0.6%).
Production, Transportation and Moving Occupations by Sex
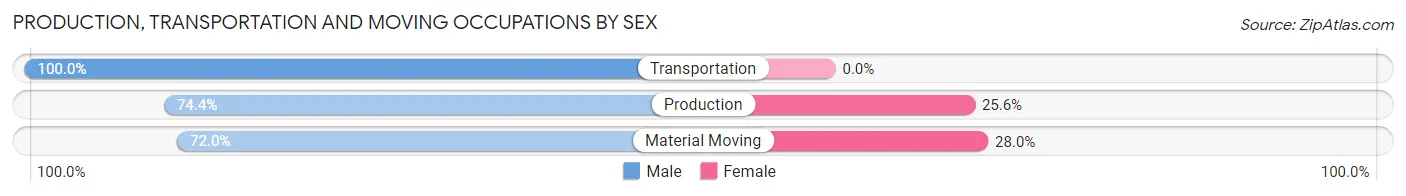
| Occupation | Male | Female |
| Production | 64 (74.4%) | 22 (25.6%) |
| Transportation | 3 (100.0%) | 0 (0.0%) |
| Material Moving | 18 (72.0%) | 7 (28.0%) |
| Total (Category) | 85 (74.6%) | 29 (25.4%) |
| Total (Overall) | 241 (48.6%) | 255 (51.4%) |
Employment Industries by Sex in Buchanan
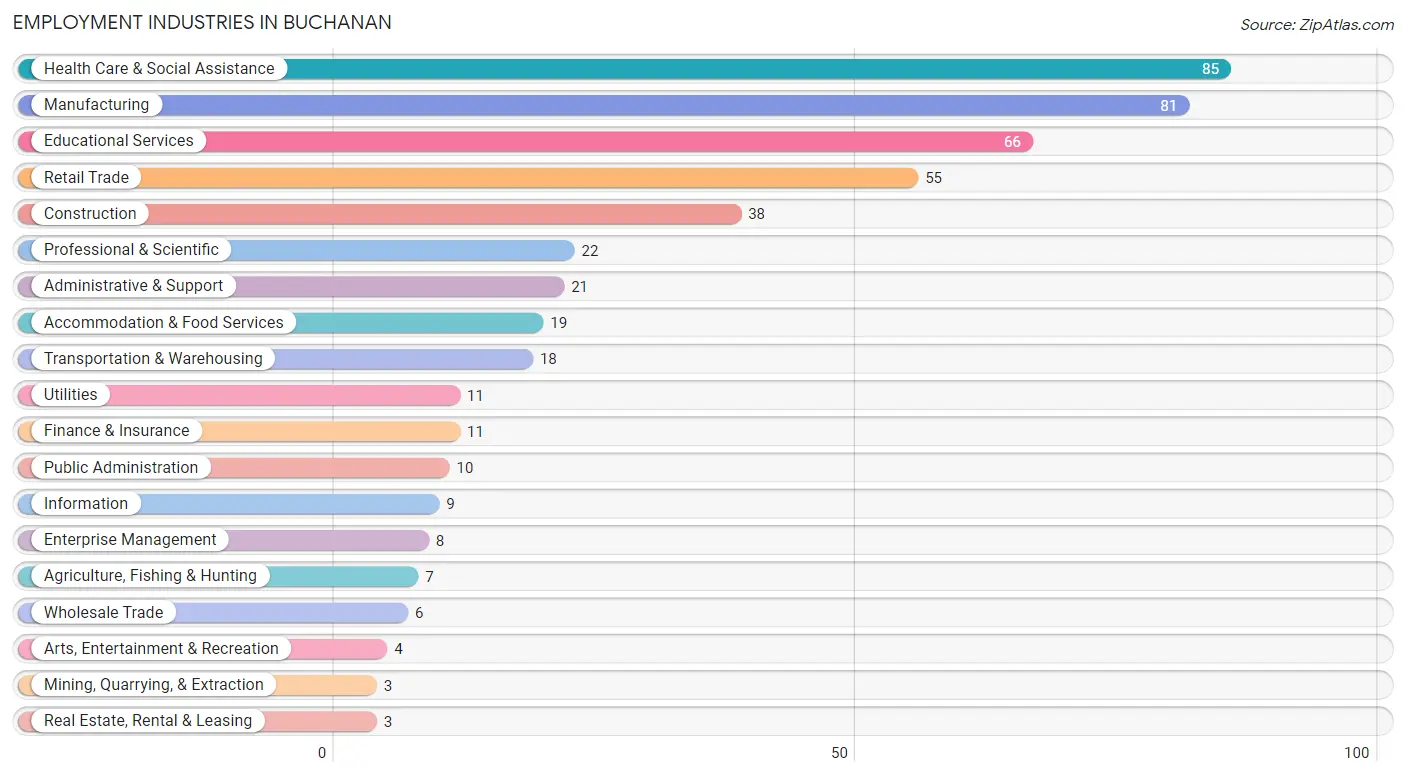
Employment Industries in Buchanan
The major employment industries in Buchanan include Health Care & Social Assistance (85 | 17.1%), Manufacturing (81 | 16.3%), Educational Services (66 | 13.3%), Retail Trade (55 | 11.1%), and Construction (38 | 7.7%).
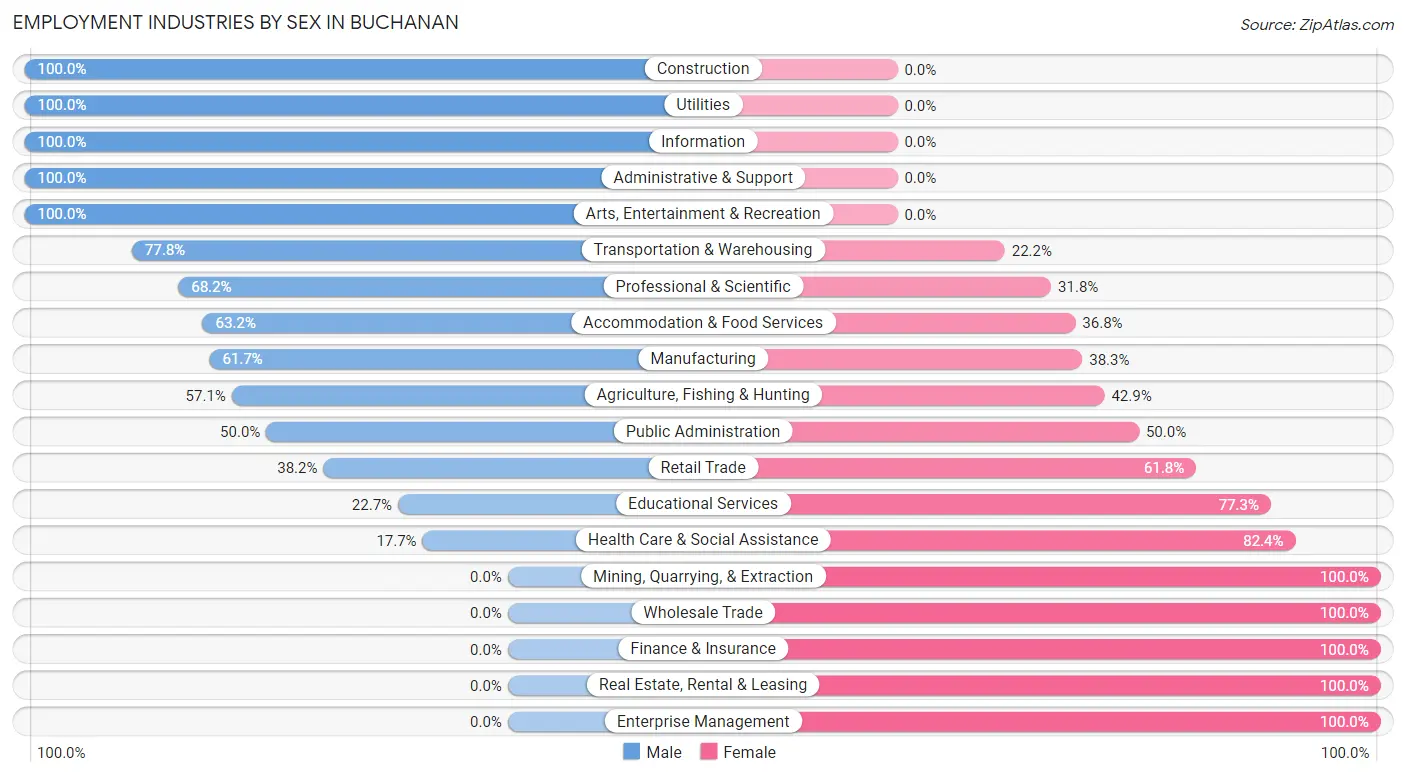
Employment Industries by Sex in Buchanan
The Buchanan industries that see more men than women are Construction (100.0%), Utilities (100.0%), and Information (100.0%), whereas the industries that tend to have a higher number of women are Mining, Quarrying, & Extraction (100.0%), Wholesale Trade (100.0%), and Finance & Insurance (100.0%).
| Industry | Male | Female |
| Agriculture, Fishing & Hunting | 4 (57.1%) | 3 (42.9%) |
| Mining, Quarrying, & Extraction | 0 (0.0%) | 3 (100.0%) |
| Construction | 38 (100.0%) | 0 (0.0%) |
| Manufacturing | 50 (61.7%) | 31 (38.3%) |
| Wholesale Trade | 0 (0.0%) | 6 (100.0%) |
| Retail Trade | 21 (38.2%) | 34 (61.8%) |
| Transportation & Warehousing | 14 (77.8%) | 4 (22.2%) |
| Utilities | 11 (100.0%) | 0 (0.0%) |
| Information | 9 (100.0%) | 0 (0.0%) |
| Finance & Insurance | 0 (0.0%) | 11 (100.0%) |
| Real Estate, Rental & Leasing | 0 (0.0%) | 3 (100.0%) |
| Professional & Scientific | 15 (68.2%) | 7 (31.8%) |
| Enterprise Management | 0 (0.0%) | 8 (100.0%) |
| Administrative & Support | 21 (100.0%) | 0 (0.0%) |
| Educational Services | 15 (22.7%) | 51 (77.3%) |
| Health Care & Social Assistance | 15 (17.6%) | 70 (82.4%) |
| Arts, Entertainment & Recreation | 4 (100.0%) | 0 (0.0%) |
| Accommodation & Food Services | 12 (63.2%) | 7 (36.8%) |
| Public Administration | 5 (50.0%) | 5 (50.0%) |
| Total | 241 (48.6%) | 255 (51.4%) |
Education in Buchanan
School Enrollment in Buchanan
The most common levels of schooling among the 192 students in Buchanan are middle school (49 | 25.5%), college / undergraduate (42 | 21.9%), and elementary school (41 | 21.3%).
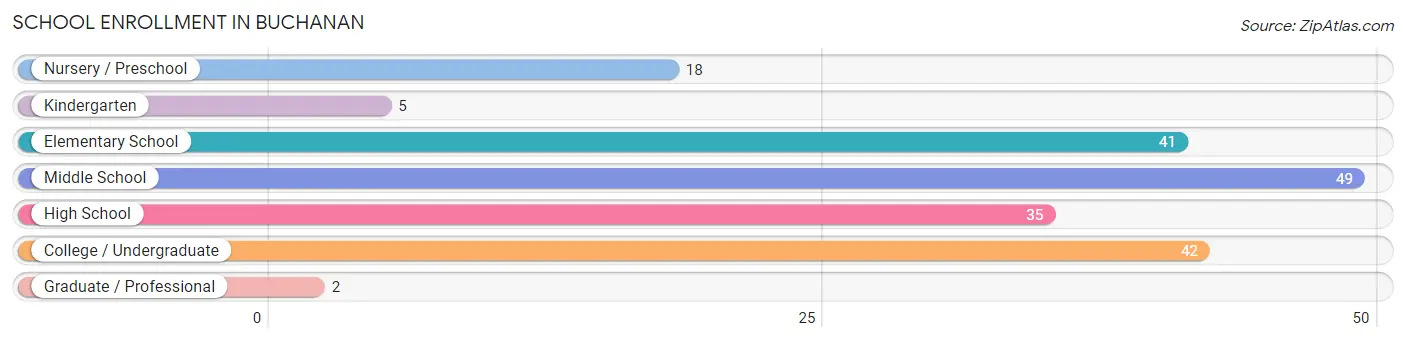
| School Level | # Students | % Students |
| Nursery / Preschool | 18 | 9.4% |
| Kindergarten | 5 | 2.6% |
| Elementary School | 41 | 21.3% |
| Middle School | 49 | 25.5% |
| High School | 35 | 18.2% |
| College / Undergraduate | 42 | 21.9% |
| Graduate / Professional | 2 | 1.0% |
| Total | 192 | 100.0% |
School Enrollment by Age by Funding Source in Buchanan
Out of a total of 192 students who are enrolled in schools in Buchanan, 22 (11.5%) attend a private institution, while the remaining 170 (88.5%) are enrolled in public schools. The age group of 20 to 24 year olds has the highest likelihood of being enrolled in private schools, with 16 (64.0% in the age bracket) enrolled. Conversely, the age group of 3 to 4 year olds has the lowest likelihood of being enrolled in a private school, with 10 (100.0% in the age bracket) attending a public institution.
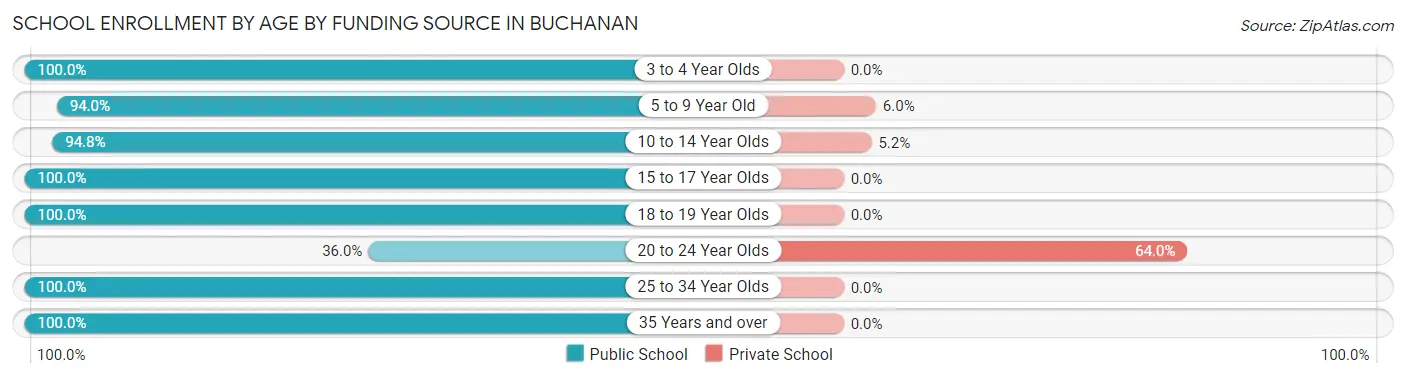
| Age Bracket | Public School | Private School |
| 3 to 4 Year Olds | 10 (100.0%) | 0 (0.0%) |
| 5 to 9 Year Old | 47 (94.0%) | 3 (6.0%) |
| 10 to 14 Year Olds | 55 (94.8%) | 3 (5.2%) |
| 15 to 17 Year Olds | 27 (100.0%) | 0 (0.0%) |
| 18 to 19 Year Olds | 12 (100.0%) | 0 (0.0%) |
| 20 to 24 Year Olds | 9 (36.0%) | 16 (64.0%) |
| 25 to 34 Year Olds | 2 (100.0%) | 0 (0.0%) |
| 35 Years and over | 8 (100.0%) | 0 (0.0%) |
| Total | 170 (88.5%) | 22 (11.5%) |
Educational Attainment by Field of Study in Buchanan
Business (41 | 17.7%), education (36 | 15.5%), visual & performing arts (30 | 12.9%), science & technology (18 | 7.8%), and bio, nature & agricultural (17 | 7.3%) are the most common fields of study among 232 individuals in Buchanan who have obtained a bachelor's degree or higher.
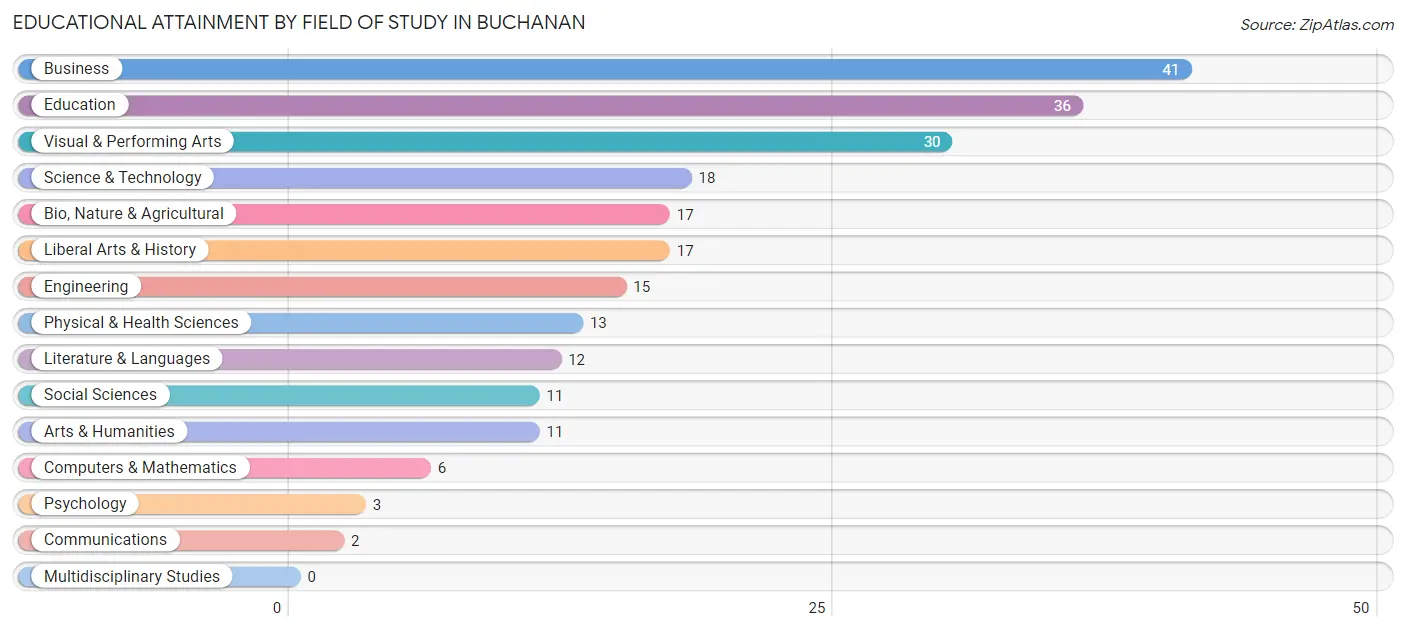
| Field of Study | # Graduates | % Graduates |
| Computers & Mathematics | 6 | 2.6% |
| Bio, Nature & Agricultural | 17 | 7.3% |
| Physical & Health Sciences | 13 | 5.6% |
| Psychology | 3 | 1.3% |
| Social Sciences | 11 | 4.7% |
| Engineering | 15 | 6.5% |
| Multidisciplinary Studies | 0 | 0.0% |
| Science & Technology | 18 | 7.8% |
| Business | 41 | 17.7% |
| Education | 36 | 15.5% |
| Literature & Languages | 12 | 5.2% |
| Liberal Arts & History | 17 | 7.3% |
| Visual & Performing Arts | 30 | 12.9% |
| Communications | 2 | 0.9% |
| Arts & Humanities | 11 | 4.7% |
| Total | 232 | 100.0% |
Transportation & Commute in Buchanan
Vehicle Availability by Sex in Buchanan
The most prevalent vehicle ownership categories in Buchanan are males with 2 vehicles (70, accounting for 29.0%) and females with 2 vehicles (54, making up 28.1%).
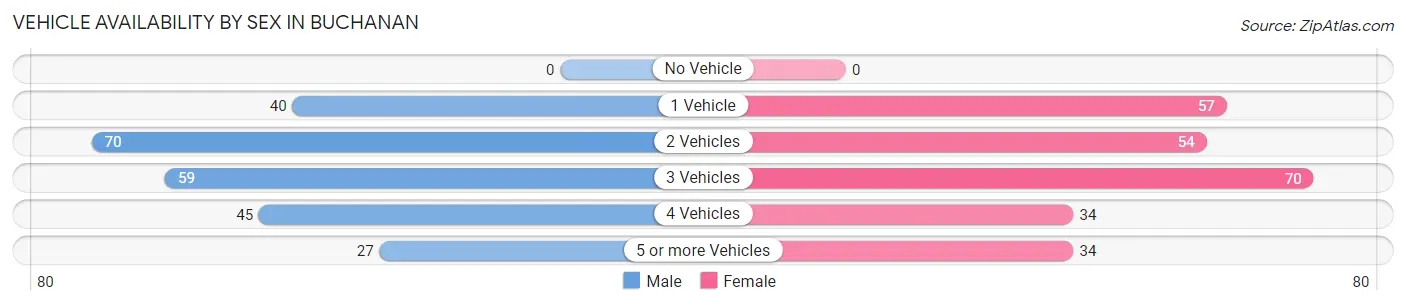
| Vehicles Available | Male | Female |
| No Vehicle | 0 (0.0%) | 0 (0.0%) |
| 1 Vehicle | 40 (16.6%) | 57 (22.9%) |
| 2 Vehicles | 70 (29.0%) | 54 (21.7%) |
| 3 Vehicles | 59 (24.5%) | 70 (28.1%) |
| 4 Vehicles | 45 (18.7%) | 34 (13.7%) |
| 5 or more Vehicles | 27 (11.2%) | 34 (13.7%) |
| Total | 241 (100.0%) | 249 (100.0%) |
Commute Time in Buchanan
The most frequently occuring commute durations in Buchanan are 30 to 34 minutes (108 commuters, 23.1%), 25 to 29 minutes (89 commuters, 19.1%), and 20 to 24 minutes (54 commuters, 11.6%).
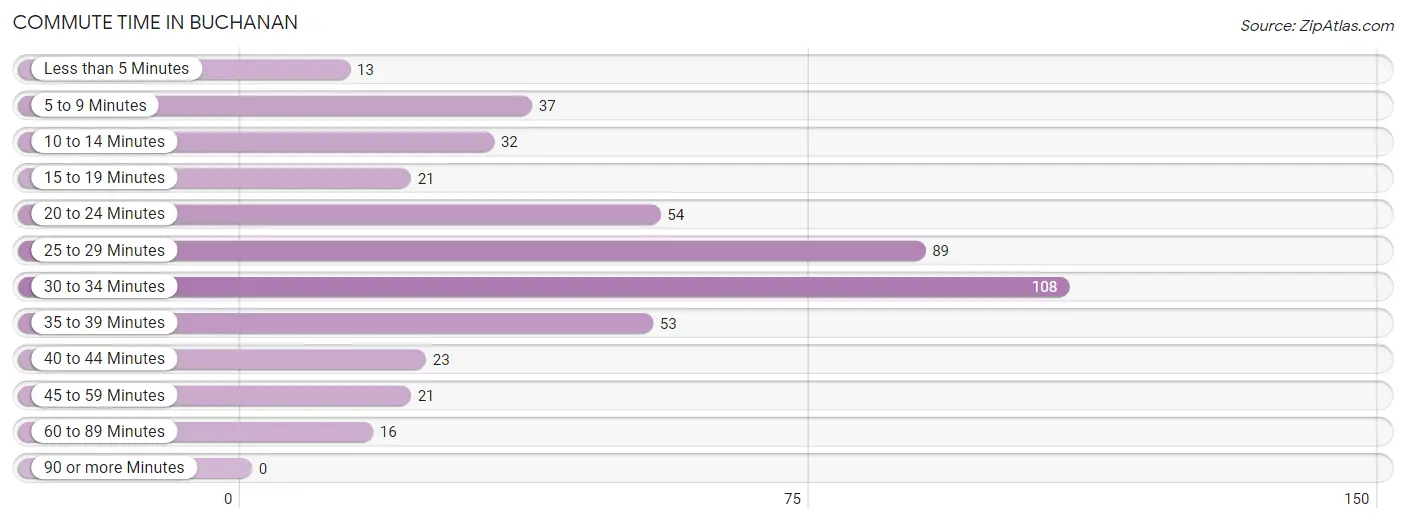
| Commute Time | # Commuters | % Commuters |
| Less than 5 Minutes | 13 | 2.8% |
| 5 to 9 Minutes | 37 | 7.9% |
| 10 to 14 Minutes | 32 | 6.9% |
| 15 to 19 Minutes | 21 | 4.5% |
| 20 to 24 Minutes | 54 | 11.6% |
| 25 to 29 Minutes | 89 | 19.1% |
| 30 to 34 Minutes | 108 | 23.1% |
| 35 to 39 Minutes | 53 | 11.4% |
| 40 to 44 Minutes | 23 | 4.9% |
| 45 to 59 Minutes | 21 | 4.5% |
| 60 to 89 Minutes | 16 | 3.4% |
| 90 or more Minutes | 0 | 0.0% |
Commute Time by Sex in Buchanan
The most common commute times in Buchanan are 30 to 34 minutes (58 commuters, 24.1%) for males and 30 to 34 minutes (50 commuters, 22.1%) for females.
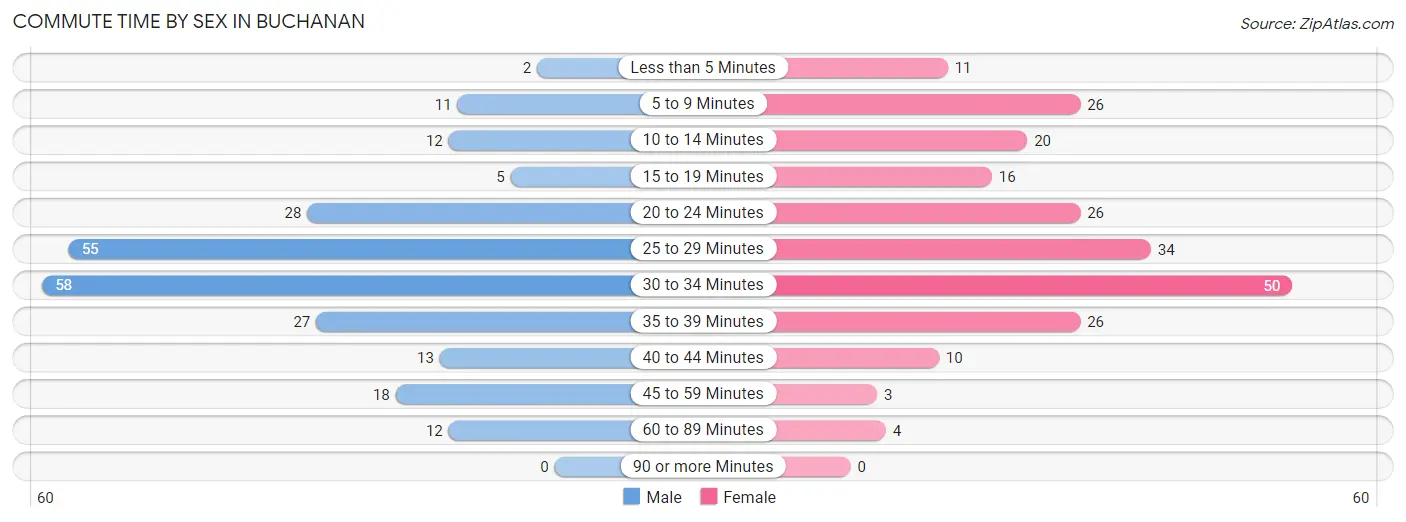
| Commute Time | Male | Female |
| Less than 5 Minutes | 2 (0.8%) | 11 (4.9%) |
| 5 to 9 Minutes | 11 (4.6%) | 26 (11.5%) |
| 10 to 14 Minutes | 12 (5.0%) | 20 (8.8%) |
| 15 to 19 Minutes | 5 (2.1%) | 16 (7.1%) |
| 20 to 24 Minutes | 28 (11.6%) | 26 (11.5%) |
| 25 to 29 Minutes | 55 (22.8%) | 34 (15.0%) |
| 30 to 34 Minutes | 58 (24.1%) | 50 (22.1%) |
| 35 to 39 Minutes | 27 (11.2%) | 26 (11.5%) |
| 40 to 44 Minutes | 13 (5.4%) | 10 (4.4%) |
| 45 to 59 Minutes | 18 (7.5%) | 3 (1.3%) |
| 60 to 89 Minutes | 12 (5.0%) | 4 (1.8%) |
| 90 or more Minutes | 0 (0.0%) | 0 (0.0%) |
Time of Departure to Work by Sex in Buchanan
The most frequent times of departure to work in Buchanan are 7:00 AM to 7:29 AM (41, 17.0%) for males and 12:00 PM to 3:59 PM (71, 31.4%) for females.
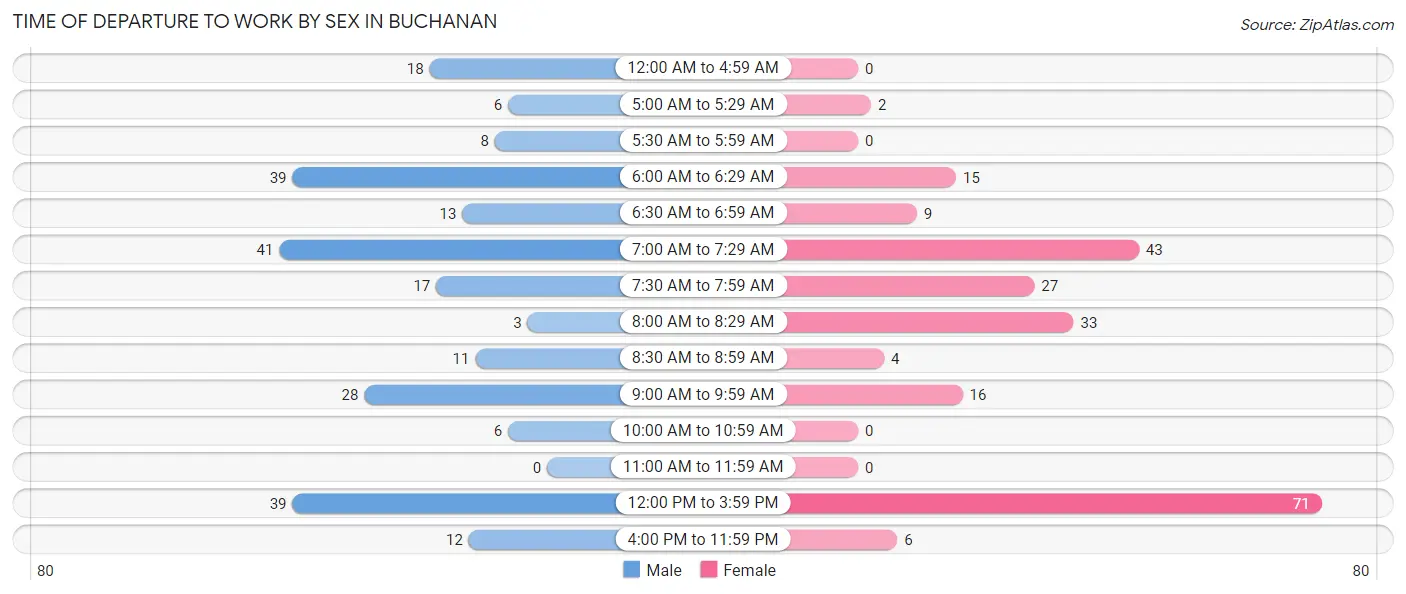
| Time of Departure | Male | Female |
| 12:00 AM to 4:59 AM | 18 (7.5%) | 0 (0.0%) |
| 5:00 AM to 5:29 AM | 6 (2.5%) | 2 (0.9%) |
| 5:30 AM to 5:59 AM | 8 (3.3%) | 0 (0.0%) |
| 6:00 AM to 6:29 AM | 39 (16.2%) | 15 (6.6%) |
| 6:30 AM to 6:59 AM | 13 (5.4%) | 9 (4.0%) |
| 7:00 AM to 7:29 AM | 41 (17.0%) | 43 (19.0%) |
| 7:30 AM to 7:59 AM | 17 (7.0%) | 27 (11.9%) |
| 8:00 AM to 8:29 AM | 3 (1.2%) | 33 (14.6%) |
| 8:30 AM to 8:59 AM | 11 (4.6%) | 4 (1.8%) |
| 9:00 AM to 9:59 AM | 28 (11.6%) | 16 (7.1%) |
| 10:00 AM to 10:59 AM | 6 (2.5%) | 0 (0.0%) |
| 11:00 AM to 11:59 AM | 0 (0.0%) | 0 (0.0%) |
| 12:00 PM to 3:59 PM | 39 (16.2%) | 71 (31.4%) |
| 4:00 PM to 11:59 PM | 12 (5.0%) | 6 (2.6%) |
| Total | 241 (100.0%) | 226 (100.0%) |
Housing Occupancy in Buchanan
Occupancy by Ownership in Buchanan
Of the total 434 dwellings in Buchanan, owner-occupied units account for 333 (76.7%), while renter-occupied units make up 101 (23.3%).
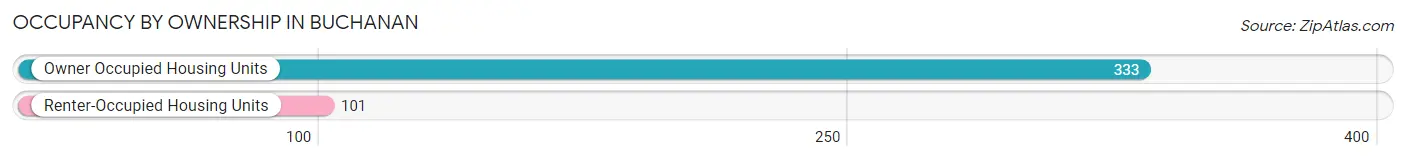
| Occupancy | # Housing Units | % Housing Units |
| Owner Occupied Housing Units | 333 | 76.7% |
| Renter-Occupied Housing Units | 101 | 23.3% |
| Total Occupied Housing Units | 434 | 100.0% |
Occupancy by Household Size in Buchanan
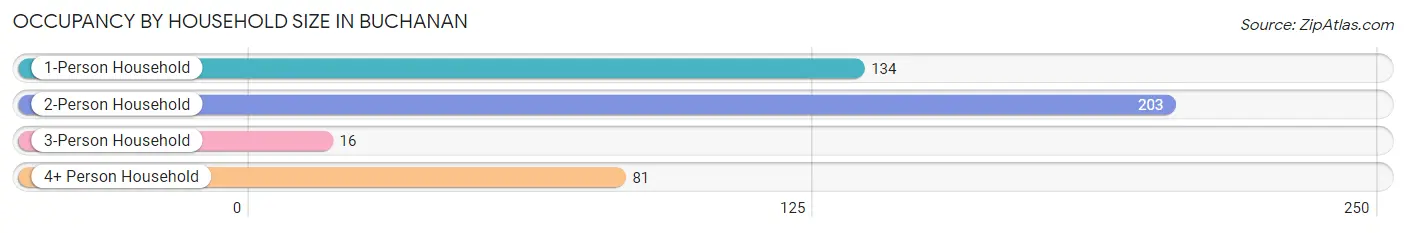
| Household Size | # Housing Units | % Housing Units |
| 1-Person Household | 134 | 30.9% |
| 2-Person Household | 203 | 46.8% |
| 3-Person Household | 16 | 3.7% |
| 4+ Person Household | 81 | 18.7% |
| Total Housing Units | 434 | 100.0% |
Occupancy by Ownership by Household Size in Buchanan
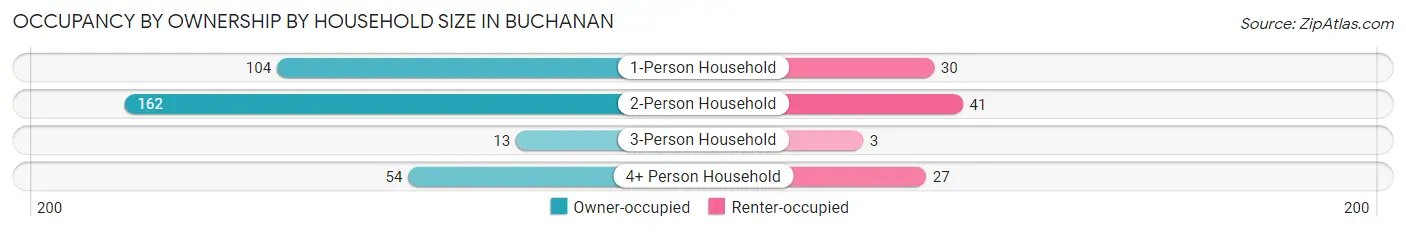
| Household Size | Owner-occupied | Renter-occupied |
| 1-Person Household | 104 (77.6%) | 30 (22.4%) |
| 2-Person Household | 162 (79.8%) | 41 (20.2%) |
| 3-Person Household | 13 (81.2%) | 3 (18.8%) |
| 4+ Person Household | 54 (66.7%) | 27 (33.3%) |
| Total Housing Units | 333 (76.7%) | 101 (23.3%) |
Occupancy by Educational Attainment in Buchanan
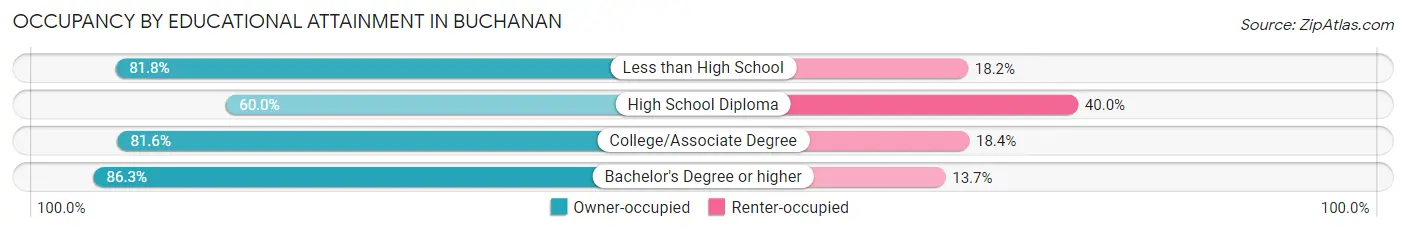
| Household Size | Owner-occupied | Renter-occupied |
| Less than High School | 36 (81.8%) | 8 (18.2%) |
| High School Diploma | 78 (60.0%) | 52 (40.0%) |
| College/Associate Degree | 93 (81.6%) | 21 (18.4%) |
| Bachelor's Degree or higher | 126 (86.3%) | 20 (13.7%) |
Occupancy by Age of Householder in Buchanan
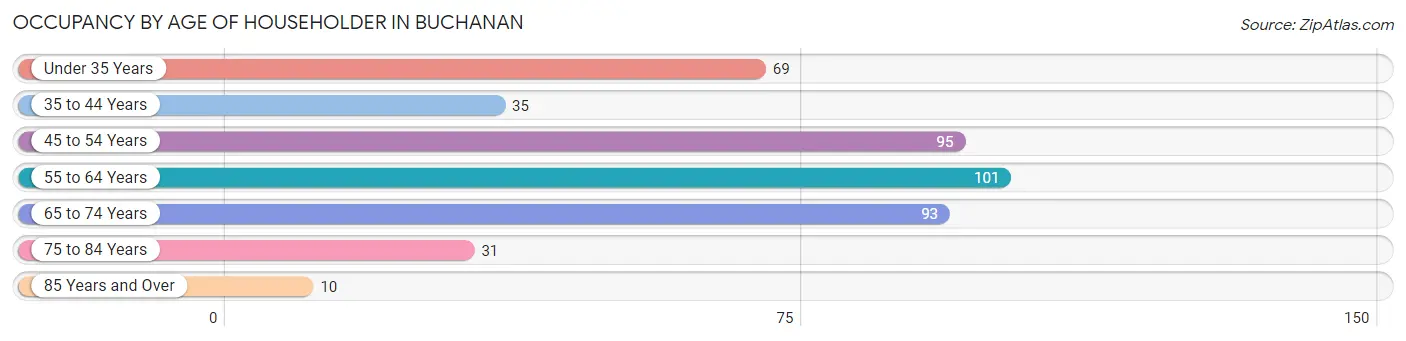
| Age Bracket | # Households | % Households |
| Under 35 Years | 69 | 15.9% |
| 35 to 44 Years | 35 | 8.1% |
| 45 to 54 Years | 95 | 21.9% |
| 55 to 64 Years | 101 | 23.3% |
| 65 to 74 Years | 93 | 21.4% |
| 75 to 84 Years | 31 | 7.1% |
| 85 Years and Over | 10 | 2.3% |
| Total | 434 | 100.0% |
Housing Finances in Buchanan
Median Income by Occupancy in Buchanan
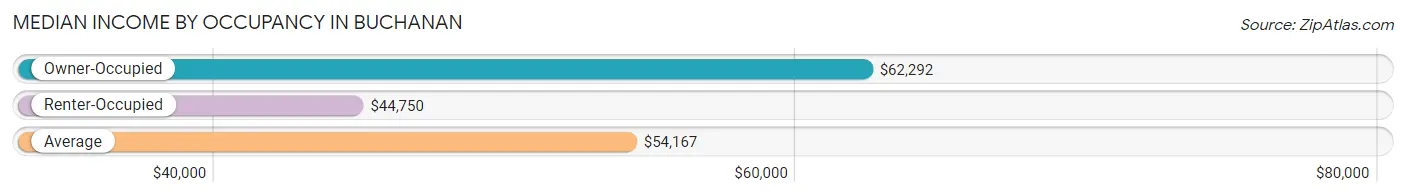
| Occupancy Type | # Households | Median Income |
| Owner-Occupied | 333 (76.7%) | $62,292 |
| Renter-Occupied | 101 (23.3%) | $44,750 |
| Average | 434 (100.0%) | $54,167 |
Occupancy by Householder Income Bracket in Buchanan
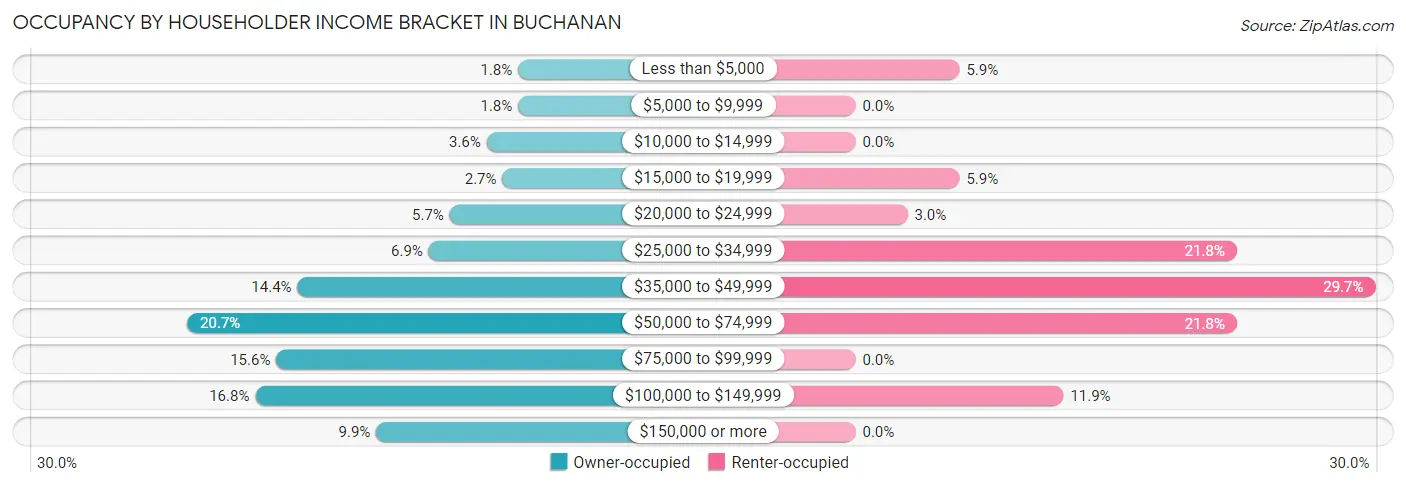
| Income Bracket | Owner-occupied | Renter-occupied |
| Less than $5,000 | 6 (1.8%) | 6 (5.9%) |
| $5,000 to $9,999 | 6 (1.8%) | 0 (0.0%) |
| $10,000 to $14,999 | 12 (3.6%) | 0 (0.0%) |
| $15,000 to $19,999 | 9 (2.7%) | 6 (5.9%) |
| $20,000 to $24,999 | 19 (5.7%) | 3 (3.0%) |
| $25,000 to $34,999 | 23 (6.9%) | 22 (21.8%) |
| $35,000 to $49,999 | 48 (14.4%) | 30 (29.7%) |
| $50,000 to $74,999 | 69 (20.7%) | 22 (21.8%) |
| $75,000 to $99,999 | 52 (15.6%) | 0 (0.0%) |
| $100,000 to $149,999 | 56 (16.8%) | 12 (11.9%) |
| $150,000 or more | 33 (9.9%) | 0 (0.0%) |
| Total | 333 (100.0%) | 101 (100.0%) |
Monthly Housing Cost Tiers in Buchanan
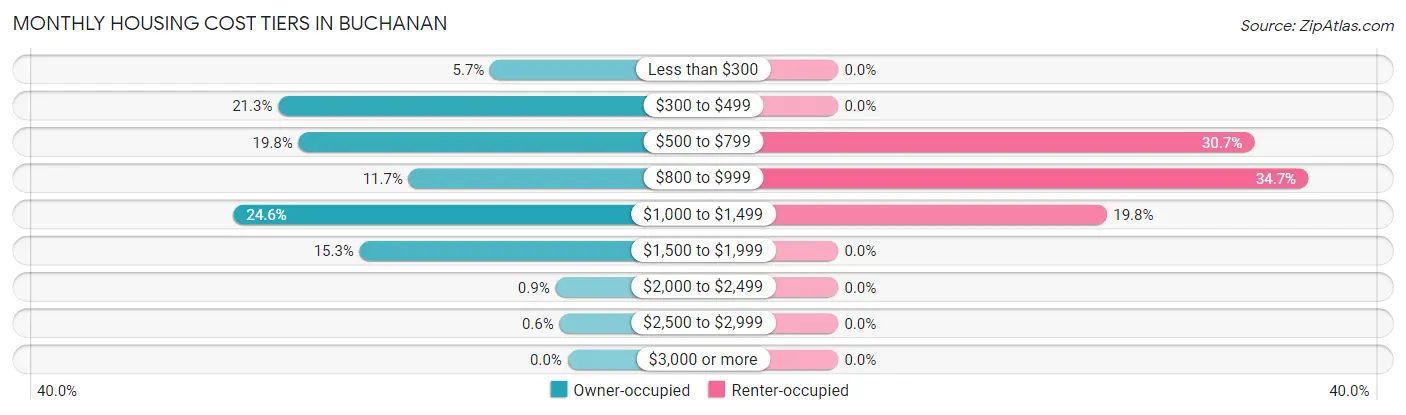
| Monthly Cost | Owner-occupied | Renter-occupied |
| Less than $300 | 19 (5.7%) | 0 (0.0%) |
| $300 to $499 | 71 (21.3%) | 0 (0.0%) |
| $500 to $799 | 66 (19.8%) | 31 (30.7%) |
| $800 to $999 | 39 (11.7%) | 35 (34.6%) |
| $1,000 to $1,499 | 82 (24.6%) | 20 (19.8%) |
| $1,500 to $1,999 | 51 (15.3%) | 0 (0.0%) |
| $2,000 to $2,499 | 3 (0.9%) | 0 (0.0%) |
| $2,500 to $2,999 | 2 (0.6%) | 0 (0.0%) |
| $3,000 or more | 0 (0.0%) | 0 (0.0%) |
| Total | 333 (100.0%) | 101 (100.0%) |
Physical Housing Characteristics in Buchanan
Housing Structures in Buchanan
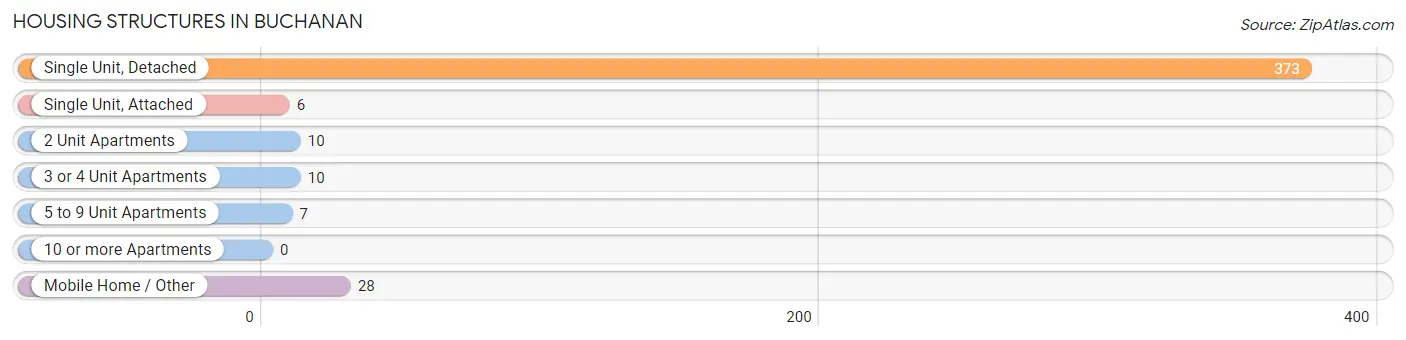
| Structure Type | # Housing Units | % Housing Units |
| Single Unit, Detached | 373 | 85.9% |
| Single Unit, Attached | 6 | 1.4% |
| 2 Unit Apartments | 10 | 2.3% |
| 3 or 4 Unit Apartments | 10 | 2.3% |
| 5 to 9 Unit Apartments | 7 | 1.6% |
| 10 or more Apartments | 0 | 0.0% |
| Mobile Home / Other | 28 | 6.5% |
| Total | 434 | 100.0% |
Housing Structures by Occupancy in Buchanan
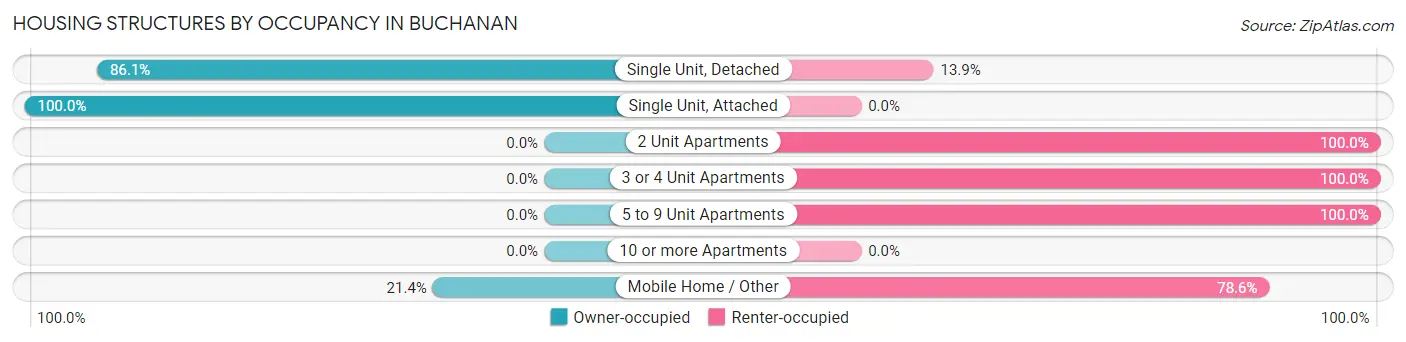
| Structure Type | Owner-occupied | Renter-occupied |
| Single Unit, Detached | 321 (86.1%) | 52 (13.9%) |
| Single Unit, Attached | 6 (100.0%) | 0 (0.0%) |
| 2 Unit Apartments | 0 (0.0%) | 10 (100.0%) |
| 3 or 4 Unit Apartments | 0 (0.0%) | 10 (100.0%) |
| 5 to 9 Unit Apartments | 0 (0.0%) | 7 (100.0%) |
| 10 or more Apartments | 0 (0.0%) | 0 (0.0%) |
| Mobile Home / Other | 6 (21.4%) | 22 (78.6%) |
| Total | 333 (76.7%) | 101 (23.3%) |
Housing Structures by Number of Rooms in Buchanan
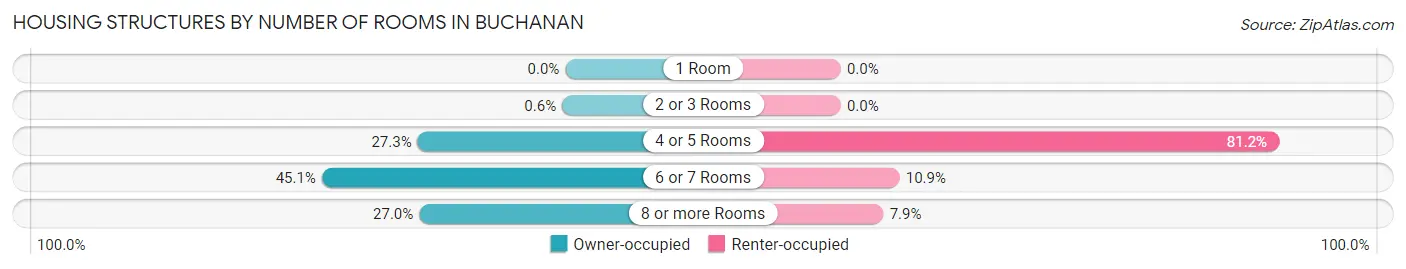
| Number of Rooms | Owner-occupied | Renter-occupied |
| 1 Room | 0 (0.0%) | 0 (0.0%) |
| 2 or 3 Rooms | 2 (0.6%) | 0 (0.0%) |
| 4 or 5 Rooms | 91 (27.3%) | 82 (81.2%) |
| 6 or 7 Rooms | 150 (45.1%) | 11 (10.9%) |
| 8 or more Rooms | 90 (27.0%) | 8 (7.9%) |
| Total | 333 (100.0%) | 101 (100.0%) |
Housing Structure by Heating Type in Buchanan
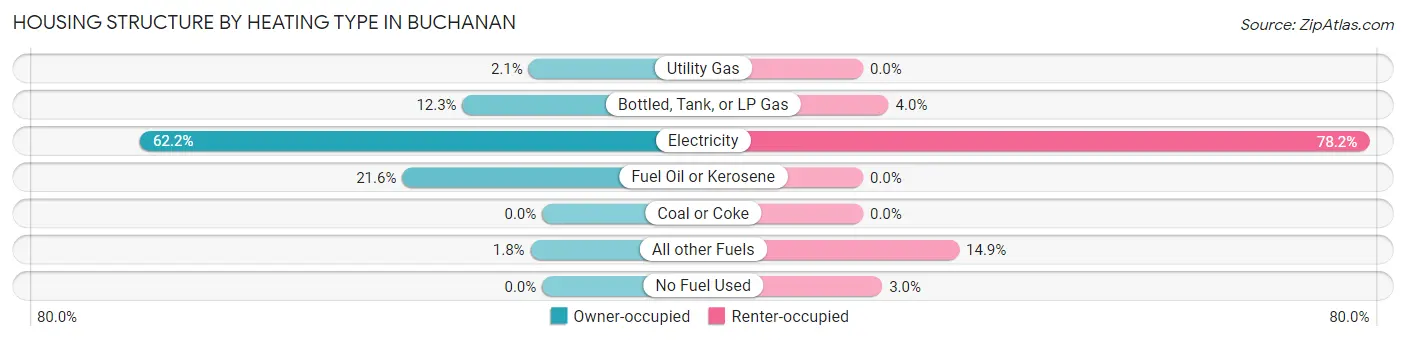
| Heating Type | Owner-occupied | Renter-occupied |
| Utility Gas | 7 (2.1%) | 0 (0.0%) |
| Bottled, Tank, or LP Gas | 41 (12.3%) | 4 (4.0%) |
| Electricity | 207 (62.2%) | 79 (78.2%) |
| Fuel Oil or Kerosene | 72 (21.6%) | 0 (0.0%) |
| Coal or Coke | 0 (0.0%) | 0 (0.0%) |
| All other Fuels | 6 (1.8%) | 15 (14.8%) |
| No Fuel Used | 0 (0.0%) | 3 (3.0%) |
| Total | 333 (100.0%) | 101 (100.0%) |
Household Vehicle Usage in Buchanan
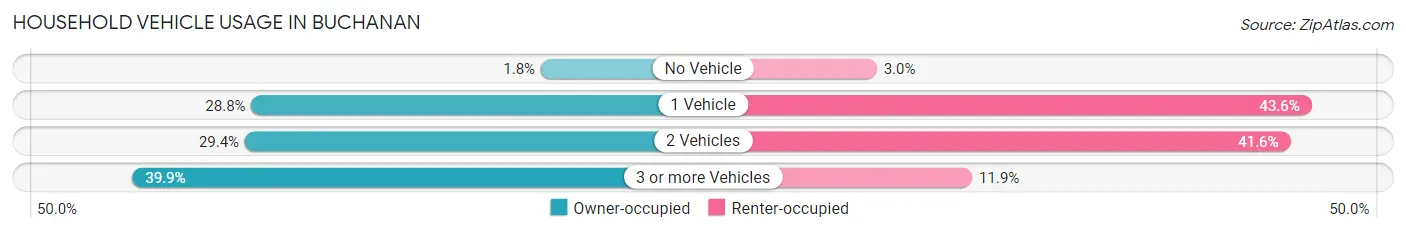
| Vehicles per Household | Owner-occupied | Renter-occupied |
| No Vehicle | 6 (1.8%) | 3 (3.0%) |
| 1 Vehicle | 96 (28.8%) | 44 (43.6%) |
| 2 Vehicles | 98 (29.4%) | 42 (41.6%) |
| 3 or more Vehicles | 133 (39.9%) | 12 (11.9%) |
| Total | 333 (100.0%) | 101 (100.0%) |
Real Estate & Mortgages in Buchanan
Real Estate and Mortgage Overview in Buchanan
| Characteristic | Without Mortgage | With Mortgage |
| Housing Units | 142 | 191 |
| Median Property Value | $99,800 | $210,900 |
| Median Household Income | $48,333 | $26 |
| Monthly Housing Costs | $471 | $0 |
| Real Estate Taxes | $1,157 | $2 |
Property Value by Mortgage Status in Buchanan
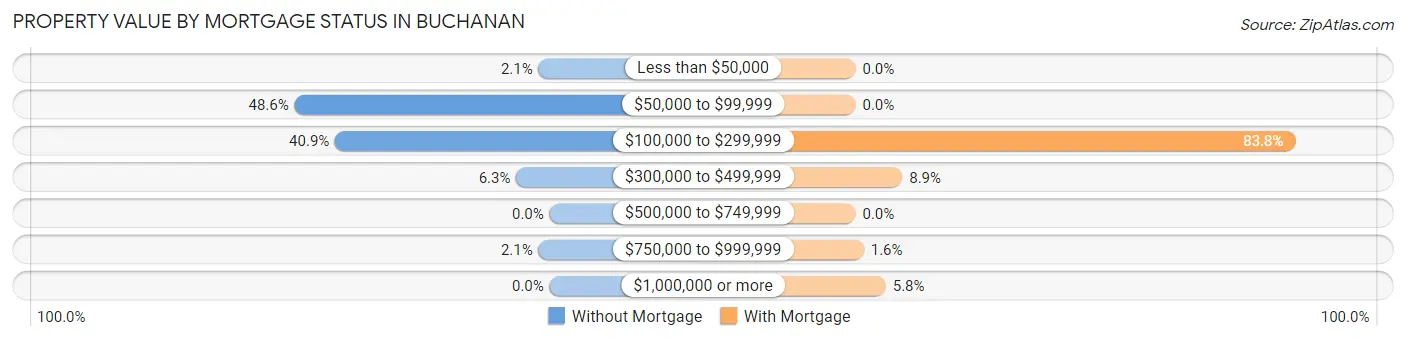
| Property Value | Without Mortgage | With Mortgage |
| Less than $50,000 | 3 (2.1%) | 0 (0.0%) |
| $50,000 to $99,999 | 69 (48.6%) | 0 (0.0%) |
| $100,000 to $299,999 | 58 (40.8%) | 160 (83.8%) |
| $300,000 to $499,999 | 9 (6.3%) | 17 (8.9%) |
| $500,000 to $749,999 | 0 (0.0%) | 0 (0.0%) |
| $750,000 to $999,999 | 3 (2.1%) | 3 (1.6%) |
| $1,000,000 or more | 0 (0.0%) | 11 (5.8%) |
| Total | 142 (100.0%) | 191 (100.0%) |
Household Income by Mortgage Status in Buchanan
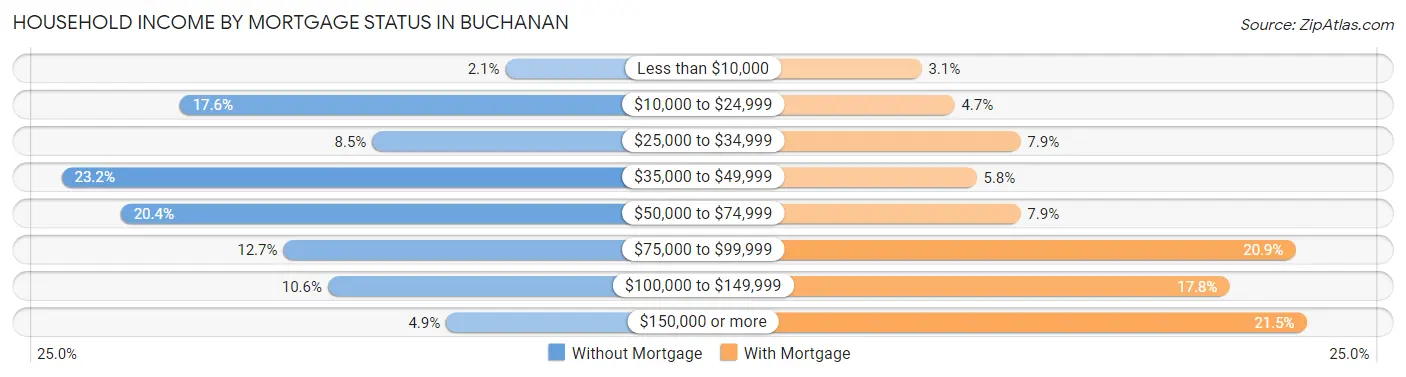
| Household Income | Without Mortgage | With Mortgage |
| Less than $10,000 | 3 (2.1%) | 6 (3.1%) |
| $10,000 to $24,999 | 25 (17.6%) | 9 (4.7%) |
| $25,000 to $34,999 | 12 (8.5%) | 15 (7.9%) |
| $35,000 to $49,999 | 33 (23.2%) | 11 (5.8%) |
| $50,000 to $74,999 | 29 (20.4%) | 15 (7.9%) |
| $75,000 to $99,999 | 18 (12.7%) | 40 (20.9%) |
| $100,000 to $149,999 | 15 (10.6%) | 34 (17.8%) |
| $150,000 or more | 7 (4.9%) | 41 (21.5%) |
| Total | 142 (100.0%) | 191 (100.0%) |
Property Value to Household Income Ratio in Buchanan
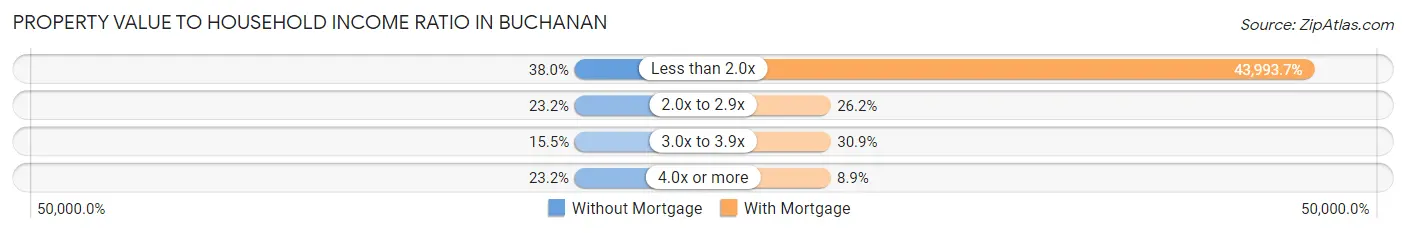
| Value-to-Income Ratio | Without Mortgage | With Mortgage |
| Less than 2.0x | 54 (38.0%) | 84,028 (43,993.7%) |
| 2.0x to 2.9x | 33 (23.2%) | 50 (26.2%) |
| 3.0x to 3.9x | 22 (15.5%) | 59 (30.9%) |
| 4.0x or more | 33 (23.2%) | 17 (8.9%) |
| Total | 142 (100.0%) | 191 (100.0%) |
Real Estate Taxes by Mortgage Status in Buchanan
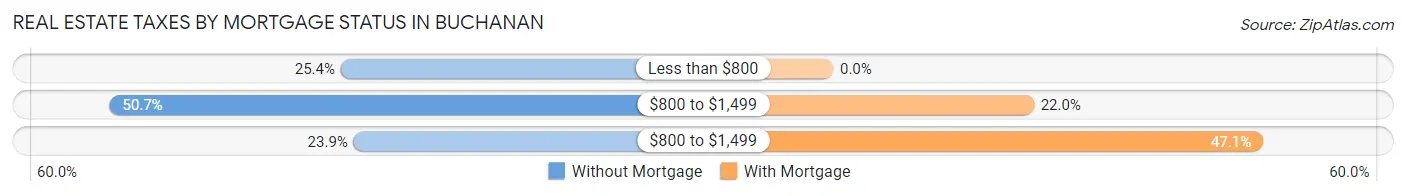
| Property Taxes | Without Mortgage | With Mortgage |
| Less than $800 | 36 (25.4%) | 0 (0.0%) |
| $800 to $1,499 | 72 (50.7%) | 42 (22.0%) |
| $800 to $1,499 | 34 (23.9%) | 90 (47.1%) |
| Total | 142 (100.0%) | 191 (100.0%) |
Health & Disability in Buchanan
Health Insurance Coverage by Age in Buchanan
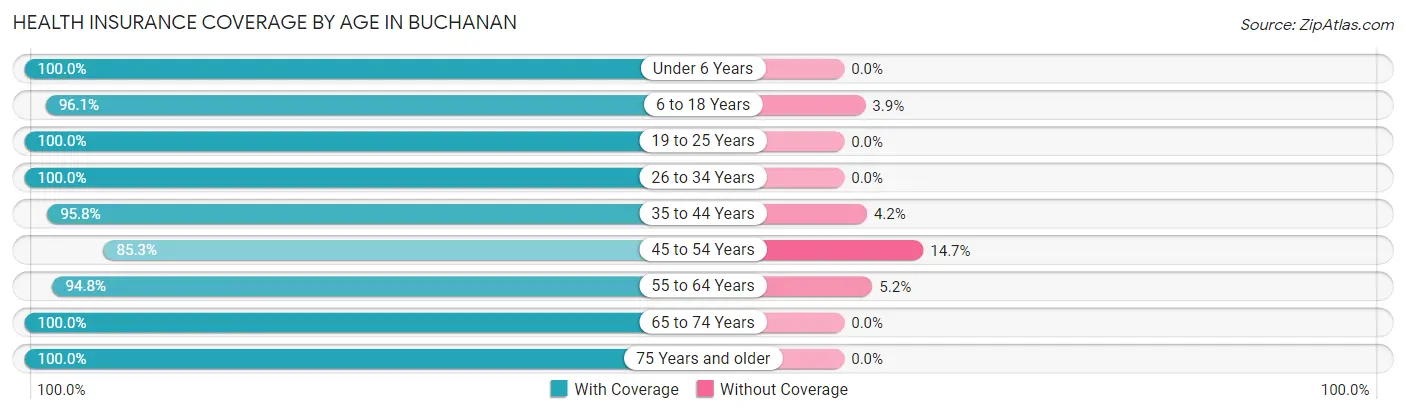
| Age Bracket | With Coverage | Without Coverage |
| Under 6 Years | 68 (100.0%) | 0 (0.0%) |
| 6 to 18 Years | 122 (96.1%) | 5 (3.9%) |
| 19 to 25 Years | 165 (100.0%) | 0 (0.0%) |
| 26 to 34 Years | 67 (100.0%) | 0 (0.0%) |
| 35 to 44 Years | 68 (95.8%) | 3 (4.2%) |
| 45 to 54 Years | 162 (85.3%) | 28 (14.7%) |
| 55 to 64 Years | 181 (94.8%) | 10 (5.2%) |
| 65 to 74 Years | 131 (100.0%) | 0 (0.0%) |
| 75 Years and older | 98 (100.0%) | 0 (0.0%) |
| Total | 1,062 (95.9%) | 46 (4.2%) |
Health Insurance Coverage by Citizenship Status in Buchanan
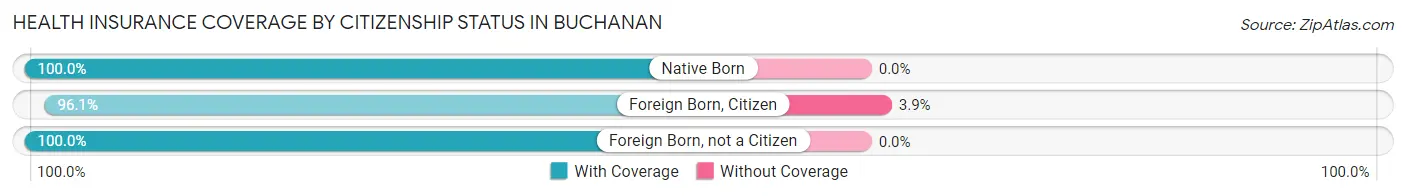
| Citizenship Status | With Coverage | Without Coverage |
| Native Born | 68 (100.0%) | 0 (0.0%) |
| Foreign Born, Citizen | 122 (96.1%) | 5 (3.9%) |
| Foreign Born, not a Citizen | 165 (100.0%) | 0 (0.0%) |
Health Insurance Coverage by Household Income in Buchanan
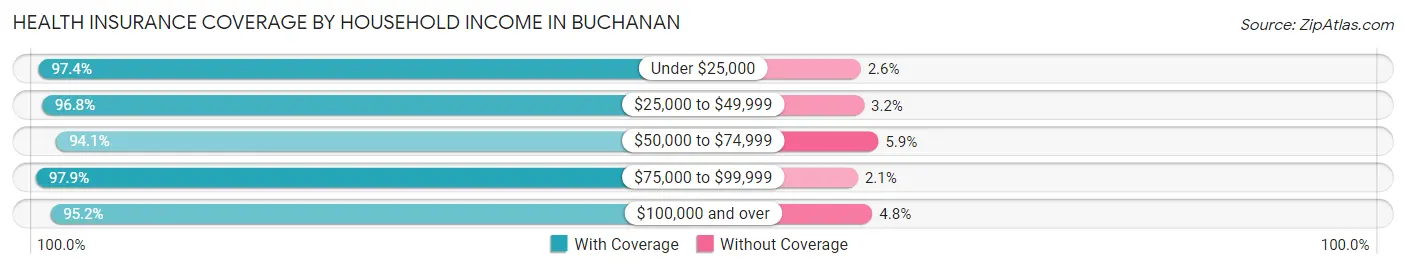
| Household Income | With Coverage | Without Coverage |
| Under $25,000 | 112 (97.4%) | 3 (2.6%) |
| $25,000 to $49,999 | 239 (96.8%) | 8 (3.2%) |
| $50,000 to $74,999 | 254 (94.1%) | 16 (5.9%) |
| $75,000 to $99,999 | 140 (97.9%) | 3 (2.1%) |
| $100,000 and over | 317 (95.2%) | 16 (4.8%) |
Public vs Private Health Insurance Coverage by Age in Buchanan
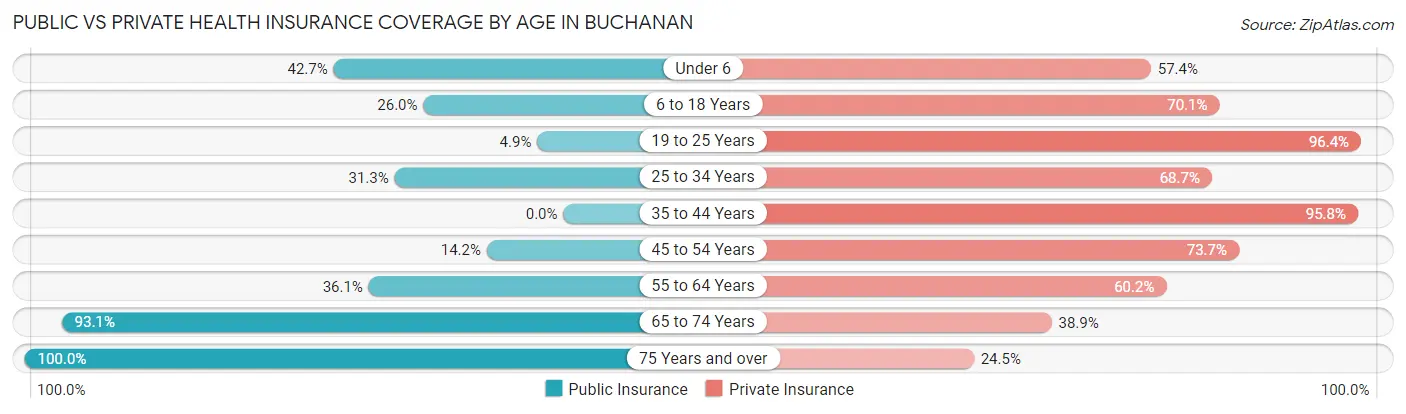
| Age Bracket | Public Insurance | Private Insurance |
| Under 6 | 29 (42.6%) | 39 (57.4%) |
| 6 to 18 Years | 33 (26.0%) | 89 (70.1%) |
| 19 to 25 Years | 8 (4.9%) | 159 (96.4%) |
| 25 to 34 Years | 21 (31.3%) | 46 (68.7%) |
| 35 to 44 Years | 0 (0.0%) | 68 (95.8%) |
| 45 to 54 Years | 27 (14.2%) | 140 (73.7%) |
| 55 to 64 Years | 69 (36.1%) | 115 (60.2%) |
| 65 to 74 Years | 122 (93.1%) | 51 (38.9%) |
| 75 Years and over | 98 (100.0%) | 24 (24.5%) |
| Total | 407 (36.7%) | 731 (66.0%) |
Disability Status by Sex by Age in Buchanan
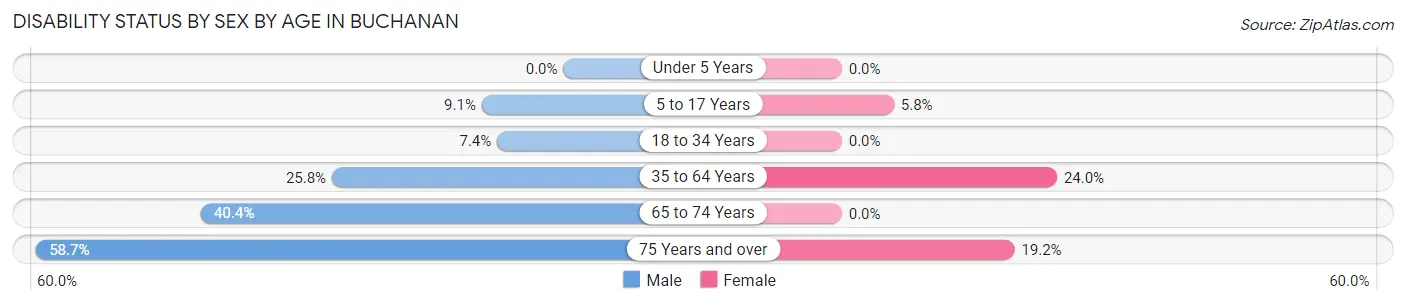
| Age Bracket | Male | Female |
| Under 5 Years | 0 (0.0%) | 0 (0.0%) |
| 5 to 17 Years | 6 (9.1%) | 4 (5.8%) |
| 18 to 34 Years | 9 (7.4%) | 0 (0.0%) |
| 35 to 64 Years | 67 (25.8%) | 46 (24.0%) |
| 65 to 74 Years | 23 (40.4%) | 0 (0.0%) |
| 75 Years and over | 27 (58.7%) | 10 (19.2%) |
Disability Class by Sex by Age in Buchanan
Disability Class: Hearing Difficulty
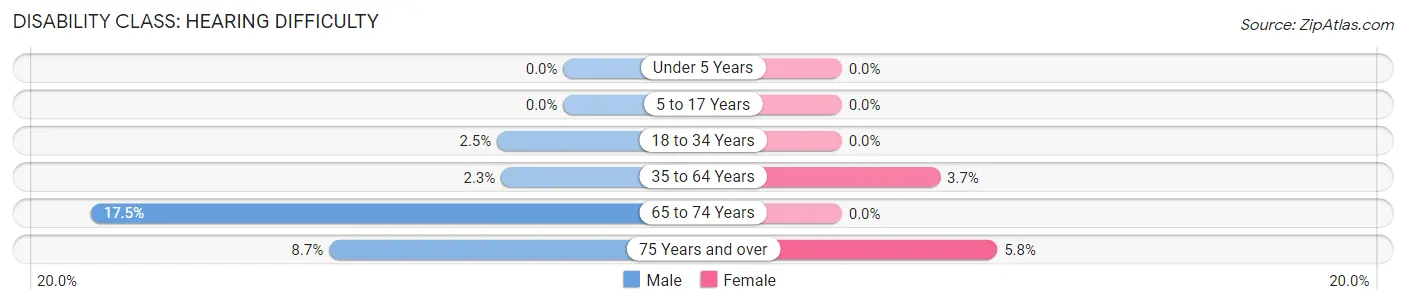
| Age Bracket | Male | Female |
| Under 5 Years | 0 (0.0%) | 0 (0.0%) |
| 5 to 17 Years | 0 (0.0%) | 0 (0.0%) |
| 18 to 34 Years | 3 (2.5%) | 0 (0.0%) |
| 35 to 64 Years | 6 (2.3%) | 7 (3.6%) |
| 65 to 74 Years | 10 (17.5%) | 0 (0.0%) |
| 75 Years and over | 4 (8.7%) | 3 (5.8%) |
Disability Class: Vision Difficulty
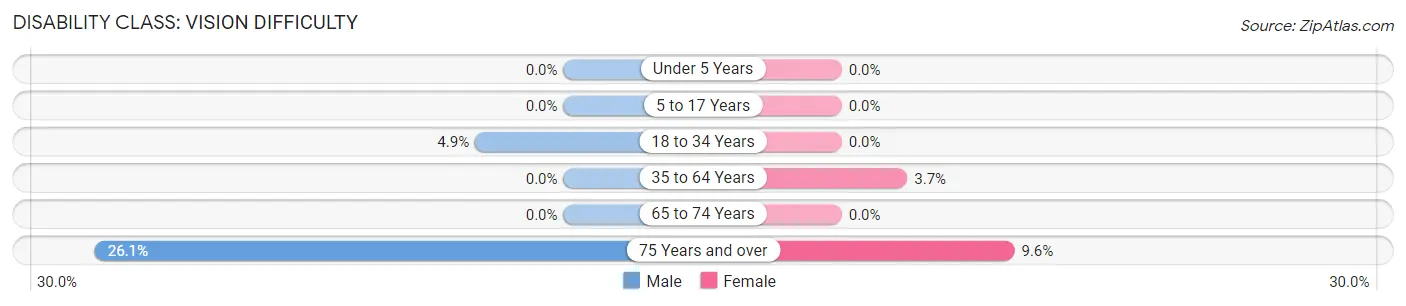
| Age Bracket | Male | Female |
| Under 5 Years | 0 (0.0%) | 0 (0.0%) |
| 5 to 17 Years | 0 (0.0%) | 0 (0.0%) |
| 18 to 34 Years | 6 (4.9%) | 0 (0.0%) |
| 35 to 64 Years | 0 (0.0%) | 7 (3.6%) |
| 65 to 74 Years | 0 (0.0%) | 0 (0.0%) |
| 75 Years and over | 12 (26.1%) | 5 (9.6%) |
Disability Class: Cognitive Difficulty
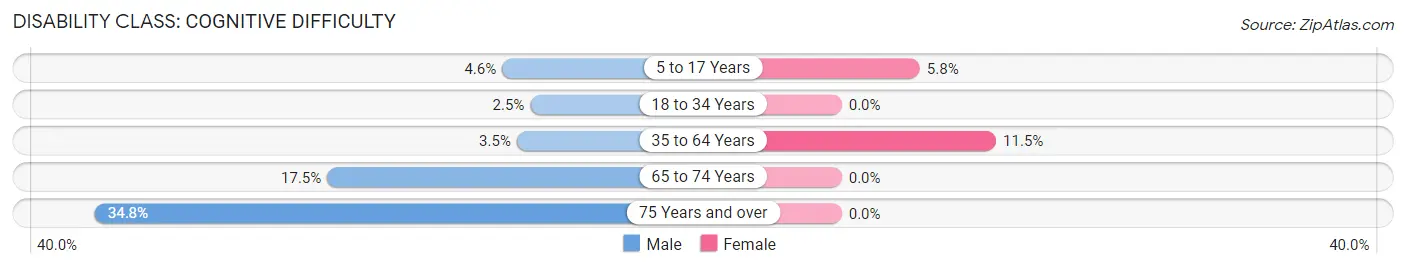
| Age Bracket | Male | Female |
| 5 to 17 Years | 3 (4.5%) | 4 (5.8%) |
| 18 to 34 Years | 3 (2.5%) | 0 (0.0%) |
| 35 to 64 Years | 9 (3.5%) | 22 (11.5%) |
| 65 to 74 Years | 10 (17.5%) | 0 (0.0%) |
| 75 Years and over | 16 (34.8%) | 0 (0.0%) |
Disability Class: Ambulatory Difficulty
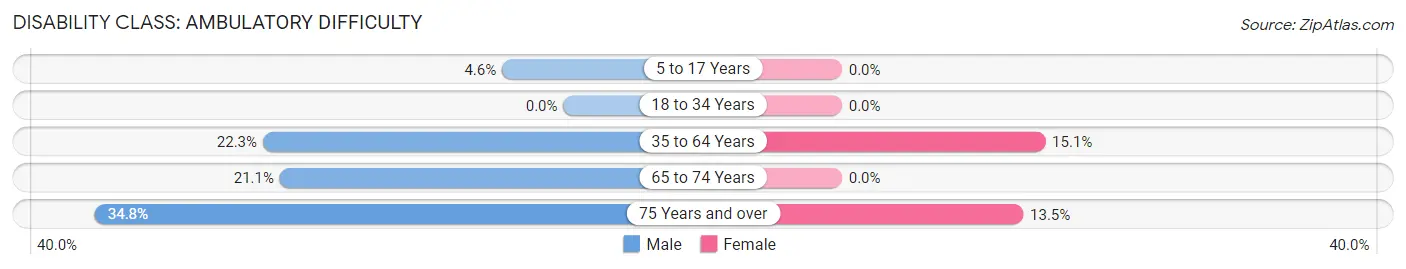
| Age Bracket | Male | Female |
| 5 to 17 Years | 3 (4.5%) | 0 (0.0%) |
| 18 to 34 Years | 0 (0.0%) | 0 (0.0%) |
| 35 to 64 Years | 58 (22.3%) | 29 (15.1%) |
| 65 to 74 Years | 12 (21.0%) | 0 (0.0%) |
| 75 Years and over | 16 (34.8%) | 7 (13.5%) |
Disability Class: Self-Care Difficulty
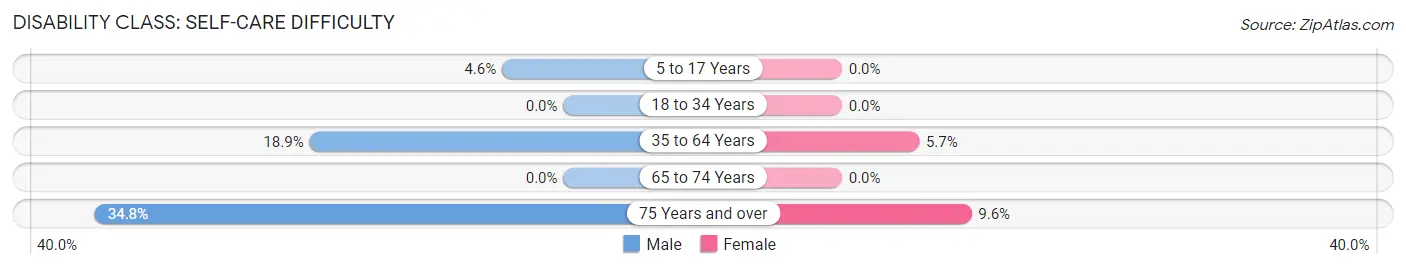
| Age Bracket | Male | Female |
| 5 to 17 Years | 3 (4.5%) | 0 (0.0%) |
| 18 to 34 Years | 0 (0.0%) | 0 (0.0%) |
| 35 to 64 Years | 49 (18.9%) | 11 (5.7%) |
| 65 to 74 Years | 0 (0.0%) | 0 (0.0%) |
| 75 Years and over | 16 (34.8%) | 5 (9.6%) |
Technology Access in Buchanan
Computing Device Access in Buchanan
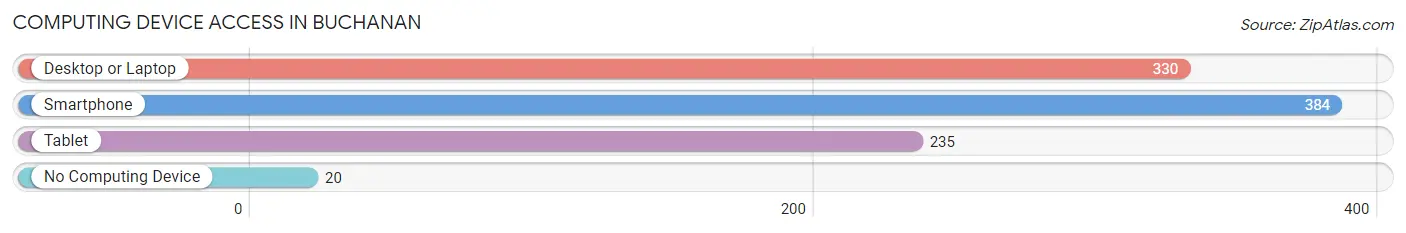
| Device Type | # Households | % Households |
| Desktop or Laptop | 330 | 76.0% |
| Smartphone | 384 | 88.5% |
| Tablet | 235 | 54.1% |
| No Computing Device | 20 | 4.6% |
| Total | 434 | 100.0% |
Internet Access in Buchanan
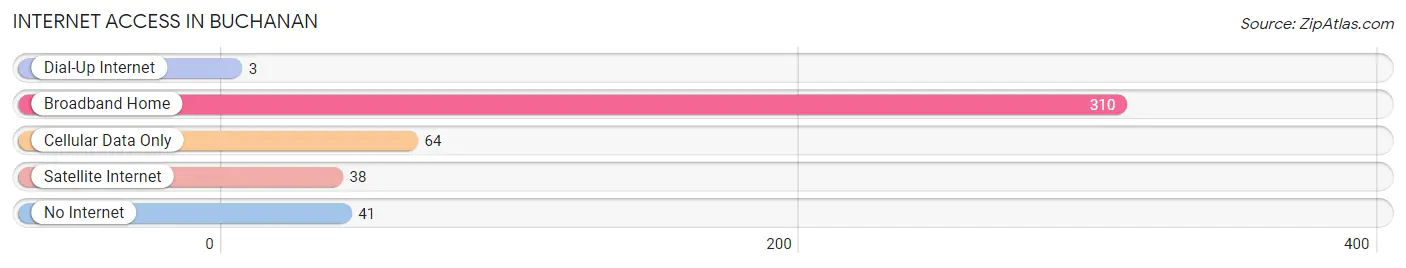
| Internet Type | # Households | % Households |
| Dial-Up Internet | 3 | 0.7% |
| Broadband Home | 310 | 71.4% |
| Cellular Data Only | 64 | 14.7% |
| Satellite Internet | 38 | 8.8% |
| No Internet | 41 | 9.5% |
| Total | 434 | 100.0% |
Buchanan Summary
Buchanan is a town located in Botetourt County, Virginia, United States. The population was 1,178 at the 2010 census. It is part of the Roanoke Metropolitan Statistical Area.
History
The town of Buchanan was established in 1790 and named after James Buchanan, the 15th President of the United States. The town was originally part of Botetourt County, but was annexed by Roanoke County in 1838. The town was incorporated in 1872.
Geography
Buchanan is located at the intersection of U.S. Route 11 and Virginia State Route 43. It is situated in the Appalachian Mountains, and is surrounded by the Blue Ridge Mountains to the east and the Allegheny Mountains to the west. The town is located in the Roanoke Valley, which is part of the Great Appalachian Valley.
The town has a total area of 0 7 square miles all of which is land
Economy
The economy of Buchanan is largely based on agriculture and tourism. The town is home to several farms, including the historic Buchanan Farm, which has been in operation since the early 1800s. The town is also home to several wineries, including the Buchanan Winery, which produces a variety of wines.
Tourism is also an important part of the local economy. The town is home to several historic sites, including the Buchanan Historic District, which is listed on the National Register of Historic Places. The town is also home to several outdoor recreation areas, including the Buchanan State Forest and the Buchanan Wildlife Management Area.
Demographics
As of the 2010 census, there were 1,178 people, 463 households, and 315 families residing in the town. The population density was 1,717.1 people per square mile. The racial makeup of the town was 95.2% White, 1.2% African American, 0.3% Native American, 0.3% Asian, 0.1% Pacific Islander, 0.8% from other races, and 1.9% from two or more races. Hispanic or Latino of any race were 2.2% of the population.
The median income for a household in the town was $37,500, and the median income for a family was $45,000. The per capita income for the town was $18,945. About 11.2% of families and 14.2% of the population were below the poverty line, including 18.2% of those under age 18 and 8.3% of those age 65 or over.
Common Questions
What is Per Capita Income in Buchanan?
Per Capita income in Buchanan is $30,280.
What is the Median Family Income in Buchanan?
Median Family Income in Buchanan is $66,250.
What is the Median Household income in Buchanan?
Median Household Income in Buchanan is $54,167.
What is Income or Wage Gap in Buchanan?
Income or Wage Gap in Buchanan is 29.6%.
Women in Buchanan earn 70.4 cents for every dollar earned by a man.
What is Family Income Deficit in Buchanan?
Family Income Deficit in Buchanan is $17,383.
Families that are below poverty line in Buchanan earn $17,383 less on average than the poverty threshold level.
What is Inequality or Gini Index in Buchanan?
Inequality or Gini Index in Buchanan is 0.39.
What is the Total Population of Buchanan?
Total Population of Buchanan is 1,108.
What is the Total Male Population of Buchanan?
Total Male Population of Buchanan is 574.
What is the Total Female Population of Buchanan?
Total Female Population of Buchanan is 534.
What is the Ratio of Males per 100 Females in Buchanan?
There are 107.49 Males per 100 Females in Buchanan.
What is the Ratio of Females per 100 Males in Buchanan?
There are 93.03 Females per 100 Males in Buchanan.
What is the Median Population Age in Buchanan?
Median Population Age in Buchanan is 47.7 Years.
What is the Average Family Size in Buchanan
Average Family Size in Buchanan is 3.0 People.
What is the Average Household Size in Buchanan
Average Household Size in Buchanan is 2.5 People.
How Large is the Labor Force in Buchanan?
There are 540 People in the Labor Forcein in Buchanan.
What is the Percentage of People in the Labor Force in Buchanan?
57.3% of People are in the Labor Force in Buchanan.
What is the Unemployment Rate in Buchanan?
Unemployment Rate in Buchanan is 8.1%.