Ruckersville, VA Map & Demographics
Ruckersville Map
Ruckersville Overview
$49,217
PER CAPITA INCOME
$124,167
AVG FAMILY INCOME
$101,875
AVG HOUSEHOLD INCOME
64.6%
WAGE / INCOME GAP [ % ]
35.4¢/ $1
WAGE / INCOME GAP [ $ ]
0.39
INEQUALITY / GINI INDEX
1,275
TOTAL POPULATION
554
MALE POPULATION
721
FEMALE POPULATION
76.84
MALES / 100 FEMALES
130.14
FEMALES / 100 MALES
36.7
MEDIAN AGE
3.9
AVG FAMILY SIZE
3.0
AVG HOUSEHOLD SIZE
733
LABOR FORCE [ PEOPLE ]
78.1%
PERCENT IN LABOR FORCE
3.4%
UNEMPLOYMENT RATE
Ruckersville Zip Codes
Ruckersville Area Codes
Income in Ruckersville
Income Overview in Ruckersville
Per Capita Income in Ruckersville is $49,217, while median incomes of families and households are $124,167 and $101,875 respectively.
| Characteristic | Number | Measure |
| Per Capita Income | 1,275 | $49,217 |
| Median Family Income | 264 | $124,167 |
| Mean Family Income | 264 | $175,650 |
| Median Household Income | 423 | $101,875 |
| Mean Household Income | 423 | $150,050 |
| Income Deficit | 264 | $0 |
| Wage / Income Gap (%) | 1,275 | 64.58% |
| Wage / Income Gap ($) | 1,275 | 35.42¢ per $1 |
| Gini / Inequality Index | 1,275 | 0.39 |
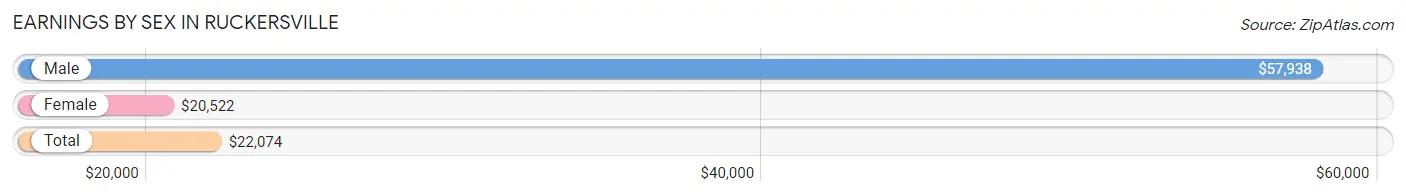
Earnings by Sex in Ruckersville
Average Earnings in Ruckersville are $22,074, $57,938 for men and $20,522 for women, a difference of 64.6%.
| Sex | Number | Average Earnings |
| Male | 311 (41.0%) | $57,938 |
| Female | 448 (59.0%) | $20,522 |
| Total | 759 (100.0%) | $22,074 |
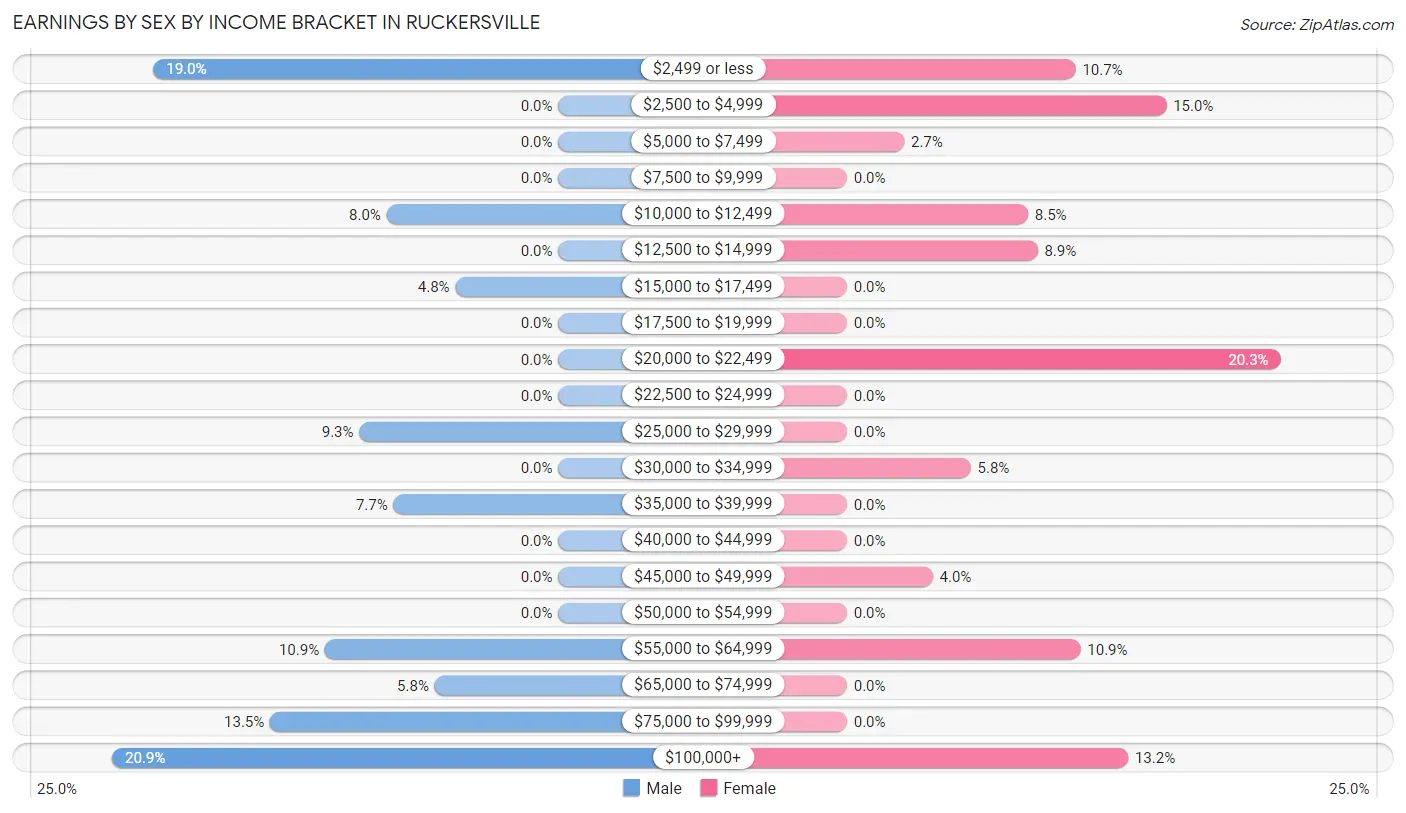
Earnings by Sex by Income Bracket in Ruckersville
The most common earnings brackets in Ruckersville are $100,000+ for men (65 | 20.9%) and $20,000 to $22,499 for women (91 | 20.3%).
| Income | Male | Female |
| $2,499 or less | 59 (19.0%) | 48 (10.7%) |
| $2,500 to $4,999 | 0 (0.0%) | 67 (15.0%) |
| $5,000 to $7,499 | 0 (0.0%) | 12 (2.7%) |
| $7,500 to $9,999 | 0 (0.0%) | 0 (0.0%) |
| $10,000 to $12,499 | 25 (8.0%) | 38 (8.5%) |
| $12,500 to $14,999 | 0 (0.0%) | 40 (8.9%) |
| $15,000 to $17,499 | 15 (4.8%) | 0 (0.0%) |
| $17,500 to $19,999 | 0 (0.0%) | 0 (0.0%) |
| $20,000 to $22,499 | 0 (0.0%) | 91 (20.3%) |
| $22,500 to $24,999 | 0 (0.0%) | 0 (0.0%) |
| $25,000 to $29,999 | 29 (9.3%) | 0 (0.0%) |
| $30,000 to $34,999 | 0 (0.0%) | 26 (5.8%) |
| $35,000 to $39,999 | 24 (7.7%) | 0 (0.0%) |
| $40,000 to $44,999 | 0 (0.0%) | 0 (0.0%) |
| $45,000 to $49,999 | 0 (0.0%) | 18 (4.0%) |
| $50,000 to $54,999 | 0 (0.0%) | 0 (0.0%) |
| $55,000 to $64,999 | 34 (10.9%) | 49 (10.9%) |
| $65,000 to $74,999 | 18 (5.8%) | 0 (0.0%) |
| $75,000 to $99,999 | 42 (13.5%) | 0 (0.0%) |
| $100,000+ | 65 (20.9%) | 59 (13.2%) |
| Total | 311 (100.0%) | 448 (100.0%) |
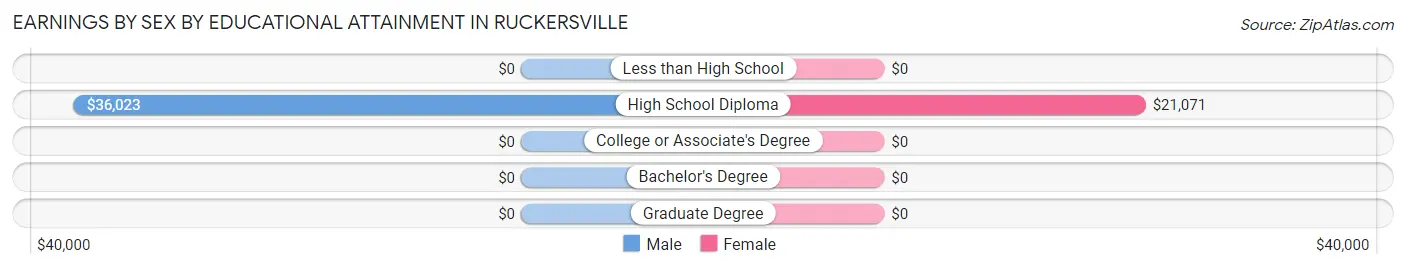
Earnings by Sex by Educational Attainment in Ruckersville
Average earnings in Ruckersville are $59,500 for men and $21,346 for women, a difference of 64.1%. Men with an educational attainment of high school diploma enjoy the highest average annual earnings of $36,023, while those with high school diploma education earn the least with $36,023. Women with an educational attainment of high school diploma earn the most with the average annual earnings of $21,071, while those with high school diploma education have the smallest earnings of $21,071.
| Educational Attainment | Male Income | Female Income |
| Less than High School | - | - |
| High School Diploma | $36,023 | $21,071 |
| College or Associate's Degree | - | - |
| Bachelor's Degree | - | - |
| Graduate Degree | - | - |
| Total | $59,500 | $21,346 |
Family Income in Ruckersville
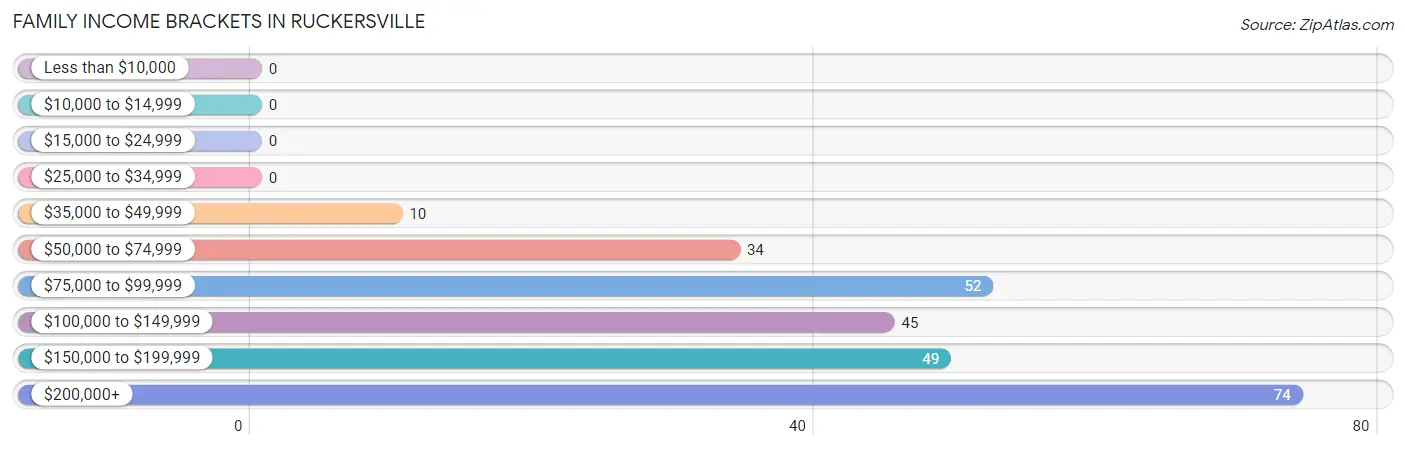
Family Income Brackets in Ruckersville
According to the Ruckersville family income data, there are 74 families falling into the $200,000+ income range, which is the most common income bracket and makes up 28.0% of all families.
| Income Bracket | # Families | % Families |
| Less than $10,000 | 0 | 0.0% |
| $10,000 to $14,999 | 0 | 0.0% |
| $15,000 to $24,999 | 0 | 0.0% |
| $25,000 to $34,999 | 0 | 0.0% |
| $35,000 to $49,999 | 10 | 3.8% |
| $50,000 to $74,999 | 34 | 12.9% |
| $75,000 to $99,999 | 52 | 19.7% |
| $100,000 to $149,999 | 45 | 17.0% |
| $150,000 to $199,999 | 49 | 18.6% |
| $200,000+ | 74 | 28.0% |
Family Income by Famaliy Size in Ruckersville
| Income Bracket | # Families | Median Income |
| 2-Person Families | 125 (47.3%) | $0 |
| 3-Person Families | 0 (0.0%) | $0 |
| 4-Person Families | 45 (17.1%) | $0 |
| 5-Person Families | 60 (22.7%) | $0 |
| 6-Person Families | 34 (12.9%) | $0 |
| 7+ Person Families | 0 (0.0%) | $0 |
| Total | 264 (100.0%) | $124,167 |
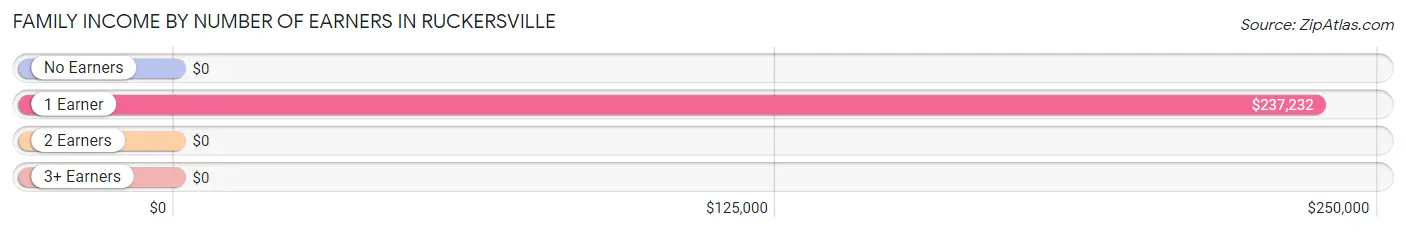
Family Income by Number of Earners in Ruckersville
| Number of Earners | # Families | Median Income |
| No Earners | 29 (11.0%) | $0 |
| 1 Earner | 45 (17.1%) | $237,232 |
| 2 Earners | 145 (54.9%) | $0 |
| 3+ Earners | 45 (17.1%) | $0 |
| Total | 264 (100.0%) | $124,167 |
Household Income in Ruckersville
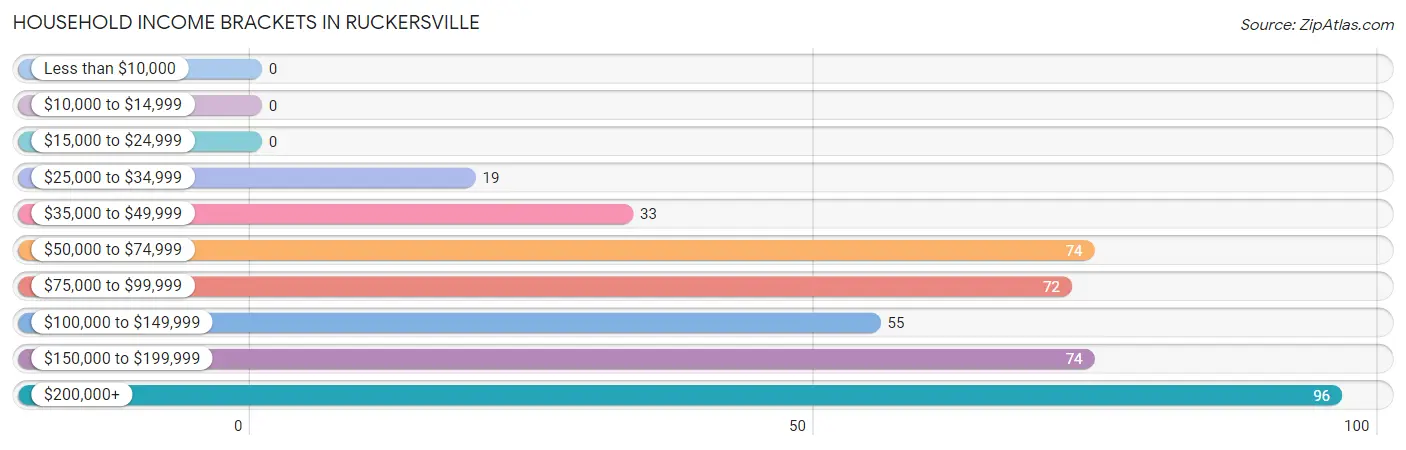
Household Income Brackets in Ruckersville
With 96 households falling in the category, the $200,000+ income range is the most frequent in Ruckersville, accounting for 22.7% of all households.
| Income Bracket | # Households | % Households |
| Less than $10,000 | 0 | 0.0% |
| $10,000 to $14,999 | 0 | 0.0% |
| $15,000 to $24,999 | 0 | 0.0% |
| $25,000 to $34,999 | 19 | 4.5% |
| $35,000 to $49,999 | 33 | 7.8% |
| $50,000 to $74,999 | 74 | 17.5% |
| $75,000 to $99,999 | 72 | 17.0% |
| $100,000 to $149,999 | 55 | 13.0% |
| $150,000 to $199,999 | 74 | 17.5% |
| $200,000+ | 96 | 22.7% |
Household Income by Householder Age in Ruckersville
The median household income in Ruckersville is $101,875, with the highest median household income of $199,007 found in the 25 to 44 years age bracket for the primary householder. A total of 119 households (28.1%) fall into this category.
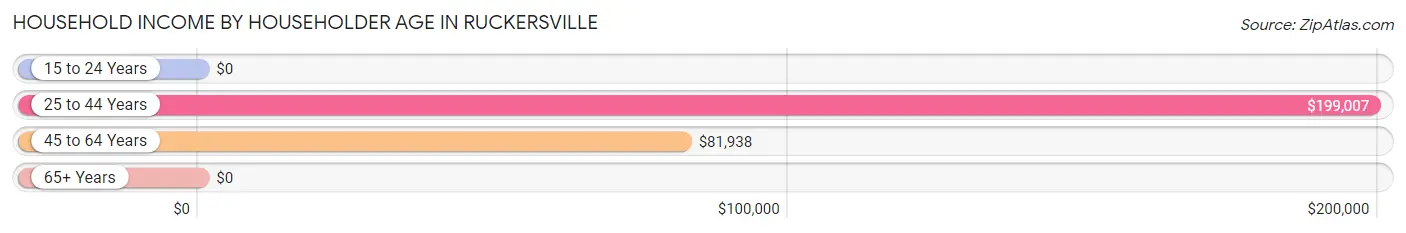
| Income Bracket | # Households | Median Income |
| 15 to 24 Years | 0 (0.0%) | $0 |
| 25 to 44 Years | 119 (28.1%) | $199,007 |
| 45 to 64 Years | 173 (40.9%) | $81,938 |
| 65+ Years | 131 (31.0%) | $0 |
| Total | 423 (100.0%) | $101,875 |
Poverty in Ruckersville
Income Below Poverty by Sex and Age in Ruckersville
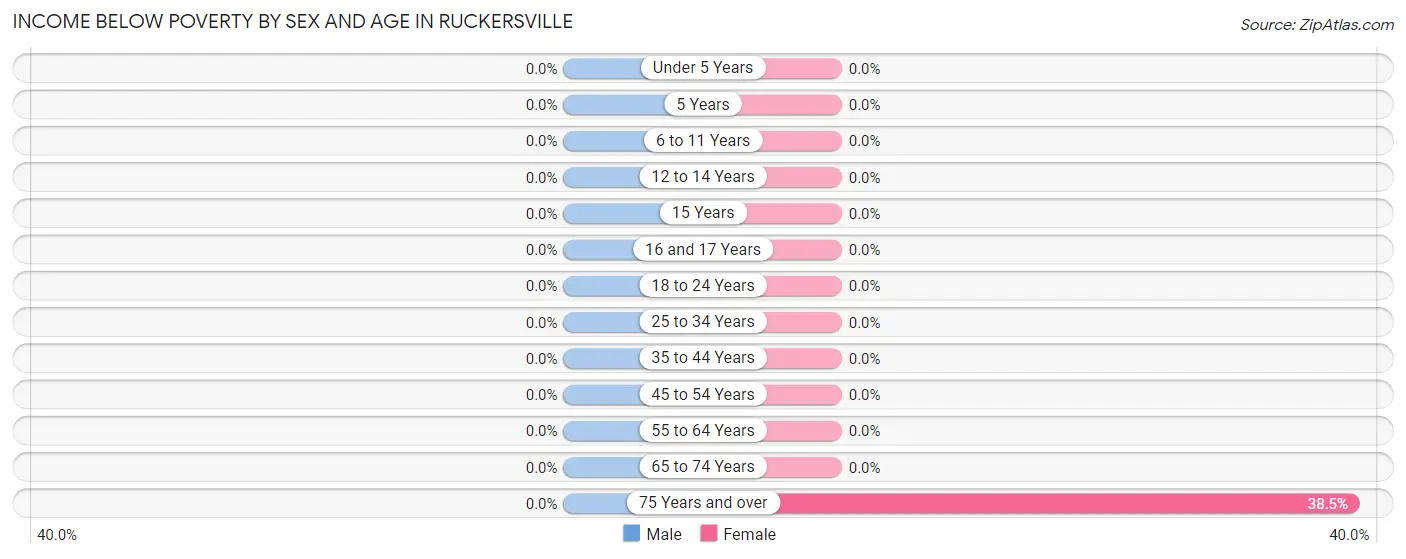
| Age Bracket | Male | Female |
| Under 5 Years | 0 (0.0%) | 0 (0.0%) |
| 5 Years | 0 (0.0%) | 0 (0.0%) |
| 6 to 11 Years | 0 (0.0%) | 0 (0.0%) |
| 12 to 14 Years | 0 (0.0%) | 0 (0.0%) |
| 15 Years | 0 (0.0%) | 0 (0.0%) |
| 16 and 17 Years | 0 (0.0%) | 0 (0.0%) |
| 18 to 24 Years | 0 (0.0%) | 0 (0.0%) |
| 25 to 34 Years | 0 (0.0%) | 0 (0.0%) |
| 35 to 44 Years | 0 (0.0%) | 0 (0.0%) |
| 45 to 54 Years | 0 (0.0%) | 0 (0.0%) |
| 55 to 64 Years | 0 (0.0%) | 0 (0.0%) |
| 65 to 74 Years | 0 (0.0%) | 0 (0.0%) |
| 75 Years and over | 0 (0.0%) | 15 (38.5%) |
| Total | 0 (0.0%) | 15 (2.1%) |
Income Above Poverty by Sex and Age in Ruckersville
According to the poverty statistics in Ruckersville, males aged under 5 years and females aged 6 to 11 years are the age groups that are most secure financially, with 100.0% of males and 100.0% of females in these age groups living above the poverty line.
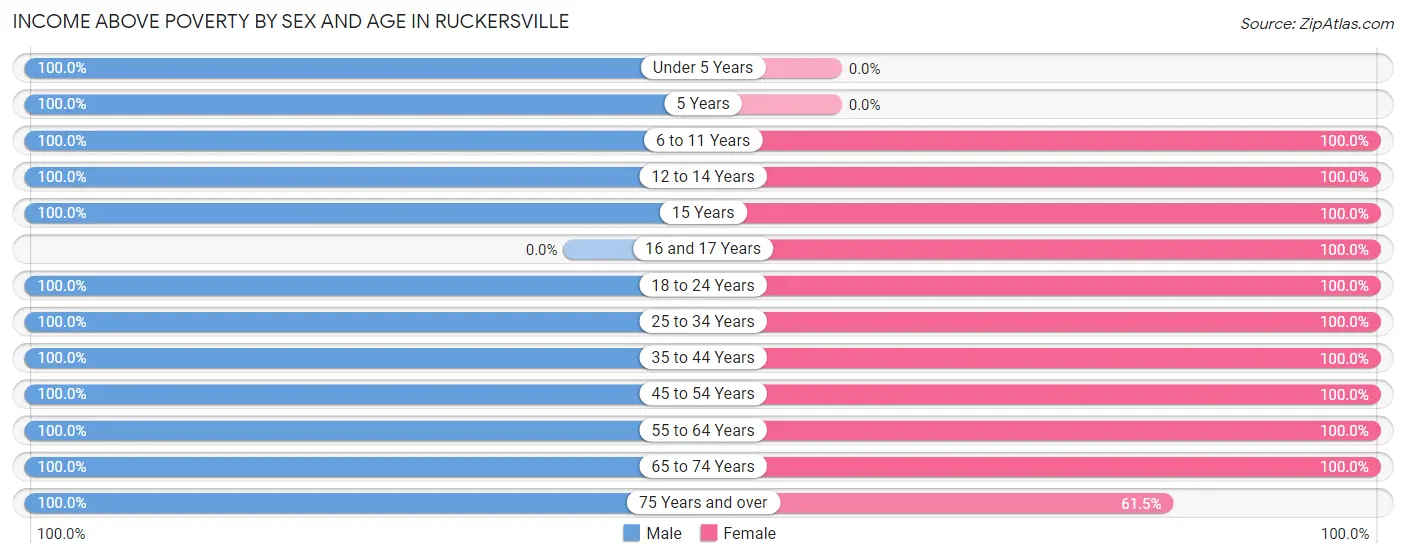
| Age Bracket | Male | Female |
| Under 5 Years | 47 (100.0%) | 0 (0.0%) |
| 5 Years | 19 (100.0%) | 0 (0.0%) |
| 6 to 11 Years | 52 (100.0%) | 60 (100.0%) |
| 12 to 14 Years | 64 (100.0%) | 20 (100.0%) |
| 15 Years | 11 (100.0%) | 63 (100.0%) |
| 16 and 17 Years | 0 (0.0%) | 60 (100.0%) |
| 18 to 24 Years | 25 (100.0%) | 24 (100.0%) |
| 25 to 34 Years | 22 (100.0%) | 122 (100.0%) |
| 35 to 44 Years | 80 (100.0%) | 84 (100.0%) |
| 45 to 54 Years | 46 (100.0%) | 78 (100.0%) |
| 55 to 64 Years | 93 (100.0%) | 67 (100.0%) |
| 65 to 74 Years | 54 (100.0%) | 104 (100.0%) |
| 75 Years and over | 41 (100.0%) | 24 (61.5%) |
| Total | 554 (100.0%) | 706 (97.9%) |
Income Below Poverty Among Married-Couple Families in Ruckersville
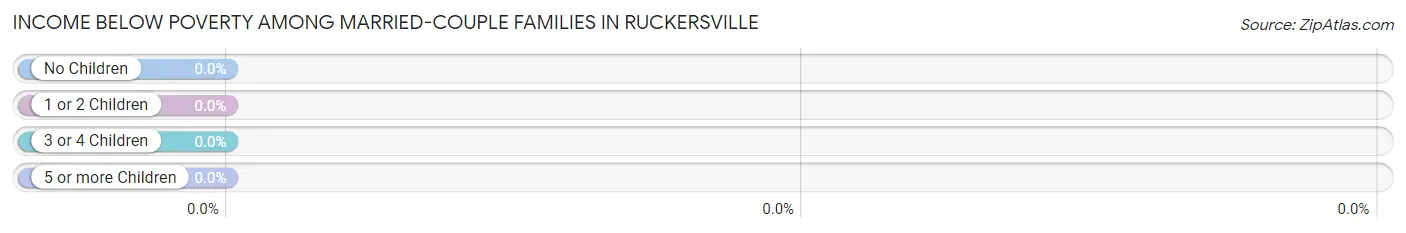
| Children | Above Poverty | Below Poverty |
| No Children | 125 (100.0%) | 0 (0.0%) |
| 1 or 2 Children | 63 (100.0%) | 0 (0.0%) |
| 3 or 4 Children | 34 (100.0%) | 0 (0.0%) |
| 5 or more Children | 0 (0.0%) | 0 (0.0%) |
| Total | 222 (100.0%) | 0 (0.0%) |
Income Below Poverty Among Single-Parent Households in Ruckersville
| Children | Single Father | Single Mother |
| No Children | 0 (0.0%) | 0 (0.0%) |
| 1 or 2 Children | 0 (0.0%) | 0 (0.0%) |
| 3 or 4 Children | 0 (0.0%) | 0 (0.0%) |
| 5 or more Children | 0 (0.0%) | 0 (0.0%) |
| Total | 0 (0.0%) | 0 (0.0%) |
Income Below Poverty Among Married-Couple vs Single-Parent Households in Ruckersville
| Children | Married-Couple Families | Single-Parent Households |
| No Children | 0 (0.0%) | 0 (0.0%) |
| 1 or 2 Children | 0 (0.0%) | 0 (0.0%) |
| 3 or 4 Children | 0 (0.0%) | 0 (0.0%) |
| 5 or more Children | 0 (0.0%) | 0 (0.0%) |
| Total | 0 (0.0%) | 0 (0.0%) |
Race in Ruckersville
The most populous races in Ruckersville are White / Caucasian (945 | 74.1%), Hispanic or Latino (170 | 13.3%), and Two or more Races (170 | 13.3%).
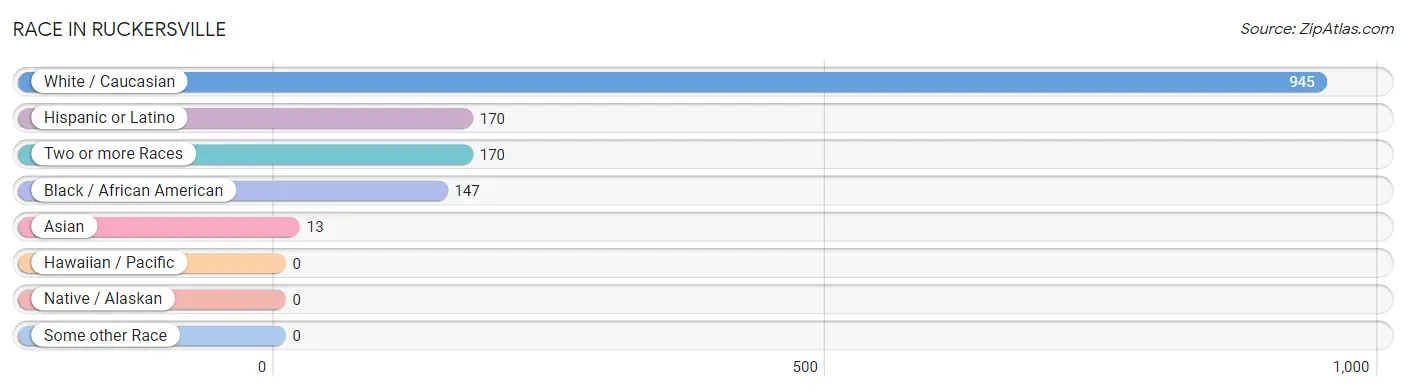
| Race | # Population | % Population |
| Asian | 13 | 1.0% |
| Black / African American | 147 | 11.5% |
| Hawaiian / Pacific | 0 | 0.0% |
| Hispanic or Latino | 170 | 13.3% |
| Native / Alaskan | 0 | 0.0% |
| White / Caucasian | 945 | 74.1% |
| Two or more Races | 170 | 13.3% |
| Some other Race | 0 | 0.0% |
| Total | 1,275 | 100.0% |
Ancestry in Ruckersville
The most populous ancestries reported in Ruckersville are European (167 | 13.1%), Cherokee (163 | 12.8%), Mexican (163 | 12.8%), Northern European (98 | 7.7%), and English (84 | 6.6%), together accounting for 52.9% of all Ruckersville residents.
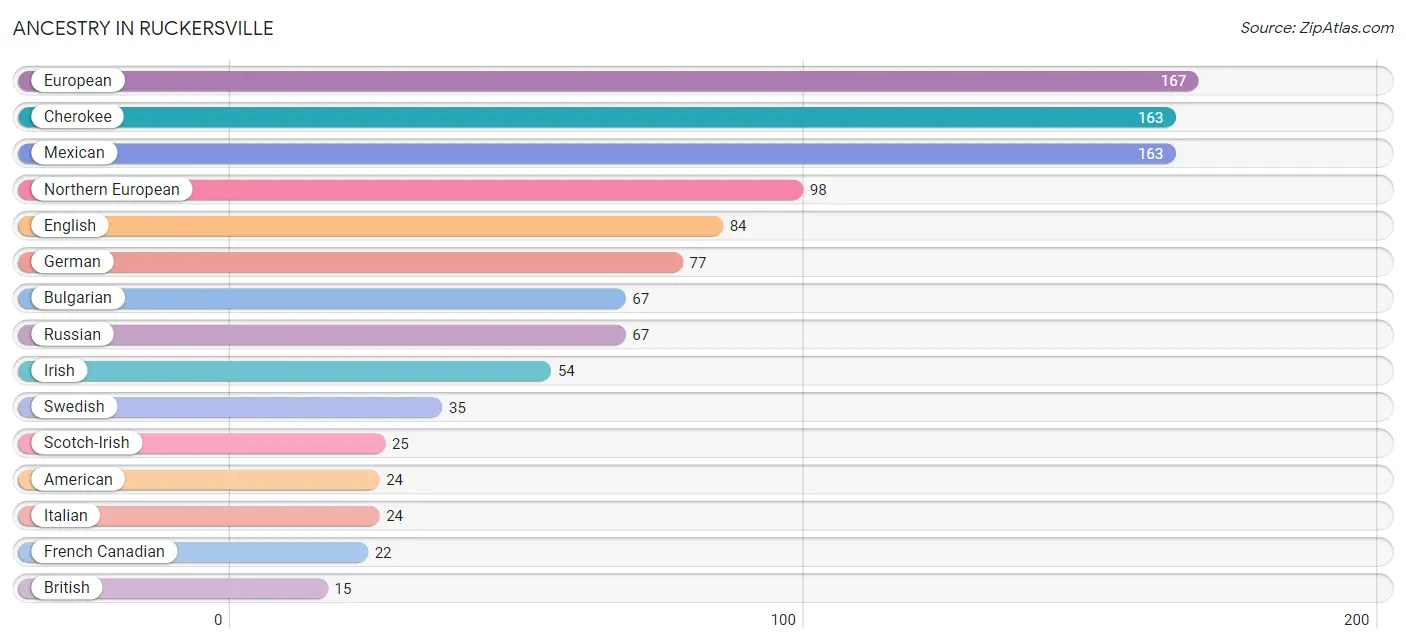
| Ancestry | # Population | % Population |
| American | 24 | 1.9% |
| British | 15 | 1.2% |
| Bulgarian | 67 | 5.2% |
| Burmese | 13 | 1.0% |
| Cherokee | 163 | 12.8% |
| English | 84 | 6.6% |
| European | 167 | 13.1% |
| French Canadian | 22 | 1.7% |
| German | 77 | 6.0% |
| Irish | 54 | 4.2% |
| Italian | 24 | 1.9% |
| Mexican | 163 | 12.8% |
| Northern European | 98 | 7.7% |
| Puerto Rican | 7 | 0.5% |
| Russian | 67 | 5.2% |
| Scotch-Irish | 25 | 2.0% |
| Scottish | 13 | 1.0% |
| Slovak | 15 | 1.2% |
| Swedish | 35 | 2.8% | View All 19 Rows |
Immigrants in Ruckersville
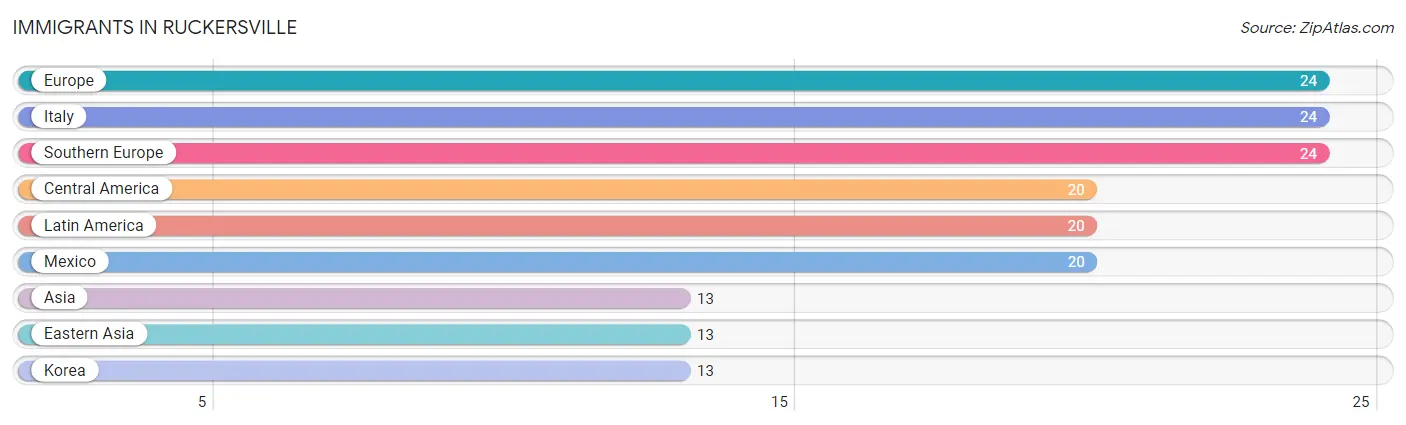
The most numerous immigrant groups reported in Ruckersville came from Europe (24 | 1.9%), Italy (24 | 1.9%), Southern Europe (24 | 1.9%), Central America (20 | 1.6%), and Latin America (20 | 1.6%), together accounting for 8.8% of all Ruckersville residents.
| Immigration Origin | # Population | % Population |
| Asia | 13 | 1.0% |
| Central America | 20 | 1.6% |
| Eastern Asia | 13 | 1.0% |
| Europe | 24 | 1.9% |
| Italy | 24 | 1.9% |
| Korea | 13 | 1.0% |
| Latin America | 20 | 1.6% |
| Mexico | 20 | 1.6% |
| Southern Europe | 24 | 1.9% | View All 9 Rows |
Sex and Age in Ruckersville
Sex and Age in Ruckersville
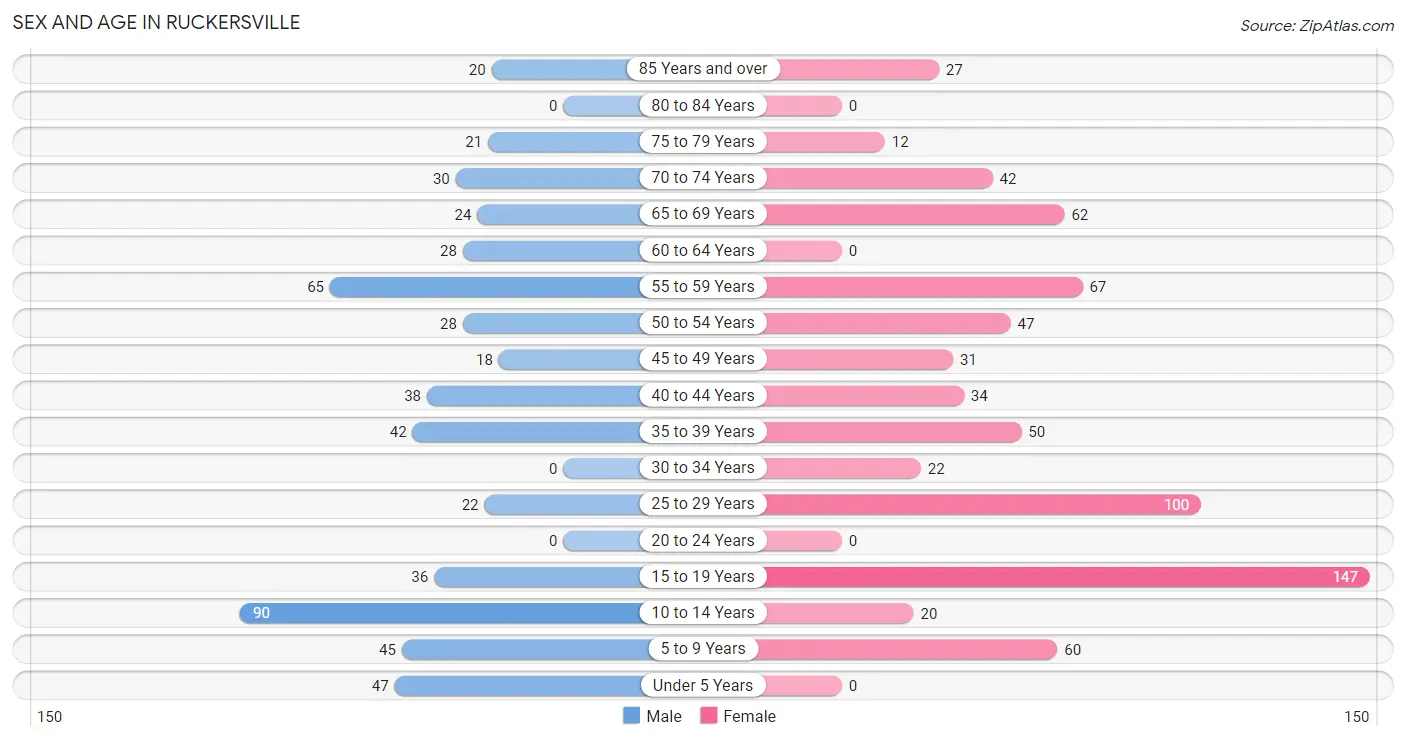
The most populous age groups in Ruckersville are 10 to 14 Years (90 | 16.3%) for men and 15 to 19 Years (147 | 20.4%) for women.
| Age Bracket | Male | Female |
| Under 5 Years | 47 (8.5%) | 0 (0.0%) |
| 5 to 9 Years | 45 (8.1%) | 60 (8.3%) |
| 10 to 14 Years | 90 (16.3%) | 20 (2.8%) |
| 15 to 19 Years | 36 (6.5%) | 147 (20.4%) |
| 20 to 24 Years | 0 (0.0%) | 0 (0.0%) |
| 25 to 29 Years | 22 (4.0%) | 100 (13.9%) |
| 30 to 34 Years | 0 (0.0%) | 22 (3.0%) |
| 35 to 39 Years | 42 (7.6%) | 50 (6.9%) |
| 40 to 44 Years | 38 (6.9%) | 34 (4.7%) |
| 45 to 49 Years | 18 (3.3%) | 31 (4.3%) |
| 50 to 54 Years | 28 (5.1%) | 47 (6.5%) |
| 55 to 59 Years | 65 (11.7%) | 67 (9.3%) |
| 60 to 64 Years | 28 (5.1%) | 0 (0.0%) |
| 65 to 69 Years | 24 (4.3%) | 62 (8.6%) |
| 70 to 74 Years | 30 (5.4%) | 42 (5.8%) |
| 75 to 79 Years | 21 (3.8%) | 12 (1.7%) |
| 80 to 84 Years | 0 (0.0%) | 0 (0.0%) |
| 85 Years and over | 20 (3.6%) | 27 (3.7%) |
| Total | 554 (100.0%) | 721 (100.0%) |
Families and Households in Ruckersville
Median Family Size in Ruckersville
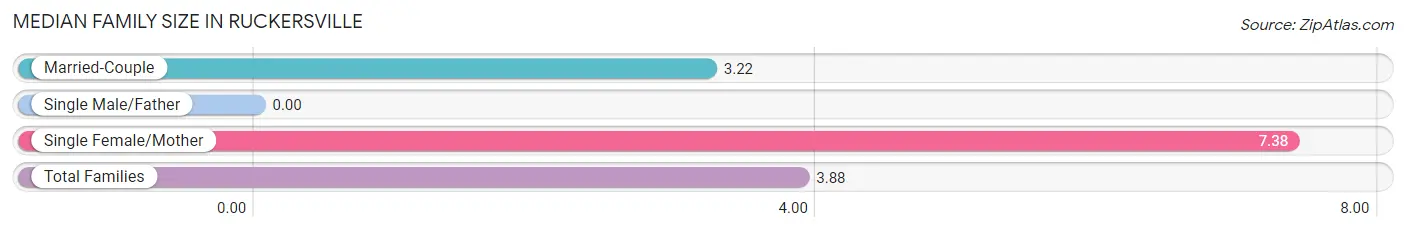
| Family Type | # Families | Family Size |
| Married-Couple | 222 (84.1%) | 3.22 |
| Single Male/Father | 0 (0.0%) | - |
| Single Female/Mother | 42 (15.9%) | 7.38 |
| Total Families | 264 (100.0%) | 3.88 |
Median Household Size in Ruckersville
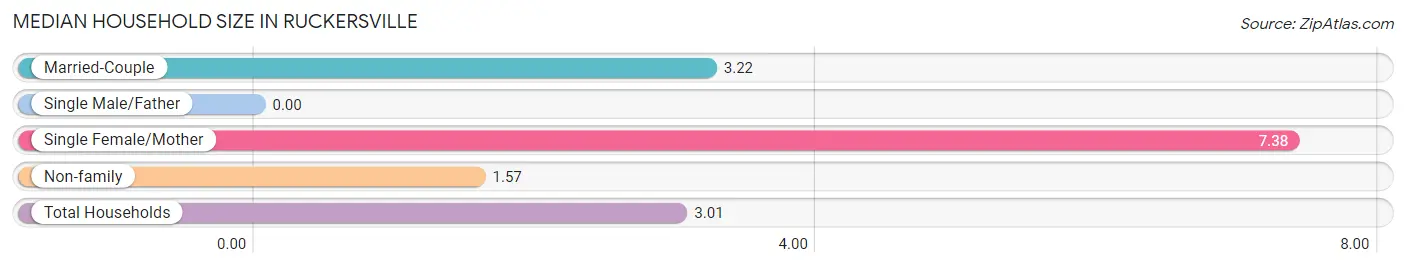
| Household Type | # Households | Household Size |
| Married-Couple | 222 (52.5%) | 3.22 |
| Single Male/Father | 0 (0.0%) | - |
| Single Female/Mother | 42 (9.9%) | 7.38 |
| Non-family | 159 (37.6%) | 1.57 |
| Total Households | 423 (100.0%) | 3.01 |
Household Size by Marriage Status in Ruckersville
Out of a total of 423 households in Ruckersville, 264 (62.4%) are family households, while 159 (37.6%) are nonfamily households. The most numerous type of family households are 2-person households, comprising 125, and the most common type of nonfamily households are 1-person households, comprising 79.
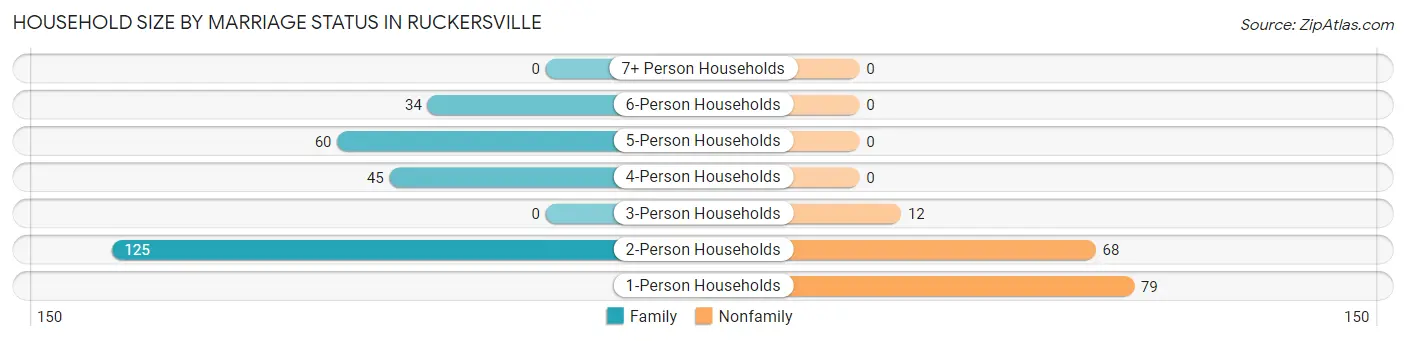
| Household Size | Family Households | Nonfamily Households |
| 1-Person Households | - | 79 (18.7%) |
| 2-Person Households | 125 (29.5%) | 68 (16.1%) |
| 3-Person Households | 0 (0.0%) | 12 (2.8%) |
| 4-Person Households | 45 (10.6%) | 0 (0.0%) |
| 5-Person Households | 60 (14.2%) | 0 (0.0%) |
| 6-Person Households | 34 (8.0%) | 0 (0.0%) |
| 7+ Person Households | 0 (0.0%) | 0 (0.0%) |
| Total | 264 (62.4%) | 159 (37.6%) |
Female Fertility in Ruckersville
Fertility by Age in Ruckersville
| Age Bracket | Women with Births | Births / 1,000 Women |
| 15 to 19 years | 0 (0.0%) | 0.0 |
| 20 to 34 years | 0 (0.0%) | 0.0 |
| 35 to 50 years | 0 (0.0%) | 0.0 |
| Total | 0 (0.0%) | 0.0 |
Fertility by Age by Marriage Status in Ruckersville
| Age Bracket | Married | Unmarried |
| 15 to 19 years | 0 (0.0%) | 0 (0.0%) |
| 20 to 34 years | 0 (0.0%) | 0 (0.0%) |
| 35 to 50 years | 0 (0.0%) | 0 (0.0%) |
| Total | 0 (0.0%) | 0 (0.0%) |
Fertility by Education in Ruckersville
| Educational Attainment | Women with Births | Births / 1,000 Women |
| Less than High School | 0 (0.0%) | 0.0 |
| High School Diploma | 0 (0.0%) | 0.0 |
| College or Associate's Degree | 0 (0.0%) | 0.0 |
| Bachelor's Degree | 0 (0.0%) | 0.0 |
| Graduate Degree | 0 (0.0%) | 0.0 |
| Total | 0 (0.0%) | 0.0 |
Fertility by Education by Marriage Status in Ruckersville
| Educational Attainment | Married | Unmarried |
| Less than High School | 0 (0.0%) | 0 (0.0%) |
| High School Diploma | 0 (0.0%) | 0 (0.0%) |
| College or Associate's Degree | 0 (0.0%) | 0 (0.0%) |
| Bachelor's Degree | 0 (0.0%) | 0 (0.0%) |
| Graduate Degree | 0 (0.0%) | 0 (0.0%) |
| Total | 0 (0.0%) | 0 (0.0%) |
Employment Characteristics in Ruckersville
Employment by Class of Employer in Ruckersville
Among the 697 employed individuals in Ruckersville, private company employees (362 | 51.9%), local government employees (97 | 13.9%), and not-for-profit organizations (79 | 11.3%) make up the most common classes of employment.
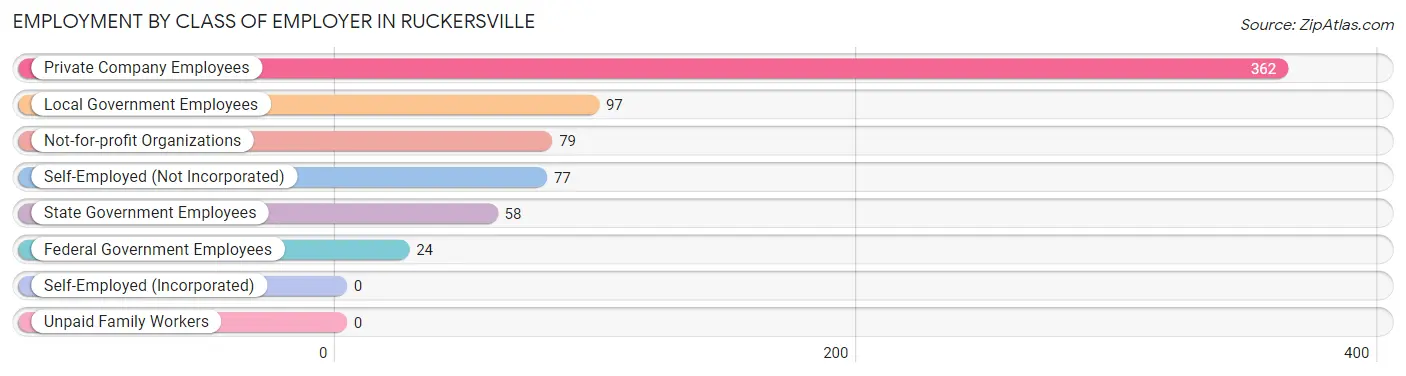
| Employer Class | # Employees | % Employees |
| Private Company Employees | 362 | 51.9% |
| Self-Employed (Incorporated) | 0 | 0.0% |
| Self-Employed (Not Incorporated) | 77 | 11.1% |
| Not-for-profit Organizations | 79 | 11.3% |
| Local Government Employees | 97 | 13.9% |
| State Government Employees | 58 | 8.3% |
| Federal Government Employees | 24 | 3.4% |
| Unpaid Family Workers | 0 | 0.0% |
| Total | 697 | 100.0% |
Employment Status by Age in Ruckersville
According to the labor force statistics for Ruckersville, out of the total population over 16 years of age (939), 78.1% or 733 individuals are in the labor force, with 3.4% or 25 of them unemployed. The age group with the highest labor force participation rate is 25 to 29 years, with 100.0% or 122 individuals in the labor force. Within the labor force, the 16 to 19 years age range has the highest percentage of unemployed individuals, with 29.4% or 25 of them being unemployed.
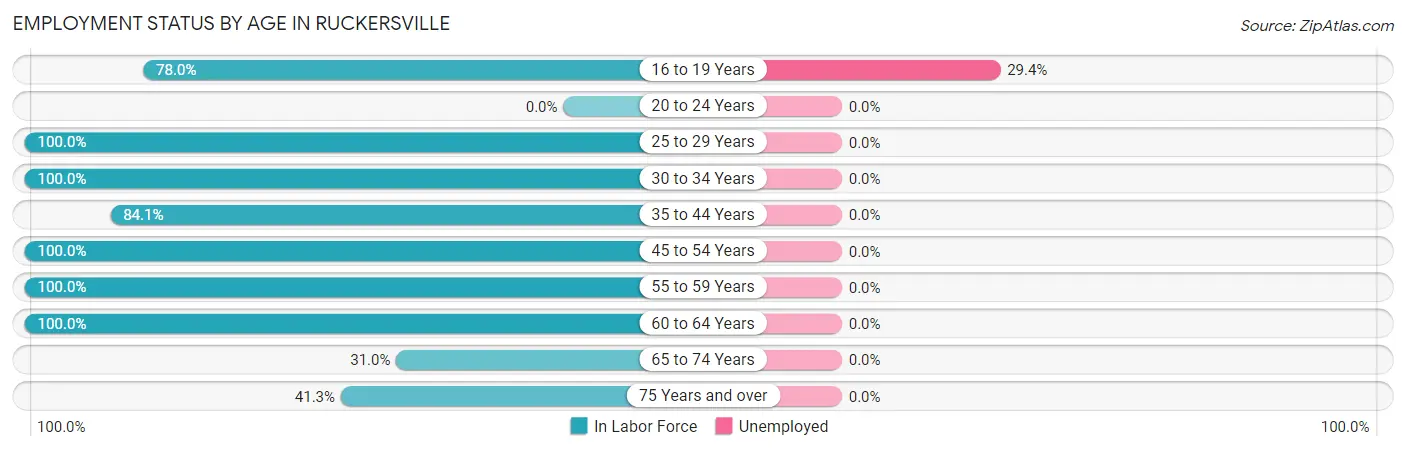
| Age Bracket | In Labor Force | Unemployed |
| 16 to 19 Years | 85 (78.0%) | 25 (29.4%) |
| 20 to 24 Years | 0 (0.0%) | 0 (0.0%) |
| 25 to 29 Years | 122 (100.0%) | 0 (0.0%) |
| 30 to 34 Years | 22 (100.0%) | 0 (0.0%) |
| 35 to 44 Years | 138 (84.1%) | 0 (0.0%) |
| 45 to 54 Years | 124 (100.0%) | 0 (0.0%) |
| 55 to 59 Years | 132 (100.0%) | 0 (0.0%) |
| 60 to 64 Years | 28 (100.0%) | 0 (0.0%) |
| 65 to 74 Years | 49 (31.0%) | 0 (0.0%) |
| 75 Years and over | 33 (41.3%) | 0 (0.0%) |
| Total | 733 (78.1%) | 25 (3.4%) |
Employment Status by Educational Attainment in Ruckersville
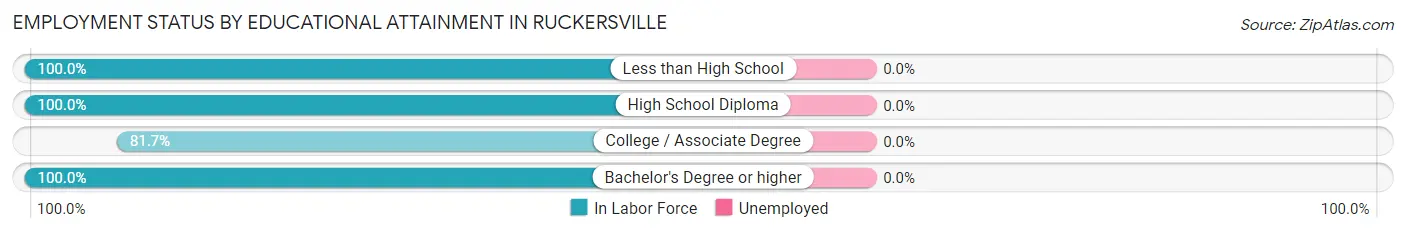
| Educational Attainment | In Labor Force | Unemployed |
| Less than High School | 15 (100.0%) | 0 (0.0%) |
| High School Diploma | 214 (100.0%) | 0 (0.0%) |
| College / Associate Degree | 116 (81.7%) | 0 (0.0%) |
| Bachelor's Degree or higher | 221 (100.0%) | 0 (0.0%) |
| Total | 566 (95.6%) | 0 (0.0%) |
Employment Occupations by Sex in Ruckersville
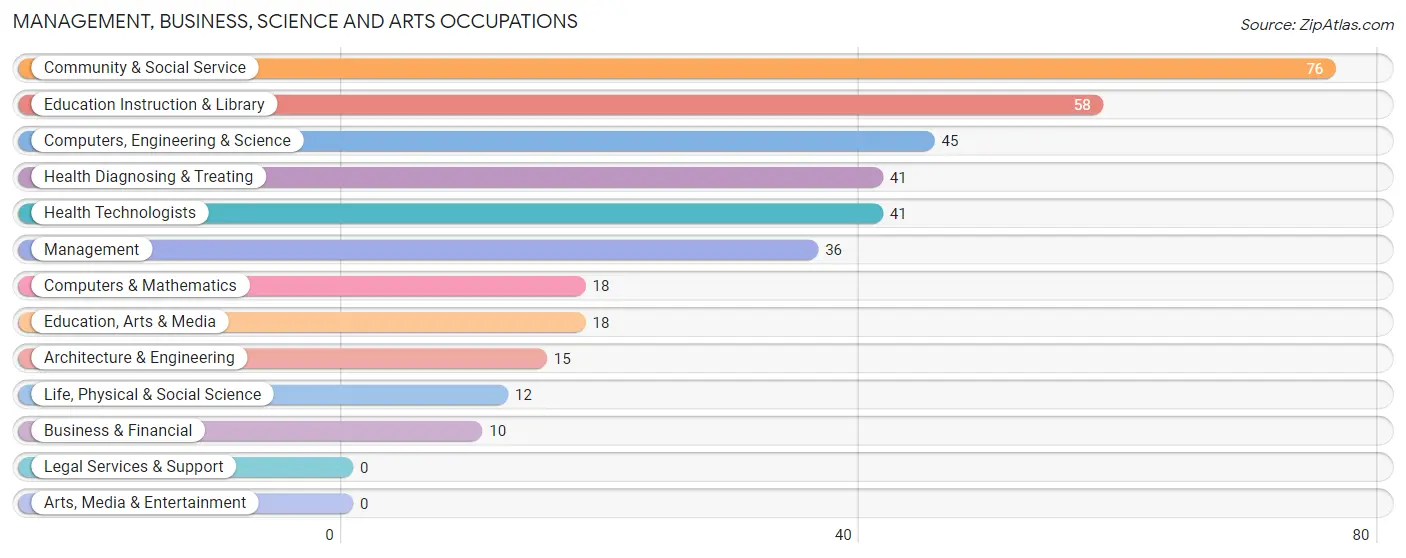
Management, Business, Science and Arts Occupations
The most common Management, Business, Science and Arts occupations in Ruckersville are Community & Social Service (76 | 10.7%), Education Instruction & Library (58 | 8.2%), Computers, Engineering & Science (45 | 6.4%), Health Diagnosing & Treating (41 | 5.8%), and Health Technologists (41 | 5.8%).
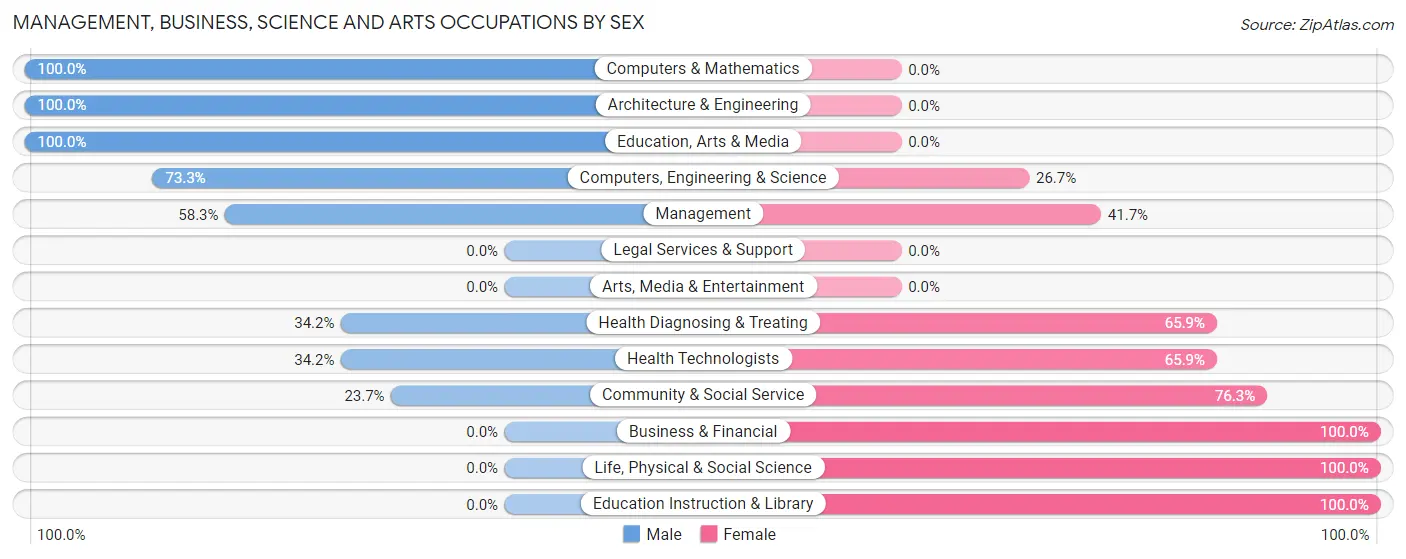
Management, Business, Science and Arts Occupations by Sex
Within the Management, Business, Science and Arts occupations in Ruckersville, the most male-oriented occupations are Computers & Mathematics (100.0%), Architecture & Engineering (100.0%), and Education, Arts & Media (100.0%), while the most female-oriented occupations are Business & Financial (100.0%), Life, Physical & Social Science (100.0%), and Education Instruction & Library (100.0%).
| Occupation | Male | Female |
| Management | 21 (58.3%) | 15 (41.7%) |
| Business & Financial | 0 (0.0%) | 10 (100.0%) |
| Computers, Engineering & Science | 33 (73.3%) | 12 (26.7%) |
| Computers & Mathematics | 18 (100.0%) | 0 (0.0%) |
| Architecture & Engineering | 15 (100.0%) | 0 (0.0%) |
| Life, Physical & Social Science | 0 (0.0%) | 12 (100.0%) |
| Community & Social Service | 18 (23.7%) | 58 (76.3%) |
| Education, Arts & Media | 18 (100.0%) | 0 (0.0%) |
| Legal Services & Support | 0 (0.0%) | 0 (0.0%) |
| Education Instruction & Library | 0 (0.0%) | 58 (100.0%) |
| Arts, Media & Entertainment | 0 (0.0%) | 0 (0.0%) |
| Health Diagnosing & Treating | 14 (34.2%) | 27 (65.8%) |
| Health Technologists | 14 (34.2%) | 27 (65.8%) |
| Total (Category) | 86 (41.3%) | 122 (58.7%) |
| Total (Overall) | 286 (40.4%) | 422 (59.6%) |
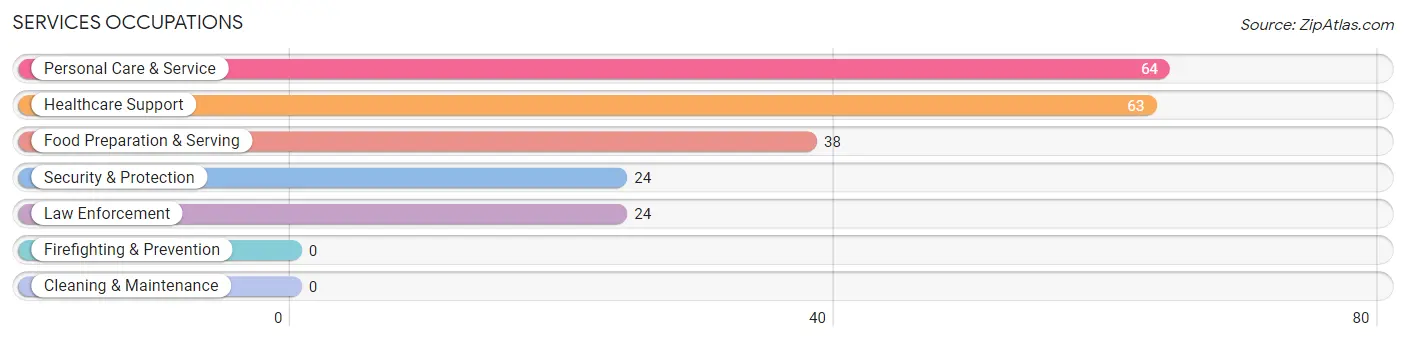
Services Occupations
The most common Services occupations in Ruckersville are Personal Care & Service (64 | 9.0%), Healthcare Support (63 | 8.9%), Food Preparation & Serving (38 | 5.4%), Security & Protection (24 | 3.4%), and Law Enforcement (24 | 3.4%).
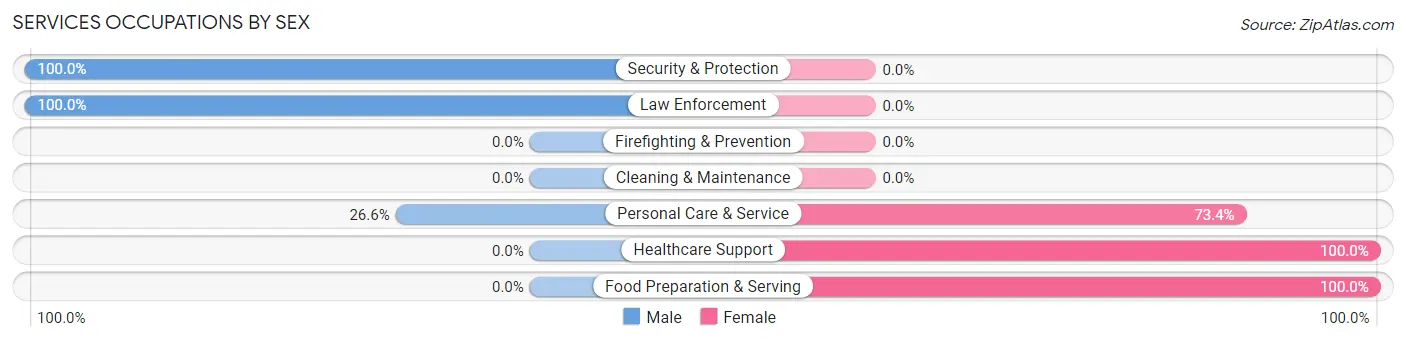
Services Occupations by Sex
Within the Services occupations in Ruckersville, the most male-oriented occupations are Security & Protection (100.0%), Law Enforcement (100.0%), and Personal Care & Service (26.6%), while the most female-oriented occupations are Healthcare Support (100.0%), Food Preparation & Serving (100.0%), and Personal Care & Service (73.4%).
| Occupation | Male | Female |
| Healthcare Support | 0 (0.0%) | 63 (100.0%) |
| Security & Protection | 24 (100.0%) | 0 (0.0%) |
| Firefighting & Prevention | 0 (0.0%) | 0 (0.0%) |
| Law Enforcement | 24 (100.0%) | 0 (0.0%) |
| Food Preparation & Serving | 0 (0.0%) | 38 (100.0%) |
| Cleaning & Maintenance | 0 (0.0%) | 0 (0.0%) |
| Personal Care & Service | 17 (26.6%) | 47 (73.4%) |
| Total (Category) | 41 (21.7%) | 148 (78.3%) |
| Total (Overall) | 286 (40.4%) | 422 (59.6%) |
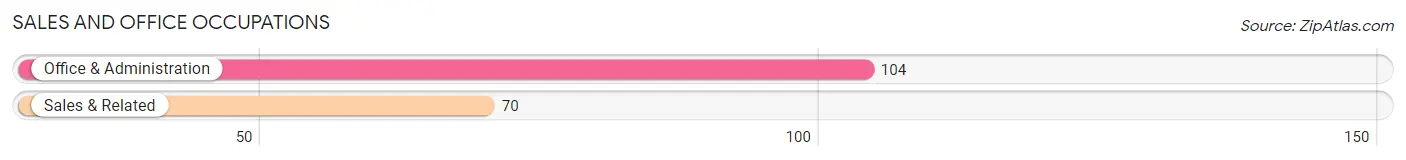
Sales and Office Occupations
The most common Sales and Office occupations in Ruckersville are Office & Administration (104 | 14.7%), and Sales & Related (70 | 9.9%).
Sales and Office Occupations by Sex
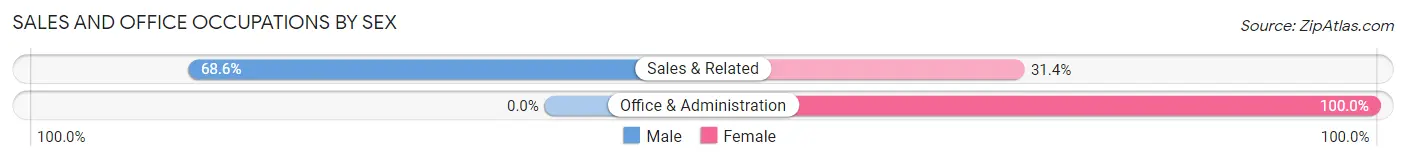
| Occupation | Male | Female |
| Sales & Related | 48 (68.6%) | 22 (31.4%) |
| Office & Administration | 0 (0.0%) | 104 (100.0%) |
| Total (Category) | 48 (27.6%) | 126 (72.4%) |
| Total (Overall) | 286 (40.4%) | 422 (59.6%) |
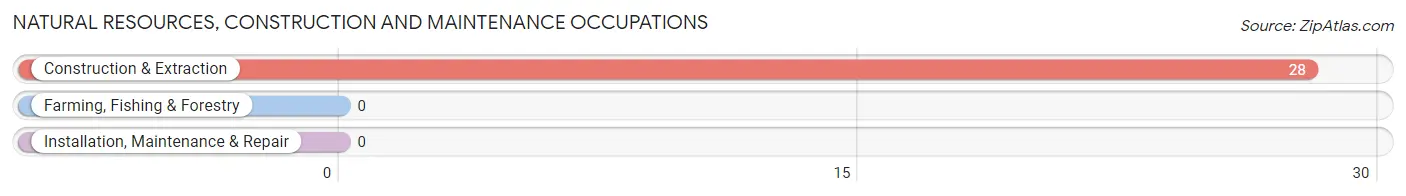
Natural Resources, Construction and Maintenance Occupations
The most common Natural Resources, Construction and Maintenance occupations in Ruckersville are , and Construction & Extraction (28 | 4.0%).
Natural Resources, Construction and Maintenance Occupations by Sex
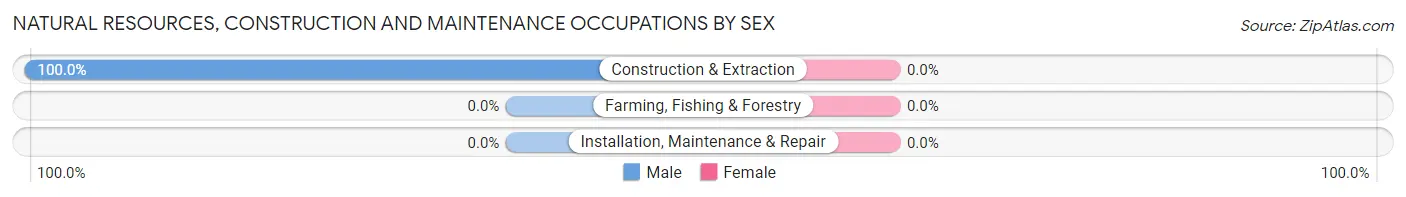
| Occupation | Male | Female |
| Farming, Fishing & Forestry | 0 (0.0%) | 0 (0.0%) |
| Construction & Extraction | 28 (100.0%) | 0 (0.0%) |
| Installation, Maintenance & Repair | 0 (0.0%) | 0 (0.0%) |
| Total (Category) | 28 (100.0%) | 0 (0.0%) |
| Total (Overall) | 286 (40.4%) | 422 (59.6%) |
Production, Transportation and Moving Occupations
The most common Production, Transportation and Moving occupations in Ruckersville are Transportation (59 | 8.3%), Material Moving (26 | 3.7%), and Production (24 | 3.4%).
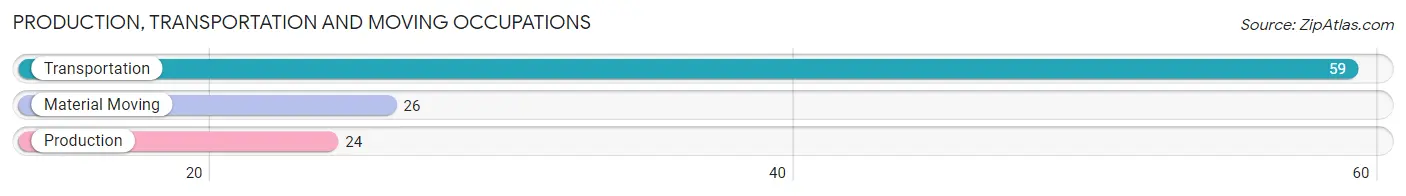
Production, Transportation and Moving Occupations by Sex
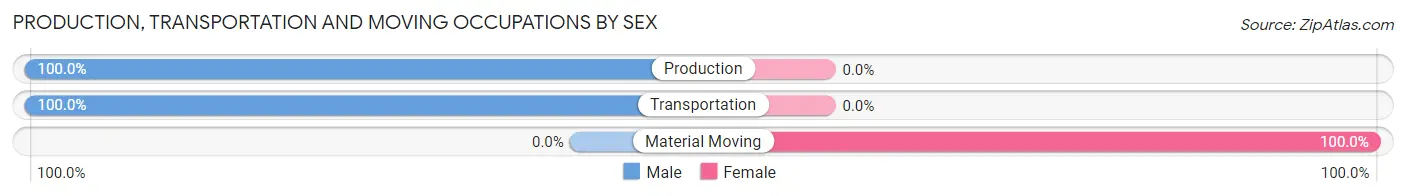
| Occupation | Male | Female |
| Production | 24 (100.0%) | 0 (0.0%) |
| Transportation | 59 (100.0%) | 0 (0.0%) |
| Material Moving | 0 (0.0%) | 26 (100.0%) |
| Total (Category) | 83 (76.1%) | 26 (23.8%) |
| Total (Overall) | 286 (40.4%) | 422 (59.6%) |
Employment Industries by Sex in Ruckersville
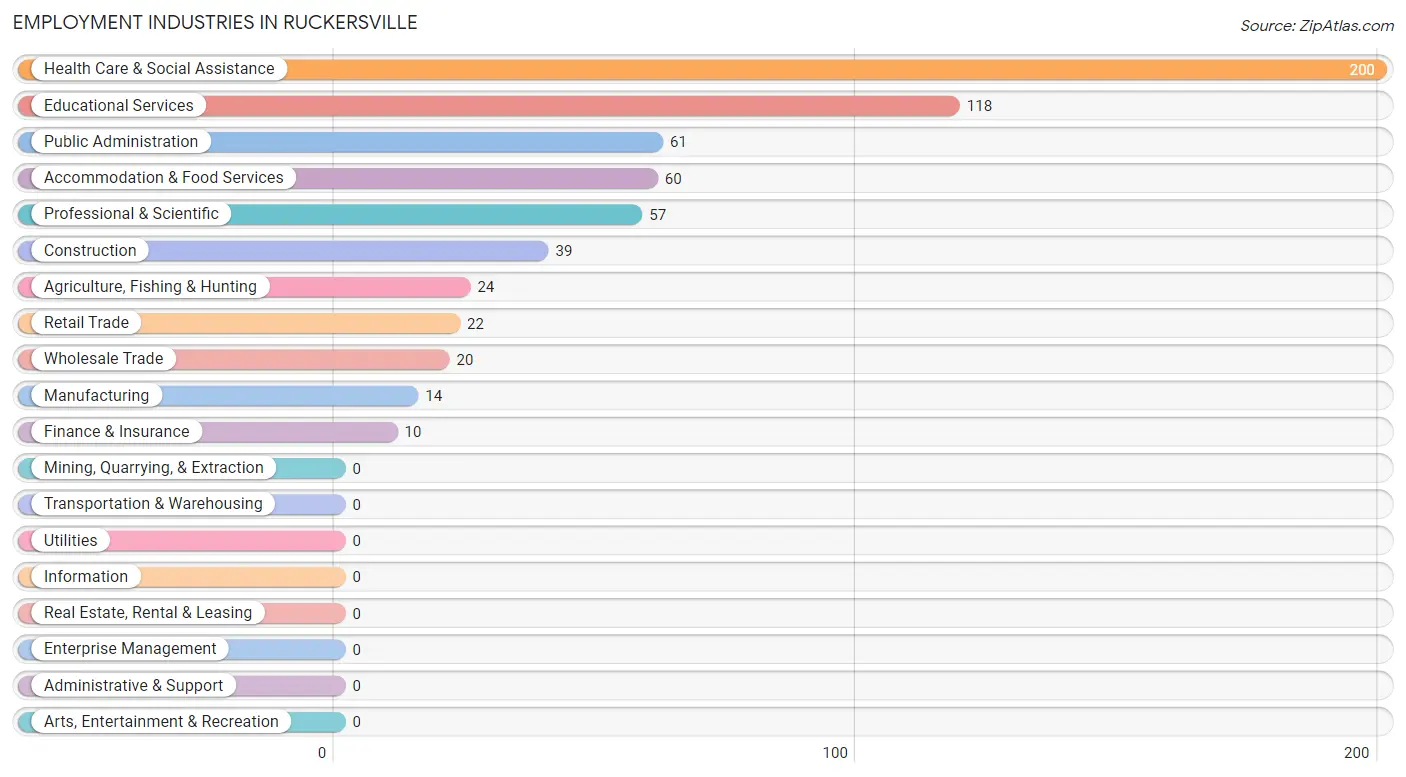
Employment Industries in Ruckersville
The major employment industries in Ruckersville include Health Care & Social Assistance (200 | 28.2%), Educational Services (118 | 16.7%), Public Administration (61 | 8.6%), Accommodation & Food Services (60 | 8.5%), and Professional & Scientific (57 | 8.1%).
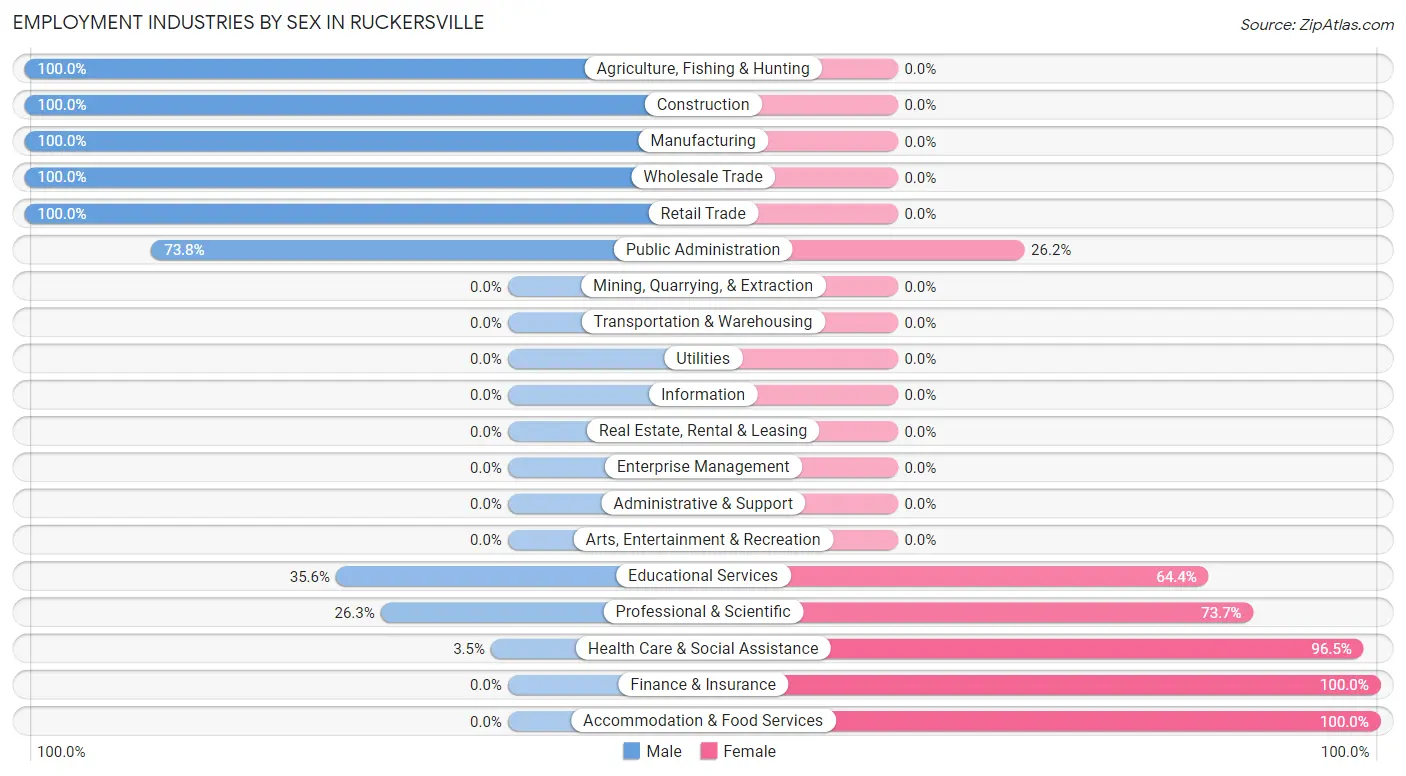
Employment Industries by Sex in Ruckersville
The Ruckersville industries that see more men than women are Agriculture, Fishing & Hunting (100.0%), Construction (100.0%), and Manufacturing (100.0%), whereas the industries that tend to have a higher number of women are Finance & Insurance (100.0%), Accommodation & Food Services (100.0%), and Health Care & Social Assistance (96.5%).
| Industry | Male | Female |
| Agriculture, Fishing & Hunting | 24 (100.0%) | 0 (0.0%) |
| Mining, Quarrying, & Extraction | 0 (0.0%) | 0 (0.0%) |
| Construction | 39 (100.0%) | 0 (0.0%) |
| Manufacturing | 14 (100.0%) | 0 (0.0%) |
| Wholesale Trade | 20 (100.0%) | 0 (0.0%) |
| Retail Trade | 22 (100.0%) | 0 (0.0%) |
| Transportation & Warehousing | 0 (0.0%) | 0 (0.0%) |
| Utilities | 0 (0.0%) | 0 (0.0%) |
| Information | 0 (0.0%) | 0 (0.0%) |
| Finance & Insurance | 0 (0.0%) | 10 (100.0%) |
| Real Estate, Rental & Leasing | 0 (0.0%) | 0 (0.0%) |
| Professional & Scientific | 15 (26.3%) | 42 (73.7%) |
| Enterprise Management | 0 (0.0%) | 0 (0.0%) |
| Administrative & Support | 0 (0.0%) | 0 (0.0%) |
| Educational Services | 42 (35.6%) | 76 (64.4%) |
| Health Care & Social Assistance | 7 (3.5%) | 193 (96.5%) |
| Arts, Entertainment & Recreation | 0 (0.0%) | 0 (0.0%) |
| Accommodation & Food Services | 0 (0.0%) | 60 (100.0%) |
| Public Administration | 45 (73.8%) | 16 (26.2%) |
| Total | 286 (40.4%) | 422 (59.6%) |
Education in Ruckersville
School Enrollment in Ruckersville
The most common levels of schooling among the 399 students in Ruckersville are high school (134 | 33.6%), elementary school (112 | 28.1%), and middle school (84 | 21.0%).
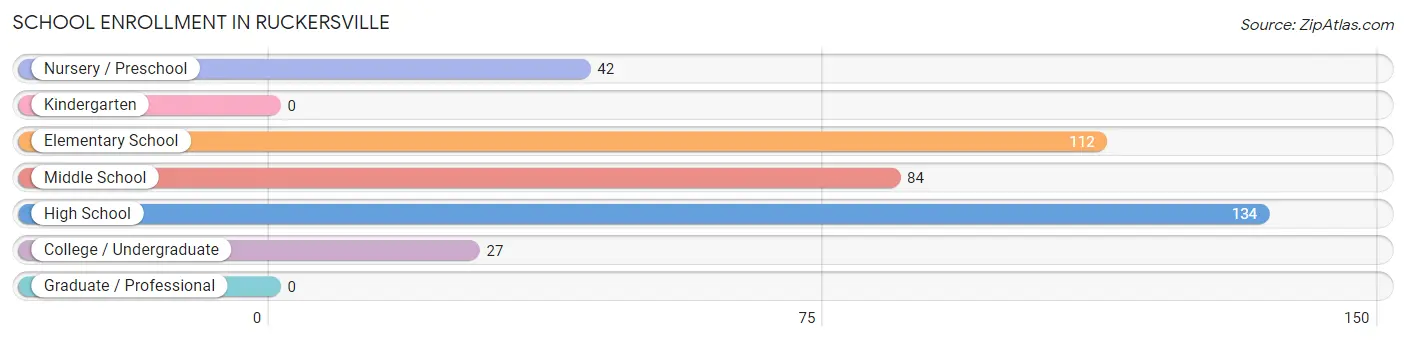
| School Level | # Students | % Students |
| Nursery / Preschool | 42 | 10.5% |
| Kindergarten | 0 | 0.0% |
| Elementary School | 112 | 28.1% |
| Middle School | 84 | 21.0% |
| High School | 134 | 33.6% |
| College / Undergraduate | 27 | 6.8% |
| Graduate / Professional | 0 | 0.0% |
| Total | 399 | 100.0% |
School Enrollment by Age by Funding Source in Ruckersville
Out of a total of 399 students who are enrolled in schools in Ruckersville, 70 (17.5%) attend a private institution, while the remaining 329 (82.5%) are enrolled in public schools. The age group of 15 to 17 year olds has the highest likelihood of being enrolled in private schools, with 31 (23.1% in the age bracket) enrolled. Conversely, the age group of 3 to 4 year olds has the lowest likelihood of being enrolled in a private school, with 23 (100.0% in the age bracket) attending a public institution.
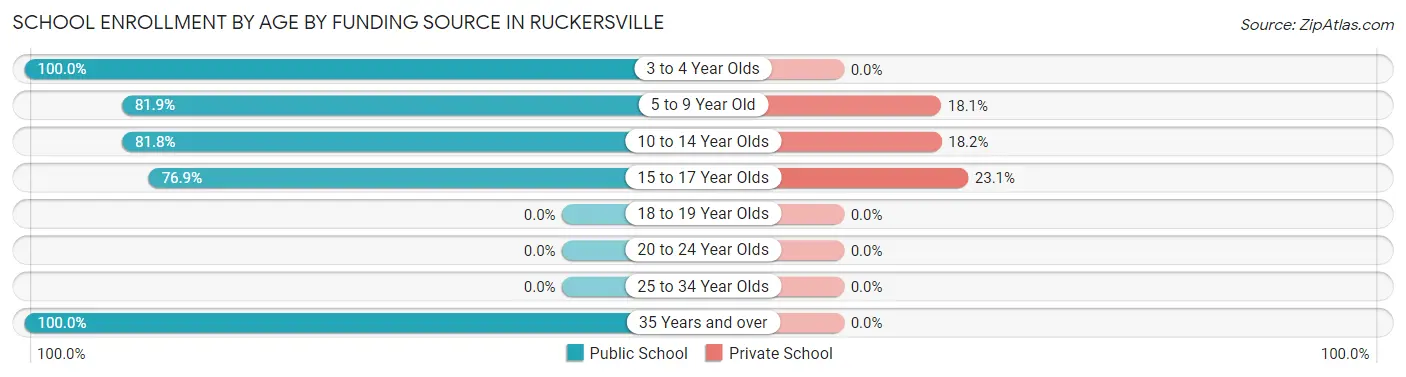
| Age Bracket | Public School | Private School |
| 3 to 4 Year Olds | 23 (100.0%) | 0 (0.0%) |
| 5 to 9 Year Old | 86 (81.9%) | 19 (18.1%) |
| 10 to 14 Year Olds | 90 (81.8%) | 20 (18.2%) |
| 15 to 17 Year Olds | 103 (76.9%) | 31 (23.1%) |
| 18 to 19 Year Olds | 0 (0.0%) | 0 (0.0%) |
| 20 to 24 Year Olds | 0 (0.0%) | 0 (0.0%) |
| 25 to 34 Year Olds | 0 (0.0%) | 0 (0.0%) |
| 35 Years and over | 27 (100.0%) | 0 (0.0%) |
| Total | 329 (82.5%) | 70 (17.5%) |
Educational Attainment by Field of Study in Ruckersville
Education (56 | 17.8%), physical & health sciences (39 | 12.4%), engineering (35 | 11.2%), multidisciplinary studies (34 | 10.8%), and computers & mathematics (24 | 7.6%) are the most common fields of study among 314 individuals in Ruckersville who have obtained a bachelor's degree or higher.
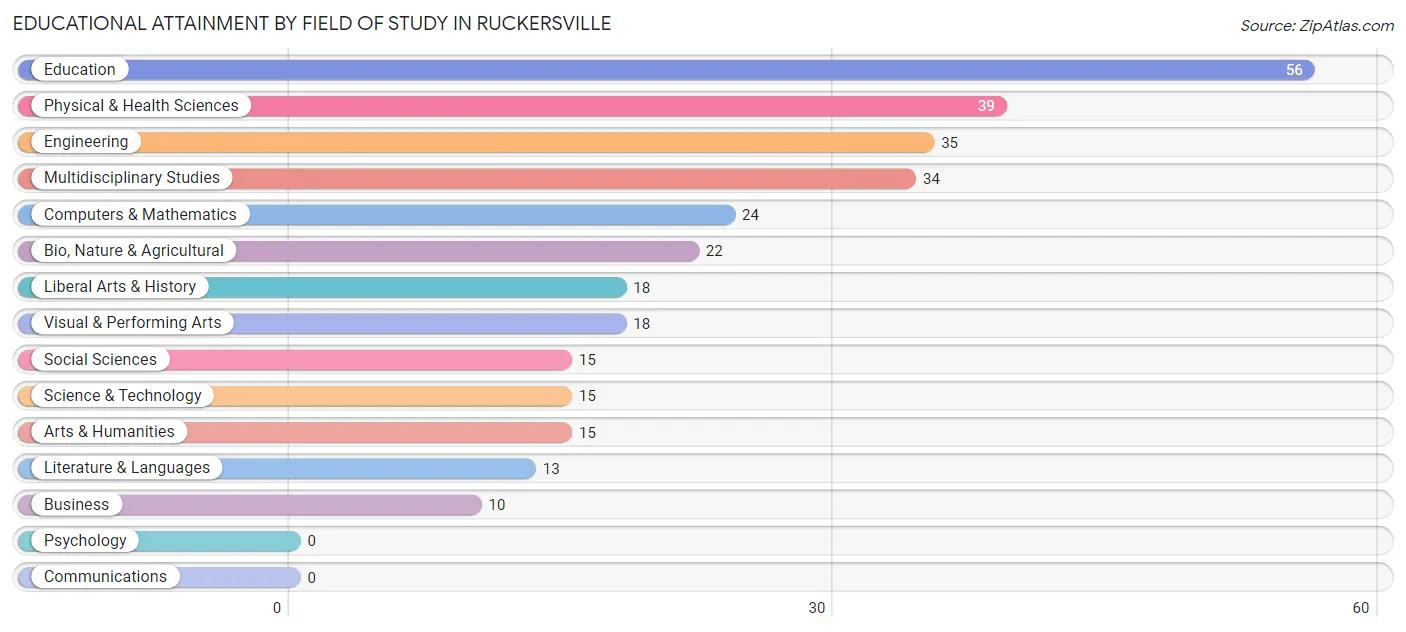
| Field of Study | # Graduates | % Graduates |
| Computers & Mathematics | 24 | 7.6% |
| Bio, Nature & Agricultural | 22 | 7.0% |
| Physical & Health Sciences | 39 | 12.4% |
| Psychology | 0 | 0.0% |
| Social Sciences | 15 | 4.8% |
| Engineering | 35 | 11.2% |
| Multidisciplinary Studies | 34 | 10.8% |
| Science & Technology | 15 | 4.8% |
| Business | 10 | 3.2% |
| Education | 56 | 17.8% |
| Literature & Languages | 13 | 4.1% |
| Liberal Arts & History | 18 | 5.7% |
| Visual & Performing Arts | 18 | 5.7% |
| Communications | 0 | 0.0% |
| Arts & Humanities | 15 | 4.8% |
| Total | 314 | 100.0% |
Transportation & Commute in Ruckersville
Vehicle Availability by Sex in Ruckersville
The most prevalent vehicle ownership categories in Ruckersville are males with 3 vehicles (126, accounting for 45.8%) and females with 3 vehicles (139, making up 29.9%).
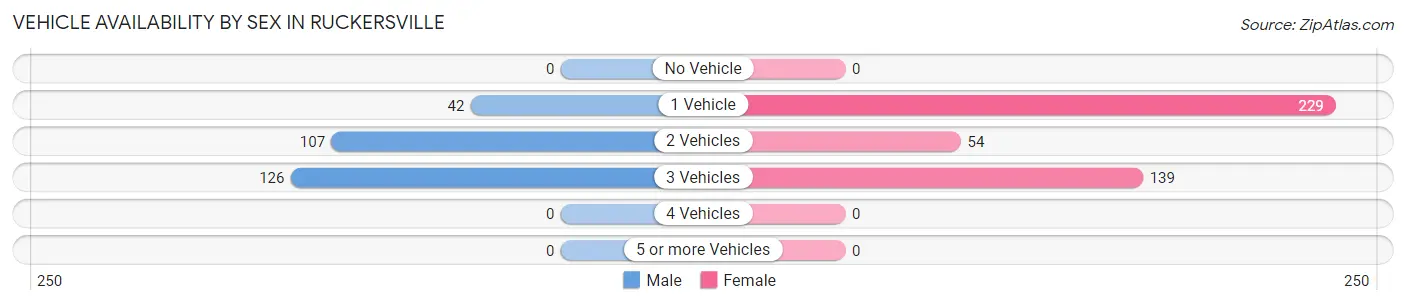
| Vehicles Available | Male | Female |
| No Vehicle | 0 (0.0%) | 0 (0.0%) |
| 1 Vehicle | 42 (15.3%) | 229 (54.3%) |
| 2 Vehicles | 107 (38.9%) | 54 (12.8%) |
| 3 Vehicles | 126 (45.8%) | 139 (32.9%) |
| 4 Vehicles | 0 (0.0%) | 0 (0.0%) |
| 5 or more Vehicles | 0 (0.0%) | 0 (0.0%) |
| Total | 275 (100.0%) | 422 (100.0%) |
Commute Time in Ruckersville
The most frequently occuring commute durations in Ruckersville are 20 to 24 minutes (117 commuters, 19.4%), 10 to 14 minutes (112 commuters, 18.6%), and 25 to 29 minutes (97 commuters, 16.1%).
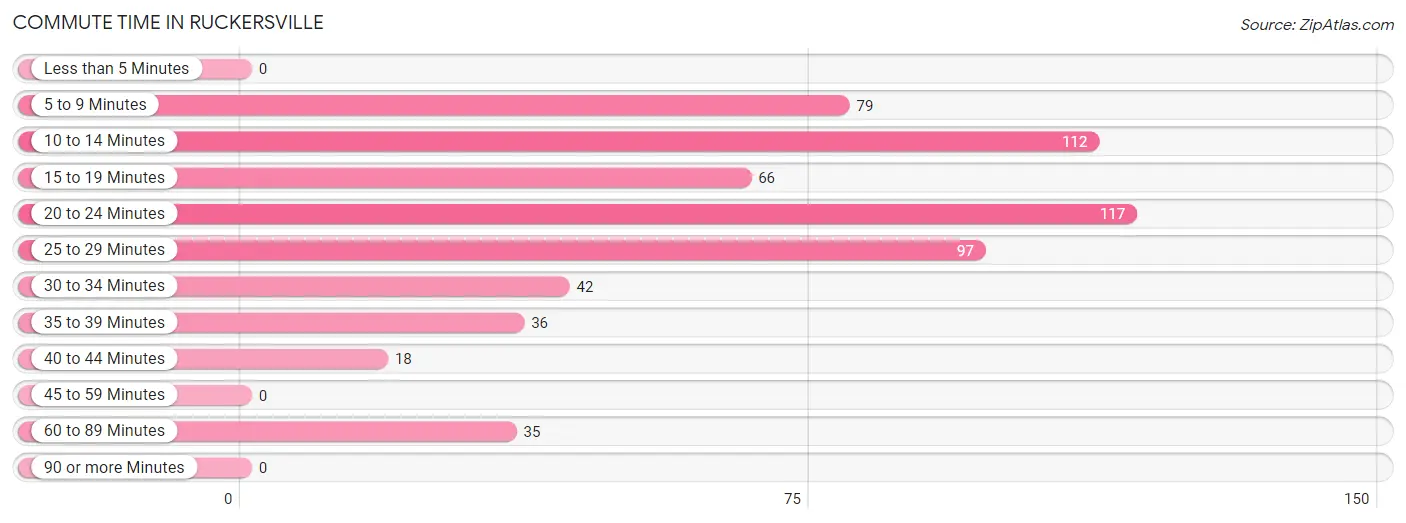
| Commute Time | # Commuters | % Commuters |
| Less than 5 Minutes | 0 | 0.0% |
| 5 to 9 Minutes | 79 | 13.1% |
| 10 to 14 Minutes | 112 | 18.6% |
| 15 to 19 Minutes | 66 | 11.0% |
| 20 to 24 Minutes | 117 | 19.4% |
| 25 to 29 Minutes | 97 | 16.1% |
| 30 to 34 Minutes | 42 | 7.0% |
| 35 to 39 Minutes | 36 | 6.0% |
| 40 to 44 Minutes | 18 | 3.0% |
| 45 to 59 Minutes | 0 | 0.0% |
| 60 to 89 Minutes | 35 | 5.8% |
| 90 or more Minutes | 0 | 0.0% |
Commute Time by Sex in Ruckersville
The most common commute times in Ruckersville are 10 to 14 minutes (90 commuters, 32.7%) for males and 25 to 29 minutes (97 commuters, 29.7%) for females.
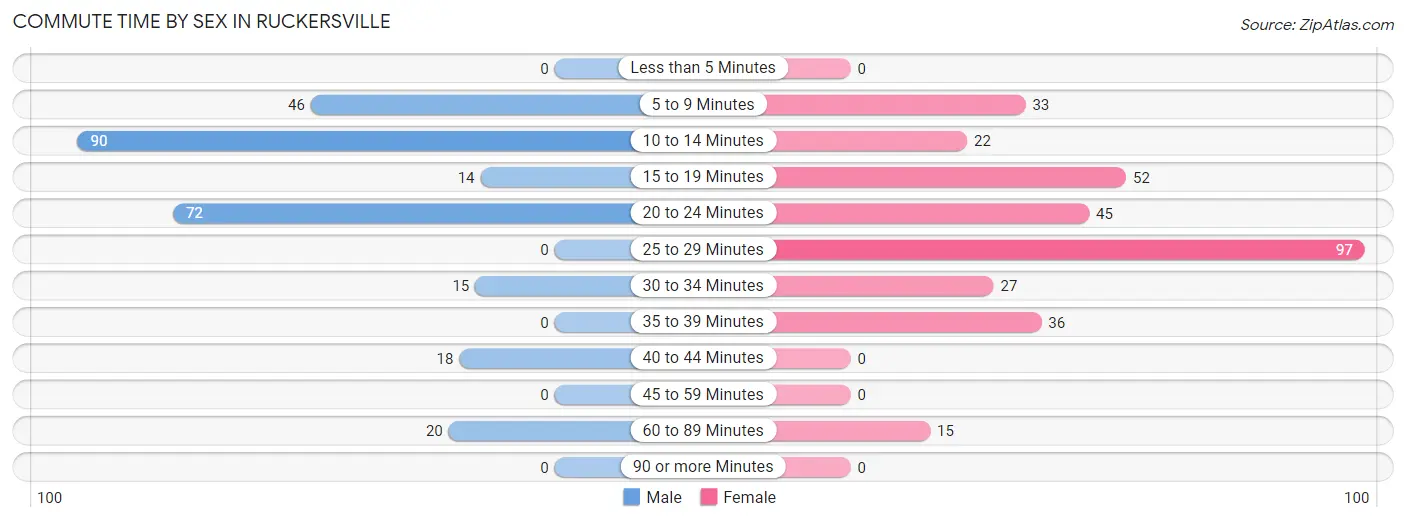
| Commute Time | Male | Female |
| Less than 5 Minutes | 0 (0.0%) | 0 (0.0%) |
| 5 to 9 Minutes | 46 (16.7%) | 33 (10.1%) |
| 10 to 14 Minutes | 90 (32.7%) | 22 (6.7%) |
| 15 to 19 Minutes | 14 (5.1%) | 52 (15.9%) |
| 20 to 24 Minutes | 72 (26.2%) | 45 (13.8%) |
| 25 to 29 Minutes | 0 (0.0%) | 97 (29.7%) |
| 30 to 34 Minutes | 15 (5.4%) | 27 (8.3%) |
| 35 to 39 Minutes | 0 (0.0%) | 36 (11.0%) |
| 40 to 44 Minutes | 18 (6.6%) | 0 (0.0%) |
| 45 to 59 Minutes | 0 (0.0%) | 0 (0.0%) |
| 60 to 89 Minutes | 20 (7.3%) | 15 (4.6%) |
| 90 or more Minutes | 0 (0.0%) | 0 (0.0%) |
Time of Departure to Work by Sex in Ruckersville
The most frequent times of departure to work in Ruckersville are 9:00 AM to 9:59 AM (72, 26.2%) for males and 8:30 AM to 8:59 AM (110, 33.6%) for females.
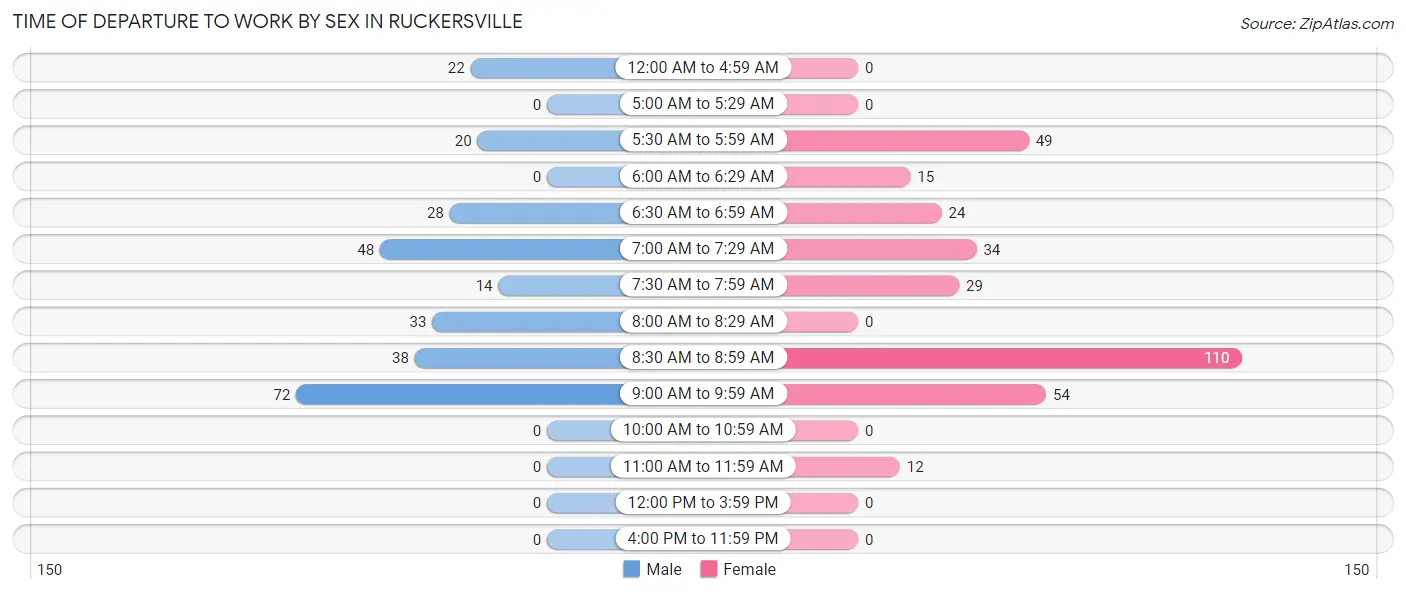
| Time of Departure | Male | Female |
| 12:00 AM to 4:59 AM | 22 (8.0%) | 0 (0.0%) |
| 5:00 AM to 5:29 AM | 0 (0.0%) | 0 (0.0%) |
| 5:30 AM to 5:59 AM | 20 (7.3%) | 49 (15.0%) |
| 6:00 AM to 6:29 AM | 0 (0.0%) | 15 (4.6%) |
| 6:30 AM to 6:59 AM | 28 (10.2%) | 24 (7.3%) |
| 7:00 AM to 7:29 AM | 48 (17.4%) | 34 (10.4%) |
| 7:30 AM to 7:59 AM | 14 (5.1%) | 29 (8.9%) |
| 8:00 AM to 8:29 AM | 33 (12.0%) | 0 (0.0%) |
| 8:30 AM to 8:59 AM | 38 (13.8%) | 110 (33.6%) |
| 9:00 AM to 9:59 AM | 72 (26.2%) | 54 (16.5%) |
| 10:00 AM to 10:59 AM | 0 (0.0%) | 0 (0.0%) |
| 11:00 AM to 11:59 AM | 0 (0.0%) | 12 (3.7%) |
| 12:00 PM to 3:59 PM | 0 (0.0%) | 0 (0.0%) |
| 4:00 PM to 11:59 PM | 0 (0.0%) | 0 (0.0%) |
| Total | 275 (100.0%) | 327 (100.0%) |
Housing Occupancy in Ruckersville
Occupancy by Ownership in Ruckersville
Of the total 423 dwellings in Ruckersville, owner-occupied units account for 323 (76.4%), while renter-occupied units make up 100 (23.6%).
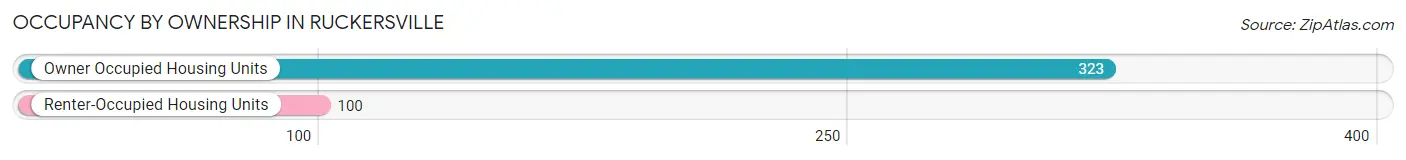
| Occupancy | # Housing Units | % Housing Units |
| Owner Occupied Housing Units | 323 | 76.4% |
| Renter-Occupied Housing Units | 100 | 23.6% |
| Total Occupied Housing Units | 423 | 100.0% |
Occupancy by Household Size in Ruckersville
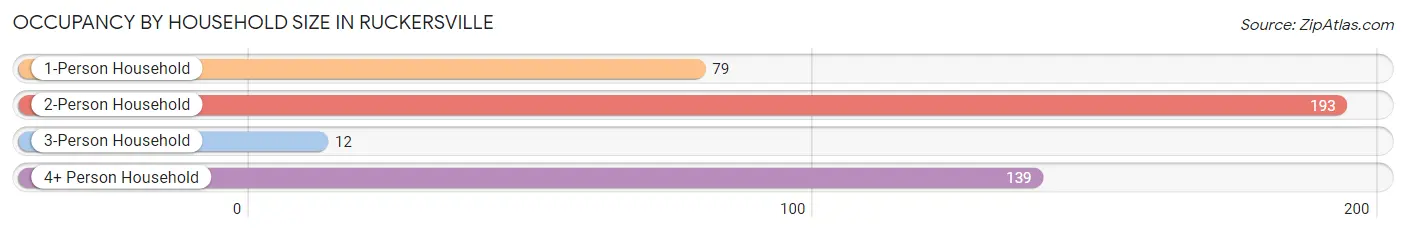
| Household Size | # Housing Units | % Housing Units |
| 1-Person Household | 79 | 18.7% |
| 2-Person Household | 193 | 45.6% |
| 3-Person Household | 12 | 2.8% |
| 4+ Person Household | 139 | 32.9% |
| Total Housing Units | 423 | 100.0% |
Occupancy by Ownership by Household Size in Ruckersville
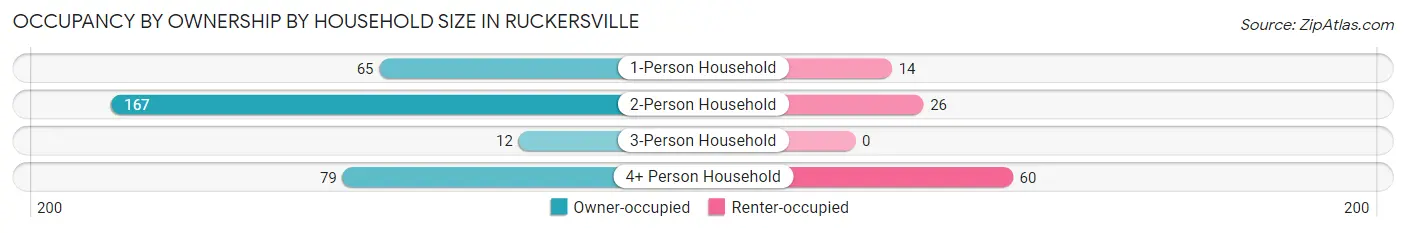
| Household Size | Owner-occupied | Renter-occupied |
| 1-Person Household | 65 (82.3%) | 14 (17.7%) |
| 2-Person Household | 167 (86.5%) | 26 (13.5%) |
| 3-Person Household | 12 (100.0%) | 0 (0.0%) |
| 4+ Person Household | 79 (56.8%) | 60 (43.2%) |
| Total Housing Units | 323 (76.4%) | 100 (23.6%) |
Occupancy by Educational Attainment in Ruckersville
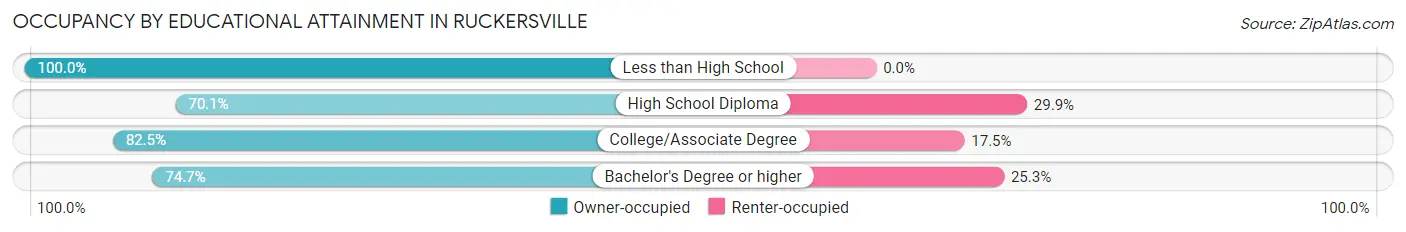
| Household Size | Owner-occupied | Renter-occupied |
| Less than High School | 12 (100.0%) | 0 (0.0%) |
| High School Diploma | 61 (70.1%) | 26 (29.9%) |
| College/Associate Degree | 85 (82.5%) | 18 (17.5%) |
| Bachelor's Degree or higher | 165 (74.7%) | 56 (25.3%) |
Occupancy by Age of Householder in Ruckersville
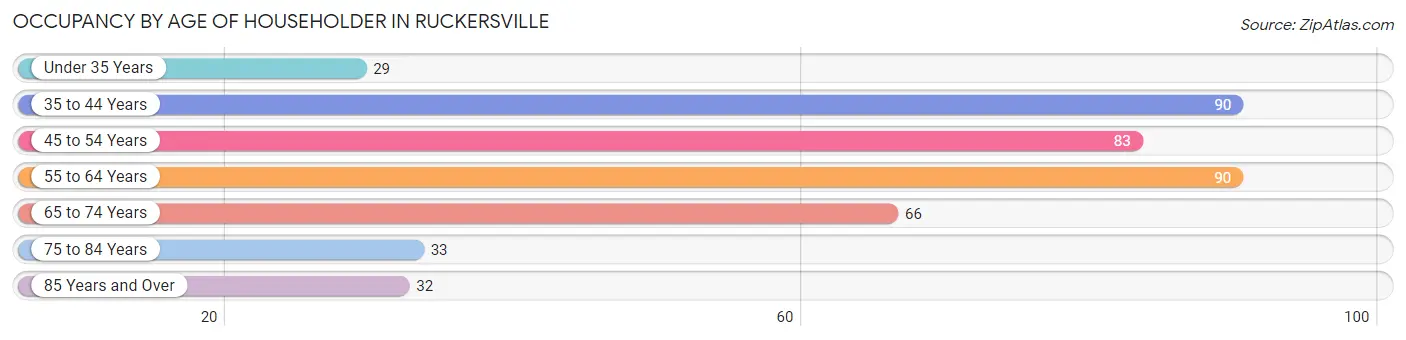
| Age Bracket | # Households | % Households |
| Under 35 Years | 29 | 6.9% |
| 35 to 44 Years | 90 | 21.3% |
| 45 to 54 Years | 83 | 19.6% |
| 55 to 64 Years | 90 | 21.3% |
| 65 to 74 Years | 66 | 15.6% |
| 75 to 84 Years | 33 | 7.8% |
| 85 Years and Over | 32 | 7.6% |
| Total | 423 | 100.0% |
Housing Finances in Ruckersville
Median Income by Occupancy in Ruckersville
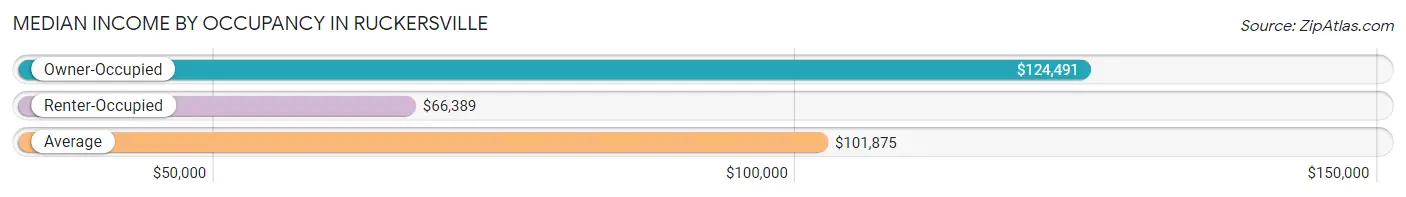
| Occupancy Type | # Households | Median Income |
| Owner-Occupied | 323 (76.4%) | $124,491 |
| Renter-Occupied | 100 (23.6%) | $66,389 |
| Average | 423 (100.0%) | $101,875 |
Occupancy by Householder Income Bracket in Ruckersville
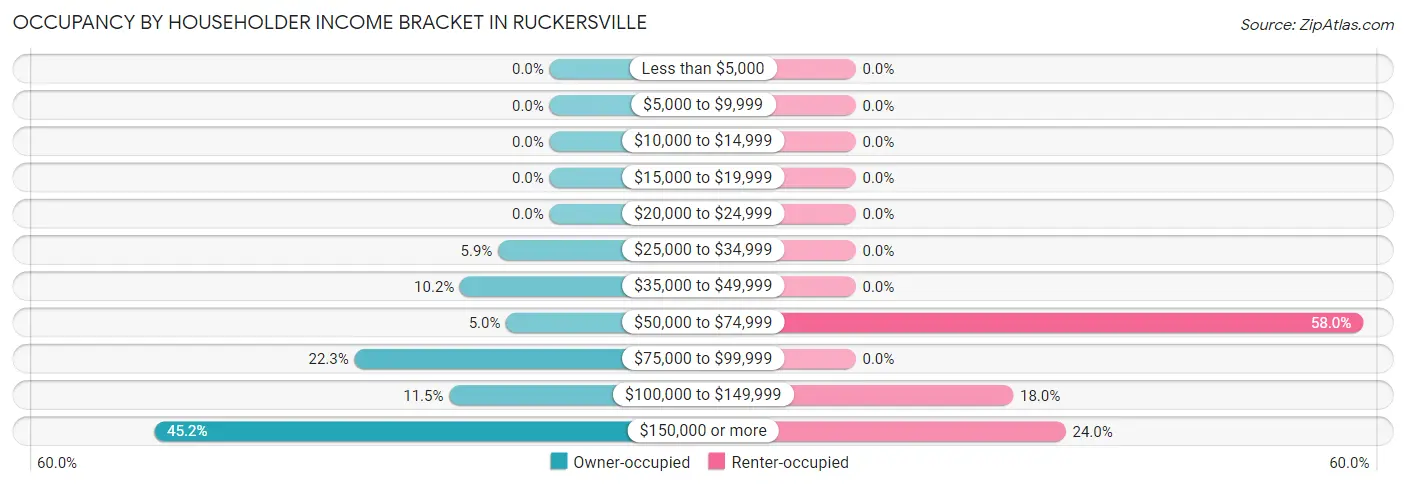
| Income Bracket | Owner-occupied | Renter-occupied |
| Less than $5,000 | 0 (0.0%) | 0 (0.0%) |
| $5,000 to $9,999 | 0 (0.0%) | 0 (0.0%) |
| $10,000 to $14,999 | 0 (0.0%) | 0 (0.0%) |
| $15,000 to $19,999 | 0 (0.0%) | 0 (0.0%) |
| $20,000 to $24,999 | 0 (0.0%) | 0 (0.0%) |
| $25,000 to $34,999 | 19 (5.9%) | 0 (0.0%) |
| $35,000 to $49,999 | 33 (10.2%) | 0 (0.0%) |
| $50,000 to $74,999 | 16 (5.0%) | 58 (58.0%) |
| $75,000 to $99,999 | 72 (22.3%) | 0 (0.0%) |
| $100,000 to $149,999 | 37 (11.5%) | 18 (18.0%) |
| $150,000 or more | 146 (45.2%) | 24 (24.0%) |
| Total | 323 (100.0%) | 100 (100.0%) |
Monthly Housing Cost Tiers in Ruckersville
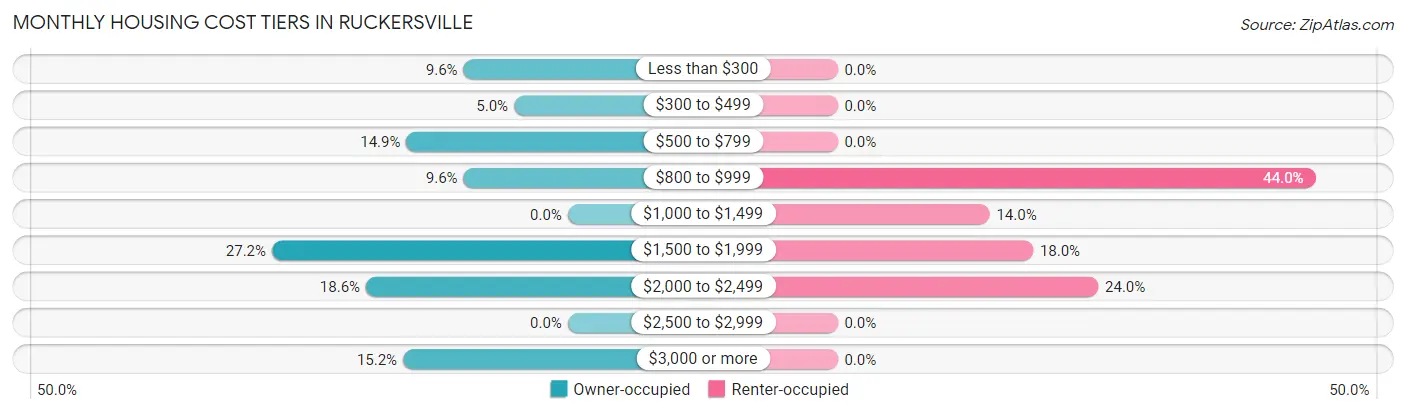
| Monthly Cost | Owner-occupied | Renter-occupied |
| Less than $300 | 31 (9.6%) | 0 (0.0%) |
| $300 to $499 | 16 (5.0%) | 0 (0.0%) |
| $500 to $799 | 48 (14.9%) | 0 (0.0%) |
| $800 to $999 | 31 (9.6%) | 44 (44.0%) |
| $1,000 to $1,499 | 0 (0.0%) | 14 (14.0%) |
| $1,500 to $1,999 | 88 (27.2%) | 18 (18.0%) |
| $2,000 to $2,499 | 60 (18.6%) | 24 (24.0%) |
| $2,500 to $2,999 | 0 (0.0%) | 0 (0.0%) |
| $3,000 or more | 49 (15.2%) | 0 (0.0%) |
| Total | 323 (100.0%) | 100 (100.0%) |
Physical Housing Characteristics in Ruckersville
Housing Structures in Ruckersville
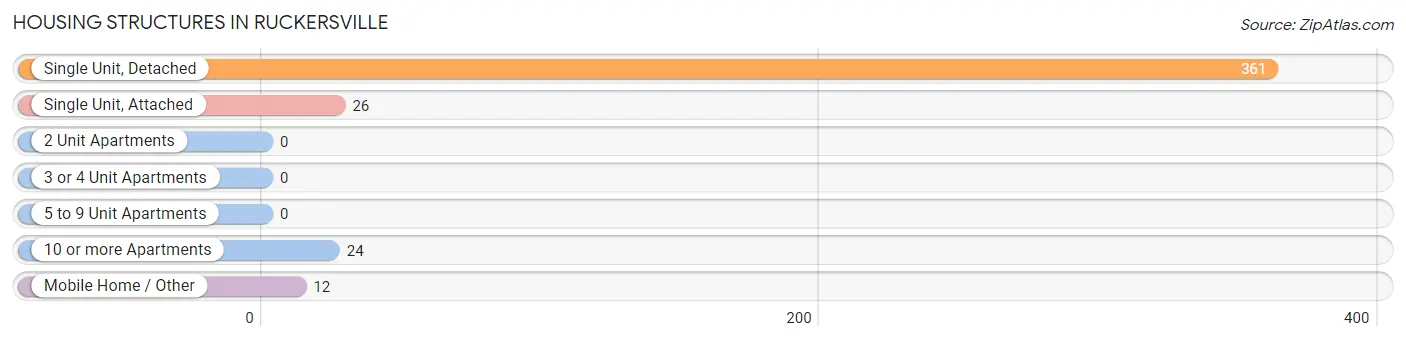
| Structure Type | # Housing Units | % Housing Units |
| Single Unit, Detached | 361 | 85.3% |
| Single Unit, Attached | 26 | 6.1% |
| 2 Unit Apartments | 0 | 0.0% |
| 3 or 4 Unit Apartments | 0 | 0.0% |
| 5 to 9 Unit Apartments | 0 | 0.0% |
| 10 or more Apartments | 24 | 5.7% |
| Mobile Home / Other | 12 | 2.8% |
| Total | 423 | 100.0% |
Housing Structures by Occupancy in Ruckersville
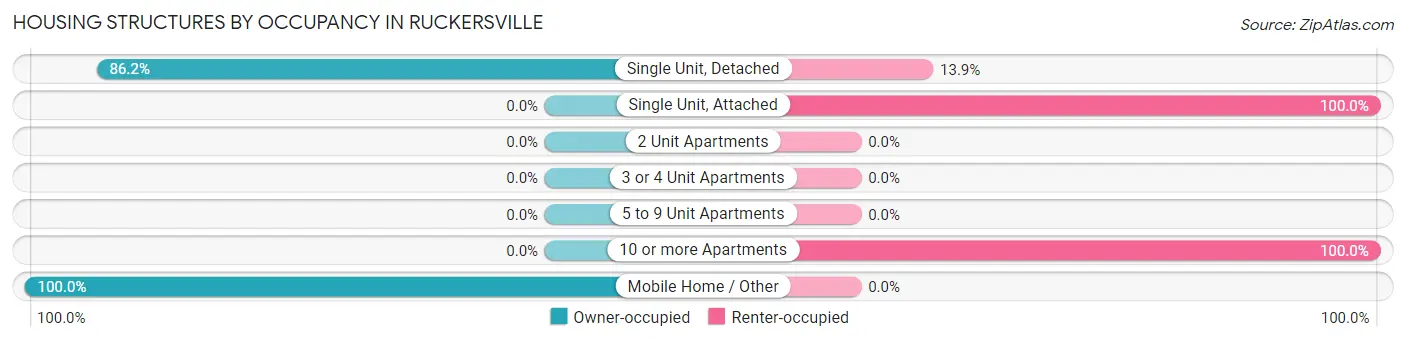
| Structure Type | Owner-occupied | Renter-occupied |
| Single Unit, Detached | 311 (86.2%) | 50 (13.9%) |
| Single Unit, Attached | 0 (0.0%) | 26 (100.0%) |
| 2 Unit Apartments | 0 (0.0%) | 0 (0.0%) |
| 3 or 4 Unit Apartments | 0 (0.0%) | 0 (0.0%) |
| 5 to 9 Unit Apartments | 0 (0.0%) | 0 (0.0%) |
| 10 or more Apartments | 0 (0.0%) | 24 (100.0%) |
| Mobile Home / Other | 12 (100.0%) | 0 (0.0%) |
| Total | 323 (76.4%) | 100 (23.6%) |
Housing Structures by Number of Rooms in Ruckersville
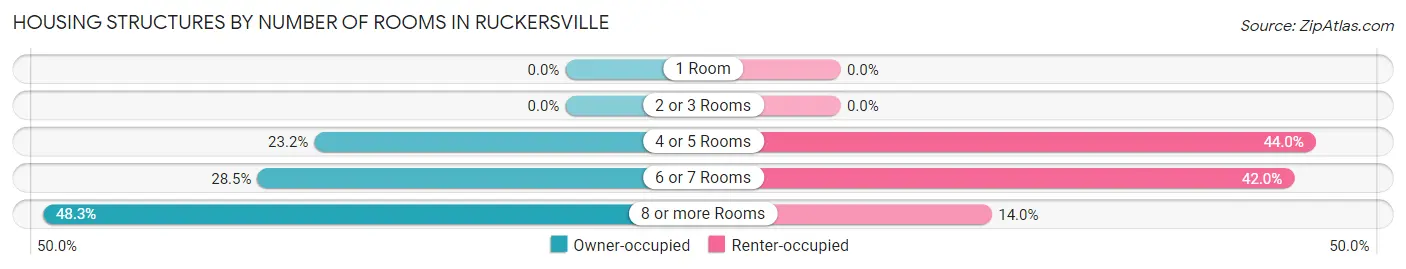
| Number of Rooms | Owner-occupied | Renter-occupied |
| 1 Room | 0 (0.0%) | 0 (0.0%) |
| 2 or 3 Rooms | 0 (0.0%) | 0 (0.0%) |
| 4 or 5 Rooms | 75 (23.2%) | 44 (44.0%) |
| 6 or 7 Rooms | 92 (28.5%) | 42 (42.0%) |
| 8 or more Rooms | 156 (48.3%) | 14 (14.0%) |
| Total | 323 (100.0%) | 100 (100.0%) |
Housing Structure by Heating Type in Ruckersville
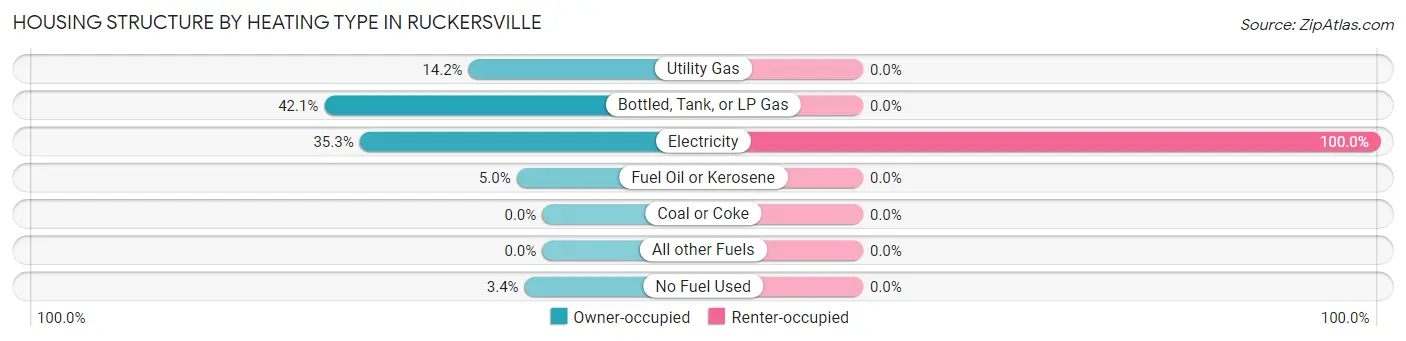
| Heating Type | Owner-occupied | Renter-occupied |
| Utility Gas | 46 (14.2%) | 0 (0.0%) |
| Bottled, Tank, or LP Gas | 136 (42.1%) | 0 (0.0%) |
| Electricity | 114 (35.3%) | 100 (100.0%) |
| Fuel Oil or Kerosene | 16 (5.0%) | 0 (0.0%) |
| Coal or Coke | 0 (0.0%) | 0 (0.0%) |
| All other Fuels | 0 (0.0%) | 0 (0.0%) |
| No Fuel Used | 11 (3.4%) | 0 (0.0%) |
| Total | 323 (100.0%) | 100 (100.0%) |
Household Vehicle Usage in Ruckersville
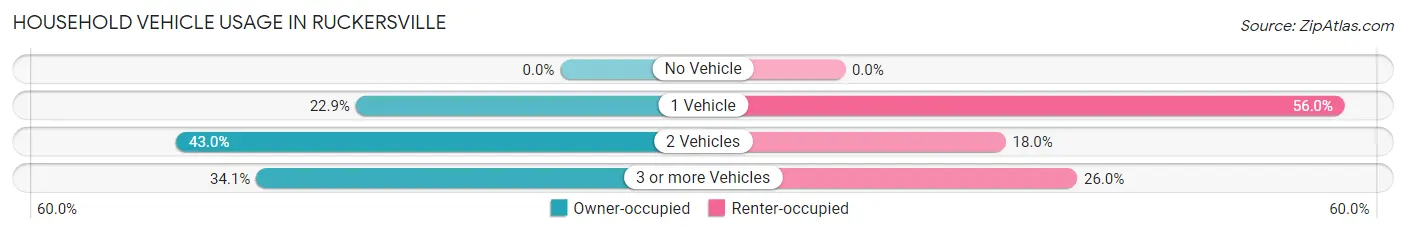
| Vehicles per Household | Owner-occupied | Renter-occupied |
| No Vehicle | 0 (0.0%) | 0 (0.0%) |
| 1 Vehicle | 74 (22.9%) | 56 (56.0%) |
| 2 Vehicles | 139 (43.0%) | 18 (18.0%) |
| 3 or more Vehicles | 110 (34.1%) | 26 (26.0%) |
| Total | 323 (100.0%) | 100 (100.0%) |
Real Estate & Mortgages in Ruckersville
Real Estate and Mortgage Overview in Ruckersville
| Characteristic | Without Mortgage | With Mortgage |
| Housing Units | 97 | 226 |
| Median Property Value | $363,500 | $376,300 |
| Median Household Income | $69,766 | $119 |
| Monthly Housing Costs | $557 | $49 |
| Real Estate Taxes | $2,232 | $0 |
Property Value by Mortgage Status in Ruckersville
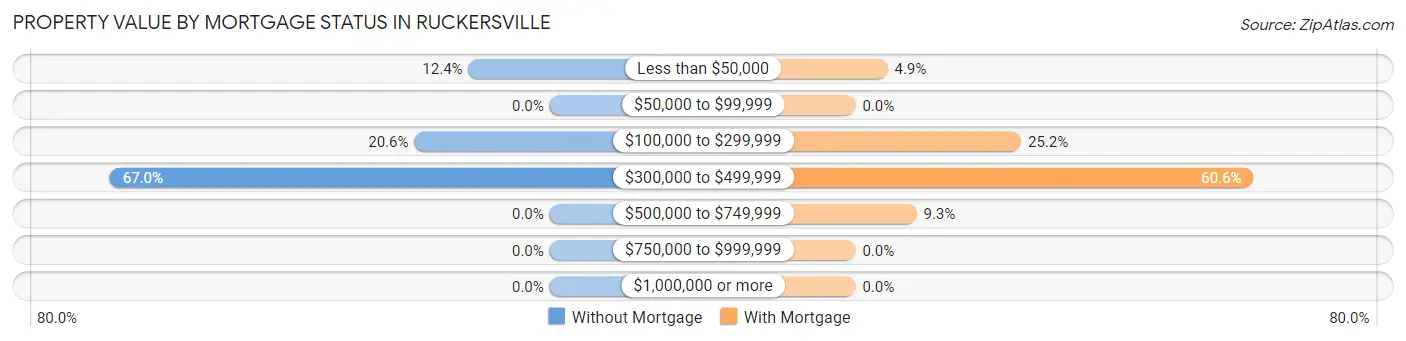
| Property Value | Without Mortgage | With Mortgage |
| Less than $50,000 | 12 (12.4%) | 11 (4.9%) |
| $50,000 to $99,999 | 0 (0.0%) | 0 (0.0%) |
| $100,000 to $299,999 | 20 (20.6%) | 57 (25.2%) |
| $300,000 to $499,999 | 65 (67.0%) | 137 (60.6%) |
| $500,000 to $749,999 | 0 (0.0%) | 21 (9.3%) |
| $750,000 to $999,999 | 0 (0.0%) | 0 (0.0%) |
| $1,000,000 or more | 0 (0.0%) | 0 (0.0%) |
| Total | 97 (100.0%) | 226 (100.0%) |
Household Income by Mortgage Status in Ruckersville
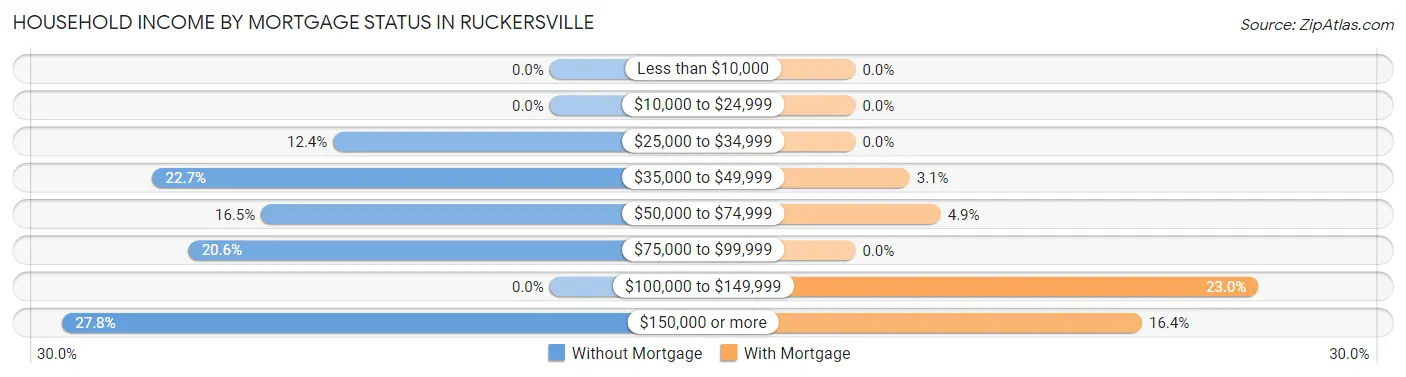
| Household Income | Without Mortgage | With Mortgage |
| Less than $10,000 | 0 (0.0%) | 0 (0.0%) |
| $10,000 to $24,999 | 0 (0.0%) | 0 (0.0%) |
| $25,000 to $34,999 | 12 (12.4%) | 0 (0.0%) |
| $35,000 to $49,999 | 22 (22.7%) | 7 (3.1%) |
| $50,000 to $74,999 | 16 (16.5%) | 11 (4.9%) |
| $75,000 to $99,999 | 20 (20.6%) | 0 (0.0%) |
| $100,000 to $149,999 | 0 (0.0%) | 52 (23.0%) |
| $150,000 or more | 27 (27.8%) | 37 (16.4%) |
| Total | 97 (100.0%) | 226 (100.0%) |
Property Value to Household Income Ratio in Ruckersville
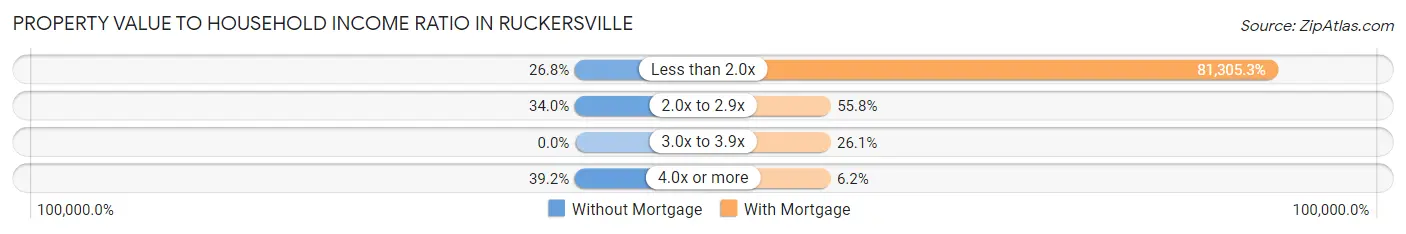
| Value-to-Income Ratio | Without Mortgage | With Mortgage |
| Less than 2.0x | 26 (26.8%) | 183,750 (81,305.3%) |
| 2.0x to 2.9x | 33 (34.0%) | 126 (55.7%) |
| 3.0x to 3.9x | 0 (0.0%) | 59 (26.1%) |
| 4.0x or more | 38 (39.2%) | 14 (6.2%) |
| Total | 97 (100.0%) | 226 (100.0%) |
Real Estate Taxes by Mortgage Status in Ruckersville
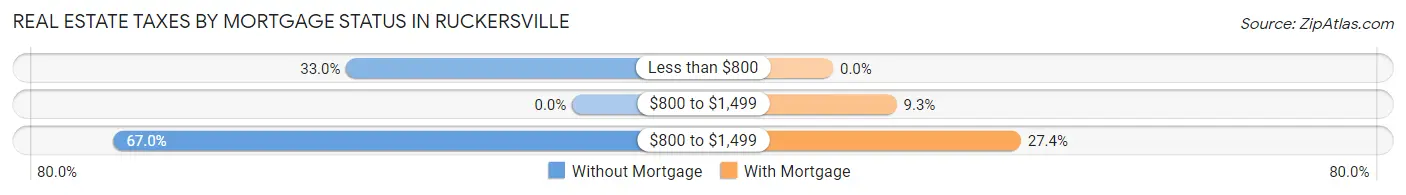
| Property Taxes | Without Mortgage | With Mortgage |
| Less than $800 | 32 (33.0%) | 0 (0.0%) |
| $800 to $1,499 | 0 (0.0%) | 21 (9.3%) |
| $800 to $1,499 | 65 (67.0%) | 62 (27.4%) |
| Total | 97 (100.0%) | 226 (100.0%) |
Health & Disability in Ruckersville
Health Insurance Coverage by Age in Ruckersville
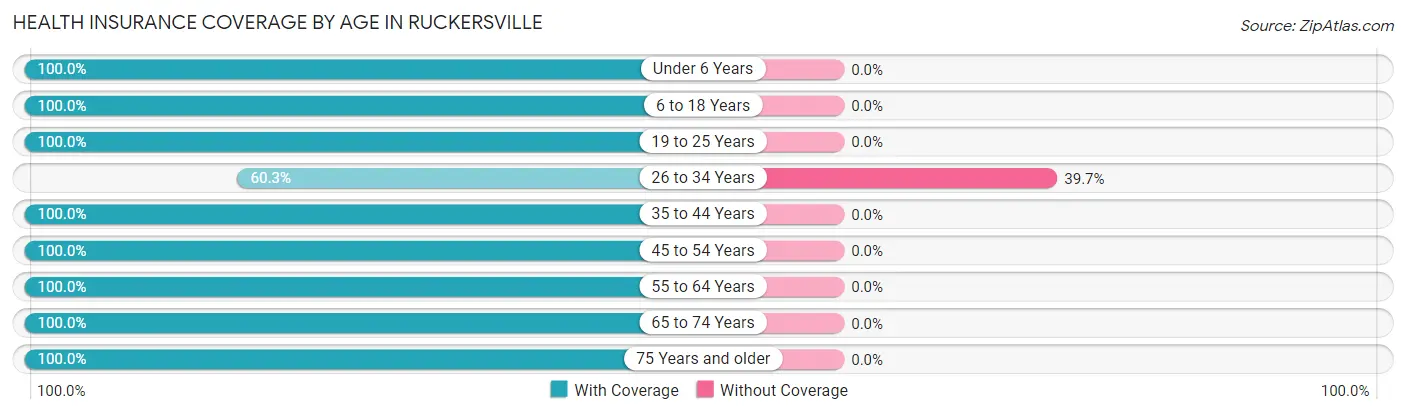
| Age Bracket | With Coverage | Without Coverage |
| Under 6 Years | 66 (100.0%) | 0 (0.0%) |
| 6 to 18 Years | 330 (100.0%) | 0 (0.0%) |
| 19 to 25 Years | 120 (100.0%) | 0 (0.0%) |
| 26 to 34 Years | 44 (60.3%) | 29 (39.7%) |
| 35 to 44 Years | 164 (100.0%) | 0 (0.0%) |
| 45 to 54 Years | 124 (100.0%) | 0 (0.0%) |
| 55 to 64 Years | 160 (100.0%) | 0 (0.0%) |
| 65 to 74 Years | 158 (100.0%) | 0 (0.0%) |
| 75 Years and older | 80 (100.0%) | 0 (0.0%) |
| Total | 1,246 (97.7%) | 29 (2.3%) |
Health Insurance Coverage by Citizenship Status in Ruckersville
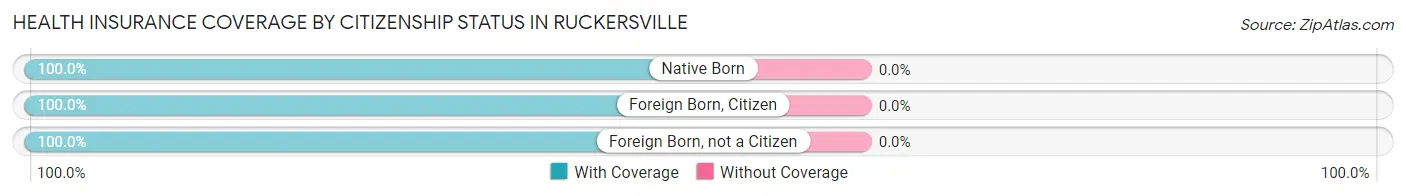
| Citizenship Status | With Coverage | Without Coverage |
| Native Born | 66 (100.0%) | 0 (0.0%) |
| Foreign Born, Citizen | 330 (100.0%) | 0 (0.0%) |
| Foreign Born, not a Citizen | 120 (100.0%) | 0 (0.0%) |
Health Insurance Coverage by Household Income in Ruckersville
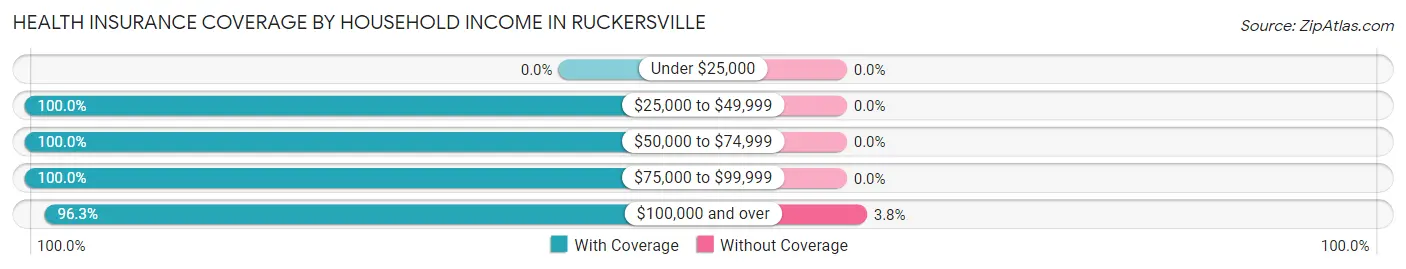
| Household Income | With Coverage | Without Coverage |
| Under $25,000 | 0 (0.0%) | 0 (0.0%) |
| $25,000 to $49,999 | 62 (100.0%) | 0 (0.0%) |
| $50,000 to $74,999 | 238 (100.0%) | 0 (0.0%) |
| $75,000 to $99,999 | 202 (100.0%) | 0 (0.0%) |
| $100,000 and over | 744 (96.3%) | 29 (3.7%) |
Public vs Private Health Insurance Coverage by Age in Ruckersville
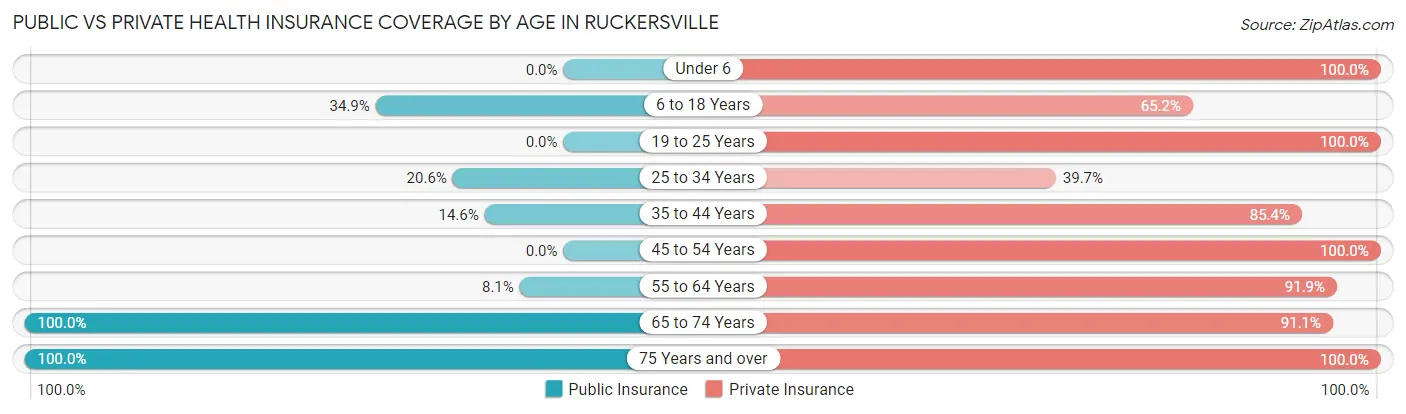
| Age Bracket | Public Insurance | Private Insurance |
| Under 6 | 0 (0.0%) | 66 (100.0%) |
| 6 to 18 Years | 115 (34.8%) | 215 (65.1%) |
| 19 to 25 Years | 0 (0.0%) | 120 (100.0%) |
| 25 to 34 Years | 15 (20.5%) | 29 (39.7%) |
| 35 to 44 Years | 24 (14.6%) | 140 (85.4%) |
| 45 to 54 Years | 0 (0.0%) | 124 (100.0%) |
| 55 to 64 Years | 13 (8.1%) | 147 (91.9%) |
| 65 to 74 Years | 158 (100.0%) | 144 (91.1%) |
| 75 Years and over | 80 (100.0%) | 80 (100.0%) |
| Total | 405 (31.8%) | 1,065 (83.5%) |
Disability Status by Sex by Age in Ruckersville
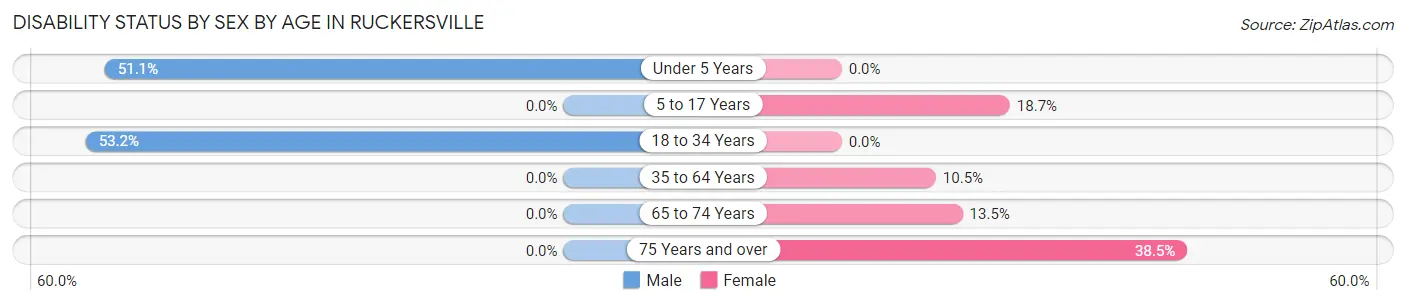
| Age Bracket | Male | Female |
| Under 5 Years | 24 (51.1%) | 0 (0.0%) |
| 5 to 17 Years | 0 (0.0%) | 38 (18.7%) |
| 18 to 34 Years | 25 (53.2%) | 0 (0.0%) |
| 35 to 64 Years | 0 (0.0%) | 24 (10.5%) |
| 65 to 74 Years | 0 (0.0%) | 14 (13.5%) |
| 75 Years and over | 0 (0.0%) | 15 (38.5%) |
Disability Class by Sex by Age in Ruckersville
Disability Class: Hearing Difficulty
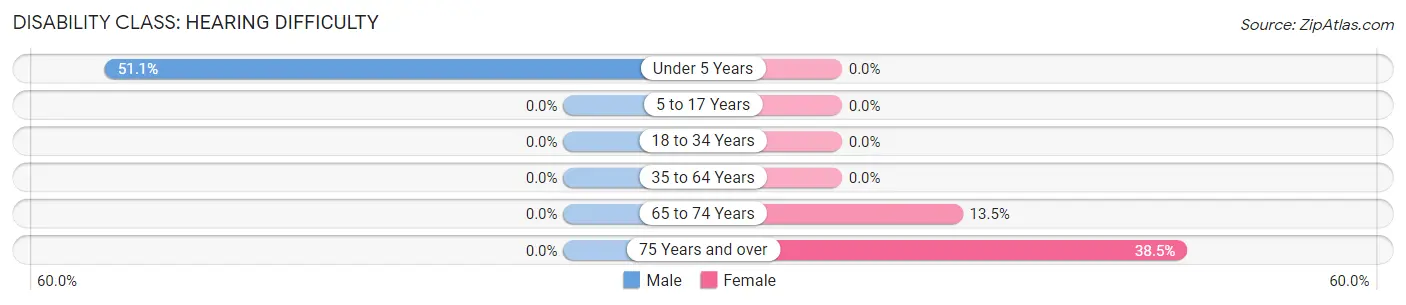
| Age Bracket | Male | Female |
| Under 5 Years | 24 (51.1%) | 0 (0.0%) |
| 5 to 17 Years | 0 (0.0%) | 0 (0.0%) |
| 18 to 34 Years | 0 (0.0%) | 0 (0.0%) |
| 35 to 64 Years | 0 (0.0%) | 0 (0.0%) |
| 65 to 74 Years | 0 (0.0%) | 14 (13.5%) |
| 75 Years and over | 0 (0.0%) | 15 (38.5%) |
Disability Class: Vision Difficulty
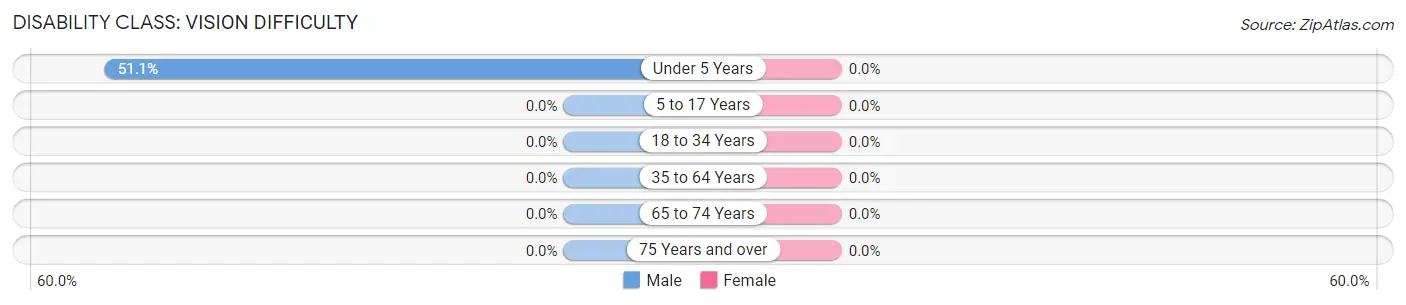
| Age Bracket | Male | Female |
| Under 5 Years | 24 (51.1%) | 0 (0.0%) |
| 5 to 17 Years | 0 (0.0%) | 0 (0.0%) |
| 18 to 34 Years | 0 (0.0%) | 0 (0.0%) |
| 35 to 64 Years | 0 (0.0%) | 0 (0.0%) |
| 65 to 74 Years | 0 (0.0%) | 0 (0.0%) |
| 75 Years and over | 0 (0.0%) | 0 (0.0%) |
Disability Class: Cognitive Difficulty
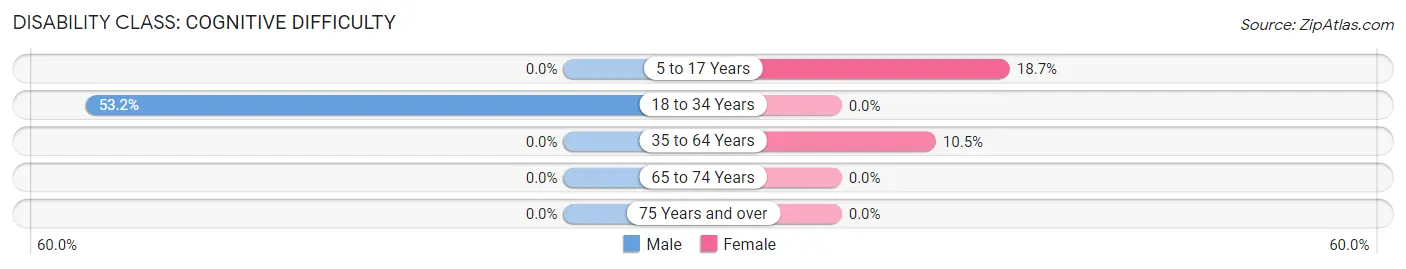
| Age Bracket | Male | Female |
| 5 to 17 Years | 0 (0.0%) | 38 (18.7%) |
| 18 to 34 Years | 25 (53.2%) | 0 (0.0%) |
| 35 to 64 Years | 0 (0.0%) | 24 (10.5%) |
| 65 to 74 Years | 0 (0.0%) | 0 (0.0%) |
| 75 Years and over | 0 (0.0%) | 0 (0.0%) |
Disability Class: Ambulatory Difficulty
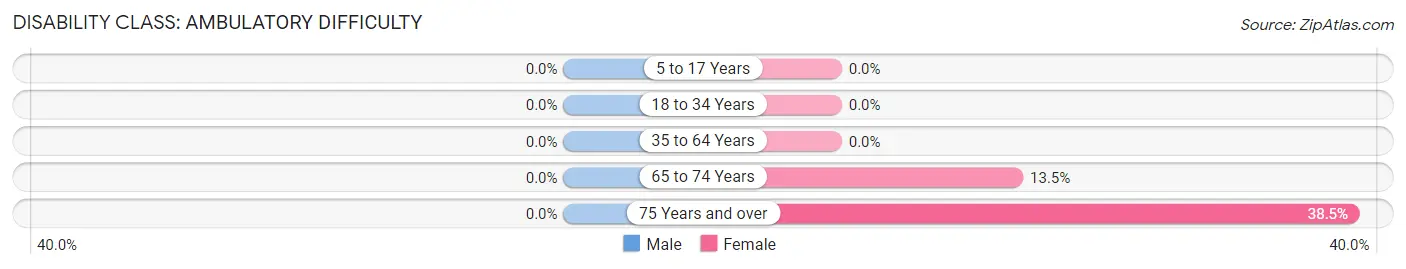
| Age Bracket | Male | Female |
| 5 to 17 Years | 0 (0.0%) | 0 (0.0%) |
| 18 to 34 Years | 0 (0.0%) | 0 (0.0%) |
| 35 to 64 Years | 0 (0.0%) | 0 (0.0%) |
| 65 to 74 Years | 0 (0.0%) | 14 (13.5%) |
| 75 Years and over | 0 (0.0%) | 15 (38.5%) |
Disability Class: Self-Care Difficulty
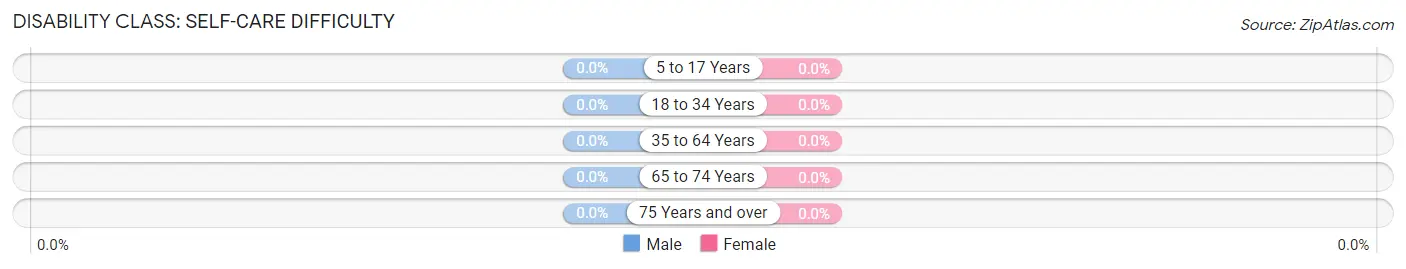
| Age Bracket | Male | Female |
| 5 to 17 Years | 0 (0.0%) | 0 (0.0%) |
| 18 to 34 Years | 0 (0.0%) | 0 (0.0%) |
| 35 to 64 Years | 0 (0.0%) | 0 (0.0%) |
| 65 to 74 Years | 0 (0.0%) | 0 (0.0%) |
| 75 Years and over | 0 (0.0%) | 0 (0.0%) |
Technology Access in Ruckersville
Computing Device Access in Ruckersville
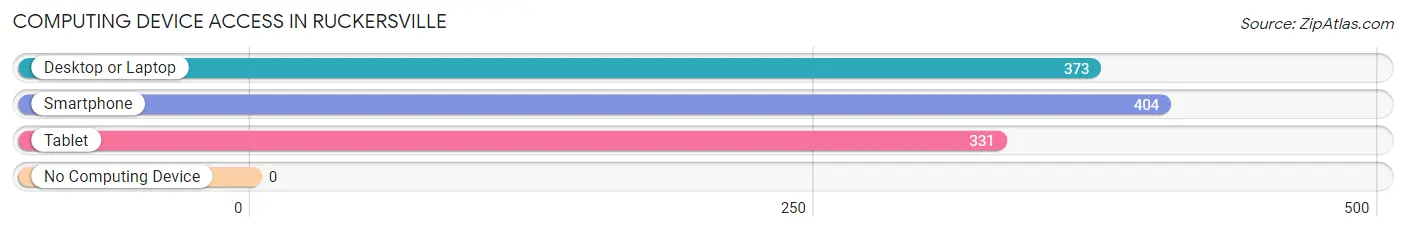
| Device Type | # Households | % Households |
| Desktop or Laptop | 373 | 88.2% |
| Smartphone | 404 | 95.5% |
| Tablet | 331 | 78.2% |
| No Computing Device | 0 | 0.0% |
| Total | 423 | 100.0% |
Internet Access in Ruckersville
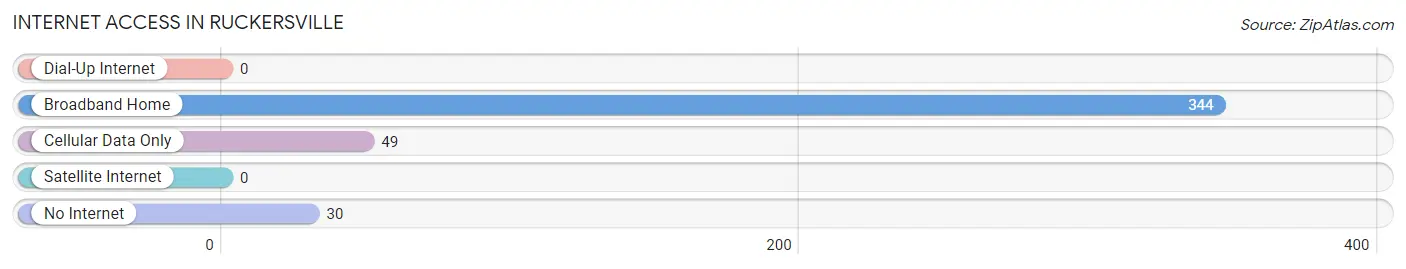
| Internet Type | # Households | % Households |
| Dial-Up Internet | 0 | 0.0% |
| Broadband Home | 344 | 81.3% |
| Cellular Data Only | 49 | 11.6% |
| Satellite Internet | 0 | 0.0% |
| No Internet | 30 | 7.1% |
| Total | 423 | 100.0% |
Ruckersville Summary
Ruckersville is a small town located in Greene County, Virginia, United States. It is situated in the foothills of the Blue Ridge Mountains, approximately 25 miles northeast of Charlottesville. The town was founded in 1790 and is named after the Rucker family, who were among the first settlers in the area.
History
Ruckersville was founded in 1790 by the Rucker family, who were among the first settlers in the area. The town was originally known as Rucker's Crossroads, and was a small farming community. In 1820, the town was officially incorporated as Ruckersville.
During the Civil War, Ruckersville was a major supply center for the Confederate Army. The town was also the site of several skirmishes between Union and Confederate forces. After the war, the town experienced a period of growth and prosperity, and by the early 1900s, it had become a popular tourist destination.
In the late 20th century, Ruckersville experienced a period of decline, as many of its businesses closed and the population decreased. However, in recent years, the town has seen a resurgence in popularity, as it has become a popular destination for outdoor recreation and tourism.
Geography
Ruckersville is located in the foothills of the Blue Ridge Mountains, approximately 25 miles northeast of Charlottesville. The town is situated in a rural area, surrounded by rolling hills and farmland. The town is located near several state parks, including Shenandoah National Park, Skyline Drive, and the George Washington National Forest.
The town is served by two major highways, US Route 29 and US Route 33. The nearest airport is Charlottesville-Albemarle Airport, located approximately 25 miles away.
Economy
Ruckersville's economy is largely based on tourism and outdoor recreation. The town is home to several wineries, breweries, and distilleries, as well as a variety of restaurants and shops. The town is also home to several outdoor recreation businesses, such as horseback riding, fishing, and hunting.
The town is also home to several manufacturing and industrial businesses, including a furniture factory, a printing company, and a plastics manufacturer.
Demographics
As of the 2010 census, the population of Ruckersville was 1,845. The racial makeup of the town was 94.3% White, 2.2% African American, 0.3% Native American, 0.7% Asian, 0.1% Pacific Islander, and 2.4% from other races. The median household income was $45,938, and the median family income was $51,938.
The town is served by the Greene County Public Schools system, which includes two elementary schools, one middle school, and one high school. The town is also home to several private schools, including a Catholic school and a Montessori school.
Common Questions
What is Per Capita Income in Ruckersville?
Per Capita income in Ruckersville is $49,217.
What is the Median Family Income in Ruckersville?
Median Family Income in Ruckersville is $124,167.
What is the Median Household income in Ruckersville?
Median Household Income in Ruckersville is $101,875.
What is Income or Wage Gap in Ruckersville?
Income or Wage Gap in Ruckersville is 64.6%.
Women in Ruckersville earn 35.4 cents for every dollar earned by a man.
What is Inequality or Gini Index in Ruckersville?
Inequality or Gini Index in Ruckersville is 0.39.
What is the Total Population of Ruckersville?
Total Population of Ruckersville is 1,275.
What is the Total Male Population of Ruckersville?
Total Male Population of Ruckersville is 554.
What is the Total Female Population of Ruckersville?
Total Female Population of Ruckersville is 721.
What is the Ratio of Males per 100 Females in Ruckersville?
There are 76.84 Males per 100 Females in Ruckersville.
What is the Ratio of Females per 100 Males in Ruckersville?
There are 130.14 Females per 100 Males in Ruckersville.
What is the Median Population Age in Ruckersville?
Median Population Age in Ruckersville is 36.7 Years.
What is the Average Family Size in Ruckersville
Average Family Size in Ruckersville is 3.9 People.
What is the Average Household Size in Ruckersville
Average Household Size in Ruckersville is 3.0 People.
How Large is the Labor Force in Ruckersville?
There are 733 People in the Labor Forcein in Ruckersville.
What is the Percentage of People in the Labor Force in Ruckersville?
78.1% of People are in the Labor Force in Ruckersville.
What is the Unemployment Rate in Ruckersville?
Unemployment Rate in Ruckersville is 3.4%.