Camptown, VA Map & Demographics
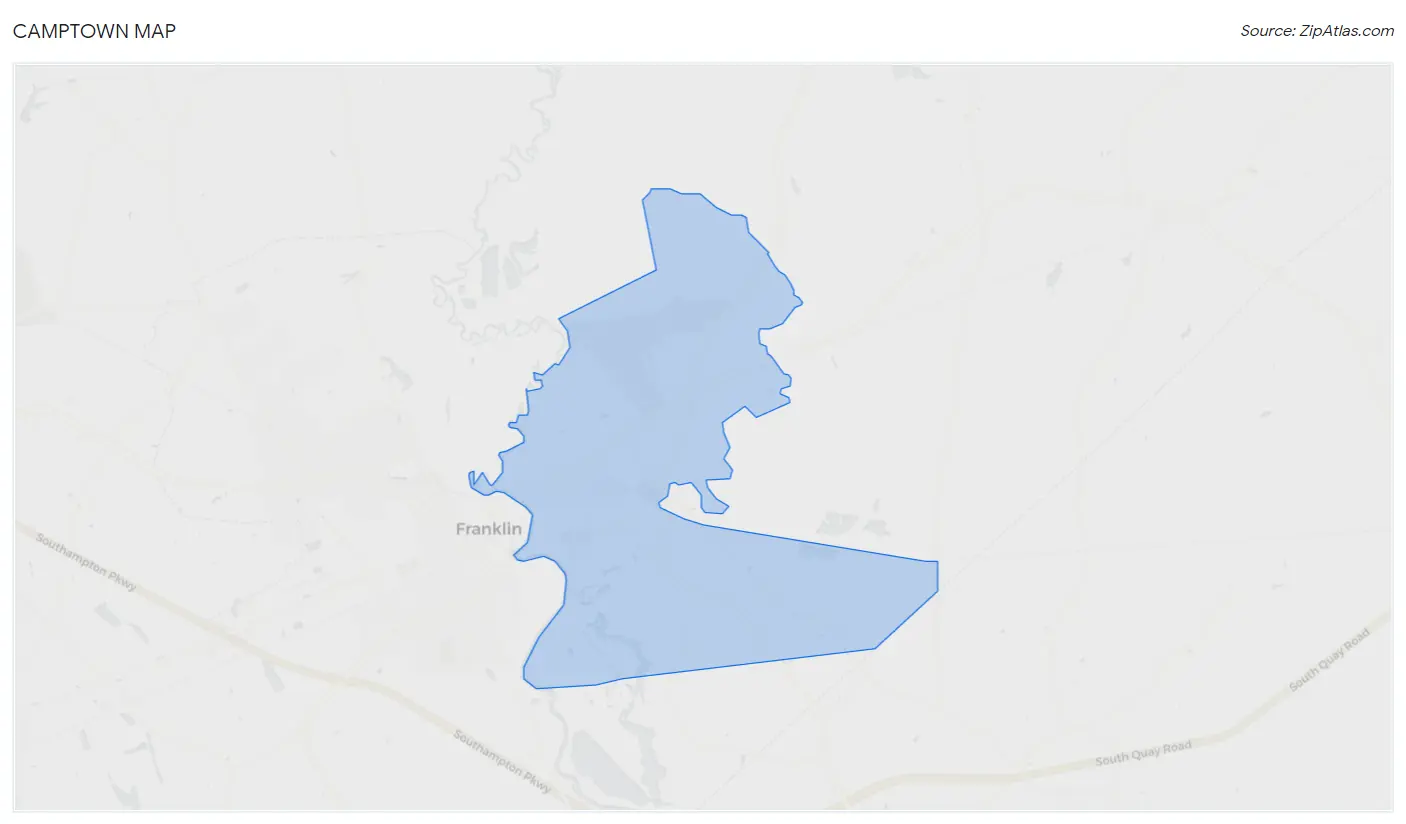
Camptown Map
Camptown Overview
$36,648
PER CAPITA INCOME
$98,056
AVG FAMILY INCOME
$81,125
AVG HOUSEHOLD INCOME
21.2%
WAGE / INCOME GAP [ % ]
78.8¢/ $1
WAGE / INCOME GAP [ $ ]
0.33
INEQUALITY / GINI INDEX
627
TOTAL POPULATION
337
MALE POPULATION
290
FEMALE POPULATION
116.21
MALES / 100 FEMALES
86.05
FEMALES / 100 MALES
49.0
MEDIAN AGE
2.6
AVG FAMILY SIZE
2.2
AVG HOUSEHOLD SIZE
347
LABOR FORCE [ PEOPLE ]
63.9%
PERCENT IN LABOR FORCE
9.5%
UNEMPLOYMENT RATE
Income in Camptown
Income Overview in Camptown
Per Capita Income in Camptown is $36,648, while median incomes of families and households are $98,056 and $81,125 respectively.
| Characteristic | Number | Measure |
| Per Capita Income | 627 | $36,648 |
| Median Family Income | 206 | $98,056 |
| Mean Family Income | 206 | $90,876 |
| Median Household Income | 281 | $81,125 |
| Mean Household Income | 281 | $73,813 |
| Income Deficit | 206 | $0 |
| Wage / Income Gap (%) | 627 | 21.21% |
| Wage / Income Gap ($) | 627 | 78.79¢ per $1 |
| Gini / Inequality Index | 627 | 0.33 |
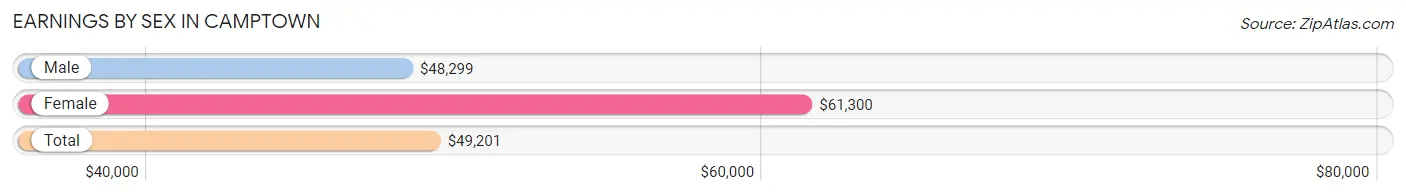
Earnings by Sex in Camptown
Average Earnings in Camptown are $49,201, $48,299 for men and $61,300 for women, a difference of 21.2%.
| Sex | Number | Average Earnings |
| Male | 223 (64.3%) | $48,299 |
| Female | 124 (35.7%) | $61,300 |
| Total | 347 (100.0%) | $49,201 |
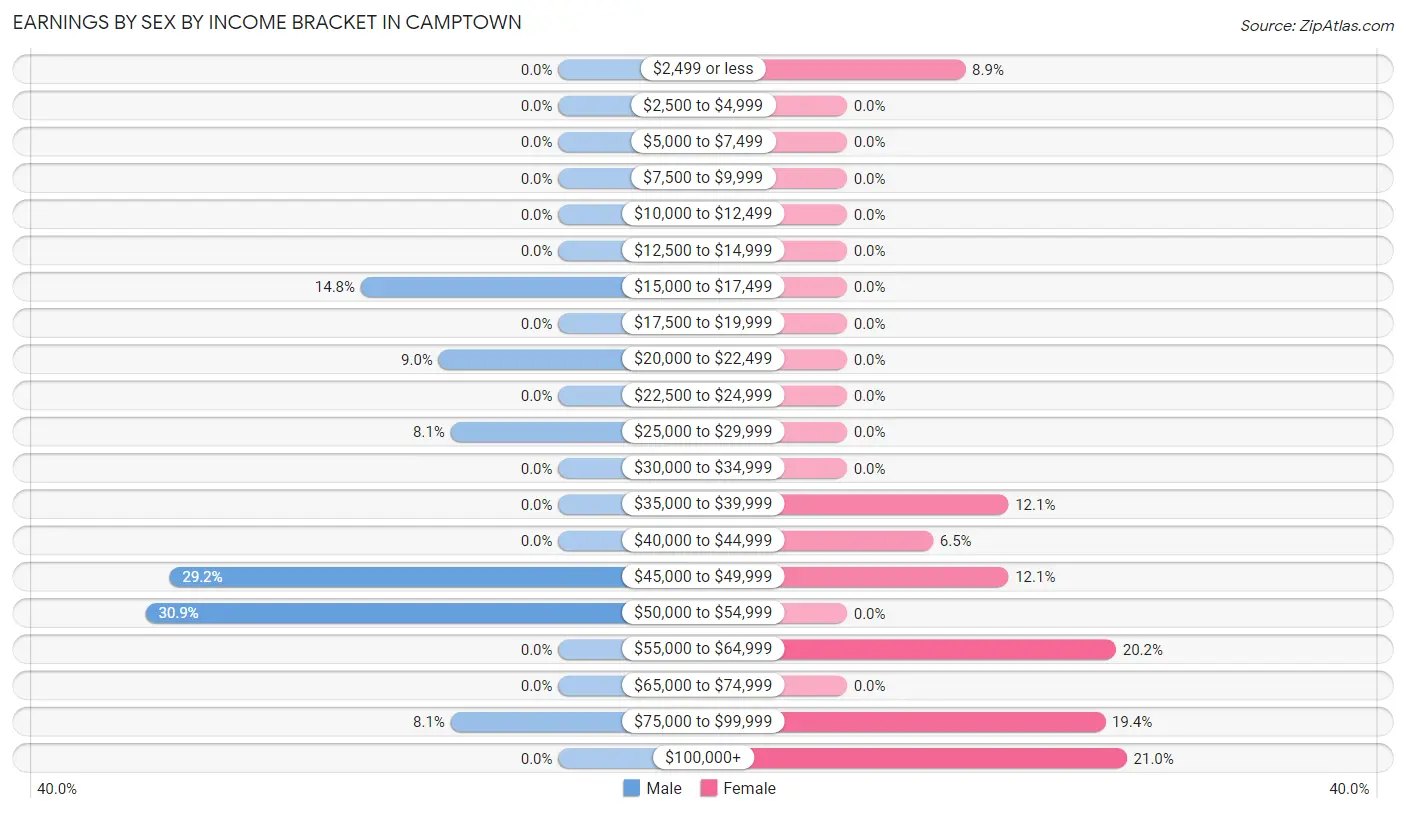
Earnings by Sex by Income Bracket in Camptown
The most common earnings brackets in Camptown are $50,000 to $54,999 for men (69 | 30.9%) and $100,000+ for women (26 | 21.0%).
| Income | Male | Female |
| $2,499 or less | 0 (0.0%) | 11 (8.9%) |
| $2,500 to $4,999 | 0 (0.0%) | 0 (0.0%) |
| $5,000 to $7,499 | 0 (0.0%) | 0 (0.0%) |
| $7,500 to $9,999 | 0 (0.0%) | 0 (0.0%) |
| $10,000 to $12,499 | 0 (0.0%) | 0 (0.0%) |
| $12,500 to $14,999 | 0 (0.0%) | 0 (0.0%) |
| $15,000 to $17,499 | 33 (14.8%) | 0 (0.0%) |
| $17,500 to $19,999 | 0 (0.0%) | 0 (0.0%) |
| $20,000 to $22,499 | 20 (9.0%) | 0 (0.0%) |
| $22,500 to $24,999 | 0 (0.0%) | 0 (0.0%) |
| $25,000 to $29,999 | 18 (8.1%) | 0 (0.0%) |
| $30,000 to $34,999 | 0 (0.0%) | 0 (0.0%) |
| $35,000 to $39,999 | 0 (0.0%) | 15 (12.1%) |
| $40,000 to $44,999 | 0 (0.0%) | 8 (6.5%) |
| $45,000 to $49,999 | 65 (29.1%) | 15 (12.1%) |
| $50,000 to $54,999 | 69 (30.9%) | 0 (0.0%) |
| $55,000 to $64,999 | 0 (0.0%) | 25 (20.2%) |
| $65,000 to $74,999 | 0 (0.0%) | 0 (0.0%) |
| $75,000 to $99,999 | 18 (8.1%) | 24 (19.4%) |
| $100,000+ | 0 (0.0%) | 26 (21.0%) |
| Total | 223 (100.0%) | 124 (100.0%) |
Earnings by Sex by Educational Attainment in Camptown
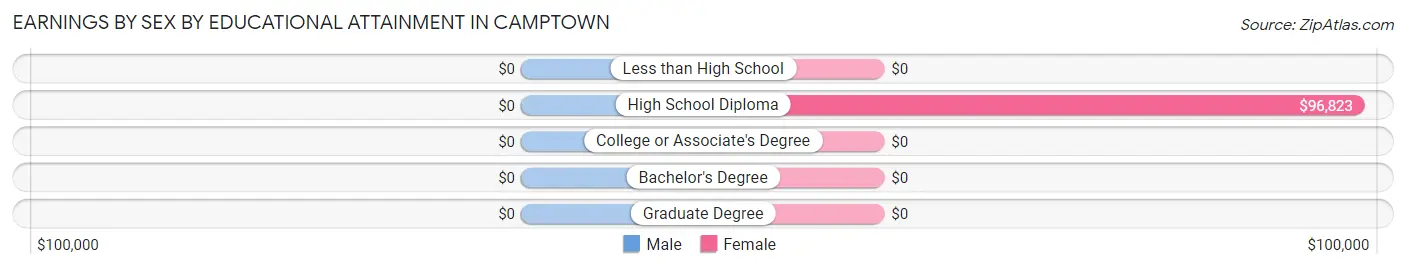
| Educational Attainment | Male Income | Female Income |
| Less than High School | - | - |
| High School Diploma | - | - |
| College or Associate's Degree | - | - |
| Bachelor's Degree | - | - |
| Graduate Degree | - | - |
| Total | $48,507 | $61,850 |
Family Income in Camptown
Family Income Brackets in Camptown
According to the Camptown family income data, there are 75 families falling into the $100,000 to $149,999 income range, which is the most common income bracket and makes up 36.4% of all families.
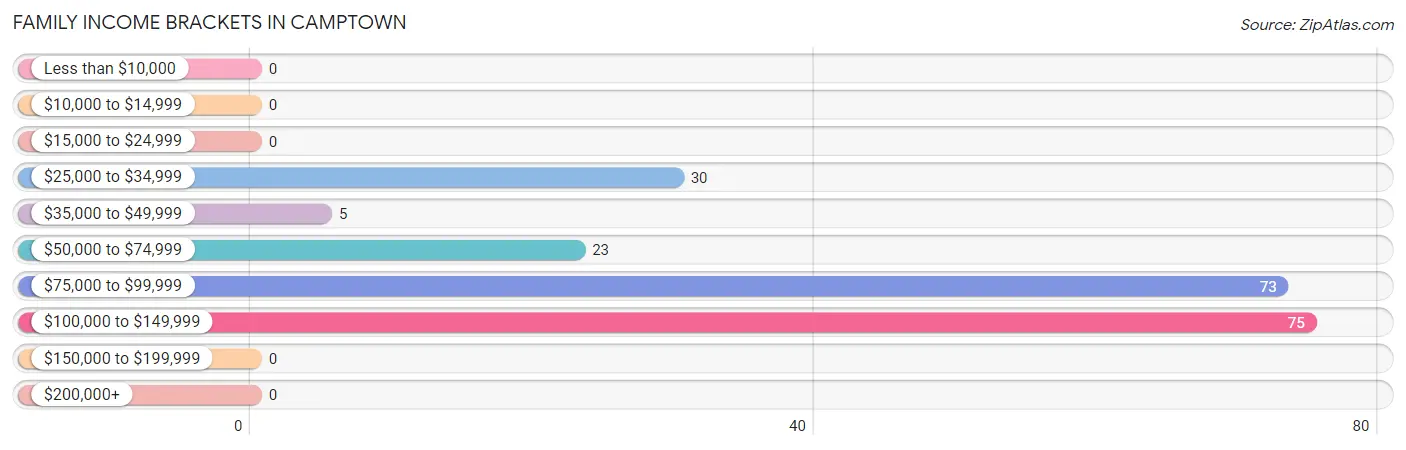
| Income Bracket | # Families | % Families |
| Less than $10,000 | 0 | 0.0% |
| $10,000 to $14,999 | 0 | 0.0% |
| $15,000 to $24,999 | 0 | 0.0% |
| $25,000 to $34,999 | 30 | 14.6% |
| $35,000 to $49,999 | 5 | 2.4% |
| $50,000 to $74,999 | 23 | 11.2% |
| $75,000 to $99,999 | 73 | 35.4% |
| $100,000 to $149,999 | 75 | 36.4% |
| $150,000 to $199,999 | 0 | 0.0% |
| $200,000+ | 0 | 0.0% |
Family Income by Famaliy Size in Camptown
2-person families (188 | 91.3%) account for the highest median family income in Camptown with $98,681 per family, while 2-person families (188 | 91.3%) have the highest median income of $49,340 per family member.
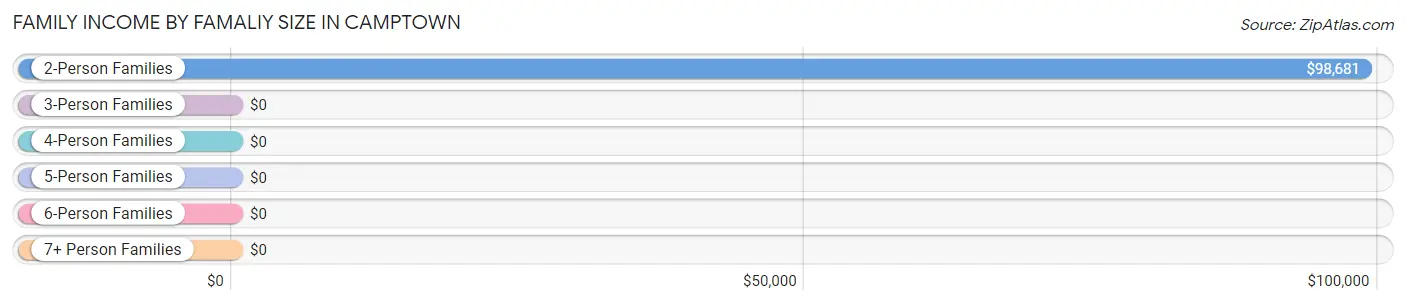
| Income Bracket | # Families | Median Income |
| 2-Person Families | 188 (91.3%) | $98,681 |
| 3-Person Families | 18 (8.7%) | $0 |
| 4-Person Families | 0 (0.0%) | $0 |
| 5-Person Families | 0 (0.0%) | $0 |
| 6-Person Families | 0 (0.0%) | $0 |
| 7+ Person Families | 0 (0.0%) | $0 |
| Total | 206 (100.0%) | $98,056 |
Family Income by Number of Earners in Camptown
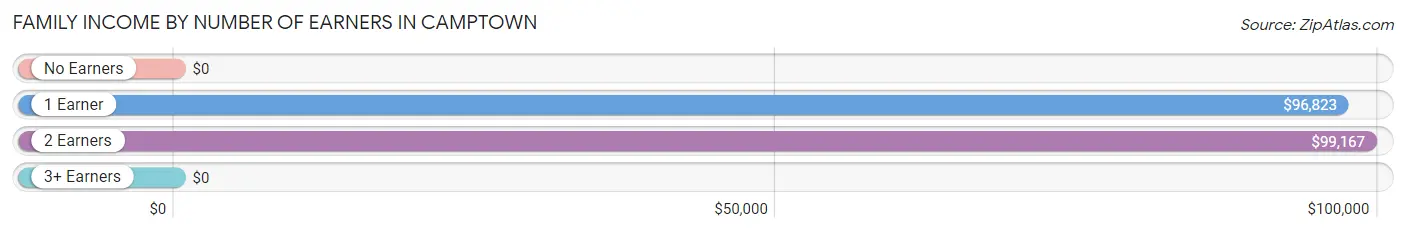
| Number of Earners | # Families | Median Income |
| No Earners | 19 (9.2%) | $0 |
| 1 Earner | 83 (40.3%) | $96,823 |
| 2 Earners | 104 (50.5%) | $99,167 |
| 3+ Earners | 0 (0.0%) | $0 |
| Total | 206 (100.0%) | $98,056 |
Household Income in Camptown
Household Income Brackets in Camptown
With 83 households falling in the category, the $75,000 to $99,999 income range is the most frequent in Camptown, accounting for 29.5% of all households.
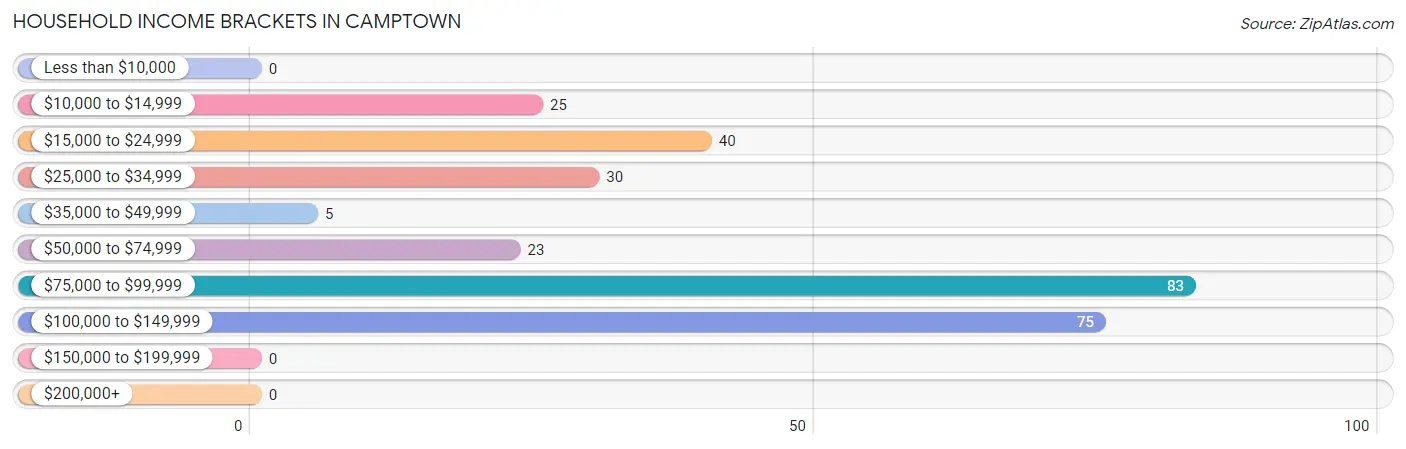
| Income Bracket | # Households | % Households |
| Less than $10,000 | 0 | 0.0% |
| $10,000 to $14,999 | 25 | 8.9% |
| $15,000 to $24,999 | 40 | 14.2% |
| $25,000 to $34,999 | 30 | 10.7% |
| $35,000 to $49,999 | 5 | 1.8% |
| $50,000 to $74,999 | 23 | 8.2% |
| $75,000 to $99,999 | 83 | 29.5% |
| $100,000 to $149,999 | 75 | 26.7% |
| $150,000 to $199,999 | 0 | 0.0% |
| $200,000+ | 0 | 0.0% |
Household Income by Householder Age in Camptown
The median household income in Camptown is $81,125, with the highest median household income of $76,538 found in the 45 to 64 years age bracket for the primary householder. A total of 164 households (58.4%) fall into this category.
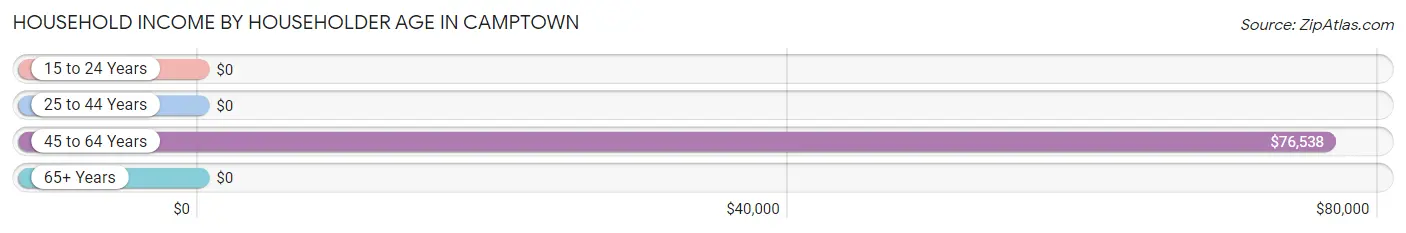
| Income Bracket | # Households | Median Income |
| 15 to 24 Years | 0 (0.0%) | $0 |
| 25 to 44 Years | 49 (17.4%) | $0 |
| 45 to 64 Years | 164 (58.4%) | $76,538 |
| 65+ Years | 68 (24.2%) | $0 |
| Total | 281 (100.0%) | $81,125 |
Poverty in Camptown
Income Below Poverty by Sex and Age in Camptown
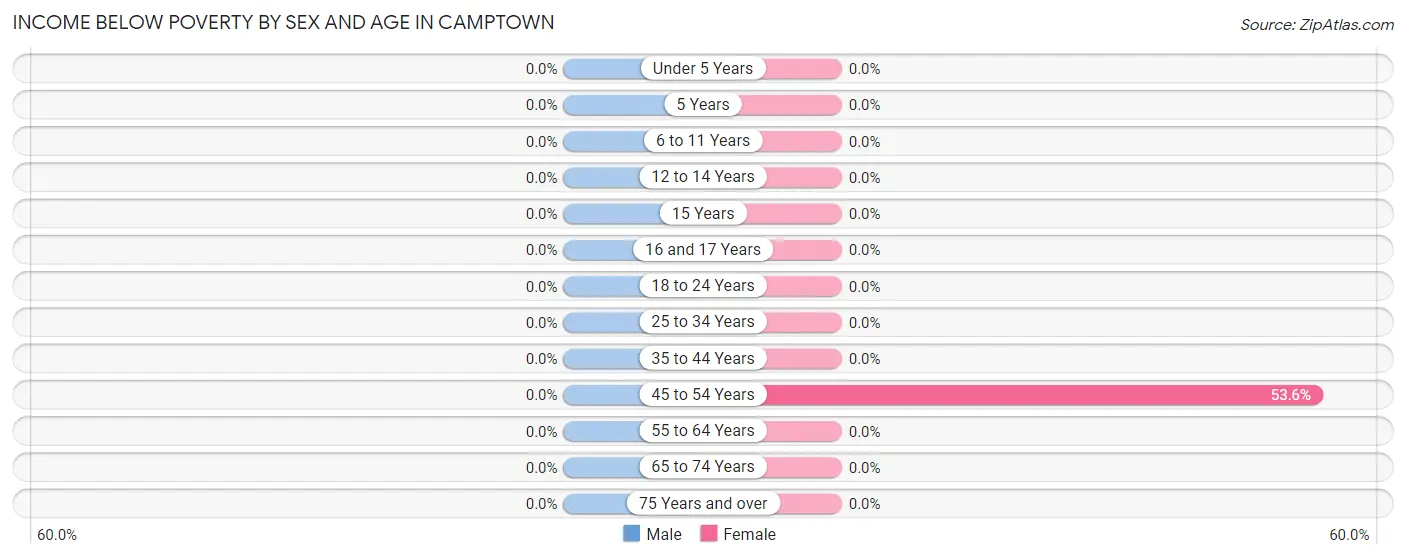
| Age Bracket | Male | Female |
| Under 5 Years | 0 (0.0%) | 0 (0.0%) |
| 5 Years | 0 (0.0%) | 0 (0.0%) |
| 6 to 11 Years | 0 (0.0%) | 0 (0.0%) |
| 12 to 14 Years | 0 (0.0%) | 0 (0.0%) |
| 15 Years | 0 (0.0%) | 0 (0.0%) |
| 16 and 17 Years | 0 (0.0%) | 0 (0.0%) |
| 18 to 24 Years | 0 (0.0%) | 0 (0.0%) |
| 25 to 34 Years | 0 (0.0%) | 0 (0.0%) |
| 35 to 44 Years | 0 (0.0%) | 0 (0.0%) |
| 45 to 54 Years | 0 (0.0%) | 15 (53.6%) |
| 55 to 64 Years | 0 (0.0%) | 0 (0.0%) |
| 65 to 74 Years | 0 (0.0%) | 0 (0.0%) |
| 75 Years and over | 0 (0.0%) | 0 (0.0%) |
| Total | 0 (0.0%) | 15 (5.2%) |
Income Above Poverty by Sex and Age in Camptown
According to the poverty statistics in Camptown, males aged 12 to 14 years and females aged 15 years are the age groups that are most secure financially, with 100.0% of males and 100.0% of females in these age groups living above the poverty line.
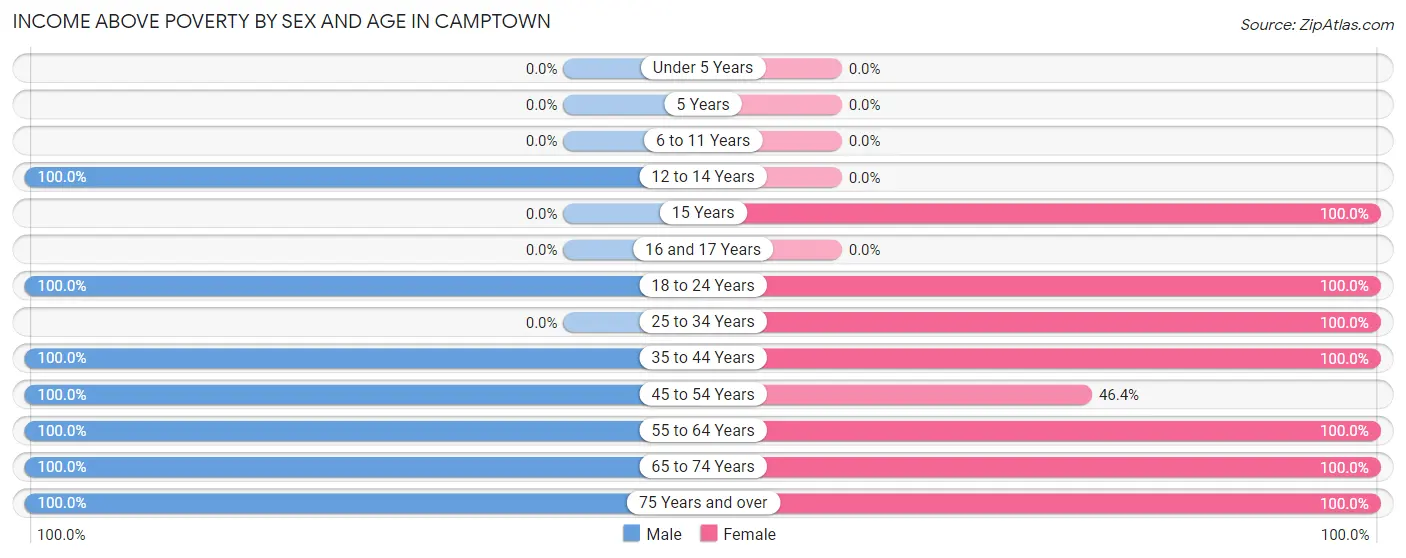
| Age Bracket | Male | Female |
| Under 5 Years | 0 (0.0%) | 0 (0.0%) |
| 5 Years | 0 (0.0%) | 0 (0.0%) |
| 6 to 11 Years | 0 (0.0%) | 0 (0.0%) |
| 12 to 14 Years | 6 (100.0%) | 0 (0.0%) |
| 15 Years | 0 (0.0%) | 78 (100.0%) |
| 16 and 17 Years | 0 (0.0%) | 0 (0.0%) |
| 18 to 24 Years | 96 (100.0%) | 11 (100.0%) |
| 25 to 34 Years | 0 (0.0%) | 25 (100.0%) |
| 35 to 44 Years | 24 (100.0%) | 24 (100.0%) |
| 45 to 54 Years | 76 (100.0%) | 13 (46.4%) |
| 55 to 64 Years | 77 (100.0%) | 72 (100.0%) |
| 65 to 74 Years | 43 (100.0%) | 35 (100.0%) |
| 75 Years and over | 15 (100.0%) | 17 (100.0%) |
| Total | 337 (100.0%) | 275 (94.8%) |
Income Below Poverty Among Married-Couple Families in Camptown
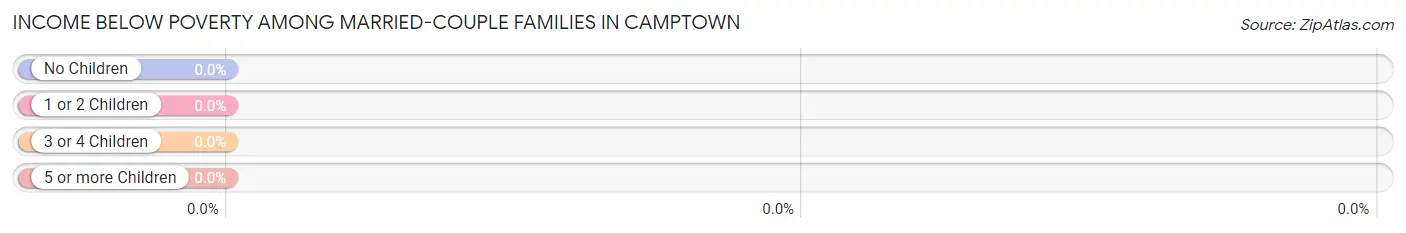
| Children | Above Poverty | Below Poverty |
| No Children | 110 (100.0%) | 0 (0.0%) |
| 1 or 2 Children | 5 (100.0%) | 0 (0.0%) |
| 3 or 4 Children | 0 (0.0%) | 0 (0.0%) |
| 5 or more Children | 0 (0.0%) | 0 (0.0%) |
| Total | 115 (100.0%) | 0 (0.0%) |
Income Below Poverty Among Single-Parent Households in Camptown
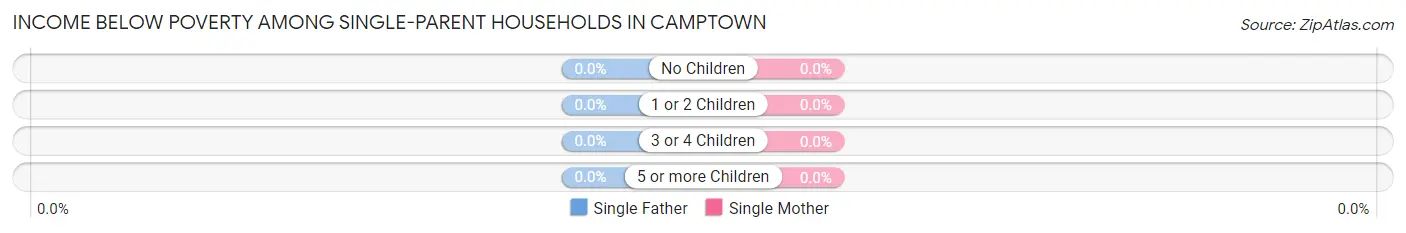
| Children | Single Father | Single Mother |
| No Children | 0 (0.0%) | 0 (0.0%) |
| 1 or 2 Children | 0 (0.0%) | 0 (0.0%) |
| 3 or 4 Children | 0 (0.0%) | 0 (0.0%) |
| 5 or more Children | 0 (0.0%) | 0 (0.0%) |
| Total | 0 (0.0%) | 0 (0.0%) |
Income Below Poverty Among Married-Couple vs Single-Parent Households in Camptown
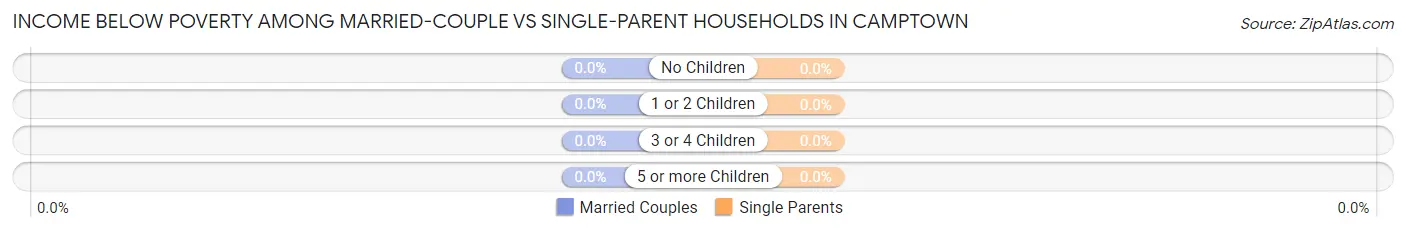
| Children | Married-Couple Families | Single-Parent Households |
| No Children | 0 (0.0%) | 0 (0.0%) |
| 1 or 2 Children | 0 (0.0%) | 0 (0.0%) |
| 3 or 4 Children | 0 (0.0%) | 0 (0.0%) |
| 5 or more Children | 0 (0.0%) | 0 (0.0%) |
| Total | 0 (0.0%) | 0 (0.0%) |
Race in Camptown
The most populous races in Camptown are Black / African American (409 | 65.2%), and White / Caucasian (218 | 34.8%).
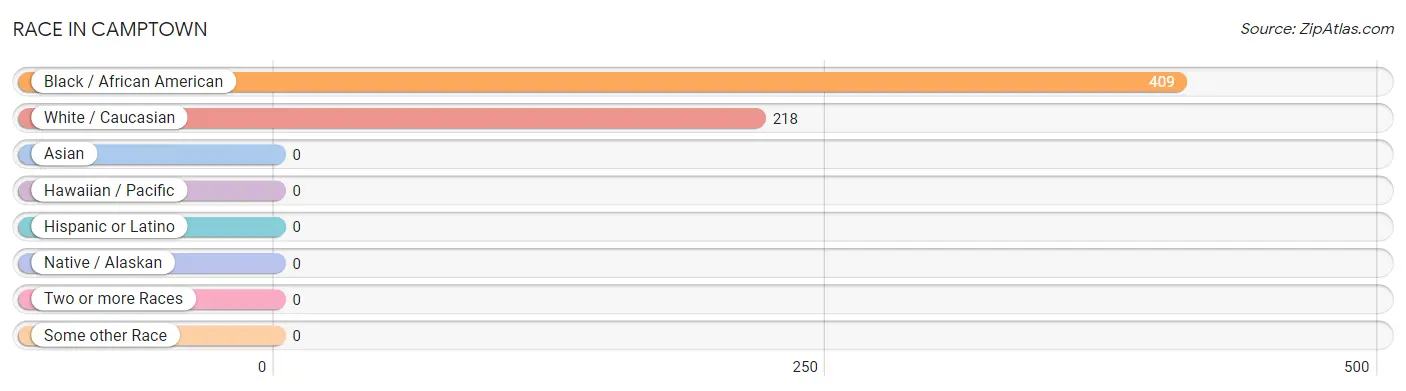
| Race | # Population | % Population |
| Asian | 0 | 0.0% |
| Black / African American | 409 | 65.2% |
| Hawaiian / Pacific | 0 | 0.0% |
| Hispanic or Latino | 0 | 0.0% |
| Native / Alaskan | 0 | 0.0% |
| White / Caucasian | 218 | 34.8% |
| Two or more Races | 0 | 0.0% |
| Some other Race | 0 | 0.0% |
| Total | 627 | 100.0% |
Ancestry in Camptown
The most populous ancestries reported in Camptown are African (124 | 19.8%), Subsaharan African (124 | 19.8%), English (68 | 10.8%), Scottish (33 | 5.3%), and American (30 | 4.8%), together accounting for 60.4% of all Camptown residents.
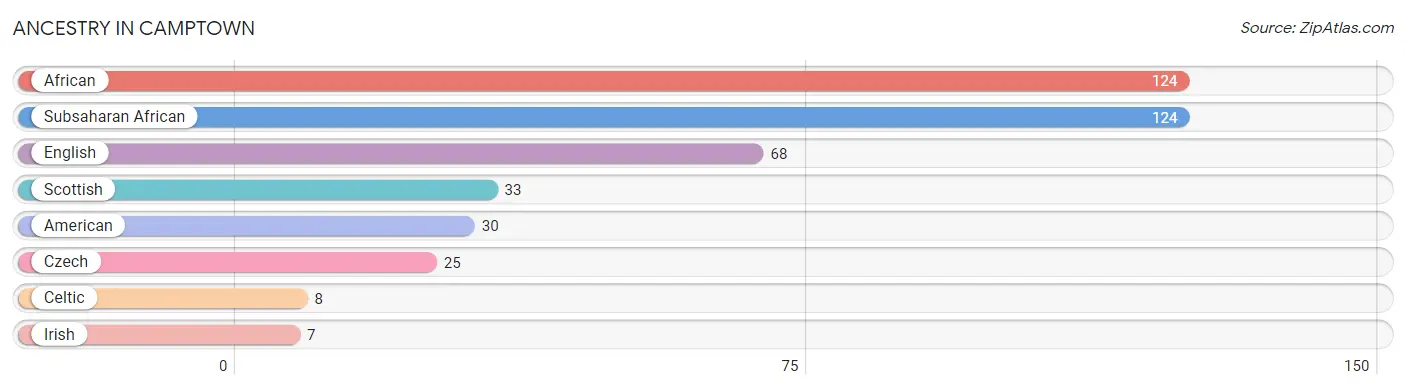
| Ancestry | # Population | % Population |
| African | 124 | 19.8% |
| American | 30 | 4.8% |
| Celtic | 8 | 1.3% |
| Czech | 25 | 4.0% |
| English | 68 | 10.8% |
| Irish | 7 | 1.1% |
| Scottish | 33 | 5.3% |
| Subsaharan African | 124 | 19.8% | View All 8 Rows |
Immigrants in Camptown

| Immigration Origin | # Population | % Population | View All 0 Rows |
Sex and Age in Camptown
Sex and Age in Camptown
The most populous age groups in Camptown are 20 to 24 Years (96 | 28.5%) for men and 15 to 19 Years (89 | 30.7%) for women.
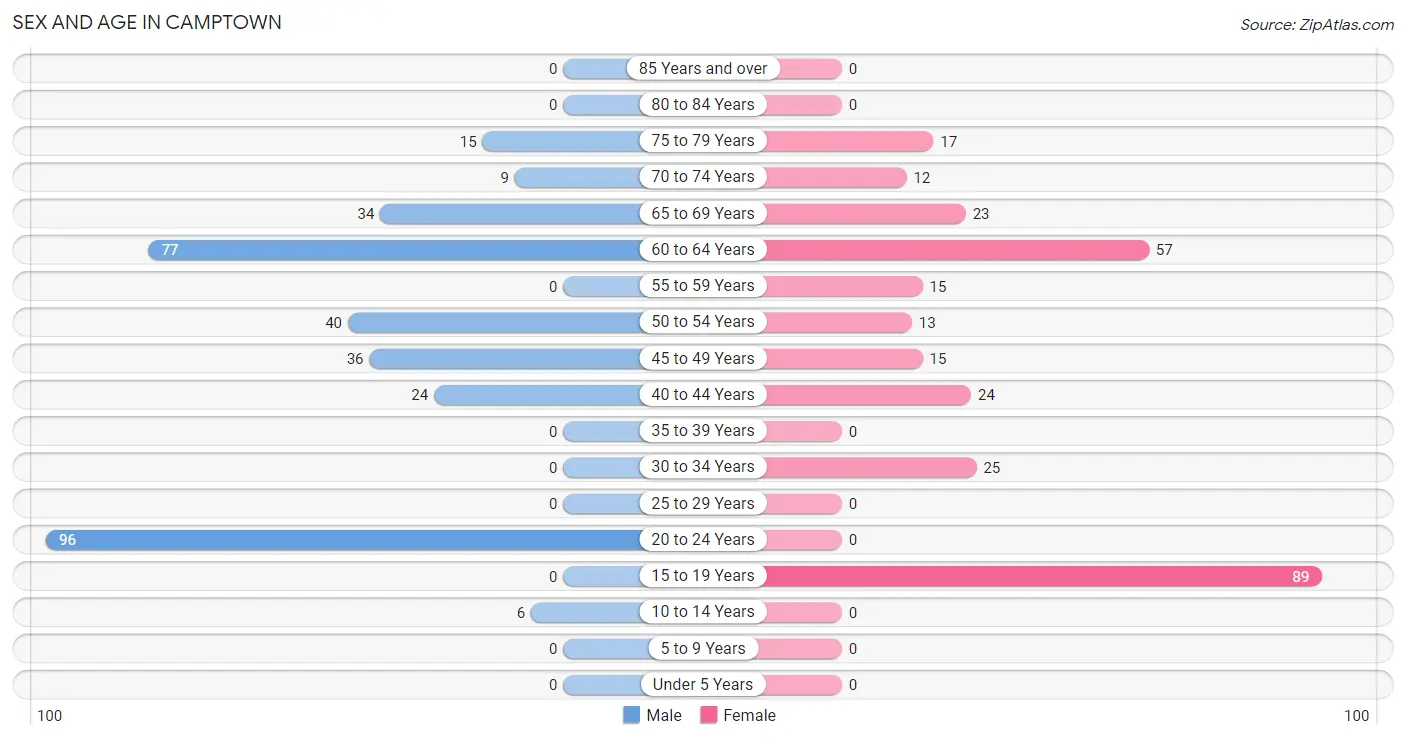
| Age Bracket | Male | Female |
| Under 5 Years | 0 (0.0%) | 0 (0.0%) |
| 5 to 9 Years | 0 (0.0%) | 0 (0.0%) |
| 10 to 14 Years | 6 (1.8%) | 0 (0.0%) |
| 15 to 19 Years | 0 (0.0%) | 89 (30.7%) |
| 20 to 24 Years | 96 (28.5%) | 0 (0.0%) |
| 25 to 29 Years | 0 (0.0%) | 0 (0.0%) |
| 30 to 34 Years | 0 (0.0%) | 25 (8.6%) |
| 35 to 39 Years | 0 (0.0%) | 0 (0.0%) |
| 40 to 44 Years | 24 (7.1%) | 24 (8.3%) |
| 45 to 49 Years | 36 (10.7%) | 15 (5.2%) |
| 50 to 54 Years | 40 (11.9%) | 13 (4.5%) |
| 55 to 59 Years | 0 (0.0%) | 15 (5.2%) |
| 60 to 64 Years | 77 (22.9%) | 57 (19.7%) |
| 65 to 69 Years | 34 (10.1%) | 23 (7.9%) |
| 70 to 74 Years | 9 (2.7%) | 12 (4.1%) |
| 75 to 79 Years | 15 (4.4%) | 17 (5.9%) |
| 80 to 84 Years | 0 (0.0%) | 0 (0.0%) |
| 85 Years and over | 0 (0.0%) | 0 (0.0%) |
| Total | 337 (100.0%) | 290 (100.0%) |
Families and Households in Camptown
Median Family Size in Camptown
The median family size in Camptown is 2.64 persons per family, with single female/mother families (55 | 26.7%) accounting for the largest median family size of 3.22 persons per family. On the other hand, single male/father families (36 | 17.5%) represent the smallest median family size with 2.25 persons per family.
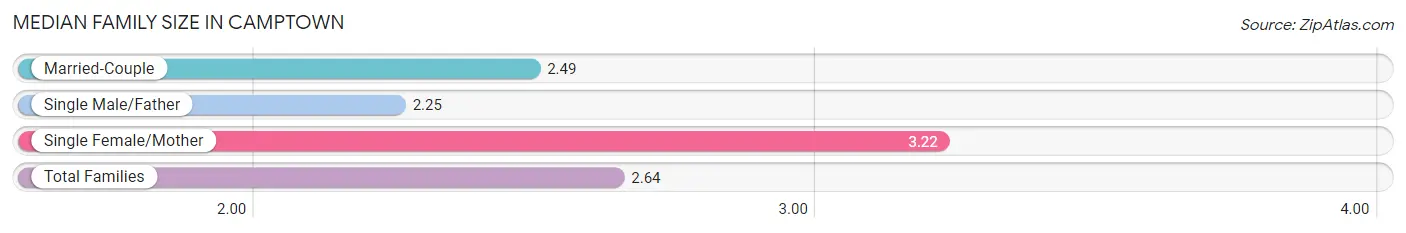
| Family Type | # Families | Family Size |
| Married-Couple | 115 (55.8%) | 2.49 |
| Single Male/Father | 36 (17.5%) | 2.25 |
| Single Female/Mother | 55 (26.7%) | 3.22 |
| Total Families | 206 (100.0%) | 2.64 |
Median Household Size in Camptown
The median household size in Camptown is 2.23 persons per household, with single female/mother households (55 | 19.6%) accounting for the largest median household size of 3.22 persons per household. non-family households (75 | 26.7%) represent the smallest median household size with 1.11 persons per household.
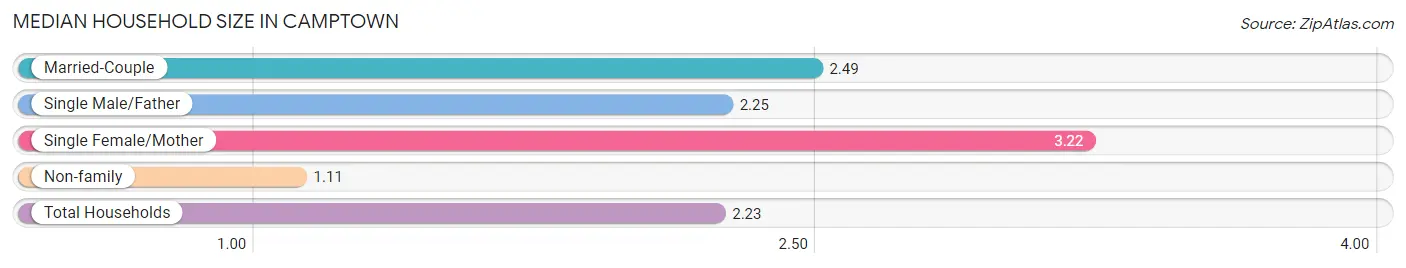
| Household Type | # Households | Household Size |
| Married-Couple | 115 (40.9%) | 2.49 |
| Single Male/Father | 36 (12.8%) | 2.25 |
| Single Female/Mother | 55 (19.6%) | 3.22 |
| Non-family | 75 (26.7%) | 1.11 |
| Total Households | 281 (100.0%) | 2.23 |
Household Size by Marriage Status in Camptown
Out of a total of 281 households in Camptown, 206 (73.3%) are family households, while 75 (26.7%) are nonfamily households. The most numerous type of family households are 2-person households, comprising 188, and the most common type of nonfamily households are 1-person households, comprising 65.
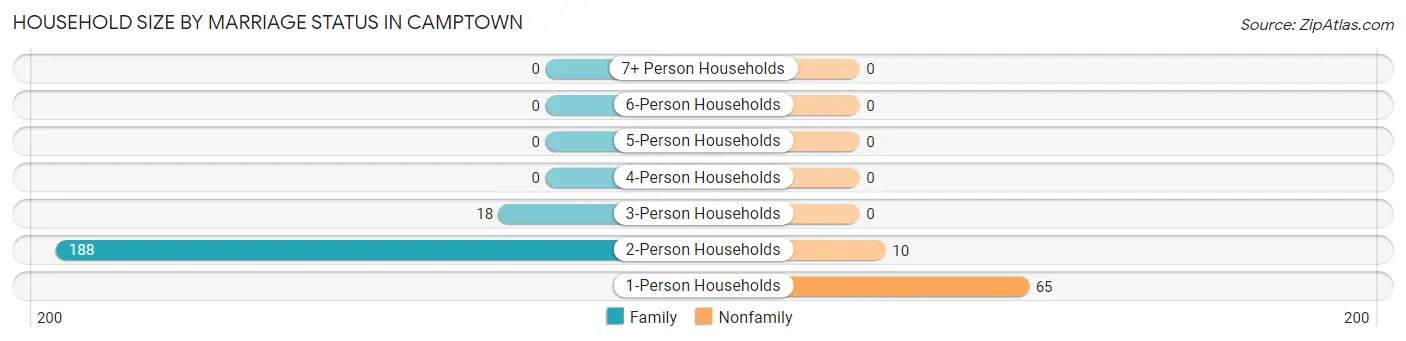
| Household Size | Family Households | Nonfamily Households |
| 1-Person Households | - | 65 (23.1%) |
| 2-Person Households | 188 (66.9%) | 10 (3.6%) |
| 3-Person Households | 18 (6.4%) | 0 (0.0%) |
| 4-Person Households | 0 (0.0%) | 0 (0.0%) |
| 5-Person Households | 0 (0.0%) | 0 (0.0%) |
| 6-Person Households | 0 (0.0%) | 0 (0.0%) |
| 7+ Person Households | 0 (0.0%) | 0 (0.0%) |
| Total | 206 (73.3%) | 75 (26.7%) |
Female Fertility in Camptown
Fertility by Age in Camptown
| Age Bracket | Women with Births | Births / 1,000 Women |
| 15 to 19 years | 0 (0.0%) | 0.0 |
| 20 to 34 years | 0 (0.0%) | 0.0 |
| 35 to 50 years | 0 (0.0%) | 0.0 |
| Total | 0 (0.0%) | 0.0 |
Fertility by Age by Marriage Status in Camptown
| Age Bracket | Married | Unmarried |
| 15 to 19 years | 0 (0.0%) | 0 (0.0%) |
| 20 to 34 years | 0 (0.0%) | 0 (0.0%) |
| 35 to 50 years | 0 (0.0%) | 0 (0.0%) |
| Total | 0 (0.0%) | 0 (0.0%) |
Fertility by Education in Camptown
| Educational Attainment | Women with Births | Births / 1,000 Women |
| Less than High School | 0 (0.0%) | 0.0 |
| High School Diploma | 0 (0.0%) | 0.0 |
| College or Associate's Degree | 0 (0.0%) | 0.0 |
| Bachelor's Degree | 0 (0.0%) | 0.0 |
| Graduate Degree | 0 (0.0%) | 0.0 |
| Total | 0 (0.0%) | 0.0 |
Fertility by Education by Marriage Status in Camptown
| Educational Attainment | Married | Unmarried |
| Less than High School | 0 (0.0%) | 0 (0.0%) |
| High School Diploma | 0 (0.0%) | 0 (0.0%) |
| College or Associate's Degree | 0 (0.0%) | 0 (0.0%) |
| Bachelor's Degree | 0 (0.0%) | 0 (0.0%) |
| Graduate Degree | 0 (0.0%) | 0 (0.0%) |
| Total | 0 (0.0%) | 0 (0.0%) |
Employment Characteristics in Camptown
Employment by Class of Employer in Camptown
Among the 303 employed individuals in Camptown, private company employees (252 | 83.2%), federal government employees (36 | 11.9%), and not-for-profit organizations (15 | 5.0%) make up the most common classes of employment.
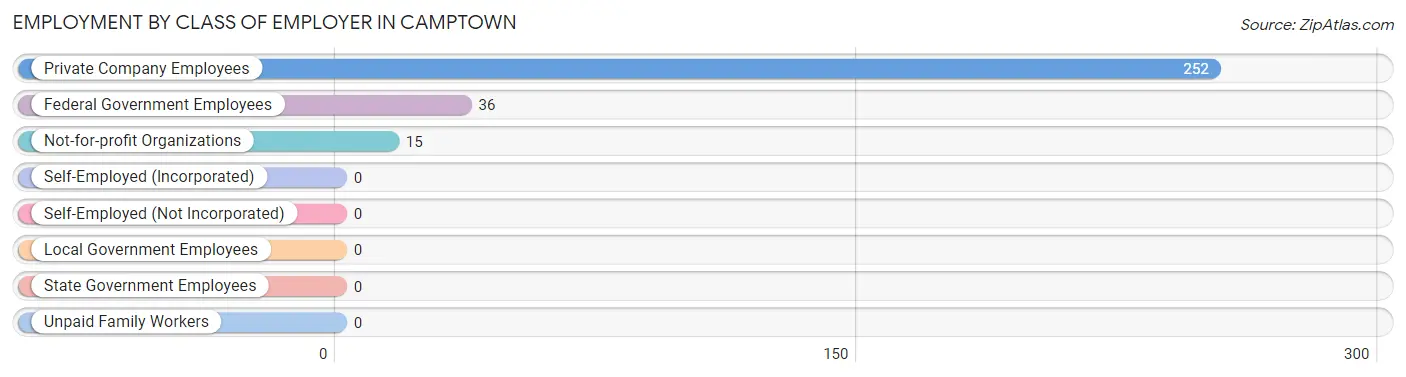
| Employer Class | # Employees | % Employees |
| Private Company Employees | 252 | 83.2% |
| Self-Employed (Incorporated) | 0 | 0.0% |
| Self-Employed (Not Incorporated) | 0 | 0.0% |
| Not-for-profit Organizations | 15 | 5.0% |
| Local Government Employees | 0 | 0.0% |
| State Government Employees | 0 | 0.0% |
| Federal Government Employees | 36 | 11.9% |
| Unpaid Family Workers | 0 | 0.0% |
| Total | 303 | 100.0% |
Employment Status by Age in Camptown
According to the labor force statistics for Camptown, out of the total population over 16 years of age (543), 63.9% or 347 individuals are in the labor force, with 9.5% or 33 of them unemployed. The age group with the highest labor force participation rate is 16 to 19 years, with 100.0% or 11 individuals in the labor force. Within the labor force, the 20 to 24 years age range has the highest percentage of unemployed individuals, with 34.4% or 33 of them being unemployed.
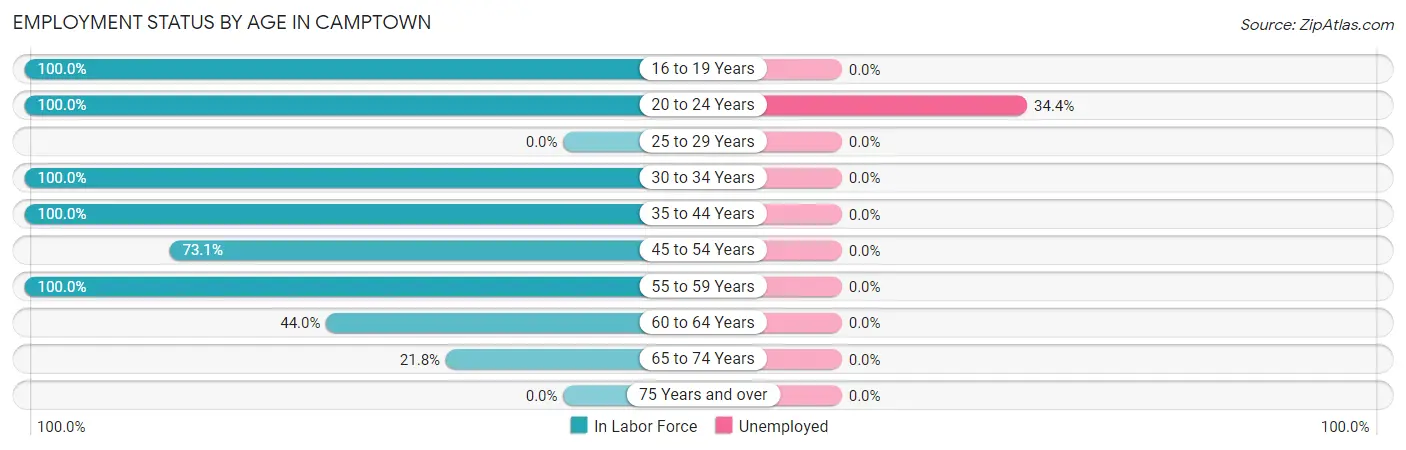
| Age Bracket | In Labor Force | Unemployed |
| 16 to 19 Years | 11 (100.0%) | 0 (0.0%) |
| 20 to 24 Years | 96 (100.0%) | 33 (34.4%) |
| 25 to 29 Years | 0 (0.0%) | 0 (0.0%) |
| 30 to 34 Years | 25 (100.0%) | 0 (0.0%) |
| 35 to 44 Years | 48 (100.0%) | 0 (0.0%) |
| 45 to 54 Years | 76 (73.1%) | 0 (0.0%) |
| 55 to 59 Years | 15 (100.0%) | 0 (0.0%) |
| 60 to 64 Years | 59 (44.0%) | 0 (0.0%) |
| 65 to 74 Years | 17 (21.8%) | 0 (0.0%) |
| 75 Years and over | 0 (0.0%) | 0 (0.0%) |
| Total | 347 (63.9%) | 33 (9.5%) |
Employment Status by Educational Attainment in Camptown
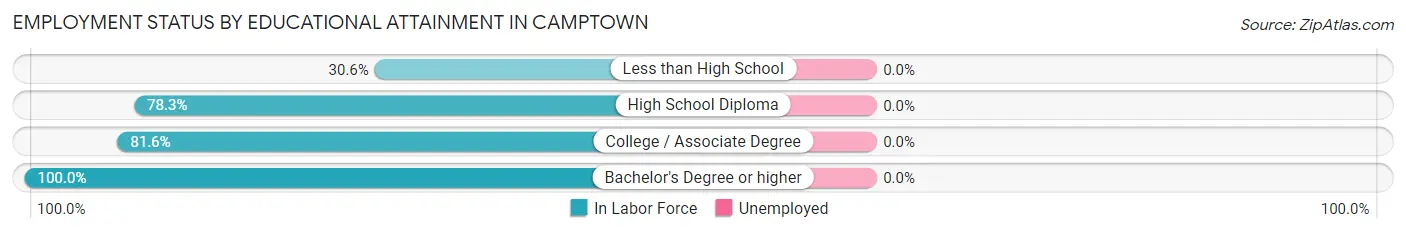
| Educational Attainment | In Labor Force | Unemployed |
| Less than High School | 26 (30.6%) | 0 (0.0%) |
| High School Diploma | 101 (78.3%) | 0 (0.0%) |
| College / Associate Degree | 71 (81.6%) | 0 (0.0%) |
| Bachelor's Degree or higher | 25 (100.0%) | 0 (0.0%) |
| Total | 223 (68.4%) | 0 (0.0%) |
Employment Occupations by Sex in Camptown
Management, Business, Science and Arts Occupations
The most common Management, Business, Science and Arts occupations in Camptown are Business & Financial (39 | 12.4%), and Management (25 | 8.0%).
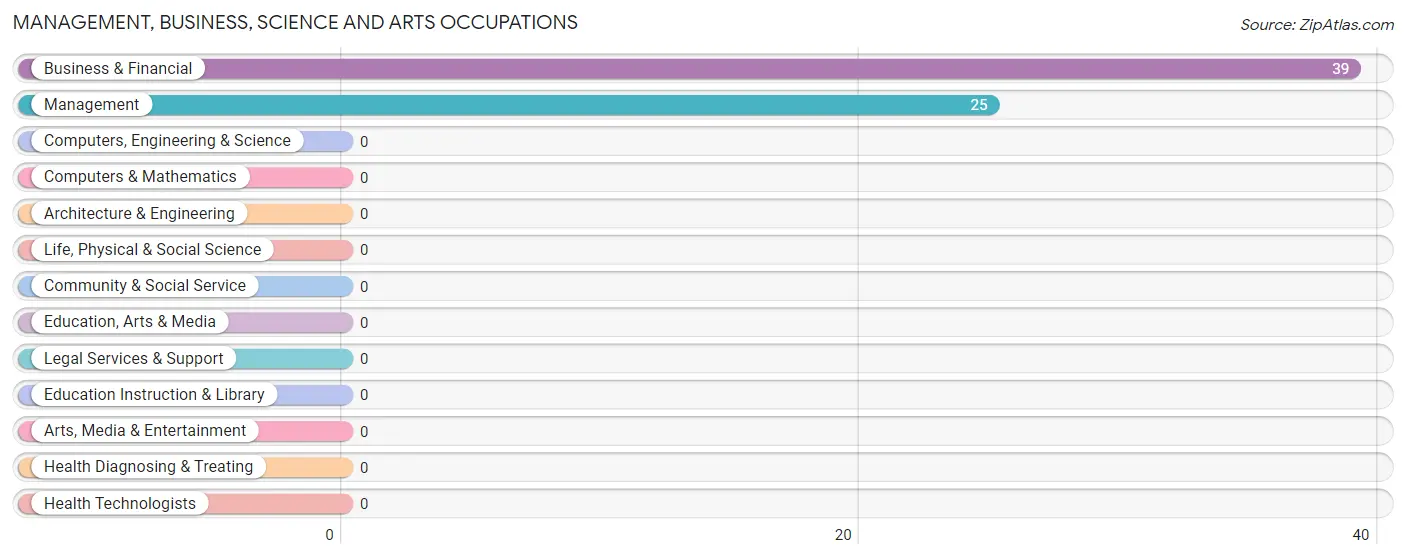
Management, Business, Science and Arts Occupations by Sex
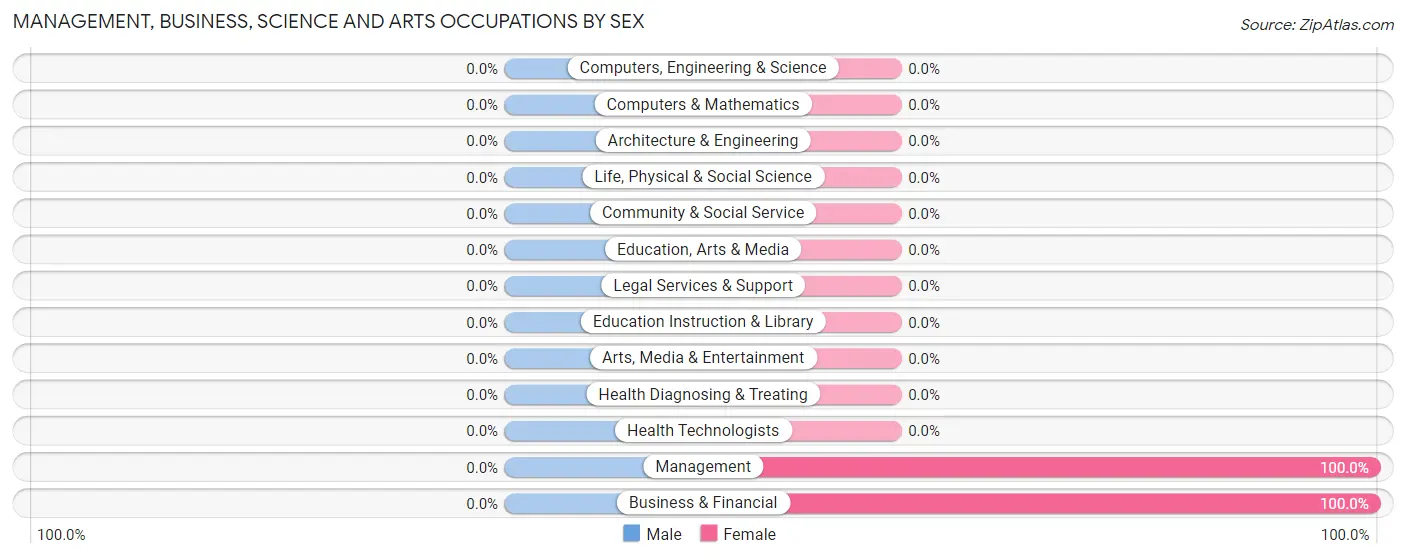
| Occupation | Male | Female |
| Management | 0 (0.0%) | 25 (100.0%) |
| Business & Financial | 0 (0.0%) | 39 (100.0%) |
| Computers, Engineering & Science | 0 (0.0%) | 0 (0.0%) |
| Computers & Mathematics | 0 (0.0%) | 0 (0.0%) |
| Architecture & Engineering | 0 (0.0%) | 0 (0.0%) |
| Life, Physical & Social Science | 0 (0.0%) | 0 (0.0%) |
| Community & Social Service | 0 (0.0%) | 0 (0.0%) |
| Education, Arts & Media | 0 (0.0%) | 0 (0.0%) |
| Legal Services & Support | 0 (0.0%) | 0 (0.0%) |
| Education Instruction & Library | 0 (0.0%) | 0 (0.0%) |
| Arts, Media & Entertainment | 0 (0.0%) | 0 (0.0%) |
| Health Diagnosing & Treating | 0 (0.0%) | 0 (0.0%) |
| Health Technologists | 0 (0.0%) | 0 (0.0%) |
| Total (Category) | 0 (0.0%) | 64 (100.0%) |
| Total (Overall) | 190 (60.5%) | 124 (39.5%) |
Services Occupations
The most common Services occupations in Camptown are , and Food Preparation & Serving (8 | 2.5%).
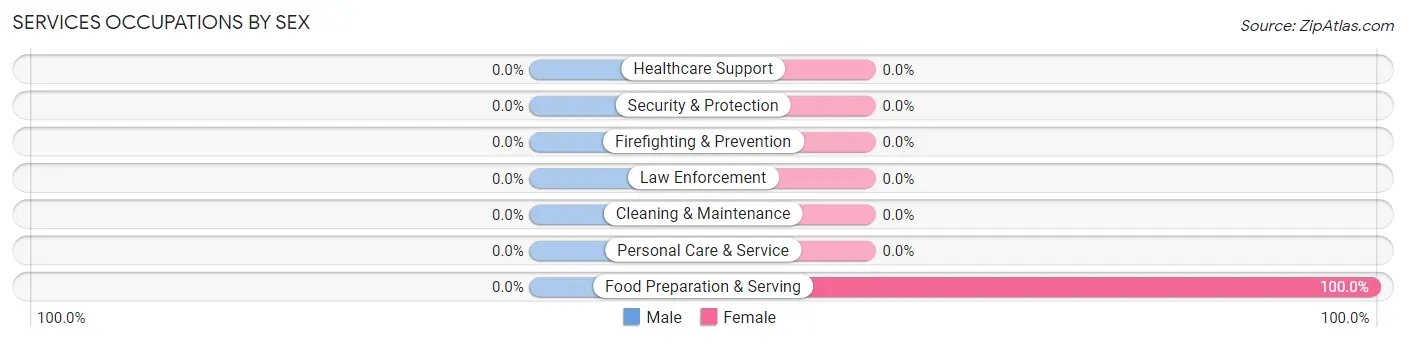
Services Occupations by Sex
| Occupation | Male | Female |
| Healthcare Support | 0 (0.0%) | 0 (0.0%) |
| Security & Protection | 0 (0.0%) | 0 (0.0%) |
| Firefighting & Prevention | 0 (0.0%) | 0 (0.0%) |
| Law Enforcement | 0 (0.0%) | 0 (0.0%) |
| Food Preparation & Serving | 0 (0.0%) | 8 (100.0%) |
| Cleaning & Maintenance | 0 (0.0%) | 0 (0.0%) |
| Personal Care & Service | 0 (0.0%) | 0 (0.0%) |
| Total (Category) | 0 (0.0%) | 8 (100.0%) |
| Total (Overall) | 190 (60.5%) | 124 (39.5%) |
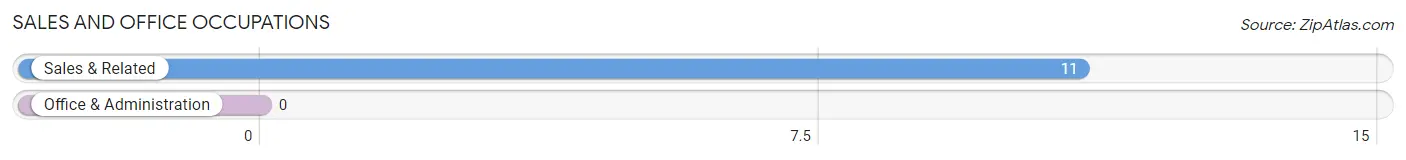
Sales and Office Occupations
The most common Sales and Office occupations in Camptown are , and Sales & Related (11 | 3.5%).
Sales and Office Occupations by Sex
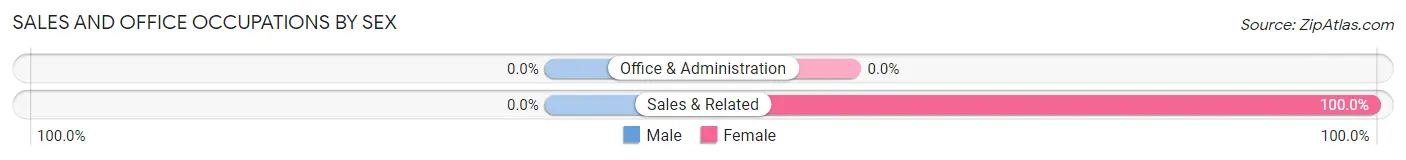
| Occupation | Male | Female |
| Sales & Related | 0 (0.0%) | 11 (100.0%) |
| Office & Administration | 0 (0.0%) | 0 (0.0%) |
| Total (Category) | 0 (0.0%) | 11 (100.0%) |
| Total (Overall) | 190 (60.5%) | 124 (39.5%) |
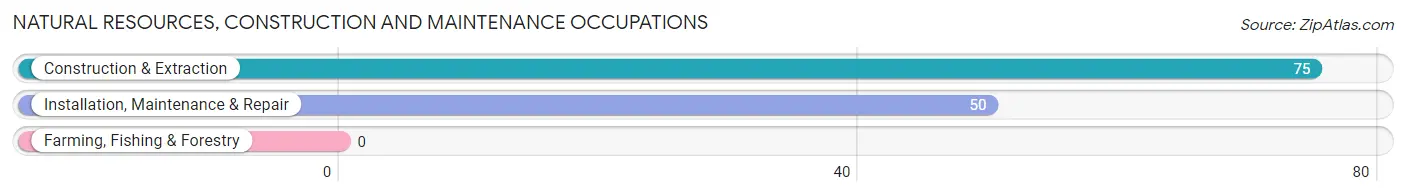
Natural Resources, Construction and Maintenance Occupations
The most common Natural Resources, Construction and Maintenance occupations in Camptown are Construction & Extraction (75 | 23.9%), and Installation, Maintenance & Repair (50 | 15.9%).
Natural Resources, Construction and Maintenance Occupations by Sex
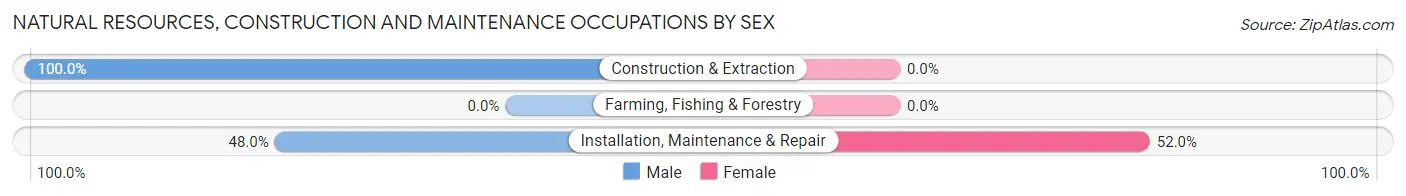
| Occupation | Male | Female |
| Farming, Fishing & Forestry | 0 (0.0%) | 0 (0.0%) |
| Construction & Extraction | 75 (100.0%) | 0 (0.0%) |
| Installation, Maintenance & Repair | 24 (48.0%) | 26 (52.0%) |
| Total (Category) | 99 (79.2%) | 26 (20.8%) |
| Total (Overall) | 190 (60.5%) | 124 (39.5%) |
Production, Transportation and Moving Occupations
The most common Production, Transportation and Moving occupations in Camptown are Material Moving (60 | 19.1%), Production (38 | 12.1%), and Transportation (8 | 2.5%).
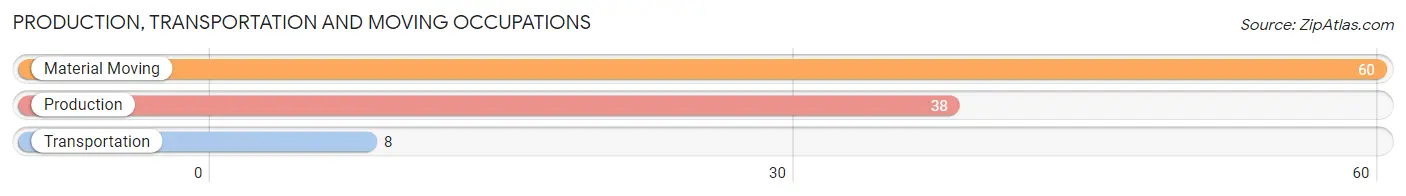
Production, Transportation and Moving Occupations by Sex
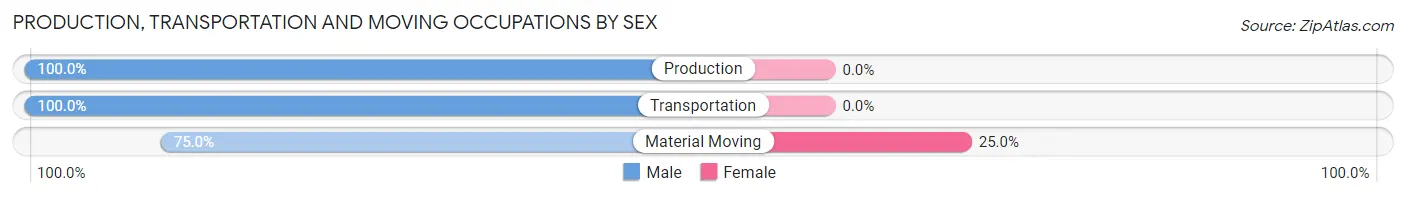
| Occupation | Male | Female |
| Production | 38 (100.0%) | 0 (0.0%) |
| Transportation | 8 (100.0%) | 0 (0.0%) |
| Material Moving | 45 (75.0%) | 15 (25.0%) |
| Total (Category) | 91 (85.9%) | 15 (14.1%) |
| Total (Overall) | 190 (60.5%) | 124 (39.5%) |
Employment Industries by Sex in Camptown
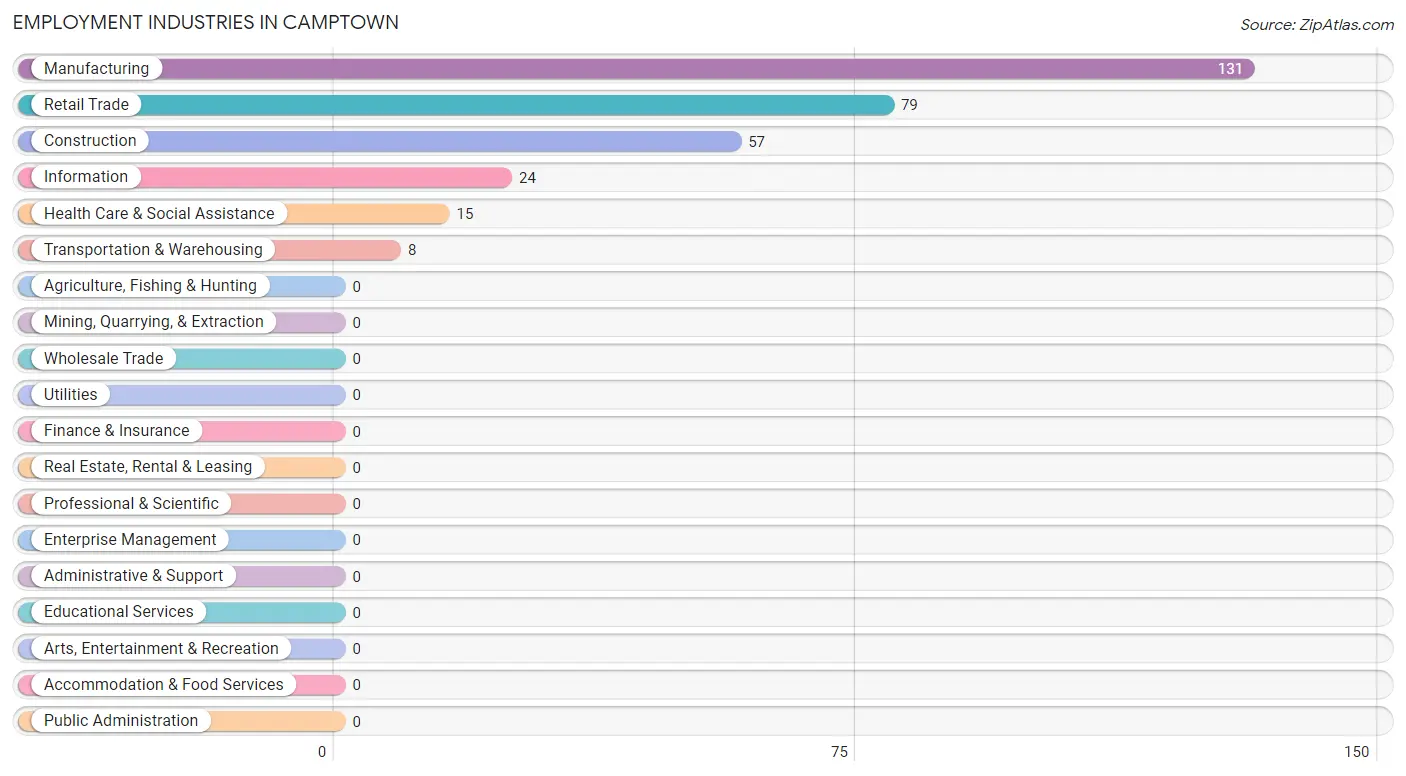
Employment Industries in Camptown
The major employment industries in Camptown include Manufacturing (131 | 41.7%), Retail Trade (79 | 25.2%), Construction (57 | 18.1%), Information (24 | 7.6%), and Health Care & Social Assistance (15 | 4.8%).
Employment Industries by Sex in Camptown
The Camptown industries that see more men than women are Construction (100.0%), Transportation & Warehousing (100.0%), and Information (100.0%), whereas the industries that tend to have a higher number of women are Health Care & Social Assistance (100.0%), Manufacturing (57.3%), and Retail Trade (43.0%).
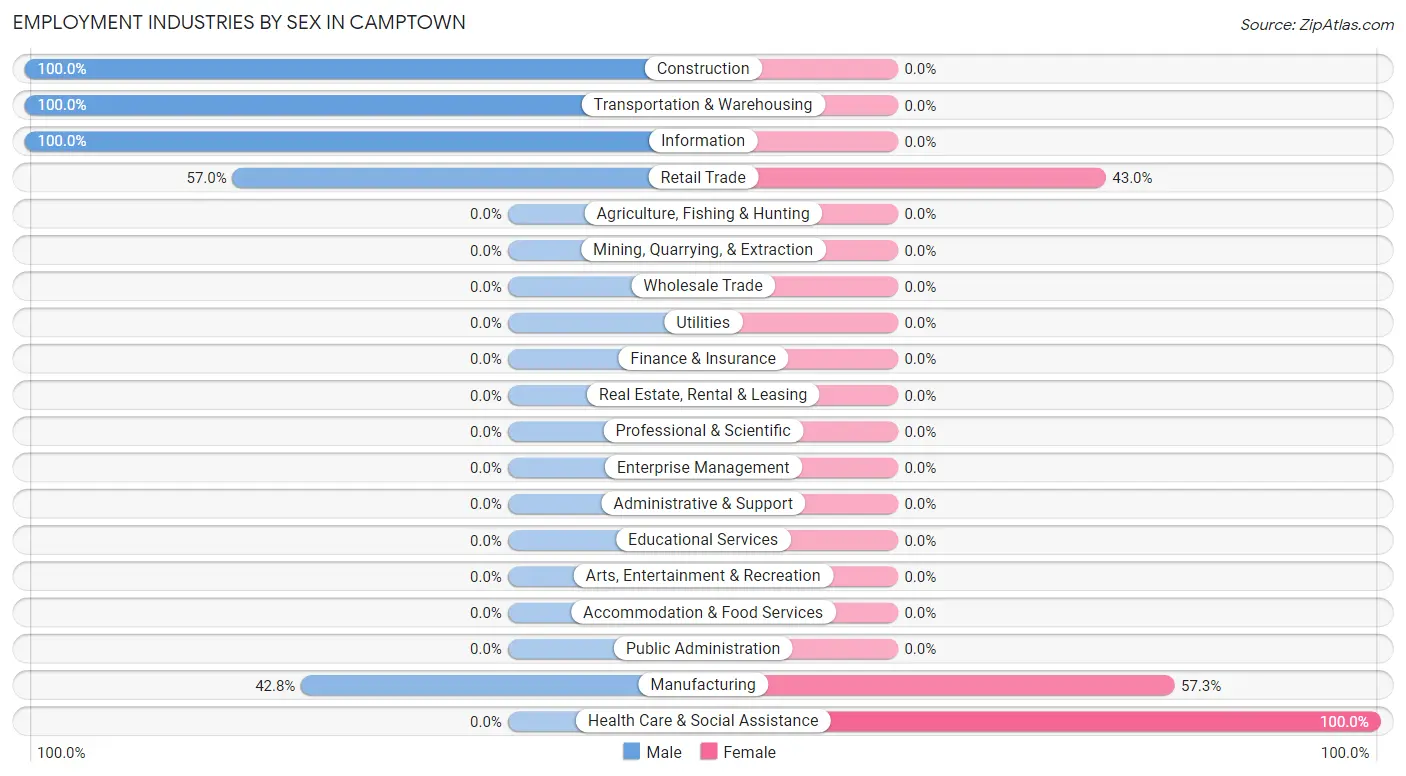
| Industry | Male | Female |
| Agriculture, Fishing & Hunting | 0 (0.0%) | 0 (0.0%) |
| Mining, Quarrying, & Extraction | 0 (0.0%) | 0 (0.0%) |
| Construction | 57 (100.0%) | 0 (0.0%) |
| Manufacturing | 56 (42.7%) | 75 (57.3%) |
| Wholesale Trade | 0 (0.0%) | 0 (0.0%) |
| Retail Trade | 45 (57.0%) | 34 (43.0%) |
| Transportation & Warehousing | 8 (100.0%) | 0 (0.0%) |
| Utilities | 0 (0.0%) | 0 (0.0%) |
| Information | 24 (100.0%) | 0 (0.0%) |
| Finance & Insurance | 0 (0.0%) | 0 (0.0%) |
| Real Estate, Rental & Leasing | 0 (0.0%) | 0 (0.0%) |
| Professional & Scientific | 0 (0.0%) | 0 (0.0%) |
| Enterprise Management | 0 (0.0%) | 0 (0.0%) |
| Administrative & Support | 0 (0.0%) | 0 (0.0%) |
| Educational Services | 0 (0.0%) | 0 (0.0%) |
| Health Care & Social Assistance | 0 (0.0%) | 15 (100.0%) |
| Arts, Entertainment & Recreation | 0 (0.0%) | 0 (0.0%) |
| Accommodation & Food Services | 0 (0.0%) | 0 (0.0%) |
| Public Administration | 0 (0.0%) | 0 (0.0%) |
| Total | 190 (60.5%) | 124 (39.5%) |
Education in Camptown
School Enrollment in Camptown
The most common levels of schooling among the 113 students in Camptown are high school (84 | 74.3%), and college / undergraduate (29 | 25.7%).
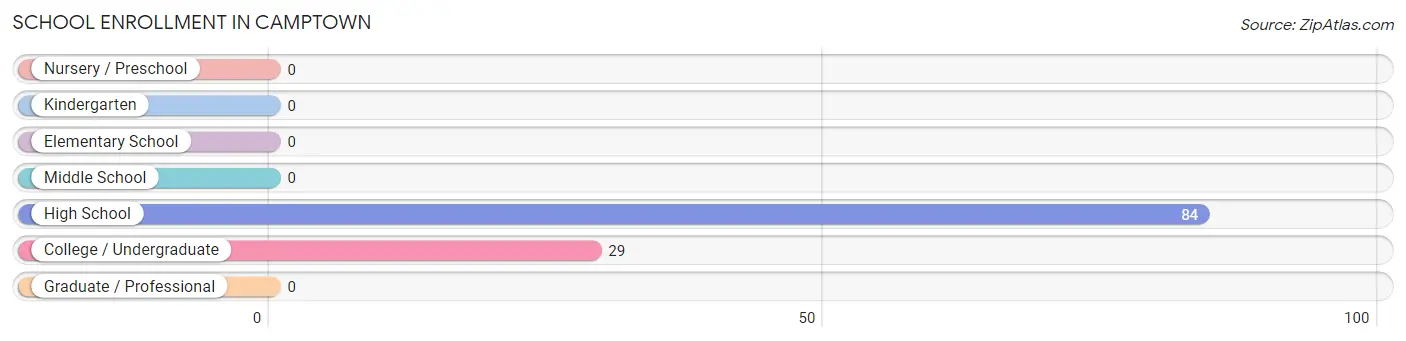
| School Level | # Students | % Students |
| Nursery / Preschool | 0 | 0.0% |
| Kindergarten | 0 | 0.0% |
| Elementary School | 0 | 0.0% |
| Middle School | 0 | 0.0% |
| High School | 84 | 74.3% |
| College / Undergraduate | 29 | 25.7% |
| Graduate / Professional | 0 | 0.0% |
| Total | 113 | 100.0% |
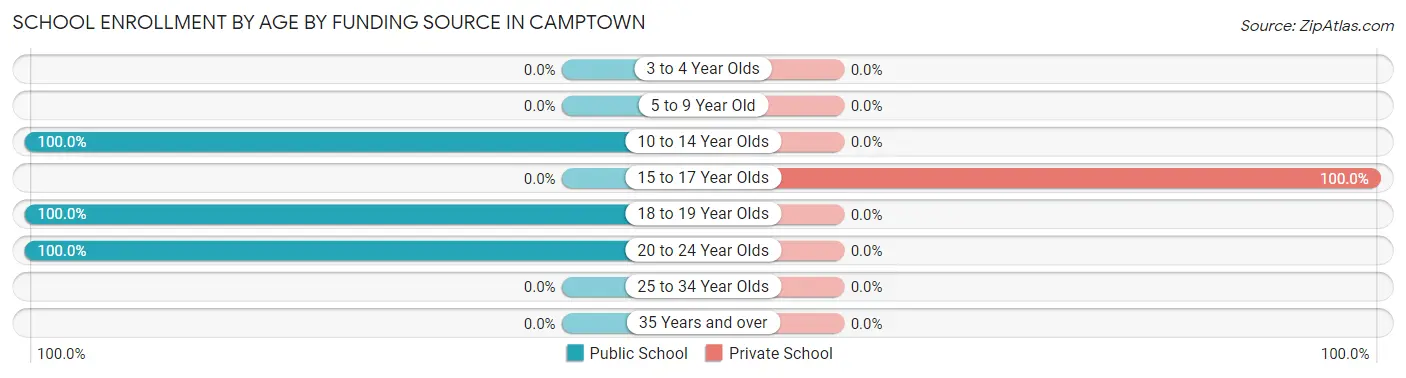
School Enrollment by Age by Funding Source in Camptown
Out of a total of 113 students who are enrolled in schools in Camptown, 78 (69.0%) attend a private institution, while the remaining 35 (31.0%) are enrolled in public schools. The age group of 15 to 17 year olds has the highest likelihood of being enrolled in private schools, with 78 (100.0% in the age bracket) enrolled. Conversely, the age group of 10 to 14 year olds has the lowest likelihood of being enrolled in a private school, with 6 (100.0% in the age bracket) attending a public institution.
| Age Bracket | Public School | Private School |
| 3 to 4 Year Olds | 0 (0.0%) | 0 (0.0%) |
| 5 to 9 Year Old | 0 (0.0%) | 0 (0.0%) |
| 10 to 14 Year Olds | 6 (100.0%) | 0 (0.0%) |
| 15 to 17 Year Olds | 0 (0.0%) | 78 (100.0%) |
| 18 to 19 Year Olds | 11 (100.0%) | 0 (0.0%) |
| 20 to 24 Year Olds | 18 (100.0%) | 0 (0.0%) |
| 25 to 34 Year Olds | 0 (0.0%) | 0 (0.0%) |
| 35 Years and over | 0 (0.0%) | 0 (0.0%) |
| Total | 35 (31.0%) | 78 (69.0%) |
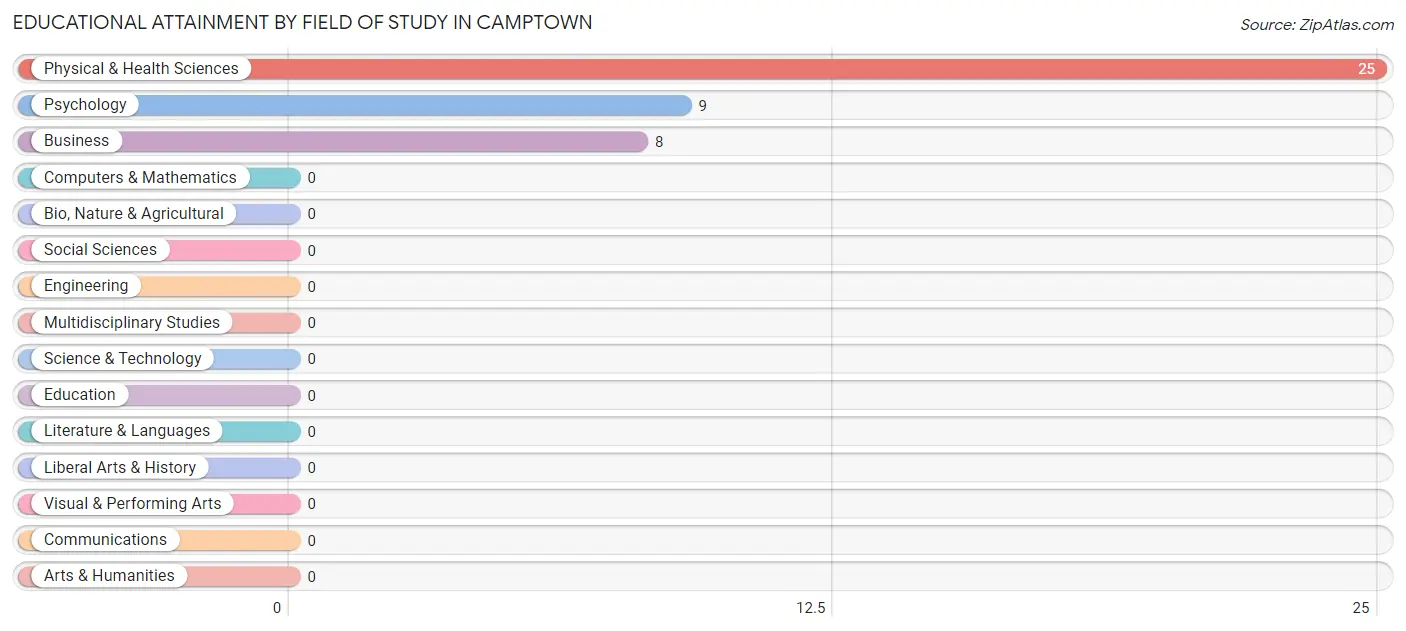
Educational Attainment by Field of Study in Camptown
Physical & health sciences (25 | 59.5%), psychology (9 | 21.4%), and business (8 | 19.1%) are the most common fields of study among 42 individuals in Camptown who have obtained a bachelor's degree or higher.
| Field of Study | # Graduates | % Graduates |
| Computers & Mathematics | 0 | 0.0% |
| Bio, Nature & Agricultural | 0 | 0.0% |
| Physical & Health Sciences | 25 | 59.5% |
| Psychology | 9 | 21.4% |
| Social Sciences | 0 | 0.0% |
| Engineering | 0 | 0.0% |
| Multidisciplinary Studies | 0 | 0.0% |
| Science & Technology | 0 | 0.0% |
| Business | 8 | 19.1% |
| Education | 0 | 0.0% |
| Literature & Languages | 0 | 0.0% |
| Liberal Arts & History | 0 | 0.0% |
| Visual & Performing Arts | 0 | 0.0% |
| Communications | 0 | 0.0% |
| Arts & Humanities | 0 | 0.0% |
| Total | 42 | 100.0% |
Transportation & Commute in Camptown
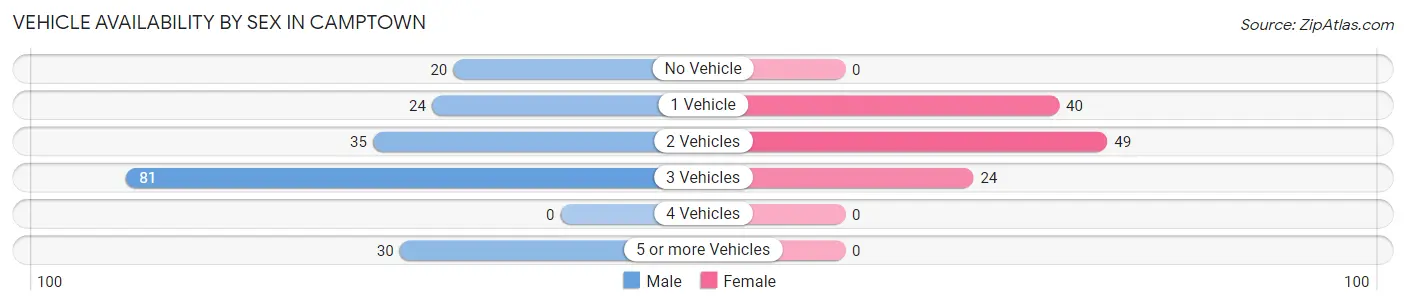
Vehicle Availability by Sex in Camptown
The most prevalent vehicle ownership categories in Camptown are males with 3 vehicles (81, accounting for 42.6%) and females with 3 vehicles (24, making up 71.7%).
| Vehicles Available | Male | Female |
| No Vehicle | 20 (10.5%) | 0 (0.0%) |
| 1 Vehicle | 24 (12.6%) | 40 (35.4%) |
| 2 Vehicles | 35 (18.4%) | 49 (43.4%) |
| 3 Vehicles | 81 (42.6%) | 24 (21.2%) |
| 4 Vehicles | 0 (0.0%) | 0 (0.0%) |
| 5 or more Vehicles | 30 (15.8%) | 0 (0.0%) |
| Total | 190 (100.0%) | 113 (100.0%) |
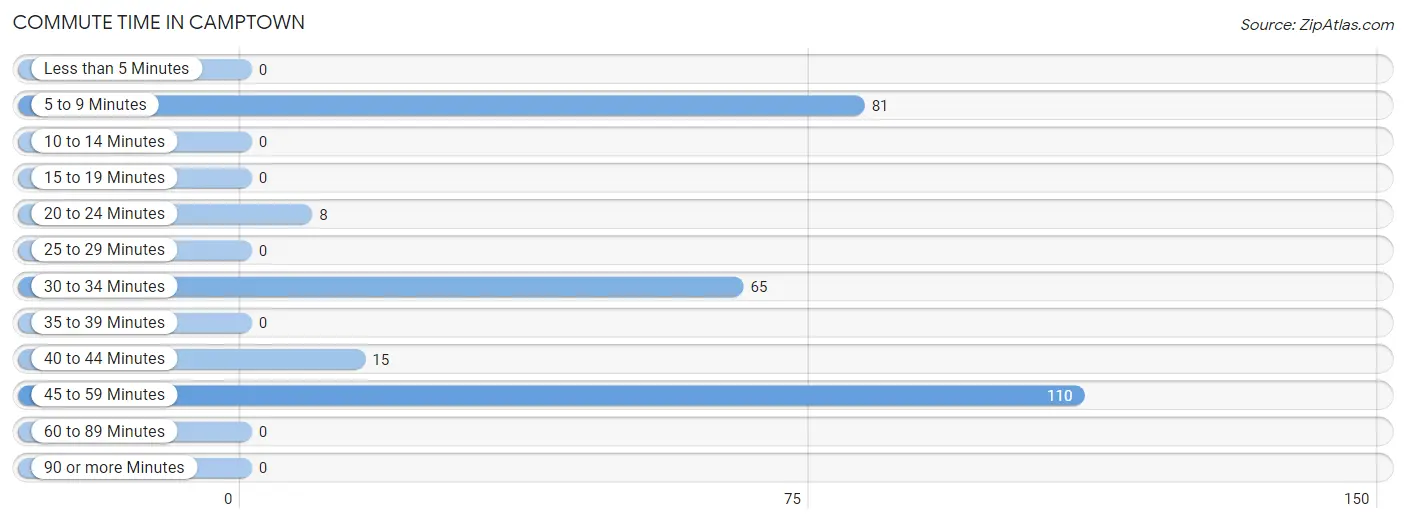
Commute Time in Camptown
The most frequently occuring commute durations in Camptown are 45 to 59 minutes (110 commuters, 39.4%), 5 to 9 minutes (81 commuters, 29.0%), and 30 to 34 minutes (65 commuters, 23.3%).
| Commute Time | # Commuters | % Commuters |
| Less than 5 Minutes | 0 | 0.0% |
| 5 to 9 Minutes | 81 | 29.0% |
| 10 to 14 Minutes | 0 | 0.0% |
| 15 to 19 Minutes | 0 | 0.0% |
| 20 to 24 Minutes | 8 | 2.9% |
| 25 to 29 Minutes | 0 | 0.0% |
| 30 to 34 Minutes | 65 | 23.3% |
| 35 to 39 Minutes | 0 | 0.0% |
| 40 to 44 Minutes | 15 | 5.4% |
| 45 to 59 Minutes | 110 | 39.4% |
| 60 to 89 Minutes | 0 | 0.0% |
| 90 or more Minutes | 0 | 0.0% |
Commute Time by Sex in Camptown
The most common commute times in Camptown are 45 to 59 minutes (84 commuters, 50.6%) for males and 5 to 9 minutes (72 commuters, 63.7%) for females.
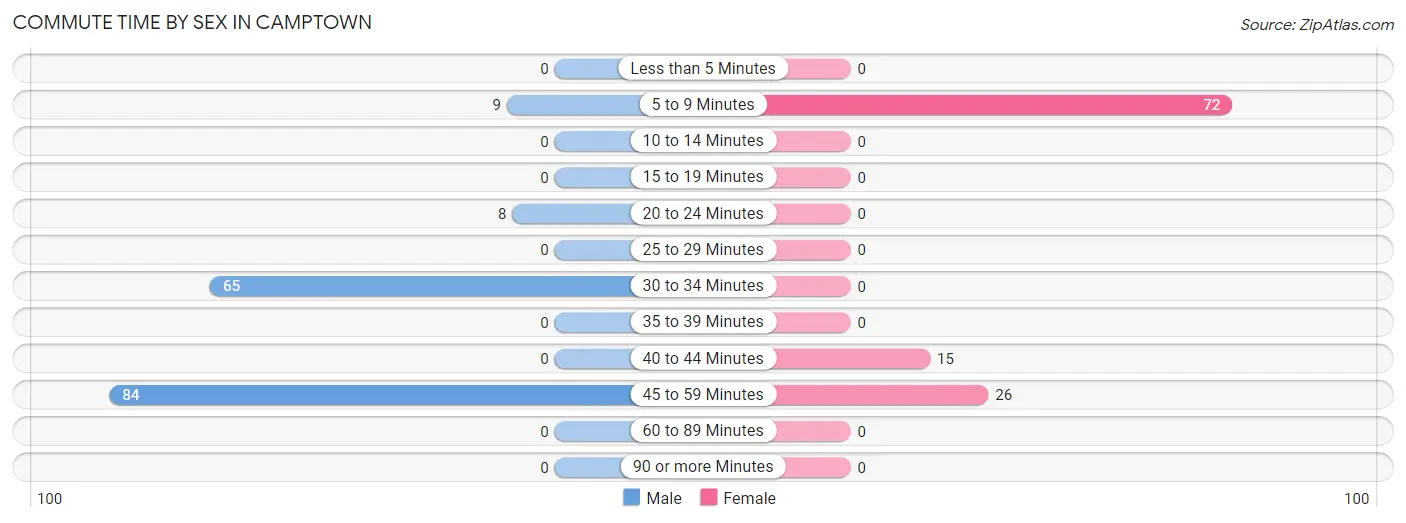
| Commute Time | Male | Female |
| Less than 5 Minutes | 0 (0.0%) | 0 (0.0%) |
| 5 to 9 Minutes | 9 (5.4%) | 72 (63.7%) |
| 10 to 14 Minutes | 0 (0.0%) | 0 (0.0%) |
| 15 to 19 Minutes | 0 (0.0%) | 0 (0.0%) |
| 20 to 24 Minutes | 8 (4.8%) | 0 (0.0%) |
| 25 to 29 Minutes | 0 (0.0%) | 0 (0.0%) |
| 30 to 34 Minutes | 65 (39.2%) | 0 (0.0%) |
| 35 to 39 Minutes | 0 (0.0%) | 0 (0.0%) |
| 40 to 44 Minutes | 0 (0.0%) | 15 (13.3%) |
| 45 to 59 Minutes | 84 (50.6%) | 26 (23.0%) |
| 60 to 89 Minutes | 0 (0.0%) | 0 (0.0%) |
| 90 or more Minutes | 0 (0.0%) | 0 (0.0%) |
Time of Departure to Work by Sex in Camptown
The most frequent times of departure to work in Camptown are 12:00 AM to 4:59 AM (80, 48.2%) for males and 5:30 AM to 5:59 AM (39, 34.5%) for females.
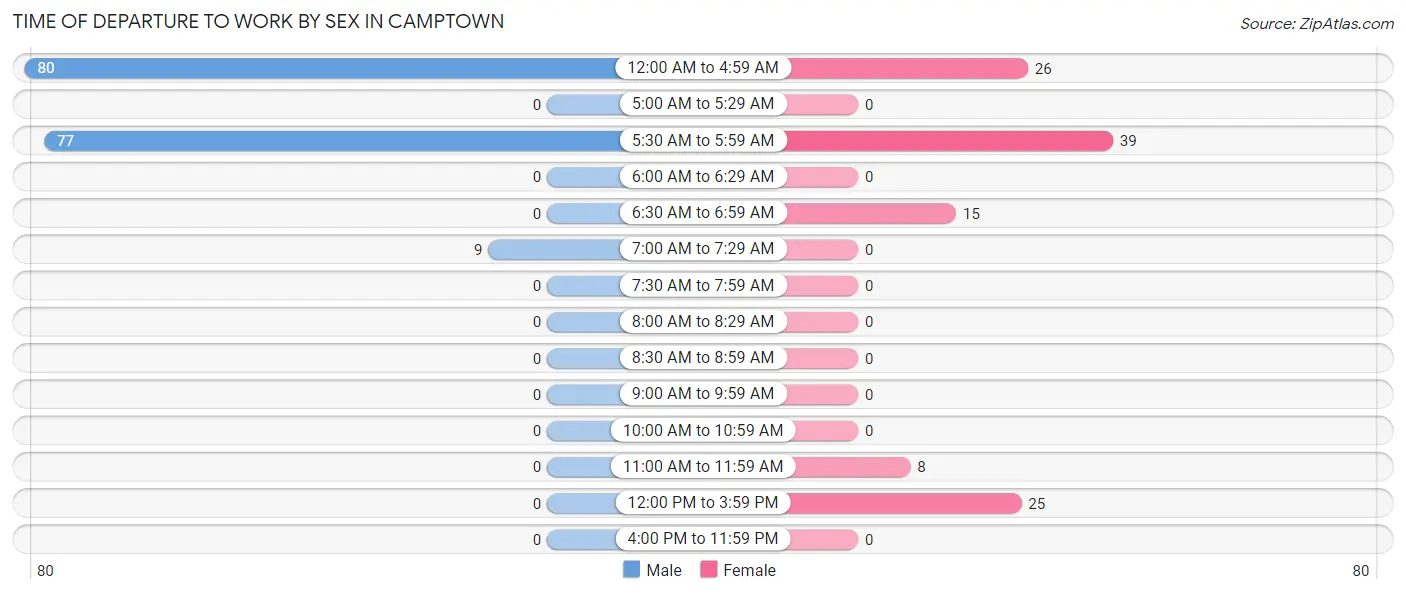
| Time of Departure | Male | Female |
| 12:00 AM to 4:59 AM | 80 (48.2%) | 26 (23.0%) |
| 5:00 AM to 5:29 AM | 0 (0.0%) | 0 (0.0%) |
| 5:30 AM to 5:59 AM | 77 (46.4%) | 39 (34.5%) |
| 6:00 AM to 6:29 AM | 0 (0.0%) | 0 (0.0%) |
| 6:30 AM to 6:59 AM | 0 (0.0%) | 15 (13.3%) |
| 7:00 AM to 7:29 AM | 9 (5.4%) | 0 (0.0%) |
| 7:30 AM to 7:59 AM | 0 (0.0%) | 0 (0.0%) |
| 8:00 AM to 8:29 AM | 0 (0.0%) | 0 (0.0%) |
| 8:30 AM to 8:59 AM | 0 (0.0%) | 0 (0.0%) |
| 9:00 AM to 9:59 AM | 0 (0.0%) | 0 (0.0%) |
| 10:00 AM to 10:59 AM | 0 (0.0%) | 0 (0.0%) |
| 11:00 AM to 11:59 AM | 0 (0.0%) | 8 (7.1%) |
| 12:00 PM to 3:59 PM | 0 (0.0%) | 25 (22.1%) |
| 4:00 PM to 11:59 PM | 0 (0.0%) | 0 (0.0%) |
| Total | 166 (100.0%) | 113 (100.0%) |
Housing Occupancy in Camptown
Occupancy by Ownership in Camptown
Of the total 281 dwellings in Camptown, owner-occupied units account for 108 (38.4%), while renter-occupied units make up 173 (61.6%).
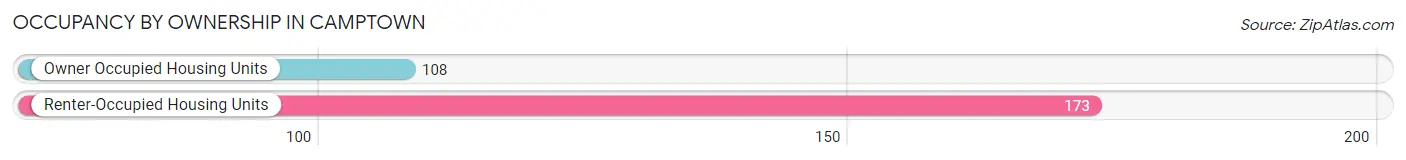
| Occupancy | # Housing Units | % Housing Units |
| Owner Occupied Housing Units | 108 | 38.4% |
| Renter-Occupied Housing Units | 173 | 61.6% |
| Total Occupied Housing Units | 281 | 100.0% |
Occupancy by Household Size in Camptown
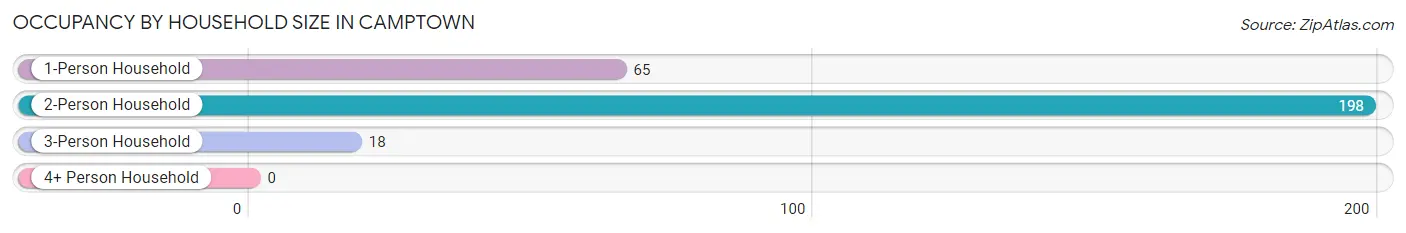
| Household Size | # Housing Units | % Housing Units |
| 1-Person Household | 65 | 23.1% |
| 2-Person Household | 198 | 70.5% |
| 3-Person Household | 18 | 6.4% |
| 4+ Person Household | 0 | 0.0% |
| Total Housing Units | 281 | 100.0% |
Occupancy by Ownership by Household Size in Camptown
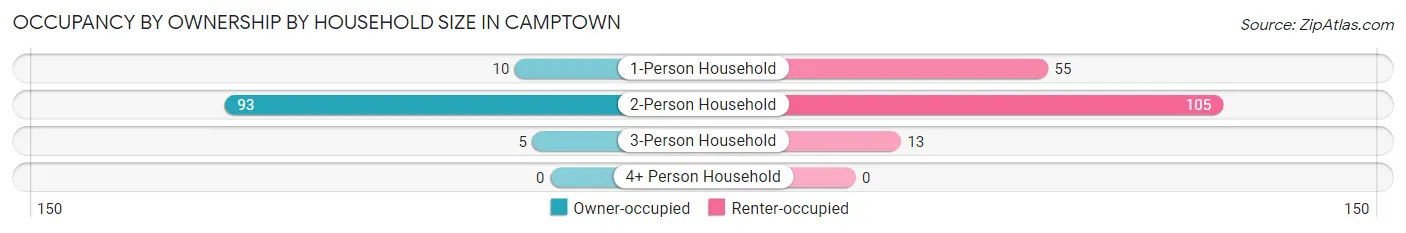
| Household Size | Owner-occupied | Renter-occupied |
| 1-Person Household | 10 (15.4%) | 55 (84.6%) |
| 2-Person Household | 93 (47.0%) | 105 (53.0%) |
| 3-Person Household | 5 (27.8%) | 13 (72.2%) |
| 4+ Person Household | 0 (0.0%) | 0 (0.0%) |
| Total Housing Units | 108 (38.4%) | 173 (61.6%) |
Occupancy by Educational Attainment in Camptown
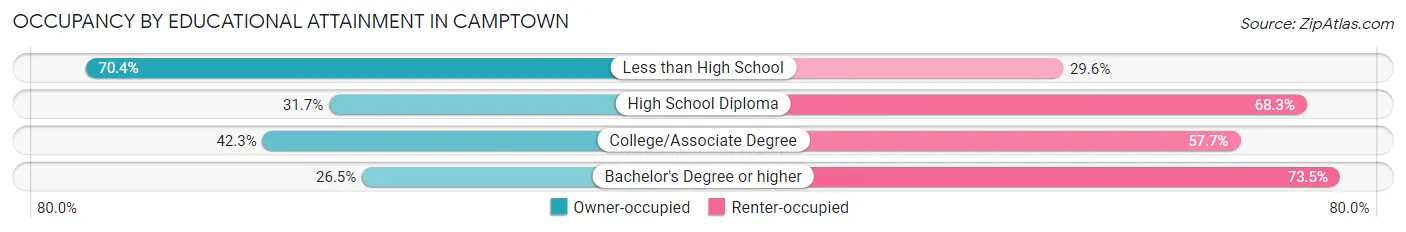
| Household Size | Owner-occupied | Renter-occupied |
| Less than High School | 19 (70.4%) | 8 (29.6%) |
| High School Diploma | 39 (31.7%) | 84 (68.3%) |
| College/Associate Degree | 41 (42.3%) | 56 (57.7%) |
| Bachelor's Degree or higher | 9 (26.5%) | 25 (73.5%) |
Occupancy by Age of Householder in Camptown
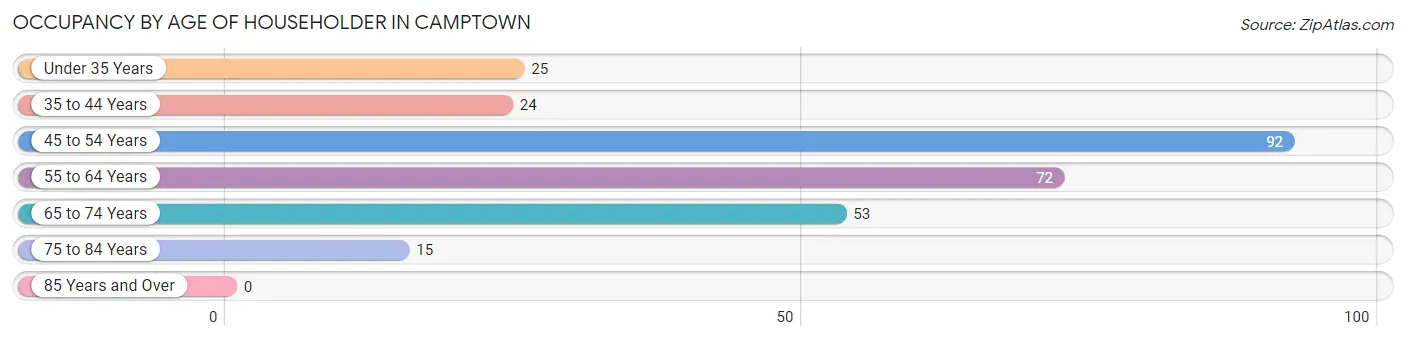
| Age Bracket | # Households | % Households |
| Under 35 Years | 25 | 8.9% |
| 35 to 44 Years | 24 | 8.5% |
| 45 to 54 Years | 92 | 32.7% |
| 55 to 64 Years | 72 | 25.6% |
| 65 to 74 Years | 53 | 18.9% |
| 75 to 84 Years | 15 | 5.3% |
| 85 Years and Over | 0 | 0.0% |
| Total | 281 | 100.0% |
Housing Finances in Camptown
Median Income by Occupancy in Camptown
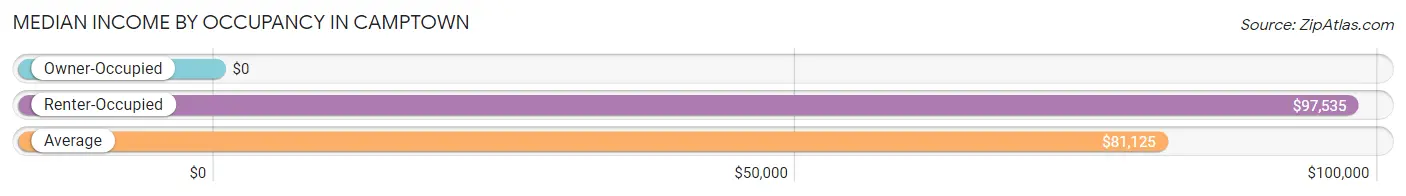
| Occupancy Type | # Households | Median Income |
| Owner-Occupied | 108 (38.4%) | $0 |
| Renter-Occupied | 173 (61.6%) | $97,535 |
| Average | 281 (100.0%) | $81,125 |
Occupancy by Householder Income Bracket in Camptown
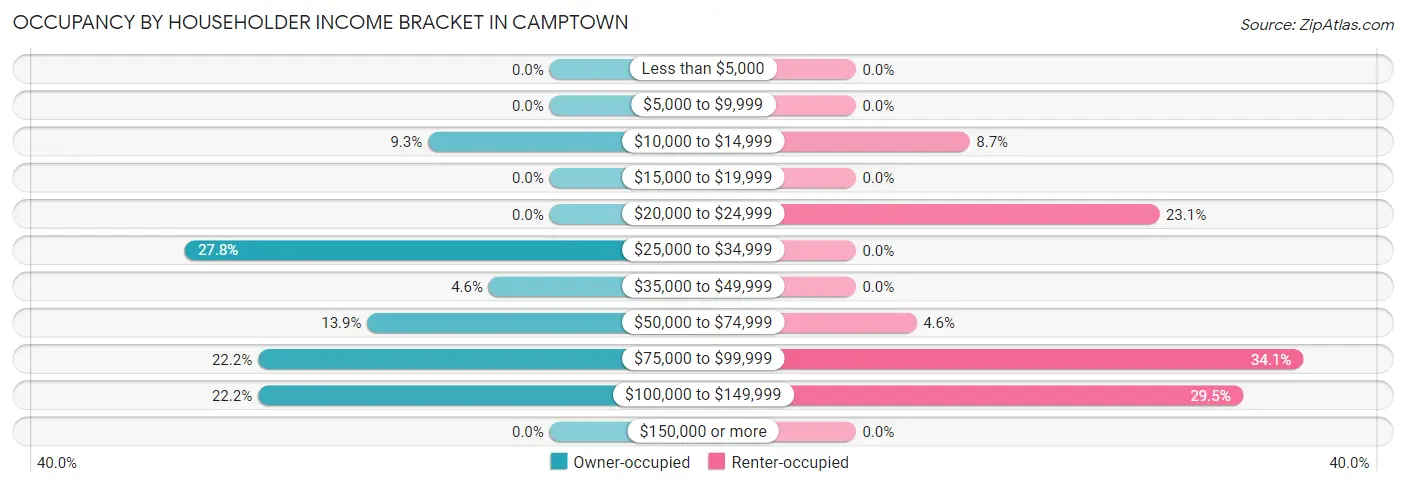
| Income Bracket | Owner-occupied | Renter-occupied |
| Less than $5,000 | 0 (0.0%) | 0 (0.0%) |
| $5,000 to $9,999 | 0 (0.0%) | 0 (0.0%) |
| $10,000 to $14,999 | 10 (9.3%) | 15 (8.7%) |
| $15,000 to $19,999 | 0 (0.0%) | 0 (0.0%) |
| $20,000 to $24,999 | 0 (0.0%) | 40 (23.1%) |
| $25,000 to $34,999 | 30 (27.8%) | 0 (0.0%) |
| $35,000 to $49,999 | 5 (4.6%) | 0 (0.0%) |
| $50,000 to $74,999 | 15 (13.9%) | 8 (4.6%) |
| $75,000 to $99,999 | 24 (22.2%) | 59 (34.1%) |
| $100,000 to $149,999 | 24 (22.2%) | 51 (29.5%) |
| $150,000 or more | 0 (0.0%) | 0 (0.0%) |
| Total | 108 (100.0%) | 173 (100.0%) |
Monthly Housing Cost Tiers in Camptown
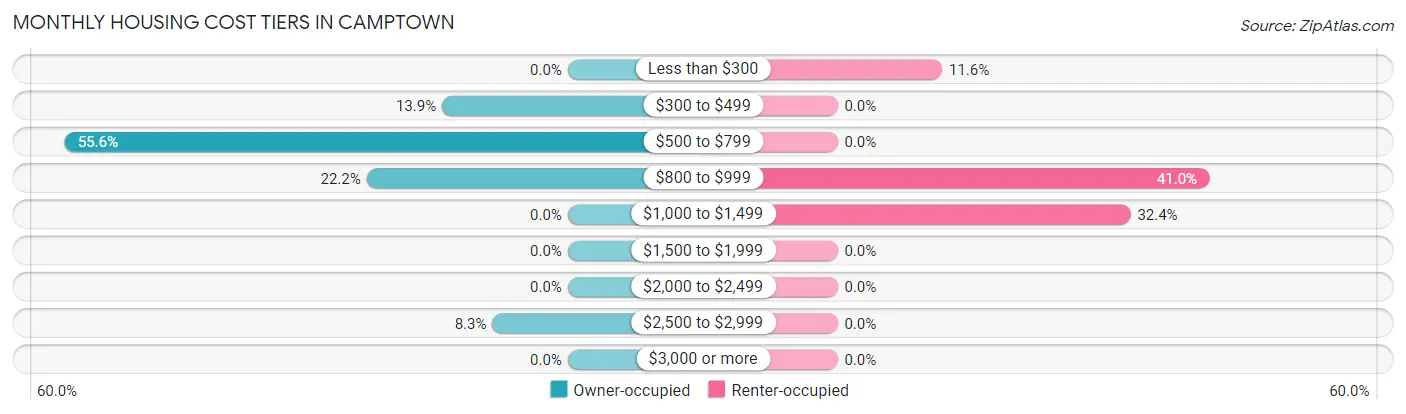
| Monthly Cost | Owner-occupied | Renter-occupied |
| Less than $300 | 0 (0.0%) | 20 (11.6%) |
| $300 to $499 | 15 (13.9%) | 0 (0.0%) |
| $500 to $799 | 60 (55.6%) | 0 (0.0%) |
| $800 to $999 | 24 (22.2%) | 71 (41.0%) |
| $1,000 to $1,499 | 0 (0.0%) | 56 (32.4%) |
| $1,500 to $1,999 | 0 (0.0%) | 0 (0.0%) |
| $2,000 to $2,499 | 0 (0.0%) | 0 (0.0%) |
| $2,500 to $2,999 | 9 (8.3%) | 0 (0.0%) |
| $3,000 or more | 0 (0.0%) | 0 (0.0%) |
| Total | 108 (100.0%) | 173 (100.0%) |
Physical Housing Characteristics in Camptown
Housing Structures in Camptown
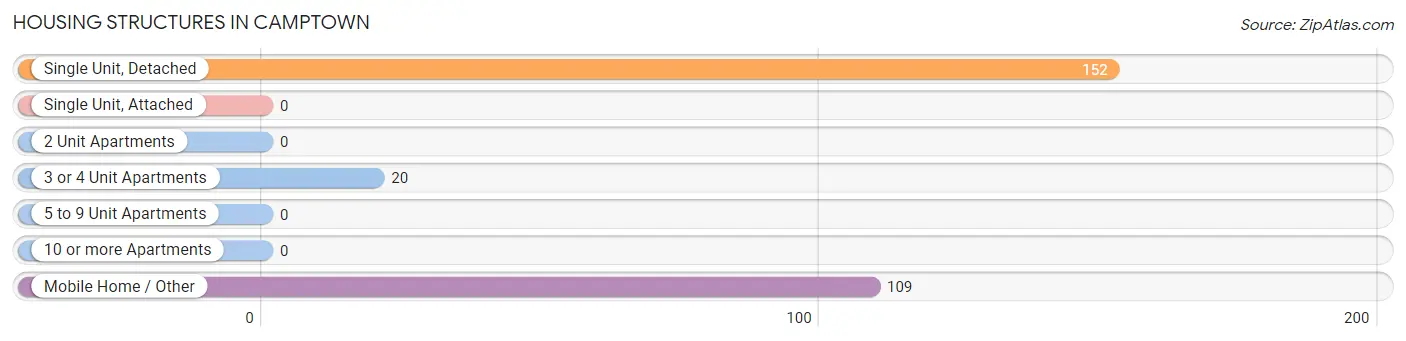
| Structure Type | # Housing Units | % Housing Units |
| Single Unit, Detached | 152 | 54.1% |
| Single Unit, Attached | 0 | 0.0% |
| 2 Unit Apartments | 0 | 0.0% |
| 3 or 4 Unit Apartments | 20 | 7.1% |
| 5 to 9 Unit Apartments | 0 | 0.0% |
| 10 or more Apartments | 0 | 0.0% |
| Mobile Home / Other | 109 | 38.8% |
| Total | 281 | 100.0% |
Housing Structures by Occupancy in Camptown
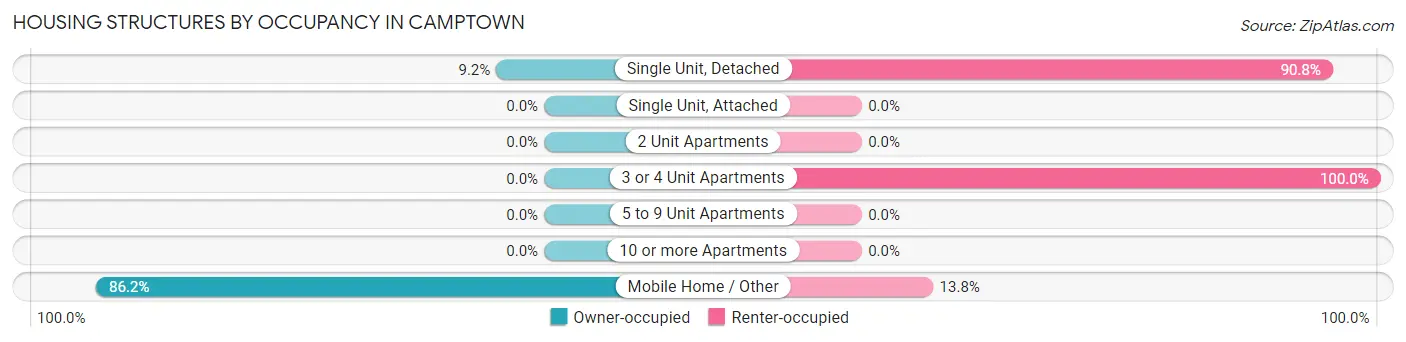
| Structure Type | Owner-occupied | Renter-occupied |
| Single Unit, Detached | 14 (9.2%) | 138 (90.8%) |
| Single Unit, Attached | 0 (0.0%) | 0 (0.0%) |
| 2 Unit Apartments | 0 (0.0%) | 0 (0.0%) |
| 3 or 4 Unit Apartments | 0 (0.0%) | 20 (100.0%) |
| 5 to 9 Unit Apartments | 0 (0.0%) | 0 (0.0%) |
| 10 or more Apartments | 0 (0.0%) | 0 (0.0%) |
| Mobile Home / Other | 94 (86.2%) | 15 (13.8%) |
| Total | 108 (38.4%) | 173 (61.6%) |
Housing Structures by Number of Rooms in Camptown
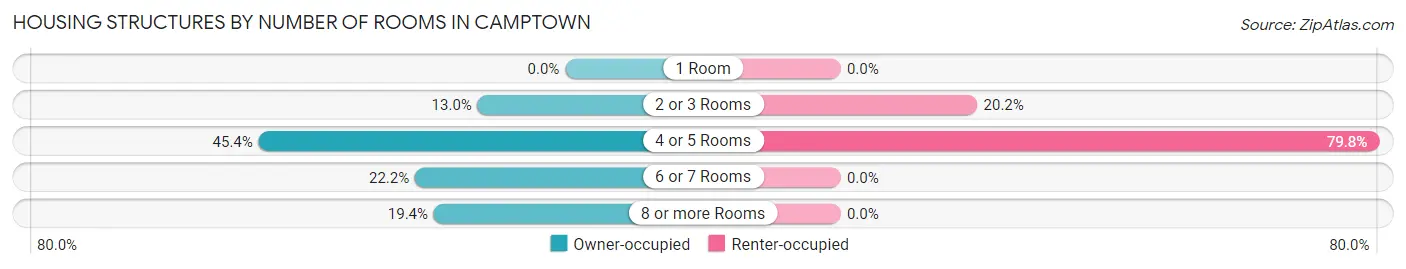
| Number of Rooms | Owner-occupied | Renter-occupied |
| 1 Room | 0 (0.0%) | 0 (0.0%) |
| 2 or 3 Rooms | 14 (13.0%) | 35 (20.2%) |
| 4 or 5 Rooms | 49 (45.4%) | 138 (79.8%) |
| 6 or 7 Rooms | 24 (22.2%) | 0 (0.0%) |
| 8 or more Rooms | 21 (19.4%) | 0 (0.0%) |
| Total | 108 (100.0%) | 173 (100.0%) |
Housing Structure by Heating Type in Camptown
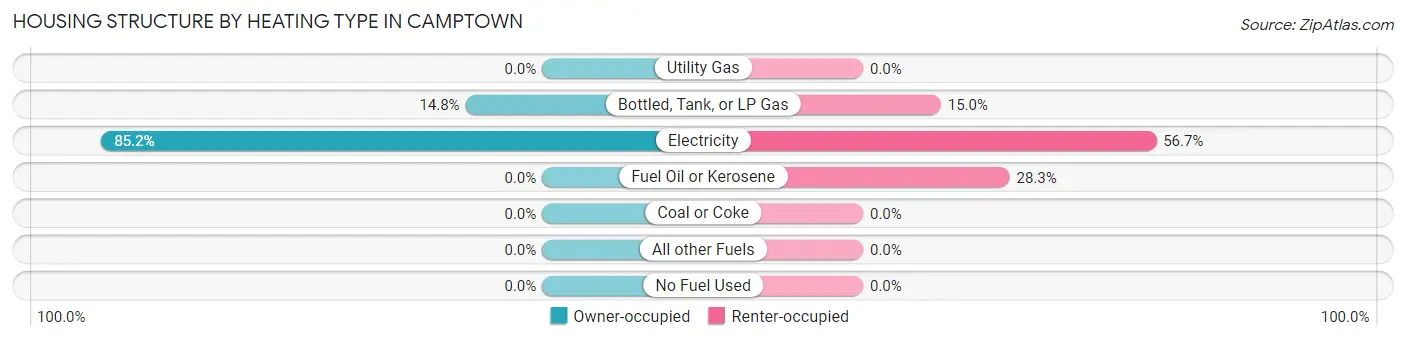
| Heating Type | Owner-occupied | Renter-occupied |
| Utility Gas | 0 (0.0%) | 0 (0.0%) |
| Bottled, Tank, or LP Gas | 16 (14.8%) | 26 (15.0%) |
| Electricity | 92 (85.2%) | 98 (56.7%) |
| Fuel Oil or Kerosene | 0 (0.0%) | 49 (28.3%) |
| Coal or Coke | 0 (0.0%) | 0 (0.0%) |
| All other Fuels | 0 (0.0%) | 0 (0.0%) |
| No Fuel Used | 0 (0.0%) | 0 (0.0%) |
| Total | 108 (100.0%) | 173 (100.0%) |
Household Vehicle Usage in Camptown
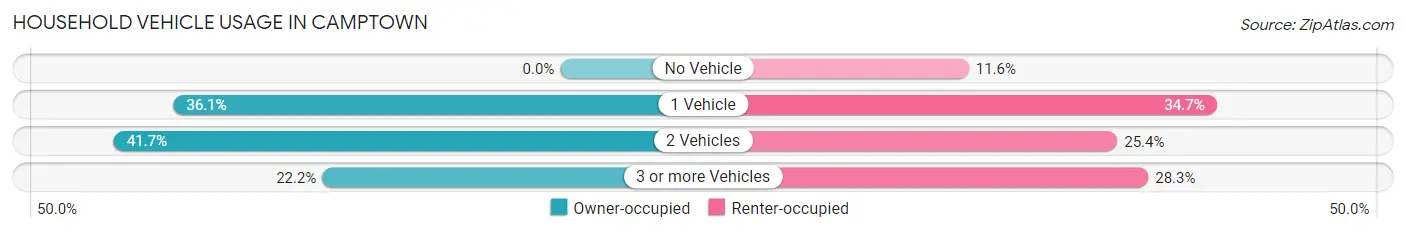
| Vehicles per Household | Owner-occupied | Renter-occupied |
| No Vehicle | 0 (0.0%) | 20 (11.6%) |
| 1 Vehicle | 39 (36.1%) | 60 (34.7%) |
| 2 Vehicles | 45 (41.7%) | 44 (25.4%) |
| 3 or more Vehicles | 24 (22.2%) | 49 (28.3%) |
| Total | 108 (100.0%) | 173 (100.0%) |
Real Estate & Mortgages in Camptown
Real Estate and Mortgage Overview in Camptown
| Characteristic | Without Mortgage | With Mortgage |
| Housing Units | 99 | 9 |
| Median Property Value | - | - |
| Median Household Income | $60,750 | $0 |
| Monthly Housing Costs | $672 | $0 |
| Real Estate Taxes | - | - |
Property Value by Mortgage Status in Camptown
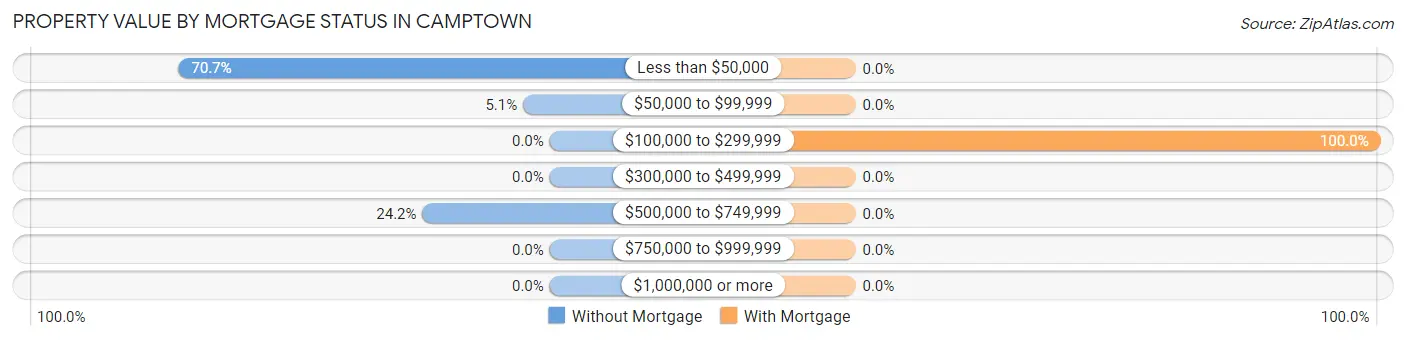
| Property Value | Without Mortgage | With Mortgage |
| Less than $50,000 | 70 (70.7%) | 0 (0.0%) |
| $50,000 to $99,999 | 5 (5.1%) | 0 (0.0%) |
| $100,000 to $299,999 | 0 (0.0%) | 9 (100.0%) |
| $300,000 to $499,999 | 0 (0.0%) | 0 (0.0%) |
| $500,000 to $749,999 | 24 (24.2%) | 0 (0.0%) |
| $750,000 to $999,999 | 0 (0.0%) | 0 (0.0%) |
| $1,000,000 or more | 0 (0.0%) | 0 (0.0%) |
| Total | 99 (100.0%) | 9 (100.0%) |
Household Income by Mortgage Status in Camptown
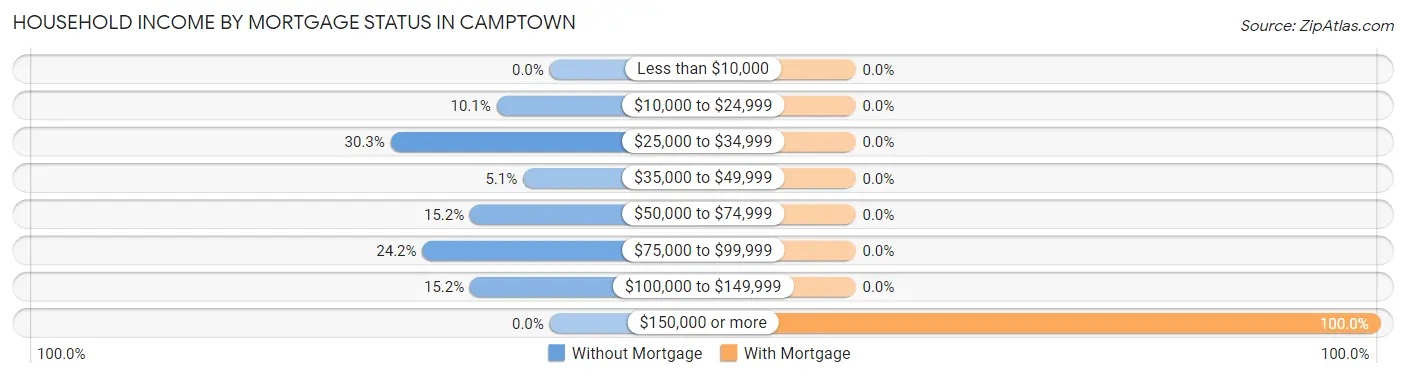
| Household Income | Without Mortgage | With Mortgage |
| Less than $10,000 | 0 (0.0%) | 0 (0.0%) |
| $10,000 to $24,999 | 10 (10.1%) | 0 (0.0%) |
| $25,000 to $34,999 | 30 (30.3%) | 0 (0.0%) |
| $35,000 to $49,999 | 5 (5.1%) | 0 (0.0%) |
| $50,000 to $74,999 | 15 (15.1%) | 0 (0.0%) |
| $75,000 to $99,999 | 24 (24.2%) | 0 (0.0%) |
| $100,000 to $149,999 | 15 (15.1%) | 0 (0.0%) |
| $150,000 or more | 0 (0.0%) | 9 (100.0%) |
| Total | 99 (100.0%) | 9 (100.0%) |
Property Value to Household Income Ratio in Camptown
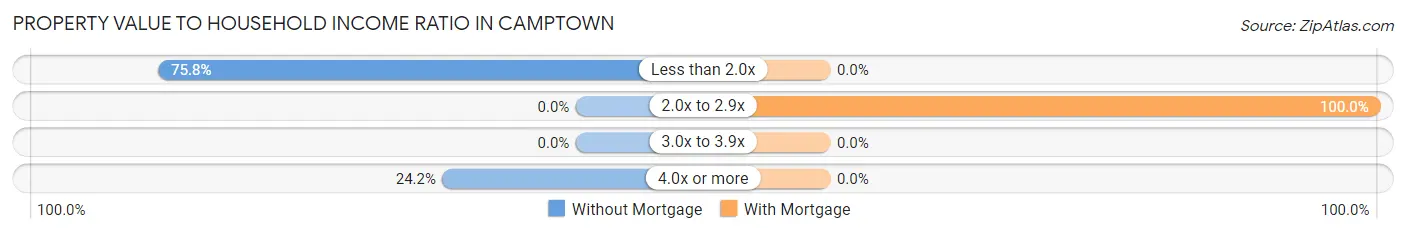
| Value-to-Income Ratio | Without Mortgage | With Mortgage |
| Less than 2.0x | 75 (75.8%) | 0 (0.0%) |
| 2.0x to 2.9x | 0 (0.0%) | 9 (100.0%) |
| 3.0x to 3.9x | 0 (0.0%) | 0 (0.0%) |
| 4.0x or more | 24 (24.2%) | 0 (0.0%) |
| Total | 99 (100.0%) | 9 (100.0%) |
Real Estate Taxes by Mortgage Status in Camptown
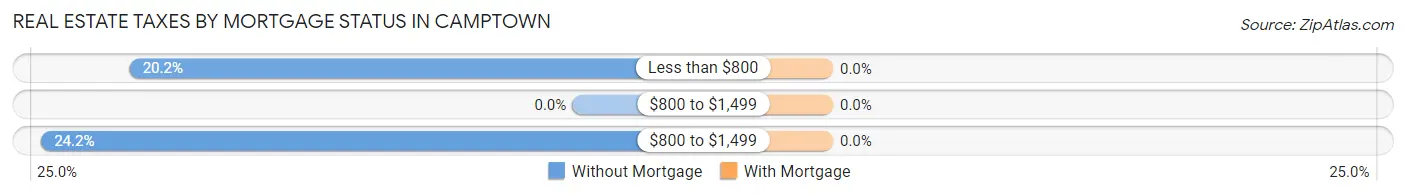
| Property Taxes | Without Mortgage | With Mortgage |
| Less than $800 | 20 (20.2%) | 0 (0.0%) |
| $800 to $1,499 | 0 (0.0%) | 0 (0.0%) |
| $800 to $1,499 | 24 (24.2%) | 0 (0.0%) |
| Total | 99 (100.0%) | 9 (100.0%) |
Health & Disability in Camptown
Health Insurance Coverage by Age in Camptown
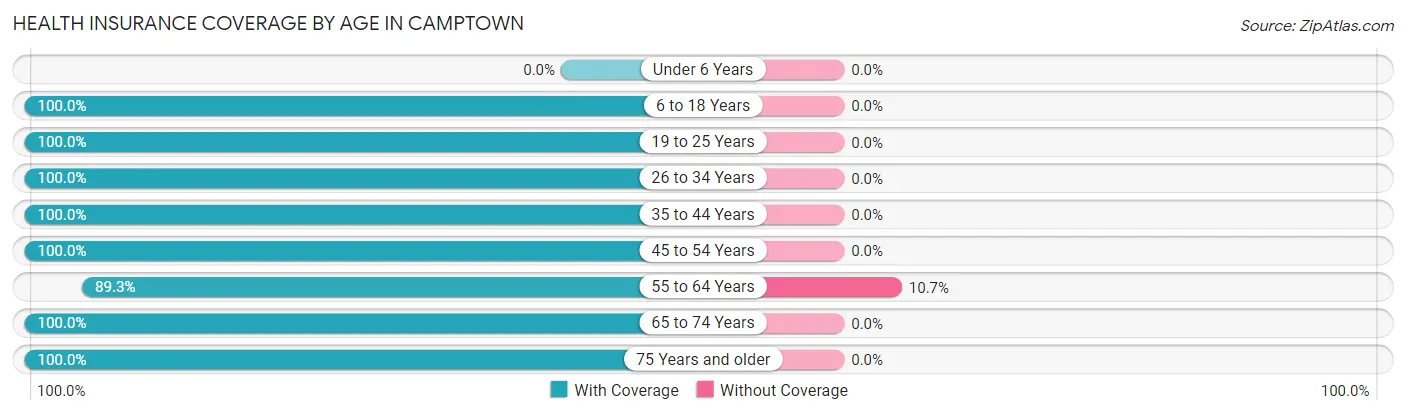
| Age Bracket | With Coverage | Without Coverage |
| Under 6 Years | 0 (0.0%) | 0 (0.0%) |
| 6 to 18 Years | 84 (100.0%) | 0 (0.0%) |
| 19 to 25 Years | 107 (100.0%) | 0 (0.0%) |
| 26 to 34 Years | 25 (100.0%) | 0 (0.0%) |
| 35 to 44 Years | 48 (100.0%) | 0 (0.0%) |
| 45 to 54 Years | 104 (100.0%) | 0 (0.0%) |
| 55 to 64 Years | 133 (89.3%) | 16 (10.7%) |
| 65 to 74 Years | 78 (100.0%) | 0 (0.0%) |
| 75 Years and older | 32 (100.0%) | 0 (0.0%) |
| Total | 611 (97.5%) | 16 (2.5%) |
Health Insurance Coverage by Citizenship Status in Camptown
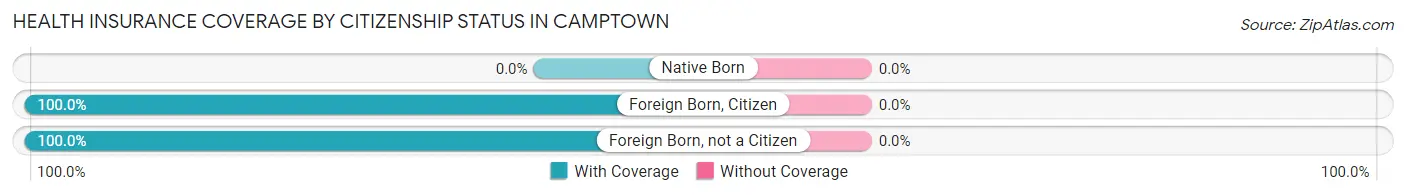
| Citizenship Status | With Coverage | Without Coverage |
| Native Born | 0 (0.0%) | 0 (0.0%) |
| Foreign Born, Citizen | 84 (100.0%) | 0 (0.0%) |
| Foreign Born, not a Citizen | 107 (100.0%) | 0 (0.0%) |
Health Insurance Coverage by Household Income in Camptown
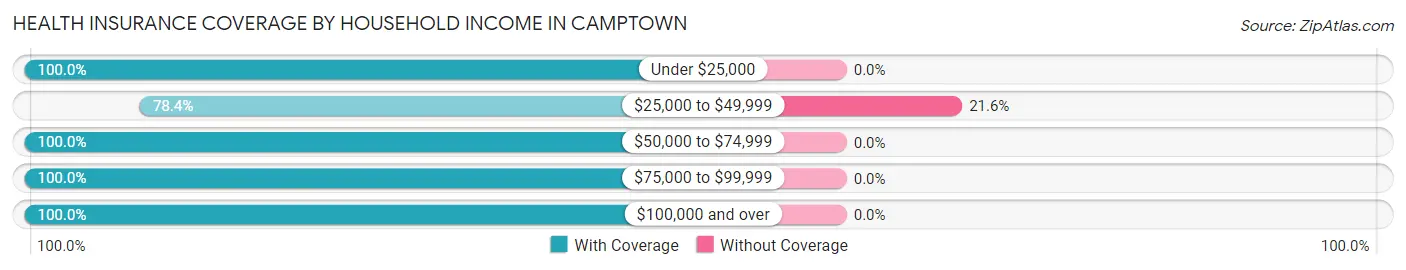
| Household Income | With Coverage | Without Coverage |
| Under $25,000 | 65 (100.0%) | 0 (0.0%) |
| $25,000 to $49,999 | 58 (78.4%) | 16 (21.6%) |
| $50,000 to $74,999 | 63 (100.0%) | 0 (0.0%) |
| $75,000 to $99,999 | 244 (100.0%) | 0 (0.0%) |
| $100,000 and over | 181 (100.0%) | 0 (0.0%) |
Public vs Private Health Insurance Coverage by Age in Camptown
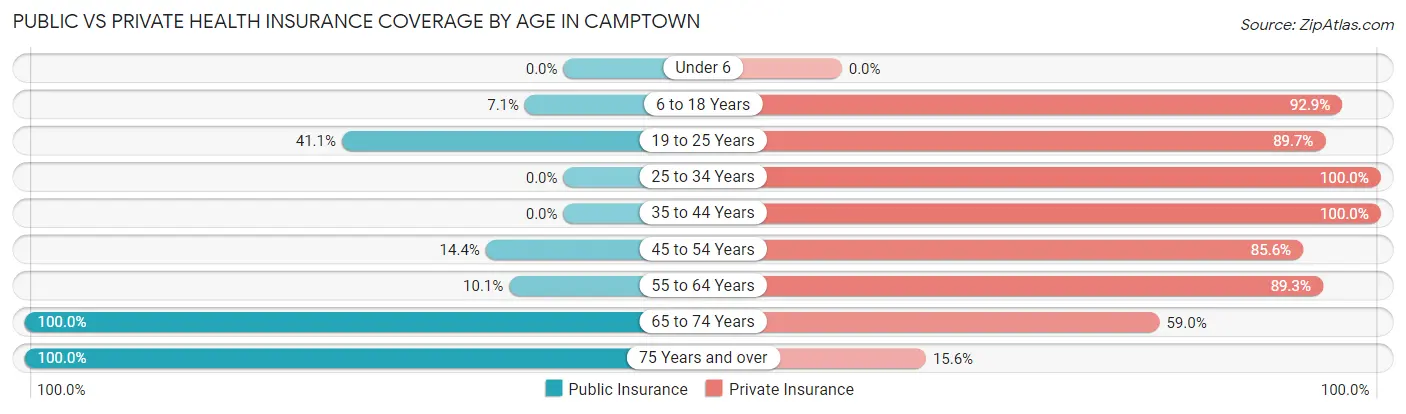
| Age Bracket | Public Insurance | Private Insurance |
| Under 6 | 0 (0.0%) | 0 (0.0%) |
| 6 to 18 Years | 6 (7.1%) | 78 (92.9%) |
| 19 to 25 Years | 44 (41.1%) | 96 (89.7%) |
| 25 to 34 Years | 0 (0.0%) | 25 (100.0%) |
| 35 to 44 Years | 0 (0.0%) | 48 (100.0%) |
| 45 to 54 Years | 15 (14.4%) | 89 (85.6%) |
| 55 to 64 Years | 15 (10.1%) | 133 (89.3%) |
| 65 to 74 Years | 78 (100.0%) | 46 (59.0%) |
| 75 Years and over | 32 (100.0%) | 5 (15.6%) |
| Total | 190 (30.3%) | 520 (82.9%) |
Disability Status by Sex by Age in Camptown
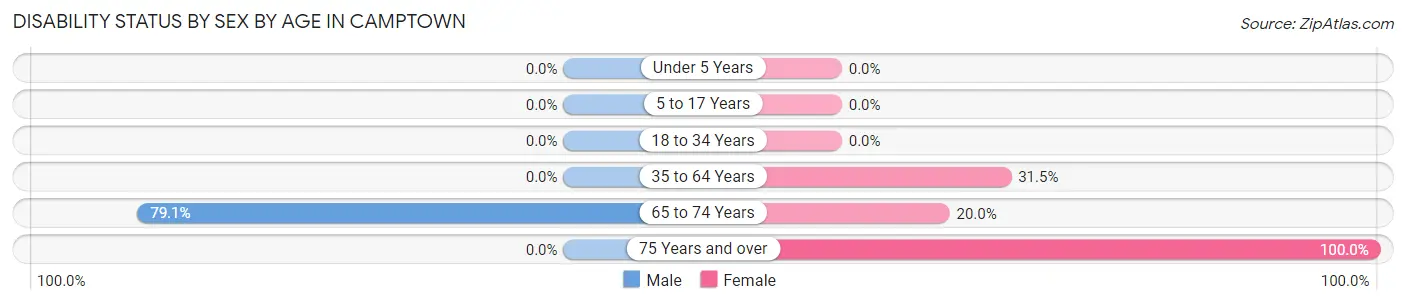
| Age Bracket | Male | Female |
| Under 5 Years | 0 (0.0%) | 0 (0.0%) |
| 5 to 17 Years | 0 (0.0%) | 0 (0.0%) |
| 18 to 34 Years | 0 (0.0%) | 0 (0.0%) |
| 35 to 64 Years | 0 (0.0%) | 39 (31.5%) |
| 65 to 74 Years | 34 (79.1%) | 7 (20.0%) |
| 75 Years and over | 0 (0.0%) | 17 (100.0%) |
Disability Class by Sex by Age in Camptown
Disability Class: Hearing Difficulty
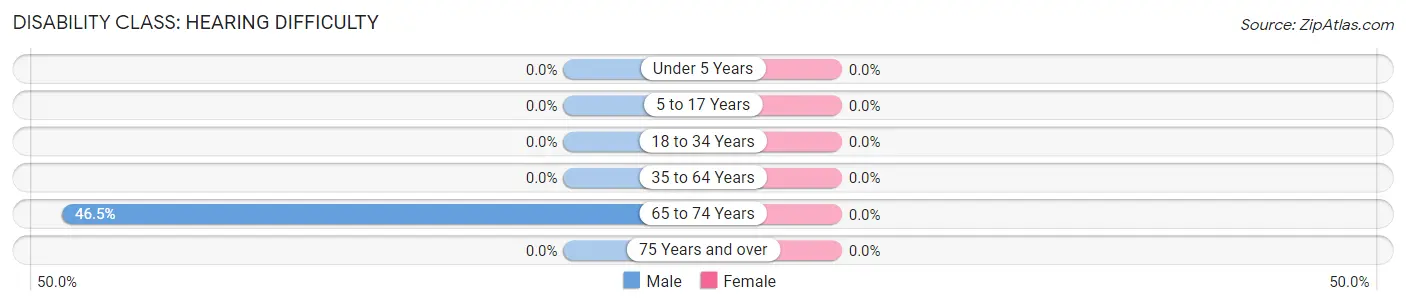
| Age Bracket | Male | Female |
| Under 5 Years | 0 (0.0%) | 0 (0.0%) |
| 5 to 17 Years | 0 (0.0%) | 0 (0.0%) |
| 18 to 34 Years | 0 (0.0%) | 0 (0.0%) |
| 35 to 64 Years | 0 (0.0%) | 0 (0.0%) |
| 65 to 74 Years | 20 (46.5%) | 0 (0.0%) |
| 75 Years and over | 0 (0.0%) | 0 (0.0%) |
Disability Class: Vision Difficulty
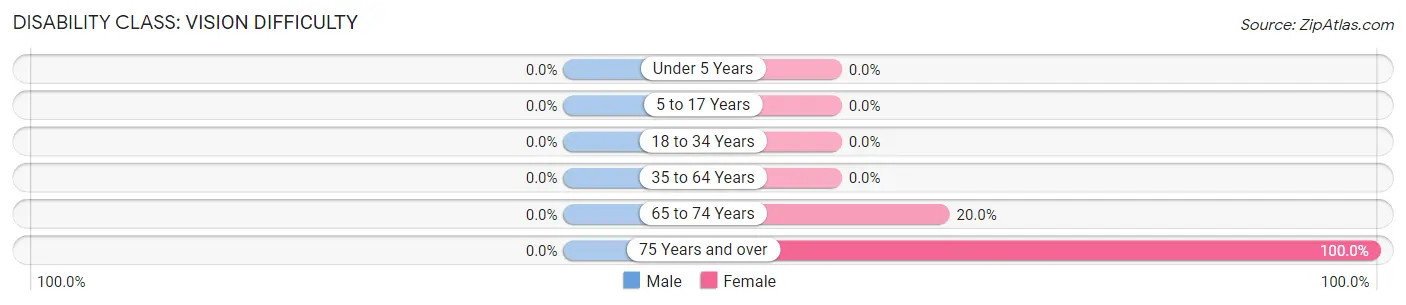
| Age Bracket | Male | Female |
| Under 5 Years | 0 (0.0%) | 0 (0.0%) |
| 5 to 17 Years | 0 (0.0%) | 0 (0.0%) |
| 18 to 34 Years | 0 (0.0%) | 0 (0.0%) |
| 35 to 64 Years | 0 (0.0%) | 0 (0.0%) |
| 65 to 74 Years | 0 (0.0%) | 7 (20.0%) |
| 75 Years and over | 0 (0.0%) | 17 (100.0%) |
Disability Class: Cognitive Difficulty
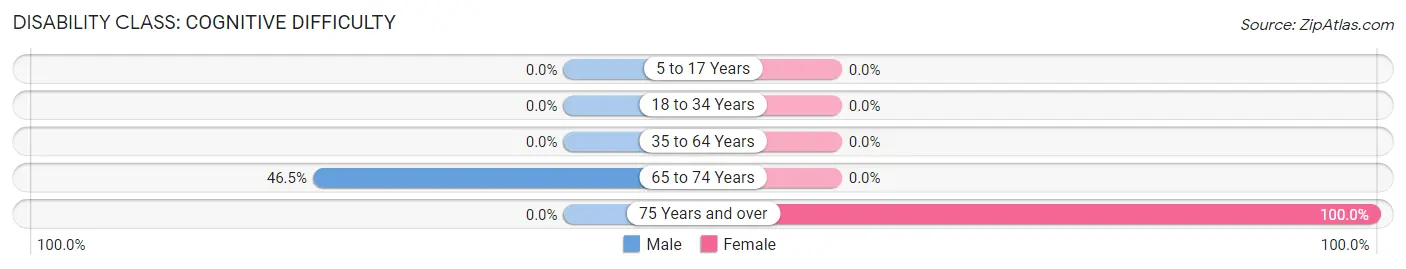
| Age Bracket | Male | Female |
| 5 to 17 Years | 0 (0.0%) | 0 (0.0%) |
| 18 to 34 Years | 0 (0.0%) | 0 (0.0%) |
| 35 to 64 Years | 0 (0.0%) | 0 (0.0%) |
| 65 to 74 Years | 20 (46.5%) | 0 (0.0%) |
| 75 Years and over | 0 (0.0%) | 17 (100.0%) |
Disability Class: Ambulatory Difficulty
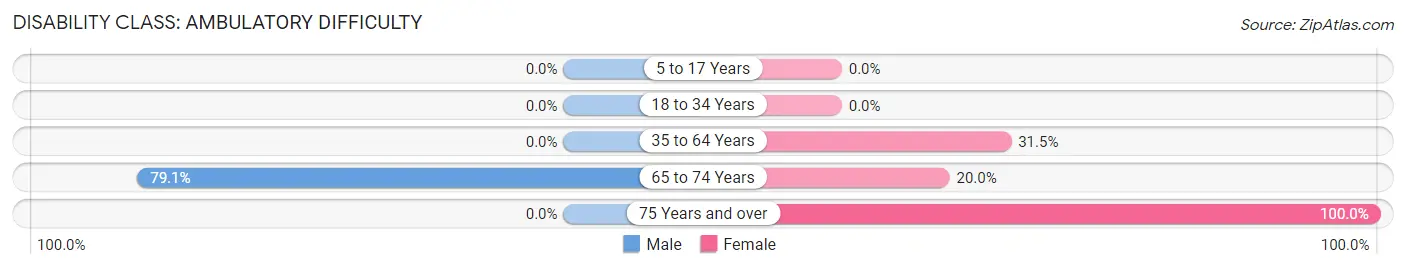
| Age Bracket | Male | Female |
| 5 to 17 Years | 0 (0.0%) | 0 (0.0%) |
| 18 to 34 Years | 0 (0.0%) | 0 (0.0%) |
| 35 to 64 Years | 0 (0.0%) | 39 (31.5%) |
| 65 to 74 Years | 34 (79.1%) | 7 (20.0%) |
| 75 Years and over | 0 (0.0%) | 17 (100.0%) |
Disability Class: Self-Care Difficulty
| Age Bracket | Male | Female |
| 5 to 17 Years | 0 (0.0%) | 0 (0.0%) |
| 18 to 34 Years | 0 (0.0%) | 0 (0.0%) |
| 35 to 64 Years | 0 (0.0%) | 0 (0.0%) |
| 65 to 74 Years | 0 (0.0%) | 0 (0.0%) |
| 75 Years and over | 0 (0.0%) | 0 (0.0%) |
Technology Access in Camptown
Computing Device Access in Camptown
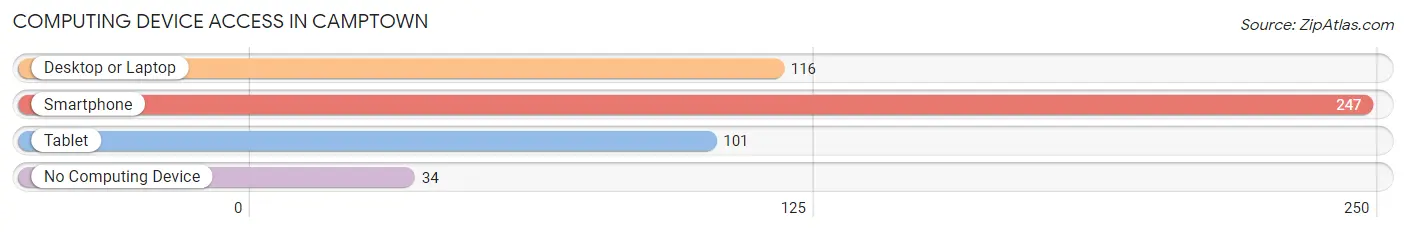
| Device Type | # Households | % Households |
| Desktop or Laptop | 116 | 41.3% |
| Smartphone | 247 | 87.9% |
| Tablet | 101 | 35.9% |
| No Computing Device | 34 | 12.1% |
| Total | 281 | 100.0% |
Internet Access in Camptown
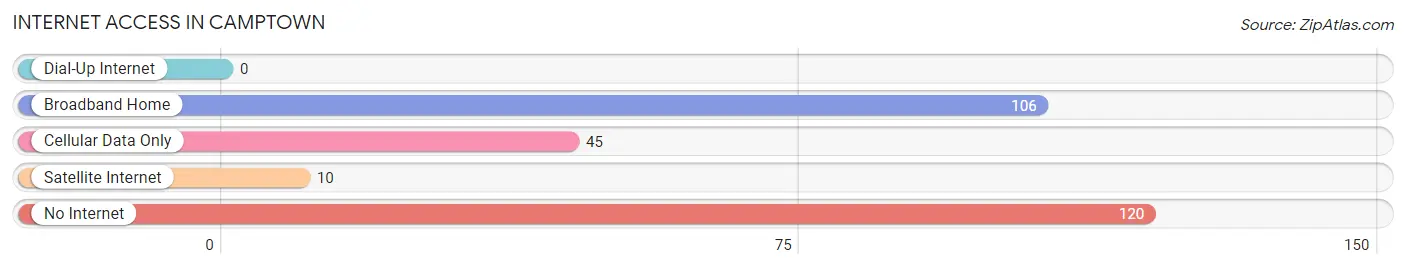
| Internet Type | # Households | % Households |
| Dial-Up Internet | 0 | 0.0% |
| Broadband Home | 106 | 37.7% |
| Cellular Data Only | 45 | 16.0% |
| Satellite Internet | 10 | 3.6% |
| No Internet | 120 | 42.7% |
| Total | 281 | 100.0% |
Camptown Summary
Camp Town, Virginia is a small town located in the Shenandoah Valley of Virginia. It is situated in the northern part of the state, about an hour and a half from Washington, D.C. The town is home to a population of just over 1,000 people, and is known for its rural charm and small-town atmosphere.
History
Camp Town was first settled in the late 1700s by a group of German immigrants. The town was originally known as “Camp”, and was named after the nearby Camp Creek. The town was officially incorporated in 1820, and was named after the nearby Camp Creek.
The town was an important stop on the Valley Turnpike, which connected the Shenandoah Valley to the rest of the state. The turnpike was a major transportation route for goods and people, and Camp Town was a popular stop for travelers.
In the late 1800s, Camp Town was a thriving agricultural community. The town was home to several farms, and the surrounding area was known for its production of apples, peaches, and other fruits.
Geography
Camp Town is located in the northern part of the Shenandoah Valley, in the foothills of the Blue Ridge Mountains. The town is situated at an elevation of 1,000 feet, and is surrounded by rolling hills and lush forests. The town is located about an hour and a half from Washington, D.C., and is about two hours from Richmond, Virginia.
The town is located in the Shenandoah Valley AVA, a wine-producing region of Virginia. The region is known for its production of high-quality wines, and Camp Town is home to several wineries.
Economy
Camp Town’s economy is largely based on agriculture and tourism. The town is home to several farms, and the surrounding area is known for its production of apples, peaches, and other fruits. The town is also home to several wineries, which attract tourists from all over the state.
The town is also home to several small businesses, including restaurants, shops, and other services. The town is also home to a small manufacturing plant, which produces a variety of products.
Demographics
As of the 2010 census, Camp Town had a population of 1,072 people. The town is predominantly white, with a small African American population. The median household income in the town is $45,000, and the median age is 44.
Conclusion
Camp Town, Virginia is a small town located in the Shenandoah Valley of Virginia. The town is known for its rural charm and small-town atmosphere, and is home to a population of just over 1,000 people. The town’s economy is largely based on agriculture and tourism, and the town is home to several wineries and small businesses. The town is predominantly white, with a small African American population, and the median household income is $45,000.
Common Questions
What is Per Capita Income in Camptown?
Per Capita income in Camptown is $36,648.
What is the Median Family Income in Camptown?
Median Family Income in Camptown is $98,056.
What is the Median Household income in Camptown?
Median Household Income in Camptown is $81,125.
What is Income or Wage Gap in Camptown?
Income or Wage Gap in Camptown is 21.2%.
Women in Camptown earn 78.8 cents for every dollar earned by a man.
What is Inequality or Gini Index in Camptown?
Inequality or Gini Index in Camptown is 0.33.
What is the Total Population of Camptown?
Total Population of Camptown is 627.
What is the Total Male Population of Camptown?
Total Male Population of Camptown is 337.
What is the Total Female Population of Camptown?
Total Female Population of Camptown is 290.
What is the Ratio of Males per 100 Females in Camptown?
There are 116.21 Males per 100 Females in Camptown.
What is the Ratio of Females per 100 Males in Camptown?
There are 86.05 Females per 100 Males in Camptown.
What is the Median Population Age in Camptown?
Median Population Age in Camptown is 49.0 Years.
What is the Average Family Size in Camptown
Average Family Size in Camptown is 2.6 People.
What is the Average Household Size in Camptown
Average Household Size in Camptown is 2.2 People.
How Large is the Labor Force in Camptown?
There are 347 People in the Labor Forcein in Camptown.
What is the Percentage of People in the Labor Force in Camptown?
63.9% of People are in the Labor Force in Camptown.
What is the Unemployment Rate in Camptown?
Unemployment Rate in Camptown is 9.5%.