Cities with the Most Immigrants from Liberia in Texas
RELATED REPORTS & OPTIONS
Liberia
Texas
Compare Cities
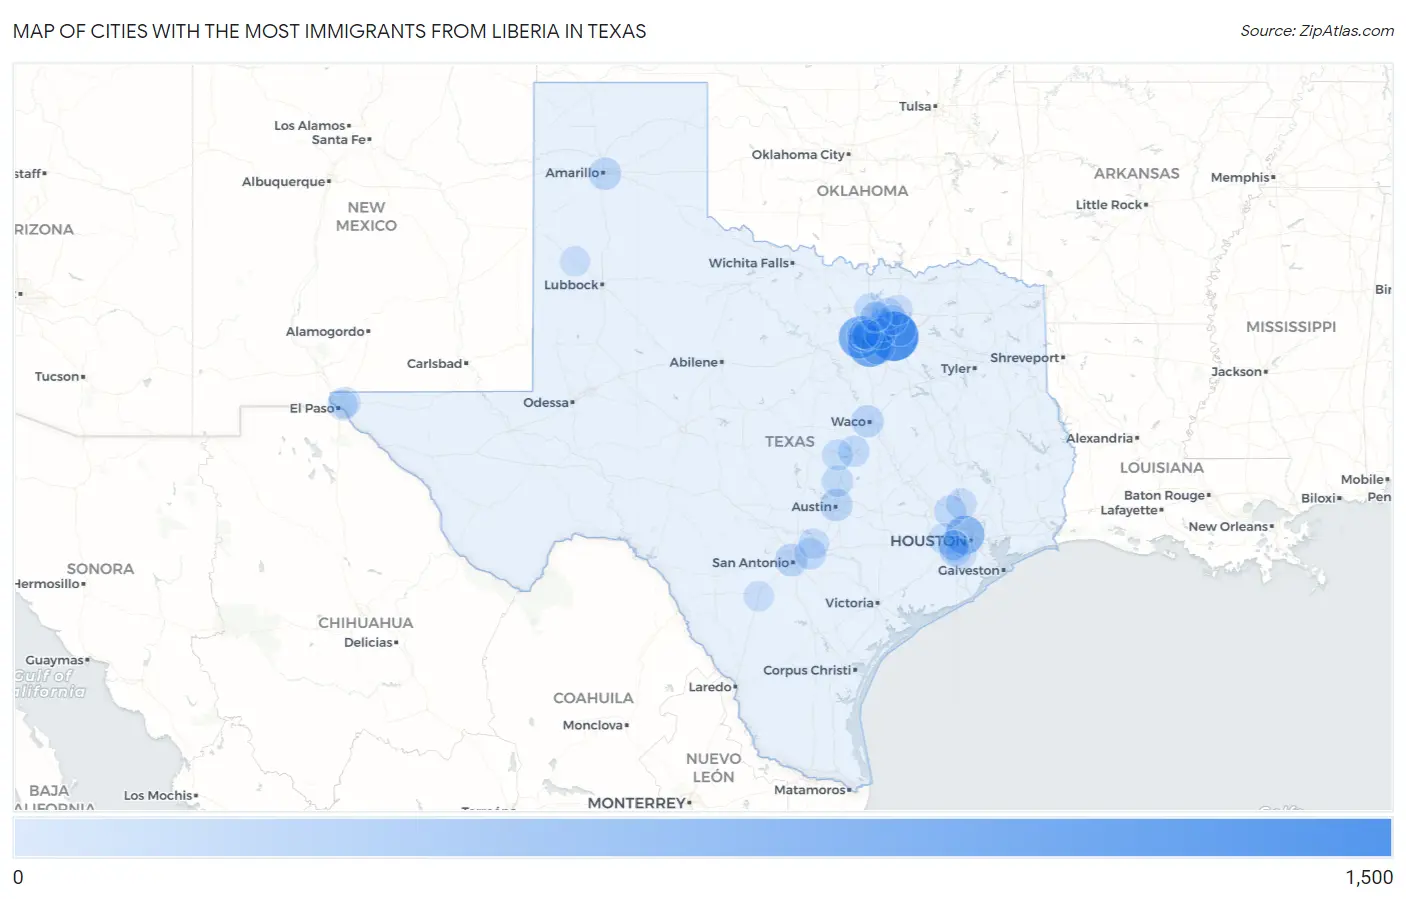
Map of Cities with the Most Immigrants from Liberia in Texas
0
1,500

Cities with the Most Immigrants from Liberia in Texas
| City | Liberia | vs State | vs National | |
| 1. | Dallas | 1,044 | 5,906(17.68%)#1 | 98,441(1.06%)#12 |
| 2. | Arlington | 727 | 5,906(12.31%)#2 | 98,441(0.74%)#18 |
| 3. | Fort Worth | 645 | 5,906(10.92%)#3 | 98,441(0.66%)#22 |
| 4. | Houston | 464 | 5,906(7.86%)#4 | 98,441(0.47%)#31 |
| 5. | Grand Prairie | 187 | 5,906(3.17%)#5 | 98,441(0.19%)#84 |
| 6. | Carrollton | 151 | 5,906(2.56%)#6 | 98,441(0.15%)#105 |
| 7. | Watauga | 133 | 5,906(2.25%)#7 | 98,441(0.14%)#120 |
| 8. | Austin | 121 | 5,906(2.05%)#8 | 98,441(0.12%)#132 |
| 9. | San Antonio | 118 | 5,906(2.00%)#9 | 98,441(0.12%)#138 |
| 10. | Amarillo | 115 | 5,906(1.95%)#10 | 98,441(0.12%)#142 |
| 11. | Waco | 114 | 5,906(1.93%)#11 | 98,441(0.12%)#144 |
| 12. | Garland | 88 | 5,906(1.49%)#12 | 98,441(0.09%)#181 |
| 13. | Magnolia | 88 | 5,906(1.49%)#13 | 98,441(0.09%)#182 |
| 14. | Frisco | 86 | 5,906(1.46%)#14 | 98,441(0.09%)#184 |
| 15. | Cibolo | 85 | 5,906(1.44%)#15 | 98,441(0.09%)#189 |
| 16. | Four Corners | 81 | 5,906(1.37%)#16 | 98,441(0.08%)#201 |
| 17. | Georgetown | 69 | 5,906(1.17%)#17 | 98,441(0.07%)#221 |
| 18. | Temple | 62 | 5,906(1.05%)#18 | 98,441(0.06%)#244 |
| 19. | Denton | 53 | 5,906(0.90%)#19 | 98,441(0.05%)#271 |
| 20. | Fort Bliss | 53 | 5,906(0.90%)#20 | 98,441(0.05%)#274 |
| 21. | Haltom City | 50 | 5,906(0.85%)#21 | 98,441(0.05%)#284 |
| 22. | Killeen | 47 | 5,906(0.80%)#22 | 98,441(0.05%)#295 |
| 23. | Katy | 44 | 5,906(0.75%)#23 | 98,441(0.04%)#311 |
| 24. | Conroe | 43 | 5,906(0.73%)#24 | 98,441(0.04%)#313 |
| 25. | North Richland Hills | 41 | 5,906(0.69%)#25 | 98,441(0.04%)#328 |
| 26. | Missouri City | 31 | 5,906(0.52%)#26 | 98,441(0.03%)#383 |
| 27. | Sugar Land | 30 | 5,906(0.51%)#27 | 98,441(0.03%)#390 |
| 28. | New Braunfels | 28 | 5,906(0.47%)#28 | 98,441(0.03%)#410 |
| 29. | El Paso | 24 | 5,906(0.41%)#29 | 98,441(0.02%)#441 |
| 30. | Irving | 24 | 5,906(0.41%)#30 | 98,441(0.02%)#442 |
| 31. | Mckinney | 20 | 5,906(0.34%)#31 | 98,441(0.02%)#478 |
| 32. | Littlefield | 19 | 5,906(0.32%)#32 | 98,441(0.02%)#501 |
| 33. | Highland Village | 18 | 5,906(0.30%)#33 | 98,441(0.02%)#509 |
| 34. | Plano | 15 | 5,906(0.25%)#34 | 98,441(0.02%)#541 |
| 35. | Hurst | 12 | 5,906(0.20%)#35 | 98,441(0.01%)#587 |
| 36. | Mission Bend | 12 | 5,906(0.20%)#36 | 98,441(0.01%)#588 |
| 37. | Pearsall | 11 | 5,906(0.19%)#37 | 98,441(0.01%)#612 |
| 38. | Lake Dallas | 11 | 5,906(0.19%)#38 | 98,441(0.01%)#613 |
Common Questions
What are the Top 10 Cities with the Most Immigrants from Liberia in Texas?
Top 10 Cities with the Most Immigrants from Liberia in Texas are:
#1
1,044
#2
727
#3
645
#4
464
#5
187
#6
151
#7
133
#8
121
#9
118
#10
115
What city has the Most Immigrants from Liberia in Texas?
Dallas has the Most Immigrants from Liberia in Texas with 1,044.
What is the Total Immigrants from Liberia in the State of Texas?
Total Immigrants from Liberia in Texas is 5,906.
What is the Total Immigrants from Liberia in the United States?
Total Immigrants from Liberia in the United States is 98,441.