Zip Codes with the Highest Percentage of Households Heated by Fuel Oil / Kerosene in Cincinnati, OH
RELATED REPORTS & OPTIONS
Fuel Oil Heating
Cincinnati
Compare Zip Codes
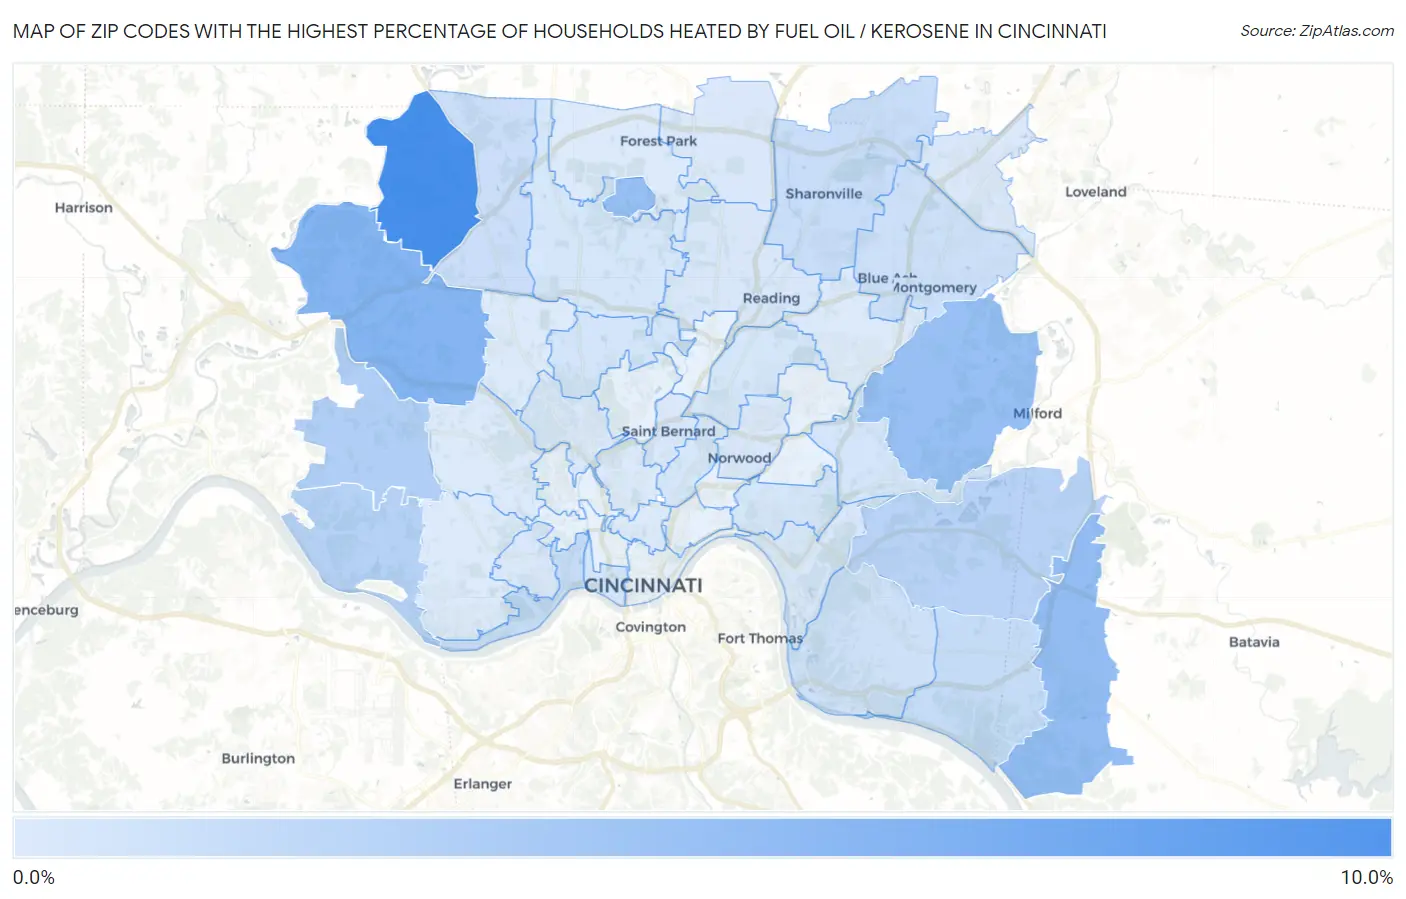
Map of Zip Codes with the Highest Percentage of Households Heated by Fuel Oil / Kerosene in Cincinnati
0.10%
10.0%
Zip Codes with the Highest Percentage of Households Heated by Fuel Oil / Kerosene in Cincinnati, OH
| Zip Code | Fuel Oil Heating | vs State | vs National | |
| 1. | 45252 | 10.0% | 1.9%(+8.10)#158 | 4.2%(+5.80)#6,061 |
| 2. | 45247 | 5.7% | 1.9%(+3.80)#273 | 4.2%(+1.50)#7,718 |
| 3. | 45245 | 4.9% | 1.9%(+3.00)#314 | 4.2%(+0.700)#8,159 |
| 4. | 45243 | 4.5% | 1.9%(+2.60)#334 | 4.2%(+0.300)#8,440 |
| 5. | 45218 | 4.5% | 1.9%(+2.60)#338 | 4.2%(+0.300)#8,453 |
| 6. | 45248 | 2.9% | 1.9%(+1.000)#442 | 4.2%(-1.30)#9,765 |
| 7. | 45233 | 2.6% | 1.9%(+0.700)#467 | 4.2%(-1.60)#10,108 |
| 8. | 45244 | 2.4% | 1.9%(+0.500)#485 | 4.2%(-1.80)#10,323 |
| 9. | 45204 | 1.6% | 1.9%(-0.300)#576 | 4.2%(-2.60)#11,557 |
| 10. | 45255 | 1.5% | 1.9%(-0.400)#586 | 4.2%(-2.70)#11,713 |
| 11. | 45241 | 1.4% | 1.9%(-0.500)#600 | 4.2%(-2.80)#11,875 |
| 12. | 45251 | 1.2% | 1.9%(-0.700)#627 | 4.2%(-3.00)#12,287 |
| 13. | 45242 | 1.1% | 1.9%(-0.800)#646 | 4.2%(-3.10)#12,481 |
| 14. | 45230 | 1.0% | 1.9%(-0.900)#659 | 4.2%(-3.20)#12,715 |
| 15. | 45224 | 0.70% | 1.9%(-1.20)#709 | 4.2%(-3.50)#13,603 |
| 16. | 45227 | 0.70% | 1.9%(-1.20)#710 | 4.2%(-3.50)#13,619 |
| 17. | 45203 | 0.70% | 1.9%(-1.20)#717 | 4.2%(-3.50)#13,785 |
| 18. | 45231 | 0.60% | 1.9%(-1.30)#723 | 4.2%(-3.60)#13,895 |
| 19. | 45237 | 0.60% | 1.9%(-1.30)#729 | 4.2%(-3.60)#13,978 |
| 20. | 45229 | 0.60% | 1.9%(-1.30)#735 | 4.2%(-3.60)#14,036 |
| 21. | 45208 | 0.50% | 1.9%(-1.40)#751 | 4.2%(-3.70)#14,433 |
| 22. | 45215 | 0.40% | 1.9%(-1.50)#772 | 4.2%(-3.80)#14,813 |
| 23. | 45226 | 0.40% | 1.9%(-1.50)#791 | 4.2%(-3.80)#15,059 |
| 24. | 45249 | 0.30% | 1.9%(-1.60)#810 | 4.2%(-3.90)#15,563 |
| 25. | 45223 | 0.30% | 1.9%(-1.60)#812 | 4.2%(-3.90)#15,580 |
| 26. | 45212 | 0.20% | 1.9%(-1.70)#840 | 4.2%(-4.00)#16,264 |
| 27. | 45205 | 0.20% | 1.9%(-1.70)#845 | 4.2%(-4.00)#16,296 |
| 28. | 45246 | 0.20% | 1.9%(-1.70)#850 | 4.2%(-4.00)#16,414 |
| 29. | 45217 | 0.20% | 1.9%(-1.70)#853 | 4.2%(-4.00)#16,522 |
| 30. | 45238 | 0.10% | 1.9%(-1.80)#860 | 4.2%(-4.10)#16,848 |
| 31. | 45211 | 0.10% | 1.9%(-1.80)#870 | 4.2%(-4.10)#17,021 |
| 32. | 45239 | 0.10% | 1.9%(-1.80)#878 | 4.2%(-4.10)#17,204 |
| 33. | 45240 | 0.10% | 1.9%(-1.80)#879 | 4.2%(-4.10)#17,213 |
| 34. | 45236 | 0.10% | 1.9%(-1.80)#891 | 4.2%(-4.10)#17,339 |
| 35. | 45219 | 0.10% | 1.9%(-1.80)#900 | 4.2%(-4.10)#17,476 |
| 36. | 45220 | 0.10% | 1.9%(-1.80)#905 | 4.2%(-4.10)#17,569 |
1
Common Questions
What are the Top 10 Zip Codes with the Highest Percentage of Households Heated by Fuel Oil / Kerosene in Cincinnati, OH?
Top 10 Zip Codes with the Highest Percentage of Households Heated by Fuel Oil / Kerosene in Cincinnati, OH are:
What zip code has the Highest Percentage of Households Heated by Fuel Oil / Kerosene in Cincinnati, OH?
45252 has the Highest Percentage of Households Heated by Fuel Oil / Kerosene in Cincinnati, OH with 10.0%.
What is the Percentage of Households Heated by Fuel Oil / Kerosene in Cincinnati, OH?
Percentage of Households Heated by Fuel Oil / Kerosene in Cincinnati is 0.20%.
What is the Percentage of Households Heated by Fuel Oil / Kerosene in Ohio?
Percentage of Households Heated by Fuel Oil / Kerosene in Ohio is 1.9%.
What is the Percentage of Households Heated by Fuel Oil / Kerosene in the United States?
Percentage of Households Heated by Fuel Oil / Kerosene in the United States is 4.2%.