Zip Codes with the Highest Percentage of Households Heated by Fuel Oil / Kerosene in Ohio
RELATED REPORTS & OPTIONS
Fuel Oil Heating
Ohio
Compare Zip Codes
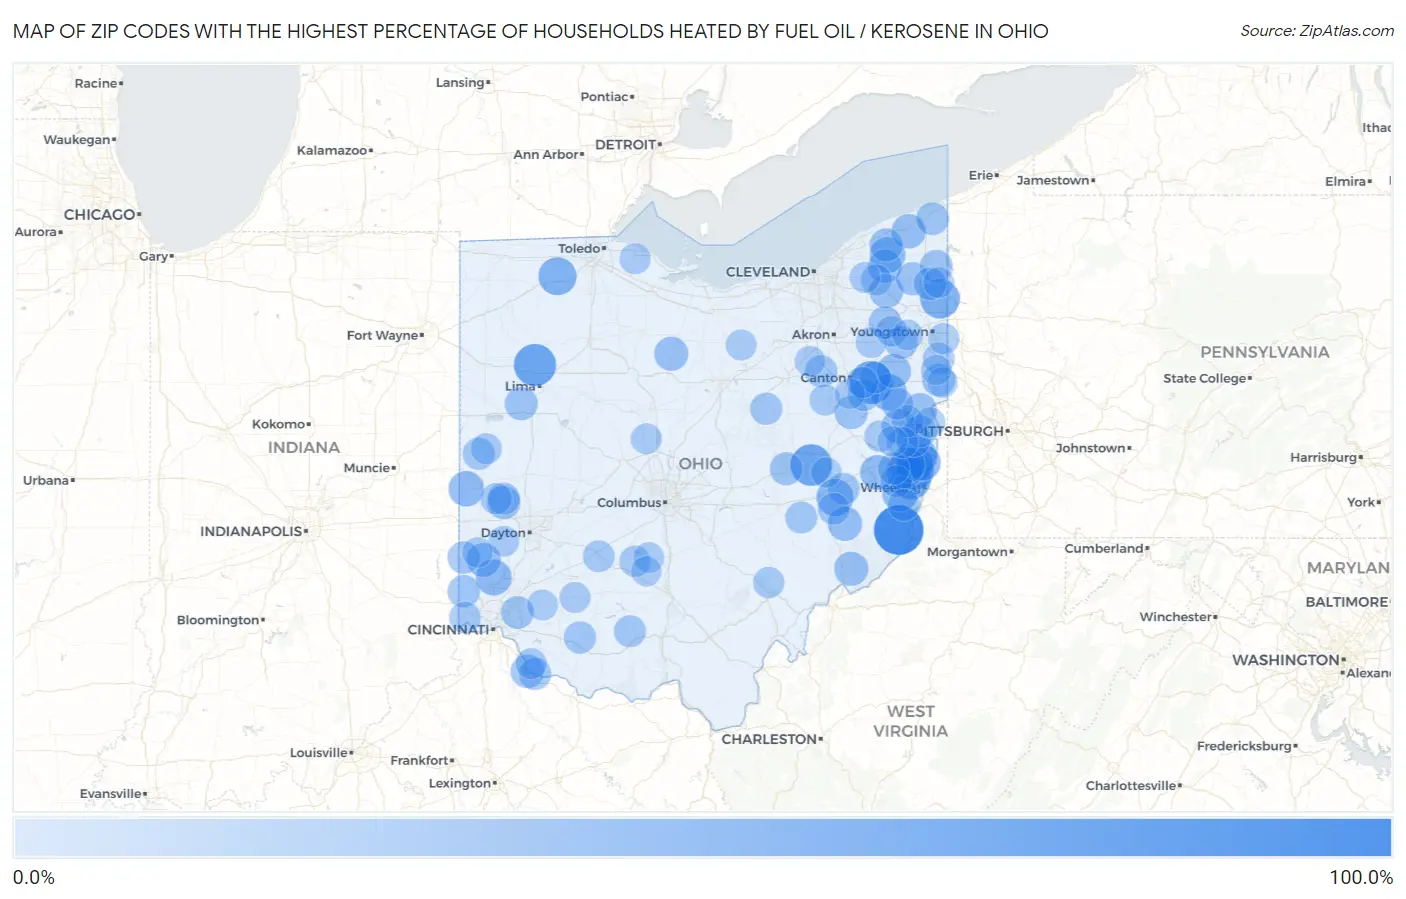
Map of Zip Codes with the Highest Percentage of Households Heated by Fuel Oil / Kerosene in Ohio
0.0%
100.0%
Zip Codes with the Highest Percentage of Households Heated by Fuel Oil / Kerosene in Ohio
| Zip Code | Fuel Oil Heating | vs State | vs National | |
| 1. | 43914 | 100.0% | 1.9%(+98.1)#1 | 4.2%(+95.8)#89 |
| 2. | 44670 | 69.1% | 1.9%(+67.2)#2 | 4.2%(+64.9)#566 |
| 3. | 45893 | 66.1% | 1.9%(+64.2)#3 | 4.2%(+61.9)#734 |
| 4. | 43836 | 63.2% | 1.9%(+61.3)#4 | 4.2%(+59.0)#904 |
| 5. | 44424 | 53.1% | 1.9%(+51.2)#5 | 4.2%(+48.9)#1,621 |
| 6. | 43905 | 51.8% | 1.9%(+49.9)#6 | 4.2%(+47.6)#1,722 |
| 7. | 43948 | 51.6% | 1.9%(+49.7)#7 | 4.2%(+47.4)#1,740 |
| 8. | 43510 | 47.1% | 1.9%(+45.2)#8 | 4.2%(+42.9)#2,043 |
| 9. | 43939 | 45.7% | 1.9%(+43.8)#9 | 4.2%(+41.5)#2,132 |
| 10. | 43750 | 42.9% | 1.9%(+41.0)#10 | 4.2%(+38.7)#2,347 |
| 11. | 43917 | 42.8% | 1.9%(+40.9)#11 | 4.2%(+38.6)#2,354 |
| 12. | 43974 | 41.0% | 1.9%(+39.1)#12 | 4.2%(+36.8)#2,492 |
| 13. | 44607 | 40.0% | 1.9%(+38.1)#13 | 4.2%(+35.8)#2,577 |
| 14. | 43943 | 39.9% | 1.9%(+38.0)#14 | 4.2%(+35.7)#2,584 |
| 15. | 45055 | 38.1% | 1.9%(+36.2)#15 | 4.2%(+33.9)#2,703 |
| 16. | 44064 | 36.4% | 1.9%(+34.5)#16 | 4.2%(+32.2)#2,843 |
| 17. | 45352 | 36.0% | 1.9%(+34.1)#17 | 4.2%(+31.8)#2,867 |
| 18. | 43901 | 35.0% | 1.9%(+33.1)#18 | 4.2%(+30.8)#2,953 |
| 19. | 43967 | 35.0% | 1.9%(+33.1)#19 | 4.2%(+30.8)#2,957 |
| 20. | 43985 | 33.3% | 1.9%(+31.4)#20 | 4.2%(+29.1)#3,078 |
| 21. | 44010 | 31.0% | 1.9%(+29.1)#21 | 4.2%(+26.8)#3,258 |
| 22. | 43903 | 30.2% | 1.9%(+28.3)#22 | 4.2%(+26.0)#3,317 |
| 23. | 44665 | 30.1% | 1.9%(+28.2)#23 | 4.2%(+25.9)#3,331 |
| 24. | 43910 | 30.0% | 1.9%(+28.1)#24 | 4.2%(+25.8)#3,335 |
| 25. | 43779 | 30.0% | 1.9%(+28.1)#25 | 4.2%(+25.8)#3,339 |
| 26. | 45064 | 29.5% | 1.9%(+27.6)#26 | 4.2%(+25.3)#3,368 |
| 27. | 45788 | 29.3% | 1.9%(+27.4)#27 | 4.2%(+25.1)#3,392 |
| 28. | 44825 | 29.3% | 1.9%(+27.4)#28 | 4.2%(+25.1)#3,394 |
| 29. | 43930 | 28.6% | 1.9%(+26.7)#29 | 4.2%(+24.4)#3,444 |
| 30. | 44080 | 28.3% | 1.9%(+26.4)#30 | 4.2%(+24.1)#3,469 |
| 31. | 44046 | 27.1% | 1.9%(+25.2)#31 | 4.2%(+22.9)#3,582 |
| 32. | 45156 | 26.7% | 1.9%(+24.8)#32 | 4.2%(+22.5)#3,615 |
| 33. | 45361 | 26.4% | 1.9%(+24.5)#33 | 4.2%(+22.2)#3,641 |
| 34. | 44086 | 26.3% | 1.9%(+24.4)#34 | 4.2%(+22.1)#3,650 |
| 35. | 44450 | 25.1% | 1.9%(+23.2)#35 | 4.2%(+20.9)#3,761 |
| 36. | 45819 | 25.0% | 1.9%(+23.1)#36 | 4.2%(+20.8)#3,780 |
| 37. | 44678 | 24.7% | 1.9%(+22.8)#37 | 4.2%(+20.5)#3,806 |
| 38. | 43811 | 24.3% | 1.9%(+22.4)#38 | 4.2%(+20.1)#3,839 |
| 39. | 44401 | 24.2% | 1.9%(+22.3)#39 | 4.2%(+20.0)#3,846 |
| 40. | 44093 | 23.9% | 1.9%(+22.0)#40 | 4.2%(+19.7)#3,875 |
| 41. | 45147 | 23.7% | 1.9%(+21.8)#41 | 4.2%(+19.5)#3,902 |
| 42. | 44455 | 23.6% | 1.9%(+21.7)#42 | 4.2%(+19.4)#3,910 |
| 43. | 44048 | 23.3% | 1.9%(+21.4)#43 | 4.2%(+19.1)#3,937 |
| 44. | 44285 | 23.3% | 1.9%(+21.4)#44 | 4.2%(+19.1)#3,951 |
| 45. | 44417 | 23.0% | 1.9%(+21.1)#45 | 4.2%(+18.8)#3,977 |
| 46. | 45003 | 22.2% | 1.9%(+20.3)#46 | 4.2%(+18.0)#4,047 |
| 47. | 45112 | 22.2% | 1.9%(+20.3)#47 | 4.2%(+18.0)#4,054 |
| 48. | 43944 | 22.1% | 1.9%(+20.2)#48 | 4.2%(+17.9)#4,062 |
| 49. | 45053 | 21.8% | 1.9%(+19.9)#49 | 4.2%(+17.6)#4,091 |
| 50. | 45155 | 21.5% | 1.9%(+19.6)#50 | 4.2%(+17.3)#4,126 |
| 51. | 45337 | 21.1% | 1.9%(+19.2)#51 | 4.2%(+16.9)#4,162 |
| 52. | 44661 | 21.1% | 1.9%(+19.2)#52 | 4.2%(+16.9)#4,167 |
| 53. | 44666 | 21.0% | 1.9%(+19.1)#53 | 4.2%(+16.8)#4,175 |
| 54. | 45362 | 20.8% | 1.9%(+18.9)#54 | 4.2%(+16.6)#4,200 |
| 55. | 43908 | 20.2% | 1.9%(+18.3)#55 | 4.2%(+16.0)#4,258 |
| 56. | 43972 | 20.0% | 1.9%(+18.1)#56 | 4.2%(+15.8)#4,288 |
| 57. | 45646 | 19.9% | 1.9%(+18.0)#57 | 4.2%(+15.7)#4,306 |
| 58. | 43727 | 19.8% | 1.9%(+17.9)#58 | 4.2%(+15.6)#4,314 |
| 59. | 43981 | 19.8% | 1.9%(+17.9)#59 | 4.2%(+15.6)#4,317 |
| 60. | 44688 | 19.7% | 1.9%(+17.8)#60 | 4.2%(+15.5)#4,322 |
| 61. | 44651 | 19.7% | 1.9%(+17.8)#61 | 4.2%(+15.5)#4,326 |
| 62. | 43933 | 19.5% | 1.9%(+17.6)#62 | 4.2%(+15.3)#4,347 |
| 63. | 43755 | 19.3% | 1.9%(+17.4)#63 | 4.2%(+15.1)#4,367 |
| 64. | 43722 | 19.2% | 1.9%(+17.3)#64 | 4.2%(+15.0)#4,378 |
| 65. | 43142 | 19.1% | 1.9%(+17.2)#65 | 4.2%(+14.9)#4,391 |
| 66. | 44669 | 18.6% | 1.9%(+16.7)#66 | 4.2%(+14.4)#4,439 |
| 67. | 45033 | 18.6% | 1.9%(+16.7)#67 | 4.2%(+14.4)#4,448 |
| 68. | 44443 | 18.5% | 1.9%(+16.6)#68 | 4.2%(+14.3)#4,455 |
| 69. | 43976 | 18.0% | 1.9%(+16.1)#69 | 4.2%(+13.8)#4,518 |
| 70. | 44730 | 17.8% | 1.9%(+15.9)#70 | 4.2%(+13.6)#4,550 |
| 71. | 45358 | 17.3% | 1.9%(+15.4)#71 | 4.2%(+13.1)#4,630 |
| 72. | 44436 | 17.2% | 1.9%(+15.3)#72 | 4.2%(+13.0)#4,638 |
| 73. | 44021 | 16.8% | 1.9%(+14.9)#73 | 4.2%(+12.6)#4,703 |
| 74. | 45761 | 16.8% | 1.9%(+14.9)#74 | 4.2%(+12.6)#4,707 |
| 75. | 43988 | 16.5% | 1.9%(+14.6)#75 | 4.2%(+12.3)#4,755 |
| 76. | 43145 | 16.5% | 1.9%(+14.6)#76 | 4.2%(+12.3)#4,757 |
| 77. | 44608 | 16.2% | 1.9%(+14.3)#77 | 4.2%(+12.0)#4,797 |
| 78. | 45153 | 15.8% | 1.9%(+13.9)#78 | 4.2%(+11.6)#4,866 |
| 79. | 45350 | 15.8% | 1.9%(+13.9)#79 | 4.2%(+11.6)#4,875 |
| 80. | 44201 | 15.7% | 1.9%(+13.8)#80 | 4.2%(+11.5)#4,882 |
| 81. | 43445 | 15.7% | 1.9%(+13.8)#81 | 4.2%(+11.5)#4,890 |
| 82. | 45146 | 15.4% | 1.9%(+13.5)#82 | 4.2%(+11.2)#4,935 |
| 83. | 44428 | 15.2% | 1.9%(+13.3)#83 | 4.2%(+11.0)#4,958 |
| 84. | 44859 | 15.2% | 1.9%(+13.3)#84 | 4.2%(+11.0)#4,960 |
| 85. | 45162 | 15.1% | 1.9%(+13.2)#85 | 4.2%(+10.9)#4,975 |
| 86. | 43066 | 14.9% | 1.9%(+13.0)#86 | 4.2%(+10.7)#5,013 |
| 87. | 44412 | 14.8% | 1.9%(+12.9)#87 | 4.2%(+10.6)#5,025 |
| 88. | 44065 | 14.7% | 1.9%(+12.8)#88 | 4.2%(+10.5)#5,045 |
| 89. | 45325 | 14.6% | 1.9%(+12.7)#89 | 4.2%(+10.4)#5,071 |
| 90. | 44451 | 14.2% | 1.9%(+12.3)#90 | 4.2%(+10.00)#5,140 |
| 91. | 44645 | 14.2% | 1.9%(+12.3)#91 | 4.2%(+10.00)#5,141 |
| 92. | 43164 | 13.9% | 1.9%(+12.0)#92 | 4.2%(+9.70)#5,199 |
| 93. | 44626 | 13.8% | 1.9%(+11.9)#93 | 4.2%(+9.60)#5,215 |
| 94. | 43115 | 13.6% | 1.9%(+11.7)#94 | 4.2%(+9.40)#5,242 |
| 95. | 44441 | 13.6% | 1.9%(+11.7)#95 | 4.2%(+9.40)#5,243 |
| 96. | 45311 | 13.5% | 1.9%(+11.6)#96 | 4.2%(+9.30)#5,257 |
| 97. | 43749 | 13.5% | 1.9%(+11.6)#97 | 4.2%(+9.30)#5,259 |
| 98. | 43964 | 13.1% | 1.9%(+11.2)#98 | 4.2%(+8.90)#5,323 |
| 99. | 44445 | 13.1% | 1.9%(+11.2)#99 | 4.2%(+8.90)#5,329 |
| 100. | 43986 | 13.1% | 1.9%(+11.2)#100 | 4.2%(+8.90)#5,331 |
Common Questions
What are the Top 10 Zip Codes with the Highest Percentage of Households Heated by Fuel Oil / Kerosene in Ohio?
Top 10 Zip Codes with the Highest Percentage of Households Heated by Fuel Oil / Kerosene in Ohio are:
What zip code has the Highest Percentage of Households Heated by Fuel Oil / Kerosene in Ohio?
43914 has the Highest Percentage of Households Heated by Fuel Oil / Kerosene in Ohio with 100.0%.
What is the Percentage of Households Heated by Fuel Oil / Kerosene in the State of Ohio?
Percentage of Households Heated by Fuel Oil / Kerosene in Ohio is 1.9%.
What is the Percentage of Households Heated by Fuel Oil / Kerosene in the United States?
Percentage of Households Heated by Fuel Oil / Kerosene in the United States is 4.2%.