South Gull Lake, MI Map & Demographics
South Gull Lake Map
South Gull Lake Overview
$120,673
PER CAPITA INCOME
$167,000
AVG FAMILY INCOME
0.51
INEQUALITY / GINI INDEX
1,585
TOTAL POPULATION
833
MALE POPULATION
752
FEMALE POPULATION
110.77
MALES / 100 FEMALES
90.28
FEMALES / 100 MALES
55.4
MEDIAN AGE
2.6
AVG FAMILY SIZE
2.3
AVG HOUSEHOLD SIZE
879
LABOR FORCE [ PEOPLE ]
68.6%
PERCENT IN LABOR FORCE
1.3%
UNEMPLOYMENT RATE
Income in South Gull Lake
Income Overview in South Gull Lake
| Characteristic | Number | Measure |
| Per Capita Income | 1,585 | $120,673 |
| Median Family Income | 536 | $167,000 |
| Mean Family Income | 536 | $327,849 |
| Median Household Income | 672 | $0 |
| Mean Household Income | 672 | $281,722 |
| Income Deficit | 536 | $0 |
| Wage / Income Gap (%) | 1,585 | 0.00% |
| Wage / Income Gap ($) | 1,585 | 100.00¢ per $1 |
| Gini / Inequality Index | 1,585 | 0.51 |
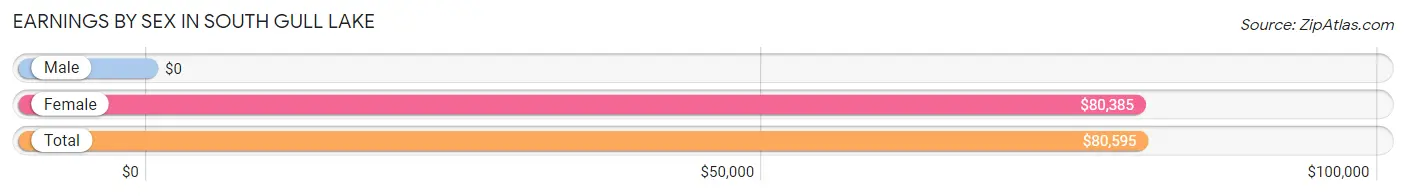
Earnings by Sex in South Gull Lake
| Sex | Number | Average Earnings |
| Male | 465 (53.2%) | $0 |
| Female | 409 (46.8%) | $80,385 |
| Total | 874 (100.0%) | $80,595 |
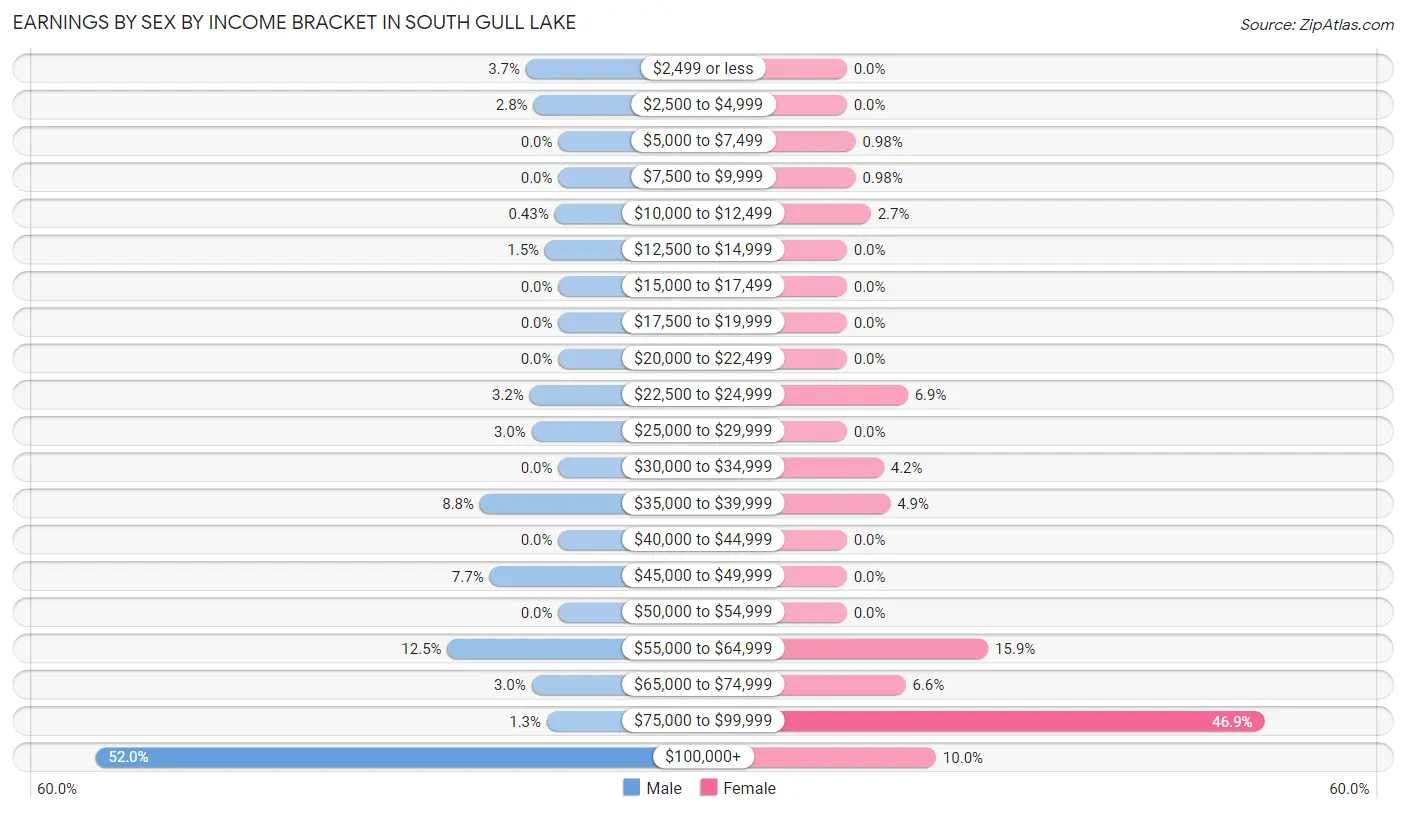
Earnings by Sex by Income Bracket in South Gull Lake
The most common earnings brackets in South Gull Lake are $100,000+ for men (242 | 52.0%) and $75,000 to $99,999 for women (192 | 46.9%).
| Income | Male | Female |
| $2,499 or less | 17 (3.7%) | 0 (0.0%) |
| $2,500 to $4,999 | 13 (2.8%) | 0 (0.0%) |
| $5,000 to $7,499 | 0 (0.0%) | 4 (1.0%) |
| $7,500 to $9,999 | 0 (0.0%) | 4 (1.0%) |
| $10,000 to $12,499 | 2 (0.4%) | 11 (2.7%) |
| $12,500 to $14,999 | 7 (1.5%) | 0 (0.0%) |
| $15,000 to $17,499 | 0 (0.0%) | 0 (0.0%) |
| $17,500 to $19,999 | 0 (0.0%) | 0 (0.0%) |
| $20,000 to $22,499 | 0 (0.0%) | 0 (0.0%) |
| $22,500 to $24,999 | 15 (3.2%) | 28 (6.9%) |
| $25,000 to $29,999 | 14 (3.0%) | 0 (0.0%) |
| $30,000 to $34,999 | 0 (0.0%) | 17 (4.2%) |
| $35,000 to $39,999 | 41 (8.8%) | 20 (4.9%) |
| $40,000 to $44,999 | 0 (0.0%) | 0 (0.0%) |
| $45,000 to $49,999 | 36 (7.7%) | 0 (0.0%) |
| $50,000 to $54,999 | 0 (0.0%) | 0 (0.0%) |
| $55,000 to $64,999 | 58 (12.5%) | 65 (15.9%) |
| $65,000 to $74,999 | 14 (3.0%) | 27 (6.6%) |
| $75,000 to $99,999 | 6 (1.3%) | 192 (46.9%) |
| $100,000+ | 242 (52.0%) | 41 (10.0%) |
| Total | 465 (100.0%) | 409 (100.0%) |
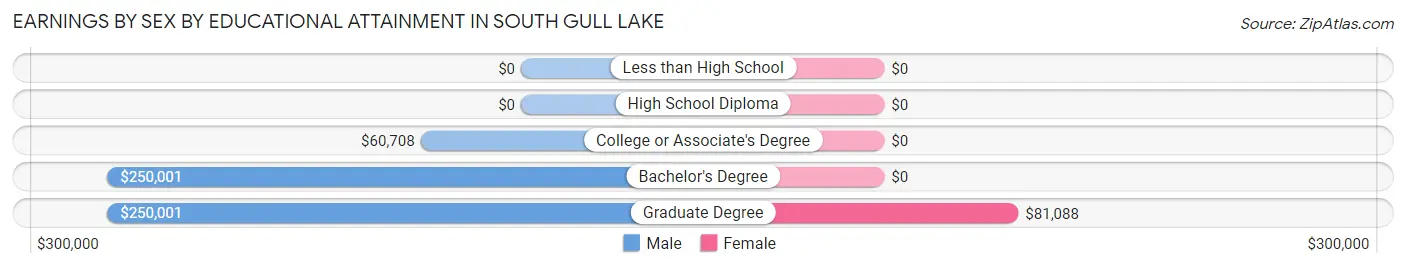
Earnings by Sex by Educational Attainment in South Gull Lake
| Educational Attainment | Male Income | Female Income |
| Less than High School | - | - |
| High School Diploma | - | - |
| College or Associate's Degree | $60,708 | $0 |
| Bachelor's Degree | $250,001 | $0 |
| Graduate Degree | $250,001 | $81,088 |
| Total | - | - |
Family Income in South Gull Lake
Family Income Brackets in South Gull Lake
According to the South Gull Lake family income data, there are 249 families falling into the $200,000+ income range, which is the most common income bracket and makes up 46.5% of all families.
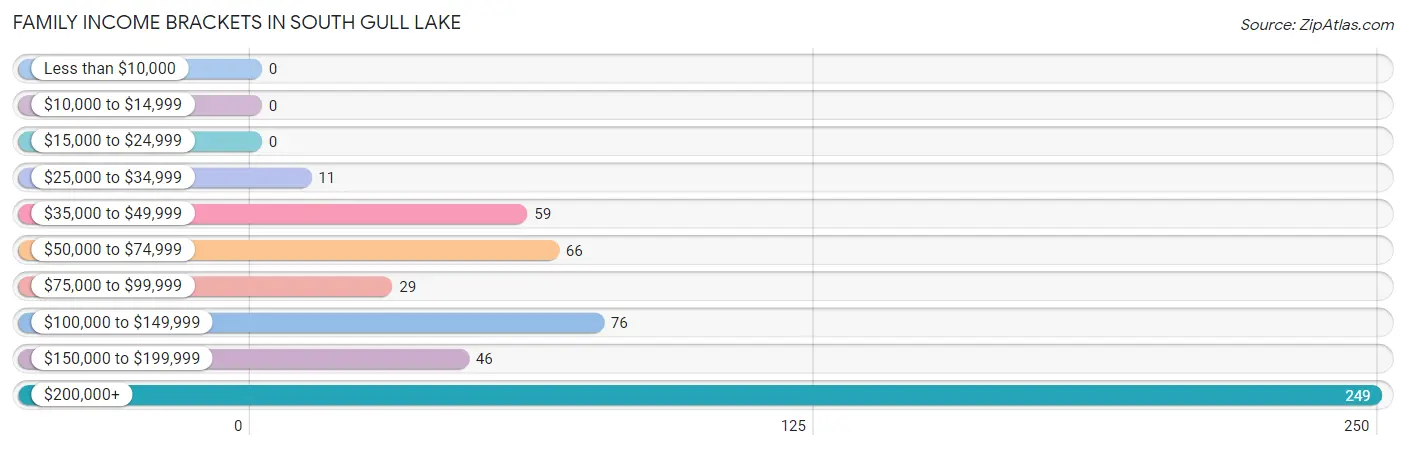
| Income Bracket | # Families | % Families |
| Less than $10,000 | 0 | 0.0% |
| $10,000 to $14,999 | 0 | 0.0% |
| $15,000 to $24,999 | 0 | 0.0% |
| $25,000 to $34,999 | 11 | 2.1% |
| $35,000 to $49,999 | 59 | 11.0% |
| $50,000 to $74,999 | 66 | 12.3% |
| $75,000 to $99,999 | 29 | 5.4% |
| $100,000 to $149,999 | 76 | 14.2% |
| $150,000 to $199,999 | 46 | 8.6% |
| $200,000+ | 249 | 46.5% |
Family Income by Famaliy Size in South Gull Lake
2-person families (400 | 74.6%) account for the highest median family income in South Gull Lake with $250,001 per family, while 2-person families (400 | 74.6%) have the highest median income of $125,000 per family member.
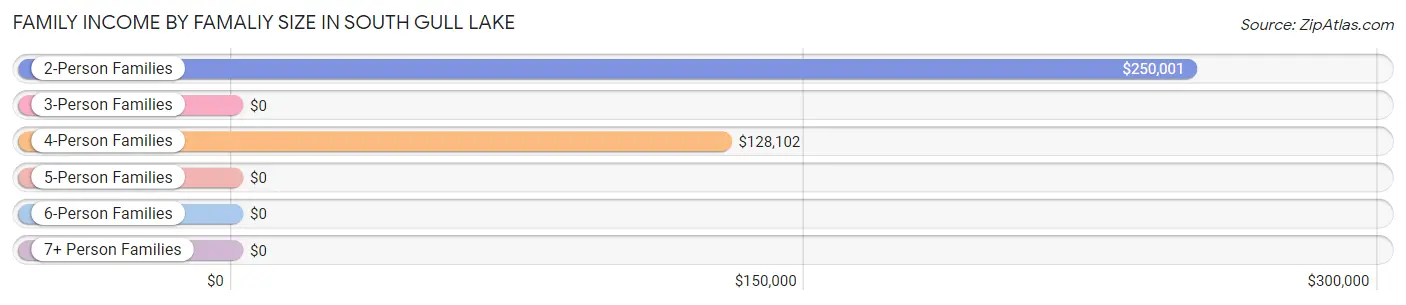
| Income Bracket | # Families | Median Income |
| 2-Person Families | 400 (74.6%) | $250,001 |
| 3-Person Families | 47 (8.8%) | $0 |
| 4-Person Families | 41 (7.6%) | $128,102 |
| 5-Person Families | 18 (3.4%) | $0 |
| 6-Person Families | 30 (5.6%) | $0 |
| 7+ Person Families | 0 (0.0%) | $0 |
| Total | 536 (100.0%) | $167,000 |
Family Income by Number of Earners in South Gull Lake
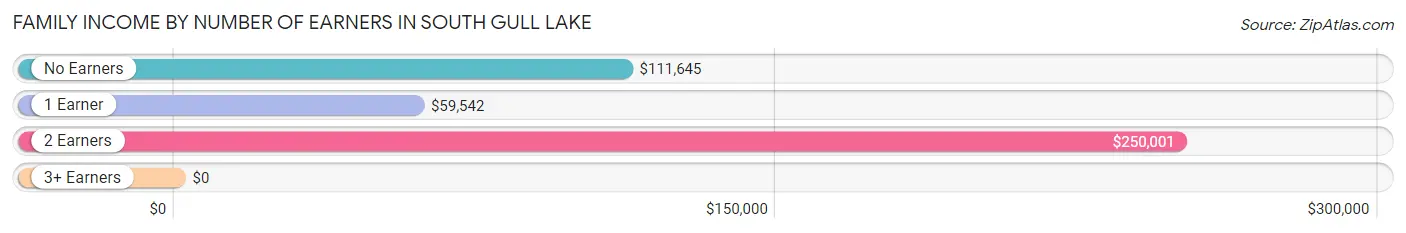
| Number of Earners | # Families | Median Income |
| No Earners | 83 (15.5%) | $111,645 |
| 1 Earner | 159 (29.7%) | $59,542 |
| 2 Earners | 294 (54.8%) | $250,001 |
| 3+ Earners | 0 (0.0%) | $0 |
| Total | 536 (100.0%) | $167,000 |
Household Income in South Gull Lake
Household Income Brackets in South Gull Lake
With 282 households falling in the category, the $200,000+ income range is the most frequent in South Gull Lake, accounting for 42.0% of all households.
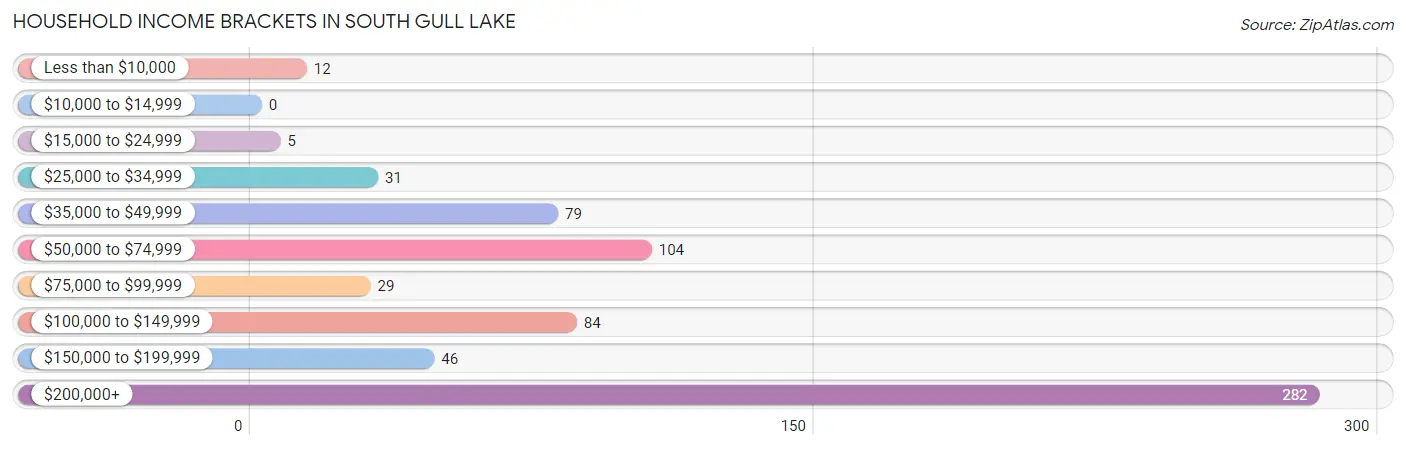
| Income Bracket | # Households | % Households |
| Less than $10,000 | 12 | 1.8% |
| $10,000 to $14,999 | 0 | 0.0% |
| $15,000 to $24,999 | 5 | 0.7% |
| $25,000 to $34,999 | 31 | 4.6% |
| $35,000 to $49,999 | 79 | 11.8% |
| $50,000 to $74,999 | 104 | 15.5% |
| $75,000 to $99,999 | 29 | 4.3% |
| $100,000 to $149,999 | 84 | 12.5% |
| $150,000 to $199,999 | 46 | 6.8% |
| $200,000+ | 282 | 42.0% |
Household Income by Householder Age in South Gull Lake
The median household income in South Gull Lake is $0, with the highest median household income of $250,001 found in the 45 to 64 years age bracket for the primary householder. A total of 263 households (39.1%) fall into this category. Meanwhile, the 15 to 24 years age bracket for the primary householder has the lowest median household income of $0, with 34 households (5.1%) in this group.
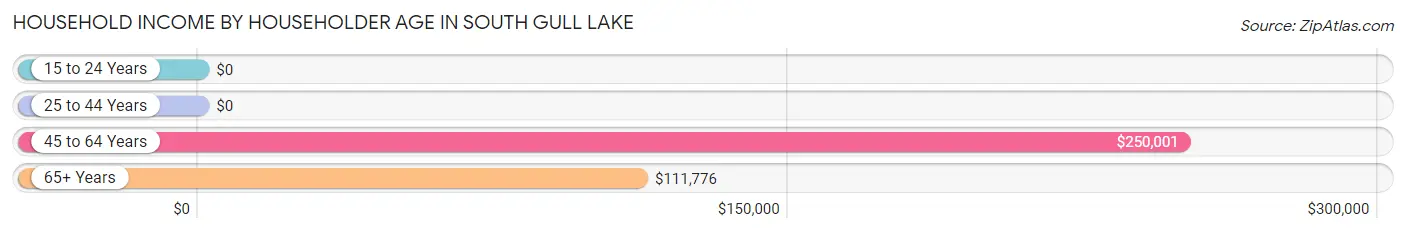
| Income Bracket | # Households | Median Income |
| 15 to 24 Years | 34 (5.1%) | $0 |
| 25 to 44 Years | 134 (19.9%) | $0 |
| 45 to 64 Years | 263 (39.1%) | $250,001 |
| 65+ Years | 241 (35.9%) | $111,776 |
| Total | 672 (100.0%) | $0 |
Poverty in South Gull Lake
Income Below Poverty by Sex and Age in South Gull Lake
With 0.2% poverty level for males and 1.6% for females among the residents of South Gull Lake, 45 to 54 year old males and 75 year old and over females are the most vulnerable to poverty, with 2 males (6.9%) and 12 females (12.4%) in their respective age groups living below the poverty level.
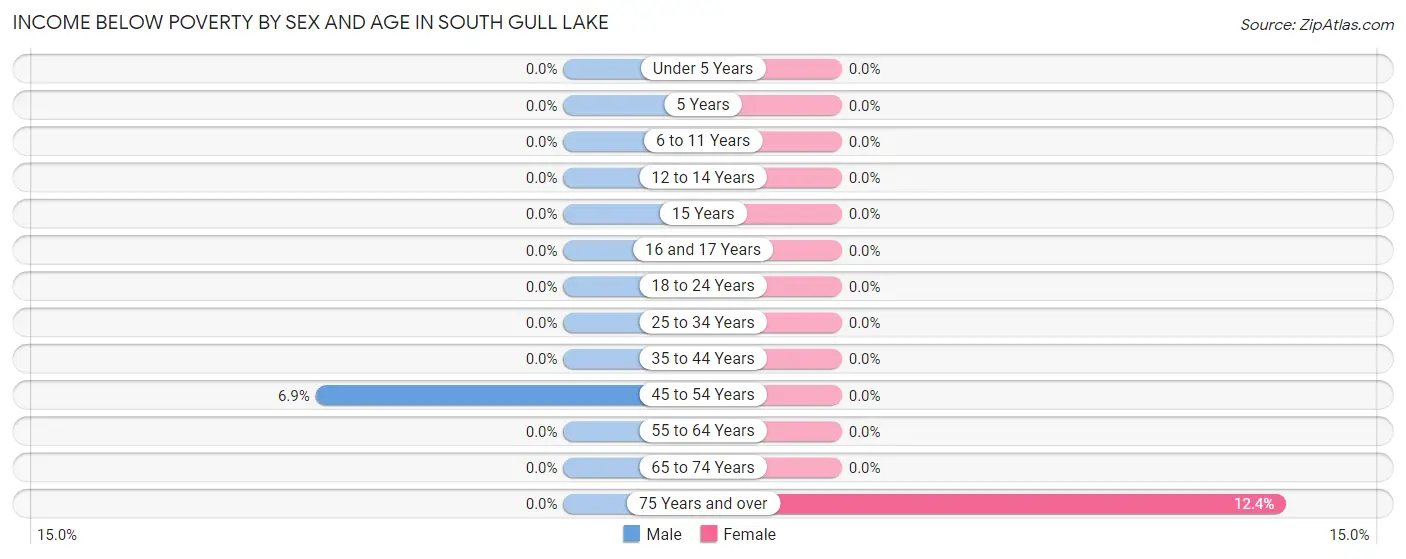
| Age Bracket | Male | Female |
| Under 5 Years | 0 (0.0%) | 0 (0.0%) |
| 5 Years | 0 (0.0%) | 0 (0.0%) |
| 6 to 11 Years | 0 (0.0%) | 0 (0.0%) |
| 12 to 14 Years | 0 (0.0%) | 0 (0.0%) |
| 15 Years | 0 (0.0%) | 0 (0.0%) |
| 16 and 17 Years | 0 (0.0%) | 0 (0.0%) |
| 18 to 24 Years | 0 (0.0%) | 0 (0.0%) |
| 25 to 34 Years | 0 (0.0%) | 0 (0.0%) |
| 35 to 44 Years | 0 (0.0%) | 0 (0.0%) |
| 45 to 54 Years | 2 (6.9%) | 0 (0.0%) |
| 55 to 64 Years | 0 (0.0%) | 0 (0.0%) |
| 65 to 74 Years | 0 (0.0%) | 0 (0.0%) |
| 75 Years and over | 0 (0.0%) | 12 (12.4%) |
| Total | 2 (0.2%) | 12 (1.6%) |
Income Above Poverty by Sex and Age in South Gull Lake
According to the poverty statistics in South Gull Lake, males aged under 5 years and females aged under 5 years are the age groups that are most secure financially, with 100.0% of males and 100.0% of females in these age groups living above the poverty line.
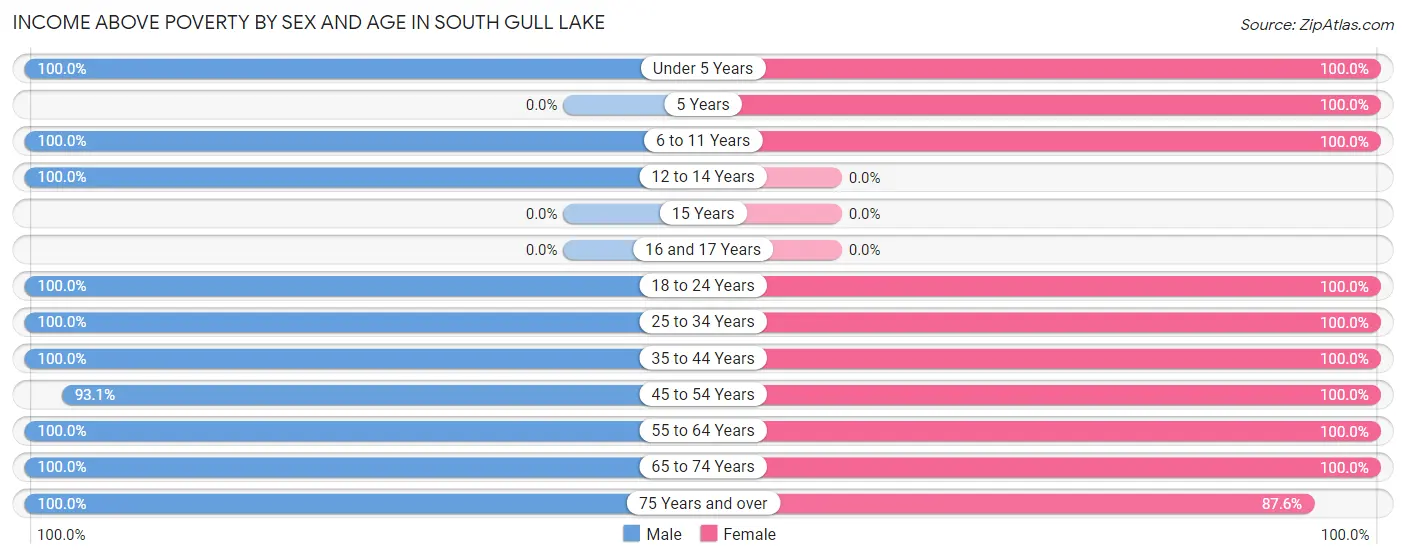
| Age Bracket | Male | Female |
| Under 5 Years | 54 (100.0%) | 75 (100.0%) |
| 5 Years | 0 (0.0%) | 6 (100.0%) |
| 6 to 11 Years | 60 (100.0%) | 52 (100.0%) |
| 12 to 14 Years | 56 (100.0%) | 0 (0.0%) |
| 15 Years | 0 (0.0%) | 0 (0.0%) |
| 16 and 17 Years | 0 (0.0%) | 0 (0.0%) |
| 18 to 24 Years | 27 (100.0%) | 60 (100.0%) |
| 25 to 34 Years | 61 (100.0%) | 9 (100.0%) |
| 35 to 44 Years | 72 (100.0%) | 113 (100.0%) |
| 45 to 54 Years | 27 (93.1%) | 30 (100.0%) |
| 55 to 64 Years | 244 (100.0%) | 259 (100.0%) |
| 65 to 74 Years | 101 (100.0%) | 47 (100.0%) |
| 75 Years and over | 124 (100.0%) | 85 (87.6%) |
| Total | 826 (99.8%) | 736 (98.4%) |
Income Below Poverty Among Married-Couple Families in South Gull Lake
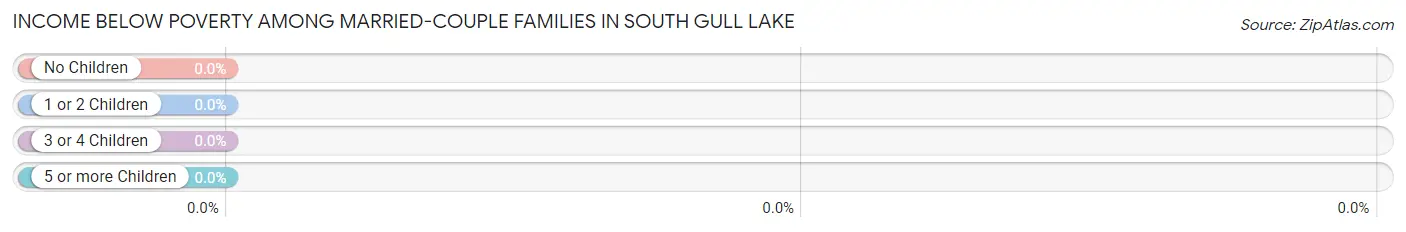
| Children | Above Poverty | Below Poverty |
| No Children | 358 (100.0%) | 0 (0.0%) |
| 1 or 2 Children | 36 (100.0%) | 0 (0.0%) |
| 3 or 4 Children | 48 (100.0%) | 0 (0.0%) |
| 5 or more Children | 0 (0.0%) | 0 (0.0%) |
| Total | 442 (100.0%) | 0 (0.0%) |
Income Below Poverty Among Single-Parent Households in South Gull Lake
| Children | Single Father | Single Mother |
| No Children | 0 (0.0%) | 0 (0.0%) |
| 1 or 2 Children | 0 (0.0%) | 0 (0.0%) |
| 3 or 4 Children | 0 (0.0%) | 0 (0.0%) |
| 5 or more Children | 0 (0.0%) | 0 (0.0%) |
| Total | 0 (0.0%) | 0 (0.0%) |
Income Below Poverty Among Married-Couple vs Single-Parent Households in South Gull Lake
| Children | Married-Couple Families | Single-Parent Households |
| No Children | 0 (0.0%) | 0 (0.0%) |
| 1 or 2 Children | 0 (0.0%) | 0 (0.0%) |
| 3 or 4 Children | 0 (0.0%) | 0 (0.0%) |
| 5 or more Children | 0 (0.0%) | 0 (0.0%) |
| Total | 0 (0.0%) | 0 (0.0%) |
Race in South Gull Lake
The most populous races in South Gull Lake are White / Caucasian (1,529 | 96.5%), Two or more Races (52 | 3.3%), and Black / African American (4 | 0.3%).
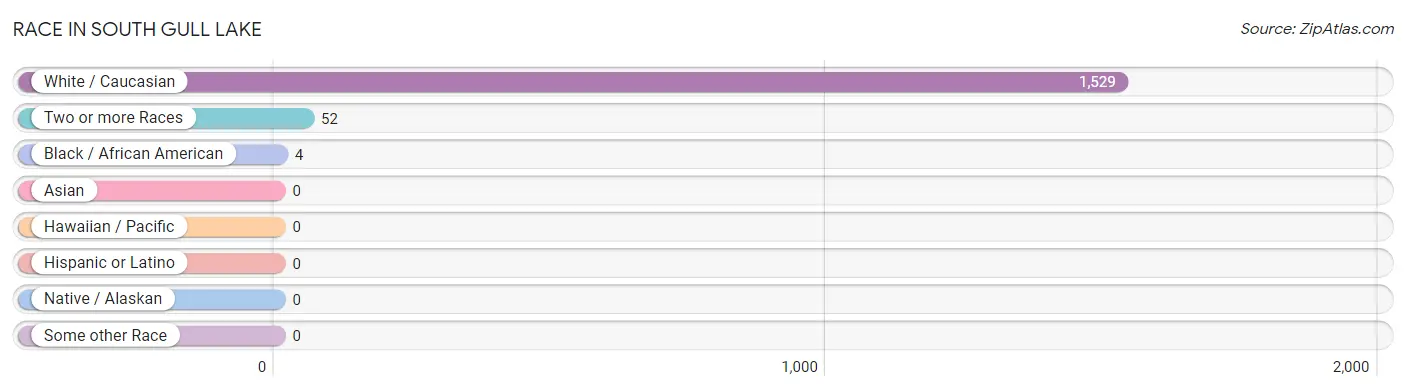
| Race | # Population | % Population |
| Asian | 0 | 0.0% |
| Black / African American | 4 | 0.3% |
| Hawaiian / Pacific | 0 | 0.0% |
| Hispanic or Latino | 0 | 0.0% |
| Native / Alaskan | 0 | 0.0% |
| White / Caucasian | 1,529 | 96.5% |
| Two or more Races | 52 | 3.3% |
| Some other Race | 0 | 0.0% |
| Total | 1,585 | 100.0% |
Ancestry in South Gull Lake
The most populous ancestries reported in South Gull Lake are German (883 | 55.7%), Irish (361 | 22.8%), English (259 | 16.3%), Canadian (185 | 11.7%), and Greek (156 | 9.8%), together accounting for 116.3% of all South Gull Lake residents.
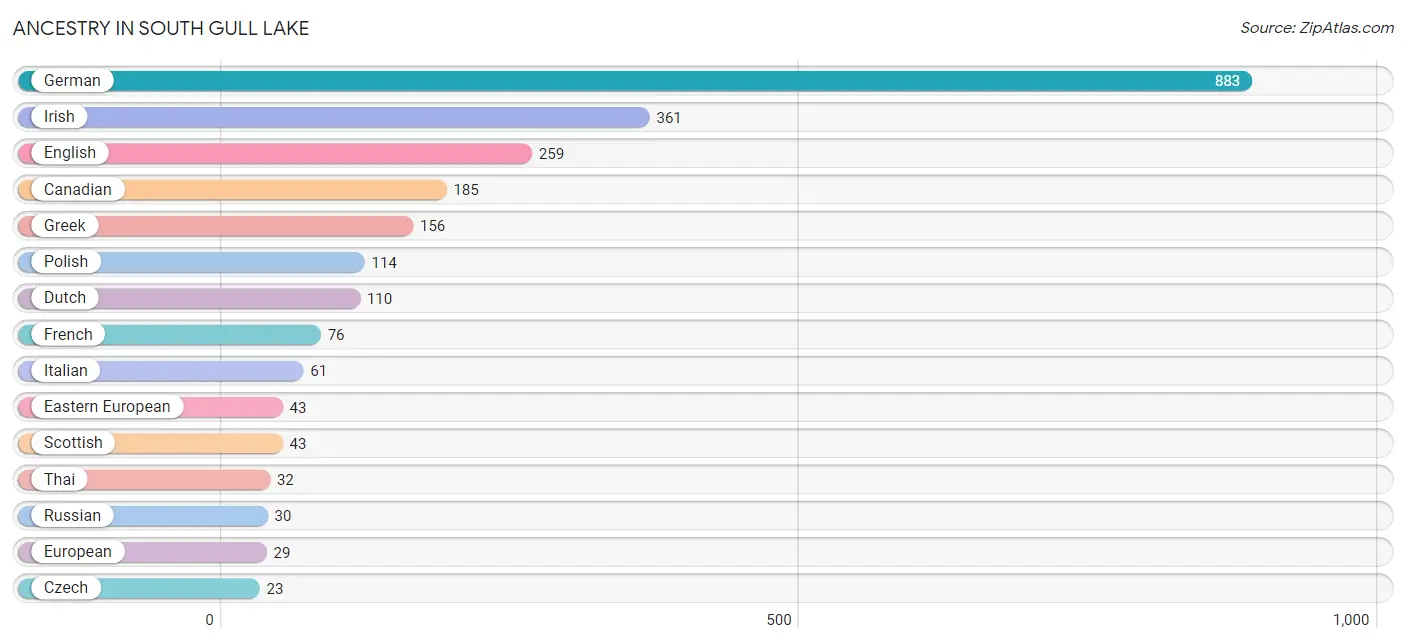
| Ancestry | # Population | % Population |
| American | 18 | 1.1% |
| Arab | 2 | 0.1% |
| Austrian | 11 | 0.7% |
| Barbadian | 7 | 0.4% |
| Canadian | 185 | 11.7% |
| Czech | 23 | 1.5% |
| Danish | 7 | 0.4% |
| Dutch | 110 | 6.9% |
| Eastern European | 43 | 2.7% |
| English | 259 | 16.3% |
| European | 29 | 1.8% |
| French | 76 | 4.8% |
| German | 883 | 55.7% |
| Greek | 156 | 9.8% |
| Hungarian | 5 | 0.3% |
| Irish | 361 | 22.8% |
| Italian | 61 | 3.8% |
| Latvian | 7 | 0.4% |
| Lebanese | 2 | 0.1% |
| Norwegian | 6 | 0.4% |
| Polish | 114 | 7.2% |
| Russian | 30 | 1.9% |
| Scottish | 43 | 2.7% |
| Swedish | 1 | 0.1% |
| Thai | 32 | 2.0% |
| Welsh | 6 | 0.4% | View All 26 Rows |
Immigrants in South Gull Lake
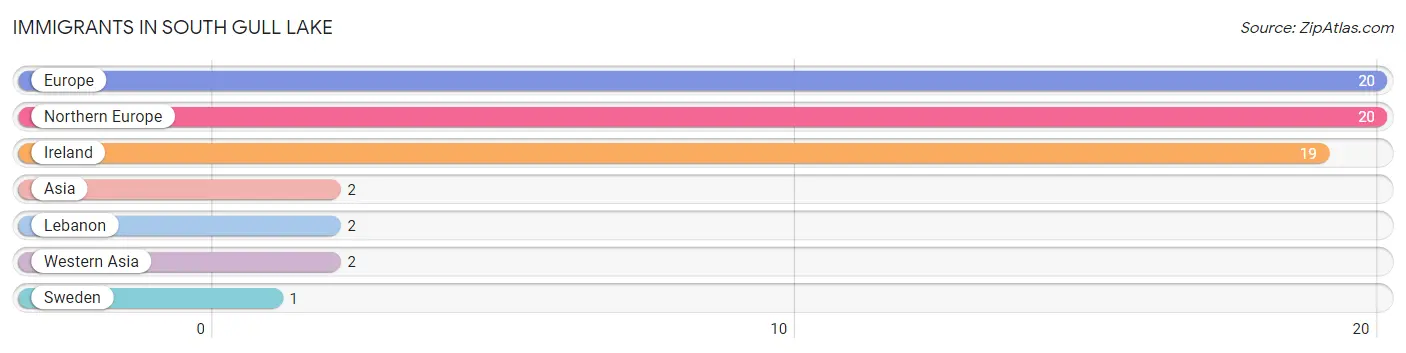
The most numerous immigrant groups reported in South Gull Lake came from Europe (20 | 1.3%), Northern Europe (20 | 1.3%), Ireland (19 | 1.2%), Asia (2 | 0.1%), and Lebanon (2 | 0.1%), together accounting for 4.0% of all South Gull Lake residents.
| Immigration Origin | # Population | % Population |
| Asia | 2 | 0.1% |
| Europe | 20 | 1.3% |
| Ireland | 19 | 1.2% |
| Lebanon | 2 | 0.1% |
| Northern Europe | 20 | 1.3% |
| Sweden | 1 | 0.1% |
| Western Asia | 2 | 0.1% | View All 7 Rows |
Sex and Age in South Gull Lake
Sex and Age in South Gull Lake
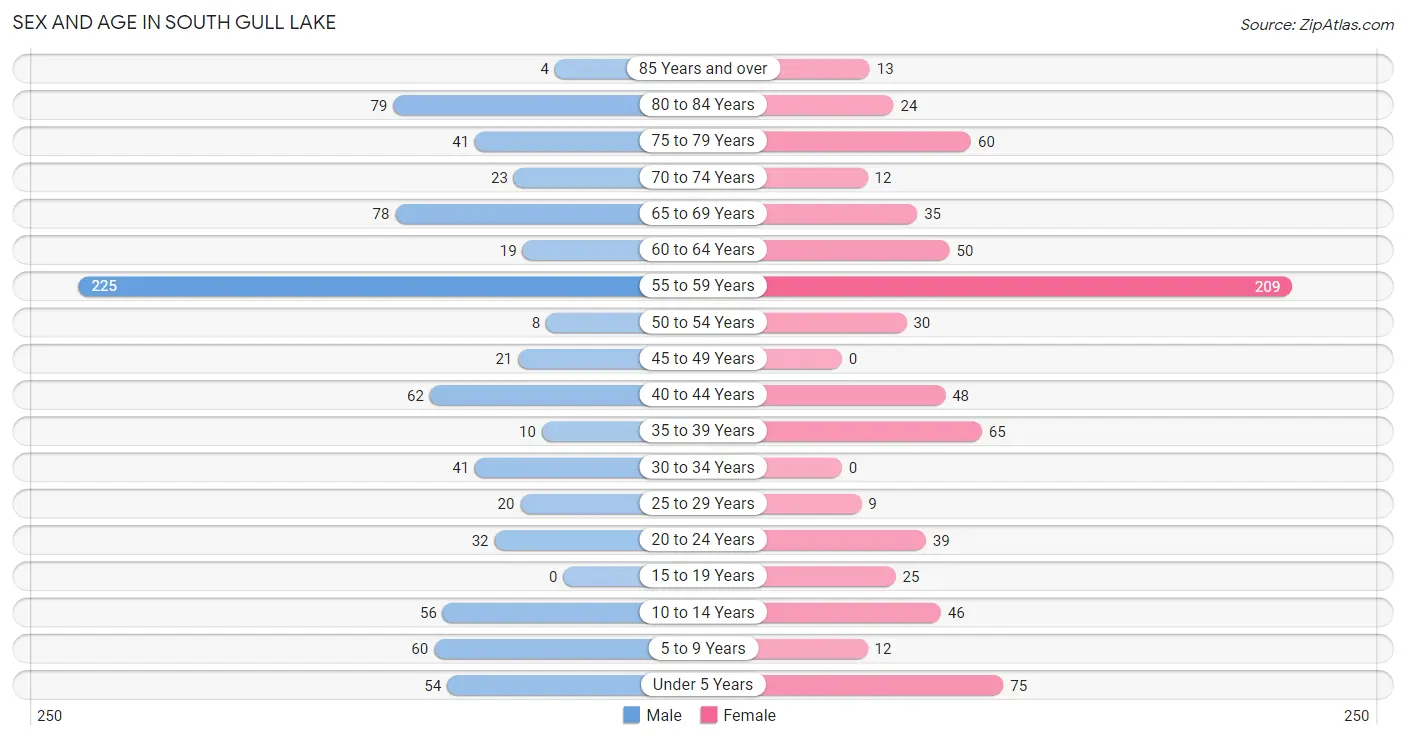
The most populous age groups in South Gull Lake are 55 to 59 Years (225 | 27.0%) for men and 55 to 59 Years (209 | 27.8%) for women.
| Age Bracket | Male | Female |
| Under 5 Years | 54 (6.5%) | 75 (10.0%) |
| 5 to 9 Years | 60 (7.2%) | 12 (1.6%) |
| 10 to 14 Years | 56 (6.7%) | 46 (6.1%) |
| 15 to 19 Years | 0 (0.0%) | 25 (3.3%) |
| 20 to 24 Years | 32 (3.8%) | 39 (5.2%) |
| 25 to 29 Years | 20 (2.4%) | 9 (1.2%) |
| 30 to 34 Years | 41 (4.9%) | 0 (0.0%) |
| 35 to 39 Years | 10 (1.2%) | 65 (8.6%) |
| 40 to 44 Years | 62 (7.4%) | 48 (6.4%) |
| 45 to 49 Years | 21 (2.5%) | 0 (0.0%) |
| 50 to 54 Years | 8 (1.0%) | 30 (4.0%) |
| 55 to 59 Years | 225 (27.0%) | 209 (27.8%) |
| 60 to 64 Years | 19 (2.3%) | 50 (6.7%) |
| 65 to 69 Years | 78 (9.4%) | 35 (4.6%) |
| 70 to 74 Years | 23 (2.8%) | 12 (1.6%) |
| 75 to 79 Years | 41 (4.9%) | 60 (8.0%) |
| 80 to 84 Years | 79 (9.5%) | 24 (3.2%) |
| 85 Years and over | 4 (0.5%) | 13 (1.7%) |
| Total | 833 (100.0%) | 752 (100.0%) |
Families and Households in South Gull Lake
Median Family Size in South Gull Lake
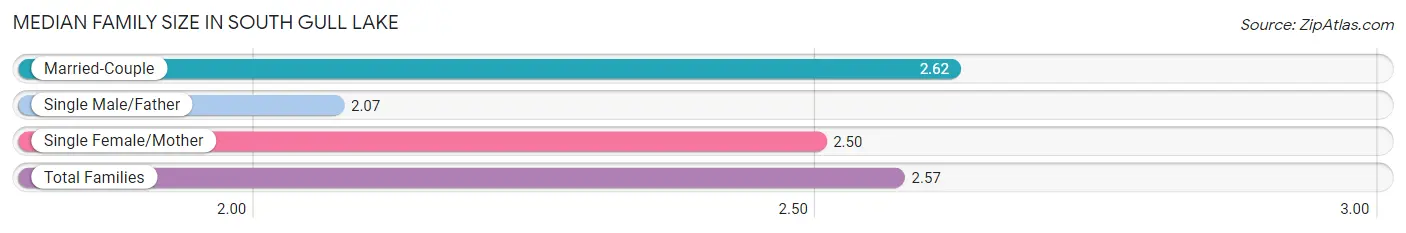
The median family size in South Gull Lake is 2.57 persons per family, with married-couple families (442 | 82.5%) accounting for the largest median family size of 2.62 persons per family. On the other hand, single male/father families (44 | 8.2%) represent the smallest median family size with 2.07 persons per family.
| Family Type | # Families | Family Size |
| Married-Couple | 442 (82.5%) | 2.62 |
| Single Male/Father | 44 (8.2%) | 2.07 |
| Single Female/Mother | 50 (9.3%) | 2.50 |
| Total Families | 536 (100.0%) | 2.57 |
Median Household Size in South Gull Lake
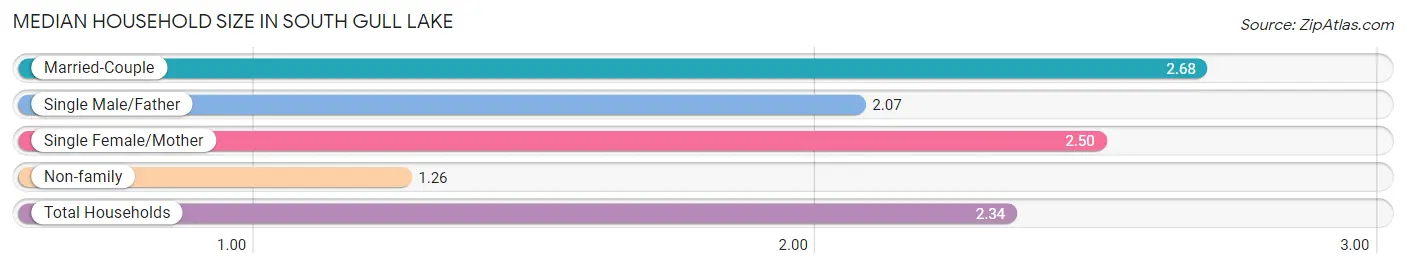
The median household size in South Gull Lake is 2.34 persons per household, with married-couple households (442 | 65.8%) accounting for the largest median household size of 2.68 persons per household. non-family households (136 | 20.2%) represent the smallest median household size with 1.26 persons per household.
| Household Type | # Households | Household Size |
| Married-Couple | 442 (65.8%) | 2.68 |
| Single Male/Father | 44 (6.6%) | 2.07 |
| Single Female/Mother | 50 (7.4%) | 2.50 |
| Non-family | 136 (20.2%) | 1.26 |
| Total Households | 672 (100.0%) | 2.34 |
Household Size by Marriage Status in South Gull Lake
Out of a total of 672 households in South Gull Lake, 536 (79.8%) are family households, while 136 (20.2%) are nonfamily households. The most numerous type of family households are 2-person households, comprising 400, and the most common type of nonfamily households are 1-person households, comprising 99.
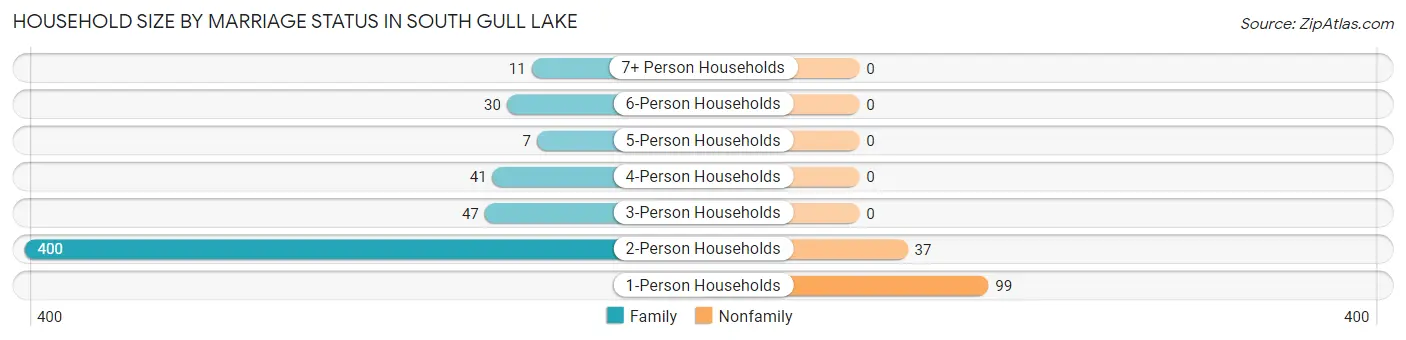
| Household Size | Family Households | Nonfamily Households |
| 1-Person Households | - | 99 (14.7%) |
| 2-Person Households | 400 (59.5%) | 37 (5.5%) |
| 3-Person Households | 47 (7.0%) | 0 (0.0%) |
| 4-Person Households | 41 (6.1%) | 0 (0.0%) |
| 5-Person Households | 7 (1.0%) | 0 (0.0%) |
| 6-Person Households | 30 (4.5%) | 0 (0.0%) |
| 7+ Person Households | 11 (1.6%) | 0 (0.0%) |
| Total | 536 (79.8%) | 136 (20.2%) |
Female Fertility in South Gull Lake
Fertility by Age in South Gull Lake
Average fertility rate in South Gull Lake is 145.0 births per 1,000 women. Women in the age bracket of 35 to 50 years have the highest fertility rate with 239.0 births per 1,000 women. Women in the age bracket of 35 to 50 years acount for 100.0% of all women with births.
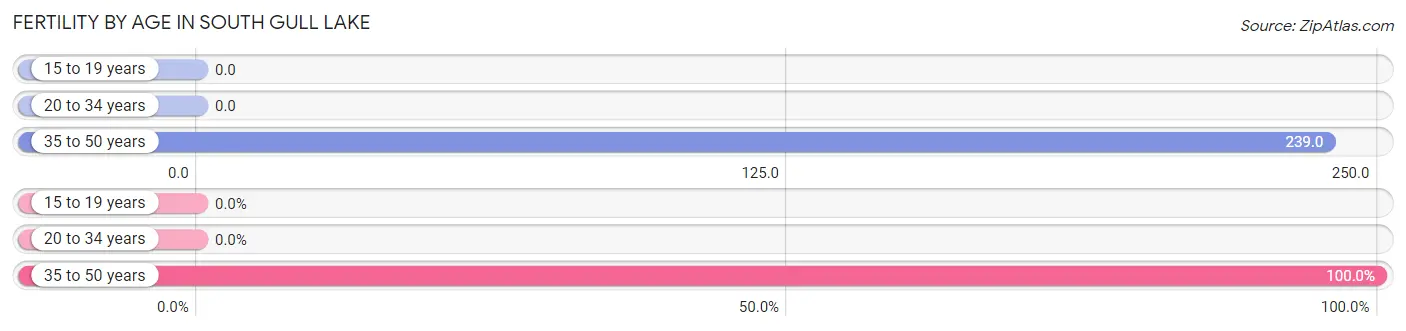
| Age Bracket | Women with Births | Births / 1,000 Women |
| 15 to 19 years | 0 (0.0%) | 0.0 |
| 20 to 34 years | 0 (0.0%) | 0.0 |
| 35 to 50 years | 27 (100.0%) | 239.0 |
| Total | 27 (100.0%) | 145.0 |
Fertility by Age by Marriage Status in South Gull Lake
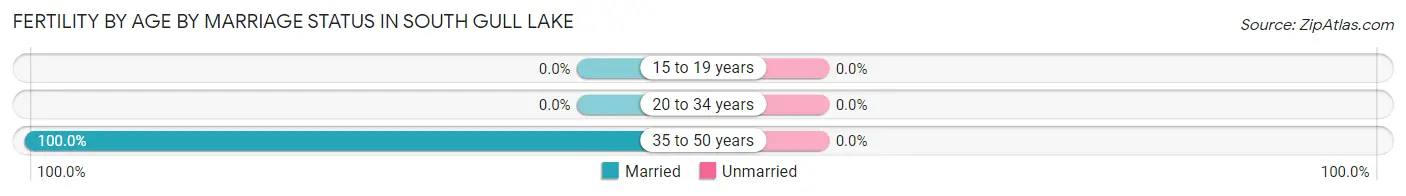
| Age Bracket | Married | Unmarried |
| 15 to 19 years | 0 (0.0%) | 0 (0.0%) |
| 20 to 34 years | 0 (0.0%) | 0 (0.0%) |
| 35 to 50 years | 27 (100.0%) | 0 (0.0%) |
| Total | 27 (100.0%) | 0 (0.0%) |
Fertility by Education in South Gull Lake
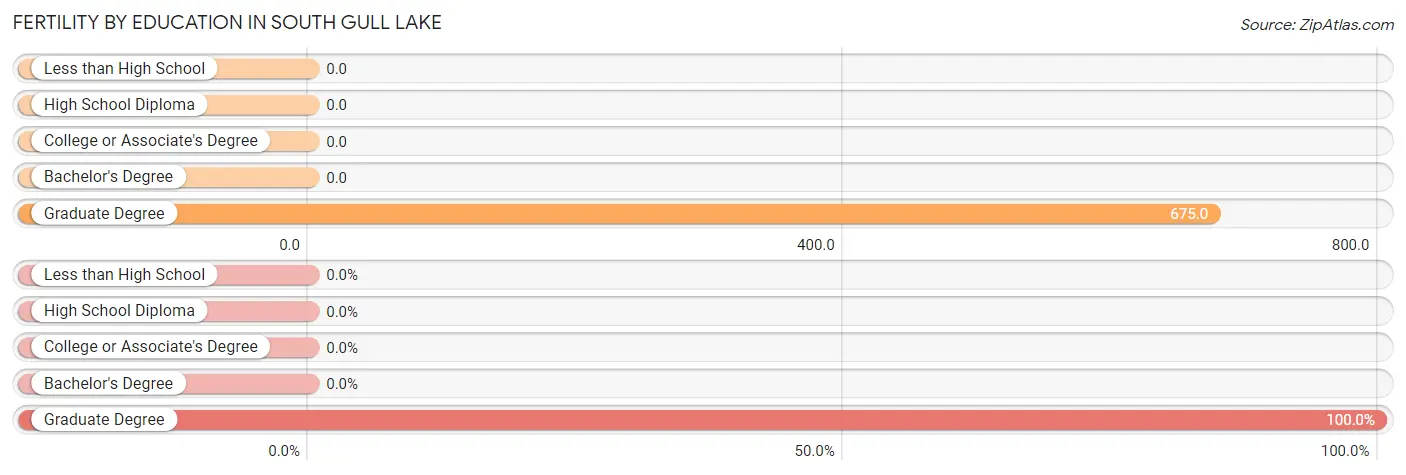
| Educational Attainment | Women with Births | Births / 1,000 Women |
| Less than High School | 0 (0.0%) | 0.0 |
| High School Diploma | 0 (0.0%) | 0.0 |
| College or Associate's Degree | 0 (0.0%) | 0.0 |
| Bachelor's Degree | 0 (0.0%) | 0.0 |
| Graduate Degree | 27 (100.0%) | 675.0 |
| Total | 27 (100.0%) | 145.0 |
Fertility by Education by Marriage Status in South Gull Lake
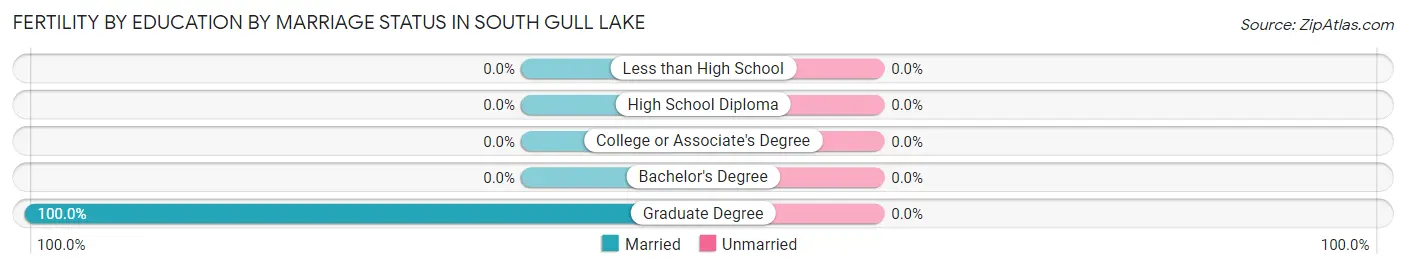
| Educational Attainment | Married | Unmarried |
| Less than High School | 0 (0.0%) | 0 (0.0%) |
| High School Diploma | 0 (0.0%) | 0 (0.0%) |
| College or Associate's Degree | 0 (0.0%) | 0 (0.0%) |
| Bachelor's Degree | 0 (0.0%) | 0 (0.0%) |
| Graduate Degree | 27 (100.0%) | 0 (0.0%) |
| Total | 27 (100.0%) | 0 (0.0%) |
Employment Characteristics in South Gull Lake
Employment by Class of Employer in South Gull Lake
Among the 847 employed individuals in South Gull Lake, private company employees (436 | 51.5%), not-for-profit organizations (312 | 36.8%), and local government employees (50 | 5.9%) make up the most common classes of employment.

| Employer Class | # Employees | % Employees |
| Private Company Employees | 436 | 51.5% |
| Self-Employed (Incorporated) | 36 | 4.3% |
| Self-Employed (Not Incorporated) | 7 | 0.8% |
| Not-for-profit Organizations | 312 | 36.8% |
| Local Government Employees | 50 | 5.9% |
| State Government Employees | 0 | 0.0% |
| Federal Government Employees | 6 | 0.7% |
| Unpaid Family Workers | 0 | 0.0% |
| Total | 847 | 100.0% |
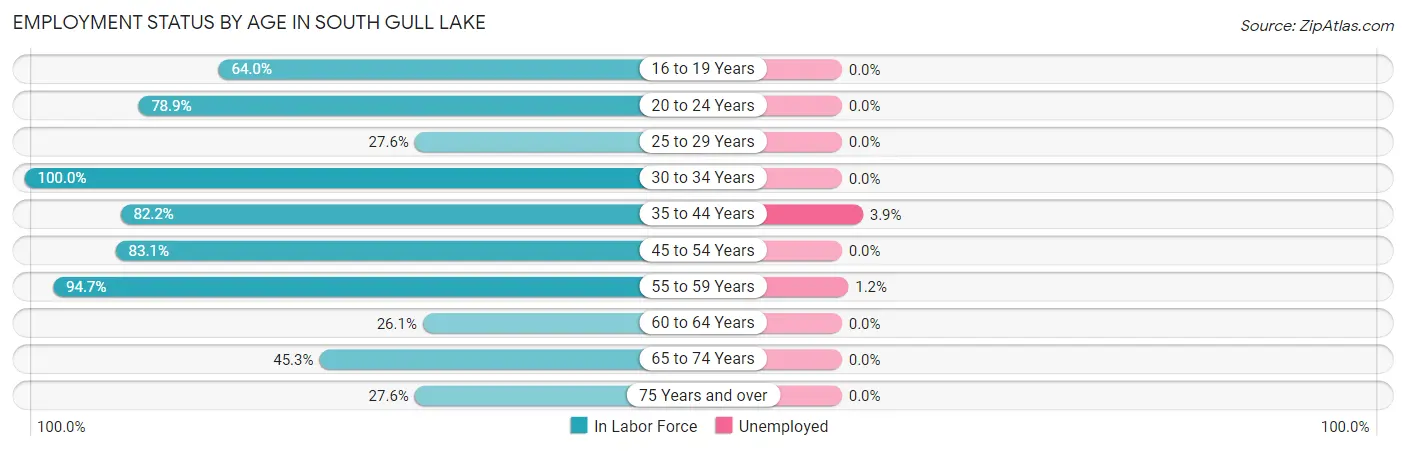
Employment Status by Age in South Gull Lake
According to the labor force statistics for South Gull Lake, out of the total population over 16 years of age (1,282), 68.6% or 879 individuals are in the labor force, with 1.3% or 11 of them unemployed. The age group with the highest labor force participation rate is 30 to 34 years, with 100.0% or 41 individuals in the labor force. Within the labor force, the 35 to 44 years age range has the highest percentage of unemployed individuals, with 3.9% or 6 of them being unemployed.
| Age Bracket | In Labor Force | Unemployed |
| 16 to 19 Years | 16 (64.0%) | 0 (0.0%) |
| 20 to 24 Years | 56 (78.9%) | 0 (0.0%) |
| 25 to 29 Years | 8 (27.6%) | 0 (0.0%) |
| 30 to 34 Years | 41 (100.0%) | 0 (0.0%) |
| 35 to 44 Years | 152 (82.2%) | 6 (3.9%) |
| 45 to 54 Years | 49 (83.1%) | 0 (0.0%) |
| 55 to 59 Years | 411 (94.7%) | 5 (1.2%) |
| 60 to 64 Years | 18 (26.1%) | 0 (0.0%) |
| 65 to 74 Years | 67 (45.3%) | 0 (0.0%) |
| 75 Years and over | 61 (27.6%) | 0 (0.0%) |
| Total | 879 (68.6%) | 11 (1.3%) |
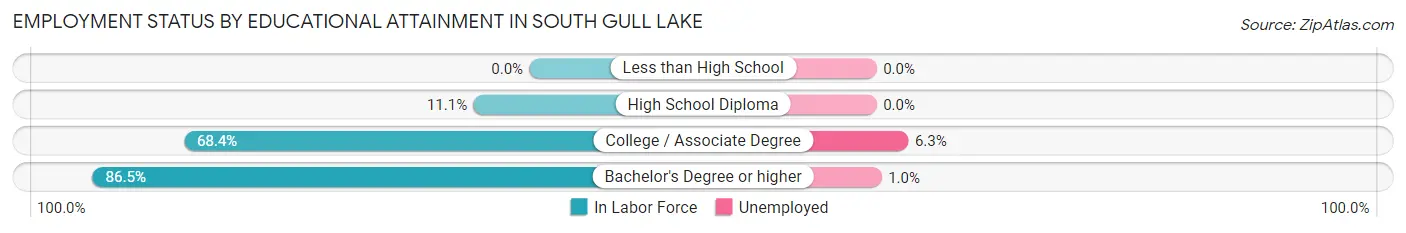
Employment Status by Educational Attainment in South Gull Lake
According to labor force statistics for South Gull Lake, 83.1% of individuals (679) out of the total population between 25 and 64 years of age (817) are in the labor force, with 1.6% or 11 of them being unemployed. The group with the highest labor force participation rate are those with the educational attainment of bachelor's degree or higher, with 86.5% or 598 individuals in the labor force. Within the labor force, individuals with college / associate degree education have the highest percentage of unemployment, with 6.3% or 5 of them being unemployed.
| Educational Attainment | In Labor Force | Unemployed |
| Less than High School | 0 (0.0%) | 0 (0.0%) |
| High School Diploma | 1 (11.1%) | 0 (0.0%) |
| College / Associate Degree | 80 (68.4%) | 7 (6.3%) |
| Bachelor's Degree or higher | 598 (86.5%) | 7 (1.0%) |
| Total | 679 (83.1%) | 13 (1.6%) |
Employment Occupations by Sex in South Gull Lake
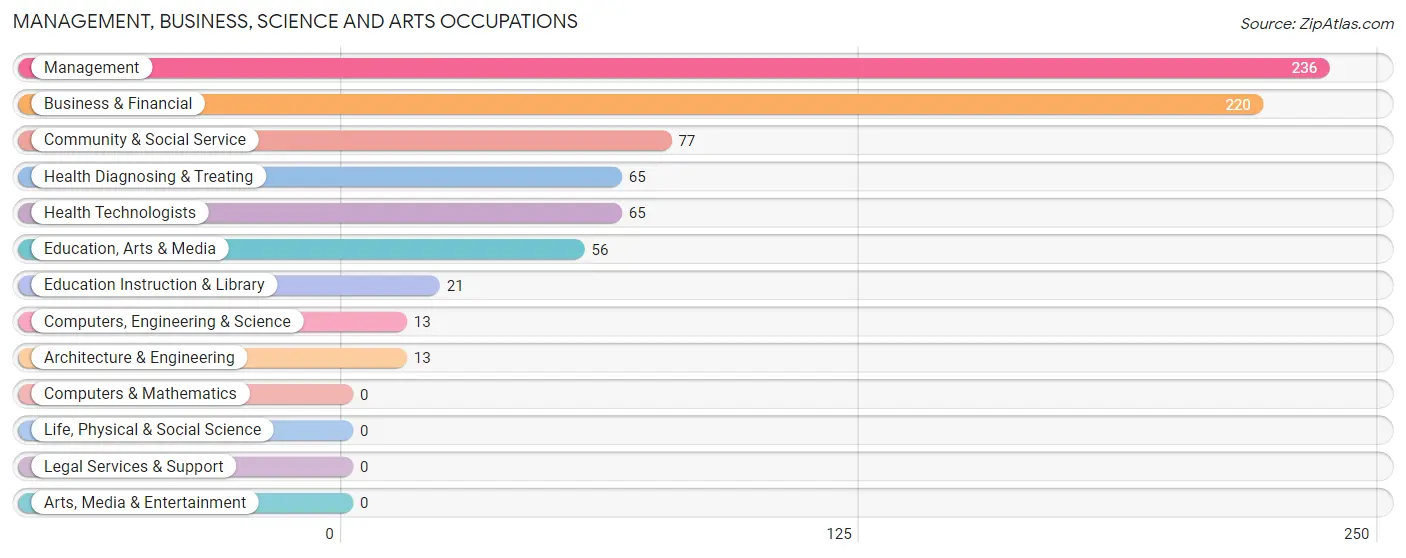
Management, Business, Science and Arts Occupations
The most common Management, Business, Science and Arts occupations in South Gull Lake are Management (236 | 27.2%), Business & Financial (220 | 25.4%), Community & Social Service (77 | 8.9%), Health Diagnosing & Treating (65 | 7.5%), and Health Technologists (65 | 7.5%).
Management, Business, Science and Arts Occupations by Sex
Within the Management, Business, Science and Arts occupations in South Gull Lake, the most male-oriented occupations are Computers, Engineering & Science (100.0%), Architecture & Engineering (100.0%), and Management (86.9%), while the most female-oriented occupations are Education, Arts & Media (96.4%), Community & Social Service (89.6%), and Business & Financial (84.1%).
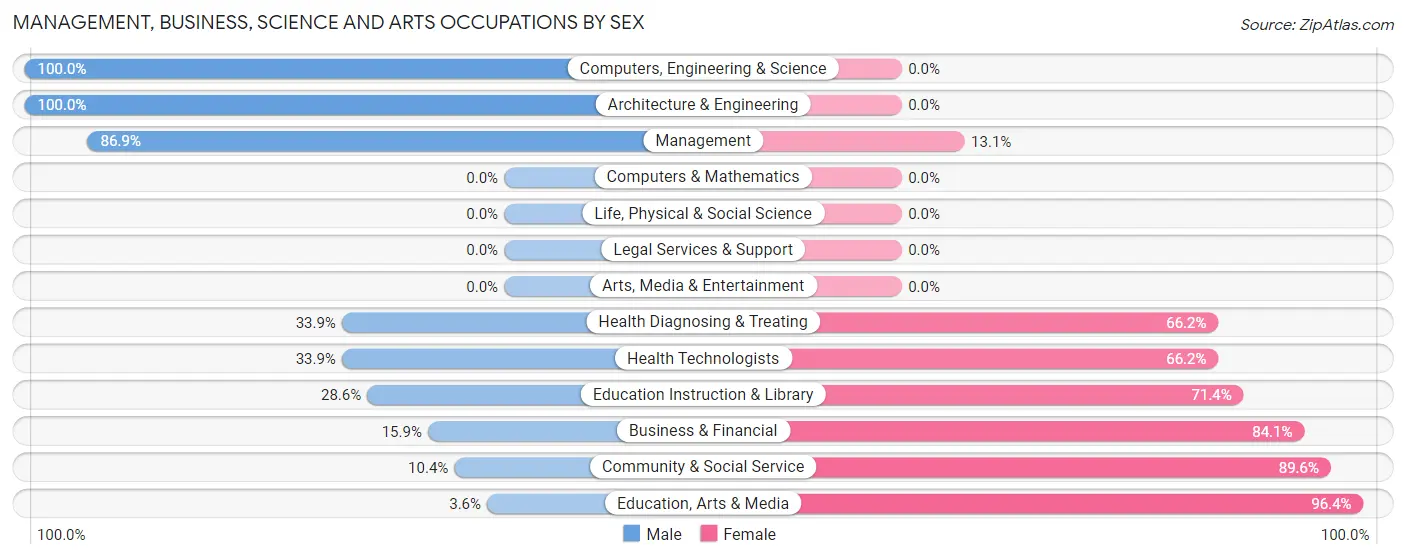
| Occupation | Male | Female |
| Management | 205 (86.9%) | 31 (13.1%) |
| Business & Financial | 35 (15.9%) | 185 (84.1%) |
| Computers, Engineering & Science | 13 (100.0%) | 0 (0.0%) |
| Computers & Mathematics | 0 (0.0%) | 0 (0.0%) |
| Architecture & Engineering | 13 (100.0%) | 0 (0.0%) |
| Life, Physical & Social Science | 0 (0.0%) | 0 (0.0%) |
| Community & Social Service | 8 (10.4%) | 69 (89.6%) |
| Education, Arts & Media | 2 (3.6%) | 54 (96.4%) |
| Legal Services & Support | 0 (0.0%) | 0 (0.0%) |
| Education Instruction & Library | 6 (28.6%) | 15 (71.4%) |
| Arts, Media & Entertainment | 0 (0.0%) | 0 (0.0%) |
| Health Diagnosing & Treating | 22 (33.9%) | 43 (66.1%) |
| Health Technologists | 22 (33.9%) | 43 (66.1%) |
| Total (Category) | 283 (46.3%) | 328 (53.7%) |
| Total (Overall) | 465 (53.6%) | 403 (46.4%) |
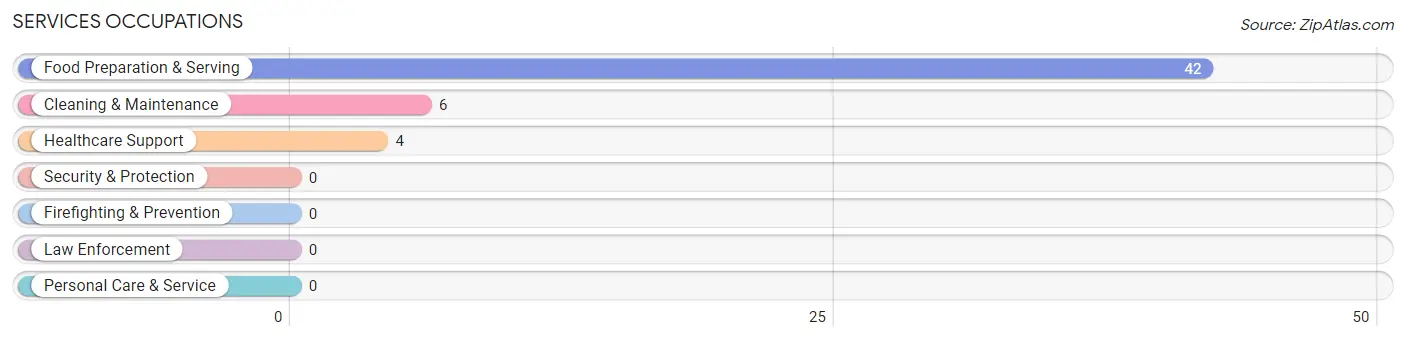
Services Occupations
The most common Services occupations in South Gull Lake are Food Preparation & Serving (42 | 4.8%), Cleaning & Maintenance (6 | 0.7%), and Healthcare Support (4 | 0.5%).
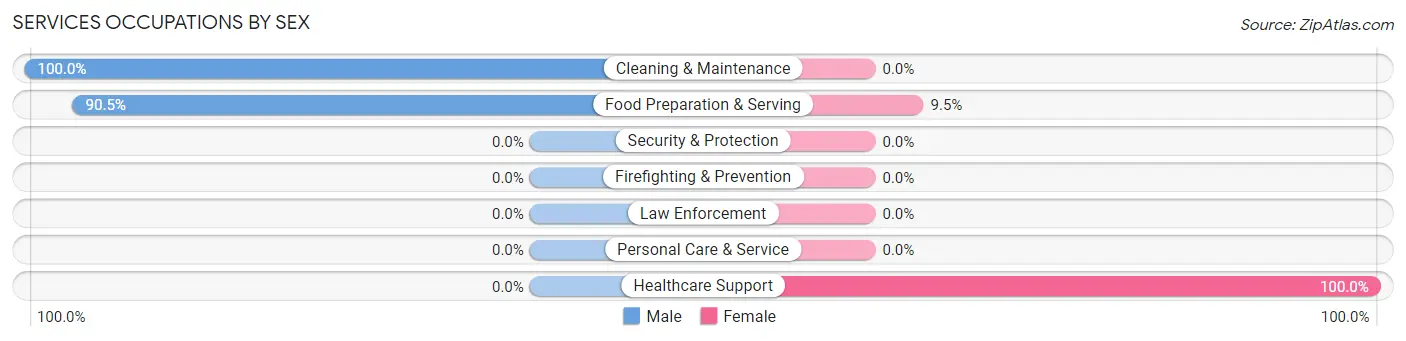
Services Occupations by Sex
Within the Services occupations in South Gull Lake, the most male-oriented occupations are Cleaning & Maintenance (100.0%), and Food Preparation & Serving (90.5%), while the most female-oriented occupations are Healthcare Support (100.0%), and Food Preparation & Serving (9.5%).
| Occupation | Male | Female |
| Healthcare Support | 0 (0.0%) | 4 (100.0%) |
| Security & Protection | 0 (0.0%) | 0 (0.0%) |
| Firefighting & Prevention | 0 (0.0%) | 0 (0.0%) |
| Law Enforcement | 0 (0.0%) | 0 (0.0%) |
| Food Preparation & Serving | 38 (90.5%) | 4 (9.5%) |
| Cleaning & Maintenance | 6 (100.0%) | 0 (0.0%) |
| Personal Care & Service | 0 (0.0%) | 0 (0.0%) |
| Total (Category) | 44 (84.6%) | 8 (15.4%) |
| Total (Overall) | 465 (53.6%) | 403 (46.4%) |
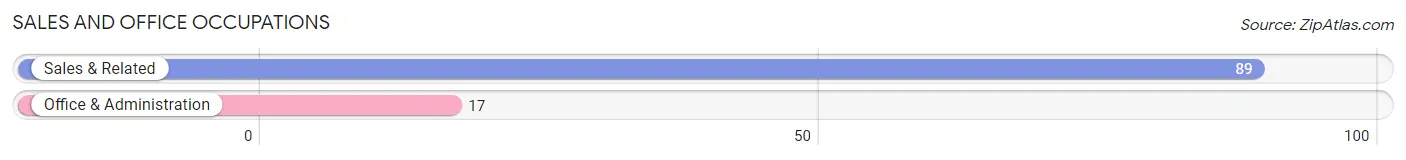
Sales and Office Occupations
The most common Sales and Office occupations in South Gull Lake are Sales & Related (89 | 10.2%), and Office & Administration (17 | 2.0%).
Sales and Office Occupations by Sex
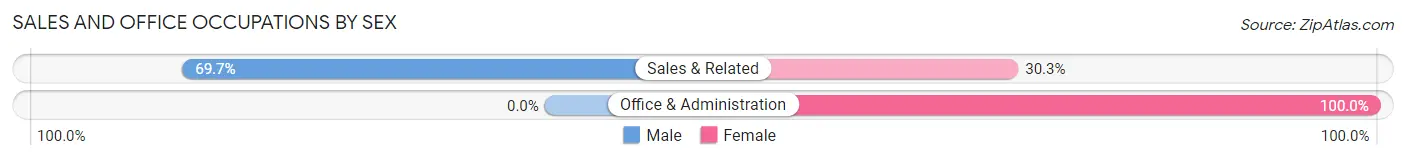
| Occupation | Male | Female |
| Sales & Related | 62 (69.7%) | 27 (30.3%) |
| Office & Administration | 0 (0.0%) | 17 (100.0%) |
| Total (Category) | 62 (58.5%) | 44 (41.5%) |
| Total (Overall) | 465 (53.6%) | 403 (46.4%) |
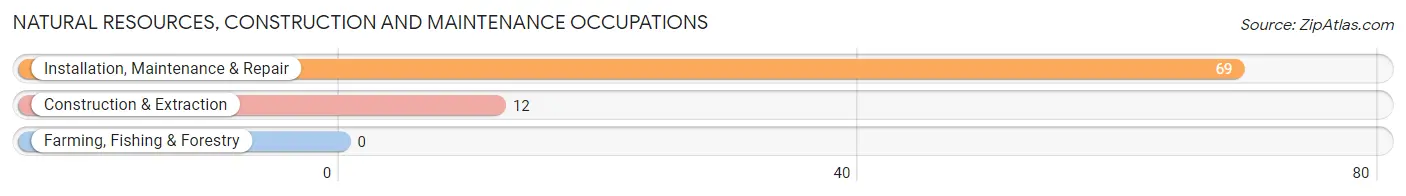
Natural Resources, Construction and Maintenance Occupations
The most common Natural Resources, Construction and Maintenance occupations in South Gull Lake are Installation, Maintenance & Repair (69 | 8.0%), and Construction & Extraction (12 | 1.4%).
Natural Resources, Construction and Maintenance Occupations by Sex
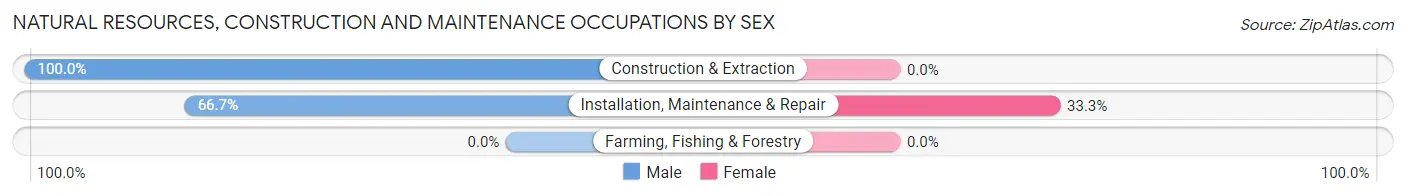
| Occupation | Male | Female |
| Farming, Fishing & Forestry | 0 (0.0%) | 0 (0.0%) |
| Construction & Extraction | 12 (100.0%) | 0 (0.0%) |
| Installation, Maintenance & Repair | 46 (66.7%) | 23 (33.3%) |
| Total (Category) | 58 (71.6%) | 23 (28.4%) |
| Total (Overall) | 465 (53.6%) | 403 (46.4%) |
Production, Transportation and Moving Occupations
The most common Production, Transportation and Moving occupations in South Gull Lake are Material Moving (11 | 1.3%), and Transportation (7 | 0.8%).
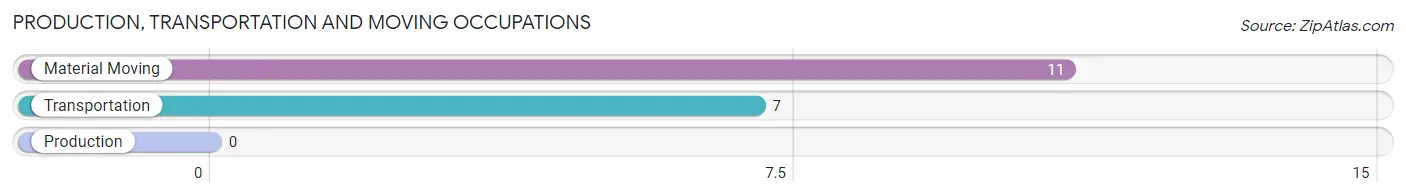
Production, Transportation and Moving Occupations by Sex
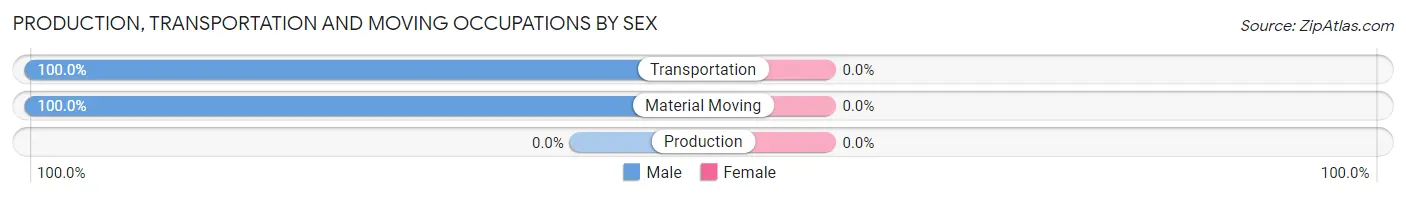
| Occupation | Male | Female |
| Production | 0 (0.0%) | 0 (0.0%) |
| Transportation | 7 (100.0%) | 0 (0.0%) |
| Material Moving | 11 (100.0%) | 0 (0.0%) |
| Total (Category) | 18 (100.0%) | 0 (0.0%) |
| Total (Overall) | 465 (53.6%) | 403 (46.4%) |
Employment Industries by Sex in South Gull Lake
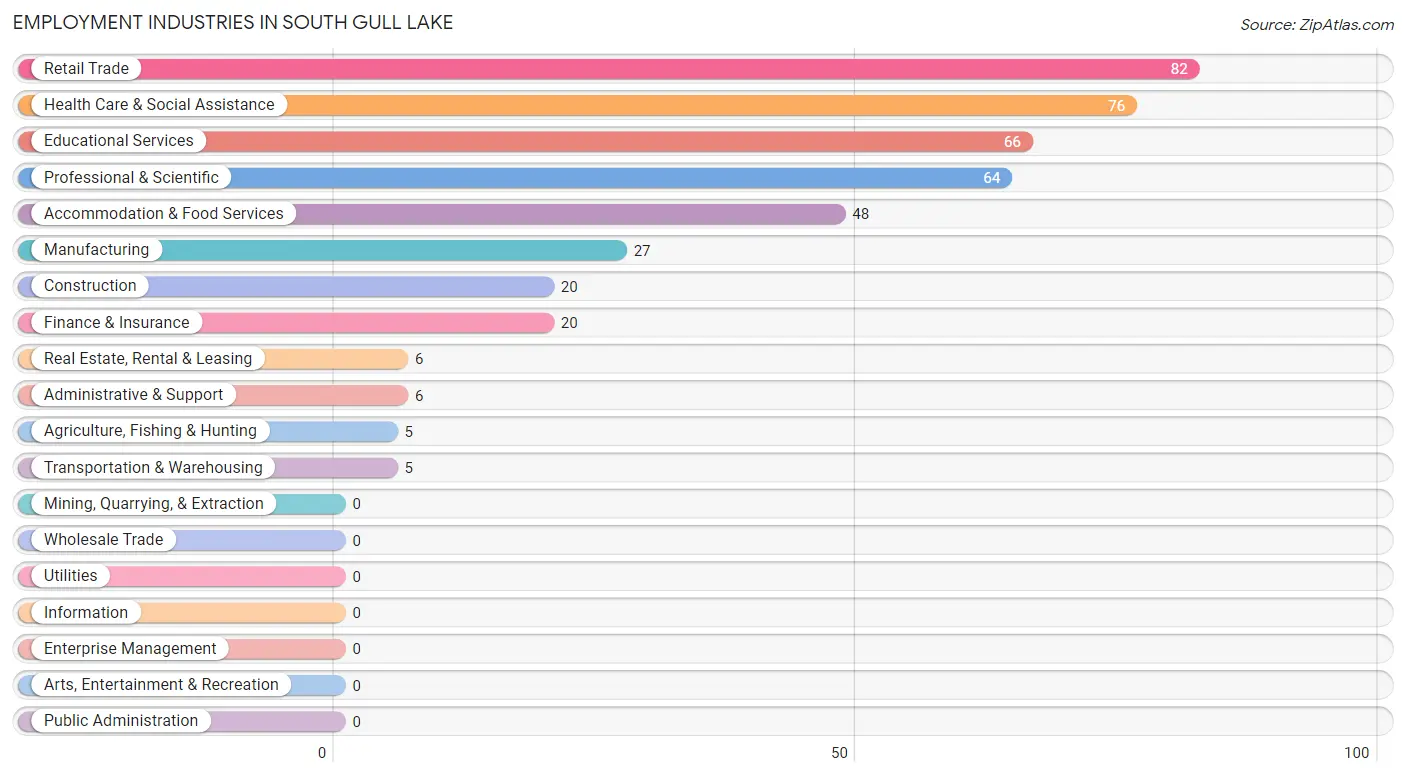
Employment Industries in South Gull Lake
The major employment industries in South Gull Lake include Retail Trade (82 | 9.5%), Health Care & Social Assistance (76 | 8.8%), Educational Services (66 | 7.6%), Professional & Scientific (64 | 7.4%), and Accommodation & Food Services (48 | 5.5%).
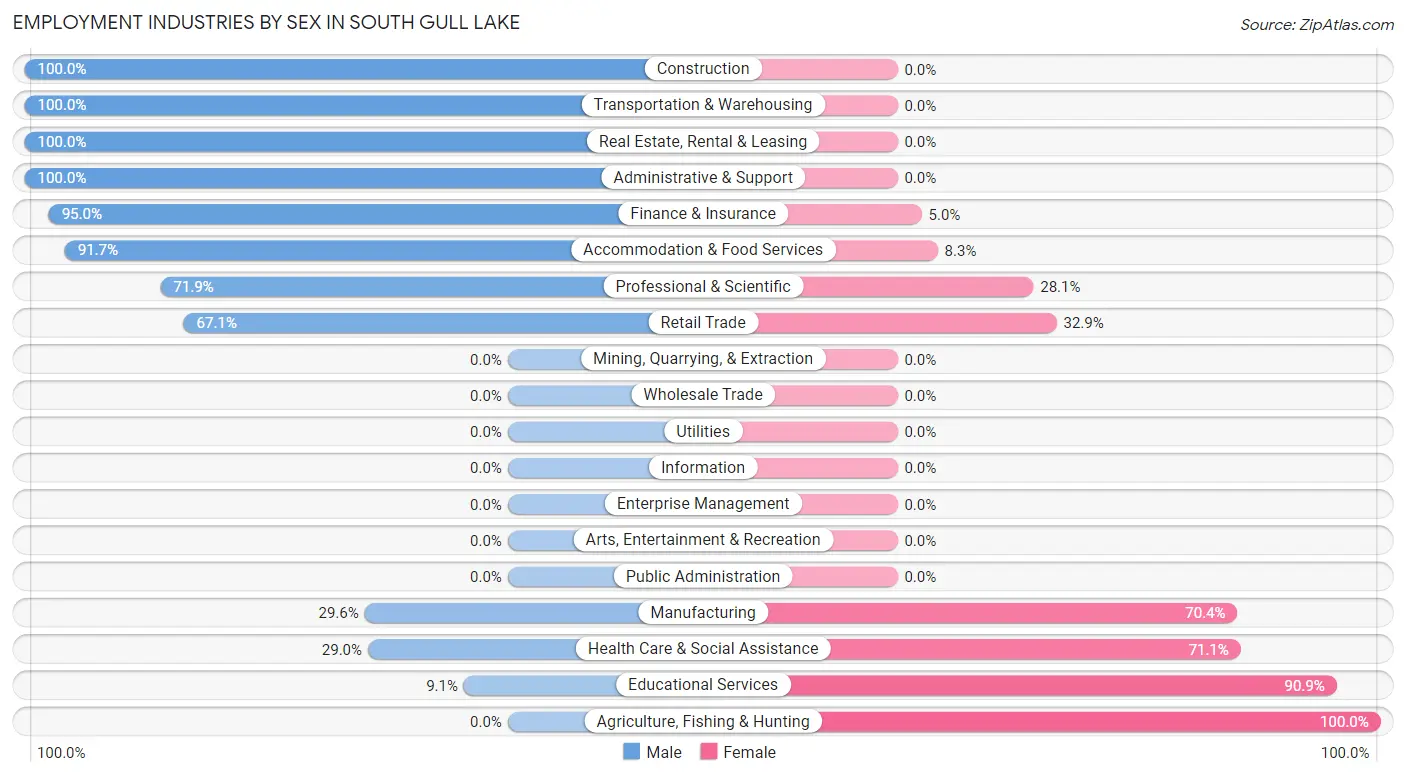
Employment Industries by Sex in South Gull Lake
The South Gull Lake industries that see more men than women are Construction (100.0%), Transportation & Warehousing (100.0%), and Real Estate, Rental & Leasing (100.0%), whereas the industries that tend to have a higher number of women are Agriculture, Fishing & Hunting (100.0%), Educational Services (90.9%), and Health Care & Social Assistance (71.1%).
| Industry | Male | Female |
| Agriculture, Fishing & Hunting | 0 (0.0%) | 5 (100.0%) |
| Mining, Quarrying, & Extraction | 0 (0.0%) | 0 (0.0%) |
| Construction | 20 (100.0%) | 0 (0.0%) |
| Manufacturing | 8 (29.6%) | 19 (70.4%) |
| Wholesale Trade | 0 (0.0%) | 0 (0.0%) |
| Retail Trade | 55 (67.1%) | 27 (32.9%) |
| Transportation & Warehousing | 5 (100.0%) | 0 (0.0%) |
| Utilities | 0 (0.0%) | 0 (0.0%) |
| Information | 0 (0.0%) | 0 (0.0%) |
| Finance & Insurance | 19 (95.0%) | 1 (5.0%) |
| Real Estate, Rental & Leasing | 6 (100.0%) | 0 (0.0%) |
| Professional & Scientific | 46 (71.9%) | 18 (28.1%) |
| Enterprise Management | 0 (0.0%) | 0 (0.0%) |
| Administrative & Support | 6 (100.0%) | 0 (0.0%) |
| Educational Services | 6 (9.1%) | 60 (90.9%) |
| Health Care & Social Assistance | 22 (28.9%) | 54 (71.1%) |
| Arts, Entertainment & Recreation | 0 (0.0%) | 0 (0.0%) |
| Accommodation & Food Services | 44 (91.7%) | 4 (8.3%) |
| Public Administration | 0 (0.0%) | 0 (0.0%) |
| Total | 465 (53.6%) | 403 (46.4%) |
Education in South Gull Lake
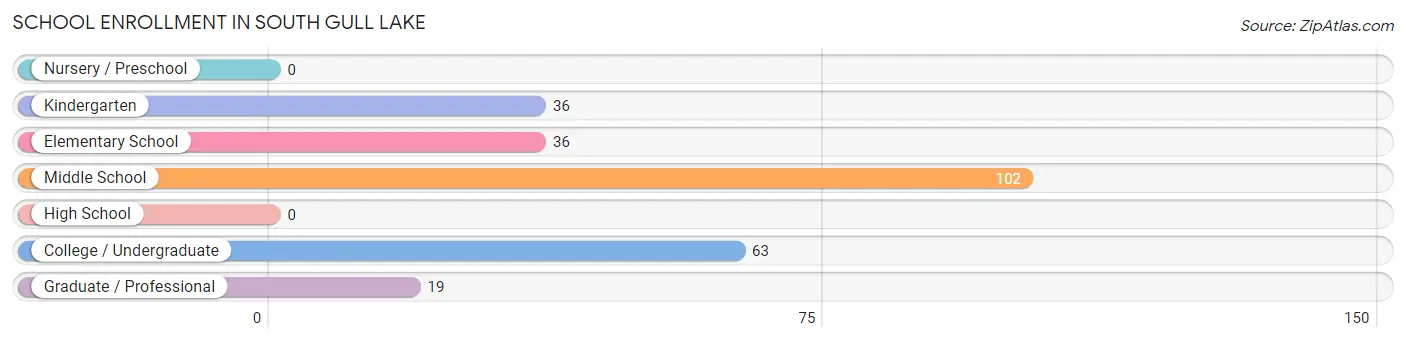
School Enrollment in South Gull Lake
The most common levels of schooling among the 256 students in South Gull Lake are middle school (102 | 39.8%), college / undergraduate (63 | 24.6%), and kindergarten (36 | 14.1%).
| School Level | # Students | % Students |
| Nursery / Preschool | 0 | 0.0% |
| Kindergarten | 36 | 14.1% |
| Elementary School | 36 | 14.1% |
| Middle School | 102 | 39.8% |
| High School | 0 | 0.0% |
| College / Undergraduate | 63 | 24.6% |
| Graduate / Professional | 19 | 7.4% |
| Total | 256 | 100.0% |
School Enrollment by Age by Funding Source in South Gull Lake
Out of a total of 256 students who are enrolled in schools in South Gull Lake, 78 (30.5%) attend a private institution, while the remaining 178 (69.5%) are enrolled in public schools. The age group of 5 to 9 year old has the highest likelihood of being enrolled in private schools, with 72 (100.0% in the age bracket) enrolled. Conversely, the age group of 18 to 19 year olds has the lowest likelihood of being enrolled in a private school, with 9 (100.0% in the age bracket) attending a public institution.
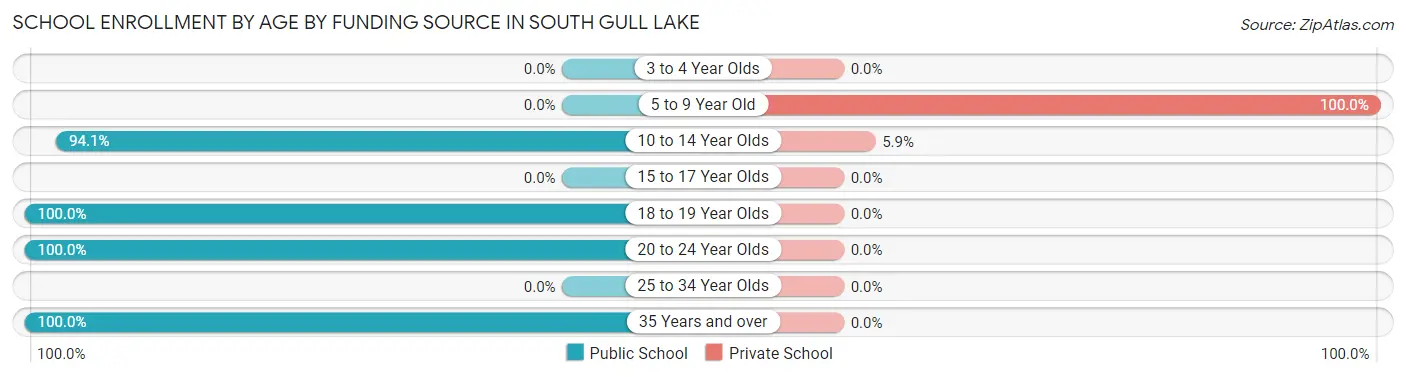
| Age Bracket | Public School | Private School |
| 3 to 4 Year Olds | 0 (0.0%) | 0 (0.0%) |
| 5 to 9 Year Old | 0 (0.0%) | 72 (100.0%) |
| 10 to 14 Year Olds | 96 (94.1%) | 6 (5.9%) |
| 15 to 17 Year Olds | 0 (0.0%) | 0 (0.0%) |
| 18 to 19 Year Olds | 9 (100.0%) | 0 (0.0%) |
| 20 to 24 Year Olds | 24 (100.0%) | 0 (0.0%) |
| 25 to 34 Year Olds | 0 (0.0%) | 0 (0.0%) |
| 35 Years and over | 49 (100.0%) | 0 (0.0%) |
| Total | 178 (69.5%) | 78 (30.5%) |
Educational Attainment by Field of Study in South Gull Lake
Business (434 | 45.3%), education (153 | 16.0%), engineering (89 | 9.3%), bio, nature & agricultural (65 | 6.8%), and arts & humanities (53 | 5.5%) are the most common fields of study among 958 individuals in South Gull Lake who have obtained a bachelor's degree or higher.
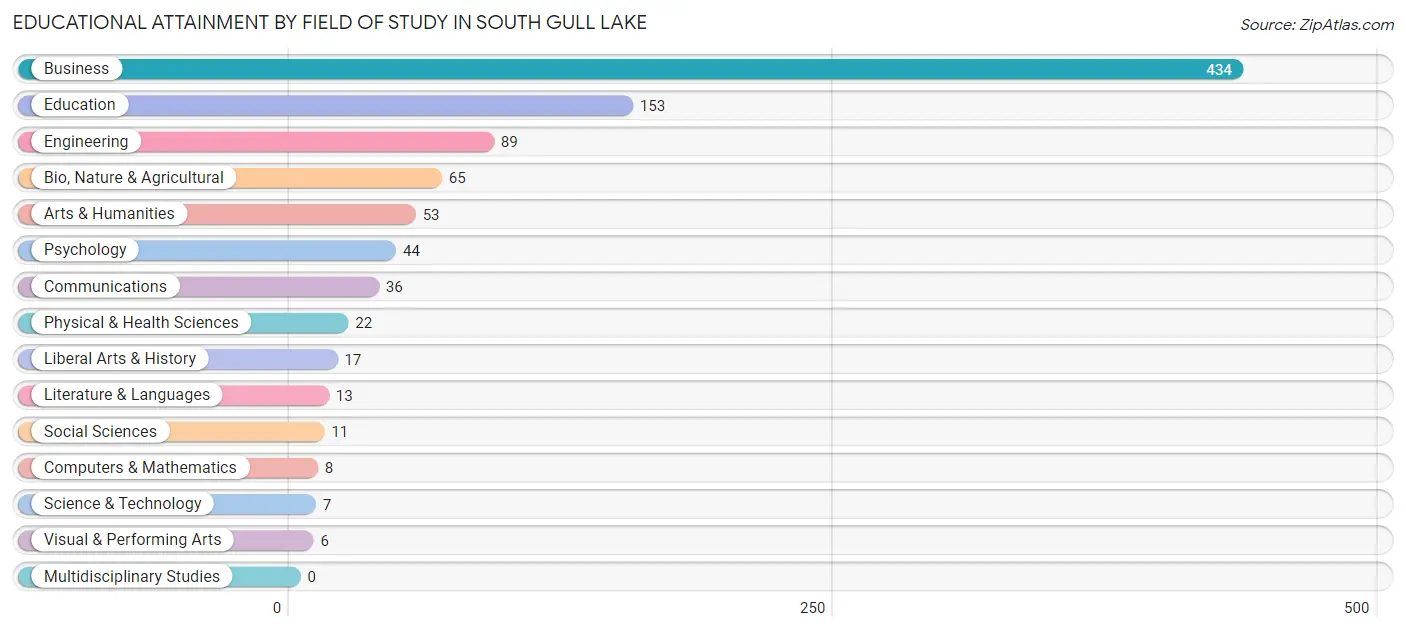
| Field of Study | # Graduates | % Graduates |
| Computers & Mathematics | 8 | 0.8% |
| Bio, Nature & Agricultural | 65 | 6.8% |
| Physical & Health Sciences | 22 | 2.3% |
| Psychology | 44 | 4.6% |
| Social Sciences | 11 | 1.1% |
| Engineering | 89 | 9.3% |
| Multidisciplinary Studies | 0 | 0.0% |
| Science & Technology | 7 | 0.7% |
| Business | 434 | 45.3% |
| Education | 153 | 16.0% |
| Literature & Languages | 13 | 1.4% |
| Liberal Arts & History | 17 | 1.8% |
| Visual & Performing Arts | 6 | 0.6% |
| Communications | 36 | 3.8% |
| Arts & Humanities | 53 | 5.5% |
| Total | 958 | 100.0% |
Transportation & Commute in South Gull Lake
Vehicle Availability by Sex in South Gull Lake
The most prevalent vehicle ownership categories in South Gull Lake are males with 4 vehicles (221, accounting for 49.5%) and females with 4 vehicles (212, making up 56.7%).
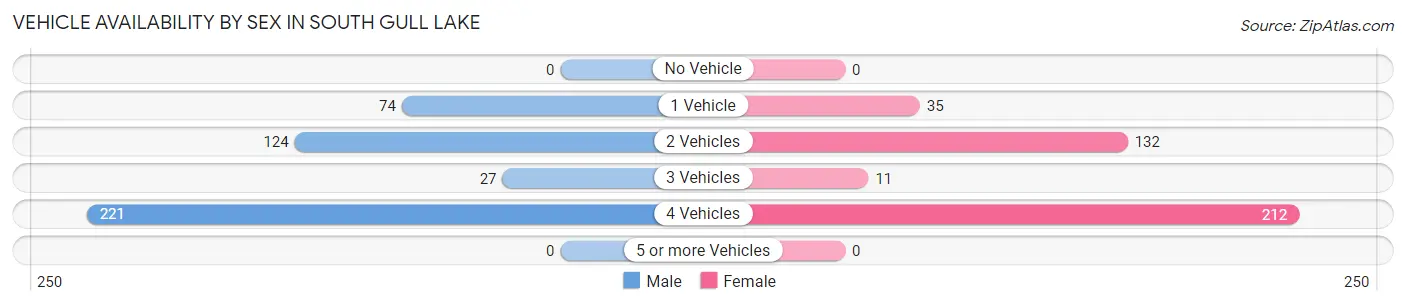
| Vehicles Available | Male | Female |
| No Vehicle | 0 (0.0%) | 0 (0.0%) |
| 1 Vehicle | 74 (16.6%) | 35 (9.0%) |
| 2 Vehicles | 124 (27.8%) | 132 (33.9%) |
| 3 Vehicles | 27 (6.0%) | 11 (2.8%) |
| 4 Vehicles | 221 (49.5%) | 212 (54.4%) |
| 5 or more Vehicles | 0 (0.0%) | 0 (0.0%) |
| Total | 446 (100.0%) | 390 (100.0%) |
Commute Time in South Gull Lake
The most frequently occuring commute durations in South Gull Lake are 15 to 19 minutes (198 commuters, 34.4%), 30 to 34 minutes (116 commuters, 20.1%), and 5 to 9 minutes (100 commuters, 17.4%).
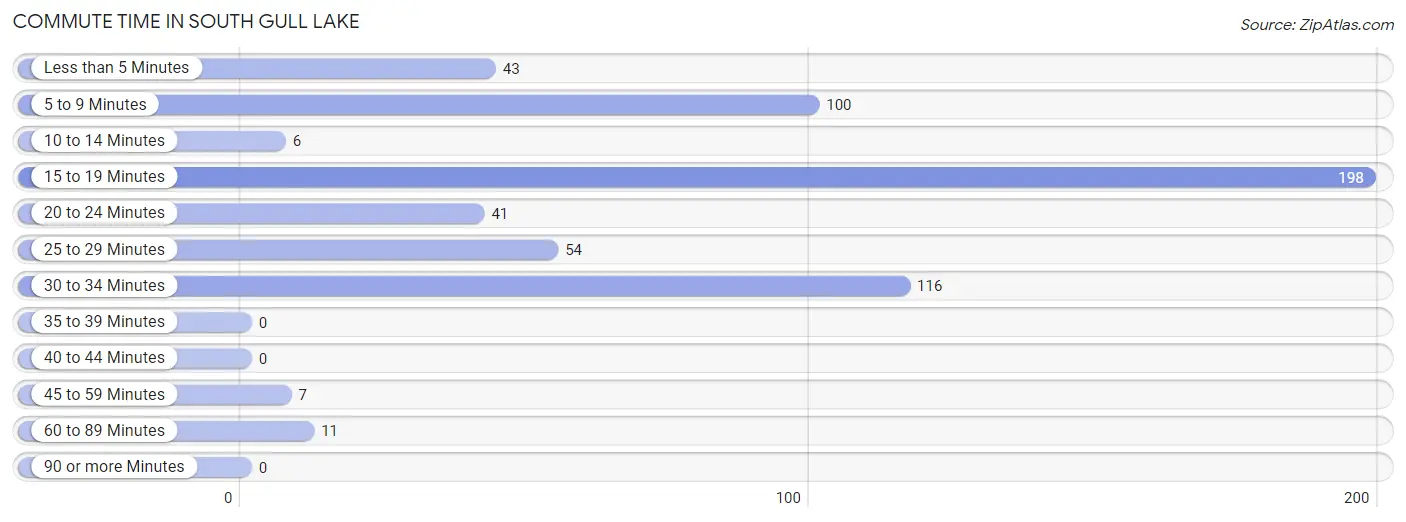
| Commute Time | # Commuters | % Commuters |
| Less than 5 Minutes | 43 | 7.5% |
| 5 to 9 Minutes | 100 | 17.4% |
| 10 to 14 Minutes | 6 | 1.0% |
| 15 to 19 Minutes | 198 | 34.4% |
| 20 to 24 Minutes | 41 | 7.1% |
| 25 to 29 Minutes | 54 | 9.4% |
| 30 to 34 Minutes | 116 | 20.1% |
| 35 to 39 Minutes | 0 | 0.0% |
| 40 to 44 Minutes | 0 | 0.0% |
| 45 to 59 Minutes | 7 | 1.2% |
| 60 to 89 Minutes | 11 | 1.9% |
| 90 or more Minutes | 0 | 0.0% |
Commute Time by Sex in South Gull Lake
The most common commute times in South Gull Lake are 15 to 19 minutes (192 commuters, 47.6%) for males and 30 to 34 minutes (66 commuters, 38.2%) for females.
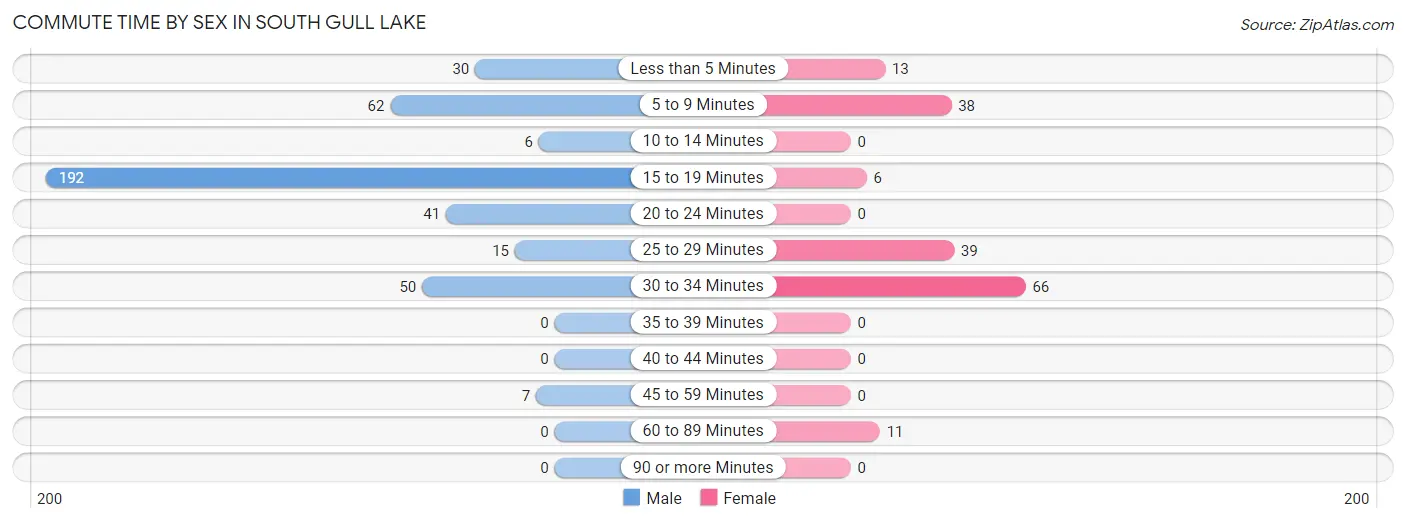
| Commute Time | Male | Female |
| Less than 5 Minutes | 30 (7.4%) | 13 (7.5%) |
| 5 to 9 Minutes | 62 (15.4%) | 38 (22.0%) |
| 10 to 14 Minutes | 6 (1.5%) | 0 (0.0%) |
| 15 to 19 Minutes | 192 (47.6%) | 6 (3.5%) |
| 20 to 24 Minutes | 41 (10.2%) | 0 (0.0%) |
| 25 to 29 Minutes | 15 (3.7%) | 39 (22.5%) |
| 30 to 34 Minutes | 50 (12.4%) | 66 (38.2%) |
| 35 to 39 Minutes | 0 (0.0%) | 0 (0.0%) |
| 40 to 44 Minutes | 0 (0.0%) | 0 (0.0%) |
| 45 to 59 Minutes | 7 (1.7%) | 0 (0.0%) |
| 60 to 89 Minutes | 0 (0.0%) | 11 (6.4%) |
| 90 or more Minutes | 0 (0.0%) | 0 (0.0%) |
Time of Departure to Work by Sex in South Gull Lake
The most frequent times of departure to work in South Gull Lake are 7:30 AM to 7:59 AM (198, 49.1%) for males and 7:00 AM to 7:29 AM (54, 31.2%) for females.
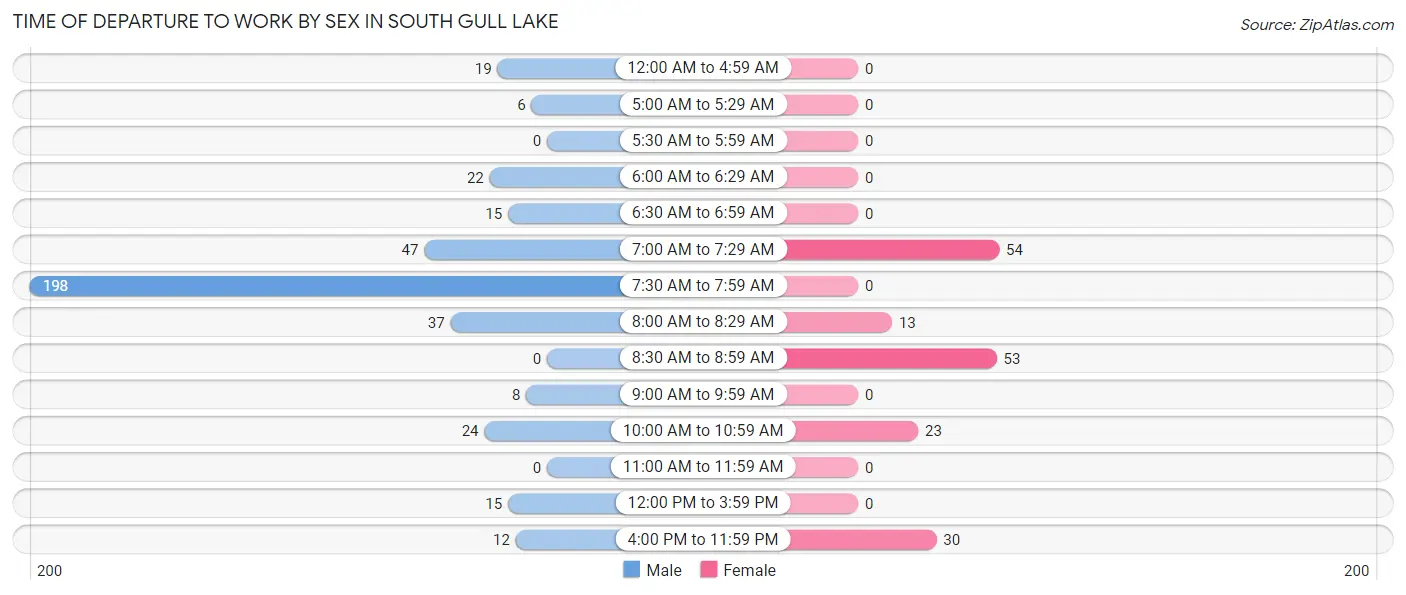
| Time of Departure | Male | Female |
| 12:00 AM to 4:59 AM | 19 (4.7%) | 0 (0.0%) |
| 5:00 AM to 5:29 AM | 6 (1.5%) | 0 (0.0%) |
| 5:30 AM to 5:59 AM | 0 (0.0%) | 0 (0.0%) |
| 6:00 AM to 6:29 AM | 22 (5.5%) | 0 (0.0%) |
| 6:30 AM to 6:59 AM | 15 (3.7%) | 0 (0.0%) |
| 7:00 AM to 7:29 AM | 47 (11.7%) | 54 (31.2%) |
| 7:30 AM to 7:59 AM | 198 (49.1%) | 0 (0.0%) |
| 8:00 AM to 8:29 AM | 37 (9.2%) | 13 (7.5%) |
| 8:30 AM to 8:59 AM | 0 (0.0%) | 53 (30.6%) |
| 9:00 AM to 9:59 AM | 8 (2.0%) | 0 (0.0%) |
| 10:00 AM to 10:59 AM | 24 (6.0%) | 23 (13.3%) |
| 11:00 AM to 11:59 AM | 0 (0.0%) | 0 (0.0%) |
| 12:00 PM to 3:59 PM | 15 (3.7%) | 0 (0.0%) |
| 4:00 PM to 11:59 PM | 12 (3.0%) | 30 (17.3%) |
| Total | 403 (100.0%) | 173 (100.0%) |
Housing Occupancy in South Gull Lake
Occupancy by Ownership in South Gull Lake
Of the total 672 dwellings in South Gull Lake, owner-occupied units account for 574 (85.4%), while renter-occupied units make up 98 (14.6%).
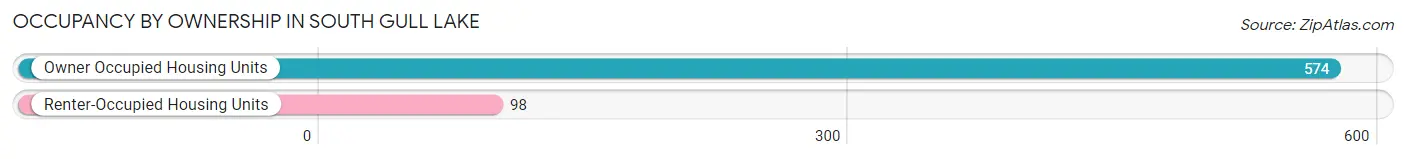
| Occupancy | # Housing Units | % Housing Units |
| Owner Occupied Housing Units | 574 | 85.4% |
| Renter-Occupied Housing Units | 98 | 14.6% |
| Total Occupied Housing Units | 672 | 100.0% |
Occupancy by Household Size in South Gull Lake
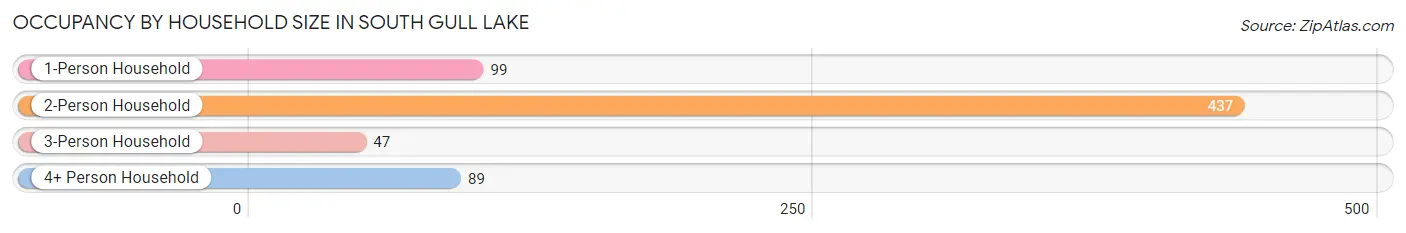
| Household Size | # Housing Units | % Housing Units |
| 1-Person Household | 99 | 14.7% |
| 2-Person Household | 437 | 65.0% |
| 3-Person Household | 47 | 7.0% |
| 4+ Person Household | 89 | 13.2% |
| Total Housing Units | 672 | 100.0% |
Occupancy by Ownership by Household Size in South Gull Lake
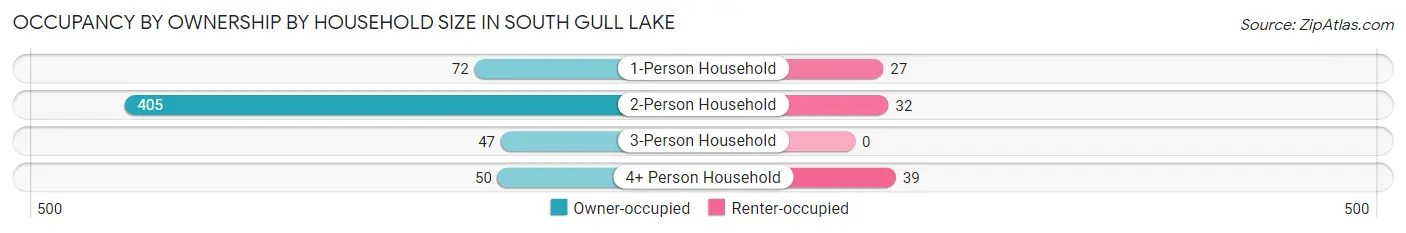
| Household Size | Owner-occupied | Renter-occupied |
| 1-Person Household | 72 (72.7%) | 27 (27.3%) |
| 2-Person Household | 405 (92.7%) | 32 (7.3%) |
| 3-Person Household | 47 (100.0%) | 0 (0.0%) |
| 4+ Person Household | 50 (56.2%) | 39 (43.8%) |
| Total Housing Units | 574 (85.4%) | 98 (14.6%) |
Occupancy by Educational Attainment in South Gull Lake
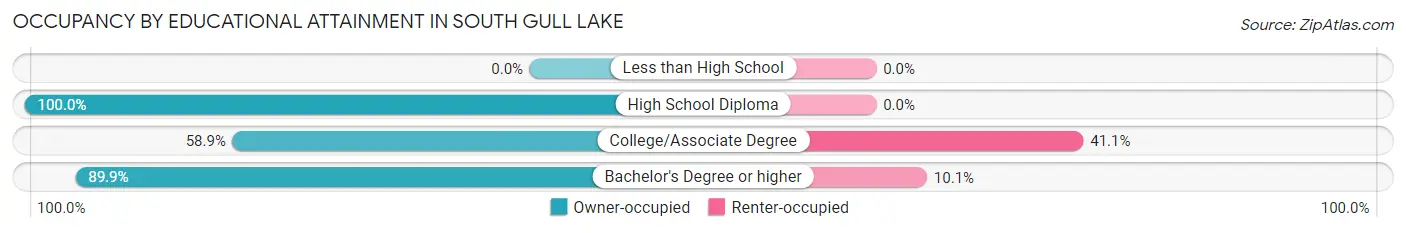
| Household Size | Owner-occupied | Renter-occupied |
| Less than High School | 0 (0.0%) | 0 (0.0%) |
| High School Diploma | 43 (100.0%) | 0 (0.0%) |
| College/Associate Degree | 66 (58.9%) | 46 (41.1%) |
| Bachelor's Degree or higher | 465 (89.9%) | 52 (10.1%) |
Occupancy by Age of Householder in South Gull Lake
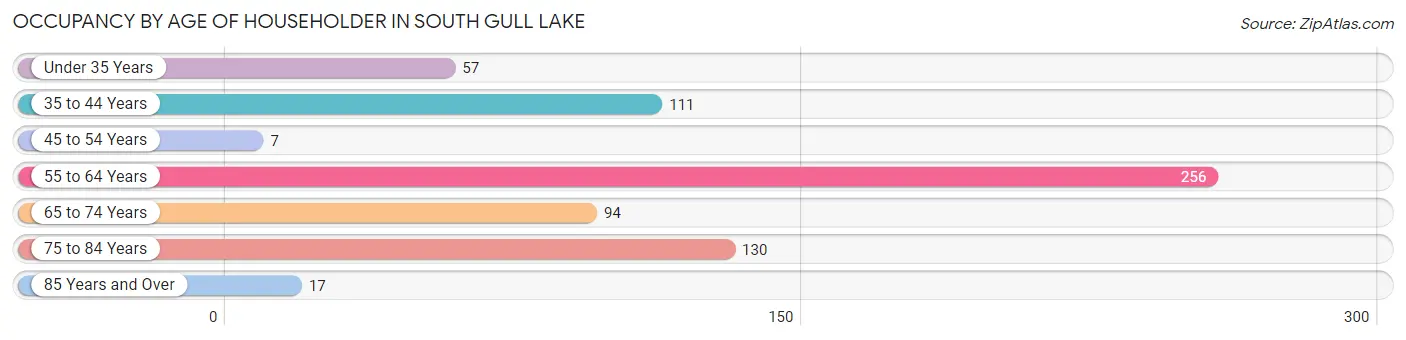
| Age Bracket | # Households | % Households |
| Under 35 Years | 57 | 8.5% |
| 35 to 44 Years | 111 | 16.5% |
| 45 to 54 Years | 7 | 1.0% |
| 55 to 64 Years | 256 | 38.1% |
| 65 to 74 Years | 94 | 14.0% |
| 75 to 84 Years | 130 | 19.4% |
| 85 Years and Over | 17 | 2.5% |
| Total | 672 | 100.0% |
Housing Finances in South Gull Lake
Median Income by Occupancy in South Gull Lake
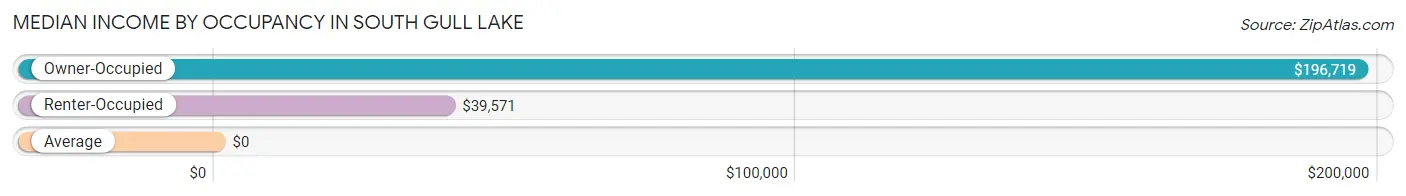
| Occupancy Type | # Households | Median Income |
| Owner-Occupied | 574 (85.4%) | $196,719 |
| Renter-Occupied | 98 (14.6%) | $39,571 |
| Average | 672 (100.0%) | $0 |
Occupancy by Householder Income Bracket in South Gull Lake
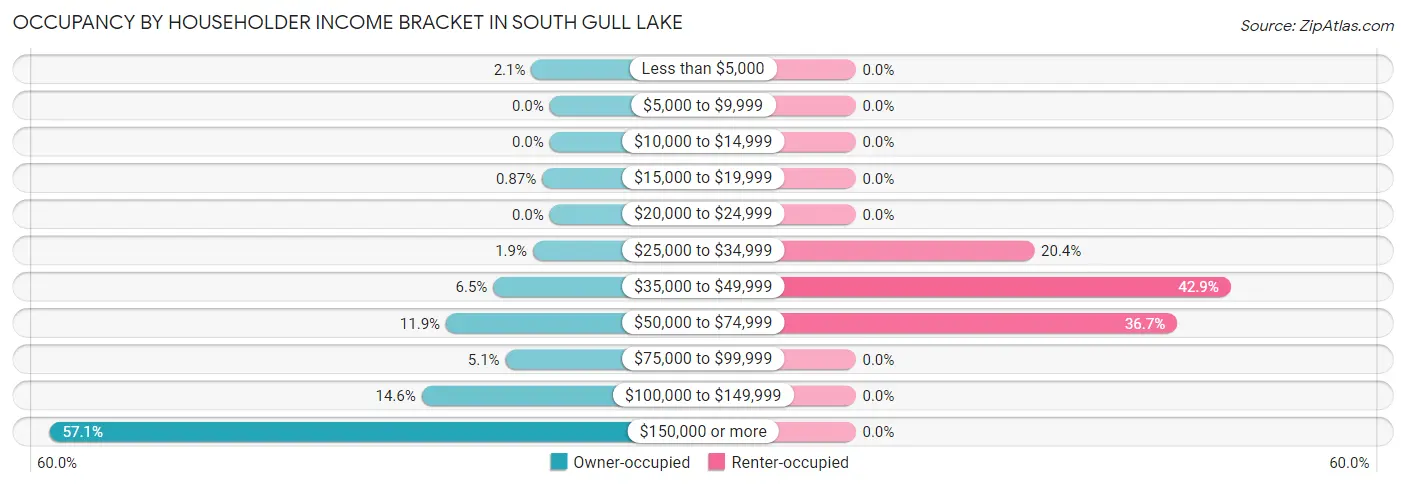
| Income Bracket | Owner-occupied | Renter-occupied |
| Less than $5,000 | 12 (2.1%) | 0 (0.0%) |
| $5,000 to $9,999 | 0 (0.0%) | 0 (0.0%) |
| $10,000 to $14,999 | 0 (0.0%) | 0 (0.0%) |
| $15,000 to $19,999 | 5 (0.9%) | 0 (0.0%) |
| $20,000 to $24,999 | 0 (0.0%) | 0 (0.0%) |
| $25,000 to $34,999 | 11 (1.9%) | 20 (20.4%) |
| $35,000 to $49,999 | 37 (6.5%) | 42 (42.9%) |
| $50,000 to $74,999 | 68 (11.8%) | 36 (36.7%) |
| $75,000 to $99,999 | 29 (5.1%) | 0 (0.0%) |
| $100,000 to $149,999 | 84 (14.6%) | 0 (0.0%) |
| $150,000 or more | 328 (57.1%) | 0 (0.0%) |
| Total | 574 (100.0%) | 98 (100.0%) |
Monthly Housing Cost Tiers in South Gull Lake
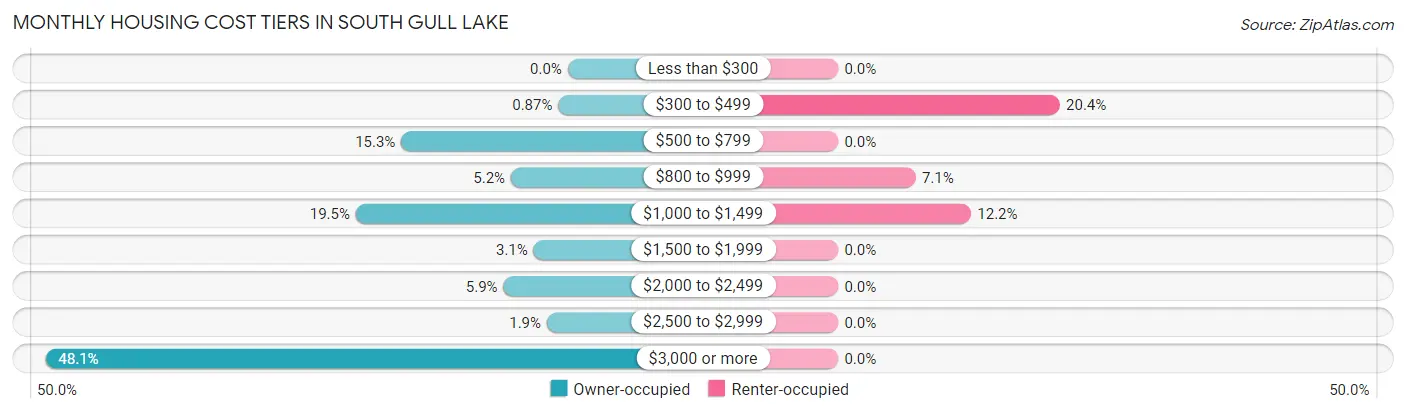
| Monthly Cost | Owner-occupied | Renter-occupied |
| Less than $300 | 0 (0.0%) | 0 (0.0%) |
| $300 to $499 | 5 (0.9%) | 20 (20.4%) |
| $500 to $799 | 88 (15.3%) | 0 (0.0%) |
| $800 to $999 | 30 (5.2%) | 7 (7.1%) |
| $1,000 to $1,499 | 112 (19.5%) | 12 (12.2%) |
| $1,500 to $1,999 | 18 (3.1%) | 0 (0.0%) |
| $2,000 to $2,499 | 34 (5.9%) | 0 (0.0%) |
| $2,500 to $2,999 | 11 (1.9%) | 0 (0.0%) |
| $3,000 or more | 276 (48.1%) | 0 (0.0%) |
| Total | 574 (100.0%) | 98 (100.0%) |
Physical Housing Characteristics in South Gull Lake
Housing Structures in South Gull Lake
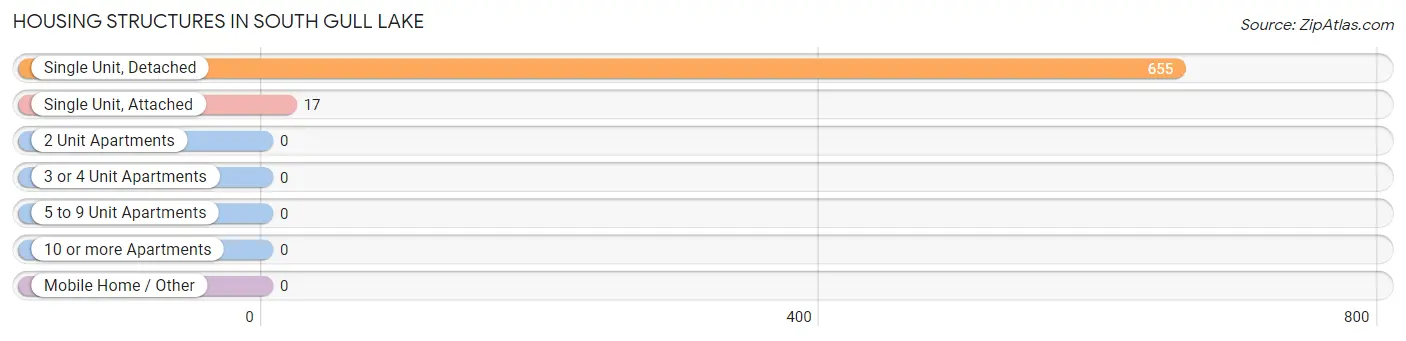
| Structure Type | # Housing Units | % Housing Units |
| Single Unit, Detached | 655 | 97.5% |
| Single Unit, Attached | 17 | 2.5% |
| 2 Unit Apartments | 0 | 0.0% |
| 3 or 4 Unit Apartments | 0 | 0.0% |
| 5 to 9 Unit Apartments | 0 | 0.0% |
| 10 or more Apartments | 0 | 0.0% |
| Mobile Home / Other | 0 | 0.0% |
| Total | 672 | 100.0% |
Housing Structures by Occupancy in South Gull Lake
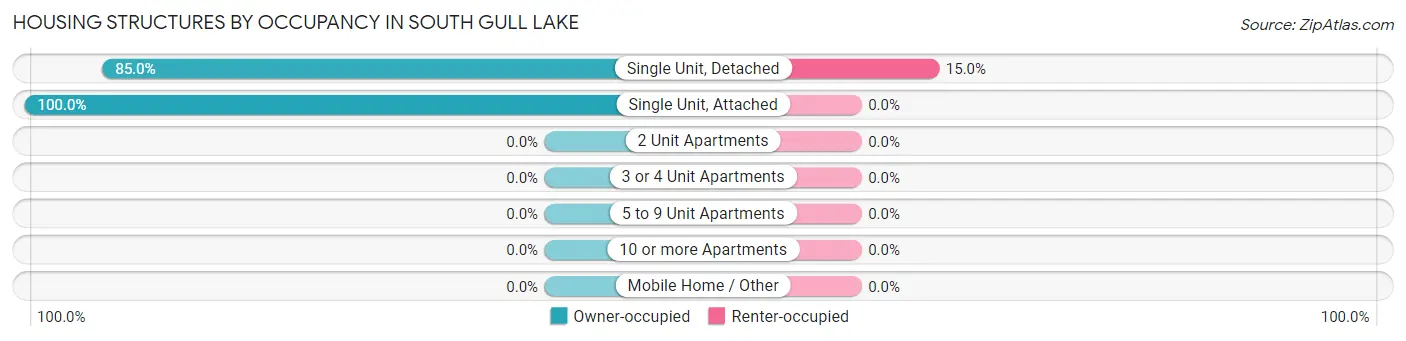
| Structure Type | Owner-occupied | Renter-occupied |
| Single Unit, Detached | 557 (85.0%) | 98 (15.0%) |
| Single Unit, Attached | 17 (100.0%) | 0 (0.0%) |
| 2 Unit Apartments | 0 (0.0%) | 0 (0.0%) |
| 3 or 4 Unit Apartments | 0 (0.0%) | 0 (0.0%) |
| 5 to 9 Unit Apartments | 0 (0.0%) | 0 (0.0%) |
| 10 or more Apartments | 0 (0.0%) | 0 (0.0%) |
| Mobile Home / Other | 0 (0.0%) | 0 (0.0%) |
| Total | 574 (85.4%) | 98 (14.6%) |
Housing Structures by Number of Rooms in South Gull Lake
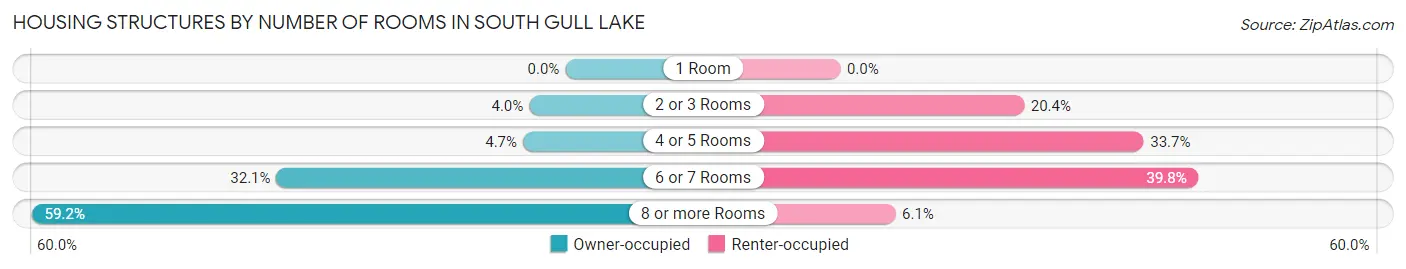
| Number of Rooms | Owner-occupied | Renter-occupied |
| 1 Room | 0 (0.0%) | 0 (0.0%) |
| 2 or 3 Rooms | 23 (4.0%) | 20 (20.4%) |
| 4 or 5 Rooms | 27 (4.7%) | 33 (33.7%) |
| 6 or 7 Rooms | 184 (32.1%) | 39 (39.8%) |
| 8 or more Rooms | 340 (59.2%) | 6 (6.1%) |
| Total | 574 (100.0%) | 98 (100.0%) |
Housing Structure by Heating Type in South Gull Lake
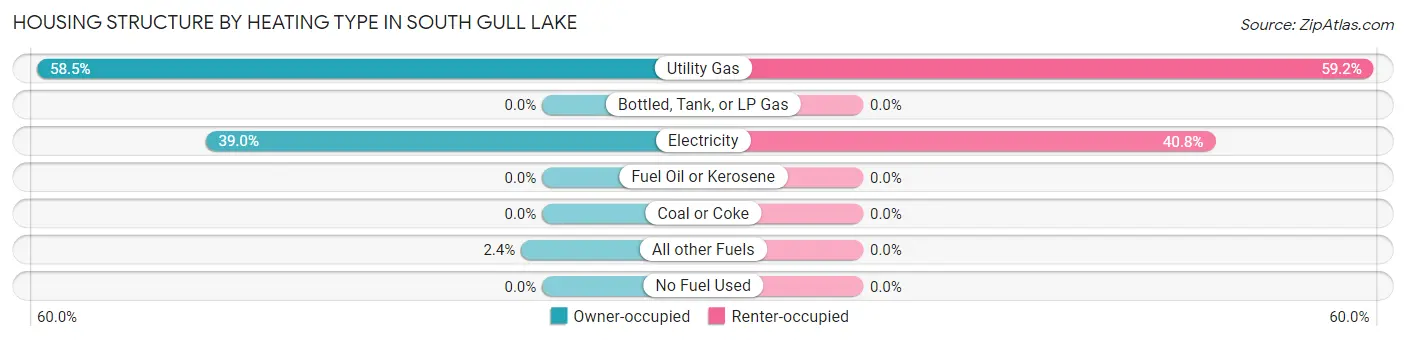
| Heating Type | Owner-occupied | Renter-occupied |
| Utility Gas | 336 (58.5%) | 58 (59.2%) |
| Bottled, Tank, or LP Gas | 0 (0.0%) | 0 (0.0%) |
| Electricity | 224 (39.0%) | 40 (40.8%) |
| Fuel Oil or Kerosene | 0 (0.0%) | 0 (0.0%) |
| Coal or Coke | 0 (0.0%) | 0 (0.0%) |
| All other Fuels | 14 (2.4%) | 0 (0.0%) |
| No Fuel Used | 0 (0.0%) | 0 (0.0%) |
| Total | 574 (100.0%) | 98 (100.0%) |
Household Vehicle Usage in South Gull Lake
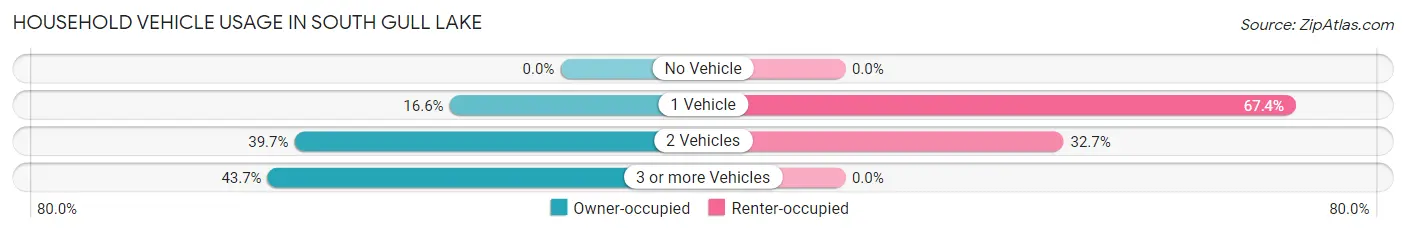
| Vehicles per Household | Owner-occupied | Renter-occupied |
| No Vehicle | 0 (0.0%) | 0 (0.0%) |
| 1 Vehicle | 95 (16.6%) | 66 (67.3%) |
| 2 Vehicles | 228 (39.7%) | 32 (32.7%) |
| 3 or more Vehicles | 251 (43.7%) | 0 (0.0%) |
| Total | 574 (100.0%) | 98 (100.0%) |
Real Estate & Mortgages in South Gull Lake
Real Estate and Mortgage Overview in South Gull Lake
| Characteristic | Without Mortgage | With Mortgage |
| Housing Units | 171 | 403 |
| Median Property Value | - | - |
| Median Household Income | $83,750 | $277 |
| Monthly Housing Costs | $788 | $276 |
| Real Estate Taxes | $4,549 | $7 |
Property Value by Mortgage Status in South Gull Lake
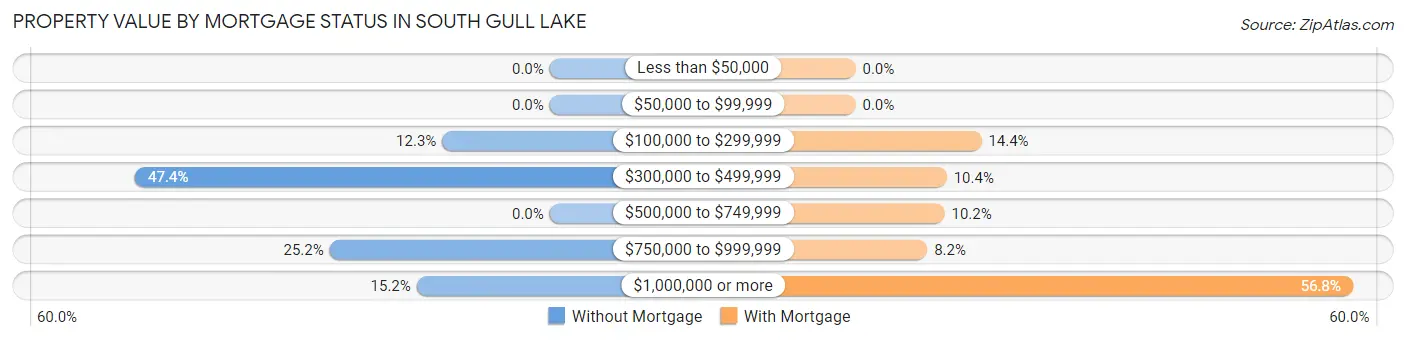
| Property Value | Without Mortgage | With Mortgage |
| Less than $50,000 | 0 (0.0%) | 0 (0.0%) |
| $50,000 to $99,999 | 0 (0.0%) | 0 (0.0%) |
| $100,000 to $299,999 | 21 (12.3%) | 58 (14.4%) |
| $300,000 to $499,999 | 81 (47.4%) | 42 (10.4%) |
| $500,000 to $749,999 | 0 (0.0%) | 41 (10.2%) |
| $750,000 to $999,999 | 43 (25.2%) | 33 (8.2%) |
| $1,000,000 or more | 26 (15.2%) | 229 (56.8%) |
| Total | 171 (100.0%) | 403 (100.0%) |
Household Income by Mortgage Status in South Gull Lake
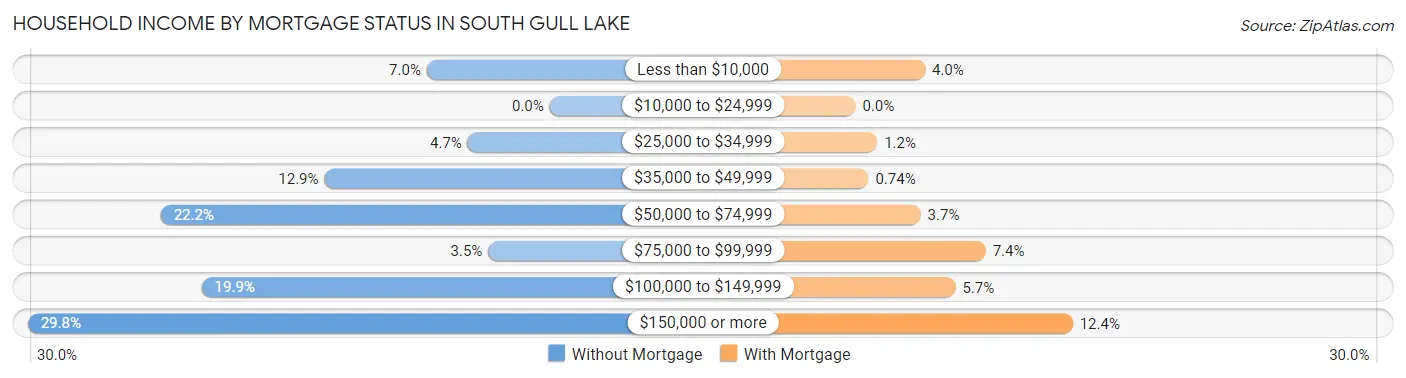
| Household Income | Without Mortgage | With Mortgage |
| Less than $10,000 | 12 (7.0%) | 16 (4.0%) |
| $10,000 to $24,999 | 0 (0.0%) | 0 (0.0%) |
| $25,000 to $34,999 | 8 (4.7%) | 5 (1.2%) |
| $35,000 to $49,999 | 22 (12.9%) | 3 (0.7%) |
| $50,000 to $74,999 | 38 (22.2%) | 15 (3.7%) |
| $75,000 to $99,999 | 6 (3.5%) | 30 (7.4%) |
| $100,000 to $149,999 | 34 (19.9%) | 23 (5.7%) |
| $150,000 or more | 51 (29.8%) | 50 (12.4%) |
| Total | 171 (100.0%) | 403 (100.0%) |
Property Value to Household Income Ratio in South Gull Lake
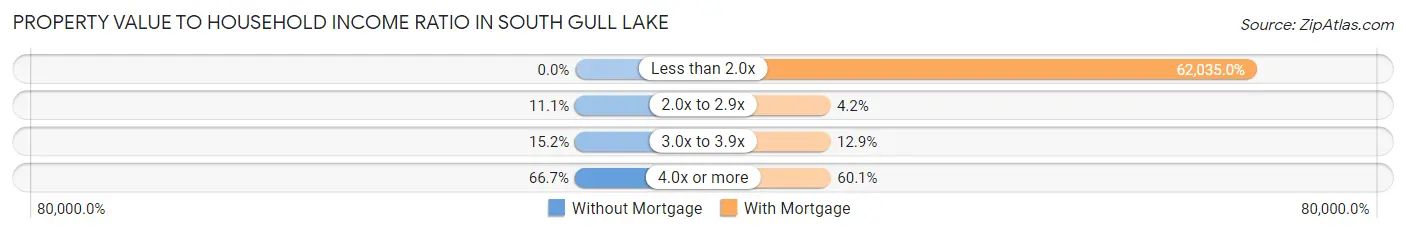
| Value-to-Income Ratio | Without Mortgage | With Mortgage |
| Less than 2.0x | 0 (0.0%) | 250,001 (62,035.0%) |
| 2.0x to 2.9x | 19 (11.1%) | 17 (4.2%) |
| 3.0x to 3.9x | 26 (15.2%) | 52 (12.9%) |
| 4.0x or more | 114 (66.7%) | 242 (60.1%) |
| Total | 171 (100.0%) | 403 (100.0%) |
Real Estate Taxes by Mortgage Status in South Gull Lake
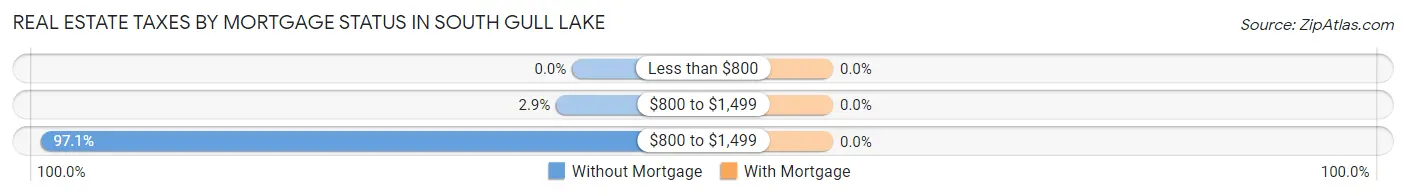
| Property Taxes | Without Mortgage | With Mortgage |
| Less than $800 | 0 (0.0%) | 0 (0.0%) |
| $800 to $1,499 | 5 (2.9%) | 0 (0.0%) |
| $800 to $1,499 | 166 (97.1%) | 0 (0.0%) |
| Total | 171 (100.0%) | 403 (100.0%) |
Health & Disability in South Gull Lake
Health Insurance Coverage by Age in South Gull Lake
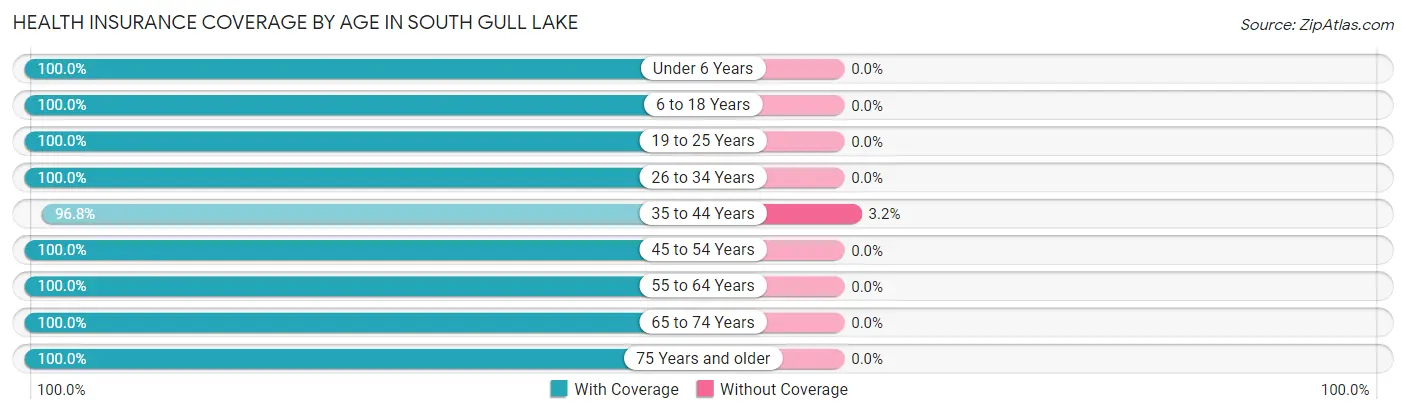
| Age Bracket | With Coverage | Without Coverage |
| Under 6 Years | 135 (100.0%) | 0 (0.0%) |
| 6 to 18 Years | 177 (100.0%) | 0 (0.0%) |
| 19 to 25 Years | 87 (100.0%) | 0 (0.0%) |
| 26 to 34 Years | 70 (100.0%) | 0 (0.0%) |
| 35 to 44 Years | 179 (96.8%) | 6 (3.2%) |
| 45 to 54 Years | 59 (100.0%) | 0 (0.0%) |
| 55 to 64 Years | 503 (100.0%) | 0 (0.0%) |
| 65 to 74 Years | 148 (100.0%) | 0 (0.0%) |
| 75 Years and older | 221 (100.0%) | 0 (0.0%) |
| Total | 1,579 (99.6%) | 6 (0.4%) |
Health Insurance Coverage by Citizenship Status in South Gull Lake
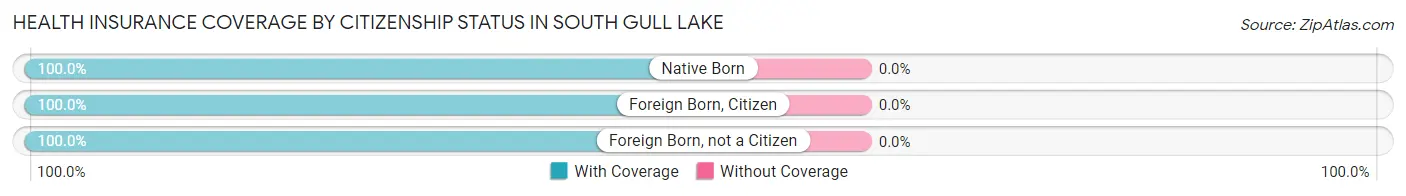
| Citizenship Status | With Coverage | Without Coverage |
| Native Born | 135 (100.0%) | 0 (0.0%) |
| Foreign Born, Citizen | 177 (100.0%) | 0 (0.0%) |
| Foreign Born, not a Citizen | 87 (100.0%) | 0 (0.0%) |
Health Insurance Coverage by Household Income in South Gull Lake
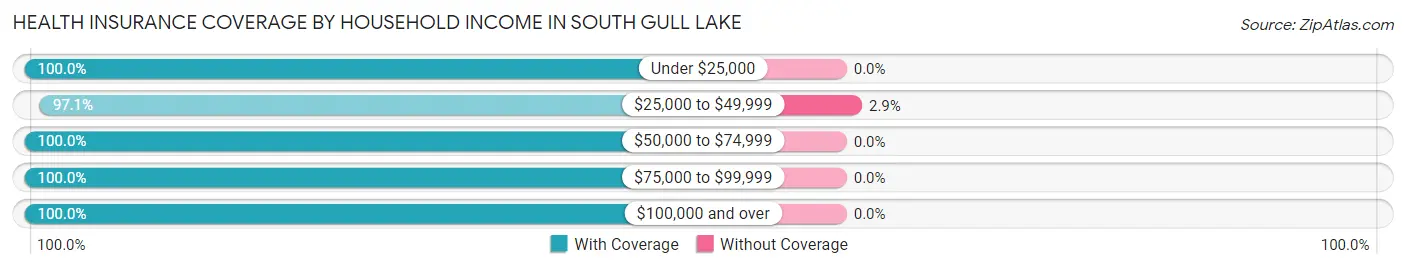
| Household Income | With Coverage | Without Coverage |
| Under $25,000 | 17 (100.0%) | 0 (0.0%) |
| $25,000 to $49,999 | 204 (97.1%) | 6 (2.9%) |
| $50,000 to $74,999 | 320 (100.0%) | 0 (0.0%) |
| $75,000 to $99,999 | 56 (100.0%) | 0 (0.0%) |
| $100,000 and over | 971 (100.0%) | 0 (0.0%) |
Public vs Private Health Insurance Coverage by Age in South Gull Lake
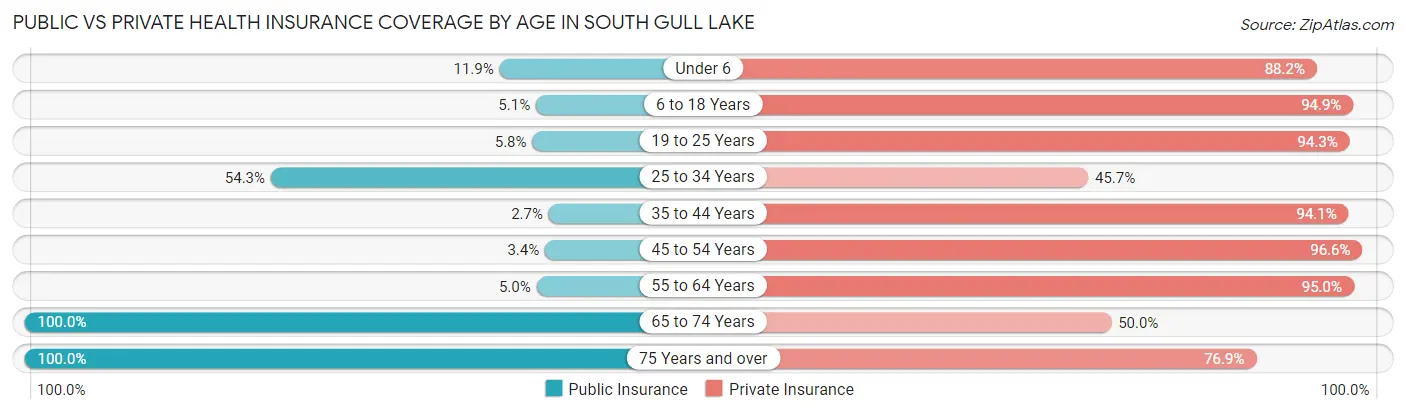
| Age Bracket | Public Insurance | Private Insurance |
| Under 6 | 16 (11.8%) | 119 (88.1%) |
| 6 to 18 Years | 9 (5.1%) | 168 (94.9%) |
| 19 to 25 Years | 5 (5.8%) | 82 (94.3%) |
| 25 to 34 Years | 38 (54.3%) | 32 (45.7%) |
| 35 to 44 Years | 5 (2.7%) | 174 (94.1%) |
| 45 to 54 Years | 2 (3.4%) | 57 (96.6%) |
| 55 to 64 Years | 25 (5.0%) | 478 (95.0%) |
| 65 to 74 Years | 148 (100.0%) | 74 (50.0%) |
| 75 Years and over | 221 (100.0%) | 170 (76.9%) |
| Total | 469 (29.6%) | 1,354 (85.4%) |
Disability Status by Sex by Age in South Gull Lake
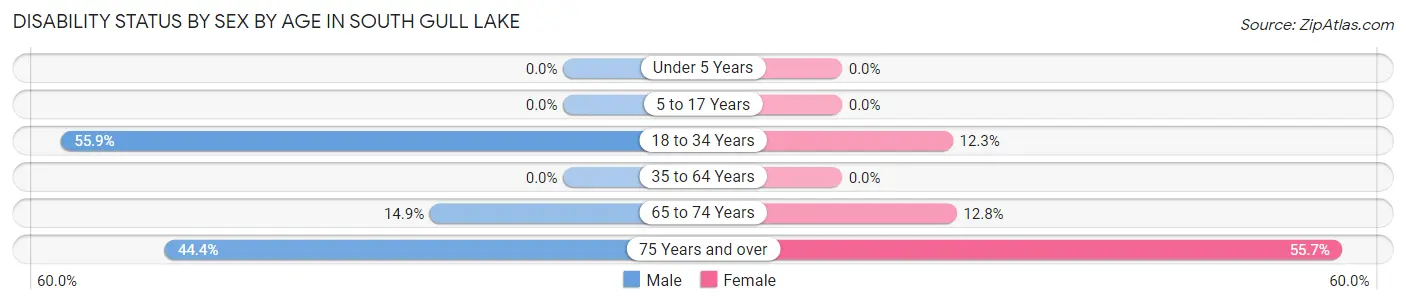
| Age Bracket | Male | Female |
| Under 5 Years | 0 (0.0%) | 0 (0.0%) |
| 5 to 17 Years | 0 (0.0%) | 0 (0.0%) |
| 18 to 34 Years | 52 (55.9%) | 9 (12.3%) |
| 35 to 64 Years | 0 (0.0%) | 0 (0.0%) |
| 65 to 74 Years | 15 (14.8%) | 6 (12.8%) |
| 75 Years and over | 55 (44.4%) | 54 (55.7%) |
Disability Class by Sex by Age in South Gull Lake
Disability Class: Hearing Difficulty
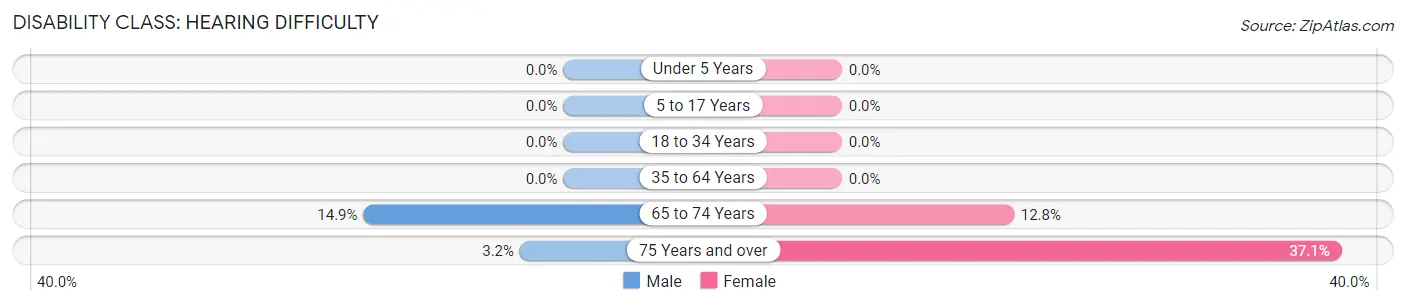
| Age Bracket | Male | Female |
| Under 5 Years | 0 (0.0%) | 0 (0.0%) |
| 5 to 17 Years | 0 (0.0%) | 0 (0.0%) |
| 18 to 34 Years | 0 (0.0%) | 0 (0.0%) |
| 35 to 64 Years | 0 (0.0%) | 0 (0.0%) |
| 65 to 74 Years | 15 (14.8%) | 6 (12.8%) |
| 75 Years and over | 4 (3.2%) | 36 (37.1%) |
Disability Class: Vision Difficulty
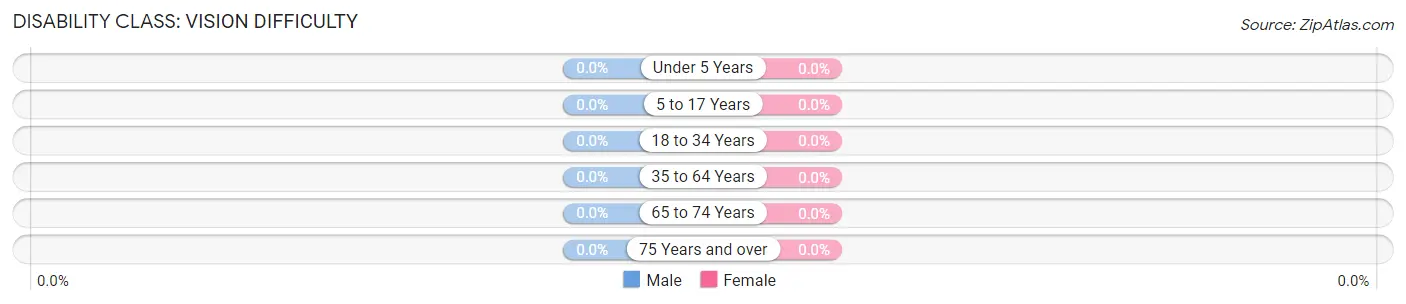
| Age Bracket | Male | Female |
| Under 5 Years | 0 (0.0%) | 0 (0.0%) |
| 5 to 17 Years | 0 (0.0%) | 0 (0.0%) |
| 18 to 34 Years | 0 (0.0%) | 0 (0.0%) |
| 35 to 64 Years | 0 (0.0%) | 0 (0.0%) |
| 65 to 74 Years | 0 (0.0%) | 0 (0.0%) |
| 75 Years and over | 0 (0.0%) | 0 (0.0%) |
Disability Class: Cognitive Difficulty
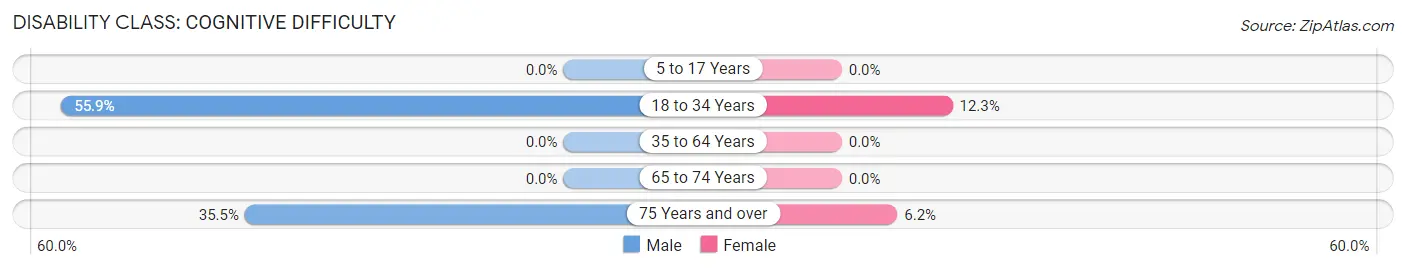
| Age Bracket | Male | Female |
| 5 to 17 Years | 0 (0.0%) | 0 (0.0%) |
| 18 to 34 Years | 52 (55.9%) | 9 (12.3%) |
| 35 to 64 Years | 0 (0.0%) | 0 (0.0%) |
| 65 to 74 Years | 0 (0.0%) | 0 (0.0%) |
| 75 Years and over | 44 (35.5%) | 6 (6.2%) |
Disability Class: Ambulatory Difficulty
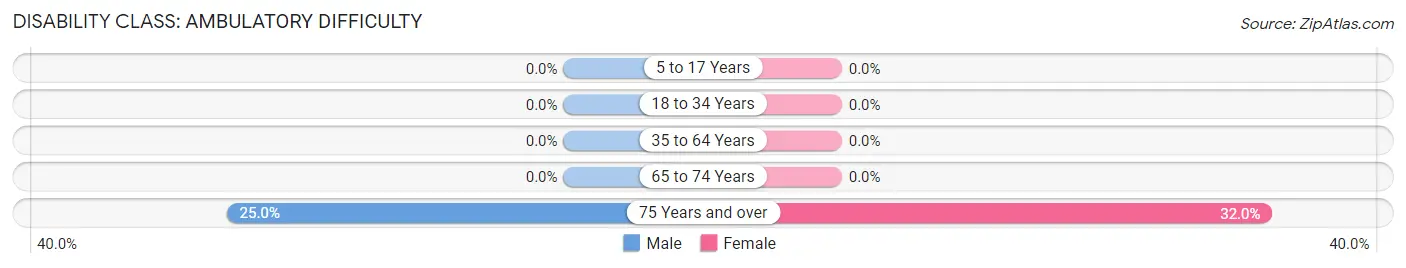
| Age Bracket | Male | Female |
| 5 to 17 Years | 0 (0.0%) | 0 (0.0%) |
| 18 to 34 Years | 0 (0.0%) | 0 (0.0%) |
| 35 to 64 Years | 0 (0.0%) | 0 (0.0%) |
| 65 to 74 Years | 0 (0.0%) | 0 (0.0%) |
| 75 Years and over | 31 (25.0%) | 31 (32.0%) |
Disability Class: Self-Care Difficulty
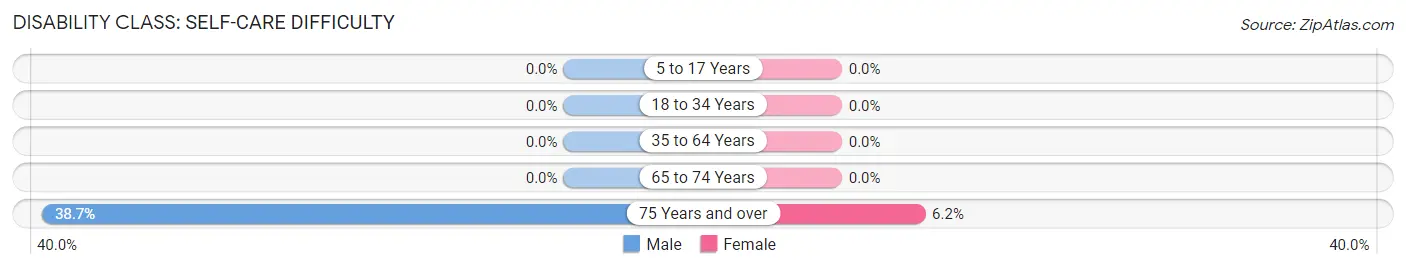
| Age Bracket | Male | Female |
| 5 to 17 Years | 0 (0.0%) | 0 (0.0%) |
| 18 to 34 Years | 0 (0.0%) | 0 (0.0%) |
| 35 to 64 Years | 0 (0.0%) | 0 (0.0%) |
| 65 to 74 Years | 0 (0.0%) | 0 (0.0%) |
| 75 Years and over | 48 (38.7%) | 6 (6.2%) |
Technology Access in South Gull Lake
Computing Device Access in South Gull Lake
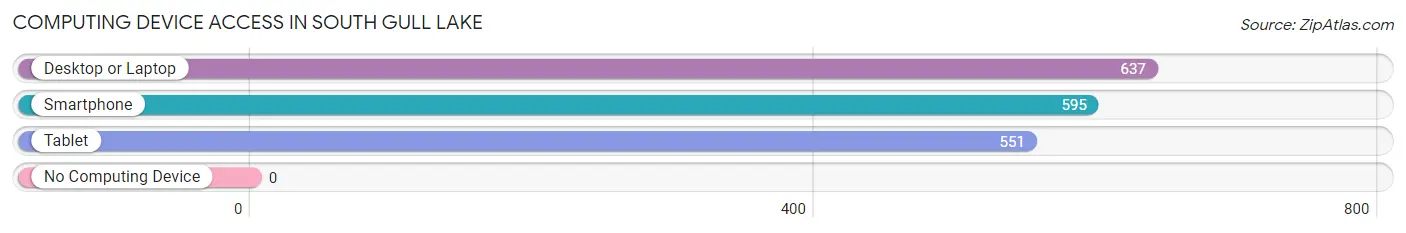
| Device Type | # Households | % Households |
| Desktop or Laptop | 637 | 94.8% |
| Smartphone | 595 | 88.5% |
| Tablet | 551 | 82.0% |
| No Computing Device | 0 | 0.0% |
| Total | 672 | 100.0% |
Internet Access in South Gull Lake
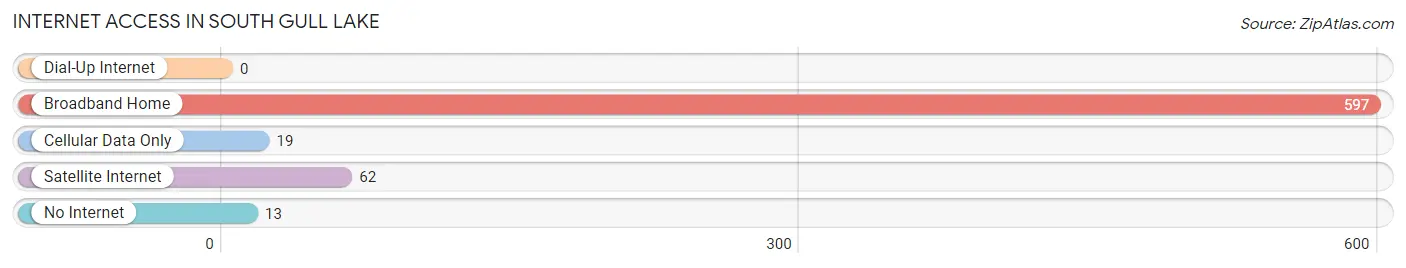
| Internet Type | # Households | % Households |
| Dial-Up Internet | 0 | 0.0% |
| Broadband Home | 597 | 88.8% |
| Cellular Data Only | 19 | 2.8% |
| Satellite Internet | 62 | 9.2% |
| No Internet | 13 | 1.9% |
| Total | 672 | 100.0% |
South Gull Lake Summary
South Gull Lake is a small unincorporated community located in the northern part of Michigan’s Lower Peninsula. It is situated in the northwest corner of Antrim County, approximately 10 miles south of Traverse City. The community is surrounded by rolling hills, forests, and lakes, making it a popular destination for outdoor recreation.
History
The area around South Gull Lake has been inhabited for thousands of years. The Anishinaabe people, also known as the Ojibwe, were the first to settle in the area. They used the area for hunting, fishing, and gathering wild plants.
The first European settlers arrived in the area in the early 1800s. They were mostly farmers and loggers who were attracted to the area’s abundant natural resources. The first post office in the area was established in 1871.
In the late 1800s, the area around South Gull Lake began to develop as a resort destination. The first resort was established in 1887 and was called the Gull Lake Hotel. It was a popular destination for wealthy families from Detroit and Chicago.
In the early 1900s, the area around South Gull Lake began to develop as a summer vacation destination. The area was known for its beautiful scenery and abundant recreational opportunities.
Geography
South Gull Lake is located in the northwest corner of Antrim County, approximately 10 miles south of Traverse City. The community is situated on the south shore of Gull Lake, a large lake that is part of the Chain of Lakes. The lake is approximately 4,000 acres in size and is popular for fishing, boating, and swimming.
The area around South Gull Lake is mostly rural and is characterized by rolling hills, forests, and lakes. The area is home to a variety of wildlife, including deer, bear, and waterfowl.
Economy
The economy of South Gull Lake is largely based on tourism. The area is a popular destination for outdoor recreation, such as fishing, boating, and swimming. The area is also home to several resorts, restaurants, and other businesses that cater to tourists.
In addition to tourism, the area is also home to several small businesses, such as farms, logging companies, and construction companies.
Demographics
As of the 2010 census, the population of South Gull Lake was 1,093. The population is mostly white (97.3%) and the median age is 44. The median household income is $45,000 and the median home value is $150,000.
Conclusion
South Gull Lake is a small unincorporated community located in the northern part of Michigan’s Lower Peninsula. It is situated in the northwest corner of Antrim County, approximately 10 miles south of Traverse City. The area is known for its beautiful scenery and abundant recreational opportunities. The economy of South Gull Lake is largely based on tourism and the area is home to several small businesses. The population of South Gull Lake is mostly white and the median age is 44.
Common Questions
What is Per Capita Income in South Gull Lake?
Per Capita income in South Gull Lake is $120,673.
What is the Median Family Income in South Gull Lake?
Median Family Income in South Gull Lake is $167,000.
What is Inequality or Gini Index in South Gull Lake?
Inequality or Gini Index in South Gull Lake is 0.51.
What is the Total Population of South Gull Lake?
Total Population of South Gull Lake is 1,585.
What is the Total Male Population of South Gull Lake?
Total Male Population of South Gull Lake is 833.
What is the Total Female Population of South Gull Lake?
Total Female Population of South Gull Lake is 752.
What is the Ratio of Males per 100 Females in South Gull Lake?
There are 110.77 Males per 100 Females in South Gull Lake.
What is the Ratio of Females per 100 Males in South Gull Lake?
There are 90.28 Females per 100 Males in South Gull Lake.
What is the Median Population Age in South Gull Lake?
Median Population Age in South Gull Lake is 55.4 Years.
What is the Average Family Size in South Gull Lake
Average Family Size in South Gull Lake is 2.6 People.
What is the Average Household Size in South Gull Lake
Average Household Size in South Gull Lake is 2.3 People.
How Large is the Labor Force in South Gull Lake?
There are 879 People in the Labor Forcein in South Gull Lake.
What is the Percentage of People in the Labor Force in South Gull Lake?
68.6% of People are in the Labor Force in South Gull Lake.
What is the Unemployment Rate in South Gull Lake?
Unemployment Rate in South Gull Lake is 1.3%.