Crystal Downs Country Club, MI Map & Demographics
Crystal Downs Country Club Map
Crystal Downs Country Club Overview
$44,766
PER CAPITA INCOME
$75,000
AVG FAMILY INCOME
30.8%
WAGE / INCOME GAP [ % ]
69.2¢/ $1
WAGE / INCOME GAP [ $ ]
0.48
INEQUALITY / GINI INDEX
61
TOTAL POPULATION
35
MALE POPULATION
26
FEMALE POPULATION
134.62
MALES / 100 FEMALES
74.29
FEMALES / 100 MALES
77.7
MEDIAN AGE
2.4
AVG FAMILY SIZE
1.9
AVG HOUSEHOLD SIZE
20
LABOR FORCE [ PEOPLE ]
32.8%
PERCENT IN LABOR FORCE
Income in Crystal Downs Country Club
Income Overview in Crystal Downs Country Club
| Characteristic | Number | Measure |
| Per Capita Income | 61 | $44,766 |
| Median Family Income | 20 | $75,000 |
| Mean Family Income | 20 | $111,185 |
| Median Household Income | 33 | $0 |
| Mean Household Income | 33 | $74,255 |
| Income Deficit | 20 | $0 |
| Wage / Income Gap (%) | 61 | 30.77% |
| Wage / Income Gap ($) | 61 | 69.23¢ per $1 |
| Gini / Inequality Index | 61 | 0.48 |
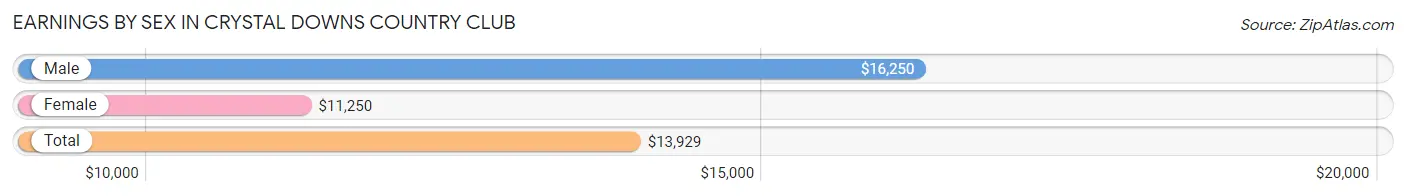
Earnings by Sex in Crystal Downs Country Club
Average Earnings in Crystal Downs Country Club are $13,929, $16,250 for men and $11,250 for women, a difference of 30.8%.
| Sex | Number | Average Earnings |
| Male | 12 (50.0%) | $16,250 |
| Female | 12 (50.0%) | $11,250 |
| Total | 24 (100.0%) | $13,929 |
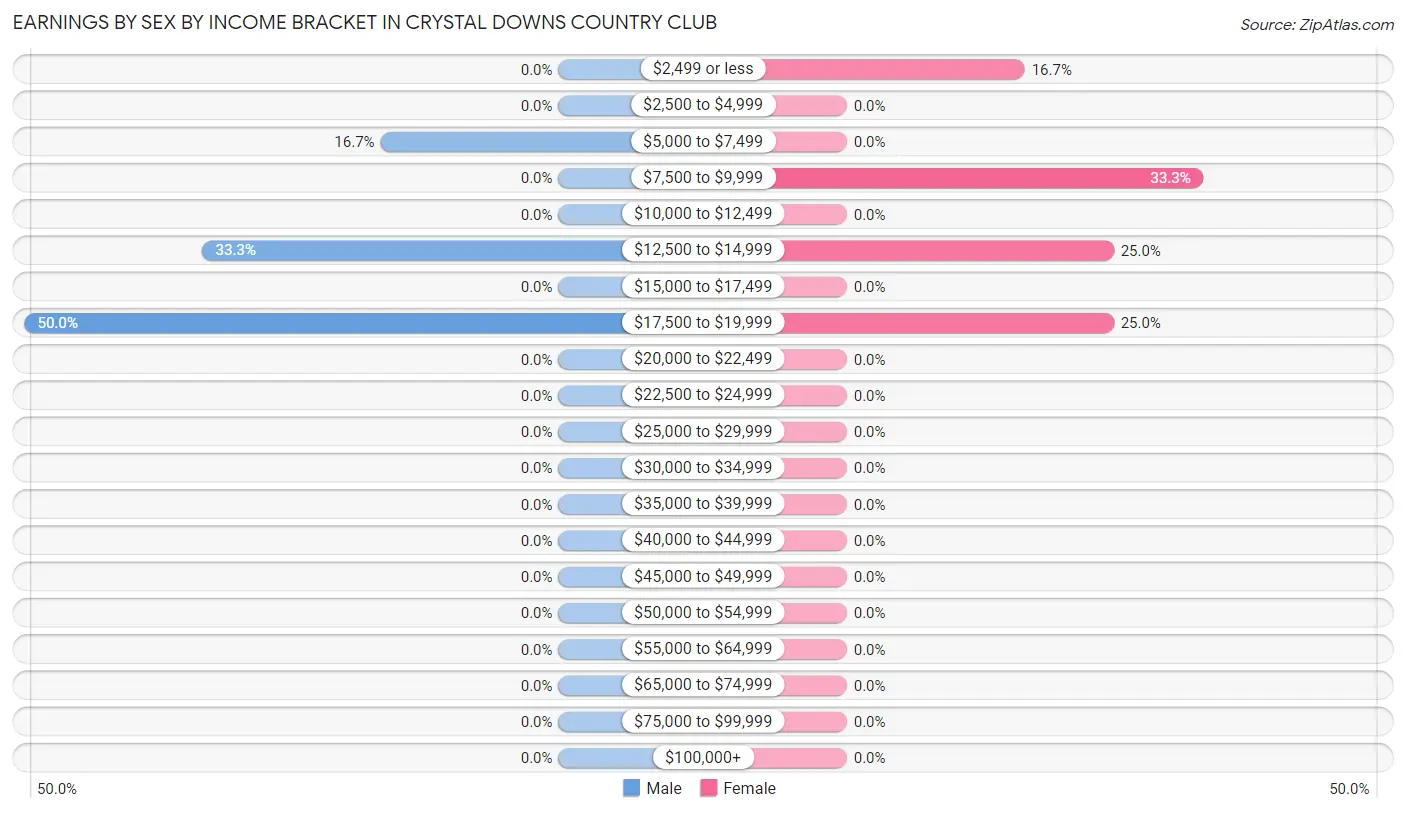
Earnings by Sex by Income Bracket in Crystal Downs Country Club
The most common earnings brackets in Crystal Downs Country Club are $17,500 to $19,999 for men (6 | 50.0%) and $7,500 to $9,999 for women (4 | 33.3%).
| Income | Male | Female |
| $2,499 or less | 0 (0.0%) | 2 (16.7%) |
| $2,500 to $4,999 | 0 (0.0%) | 0 (0.0%) |
| $5,000 to $7,499 | 2 (16.7%) | 0 (0.0%) |
| $7,500 to $9,999 | 0 (0.0%) | 4 (33.3%) |
| $10,000 to $12,499 | 0 (0.0%) | 0 (0.0%) |
| $12,500 to $14,999 | 4 (33.3%) | 3 (25.0%) |
| $15,000 to $17,499 | 0 (0.0%) | 0 (0.0%) |
| $17,500 to $19,999 | 6 (50.0%) | 3 (25.0%) |
| $20,000 to $22,499 | 0 (0.0%) | 0 (0.0%) |
| $22,500 to $24,999 | 0 (0.0%) | 0 (0.0%) |
| $25,000 to $29,999 | 0 (0.0%) | 0 (0.0%) |
| $30,000 to $34,999 | 0 (0.0%) | 0 (0.0%) |
| $35,000 to $39,999 | 0 (0.0%) | 0 (0.0%) |
| $40,000 to $44,999 | 0 (0.0%) | 0 (0.0%) |
| $45,000 to $49,999 | 0 (0.0%) | 0 (0.0%) |
| $50,000 to $54,999 | 0 (0.0%) | 0 (0.0%) |
| $55,000 to $64,999 | 0 (0.0%) | 0 (0.0%) |
| $65,000 to $74,999 | 0 (0.0%) | 0 (0.0%) |
| $75,000 to $99,999 | 0 (0.0%) | 0 (0.0%) |
| $100,000+ | 0 (0.0%) | 0 (0.0%) |
| Total | 12 (100.0%) | 12 (100.0%) |
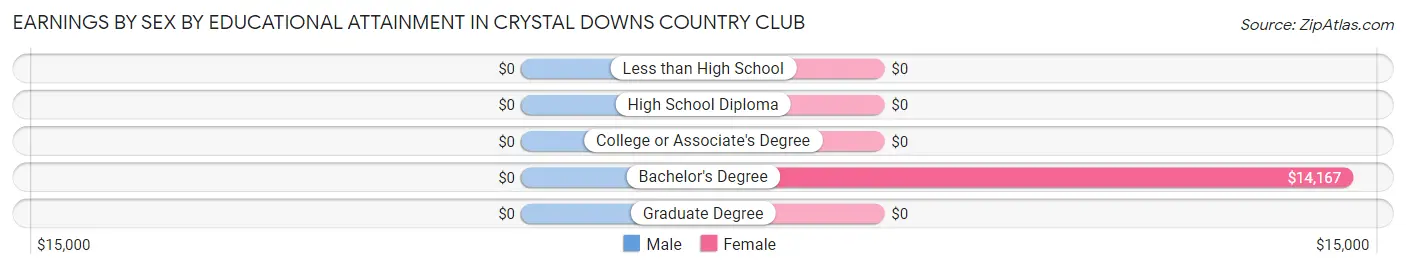
Earnings by Sex by Educational Attainment in Crystal Downs Country Club
| Educational Attainment | Male Income | Female Income |
| Less than High School | - | - |
| High School Diploma | - | - |
| College or Associate's Degree | - | - |
| Bachelor's Degree | - | - |
| Graduate Degree | - | - |
| Total | $16,250 | $11,250 |
Family Income in Crystal Downs Country Club
Family Income Brackets in Crystal Downs Country Club
According to the Crystal Downs Country Club family income data, there are 10 families falling into the $50,000 to $74,999 income range, which is the most common income bracket and makes up 50.0% of all families.
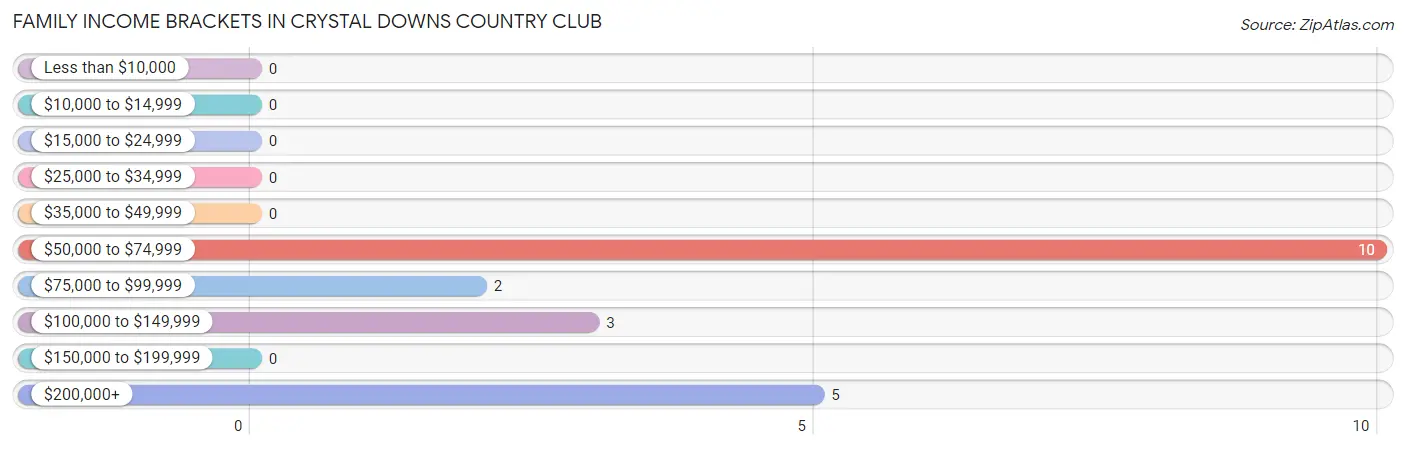
| Income Bracket | # Families | % Families |
| Less than $10,000 | 0 | 0.0% |
| $10,000 to $14,999 | 0 | 0.0% |
| $15,000 to $24,999 | 0 | 0.0% |
| $25,000 to $34,999 | 0 | 0.0% |
| $35,000 to $49,999 | 0 | 0.0% |
| $50,000 to $74,999 | 10 | 50.0% |
| $75,000 to $99,999 | 2 | 10.0% |
| $100,000 to $149,999 | 3 | 15.0% |
| $150,000 to $199,999 | 0 | 0.0% |
| $200,000+ | 5 | 25.0% |
Family Income by Famaliy Size in Crystal Downs Country Club
2-person families (17 | 85.0%) account for the highest median family income in Crystal Downs Country Club with $65,625 per family, while 2-person families (17 | 85.0%) have the highest median income of $32,812 per family member.
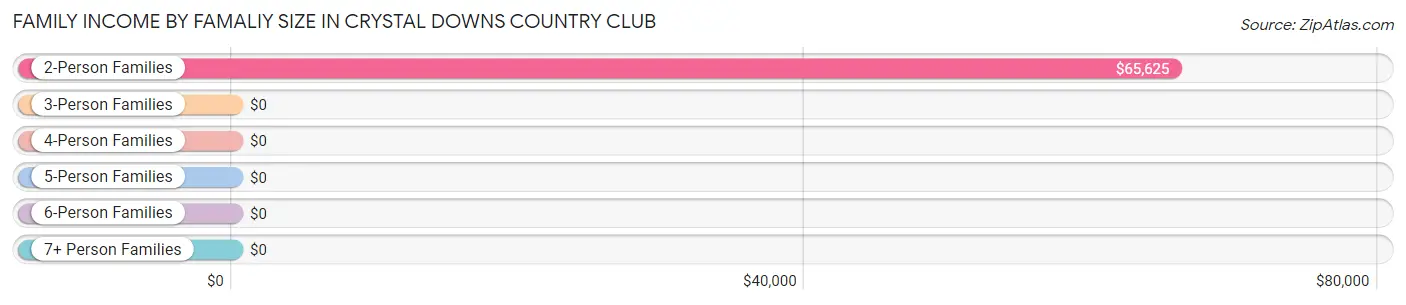
| Income Bracket | # Families | Median Income |
| 2-Person Families | 17 (85.0%) | $65,625 |
| 3-Person Families | 3 (15.0%) | $0 |
| 4-Person Families | 0 (0.0%) | $0 |
| 5-Person Families | 0 (0.0%) | $0 |
| 6-Person Families | 0 (0.0%) | $0 |
| 7+ Person Families | 0 (0.0%) | $0 |
| Total | 20 (100.0%) | $75,000 |
Family Income by Number of Earners in Crystal Downs Country Club
| Number of Earners | # Families | Median Income |
| No Earners | 2 (10.0%) | $0 |
| 1 Earner | 11 (55.0%) | $0 |
| 2 Earners | 7 (35.0%) | $0 |
| 3+ Earners | 0 (0.0%) | $0 |
| Total | 20 (100.0%) | $75,000 |
Household Income in Crystal Downs Country Club
Household Income Brackets in Crystal Downs Country Club
With 13 households falling in the category, the $15,000 to $24,999 income range is the most frequent in Crystal Downs Country Club, accounting for 39.4% of all households.
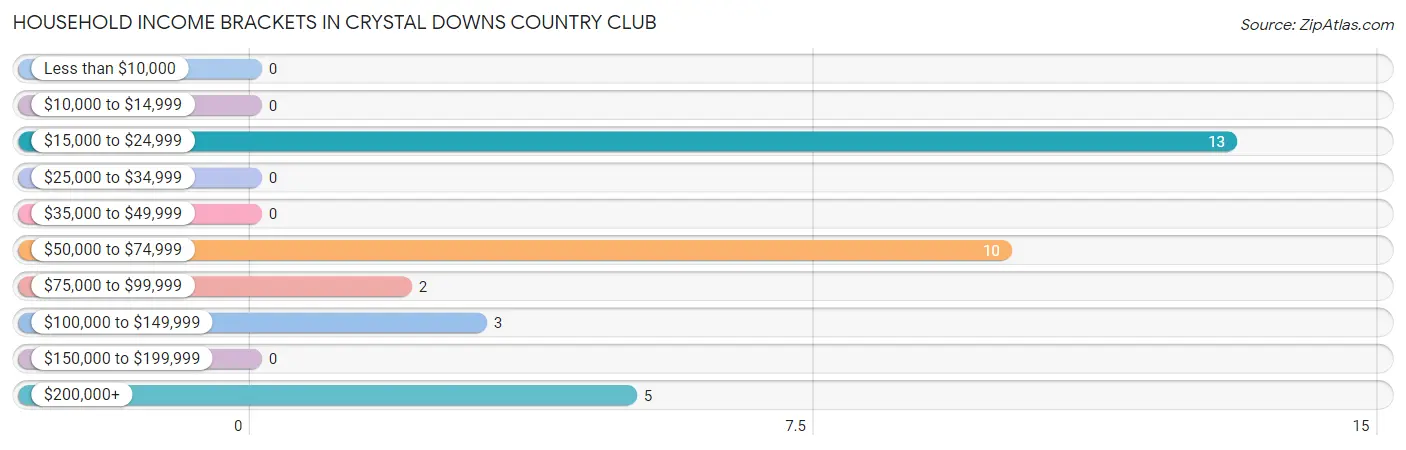
| Income Bracket | # Households | % Households |
| Less than $10,000 | 0 | 0.0% |
| $10,000 to $14,999 | 0 | 0.0% |
| $15,000 to $24,999 | 13 | 39.4% |
| $25,000 to $34,999 | 0 | 0.0% |
| $35,000 to $49,999 | 0 | 0.0% |
| $50,000 to $74,999 | 10 | 30.3% |
| $75,000 to $99,999 | 2 | 6.1% |
| $100,000 to $149,999 | 3 | 9.1% |
| $150,000 to $199,999 | 0 | 0.0% |
| $200,000+ | 5 | 15.2% |
Household Income by Householder Age in Crystal Downs Country Club
| Income Bracket | # Households | Median Income |
| 15 to 24 Years | 0 (0.0%) | $0 |
| 25 to 44 Years | 0 (0.0%) | $0 |
| 45 to 64 Years | 4 (12.1%) | $0 |
| 65+ Years | 29 (87.9%) | $0 |
| Total | 33 (100.0%) | $0 |
Poverty in Crystal Downs Country Club
Income Below Poverty by Sex and Age in Crystal Downs Country Club
| Age Bracket | Male | Female |
| Under 5 Years | 0 (0.0%) | 0 (0.0%) |
| 5 Years | 0 (0.0%) | 0 (0.0%) |
| 6 to 11 Years | 0 (0.0%) | 0 (0.0%) |
| 12 to 14 Years | 0 (0.0%) | 0 (0.0%) |
| 15 Years | 0 (0.0%) | 0 (0.0%) |
| 16 and 17 Years | 0 (0.0%) | 0 (0.0%) |
| 18 to 24 Years | 0 (0.0%) | 0 (0.0%) |
| 25 to 34 Years | 0 (0.0%) | 0 (0.0%) |
| 35 to 44 Years | 0 (0.0%) | 0 (0.0%) |
| 45 to 54 Years | 0 (0.0%) | 0 (0.0%) |
| 55 to 64 Years | 0 (0.0%) | 0 (0.0%) |
| 65 to 74 Years | 0 (0.0%) | 0 (0.0%) |
| 75 Years and over | 0 (0.0%) | 0 (0.0%) |
| Total | 0 (0.0%) | 0 (0.0%) |
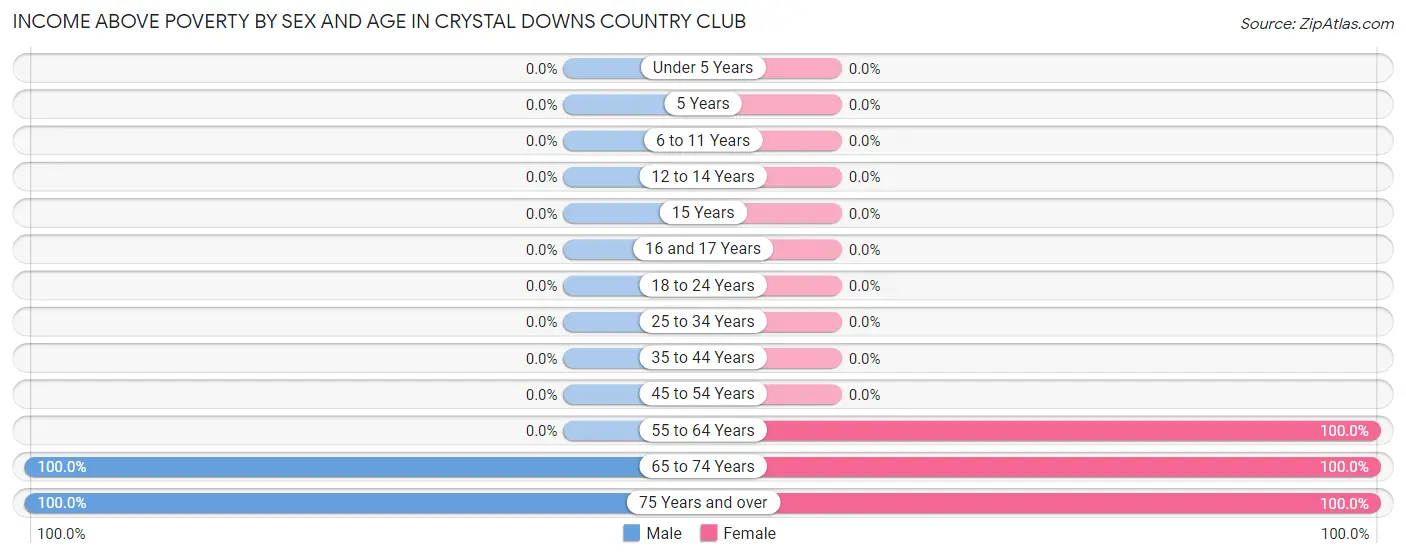
Income Above Poverty by Sex and Age in Crystal Downs Country Club
According to the poverty statistics in Crystal Downs Country Club, males aged 65 to 74 years and females aged 55 to 64 years are the age groups that are most secure financially, with 100.0% of males and 100.0% of females in these age groups living above the poverty line.
| Age Bracket | Male | Female |
| Under 5 Years | 0 (0.0%) | 0 (0.0%) |
| 5 Years | 0 (0.0%) | 0 (0.0%) |
| 6 to 11 Years | 0 (0.0%) | 0 (0.0%) |
| 12 to 14 Years | 0 (0.0%) | 0 (0.0%) |
| 15 Years | 0 (0.0%) | 0 (0.0%) |
| 16 and 17 Years | 0 (0.0%) | 0 (0.0%) |
| 18 to 24 Years | 0 (0.0%) | 0 (0.0%) |
| 25 to 34 Years | 0 (0.0%) | 0 (0.0%) |
| 35 to 44 Years | 0 (0.0%) | 0 (0.0%) |
| 45 to 54 Years | 0 (0.0%) | 0 (0.0%) |
| 55 to 64 Years | 0 (0.0%) | 4 (100.0%) |
| 65 to 74 Years | 6 (100.0%) | 10 (100.0%) |
| 75 Years and over | 29 (100.0%) | 12 (100.0%) |
| Total | 35 (100.0%) | 26 (100.0%) |
Income Below Poverty Among Married-Couple Families in Crystal Downs Country Club
| Children | Above Poverty | Below Poverty |
| No Children | 20 (100.0%) | 0 (0.0%) |
| 1 or 2 Children | 0 (0.0%) | 0 (0.0%) |
| 3 or 4 Children | 0 (0.0%) | 0 (0.0%) |
| 5 or more Children | 0 (0.0%) | 0 (0.0%) |
| Total | 20 (100.0%) | 0 (0.0%) |
Income Below Poverty Among Single-Parent Households in Crystal Downs Country Club
| Children | Single Father | Single Mother |
| No Children | 0 (0.0%) | 0 (0.0%) |
| 1 or 2 Children | 0 (0.0%) | 0 (0.0%) |
| 3 or 4 Children | 0 (0.0%) | 0 (0.0%) |
| 5 or more Children | 0 (0.0%) | 0 (0.0%) |
| Total | 0 (0.0%) | 0 (0.0%) |
Income Below Poverty Among Married-Couple vs Single-Parent Households in Crystal Downs Country Club
| Children | Married-Couple Families | Single-Parent Households |
| No Children | 0 (0.0%) | 0 (0.0%) |
| 1 or 2 Children | 0 (0.0%) | 0 (0.0%) |
| 3 or 4 Children | 0 (0.0%) | 0 (0.0%) |
| 5 or more Children | 0 (0.0%) | 0 (0.0%) |
| Total | 0 (0.0%) | 0 (0.0%) |
Race in Crystal Downs Country Club
The most populous races in Crystal Downs Country Club are , and White / Caucasian (61 | 100.0%).
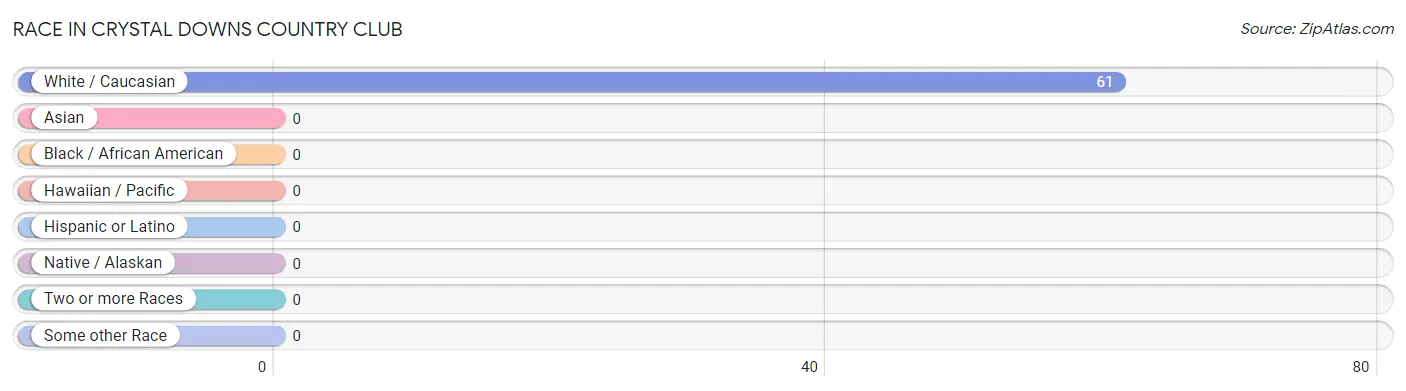
| Race | # Population | % Population |
| Asian | 0 | 0.0% |
| Black / African American | 0 | 0.0% |
| Hawaiian / Pacific | 0 | 0.0% |
| Hispanic or Latino | 0 | 0.0% |
| Native / Alaskan | 0 | 0.0% |
| White / Caucasian | 61 | 100.0% |
| Two or more Races | 0 | 0.0% |
| Some other Race | 0 | 0.0% |
| Total | 61 | 100.0% |
Ancestry in Crystal Downs Country Club
The most populous ancestries reported in Crystal Downs Country Club are German (28 | 45.9%), English (21 | 34.4%), Irish (13 | 21.3%), Italian (7 | 11.5%), and Scottish (6 | 9.8%), together accounting for 123.0% of all Crystal Downs Country Club residents.
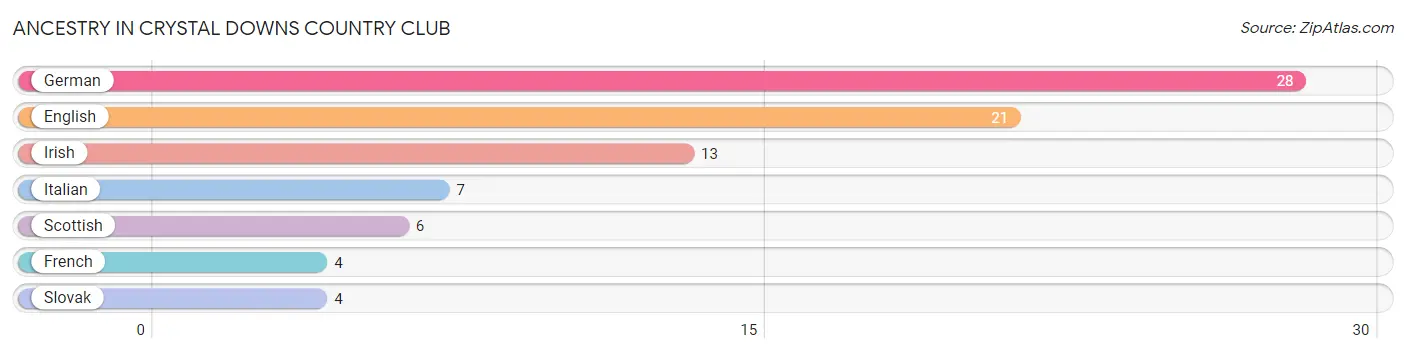
| Ancestry | # Population | % Population |
| English | 21 | 34.4% |
| French | 4 | 6.6% |
| German | 28 | 45.9% |
| Irish | 13 | 21.3% |
| Italian | 7 | 11.5% |
| Scottish | 6 | 9.8% |
| Slovak | 4 | 6.6% | View All 7 Rows |
Immigrants in Crystal Downs Country Club

| Immigration Origin | # Population | % Population | View All 0 Rows |
Sex and Age in Crystal Downs Country Club
Sex and Age in Crystal Downs Country Club
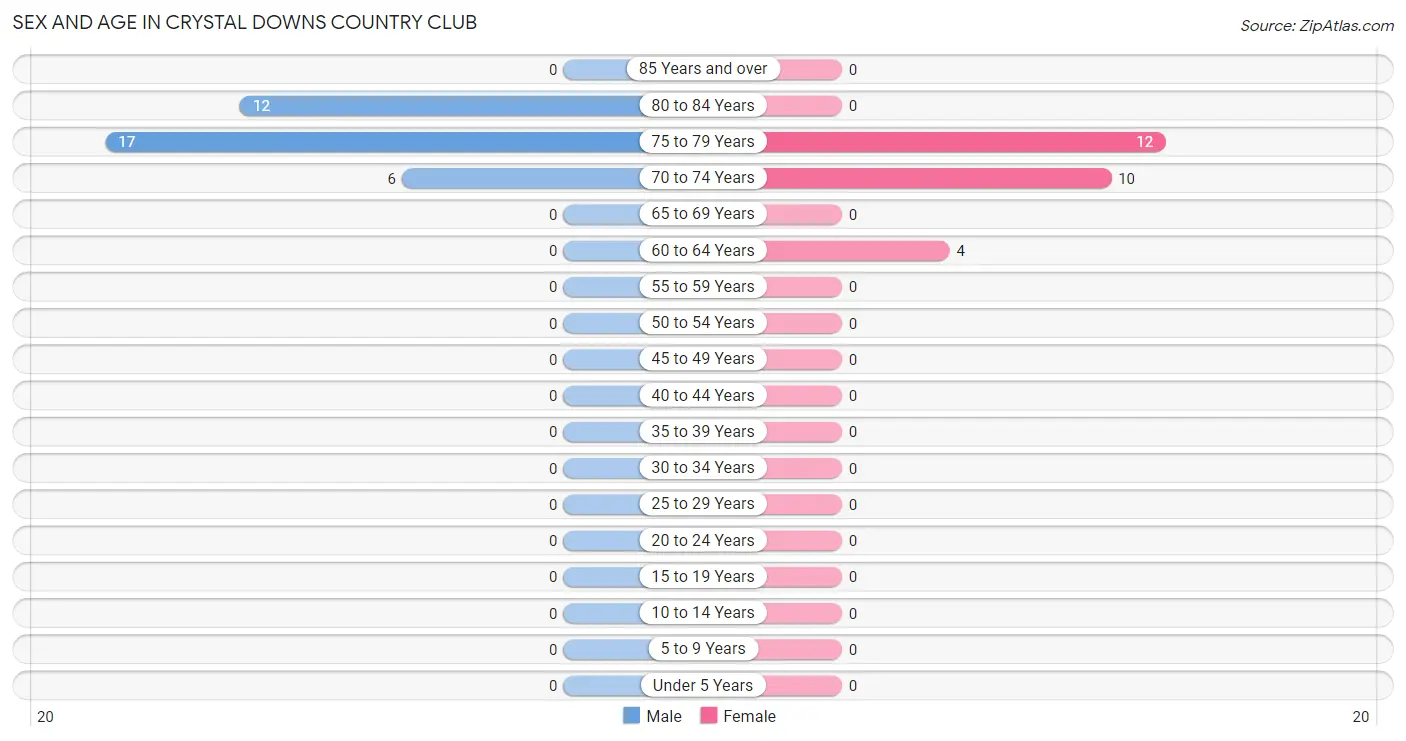
The most populous age groups in Crystal Downs Country Club are 75 to 79 Years (17 | 48.6%) for men and 75 to 79 Years (12 | 46.2%) for women.
| Age Bracket | Male | Female |
| Under 5 Years | 0 (0.0%) | 0 (0.0%) |
| 5 to 9 Years | 0 (0.0%) | 0 (0.0%) |
| 10 to 14 Years | 0 (0.0%) | 0 (0.0%) |
| 15 to 19 Years | 0 (0.0%) | 0 (0.0%) |
| 20 to 24 Years | 0 (0.0%) | 0 (0.0%) |
| 25 to 29 Years | 0 (0.0%) | 0 (0.0%) |
| 30 to 34 Years | 0 (0.0%) | 0 (0.0%) |
| 35 to 39 Years | 0 (0.0%) | 0 (0.0%) |
| 40 to 44 Years | 0 (0.0%) | 0 (0.0%) |
| 45 to 49 Years | 0 (0.0%) | 0 (0.0%) |
| 50 to 54 Years | 0 (0.0%) | 0 (0.0%) |
| 55 to 59 Years | 0 (0.0%) | 0 (0.0%) |
| 60 to 64 Years | 0 (0.0%) | 4 (15.4%) |
| 65 to 69 Years | 0 (0.0%) | 0 (0.0%) |
| 70 to 74 Years | 6 (17.1%) | 10 (38.5%) |
| 75 to 79 Years | 17 (48.6%) | 12 (46.2%) |
| 80 to 84 Years | 12 (34.3%) | 0 (0.0%) |
| 85 Years and over | 0 (0.0%) | 0 (0.0%) |
| Total | 35 (100.0%) | 26 (100.0%) |
Families and Households in Crystal Downs Country Club
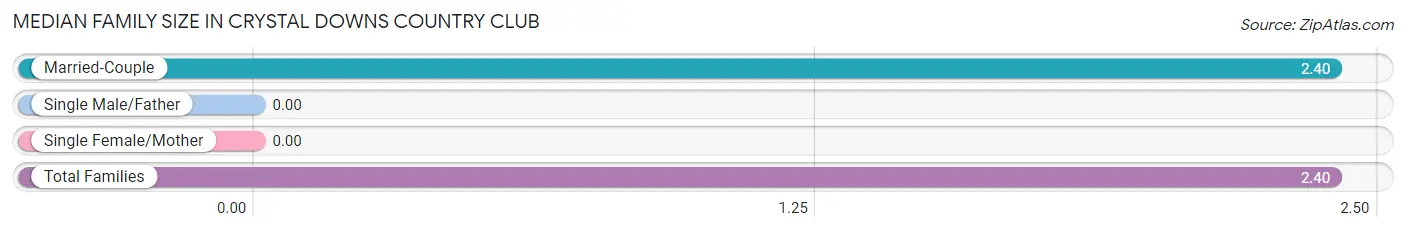
Median Family Size in Crystal Downs Country Club
| Family Type | # Families | Family Size |
| Married-Couple | 20 (100.0%) | 2.40 |
| Single Male/Father | 0 (0.0%) | - |
| Single Female/Mother | 0 (0.0%) | - |
| Total Families | 20 (100.0%) | 2.40 |
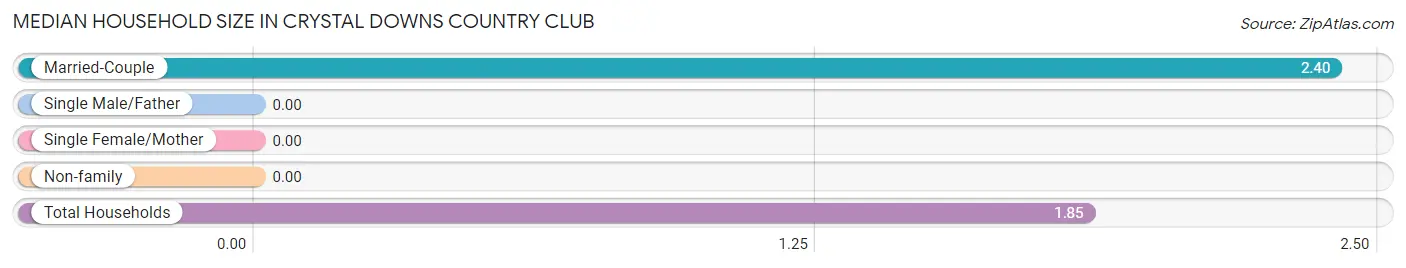
Median Household Size in Crystal Downs Country Club
| Household Type | # Households | Household Size |
| Married-Couple | 20 (60.6%) | 2.40 |
| Single Male/Father | 0 (0.0%) | - |
| Single Female/Mother | 0 (0.0%) | - |
| Non-family | 13 (39.4%) | - |
| Total Households | 33 (100.0%) | 1.85 |
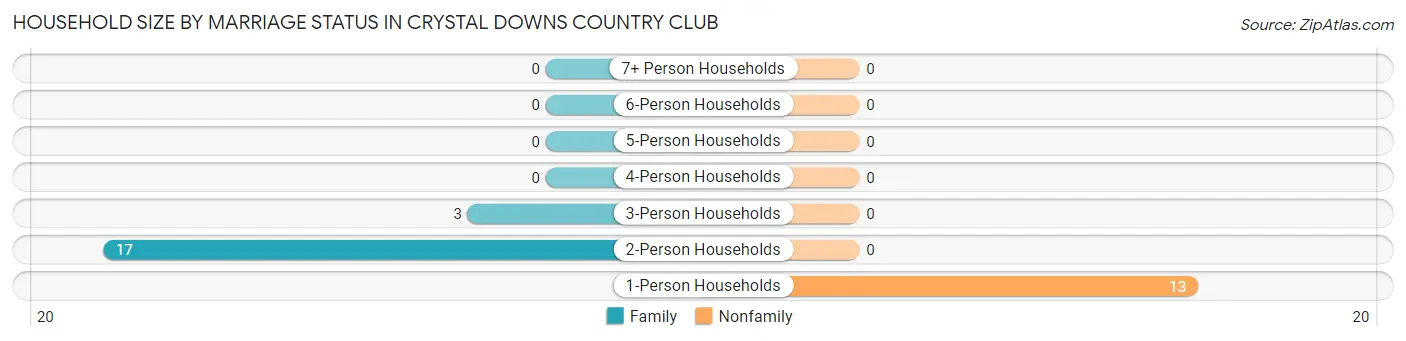
Household Size by Marriage Status in Crystal Downs Country Club
Out of a total of 33 households in Crystal Downs Country Club, 20 (60.6%) are family households, while 13 (39.4%) are nonfamily households. The most numerous type of family households are 2-person households, comprising 17, and the most common type of nonfamily households are 1-person households, comprising 13.
| Household Size | Family Households | Nonfamily Households |
| 1-Person Households | - | 13 (39.4%) |
| 2-Person Households | 17 (51.5%) | 0 (0.0%) |
| 3-Person Households | 3 (9.1%) | 0 (0.0%) |
| 4-Person Households | 0 (0.0%) | 0 (0.0%) |
| 5-Person Households | 0 (0.0%) | 0 (0.0%) |
| 6-Person Households | 0 (0.0%) | 0 (0.0%) |
| 7+ Person Households | 0 (0.0%) | 0 (0.0%) |
| Total | 20 (60.6%) | 13 (39.4%) |
Female Fertility in Crystal Downs Country Club
Fertility by Age in Crystal Downs Country Club
| Age Bracket | Women with Births | Births / 1,000 Women |
| 15 to 19 years | 0 (0.0%) | 0.0 |
| 20 to 34 years | 0 (0.0%) | 0.0 |
| 35 to 50 years | 0 (0.0%) | 0.0 |
| Total | 0 (0.0%) | 0.0 |
Fertility by Age by Marriage Status in Crystal Downs Country Club
| Age Bracket | Married | Unmarried |
| 15 to 19 years | 0 (0.0%) | 0 (0.0%) |
| 20 to 34 years | 0 (0.0%) | 0 (0.0%) |
| 35 to 50 years | 0 (0.0%) | 0 (0.0%) |
| Total | 0 (0.0%) | 0 (0.0%) |
Fertility by Education in Crystal Downs Country Club
| Educational Attainment | Women with Births | Births / 1,000 Women |
| Less than High School | 0 (0.0%) | 0.0 |
| High School Diploma | 0 (0.0%) | 0.0 |
| College or Associate's Degree | 0 (0.0%) | 0.0 |
| Bachelor's Degree | 0 (0.0%) | 0.0 |
| Graduate Degree | 0 (0.0%) | 0.0 |
| Total | 0 (0.0%) | 0.0 |
Fertility by Education by Marriage Status in Crystal Downs Country Club
| Educational Attainment | Married | Unmarried |
| Less than High School | 0 (0.0%) | 0 (0.0%) |
| High School Diploma | 0 (0.0%) | 0 (0.0%) |
| College or Associate's Degree | 0 (0.0%) | 0 (0.0%) |
| Bachelor's Degree | 0 (0.0%) | 0 (0.0%) |
| Graduate Degree | 0 (0.0%) | 0 (0.0%) |
| Total | 0 (0.0%) | 0 (0.0%) |
Employment Characteristics in Crystal Downs Country Club
Employment by Class of Employer in Crystal Downs Country Club
Among the 20 employed individuals in Crystal Downs Country Club, private company employees (16 | 80.0%), and not-for-profit organizations (4 | 20.0%) make up the most common classes of employment.
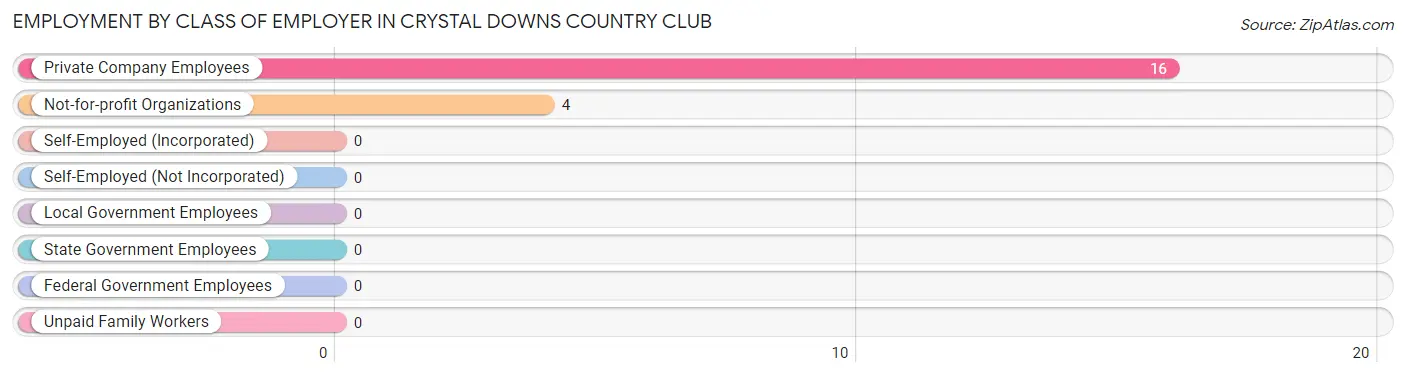
| Employer Class | # Employees | % Employees |
| Private Company Employees | 16 | 80.0% |
| Self-Employed (Incorporated) | 0 | 0.0% |
| Self-Employed (Not Incorporated) | 0 | 0.0% |
| Not-for-profit Organizations | 4 | 20.0% |
| Local Government Employees | 0 | 0.0% |
| State Government Employees | 0 | 0.0% |
| Federal Government Employees | 0 | 0.0% |
| Unpaid Family Workers | 0 | 0.0% |
| Total | 20 | 100.0% |
Employment Status by Age in Crystal Downs Country Club
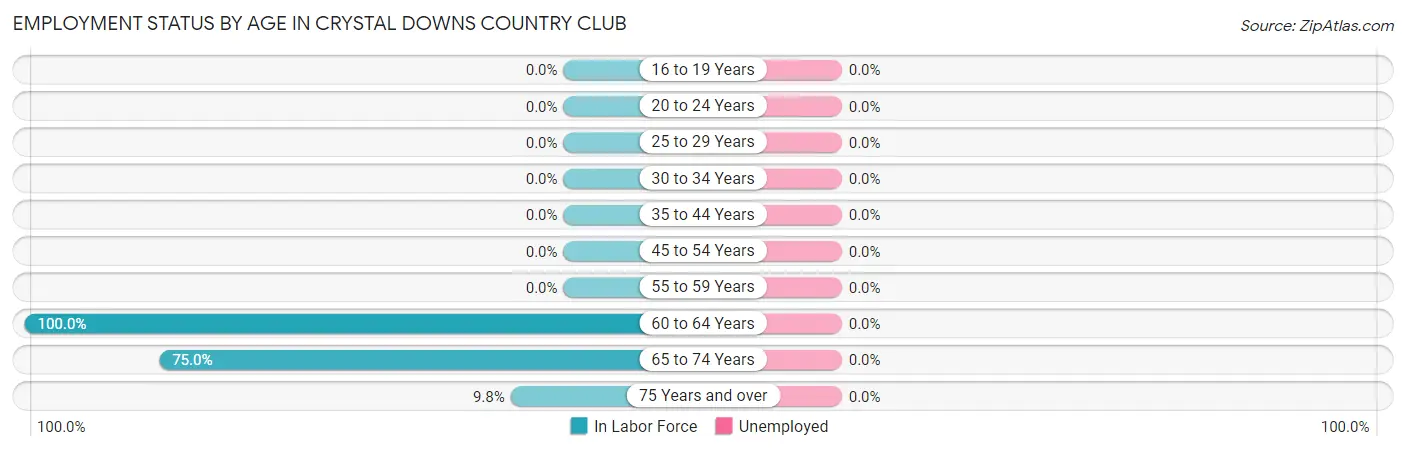
| Age Bracket | In Labor Force | Unemployed |
| 16 to 19 Years | 0 (0.0%) | 0 (0.0%) |
| 20 to 24 Years | 0 (0.0%) | 0 (0.0%) |
| 25 to 29 Years | 0 (0.0%) | 0 (0.0%) |
| 30 to 34 Years | 0 (0.0%) | 0 (0.0%) |
| 35 to 44 Years | 0 (0.0%) | 0 (0.0%) |
| 45 to 54 Years | 0 (0.0%) | 0 (0.0%) |
| 55 to 59 Years | 0 (0.0%) | 0 (0.0%) |
| 60 to 64 Years | 4 (100.0%) | 0 (0.0%) |
| 65 to 74 Years | 12 (75.0%) | 0 (0.0%) |
| 75 Years and over | 4 (9.8%) | 0 (0.0%) |
| Total | 20 (32.8%) | 0 (0.0%) |
Employment Status by Educational Attainment in Crystal Downs Country Club
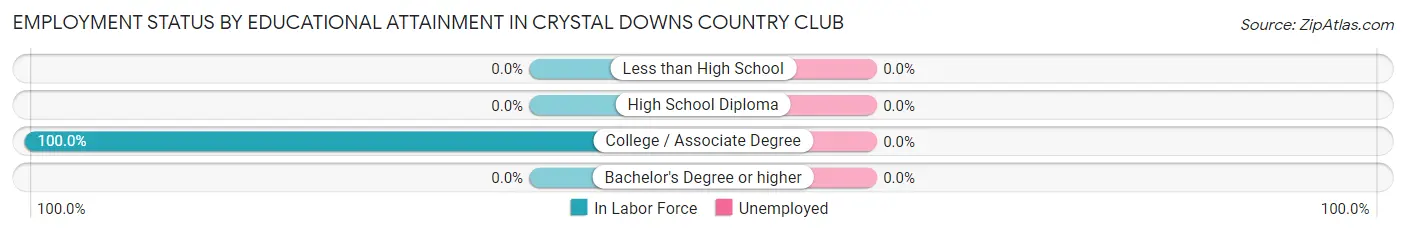
| Educational Attainment | In Labor Force | Unemployed |
| Less than High School | 0 (0.0%) | 0 (0.0%) |
| High School Diploma | 0 (0.0%) | 0 (0.0%) |
| College / Associate Degree | 4 (100.0%) | 0 (0.0%) |
| Bachelor's Degree or higher | 0 (0.0%) | 0 (0.0%) |
| Total | 4 (100.0%) | 0 (0.0%) |
Employment Occupations by Sex in Crystal Downs Country Club
Management, Business, Science and Arts Occupations
The most common Management, Business, Science and Arts occupations in Crystal Downs Country Club are Business & Financial (3 | 15.0%), Community & Social Service (3 | 15.0%), and Arts, Media & Entertainment (3 | 15.0%).
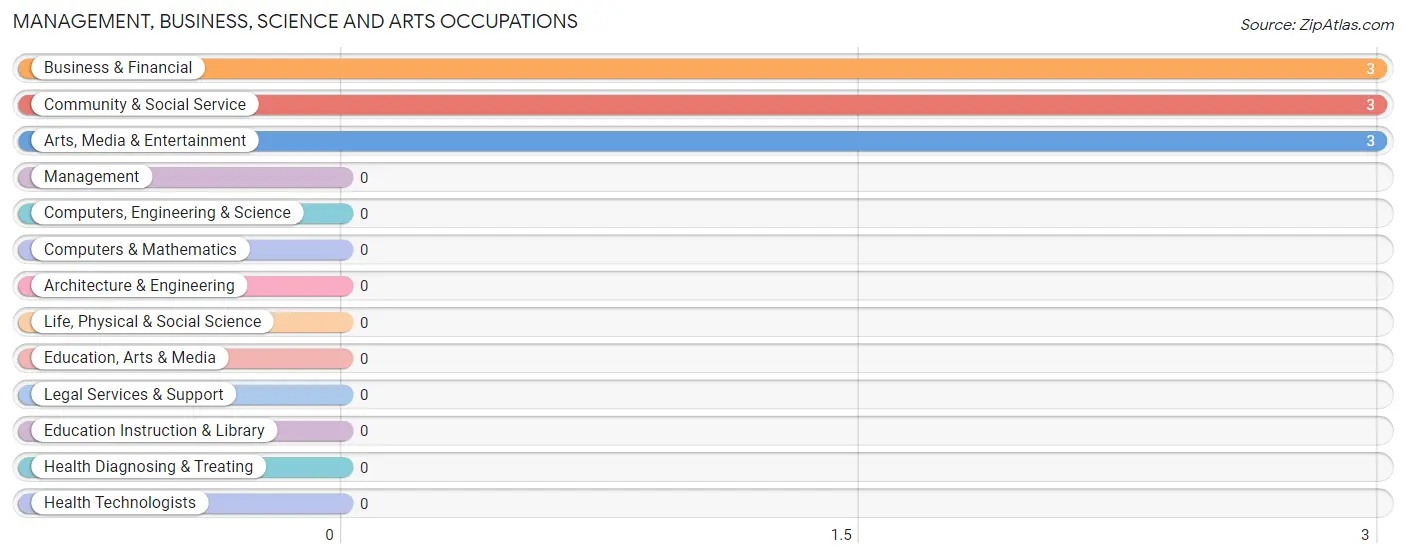
Management, Business, Science and Arts Occupations by Sex
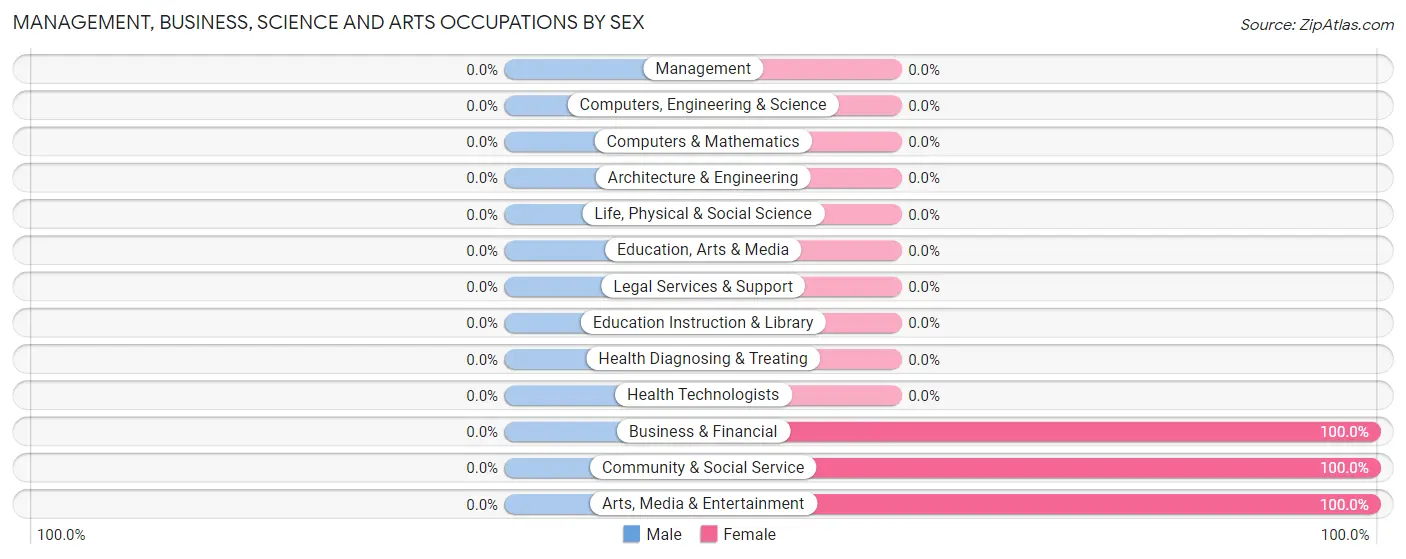
| Occupation | Male | Female |
| Management | 0 (0.0%) | 0 (0.0%) |
| Business & Financial | 0 (0.0%) | 3 (100.0%) |
| Computers, Engineering & Science | 0 (0.0%) | 0 (0.0%) |
| Computers & Mathematics | 0 (0.0%) | 0 (0.0%) |
| Architecture & Engineering | 0 (0.0%) | 0 (0.0%) |
| Life, Physical & Social Science | 0 (0.0%) | 0 (0.0%) |
| Community & Social Service | 0 (0.0%) | 3 (100.0%) |
| Education, Arts & Media | 0 (0.0%) | 0 (0.0%) |
| Legal Services & Support | 0 (0.0%) | 0 (0.0%) |
| Education Instruction & Library | 0 (0.0%) | 0 (0.0%) |
| Arts, Media & Entertainment | 0 (0.0%) | 3 (100.0%) |
| Health Diagnosing & Treating | 0 (0.0%) | 0 (0.0%) |
| Health Technologists | 0 (0.0%) | 0 (0.0%) |
| Total (Category) | 0 (0.0%) | 6 (100.0%) |
| Total (Overall) | 10 (50.0%) | 10 (50.0%) |
Services Occupations
Services Occupations by Sex
| Occupation | Male | Female |
| Healthcare Support | 0 (0.0%) | 0 (0.0%) |
| Security & Protection | 0 (0.0%) | 0 (0.0%) |
| Firefighting & Prevention | 0 (0.0%) | 0 (0.0%) |
| Law Enforcement | 0 (0.0%) | 0 (0.0%) |
| Food Preparation & Serving | 0 (0.0%) | 0 (0.0%) |
| Cleaning & Maintenance | 0 (0.0%) | 0 (0.0%) |
| Personal Care & Service | 0 (0.0%) | 0 (0.0%) |
| Total (Category) | 0 (0.0%) | 0 (0.0%) |
| Total (Overall) | 10 (50.0%) | 10 (50.0%) |
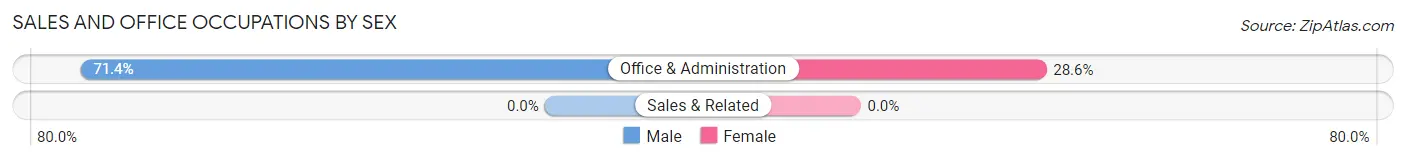
Sales and Office Occupations
The most common Sales and Office occupations in Crystal Downs Country Club are , and Office & Administration (14 | 70.0%).
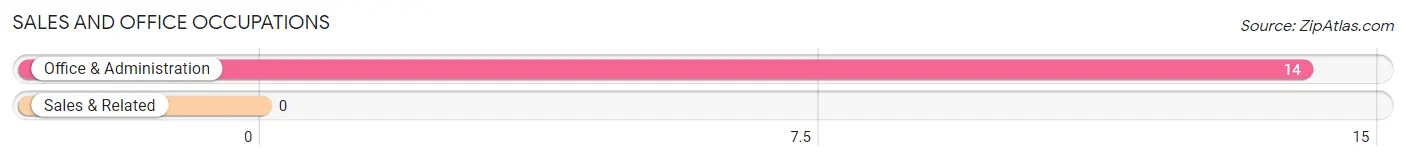
Sales and Office Occupations by Sex
| Occupation | Male | Female |
| Sales & Related | 0 (0.0%) | 0 (0.0%) |
| Office & Administration | 10 (71.4%) | 4 (28.6%) |
| Total (Category) | 10 (71.4%) | 4 (28.6%) |
| Total (Overall) | 10 (50.0%) | 10 (50.0%) |
Natural Resources, Construction and Maintenance Occupations
Natural Resources, Construction and Maintenance Occupations by Sex
| Occupation | Male | Female |
| Farming, Fishing & Forestry | 0 (0.0%) | 0 (0.0%) |
| Construction & Extraction | 0 (0.0%) | 0 (0.0%) |
| Installation, Maintenance & Repair | 0 (0.0%) | 0 (0.0%) |
| Total (Category) | 0 (0.0%) | 0 (0.0%) |
| Total (Overall) | 10 (50.0%) | 10 (50.0%) |
Production, Transportation and Moving Occupations
Production, Transportation and Moving Occupations by Sex
| Occupation | Male | Female |
| Production | 0 (0.0%) | 0 (0.0%) |
| Transportation | 0 (0.0%) | 0 (0.0%) |
| Material Moving | 0 (0.0%) | 0 (0.0%) |
| Total (Category) | 0 (0.0%) | 0 (0.0%) |
| Total (Overall) | 10 (50.0%) | 10 (50.0%) |
Employment Industries by Sex in Crystal Downs Country Club
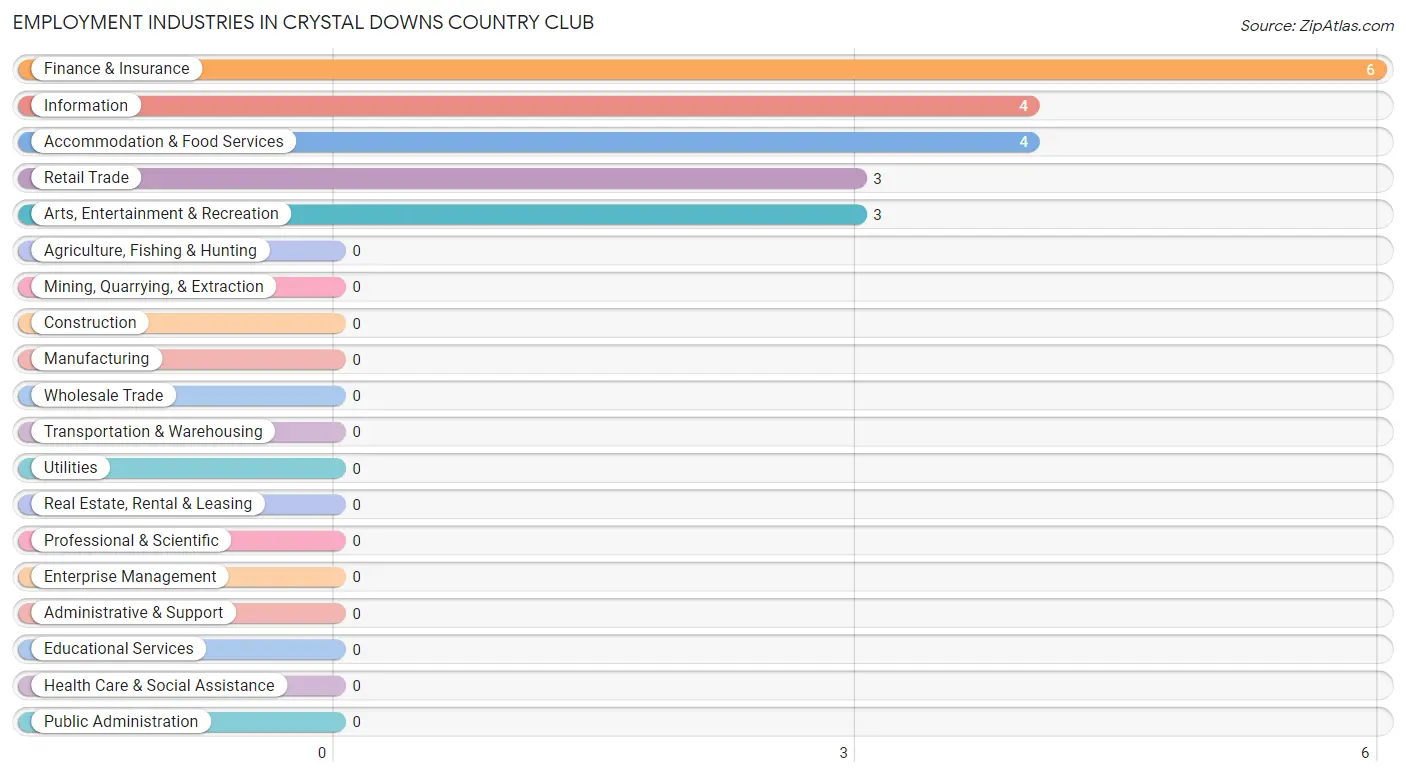
Employment Industries in Crystal Downs Country Club
The major employment industries in Crystal Downs Country Club include Finance & Insurance (6 | 30.0%), Information (4 | 20.0%), Accommodation & Food Services (4 | 20.0%), Retail Trade (3 | 15.0%), and Arts, Entertainment & Recreation (3 | 15.0%).
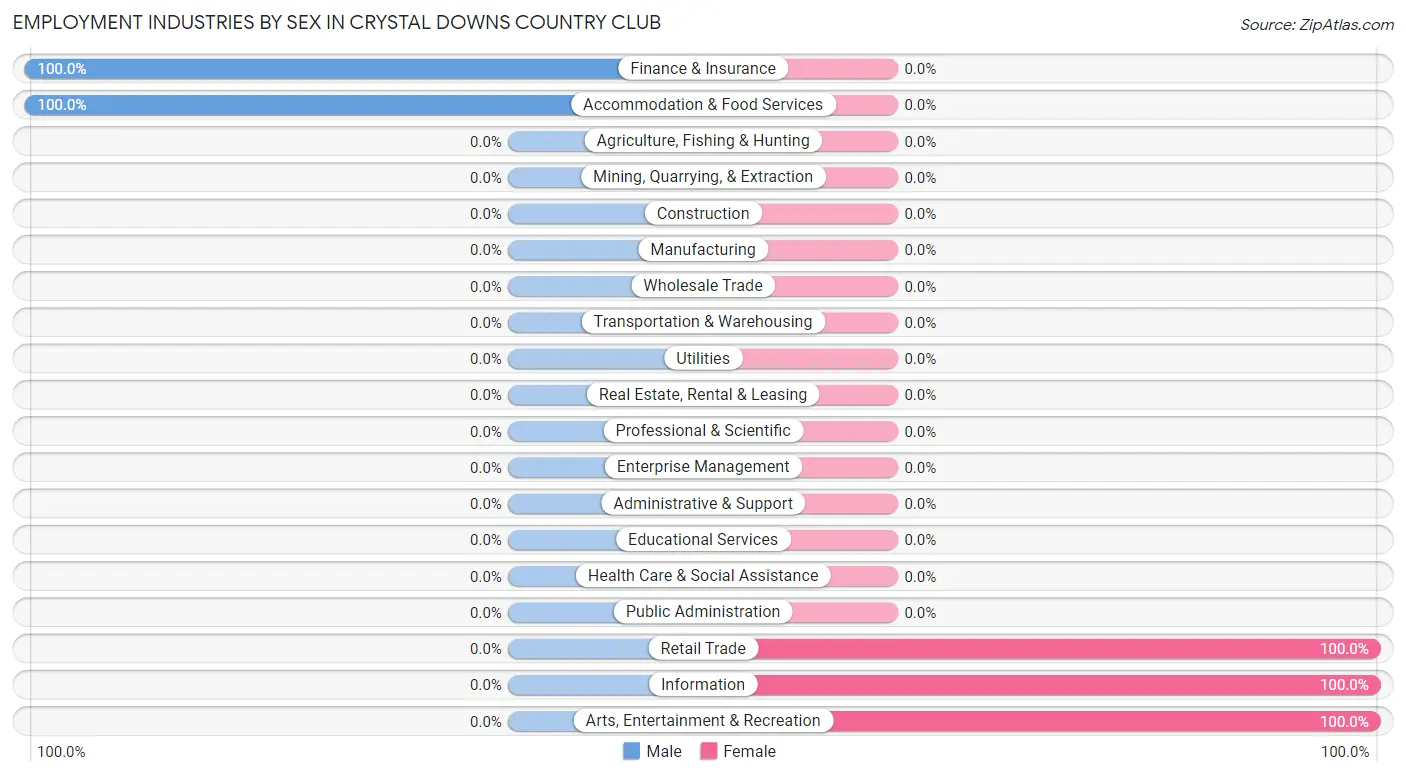
Employment Industries by Sex in Crystal Downs Country Club
The Crystal Downs Country Club industries that see more men than women are Finance & Insurance (100.0%), and Accommodation & Food Services (100.0%), whereas the industries that tend to have a higher number of women are Retail Trade (100.0%), Information (100.0%), and Arts, Entertainment & Recreation (100.0%).
| Industry | Male | Female |
| Agriculture, Fishing & Hunting | 0 (0.0%) | 0 (0.0%) |
| Mining, Quarrying, & Extraction | 0 (0.0%) | 0 (0.0%) |
| Construction | 0 (0.0%) | 0 (0.0%) |
| Manufacturing | 0 (0.0%) | 0 (0.0%) |
| Wholesale Trade | 0 (0.0%) | 0 (0.0%) |
| Retail Trade | 0 (0.0%) | 3 (100.0%) |
| Transportation & Warehousing | 0 (0.0%) | 0 (0.0%) |
| Utilities | 0 (0.0%) | 0 (0.0%) |
| Information | 0 (0.0%) | 4 (100.0%) |
| Finance & Insurance | 6 (100.0%) | 0 (0.0%) |
| Real Estate, Rental & Leasing | 0 (0.0%) | 0 (0.0%) |
| Professional & Scientific | 0 (0.0%) | 0 (0.0%) |
| Enterprise Management | 0 (0.0%) | 0 (0.0%) |
| Administrative & Support | 0 (0.0%) | 0 (0.0%) |
| Educational Services | 0 (0.0%) | 0 (0.0%) |
| Health Care & Social Assistance | 0 (0.0%) | 0 (0.0%) |
| Arts, Entertainment & Recreation | 0 (0.0%) | 3 (100.0%) |
| Accommodation & Food Services | 4 (100.0%) | 0 (0.0%) |
| Public Administration | 0 (0.0%) | 0 (0.0%) |
| Total | 10 (50.0%) | 10 (50.0%) |
Education in Crystal Downs Country Club
School Enrollment in Crystal Downs Country Club
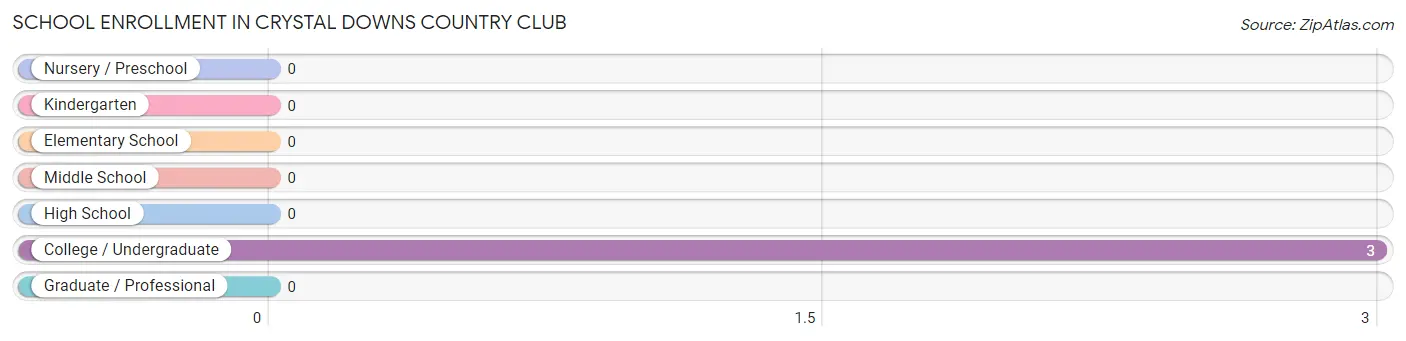
| School Level | # Students | % Students |
| Nursery / Preschool | 0 | 0.0% |
| Kindergarten | 0 | 0.0% |
| Elementary School | 0 | 0.0% |
| Middle School | 0 | 0.0% |
| High School | 0 | 0.0% |
| College / Undergraduate | 3 | 100.0% |
| Graduate / Professional | 0 | 0.0% |
| Total | 3 | 100.0% |
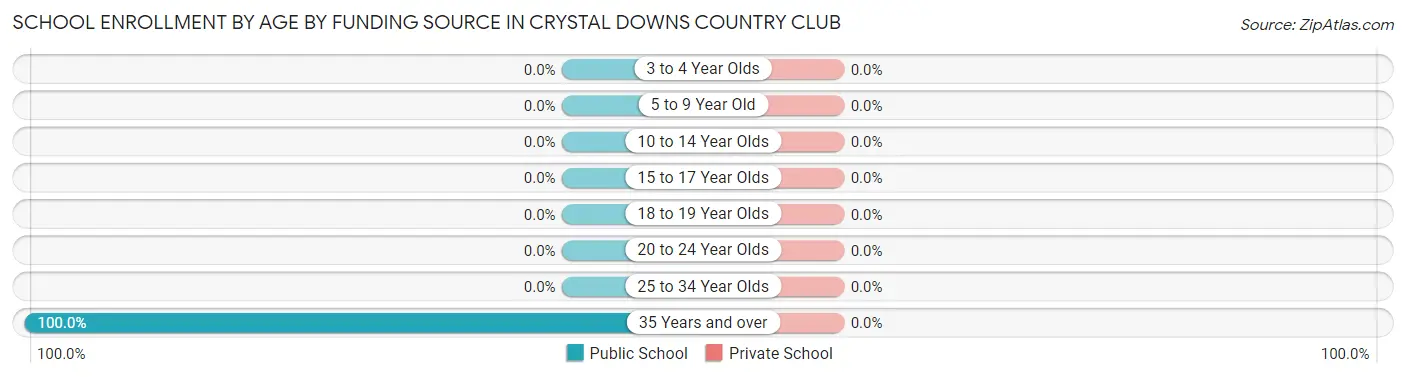
School Enrollment by Age by Funding Source in Crystal Downs Country Club
| Age Bracket | Public School | Private School |
| 3 to 4 Year Olds | 0 (0.0%) | 0 (0.0%) |
| 5 to 9 Year Old | 0 (0.0%) | 0 (0.0%) |
| 10 to 14 Year Olds | 0 (0.0%) | 0 (0.0%) |
| 15 to 17 Year Olds | 0 (0.0%) | 0 (0.0%) |
| 18 to 19 Year Olds | 0 (0.0%) | 0 (0.0%) |
| 20 to 24 Year Olds | 0 (0.0%) | 0 (0.0%) |
| 25 to 34 Year Olds | 0 (0.0%) | 0 (0.0%) |
| 35 Years and over | 3 (100.0%) | 0 (0.0%) |
| Total | 3 (100.0%) | 0 (0.0%) |
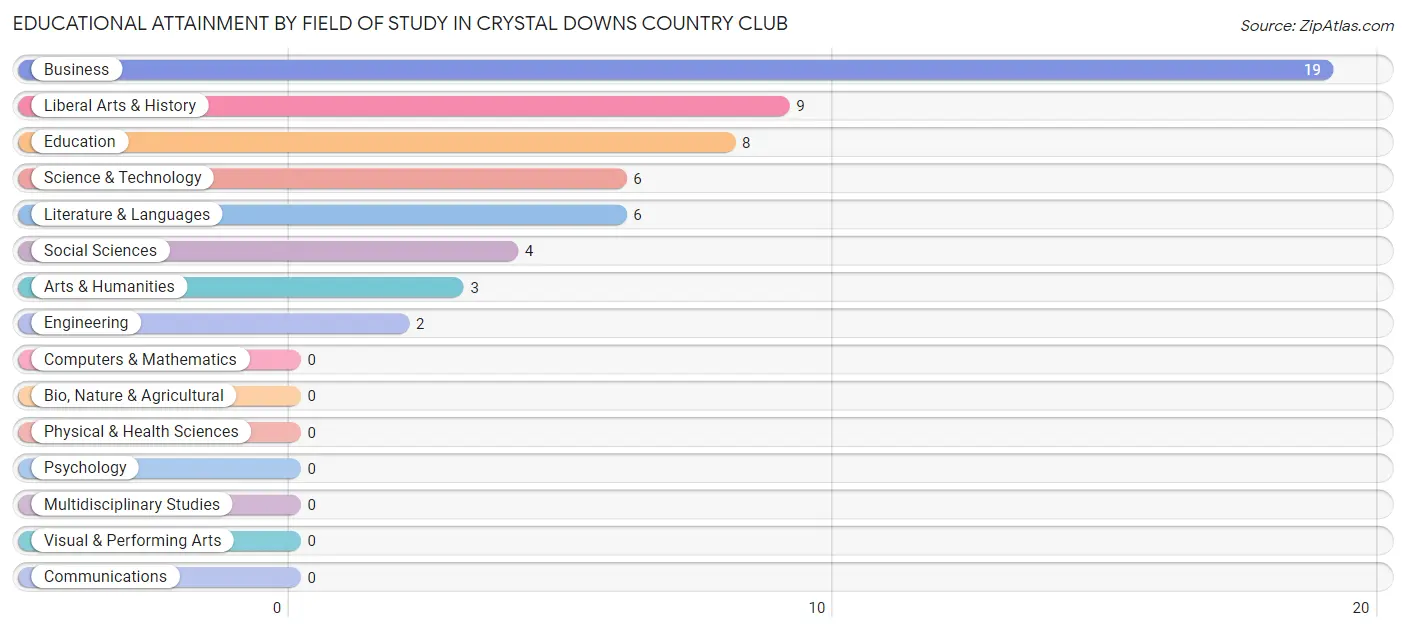
Educational Attainment by Field of Study in Crystal Downs Country Club
Business (19 | 33.3%), liberal arts & history (9 | 15.8%), education (8 | 14.0%), science & technology (6 | 10.5%), and literature & languages (6 | 10.5%) are the most common fields of study among 57 individuals in Crystal Downs Country Club who have obtained a bachelor's degree or higher.
| Field of Study | # Graduates | % Graduates |
| Computers & Mathematics | 0 | 0.0% |
| Bio, Nature & Agricultural | 0 | 0.0% |
| Physical & Health Sciences | 0 | 0.0% |
| Psychology | 0 | 0.0% |
| Social Sciences | 4 | 7.0% |
| Engineering | 2 | 3.5% |
| Multidisciplinary Studies | 0 | 0.0% |
| Science & Technology | 6 | 10.5% |
| Business | 19 | 33.3% |
| Education | 8 | 14.0% |
| Literature & Languages | 6 | 10.5% |
| Liberal Arts & History | 9 | 15.8% |
| Visual & Performing Arts | 0 | 0.0% |
| Communications | 0 | 0.0% |
| Arts & Humanities | 3 | 5.3% |
| Total | 57 | 100.0% |
Transportation & Commute in Crystal Downs Country Club
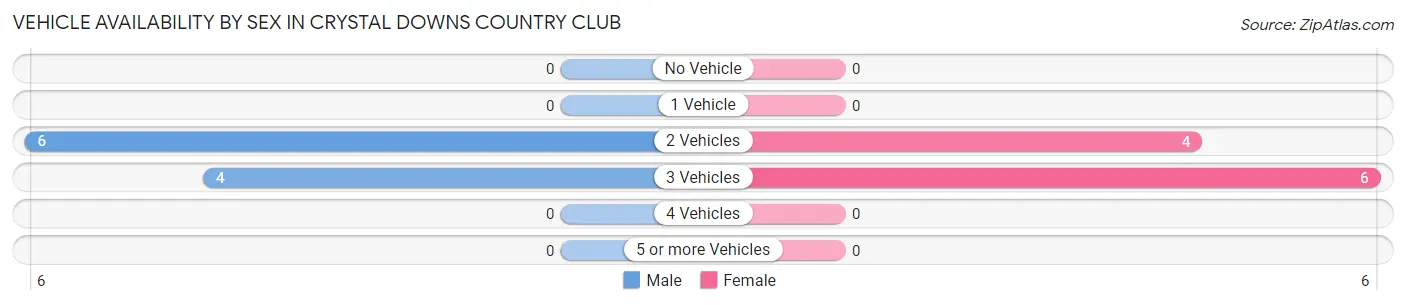
Vehicle Availability by Sex in Crystal Downs Country Club
The most prevalent vehicle ownership categories in Crystal Downs Country Club are males with 2 vehicles (6, accounting for 60.0%) and females with 2 vehicles (4, making up 60.0%).
| Vehicles Available | Male | Female |
| No Vehicle | 0 (0.0%) | 0 (0.0%) |
| 1 Vehicle | 0 (0.0%) | 0 (0.0%) |
| 2 Vehicles | 6 (60.0%) | 4 (40.0%) |
| 3 Vehicles | 4 (40.0%) | 6 (60.0%) |
| 4 Vehicles | 0 (0.0%) | 0 (0.0%) |
| 5 or more Vehicles | 0 (0.0%) | 0 (0.0%) |
| Total | 10 (100.0%) | 10 (100.0%) |
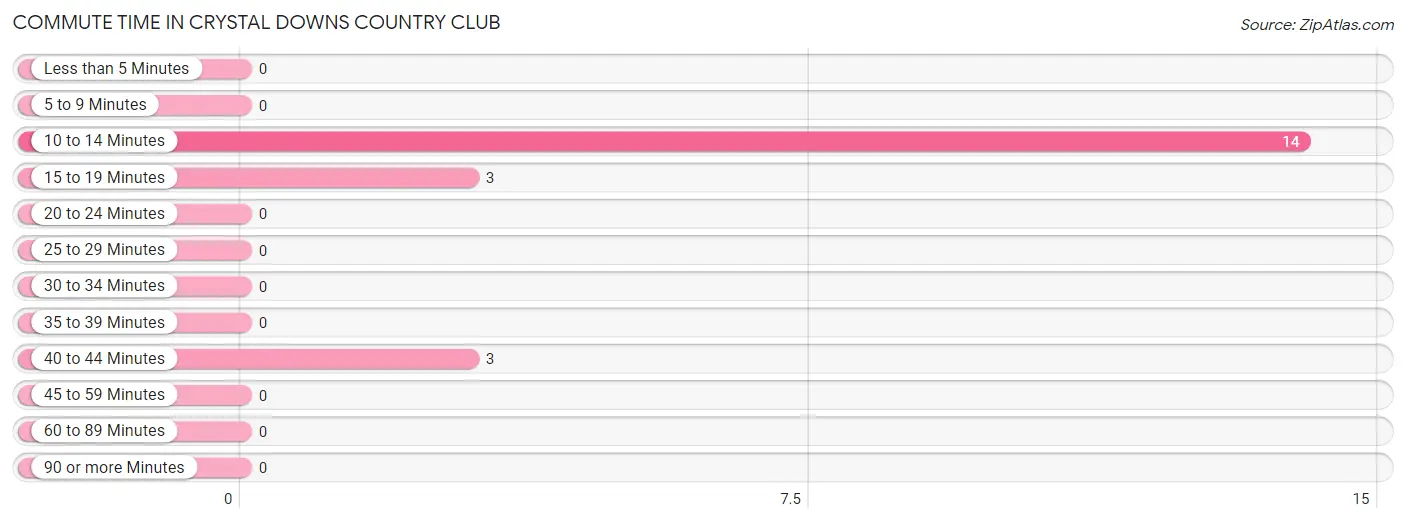
Commute Time in Crystal Downs Country Club
The most frequently occuring commute durations in Crystal Downs Country Club are 10 to 14 minutes (14 commuters, 70.0%), 15 to 19 minutes (3 commuters, 15.0%), and 40 to 44 minutes (3 commuters, 15.0%).
| Commute Time | # Commuters | % Commuters |
| Less than 5 Minutes | 0 | 0.0% |
| 5 to 9 Minutes | 0 | 0.0% |
| 10 to 14 Minutes | 14 | 70.0% |
| 15 to 19 Minutes | 3 | 15.0% |
| 20 to 24 Minutes | 0 | 0.0% |
| 25 to 29 Minutes | 0 | 0.0% |
| 30 to 34 Minutes | 0 | 0.0% |
| 35 to 39 Minutes | 0 | 0.0% |
| 40 to 44 Minutes | 3 | 15.0% |
| 45 to 59 Minutes | 0 | 0.0% |
| 60 to 89 Minutes | 0 | 0.0% |
| 90 or more Minutes | 0 | 0.0% |
Commute Time by Sex in Crystal Downs Country Club
The most common commute times in Crystal Downs Country Club are 10 to 14 minutes (7 commuters, 70.0%) for males and 10 to 14 minutes (7 commuters, 70.0%) for females.
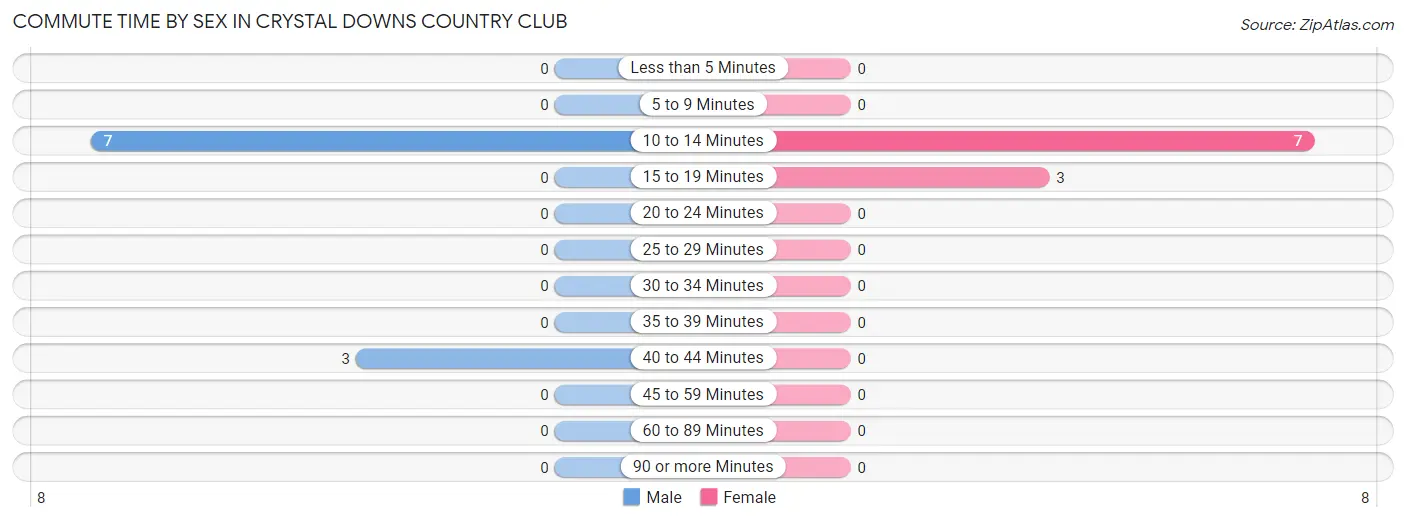
| Commute Time | Male | Female |
| Less than 5 Minutes | 0 (0.0%) | 0 (0.0%) |
| 5 to 9 Minutes | 0 (0.0%) | 0 (0.0%) |
| 10 to 14 Minutes | 7 (70.0%) | 7 (70.0%) |
| 15 to 19 Minutes | 0 (0.0%) | 3 (30.0%) |
| 20 to 24 Minutes | 0 (0.0%) | 0 (0.0%) |
| 25 to 29 Minutes | 0 (0.0%) | 0 (0.0%) |
| 30 to 34 Minutes | 0 (0.0%) | 0 (0.0%) |
| 35 to 39 Minutes | 0 (0.0%) | 0 (0.0%) |
| 40 to 44 Minutes | 3 (30.0%) | 0 (0.0%) |
| 45 to 59 Minutes | 0 (0.0%) | 0 (0.0%) |
| 60 to 89 Minutes | 0 (0.0%) | 0 (0.0%) |
| 90 or more Minutes | 0 (0.0%) | 0 (0.0%) |
Time of Departure to Work by Sex in Crystal Downs Country Club
The most frequent times of departure to work in Crystal Downs Country Club are 5:00 AM to 5:29 AM (6, 60.0%) for males and 5:00 AM to 5:29 AM (4, 40.0%) for females.
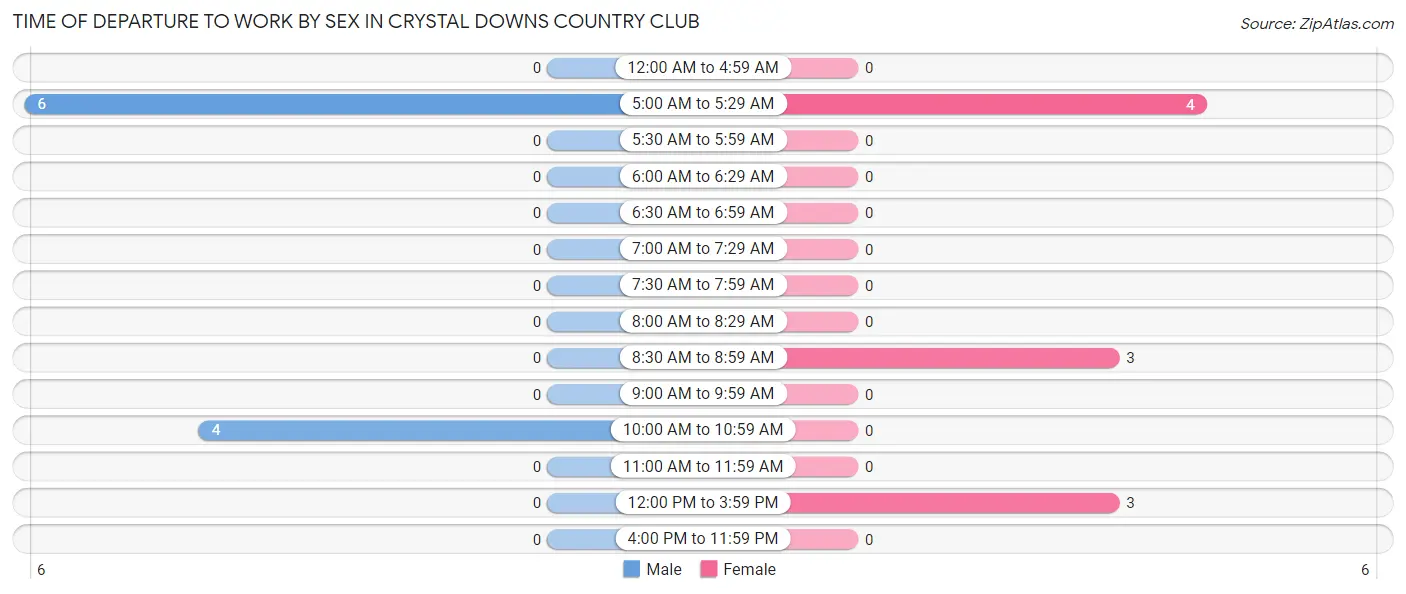
| Time of Departure | Male | Female |
| 12:00 AM to 4:59 AM | 0 (0.0%) | 0 (0.0%) |
| 5:00 AM to 5:29 AM | 6 (60.0%) | 4 (40.0%) |
| 5:30 AM to 5:59 AM | 0 (0.0%) | 0 (0.0%) |
| 6:00 AM to 6:29 AM | 0 (0.0%) | 0 (0.0%) |
| 6:30 AM to 6:59 AM | 0 (0.0%) | 0 (0.0%) |
| 7:00 AM to 7:29 AM | 0 (0.0%) | 0 (0.0%) |
| 7:30 AM to 7:59 AM | 0 (0.0%) | 0 (0.0%) |
| 8:00 AM to 8:29 AM | 0 (0.0%) | 0 (0.0%) |
| 8:30 AM to 8:59 AM | 0 (0.0%) | 3 (30.0%) |
| 9:00 AM to 9:59 AM | 0 (0.0%) | 0 (0.0%) |
| 10:00 AM to 10:59 AM | 4 (40.0%) | 0 (0.0%) |
| 11:00 AM to 11:59 AM | 0 (0.0%) | 0 (0.0%) |
| 12:00 PM to 3:59 PM | 0 (0.0%) | 3 (30.0%) |
| 4:00 PM to 11:59 PM | 0 (0.0%) | 0 (0.0%) |
| Total | 10 (100.0%) | 10 (100.0%) |
Housing Occupancy in Crystal Downs Country Club
Occupancy by Ownership in Crystal Downs Country Club
Of the total 33 dwellings in Crystal Downs Country Club, owner-occupied units account for 33 (100.0%), while renter-occupied units make up 0 (0.0%).
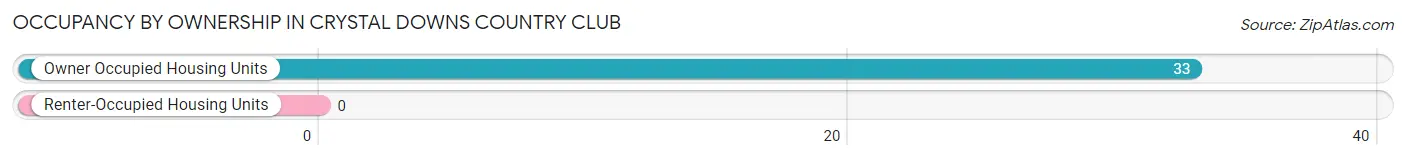
| Occupancy | # Housing Units | % Housing Units |
| Owner Occupied Housing Units | 33 | 100.0% |
| Renter-Occupied Housing Units | 0 | 0.0% |
| Total Occupied Housing Units | 33 | 100.0% |
Occupancy by Household Size in Crystal Downs Country Club
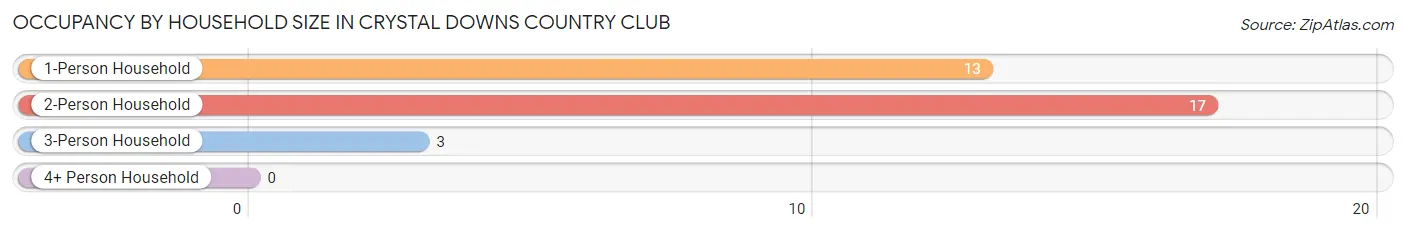
| Household Size | # Housing Units | % Housing Units |
| 1-Person Household | 13 | 39.4% |
| 2-Person Household | 17 | 51.5% |
| 3-Person Household | 3 | 9.1% |
| 4+ Person Household | 0 | 0.0% |
| Total Housing Units | 33 | 100.0% |
Occupancy by Ownership by Household Size in Crystal Downs Country Club
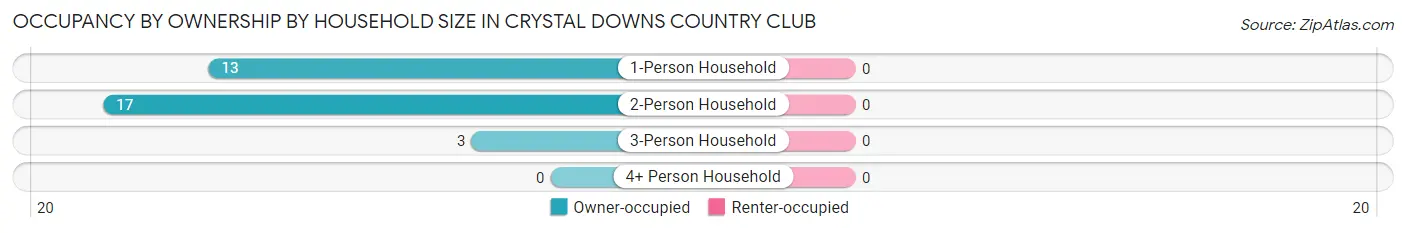
| Household Size | Owner-occupied | Renter-occupied |
| 1-Person Household | 13 (100.0%) | 0 (0.0%) |
| 2-Person Household | 17 (100.0%) | 0 (0.0%) |
| 3-Person Household | 3 (100.0%) | 0 (0.0%) |
| 4+ Person Household | 0 (0.0%) | 0 (0.0%) |
| Total Housing Units | 33 (100.0%) | 0 (0.0%) |
Occupancy by Educational Attainment in Crystal Downs Country Club
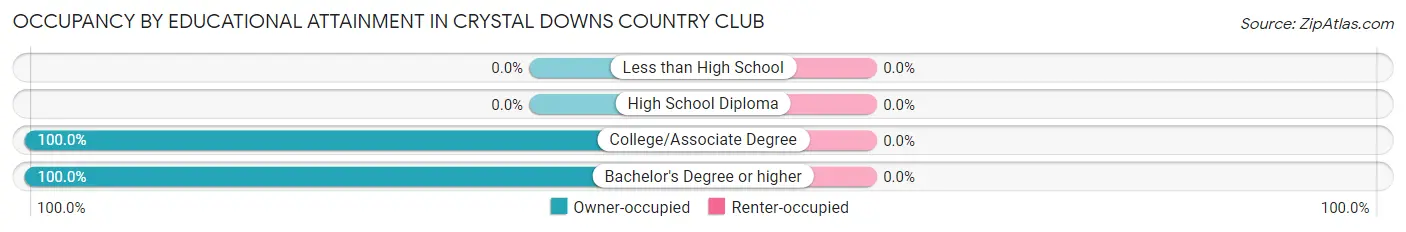
| Household Size | Owner-occupied | Renter-occupied |
| Less than High School | 0 (0.0%) | 0 (0.0%) |
| High School Diploma | 0 (0.0%) | 0 (0.0%) |
| College/Associate Degree | 4 (100.0%) | 0 (0.0%) |
| Bachelor's Degree or higher | 29 (100.0%) | 0 (0.0%) |
Occupancy by Age of Householder in Crystal Downs Country Club
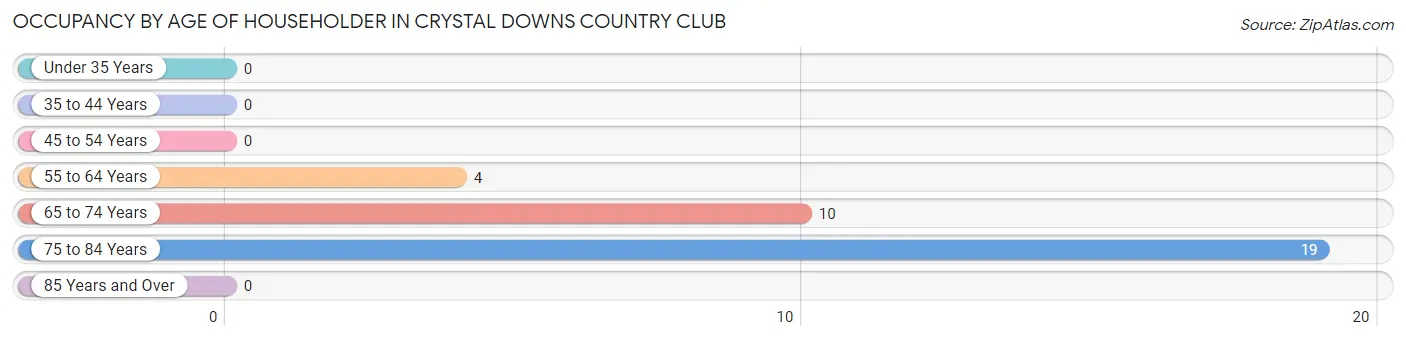
| Age Bracket | # Households | % Households |
| Under 35 Years | 0 | 0.0% |
| 35 to 44 Years | 0 | 0.0% |
| 45 to 54 Years | 0 | 0.0% |
| 55 to 64 Years | 4 | 12.1% |
| 65 to 74 Years | 10 | 30.3% |
| 75 to 84 Years | 19 | 57.6% |
| 85 Years and Over | 0 | 0.0% |
| Total | 33 | 100.0% |
Housing Finances in Crystal Downs Country Club
Median Income by Occupancy in Crystal Downs Country Club
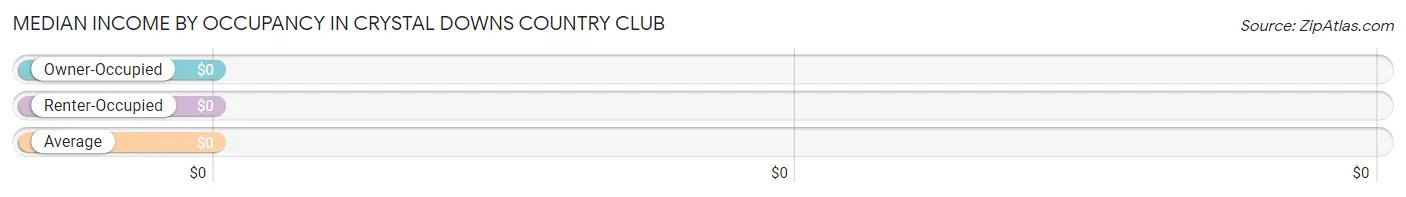
| Occupancy Type | # Households | Median Income |
| Owner-Occupied | 33 (100.0%) | $0 |
| Renter-Occupied | 0 (0.0%) | $0 |
| Average | 33 (100.0%) | $0 |
Occupancy by Householder Income Bracket in Crystal Downs Country Club
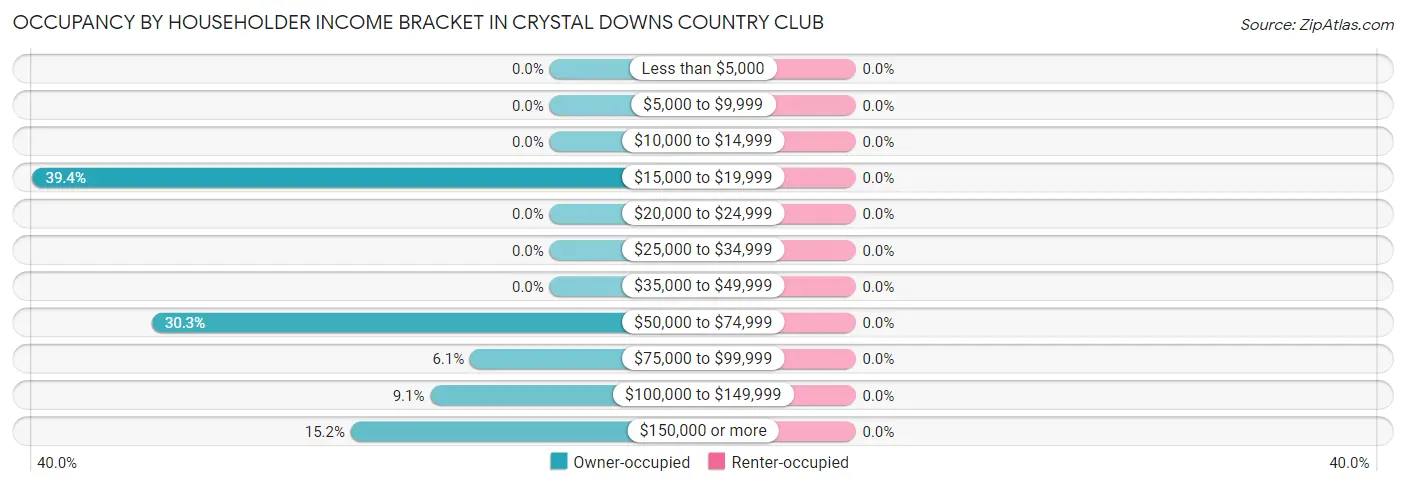
| Income Bracket | Owner-occupied | Renter-occupied |
| Less than $5,000 | 0 (0.0%) | 0 (0.0%) |
| $5,000 to $9,999 | 0 (0.0%) | 0 (0.0%) |
| $10,000 to $14,999 | 0 (0.0%) | 0 (0.0%) |
| $15,000 to $19,999 | 13 (39.4%) | 0 (0.0%) |
| $20,000 to $24,999 | 0 (0.0%) | 0 (0.0%) |
| $25,000 to $34,999 | 0 (0.0%) | 0 (0.0%) |
| $35,000 to $49,999 | 0 (0.0%) | 0 (0.0%) |
| $50,000 to $74,999 | 10 (30.3%) | 0 (0.0%) |
| $75,000 to $99,999 | 2 (6.1%) | 0 (0.0%) |
| $100,000 to $149,999 | 3 (9.1%) | 0 (0.0%) |
| $150,000 or more | 5 (15.1%) | 0 (0.0%) |
| Total | 33 (100.0%) | 0 (0.0%) |
Monthly Housing Cost Tiers in Crystal Downs Country Club
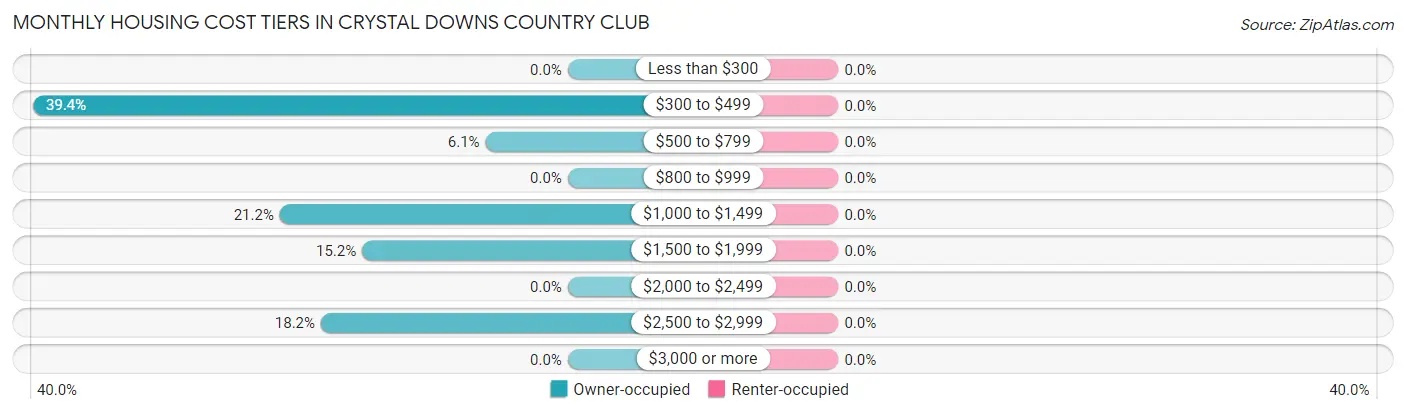
| Monthly Cost | Owner-occupied | Renter-occupied |
| Less than $300 | 0 (0.0%) | 0 (0.0%) |
| $300 to $499 | 13 (39.4%) | 0 (0.0%) |
| $500 to $799 | 2 (6.1%) | 0 (0.0%) |
| $800 to $999 | 0 (0.0%) | 0 (0.0%) |
| $1,000 to $1,499 | 7 (21.2%) | 0 (0.0%) |
| $1,500 to $1,999 | 5 (15.1%) | 0 (0.0%) |
| $2,000 to $2,499 | 0 (0.0%) | 0 (0.0%) |
| $2,500 to $2,999 | 6 (18.2%) | 0 (0.0%) |
| $3,000 or more | 0 (0.0%) | 0 (0.0%) |
| Total | 33 (100.0%) | 0 (0.0%) |
Physical Housing Characteristics in Crystal Downs Country Club
Housing Structures in Crystal Downs Country Club
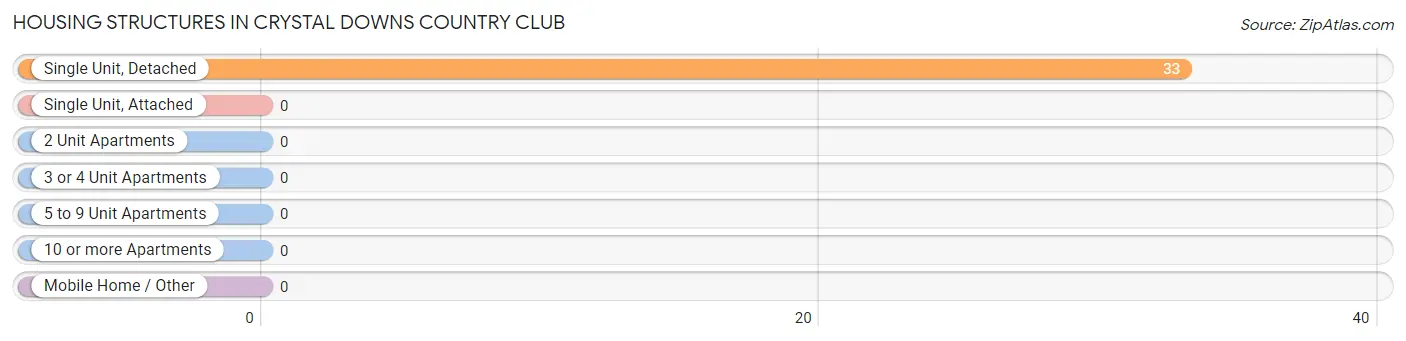
| Structure Type | # Housing Units | % Housing Units |
| Single Unit, Detached | 33 | 100.0% |
| Single Unit, Attached | 0 | 0.0% |
| 2 Unit Apartments | 0 | 0.0% |
| 3 or 4 Unit Apartments | 0 | 0.0% |
| 5 to 9 Unit Apartments | 0 | 0.0% |
| 10 or more Apartments | 0 | 0.0% |
| Mobile Home / Other | 0 | 0.0% |
| Total | 33 | 100.0% |
Housing Structures by Occupancy in Crystal Downs Country Club
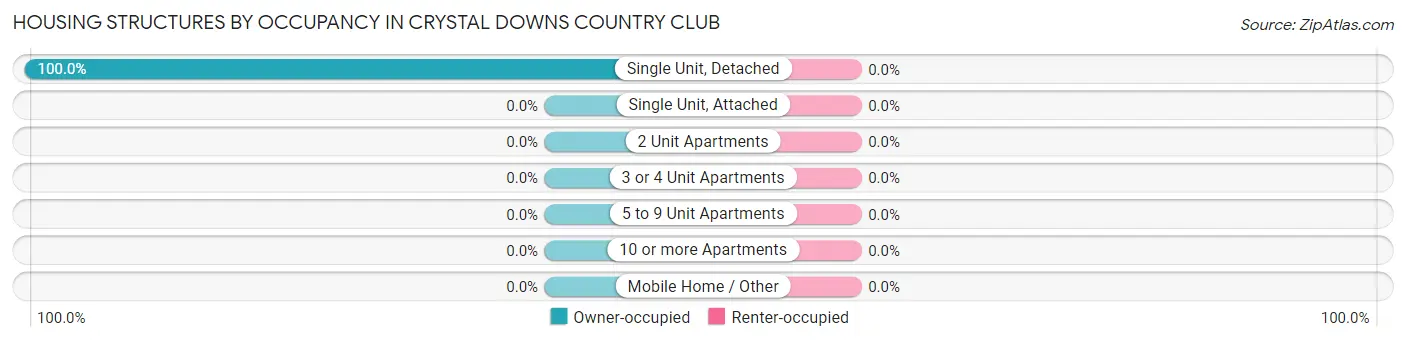
| Structure Type | Owner-occupied | Renter-occupied |
| Single Unit, Detached | 33 (100.0%) | 0 (0.0%) |
| Single Unit, Attached | 0 (0.0%) | 0 (0.0%) |
| 2 Unit Apartments | 0 (0.0%) | 0 (0.0%) |
| 3 or 4 Unit Apartments | 0 (0.0%) | 0 (0.0%) |
| 5 to 9 Unit Apartments | 0 (0.0%) | 0 (0.0%) |
| 10 or more Apartments | 0 (0.0%) | 0 (0.0%) |
| Mobile Home / Other | 0 (0.0%) | 0 (0.0%) |
| Total | 33 (100.0%) | 0 (0.0%) |
Housing Structures by Number of Rooms in Crystal Downs Country Club
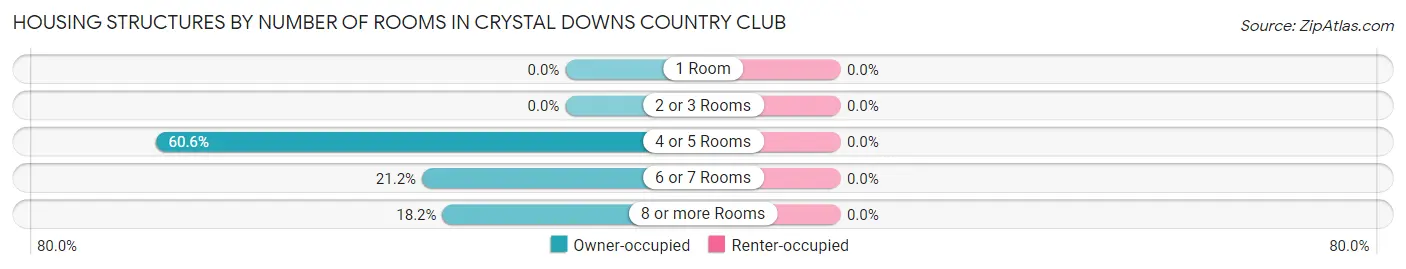
| Number of Rooms | Owner-occupied | Renter-occupied |
| 1 Room | 0 (0.0%) | 0 (0.0%) |
| 2 or 3 Rooms | 0 (0.0%) | 0 (0.0%) |
| 4 or 5 Rooms | 20 (60.6%) | 0 (0.0%) |
| 6 or 7 Rooms | 7 (21.2%) | 0 (0.0%) |
| 8 or more Rooms | 6 (18.2%) | 0 (0.0%) |
| Total | 33 (100.0%) | 0 (0.0%) |
Housing Structure by Heating Type in Crystal Downs Country Club
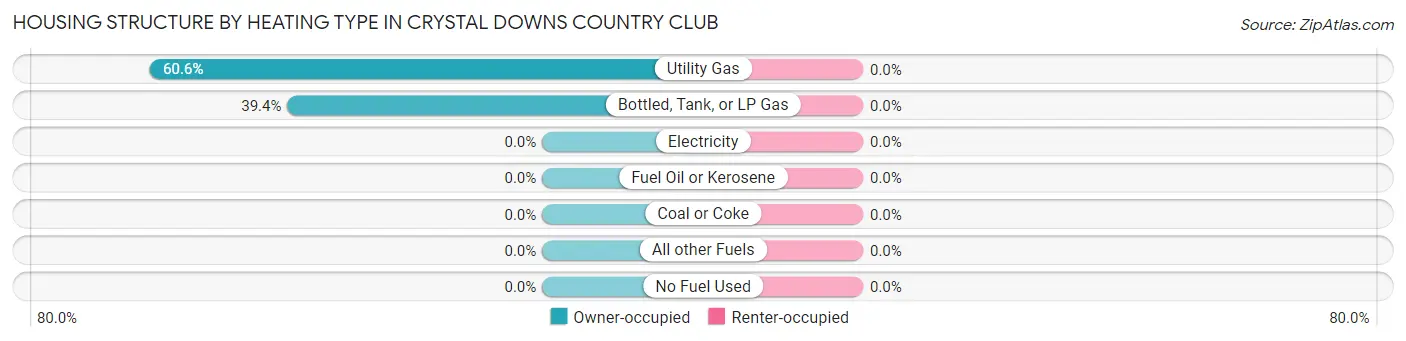
| Heating Type | Owner-occupied | Renter-occupied |
| Utility Gas | 20 (60.6%) | 0 (0.0%) |
| Bottled, Tank, or LP Gas | 13 (39.4%) | 0 (0.0%) |
| Electricity | 0 (0.0%) | 0 (0.0%) |
| Fuel Oil or Kerosene | 0 (0.0%) | 0 (0.0%) |
| Coal or Coke | 0 (0.0%) | 0 (0.0%) |
| All other Fuels | 0 (0.0%) | 0 (0.0%) |
| No Fuel Used | 0 (0.0%) | 0 (0.0%) |
| Total | 33 (100.0%) | 0 (0.0%) |
Household Vehicle Usage in Crystal Downs Country Club
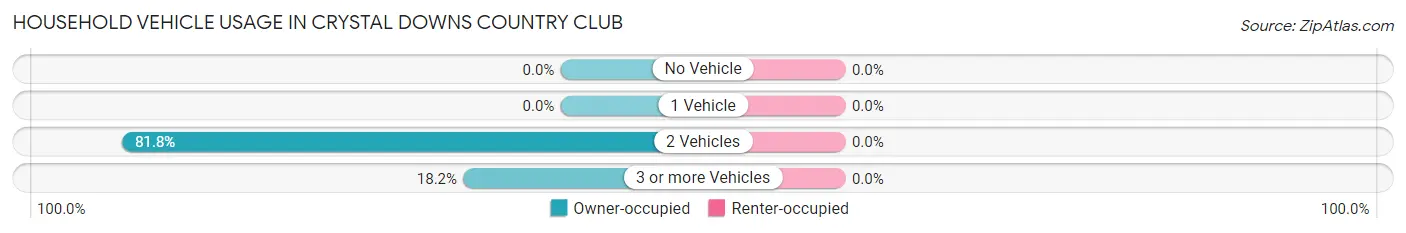
| Vehicles per Household | Owner-occupied | Renter-occupied |
| No Vehicle | 0 (0.0%) | 0 (0.0%) |
| 1 Vehicle | 0 (0.0%) | 0 (0.0%) |
| 2 Vehicles | 27 (81.8%) | 0 (0.0%) |
| 3 or more Vehicles | 6 (18.2%) | 0 (0.0%) |
| Total | 33 (100.0%) | 0 (0.0%) |
Real Estate & Mortgages in Crystal Downs Country Club
Real Estate and Mortgage Overview in Crystal Downs Country Club
| Characteristic | Without Mortgage | With Mortgage |
| Housing Units | 28 | 5 |
| Median Property Value | $916,700 | $0 |
| Median Household Income | - | - |
| Monthly Housing Costs | - | - |
| Real Estate Taxes | $5,417 | $0 |
Property Value by Mortgage Status in Crystal Downs Country Club
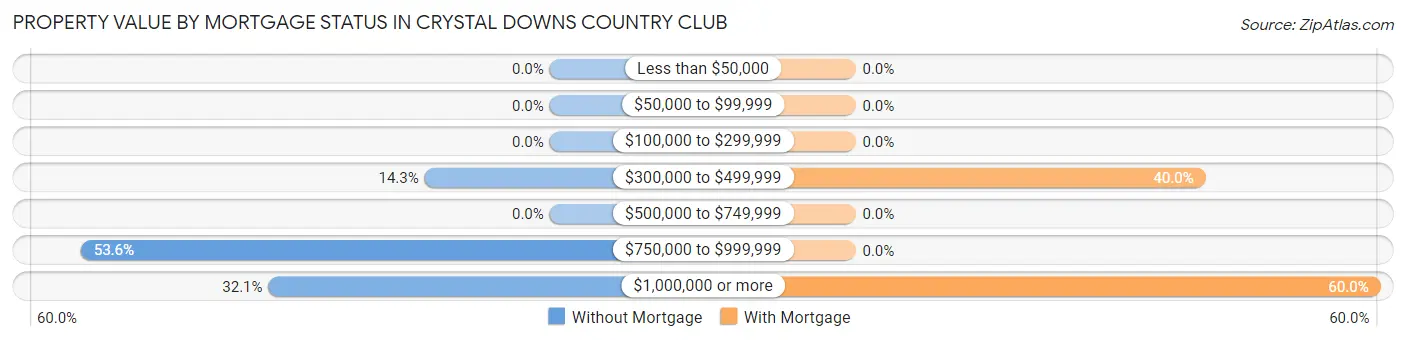
| Property Value | Without Mortgage | With Mortgage |
| Less than $50,000 | 0 (0.0%) | 0 (0.0%) |
| $50,000 to $99,999 | 0 (0.0%) | 0 (0.0%) |
| $100,000 to $299,999 | 0 (0.0%) | 0 (0.0%) |
| $300,000 to $499,999 | 4 (14.3%) | 2 (40.0%) |
| $500,000 to $749,999 | 0 (0.0%) | 0 (0.0%) |
| $750,000 to $999,999 | 15 (53.6%) | 0 (0.0%) |
| $1,000,000 or more | 9 (32.1%) | 3 (60.0%) |
| Total | 28 (100.0%) | 5 (100.0%) |
Household Income by Mortgage Status in Crystal Downs Country Club
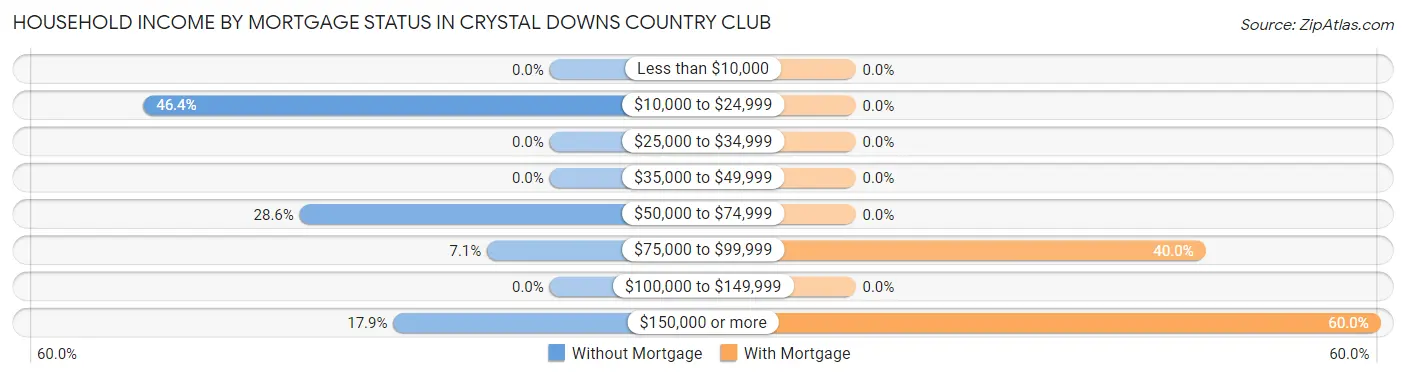
| Household Income | Without Mortgage | With Mortgage |
| Less than $10,000 | 0 (0.0%) | 0 (0.0%) |
| $10,000 to $24,999 | 13 (46.4%) | 0 (0.0%) |
| $25,000 to $34,999 | 0 (0.0%) | 0 (0.0%) |
| $35,000 to $49,999 | 0 (0.0%) | 0 (0.0%) |
| $50,000 to $74,999 | 8 (28.6%) | 0 (0.0%) |
| $75,000 to $99,999 | 2 (7.1%) | 2 (40.0%) |
| $100,000 to $149,999 | 0 (0.0%) | 0 (0.0%) |
| $150,000 or more | 5 (17.9%) | 3 (60.0%) |
| Total | 28 (100.0%) | 5 (100.0%) |
Property Value to Household Income Ratio in Crystal Downs Country Club
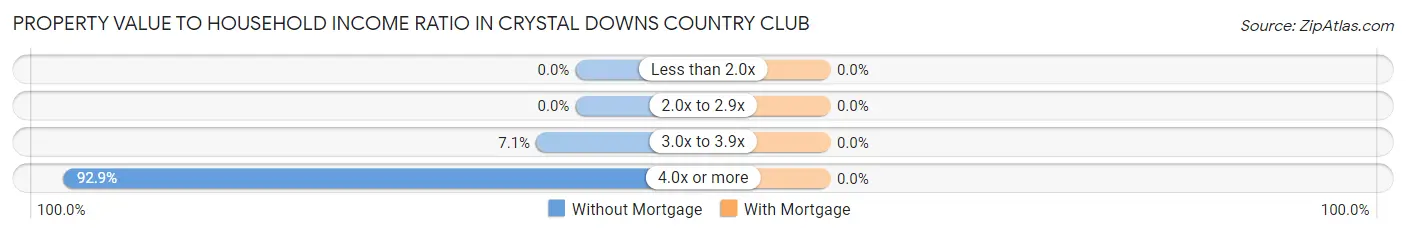
| Value-to-Income Ratio | Without Mortgage | With Mortgage |
| Less than 2.0x | 0 (0.0%) | 0 (0.0%) |
| 2.0x to 2.9x | 0 (0.0%) | 0 (0.0%) |
| 3.0x to 3.9x | 2 (7.1%) | 0 (0.0%) |
| 4.0x or more | 26 (92.9%) | 0 (0.0%) |
| Total | 28 (100.0%) | 5 (100.0%) |
Real Estate Taxes by Mortgage Status in Crystal Downs Country Club
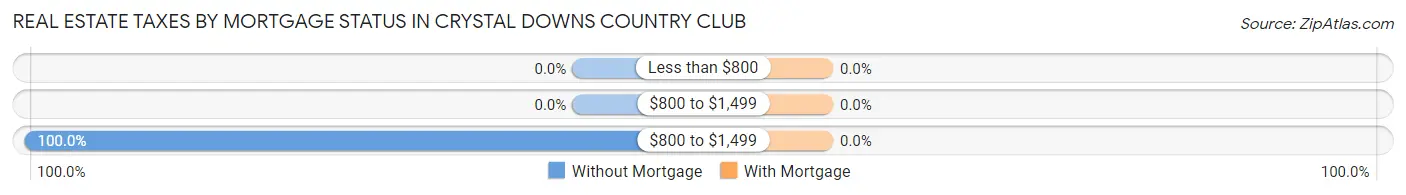
| Property Taxes | Without Mortgage | With Mortgage |
| Less than $800 | 0 (0.0%) | 0 (0.0%) |
| $800 to $1,499 | 0 (0.0%) | 0 (0.0%) |
| $800 to $1,499 | 28 (100.0%) | 0 (0.0%) |
| Total | 28 (100.0%) | 5 (100.0%) |
Health & Disability in Crystal Downs Country Club
Health Insurance Coverage by Age in Crystal Downs Country Club
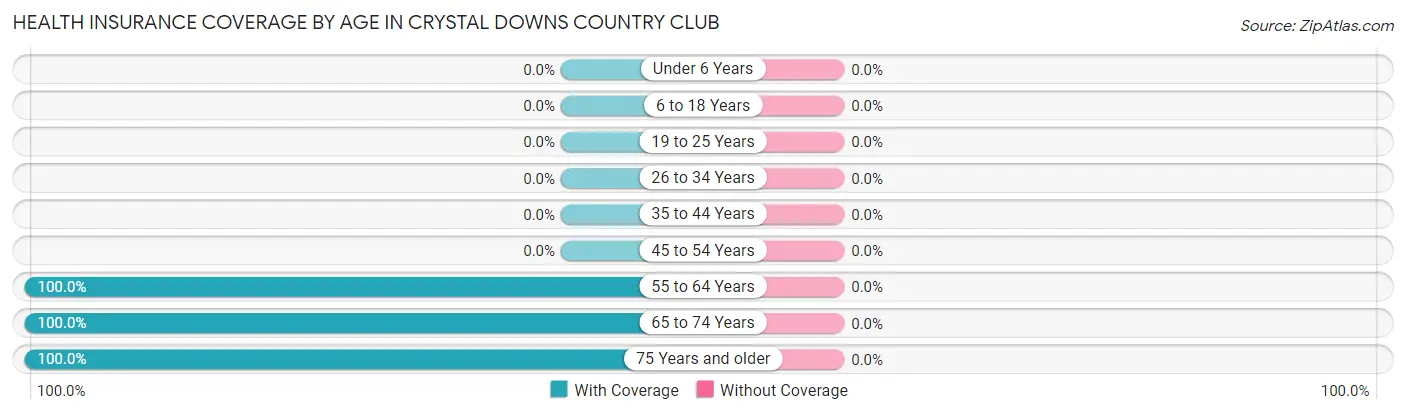
| Age Bracket | With Coverage | Without Coverage |
| Under 6 Years | 0 (0.0%) | 0 (0.0%) |
| 6 to 18 Years | 0 (0.0%) | 0 (0.0%) |
| 19 to 25 Years | 0 (0.0%) | 0 (0.0%) |
| 26 to 34 Years | 0 (0.0%) | 0 (0.0%) |
| 35 to 44 Years | 0 (0.0%) | 0 (0.0%) |
| 45 to 54 Years | 0 (0.0%) | 0 (0.0%) |
| 55 to 64 Years | 4 (100.0%) | 0 (0.0%) |
| 65 to 74 Years | 16 (100.0%) | 0 (0.0%) |
| 75 Years and older | 41 (100.0%) | 0 (0.0%) |
| Total | 61 (100.0%) | 0 (0.0%) |
Health Insurance Coverage by Citizenship Status in Crystal Downs Country Club
| Citizenship Status | With Coverage | Without Coverage |
| Native Born | 0 (0.0%) | 0 (0.0%) |
| Foreign Born, Citizen | 0 (0.0%) | 0 (0.0%) |
| Foreign Born, not a Citizen | 0 (0.0%) | 0 (0.0%) |
Health Insurance Coverage by Household Income in Crystal Downs Country Club
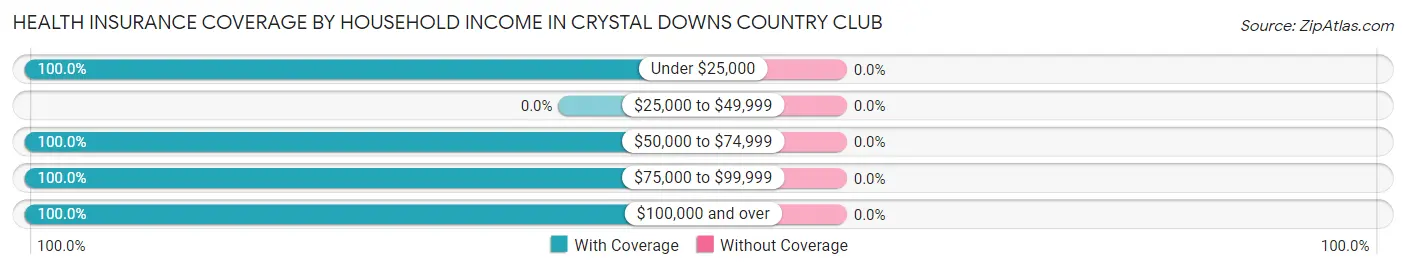
| Household Income | With Coverage | Without Coverage |
| Under $25,000 | 13 (100.0%) | 0 (0.0%) |
| $25,000 to $49,999 | 0 (0.0%) | 0 (0.0%) |
| $50,000 to $74,999 | 20 (100.0%) | 0 (0.0%) |
| $75,000 to $99,999 | 5 (100.0%) | 0 (0.0%) |
| $100,000 and over | 23 (100.0%) | 0 (0.0%) |
Public vs Private Health Insurance Coverage by Age in Crystal Downs Country Club
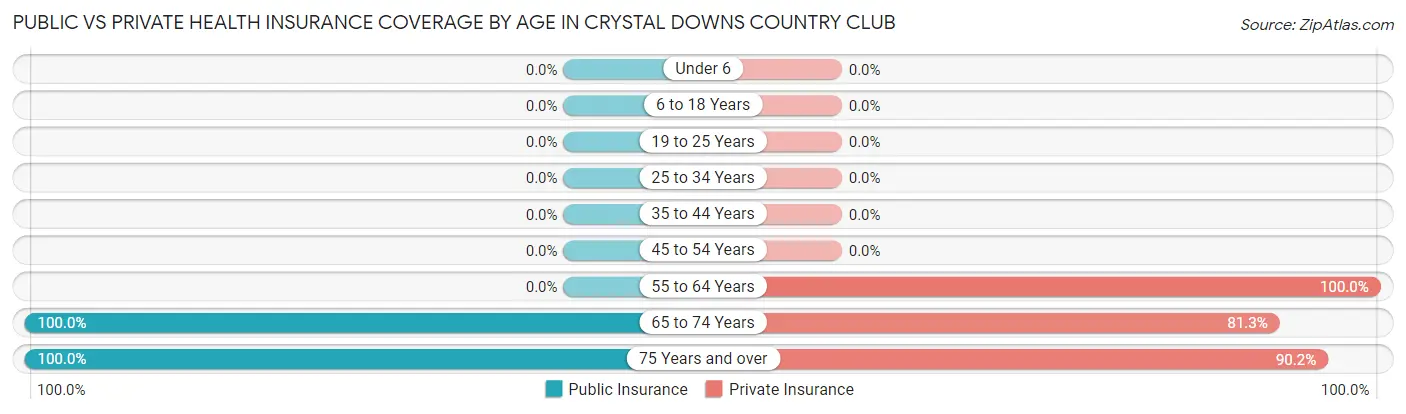
| Age Bracket | Public Insurance | Private Insurance |
| Under 6 | 0 (0.0%) | 0 (0.0%) |
| 6 to 18 Years | 0 (0.0%) | 0 (0.0%) |
| 19 to 25 Years | 0 (0.0%) | 0 (0.0%) |
| 25 to 34 Years | 0 (0.0%) | 0 (0.0%) |
| 35 to 44 Years | 0 (0.0%) | 0 (0.0%) |
| 45 to 54 Years | 0 (0.0%) | 0 (0.0%) |
| 55 to 64 Years | 0 (0.0%) | 4 (100.0%) |
| 65 to 74 Years | 16 (100.0%) | 13 (81.2%) |
| 75 Years and over | 41 (100.0%) | 37 (90.2%) |
| Total | 57 (93.4%) | 54 (88.5%) |
Disability Status by Sex by Age in Crystal Downs Country Club
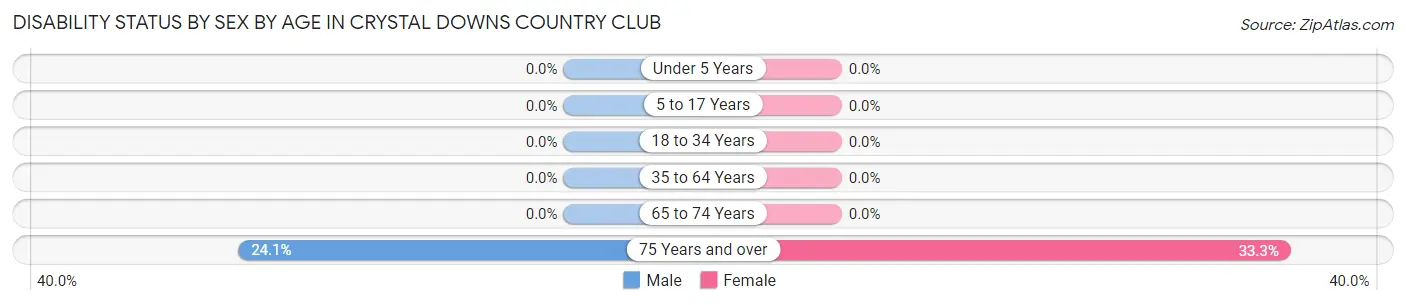
| Age Bracket | Male | Female |
| Under 5 Years | 0 (0.0%) | 0 (0.0%) |
| 5 to 17 Years | 0 (0.0%) | 0 (0.0%) |
| 18 to 34 Years | 0 (0.0%) | 0 (0.0%) |
| 35 to 64 Years | 0 (0.0%) | 0 (0.0%) |
| 65 to 74 Years | 0 (0.0%) | 0 (0.0%) |
| 75 Years and over | 7 (24.1%) | 4 (33.3%) |
Disability Class by Sex by Age in Crystal Downs Country Club
Disability Class: Hearing Difficulty
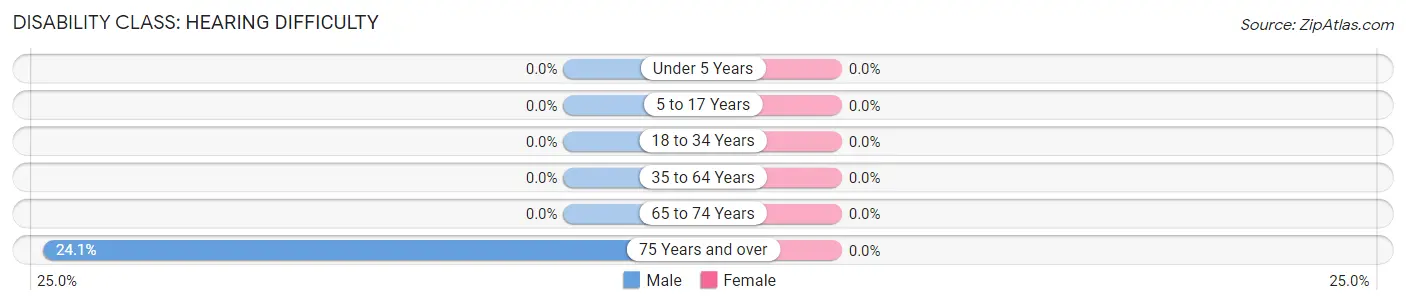
| Age Bracket | Male | Female |
| Under 5 Years | 0 (0.0%) | 0 (0.0%) |
| 5 to 17 Years | 0 (0.0%) | 0 (0.0%) |
| 18 to 34 Years | 0 (0.0%) | 0 (0.0%) |
| 35 to 64 Years | 0 (0.0%) | 0 (0.0%) |
| 65 to 74 Years | 0 (0.0%) | 0 (0.0%) |
| 75 Years and over | 7 (24.1%) | 0 (0.0%) |
Disability Class: Vision Difficulty
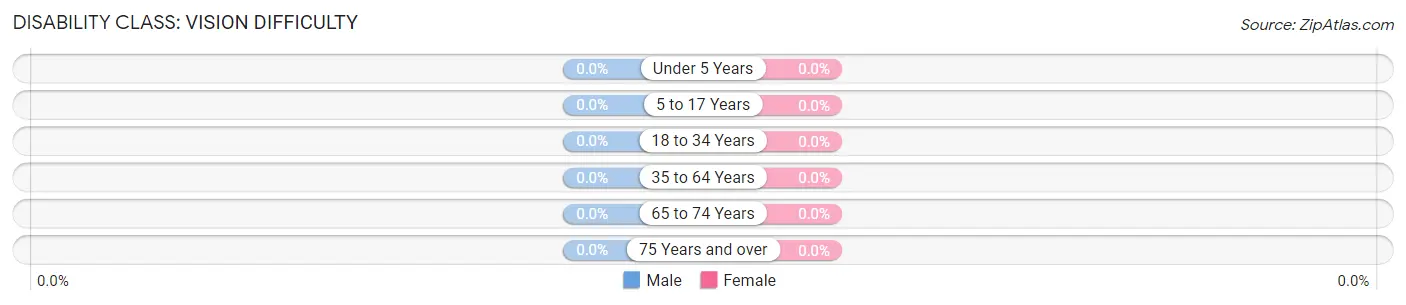
| Age Bracket | Male | Female |
| Under 5 Years | 0 (0.0%) | 0 (0.0%) |
| 5 to 17 Years | 0 (0.0%) | 0 (0.0%) |
| 18 to 34 Years | 0 (0.0%) | 0 (0.0%) |
| 35 to 64 Years | 0 (0.0%) | 0 (0.0%) |
| 65 to 74 Years | 0 (0.0%) | 0 (0.0%) |
| 75 Years and over | 0 (0.0%) | 0 (0.0%) |
Disability Class: Cognitive Difficulty
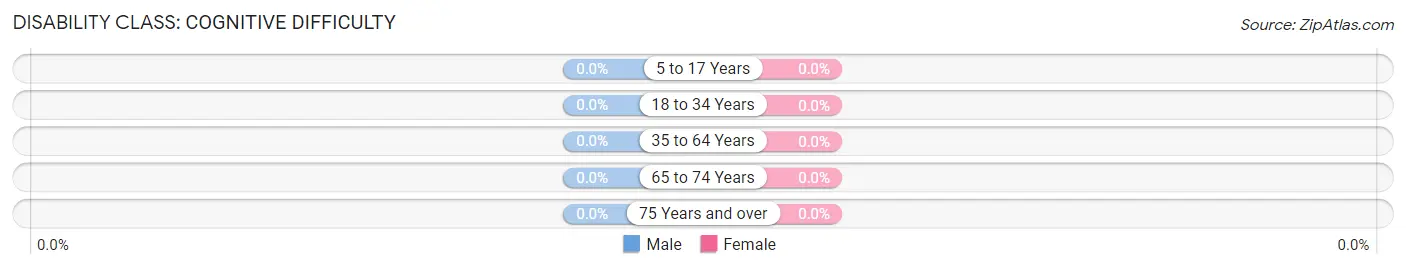
| Age Bracket | Male | Female |
| 5 to 17 Years | 0 (0.0%) | 0 (0.0%) |
| 18 to 34 Years | 0 (0.0%) | 0 (0.0%) |
| 35 to 64 Years | 0 (0.0%) | 0 (0.0%) |
| 65 to 74 Years | 0 (0.0%) | 0 (0.0%) |
| 75 Years and over | 0 (0.0%) | 0 (0.0%) |
Disability Class: Ambulatory Difficulty
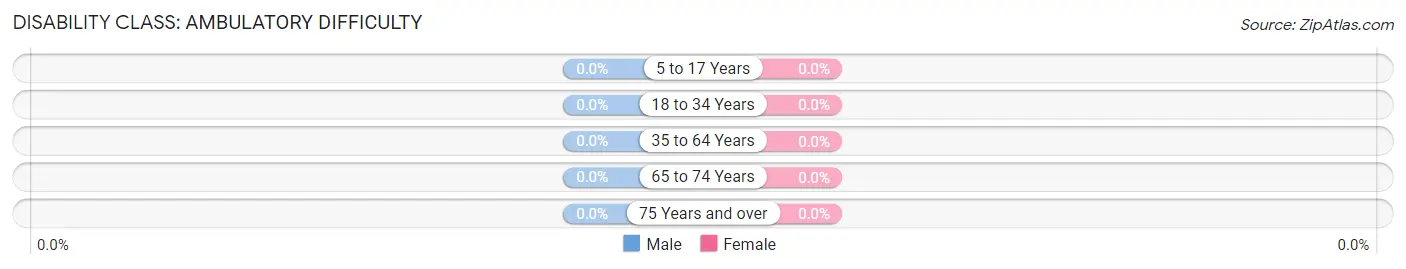
| Age Bracket | Male | Female |
| 5 to 17 Years | 0 (0.0%) | 0 (0.0%) |
| 18 to 34 Years | 0 (0.0%) | 0 (0.0%) |
| 35 to 64 Years | 0 (0.0%) | 0 (0.0%) |
| 65 to 74 Years | 0 (0.0%) | 0 (0.0%) |
| 75 Years and over | 0 (0.0%) | 0 (0.0%) |
Disability Class: Self-Care Difficulty
| Age Bracket | Male | Female |
| 5 to 17 Years | 0 (0.0%) | 0 (0.0%) |
| 18 to 34 Years | 0 (0.0%) | 0 (0.0%) |
| 35 to 64 Years | 0 (0.0%) | 0 (0.0%) |
| 65 to 74 Years | 0 (0.0%) | 0 (0.0%) |
| 75 Years and over | 0 (0.0%) | 0 (0.0%) |
Technology Access in Crystal Downs Country Club
Computing Device Access in Crystal Downs Country Club
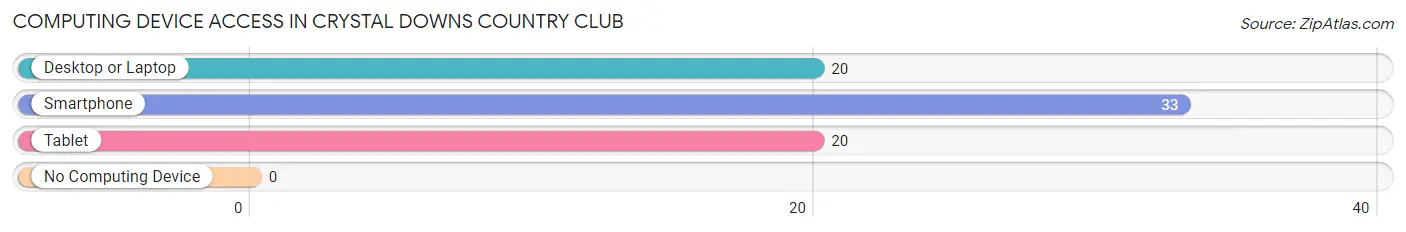
| Device Type | # Households | % Households |
| Desktop or Laptop | 20 | 60.6% |
| Smartphone | 33 | 100.0% |
| Tablet | 20 | 60.6% |
| No Computing Device | 0 | 0.0% |
| Total | 33 | 100.0% |
Internet Access in Crystal Downs Country Club
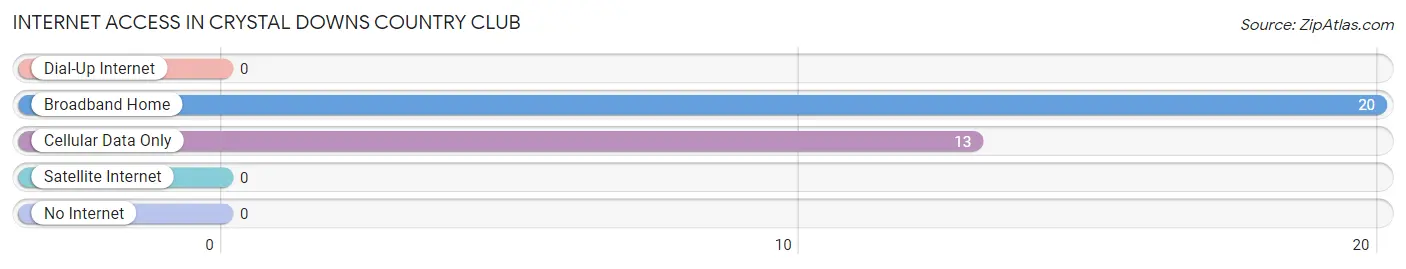
| Internet Type | # Households | % Households |
| Dial-Up Internet | 0 | 0.0% |
| Broadband Home | 20 | 60.6% |
| Cellular Data Only | 13 | 39.4% |
| Satellite Internet | 0 | 0.0% |
| No Internet | 0 | 0.0% |
| Total | 33 | 100.0% |
Crystal Downs Country Club Summary
History
The history of Crystal Downs Country Club in Michigan dates back to the early 1920s. The club was founded by a group of prominent businessmen from the area, including Charles T. Fisher, who was the president of the Fisher Body Company. The club was originally located in the small town of Frankfort, Michigan, but was moved to its current location in Arcadia Township in 1929.
The club was designed by renowned golf course architect Alister MacKenzie, who is best known for his work on Augusta National Golf Club and Cypress Point Club. MacKenzie was hired to design the course in 1929 and it opened for play in 1931. The course was designed to be a championship-level course, and it has hosted several major tournaments over the years, including the Michigan Open in 1932 and the Western Open in 1933.
The club has also hosted the Michigan Amateur Championship in 1934, the Michigan PGA Championship in 1935, and the Michigan Open in 1936. The club has also hosted the U.S. Women’s Open in 1967 and the U.S. Senior Open in 1988.
Geography
Crystal Downs Country Club is located in Arcadia Township, Michigan, which is in the northwest corner of the state. The club is situated on the shores of Lake Michigan, and is surrounded by rolling hills and forests. The course is located on a peninsula, which provides stunning views of the lake and the surrounding countryside.
The course is approximately 6,800 yards in length, and is a par 72. The course features several challenging holes, including the par-3 fourth hole, which is considered one of the most difficult holes in the state.
Economy
The economy of Arcadia Township is largely driven by tourism, as the area is a popular destination for golfers and outdoor enthusiasts. The Crystal Downs Country Club is one of the main attractions in the area, and it draws golfers from all over the country.
The club also hosts several tournaments throughout the year, which bring in additional revenue for the local economy. The club also employs a number of people, including groundskeepers, caddies, and other staff members.
Demographics
As of the 2010 census, the population of Arcadia Township was 2,845. The median age of the population was 44.7 years, and the median household income was $50,945. The racial makeup of the township was 94.3% White, 1.2% African American, 0.3% Native American, 0.7% Asian, and 3.5% from other races.
Conclusion
Crystal Downs Country Club is a historic golf course located in Arcadia Township, Michigan. The course was designed by renowned golf course architect Alister MacKenzie, and it has hosted several major tournaments over the years. The club is a major attraction in the area, and it draws golfers from all over the country. The economy of Arcadia Township is largely driven by tourism, and the club employs a number of people and hosts several tournaments throughout the year. The population of Arcadia Township is largely white, with a median age of 44.7 years and a median household income of $50,945.
Common Questions
What is Per Capita Income in Crystal Downs Country Club?
Per Capita income in Crystal Downs Country Club is $44,766.
What is the Median Family Income in Crystal Downs Country Club?
Median Family Income in Crystal Downs Country Club is $75,000.
What is Income or Wage Gap in Crystal Downs Country Club?
Income or Wage Gap in Crystal Downs Country Club is 30.8%.
Women in Crystal Downs Country Club earn 69.2 cents for every dollar earned by a man.
What is Inequality or Gini Index in Crystal Downs Country Club?
Inequality or Gini Index in Crystal Downs Country Club is 0.48.
What is the Total Population of Crystal Downs Country Club?
Total Population of Crystal Downs Country Club is 61.
What is the Total Male Population of Crystal Downs Country Club?
Total Male Population of Crystal Downs Country Club is 35.
What is the Total Female Population of Crystal Downs Country Club?
Total Female Population of Crystal Downs Country Club is 26.
What is the Ratio of Males per 100 Females in Crystal Downs Country Club?
There are 134.62 Males per 100 Females in Crystal Downs Country Club.
What is the Ratio of Females per 100 Males in Crystal Downs Country Club?
There are 74.29 Females per 100 Males in Crystal Downs Country Club.
What is the Median Population Age in Crystal Downs Country Club?
Median Population Age in Crystal Downs Country Club is 77.7 Years.
What is the Average Family Size in Crystal Downs Country Club
Average Family Size in Crystal Downs Country Club is 2.4 People.
What is the Average Household Size in Crystal Downs Country Club
Average Household Size in Crystal Downs Country Club is 1.9 People.
How Large is the Labor Force in Crystal Downs Country Club?
There are 20 People in the Labor Forcein in Crystal Downs Country Club.
What is the Percentage of People in the Labor Force in Crystal Downs Country Club?
32.8% of People are in the Labor Force in Crystal Downs Country Club.