Sylvan Lake, MI Map & Demographics
Sylvan Lake Map
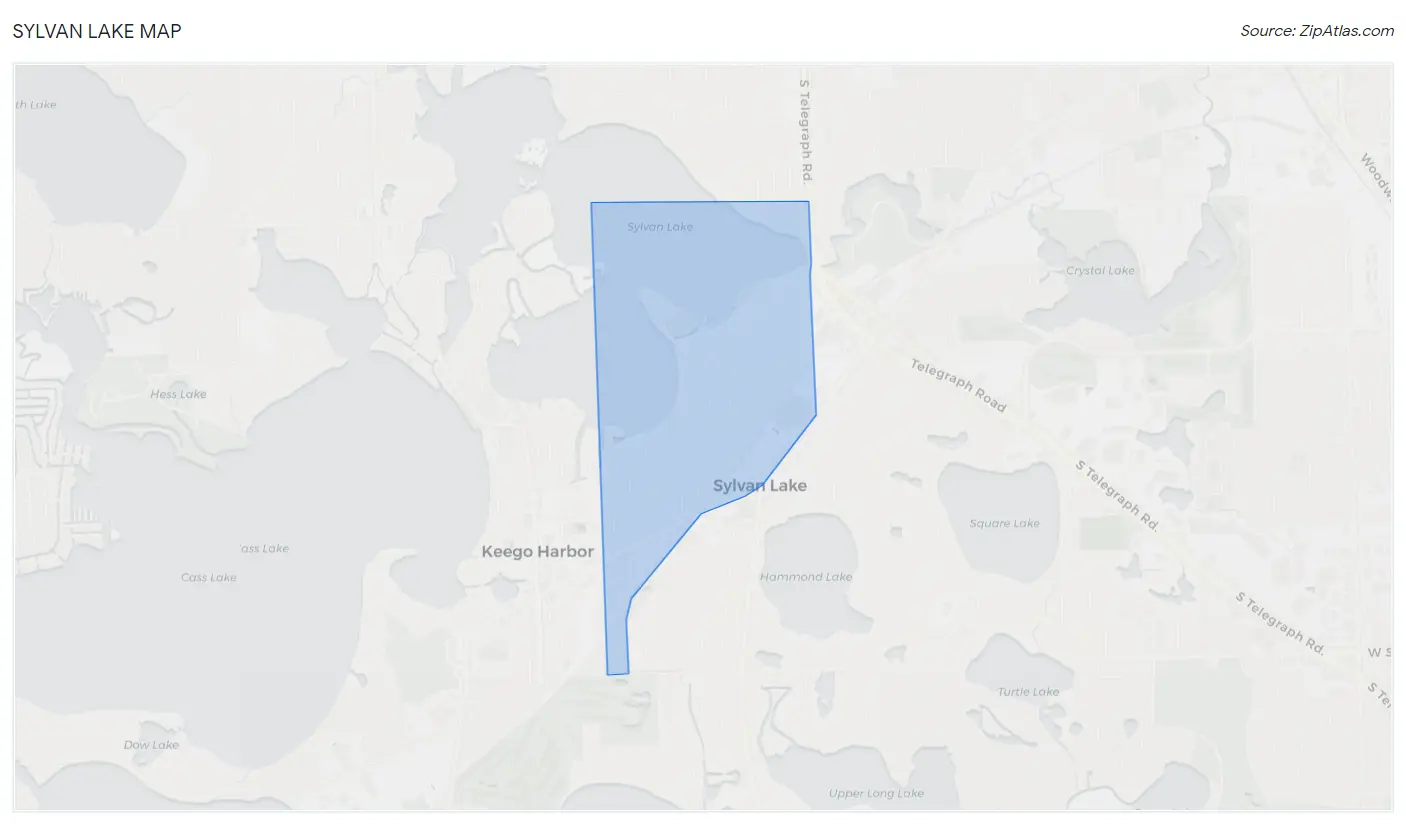
Sylvan Lake Overview
$77,967
PER CAPITA INCOME
$174,063
AVG FAMILY INCOME
$96,900
AVG HOUSEHOLD INCOME
6.1%
WAGE / INCOME GAP [ % ]
93.9¢/ $1
WAGE / INCOME GAP [ $ ]
0.52
INEQUALITY / GINI INDEX
1,729
TOTAL POPULATION
870
MALE POPULATION
859
FEMALE POPULATION
101.28
MALES / 100 FEMALES
98.74
FEMALES / 100 MALES
51.9
MEDIAN AGE
2.8
AVG FAMILY SIZE
2.0
AVG HOUSEHOLD SIZE
989
LABOR FORCE [ PEOPLE ]
64.2%
PERCENT IN LABOR FORCE
4.6%
UNEMPLOYMENT RATE
Sylvan Lake Area Codes
Income in Sylvan Lake
Income Overview in Sylvan Lake
Per Capita Income in Sylvan Lake is $77,967, while median incomes of families and households are $174,063 and $96,900 respectively.
| Characteristic | Number | Measure |
| Per Capita Income | 1,729 | $77,967 |
| Median Family Income | 449 | $174,063 |
| Mean Family Income | 449 | $243,155 |
| Median Household Income | 866 | $96,900 |
| Mean Household Income | 866 | $158,178 |
| Income Deficit | 449 | $0 |
| Wage / Income Gap (%) | 1,729 | 6.07% |
| Wage / Income Gap ($) | 1,729 | 93.93¢ per $1 |
| Gini / Inequality Index | 1,729 | 0.52 |
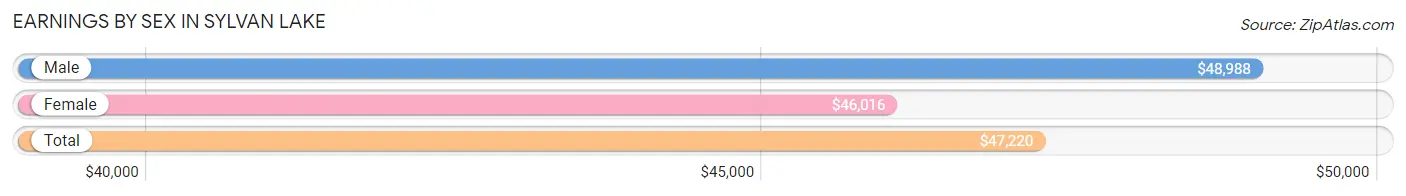
Earnings by Sex in Sylvan Lake
Average Earnings in Sylvan Lake are $47,220, $48,988 for men and $46,016 for women, a difference of 6.1%.
| Sex | Number | Average Earnings |
| Male | 635 (58.6%) | $48,988 |
| Female | 448 (41.4%) | $46,016 |
| Total | 1,083 (100.0%) | $47,220 |
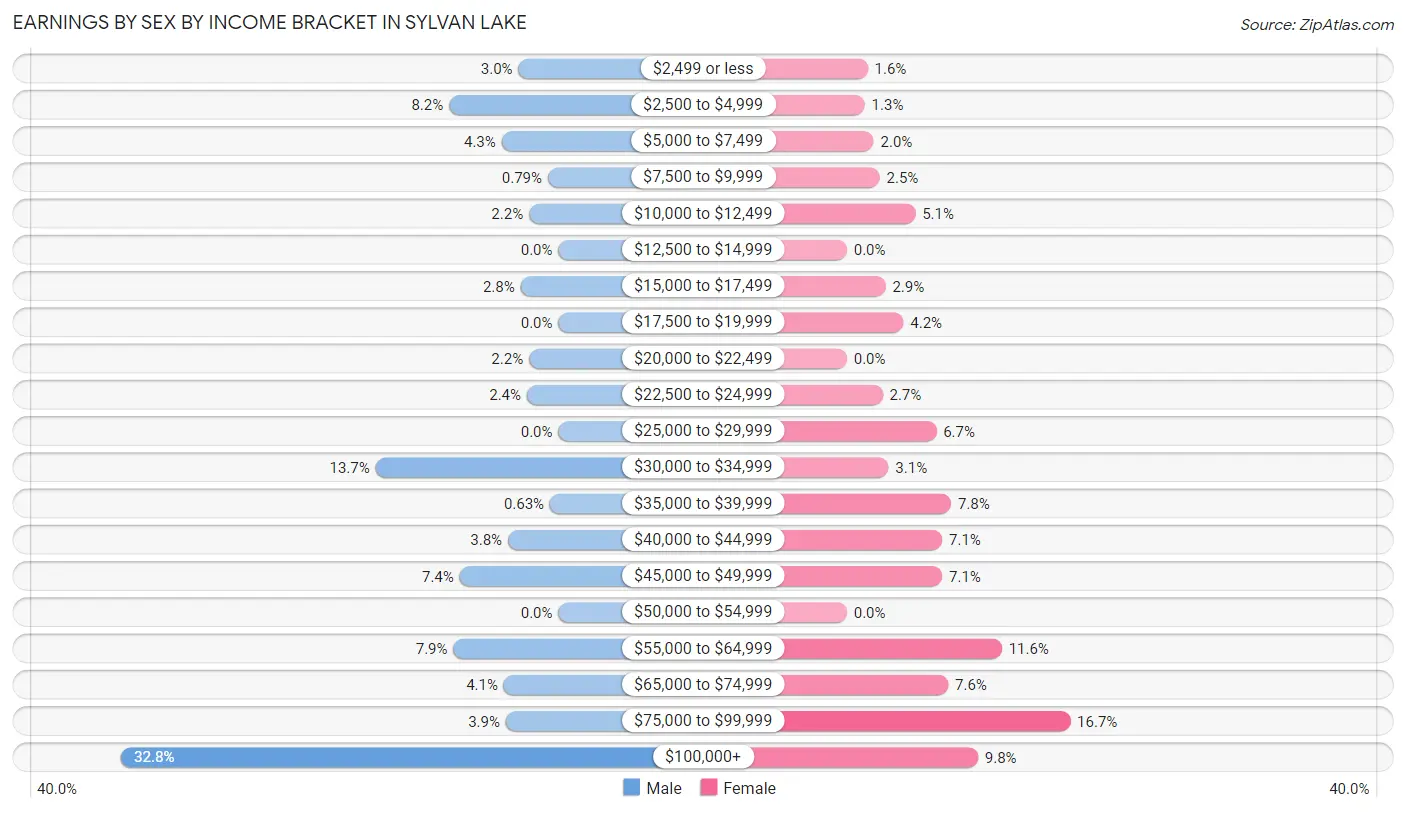
Earnings by Sex by Income Bracket in Sylvan Lake
The most common earnings brackets in Sylvan Lake are $100,000+ for men (208 | 32.8%) and $75,000 to $99,999 for women (75 | 16.7%).
| Income | Male | Female |
| $2,499 or less | 19 (3.0%) | 7 (1.6%) |
| $2,500 to $4,999 | 52 (8.2%) | 6 (1.3%) |
| $5,000 to $7,499 | 27 (4.3%) | 9 (2.0%) |
| $7,500 to $9,999 | 5 (0.8%) | 11 (2.5%) |
| $10,000 to $12,499 | 14 (2.2%) | 23 (5.1%) |
| $12,500 to $14,999 | 0 (0.0%) | 0 (0.0%) |
| $15,000 to $17,499 | 18 (2.8%) | 13 (2.9%) |
| $17,500 to $19,999 | 0 (0.0%) | 19 (4.2%) |
| $20,000 to $22,499 | 14 (2.2%) | 0 (0.0%) |
| $22,500 to $24,999 | 15 (2.4%) | 12 (2.7%) |
| $25,000 to $29,999 | 0 (0.0%) | 30 (6.7%) |
| $30,000 to $34,999 | 87 (13.7%) | 14 (3.1%) |
| $35,000 to $39,999 | 4 (0.6%) | 35 (7.8%) |
| $40,000 to $44,999 | 24 (3.8%) | 32 (7.1%) |
| $45,000 to $49,999 | 47 (7.4%) | 32 (7.1%) |
| $50,000 to $54,999 | 0 (0.0%) | 0 (0.0%) |
| $55,000 to $64,999 | 50 (7.9%) | 52 (11.6%) |
| $65,000 to $74,999 | 26 (4.1%) | 34 (7.6%) |
| $75,000 to $99,999 | 25 (3.9%) | 75 (16.7%) |
| $100,000+ | 208 (32.8%) | 44 (9.8%) |
| Total | 635 (100.0%) | 448 (100.0%) |
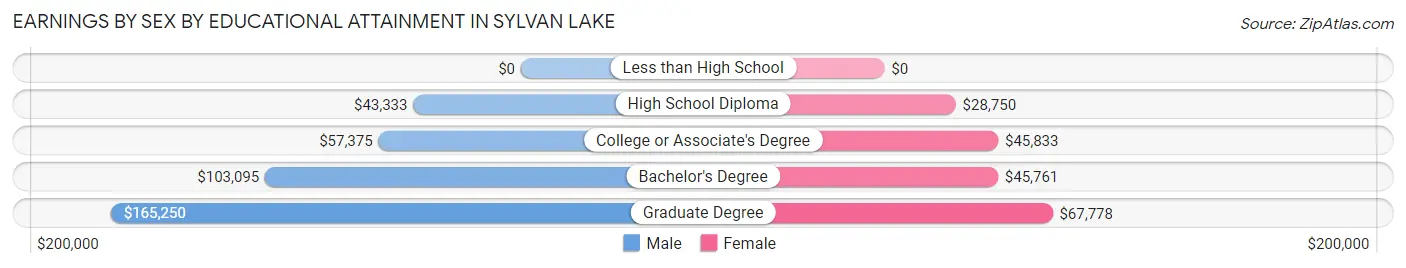
Earnings by Sex by Educational Attainment in Sylvan Lake
Average earnings in Sylvan Lake are $62,143 for men and $46,289 for women, a difference of 25.5%. Men with an educational attainment of graduate degree enjoy the highest average annual earnings of $165,250, while those with high school diploma education earn the least with $43,333. Women with an educational attainment of graduate degree earn the most with the average annual earnings of $67,778, while those with high school diploma education have the smallest earnings of $28,750.
| Educational Attainment | Male Income | Female Income |
| Less than High School | - | - |
| High School Diploma | $43,333 | $28,750 |
| College or Associate's Degree | $57,375 | $45,833 |
| Bachelor's Degree | $103,095 | $45,761 |
| Graduate Degree | $165,250 | $67,778 |
| Total | $62,143 | $46,289 |
Family Income in Sylvan Lake
Family Income Brackets in Sylvan Lake
According to the Sylvan Lake family income data, there are 193 families falling into the $200,000+ income range, which is the most common income bracket and makes up 43.0% of all families.
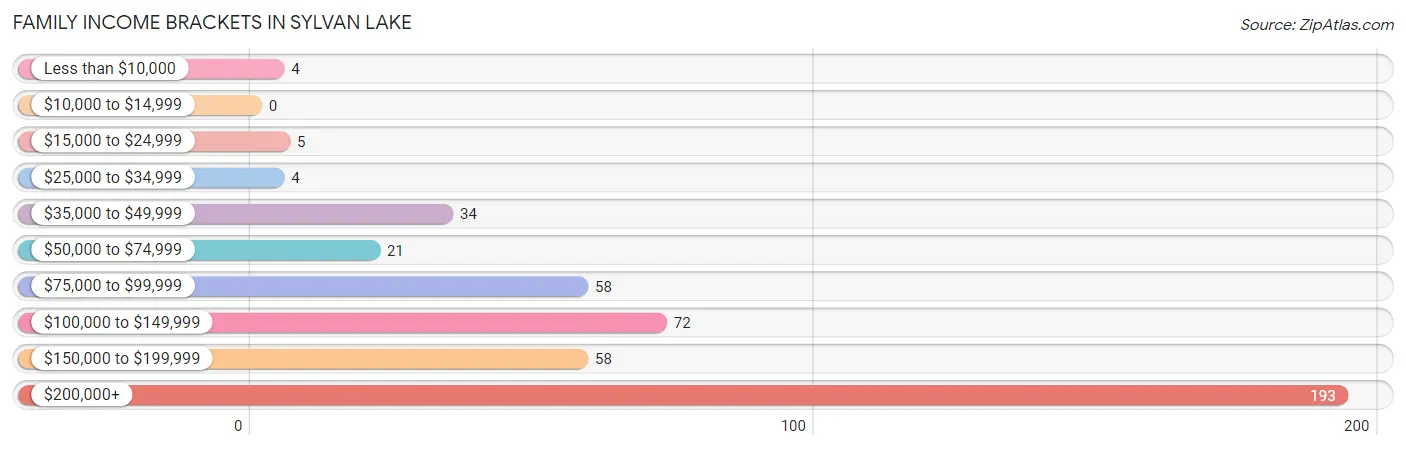
| Income Bracket | # Families | % Families |
| Less than $10,000 | 4 | 0.9% |
| $10,000 to $14,999 | 0 | 0.0% |
| $15,000 to $24,999 | 5 | 1.1% |
| $25,000 to $34,999 | 4 | 0.9% |
| $35,000 to $49,999 | 34 | 7.6% |
| $50,000 to $74,999 | 21 | 4.7% |
| $75,000 to $99,999 | 58 | 12.9% |
| $100,000 to $149,999 | 72 | 16.0% |
| $150,000 to $199,999 | 58 | 12.9% |
| $200,000+ | 193 | 43.0% |
Family Income by Famaliy Size in Sylvan Lake
3-person families (22 | 4.9%) account for the highest median family income in Sylvan Lake with $250,001 per family, while 3-person families (22 | 4.9%) have the highest median income of $83,334 per family member.
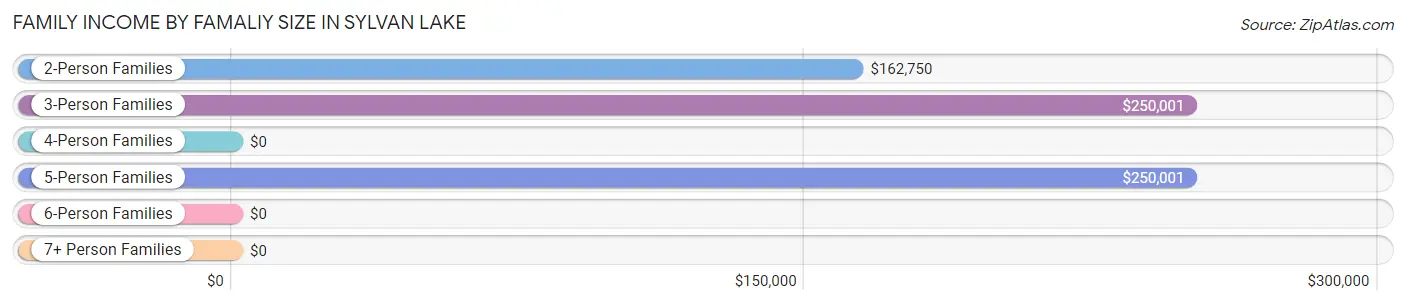
| Income Bracket | # Families | Median Income |
| 2-Person Families | 313 (69.7%) | $162,750 |
| 3-Person Families | 22 (4.9%) | $250,001 |
| 4-Person Families | 52 (11.6%) | $0 |
| 5-Person Families | 37 (8.2%) | $250,001 |
| 6-Person Families | 25 (5.6%) | $0 |
| 7+ Person Families | 0 (0.0%) | $0 |
| Total | 449 (100.0%) | $174,063 |
Family Income by Number of Earners in Sylvan Lake
The median family income in Sylvan Lake is $174,063, with families comprising 3+ earners (42) having the highest median family income of $250,001, while families with no earners (32) have the lowest median family income of $136,500, accounting for 9.3% and 7.1% of families, respectively.
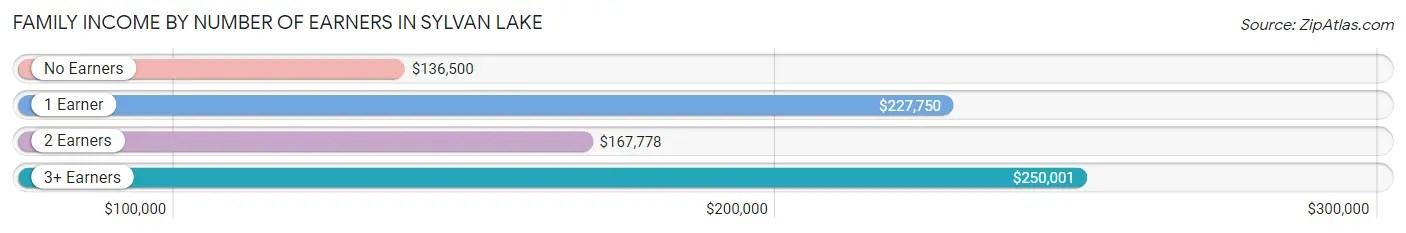
| Number of Earners | # Families | Median Income |
| No Earners | 32 (7.1%) | $136,500 |
| 1 Earner | 169 (37.6%) | $227,750 |
| 2 Earners | 206 (45.9%) | $167,778 |
| 3+ Earners | 42 (9.3%) | $250,001 |
| Total | 449 (100.0%) | $174,063 |
Household Income in Sylvan Lake
Household Income Brackets in Sylvan Lake
With 198 households falling in the category, the $200,000+ income range is the most frequent in Sylvan Lake, accounting for 22.9% of all households. In contrast, only 13 households (1.5%) fall into the $15,000 to $24,999 income bracket, making it the least populous group.
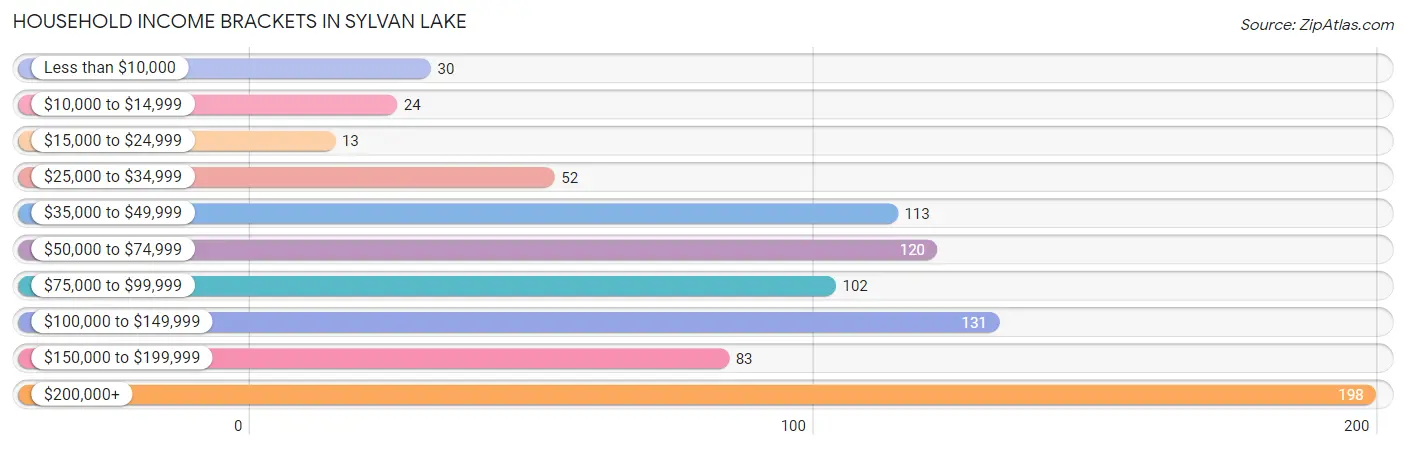
| Income Bracket | # Households | % Households |
| Less than $10,000 | 30 | 3.5% |
| $10,000 to $14,999 | 24 | 2.8% |
| $15,000 to $24,999 | 13 | 1.5% |
| $25,000 to $34,999 | 52 | 6.0% |
| $35,000 to $49,999 | 113 | 13.0% |
| $50,000 to $74,999 | 120 | 13.9% |
| $75,000 to $99,999 | 102 | 11.8% |
| $100,000 to $149,999 | 131 | 15.1% |
| $150,000 to $199,999 | 83 | 9.6% |
| $200,000+ | 198 | 22.9% |
Household Income by Householder Age in Sylvan Lake
The median household income in Sylvan Lake is $96,900, with the highest median household income of $130,833 found in the 45 to 64 years age bracket for the primary householder. A total of 360 households (41.6%) fall into this category. Meanwhile, the 15 to 24 years age bracket for the primary householder has the lowest median household income of $0, with 5 households (0.6%) in this group.
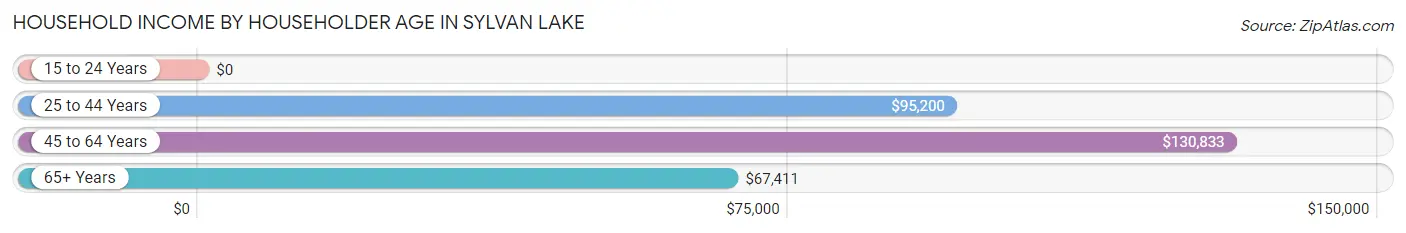
| Income Bracket | # Households | Median Income |
| 15 to 24 Years | 5 (0.6%) | $0 |
| 25 to 44 Years | 210 (24.2%) | $95,200 |
| 45 to 64 Years | 360 (41.6%) | $130,833 |
| 65+ Years | 291 (33.6%) | $67,411 |
| Total | 866 (100.0%) | $96,900 |
Poverty in Sylvan Lake
Income Below Poverty by Sex and Age in Sylvan Lake
With 3.9% poverty level for males and 4.5% for females among the residents of Sylvan Lake, 18 to 24 year old males and 18 to 24 year old females are the most vulnerable to poverty, with 12 males (11.8%) and 4 females (36.4%) in their respective age groups living below the poverty level.
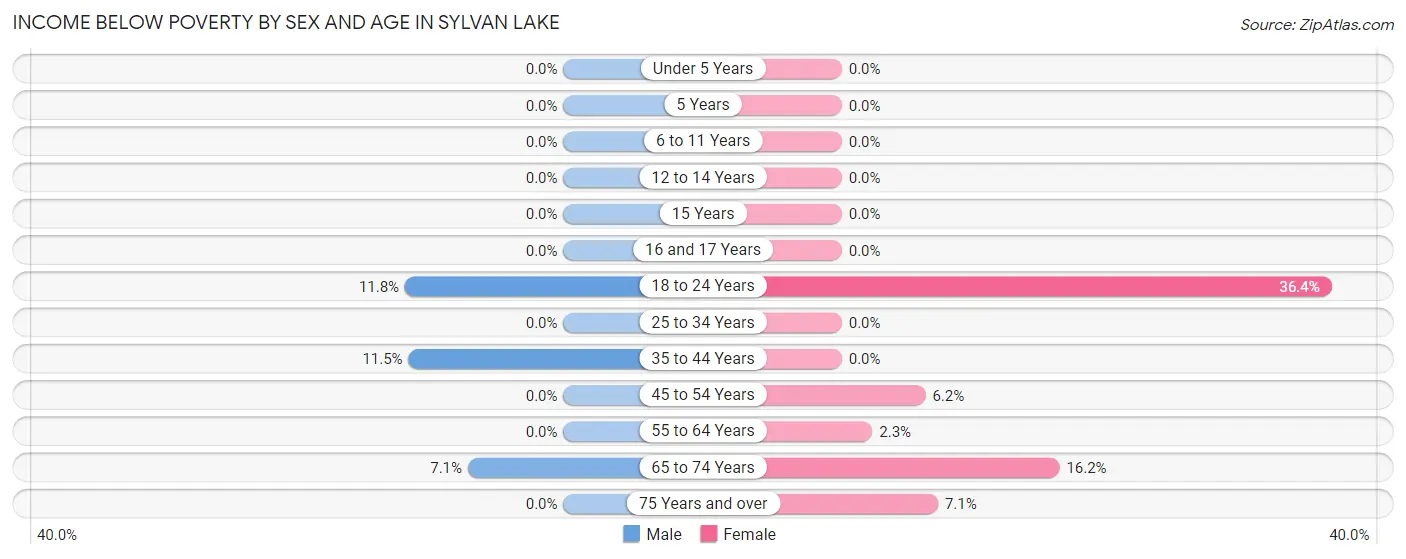
| Age Bracket | Male | Female |
| Under 5 Years | 0 (0.0%) | 0 (0.0%) |
| 5 Years | 0 (0.0%) | 0 (0.0%) |
| 6 to 11 Years | 0 (0.0%) | 0 (0.0%) |
| 12 to 14 Years | 0 (0.0%) | 0 (0.0%) |
| 15 Years | 0 (0.0%) | 0 (0.0%) |
| 16 and 17 Years | 0 (0.0%) | 0 (0.0%) |
| 18 to 24 Years | 12 (11.8%) | 4 (36.4%) |
| 25 to 34 Years | 0 (0.0%) | 0 (0.0%) |
| 35 to 44 Years | 13 (11.5%) | 0 (0.0%) |
| 45 to 54 Years | 0 (0.0%) | 9 (6.2%) |
| 55 to 64 Years | 0 (0.0%) | 5 (2.3%) |
| 65 to 74 Years | 9 (7.1%) | 16 (16.2%) |
| 75 Years and over | 0 (0.0%) | 5 (7.1%) |
| Total | 34 (3.9%) | 39 (4.5%) |
Income Above Poverty by Sex and Age in Sylvan Lake
According to the poverty statistics in Sylvan Lake, males aged under 5 years and females aged under 5 years are the age groups that are most secure financially, with 100.0% of males and 100.0% of females in these age groups living above the poverty line.
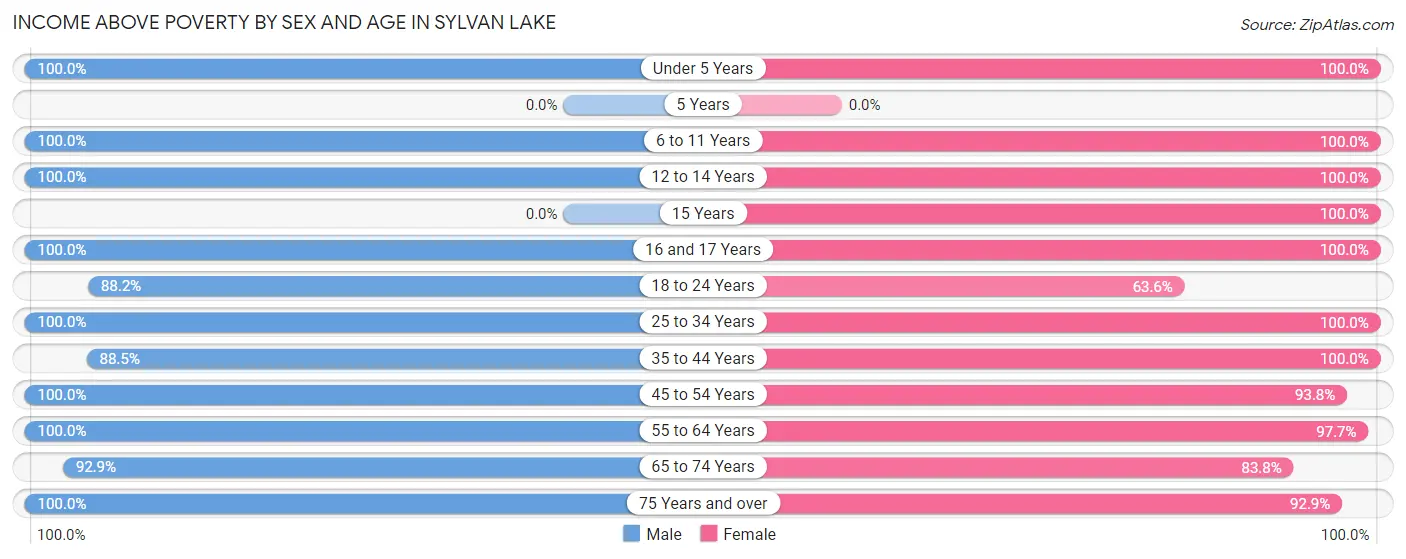
| Age Bracket | Male | Female |
| Under 5 Years | 30 (100.0%) | 25 (100.0%) |
| 5 Years | 0 (0.0%) | 0 (0.0%) |
| 6 to 11 Years | 29 (100.0%) | 40 (100.0%) |
| 12 to 14 Years | 30 (100.0%) | 20 (100.0%) |
| 15 Years | 0 (0.0%) | 14 (100.0%) |
| 16 and 17 Years | 17 (100.0%) | 17 (100.0%) |
| 18 to 24 Years | 90 (88.2%) | 7 (63.6%) |
| 25 to 34 Years | 85 (100.0%) | 152 (100.0%) |
| 35 to 44 Years | 100 (88.5%) | 46 (100.0%) |
| 45 to 54 Years | 98 (100.0%) | 136 (93.8%) |
| 55 to 64 Years | 155 (100.0%) | 215 (97.7%) |
| 65 to 74 Years | 118 (92.9%) | 83 (83.8%) |
| 75 Years and over | 84 (100.0%) | 65 (92.9%) |
| Total | 836 (96.1%) | 820 (95.5%) |
Income Below Poverty Among Married-Couple Families in Sylvan Lake
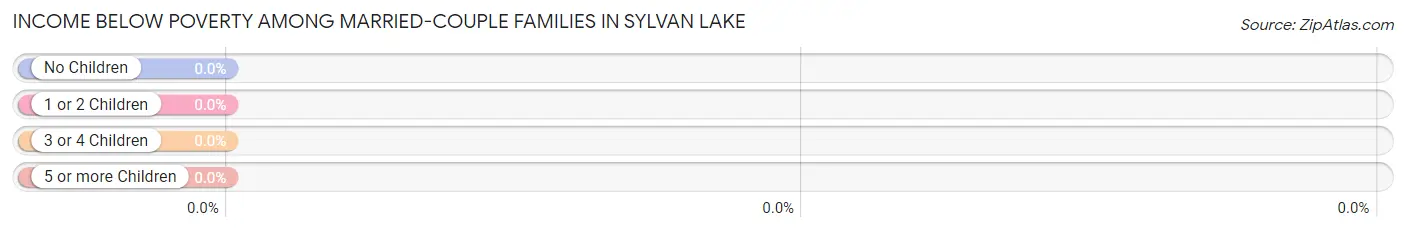
| Children | Above Poverty | Below Poverty |
| No Children | 284 (100.0%) | 0 (0.0%) |
| 1 or 2 Children | 39 (100.0%) | 0 (0.0%) |
| 3 or 4 Children | 48 (100.0%) | 0 (0.0%) |
| 5 or more Children | 0 (0.0%) | 0 (0.0%) |
| Total | 371 (100.0%) | 0 (0.0%) |
Income Below Poverty Among Single-Parent Households in Sylvan Lake
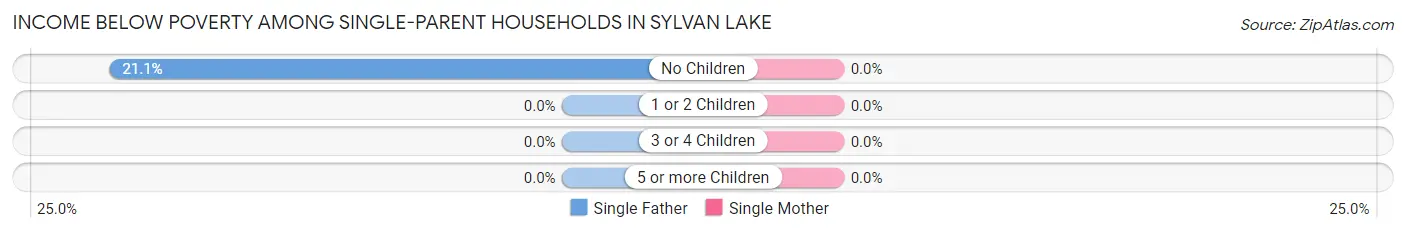
| Children | Single Father | Single Mother |
| No Children | 4 (21.0%) | 0 (0.0%) |
| 1 or 2 Children | 0 (0.0%) | 0 (0.0%) |
| 3 or 4 Children | 0 (0.0%) | 0 (0.0%) |
| 5 or more Children | 0 (0.0%) | 0 (0.0%) |
| Total | 4 (9.5%) | 0 (0.0%) |
Income Below Poverty Among Married-Couple vs Single-Parent Households in Sylvan Lake
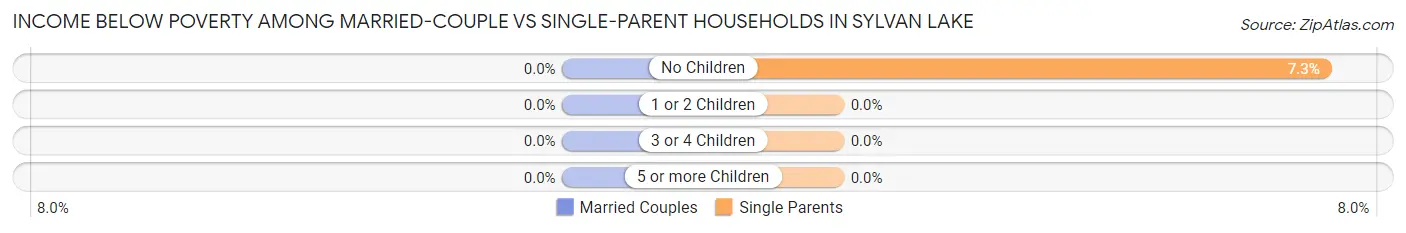
| Children | Married-Couple Families | Single-Parent Households |
| No Children | 0 (0.0%) | 4 (7.3%) |
| 1 or 2 Children | 0 (0.0%) | 0 (0.0%) |
| 3 or 4 Children | 0 (0.0%) | 0 (0.0%) |
| 5 or more Children | 0 (0.0%) | 0 (0.0%) |
| Total | 0 (0.0%) | 4 (5.1%) |
Race in Sylvan Lake
The most populous races in Sylvan Lake are White / Caucasian (1,522 | 88.0%), Black / African American (173 | 10.0%), and Hispanic or Latino (45 | 2.6%).
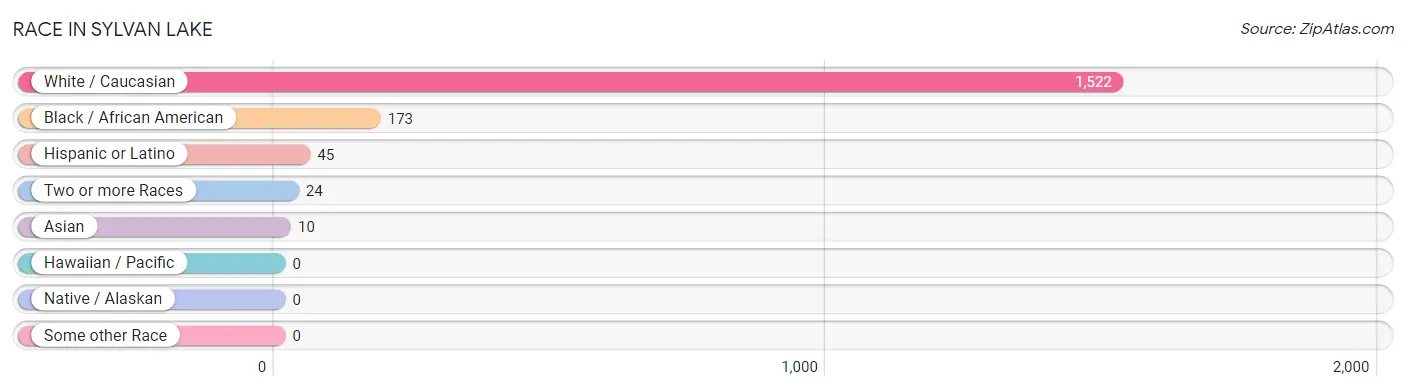
| Race | # Population | % Population |
| Asian | 10 | 0.6% |
| Black / African American | 173 | 10.0% |
| Hawaiian / Pacific | 0 | 0.0% |
| Hispanic or Latino | 45 | 2.6% |
| Native / Alaskan | 0 | 0.0% |
| White / Caucasian | 1,522 | 88.0% |
| Two or more Races | 24 | 1.4% |
| Some other Race | 0 | 0.0% |
| Total | 1,729 | 100.0% |
Ancestry in Sylvan Lake
The most populous ancestries reported in Sylvan Lake are English (267 | 15.4%), German (262 | 15.1%), Irish (260 | 15.0%), Polish (180 | 10.4%), and Italian (120 | 6.9%), together accounting for 63.0% of all Sylvan Lake residents.
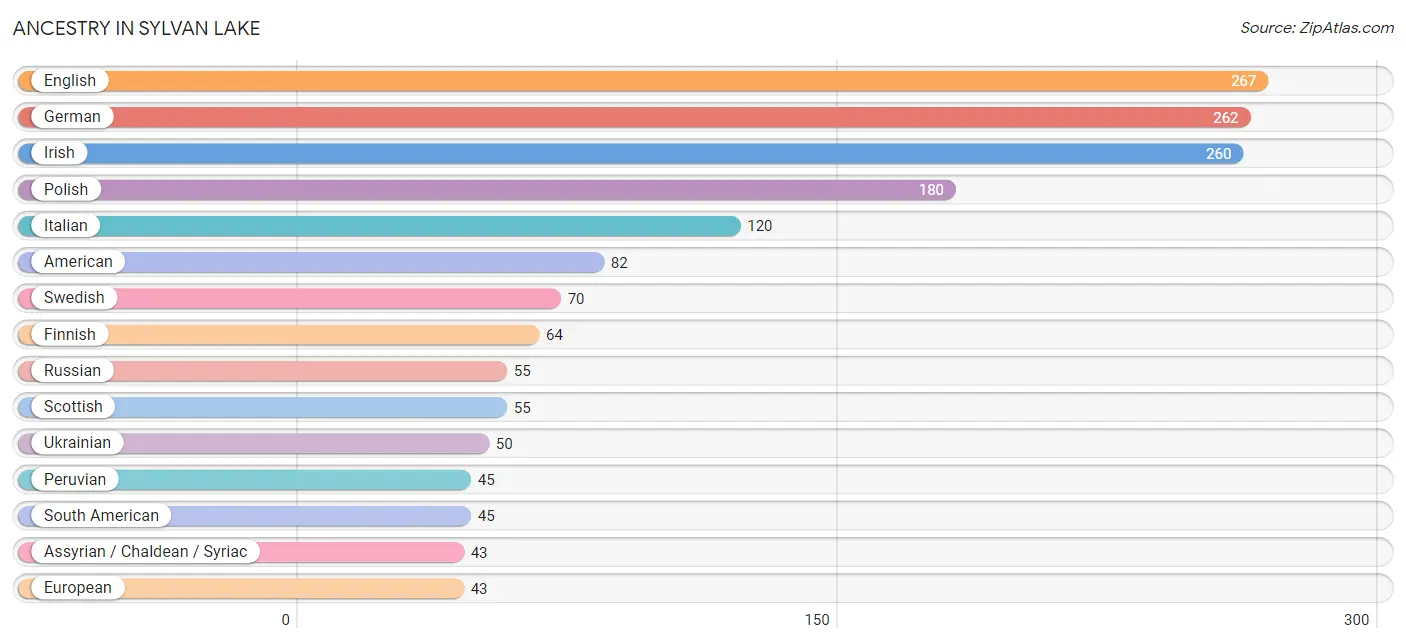
| Ancestry | # Population | % Population |
| American | 82 | 4.7% |
| Arab | 10 | 0.6% |
| Armenian | 5 | 0.3% |
| Assyrian / Chaldean / Syriac | 43 | 2.5% |
| Belgian | 13 | 0.7% |
| Croatian | 5 | 0.3% |
| Czech | 17 | 1.0% |
| Danish | 12 | 0.7% |
| Dutch | 8 | 0.5% |
| English | 267 | 15.4% |
| European | 43 | 2.5% |
| Finnish | 64 | 3.7% |
| French | 17 | 1.0% |
| French American Indian | 7 | 0.4% |
| French Canadian | 22 | 1.3% |
| German | 262 | 15.1% |
| Greek | 9 | 0.5% |
| Hungarian | 32 | 1.8% |
| Iranian | 16 | 0.9% |
| Irish | 260 | 15.0% |
| Italian | 120 | 6.9% |
| Lebanese | 4 | 0.2% |
| Macedonian | 9 | 0.5% |
| Maltese | 5 | 0.3% |
| Norwegian | 17 | 1.0% |
| Pakistani | 10 | 0.6% |
| Palestinian | 6 | 0.4% |
| Peruvian | 45 | 2.6% |
| Polish | 180 | 10.4% |
| Russian | 55 | 3.2% |
| Scandinavian | 5 | 0.3% |
| Scotch-Irish | 21 | 1.2% |
| Scottish | 55 | 3.2% |
| Slovak | 5 | 0.3% |
| South American | 45 | 2.6% |
| Swedish | 70 | 4.1% |
| Ukrainian | 50 | 2.9% |
| Welsh | 10 | 0.6% | View All 38 Rows |
Immigrants in Sylvan Lake
The most numerous immigrant groups reported in Sylvan Lake came from Canada (51 | 2.9%), Asia (36 | 2.1%), Europe (35 | 2.0%), Iran (16 | 0.9%), and South Central Asia (16 | 0.9%), together accounting for 8.9% of all Sylvan Lake residents.
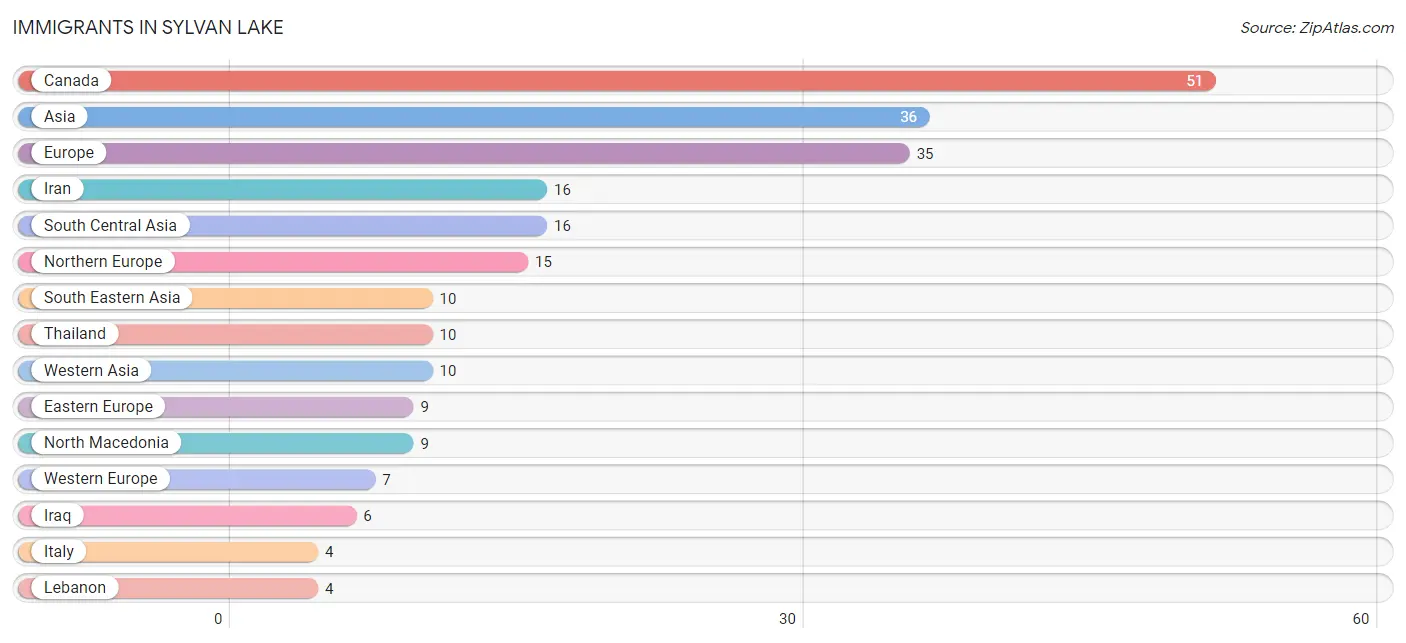
| Immigration Origin | # Population | % Population |
| Asia | 36 | 2.1% |
| Canada | 51 | 2.9% |
| Eastern Europe | 9 | 0.5% |
| Europe | 35 | 2.0% |
| Germany | 3 | 0.2% |
| Iran | 16 | 0.9% |
| Iraq | 6 | 0.4% |
| Italy | 4 | 0.2% |
| Lebanon | 4 | 0.2% |
| Netherlands | 4 | 0.2% |
| North Macedonia | 9 | 0.5% |
| Northern Europe | 15 | 0.9% |
| South Central Asia | 16 | 0.9% |
| South Eastern Asia | 10 | 0.6% |
| Southern Europe | 4 | 0.2% |
| Thailand | 10 | 0.6% |
| Western Asia | 10 | 0.6% |
| Western Europe | 7 | 0.4% | View All 18 Rows |
Sex and Age in Sylvan Lake
Sex and Age in Sylvan Lake
The most populous age groups in Sylvan Lake are 60 to 64 Years (78 | 9.0%) for men and 60 to 64 Years (152 | 17.7%) for women.
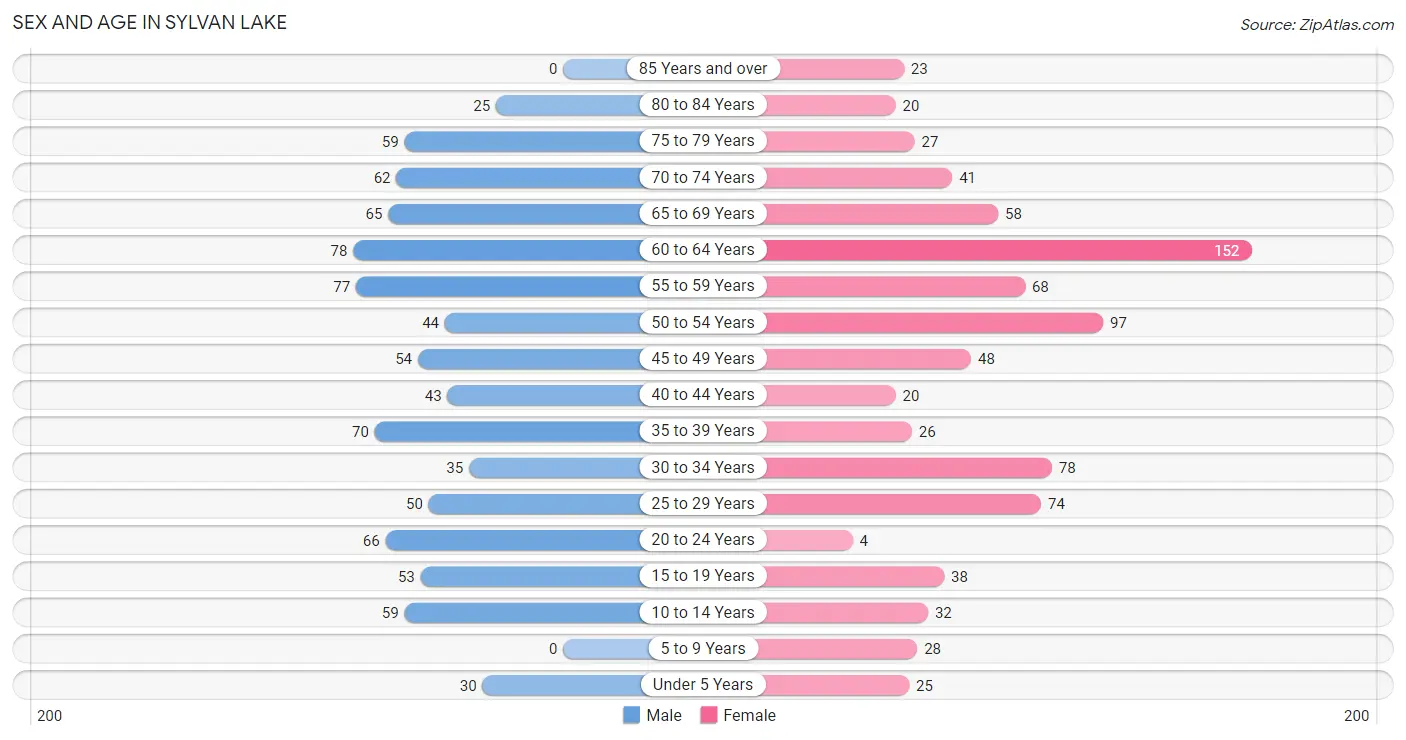
| Age Bracket | Male | Female |
| Under 5 Years | 30 (3.5%) | 25 (2.9%) |
| 5 to 9 Years | 0 (0.0%) | 28 (3.3%) |
| 10 to 14 Years | 59 (6.8%) | 32 (3.7%) |
| 15 to 19 Years | 53 (6.1%) | 38 (4.4%) |
| 20 to 24 Years | 66 (7.6%) | 4 (0.5%) |
| 25 to 29 Years | 50 (5.8%) | 74 (8.6%) |
| 30 to 34 Years | 35 (4.0%) | 78 (9.1%) |
| 35 to 39 Years | 70 (8.1%) | 26 (3.0%) |
| 40 to 44 Years | 43 (4.9%) | 20 (2.3%) |
| 45 to 49 Years | 54 (6.2%) | 48 (5.6%) |
| 50 to 54 Years | 44 (5.1%) | 97 (11.3%) |
| 55 to 59 Years | 77 (8.8%) | 68 (7.9%) |
| 60 to 64 Years | 78 (9.0%) | 152 (17.7%) |
| 65 to 69 Years | 65 (7.5%) | 58 (6.8%) |
| 70 to 74 Years | 62 (7.1%) | 41 (4.8%) |
| 75 to 79 Years | 59 (6.8%) | 27 (3.1%) |
| 80 to 84 Years | 25 (2.9%) | 20 (2.3%) |
| 85 Years and over | 0 (0.0%) | 23 (2.7%) |
| Total | 870 (100.0%) | 859 (100.0%) |
Families and Households in Sylvan Lake
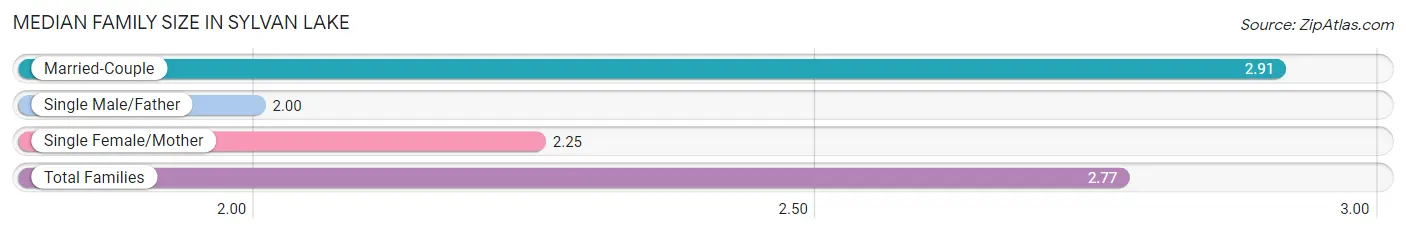
Median Family Size in Sylvan Lake
The median family size in Sylvan Lake is 2.77 persons per family, with married-couple families (371 | 82.6%) accounting for the largest median family size of 2.91 persons per family. On the other hand, single male/father families (42 | 9.3%) represent the smallest median family size with 2.00 persons per family.
| Family Type | # Families | Family Size |
| Married-Couple | 371 (82.6%) | 2.91 |
| Single Male/Father | 42 (9.3%) | 2.00 |
| Single Female/Mother | 36 (8.0%) | 2.25 |
| Total Families | 449 (100.0%) | 2.77 |
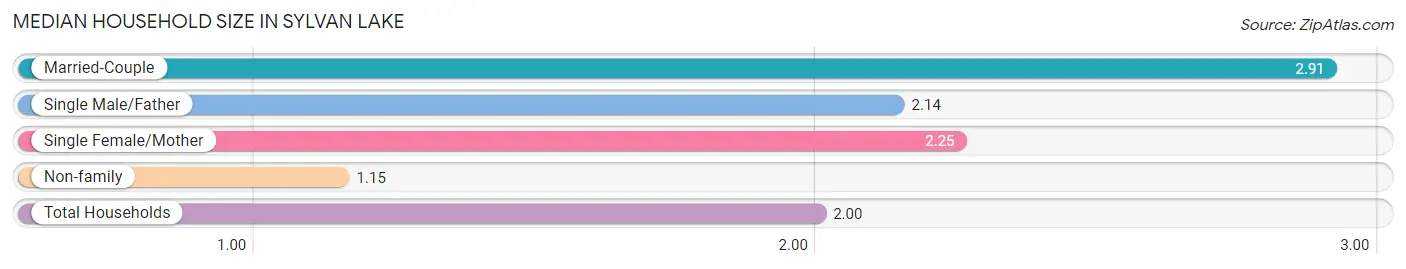
Median Household Size in Sylvan Lake
The median household size in Sylvan Lake is 2.00 persons per household, with married-couple households (371 | 42.8%) accounting for the largest median household size of 2.91 persons per household. non-family households (417 | 48.1%) represent the smallest median household size with 1.15 persons per household.
| Household Type | # Households | Household Size |
| Married-Couple | 371 (42.8%) | 2.91 |
| Single Male/Father | 42 (4.9%) | 2.14 |
| Single Female/Mother | 36 (4.2%) | 2.25 |
| Non-family | 417 (48.1%) | 1.15 |
| Total Households | 866 (100.0%) | 2.00 |
Household Size by Marriage Status in Sylvan Lake
Out of a total of 866 households in Sylvan Lake, 449 (51.8%) are family households, while 417 (48.1%) are nonfamily households. The most numerous type of family households are 2-person households, comprising 305, and the most common type of nonfamily households are 1-person households, comprising 366.
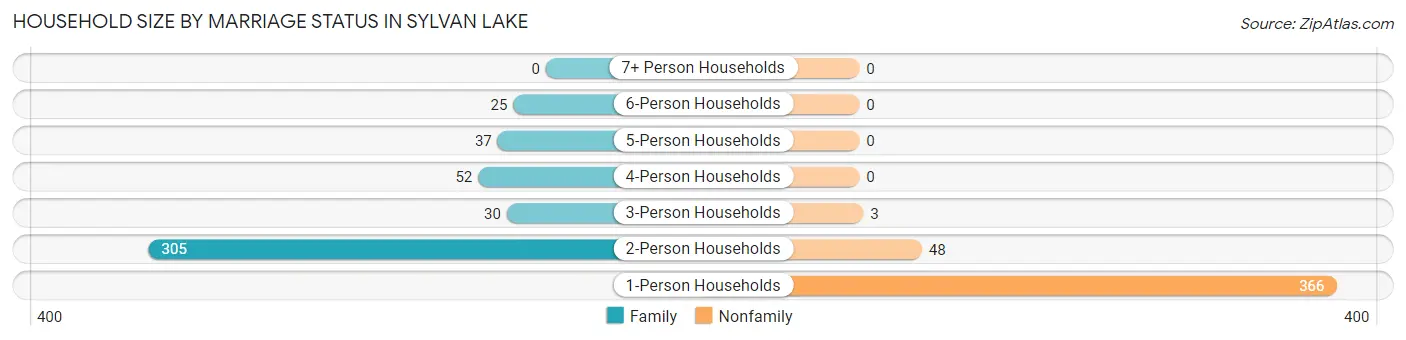
| Household Size | Family Households | Nonfamily Households |
| 1-Person Households | - | 366 (42.3%) |
| 2-Person Households | 305 (35.2%) | 48 (5.5%) |
| 3-Person Households | 30 (3.5%) | 3 (0.4%) |
| 4-Person Households | 52 (6.0%) | 0 (0.0%) |
| 5-Person Households | 37 (4.3%) | 0 (0.0%) |
| 6-Person Households | 25 (2.9%) | 0 (0.0%) |
| 7+ Person Households | 0 (0.0%) | 0 (0.0%) |
| Total | 449 (51.8%) | 417 (48.1%) |
Female Fertility in Sylvan Lake
Fertility by Age in Sylvan Lake
Average fertility rate in Sylvan Lake is 56.0 births per 1,000 women. Women in the age bracket of 20 to 34 years have the highest fertility rate with 103.0 births per 1,000 women. Women in the age bracket of 20 to 34 years acount for 100.0% of all women with births.
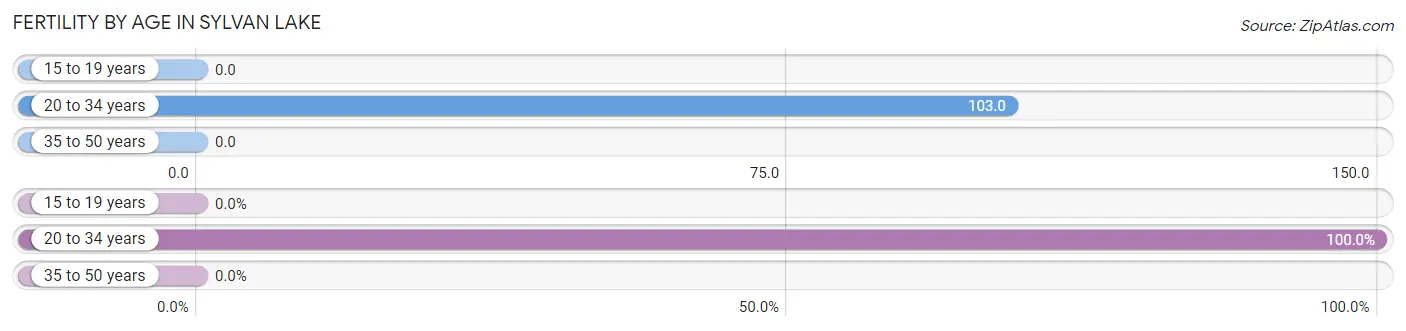
| Age Bracket | Women with Births | Births / 1,000 Women |
| 15 to 19 years | 0 (0.0%) | 0.0 |
| 20 to 34 years | 16 (100.0%) | 103.0 |
| 35 to 50 years | 0 (0.0%) | 0.0 |
| Total | 16 (100.0%) | 56.0 |
Fertility by Age by Marriage Status in Sylvan Lake
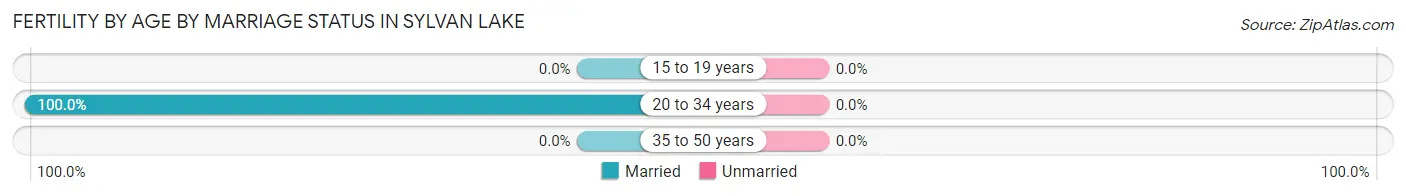
| Age Bracket | Married | Unmarried |
| 15 to 19 years | 0 (0.0%) | 0 (0.0%) |
| 20 to 34 years | 16 (100.0%) | 0 (0.0%) |
| 35 to 50 years | 0 (0.0%) | 0 (0.0%) |
| Total | 16 (100.0%) | 0 (0.0%) |
Fertility by Education in Sylvan Lake
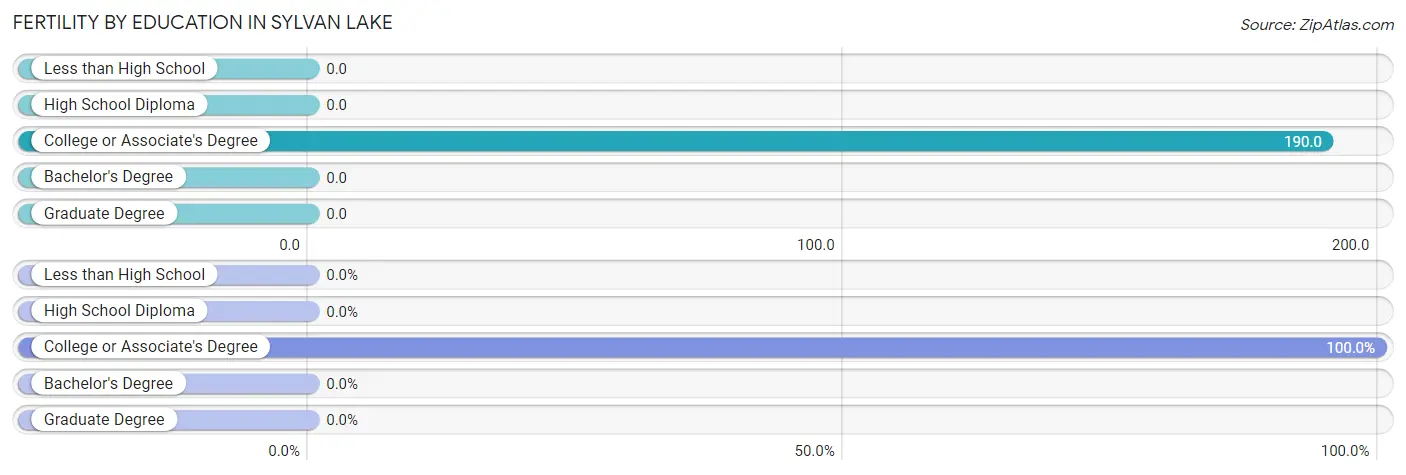
| Educational Attainment | Women with Births | Births / 1,000 Women |
| Less than High School | 0 (0.0%) | 0.0 |
| High School Diploma | 0 (0.0%) | 0.0 |
| College or Associate's Degree | 16 (100.0%) | 190.0 |
| Bachelor's Degree | 0 (0.0%) | 0.0 |
| Graduate Degree | 0 (0.0%) | 0.0 |
| Total | 16 (100.0%) | 56.0 |
Fertility by Education by Marriage Status in Sylvan Lake
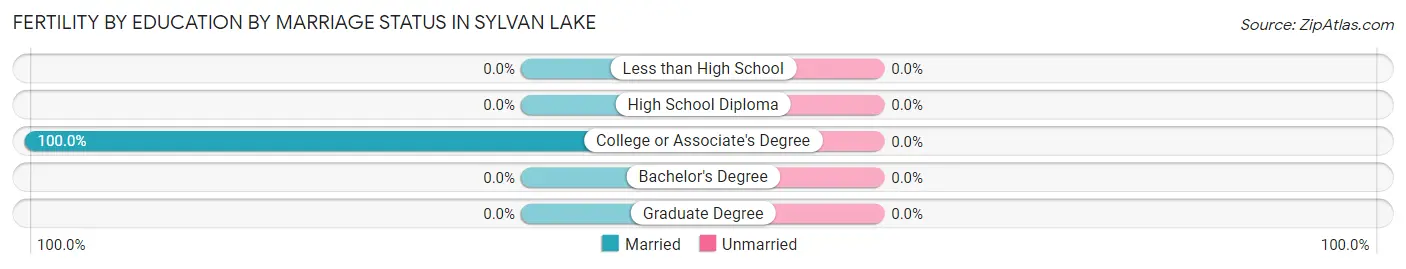
| Educational Attainment | Married | Unmarried |
| Less than High School | 0 (0.0%) | 0 (0.0%) |
| High School Diploma | 0 (0.0%) | 0 (0.0%) |
| College or Associate's Degree | 16 (100.0%) | 0 (0.0%) |
| Bachelor's Degree | 0 (0.0%) | 0 (0.0%) |
| Graduate Degree | 0 (0.0%) | 0 (0.0%) |
| Total | 16 (100.0%) | 0 (0.0%) |
Employment Characteristics in Sylvan Lake
Employment by Class of Employer in Sylvan Lake
Among the 919 employed individuals in Sylvan Lake, private company employees (546 | 59.4%), not-for-profit organizations (118 | 12.8%), and self-employed (not incorporated) (84 | 9.1%) make up the most common classes of employment.
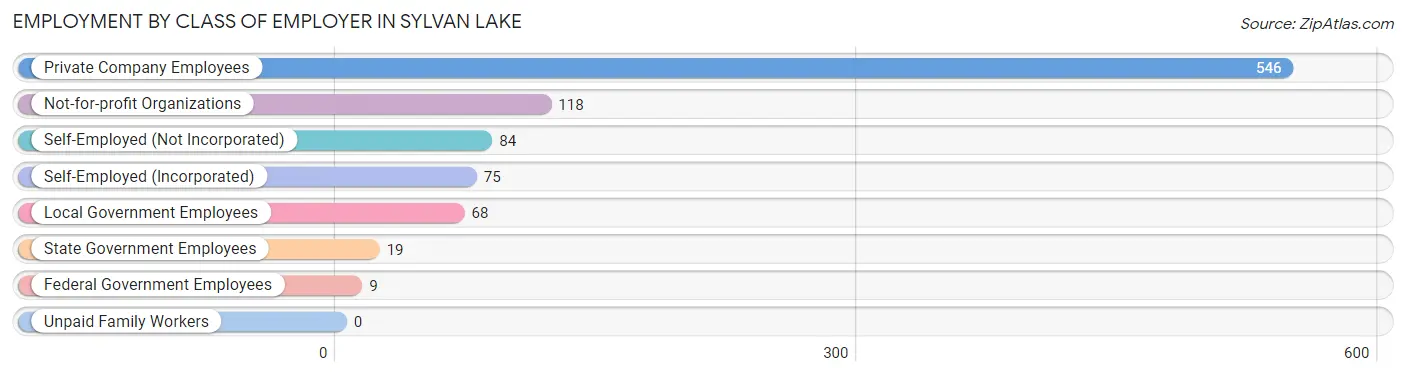
| Employer Class | # Employees | % Employees |
| Private Company Employees | 546 | 59.4% |
| Self-Employed (Incorporated) | 75 | 8.2% |
| Self-Employed (Not Incorporated) | 84 | 9.1% |
| Not-for-profit Organizations | 118 | 12.8% |
| Local Government Employees | 68 | 7.4% |
| State Government Employees | 19 | 2.1% |
| Federal Government Employees | 9 | 1.0% |
| Unpaid Family Workers | 0 | 0.0% |
| Total | 919 | 100.0% |
Employment Status by Age in Sylvan Lake
According to the labor force statistics for Sylvan Lake, out of the total population over 16 years of age (1,541), 64.2% or 989 individuals are in the labor force, with 4.6% or 45 of them unemployed. The age group with the highest labor force participation rate is 30 to 34 years, with 100.0% or 113 individuals in the labor force. Within the labor force, the 20 to 24 years age range has the highest percentage of unemployed individuals, with 19.7% or 12 of them being unemployed.
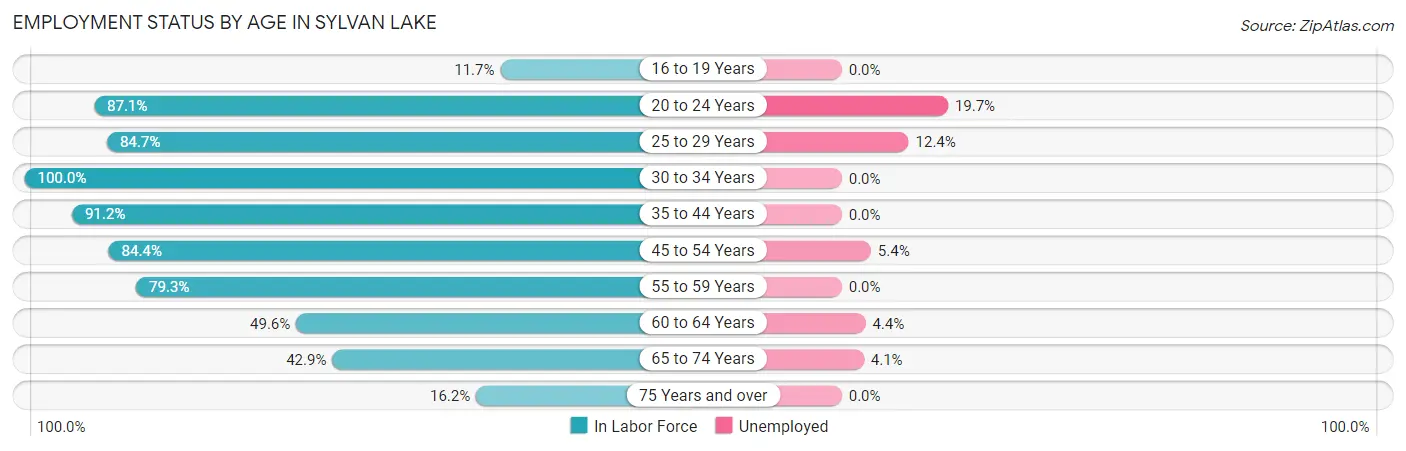
| Age Bracket | In Labor Force | Unemployed |
| 16 to 19 Years | 9 (11.7%) | 0 (0.0%) |
| 20 to 24 Years | 61 (87.1%) | 12 (19.7%) |
| 25 to 29 Years | 105 (84.7%) | 13 (12.4%) |
| 30 to 34 Years | 113 (100.0%) | 0 (0.0%) |
| 35 to 44 Years | 145 (91.2%) | 0 (0.0%) |
| 45 to 54 Years | 205 (84.4%) | 11 (5.4%) |
| 55 to 59 Years | 115 (79.3%) | 0 (0.0%) |
| 60 to 64 Years | 114 (49.6%) | 5 (4.4%) |
| 65 to 74 Years | 97 (42.9%) | 4 (4.1%) |
| 75 Years and over | 25 (16.2%) | 0 (0.0%) |
| Total | 989 (64.2%) | 45 (4.6%) |
Employment Status by Educational Attainment in Sylvan Lake
According to labor force statistics for Sylvan Lake, 78.6% of individuals (797) out of the total population between 25 and 64 years of age (1,014) are in the labor force, with 3.6% or 29 of them being unemployed. The group with the highest labor force participation rate are those with the educational attainment of less than high school, with 100.0% or 5 individuals in the labor force. Within the labor force, individuals with college / associate degree education have the highest percentage of unemployment, with 6.9% or 18 of them being unemployed.
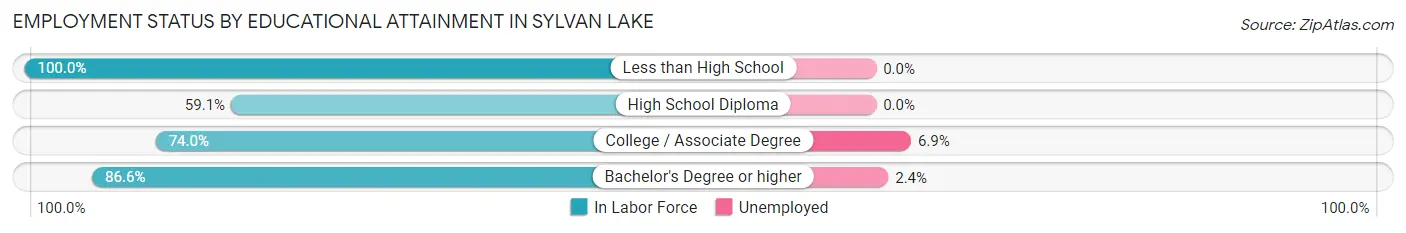
| Educational Attainment | In Labor Force | Unemployed |
| Less than High School | 5 (100.0%) | 0 (0.0%) |
| High School Diploma | 81 (59.1%) | 0 (0.0%) |
| College / Associate Degree | 259 (74.0%) | 24 (6.9%) |
| Bachelor's Degree or higher | 452 (86.6%) | 13 (2.4%) |
| Total | 797 (78.6%) | 37 (3.6%) |
Employment Occupations by Sex in Sylvan Lake
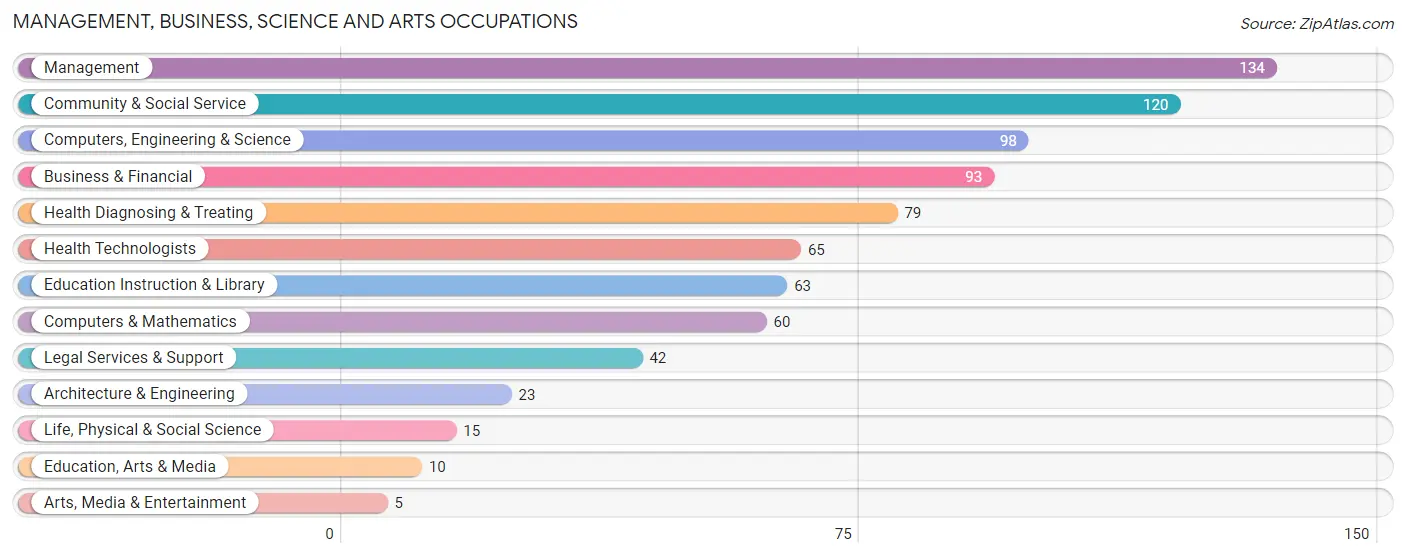
Management, Business, Science and Arts Occupations
The most common Management, Business, Science and Arts occupations in Sylvan Lake are Management (134 | 14.2%), Community & Social Service (120 | 12.7%), Computers, Engineering & Science (98 | 10.4%), Business & Financial (93 | 9.9%), and Health Diagnosing & Treating (79 | 8.4%).
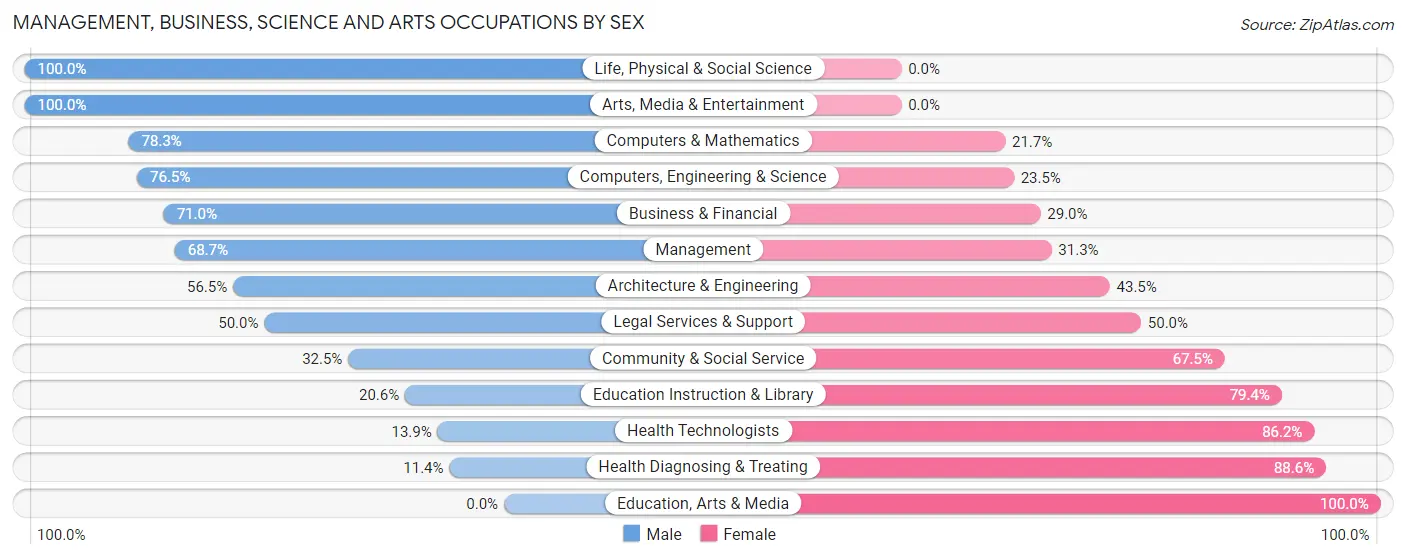
Management, Business, Science and Arts Occupations by Sex
Within the Management, Business, Science and Arts occupations in Sylvan Lake, the most male-oriented occupations are Life, Physical & Social Science (100.0%), Arts, Media & Entertainment (100.0%), and Computers & Mathematics (78.3%), while the most female-oriented occupations are Education, Arts & Media (100.0%), Health Diagnosing & Treating (88.6%), and Health Technologists (86.2%).
| Occupation | Male | Female |
| Management | 92 (68.7%) | 42 (31.3%) |
| Business & Financial | 66 (71.0%) | 27 (29.0%) |
| Computers, Engineering & Science | 75 (76.5%) | 23 (23.5%) |
| Computers & Mathematics | 47 (78.3%) | 13 (21.7%) |
| Architecture & Engineering | 13 (56.5%) | 10 (43.5%) |
| Life, Physical & Social Science | 15 (100.0%) | 0 (0.0%) |
| Community & Social Service | 39 (32.5%) | 81 (67.5%) |
| Education, Arts & Media | 0 (0.0%) | 10 (100.0%) |
| Legal Services & Support | 21 (50.0%) | 21 (50.0%) |
| Education Instruction & Library | 13 (20.6%) | 50 (79.4%) |
| Arts, Media & Entertainment | 5 (100.0%) | 0 (0.0%) |
| Health Diagnosing & Treating | 9 (11.4%) | 70 (88.6%) |
| Health Technologists | 9 (13.9%) | 56 (86.2%) |
| Total (Category) | 281 (53.6%) | 243 (46.4%) |
| Total (Overall) | 528 (55.9%) | 416 (44.1%) |
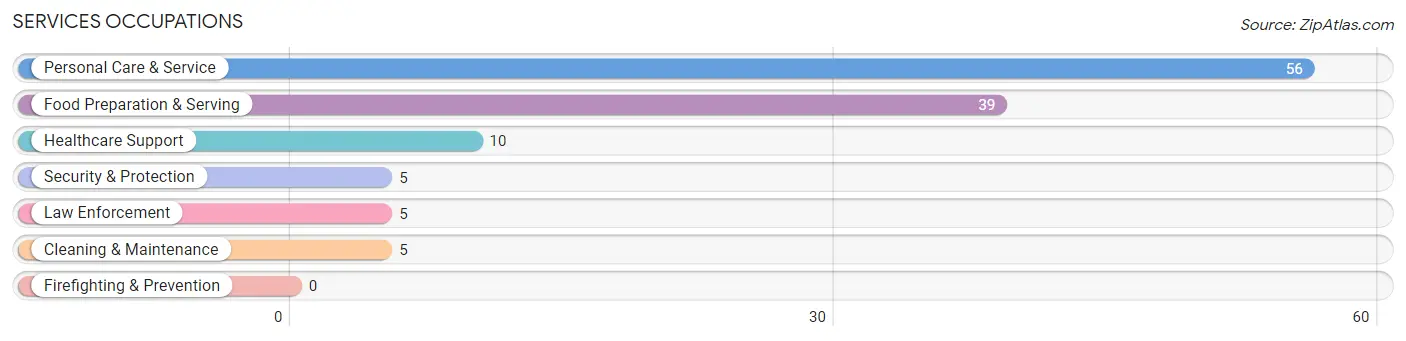
Services Occupations
The most common Services occupations in Sylvan Lake are Personal Care & Service (56 | 5.9%), Food Preparation & Serving (39 | 4.1%), Healthcare Support (10 | 1.1%), Security & Protection (5 | 0.5%), and Law Enforcement (5 | 0.5%).
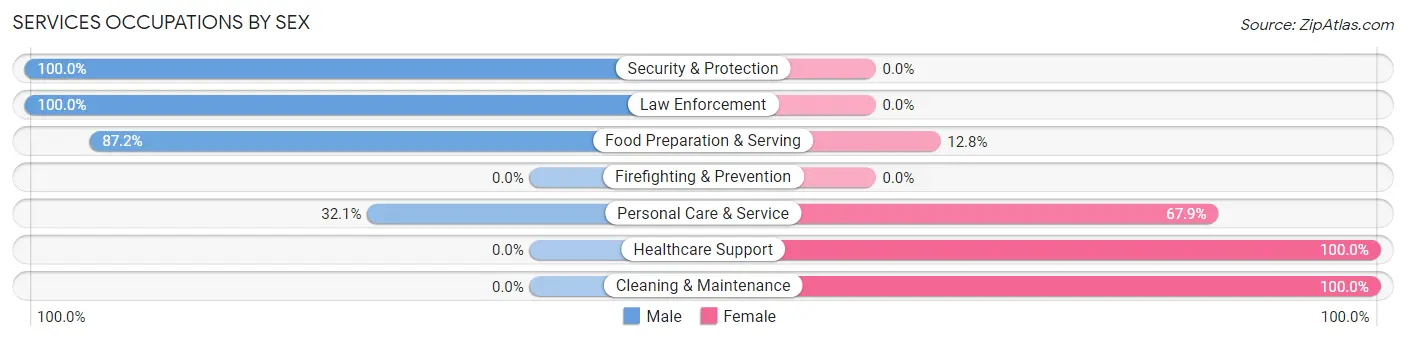
Services Occupations by Sex
Within the Services occupations in Sylvan Lake, the most male-oriented occupations are Security & Protection (100.0%), Law Enforcement (100.0%), and Food Preparation & Serving (87.2%), while the most female-oriented occupations are Healthcare Support (100.0%), Cleaning & Maintenance (100.0%), and Personal Care & Service (67.9%).
| Occupation | Male | Female |
| Healthcare Support | 0 (0.0%) | 10 (100.0%) |
| Security & Protection | 5 (100.0%) | 0 (0.0%) |
| Firefighting & Prevention | 0 (0.0%) | 0 (0.0%) |
| Law Enforcement | 5 (100.0%) | 0 (0.0%) |
| Food Preparation & Serving | 34 (87.2%) | 5 (12.8%) |
| Cleaning & Maintenance | 0 (0.0%) | 5 (100.0%) |
| Personal Care & Service | 18 (32.1%) | 38 (67.9%) |
| Total (Category) | 57 (49.6%) | 58 (50.4%) |
| Total (Overall) | 528 (55.9%) | 416 (44.1%) |
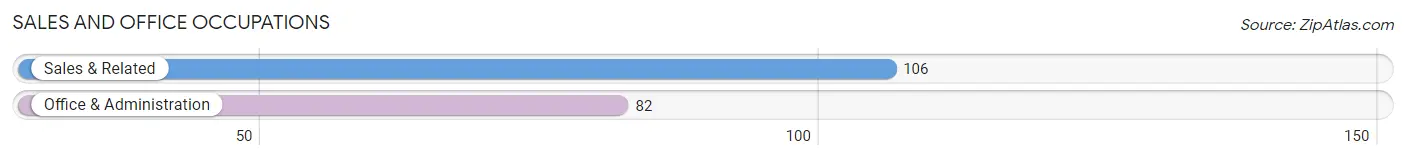
Sales and Office Occupations
The most common Sales and Office occupations in Sylvan Lake are Sales & Related (106 | 11.2%), and Office & Administration (82 | 8.7%).
Sales and Office Occupations by Sex
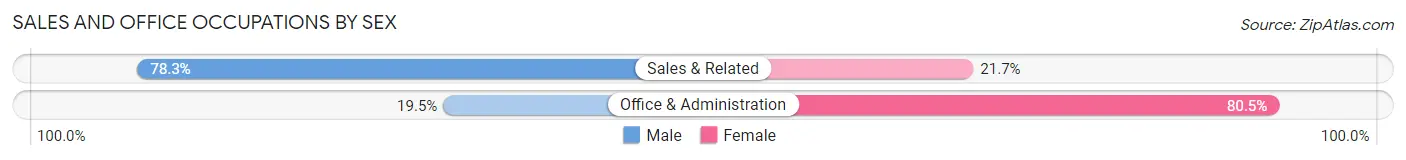
| Occupation | Male | Female |
| Sales & Related | 83 (78.3%) | 23 (21.7%) |
| Office & Administration | 16 (19.5%) | 66 (80.5%) |
| Total (Category) | 99 (52.7%) | 89 (47.3%) |
| Total (Overall) | 528 (55.9%) | 416 (44.1%) |
Natural Resources, Construction and Maintenance Occupations
Natural Resources, Construction and Maintenance Occupations by Sex
| Occupation | Male | Female |
| Farming, Fishing & Forestry | 0 (0.0%) | 0 (0.0%) |
| Construction & Extraction | 0 (0.0%) | 0 (0.0%) |
| Installation, Maintenance & Repair | 0 (0.0%) | 0 (0.0%) |
| Total (Category) | 0 (0.0%) | 0 (0.0%) |
| Total (Overall) | 528 (55.9%) | 416 (44.1%) |
Production, Transportation and Moving Occupations
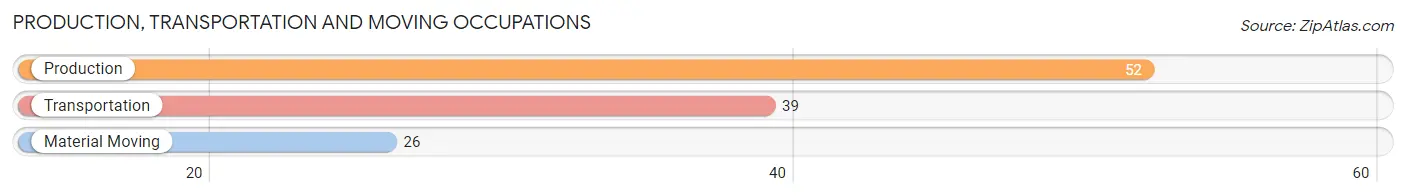
The most common Production, Transportation and Moving occupations in Sylvan Lake are Production (52 | 5.5%), Transportation (39 | 4.1%), and Material Moving (26 | 2.8%).
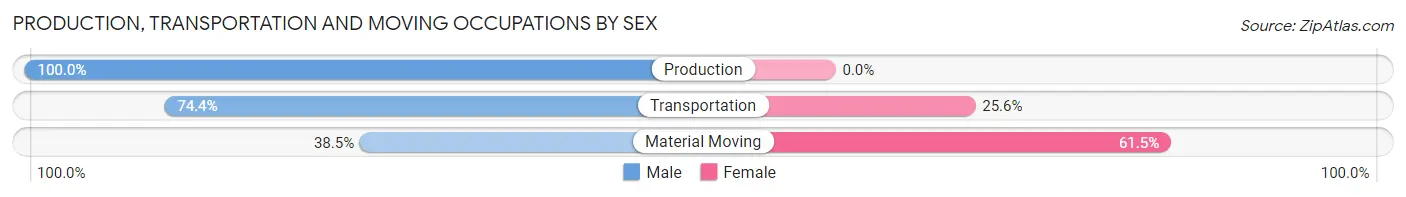
Production, Transportation and Moving Occupations by Sex
| Occupation | Male | Female |
| Production | 52 (100.0%) | 0 (0.0%) |
| Transportation | 29 (74.4%) | 10 (25.6%) |
| Material Moving | 10 (38.5%) | 16 (61.5%) |
| Total (Category) | 91 (77.8%) | 26 (22.2%) |
| Total (Overall) | 528 (55.9%) | 416 (44.1%) |
Employment Industries by Sex in Sylvan Lake
Employment Industries in Sylvan Lake
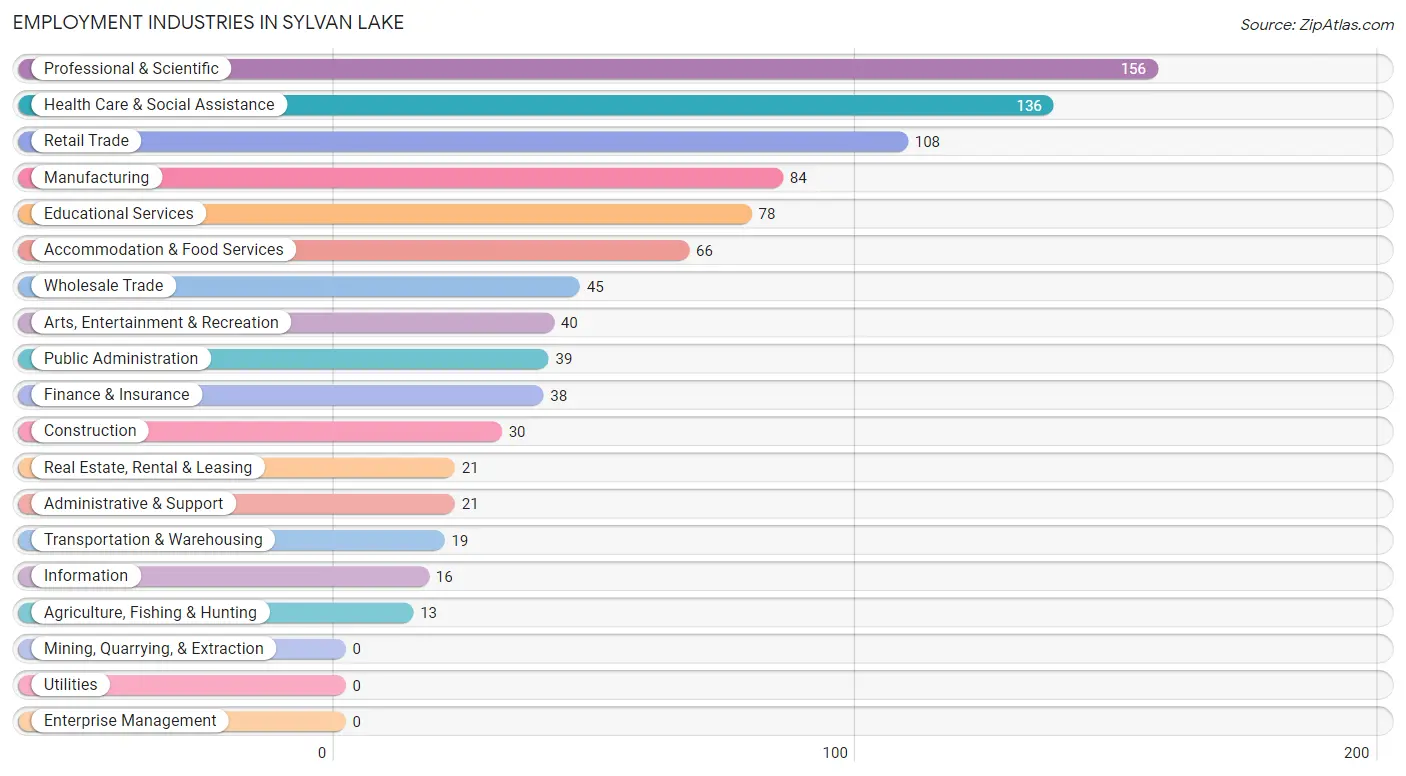
The major employment industries in Sylvan Lake include Professional & Scientific (156 | 16.5%), Health Care & Social Assistance (136 | 14.4%), Retail Trade (108 | 11.4%), Manufacturing (84 | 8.9%), and Educational Services (78 | 8.3%).
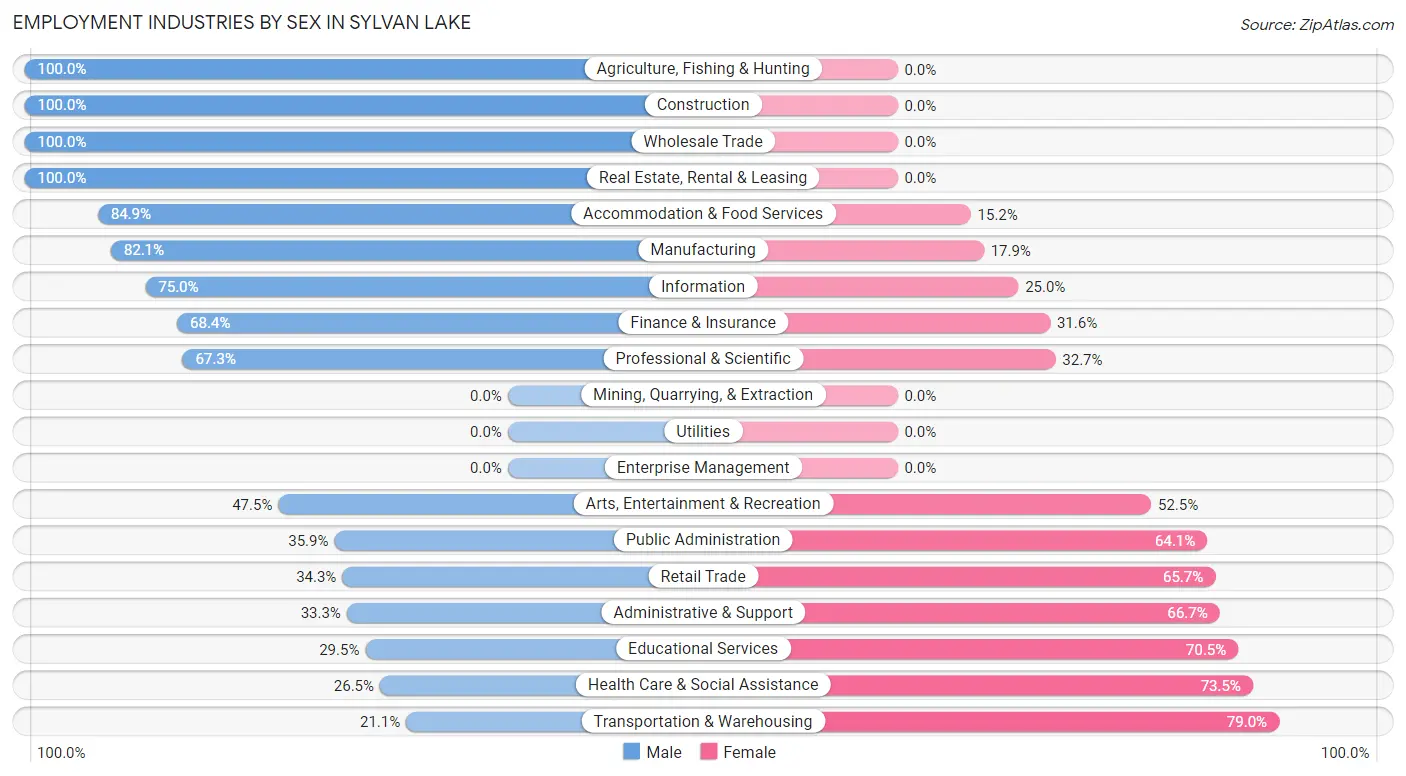
Employment Industries by Sex in Sylvan Lake
The Sylvan Lake industries that see more men than women are Agriculture, Fishing & Hunting (100.0%), Construction (100.0%), and Wholesale Trade (100.0%), whereas the industries that tend to have a higher number of women are Transportation & Warehousing (78.9%), Health Care & Social Assistance (73.5%), and Educational Services (70.5%).
| Industry | Male | Female |
| Agriculture, Fishing & Hunting | 13 (100.0%) | 0 (0.0%) |
| Mining, Quarrying, & Extraction | 0 (0.0%) | 0 (0.0%) |
| Construction | 30 (100.0%) | 0 (0.0%) |
| Manufacturing | 69 (82.1%) | 15 (17.9%) |
| Wholesale Trade | 45 (100.0%) | 0 (0.0%) |
| Retail Trade | 37 (34.3%) | 71 (65.7%) |
| Transportation & Warehousing | 4 (21.0%) | 15 (78.9%) |
| Utilities | 0 (0.0%) | 0 (0.0%) |
| Information | 12 (75.0%) | 4 (25.0%) |
| Finance & Insurance | 26 (68.4%) | 12 (31.6%) |
| Real Estate, Rental & Leasing | 21 (100.0%) | 0 (0.0%) |
| Professional & Scientific | 105 (67.3%) | 51 (32.7%) |
| Enterprise Management | 0 (0.0%) | 0 (0.0%) |
| Administrative & Support | 7 (33.3%) | 14 (66.7%) |
| Educational Services | 23 (29.5%) | 55 (70.5%) |
| Health Care & Social Assistance | 36 (26.5%) | 100 (73.5%) |
| Arts, Entertainment & Recreation | 19 (47.5%) | 21 (52.5%) |
| Accommodation & Food Services | 56 (84.9%) | 10 (15.1%) |
| Public Administration | 14 (35.9%) | 25 (64.1%) |
| Total | 528 (55.9%) | 416 (44.1%) |
Education in Sylvan Lake
School Enrollment in Sylvan Lake
The most common levels of schooling among the 323 students in Sylvan Lake are college / undergraduate (120 | 37.1%), high school (80 | 24.8%), and middle school (54 | 16.7%).
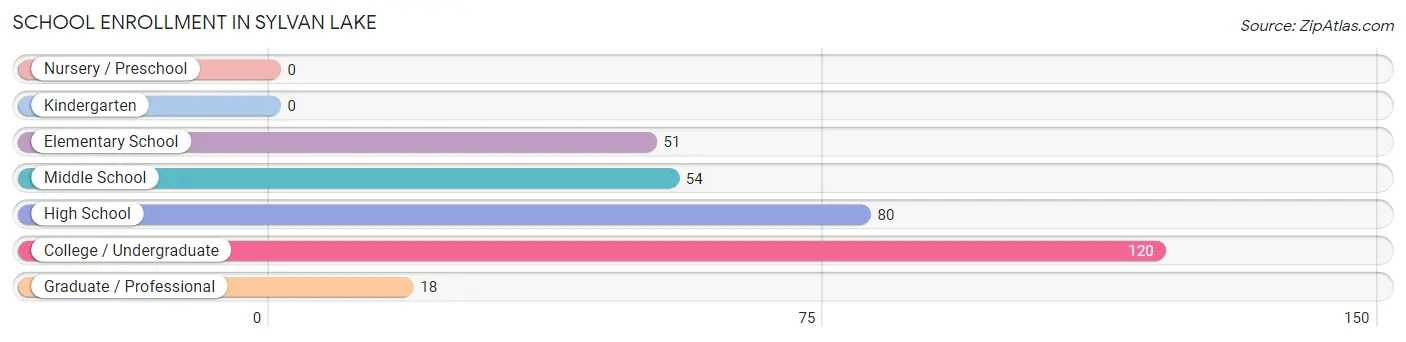
| School Level | # Students | % Students |
| Nursery / Preschool | 0 | 0.0% |
| Kindergarten | 0 | 0.0% |
| Elementary School | 51 | 15.8% |
| Middle School | 54 | 16.7% |
| High School | 80 | 24.8% |
| College / Undergraduate | 120 | 37.1% |
| Graduate / Professional | 18 | 5.6% |
| Total | 323 | 100.0% |
School Enrollment by Age by Funding Source in Sylvan Lake
Out of a total of 323 students who are enrolled in schools in Sylvan Lake, 77 (23.8%) attend a private institution, while the remaining 246 (76.2%) are enrolled in public schools. The age group of 18 to 19 year olds has the highest likelihood of being enrolled in private schools, with 23 (53.5% in the age bracket) enrolled. Conversely, the age group of 5 to 9 year old has the lowest likelihood of being enrolled in a private school, with 28 (100.0% in the age bracket) attending a public institution.
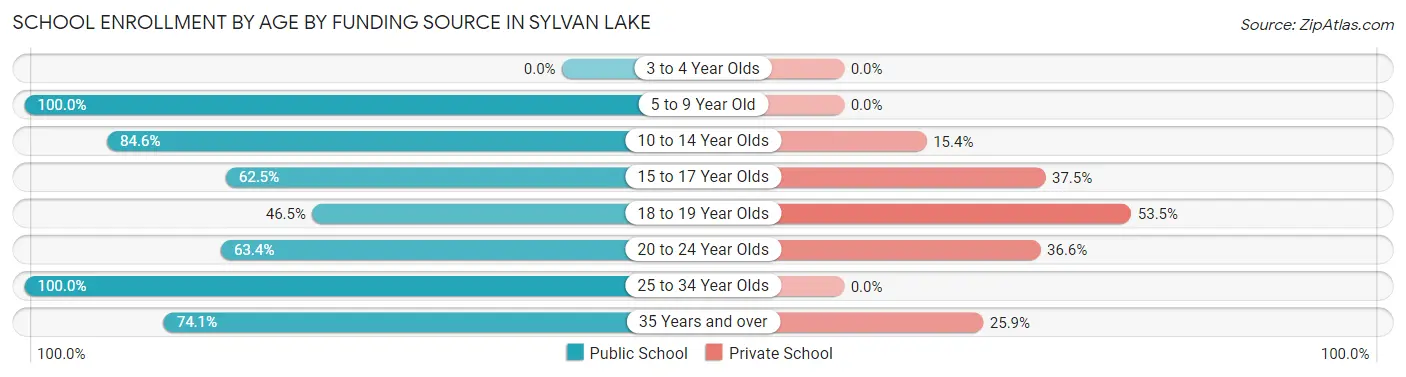
| Age Bracket | Public School | Private School |
| 3 to 4 Year Olds | 0 (0.0%) | 0 (0.0%) |
| 5 to 9 Year Old | 28 (100.0%) | 0 (0.0%) |
| 10 to 14 Year Olds | 77 (84.6%) | 14 (15.4%) |
| 15 to 17 Year Olds | 30 (62.5%) | 18 (37.5%) |
| 18 to 19 Year Olds | 20 (46.5%) | 23 (53.5%) |
| 20 to 24 Year Olds | 26 (63.4%) | 15 (36.6%) |
| 25 to 34 Year Olds | 45 (100.0%) | 0 (0.0%) |
| 35 Years and over | 20 (74.1%) | 7 (25.9%) |
| Total | 246 (76.2%) | 77 (23.8%) |
Educational Attainment by Field of Study in Sylvan Lake
Business (230 | 29.7%), education (94 | 12.1%), science & technology (66 | 8.5%), engineering (58 | 7.5%), and liberal arts & history (52 | 6.7%) are the most common fields of study among 774 individuals in Sylvan Lake who have obtained a bachelor's degree or higher.
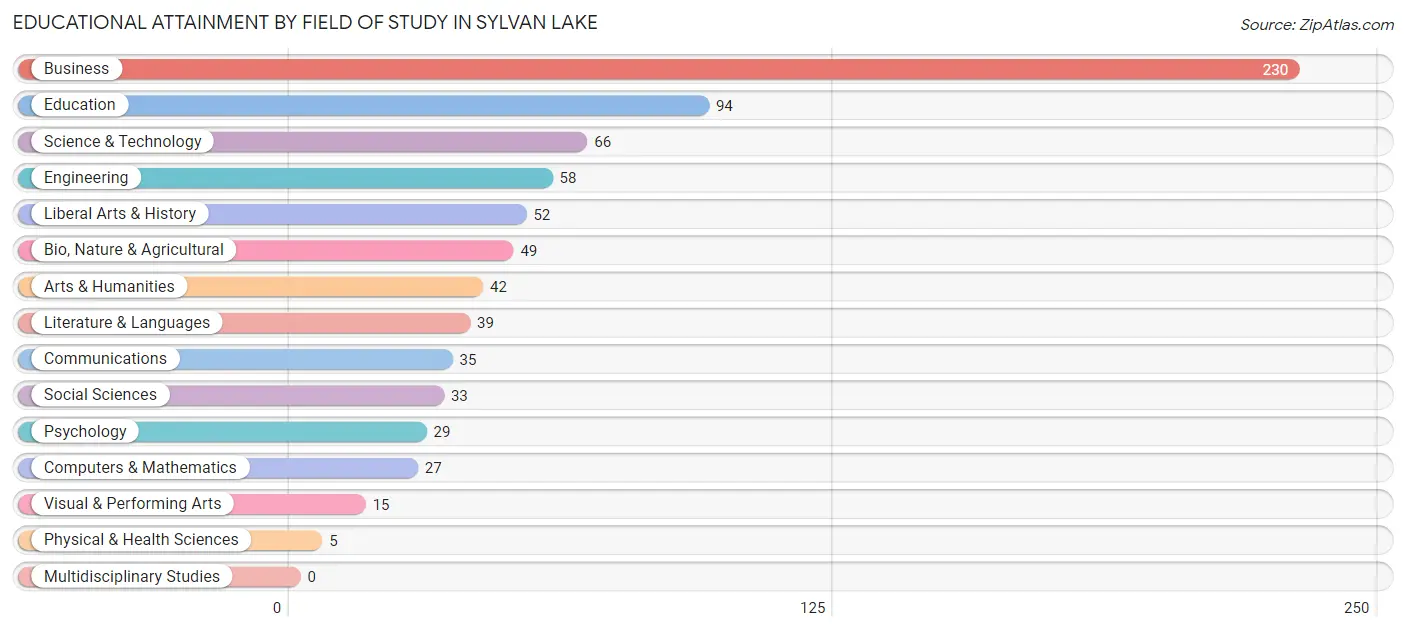
| Field of Study | # Graduates | % Graduates |
| Computers & Mathematics | 27 | 3.5% |
| Bio, Nature & Agricultural | 49 | 6.3% |
| Physical & Health Sciences | 5 | 0.6% |
| Psychology | 29 | 3.7% |
| Social Sciences | 33 | 4.3% |
| Engineering | 58 | 7.5% |
| Multidisciplinary Studies | 0 | 0.0% |
| Science & Technology | 66 | 8.5% |
| Business | 230 | 29.7% |
| Education | 94 | 12.1% |
| Literature & Languages | 39 | 5.0% |
| Liberal Arts & History | 52 | 6.7% |
| Visual & Performing Arts | 15 | 1.9% |
| Communications | 35 | 4.5% |
| Arts & Humanities | 42 | 5.4% |
| Total | 774 | 100.0% |
Transportation & Commute in Sylvan Lake
Vehicle Availability by Sex in Sylvan Lake
The most prevalent vehicle ownership categories in Sylvan Lake are males with 2 vehicles (243, accounting for 46.0%) and females with 2 vehicles (180, making up 62.2%).
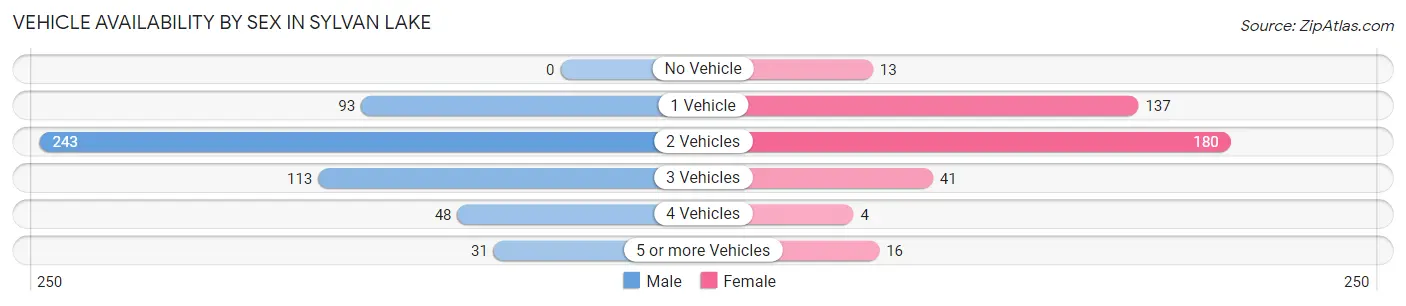
| Vehicles Available | Male | Female |
| No Vehicle | 0 (0.0%) | 13 (3.3%) |
| 1 Vehicle | 93 (17.6%) | 137 (35.0%) |
| 2 Vehicles | 243 (46.0%) | 180 (46.0%) |
| 3 Vehicles | 113 (21.4%) | 41 (10.5%) |
| 4 Vehicles | 48 (9.1%) | 4 (1.0%) |
| 5 or more Vehicles | 31 (5.9%) | 16 (4.1%) |
| Total | 528 (100.0%) | 391 (100.0%) |
Commute Time in Sylvan Lake
The most frequently occuring commute durations in Sylvan Lake are 20 to 24 minutes (121 commuters, 15.6%), 15 to 19 minutes (120 commuters, 15.5%), and 30 to 34 minutes (118 commuters, 15.2%).
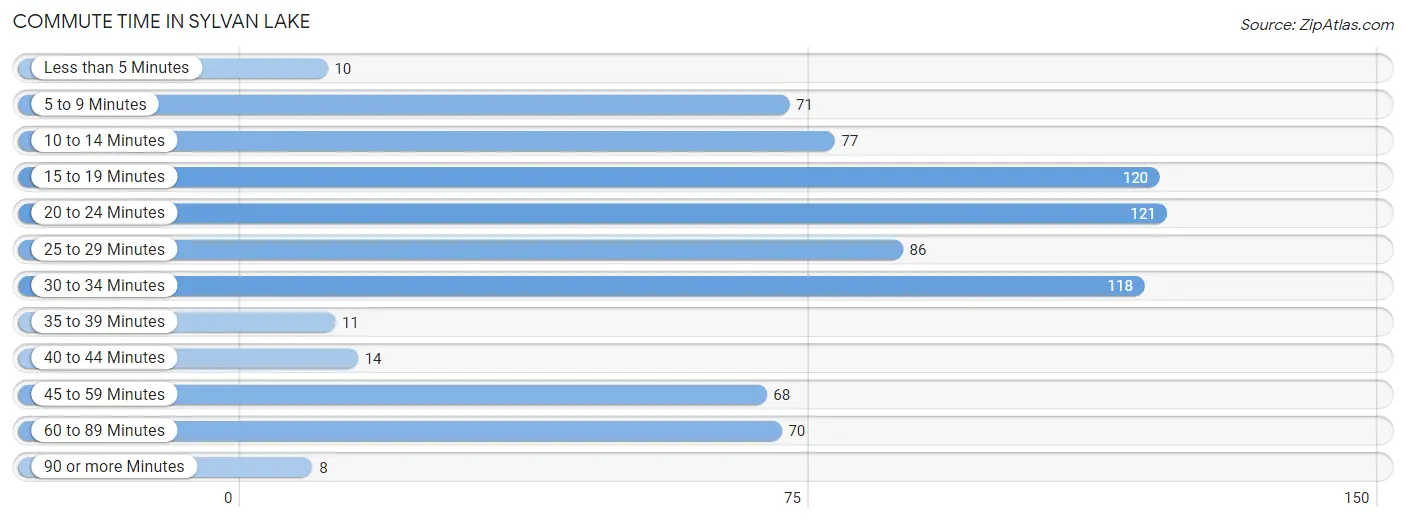
| Commute Time | # Commuters | % Commuters |
| Less than 5 Minutes | 10 | 1.3% |
| 5 to 9 Minutes | 71 | 9.2% |
| 10 to 14 Minutes | 77 | 10.0% |
| 15 to 19 Minutes | 120 | 15.5% |
| 20 to 24 Minutes | 121 | 15.6% |
| 25 to 29 Minutes | 86 | 11.1% |
| 30 to 34 Minutes | 118 | 15.2% |
| 35 to 39 Minutes | 11 | 1.4% |
| 40 to 44 Minutes | 14 | 1.8% |
| 45 to 59 Minutes | 68 | 8.8% |
| 60 to 89 Minutes | 70 | 9.0% |
| 90 or more Minutes | 8 | 1.0% |
Commute Time by Sex in Sylvan Lake
The most common commute times in Sylvan Lake are 15 to 19 minutes (98 commuters, 21.7%) for males and 20 to 24 minutes (66 commuters, 20.4%) for females.
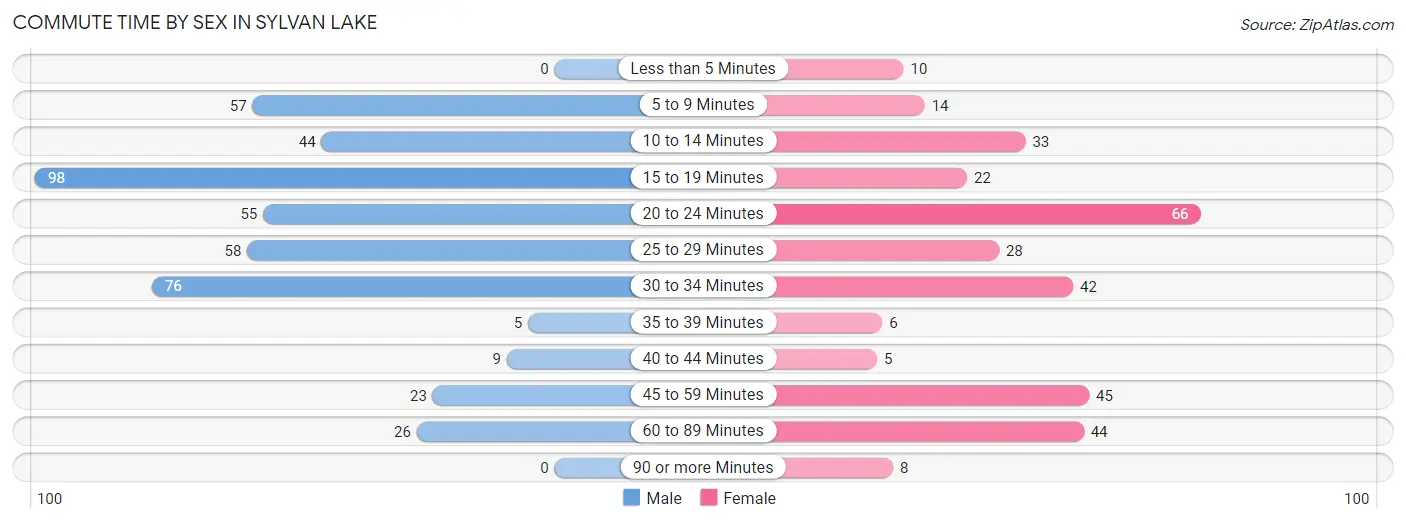
| Commute Time | Male | Female |
| Less than 5 Minutes | 0 (0.0%) | 10 (3.1%) |
| 5 to 9 Minutes | 57 (12.6%) | 14 (4.3%) |
| 10 to 14 Minutes | 44 (9.8%) | 33 (10.2%) |
| 15 to 19 Minutes | 98 (21.7%) | 22 (6.8%) |
| 20 to 24 Minutes | 55 (12.2%) | 66 (20.4%) |
| 25 to 29 Minutes | 58 (12.9%) | 28 (8.7%) |
| 30 to 34 Minutes | 76 (16.9%) | 42 (13.0%) |
| 35 to 39 Minutes | 5 (1.1%) | 6 (1.9%) |
| 40 to 44 Minutes | 9 (2.0%) | 5 (1.5%) |
| 45 to 59 Minutes | 23 (5.1%) | 45 (13.9%) |
| 60 to 89 Minutes | 26 (5.8%) | 44 (13.6%) |
| 90 or more Minutes | 0 (0.0%) | 8 (2.5%) |
Time of Departure to Work by Sex in Sylvan Lake
The most frequent times of departure to work in Sylvan Lake are 7:00 AM to 7:29 AM (68, 15.1%) for males and 7:00 AM to 7:29 AM (67, 20.7%) for females.
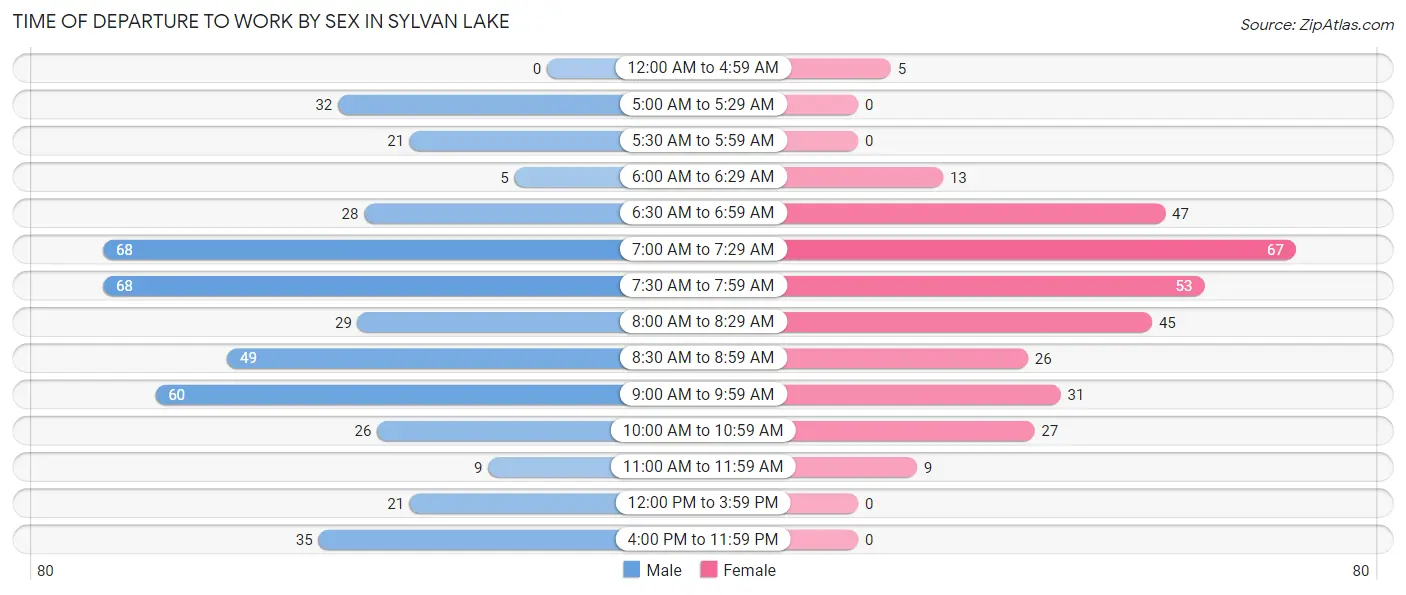
| Time of Departure | Male | Female |
| 12:00 AM to 4:59 AM | 0 (0.0%) | 5 (1.5%) |
| 5:00 AM to 5:29 AM | 32 (7.1%) | 0 (0.0%) |
| 5:30 AM to 5:59 AM | 21 (4.7%) | 0 (0.0%) |
| 6:00 AM to 6:29 AM | 5 (1.1%) | 13 (4.0%) |
| 6:30 AM to 6:59 AM | 28 (6.2%) | 47 (14.5%) |
| 7:00 AM to 7:29 AM | 68 (15.1%) | 67 (20.7%) |
| 7:30 AM to 7:59 AM | 68 (15.1%) | 53 (16.4%) |
| 8:00 AM to 8:29 AM | 29 (6.4%) | 45 (13.9%) |
| 8:30 AM to 8:59 AM | 49 (10.9%) | 26 (8.1%) |
| 9:00 AM to 9:59 AM | 60 (13.3%) | 31 (9.6%) |
| 10:00 AM to 10:59 AM | 26 (5.8%) | 27 (8.4%) |
| 11:00 AM to 11:59 AM | 9 (2.0%) | 9 (2.8%) |
| 12:00 PM to 3:59 PM | 21 (4.7%) | 0 (0.0%) |
| 4:00 PM to 11:59 PM | 35 (7.8%) | 0 (0.0%) |
| Total | 451 (100.0%) | 323 (100.0%) |
Housing Occupancy in Sylvan Lake
Occupancy by Ownership in Sylvan Lake
Of the total 866 dwellings in Sylvan Lake, owner-occupied units account for 689 (79.6%), while renter-occupied units make up 177 (20.4%).
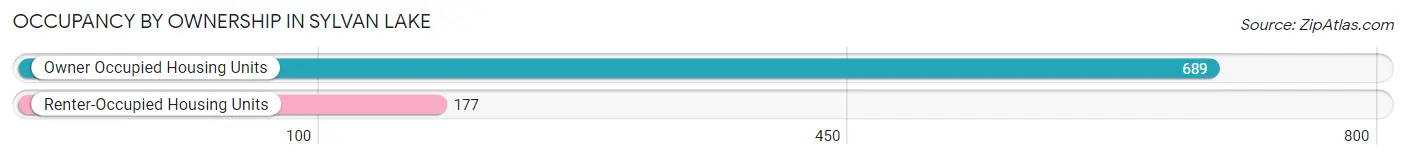
| Occupancy | # Housing Units | % Housing Units |
| Owner Occupied Housing Units | 689 | 79.6% |
| Renter-Occupied Housing Units | 177 | 20.4% |
| Total Occupied Housing Units | 866 | 100.0% |
Occupancy by Household Size in Sylvan Lake
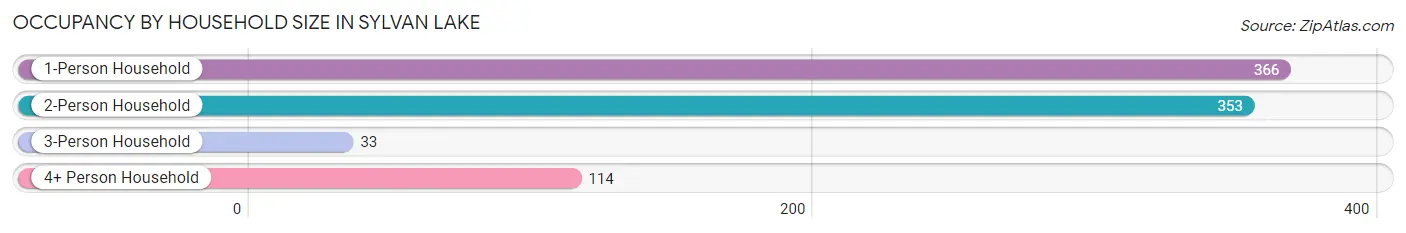
| Household Size | # Housing Units | % Housing Units |
| 1-Person Household | 366 | 42.3% |
| 2-Person Household | 353 | 40.8% |
| 3-Person Household | 33 | 3.8% |
| 4+ Person Household | 114 | 13.2% |
| Total Housing Units | 866 | 100.0% |
Occupancy by Ownership by Household Size in Sylvan Lake
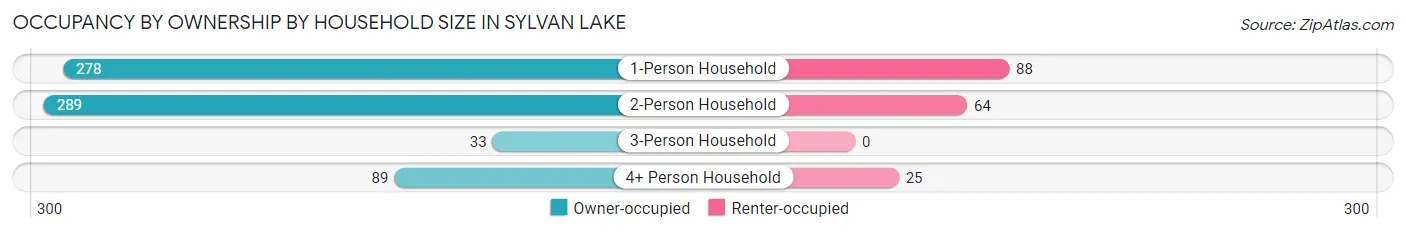
| Household Size | Owner-occupied | Renter-occupied |
| 1-Person Household | 278 (76.0%) | 88 (24.0%) |
| 2-Person Household | 289 (81.9%) | 64 (18.1%) |
| 3-Person Household | 33 (100.0%) | 0 (0.0%) |
| 4+ Person Household | 89 (78.1%) | 25 (21.9%) |
| Total Housing Units | 689 (79.6%) | 177 (20.4%) |
Occupancy by Educational Attainment in Sylvan Lake

| Household Size | Owner-occupied | Renter-occupied |
| Less than High School | 0 (0.0%) | 0 (0.0%) |
| High School Diploma | 114 (76.0%) | 36 (24.0%) |
| College/Associate Degree | 142 (62.3%) | 86 (37.7%) |
| Bachelor's Degree or higher | 433 (88.7%) | 55 (11.3%) |
Occupancy by Age of Householder in Sylvan Lake
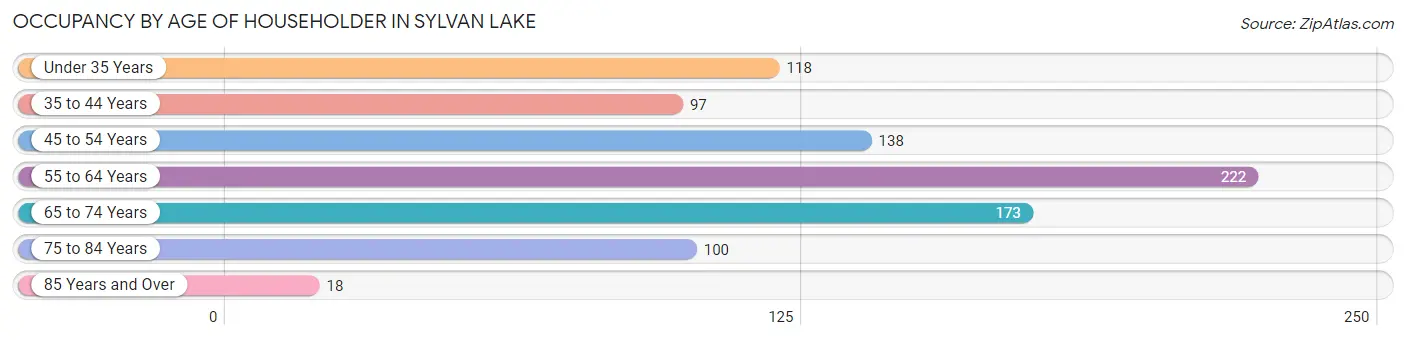
| Age Bracket | # Households | % Households |
| Under 35 Years | 118 | 13.6% |
| 35 to 44 Years | 97 | 11.2% |
| 45 to 54 Years | 138 | 15.9% |
| 55 to 64 Years | 222 | 25.6% |
| 65 to 74 Years | 173 | 20.0% |
| 75 to 84 Years | 100 | 11.6% |
| 85 Years and Over | 18 | 2.1% |
| Total | 866 | 100.0% |
Housing Finances in Sylvan Lake
Median Income by Occupancy in Sylvan Lake
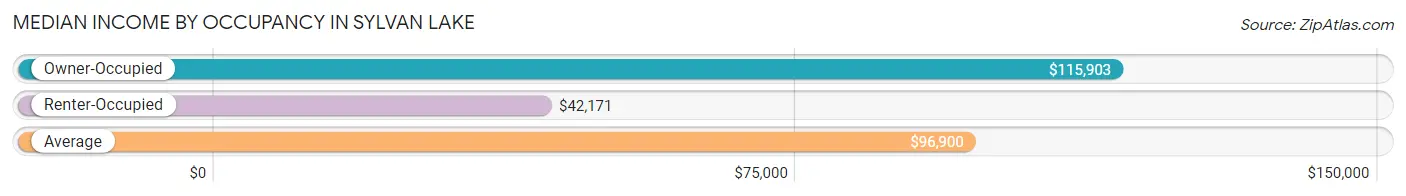
| Occupancy Type | # Households | Median Income |
| Owner-Occupied | 689 (79.6%) | $115,903 |
| Renter-Occupied | 177 (20.4%) | $42,171 |
| Average | 866 (100.0%) | $96,900 |
Occupancy by Householder Income Bracket in Sylvan Lake
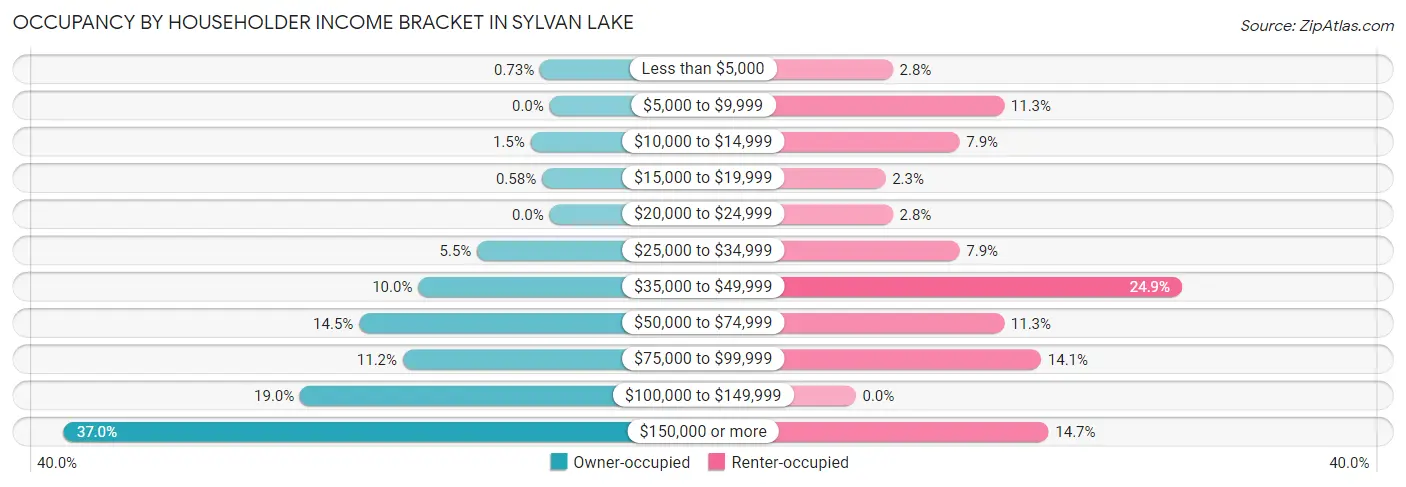
| Income Bracket | Owner-occupied | Renter-occupied |
| Less than $5,000 | 5 (0.7%) | 5 (2.8%) |
| $5,000 to $9,999 | 0 (0.0%) | 20 (11.3%) |
| $10,000 to $14,999 | 10 (1.5%) | 14 (7.9%) |
| $15,000 to $19,999 | 4 (0.6%) | 4 (2.3%) |
| $20,000 to $24,999 | 0 (0.0%) | 5 (2.8%) |
| $25,000 to $34,999 | 38 (5.5%) | 14 (7.9%) |
| $35,000 to $49,999 | 69 (10.0%) | 44 (24.9%) |
| $50,000 to $74,999 | 100 (14.5%) | 20 (11.3%) |
| $75,000 to $99,999 | 77 (11.2%) | 25 (14.1%) |
| $100,000 to $149,999 | 131 (19.0%) | 0 (0.0%) |
| $150,000 or more | 255 (37.0%) | 26 (14.7%) |
| Total | 689 (100.0%) | 177 (100.0%) |
Monthly Housing Cost Tiers in Sylvan Lake
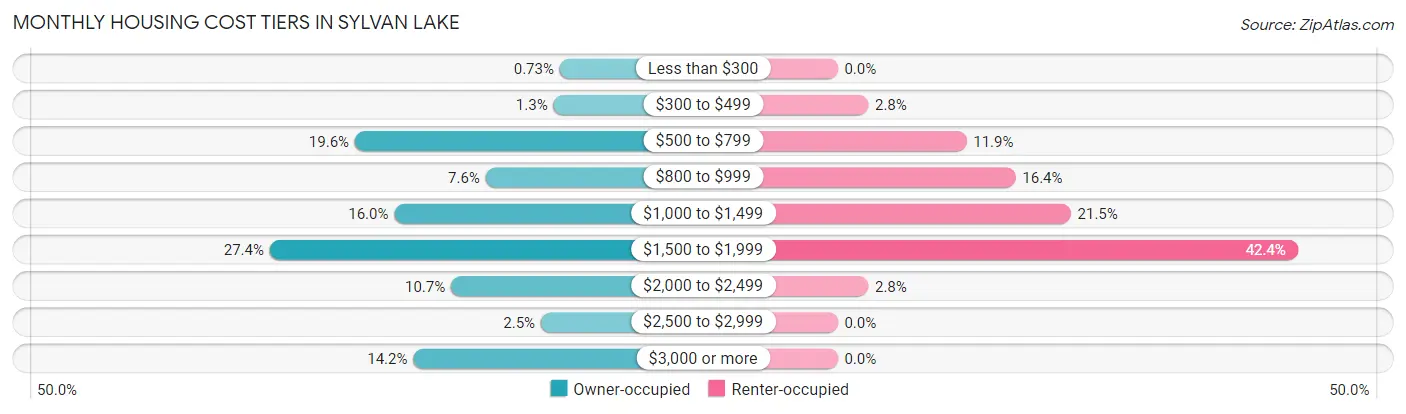
| Monthly Cost | Owner-occupied | Renter-occupied |
| Less than $300 | 5 (0.7%) | 0 (0.0%) |
| $300 to $499 | 9 (1.3%) | 5 (2.8%) |
| $500 to $799 | 135 (19.6%) | 21 (11.9%) |
| $800 to $999 | 52 (7.5%) | 29 (16.4%) |
| $1,000 to $1,499 | 110 (16.0%) | 38 (21.5%) |
| $1,500 to $1,999 | 189 (27.4%) | 75 (42.4%) |
| $2,000 to $2,499 | 74 (10.7%) | 5 (2.8%) |
| $2,500 to $2,999 | 17 (2.5%) | 0 (0.0%) |
| $3,000 or more | 98 (14.2%) | 0 (0.0%) |
| Total | 689 (100.0%) | 177 (100.0%) |
Physical Housing Characteristics in Sylvan Lake
Housing Structures in Sylvan Lake
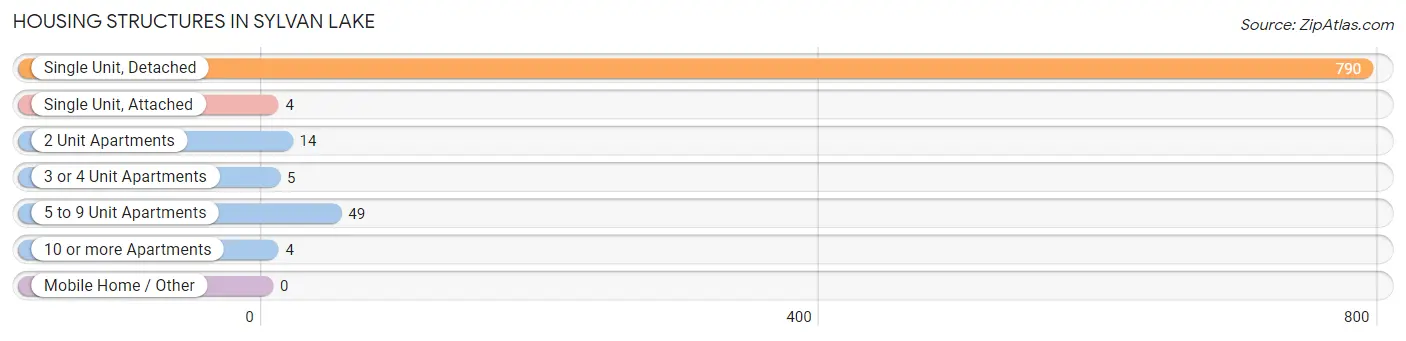
| Structure Type | # Housing Units | % Housing Units |
| Single Unit, Detached | 790 | 91.2% |
| Single Unit, Attached | 4 | 0.5% |
| 2 Unit Apartments | 14 | 1.6% |
| 3 or 4 Unit Apartments | 5 | 0.6% |
| 5 to 9 Unit Apartments | 49 | 5.7% |
| 10 or more Apartments | 4 | 0.5% |
| Mobile Home / Other | 0 | 0.0% |
| Total | 866 | 100.0% |
Housing Structures by Occupancy in Sylvan Lake
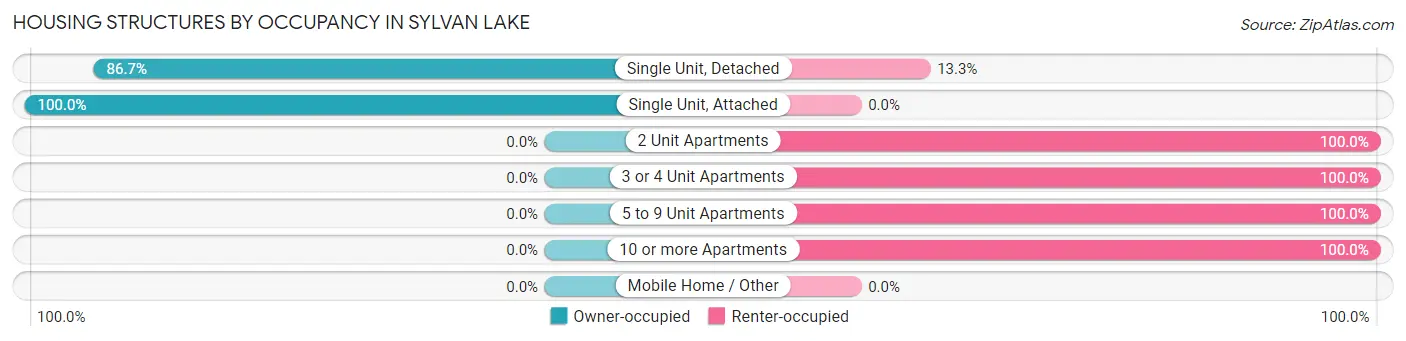
| Structure Type | Owner-occupied | Renter-occupied |
| Single Unit, Detached | 685 (86.7%) | 105 (13.3%) |
| Single Unit, Attached | 4 (100.0%) | 0 (0.0%) |
| 2 Unit Apartments | 0 (0.0%) | 14 (100.0%) |
| 3 or 4 Unit Apartments | 0 (0.0%) | 5 (100.0%) |
| 5 to 9 Unit Apartments | 0 (0.0%) | 49 (100.0%) |
| 10 or more Apartments | 0 (0.0%) | 4 (100.0%) |
| Mobile Home / Other | 0 (0.0%) | 0 (0.0%) |
| Total | 689 (79.6%) | 177 (20.4%) |
Housing Structures by Number of Rooms in Sylvan Lake
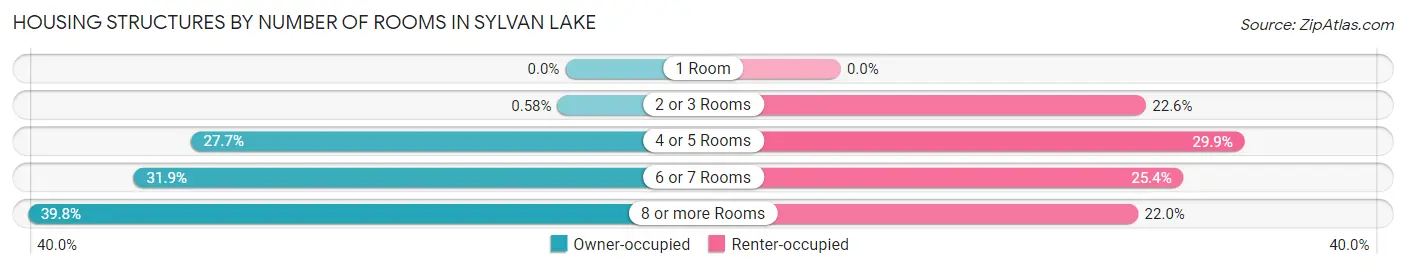
| Number of Rooms | Owner-occupied | Renter-occupied |
| 1 Room | 0 (0.0%) | 0 (0.0%) |
| 2 or 3 Rooms | 4 (0.6%) | 40 (22.6%) |
| 4 or 5 Rooms | 191 (27.7%) | 53 (29.9%) |
| 6 or 7 Rooms | 220 (31.9%) | 45 (25.4%) |
| 8 or more Rooms | 274 (39.8%) | 39 (22.0%) |
| Total | 689 (100.0%) | 177 (100.0%) |
Housing Structure by Heating Type in Sylvan Lake
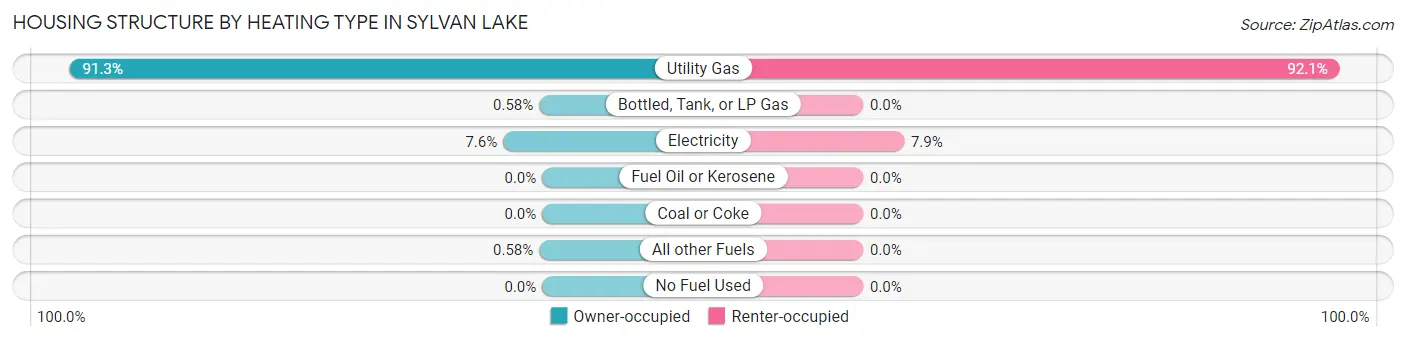
| Heating Type | Owner-occupied | Renter-occupied |
| Utility Gas | 629 (91.3%) | 163 (92.1%) |
| Bottled, Tank, or LP Gas | 4 (0.6%) | 0 (0.0%) |
| Electricity | 52 (7.5%) | 14 (7.9%) |
| Fuel Oil or Kerosene | 0 (0.0%) | 0 (0.0%) |
| Coal or Coke | 0 (0.0%) | 0 (0.0%) |
| All other Fuels | 4 (0.6%) | 0 (0.0%) |
| No Fuel Used | 0 (0.0%) | 0 (0.0%) |
| Total | 689 (100.0%) | 177 (100.0%) |
Household Vehicle Usage in Sylvan Lake
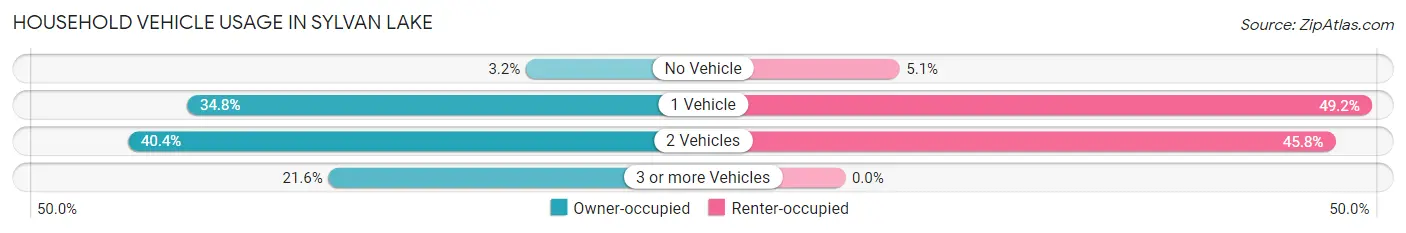
| Vehicles per Household | Owner-occupied | Renter-occupied |
| No Vehicle | 22 (3.2%) | 9 (5.1%) |
| 1 Vehicle | 240 (34.8%) | 87 (49.1%) |
| 2 Vehicles | 278 (40.4%) | 81 (45.8%) |
| 3 or more Vehicles | 149 (21.6%) | 0 (0.0%) |
| Total | 689 (100.0%) | 177 (100.0%) |
Real Estate & Mortgages in Sylvan Lake
Real Estate and Mortgage Overview in Sylvan Lake
| Characteristic | Without Mortgage | With Mortgage |
| Housing Units | 236 | 453 |
| Median Property Value | $339,700 | $293,800 |
| Median Household Income | $81,875 | $192 |
| Monthly Housing Costs | $728 | $92 |
| Real Estate Taxes | $4,075 | $5 |
Property Value by Mortgage Status in Sylvan Lake
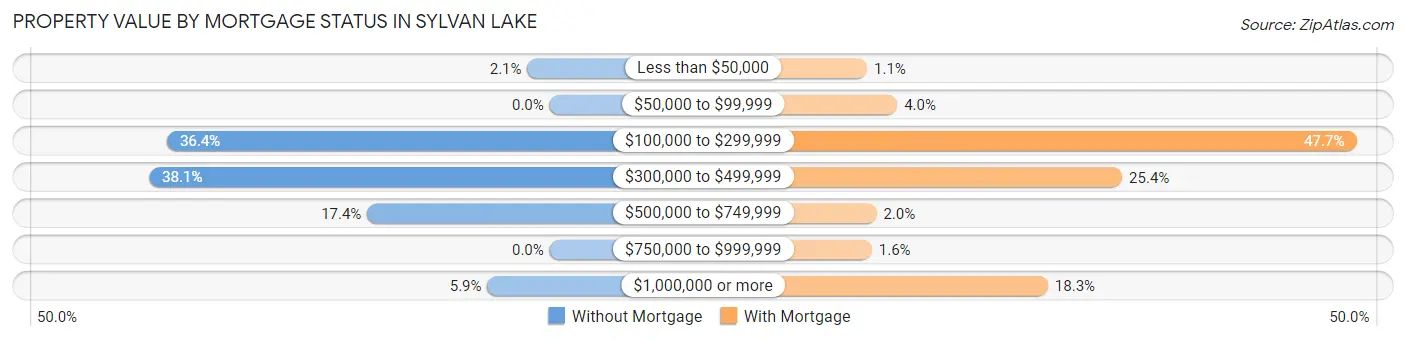
| Property Value | Without Mortgage | With Mortgage |
| Less than $50,000 | 5 (2.1%) | 5 (1.1%) |
| $50,000 to $99,999 | 0 (0.0%) | 18 (4.0%) |
| $100,000 to $299,999 | 86 (36.4%) | 216 (47.7%) |
| $300,000 to $499,999 | 90 (38.1%) | 115 (25.4%) |
| $500,000 to $749,999 | 41 (17.4%) | 9 (2.0%) |
| $750,000 to $999,999 | 0 (0.0%) | 7 (1.5%) |
| $1,000,000 or more | 14 (5.9%) | 83 (18.3%) |
| Total | 236 (100.0%) | 453 (100.0%) |
Household Income by Mortgage Status in Sylvan Lake
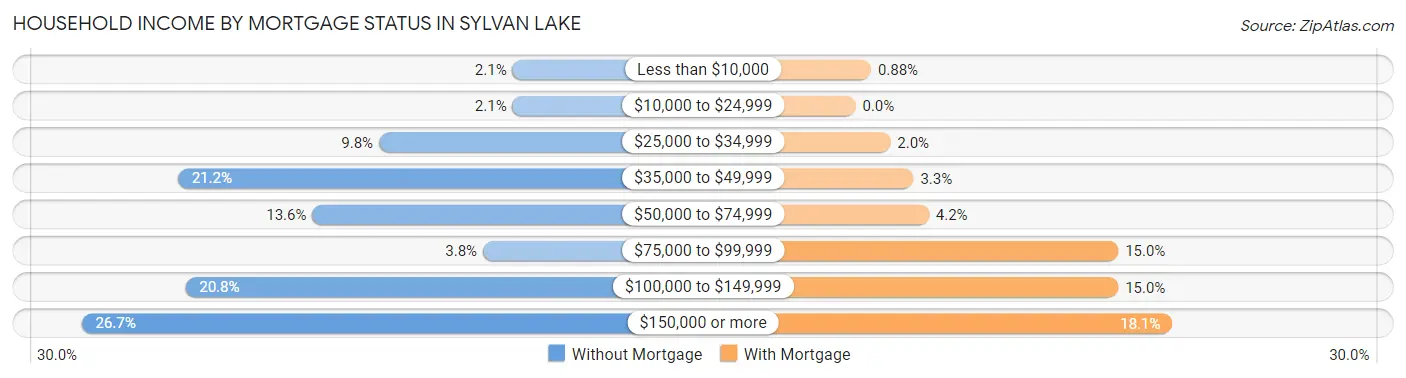
| Household Income | Without Mortgage | With Mortgage |
| Less than $10,000 | 5 (2.1%) | 4 (0.9%) |
| $10,000 to $24,999 | 5 (2.1%) | 0 (0.0%) |
| $25,000 to $34,999 | 23 (9.8%) | 9 (2.0%) |
| $35,000 to $49,999 | 50 (21.2%) | 15 (3.3%) |
| $50,000 to $74,999 | 32 (13.6%) | 19 (4.2%) |
| $75,000 to $99,999 | 9 (3.8%) | 68 (15.0%) |
| $100,000 to $149,999 | 49 (20.8%) | 68 (15.0%) |
| $150,000 or more | 63 (26.7%) | 82 (18.1%) |
| Total | 236 (100.0%) | 453 (100.0%) |
Property Value to Household Income Ratio in Sylvan Lake
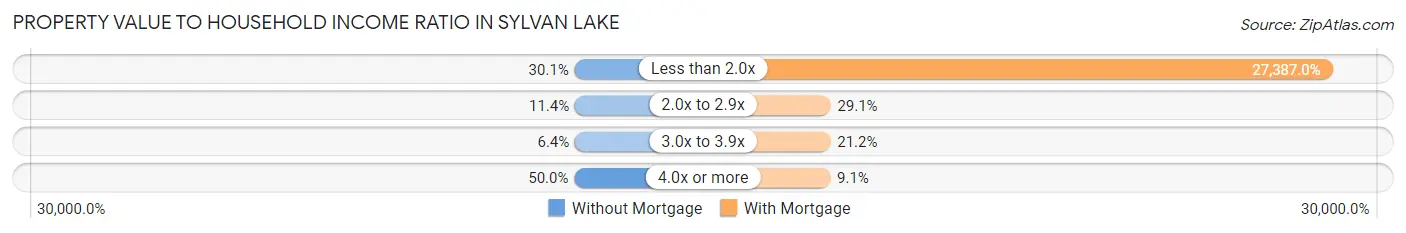
| Value-to-Income Ratio | Without Mortgage | With Mortgage |
| Less than 2.0x | 71 (30.1%) | 124,063 (27,387.0%) |
| 2.0x to 2.9x | 27 (11.4%) | 132 (29.1%) |
| 3.0x to 3.9x | 15 (6.4%) | 96 (21.2%) |
| 4.0x or more | 118 (50.0%) | 41 (9.0%) |
| Total | 236 (100.0%) | 453 (100.0%) |
Real Estate Taxes by Mortgage Status in Sylvan Lake
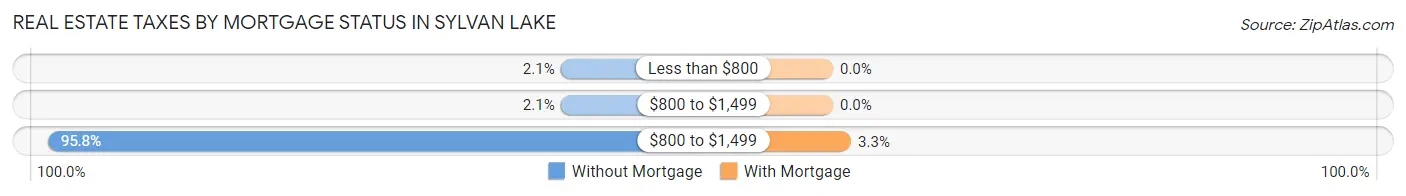
| Property Taxes | Without Mortgage | With Mortgage |
| Less than $800 | 5 (2.1%) | 0 (0.0%) |
| $800 to $1,499 | 5 (2.1%) | 0 (0.0%) |
| $800 to $1,499 | 226 (95.8%) | 15 (3.3%) |
| Total | 236 (100.0%) | 453 (100.0%) |
Health & Disability in Sylvan Lake
Health Insurance Coverage by Age in Sylvan Lake
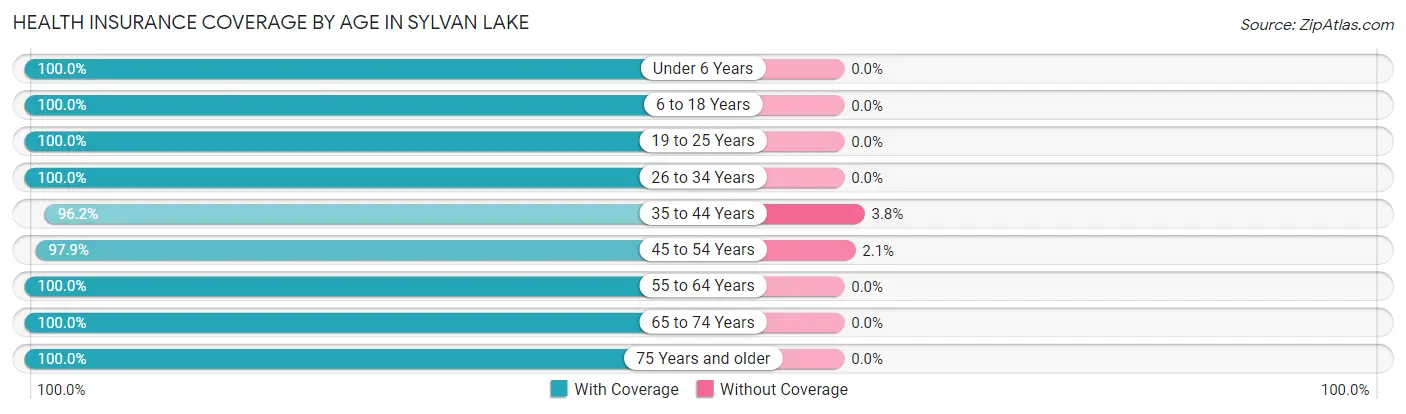
| Age Bracket | With Coverage | Without Coverage |
| Under 6 Years | 55 (100.0%) | 0 (0.0%) |
| 6 to 18 Years | 210 (100.0%) | 0 (0.0%) |
| 19 to 25 Years | 97 (100.0%) | 0 (0.0%) |
| 26 to 34 Years | 210 (100.0%) | 0 (0.0%) |
| 35 to 44 Years | 153 (96.2%) | 6 (3.8%) |
| 45 to 54 Years | 238 (97.9%) | 5 (2.1%) |
| 55 to 64 Years | 375 (100.0%) | 0 (0.0%) |
| 65 to 74 Years | 226 (100.0%) | 0 (0.0%) |
| 75 Years and older | 154 (100.0%) | 0 (0.0%) |
| Total | 1,718 (99.4%) | 11 (0.6%) |
Health Insurance Coverage by Citizenship Status in Sylvan Lake
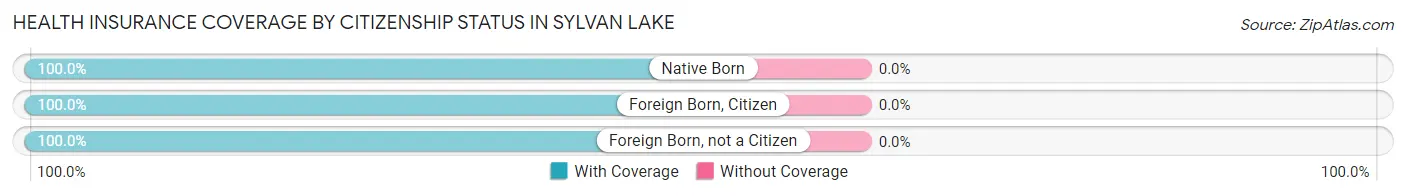
| Citizenship Status | With Coverage | Without Coverage |
| Native Born | 55 (100.0%) | 0 (0.0%) |
| Foreign Born, Citizen | 210 (100.0%) | 0 (0.0%) |
| Foreign Born, not a Citizen | 97 (100.0%) | 0 (0.0%) |
Health Insurance Coverage by Household Income in Sylvan Lake
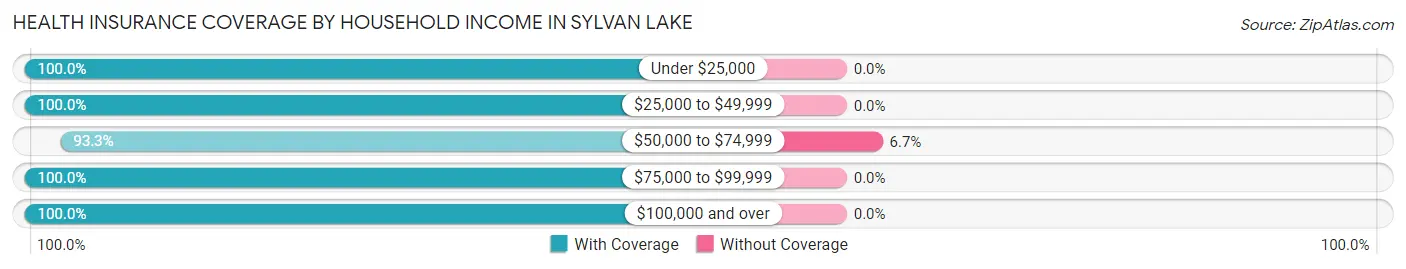
| Household Income | With Coverage | Without Coverage |
| Under $25,000 | 83 (100.0%) | 0 (0.0%) |
| $25,000 to $49,999 | 206 (100.0%) | 0 (0.0%) |
| $50,000 to $74,999 | 153 (93.3%) | 11 (6.7%) |
| $75,000 to $99,999 | 254 (100.0%) | 0 (0.0%) |
| $100,000 and over | 1,022 (100.0%) | 0 (0.0%) |
Public vs Private Health Insurance Coverage by Age in Sylvan Lake
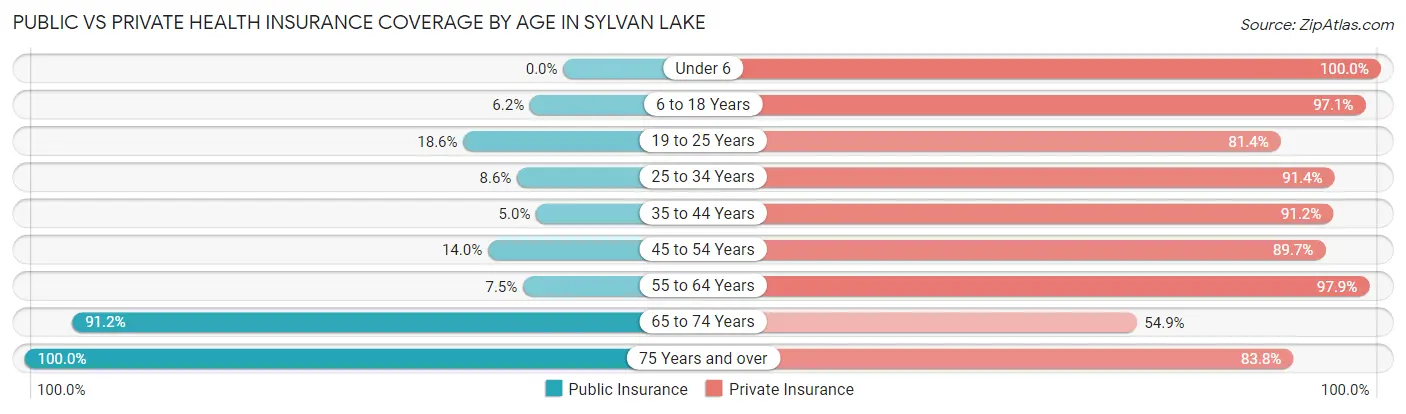
| Age Bracket | Public Insurance | Private Insurance |
| Under 6 | 0 (0.0%) | 55 (100.0%) |
| 6 to 18 Years | 13 (6.2%) | 204 (97.1%) |
| 19 to 25 Years | 18 (18.6%) | 79 (81.4%) |
| 25 to 34 Years | 18 (8.6%) | 192 (91.4%) |
| 35 to 44 Years | 8 (5.0%) | 145 (91.2%) |
| 45 to 54 Years | 34 (14.0%) | 218 (89.7%) |
| 55 to 64 Years | 28 (7.5%) | 367 (97.9%) |
| 65 to 74 Years | 206 (91.1%) | 124 (54.9%) |
| 75 Years and over | 154 (100.0%) | 129 (83.8%) |
| Total | 479 (27.7%) | 1,513 (87.5%) |
Disability Status by Sex by Age in Sylvan Lake
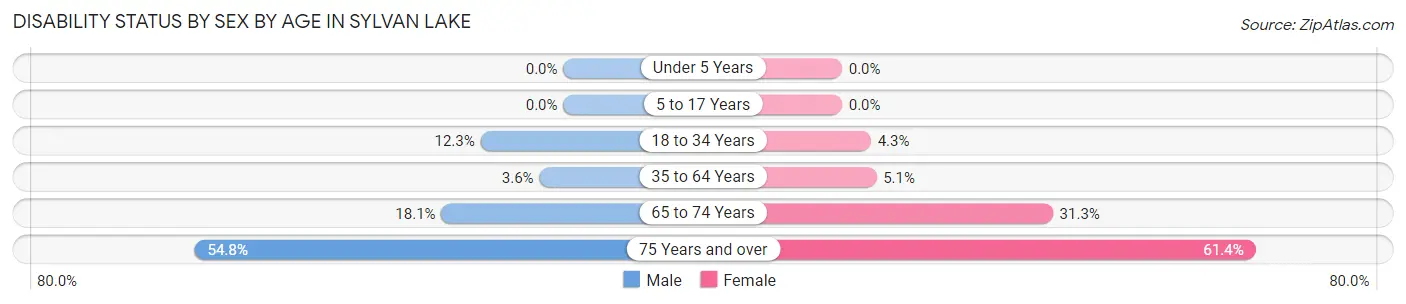
| Age Bracket | Male | Female |
| Under 5 Years | 0 (0.0%) | 0 (0.0%) |
| 5 to 17 Years | 0 (0.0%) | 0 (0.0%) |
| 18 to 34 Years | 23 (12.3%) | 7 (4.3%) |
| 35 to 64 Years | 13 (3.5%) | 21 (5.1%) |
| 65 to 74 Years | 23 (18.1%) | 31 (31.3%) |
| 75 Years and over | 46 (54.8%) | 43 (61.4%) |
Disability Class by Sex by Age in Sylvan Lake
Disability Class: Hearing Difficulty
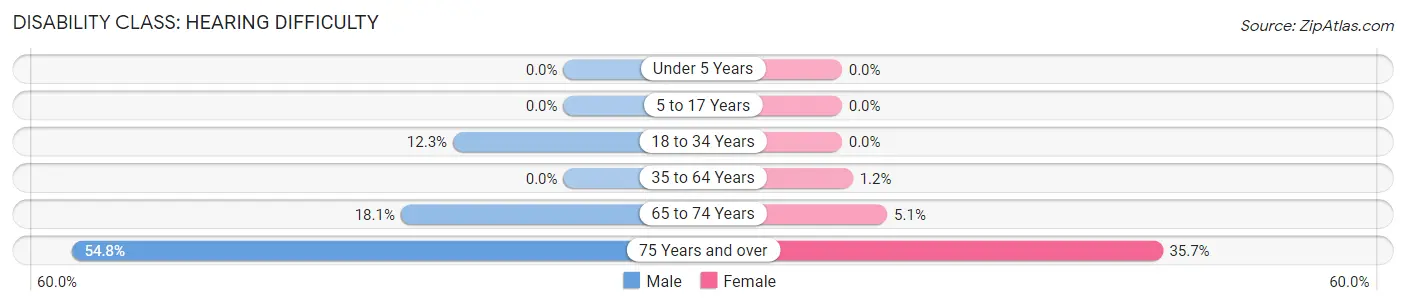
| Age Bracket | Male | Female |
| Under 5 Years | 0 (0.0%) | 0 (0.0%) |
| 5 to 17 Years | 0 (0.0%) | 0 (0.0%) |
| 18 to 34 Years | 23 (12.3%) | 0 (0.0%) |
| 35 to 64 Years | 0 (0.0%) | 5 (1.2%) |
| 65 to 74 Years | 23 (18.1%) | 5 (5.1%) |
| 75 Years and over | 46 (54.8%) | 25 (35.7%) |
Disability Class: Vision Difficulty
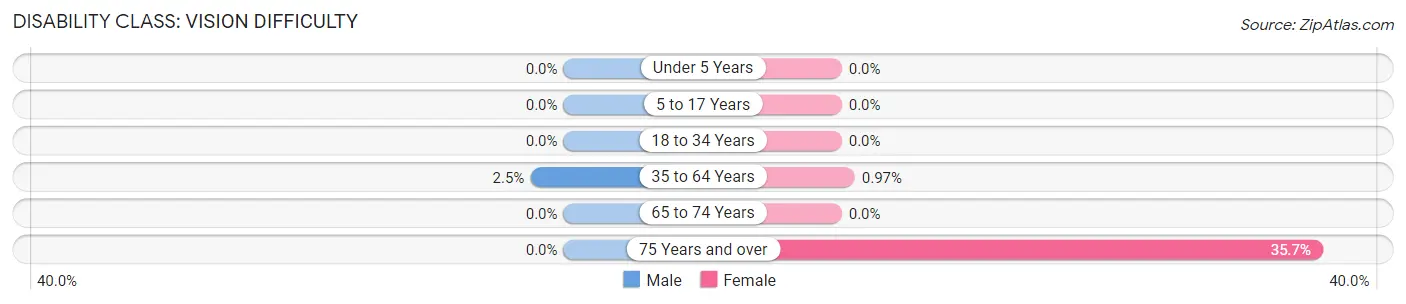
| Age Bracket | Male | Female |
| Under 5 Years | 0 (0.0%) | 0 (0.0%) |
| 5 to 17 Years | 0 (0.0%) | 0 (0.0%) |
| 18 to 34 Years | 0 (0.0%) | 0 (0.0%) |
| 35 to 64 Years | 9 (2.5%) | 4 (1.0%) |
| 65 to 74 Years | 0 (0.0%) | 0 (0.0%) |
| 75 Years and over | 0 (0.0%) | 25 (35.7%) |
Disability Class: Cognitive Difficulty
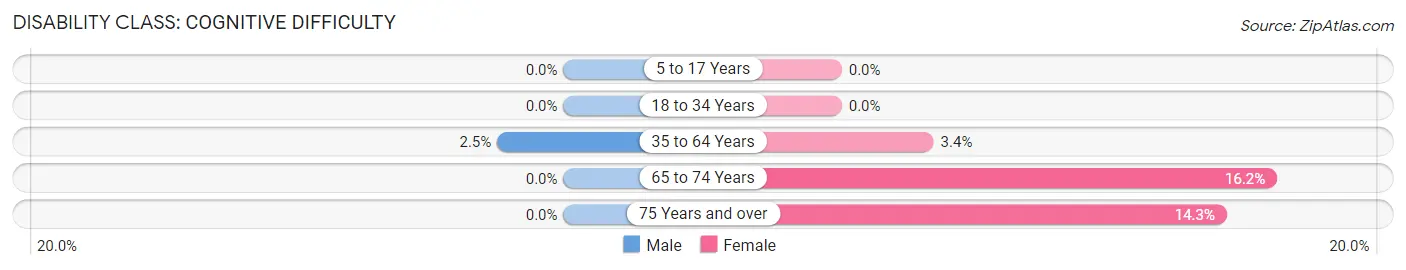
| Age Bracket | Male | Female |
| 5 to 17 Years | 0 (0.0%) | 0 (0.0%) |
| 18 to 34 Years | 0 (0.0%) | 0 (0.0%) |
| 35 to 64 Years | 9 (2.5%) | 14 (3.4%) |
| 65 to 74 Years | 0 (0.0%) | 16 (16.2%) |
| 75 Years and over | 0 (0.0%) | 10 (14.3%) |
Disability Class: Ambulatory Difficulty
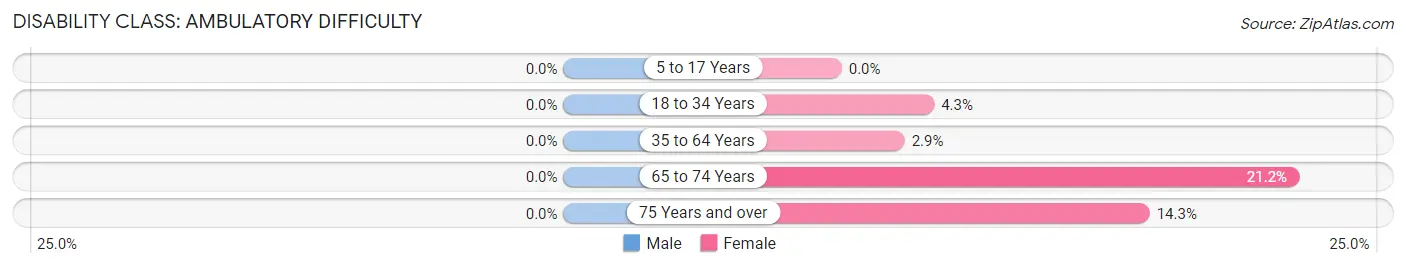
| Age Bracket | Male | Female |
| 5 to 17 Years | 0 (0.0%) | 0 (0.0%) |
| 18 to 34 Years | 0 (0.0%) | 7 (4.3%) |
| 35 to 64 Years | 0 (0.0%) | 12 (2.9%) |
| 65 to 74 Years | 0 (0.0%) | 21 (21.2%) |
| 75 Years and over | 0 (0.0%) | 10 (14.3%) |
Disability Class: Self-Care Difficulty
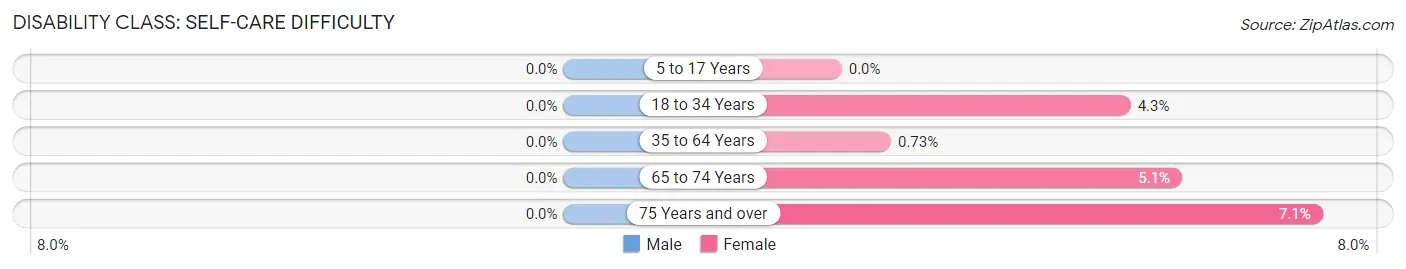
| Age Bracket | Male | Female |
| 5 to 17 Years | 0 (0.0%) | 0 (0.0%) |
| 18 to 34 Years | 0 (0.0%) | 7 (4.3%) |
| 35 to 64 Years | 0 (0.0%) | 3 (0.7%) |
| 65 to 74 Years | 0 (0.0%) | 5 (5.1%) |
| 75 Years and over | 0 (0.0%) | 5 (7.1%) |
Technology Access in Sylvan Lake
Computing Device Access in Sylvan Lake
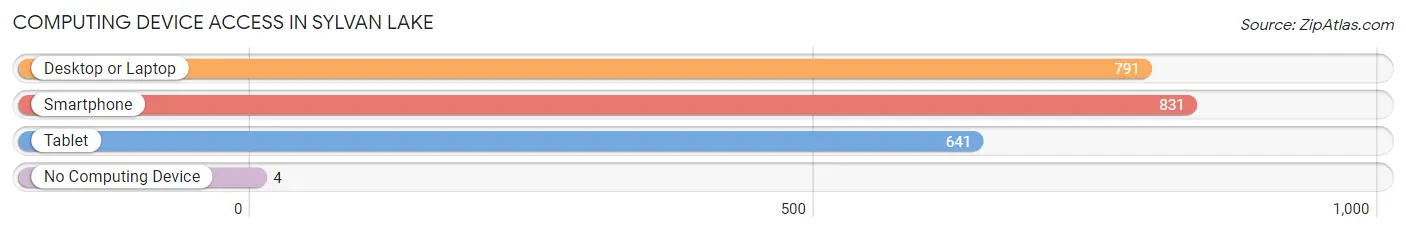
| Device Type | # Households | % Households |
| Desktop or Laptop | 791 | 91.3% |
| Smartphone | 831 | 96.0% |
| Tablet | 641 | 74.0% |
| No Computing Device | 4 | 0.5% |
| Total | 866 | 100.0% |
Internet Access in Sylvan Lake
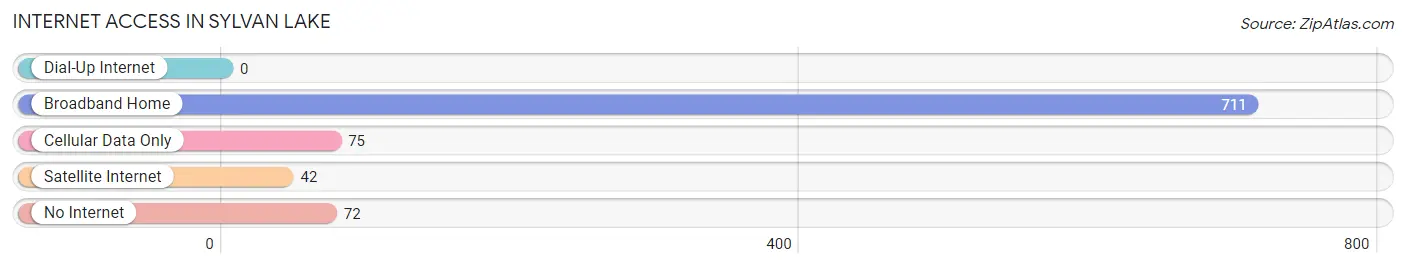
| Internet Type | # Households | % Households |
| Dial-Up Internet | 0 | 0.0% |
| Broadband Home | 711 | 82.1% |
| Cellular Data Only | 75 | 8.7% |
| Satellite Internet | 42 | 4.9% |
| No Internet | 72 | 8.3% |
| Total | 866 | 100.0% |
Sylvan Lake Summary
Sylvan Lake is a small town located in Oakland County, Michigan. It is situated on the western shore of Sylvan Lake, a natural lake that is part of the Huron River watershed. The town was founded in 1837 and has a population of approximately 2,000 people.
History
Sylvan Lake was first settled in 1837 by a group of settlers from New York. The settlers named the lake after the Latin word for “wooded”, and the town was named after the lake. The town was originally a farming community, but in the late 19th century, it became a popular summer resort destination. The town was incorporated in 1891 and the first mayor was elected in 1892.
In the early 20th century, Sylvan Lake became a popular destination for wealthy Detroiters looking to escape the city. The town was home to several large estates, including the estate of Henry Ford. The town also became a popular destination for boaters and fishermen.
Geography
Sylvan Lake is located in Oakland County, Michigan. It is situated on the western shore of Sylvan Lake, a natural lake that is part of the Huron River watershed. The town is bordered by the cities of West Bloomfield and Keego Harbor to the north, and the city of Waterford to the south. The town is approximately 25 miles northwest of Detroit.
The town has a total area of 1.2 square miles, all of which is land. The terrain is mostly flat, with some rolling hills. The town is located in a temperate climate zone, with hot summers and cold winters.
Economy
Sylvan Lake has a diverse economy, with a mix of retail, manufacturing, and service businesses. The town is home to several small businesses, including a grocery store, a hardware store, and a restaurant. The town is also home to several large employers, including a manufacturing plant and a medical center.
The town is also home to several recreational businesses, including a marina, a golf course, and a beach. The town is also home to several parks, including a nature preserve and a public beach.
Demographics
As of the 2010 census, the population of Sylvan Lake was 2,000. The racial makeup of the town was 95.2% White, 1.2% African American, 0.7% Native American, 0.7% Asian, 0.2% Pacific Islander, and 1.9% from other races. The median household income was $50,000, and the median family income was $60,000.
Conclusion
Sylvan Lake is a small town located in Oakland County, Michigan. It is situated on the western shore of Sylvan Lake, a natural lake that is part of the Huron River watershed. The town was founded in 1837 and has a population of approximately 2,000 people. The town has a diverse economy, with a mix of retail, manufacturing, and service businesses. The town is also home to several recreational businesses, including a marina, a golf course, and a beach. As of the 2010 census, the population of Sylvan Lake was 2,000. The racial makeup of the town was 95.2% White, 1.2% African American, 0.7% Native American, 0.7% Asian, 0.2% Pacific Islander, and 1.9% from other races. The median household income was $50,000, and the median family income was $60,000.
Common Questions
What is Per Capita Income in Sylvan Lake?
Per Capita income in Sylvan Lake is $77,967.
What is the Median Family Income in Sylvan Lake?
Median Family Income in Sylvan Lake is $174,063.
What is the Median Household income in Sylvan Lake?
Median Household Income in Sylvan Lake is $96,900.
What is Income or Wage Gap in Sylvan Lake?
Income or Wage Gap in Sylvan Lake is 6.1%.
Women in Sylvan Lake earn 93.9 cents for every dollar earned by a man.
What is Inequality or Gini Index in Sylvan Lake?
Inequality or Gini Index in Sylvan Lake is 0.52.
What is the Total Population of Sylvan Lake?
Total Population of Sylvan Lake is 1,729.
What is the Total Male Population of Sylvan Lake?
Total Male Population of Sylvan Lake is 870.
What is the Total Female Population of Sylvan Lake?
Total Female Population of Sylvan Lake is 859.
What is the Ratio of Males per 100 Females in Sylvan Lake?
There are 101.28 Males per 100 Females in Sylvan Lake.
What is the Ratio of Females per 100 Males in Sylvan Lake?
There are 98.74 Females per 100 Males in Sylvan Lake.
What is the Median Population Age in Sylvan Lake?
Median Population Age in Sylvan Lake is 51.9 Years.
What is the Average Family Size in Sylvan Lake
Average Family Size in Sylvan Lake is 2.8 People.
What is the Average Household Size in Sylvan Lake
Average Household Size in Sylvan Lake is 2.0 People.
How Large is the Labor Force in Sylvan Lake?
There are 989 People in the Labor Forcein in Sylvan Lake.
What is the Percentage of People in the Labor Force in Sylvan Lake?
64.2% of People are in the Labor Force in Sylvan Lake.
What is the Unemployment Rate in Sylvan Lake?
Unemployment Rate in Sylvan Lake is 4.6%.