Shorewood Tower Hills Harbert, MI Map & Demographics
Shorewood Tower Hills Harbert Map
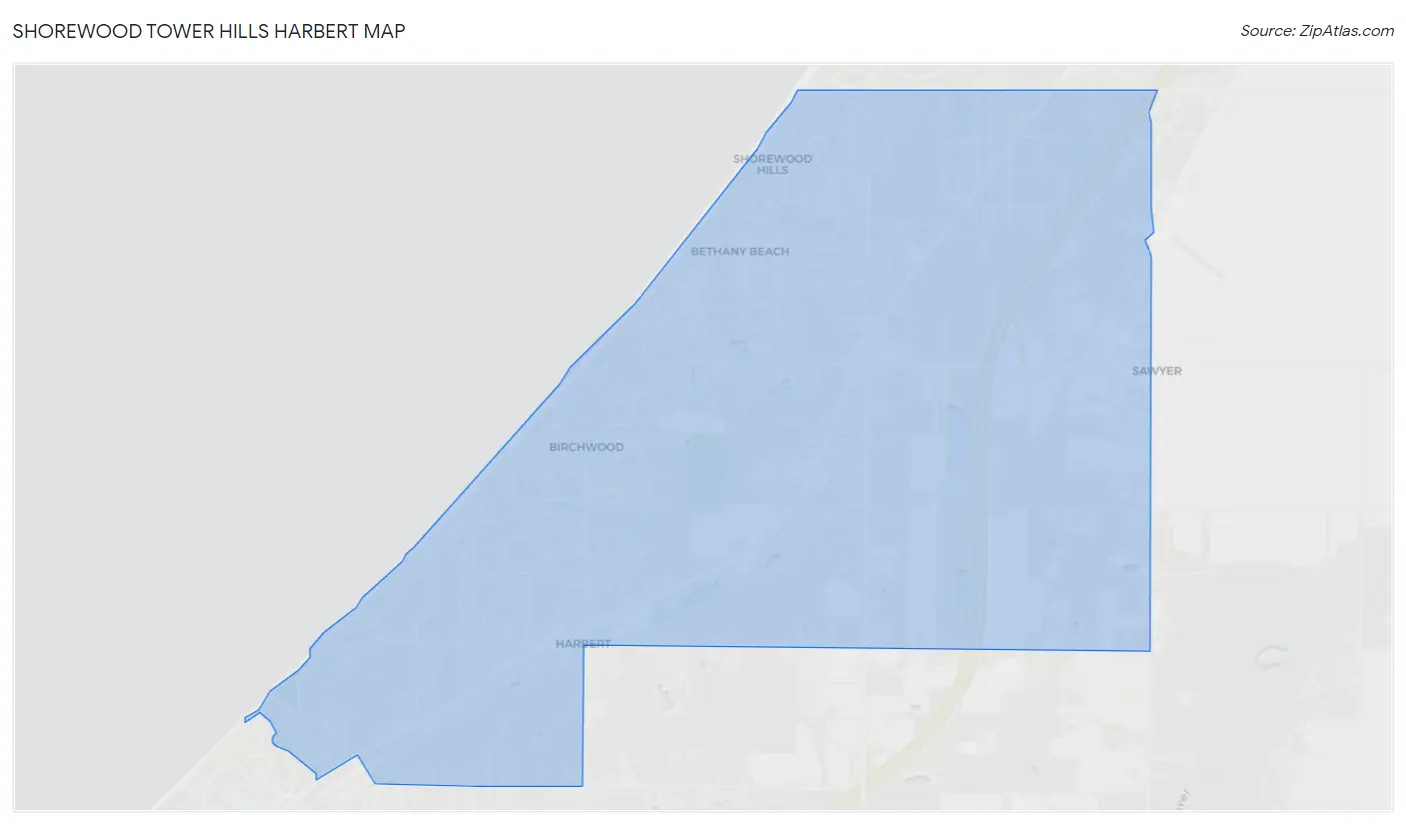
Shorewood Tower Hills Harbert Overview
$59,811
PER CAPITA INCOME
$79,826
AVG FAMILY INCOME
$77,674
AVG HOUSEHOLD INCOME
19.8%
WAGE / INCOME GAP [ % ]
80.2¢/ $1
WAGE / INCOME GAP [ $ ]
0.51
INEQUALITY / GINI INDEX
1,501
TOTAL POPULATION
620
MALE POPULATION
881
FEMALE POPULATION
70.37
MALES / 100 FEMALES
142.10
FEMALES / 100 MALES
54.8
MEDIAN AGE
2.5
AVG FAMILY SIZE
2.2
AVG HOUSEHOLD SIZE
689
LABOR FORCE [ PEOPLE ]
50.3%
PERCENT IN LABOR FORCE
1.5%
UNEMPLOYMENT RATE
Income in Shorewood Tower Hills Harbert
Income Overview in Shorewood Tower Hills Harbert
Per Capita Income in Shorewood Tower Hills Harbert is $59,811, while median incomes of families and households are $79,826 and $77,674 respectively.
| Characteristic | Number | Measure |
| Per Capita Income | 1,501 | $59,811 |
| Median Family Income | 486 | $79,826 |
| Mean Family Income | 486 | $119,042 |
| Median Household Income | 682 | $77,674 |
| Mean Household Income | 682 | $120,573 |
| Income Deficit | 486 | $0 |
| Wage / Income Gap (%) | 1,501 | 19.79% |
| Wage / Income Gap ($) | 1,501 | 80.21¢ per $1 |
| Gini / Inequality Index | 1,501 | 0.51 |
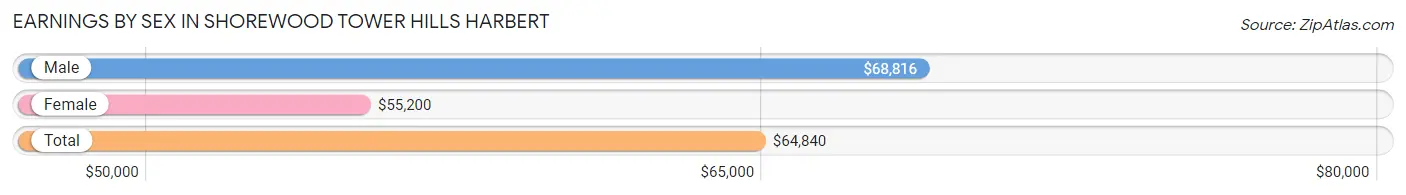
Earnings by Sex in Shorewood Tower Hills Harbert
Average Earnings in Shorewood Tower Hills Harbert are $64,840, $68,816 for men and $55,200 for women, a difference of 19.8%.
| Sex | Number | Average Earnings |
| Male | 430 (59.6%) | $68,816 |
| Female | 292 (40.4%) | $55,200 |
| Total | 722 (100.0%) | $64,840 |
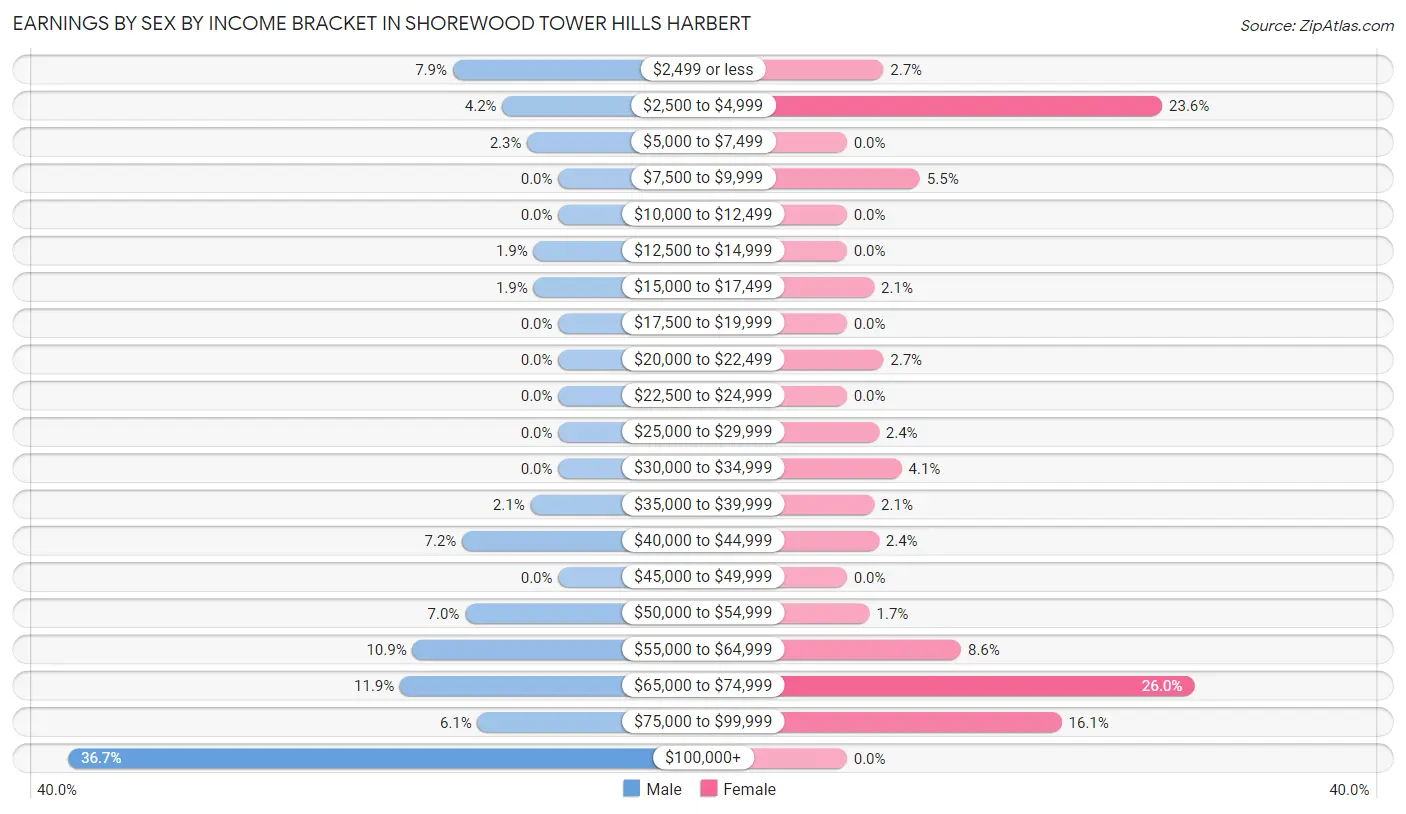
Earnings by Sex by Income Bracket in Shorewood Tower Hills Harbert
The most common earnings brackets in Shorewood Tower Hills Harbert are $100,000+ for men (158 | 36.7%) and $65,000 to $74,999 for women (76 | 26.0%).
| Income | Male | Female |
| $2,499 or less | 34 (7.9%) | 8 (2.7%) |
| $2,500 to $4,999 | 18 (4.2%) | 69 (23.6%) |
| $5,000 to $7,499 | 10 (2.3%) | 0 (0.0%) |
| $7,500 to $9,999 | 0 (0.0%) | 16 (5.5%) |
| $10,000 to $12,499 | 0 (0.0%) | 0 (0.0%) |
| $12,500 to $14,999 | 8 (1.9%) | 0 (0.0%) |
| $15,000 to $17,499 | 8 (1.9%) | 6 (2.1%) |
| $17,500 to $19,999 | 0 (0.0%) | 0 (0.0%) |
| $20,000 to $22,499 | 0 (0.0%) | 8 (2.7%) |
| $22,500 to $24,999 | 0 (0.0%) | 0 (0.0%) |
| $25,000 to $29,999 | 0 (0.0%) | 7 (2.4%) |
| $30,000 to $34,999 | 0 (0.0%) | 12 (4.1%) |
| $35,000 to $39,999 | 9 (2.1%) | 6 (2.1%) |
| $40,000 to $44,999 | 31 (7.2%) | 7 (2.4%) |
| $45,000 to $49,999 | 0 (0.0%) | 0 (0.0%) |
| $50,000 to $54,999 | 30 (7.0%) | 5 (1.7%) |
| $55,000 to $64,999 | 47 (10.9%) | 25 (8.6%) |
| $65,000 to $74,999 | 51 (11.9%) | 76 (26.0%) |
| $75,000 to $99,999 | 26 (6.0%) | 47 (16.1%) |
| $100,000+ | 158 (36.7%) | 0 (0.0%) |
| Total | 430 (100.0%) | 292 (100.0%) |
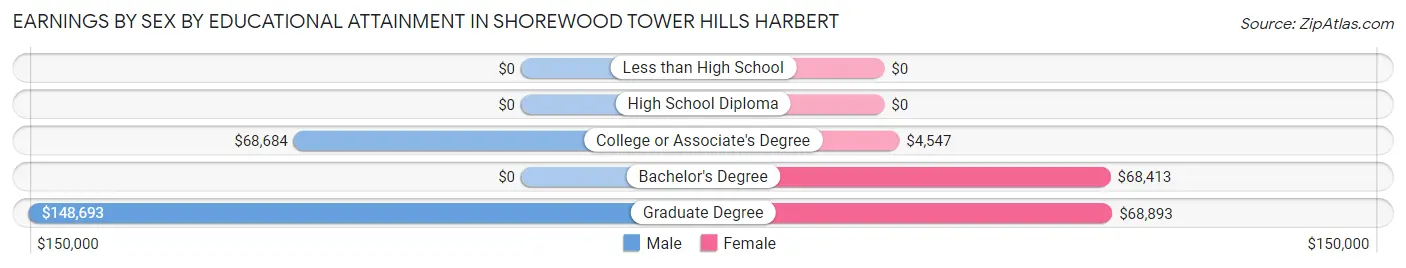
Earnings by Sex by Educational Attainment in Shorewood Tower Hills Harbert
Average earnings in Shorewood Tower Hills Harbert are $69,112 for men and $55,200 for women, a difference of 20.1%. Men with an educational attainment of graduate degree enjoy the highest average annual earnings of $148,693, while those with college or associate's degree education earn the least with $68,684. Women with an educational attainment of graduate degree earn the most with the average annual earnings of $68,893, while those with college or associate's degree education have the smallest earnings of $4,547.
| Educational Attainment | Male Income | Female Income |
| Less than High School | - | - |
| High School Diploma | - | - |
| College or Associate's Degree | $68,684 | $4,547 |
| Bachelor's Degree | - | - |
| Graduate Degree | $148,693 | $68,893 |
| Total | $69,112 | $55,200 |
Family Income in Shorewood Tower Hills Harbert
Family Income Brackets in Shorewood Tower Hills Harbert
According to the Shorewood Tower Hills Harbert family income data, there are 100 families falling into the $75,000 to $99,999 income range, which is the most common income bracket and makes up 20.6% of all families.
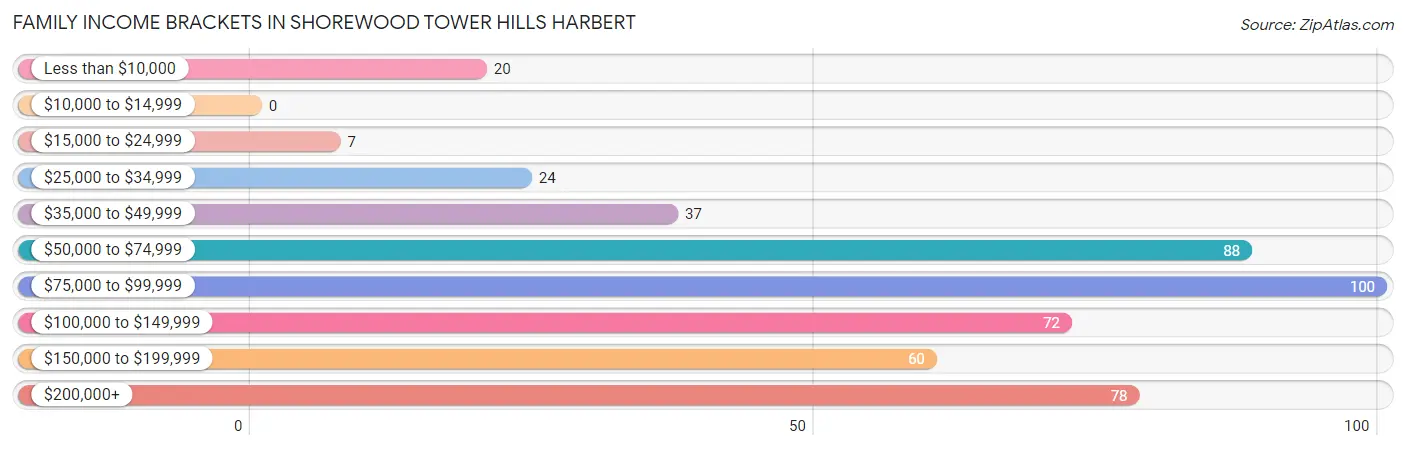
| Income Bracket | # Families | % Families |
| Less than $10,000 | 20 | 4.1% |
| $10,000 to $14,999 | 0 | 0.0% |
| $15,000 to $24,999 | 7 | 1.4% |
| $25,000 to $34,999 | 24 | 4.9% |
| $35,000 to $49,999 | 37 | 7.6% |
| $50,000 to $74,999 | 88 | 18.1% |
| $75,000 to $99,999 | 100 | 20.6% |
| $100,000 to $149,999 | 72 | 14.8% |
| $150,000 to $199,999 | 60 | 12.3% |
| $200,000+ | 78 | 16.0% |
Family Income by Famaliy Size in Shorewood Tower Hills Harbert
2-person families (360 | 74.1%) account for the highest median family income in Shorewood Tower Hills Harbert with $79,549 per family, while 2-person families (360 | 74.1%) have the highest median income of $39,774 per family member.
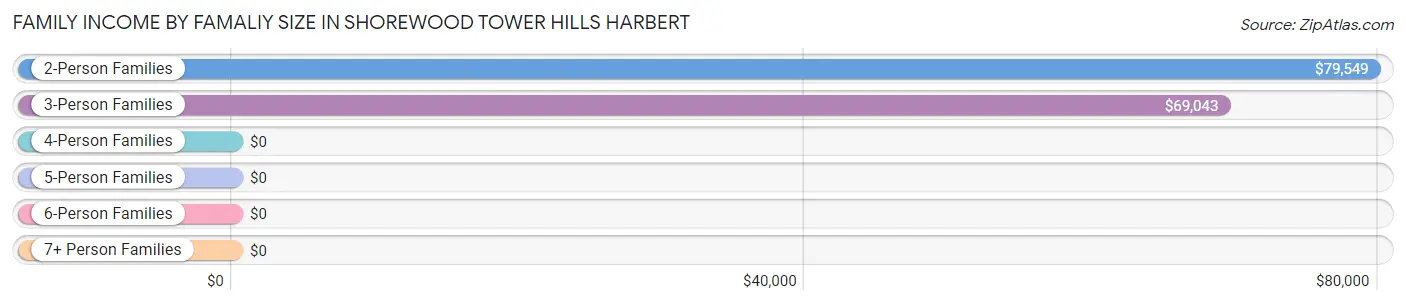
| Income Bracket | # Families | Median Income |
| 2-Person Families | 360 (74.1%) | $79,549 |
| 3-Person Families | 74 (15.2%) | $69,043 |
| 4-Person Families | 31 (6.4%) | $0 |
| 5-Person Families | 0 (0.0%) | $0 |
| 6-Person Families | 21 (4.3%) | $0 |
| 7+ Person Families | 0 (0.0%) | $0 |
| Total | 486 (100.0%) | $79,826 |
Family Income by Number of Earners in Shorewood Tower Hills Harbert
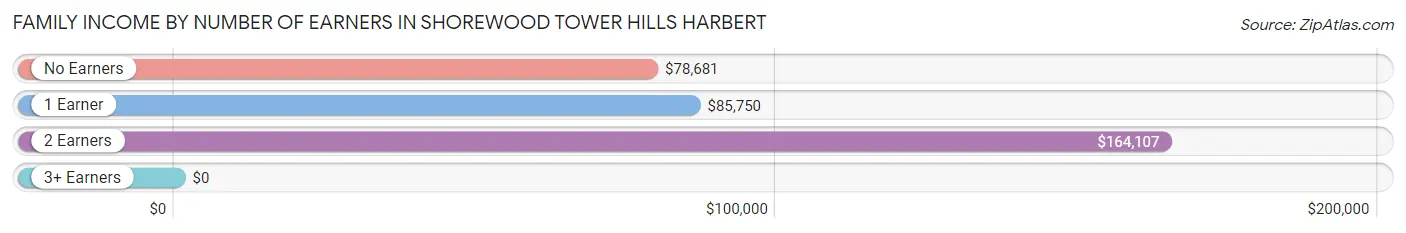
| Number of Earners | # Families | Median Income |
| No Earners | 122 (25.1%) | $78,681 |
| 1 Earner | 194 (39.9%) | $85,750 |
| 2 Earners | 153 (31.5%) | $164,107 |
| 3+ Earners | 17 (3.5%) | $0 |
| Total | 486 (100.0%) | $79,826 |
Household Income in Shorewood Tower Hills Harbert
Household Income Brackets in Shorewood Tower Hills Harbert
With 135 households falling in the category, the $50,000 to $74,999 income range is the most frequent in Shorewood Tower Hills Harbert, accounting for 19.8% of all households.
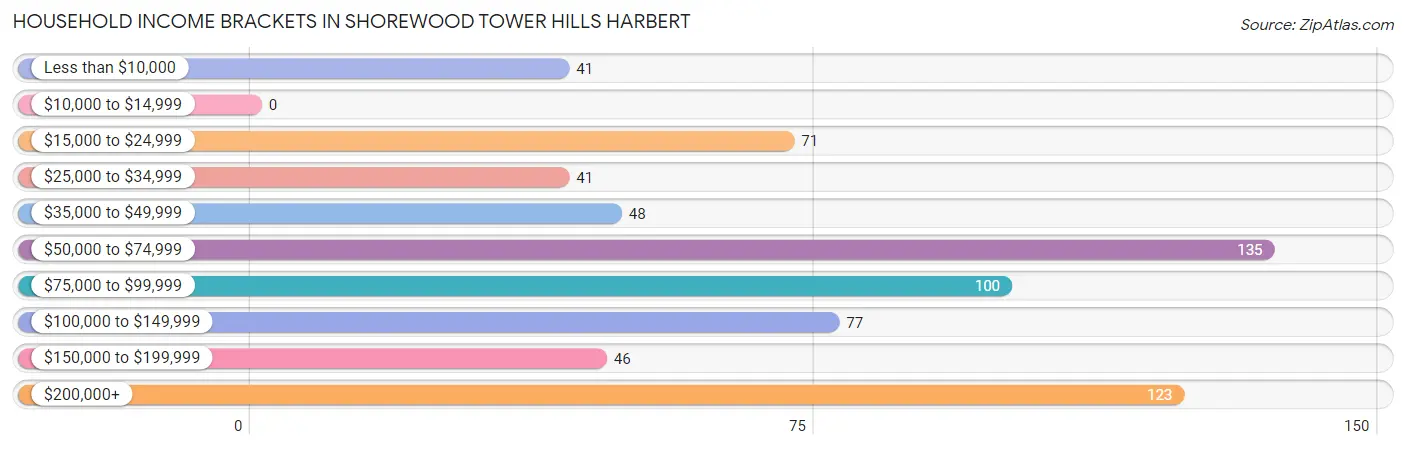
| Income Bracket | # Households | % Households |
| Less than $10,000 | 41 | 6.0% |
| $10,000 to $14,999 | 0 | 0.0% |
| $15,000 to $24,999 | 71 | 10.4% |
| $25,000 to $34,999 | 41 | 6.0% |
| $35,000 to $49,999 | 48 | 7.0% |
| $50,000 to $74,999 | 135 | 19.8% |
| $75,000 to $99,999 | 100 | 14.7% |
| $100,000 to $149,999 | 77 | 11.3% |
| $150,000 to $199,999 | 46 | 6.7% |
| $200,000+ | 123 | 18.0% |
Household Income by Householder Age in Shorewood Tower Hills Harbert
The median household income in Shorewood Tower Hills Harbert is $77,674, with the highest median household income of $103,548 found in the 45 to 64 years age bracket for the primary householder. A total of 166 households (24.3%) fall into this category.
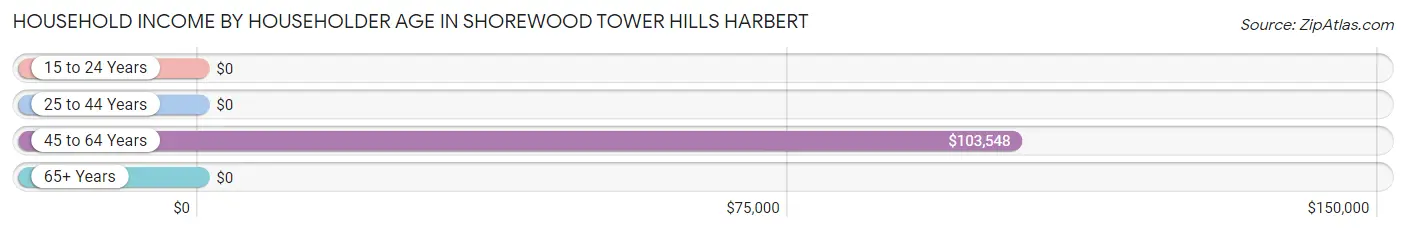
| Income Bracket | # Households | Median Income |
| 15 to 24 Years | 0 (0.0%) | $0 |
| 25 to 44 Years | 143 (21.0%) | $0 |
| 45 to 64 Years | 166 (24.3%) | $103,548 |
| 65+ Years | 373 (54.7%) | $0 |
| Total | 682 (100.0%) | $77,674 |
Poverty in Shorewood Tower Hills Harbert
Income Below Poverty by Sex and Age in Shorewood Tower Hills Harbert
With 5.8% poverty level for males and 7.1% for females among the residents of Shorewood Tower Hills Harbert, 75 year old and over males and 75 year old and over females are the most vulnerable to poverty, with 27 males (46.6%) and 25 females (15.5%) in their respective age groups living below the poverty level.
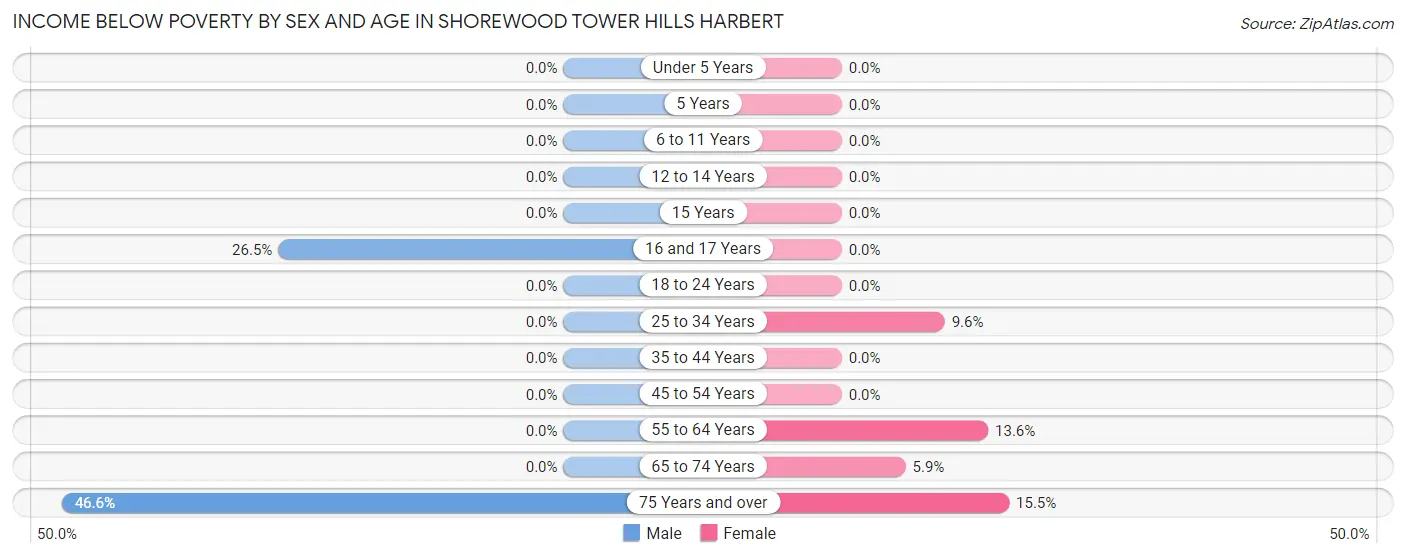
| Age Bracket | Male | Female |
| Under 5 Years | 0 (0.0%) | 0 (0.0%) |
| 5 Years | 0 (0.0%) | 0 (0.0%) |
| 6 to 11 Years | 0 (0.0%) | 0 (0.0%) |
| 12 to 14 Years | 0 (0.0%) | 0 (0.0%) |
| 15 Years | 0 (0.0%) | 0 (0.0%) |
| 16 and 17 Years | 9 (26.5%) | 0 (0.0%) |
| 18 to 24 Years | 0 (0.0%) | 0 (0.0%) |
| 25 to 34 Years | 0 (0.0%) | 15 (9.6%) |
| 35 to 44 Years | 0 (0.0%) | 0 (0.0%) |
| 45 to 54 Years | 0 (0.0%) | 0 (0.0%) |
| 55 to 64 Years | 0 (0.0%) | 11 (13.6%) |
| 65 to 74 Years | 0 (0.0%) | 10 (5.9%) |
| 75 Years and over | 27 (46.6%) | 25 (15.5%) |
| Total | 36 (5.8%) | 61 (7.1%) |
Income Above Poverty by Sex and Age in Shorewood Tower Hills Harbert
According to the poverty statistics in Shorewood Tower Hills Harbert, males aged under 5 years and females aged under 5 years are the age groups that are most secure financially, with 100.0% of males and 100.0% of females in these age groups living above the poverty line.
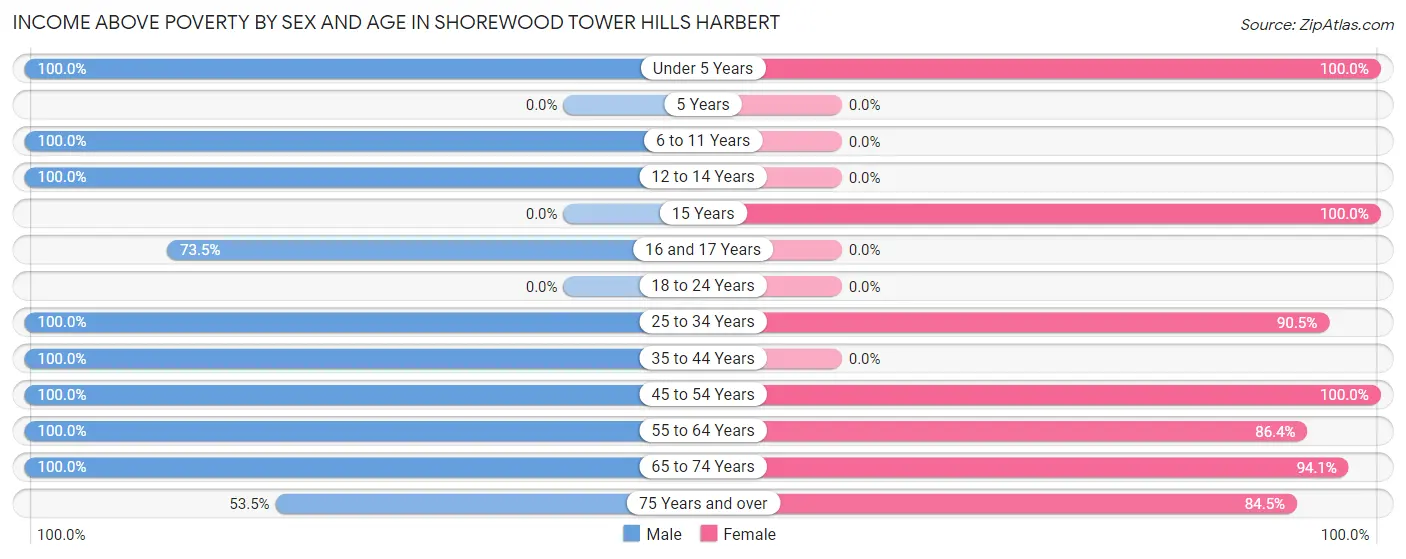
| Age Bracket | Male | Female |
| Under 5 Years | 20 (100.0%) | 54 (100.0%) |
| 5 Years | 0 (0.0%) | 0 (0.0%) |
| 6 to 11 Years | 8 (100.0%) | 0 (0.0%) |
| 12 to 14 Years | 24 (100.0%) | 0 (0.0%) |
| 15 Years | 0 (0.0%) | 8 (100.0%) |
| 16 and 17 Years | 25 (73.5%) | 0 (0.0%) |
| 18 to 24 Years | 0 (0.0%) | 0 (0.0%) |
| 25 to 34 Years | 72 (100.0%) | 142 (90.4%) |
| 35 to 44 Years | 153 (100.0%) | 0 (0.0%) |
| 45 to 54 Years | 12 (100.0%) | 233 (100.0%) |
| 55 to 64 Years | 115 (100.0%) | 70 (86.4%) |
| 65 to 74 Years | 124 (100.0%) | 159 (94.1%) |
| 75 Years and over | 31 (53.4%) | 136 (84.5%) |
| Total | 584 (94.2%) | 802 (92.9%) |
Income Below Poverty Among Married-Couple Families in Shorewood Tower Hills Harbert
The poverty statistics for married-couple families in Shorewood Tower Hills Harbert show that 7.3% or 27 of the total 370 families live below the poverty line. Families with no children have the highest poverty rate of 9.2%, comprising of 27 families. On the other hand, families with 1 or 2 children have the lowest poverty rate of 0.0%, which includes 0 families.
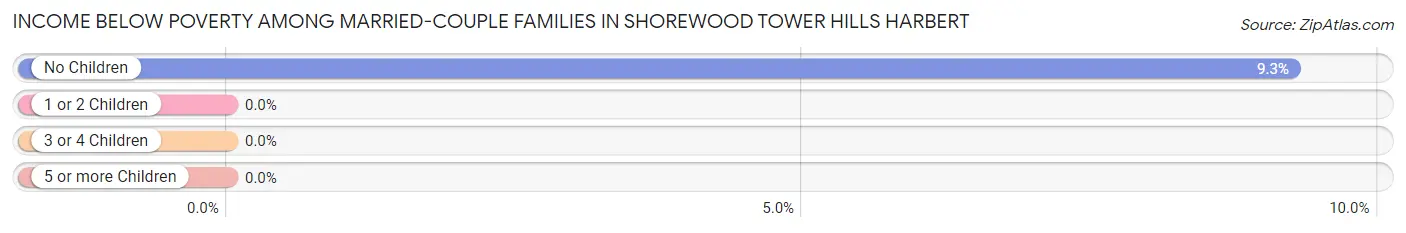
| Children | Above Poverty | Below Poverty |
| No Children | 265 (90.7%) | 27 (9.2%) |
| 1 or 2 Children | 78 (100.0%) | 0 (0.0%) |
| 3 or 4 Children | 0 (0.0%) | 0 (0.0%) |
| 5 or more Children | 0 (0.0%) | 0 (0.0%) |
| Total | 343 (92.7%) | 27 (7.3%) |
Income Below Poverty Among Single-Parent Households in Shorewood Tower Hills Harbert
| Children | Single Father | Single Mother |
| No Children | 0 (0.0%) | 0 (0.0%) |
| 1 or 2 Children | 0 (0.0%) | 0 (0.0%) |
| 3 or 4 Children | 0 (0.0%) | 0 (0.0%) |
| 5 or more Children | 0 (0.0%) | 0 (0.0%) |
| Total | 0 (0.0%) | 0 (0.0%) |
Income Below Poverty Among Married-Couple vs Single-Parent Households in Shorewood Tower Hills Harbert
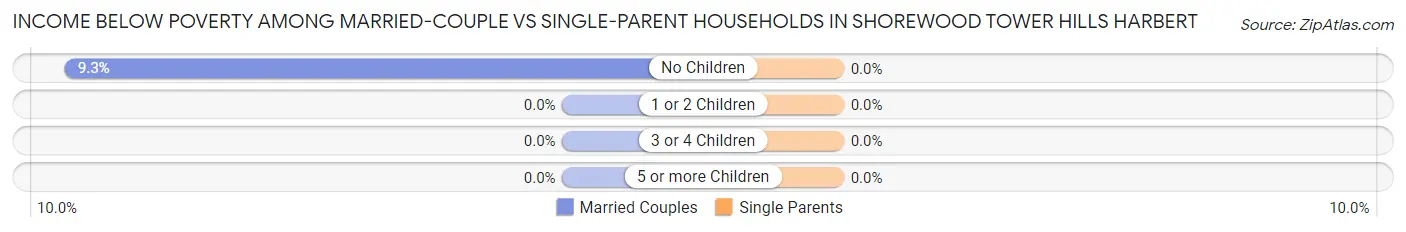
| Children | Married-Couple Families | Single-Parent Households |
| No Children | 27 (9.2%) | 0 (0.0%) |
| 1 or 2 Children | 0 (0.0%) | 0 (0.0%) |
| 3 or 4 Children | 0 (0.0%) | 0 (0.0%) |
| 5 or more Children | 0 (0.0%) | 0 (0.0%) |
| Total | 27 (7.3%) | 0 (0.0%) |
Race in Shorewood Tower Hills Harbert
The most populous races in Shorewood Tower Hills Harbert are White / Caucasian (1,352 | 90.1%), Two or more Races (142 | 9.5%), and Some other Race (7 | 0.5%).
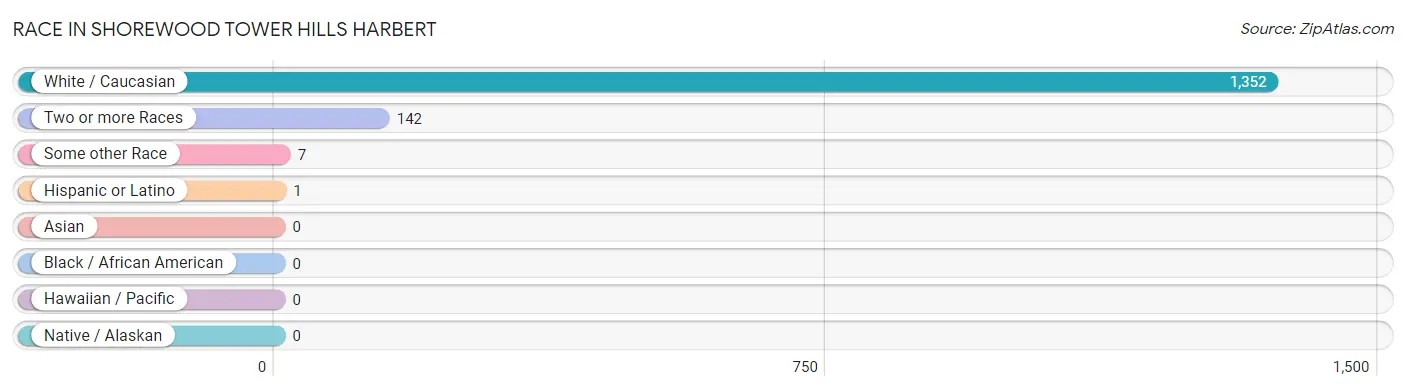
| Race | # Population | % Population |
| Asian | 0 | 0.0% |
| Black / African American | 0 | 0.0% |
| Hawaiian / Pacific | 0 | 0.0% |
| Hispanic or Latino | 1 | 0.1% |
| Native / Alaskan | 0 | 0.0% |
| White / Caucasian | 1,352 | 90.1% |
| Two or more Races | 142 | 9.5% |
| Some other Race | 7 | 0.5% |
| Total | 1,501 | 100.0% |
Ancestry in Shorewood Tower Hills Harbert
The most populous ancestries reported in Shorewood Tower Hills Harbert are German (516 | 34.4%), English (390 | 26.0%), Swedish (342 | 22.8%), Irish (264 | 17.6%), and Polish (151 | 10.1%), together accounting for 110.8% of all Shorewood Tower Hills Harbert residents.
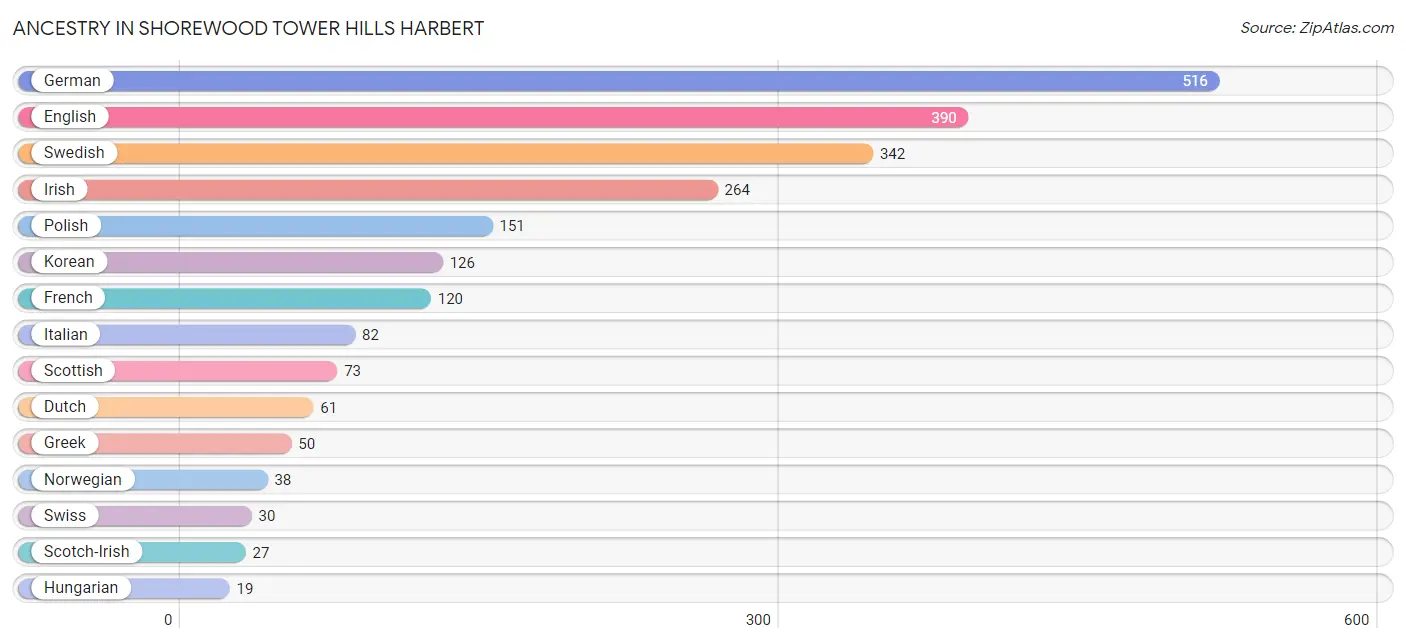
| Ancestry | # Population | % Population |
| American | 17 | 1.1% |
| Croatian | 7 | 0.5% |
| Czech | 5 | 0.3% |
| Dutch | 61 | 4.1% |
| English | 390 | 26.0% |
| French | 120 | 8.0% |
| German | 516 | 34.4% |
| Greek | 50 | 3.3% |
| Hungarian | 19 | 1.3% |
| Irish | 264 | 17.6% |
| Italian | 82 | 5.5% |
| Korean | 126 | 8.4% |
| Lithuanian | 17 | 1.1% |
| Mexican | 1 | 0.1% |
| Norwegian | 38 | 2.5% |
| Polish | 151 | 10.1% |
| Romanian | 15 | 1.0% |
| Scandinavian | 10 | 0.7% |
| Scotch-Irish | 27 | 1.8% |
| Scottish | 73 | 4.9% |
| Swedish | 342 | 22.8% |
| Swiss | 30 | 2.0% |
| Welsh | 16 | 1.1% | View All 23 Rows |
Immigrants in Shorewood Tower Hills Harbert
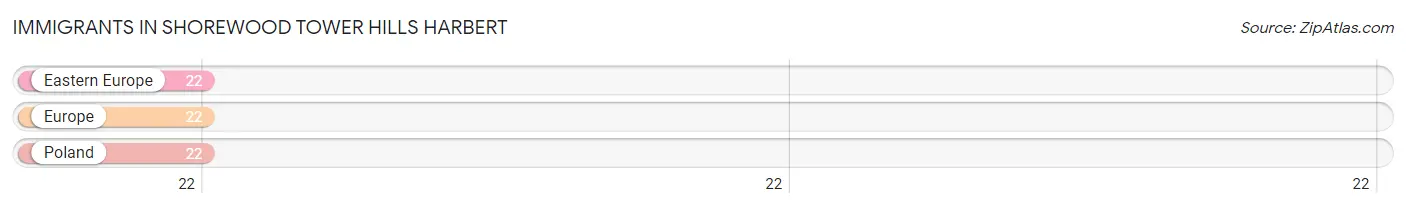
The most numerous immigrant groups reported in Shorewood Tower Hills Harbert came from Eastern Europe (22 | 1.5%), Europe (22 | 1.5%), and Poland (22 | 1.5%), together accounting for 4.4% of all Shorewood Tower Hills Harbert residents.
| Immigration Origin | # Population | % Population |
| Eastern Europe | 22 | 1.5% |
| Europe | 22 | 1.5% |
| Poland | 22 | 1.5% | View All 3 Rows |
Sex and Age in Shorewood Tower Hills Harbert
Sex and Age in Shorewood Tower Hills Harbert
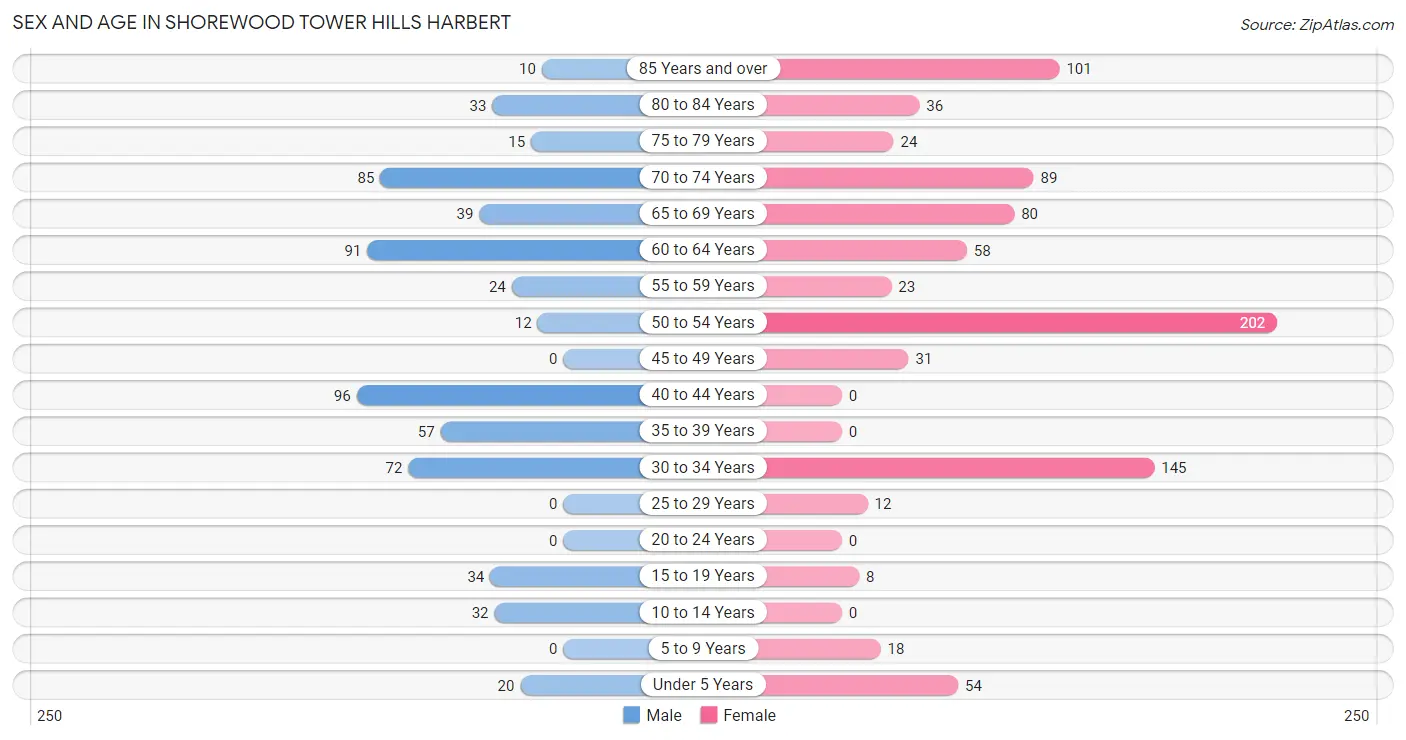
The most populous age groups in Shorewood Tower Hills Harbert are 40 to 44 Years (96 | 15.5%) for men and 50 to 54 Years (202 | 22.9%) for women.
| Age Bracket | Male | Female |
| Under 5 Years | 20 (3.2%) | 54 (6.1%) |
| 5 to 9 Years | 0 (0.0%) | 18 (2.0%) |
| 10 to 14 Years | 32 (5.2%) | 0 (0.0%) |
| 15 to 19 Years | 34 (5.5%) | 8 (0.9%) |
| 20 to 24 Years | 0 (0.0%) | 0 (0.0%) |
| 25 to 29 Years | 0 (0.0%) | 12 (1.4%) |
| 30 to 34 Years | 72 (11.6%) | 145 (16.5%) |
| 35 to 39 Years | 57 (9.2%) | 0 (0.0%) |
| 40 to 44 Years | 96 (15.5%) | 0 (0.0%) |
| 45 to 49 Years | 0 (0.0%) | 31 (3.5%) |
| 50 to 54 Years | 12 (1.9%) | 202 (22.9%) |
| 55 to 59 Years | 24 (3.9%) | 23 (2.6%) |
| 60 to 64 Years | 91 (14.7%) | 58 (6.6%) |
| 65 to 69 Years | 39 (6.3%) | 80 (9.1%) |
| 70 to 74 Years | 85 (13.7%) | 89 (10.1%) |
| 75 to 79 Years | 15 (2.4%) | 24 (2.7%) |
| 80 to 84 Years | 33 (5.3%) | 36 (4.1%) |
| 85 Years and over | 10 (1.6%) | 101 (11.5%) |
| Total | 620 (100.0%) | 881 (100.0%) |
Families and Households in Shorewood Tower Hills Harbert
Median Family Size in Shorewood Tower Hills Harbert
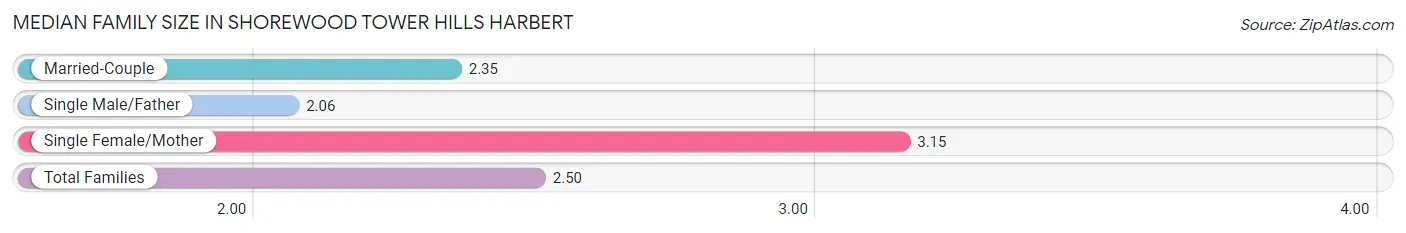
The median family size in Shorewood Tower Hills Harbert is 2.50 persons per family, with single female/mother families (100 | 20.6%) accounting for the largest median family size of 3.15 persons per family. On the other hand, single male/father families (16 | 3.3%) represent the smallest median family size with 2.06 persons per family.
| Family Type | # Families | Family Size |
| Married-Couple | 370 (76.1%) | 2.35 |
| Single Male/Father | 16 (3.3%) | 2.06 |
| Single Female/Mother | 100 (20.6%) | 3.15 |
| Total Families | 486 (100.0%) | 2.50 |
Median Household Size in Shorewood Tower Hills Harbert
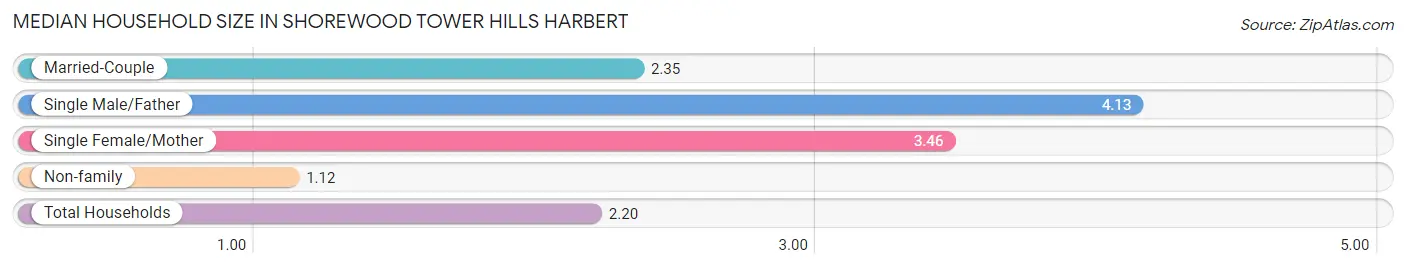
The median household size in Shorewood Tower Hills Harbert is 2.20 persons per household, with single male/father households (16 | 2.4%) accounting for the largest median household size of 4.13 persons per household. non-family households (196 | 28.7%) represent the smallest median household size with 1.12 persons per household.
| Household Type | # Households | Household Size |
| Married-Couple | 370 (54.2%) | 2.35 |
| Single Male/Father | 16 (2.4%) | 4.13 |
| Single Female/Mother | 100 (14.7%) | 3.46 |
| Non-family | 196 (28.7%) | 1.12 |
| Total Households | 682 (100.0%) | 2.20 |
Household Size by Marriage Status in Shorewood Tower Hills Harbert
Out of a total of 682 households in Shorewood Tower Hills Harbert, 486 (71.3%) are family households, while 196 (28.7%) are nonfamily households. The most numerous type of family households are 2-person households, comprising 344, and the most common type of nonfamily households are 1-person households, comprising 172.
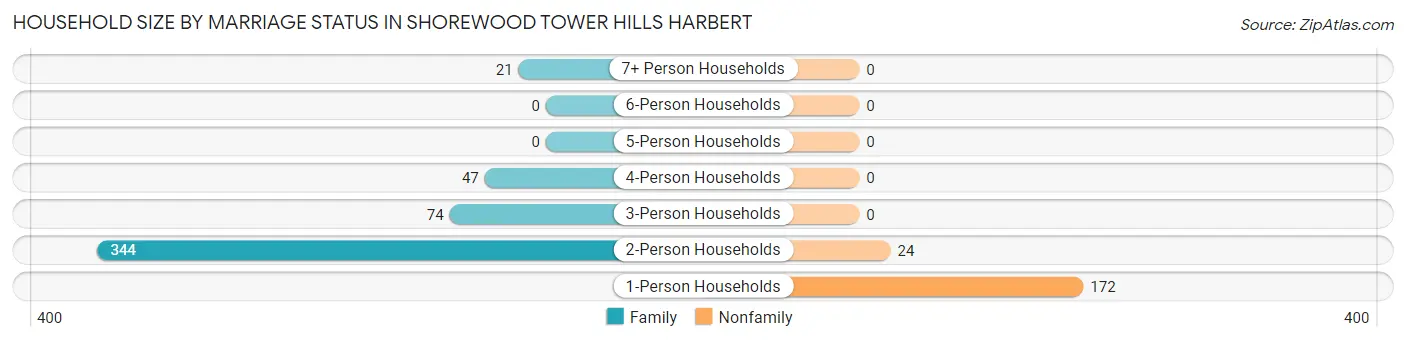
| Household Size | Family Households | Nonfamily Households |
| 1-Person Households | - | 172 (25.2%) |
| 2-Person Households | 344 (50.4%) | 24 (3.5%) |
| 3-Person Households | 74 (10.8%) | 0 (0.0%) |
| 4-Person Households | 47 (6.9%) | 0 (0.0%) |
| 5-Person Households | 0 (0.0%) | 0 (0.0%) |
| 6-Person Households | 0 (0.0%) | 0 (0.0%) |
| 7+ Person Households | 21 (3.1%) | 0 (0.0%) |
| Total | 486 (71.3%) | 196 (28.7%) |
Female Fertility in Shorewood Tower Hills Harbert
Fertility by Age in Shorewood Tower Hills Harbert
Average fertility rate in Shorewood Tower Hills Harbert is 114.0 births per 1,000 women. Women in the age bracket of 20 to 34 years have the highest fertility rate with 166.0 births per 1,000 women. Women in the age bracket of 20 to 34 years acount for 100.0% of all women with births.
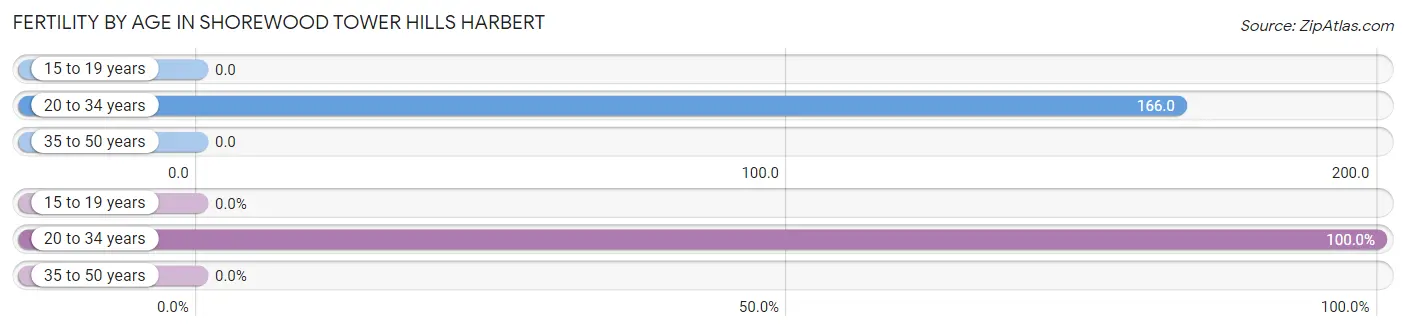
| Age Bracket | Women with Births | Births / 1,000 Women |
| 15 to 19 years | 0 (0.0%) | 0.0 |
| 20 to 34 years | 26 (100.0%) | 166.0 |
| 35 to 50 years | 0 (0.0%) | 0.0 |
| Total | 26 (100.0%) | 114.0 |
Fertility by Age by Marriage Status in Shorewood Tower Hills Harbert
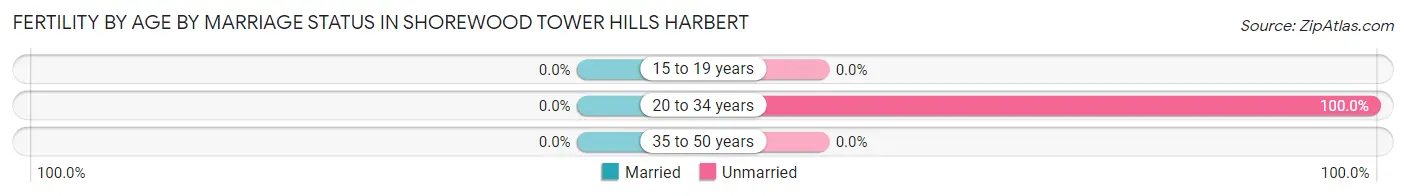
| Age Bracket | Married | Unmarried |
| 15 to 19 years | 0 (0.0%) | 0 (0.0%) |
| 20 to 34 years | 0 (0.0%) | 26 (100.0%) |
| 35 to 50 years | 0 (0.0%) | 0 (0.0%) |
| Total | 0 (0.0%) | 26 (100.0%) |
Fertility by Education in Shorewood Tower Hills Harbert
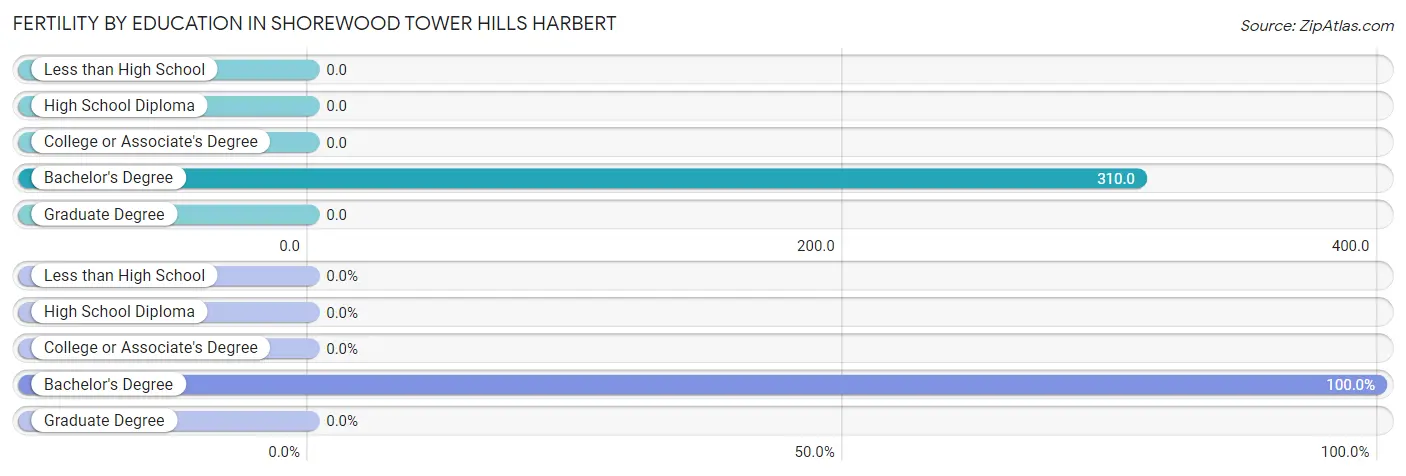
| Educational Attainment | Women with Births | Births / 1,000 Women |
| Less than High School | 0 (0.0%) | 0.0 |
| High School Diploma | 0 (0.0%) | 0.0 |
| College or Associate's Degree | 0 (0.0%) | 0.0 |
| Bachelor's Degree | 26 (100.0%) | 310.0 |
| Graduate Degree | 0 (0.0%) | 0.0 |
| Total | 26 (100.0%) | 114.0 |
Fertility by Education by Marriage Status in Shorewood Tower Hills Harbert
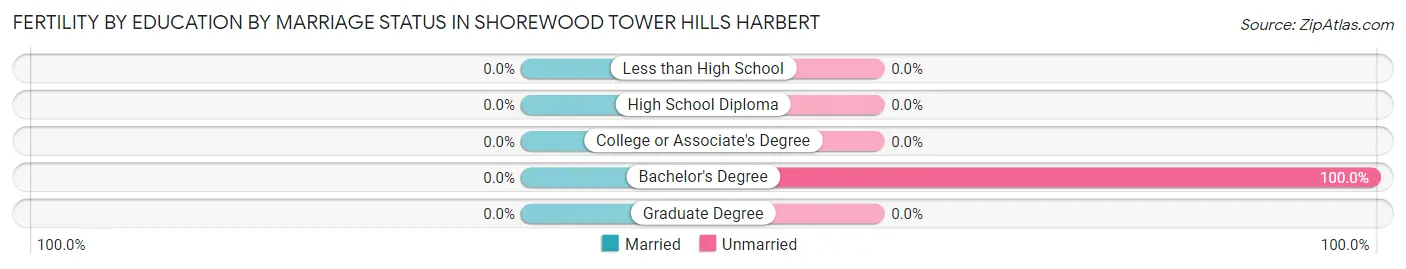
| Educational Attainment | Married | Unmarried |
| Less than High School | 0 (0.0%) | 0 (0.0%) |
| High School Diploma | 0 (0.0%) | 0 (0.0%) |
| College or Associate's Degree | 0 (0.0%) | 0 (0.0%) |
| Bachelor's Degree | 0 (0.0%) | 26 (100.0%) |
| Graduate Degree | 0 (0.0%) | 0 (0.0%) |
| Total | 0 (0.0%) | 26 (100.0%) |
Employment Characteristics in Shorewood Tower Hills Harbert
Employment by Class of Employer in Shorewood Tower Hills Harbert
Among the 641 employed individuals in Shorewood Tower Hills Harbert, private company employees (410 | 64.0%), self-employed (not incorporated) (58 | 9.0%), and not-for-profit organizations (55 | 8.6%) make up the most common classes of employment.
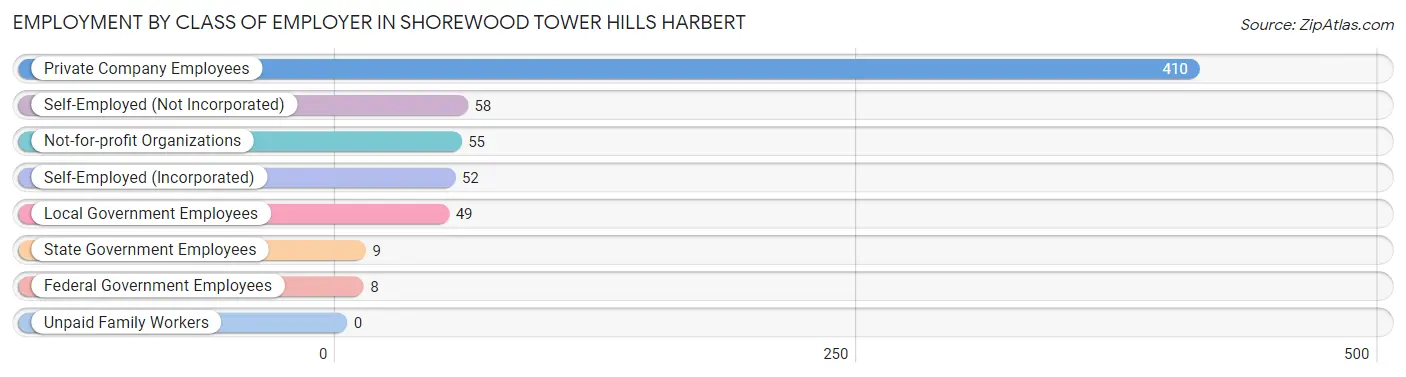
| Employer Class | # Employees | % Employees |
| Private Company Employees | 410 | 64.0% |
| Self-Employed (Incorporated) | 52 | 8.1% |
| Self-Employed (Not Incorporated) | 58 | 9.0% |
| Not-for-profit Organizations | 55 | 8.6% |
| Local Government Employees | 49 | 7.6% |
| State Government Employees | 9 | 1.4% |
| Federal Government Employees | 8 | 1.3% |
| Unpaid Family Workers | 0 | 0.0% |
| Total | 641 | 100.0% |
Employment Status by Age in Shorewood Tower Hills Harbert
According to the labor force statistics for Shorewood Tower Hills Harbert, out of the total population over 16 years of age (1,369), 50.3% or 689 individuals are in the labor force, with 1.5% or 10 of them unemployed. The age group with the highest labor force participation rate is 25 to 29 years, with 100.0% or 12 individuals in the labor force. Within the labor force, the 65 to 74 years age range has the highest percentage of unemployed individuals, with 10.5% or 10 of them being unemployed.
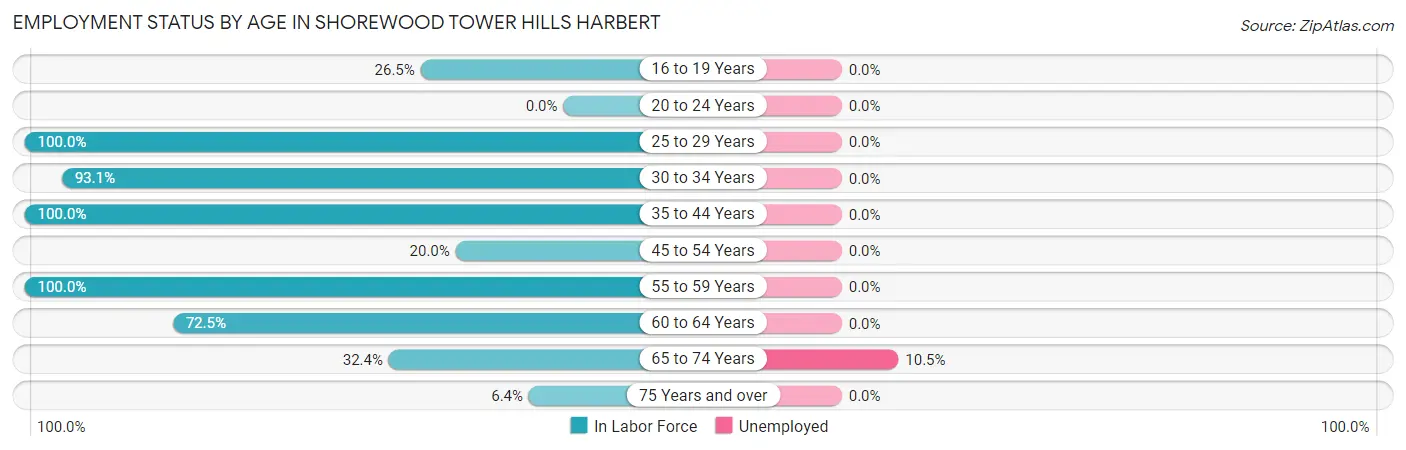
| Age Bracket | In Labor Force | Unemployed |
| 16 to 19 Years | 9 (26.5%) | 0 (0.0%) |
| 20 to 24 Years | 0 (0.0%) | 0 (0.0%) |
| 25 to 29 Years | 12 (100.0%) | 0 (0.0%) |
| 30 to 34 Years | 202 (93.1%) | 0 (0.0%) |
| 35 to 44 Years | 153 (100.0%) | 0 (0.0%) |
| 45 to 54 Years | 49 (20.0%) | 0 (0.0%) |
| 55 to 59 Years | 47 (100.0%) | 0 (0.0%) |
| 60 to 64 Years | 108 (72.5%) | 0 (0.0%) |
| 65 to 74 Years | 95 (32.4%) | 10 (10.5%) |
| 75 Years and over | 14 (6.4%) | 0 (0.0%) |
| Total | 689 (50.3%) | 10 (1.5%) |
Employment Status by Educational Attainment in Shorewood Tower Hills Harbert
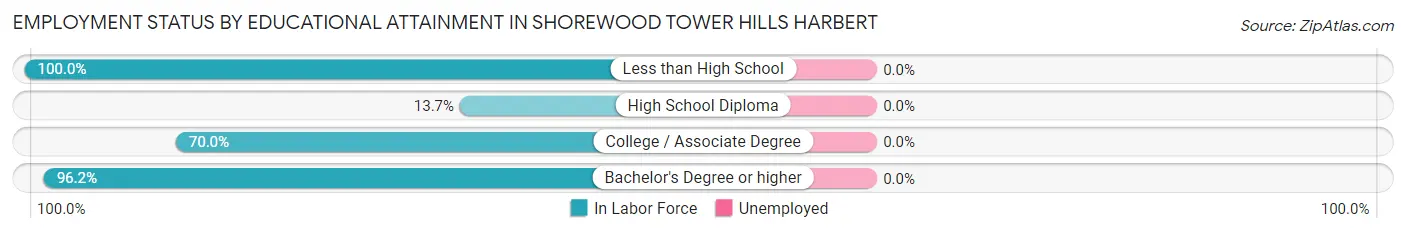
| Educational Attainment | In Labor Force | Unemployed |
| Less than High School | 13 (100.0%) | 0 (0.0%) |
| High School Diploma | 26 (13.7%) | 0 (0.0%) |
| College / Associate Degree | 173 (70.0%) | 0 (0.0%) |
| Bachelor's Degree or higher | 359 (96.2%) | 0 (0.0%) |
| Total | 571 (69.4%) | 0 (0.0%) |
Employment Occupations by Sex in Shorewood Tower Hills Harbert
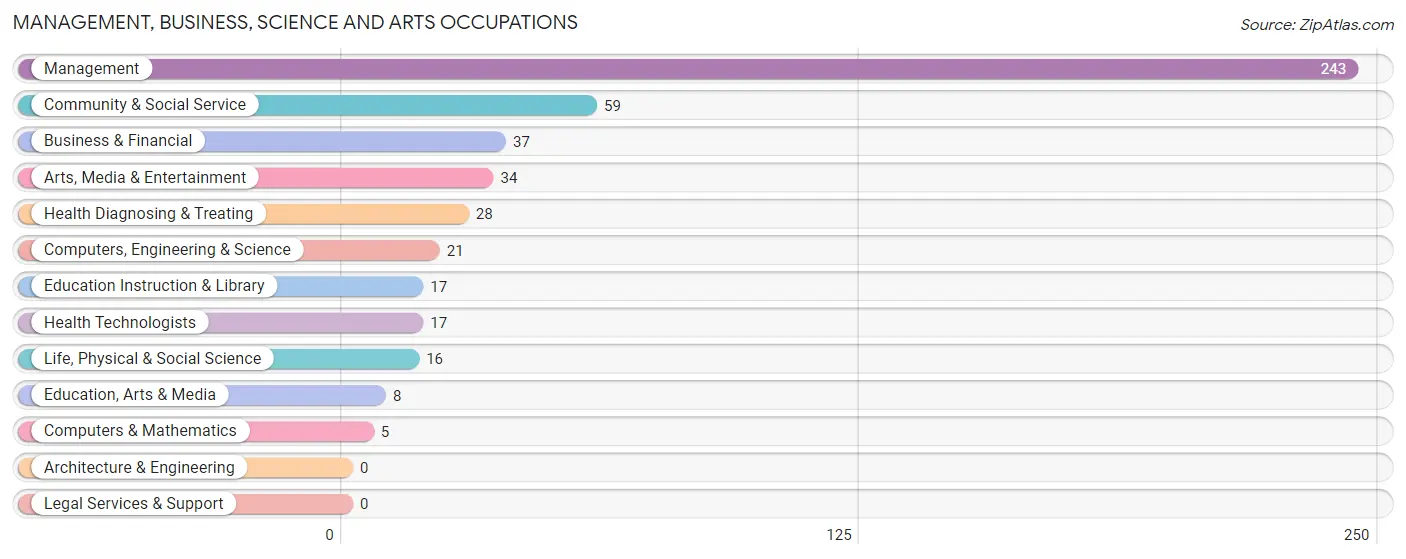
Management, Business, Science and Arts Occupations
The most common Management, Business, Science and Arts occupations in Shorewood Tower Hills Harbert are Management (243 | 35.8%), Community & Social Service (59 | 8.7%), Business & Financial (37 | 5.4%), Arts, Media & Entertainment (34 | 5.0%), and Health Diagnosing & Treating (28 | 4.1%).
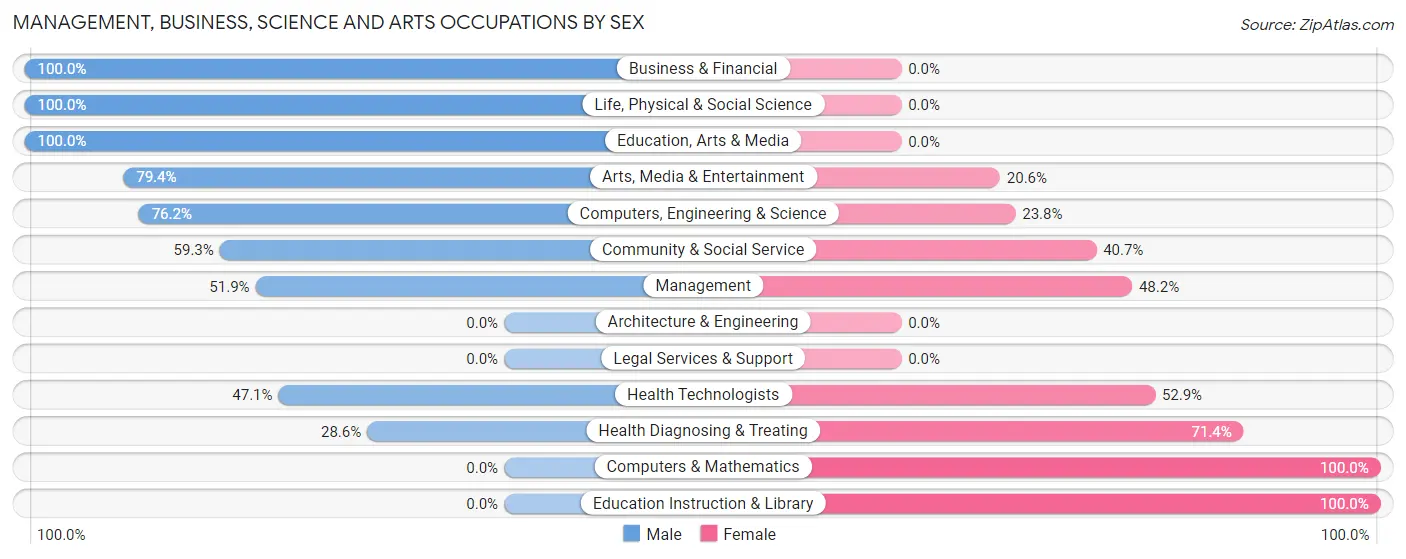
Management, Business, Science and Arts Occupations by Sex
Within the Management, Business, Science and Arts occupations in Shorewood Tower Hills Harbert, the most male-oriented occupations are Business & Financial (100.0%), Life, Physical & Social Science (100.0%), and Education, Arts & Media (100.0%), while the most female-oriented occupations are Computers & Mathematics (100.0%), Education Instruction & Library (100.0%), and Health Diagnosing & Treating (71.4%).
| Occupation | Male | Female |
| Management | 126 (51.8%) | 117 (48.1%) |
| Business & Financial | 37 (100.0%) | 0 (0.0%) |
| Computers, Engineering & Science | 16 (76.2%) | 5 (23.8%) |
| Computers & Mathematics | 0 (0.0%) | 5 (100.0%) |
| Architecture & Engineering | 0 (0.0%) | 0 (0.0%) |
| Life, Physical & Social Science | 16 (100.0%) | 0 (0.0%) |
| Community & Social Service | 35 (59.3%) | 24 (40.7%) |
| Education, Arts & Media | 8 (100.0%) | 0 (0.0%) |
| Legal Services & Support | 0 (0.0%) | 0 (0.0%) |
| Education Instruction & Library | 0 (0.0%) | 17 (100.0%) |
| Arts, Media & Entertainment | 27 (79.4%) | 7 (20.6%) |
| Health Diagnosing & Treating | 8 (28.6%) | 20 (71.4%) |
| Health Technologists | 8 (47.1%) | 9 (52.9%) |
| Total (Category) | 222 (57.2%) | 166 (42.8%) |
| Total (Overall) | 405 (59.7%) | 274 (40.4%) |
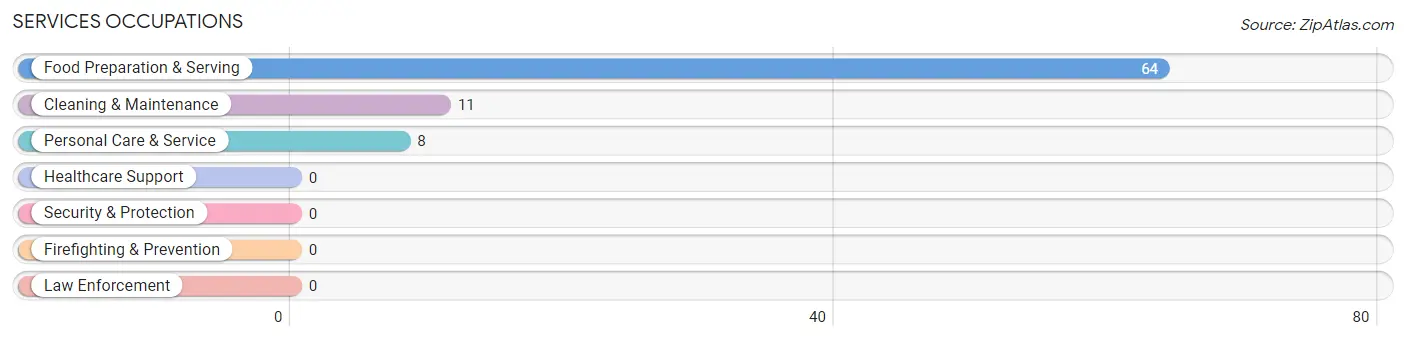
Services Occupations
The most common Services occupations in Shorewood Tower Hills Harbert are Food Preparation & Serving (64 | 9.4%), Cleaning & Maintenance (11 | 1.6%), and Personal Care & Service (8 | 1.2%).
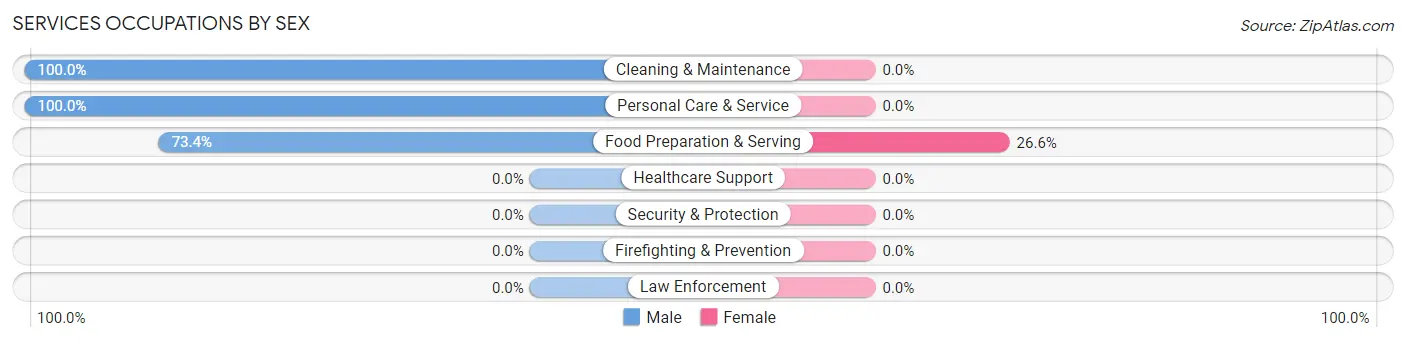
Services Occupations by Sex
| Occupation | Male | Female |
| Healthcare Support | 0 (0.0%) | 0 (0.0%) |
| Security & Protection | 0 (0.0%) | 0 (0.0%) |
| Firefighting & Prevention | 0 (0.0%) | 0 (0.0%) |
| Law Enforcement | 0 (0.0%) | 0 (0.0%) |
| Food Preparation & Serving | 47 (73.4%) | 17 (26.6%) |
| Cleaning & Maintenance | 11 (100.0%) | 0 (0.0%) |
| Personal Care & Service | 8 (100.0%) | 0 (0.0%) |
| Total (Category) | 66 (79.5%) | 17 (20.5%) |
| Total (Overall) | 405 (59.7%) | 274 (40.4%) |
Sales and Office Occupations
The most common Sales and Office occupations in Shorewood Tower Hills Harbert are Sales & Related (90 | 13.3%), and Office & Administration (26 | 3.8%).
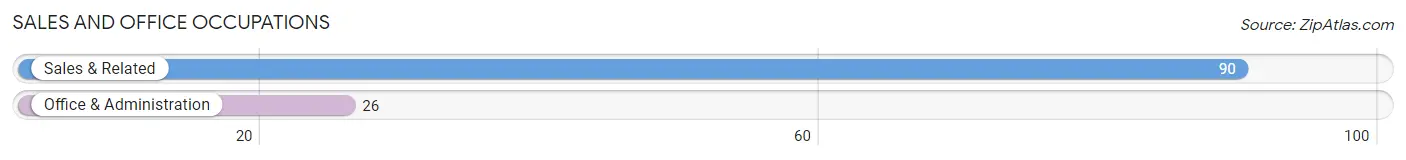
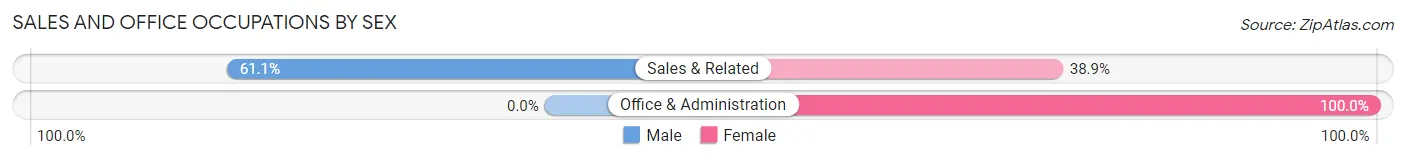
Sales and Office Occupations by Sex
| Occupation | Male | Female |
| Sales & Related | 55 (61.1%) | 35 (38.9%) |
| Office & Administration | 0 (0.0%) | 26 (100.0%) |
| Total (Category) | 55 (47.4%) | 61 (52.6%) |
| Total (Overall) | 405 (59.7%) | 274 (40.4%) |
Natural Resources, Construction and Maintenance Occupations
The most common Natural Resources, Construction and Maintenance occupations in Shorewood Tower Hills Harbert are , and Construction & Extraction (22 | 3.2%).
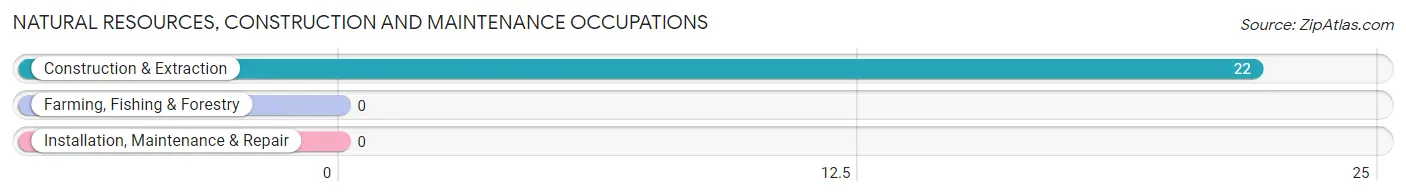
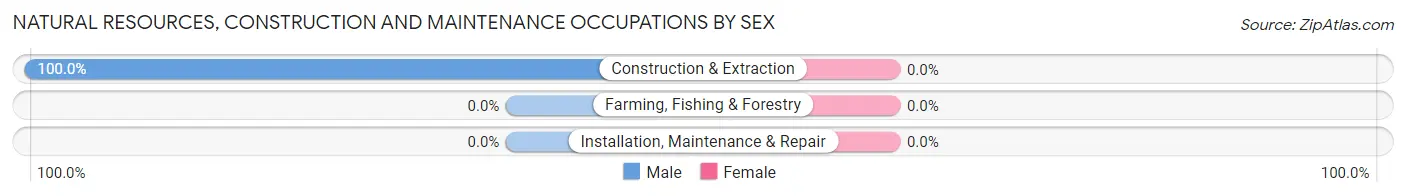
Natural Resources, Construction and Maintenance Occupations by Sex
| Occupation | Male | Female |
| Farming, Fishing & Forestry | 0 (0.0%) | 0 (0.0%) |
| Construction & Extraction | 22 (100.0%) | 0 (0.0%) |
| Installation, Maintenance & Repair | 0 (0.0%) | 0 (0.0%) |
| Total (Category) | 22 (100.0%) | 0 (0.0%) |
| Total (Overall) | 405 (59.7%) | 274 (40.4%) |
Production, Transportation and Moving Occupations
The most common Production, Transportation and Moving occupations in Shorewood Tower Hills Harbert are Transportation (60 | 8.8%), and Production (10 | 1.5%).
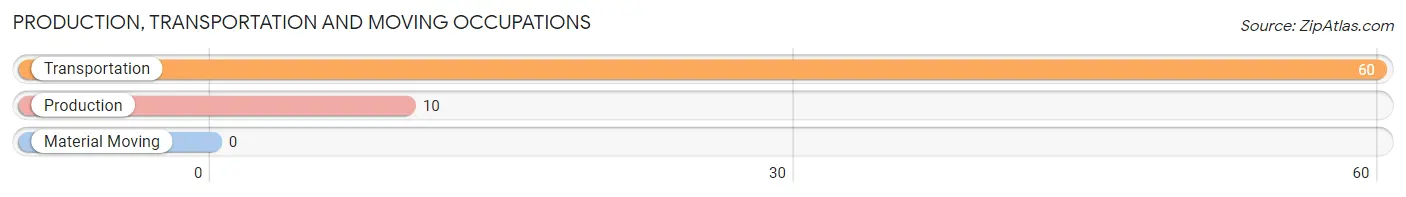
Production, Transportation and Moving Occupations by Sex
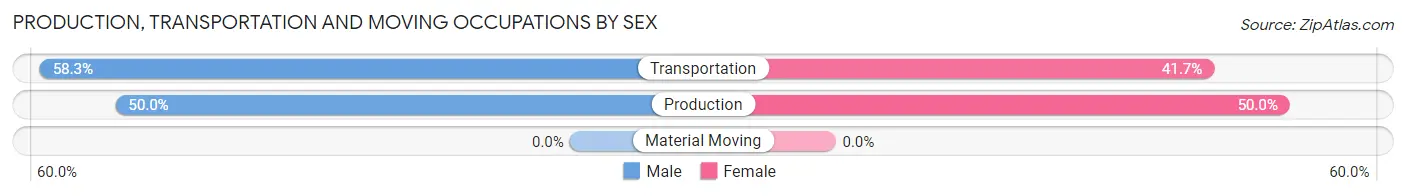
| Occupation | Male | Female |
| Production | 5 (50.0%) | 5 (50.0%) |
| Transportation | 35 (58.3%) | 25 (41.7%) |
| Material Moving | 0 (0.0%) | 0 (0.0%) |
| Total (Category) | 40 (57.1%) | 30 (42.9%) |
| Total (Overall) | 405 (59.7%) | 274 (40.4%) |
Employment Industries by Sex in Shorewood Tower Hills Harbert
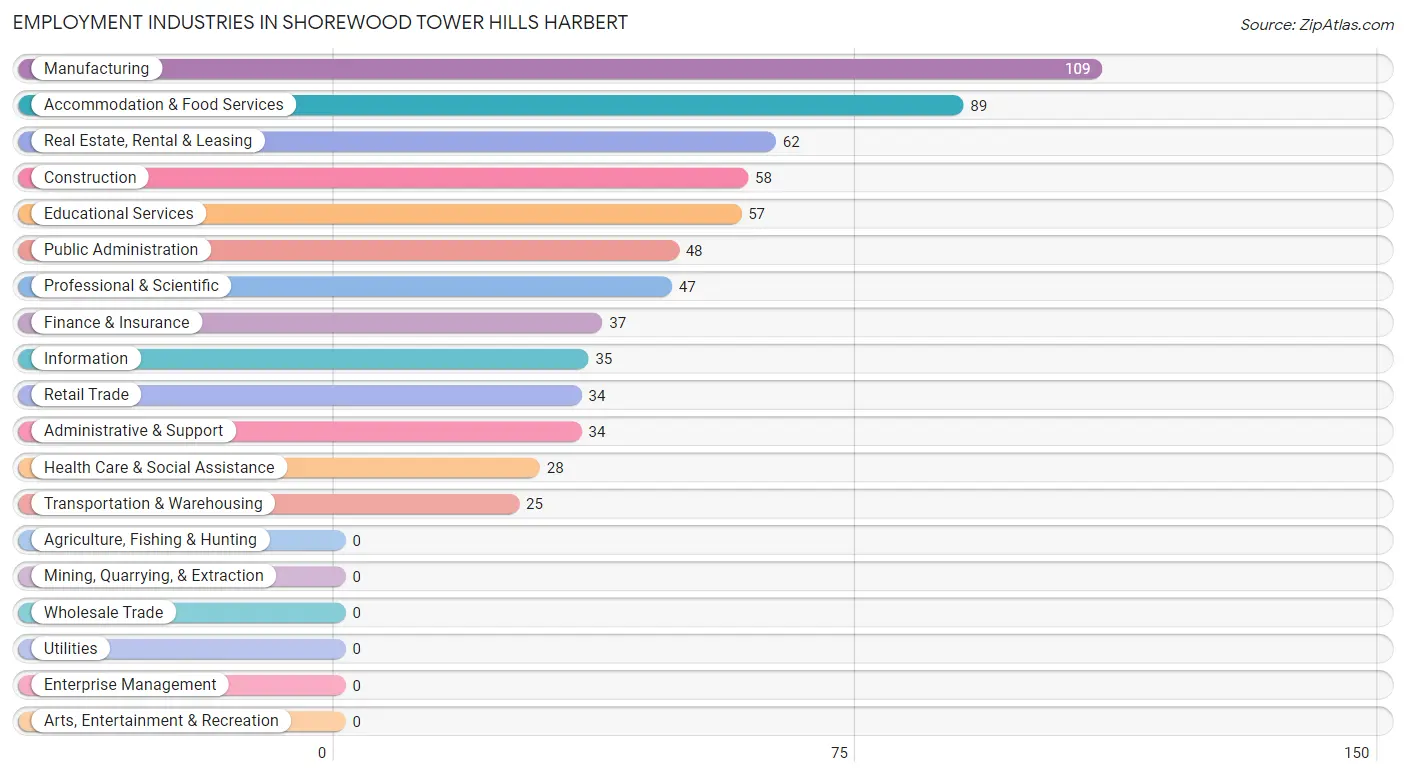
Employment Industries in Shorewood Tower Hills Harbert
The major employment industries in Shorewood Tower Hills Harbert include Manufacturing (109 | 16.1%), Accommodation & Food Services (89 | 13.1%), Real Estate, Rental & Leasing (62 | 9.1%), Construction (58 | 8.5%), and Educational Services (57 | 8.4%).
Employment Industries by Sex in Shorewood Tower Hills Harbert
The Shorewood Tower Hills Harbert industries that see more men than women are Information (100.0%), Finance & Insurance (100.0%), and Administrative & Support (100.0%), whereas the industries that tend to have a higher number of women are Transportation & Warehousing (100.0%), Professional & Scientific (100.0%), and Public Administration (100.0%).
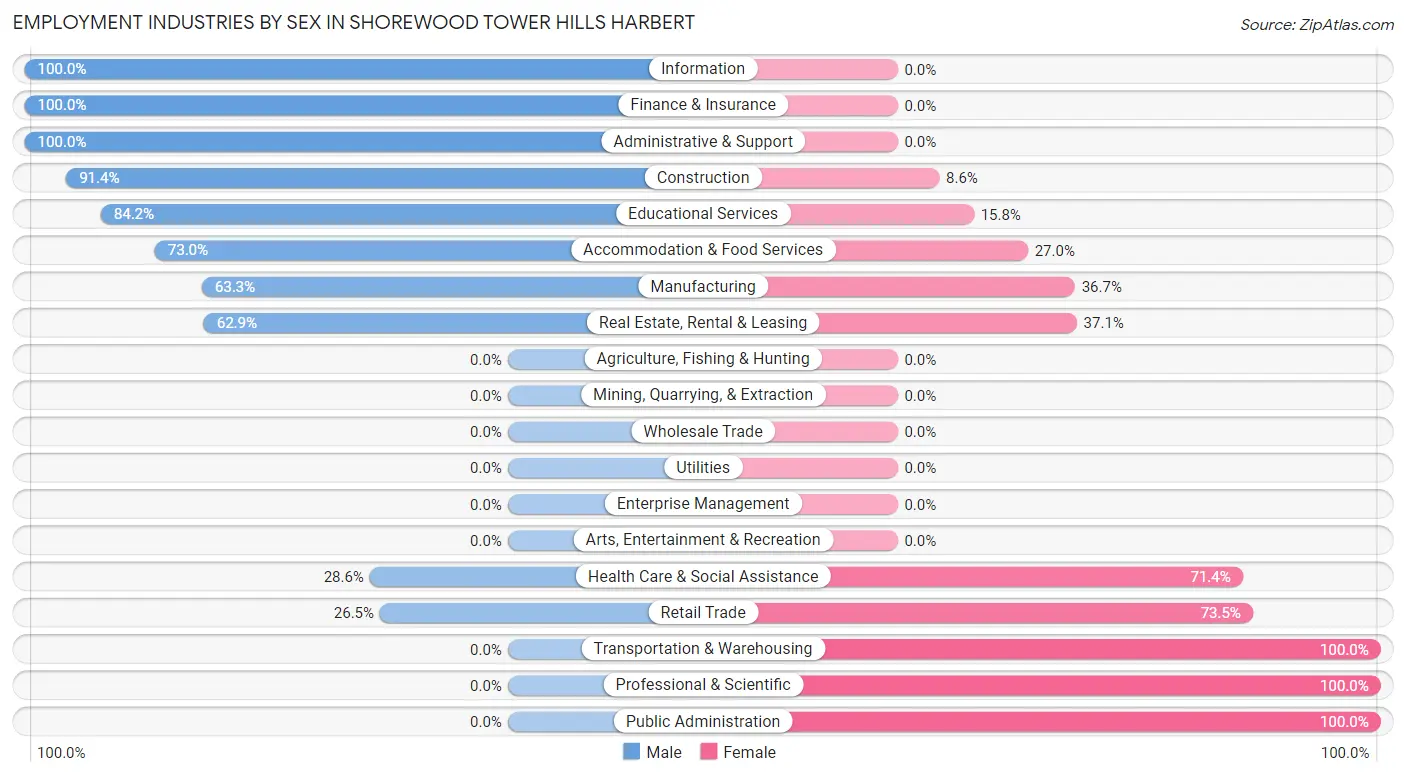
| Industry | Male | Female |
| Agriculture, Fishing & Hunting | 0 (0.0%) | 0 (0.0%) |
| Mining, Quarrying, & Extraction | 0 (0.0%) | 0 (0.0%) |
| Construction | 53 (91.4%) | 5 (8.6%) |
| Manufacturing | 69 (63.3%) | 40 (36.7%) |
| Wholesale Trade | 0 (0.0%) | 0 (0.0%) |
| Retail Trade | 9 (26.5%) | 25 (73.5%) |
| Transportation & Warehousing | 0 (0.0%) | 25 (100.0%) |
| Utilities | 0 (0.0%) | 0 (0.0%) |
| Information | 35 (100.0%) | 0 (0.0%) |
| Finance & Insurance | 37 (100.0%) | 0 (0.0%) |
| Real Estate, Rental & Leasing | 39 (62.9%) | 23 (37.1%) |
| Professional & Scientific | 0 (0.0%) | 47 (100.0%) |
| Enterprise Management | 0 (0.0%) | 0 (0.0%) |
| Administrative & Support | 34 (100.0%) | 0 (0.0%) |
| Educational Services | 48 (84.2%) | 9 (15.8%) |
| Health Care & Social Assistance | 8 (28.6%) | 20 (71.4%) |
| Arts, Entertainment & Recreation | 0 (0.0%) | 0 (0.0%) |
| Accommodation & Food Services | 65 (73.0%) | 24 (27.0%) |
| Public Administration | 0 (0.0%) | 48 (100.0%) |
| Total | 405 (59.7%) | 274 (40.4%) |
Education in Shorewood Tower Hills Harbert
School Enrollment in Shorewood Tower Hills Harbert
The most common levels of schooling among the 100 students in Shorewood Tower Hills Harbert are high school (42 | 42.0%), middle school (32 | 32.0%), and elementary school (18 | 18.0%).
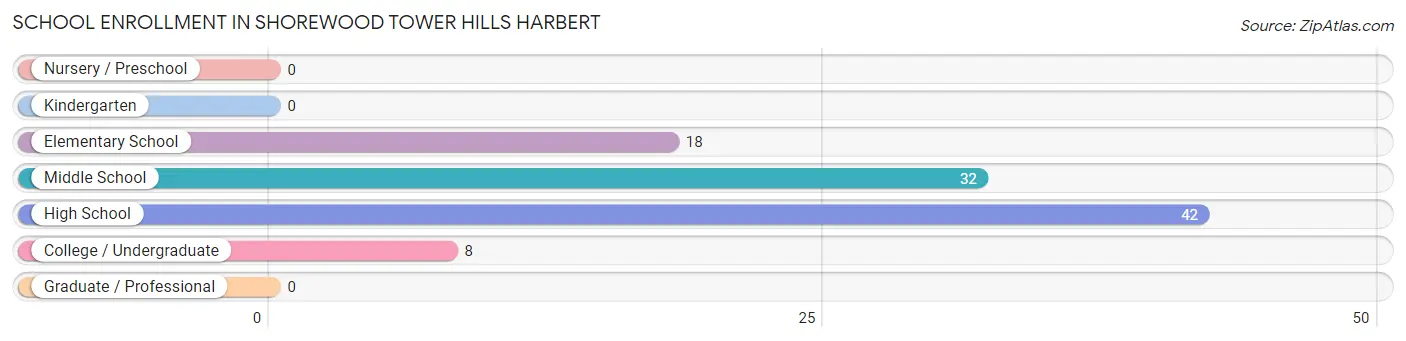
| School Level | # Students | % Students |
| Nursery / Preschool | 0 | 0.0% |
| Kindergarten | 0 | 0.0% |
| Elementary School | 18 | 18.0% |
| Middle School | 32 | 32.0% |
| High School | 42 | 42.0% |
| College / Undergraduate | 8 | 8.0% |
| Graduate / Professional | 0 | 0.0% |
| Total | 100 | 100.0% |
School Enrollment by Age by Funding Source in Shorewood Tower Hills Harbert
Out of a total of 100 students who are enrolled in schools in Shorewood Tower Hills Harbert, 24 (24.0%) attend a private institution, while the remaining 76 (76.0%) are enrolled in public schools. The age group of 10 to 14 year olds has the highest likelihood of being enrolled in private schools, with 24 (75.0% in the age bracket) enrolled. Conversely, the age group of 5 to 9 year old has the lowest likelihood of being enrolled in a private school, with 18 (100.0% in the age bracket) attending a public institution.
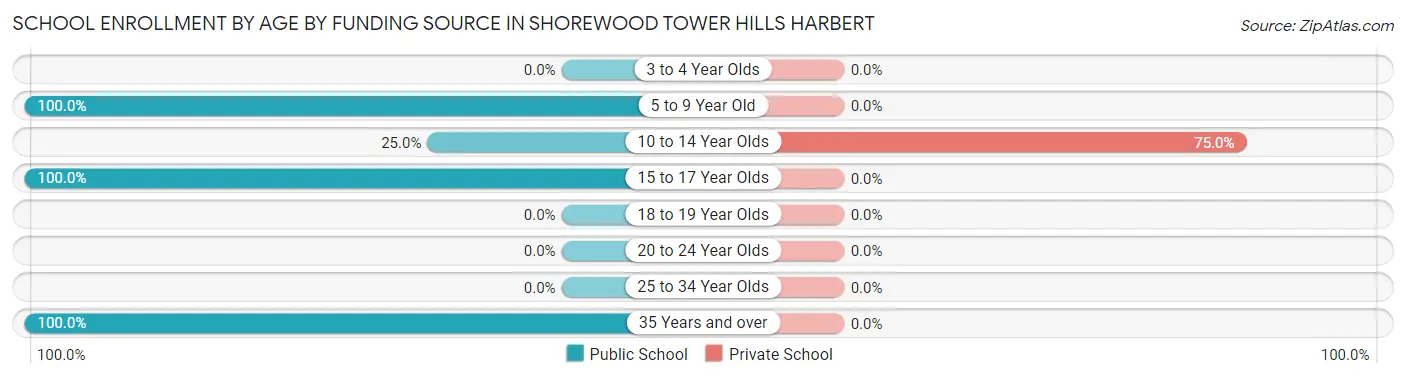
| Age Bracket | Public School | Private School |
| 3 to 4 Year Olds | 0 (0.0%) | 0 (0.0%) |
| 5 to 9 Year Old | 18 (100.0%) | 0 (0.0%) |
| 10 to 14 Year Olds | 8 (25.0%) | 24 (75.0%) |
| 15 to 17 Year Olds | 42 (100.0%) | 0 (0.0%) |
| 18 to 19 Year Olds | 0 (0.0%) | 0 (0.0%) |
| 20 to 24 Year Olds | 0 (0.0%) | 0 (0.0%) |
| 25 to 34 Year Olds | 0 (0.0%) | 0 (0.0%) |
| 35 Years and over | 8 (100.0%) | 0 (0.0%) |
| Total | 76 (76.0%) | 24 (24.0%) |
Educational Attainment by Field of Study in Shorewood Tower Hills Harbert
Business (185 | 28.4%), science & technology (81 | 12.4%), education (72 | 11.1%), bio, nature & agricultural (62 | 9.5%), and social sciences (50 | 7.7%) are the most common fields of study among 651 individuals in Shorewood Tower Hills Harbert who have obtained a bachelor's degree or higher.
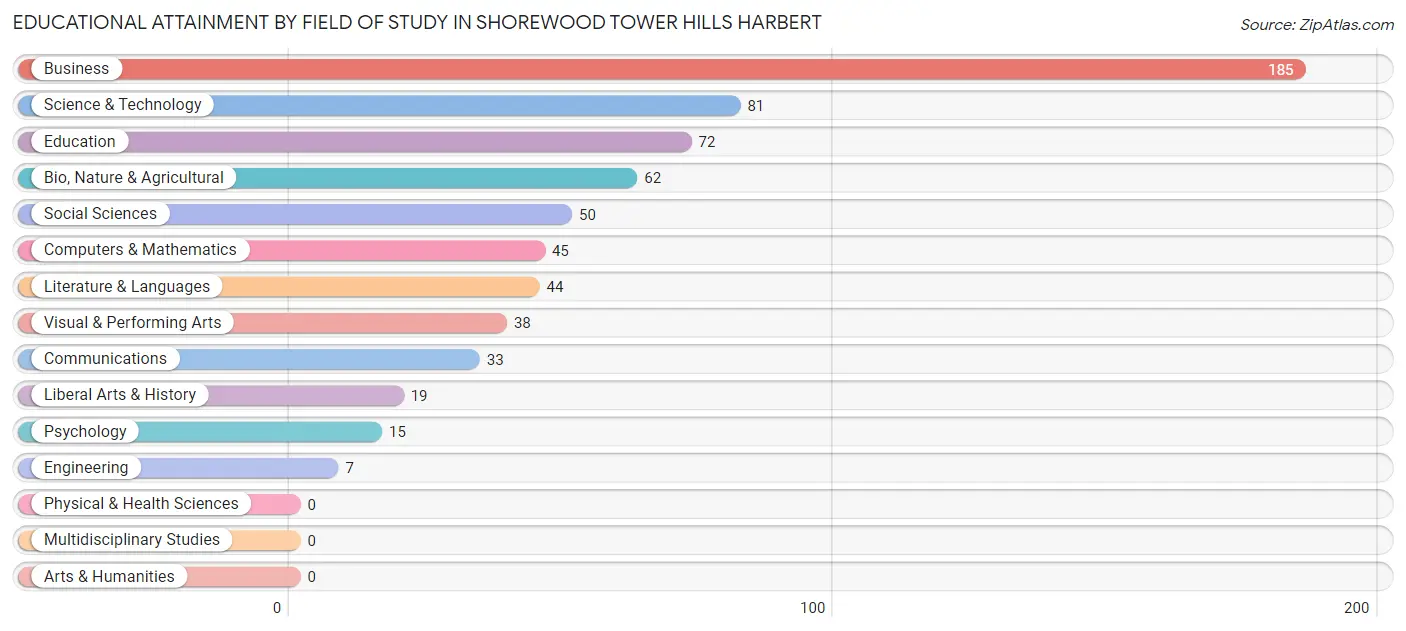
| Field of Study | # Graduates | % Graduates |
| Computers & Mathematics | 45 | 6.9% |
| Bio, Nature & Agricultural | 62 | 9.5% |
| Physical & Health Sciences | 0 | 0.0% |
| Psychology | 15 | 2.3% |
| Social Sciences | 50 | 7.7% |
| Engineering | 7 | 1.1% |
| Multidisciplinary Studies | 0 | 0.0% |
| Science & Technology | 81 | 12.4% |
| Business | 185 | 28.4% |
| Education | 72 | 11.1% |
| Literature & Languages | 44 | 6.8% |
| Liberal Arts & History | 19 | 2.9% |
| Visual & Performing Arts | 38 | 5.8% |
| Communications | 33 | 5.1% |
| Arts & Humanities | 0 | 0.0% |
| Total | 651 | 100.0% |
Transportation & Commute in Shorewood Tower Hills Harbert
Vehicle Availability by Sex in Shorewood Tower Hills Harbert
The most prevalent vehicle ownership categories in Shorewood Tower Hills Harbert are males with 2 vehicles (227, accounting for 57.9%) and females with 2 vehicles (64, making up 91.2%).
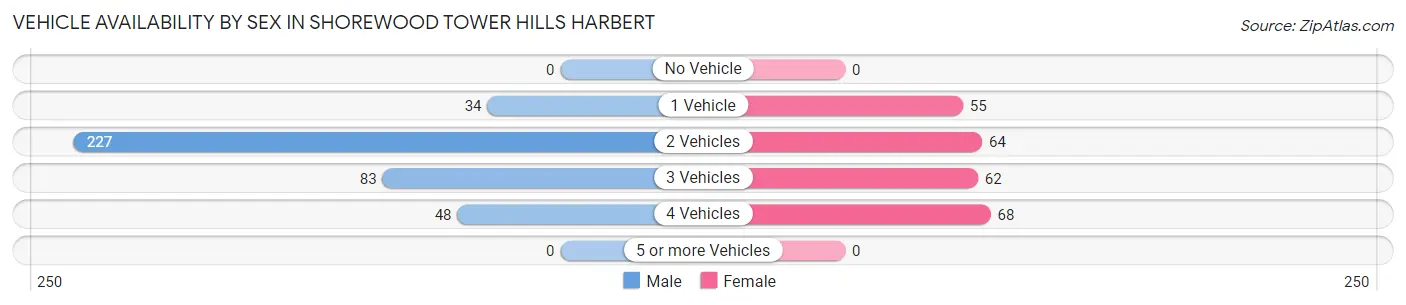
| Vehicles Available | Male | Female |
| No Vehicle | 0 (0.0%) | 0 (0.0%) |
| 1 Vehicle | 34 (8.7%) | 55 (22.1%) |
| 2 Vehicles | 227 (57.9%) | 64 (25.7%) |
| 3 Vehicles | 83 (21.2%) | 62 (24.9%) |
| 4 Vehicles | 48 (12.2%) | 68 (27.3%) |
| 5 or more Vehicles | 0 (0.0%) | 0 (0.0%) |
| Total | 392 (100.0%) | 249 (100.0%) |
Commute Time in Shorewood Tower Hills Harbert
The most frequently occuring commute durations in Shorewood Tower Hills Harbert are 90 or more minutes (138 commuters, 30.2%), 10 to 14 minutes (84 commuters, 18.4%), and less than 5 minutes (65 commuters, 14.2%).
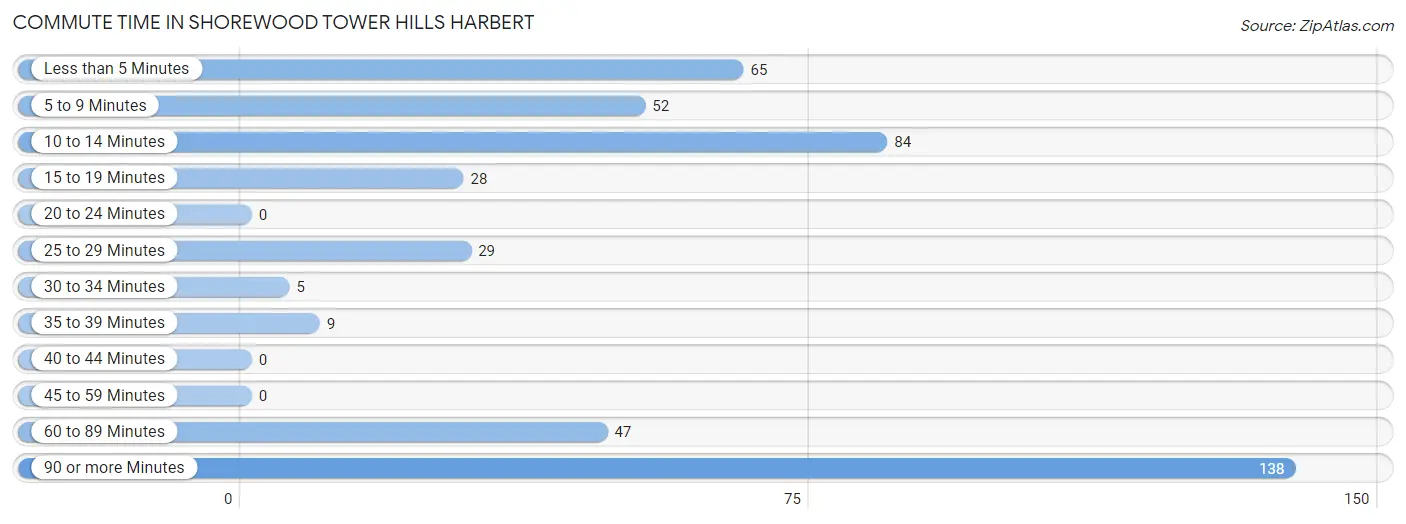
| Commute Time | # Commuters | % Commuters |
| Less than 5 Minutes | 65 | 14.2% |
| 5 to 9 Minutes | 52 | 11.4% |
| 10 to 14 Minutes | 84 | 18.4% |
| 15 to 19 Minutes | 28 | 6.1% |
| 20 to 24 Minutes | 0 | 0.0% |
| 25 to 29 Minutes | 29 | 6.4% |
| 30 to 34 Minutes | 5 | 1.1% |
| 35 to 39 Minutes | 9 | 2.0% |
| 40 to 44 Minutes | 0 | 0.0% |
| 45 to 59 Minutes | 0 | 0.0% |
| 60 to 89 Minutes | 47 | 10.3% |
| 90 or more Minutes | 138 | 30.2% |
Commute Time by Sex in Shorewood Tower Hills Harbert
The most common commute times in Shorewood Tower Hills Harbert are 90 or more minutes (97 commuters, 34.4%) for males and 10 to 14 minutes (45 commuters, 25.7%) for females.
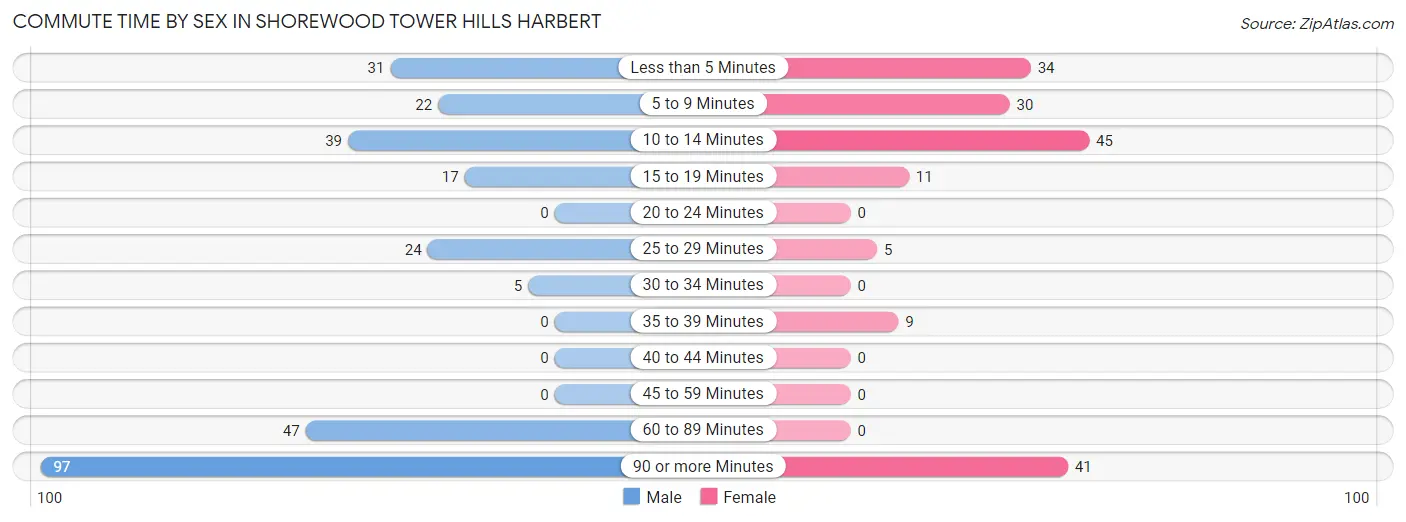
| Commute Time | Male | Female |
| Less than 5 Minutes | 31 (11.0%) | 34 (19.4%) |
| 5 to 9 Minutes | 22 (7.8%) | 30 (17.1%) |
| 10 to 14 Minutes | 39 (13.8%) | 45 (25.7%) |
| 15 to 19 Minutes | 17 (6.0%) | 11 (6.3%) |
| 20 to 24 Minutes | 0 (0.0%) | 0 (0.0%) |
| 25 to 29 Minutes | 24 (8.5%) | 5 (2.9%) |
| 30 to 34 Minutes | 5 (1.8%) | 0 (0.0%) |
| 35 to 39 Minutes | 0 (0.0%) | 9 (5.1%) |
| 40 to 44 Minutes | 0 (0.0%) | 0 (0.0%) |
| 45 to 59 Minutes | 0 (0.0%) | 0 (0.0%) |
| 60 to 89 Minutes | 47 (16.7%) | 0 (0.0%) |
| 90 or more Minutes | 97 (34.4%) | 41 (23.4%) |
Time of Departure to Work by Sex in Shorewood Tower Hills Harbert
The most frequent times of departure to work in Shorewood Tower Hills Harbert are 6:30 AM to 6:59 AM (98, 34.7%) for males and 6:30 AM to 6:59 AM (35, 20.0%) for females.
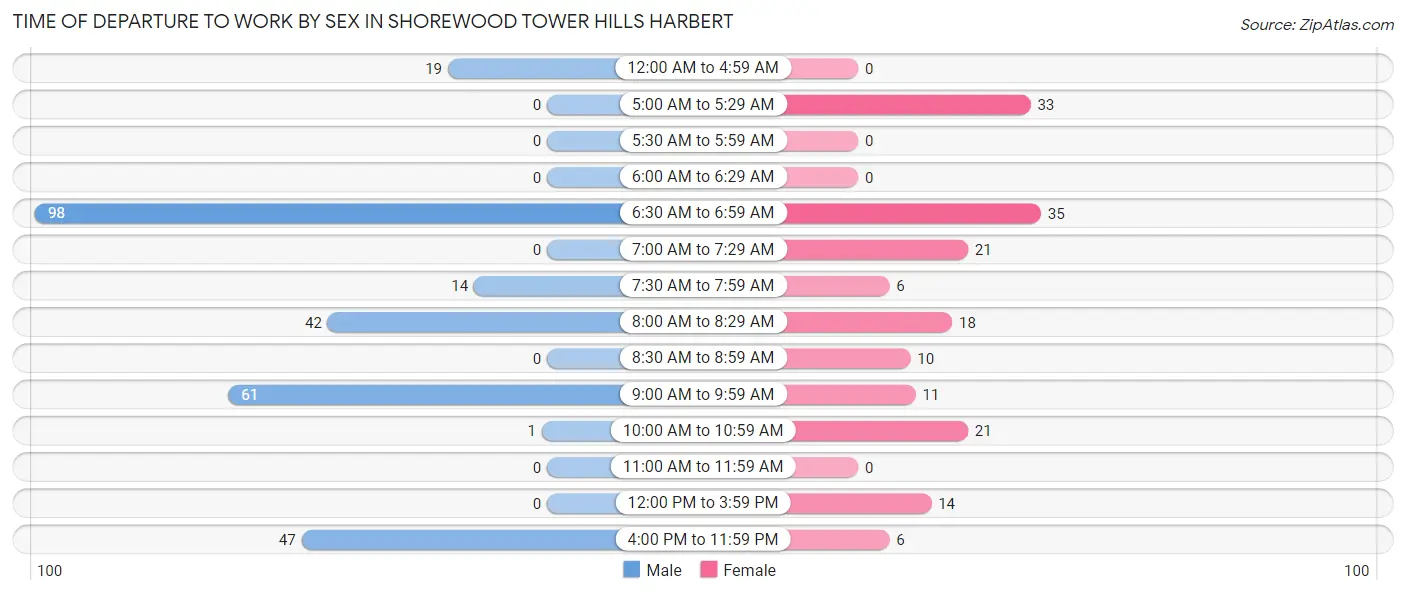
| Time of Departure | Male | Female |
| 12:00 AM to 4:59 AM | 19 (6.7%) | 0 (0.0%) |
| 5:00 AM to 5:29 AM | 0 (0.0%) | 33 (18.9%) |
| 5:30 AM to 5:59 AM | 0 (0.0%) | 0 (0.0%) |
| 6:00 AM to 6:29 AM | 0 (0.0%) | 0 (0.0%) |
| 6:30 AM to 6:59 AM | 98 (34.7%) | 35 (20.0%) |
| 7:00 AM to 7:29 AM | 0 (0.0%) | 21 (12.0%) |
| 7:30 AM to 7:59 AM | 14 (5.0%) | 6 (3.4%) |
| 8:00 AM to 8:29 AM | 42 (14.9%) | 18 (10.3%) |
| 8:30 AM to 8:59 AM | 0 (0.0%) | 10 (5.7%) |
| 9:00 AM to 9:59 AM | 61 (21.6%) | 11 (6.3%) |
| 10:00 AM to 10:59 AM | 1 (0.4%) | 21 (12.0%) |
| 11:00 AM to 11:59 AM | 0 (0.0%) | 0 (0.0%) |
| 12:00 PM to 3:59 PM | 0 (0.0%) | 14 (8.0%) |
| 4:00 PM to 11:59 PM | 47 (16.7%) | 6 (3.4%) |
| Total | 282 (100.0%) | 175 (100.0%) |
Housing Occupancy in Shorewood Tower Hills Harbert
Occupancy by Ownership in Shorewood Tower Hills Harbert
Of the total 682 dwellings in Shorewood Tower Hills Harbert, owner-occupied units account for 665 (97.5%), while renter-occupied units make up 17 (2.5%).
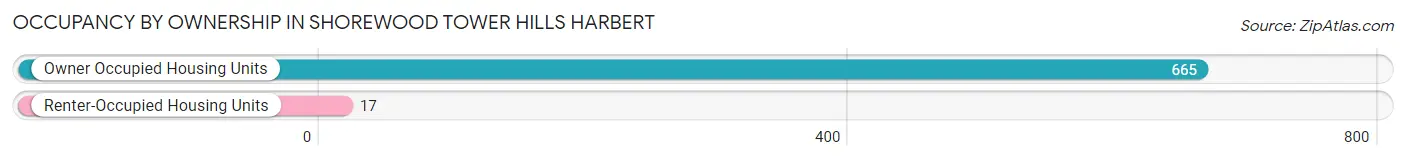
| Occupancy | # Housing Units | % Housing Units |
| Owner Occupied Housing Units | 665 | 97.5% |
| Renter-Occupied Housing Units | 17 | 2.5% |
| Total Occupied Housing Units | 682 | 100.0% |
Occupancy by Household Size in Shorewood Tower Hills Harbert
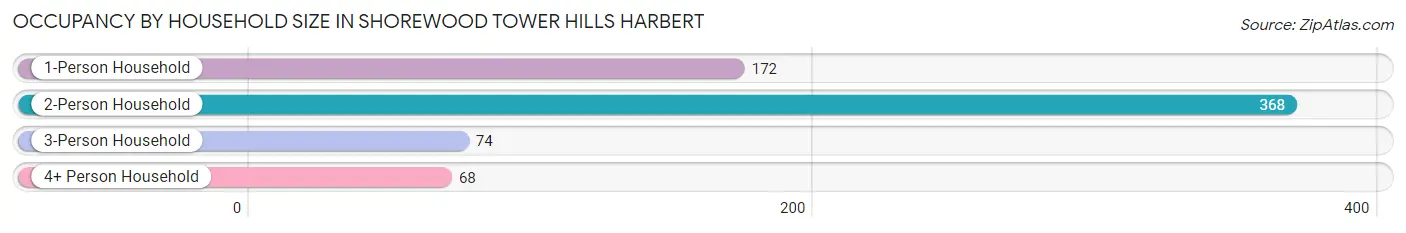
| Household Size | # Housing Units | % Housing Units |
| 1-Person Household | 172 | 25.2% |
| 2-Person Household | 368 | 54.0% |
| 3-Person Household | 74 | 10.8% |
| 4+ Person Household | 68 | 10.0% |
| Total Housing Units | 682 | 100.0% |
Occupancy by Ownership by Household Size in Shorewood Tower Hills Harbert
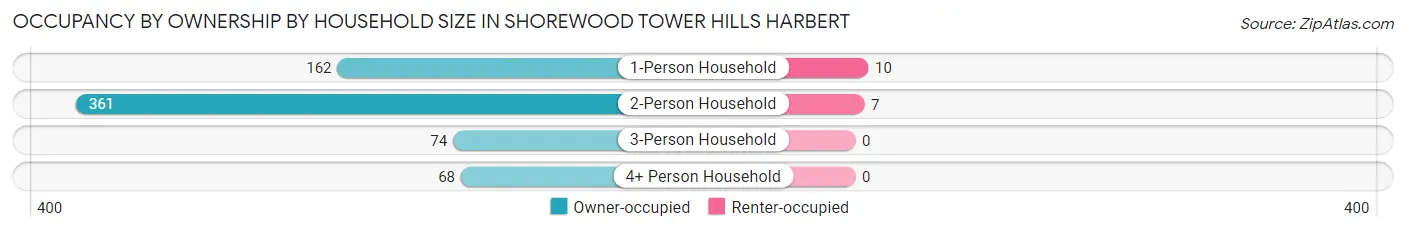
| Household Size | Owner-occupied | Renter-occupied |
| 1-Person Household | 162 (94.2%) | 10 (5.8%) |
| 2-Person Household | 361 (98.1%) | 7 (1.9%) |
| 3-Person Household | 74 (100.0%) | 0 (0.0%) |
| 4+ Person Household | 68 (100.0%) | 0 (0.0%) |
| Total Housing Units | 665 (97.5%) | 17 (2.5%) |
Occupancy by Educational Attainment in Shorewood Tower Hills Harbert
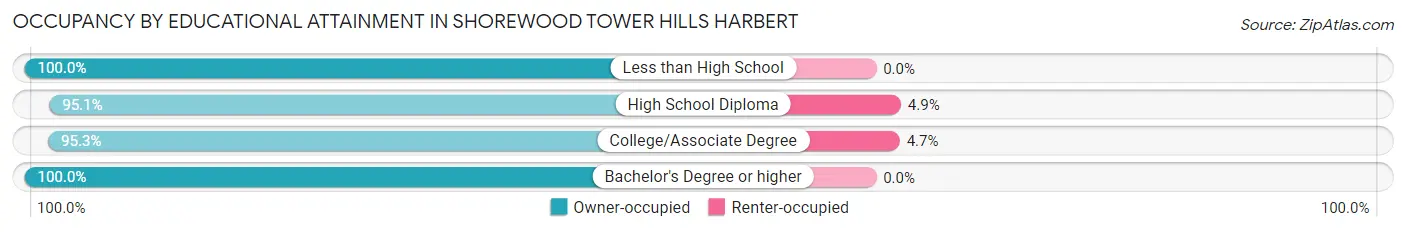
| Household Size | Owner-occupied | Renter-occupied |
| Less than High School | 13 (100.0%) | 0 (0.0%) |
| High School Diploma | 136 (95.1%) | 7 (4.9%) |
| College/Associate Degree | 204 (95.3%) | 10 (4.7%) |
| Bachelor's Degree or higher | 312 (100.0%) | 0 (0.0%) |
Occupancy by Age of Householder in Shorewood Tower Hills Harbert
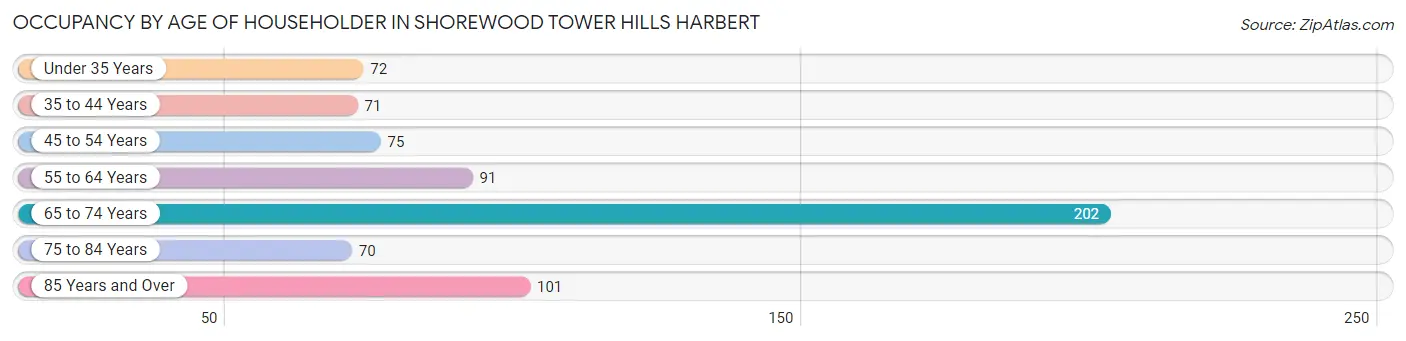
| Age Bracket | # Households | % Households |
| Under 35 Years | 72 | 10.6% |
| 35 to 44 Years | 71 | 10.4% |
| 45 to 54 Years | 75 | 11.0% |
| 55 to 64 Years | 91 | 13.3% |
| 65 to 74 Years | 202 | 29.6% |
| 75 to 84 Years | 70 | 10.3% |
| 85 Years and Over | 101 | 14.8% |
| Total | 682 | 100.0% |
Housing Finances in Shorewood Tower Hills Harbert
Median Income by Occupancy in Shorewood Tower Hills Harbert
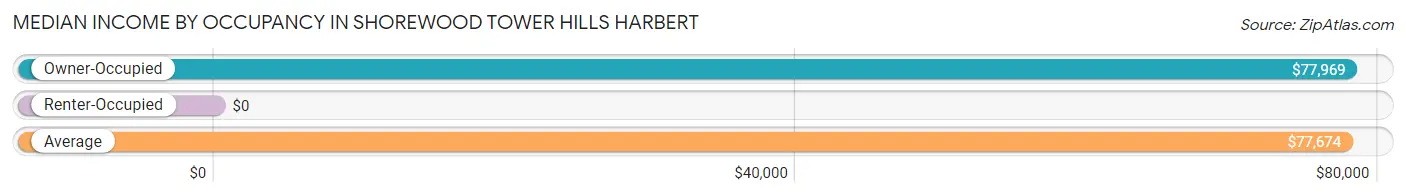
| Occupancy Type | # Households | Median Income |
| Owner-Occupied | 665 (97.5%) | $77,969 |
| Renter-Occupied | 17 (2.5%) | $0 |
| Average | 682 (100.0%) | $77,674 |
Occupancy by Householder Income Bracket in Shorewood Tower Hills Harbert
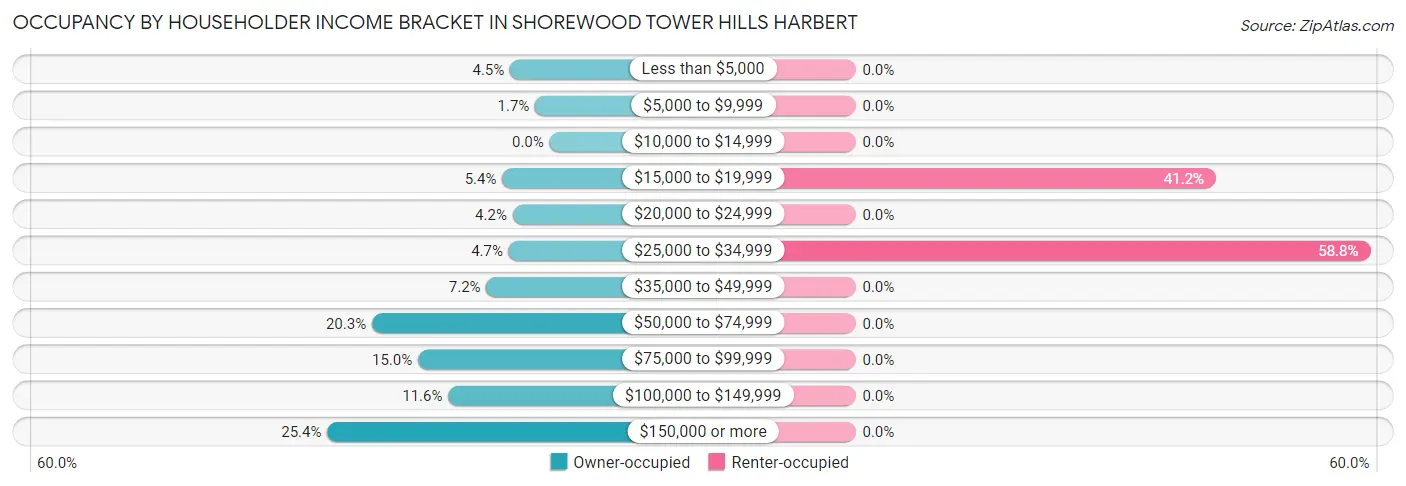
| Income Bracket | Owner-occupied | Renter-occupied |
| Less than $5,000 | 30 (4.5%) | 0 (0.0%) |
| $5,000 to $9,999 | 11 (1.7%) | 0 (0.0%) |
| $10,000 to $14,999 | 0 (0.0%) | 0 (0.0%) |
| $15,000 to $19,999 | 36 (5.4%) | 7 (41.2%) |
| $20,000 to $24,999 | 28 (4.2%) | 0 (0.0%) |
| $25,000 to $34,999 | 31 (4.7%) | 10 (58.8%) |
| $35,000 to $49,999 | 48 (7.2%) | 0 (0.0%) |
| $50,000 to $74,999 | 135 (20.3%) | 0 (0.0%) |
| $75,000 to $99,999 | 100 (15.0%) | 0 (0.0%) |
| $100,000 to $149,999 | 77 (11.6%) | 0 (0.0%) |
| $150,000 or more | 169 (25.4%) | 0 (0.0%) |
| Total | 665 (100.0%) | 17 (100.0%) |
Monthly Housing Cost Tiers in Shorewood Tower Hills Harbert
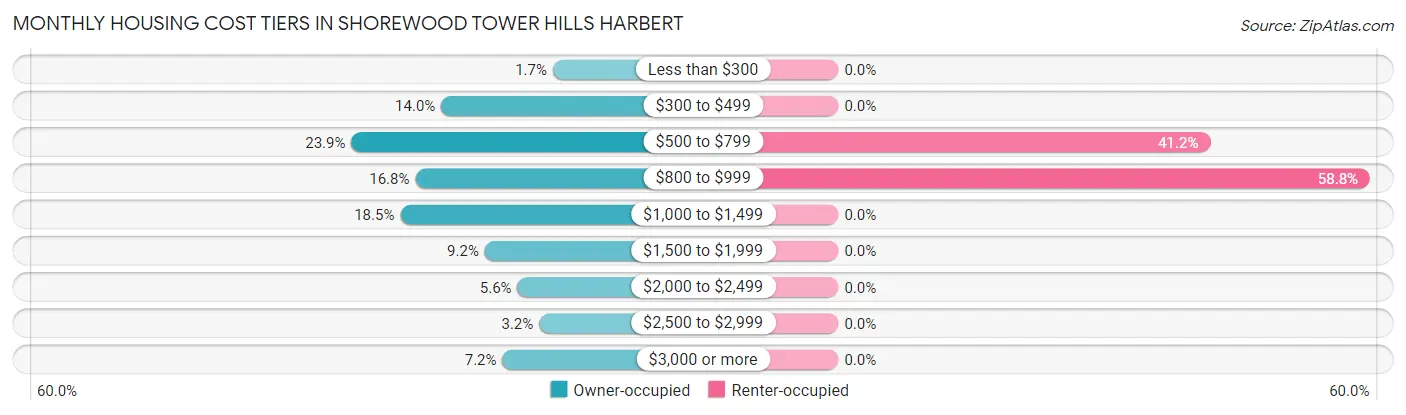
| Monthly Cost | Owner-occupied | Renter-occupied |
| Less than $300 | 11 (1.7%) | 0 (0.0%) |
| $300 to $499 | 93 (14.0%) | 0 (0.0%) |
| $500 to $799 | 159 (23.9%) | 7 (41.2%) |
| $800 to $999 | 112 (16.8%) | 10 (58.8%) |
| $1,000 to $1,499 | 123 (18.5%) | 0 (0.0%) |
| $1,500 to $1,999 | 61 (9.2%) | 0 (0.0%) |
| $2,000 to $2,499 | 37 (5.6%) | 0 (0.0%) |
| $2,500 to $2,999 | 21 (3.2%) | 0 (0.0%) |
| $3,000 or more | 48 (7.2%) | 0 (0.0%) |
| Total | 665 (100.0%) | 17 (100.0%) |
Physical Housing Characteristics in Shorewood Tower Hills Harbert
Housing Structures in Shorewood Tower Hills Harbert
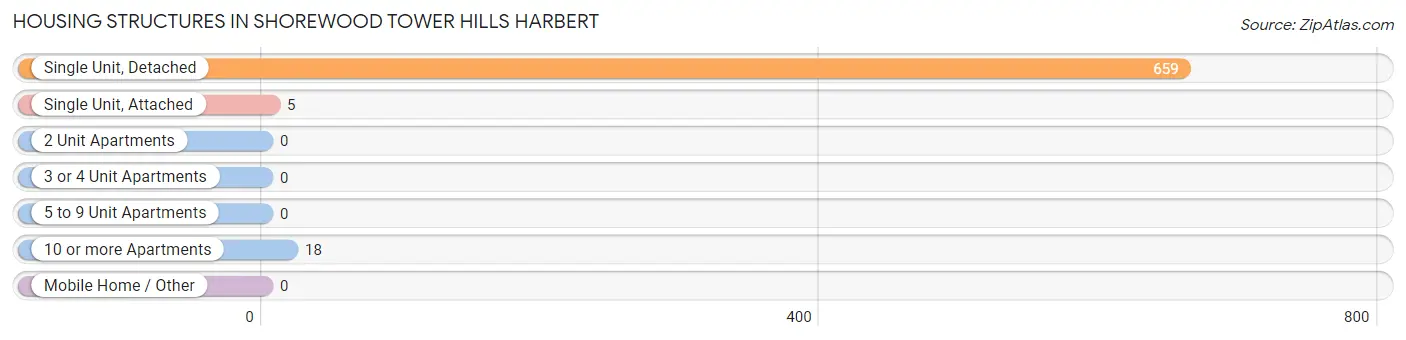
| Structure Type | # Housing Units | % Housing Units |
| Single Unit, Detached | 659 | 96.6% |
| Single Unit, Attached | 5 | 0.7% |
| 2 Unit Apartments | 0 | 0.0% |
| 3 or 4 Unit Apartments | 0 | 0.0% |
| 5 to 9 Unit Apartments | 0 | 0.0% |
| 10 or more Apartments | 18 | 2.6% |
| Mobile Home / Other | 0 | 0.0% |
| Total | 682 | 100.0% |
Housing Structures by Occupancy in Shorewood Tower Hills Harbert
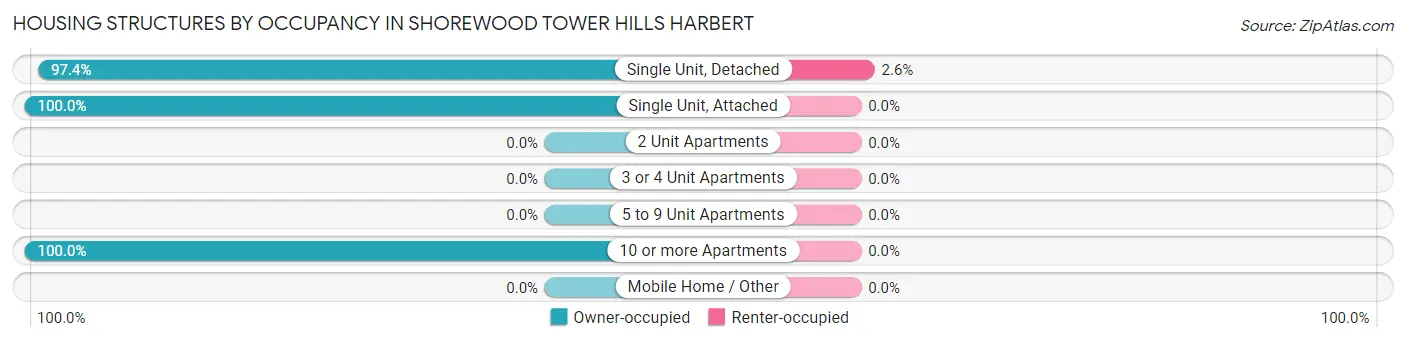
| Structure Type | Owner-occupied | Renter-occupied |
| Single Unit, Detached | 642 (97.4%) | 17 (2.6%) |
| Single Unit, Attached | 5 (100.0%) | 0 (0.0%) |
| 2 Unit Apartments | 0 (0.0%) | 0 (0.0%) |
| 3 or 4 Unit Apartments | 0 (0.0%) | 0 (0.0%) |
| 5 to 9 Unit Apartments | 0 (0.0%) | 0 (0.0%) |
| 10 or more Apartments | 18 (100.0%) | 0 (0.0%) |
| Mobile Home / Other | 0 (0.0%) | 0 (0.0%) |
| Total | 665 (97.5%) | 17 (2.5%) |
Housing Structures by Number of Rooms in Shorewood Tower Hills Harbert
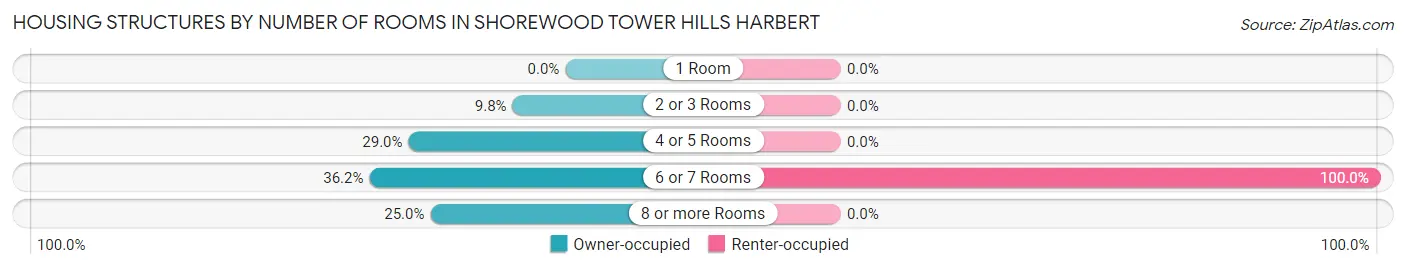
| Number of Rooms | Owner-occupied | Renter-occupied |
| 1 Room | 0 (0.0%) | 0 (0.0%) |
| 2 or 3 Rooms | 65 (9.8%) | 0 (0.0%) |
| 4 or 5 Rooms | 193 (29.0%) | 0 (0.0%) |
| 6 or 7 Rooms | 241 (36.2%) | 17 (100.0%) |
| 8 or more Rooms | 166 (25.0%) | 0 (0.0%) |
| Total | 665 (100.0%) | 17 (100.0%) |
Housing Structure by Heating Type in Shorewood Tower Hills Harbert
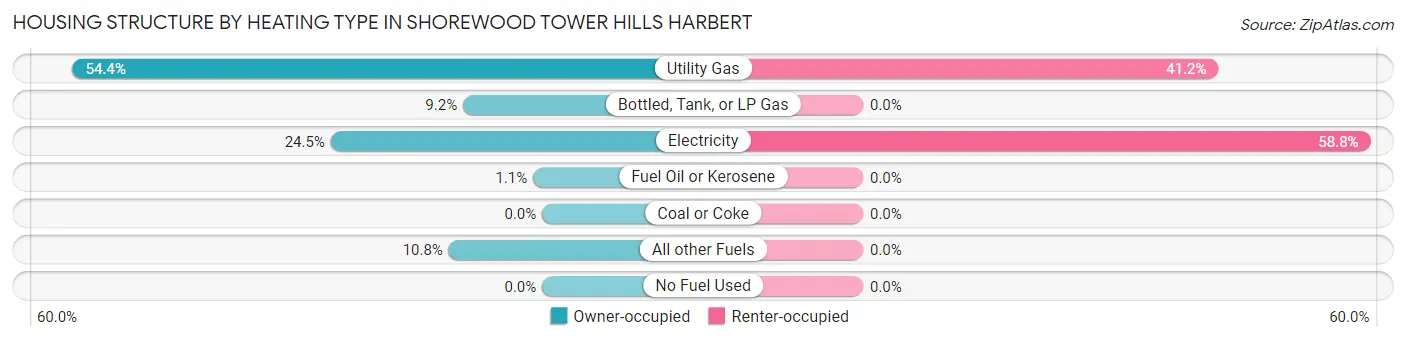
| Heating Type | Owner-occupied | Renter-occupied |
| Utility Gas | 362 (54.4%) | 7 (41.2%) |
| Bottled, Tank, or LP Gas | 61 (9.2%) | 0 (0.0%) |
| Electricity | 163 (24.5%) | 10 (58.8%) |
| Fuel Oil or Kerosene | 7 (1.1%) | 0 (0.0%) |
| Coal or Coke | 0 (0.0%) | 0 (0.0%) |
| All other Fuels | 72 (10.8%) | 0 (0.0%) |
| No Fuel Used | 0 (0.0%) | 0 (0.0%) |
| Total | 665 (100.0%) | 17 (100.0%) |
Household Vehicle Usage in Shorewood Tower Hills Harbert
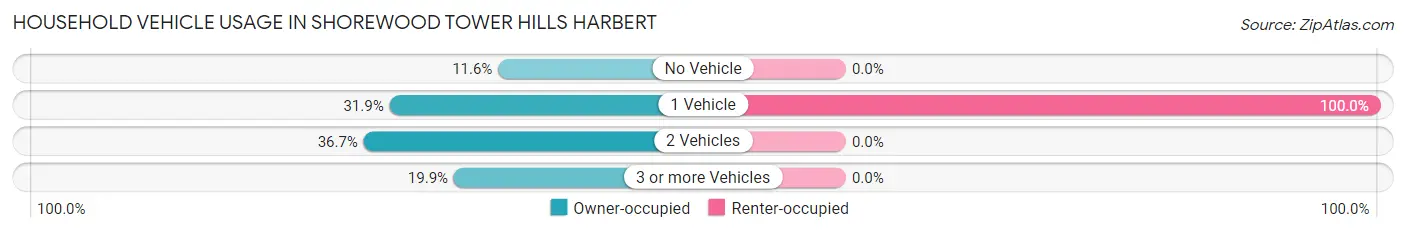
| Vehicles per Household | Owner-occupied | Renter-occupied |
| No Vehicle | 77 (11.6%) | 0 (0.0%) |
| 1 Vehicle | 212 (31.9%) | 17 (100.0%) |
| 2 Vehicles | 244 (36.7%) | 0 (0.0%) |
| 3 or more Vehicles | 132 (19.9%) | 0 (0.0%) |
| Total | 665 (100.0%) | 17 (100.0%) |
Real Estate & Mortgages in Shorewood Tower Hills Harbert
Real Estate and Mortgage Overview in Shorewood Tower Hills Harbert
| Characteristic | Without Mortgage | With Mortgage |
| Housing Units | 353 | 312 |
| Median Property Value | $305,600 | $250,000 |
| Median Household Income | $78,108 | $106 |
| Monthly Housing Costs | $737 | $48 |
| Real Estate Taxes | $4,675 | $0 |
Property Value by Mortgage Status in Shorewood Tower Hills Harbert
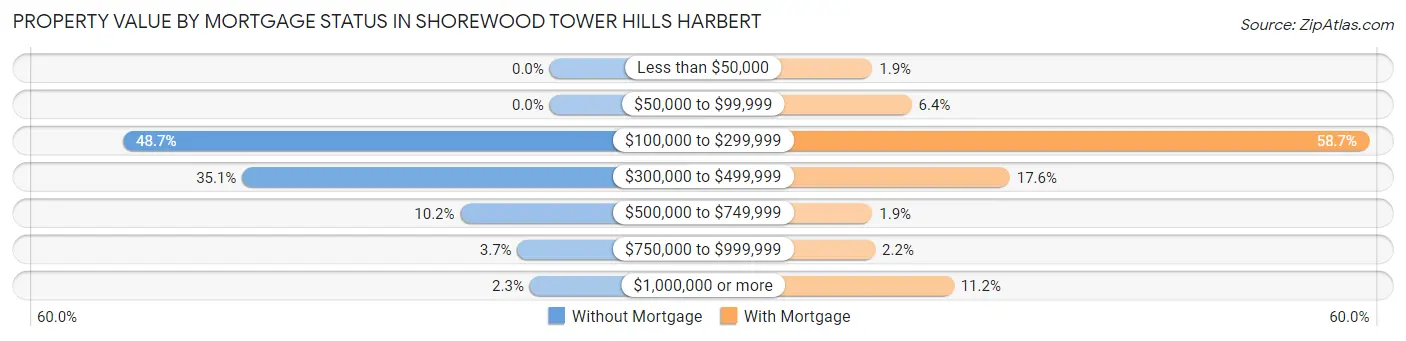
| Property Value | Without Mortgage | With Mortgage |
| Less than $50,000 | 0 (0.0%) | 6 (1.9%) |
| $50,000 to $99,999 | 0 (0.0%) | 20 (6.4%) |
| $100,000 to $299,999 | 172 (48.7%) | 183 (58.7%) |
| $300,000 to $499,999 | 124 (35.1%) | 55 (17.6%) |
| $500,000 to $749,999 | 36 (10.2%) | 6 (1.9%) |
| $750,000 to $999,999 | 13 (3.7%) | 7 (2.2%) |
| $1,000,000 or more | 8 (2.3%) | 35 (11.2%) |
| Total | 353 (100.0%) | 312 (100.0%) |
Household Income by Mortgage Status in Shorewood Tower Hills Harbert
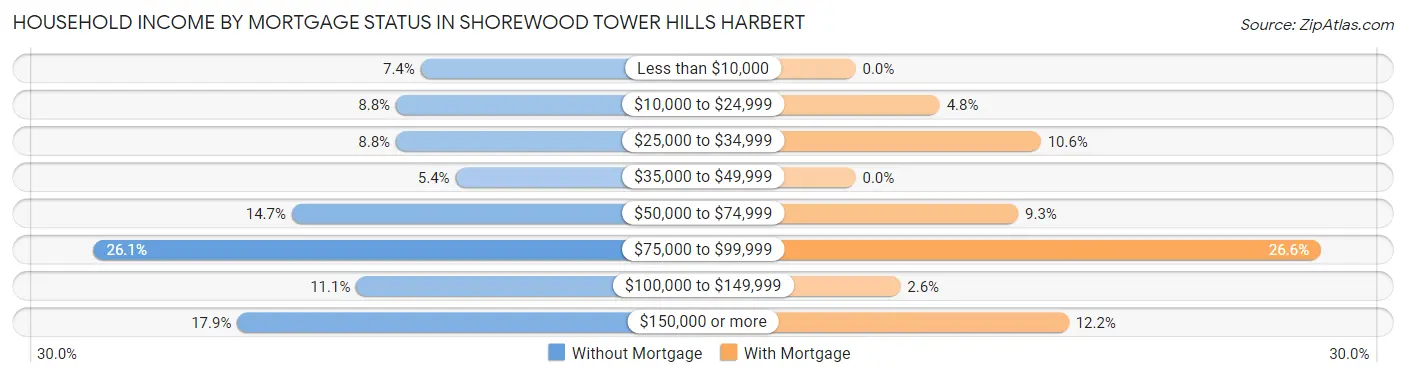
| Household Income | Without Mortgage | With Mortgage |
| Less than $10,000 | 26 (7.4%) | 0 (0.0%) |
| $10,000 to $24,999 | 31 (8.8%) | 15 (4.8%) |
| $25,000 to $34,999 | 31 (8.8%) | 33 (10.6%) |
| $35,000 to $49,999 | 19 (5.4%) | 0 (0.0%) |
| $50,000 to $74,999 | 52 (14.7%) | 29 (9.3%) |
| $75,000 to $99,999 | 92 (26.1%) | 83 (26.6%) |
| $100,000 to $149,999 | 39 (11.1%) | 8 (2.6%) |
| $150,000 or more | 63 (17.8%) | 38 (12.2%) |
| Total | 353 (100.0%) | 312 (100.0%) |
Property Value to Household Income Ratio in Shorewood Tower Hills Harbert
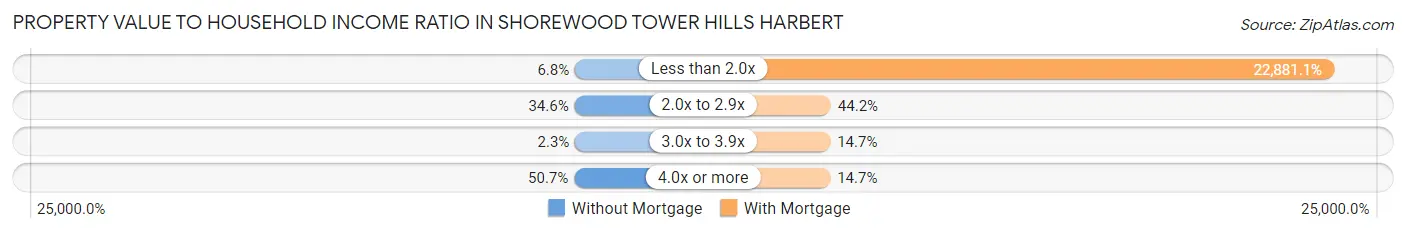
| Value-to-Income Ratio | Without Mortgage | With Mortgage |
| Less than 2.0x | 24 (6.8%) | 71,389 (22,881.1%) |
| 2.0x to 2.9x | 122 (34.6%) | 138 (44.2%) |
| 3.0x to 3.9x | 8 (2.3%) | 46 (14.7%) |
| 4.0x or more | 179 (50.7%) | 46 (14.7%) |
| Total | 353 (100.0%) | 312 (100.0%) |
Real Estate Taxes by Mortgage Status in Shorewood Tower Hills Harbert
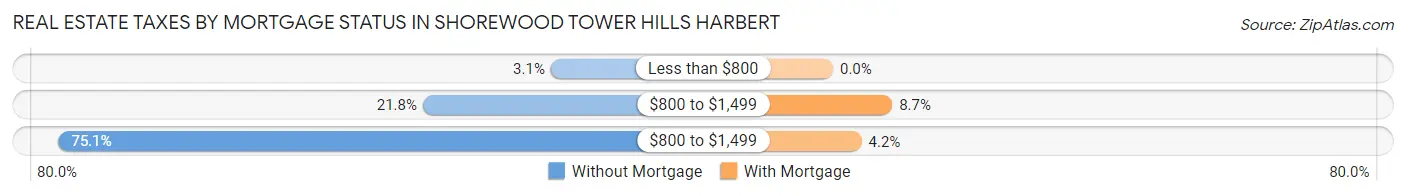
| Property Taxes | Without Mortgage | With Mortgage |
| Less than $800 | 11 (3.1%) | 0 (0.0%) |
| $800 to $1,499 | 77 (21.8%) | 27 (8.6%) |
| $800 to $1,499 | 265 (75.1%) | 13 (4.2%) |
| Total | 353 (100.0%) | 312 (100.0%) |
Health & Disability in Shorewood Tower Hills Harbert
Health Insurance Coverage by Age in Shorewood Tower Hills Harbert
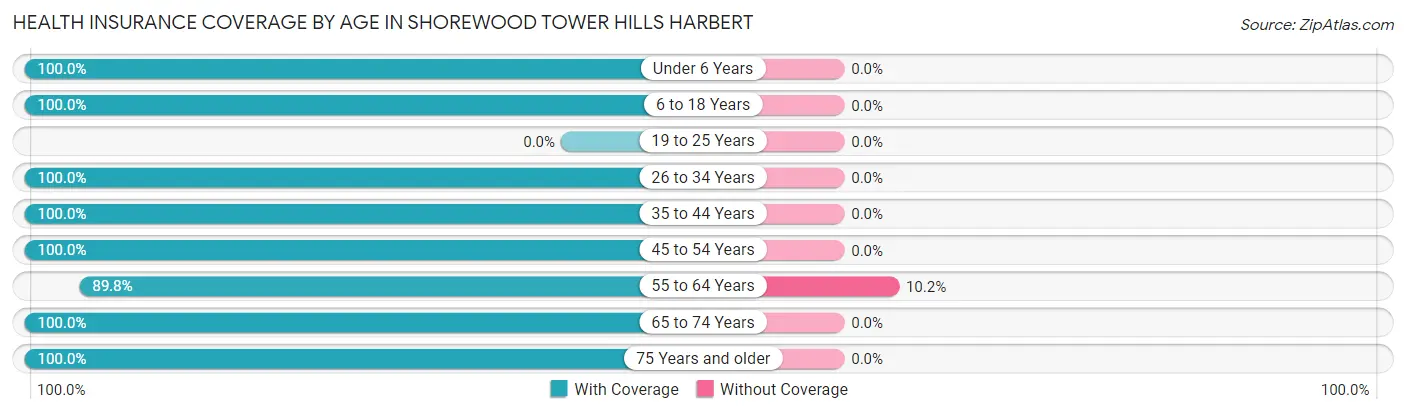
| Age Bracket | With Coverage | Without Coverage |
| Under 6 Years | 74 (100.0%) | 0 (0.0%) |
| 6 to 18 Years | 92 (100.0%) | 0 (0.0%) |
| 19 to 25 Years | 0 (0.0%) | 0 (0.0%) |
| 26 to 34 Years | 229 (100.0%) | 0 (0.0%) |
| 35 to 44 Years | 153 (100.0%) | 0 (0.0%) |
| 45 to 54 Years | 245 (100.0%) | 0 (0.0%) |
| 55 to 64 Years | 176 (89.8%) | 20 (10.2%) |
| 65 to 74 Years | 293 (100.0%) | 0 (0.0%) |
| 75 Years and older | 219 (100.0%) | 0 (0.0%) |
| Total | 1,481 (98.7%) | 20 (1.3%) |
Health Insurance Coverage by Citizenship Status in Shorewood Tower Hills Harbert
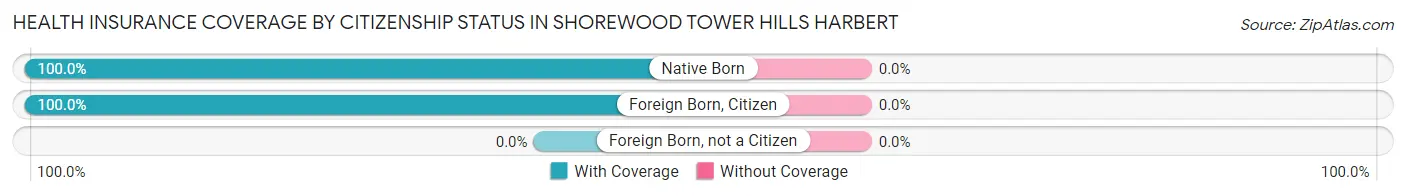
| Citizenship Status | With Coverage | Without Coverage |
| Native Born | 74 (100.0%) | 0 (0.0%) |
| Foreign Born, Citizen | 92 (100.0%) | 0 (0.0%) |
| Foreign Born, not a Citizen | 0 (0.0%) | 0 (0.0%) |
Health Insurance Coverage by Household Income in Shorewood Tower Hills Harbert
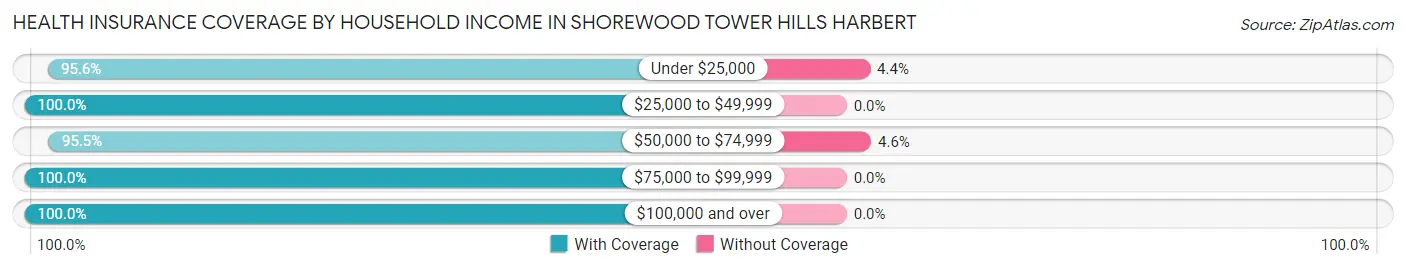
| Household Income | With Coverage | Without Coverage |
| Under $25,000 | 131 (95.6%) | 6 (4.4%) |
| $25,000 to $49,999 | 150 (100.0%) | 0 (0.0%) |
| $50,000 to $74,999 | 294 (95.5%) | 14 (4.5%) |
| $75,000 to $99,999 | 284 (100.0%) | 0 (0.0%) |
| $100,000 and over | 622 (100.0%) | 0 (0.0%) |
Public vs Private Health Insurance Coverage by Age in Shorewood Tower Hills Harbert
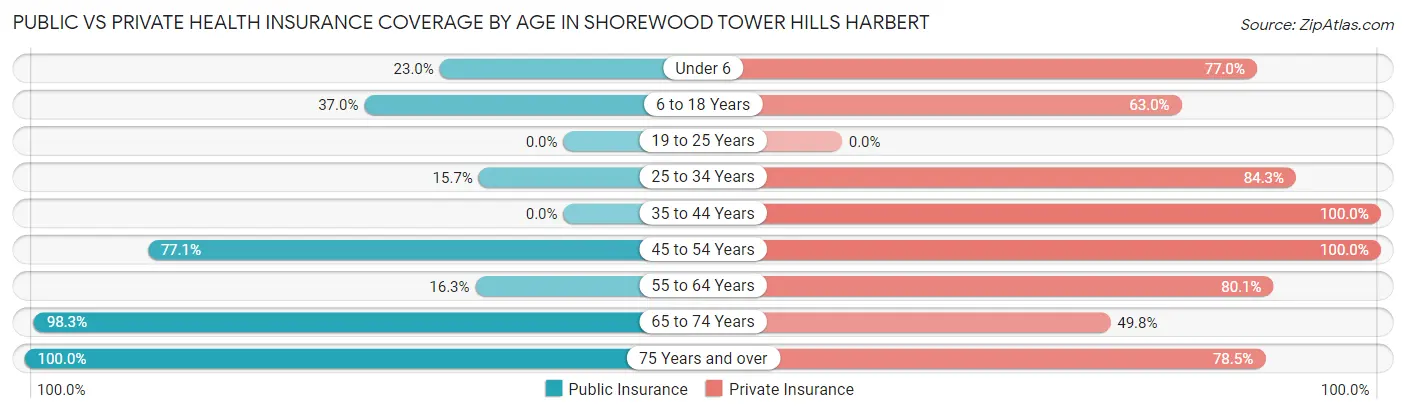
| Age Bracket | Public Insurance | Private Insurance |
| Under 6 | 17 (23.0%) | 57 (77.0%) |
| 6 to 18 Years | 34 (37.0%) | 58 (63.0%) |
| 19 to 25 Years | 0 (0.0%) | 0 (0.0%) |
| 25 to 34 Years | 36 (15.7%) | 193 (84.3%) |
| 35 to 44 Years | 0 (0.0%) | 153 (100.0%) |
| 45 to 54 Years | 189 (77.1%) | 245 (100.0%) |
| 55 to 64 Years | 32 (16.3%) | 157 (80.1%) |
| 65 to 74 Years | 288 (98.3%) | 146 (49.8%) |
| 75 Years and over | 219 (100.0%) | 172 (78.5%) |
| Total | 815 (54.3%) | 1,181 (78.7%) |
Disability Status by Sex by Age in Shorewood Tower Hills Harbert
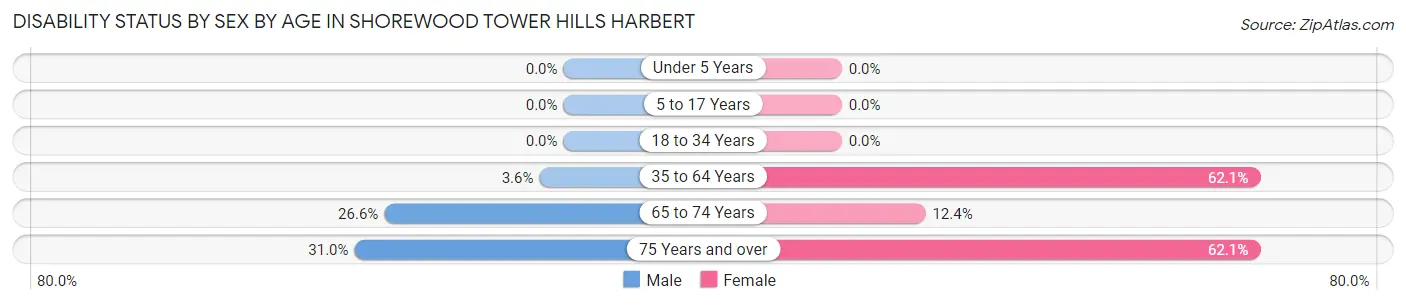
| Age Bracket | Male | Female |
| Under 5 Years | 0 (0.0%) | 0 (0.0%) |
| 5 to 17 Years | 0 (0.0%) | 0 (0.0%) |
| 18 to 34 Years | 0 (0.0%) | 0 (0.0%) |
| 35 to 64 Years | 10 (3.6%) | 195 (62.1%) |
| 65 to 74 Years | 33 (26.6%) | 21 (12.4%) |
| 75 Years and over | 18 (31.0%) | 100 (62.1%) |
Disability Class by Sex by Age in Shorewood Tower Hills Harbert
Disability Class: Hearing Difficulty
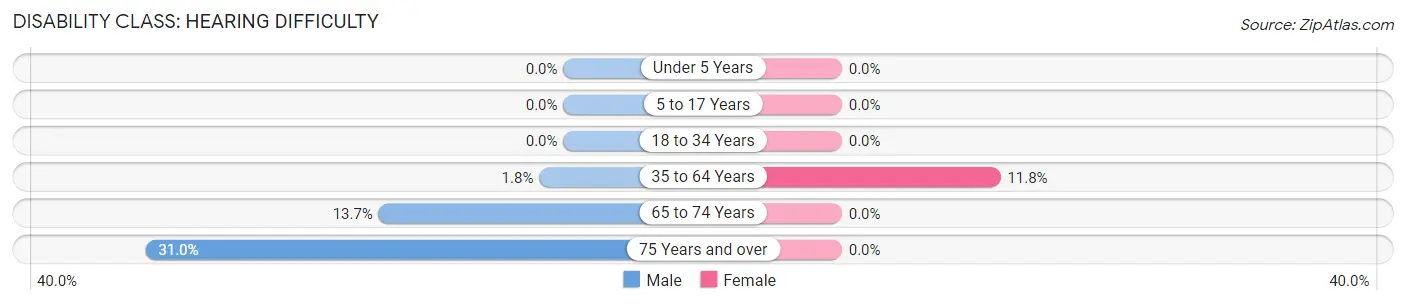
| Age Bracket | Male | Female |
| Under 5 Years | 0 (0.0%) | 0 (0.0%) |
| 5 to 17 Years | 0 (0.0%) | 0 (0.0%) |
| 18 to 34 Years | 0 (0.0%) | 0 (0.0%) |
| 35 to 64 Years | 5 (1.8%) | 37 (11.8%) |
| 65 to 74 Years | 17 (13.7%) | 0 (0.0%) |
| 75 Years and over | 18 (31.0%) | 0 (0.0%) |
Disability Class: Vision Difficulty
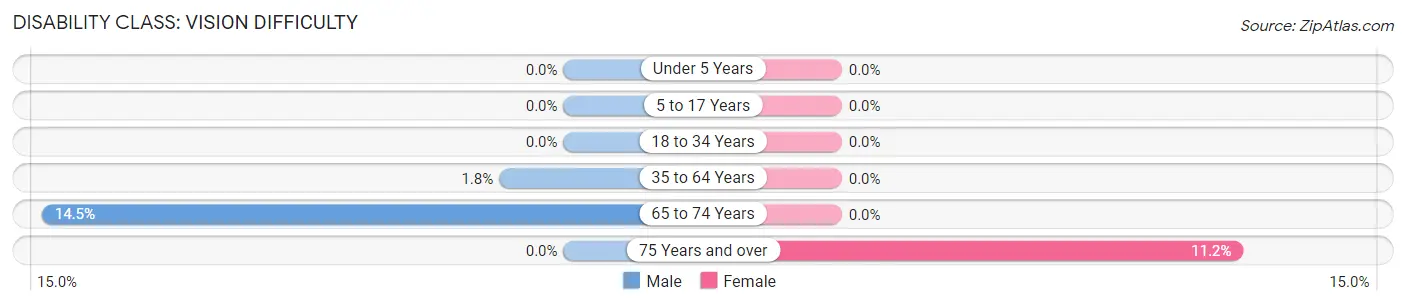
| Age Bracket | Male | Female |
| Under 5 Years | 0 (0.0%) | 0 (0.0%) |
| 5 to 17 Years | 0 (0.0%) | 0 (0.0%) |
| 18 to 34 Years | 0 (0.0%) | 0 (0.0%) |
| 35 to 64 Years | 5 (1.8%) | 0 (0.0%) |
| 65 to 74 Years | 18 (14.5%) | 0 (0.0%) |
| 75 Years and over | 0 (0.0%) | 18 (11.2%) |
Disability Class: Cognitive Difficulty
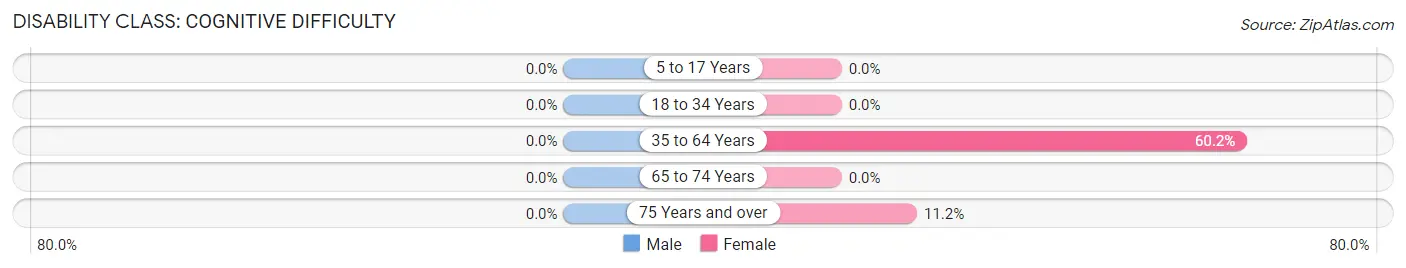
| Age Bracket | Male | Female |
| 5 to 17 Years | 0 (0.0%) | 0 (0.0%) |
| 18 to 34 Years | 0 (0.0%) | 0 (0.0%) |
| 35 to 64 Years | 0 (0.0%) | 189 (60.2%) |
| 65 to 74 Years | 0 (0.0%) | 0 (0.0%) |
| 75 Years and over | 0 (0.0%) | 18 (11.2%) |
Disability Class: Ambulatory Difficulty
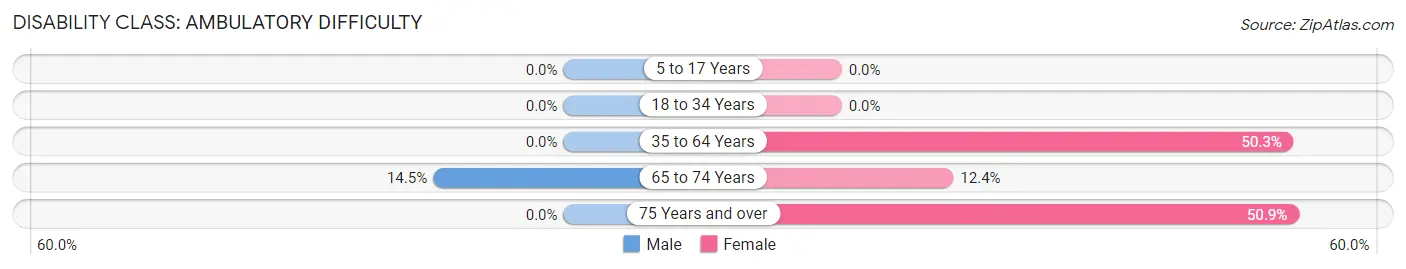
| Age Bracket | Male | Female |
| 5 to 17 Years | 0 (0.0%) | 0 (0.0%) |
| 18 to 34 Years | 0 (0.0%) | 0 (0.0%) |
| 35 to 64 Years | 0 (0.0%) | 158 (50.3%) |
| 65 to 74 Years | 18 (14.5%) | 21 (12.4%) |
| 75 Years and over | 0 (0.0%) | 82 (50.9%) |
Disability Class: Self-Care Difficulty
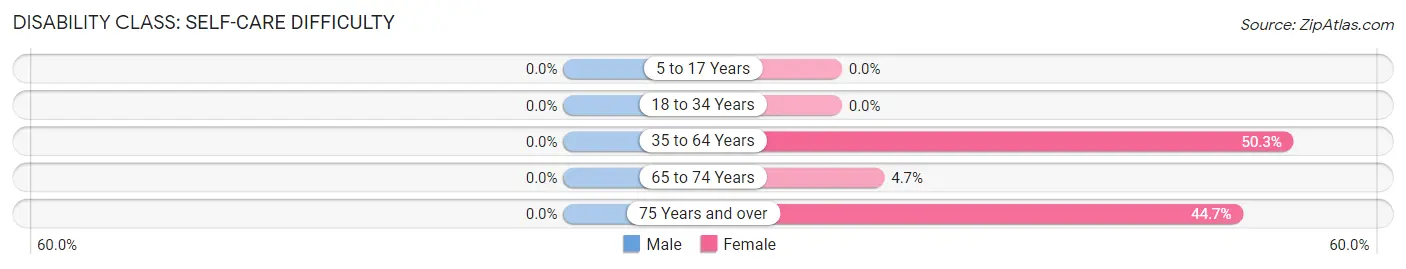
| Age Bracket | Male | Female |
| 5 to 17 Years | 0 (0.0%) | 0 (0.0%) |
| 18 to 34 Years | 0 (0.0%) | 0 (0.0%) |
| 35 to 64 Years | 0 (0.0%) | 158 (50.3%) |
| 65 to 74 Years | 0 (0.0%) | 8 (4.7%) |
| 75 Years and over | 0 (0.0%) | 72 (44.7%) |
Technology Access in Shorewood Tower Hills Harbert
Computing Device Access in Shorewood Tower Hills Harbert
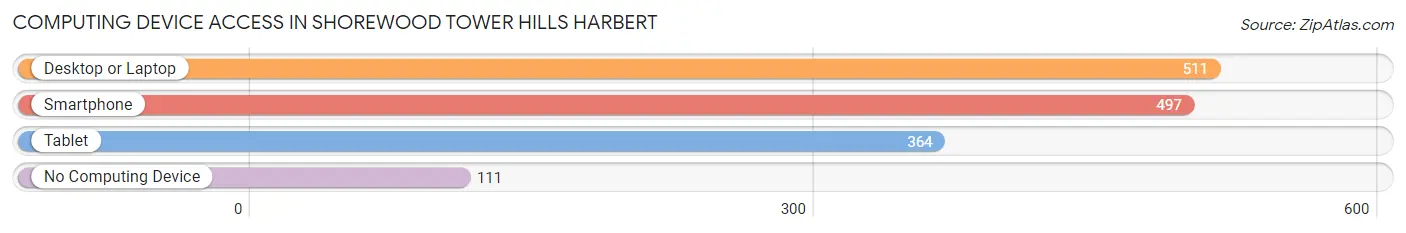
| Device Type | # Households | % Households |
| Desktop or Laptop | 511 | 74.9% |
| Smartphone | 497 | 72.9% |
| Tablet | 364 | 53.4% |
| No Computing Device | 111 | 16.3% |
| Total | 682 | 100.0% |
Internet Access in Shorewood Tower Hills Harbert
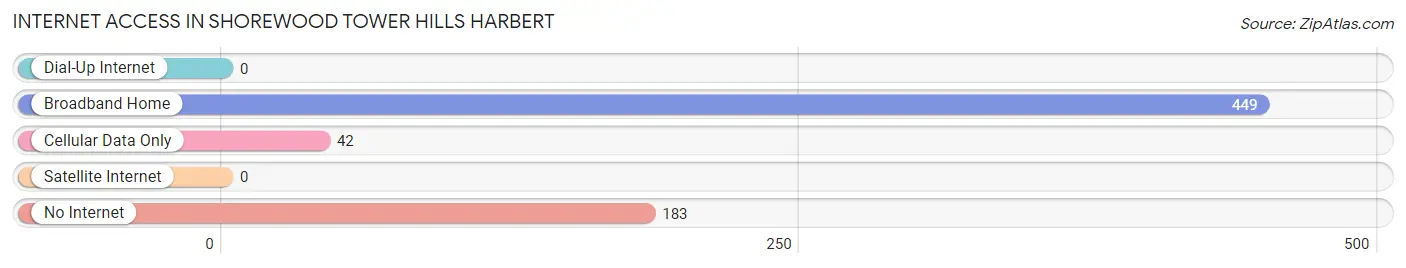
| Internet Type | # Households | % Households |
| Dial-Up Internet | 0 | 0.0% |
| Broadband Home | 449 | 65.8% |
| Cellular Data Only | 42 | 6.2% |
| Satellite Internet | 0 | 0.0% |
| No Internet | 183 | 26.8% |
| Total | 682 | 100.0% |
Shorewood Tower Hills Harbert Summary
Shorewood Tower Hills Harbert, MI is a small unincorporated community located in Berrien County, Michigan. It is situated on the eastern shore of Lake Michigan, just south of the city of St. Joseph. The community is part of the Chikaming Township and is bordered by the towns of Harbert, Sawyer, and Lakeside. The population of Shorewood Tower Hills Harbert, MI was estimated to be around 1,000 people in 2020.
History
Shorewood Tower Hills Harbert, MI was first settled in the late 1800s by a group of Swedish immigrants. The area was originally known as “Swedish Settlement” and was home to a number of small farms. The community was officially incorporated in 1891 and was named after the nearby Tower Hill, which was a popular lookout point for the area.
In the early 1900s, the area began to develop as a resort community. The Tower Hill Inn was built in 1906 and was a popular destination for visitors from Chicago and other nearby cities. The inn was later converted into a hotel and was a popular destination for vacationers until it closed in the 1950s.
Geography
Shorewood Tower Hills Harbert, MI is located in the southwestern corner of Berrien County, Michigan. It is situated on the eastern shore of Lake Michigan, just south of the city of St. Joseph. The community is part of the Chikaming Township and is bordered by the towns of Harbert, Sawyer, and Lakeside. The area is mostly flat and is surrounded by wooded areas and rolling hills.
Economy
The economy of Shorewood Tower Hills Harbert, MI is largely based on tourism and agriculture. The area is home to a number of small farms and orchards, which produce a variety of fruits and vegetables. The area is also home to a number of small businesses, including restaurants, shops, and galleries.
Demographics
As of the 2020 census, the population of Shorewood Tower Hills Harbert, MI was estimated to be around 1,000 people. The racial makeup of the community was 94.2% White, 1.2% African American, 0.7% Native American, 0.7% Asian, 0.2% Pacific Islander, and 2.9% from other races. The median household income was estimated to be around $50,000. The median age of the population was estimated to be around 40 years old.
Common Questions
What is Per Capita Income in Shorewood Tower Hills Harbert?
Per Capita income in Shorewood Tower Hills Harbert is $59,811.
What is the Median Family Income in Shorewood Tower Hills Harbert?
Median Family Income in Shorewood Tower Hills Harbert is $79,826.
What is the Median Household income in Shorewood Tower Hills Harbert?
Median Household Income in Shorewood Tower Hills Harbert is $77,674.
What is Income or Wage Gap in Shorewood Tower Hills Harbert?
Income or Wage Gap in Shorewood Tower Hills Harbert is 19.8%.
Women in Shorewood Tower Hills Harbert earn 80.2 cents for every dollar earned by a man.
What is Inequality or Gini Index in Shorewood Tower Hills Harbert?
Inequality or Gini Index in Shorewood Tower Hills Harbert is 0.51.
What is the Total Population of Shorewood Tower Hills Harbert?
Total Population of Shorewood Tower Hills Harbert is 1,501.
What is the Total Male Population of Shorewood Tower Hills Harbert?
Total Male Population of Shorewood Tower Hills Harbert is 620.
What is the Total Female Population of Shorewood Tower Hills Harbert?
Total Female Population of Shorewood Tower Hills Harbert is 881.
What is the Ratio of Males per 100 Females in Shorewood Tower Hills Harbert?
There are 70.37 Males per 100 Females in Shorewood Tower Hills Harbert.
What is the Ratio of Females per 100 Males in Shorewood Tower Hills Harbert?
There are 142.10 Females per 100 Males in Shorewood Tower Hills Harbert.
What is the Median Population Age in Shorewood Tower Hills Harbert?
Median Population Age in Shorewood Tower Hills Harbert is 54.8 Years.
What is the Average Family Size in Shorewood Tower Hills Harbert
Average Family Size in Shorewood Tower Hills Harbert is 2.5 People.
What is the Average Household Size in Shorewood Tower Hills Harbert
Average Household Size in Shorewood Tower Hills Harbert is 2.2 People.
How Large is the Labor Force in Shorewood Tower Hills Harbert?
There are 689 People in the Labor Forcein in Shorewood Tower Hills Harbert.
What is the Percentage of People in the Labor Force in Shorewood Tower Hills Harbert?
50.3% of People are in the Labor Force in Shorewood Tower Hills Harbert.
What is the Unemployment Rate in Shorewood Tower Hills Harbert?
Unemployment Rate in Shorewood Tower Hills Harbert is 1.5%.