Michiana, MI Map & Demographics
Michiana Map
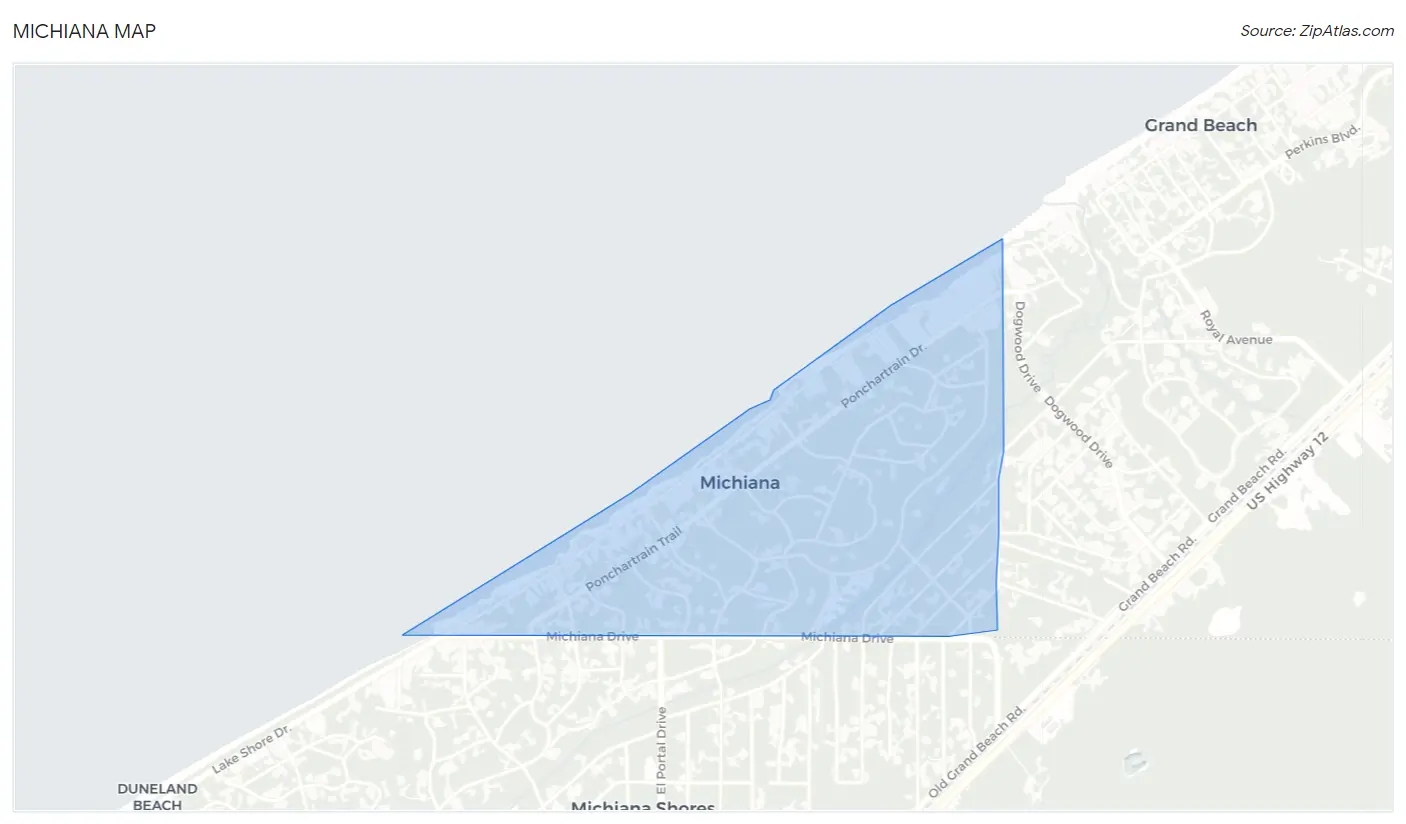
Michiana Overview
$98,188
PER CAPITA INCOME
$182,500
AVG FAMILY INCOME
$157,917
AVG HOUSEHOLD INCOME
63.6%
WAGE / INCOME GAP [ % ]
36.4¢/ $1
WAGE / INCOME GAP [ $ ]
0.40
INEQUALITY / GINI INDEX
285
TOTAL POPULATION
132
MALE POPULATION
153
FEMALE POPULATION
86.27
MALES / 100 FEMALES
115.91
FEMALES / 100 MALES
66.7
MEDIAN AGE
2.1
AVG FAMILY SIZE
1.8
AVG HOUSEHOLD SIZE
156
LABOR FORCE [ PEOPLE ]
55.5%
PERCENT IN LABOR FORCE
3.2%
UNEMPLOYMENT RATE
Michiana Area Codes
Income in Michiana
Income Overview in Michiana
Per Capita Income in Michiana is $98,188, while median incomes of families and households are $182,500 and $157,917 respectively.
| Characteristic | Number | Measure |
| Per Capita Income | 285 | $98,188 |
| Median Family Income | 104 | $182,500 |
| Mean Family Income | 104 | $206,821 |
| Median Household Income | 159 | $157,917 |
| Mean Household Income | 159 | $176,132 |
| Income Deficit | 104 | $0 |
| Wage / Income Gap (%) | 285 | 63.57% |
| Wage / Income Gap ($) | 285 | 36.43¢ per $1 |
| Gini / Inequality Index | 285 | 0.40 |
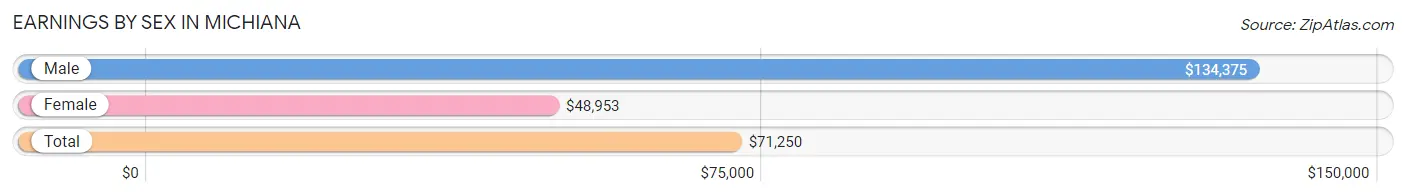
Earnings by Sex in Michiana
Average Earnings in Michiana are $71,250, $134,375 for men and $48,953 for women, a difference of 63.6%.
| Sex | Number | Average Earnings |
| Male | 85 (51.8%) | $134,375 |
| Female | 79 (48.2%) | $48,953 |
| Total | 164 (100.0%) | $71,250 |
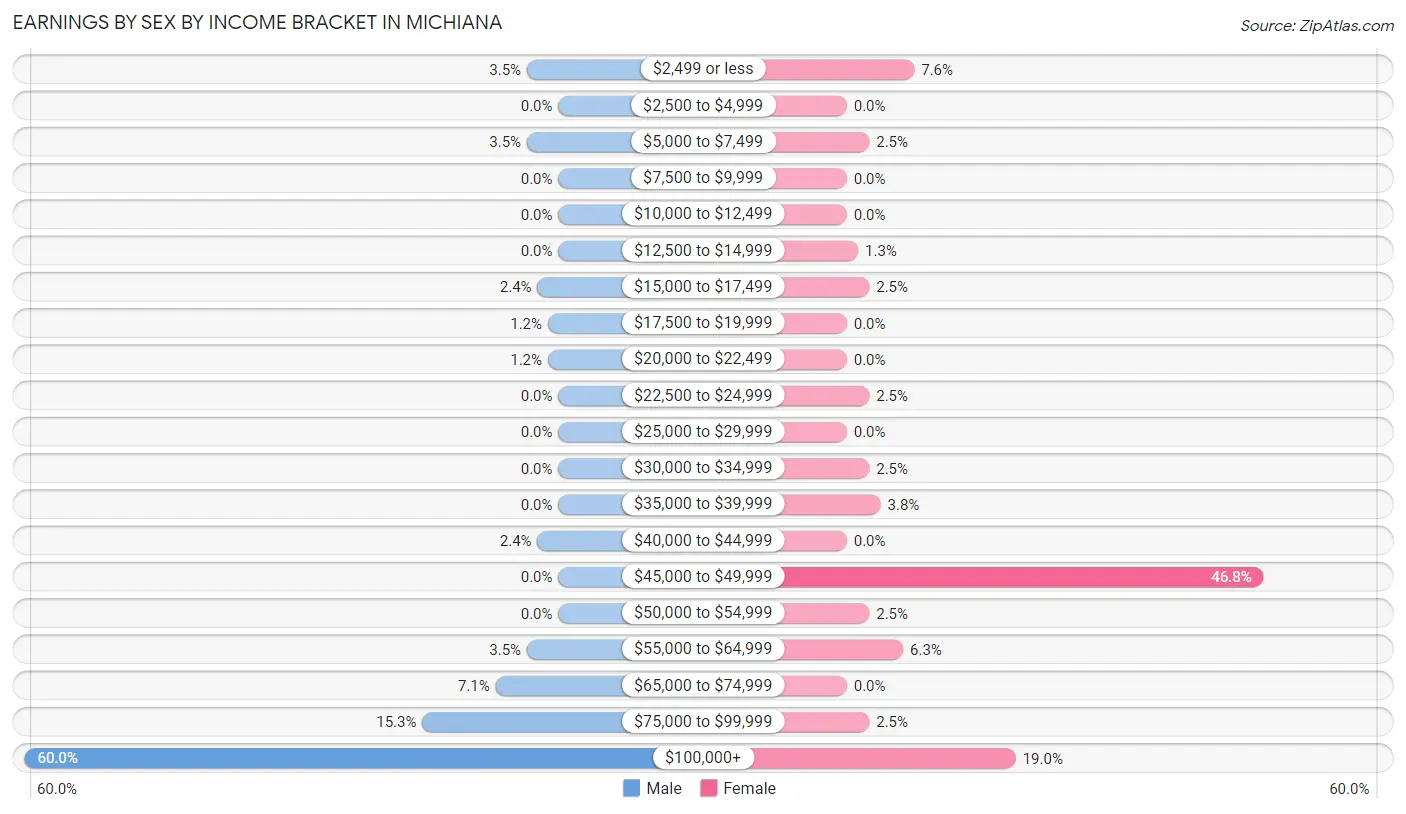
Earnings by Sex by Income Bracket in Michiana
The most common earnings brackets in Michiana are $100,000+ for men (51 | 60.0%) and $45,000 to $49,999 for women (37 | 46.8%).
| Income | Male | Female |
| $2,499 or less | 3 (3.5%) | 6 (7.6%) |
| $2,500 to $4,999 | 0 (0.0%) | 0 (0.0%) |
| $5,000 to $7,499 | 3 (3.5%) | 2 (2.5%) |
| $7,500 to $9,999 | 0 (0.0%) | 0 (0.0%) |
| $10,000 to $12,499 | 0 (0.0%) | 0 (0.0%) |
| $12,500 to $14,999 | 0 (0.0%) | 1 (1.3%) |
| $15,000 to $17,499 | 2 (2.4%) | 2 (2.5%) |
| $17,500 to $19,999 | 1 (1.2%) | 0 (0.0%) |
| $20,000 to $22,499 | 1 (1.2%) | 0 (0.0%) |
| $22,500 to $24,999 | 0 (0.0%) | 2 (2.5%) |
| $25,000 to $29,999 | 0 (0.0%) | 0 (0.0%) |
| $30,000 to $34,999 | 0 (0.0%) | 2 (2.5%) |
| $35,000 to $39,999 | 0 (0.0%) | 3 (3.8%) |
| $40,000 to $44,999 | 2 (2.4%) | 0 (0.0%) |
| $45,000 to $49,999 | 0 (0.0%) | 37 (46.8%) |
| $50,000 to $54,999 | 0 (0.0%) | 2 (2.5%) |
| $55,000 to $64,999 | 3 (3.5%) | 5 (6.3%) |
| $65,000 to $74,999 | 6 (7.1%) | 0 (0.0%) |
| $75,000 to $99,999 | 13 (15.3%) | 2 (2.5%) |
| $100,000+ | 51 (60.0%) | 15 (19.0%) |
| Total | 85 (100.0%) | 79 (100.0%) |
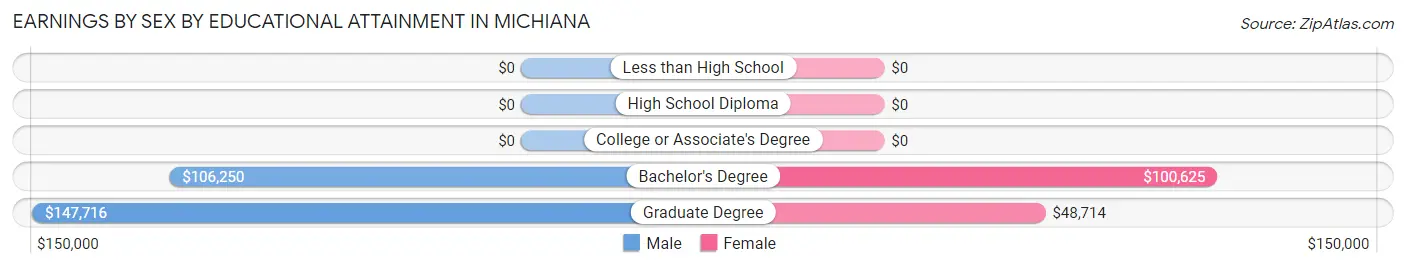
Earnings by Sex by Educational Attainment in Michiana
Average earnings in Michiana are $134,375 for men and $49,020 for women, a difference of 63.5%. Men with an educational attainment of graduate degree enjoy the highest average annual earnings of $147,716, while those with bachelor's degree education earn the least with $106,250. Women with an educational attainment of bachelor's degree earn the most with the average annual earnings of $100,625, while those with graduate degree education have the smallest earnings of $48,714.
| Educational Attainment | Male Income | Female Income |
| Less than High School | - | - |
| High School Diploma | - | - |
| College or Associate's Degree | - | - |
| Bachelor's Degree | $106,250 | $100,625 |
| Graduate Degree | $147,716 | $48,714 |
| Total | $134,375 | $49,020 |
Family Income in Michiana
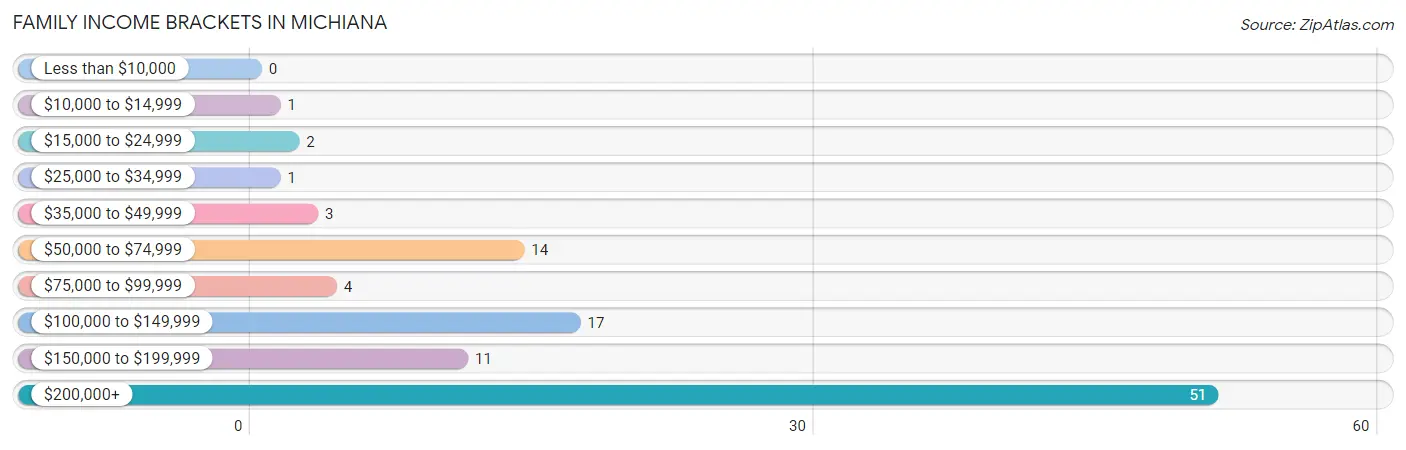
Family Income Brackets in Michiana
According to the Michiana family income data, there are 51 families falling into the $200,000+ income range, which is the most common income bracket and makes up 49.0% of all families.
| Income Bracket | # Families | % Families |
| Less than $10,000 | 0 | 0.0% |
| $10,000 to $14,999 | 1 | 1.0% |
| $15,000 to $24,999 | 2 | 1.9% |
| $25,000 to $34,999 | 1 | 1.0% |
| $35,000 to $49,999 | 3 | 2.9% |
| $50,000 to $74,999 | 14 | 13.5% |
| $75,000 to $99,999 | 4 | 3.8% |
| $100,000 to $149,999 | 17 | 16.3% |
| $150,000 to $199,999 | 11 | 10.6% |
| $200,000+ | 51 | 49.0% |
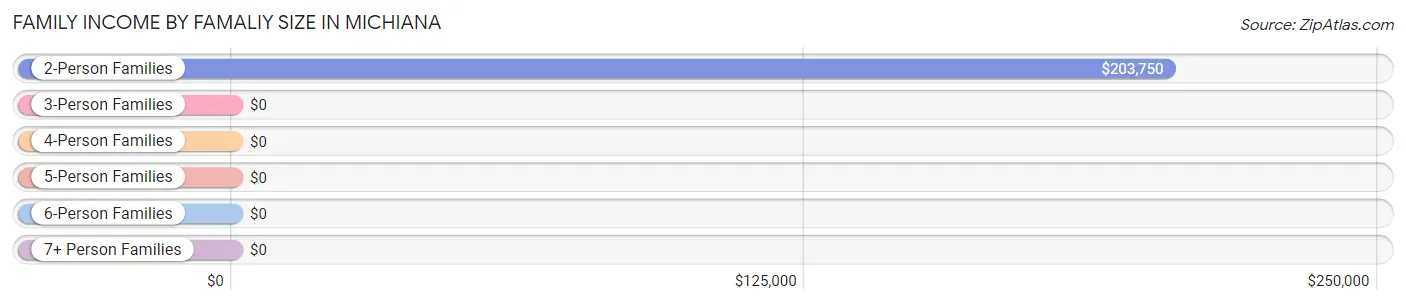
Family Income by Famaliy Size in Michiana
2-person families (98 | 94.2%) account for the highest median family income in Michiana with $203,750 per family, while 2-person families (98 | 94.2%) have the highest median income of $101,875 per family member.
| Income Bracket | # Families | Median Income |
| 2-Person Families | 98 (94.2%) | $203,750 |
| 3-Person Families | 4 (3.8%) | $0 |
| 4-Person Families | 2 (1.9%) | $0 |
| 5-Person Families | 0 (0.0%) | $0 |
| 6-Person Families | 0 (0.0%) | $0 |
| 7+ Person Families | 0 (0.0%) | $0 |
| Total | 104 (100.0%) | $182,500 |
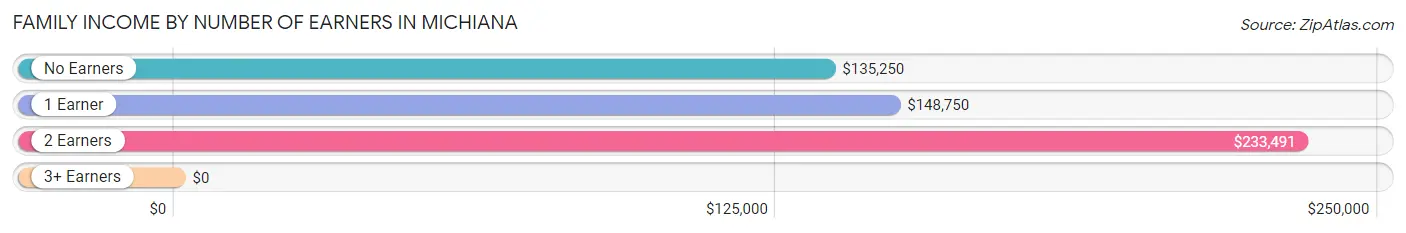
Family Income by Number of Earners in Michiana
| Number of Earners | # Families | Median Income |
| No Earners | 23 (22.1%) | $135,250 |
| 1 Earner | 38 (36.5%) | $148,750 |
| 2 Earners | 43 (41.3%) | $233,491 |
| 3+ Earners | 0 (0.0%) | $0 |
| Total | 104 (100.0%) | $182,500 |
Household Income in Michiana
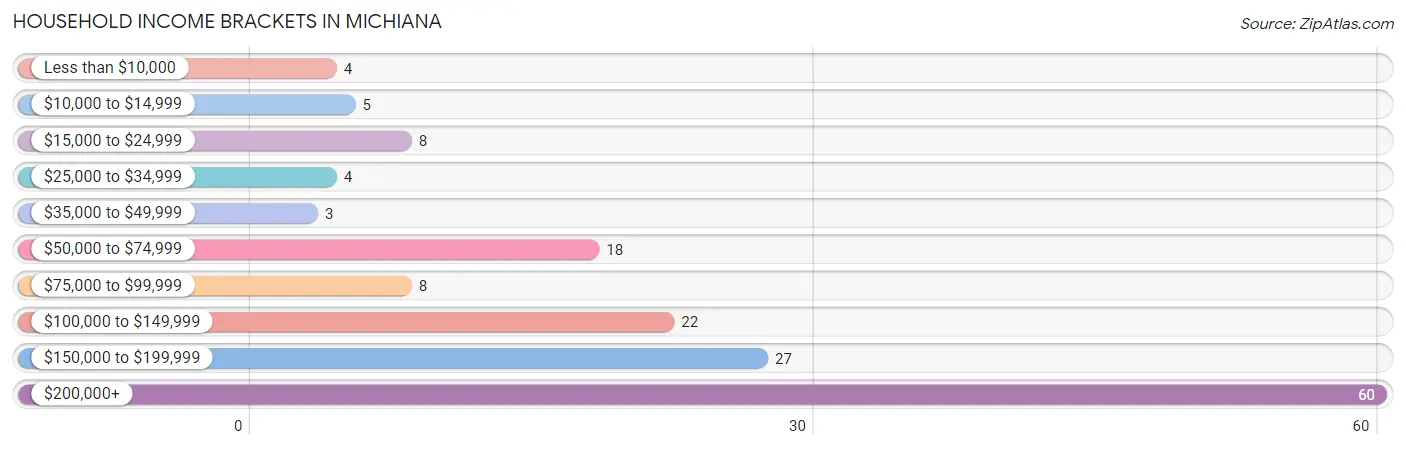
Household Income Brackets in Michiana
With 60 households falling in the category, the $200,000+ income range is the most frequent in Michiana, accounting for 37.7% of all households. In contrast, only 3 households (1.9%) fall into the $35,000 to $49,999 income bracket, making it the least populous group.
| Income Bracket | # Households | % Households |
| Less than $10,000 | 4 | 2.5% |
| $10,000 to $14,999 | 5 | 3.1% |
| $15,000 to $24,999 | 8 | 5.0% |
| $25,000 to $34,999 | 4 | 2.5% |
| $35,000 to $49,999 | 3 | 1.9% |
| $50,000 to $74,999 | 18 | 11.3% |
| $75,000 to $99,999 | 8 | 5.0% |
| $100,000 to $149,999 | 22 | 13.8% |
| $150,000 to $199,999 | 27 | 17.0% |
| $200,000+ | 60 | 37.7% |
Household Income by Householder Age in Michiana
The median household income in Michiana is $157,917, with the highest median household income of $173,750 found in the 25 to 44 years age bracket for the primary householder. A total of 9 households (5.7%) fall into this category.
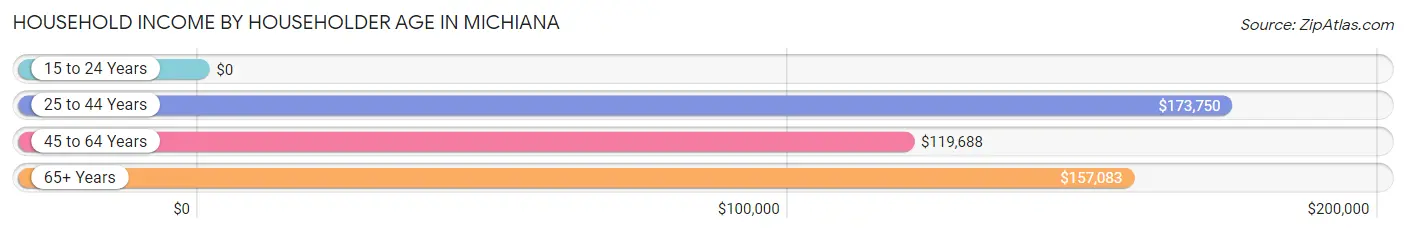
| Income Bracket | # Households | Median Income |
| 15 to 24 Years | 0 (0.0%) | $0 |
| 25 to 44 Years | 9 (5.7%) | $173,750 |
| 45 to 64 Years | 45 (28.3%) | $119,688 |
| 65+ Years | 105 (66.0%) | $157,083 |
| Total | 159 (100.0%) | $157,917 |
Poverty in Michiana
Income Below Poverty by Sex and Age in Michiana
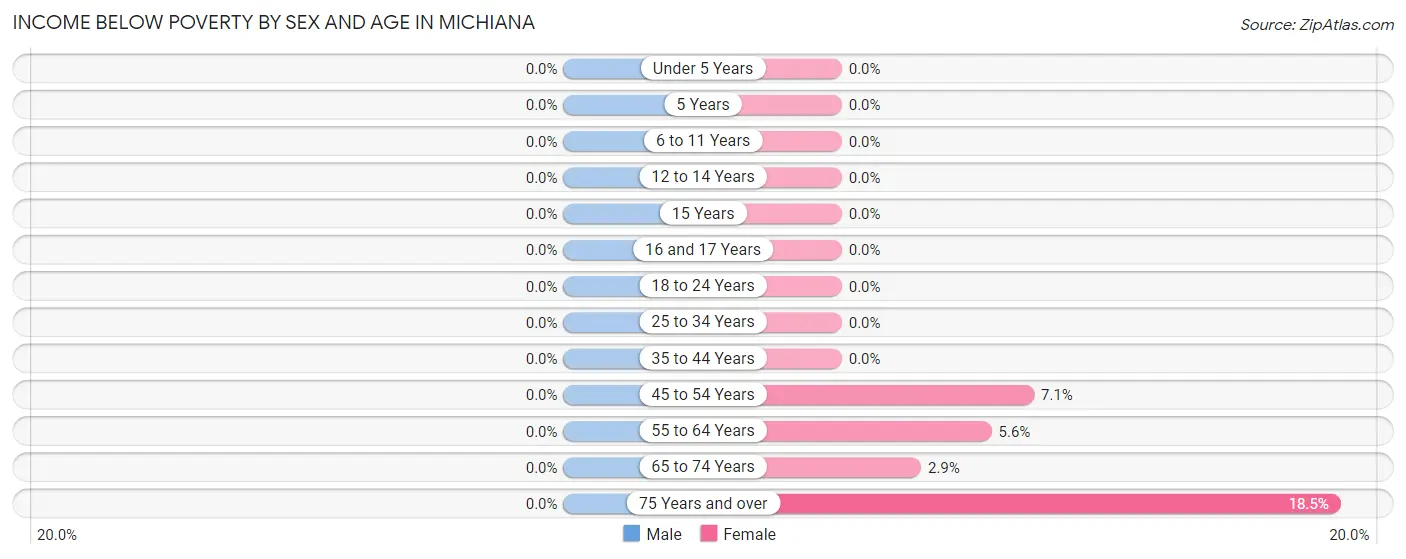
| Age Bracket | Male | Female |
| Under 5 Years | 0 (0.0%) | 0 (0.0%) |
| 5 Years | 0 (0.0%) | 0 (0.0%) |
| 6 to 11 Years | 0 (0.0%) | 0 (0.0%) |
| 12 to 14 Years | 0 (0.0%) | 0 (0.0%) |
| 15 Years | 0 (0.0%) | 0 (0.0%) |
| 16 and 17 Years | 0 (0.0%) | 0 (0.0%) |
| 18 to 24 Years | 0 (0.0%) | 0 (0.0%) |
| 25 to 34 Years | 0 (0.0%) | 0 (0.0%) |
| 35 to 44 Years | 0 (0.0%) | 0 (0.0%) |
| 45 to 54 Years | 0 (0.0%) | 1 (7.1%) |
| 55 to 64 Years | 0 (0.0%) | 2 (5.6%) |
| 65 to 74 Years | 0 (0.0%) | 2 (2.9%) |
| 75 Years and over | 0 (0.0%) | 5 (18.5%) |
| Total | 0 (0.0%) | 10 (6.5%) |
Income Above Poverty by Sex and Age in Michiana
According to the poverty statistics in Michiana, males aged under 5 years and females aged under 5 years are the age groups that are most secure financially, with 100.0% of males and 100.0% of females in these age groups living above the poverty line.
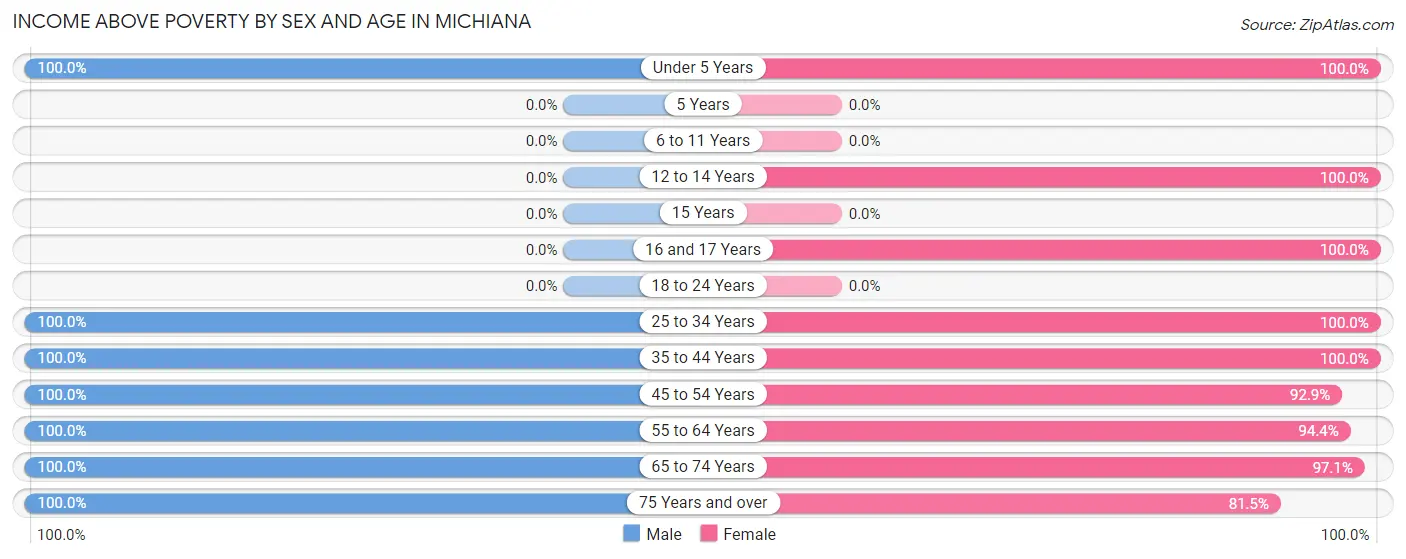
| Age Bracket | Male | Female |
| Under 5 Years | 1 (100.0%) | 2 (100.0%) |
| 5 Years | 0 (0.0%) | 0 (0.0%) |
| 6 to 11 Years | 0 (0.0%) | 0 (0.0%) |
| 12 to 14 Years | 0 (0.0%) | 1 (100.0%) |
| 15 Years | 0 (0.0%) | 0 (0.0%) |
| 16 and 17 Years | 0 (0.0%) | 2 (100.0%) |
| 18 to 24 Years | 0 (0.0%) | 0 (0.0%) |
| 25 to 34 Years | 6 (100.0%) | 2 (100.0%) |
| 35 to 44 Years | 8 (100.0%) | 1 (100.0%) |
| 45 to 54 Years | 3 (100.0%) | 13 (92.9%) |
| 55 to 64 Years | 22 (100.0%) | 34 (94.4%) |
| 65 to 74 Years | 73 (100.0%) | 66 (97.1%) |
| 75 Years and over | 19 (100.0%) | 22 (81.5%) |
| Total | 132 (100.0%) | 143 (93.5%) |
Income Below Poverty Among Married-Couple Families in Michiana
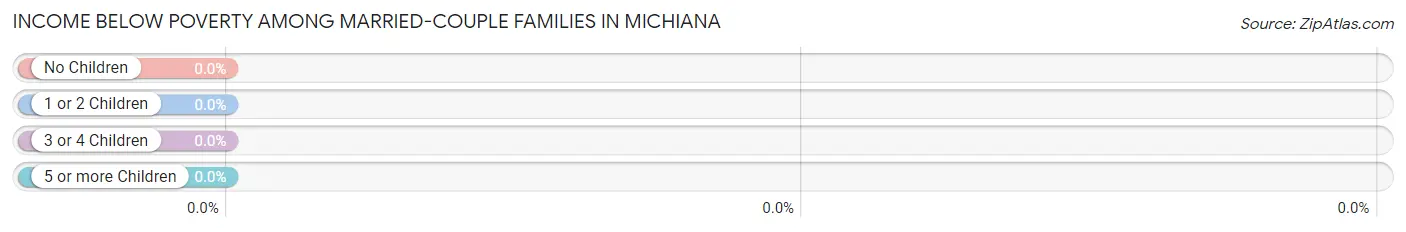
| Children | Above Poverty | Below Poverty |
| No Children | 95 (100.0%) | 0 (0.0%) |
| 1 or 2 Children | 3 (100.0%) | 0 (0.0%) |
| 3 or 4 Children | 0 (0.0%) | 0 (0.0%) |
| 5 or more Children | 0 (0.0%) | 0 (0.0%) |
| Total | 98 (100.0%) | 0 (0.0%) |
Income Below Poverty Among Single-Parent Households in Michiana
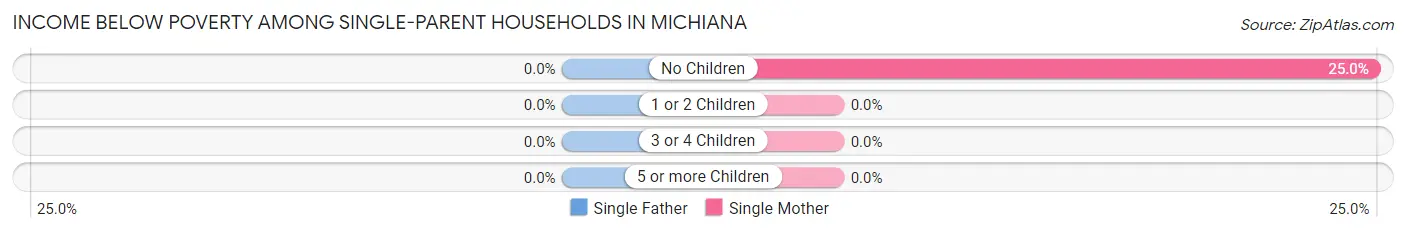
| Children | Single Father | Single Mother |
| No Children | 0 (0.0%) | 1 (25.0%) |
| 1 or 2 Children | 0 (0.0%) | 0 (0.0%) |
| 3 or 4 Children | 0 (0.0%) | 0 (0.0%) |
| 5 or more Children | 0 (0.0%) | 0 (0.0%) |
| Total | 0 (0.0%) | 1 (20.0%) |
Income Below Poverty Among Married-Couple vs Single-Parent Households in Michiana
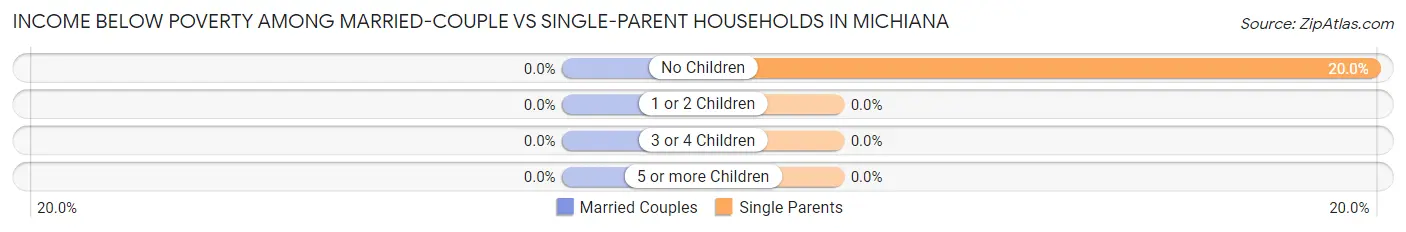
| Children | Married-Couple Families | Single-Parent Households |
| No Children | 0 (0.0%) | 1 (20.0%) |
| 1 or 2 Children | 0 (0.0%) | 0 (0.0%) |
| 3 or 4 Children | 0 (0.0%) | 0 (0.0%) |
| 5 or more Children | 0 (0.0%) | 0 (0.0%) |
| Total | 0 (0.0%) | 1 (16.7%) |
Race in Michiana
The most populous races in Michiana are White / Caucasian (264 | 92.6%), Asian (12 | 4.2%), and Hispanic or Latino (8 | 2.8%).
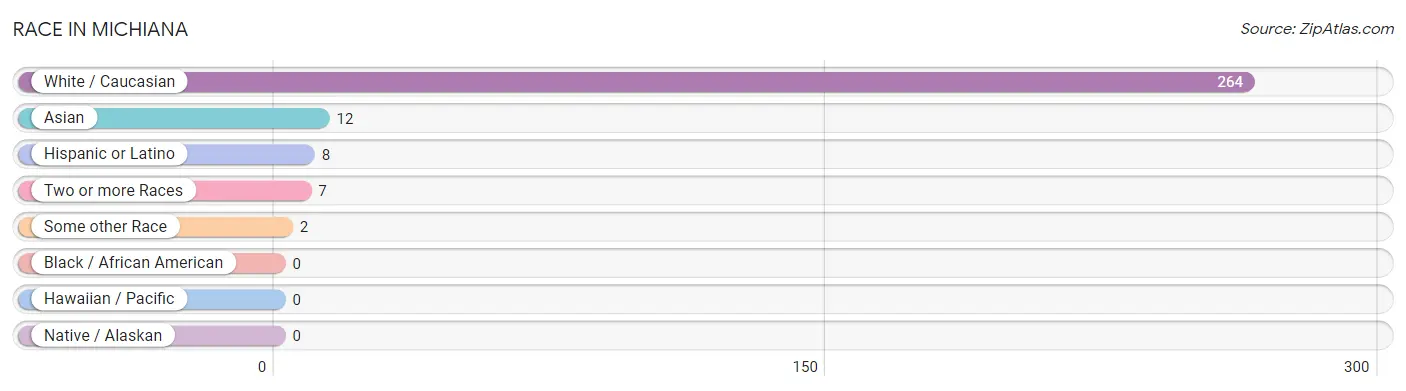
| Race | # Population | % Population |
| Asian | 12 | 4.2% |
| Black / African American | 0 | 0.0% |
| Hawaiian / Pacific | 0 | 0.0% |
| Hispanic or Latino | 8 | 2.8% |
| Native / Alaskan | 0 | 0.0% |
| White / Caucasian | 264 | 92.6% |
| Two or more Races | 7 | 2.5% |
| Some other Race | 2 | 0.7% |
| Total | 285 | 100.0% |
Ancestry in Michiana
The most populous ancestries reported in Michiana are Irish (80 | 28.1%), German (43 | 15.1%), Scottish (31 | 10.9%), Russian (25 | 8.8%), and Polish (18 | 6.3%), together accounting for 69.1% of all Michiana residents.
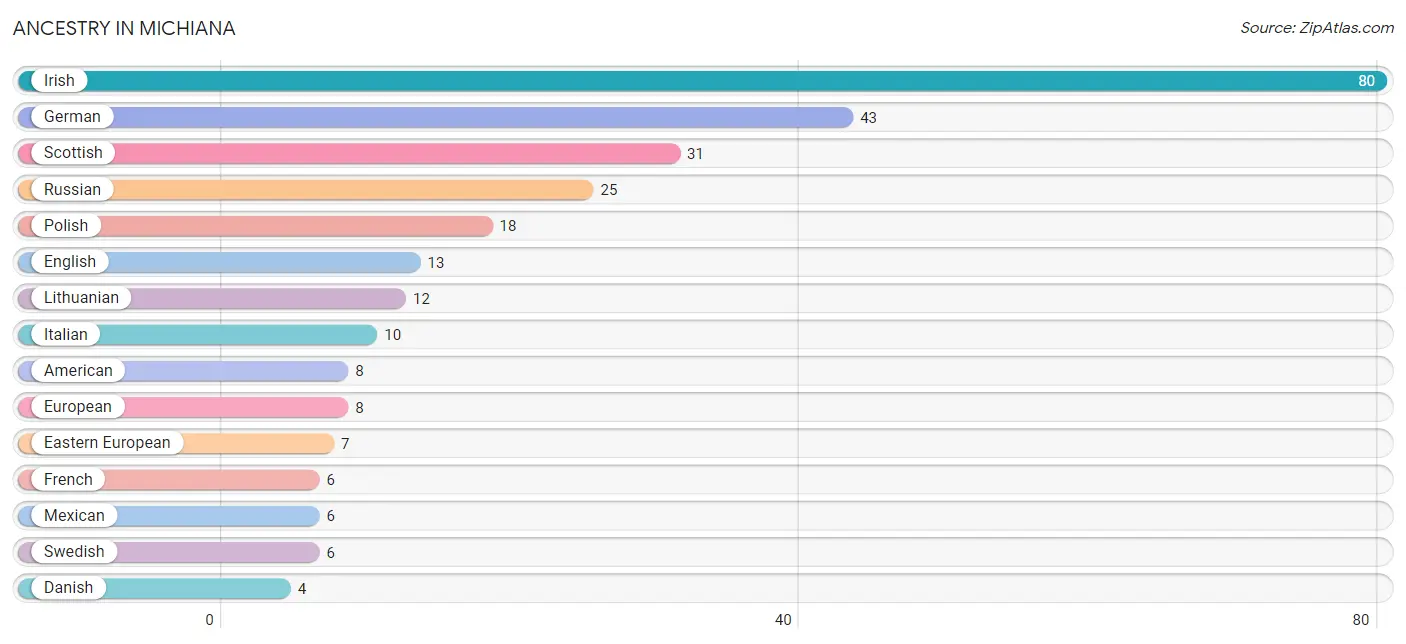
| Ancestry | # Population | % Population |
| American | 8 | 2.8% |
| Arab | 2 | 0.7% |
| Austrian | 3 | 1.1% |
| Belgian | 1 | 0.4% |
| Bhutanese | 2 | 0.7% |
| British | 3 | 1.1% |
| Canadian | 1 | 0.4% |
| Cherokee | 2 | 0.7% |
| Czechoslovakian | 2 | 0.7% |
| Danish | 4 | 1.4% |
| Dutch | 1 | 0.4% |
| Eastern European | 7 | 2.5% |
| English | 13 | 4.6% |
| European | 8 | 2.8% |
| Finnish | 1 | 0.4% |
| French | 6 | 2.1% |
| German | 43 | 15.1% |
| Greek | 2 | 0.7% |
| Hungarian | 1 | 0.4% |
| Indian (Asian) | 2 | 0.7% |
| Irish | 80 | 28.1% |
| Italian | 10 | 3.5% |
| Korean | 2 | 0.7% |
| Latvian | 4 | 1.4% |
| Lithuanian | 12 | 4.2% |
| Maltese | 2 | 0.7% |
| Mexican | 6 | 2.1% |
| Northern European | 2 | 0.7% |
| Norwegian | 2 | 0.7% |
| Pennsylvania German | 2 | 0.7% |
| Polish | 18 | 6.3% |
| Russian | 25 | 8.8% |
| Scandinavian | 2 | 0.7% |
| Scottish | 31 | 10.9% |
| Slovak | 1 | 0.4% |
| Slovene | 2 | 0.7% |
| Spanish | 2 | 0.7% |
| Swedish | 6 | 2.1% |
| Ukrainian | 1 | 0.4% | View All 39 Rows |
Immigrants in Michiana
The most numerous immigrant groups reported in Michiana came from Europe (9 | 3.2%), Asia (7 | 2.5%), Eastern Europe (6 | 2.1%), India (6 | 2.1%), and South Central Asia (6 | 2.1%), together accounting for 12.0% of all Michiana residents.
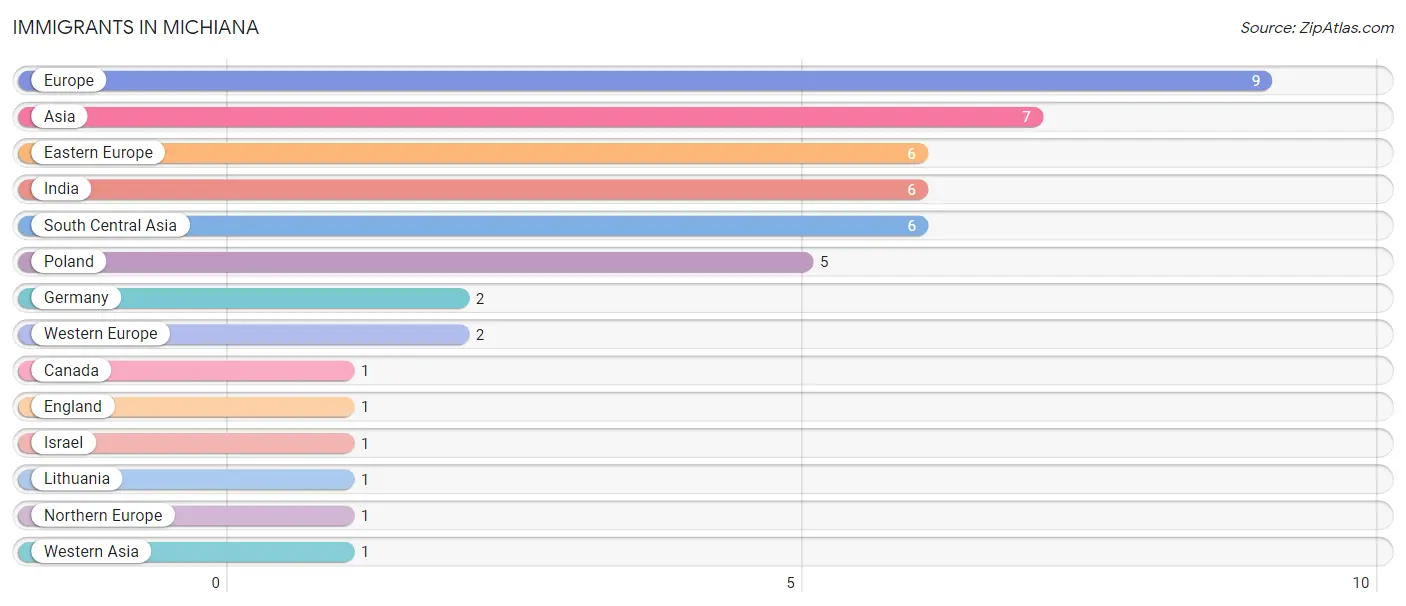
| Immigration Origin | # Population | % Population |
| Asia | 7 | 2.5% |
| Canada | 1 | 0.4% |
| Eastern Europe | 6 | 2.1% |
| England | 1 | 0.4% |
| Europe | 9 | 3.2% |
| Germany | 2 | 0.7% |
| India | 6 | 2.1% |
| Israel | 1 | 0.4% |
| Lithuania | 1 | 0.4% |
| Northern Europe | 1 | 0.4% |
| Poland | 5 | 1.8% |
| South Central Asia | 6 | 2.1% |
| Western Asia | 1 | 0.4% |
| Western Europe | 2 | 0.7% | View All 14 Rows |
Sex and Age in Michiana
Sex and Age in Michiana
The most populous age groups in Michiana are 70 to 74 Years (51 | 38.6%) for men and 65 to 69 Years (56 | 36.6%) for women.
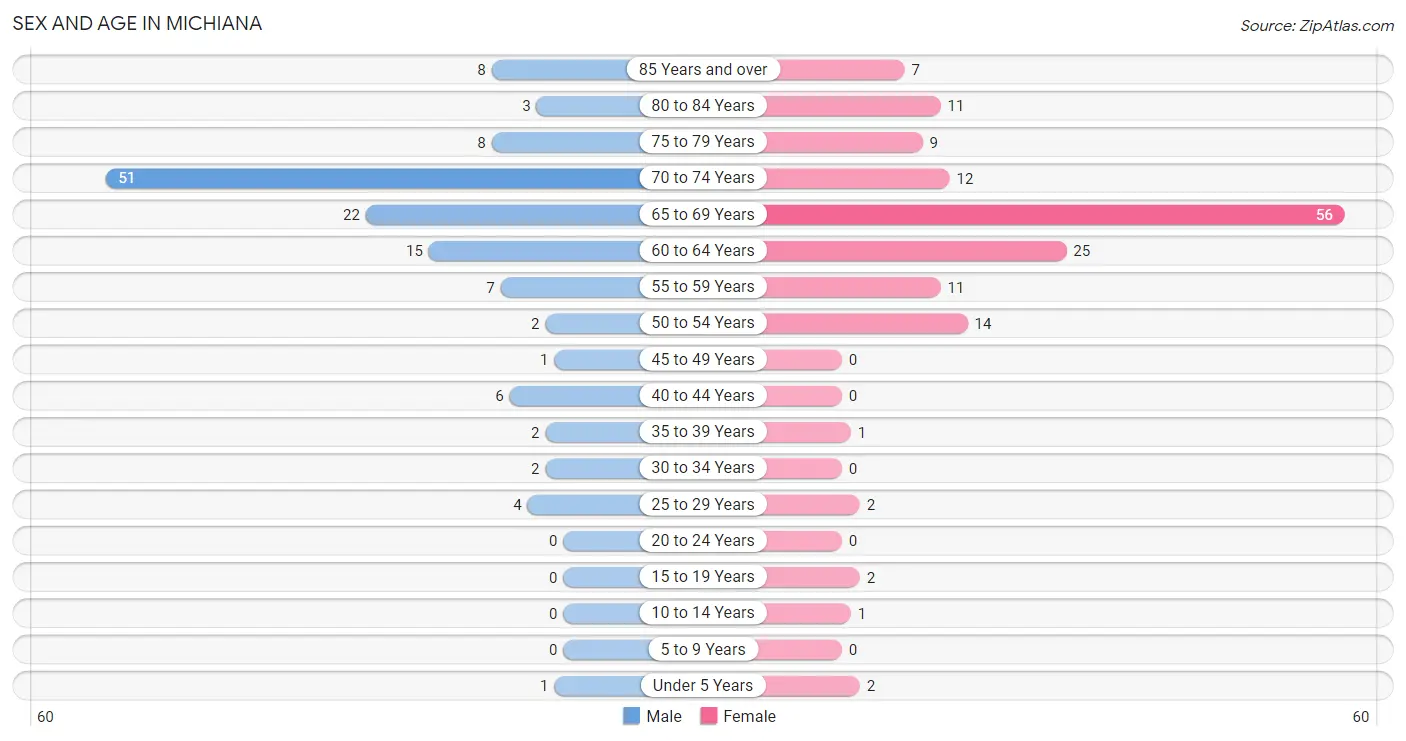
| Age Bracket | Male | Female |
| Under 5 Years | 1 (0.8%) | 2 (1.3%) |
| 5 to 9 Years | 0 (0.0%) | 0 (0.0%) |
| 10 to 14 Years | 0 (0.0%) | 1 (0.6%) |
| 15 to 19 Years | 0 (0.0%) | 2 (1.3%) |
| 20 to 24 Years | 0 (0.0%) | 0 (0.0%) |
| 25 to 29 Years | 4 (3.0%) | 2 (1.3%) |
| 30 to 34 Years | 2 (1.5%) | 0 (0.0%) |
| 35 to 39 Years | 2 (1.5%) | 1 (0.6%) |
| 40 to 44 Years | 6 (4.5%) | 0 (0.0%) |
| 45 to 49 Years | 1 (0.8%) | 0 (0.0%) |
| 50 to 54 Years | 2 (1.5%) | 14 (9.1%) |
| 55 to 59 Years | 7 (5.3%) | 11 (7.2%) |
| 60 to 64 Years | 15 (11.4%) | 25 (16.3%) |
| 65 to 69 Years | 22 (16.7%) | 56 (36.6%) |
| 70 to 74 Years | 51 (38.6%) | 12 (7.8%) |
| 75 to 79 Years | 8 (6.1%) | 9 (5.9%) |
| 80 to 84 Years | 3 (2.3%) | 11 (7.2%) |
| 85 Years and over | 8 (6.1%) | 7 (4.6%) |
| Total | 132 (100.0%) | 153 (100.0%) |
Families and Households in Michiana
Median Family Size in Michiana
The median family size in Michiana is 2.15 persons per family, with single male/father families (1 | 1.0%) accounting for the largest median family size of 4 persons per family. On the other hand, married-couple families (98 | 94.2%) represent the smallest median family size with 2.12 persons per family.
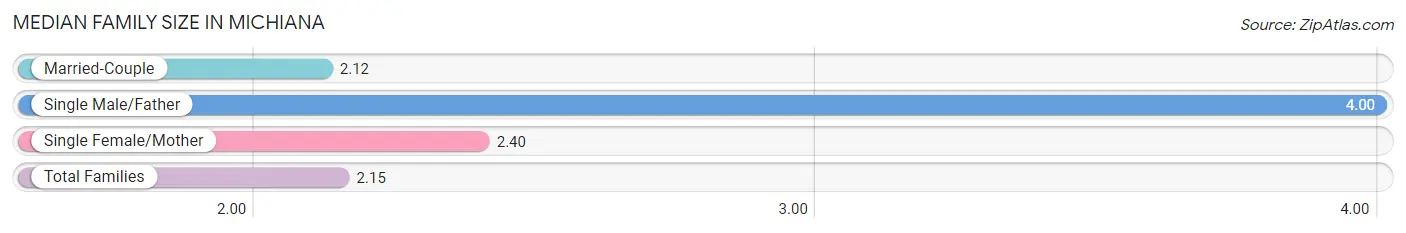
| Family Type | # Families | Family Size |
| Married-Couple | 98 (94.2%) | 2.12 |
| Single Male/Father | 1 (1.0%) | 4.00 |
| Single Female/Mother | 5 (4.8%) | 2.40 |
| Total Families | 104 (100.0%) | 2.15 |
Median Household Size in Michiana
The median household size in Michiana is 1.79 persons per household, with single male/father households (1 | 0.6%) accounting for the largest median household size of 4 persons per household. non-family households (55 | 34.6%) represent the smallest median household size with 1.11 persons per household.
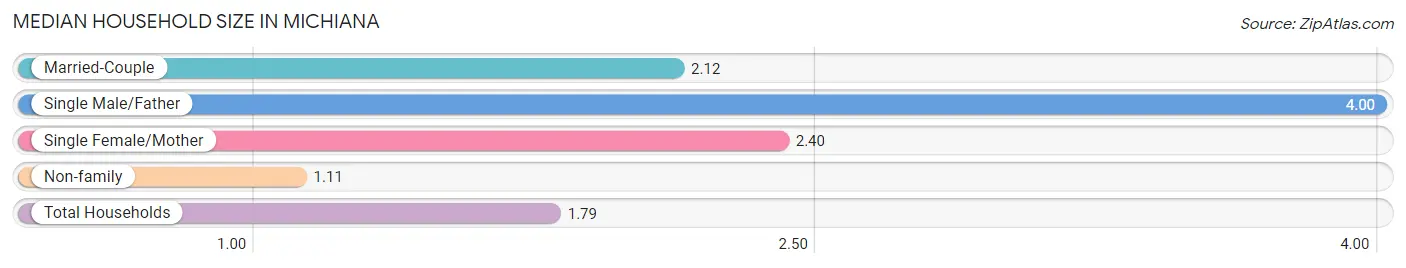
| Household Type | # Households | Household Size |
| Married-Couple | 98 (61.6%) | 2.12 |
| Single Male/Father | 1 (0.6%) | 4.00 |
| Single Female/Mother | 5 (3.1%) | 2.40 |
| Non-family | 55 (34.6%) | 1.11 |
| Total Households | 159 (100.0%) | 1.79 |
Household Size by Marriage Status in Michiana
Out of a total of 159 households in Michiana, 104 (65.4%) are family households, while 55 (34.6%) are nonfamily households. The most numerous type of family households are 2-person households, comprising 98, and the most common type of nonfamily households are 1-person households, comprising 46.
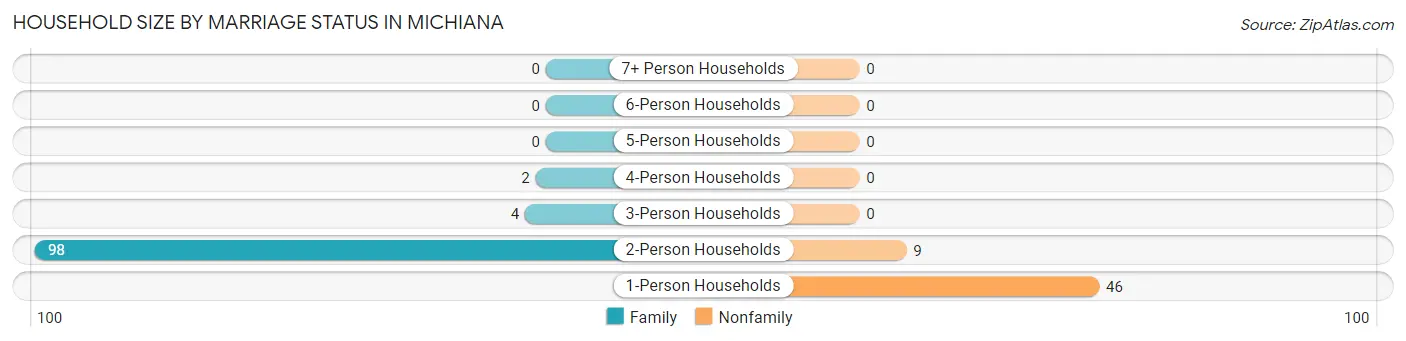
| Household Size | Family Households | Nonfamily Households |
| 1-Person Households | - | 46 (28.9%) |
| 2-Person Households | 98 (61.6%) | 9 (5.7%) |
| 3-Person Households | 4 (2.5%) | 0 (0.0%) |
| 4-Person Households | 2 (1.3%) | 0 (0.0%) |
| 5-Person Households | 0 (0.0%) | 0 (0.0%) |
| 6-Person Households | 0 (0.0%) | 0 (0.0%) |
| 7+ Person Households | 0 (0.0%) | 0 (0.0%) |
| Total | 104 (65.4%) | 55 (34.6%) |
Female Fertility in Michiana
Fertility by Age in Michiana
Average fertility rate in Michiana is 200.0 births per 1,000 women. Women in the age bracket of 35 to 50 years have the highest fertility rate with 1,000.0 births per 1,000 women. Women in the age bracket of 35 to 50 years acount for 100.0% of all women with births.
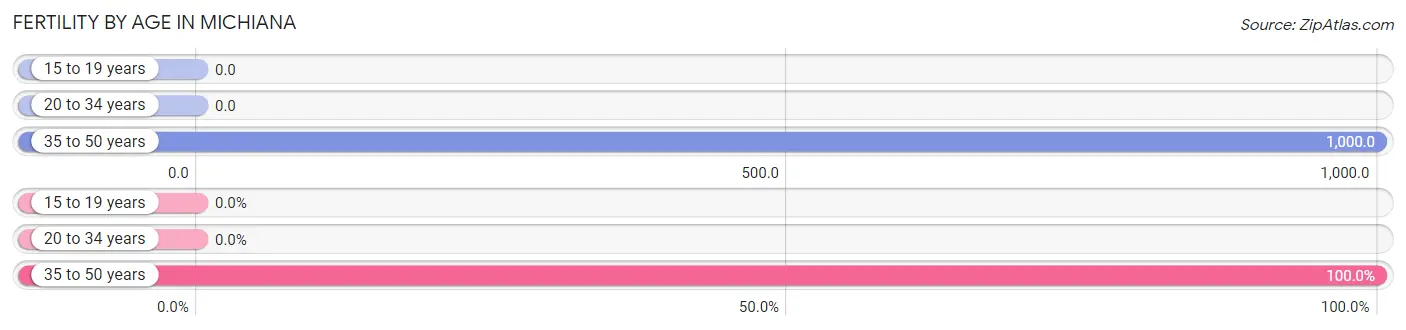
| Age Bracket | Women with Births | Births / 1,000 Women |
| 15 to 19 years | 0 (0.0%) | 0.0 |
| 20 to 34 years | 0 (0.0%) | 0.0 |
| 35 to 50 years | 1 (100.0%) | 1,000.0 |
| Total | 1 (100.0%) | 200.0 |
Fertility by Age by Marriage Status in Michiana
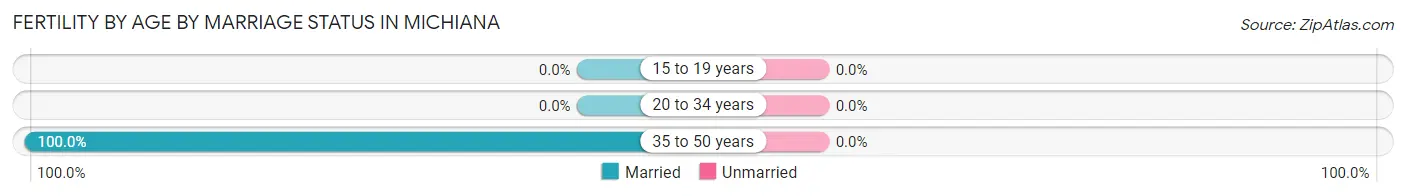
| Age Bracket | Married | Unmarried |
| 15 to 19 years | 0 (0.0%) | 0 (0.0%) |
| 20 to 34 years | 0 (0.0%) | 0 (0.0%) |
| 35 to 50 years | 1 (100.0%) | 0 (0.0%) |
| Total | 1 (100.0%) | 0 (0.0%) |
Fertility by Education in Michiana
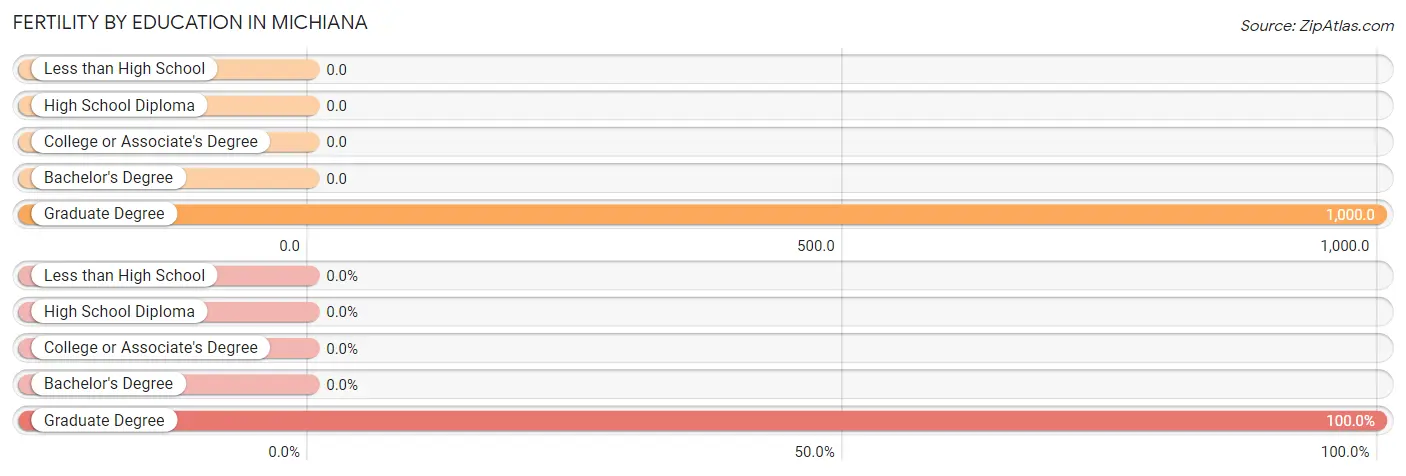
| Educational Attainment | Women with Births | Births / 1,000 Women |
| Less than High School | 0 (0.0%) | 0.0 |
| High School Diploma | 0 (0.0%) | 0.0 |
| College or Associate's Degree | 0 (0.0%) | 0.0 |
| Bachelor's Degree | 0 (0.0%) | 0.0 |
| Graduate Degree | 1 (100.0%) | 1,000.0 |
| Total | 1 (100.0%) | 200.0 |
Fertility by Education by Marriage Status in Michiana
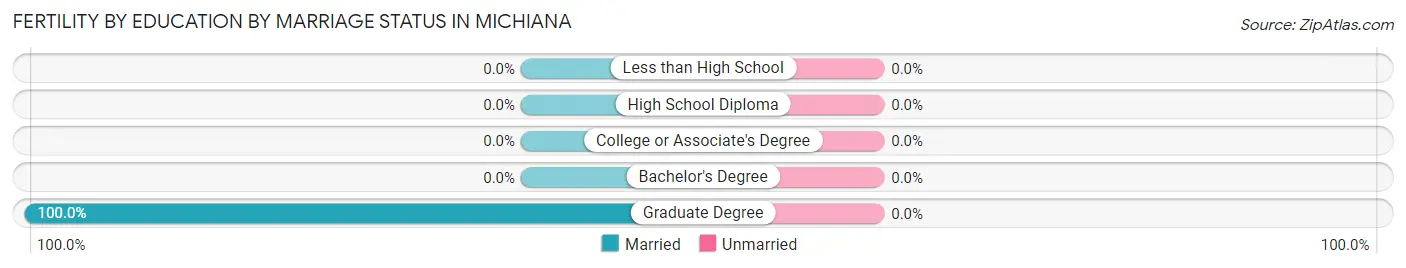
| Educational Attainment | Married | Unmarried |
| Less than High School | 0 (0.0%) | 0 (0.0%) |
| High School Diploma | 0 (0.0%) | 0 (0.0%) |
| College or Associate's Degree | 0 (0.0%) | 0 (0.0%) |
| Bachelor's Degree | 0 (0.0%) | 0 (0.0%) |
| Graduate Degree | 1 (100.0%) | 0 (0.0%) |
| Total | 1 (100.0%) | 0 (0.0%) |
Employment Characteristics in Michiana
Employment by Class of Employer in Michiana
Among the 151 employed individuals in Michiana, not-for-profit organizations (45 | 29.8%), private company employees (42 | 27.8%), and self-employed (incorporated) (36 | 23.8%) make up the most common classes of employment.
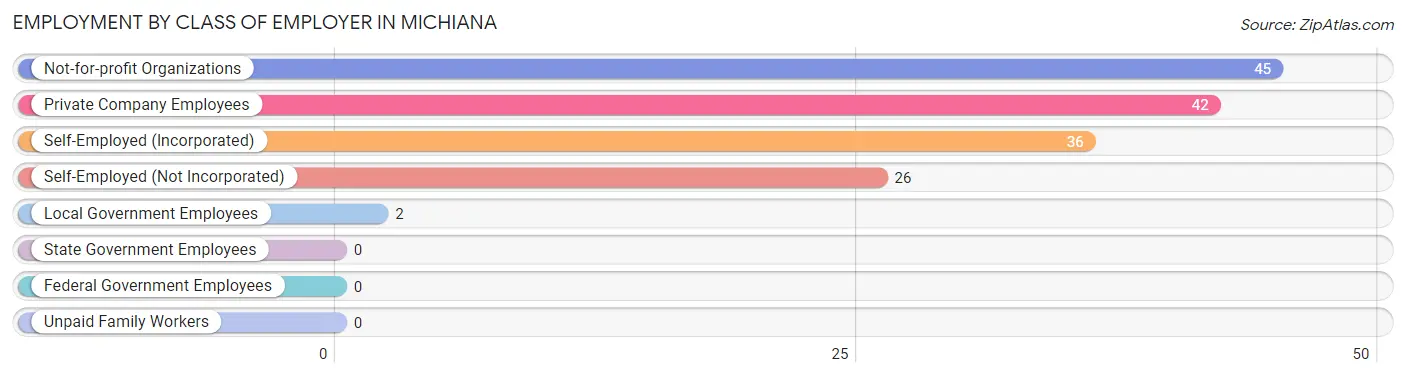
| Employer Class | # Employees | % Employees |
| Private Company Employees | 42 | 27.8% |
| Self-Employed (Incorporated) | 36 | 23.8% |
| Self-Employed (Not Incorporated) | 26 | 17.2% |
| Not-for-profit Organizations | 45 | 29.8% |
| Local Government Employees | 2 | 1.3% |
| State Government Employees | 0 | 0.0% |
| Federal Government Employees | 0 | 0.0% |
| Unpaid Family Workers | 0 | 0.0% |
| Total | 151 | 100.0% |
Employment Status by Age in Michiana
According to the labor force statistics for Michiana, out of the total population over 16 years of age (281), 55.5% or 156 individuals are in the labor force, with 3.2% or 5 of them unemployed. The age group with the highest labor force participation rate is 16 to 19 years, with 100.0% or 2 individuals in the labor force. Within the labor force, the 55 to 59 years age range has the highest percentage of unemployed individuals, with 15.4% or 2 of them being unemployed.
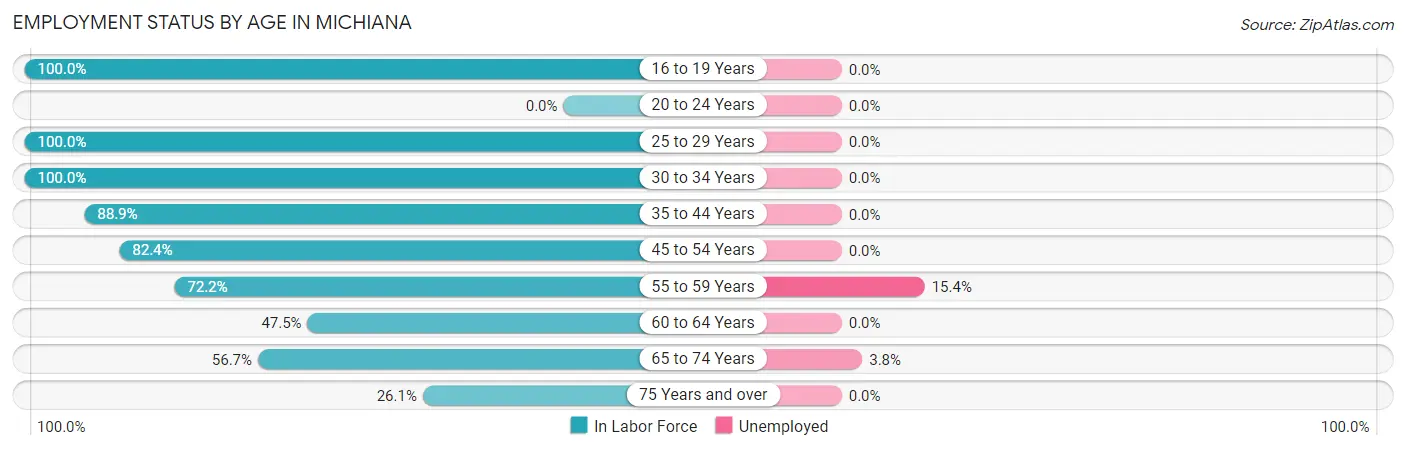
| Age Bracket | In Labor Force | Unemployed |
| 16 to 19 Years | 2 (100.0%) | 0 (0.0%) |
| 20 to 24 Years | 0 (0.0%) | 0 (0.0%) |
| 25 to 29 Years | 6 (100.0%) | 0 (0.0%) |
| 30 to 34 Years | 2 (100.0%) | 0 (0.0%) |
| 35 to 44 Years | 8 (88.9%) | 0 (0.0%) |
| 45 to 54 Years | 14 (82.4%) | 0 (0.0%) |
| 55 to 59 Years | 13 (72.2%) | 2 (15.4%) |
| 60 to 64 Years | 19 (47.5%) | 0 (0.0%) |
| 65 to 74 Years | 80 (56.7%) | 3 (3.8%) |
| 75 Years and over | 12 (26.1%) | 0 (0.0%) |
| Total | 156 (55.5%) | 5 (3.2%) |
Employment Status by Educational Attainment in Michiana
According to labor force statistics for Michiana, 67.4% of individuals (62) out of the total population between 25 and 64 years of age (92) are in the labor force, with 3.2% or 2 of them being unemployed. The group with the highest labor force participation rate are those with the educational attainment of high school diploma, with 100.0% or 3 individuals in the labor force. Within the labor force, individuals with bachelor's degree or higher education have the highest percentage of unemployment, with 3.8% or 2 of them being unemployed.
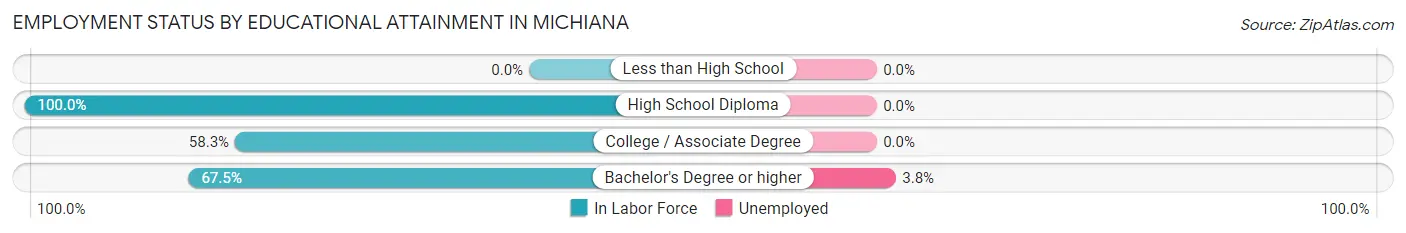
| Educational Attainment | In Labor Force | Unemployed |
| Less than High School | 0 (0.0%) | 0 (0.0%) |
| High School Diploma | 3 (100.0%) | 0 (0.0%) |
| College / Associate Degree | 7 (58.3%) | 0 (0.0%) |
| Bachelor's Degree or higher | 52 (67.5%) | 3 (3.8%) |
| Total | 62 (67.4%) | 3 (3.2%) |
Employment Occupations by Sex in Michiana
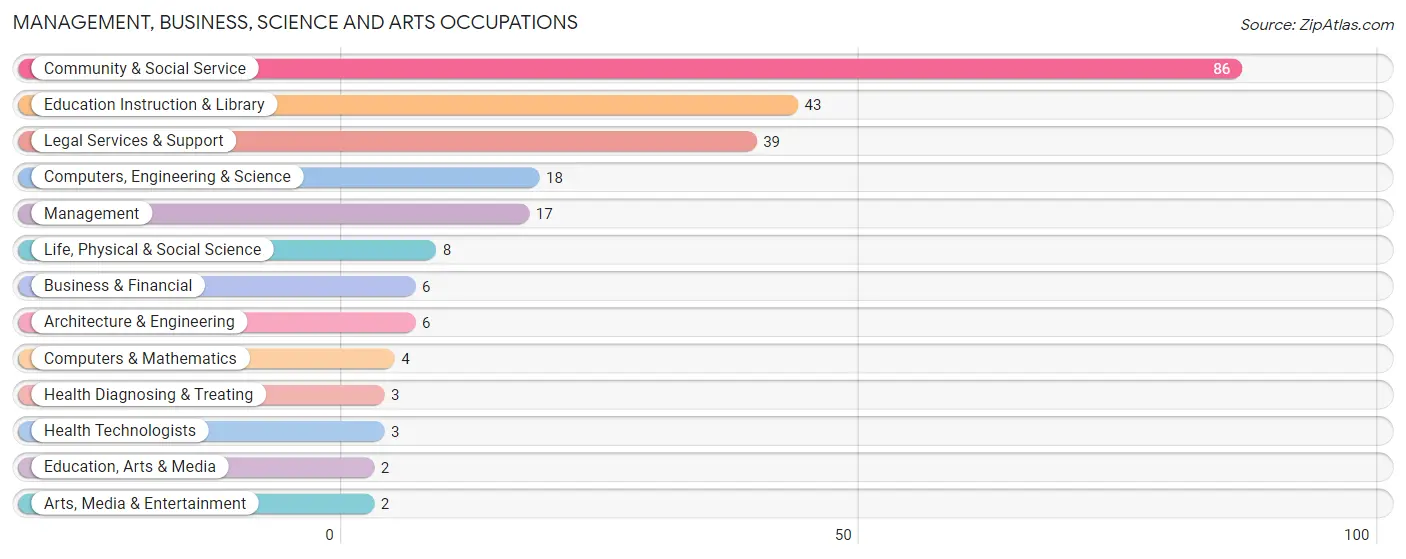
Management, Business, Science and Arts Occupations
The most common Management, Business, Science and Arts occupations in Michiana are Community & Social Service (86 | 57.0%), Education Instruction & Library (43 | 28.5%), Legal Services & Support (39 | 25.8%), Computers, Engineering & Science (18 | 11.9%), and Management (17 | 11.3%).
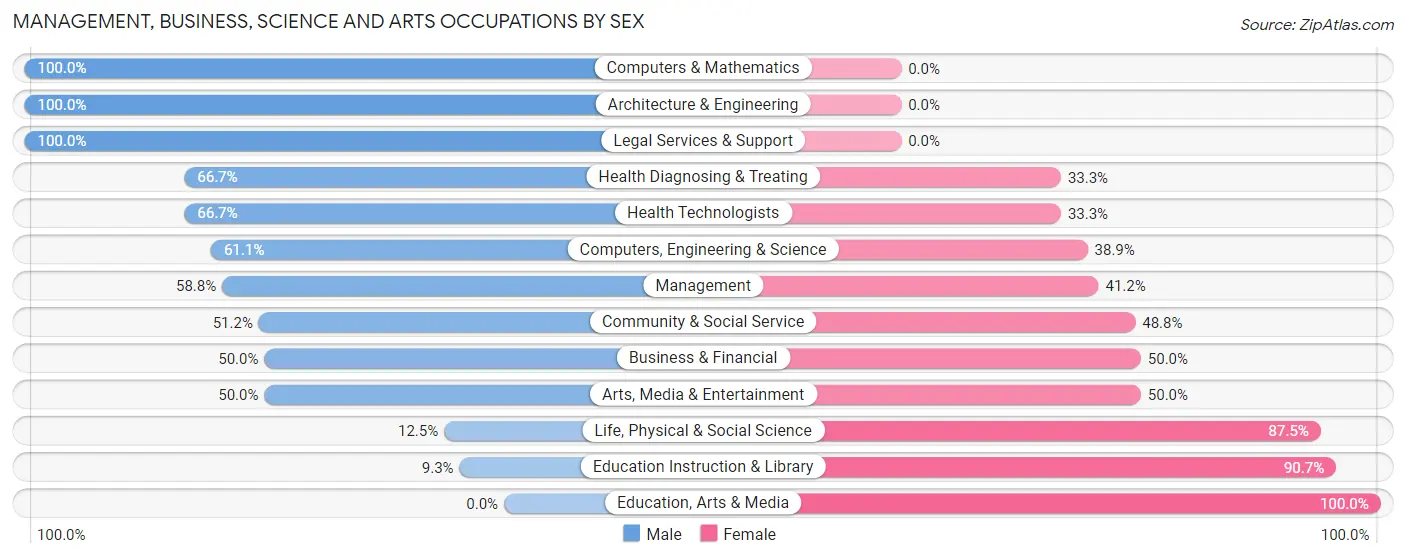
Management, Business, Science and Arts Occupations by Sex
Within the Management, Business, Science and Arts occupations in Michiana, the most male-oriented occupations are Computers & Mathematics (100.0%), Architecture & Engineering (100.0%), and Legal Services & Support (100.0%), while the most female-oriented occupations are Education, Arts & Media (100.0%), Education Instruction & Library (90.7%), and Life, Physical & Social Science (87.5%).
| Occupation | Male | Female |
| Management | 10 (58.8%) | 7 (41.2%) |
| Business & Financial | 3 (50.0%) | 3 (50.0%) |
| Computers, Engineering & Science | 11 (61.1%) | 7 (38.9%) |
| Computers & Mathematics | 4 (100.0%) | 0 (0.0%) |
| Architecture & Engineering | 6 (100.0%) | 0 (0.0%) |
| Life, Physical & Social Science | 1 (12.5%) | 7 (87.5%) |
| Community & Social Service | 44 (51.2%) | 42 (48.8%) |
| Education, Arts & Media | 0 (0.0%) | 2 (100.0%) |
| Legal Services & Support | 39 (100.0%) | 0 (0.0%) |
| Education Instruction & Library | 4 (9.3%) | 39 (90.7%) |
| Arts, Media & Entertainment | 1 (50.0%) | 1 (50.0%) |
| Health Diagnosing & Treating | 2 (66.7%) | 1 (33.3%) |
| Health Technologists | 2 (66.7%) | 1 (33.3%) |
| Total (Category) | 70 (53.8%) | 60 (46.2%) |
| Total (Overall) | 79 (52.3%) | 72 (47.7%) |
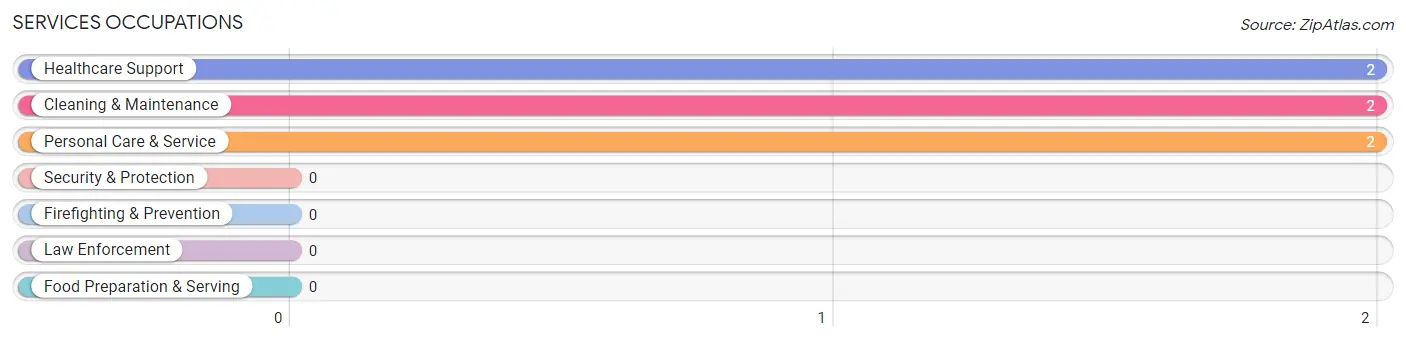
Services Occupations
The most common Services occupations in Michiana are Healthcare Support (2 | 1.3%), Cleaning & Maintenance (2 | 1.3%), and Personal Care & Service (2 | 1.3%).
Services Occupations by Sex
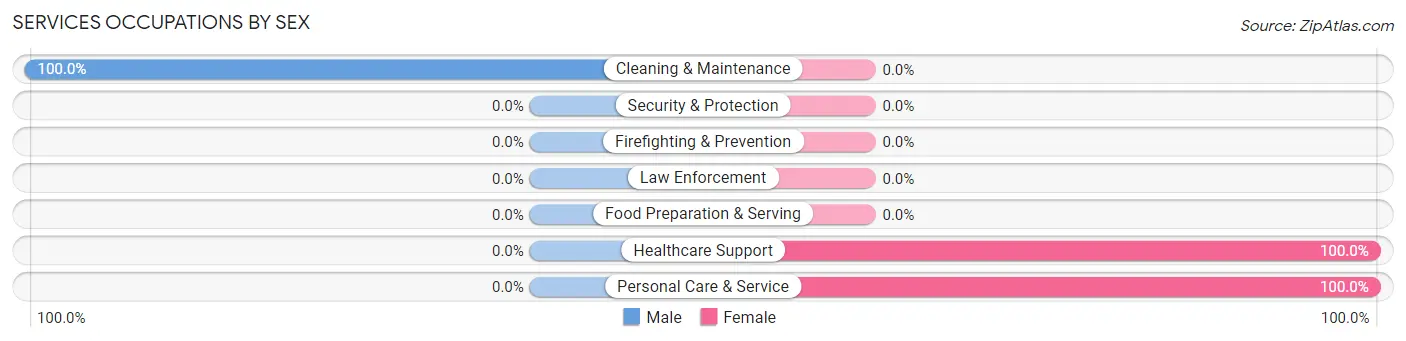
| Occupation | Male | Female |
| Healthcare Support | 0 (0.0%) | 2 (100.0%) |
| Security & Protection | 0 (0.0%) | 0 (0.0%) |
| Firefighting & Prevention | 0 (0.0%) | 0 (0.0%) |
| Law Enforcement | 0 (0.0%) | 0 (0.0%) |
| Food Preparation & Serving | 0 (0.0%) | 0 (0.0%) |
| Cleaning & Maintenance | 2 (100.0%) | 0 (0.0%) |
| Personal Care & Service | 0 (0.0%) | 2 (100.0%) |
| Total (Category) | 2 (33.3%) | 4 (66.7%) |
| Total (Overall) | 79 (52.3%) | 72 (47.7%) |
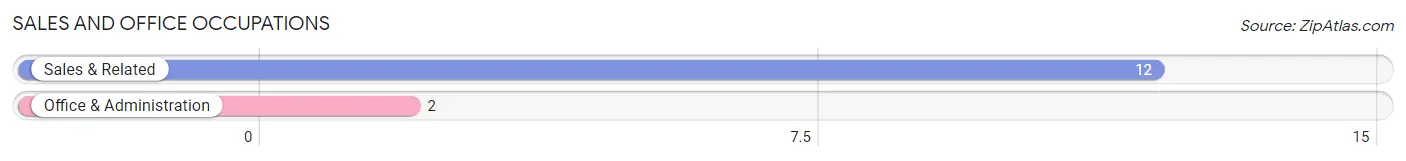
Sales and Office Occupations
The most common Sales and Office occupations in Michiana are Sales & Related (12 | 8.0%), and Office & Administration (2 | 1.3%).
Sales and Office Occupations by Sex
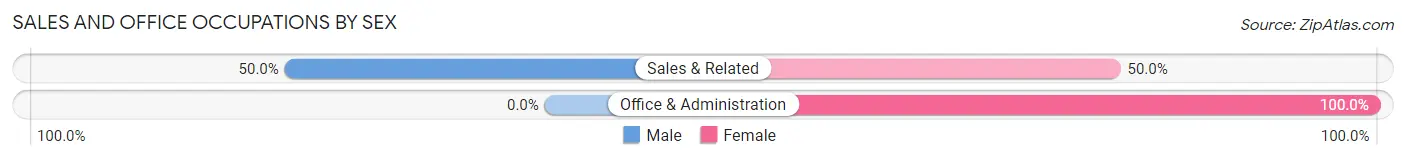
| Occupation | Male | Female |
| Sales & Related | 6 (50.0%) | 6 (50.0%) |
| Office & Administration | 0 (0.0%) | 2 (100.0%) |
| Total (Category) | 6 (42.9%) | 8 (57.1%) |
| Total (Overall) | 79 (52.3%) | 72 (47.7%) |
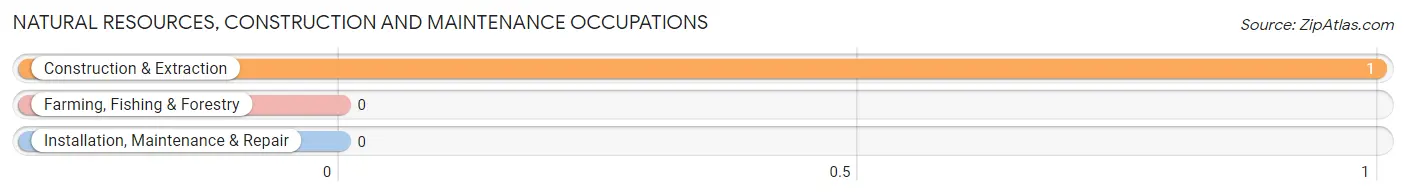
Natural Resources, Construction and Maintenance Occupations
The most common Natural Resources, Construction and Maintenance occupations in Michiana are , and Construction & Extraction (1 | 0.7%).
Natural Resources, Construction and Maintenance Occupations by Sex
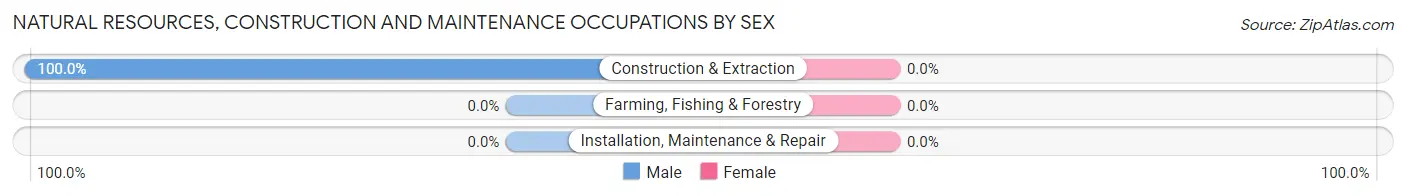
| Occupation | Male | Female |
| Farming, Fishing & Forestry | 0 (0.0%) | 0 (0.0%) |
| Construction & Extraction | 1 (100.0%) | 0 (0.0%) |
| Installation, Maintenance & Repair | 0 (0.0%) | 0 (0.0%) |
| Total (Category) | 1 (100.0%) | 0 (0.0%) |
| Total (Overall) | 79 (52.3%) | 72 (47.7%) |
Production, Transportation and Moving Occupations
Production, Transportation and Moving Occupations by Sex
| Occupation | Male | Female |
| Production | 0 (0.0%) | 0 (0.0%) |
| Transportation | 0 (0.0%) | 0 (0.0%) |
| Material Moving | 0 (0.0%) | 0 (0.0%) |
| Total (Category) | 0 (0.0%) | 0 (0.0%) |
| Total (Overall) | 79 (52.3%) | 72 (47.7%) |
Employment Industries by Sex in Michiana
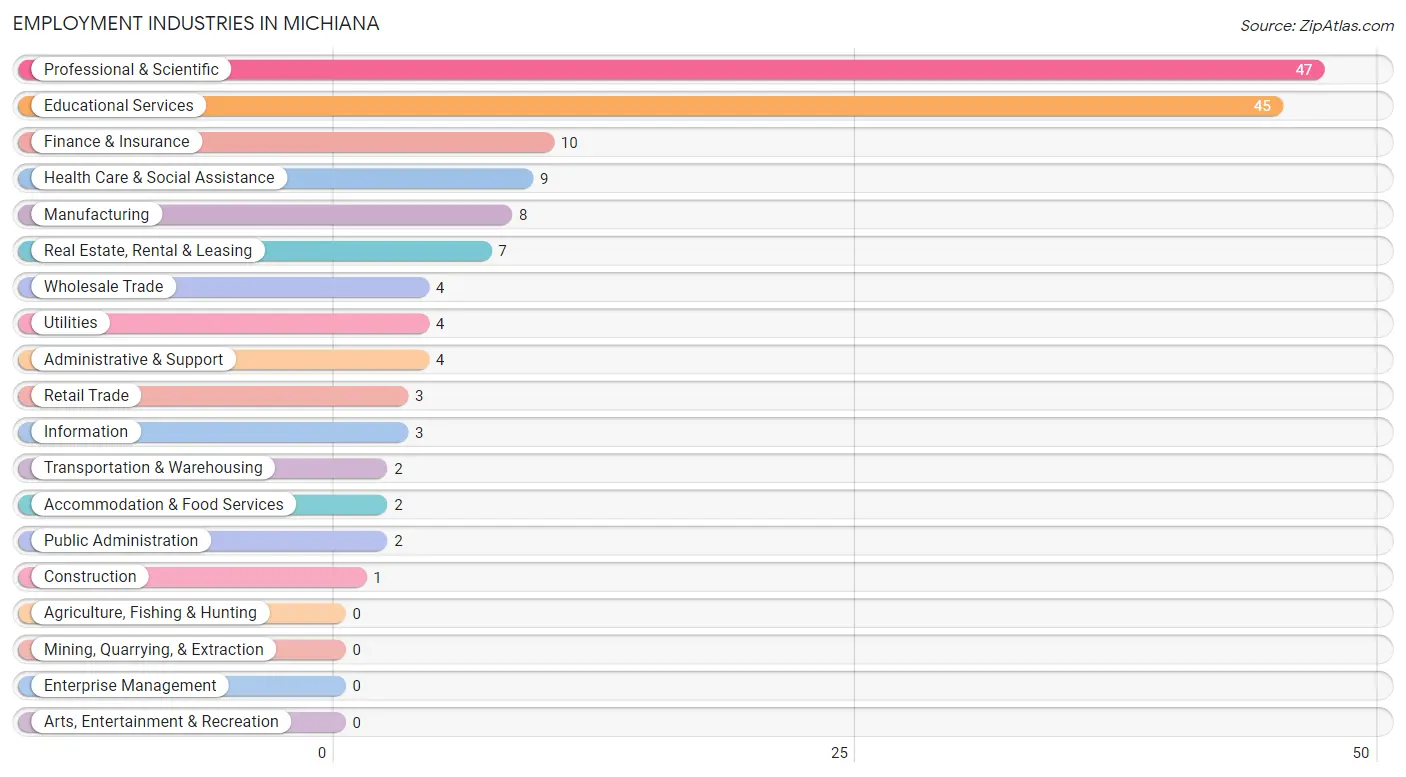
Employment Industries in Michiana
The major employment industries in Michiana include Professional & Scientific (47 | 31.1%), Educational Services (45 | 29.8%), Finance & Insurance (10 | 6.6%), Health Care & Social Assistance (9 | 6.0%), and Manufacturing (8 | 5.3%).
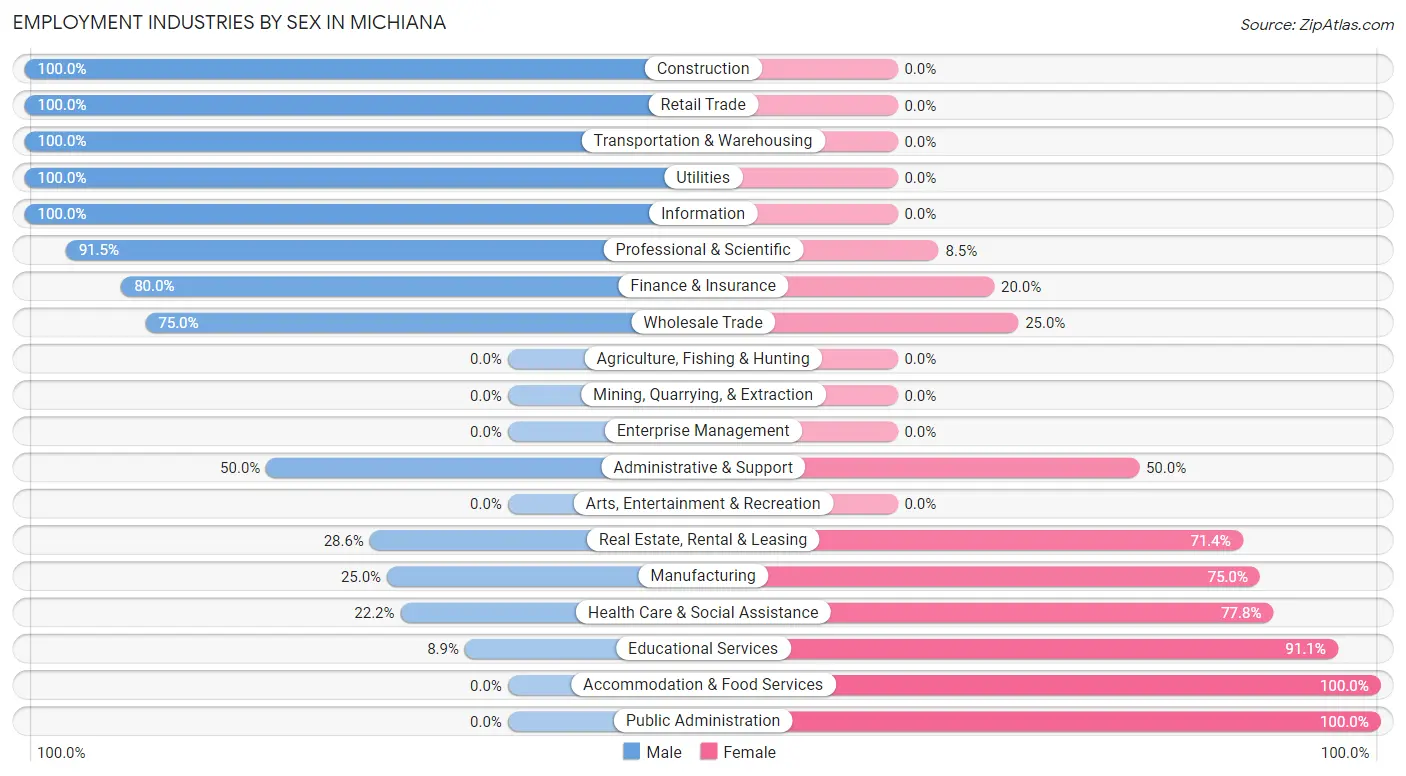
Employment Industries by Sex in Michiana
The Michiana industries that see more men than women are Construction (100.0%), Retail Trade (100.0%), and Transportation & Warehousing (100.0%), whereas the industries that tend to have a higher number of women are Accommodation & Food Services (100.0%), Public Administration (100.0%), and Educational Services (91.1%).
| Industry | Male | Female |
| Agriculture, Fishing & Hunting | 0 (0.0%) | 0 (0.0%) |
| Mining, Quarrying, & Extraction | 0 (0.0%) | 0 (0.0%) |
| Construction | 1 (100.0%) | 0 (0.0%) |
| Manufacturing | 2 (25.0%) | 6 (75.0%) |
| Wholesale Trade | 3 (75.0%) | 1 (25.0%) |
| Retail Trade | 3 (100.0%) | 0 (0.0%) |
| Transportation & Warehousing | 2 (100.0%) | 0 (0.0%) |
| Utilities | 4 (100.0%) | 0 (0.0%) |
| Information | 3 (100.0%) | 0 (0.0%) |
| Finance & Insurance | 8 (80.0%) | 2 (20.0%) |
| Real Estate, Rental & Leasing | 2 (28.6%) | 5 (71.4%) |
| Professional & Scientific | 43 (91.5%) | 4 (8.5%) |
| Enterprise Management | 0 (0.0%) | 0 (0.0%) |
| Administrative & Support | 2 (50.0%) | 2 (50.0%) |
| Educational Services | 4 (8.9%) | 41 (91.1%) |
| Health Care & Social Assistance | 2 (22.2%) | 7 (77.8%) |
| Arts, Entertainment & Recreation | 0 (0.0%) | 0 (0.0%) |
| Accommodation & Food Services | 0 (0.0%) | 2 (100.0%) |
| Public Administration | 0 (0.0%) | 2 (100.0%) |
| Total | 79 (52.3%) | 72 (47.7%) |
Education in Michiana
School Enrollment in Michiana
The most common levels of schooling among the 5 students in Michiana are high school (3 | 60.0%), and college / undergraduate (2 | 40.0%).
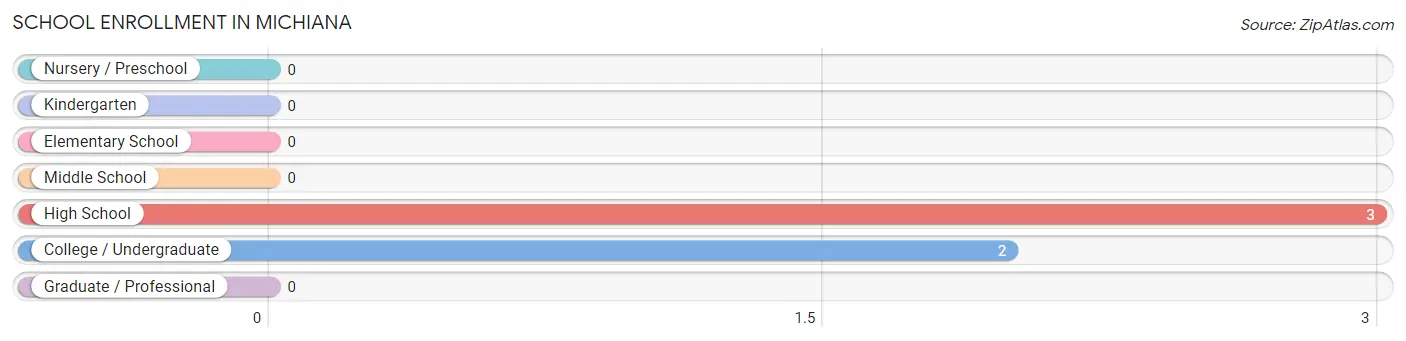
| School Level | # Students | % Students |
| Nursery / Preschool | 0 | 0.0% |
| Kindergarten | 0 | 0.0% |
| Elementary School | 0 | 0.0% |
| Middle School | 0 | 0.0% |
| High School | 3 | 60.0% |
| College / Undergraduate | 2 | 40.0% |
| Graduate / Professional | 0 | 0.0% |
| Total | 5 | 100.0% |
School Enrollment by Age by Funding Source in Michiana
Out of a total of 5 students who are enrolled in schools in Michiana, 4 (80.0%) attend a private institution, while the remaining 1 (20.0%) are enrolled in public schools. The age group of 15 to 17 year olds has the highest likelihood of being enrolled in private schools, with 2 (100.0% in the age bracket) enrolled. Conversely, the age group of 10 to 14 year olds has the lowest likelihood of being enrolled in a private school, with 1 (100.0% in the age bracket) attending a public institution.
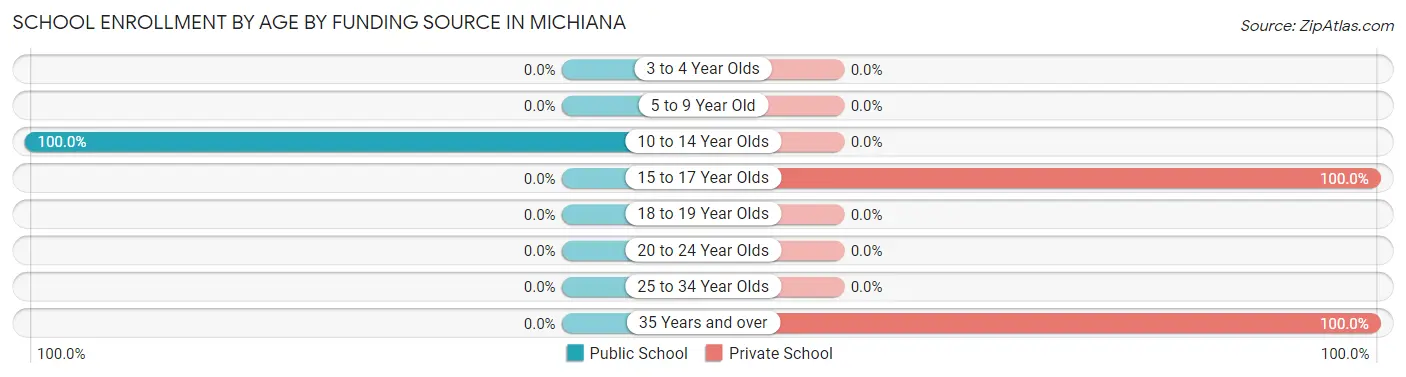
| Age Bracket | Public School | Private School |
| 3 to 4 Year Olds | 0 (0.0%) | 0 (0.0%) |
| 5 to 9 Year Old | 0 (0.0%) | 0 (0.0%) |
| 10 to 14 Year Olds | 1 (100.0%) | 0 (0.0%) |
| 15 to 17 Year Olds | 0 (0.0%) | 2 (100.0%) |
| 18 to 19 Year Olds | 0 (0.0%) | 0 (0.0%) |
| 20 to 24 Year Olds | 0 (0.0%) | 0 (0.0%) |
| 25 to 34 Year Olds | 0 (0.0%) | 0 (0.0%) |
| 35 Years and over | 0 (0.0%) | 2 (100.0%) |
| Total | 1 (20.0%) | 4 (80.0%) |
Educational Attainment by Field of Study in Michiana
Psychology (39 | 14.9%), arts & humanities (38 | 14.6%), business (31 | 11.9%), education (23 | 8.8%), and visual & performing arts (18 | 6.9%) are the most common fields of study among 261 individuals in Michiana who have obtained a bachelor's degree or higher.
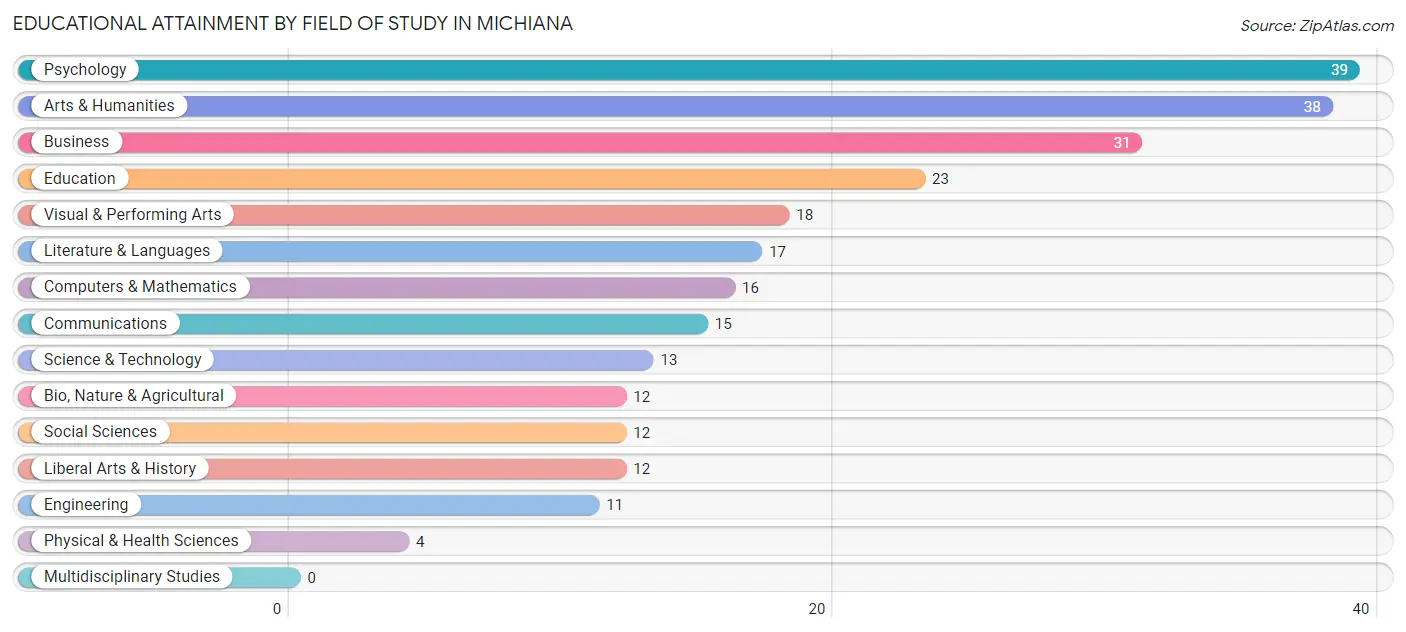
| Field of Study | # Graduates | % Graduates |
| Computers & Mathematics | 16 | 6.1% |
| Bio, Nature & Agricultural | 12 | 4.6% |
| Physical & Health Sciences | 4 | 1.5% |
| Psychology | 39 | 14.9% |
| Social Sciences | 12 | 4.6% |
| Engineering | 11 | 4.2% |
| Multidisciplinary Studies | 0 | 0.0% |
| Science & Technology | 13 | 5.0% |
| Business | 31 | 11.9% |
| Education | 23 | 8.8% |
| Literature & Languages | 17 | 6.5% |
| Liberal Arts & History | 12 | 4.6% |
| Visual & Performing Arts | 18 | 6.9% |
| Communications | 15 | 5.8% |
| Arts & Humanities | 38 | 14.6% |
| Total | 261 | 100.0% |
Transportation & Commute in Michiana
Vehicle Availability by Sex in Michiana
The most prevalent vehicle ownership categories in Michiana are males with 2 vehicles (51, accounting for 64.6%) and females with 2 vehicles (52, making up 70.8%).
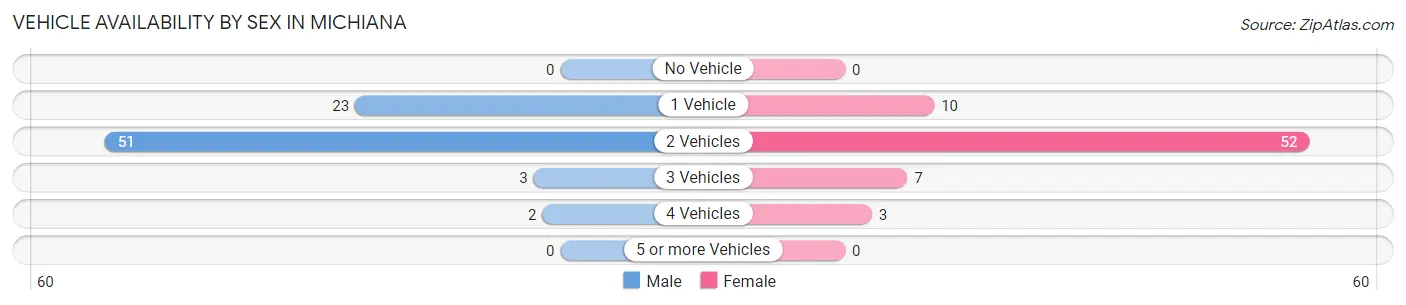
| Vehicles Available | Male | Female |
| No Vehicle | 0 (0.0%) | 0 (0.0%) |
| 1 Vehicle | 23 (29.1%) | 10 (13.9%) |
| 2 Vehicles | 51 (64.6%) | 52 (72.2%) |
| 3 Vehicles | 3 (3.8%) | 7 (9.7%) |
| 4 Vehicles | 2 (2.5%) | 3 (4.2%) |
| 5 or more Vehicles | 0 (0.0%) | 0 (0.0%) |
| Total | 79 (100.0%) | 72 (100.0%) |
Commute Time in Michiana
The most frequently occuring commute durations in Michiana are 30 to 34 minutes (31 commuters, 33.0%), 90 or more minutes (24 commuters, 25.5%), and 45 to 59 minutes (13 commuters, 13.8%).
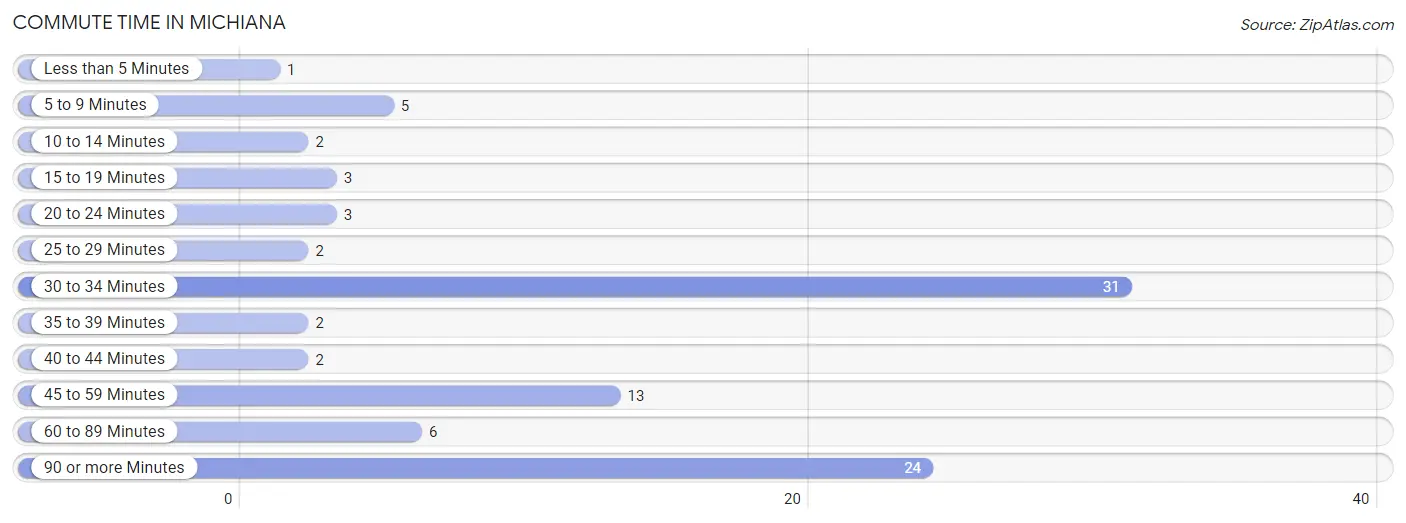
| Commute Time | # Commuters | % Commuters |
| Less than 5 Minutes | 1 | 1.1% |
| 5 to 9 Minutes | 5 | 5.3% |
| 10 to 14 Minutes | 2 | 2.1% |
| 15 to 19 Minutes | 3 | 3.2% |
| 20 to 24 Minutes | 3 | 3.2% |
| 25 to 29 Minutes | 2 | 2.1% |
| 30 to 34 Minutes | 31 | 33.0% |
| 35 to 39 Minutes | 2 | 2.1% |
| 40 to 44 Minutes | 2 | 2.1% |
| 45 to 59 Minutes | 13 | 13.8% |
| 60 to 89 Minutes | 6 | 6.4% |
| 90 or more Minutes | 24 | 25.5% |
Commute Time by Sex in Michiana
The most common commute times in Michiana are 30 to 34 minutes (29 commuters, 45.3%) for males and 45 to 59 minutes (10 commuters, 33.3%) for females.
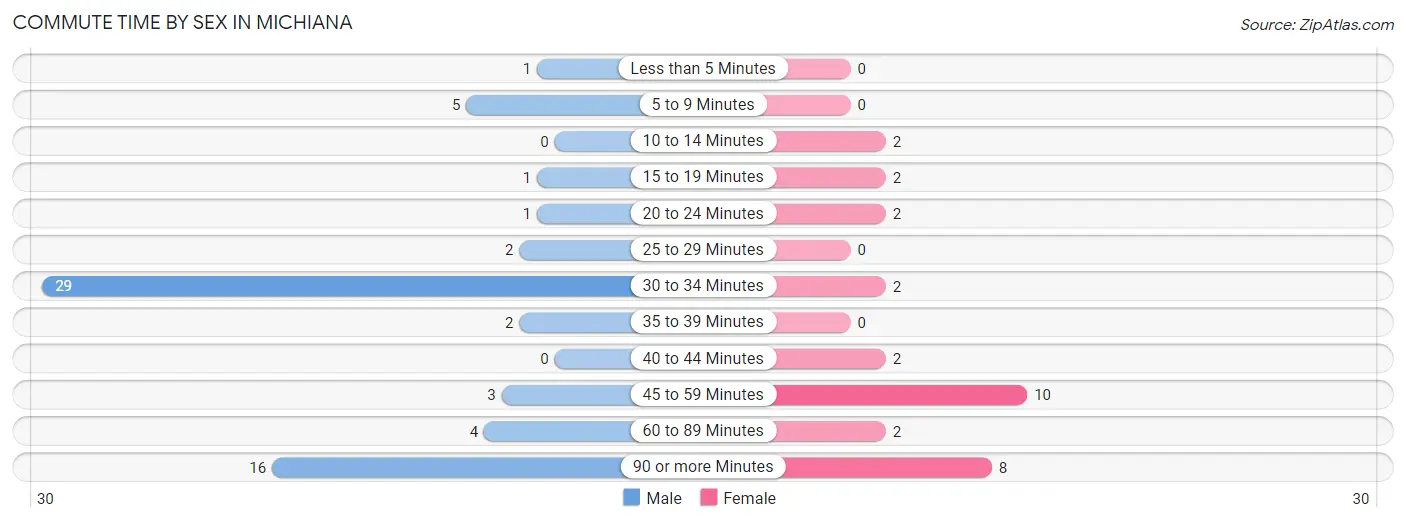
| Commute Time | Male | Female |
| Less than 5 Minutes | 1 (1.6%) | 0 (0.0%) |
| 5 to 9 Minutes | 5 (7.8%) | 0 (0.0%) |
| 10 to 14 Minutes | 0 (0.0%) | 2 (6.7%) |
| 15 to 19 Minutes | 1 (1.6%) | 2 (6.7%) |
| 20 to 24 Minutes | 1 (1.6%) | 2 (6.7%) |
| 25 to 29 Minutes | 2 (3.1%) | 0 (0.0%) |
| 30 to 34 Minutes | 29 (45.3%) | 2 (6.7%) |
| 35 to 39 Minutes | 2 (3.1%) | 0 (0.0%) |
| 40 to 44 Minutes | 0 (0.0%) | 2 (6.7%) |
| 45 to 59 Minutes | 3 (4.7%) | 10 (33.3%) |
| 60 to 89 Minutes | 4 (6.2%) | 2 (6.7%) |
| 90 or more Minutes | 16 (25.0%) | 8 (26.7%) |
Time of Departure to Work by Sex in Michiana
The most frequent times of departure to work in Michiana are 7:30 AM to 7:59 AM (31, 48.4%) for males and 6:00 AM to 6:29 AM (10, 33.3%) for females.
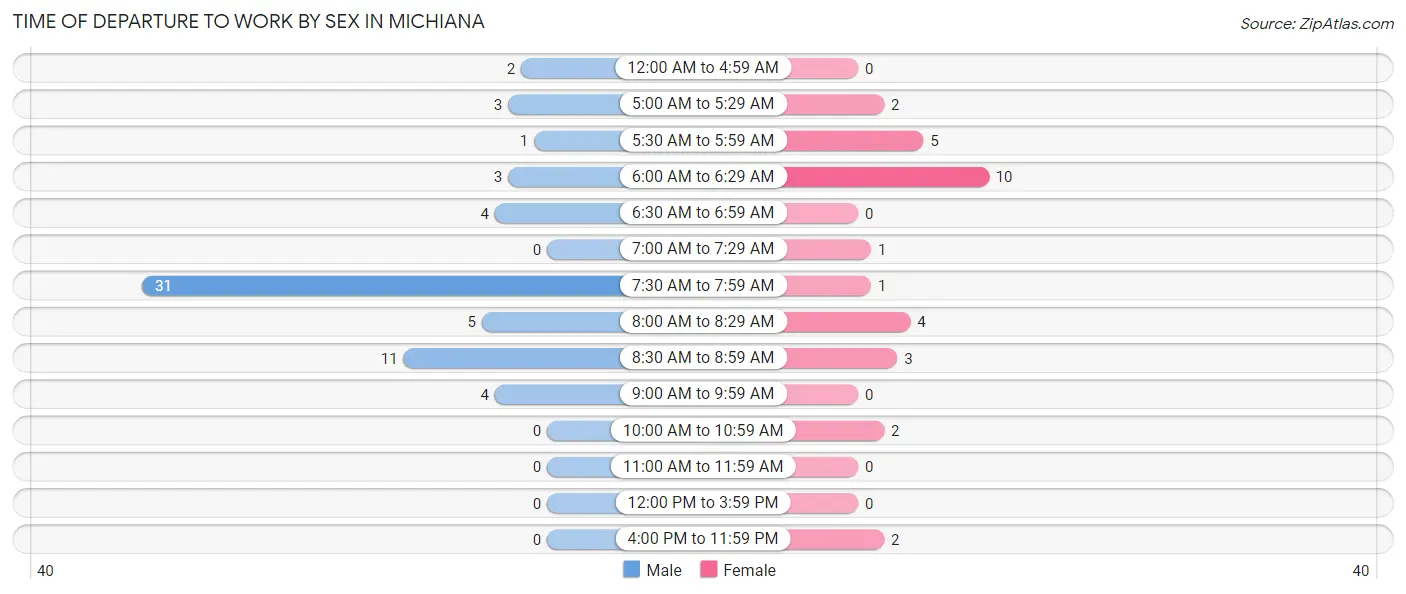
| Time of Departure | Male | Female |
| 12:00 AM to 4:59 AM | 2 (3.1%) | 0 (0.0%) |
| 5:00 AM to 5:29 AM | 3 (4.7%) | 2 (6.7%) |
| 5:30 AM to 5:59 AM | 1 (1.6%) | 5 (16.7%) |
| 6:00 AM to 6:29 AM | 3 (4.7%) | 10 (33.3%) |
| 6:30 AM to 6:59 AM | 4 (6.2%) | 0 (0.0%) |
| 7:00 AM to 7:29 AM | 0 (0.0%) | 1 (3.3%) |
| 7:30 AM to 7:59 AM | 31 (48.4%) | 1 (3.3%) |
| 8:00 AM to 8:29 AM | 5 (7.8%) | 4 (13.3%) |
| 8:30 AM to 8:59 AM | 11 (17.2%) | 3 (10.0%) |
| 9:00 AM to 9:59 AM | 4 (6.2%) | 0 (0.0%) |
| 10:00 AM to 10:59 AM | 0 (0.0%) | 2 (6.7%) |
| 11:00 AM to 11:59 AM | 0 (0.0%) | 0 (0.0%) |
| 12:00 PM to 3:59 PM | 0 (0.0%) | 0 (0.0%) |
| 4:00 PM to 11:59 PM | 0 (0.0%) | 2 (6.7%) |
| Total | 64 (100.0%) | 30 (100.0%) |
Housing Occupancy in Michiana
Occupancy by Ownership in Michiana
Of the total 159 dwellings in Michiana, owner-occupied units account for 156 (98.1%), while renter-occupied units make up 3 (1.9%).
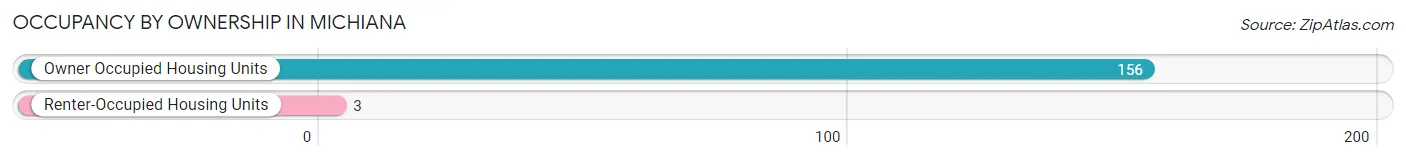
| Occupancy | # Housing Units | % Housing Units |
| Owner Occupied Housing Units | 156 | 98.1% |
| Renter-Occupied Housing Units | 3 | 1.9% |
| Total Occupied Housing Units | 159 | 100.0% |
Occupancy by Household Size in Michiana
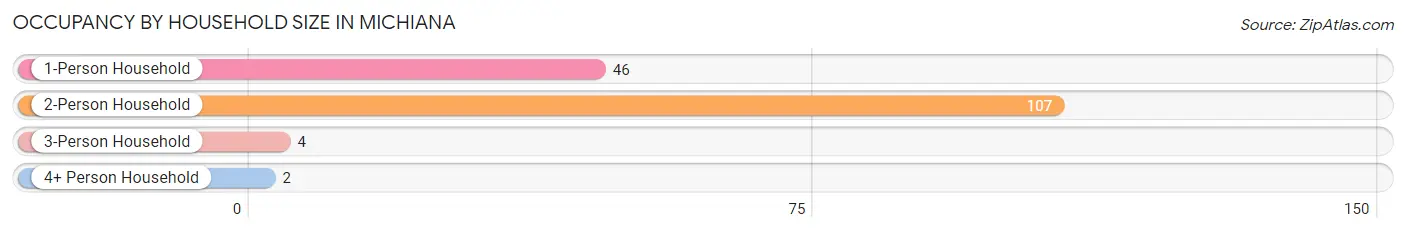
| Household Size | # Housing Units | % Housing Units |
| 1-Person Household | 46 | 28.9% |
| 2-Person Household | 107 | 67.3% |
| 3-Person Household | 4 | 2.5% |
| 4+ Person Household | 2 | 1.3% |
| Total Housing Units | 159 | 100.0% |
Occupancy by Ownership by Household Size in Michiana
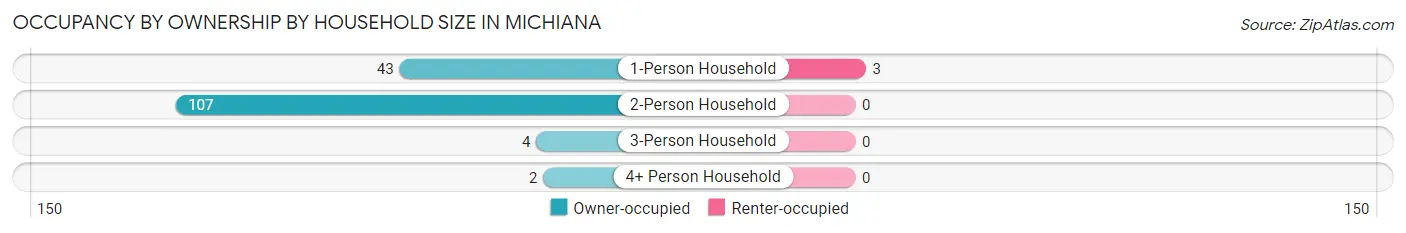
| Household Size | Owner-occupied | Renter-occupied |
| 1-Person Household | 43 (93.5%) | 3 (6.5%) |
| 2-Person Household | 107 (100.0%) | 0 (0.0%) |
| 3-Person Household | 4 (100.0%) | 0 (0.0%) |
| 4+ Person Household | 2 (100.0%) | 0 (0.0%) |
| Total Housing Units | 156 (98.1%) | 3 (1.9%) |
Occupancy by Educational Attainment in Michiana
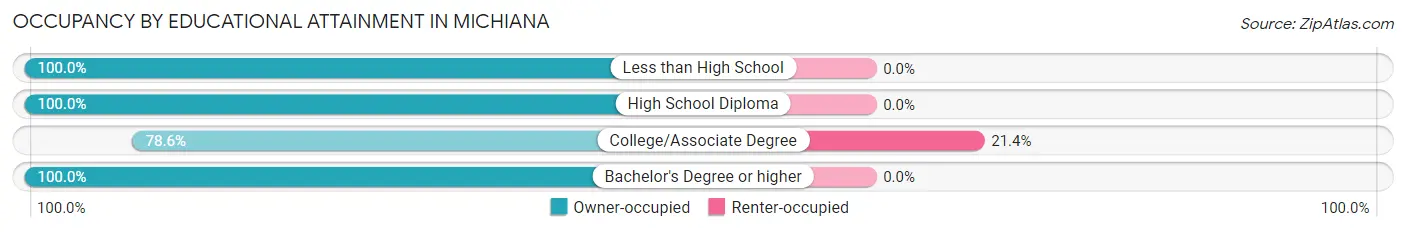
| Household Size | Owner-occupied | Renter-occupied |
| Less than High School | 1 (100.0%) | 0 (0.0%) |
| High School Diploma | 5 (100.0%) | 0 (0.0%) |
| College/Associate Degree | 11 (78.6%) | 3 (21.4%) |
| Bachelor's Degree or higher | 139 (100.0%) | 0 (0.0%) |
Occupancy by Age of Householder in Michiana
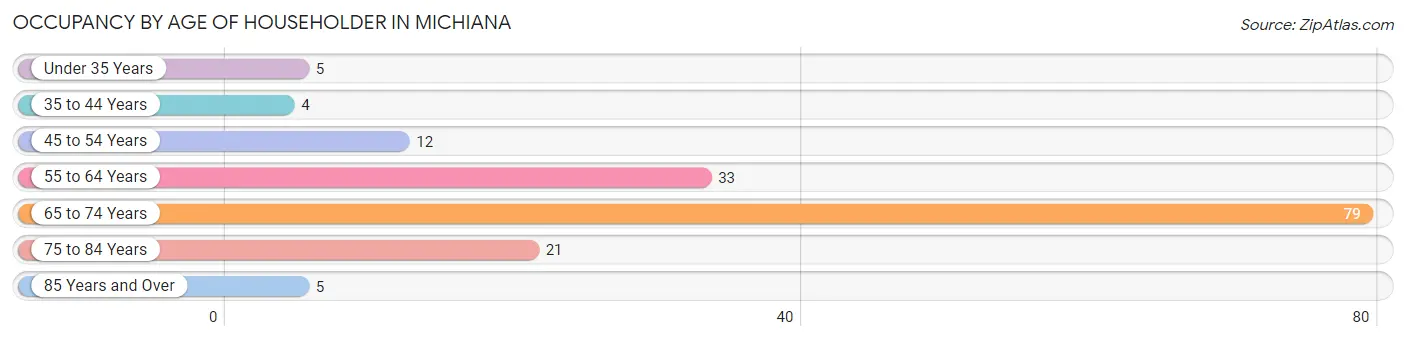
| Age Bracket | # Households | % Households |
| Under 35 Years | 5 | 3.1% |
| 35 to 44 Years | 4 | 2.5% |
| 45 to 54 Years | 12 | 7.5% |
| 55 to 64 Years | 33 | 20.7% |
| 65 to 74 Years | 79 | 49.7% |
| 75 to 84 Years | 21 | 13.2% |
| 85 Years and Over | 5 | 3.1% |
| Total | 159 | 100.0% |
Housing Finances in Michiana
Median Income by Occupancy in Michiana
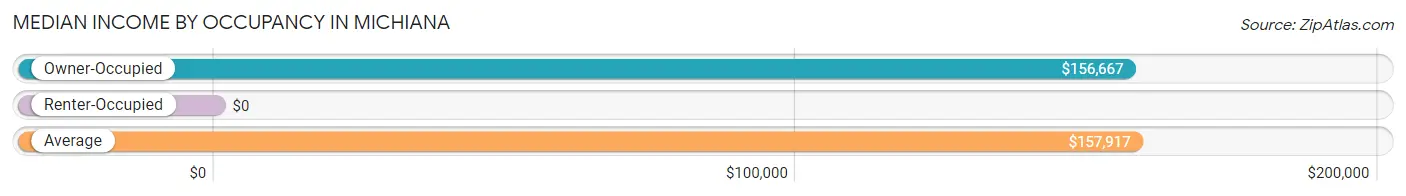
| Occupancy Type | # Households | Median Income |
| Owner-Occupied | 156 (98.1%) | $156,667 |
| Renter-Occupied | 3 (1.9%) | $0 |
| Average | 159 (100.0%) | $157,917 |
Occupancy by Householder Income Bracket in Michiana
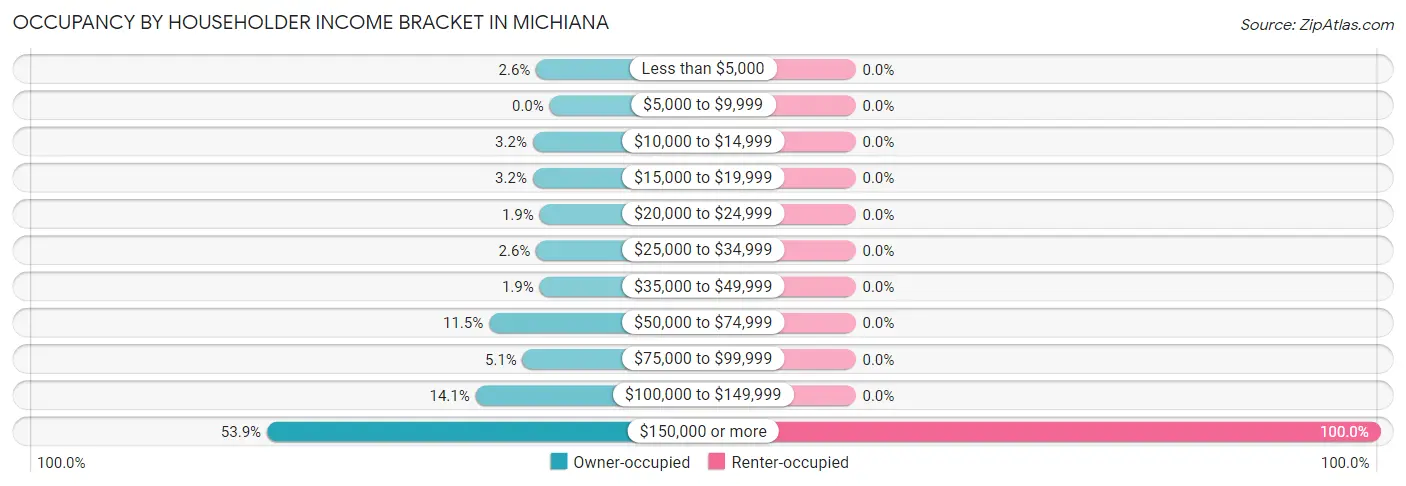
| Income Bracket | Owner-occupied | Renter-occupied |
| Less than $5,000 | 4 (2.6%) | 0 (0.0%) |
| $5,000 to $9,999 | 0 (0.0%) | 0 (0.0%) |
| $10,000 to $14,999 | 5 (3.2%) | 0 (0.0%) |
| $15,000 to $19,999 | 5 (3.2%) | 0 (0.0%) |
| $20,000 to $24,999 | 3 (1.9%) | 0 (0.0%) |
| $25,000 to $34,999 | 4 (2.6%) | 0 (0.0%) |
| $35,000 to $49,999 | 3 (1.9%) | 0 (0.0%) |
| $50,000 to $74,999 | 18 (11.5%) | 0 (0.0%) |
| $75,000 to $99,999 | 8 (5.1%) | 0 (0.0%) |
| $100,000 to $149,999 | 22 (14.1%) | 0 (0.0%) |
| $150,000 or more | 84 (53.8%) | 3 (100.0%) |
| Total | 156 (100.0%) | 3 (100.0%) |
Monthly Housing Cost Tiers in Michiana
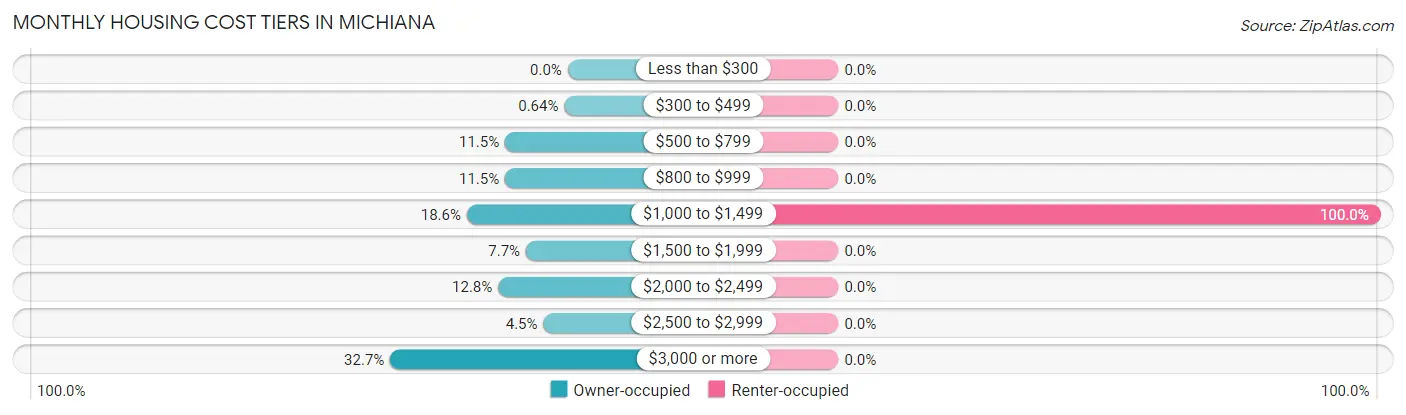
| Monthly Cost | Owner-occupied | Renter-occupied |
| Less than $300 | 0 (0.0%) | 0 (0.0%) |
| $300 to $499 | 1 (0.6%) | 0 (0.0%) |
| $500 to $799 | 18 (11.5%) | 0 (0.0%) |
| $800 to $999 | 18 (11.5%) | 0 (0.0%) |
| $1,000 to $1,499 | 29 (18.6%) | 3 (100.0%) |
| $1,500 to $1,999 | 12 (7.7%) | 0 (0.0%) |
| $2,000 to $2,499 | 20 (12.8%) | 0 (0.0%) |
| $2,500 to $2,999 | 7 (4.5%) | 0 (0.0%) |
| $3,000 or more | 51 (32.7%) | 0 (0.0%) |
| Total | 156 (100.0%) | 3 (100.0%) |
Physical Housing Characteristics in Michiana
Housing Structures in Michiana
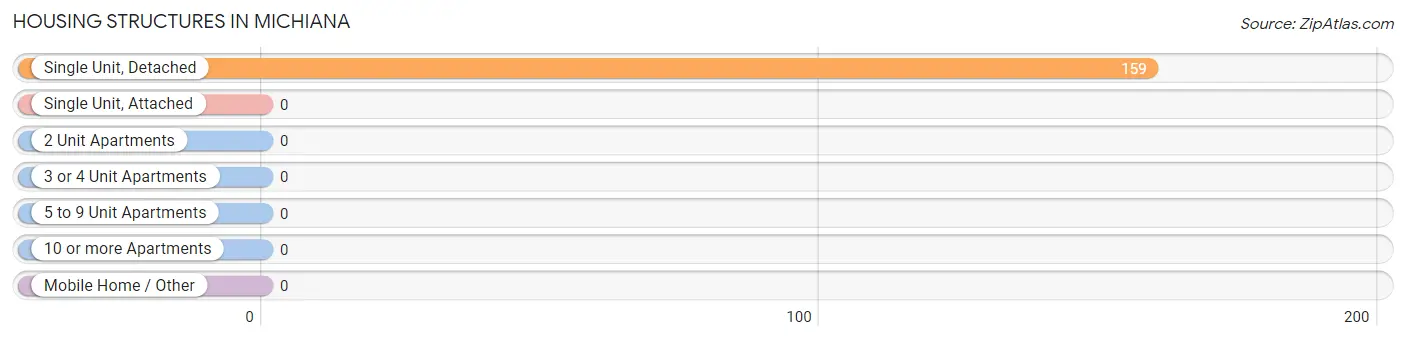
| Structure Type | # Housing Units | % Housing Units |
| Single Unit, Detached | 159 | 100.0% |
| Single Unit, Attached | 0 | 0.0% |
| 2 Unit Apartments | 0 | 0.0% |
| 3 or 4 Unit Apartments | 0 | 0.0% |
| 5 to 9 Unit Apartments | 0 | 0.0% |
| 10 or more Apartments | 0 | 0.0% |
| Mobile Home / Other | 0 | 0.0% |
| Total | 159 | 100.0% |
Housing Structures by Occupancy in Michiana
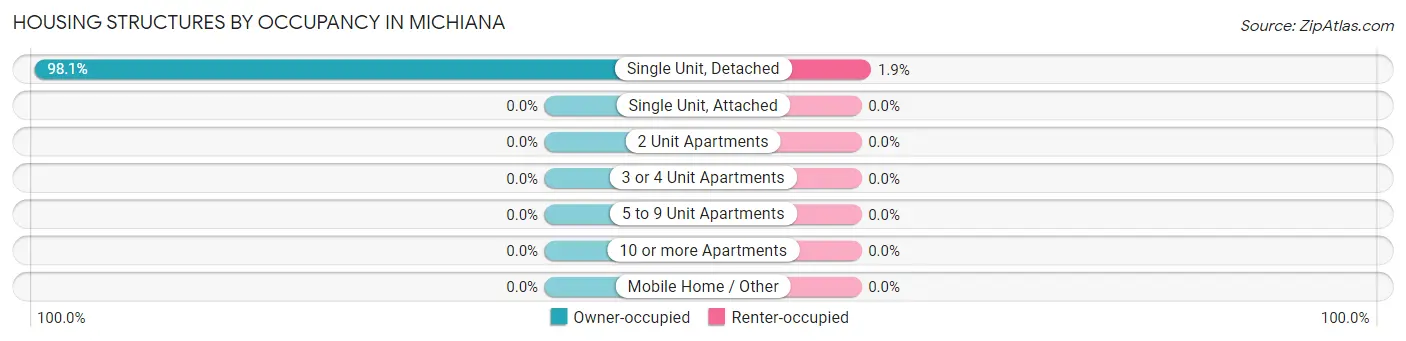
| Structure Type | Owner-occupied | Renter-occupied |
| Single Unit, Detached | 156 (98.1%) | 3 (1.9%) |
| Single Unit, Attached | 0 (0.0%) | 0 (0.0%) |
| 2 Unit Apartments | 0 (0.0%) | 0 (0.0%) |
| 3 or 4 Unit Apartments | 0 (0.0%) | 0 (0.0%) |
| 5 to 9 Unit Apartments | 0 (0.0%) | 0 (0.0%) |
| 10 or more Apartments | 0 (0.0%) | 0 (0.0%) |
| Mobile Home / Other | 0 (0.0%) | 0 (0.0%) |
| Total | 156 (98.1%) | 3 (1.9%) |
Housing Structures by Number of Rooms in Michiana
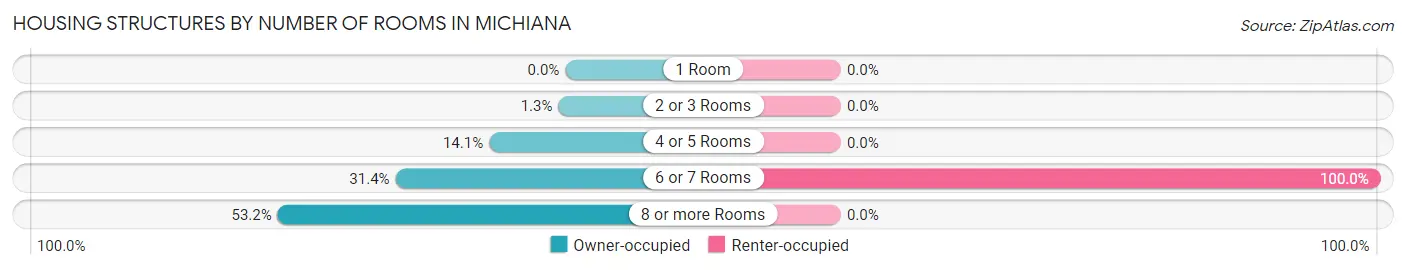
| Number of Rooms | Owner-occupied | Renter-occupied |
| 1 Room | 0 (0.0%) | 0 (0.0%) |
| 2 or 3 Rooms | 2 (1.3%) | 0 (0.0%) |
| 4 or 5 Rooms | 22 (14.1%) | 0 (0.0%) |
| 6 or 7 Rooms | 49 (31.4%) | 3 (100.0%) |
| 8 or more Rooms | 83 (53.2%) | 0 (0.0%) |
| Total | 156 (100.0%) | 3 (100.0%) |
Housing Structure by Heating Type in Michiana
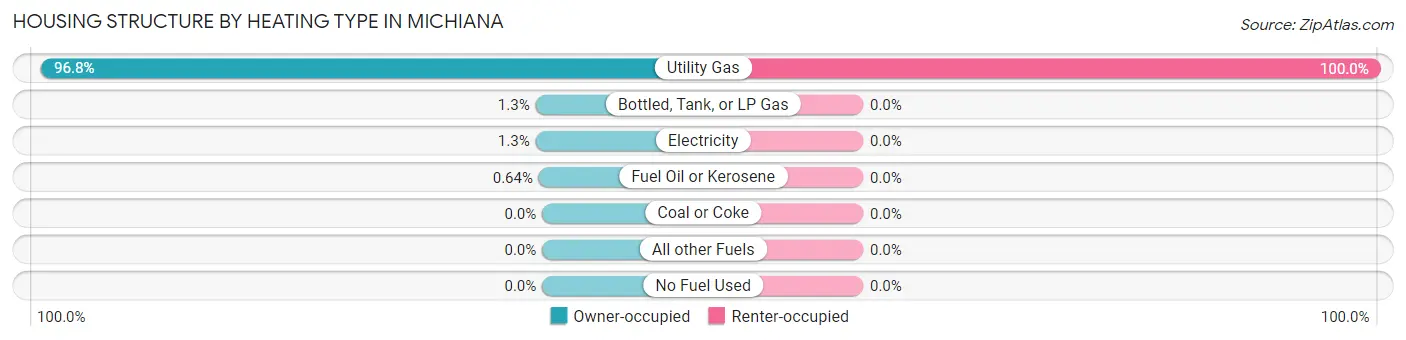
| Heating Type | Owner-occupied | Renter-occupied |
| Utility Gas | 151 (96.8%) | 3 (100.0%) |
| Bottled, Tank, or LP Gas | 2 (1.3%) | 0 (0.0%) |
| Electricity | 2 (1.3%) | 0 (0.0%) |
| Fuel Oil or Kerosene | 1 (0.6%) | 0 (0.0%) |
| Coal or Coke | 0 (0.0%) | 0 (0.0%) |
| All other Fuels | 0 (0.0%) | 0 (0.0%) |
| No Fuel Used | 0 (0.0%) | 0 (0.0%) |
| Total | 156 (100.0%) | 3 (100.0%) |
Household Vehicle Usage in Michiana
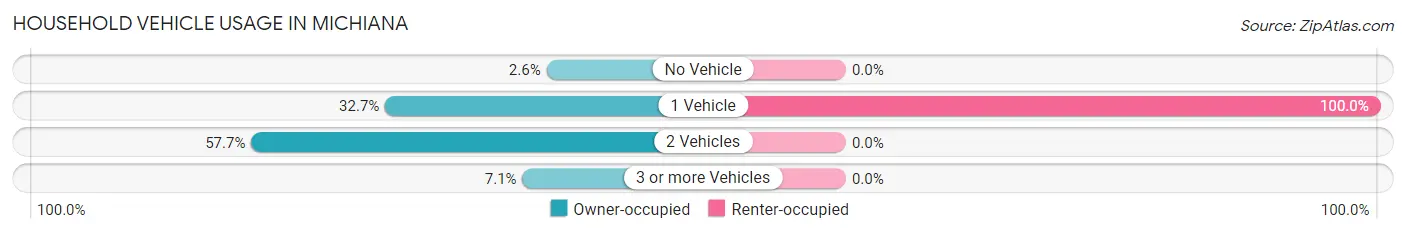
| Vehicles per Household | Owner-occupied | Renter-occupied |
| No Vehicle | 4 (2.6%) | 0 (0.0%) |
| 1 Vehicle | 51 (32.7%) | 3 (100.0%) |
| 2 Vehicles | 90 (57.7%) | 0 (0.0%) |
| 3 or more Vehicles | 11 (7.0%) | 0 (0.0%) |
| Total | 156 (100.0%) | 3 (100.0%) |
Real Estate & Mortgages in Michiana
Real Estate and Mortgage Overview in Michiana
| Characteristic | Without Mortgage | With Mortgage |
| Housing Units | 82 | 74 |
| Median Property Value | $611,100 | $812,500 |
| Median Household Income | $115,000 | $55 |
| Monthly Housing Costs | $1,050 | $47 |
| Real Estate Taxes | $7,895 | $0 |
Property Value by Mortgage Status in Michiana
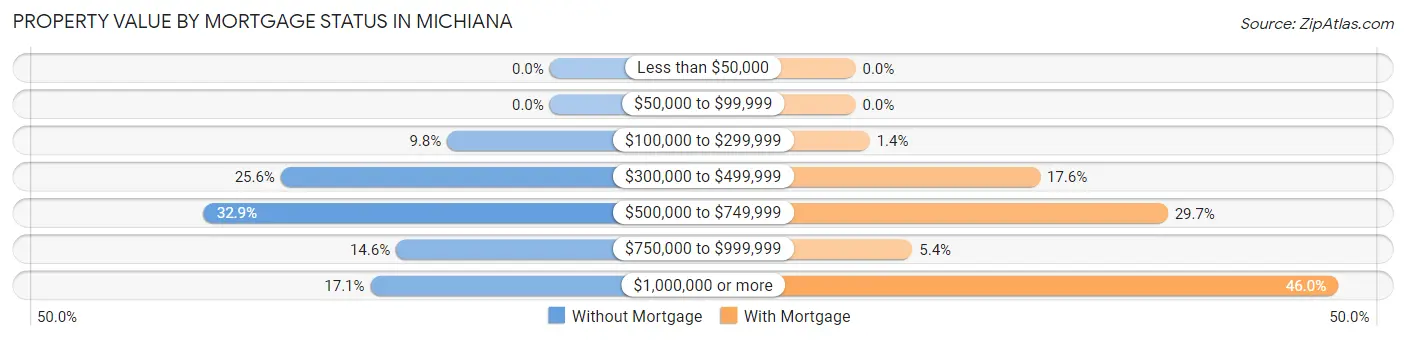
| Property Value | Without Mortgage | With Mortgage |
| Less than $50,000 | 0 (0.0%) | 0 (0.0%) |
| $50,000 to $99,999 | 0 (0.0%) | 0 (0.0%) |
| $100,000 to $299,999 | 8 (9.8%) | 1 (1.3%) |
| $300,000 to $499,999 | 21 (25.6%) | 13 (17.6%) |
| $500,000 to $749,999 | 27 (32.9%) | 22 (29.7%) |
| $750,000 to $999,999 | 12 (14.6%) | 4 (5.4%) |
| $1,000,000 or more | 14 (17.1%) | 34 (46.0%) |
| Total | 82 (100.0%) | 74 (100.0%) |
Household Income by Mortgage Status in Michiana
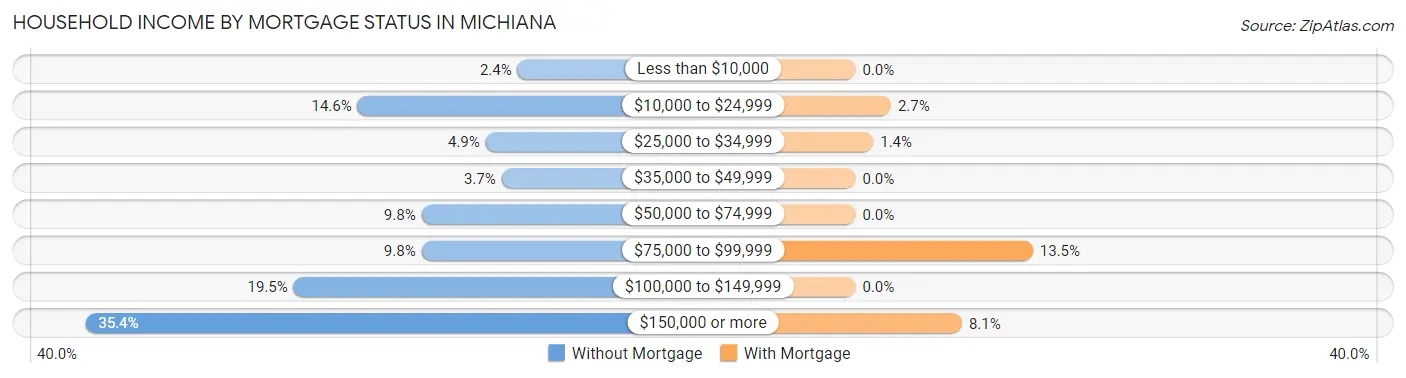
| Household Income | Without Mortgage | With Mortgage |
| Less than $10,000 | 2 (2.4%) | 0 (0.0%) |
| $10,000 to $24,999 | 12 (14.6%) | 2 (2.7%) |
| $25,000 to $34,999 | 4 (4.9%) | 1 (1.3%) |
| $35,000 to $49,999 | 3 (3.7%) | 0 (0.0%) |
| $50,000 to $74,999 | 8 (9.8%) | 0 (0.0%) |
| $75,000 to $99,999 | 8 (9.8%) | 10 (13.5%) |
| $100,000 to $149,999 | 16 (19.5%) | 0 (0.0%) |
| $150,000 or more | 29 (35.4%) | 6 (8.1%) |
| Total | 82 (100.0%) | 74 (100.0%) |
Property Value to Household Income Ratio in Michiana
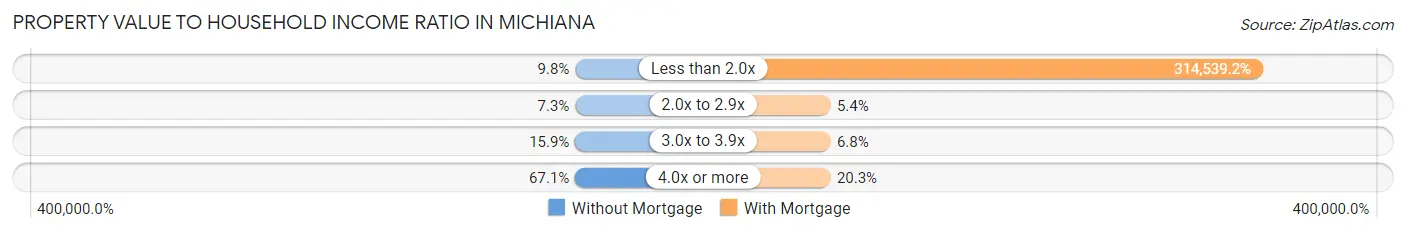
| Value-to-Income Ratio | Without Mortgage | With Mortgage |
| Less than 2.0x | 8 (9.8%) | 232,759 (314,539.2%) |
| 2.0x to 2.9x | 6 (7.3%) | 4 (5.4%) |
| 3.0x to 3.9x | 13 (15.9%) | 5 (6.8%) |
| 4.0x or more | 55 (67.1%) | 15 (20.3%) |
| Total | 82 (100.0%) | 74 (100.0%) |
Real Estate Taxes by Mortgage Status in Michiana
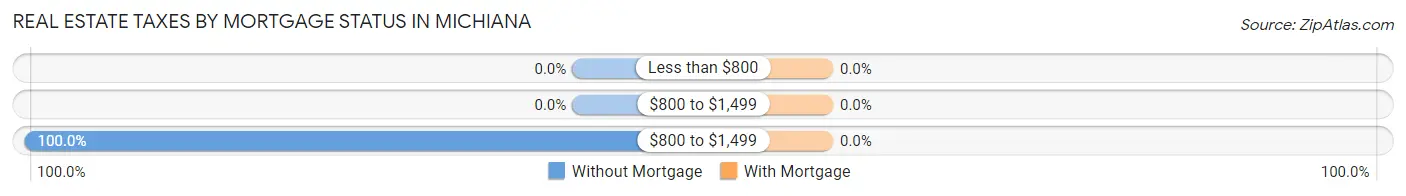
| Property Taxes | Without Mortgage | With Mortgage |
| Less than $800 | 0 (0.0%) | 0 (0.0%) |
| $800 to $1,499 | 0 (0.0%) | 0 (0.0%) |
| $800 to $1,499 | 82 (100.0%) | 0 (0.0%) |
| Total | 82 (100.0%) | 74 (100.0%) |
Health & Disability in Michiana
Health Insurance Coverage by Age in Michiana
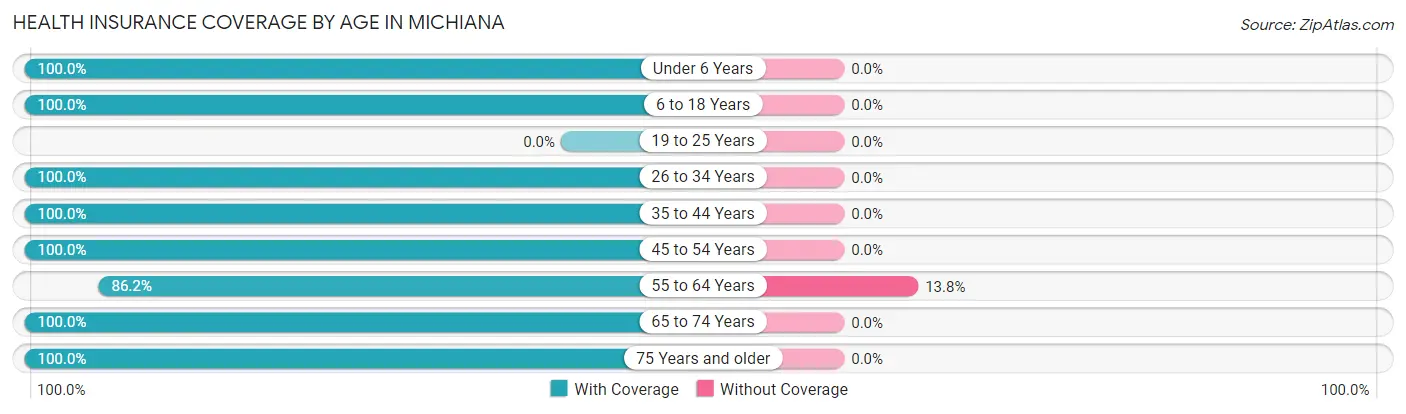
| Age Bracket | With Coverage | Without Coverage |
| Under 6 Years | 3 (100.0%) | 0 (0.0%) |
| 6 to 18 Years | 3 (100.0%) | 0 (0.0%) |
| 19 to 25 Years | 0 (0.0%) | 0 (0.0%) |
| 26 to 34 Years | 8 (100.0%) | 0 (0.0%) |
| 35 to 44 Years | 9 (100.0%) | 0 (0.0%) |
| 45 to 54 Years | 17 (100.0%) | 0 (0.0%) |
| 55 to 64 Years | 50 (86.2%) | 8 (13.8%) |
| 65 to 74 Years | 141 (100.0%) | 0 (0.0%) |
| 75 Years and older | 46 (100.0%) | 0 (0.0%) |
| Total | 277 (97.2%) | 8 (2.8%) |
Health Insurance Coverage by Citizenship Status in Michiana
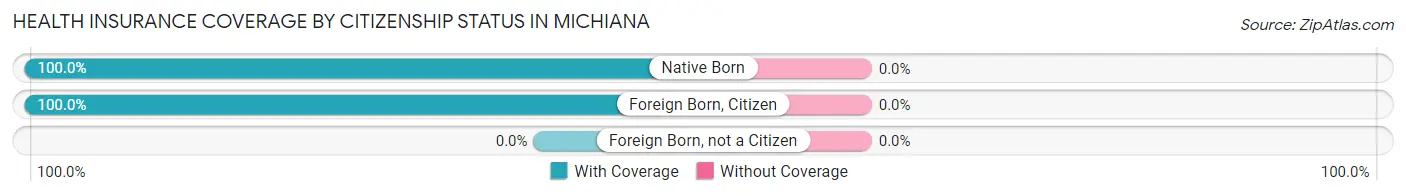
| Citizenship Status | With Coverage | Without Coverage |
| Native Born | 3 (100.0%) | 0 (0.0%) |
| Foreign Born, Citizen | 3 (100.0%) | 0 (0.0%) |
| Foreign Born, not a Citizen | 0 (0.0%) | 0 (0.0%) |
Health Insurance Coverage by Household Income in Michiana
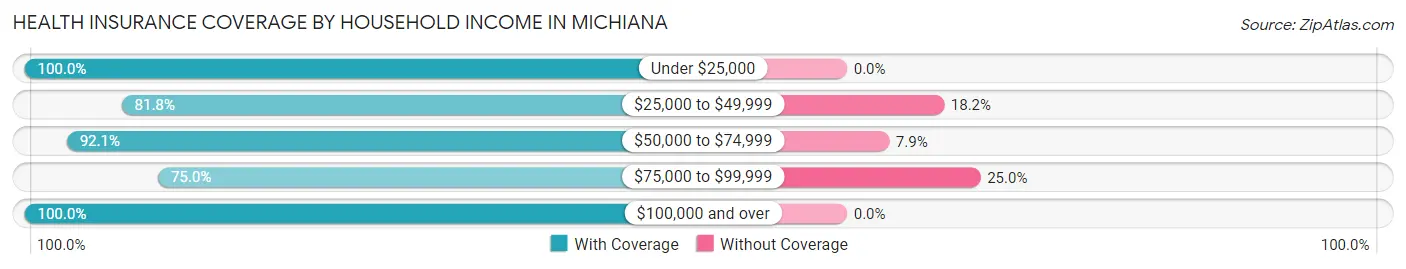
| Household Income | With Coverage | Without Coverage |
| Under $25,000 | 19 (100.0%) | 0 (0.0%) |
| $25,000 to $49,999 | 9 (81.8%) | 2 (18.2%) |
| $50,000 to $74,999 | 35 (92.1%) | 3 (7.9%) |
| $75,000 to $99,999 | 9 (75.0%) | 3 (25.0%) |
| $100,000 and over | 205 (100.0%) | 0 (0.0%) |
Public vs Private Health Insurance Coverage by Age in Michiana
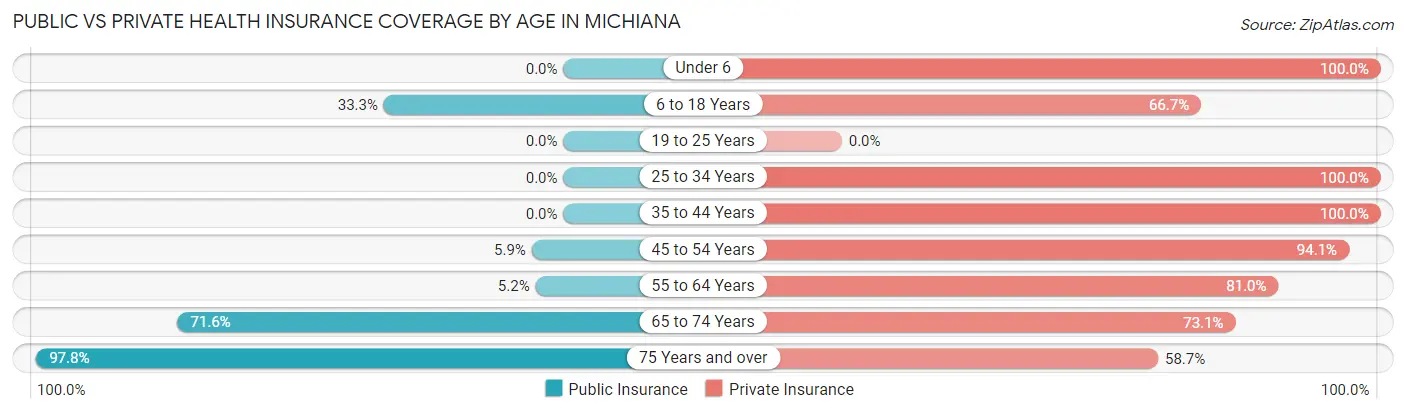
| Age Bracket | Public Insurance | Private Insurance |
| Under 6 | 0 (0.0%) | 3 (100.0%) |
| 6 to 18 Years | 1 (33.3%) | 2 (66.7%) |
| 19 to 25 Years | 0 (0.0%) | 0 (0.0%) |
| 25 to 34 Years | 0 (0.0%) | 8 (100.0%) |
| 35 to 44 Years | 0 (0.0%) | 9 (100.0%) |
| 45 to 54 Years | 1 (5.9%) | 16 (94.1%) |
| 55 to 64 Years | 3 (5.2%) | 47 (81.0%) |
| 65 to 74 Years | 101 (71.6%) | 103 (73.1%) |
| 75 Years and over | 45 (97.8%) | 27 (58.7%) |
| Total | 151 (53.0%) | 215 (75.4%) |
Disability Status by Sex by Age in Michiana
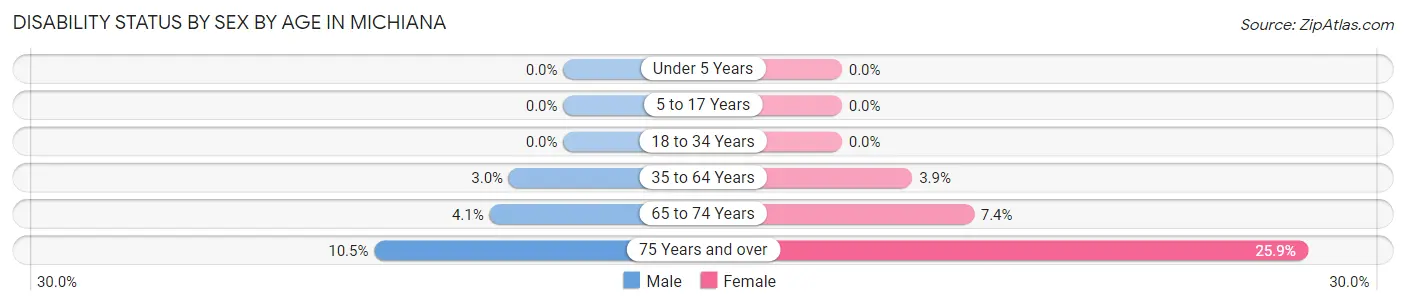
| Age Bracket | Male | Female |
| Under 5 Years | 0 (0.0%) | 0 (0.0%) |
| 5 to 17 Years | 0 (0.0%) | 0 (0.0%) |
| 18 to 34 Years | 0 (0.0%) | 0 (0.0%) |
| 35 to 64 Years | 1 (3.0%) | 2 (3.9%) |
| 65 to 74 Years | 3 (4.1%) | 5 (7.3%) |
| 75 Years and over | 2 (10.5%) | 7 (25.9%) |
Disability Class by Sex by Age in Michiana
Disability Class: Hearing Difficulty
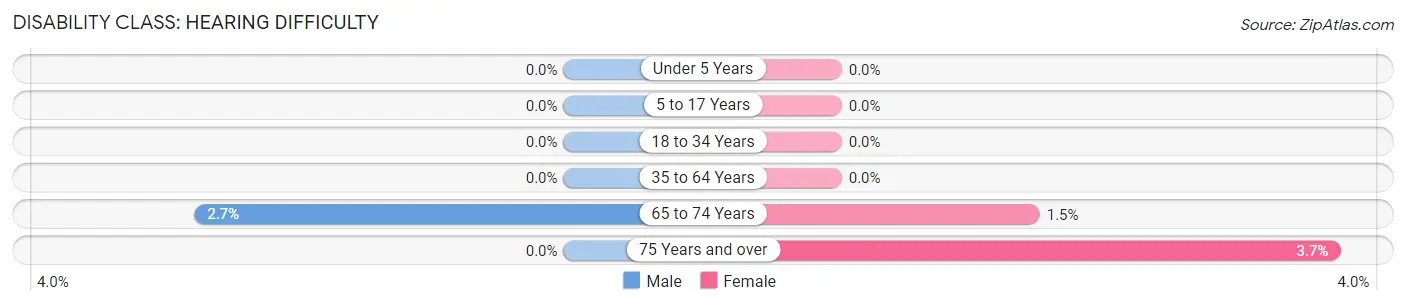
| Age Bracket | Male | Female |
| Under 5 Years | 0 (0.0%) | 0 (0.0%) |
| 5 to 17 Years | 0 (0.0%) | 0 (0.0%) |
| 18 to 34 Years | 0 (0.0%) | 0 (0.0%) |
| 35 to 64 Years | 0 (0.0%) | 0 (0.0%) |
| 65 to 74 Years | 2 (2.7%) | 1 (1.5%) |
| 75 Years and over | 0 (0.0%) | 1 (3.7%) |
Disability Class: Vision Difficulty
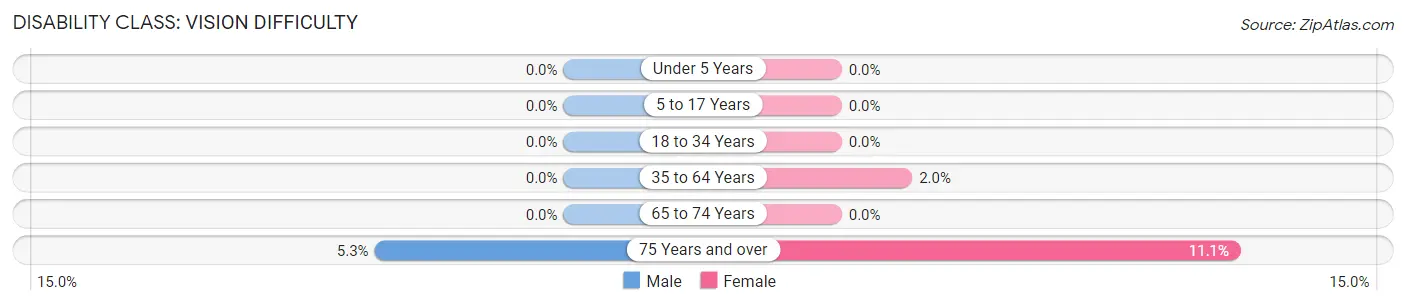
| Age Bracket | Male | Female |
| Under 5 Years | 0 (0.0%) | 0 (0.0%) |
| 5 to 17 Years | 0 (0.0%) | 0 (0.0%) |
| 18 to 34 Years | 0 (0.0%) | 0 (0.0%) |
| 35 to 64 Years | 0 (0.0%) | 1 (2.0%) |
| 65 to 74 Years | 0 (0.0%) | 0 (0.0%) |
| 75 Years and over | 1 (5.3%) | 3 (11.1%) |
Disability Class: Cognitive Difficulty
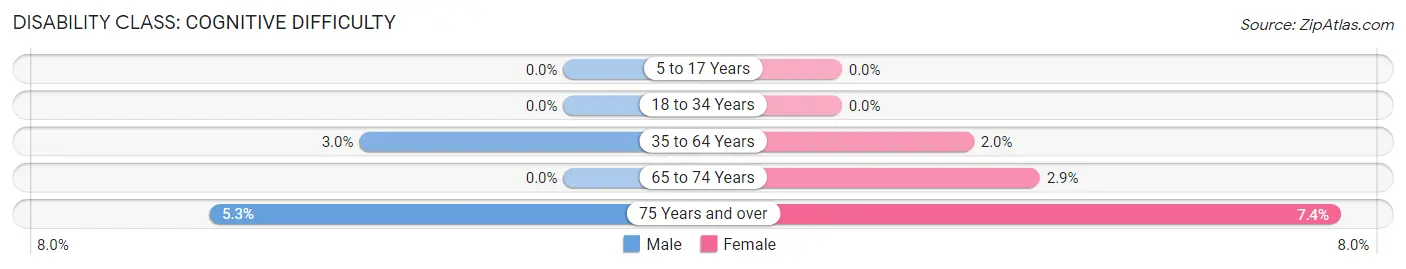
| Age Bracket | Male | Female |
| 5 to 17 Years | 0 (0.0%) | 0 (0.0%) |
| 18 to 34 Years | 0 (0.0%) | 0 (0.0%) |
| 35 to 64 Years | 1 (3.0%) | 1 (2.0%) |
| 65 to 74 Years | 0 (0.0%) | 2 (2.9%) |
| 75 Years and over | 1 (5.3%) | 2 (7.4%) |
Disability Class: Ambulatory Difficulty
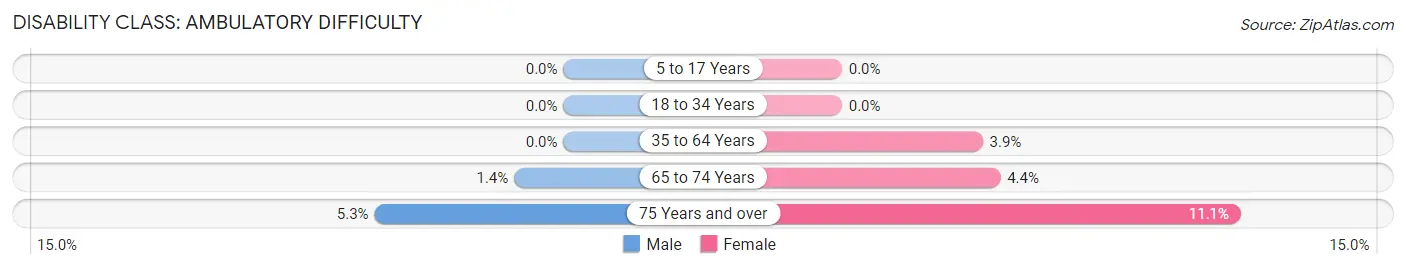
| Age Bracket | Male | Female |
| 5 to 17 Years | 0 (0.0%) | 0 (0.0%) |
| 18 to 34 Years | 0 (0.0%) | 0 (0.0%) |
| 35 to 64 Years | 0 (0.0%) | 2 (3.9%) |
| 65 to 74 Years | 1 (1.4%) | 3 (4.4%) |
| 75 Years and over | 1 (5.3%) | 3 (11.1%) |
Disability Class: Self-Care Difficulty
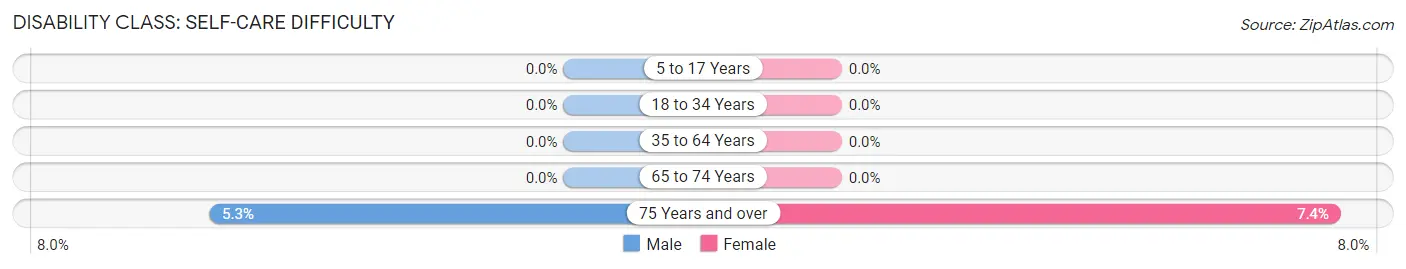
| Age Bracket | Male | Female |
| 5 to 17 Years | 0 (0.0%) | 0 (0.0%) |
| 18 to 34 Years | 0 (0.0%) | 0 (0.0%) |
| 35 to 64 Years | 0 (0.0%) | 0 (0.0%) |
| 65 to 74 Years | 0 (0.0%) | 0 (0.0%) |
| 75 Years and over | 1 (5.3%) | 2 (7.4%) |
Technology Access in Michiana
Computing Device Access in Michiana
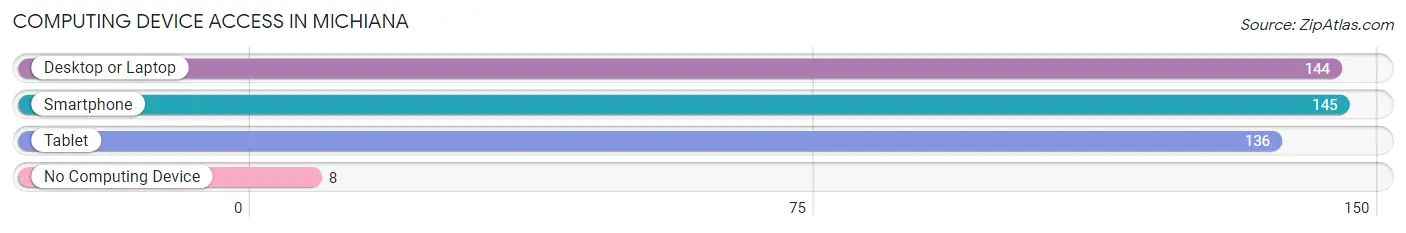
| Device Type | # Households | % Households |
| Desktop or Laptop | 144 | 90.6% |
| Smartphone | 145 | 91.2% |
| Tablet | 136 | 85.5% |
| No Computing Device | 8 | 5.0% |
| Total | 159 | 100.0% |
Internet Access in Michiana
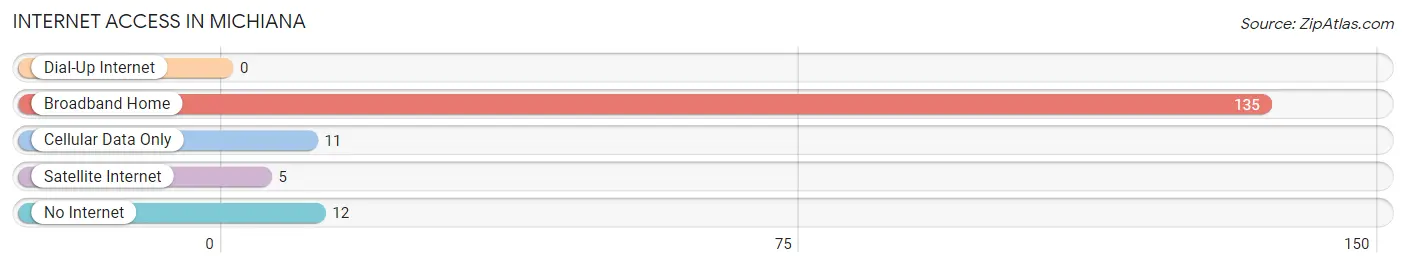
| Internet Type | # Households | % Households |
| Dial-Up Internet | 0 | 0.0% |
| Broadband Home | 135 | 84.9% |
| Cellular Data Only | 11 | 6.9% |
| Satellite Internet | 5 | 3.1% |
| No Internet | 12 | 7.5% |
| Total | 159 | 100.0% |
Michiana Summary
Michiana is a region in the United States located in the northern part of Indiana and the southwestern part of Michigan. It is a region of great economic, cultural, and historical significance. The region is home to a diverse population of people from all walks of life, and it has a rich history that dates back to the early 19th century.
Geography
Michiana is located in the northern part of Indiana and the southwestern part of Michigan. It is bordered by Lake Michigan to the east, the St. Joseph River to the west, and the Kankakee River to the south. The region is made up of several counties in both states, including Elkhart, LaGrange, St. Joseph, and Berrien counties in Indiana, and Cass, St. Joseph, and Berrien counties in Michigan. The region is known for its rolling hills, lush forests, and abundant lakes and rivers.
History
The history of Michiana dates back to the early 19th century, when the area was first settled by European immigrants. The region was originally inhabited by Native American tribes, including the Potawatomi, Miami, and Ottawa. The first European settlers arrived in the area in the early 1800s, and the region quickly became a hub for trade and commerce. The area was also home to several important battles during the War of 1812, including the Battle of Fort Dearborn.
In the late 19th century, the region experienced a period of rapid growth and development. The railroads were built, connecting the region to the rest of the country, and the industrial revolution brought new factories and businesses to the area. The region also became a popular destination for immigrants from Europe, and the population of Michiana grew rapidly.
Economy
The economy of Michiana is largely based on manufacturing and agriculture. The region is home to several large manufacturing companies, including Whirlpool, AM General, and Bosch. The region is also home to several large agricultural companies, including Cargill, Dow AgroSciences, and Monsanto. The region is also home to several universities and colleges, including the University of Notre Dame, Indiana University South Bend, and Purdue University.
Demographics
The population of Michiana is estimated to be around 1.2 million people. The region is home to a diverse population of people from all walks of life. The largest ethnic group in the region is White, making up around 75% of the population. The second largest ethnic group is Hispanic, making up around 15% of the population. Other ethnic groups in the region include African American, Asian, and Native American.
The region is also home to a large number of religious groups, including Catholic, Protestant, and Jewish. The region is also home to a large number of immigrants from all over the world, including Mexico, India, and China.
Conclusion
Michiana is a region of great economic, cultural, and historical significance. The region is home to a diverse population of people from all walks of life, and it has a rich history that dates back to the early 19th century. The economy of the region is largely based on manufacturing and agriculture, and the region is home to several large universities and colleges. The population of Michiana is estimated to be around 1.2 million people, and the region is home to a diverse population of people from all walks of life.
Common Questions
What is Per Capita Income in Michiana?
Per Capita income in Michiana is $98,188.
What is the Median Family Income in Michiana?
Median Family Income in Michiana is $182,500.
What is the Median Household income in Michiana?
Median Household Income in Michiana is $157,917.
What is Income or Wage Gap in Michiana?
Income or Wage Gap in Michiana is 63.6%.
Women in Michiana earn 36.4 cents for every dollar earned by a man.
What is Inequality or Gini Index in Michiana?
Inequality or Gini Index in Michiana is 0.40.
What is the Total Population of Michiana?
Total Population of Michiana is 285.
What is the Total Male Population of Michiana?
Total Male Population of Michiana is 132.
What is the Total Female Population of Michiana?
Total Female Population of Michiana is 153.
What is the Ratio of Males per 100 Females in Michiana?
There are 86.27 Males per 100 Females in Michiana.
What is the Ratio of Females per 100 Males in Michiana?
There are 115.91 Females per 100 Males in Michiana.
What is the Median Population Age in Michiana?
Median Population Age in Michiana is 66.7 Years.
What is the Average Family Size in Michiana
Average Family Size in Michiana is 2.1 People.
What is the Average Household Size in Michiana
Average Household Size in Michiana is 1.8 People.
How Large is the Labor Force in Michiana?
There are 156 People in the Labor Forcein in Michiana.
What is the Percentage of People in the Labor Force in Michiana?
55.5% of People are in the Labor Force in Michiana.
What is the Unemployment Rate in Michiana?
Unemployment Rate in Michiana is 3.2%.